| FREE WRITING PROSPECTUS | ||
| FILED PURSUANT TO RULE 433 | ||
| REGISTRATION FILE NO.: 333-259741-01 | ||
 |  |  |
BANK 2021-BNK38
Free Writing Prospectus
Structural and Collateral Term Sheet
$729,014,163
(Approximate Total Mortgage Pool Balance)
$613,784,000
(Approximate Offered Certificates)
Morgan Stanley Capital I Inc.
as Depositor
Morgan Stanley Mortgage Capital Holdings LLC
Bank of America, National Association
Wells Fargo Bank, National Association
National Cooperative Bank, N.A.
as Sponsors and Mortgage Loan Sellers
Commercial Mortgage Pass-Through Certificates
Series 2021-BNK38
December 7, 2021
MORGAN STANLEY Co-Lead Bookrunner Manager | WELLS FARGO SECURITIES Co-Lead Bookrunner Manager | BofA SECURITIES Co-Lead Bookrunner Manager |
Academy Securities, Inc. Co-Manager | Drexel Hamilton Co-Manager | |
STATEMENT REGARDING THIS FREE WRITING PROSPECTUS
The depositor has filed a registration statement (including a prospectus) with the SEC (File No. 333-259741) for the offering to which this communication relates. Before you invest, you should read the prospectus in that registration statement and other documents the depositor has filed with the SEC for more complete information about the depositor, the issuing entity and this offering. You may get these documents for free by visiting EDGAR on the SEC web site at www.sec.gov. Alternatively, the depositor or any underwriter or any dealer participating in the offering will arrange to send you the prospectus if you request it by calling toll free 1-866-718-1649 or by email to prospectus@ms.com.
This is not a research report and was not prepared by any Underwriter’s research department. Please see additional important information and qualifications at the end of this Term Sheet. |
| BANK 2021-BNK38 |
Neither this Term Sheet nor anything contained herein shall form the basis for any contract or commitment whatsoever. The information contained herein is preliminary as of the date hereof. This Term Sheet is subject to change, completion or amendment from time to time. The information contained herein supersedes information in any other communication relating to the securities described herein; provided, that the information contained herein will be superseded by similar information delivered to you as part of the Preliminary Prospectus. The information contained herein should be reviewed only in conjunction with the entire Preliminary Prospectus. All of the information contained herein is subject to the same limitations and qualifications contained in the Preliminary Prospectus. The information contained herein does not contain all relevant information relating to the underlying mortgage loans or mortgaged properties. Such information is described in the Preliminary Prospectus. The information contained herein will be more fully described in the Preliminary Prospectus. The information contained herein should not be viewed as projections, forecasts, predictions or opinions with respect to value. Prior to making any investment decision, prospective investors are strongly urged to read the Preliminary Prospectus in its entirety. Neither the Securities and Exchange Commission nor any state securities commission has approved or disapproved of these securities or determined if this Term Sheet is truthful or complete. Any representation to the contrary is a criminal offense.
BofA Securities is the marketing name for the global banking and global markets businesses of Bank of America Corporation. Lending, derivatives, and other commercial banking activities are performed globally by banking affiliates of Bank of America Corporation, including Bank of America, N.A., member FDIC. Securities, strategic advisory, and other investment banking activities are performed globally by investment banking affiliates of Bank of America Corporation, including, in the United States, BofA Securities, Inc., which is a registered broker-dealer and member of the Financial Industry Regulatory Authority (“FINRA”) and the Securities Investor Protection Corporation (“SIPC”), and, in other jurisdictions, locally registered entities.
Wells Fargo Securities is the trade name for the capital markets and investment banking services of Wells Fargo & Company and its subsidiaries, including but not limited to Wells Fargo Securities, LLC, a member of the New York Stock Exchange, FINRA, the National Futures Association (“NFA”) and SIPC, Wells Fargo Prime Services, LLC, a member of FINRA, NFA and SIPC, and Wells Fargo Bank, National Association. Wells Fargo Securities, LLC and Wells Fargo Prime Services, LLC are distinct entities from affiliated banks and thrifts.
IMPORTANT NOTICE RELATING TO AUTOMATICALLY GENERATED EMAIL DISCLAIMERS
Any legends, disclaimers or other notices that may appear at the bottom of, or attached to, the email communication to which this Term Sheet may have been attached are not applicable to this Term Sheet and should be disregarded. Such legends, disclaimers or other notices have been automatically generated as a result of this Term Sheet having been sent via Bloomberg or another email system.
IMPORTANT NOTICE REGARDING THE CONDITIONS FOR THIS OFFERING OF ASSET-BACKED SECURITIES
THE ASSET-BACKED SECURITIES REFERRED TO IN THIS TERM SHEET ARE BEING OFFERED WHEN, AS AND IF ISSUED. IN PARTICULAR, YOU ARE ADVISED THAT THE ASSET-BACKED SECURITIES, AND THE ASSET POOL BACKING THEM, ARE SUBJECT TO MODIFICATION OR REVISION (INCLUDING, AMONG OTHER THINGS, THE POSSIBILITY THAT ONE OR MORE CLASSES OF SECURITIES MAY BE SPLIT, COMBINED OR ELIMINATED), AT ANY TIME PRIOR TO ISSUANCE OR AVAILABILITY OF A FINAL PROSPECTUS. AS A RESULT, YOU MAY COMMIT TO PURCHASE SECURITIES THAT HAVE CHARACTERISTICS THAT MAY CHANGE, AND YOU ARE ADVISED THAT ALL OR A PORTION OF THE SECURITIES MAY NOT BE ISSUED THAT HAVE THE CHARACTERISTICS DESCRIBED IN THIS TERM SHEET. OUR OBLIGATION TO SELL SECURITIES TO YOU IS CONDITIONED ON THE SECURITIES AND THE UNDERLYING TRANSACTION HAVING THE CHARACTERISTICS DESCRIBED IN THIS TERM SHEET. IF WE DETERMINE THAT THE FOREGOING CONDITION IS NOT SATISFIED IN ANY MATERIAL RESPECT, WE WILL NOTIFY YOU, AND NEITHER THE ISSUING ENTITY NOR ANY UNDERWRITER WILL HAVE ANY OBLIGATION TO YOU TO DELIVER ALL OR ANY PORTION OF THE SECURITIES WHICH YOU HAVE COMMITTED TO PURCHASE, AND THERE WILL BE NO LIABILITY BETWEEN US AS A CONSEQUENCE OF THE NON-DELIVERY.
This is not a research report and was not prepared by any Underwriter’s research department. Please see additional important information and qualifications at the end of this Term Sheet. |
T-2
| BANK 2021-BNK38 | Structural Overview |
Offered Certificates
| Class | Expected Ratings (Fitch/S&P/KBRA)(1) | Approximate Initial Certificate Balance or Notional Amount(2) | Approximate Initial Credit Support(3) | Pass-Through Rate Description | Expected Weighted Average Life (Years)(4) | Expected Principal Window (Months)(4) | Certificate Principal UW NOI Debt Yield(5) | Certificate Principal to Value Ratio(6) |
| Class A-1 | AAAsf/AAA(sf)/AAA(sf) | $5,800,000 | 30.000% | (7) | 2.63 | 1 – 59 | 20.1% | 34.4% |
| Class A-2 | AAAsf/AAA(sf)/AAA(sf) | $11,800,000 | 30.000% | (7) | 4.92 | 59 – 60 | 20.1% | 34.4% |
| Class A-3 | AAAsf/AAA(sf)/AAA(sf) | $17,100,000 | 30.000% | (7) | 6.98 | 84 – 84 | 20.1% | 34.4% |
| Class A-SB | AAAsf/AAA(sf)/AAA(sf) | $8,200,000 | 30.000% | (7) | 7.38 | 60 – 115 | 20.1% | 34.4% |
| Class A-4(8) | AAAsf/AAA(sf)/AAA(sf) | (8)(9) | 30.000% | (7)(8) | (9) | (9) | 20.1% | 34.4% |
| Class A-5(8) | AAAsf/AAA(sf)/AAA(sf) | (8)(9) | 30.000% | (7)(8) | (9) | (9) | 20.1% | 34.4% |
| Class X-A | AAAsf/AAA(sf)/AAA(sf) | $484,794,000(10) | N/A | Variable IO(11) | N/A | N/A | N/A | N/A |
| Class X-B | AA-sf/NR/AAA(sf) | $97,825,000(10) | N/A | Variable IO(11) | N/A | N/A | N/A | N/A |
| Class A-S(8) | AAAsf/AA+(sf)/AAA(sf) | $69,256,000(8) | 20.000% | (7)(8) | 9.98 | 120 – 120 | 17.6% | 39.4% |
| Class B(8) | AA-sf/NR/AA(sf) | $28,569,000(8) | 15.875% | (7)(8) | 9.98 | 120 – 120 | 16.8% | 41.4% |
| Class C(8) | A-sf/NR/A-(sf) | $31,165,000(8) | 11.375% | (7)(8) | 9.98 | 120 – 120 | 15.9% | 43.6% |
Privately Offered Certificates(12)
| Class | Expected Ratings (Fitch/S&P/KBRA)(1) | Approximate Initial Certificate Balance or Notional Amount(2) | Approximate Initial Credit Support(3) | Pass-Through Rate Description | Expected Weighted Average Life (Years)(4) | Expected Principal Window (Months)(4) | Certificate Principal UW NOI Debt Yield(5) | Certificate Principal to Value Ratio(6) |
| Class X-D | BBB-sf/NR/BBB-(sf) | $31,165,000(10) | N/A | Variable IO(11) | N/A | N/A | N/A | N/A |
| Class X-F | BB+sf/NR/BB(sf) | $8,657,000(10) | N/A | Variable IO(11) | N/A | N/A | N/A | N/A |
| Class X-G | BB-sf/NR/BB(sf) | $7,792,000(10) | N/A | Variable IO(11) | N/A | N/A | N/A | N/A |
| Class X-H | B-sf/NR/B(sf) | $6,925,000(10) | N/A | Variable IO(11) | N/A | N/A | N/A | N/A |
| Class X-J | NR/NR/NR | $24,240,455(10) | N/A | Variable IO(11) | N/A | N/A | N/A | N/A |
| Class D | BBBsf/NR/BBB+(sf) | $17,314,000 | 8.875% | (7) | 9.98 | 120 – 120 | 15.5% | 44.8% |
| Class E | BBB-sf/NR/BBB-(sf) | $13,851,000 | 6.875% | (7) | 9.98 | 120 – 120 | 15.1% | 45.8% |
| Class F | BB+sf/NR/BB+(sf) | $8,657,000 | 5.625% | (7) | 9.98 | 120 – 120 | 14.9% | 46.4% |
| Class G | BB-sf/NR/BB(sf) | $7,792,000 | 4.500% | (7) | 9.98 | 120 – 120 | 14.8% | 47.0% |
| Class H | B-sf/NR/B(sf) | $6,925,000 | 3.500% | (7) | 9.98 | 120 – 120 | 14.6% | 47.5% |
| Class J | NR/NR/NR | $24,240,455 | 0.000% | (7) | 9.98 | 120 – 120 | 14.1% | 49.2% |
Non-Offered Eligible Vertical Interest(12)
| Class | Expected Ratings (Fitch/S&P/KBRA)(1) | Approximate Initial Certificate Balance or Notional Amount(2) | Approximate Initial Credit Support(3) | Pass-Through Rate Description | Expected Weighted Average Life (Years)(4) | Expected Principal Window (Months)(4) | Certificate Principal UW NOI Debt Yield(5) | Certificate Principal to Value Ratio(6) |
| RR Interest | NR/NR/NR | $36,450,708.18 | N/A | (13) | 9.67 | 1 – 120 | N/A | N/A |
| (1) | Ratings shown are those of Fitch Ratings, Inc. (“Fitch”), S&P Global Ratings (“S&P”) and Kroll Bond Rating Agency, LLC (“KBRA”). Certain nationally recognized statistical rating organizations that were not hired by the depositor may use information they receive pursuant to Rule 17g-5 under the Securities Exchange Act of 1934, as amended, or otherwise to rate the certificates. There can be no assurance as to what ratings a non-hired nationally recognized statistical rating organization would assign. See “Risk Factors—Other Risks Relating to the Certificates—Nationally Recognized Statistical Rating Organizations May Assign Different Ratings to the Certificates; Ratings of the Certificates Reflect Only the Views of the Applicable Rating Agencies as of the Dates Such Ratings Were Issued; Ratings May Affect ERISA Eligibility; Ratings May Be Downgraded” and “Ratings” in the Preliminary Prospectus to be dated on or about the date hereof (the “Preliminary Prospectus”). Capitalized terms used but not defined herein have the meanings assigned to such terms in the Preliminary Prospectus. |
| (2) | Approximate, subject to a permitted variance of plus or minus 5% and further subject to the discussion in footnote (9) below. In addition, the notional amounts of the Class X-A, Class X-B, Class X-D, Class X-F, Class X-G, Class X-H and Class X-J certificates may vary depending upon the final pricing of the classes of principal balance certificates or trust components whose certificate or principal balances comprise such notional amounts, and, if as a result of such pricing the pass-through rate of any class of the Class X-A, Class X-B, Class X-D, Class X-F, Class X-G, Class X-H or Class X-J certificates, as applicable, would be equal to zero at all times, such class of certificates will not be issued on the closing date of this securitization. |
| (3) | The approximate initial credit support percentages set forth for the certificates are approximate and, for the Class A-1, Class A-2, Class A-3, Class A-SB, Class A-4 and Class A-5 certificates, are presented in the aggregate, taking into account the principal balances of the Class A-4 and Class A-5 trust components. The approximate initial credit support percentage set forth for each class of the Class A-S, Class B and Class C certificates represents the |
This is not a research report and was not prepared by any Underwriter’s research department. Please see additional important information and qualifications at the end of this Term Sheet. |
T-3
| BANK 2021-BNK38 | Structural Overview |
| approximate credit support for the underlying trust component with the same alphanumeric designation. The RR Interest provides credit support only to the limited extent that it is allocated a portion of any losses incurred on the underlying mortgage loans, which such losses are allocated between it, on the one hand, and to the Non-Retained Certificates, on the other hand, pro rata in accordance with their respective Percentage Allocation Entitlements (as defined below). See “Credit Risk Retention” in the Preliminary Prospectus. |
| (4) | The Expected Weighted Average Life and Expected Principal Window during which distributions of principal would be received as set forth in the foregoing table with respect to each class of certificates having a certificate balance are based on the assumptions set forth under “Yield and Maturity Considerations—Weighted Average Life” in the Preliminary Prospectus and on the assumptions that there are no prepayments, modifications or losses in respect of the mortgage loans and that there are no extensions or forbearances of maturity dates or anticipated repayment dates of the mortgage loans. |
| (5) | Certificate Principal UW NOI Debt Yield for any class of principal balance certificates shown in the table above (other than the RR Interest) is calculated as the product of (a) the weighted average UW NOI Debt Yield for the mortgage pool, multiplied by (b) a fraction, the numerator of which is the aggregate initial certificate or principal balance of all the principal balance certificates, and the denominator of which is the sum of (x) the aggregate initial certificate or principal balance of the subject class of principal balance certificates (or, with respect to the Class A-4, Class A-5, Class A-S, Class B or Class C certificates, the trust component with the same alphanumeric designation) and all other classes of principal balance certificates (other than the RR Interest), if any, that are senior to such class and (y) the outstanding certificate balance of the RR Interest, multiplied by the applicable RR Interest Computation Percentage. The Certificate Principal UW NOI Debt Yields of the Class A-1, Class A-2, Class A-3, Class A-SB, Class A-4 and Class A-5 certificates are calculated in the aggregate for those classes as if they were a single class. With respect to any class of principal balance certificates, the “RR Interest Computation Percentage” is equal to a fraction, expressed as a percentage, the numerator of which is the total initial certificate or principal balance of the subject class of principal balance certificates (or, with respect to the Class A-4, Class A-5, Class A-S, Class B or Class C certificates, the trust component with the same alphanumeric designation) and all other classes of principal balance certificates (other than the RR Interest), if any, that are senior to such class, and the denominator of which is the sum of the aggregate initial certificate or principal balance of all the principal balance certificates (other than the RR Interest). |
| (6) | Certificate Principal to Value Ratio for any class of principal balance certificates shown in the table above (other than the RR Interest) is calculated as the product of (a) the weighted average Cut-off Date LTV Ratio of the mortgage pool, multiplied by (b) a fraction, the numerator of which is the sum of (x) the aggregate initial certificate or principal balance of the subject class of principal balance certificates (or, with respect to the Class A-4, Class A-5, Class A-S, Class B or Class C certificates, the trust component with the same alphanumeric designation) and all other classes of principal balance certificates (other than the RR Interest), if any, that are senior to such class and (y) the outstanding certificate balance of the RR Interest, multiplied by the applicable RR Interest Computation Percentage, and the denominator of which is the aggregate initial certificate or principal balance of all the principal balance certificates. The Certificate Principal to Value Ratios of the Class A-1, Class A-2, Class A-3, Class A-SB, Class A-4 and Class A-5 certificates are calculated in the aggregate for those classes as if they were a single class. |
| (7) | The pass-through rate for each class of the Class A-1, Class A-2, Class A-3, Class A-SB, Class A-4, Class A-5, Class A-S, Class B, Class C, Class D, Class E, Class F, Class G, Class H and Class J certificates for any distribution date will be one of the following: (i) a fixed rate per annum, (ii) a variable rate per annum equal to the weighted average of the net mortgage interest rates on the mortgage loans for the related distribution date, (iii) a variable rate per annum equal to the lesser of (a) a fixed rate and (b) the weighted average of the net mortgage interest rates on the mortgage loans for the related distribution date or (iv) a variable rate per annum equal to the weighted average of the net mortgage interest rates on the mortgage loans for the related distribution date minus a specified percentage. For purposes of the calculation of the weighted average of the net mortgage interest rates on the mortgage loans for each distribution date, the net mortgage interest rates will be adjusted as necessary to a 30/360 basis. |
| (8) | The Class A-4-1, Class A-4-2, Class A-4-X1, Class A-4-X2, Class A-5-1, Class A-5-2, Class A-5-X1, Class A-5-X2, Class A-S-1, Class A-S-2, Class A-S-X1, Class A-S-X2, Class B-1, Class B-2, Class B-X1, Class B-X2, Class C-1, Class C-2, Class C-X1 and Class C-X2 certificates are also offered certificates. Such classes of certificates, together with the Class A-4, Class A-5, Class A-S, Class B and Class C certificates, constitute the “Exchangeable Certificates”. The Class A-1, Class A-2, Class A-3, Class A-SB, Class D, Class E, Class F, Class G, Class H and Class J certificates, together with the RR Interest and the Exchangeable Certificates with a certificate balance, are referred to as the “principal balance certificates.” Each class of Exchangeable Certificates will have the certificate balance or notional amount and pass-through rate described below under “Exchangeable Certificates.” Each class of Class A-4, Class A-5, Class A-S, Class B and Class C Exchangeable Certificates will have the same ratings as the Class A-4, Class A-5, Class A-S, Class B and Class C certificates, respectively, shown in the table above. |
| (9) | The exact initial principal balances or notional amounts of the Class A-4, Class A-4-X1, Class A-4-X2, Class A-5, Class A-5-X1 and Class A-5-X2 trust components (and consequently, the exact aggregate initial certificate balances or notional amounts of the Exchangeable Certificates with an “A-4” or “A-5” designation) are unknown and will be determined based on the final pricing of the certificates. However, the initial principal balances, weighted average lives and principal windows of the Class A-4 and Class A-5 trust components are expected to be within the applicable ranges reflected in the following chart. The aggregate initial principal balance of the Class A-4 and Class A-5 trust components is expected to be approximately $441,894,000, subject to a variance of plus or minus 5%. The Class A-4-X1 and Class A-4-X2 trust components will have initial notional amounts equal to the initial principal balance of the Class A-4 trust component. The Class A-5-X1 and Class A-5-X2 trust components will have initial notional amounts equal to the initial principal balance of the Class A-5 trust component. In the event that the Class A-5 trust component is issued with an initial certificate balance of $441,894,000, the Class A-4 trust component (and, correspondingly, the Class A-4 Exchangeable Certificates) will not be issued. |
| Trust Components | Expected Range of Initial Principal Balance | Expected Range of Weighted Average Life (Years) | Expected Range of Principal Window (Months) |
| Class A-4 | $0 - $200,000,000 | N/A – 9.82 | N/A / 115-119 |
| Class A-5 | $241,894,000 - $441,894,000 | 9.89 – 9.94 | 115-120 / 119-120 |
| (10) | The Class X-A, Class X-B, Class X-D, Class X-F, Class X-G, Class X-H and Class X-J certificates (collectively referred to as the “Class X certificates”) are notional amount certificates and will not be entitled to distributions of principal. The notional amount of the Class X-A certificates will be equal to the aggregate certificate or principal balance of the Class A-1, Class A-2, Class A-3 and Class A-SB certificates and the Class A-4 and Class A-5 trust components. The notional amount of the Class X-B certificates will be equal to the aggregate principal balance of the Class A-S and Class B trust components. The notional amount of the Class X-D certificates will be equal to the aggregate certificate balance of the Class D and Class E certificates. The notional amount of each class of the Class X-F, Class X-G, Class X-H and Class X-J certificates will be equal to the certificate balance of the class of principal balance certificates that, with the addition of “X-,” has the same alphabetical designation as the subject class of Class X certificates. |
| (11) | The pass-through rate for the Class X-A certificates for any distribution date will be a per annum rate equal to the excess, if any, of (a) the weighted average of the net mortgage interest rates on the mortgage loans for the related distribution date, over (b) the weighted average of the pass-through rates on the Class A-1, Class A-2, Class A-3 and Class A-SB certificates and the Class A-4, Class A-4-X1, Class A-4-X2, Class A-5, Class A-5-X1 and Class A-5-X2 trust components for the related distribution date, weighted on the basis of their respective certificate or principal balances or notional amounts outstanding immediately prior to that distribution date (but excluding trust components with a notional amount in the denominator of such weighted average calculation). The pass-through rate for the Class X-B certificates for any distribution date will be a per annum rate equal to the excess, if any, of (a) the weighted average |
This is not a research report and was not prepared by any Underwriter’s research department. Please see additional important information and qualifications at the end of this Term Sheet. |
T-4
| BANK 2021-BNK38 | Structural Overview |
| of the net mortgage interest rates on the mortgage loans for the related distribution date, over (b) the weighted average of the pass-through rates on the Class A-S, Class A-S-X1, Class A-S-X2, Class B, Class B-X1 and Class B-X2 trust components for the related distribution date, weighted on the basis of their respective principal balances or notional amounts outstanding immediately prior to that distribution date (but excluding trust components with a notional amount in the denominator of such weighted average calculation). The pass-through rate for the Class X-D certificates for any distribution date will be a per annum rate equal to the excess, if any, of (a) the weighted average of the net mortgage interest rates on the mortgage loans for the related distribution date, over (b) the weighted average of the pass-through rates on the Class D and Class E certificates for the related distribution date, weighted on the basis of their respective certificate balances outstanding immediately prior to that distribution date. The pass-through rate for each class of the Class X-F, Class X-G, Class X-H and Class X-J certificates for any distribution date will be a per annum rate equal to the excess, if any, of (a) the weighted average of the net mortgage interest rates on the mortgage loans for the related distribution date, over (b) the pass-through rate for the related distribution date on the class of principal balance certificates that, with the addition of “X-,” has the same alphabetical designation as the subject class of Class X certificates. For purposes of the calculation of the weighted average of the net mortgage interest rates on the mortgage loans for each distribution date, the net mortgage interest rates will be adjusted as necessary to a 30/360 basis. |
| (12) | Not offered pursuant to the Preliminary Prospectus or this Term Sheet. Information provided in this Term Sheet regarding the characteristics of these certificates is provided only to enhance your understanding of the offered certificates. The privately offered certificates also include the Class V and Class R certificates, which do not have a certificate balance, notional amount, credit support, pass-through rate, rating, assumed final distribution date or rated final distribution date, and which are not shown in the chart. The Class V certificates represent a beneficial ownership interest held through the grantor trust in a specified percentage of certain excess interest in respect of mortgage loans having anticipated repayment dates, if any. The Class R certificates represent the beneficial ownership of the residual interest in each of the real estate mortgage investment conduits, as further described in the Preliminary Prospectus. |
| (13) | Although it does not have a specified pass-through rate (other than for tax reporting purposes), the effective pass-through rate for the RR Interest will be a variable rate per annum equal to the weighted average of the net mortgage interest rates on the mortgage loans for the related distribution date (in each case adjusted, if necessary, to accrue on the basis of a 360-day year consisting of twelve 30-day months). |
This is not a research report and was not prepared by any Underwriter’s research department. Please see additional important information and qualifications at the end of this Term Sheet. |
T-5
| BANK 2021-BNK38 | Structural Overview |
Issue Characteristics
| Offered Certificates: | $613,784,000 (approximate) monthly pay, multi-class, commercial mortgage pass-through certificates, consisting of 19 principal balance classes (Class A-1, Class A-2, Class A-3, Class A-SB, Class A-4, Class A-4-1, Class A-4-2, Class A-5, Class A-5-1, Class A-5-2, Class A-S, Class A-S-1, Class A-S-2, Class B, Class B-1, Class B-2, Class C, Class C-1 and Class C-2) and 12 interest-only classes (Class A-4-X1, Class A-4-X2, Class A-5-X1, Class A-5-X2, Class X-A, Class X-B, Class A-S-X1, Class A-S-X2, Class B-X1, Class B-X2, Class C-X1 and Class C-X2) | |
| Co-Lead Managers and Joint Bookrunners: | Morgan Stanley & Co. LLC, BofA Securities, Inc. and Wells Fargo Securities, LLC | |
| Co-Managers: | Academy Securities, Inc. and Drexel Hamilton, LLC | |
| Mortgage Loan Sellers: | Morgan Stanley Mortgage Capital Holdings LLC, Bank of America, National Association, Wells Fargo Bank, National Association and National Cooperative Bank, N.A. | |
| Rating Agencies: | Fitch, S&P and KBRA | |
| Master Servicers: | Wells Fargo Bank, National Association and National Cooperative Bank, N.A. | |
| Special Servicers: | Midland Loan Services, a Division of PNC Bank, National Association and National Cooperative Bank, N.A. | |
| Certificate Administrator/ Certificate Registrar/Custodian: | Computershare Trust Company, National Association | |
| Trustee: | Wilmington Trust, National Association | |
| Operating Advisor: | Pentalpha Surveillance LLC | |
| Asset Representations Reviewer: | Pentalpha Surveillance LLC | |
| Initial Directing Certificateholder: | KKR Real Estate Credit Opportunity Partners II L.P. | |
| Risk Retention Consultation Party: | Morgan Stanley Mortgage Capital Holdings LLC | |
| U.S. Credit Risk Retention: | For a discussion on the manner in which the U.S. credit risk retention requirements will be addressed by Morgan Stanley Mortgage Capital Holdings LLC, as the retaining sponsor, see “Credit Risk Retention” in the Preliminary Prospectus. | |
| EU Risk Retention: | None of the sponsors, the depositor or the underwriters or their respective affiliates, or any other person, intends to retain a material net economic interest in the securitization constituted by the issue of the certificates, or to take any other action in respect of such securitization, in a manner prescribed or contemplated by the EU Securitization Regulation or the UK Securitization Regulation. In particular, no such person undertakes to take any action which may be required by any potential investor or certificateholder for the purposes of its compliance with any requirement of the EU Securitization Regulation or the UK Securitization Regulation. In addition, the arrangements described under “Credit Risk Retention” in the Preliminary Prospectus have not been structured with the objective of ensuring compliance by any person with any requirement of the EU Securitization Regulation or the UK Securitization Regulation. Consequently, the Offered Certificates may not be a suitable investment for investors that are subject to any requirement of the EU Securitization Regulation or the UK Securitization Regulation. See “Risk Factors—Other Risks Relating to the Certificates—EU Securitization Regulation and UK Securitization Regulation” in the Preliminary Prospectus. | |
| Cut-off Date: | The mortgage loans will be considered part of the trust fund as of their respective cut-off dates. The cut-off date with respect to each mortgage loan is the respective due date for the monthly debt service payment that is due in December 2021 (or, in the case of any mortgage loan that has its first due date after December 2021, the date that would have been its due date in December 2021 under the terms of that mortgage loan if a monthly debt service payment were scheduled to be due in that month). | |
| Expected Pricing Date: | Week of December 6, 2021 | |
| Expected Closing Date: | December 22, 2021 | |
| Determination Dates: | The 11th day of each month or, if the 11th day is not a business day, then the business day immediately following such 11th day. | |
| Distribution Dates: | The 4th business day following each determination date. The first distribution date will be in January 2022. | |
| Rated Final Distribution Date: | The distribution date in December 2064 | |
| Interest Accrual Period: | Preceding calendar month | |
| Payment Structure: | Sequential pay | |
| Tax Treatment: | REMIC, except that the Exchangeable Certificates will evidence interests in a grantor trust | |
| Optional Termination: | 1.00% clean-up call | |
| Minimum Denominations: | $10,000 for each class of Offered Certificates (other than Class X-A and Class X-B certificates); $1,000,000 for the Class X-A and Class X-B certificates |
This is not a research report and was not prepared by any Underwriter’s research department. Please see additional important information and qualifications at the end of this Term Sheet. |
T-6
| BANK 2021-BNK38 | Structural Overview |
| Settlement Terms: | DTC, Euroclear and Clearstream | |
| Legal/Regulatory Status: | Each class of Offered Certificates is expected to be eligible for exemptive relief under ERISA. No class of Offered Certificates is SMMEA eligible. | |
| Analytics: | The certificate administrator is expected to make available all distribution date statements, CREFC® reports and supplemental notices received by it to certain modeling financial services as described in the Preliminary Prospectus. | |
| Bloomberg Ticker: | BANK 2021-BN38<MTGE><GO> | |
| Risk Factors: | THE CERTIFICATES INVOLVE CERTAIN RISKS AND MAY NOT BE SUITABLE FOR ALL INVESTORS. SEE THE “RISK FACTORS” SECTION OF THE PRELIMINARY PROSPECTUS. |
This is not a research report and was not prepared by any Underwriter’s research department. Please see additional important information and qualifications at the end of this Term Sheet. |
T-7
| BANK 2021-BNK38 | Structural Overview |
Structural Overview
| Allocation Between the RR Interest and the Non-Retained Certificates: |
The aggregate amount available for distributions to the holders of the Certificates (including the RR Interest) on each distribution date (net of specified expenses of the issuing entity, including fees payable to, and costs and expenses reimbursable to, each applicable master servicer, primary servicer and special servicer, the certificate administrator, the trustee, the operating advisor, the asset representations reviewer and CREFC®) will be allocated between amounts available for distribution to the holders of the RR Interest, on the one hand, and to all other Certificates (other than the Class V and Class R Certificates), referred to herein as the “Non-Retained Certificates”, on the other hand. The portion of such amount allocable to (a) the RR Interest will at all times be the product of such amount multiplied by 5% and (b) the Non-Retained Certificates will at all times be the product of such amount multiplied by the difference between 100% and the percentage set forth in clause (a) (each, the respective “Percentage Allocation Entitlement”).
| |
| Accrual: | Each class of Offered Certificates will accrue interest on a 30/360 basis. | |
Amount and Order of Distributions: |
First, to the Class A-1, Class A-2, Class A-3, Class A-SB, Class X-A, Class X-B, Class X-D, Class X-F, Class X-G, Class X-H and Class X-J certificates and the Class A-4, Class A-4-X1, Class A-4-X2, Class A-5, Class A-5-X1 and Class A-5-X2 trust components, in respect of interest, up to an amount equal to, and pro rata in accordance with, the interest entitlements for those classes of certificates and trust components;
Second, to the Class A-1, Class A-2, Class A-3 and Class A-SB certificates and the Class A-4 and Class A-5 trust components as follows, to the extent of applicable available funds allocated to principal: either (i)(a) first, to principal on the Class A-SB certificates, until the certificate balance of the Class A-SB certificates is reduced to the planned principal balance for the related distribution date set forth in Annex E to the Preliminary Prospectus, and (b) second, to principal on the Class A-1 certificates, the Class A-2 certificates, the Class A-3 certificates, the Class A-4 trust component, the Class A-5 trust component and the Class A-SB certificates, in that order, in each case until the certificate or principal balance of such class of certificates or trust component has been reduced to zero, or (ii) if the certificate or principal balance of each class of principal balance certificates and trust components other than the Class A-1, Class A-2, Class A-3 and Class A-SB certificates, the Class A-4 and Class A-5 trust components and the RR Interest has been reduced to zero as a result of the allocation of losses on the mortgage loans to those certificates, to principal on the Class A-1, Class A-2, Class A-3 and Class A-SB certificates and the Class A-4 and Class A-5 trust components, pro rata, without regard to the distribution priorities described above or the planned principal balance of the Class A-SB certificates;
Third, to the Class A-1, Class A-2, Class A-3 and Class A-SB certificates and the Class A-4 and Class A-5 trust components, first, up to an amount equal to, and pro rata based on, any previously unreimbursed losses on the mortgage loans allocable to principal that were previously borne by each such class or trust component and then in the amount of interest thereon;
Fourth, to the Class A-S, Class A-S-X1 and Class A-S-X2 trust components, as follows: (a) to each such trust component in respect of interest, up to an amount equal to, and pro rata in accordance with, the interest entitlements for those trust components; (b) to the extent of applicable available funds allocable to principal remaining after distributions in respect of principal to each class of certificates or trust component with a higher priority (as set forth in prior enumerated clauses set forth above), to principal on the Class A-S trust component until its principal balance has been reduced to zero; and (c) to reimburse the Class A-S trust component, first, in the amount of any previously unreimbursed losses on the mortgage loans that were previously allocated thereto, then in the amount of interest thereon;
Fifth, to the Class B, Class B-X1 and Class B-X2 trust components, as follows: (a) to each such trust component in respect of interest, up to an amount equal to, and pro rata in accordance with, the interest entitlements for those trust components; (b) to the extent of applicable available funds allocable to principal remaining after distributions in respect of principal to each class of certificates or trust component with a higher priority (as set forth in prior enumerated clauses set forth above), to principal on the Class B trust component until its principal balance has been reduced to zero; and (c) to reimburse the Class B trust component, first, in the amount of any previously unreimbursed losses on the mortgage loans that were previously allocated thereto, then in the amount of interest thereon;
Sixth, to the Class C, Class C-X1 and Class C-X2 trust components, as follows: (a) to each such trust component in respect of interest, up to an amount equal to, and pro rata in accordance with, the interest entitlements for those trust components; (b) to the extent of applicable available funds allocable to principal remaining after distributions in respect of principal to each class of certificates or trust component with a higher priority (as set forth in prior enumerated clauses set forth above), to principal on the Class C trust component until its principal balance has been reduced to zero; and (c) to reimburse the Class C trust component, first, in the amount of any previously unreimbursed losses on the mortgage loans that were previously allocated thereto, then in the amount of interest thereon;
Seventh, to the Class D, Class E, Class F, Class G, Class H and Class J certificates in the amounts and order of priority described in “Description of the Certificates—Distributions” in the Preliminary Prospectus; and |
This is not a research report and was not prepared by any Underwriter’s research department. Please see additional important information and qualifications at the end of this Term Sheet. |
T-8
| BANK 2021-BNK38 | Structural Overview |
Eighth, to the Class R certificates, any remaining amounts.
Principal and interest payable on each trust component will be distributed pro rata to the corresponding classes of Exchangeable Certificates representing interests therein in accordance with their Class Percentage Interests therein as described below under “Exchangeable Certificates.” | ||
| Interest and Principal Entitlements: |
The interest entitlement of each class of Offered Certificates on each distribution date generally will be the interest accrued during the related interest accrual period on the related certificate balance or notional amount at the related pass-through rate, net of any prepayment interest shortfalls allocated to that class for such distribution date as described below. If prepayment interest shortfalls arise from voluntary prepayments on serviced mortgage loans during any collection period, the applicable master servicer is required to make a limited compensating interest payment to offset those shortfalls. See “Description of the Certificates—Prepayment Interest Shortfalls” in the Preliminary Prospectus. The remaining amount of prepayment interest shortfalls will be allocated between the RR Interest, on one hand, and the Non-Retained Certificates, on the other hand, in accordance with their respective Percentage Allocation Entitlements. The prepayment interest shortfalls allocated to the Non-Retained Certificates will be allocated among such classes of certificates (other than the Exchangeable Certificates) and trust components that are entitled to interest, on a pro rata basis, based on their respective amounts of accrued interest for the related distribution date, to reduce the interest entitlement on each such class of certificates and trust components. For any distribution date, prepayment interest shortfalls allocated to a trust component will be allocated among the related classes of Exchangeable Certificates, pro rata, in accordance with their respective class percentage interests for that distribution date. If a class of certificates or trust component receives less than the entirety of its interest entitlement on any distribution date, then the shortfall (excluding any shortfall due to prepayment interest shortfalls), together with interest thereon, will be added to its interest entitlement for the next succeeding distribution date.
The aggregate principal distribution amount for each distribution date generally will be the aggregate amount of principal received or advanced in respect of the mortgage loans, net of any non-recoverable advances and interest thereon and any workout-delayed reimbursement amounts that are reimbursed to the applicable master servicer or the trustee during the related collection period. Non-recoverable advances and interest thereon are reimbursable from principal collections before reimbursement from other amounts. Workout-delayed reimbursement amounts will be reimbursable from principal collections. The Non-Retained Certificates and the RR Interest will be entitled to their respective Percentage Allocation Entitlements of the aggregate principal distribution amount. |
| Exchangeable Certificates: | Certificates of each class of Exchangeable Certificates may be exchanged for certificates of the corresponding classes of Exchangeable Certificates set forth next to such class in the table below, and vice versa. Following any exchange of certificates of one or more classes of Exchangeable Certificates (the applicable “Surrendered Classes”) for certificates of one or more classes of other Exchangeable Certificates (the applicable “Received Classes”), the Class Percentage Interests (as defined below) of the outstanding principal balances or notional amounts of the Corresponding Trust Components that are represented by the Surrendered Classes (and consequently their related certificate balances or notional amounts) will be decreased, and those of the Received Classes (and consequently their related certificate balances or notional amounts) will be increased. The dollar denomination of the certificates of each of the Received Classes must be equal to the dollar denomination of the certificates of each of the Surrendered Classes. No fee will be required with respect to any exchange of Exchangeable Certificates. |
| Surrendered Classes (or Received Classes) of Certificates | Received Classes (or Surrendered Classes) of Certificates | |
| Class A-4 | Class A-4-1, Class A-4-X1 | |
| Class A-4 | Class A-4-2, Class A-4-X2 | |
| Class A-5 | Class A-5-1, Class A-5-X1 | |
| Class A-5 | Class A-5-2, Class A-5-X2 | |
| Class A-S | Class A-S-1, Class A-S-X1 | |
| Class A-S | Class A-S-2, Class A-S-X2 | |
| Class B | Class B-1, Class B-X1 | |
| Class B | Class B-2, Class B-X2 | |
| Class C | Class C-1, Class C-X1 | |
| Class C | Class C-2, Class C-X2 |
On the closing date, the issuing entity will issue the following “trust components,” each with the initial principal balance (or, if such trust component has an “X” suffix, notional amount) and pass-through rate set forth next to it in the table below. Each trust component with an “X” suffix will not be entitled to distributions of principal. |
| Trust Component | Initial Principal Balance or Notional Amount | Pass-Through Rate | |
| Class A-4 | See footnote (9) to the first table above under “Structural Overview” | Class A-4 certificate pass-through rate minus 1.00% | |
| Class A-4-X1 | Equal to Class A-4 trust component principal balance | 0.50% | |
| Class A-4-X2 | Equal to Class A-4 trust component principal balance | 0.50% |
This is not a research report and was not prepared by any Underwriter’s research department. Please see additional important information and qualifications at the end of this Term Sheet. |
T-9
| BANK 2021-BNK38 | Structural Overview |
| Class A-5 | See footnote (9) to the first table above under “Structural Overview” | Class A-5 certificate pass-through rate minus 1.00% | |
| Class A-5-X1 | Equal to Class A-5 trust component principal balance | 0.50% | |
| Class A-5-X2 | Equal to Class A-5 trust component principal balance | 0.50% | |
| Class A-S | $69,256,000 | Class A-S certificate pass-through rate minus 1.00% | |
| Class A-S-X1 | Equal to Class A-S trust component principal balance | 0.50% | |
| Class A-S-X2 | Equal to Class A-S trust component principal balance | 0.50% | |
| Class B | $28,569,000 | Class B certificate pass-through rate minus 1.00% | |
| Class B-X1 | Equal to Class B trust component principal balance | 0.50% | |
| Class B-X2 | Equal to Class B trust component principal balance | 0.50% | |
| Class C | $31,165,000 | Class C certificate pass-through rate minus 1.00% | |
| Class C-X1 | Equal to Class C trust component principal balance | 0.50% | |
| Class C-X2 | Equal to Class C trust component principal balance | 0.50% |
Each class of Exchangeable Certificates represents an undivided beneficial ownership interest in the trust components set forth next to it in the table below (the “Corresponding Trust Components”). Each class of Exchangeable Certificates has a pass-through rate equal to the sum of the pass-through rates of the Corresponding Trust Components and represents a percentage interest (the related “Class Percentage Interest”) in each Corresponding Trust Component, including principal and interest payable thereon (and reimbursement of losses allocable thereto), equal to (x) the certificate balance (or, if such class has an “X” suffix, notional amount) of such class of certificates, divided by (y) the principal balance of the Class A-4 trust component (if such class of Exchangeable Certificates has an “A-4” designation), the Class A-5 trust component (if such class of Exchangeable Certificates has an “A-5” designation), the Class A-S trust component (if such class of Exchangeable Certificates has an “A-S” designation), the Class B trust component (if such class of Exchangeable Certificates has a “B” designation), or the Class C trust component (if such class of Exchangeable Certificates has a “C” designation). |
| Group of Exchangeable Certificates | Class of Exchangeable Certificates | Corresponding Trust Components |
| “Class A-4 Exchangeable Certificates” | Class A-4 | Class A-4, Class A-4-X1, Class A-4-X2 |
| Class A-4-1 | Class A-4, Class A-4-X2 | |
| Class A-4-2 | Class A-4 | |
| Class A-4-X1 | Class A-4-X1 | |
| Class A-4-X2 | Class A-4-X1, Class A-4-X2 | |
| “Class A-5 Exchangeable Certificates” | Class A-5 | Class A-5, Class A-5-X1, Class A-5-X2 |
| Class A-5-1 | Class A-5, Class A-5-X2 | |
| Class A-5-2 | Class A-5 | |
| Class A-5-X1 | Class A-5-X1 | |
| Class A-5-X2 | Class A-5-X1, Class A-5-X2 | |
| “Class A-S Exchangeable Certificates” | Class A-S | Class A-S, Class A-S-X1, Class A-S-X2 |
| Class A-S-1 | Class A-S, Class A-S-X2 | |
| Class A-S-2 | Class A-S | |
| Class A-S-X1 | Class A-S-X1 | |
| Class A-S-X2 | Class A-S-X1, Class A-S-X2 | |
| “Class B Exchangeable Certificates” | Class B | Class B, Class B-X1, Class B-X2 |
| Class B-1 | Class B, Class B-X2 | |
| Class B-2 | Class B | |
| Class B-X1 | Class B-X1 | |
| Class B-X2 | Class B-X1, Class B-X2 | |
| “Class C Exchangeable Certificates” | Class C | Class C, Class C-X1, Class C-X2 |
| Class C-1 | Class C, Class C-X2 | |
| Class C-2 | Class C | |
| Class C-X1 | Class C-X1 | |
| Class C-X2 | Class C-X1, Class C-X2 |
This is not a research report and was not prepared by any Underwriter’s research department. Please see additional important information and qualifications at the end of this Term Sheet. |
T-10
| BANK 2021-BNK38 | Structural Overview |
The maximum certificate balance or notional amount of each class of Class A-4 Exchangeable Certificates, Class A-5 Exchangeable Certificates, Class A-S Exchangeable Certificates, Class B Exchangeable Certificates or Class C Exchangeable Certificates that could be issued in an exchange is equal to the principal balance of the Class A-4, Class A-5, Class A-S, Class B or Class C trust component, respectively. The maximum certificate balances of Class A-4, Class A-5, Class A-S, Class B and Class C certificates (subject to the constraint on the aggregate initial principal balance of the Class A-4 and Class A-5 trust components discussed in footnote (9) to the first table above under “Structural Overview”) will be issued on the closing date, and the certificate balance or notional amount of each other class of Exchangeable Certificates will be equal to zero on the closing date.
Each class of Class A-4 Exchangeable Certificates, Class A-5 Exchangeable Certificates, Class A-S Exchangeable Certificates, Class B Exchangeable Certificates and Class C Exchangeable Certificates will have a certificate balance or notional amount equal to its Class Percentage Interest multiplied by the principal balance of the Class A-4, Class A-5, Class A-S, Class B or Class C trust component, respectively. Each class of Class A-4 Exchangeable Certificates, Class A-5 Exchangeable Certificates, Class A-S Exchangeable Certificates, Class B Exchangeable Certificates and Class C Exchangeable Certificates with a certificate balance will have the same approximate initial credit support percentage, Expected Weighted Average Life, Expected Principal Window, Certificate Principal UW NOI Debt Yield and Certificate Principal to Value Ratio as the Class A-4, Class A-5, Class A-S, Class B or Class C certificates, respectively, shown above.
| ||
| Special Servicer Compensation: | The principal compensation to be paid to a special servicer in respect of its special servicing activities will be the special servicing fee, the workout fee and the liquidation fee.
The special servicing fee for each distribution date is calculated based on the outstanding principal balance of each serviced mortgage loan that is a specially serviced mortgage loan (and any related serviced companion loan) or as to which the related mortgaged property has become an REO property at the special servicing fee rate, which will be a rate equal to 0.25% per annum (subject to a monthly floor of $3,500 (in the case of Midland) or $1,000 (in the case of NCB)). The special servicing fee will be payable monthly, first, from liquidation proceeds, insurance and condemnation proceeds, and other collections in respect of the related specially serviced mortgage loan or REO property and, then, from general collections on all the mortgage loans and any REO properties.
Each applicable special servicer will also be entitled to (i) liquidation fees generally equal to 1.0% (or, if such rate would result in an aggregate liquidation fee less than $25,000, then the liquidation fee rate will be equal to the lesser of (i) 3.0% and (ii) such lower rate as would result in an aggregate liquidation fee equal to $25,000) of liquidation proceeds and certain other collections in respect of a specially serviced mortgage loan (and any related serviced companion loan) or related REO property and of amounts received in respect of mortgage loan repurchases by the related mortgage loan sellers and (ii) workout fees generally equal to 1.0% of interest (other than post-ARD excess interest on mortgage loans with anticipated repayment dates and other than default interest) and principal payments made in respect of a rehabilitated mortgage loan (and any related serviced companion loan), subject to a floor of $25,000 with respect to any mortgage loan, whole loan or related REO property, and in the case of each of clause (i) and (ii), subject to certain adjustments and exceptions as described in the Preliminary Prospectus under “Pooling and Servicing Agreement—Servicing and Other Compensation and Payment of Expenses—Special Servicing Compensation”.
With respect to any non-serviced mortgage loan, the related special servicer under the related other pooling and servicing agreement pursuant to which such mortgage loan is being serviced will be entitled to similar compensation as that described above with respect to such non-serviced mortgage loan under such other pooling and servicing agreement as further described in the Preliminary Prospectus, although any related fees may accrue at a different rate and there may be a higher (or no) cap on liquidation and workout fees.
| |
| Prepayment Premiums/Yield Maintenance Charges: |
If any yield maintenance charge or prepayment premium is collected during any collection period with respect to any mortgage loan, then on the immediately succeeding distribution date, the certificate administrator will pay:
(1) to the Non-Retained Certificates, in the following amounts:
| |
(a) to the holders of each class of the Class A-1, Class A-2, Class A-3, Class A-SB, Class A-4, Class A-4-1, Class A-4-2, Class A-5, Class A-5-1, Class A-5-2, Class A-S, Class A-S-1, Class A-S-2, Class B, Class B-1, Class B-2, Class C, Class C-1, Class C-2, Class D and Class E certificates, the product of (x) the Non-Retained Certificates’ Percentage Allocation Entitlement of such yield maintenance charge or prepayment premium, (y) the related Base Interest Fraction for such class and the applicable principal prepayment, and (z) a fraction, the numerator of which is equal to the amount of principal distributed to such class for that distribution date, and the denominator of which is the total amount of principal distributed to the Class A-1, Class A-2, Class A-3, Class A-SB, Class D and Class E certificates and the Class A-4 Exchangeable Certificates, the Class A-5 Exchangeable Certificates, the Class A-S Exchangeable Certificates, the Class B Exchangeable Certificates and the Class C Exchangeable Certificates for that distribution date, |
This is not a research report and was not prepared by any Underwriter’s research department. Please see additional important information and qualifications at the end of this Term Sheet. |
T-11
| BANK 2021-BNK38 | Structural Overview |
the Class A-4 Exchangeable Certificates, the Class A-5 Exchangeable Certificates, the Class A-S Exchangeable Certificates, the Class B Exchangeable Certificates and the Class C Exchangeable Certificates for that distribution date, and (z) the difference between (1) the Base Interest Fraction for the Class A-4 certificates and the applicable principal prepayment and (2) the Base Interest Fraction for the Class A-4-1 certificates and the applicable principal prepayment,
(c) to the holders of the Class A-4-X2 certificates, the product of (x) the Non-Retained Certificates’ Percentage Allocation Entitlement of such yield maintenance charge or prepayment premium, (y) a fraction, the numerator of which is equal to the amount of principal distributed to the Class A-4-2 certificates for that distribution date, and the denominator of which is the total amount of principal distributed to the Class A-1, Class A-2, Class A-3, Class A-SB, Class D and Class E certificates and the Class A-4 Exchangeable Certificates, the Class A-5 Exchangeable Certificates, the Class A-S Exchangeable Certificates, the Class B Exchangeable Certificates and the Class C Exchangeable Certificates for that distribution date, and (z) the difference between (1) the Base Interest Fraction for the Class A-4 certificates and the applicable principal prepayment and (2) the Base Interest Fraction for the Class A-4-2 certificates and the applicable principal prepayment,
(d) to the holders of the Class A-5-X1 certificates, the product of (x) the Non-Retained Certificates’ Percentage Allocation Entitlement of such yield maintenance charge or prepayment premium, (y) a fraction, the numerator of which is equal to the amount of principal distributed to the Class A-5-1 certificates for that distribution date, and the denominator of which is the total amount of principal distributed to the Class A-1, Class A-2, Class A-3, Class A-SB, Class D and Class E certificates and the Class A-4 Exchangeable Certificates, the Class A-5 Exchangeable Certificates, the Class A-S Exchangeable Certificates, the Class B Exchangeable Certificates and the Class C Exchangeable Certificates for that distribution date, and (z) the difference between (1) the Base Interest Fraction for the Class A-5 certificates and the applicable principal prepayment and (2) the Base Interest Fraction for the Class A-5-1 certificates and the applicable principal prepayment,
(e) to the holders of the Class A-5-X2 certificates, the product of (x) the Non-Retained Certificates’ Percentage Allocation Entitlement of such yield maintenance charge or prepayment premium, (y) a fraction, the numerator of which is equal to the amount of principal distributed to the Class A-5-2 certificates for that distribution date, and the denominator of which is the total amount of principal distributed to the Class A-1, Class A-2, Class A-3, Class A-SB, Class D and Class E certificates and the Class A-4 Exchangeable Certificates, the Class A-5 Exchangeable Certificates, the Class A-S Exchangeable Certificates, the Class B Exchangeable Certificates and the Class C Exchangeable Certificates for that distribution date, and (z) the difference between (1) the Base Interest Fraction for the Class A-5 certificates and the applicable principal prepayment and (2) the Base Interest Fraction for the Class A-5-2 certificates and the applicable principal prepayment,
(f) to the holders of the Class A-S-X1 certificates, the product of (x) the Non-Retained Certificates’ Percentage Allocation Entitlement of such yield maintenance charge or prepayment premium, (y) a fraction, the numerator of which is equal to the amount of principal distributed to the Class A-S-1 certificates for that distribution date, and the denominator of which is the total amount of principal distributed to the Class A-1, Class A-2, Class A-3, Class A-SB, Class D and Class E certificates and the Class A-4 Exchangeable Certificates, the Class A-5 Exchangeable Certificates, the Class A-S Exchangeable Certificates, the Class B Exchangeable Certificates and the Class C Exchangeable Certificates for that distribution date, and (z) the difference between (1) the Base Interest Fraction for the Class A-S certificates and the applicable principal prepayment and (2) the Base Interest Fraction for the Class A-S-1 certificates and the applicable principal prepayment,
(g) to the holders of the Class A-S-X2 certificates, the product of (x) the Non-Retained Certificates’ Percentage Allocation Entitlement of such yield maintenance charge or prepayment premium, (y) a fraction, the numerator of which is equal to the amount of principal distributed to the Class A-S-2 certificates for that distribution date, and the denominator of which is the total amount of principal distributed to the Class A-1, Class A-2, Class A-3, Class A-SB, Class D and Class E certificates and the Class A-4 Exchangeable Certificates, the Class A-5 Exchangeable Certificates, the Class A-S Exchangeable Certificates, the Class B Exchangeable Certificates and the Class C Exchangeable Certificates for that distribution date, and (z) the difference between (1) the Base Interest Fraction for the Class A-S certificates and the applicable principal prepayment and (2) the Base Interest Fraction for the Class A-S-2 certificates and the applicable principal prepayment,
(h) to the holders of the Class B-X1 certificates, the product of (x) the Non-Retained Certificates’ Percentage Allocation Entitlement of such yield maintenance charge or prepayment premium, (y) a fraction, the numerator of which is equal to the amount of principal distributed to the Class B-1 certificates for that distribution date, and the denominator of which is the total amount of principal distributed to the Class A-1, Class A-2, Class A-3, Class A-SB, Class D and Class E certificates and the Class A-4 Exchangeable Certificates, the Class A-5 Exchangeable Certificates, the Class A-S Exchangeable Certificates, the Class B Exchangeable Certificates and the Class C Exchangeable Certificates for that distribution date, and (z) the difference between (1) the Base Interest Fraction for the Class B certificates and the applicable principal prepayment and (2) the Base Interest Fraction for the Class B-1 certificates and the applicable principal prepayment,
(i) to the holders of the Class B-X2 certificates, the product of (x) the Non-Retained Certificates’ Percentage Allocation Entitlement of such yield maintenance charge or prepayment premium, (y) a |
This is not a research report and was not prepared by any Underwriter’s research department. Please see additional important information and qualifications at the end of this Term Sheet. |
T-12
| BANK 2021-BNK38 | Structural Overview |
fraction, the numerator of which is equal to the amount of principal distributed to the Class B-2 certificates for that distribution date, and the denominator of which is the total amount of principal distributed to the Class A-1, Class A-2, Class A-3, Class A-SB, Class D and Class E certificates and the Class A-4 Exchangeable Certificates, the Class A-5 Exchangeable Certificates, the Class A-S Exchangeable Certificates, the Class B Exchangeable Certificates and the Class C Exchangeable Certificates for that distribution date, and (z) the difference between (1) the Base Interest Fraction for the Class B certificates and the applicable principal prepayment and (2) the Base Interest Fraction for the Class B-2 certificates and the applicable principal prepayment,
(j) to the holders of the Class C-X1 certificates, the product of (x) the Non-Retained Certificates’ Percentage Allocation Entitlement of such yield maintenance charge or prepayment premium, (y) a fraction, the numerator of which is equal to the amount of principal distributed to the Class C-1 certificates for that distribution date, and the denominator of which is the total amount of principal distributed to the Class A-1, Class A-2, Class A-3, Class A-SB, Class D and Class E certificates and the Class A-4 Exchangeable Certificates, the Class A-5 Exchangeable Certificates, the Class A-S Exchangeable Certificates, the Class B Exchangeable Certificates and the Class C Exchangeable Certificates for that distribution date, and (z) the difference between (1) the Base Interest Fraction for the Class C certificates and the applicable principal prepayment and (2) the Base Interest Fraction for the Class C-1 certificates and the applicable principal prepayment,
(k) to the holders of the Class C-X2 certificates, the product of (x) the Non-Retained Certificates’ Percentage Allocation Entitlement of such yield maintenance charge or prepayment premium, (y) a fraction, the numerator of which is equal to the amount of principal distributed to the Class C-2 certificates for that distribution date, and the denominator of which is the total amount of principal distributed to the Class A-1, Class A-2, Class A-3, Class A-SB, Class D and Class E certificates and the Class A-4 Exchangeable Certificates, the Class A-5 Exchangeable Certificates, the Class A-S Exchangeable Certificates, the Class B Exchangeable Certificates and the Class C Exchangeable Certificates for that distribution date, and (z) the difference between (1) the Base Interest Fraction for the Class C certificates and the applicable principal prepayment and (2) the Base Interest Fraction for the Class C-2 certificates and the applicable principal prepayment,
(l) to the holders of the Class X-A certificates, the excess, if any, of (x) the product of (1) the Non-Retained Certificates’ Percentage Allocation Entitlement of such yield maintenance charge or prepayment premium and (2) a fraction, the numerator of which is equal to the total amount of principal distributed to the Class A-1, Class A-2, Class A-3 and Class A-SB certificates and the Class A-4 Exchangeable Certificates and the Class A-5 Exchangeable Certificates for that distribution date, and the denominator of which is the total amount of principal distributed to the Class A-1, Class A-2, Class A-3, Class A-SB, Class D and Class E certificates and the Class A-4 Exchangeable Certificates, the Class A-5 Exchangeable Certificates, the Class A-S Exchangeable Certificates, the Class B Exchangeable Certificates and the Class C Exchangeable Certificates for that distribution date, over (y) the total amount of such yield maintenance charge or prepayment premium distributed to the Class A-1, Class A-2, Class A-3 and Class A-SB certificates and the Class A-4 Exchangeable Certificates and the Class A-5 Exchangeable Certificates as described above,
(m) to the holders of the Class X-B certificates, the excess, if any, of (x) the product of (1) the Non-Retained Certificates’ Percentage Allocation Entitlement of such yield maintenance charge or prepayment premium and (2) a fraction, the numerator of which is equal to the total amount of principal distributed to the Class A-S Exchangeable Certificates and the Class B Exchangeable Certificates for that distribution date, and the denominator of which is the total amount of principal distributed to the Class A-1, Class A-2, Class A-3, Class A-SB, Class D and Class E certificates and the Class A-4 Exchangeable Certificates, the Class A-5 Exchangeable Certificates, the Class A-S Exchangeable Certificates, the Class B Exchangeable Certificates and the Class C Exchangeable Certificates for that distribution date, over (y) the total amount of such yield maintenance charge or prepayment premium distributed to the Class A-S Exchangeable Certificates and the Class B Exchangeable Certificates as described above,
and (n) to the holders of the Class X-D certificates, any remaining portion of the Non-Retained Certificates’ Percentage Allocation Entitlement of such yield maintenance charge or prepayment premium not distributed as described above in this clause (1),
and (2) to the RR Interest, its Percentage Allocation Entitlement of such yield maintenance charge or prepayment premium. All yield maintenance charges and prepayment premiums referred to above will be net of any liquidation fees payable therefrom.
No yield maintenance charges or prepayment premiums will be distributed to the holders of the Class X-F, Class X-G, Class X-H, Class X-J, Class F, Class G, Class H, Class J, Class V or Class R Certificates.
“Base Interest Fraction” means, with respect to any principal prepayment of any mortgage loan that provides for the payment of a yield maintenance charge or prepayment premium, and with respect to any class of principal balance certificates (other than the RR Interest), a fraction (A) the numerator of which is the greater of (x) zero and (y) the difference between (i) the pass-through rate on that class, and (ii) the applicable discount rate and (B) the denominator of which is the difference between (i) the mortgage interest rate on the related mortgage loan and (ii) the applicable discount rate; provided, that: under no circumstances will the Base Interest Fraction be greater than one; if the discount rate referred to above is greater than or equal to both the mortgage interest rate on the related mortgage loan and the pass-through rate on that class, then the |
This is not a research report and was not prepared by any Underwriter’s research department. Please see additional important information and qualifications at the end of this Term Sheet. |
T-13
| BANK 2021-BNK38 | Structural Overview |
Base Interest Fraction will equal zero; and if the discount rate referred to above is greater than or equal to the mortgage interest rate on the related mortgage loan and is less than the pass-through rate on that class, then the Base Interest Fraction will be equal to 1.0.
Consistent with the foregoing, the Base Interest Fraction is equal to: |
| (Pass-Through Rate – Discount Rate) | |||
| (Mortgage Rate – Discount Rate) |
| Realized Losses: | On each distribution date, immediately following the distributions to be made to the certificateholders on that date, the certificate administrator is required to calculate the amount, if any, by which (i) the aggregate stated principal balance of the mortgage loans, including any successor REO loans, expected to be outstanding immediately following that distribution date is less than (ii) the then aggregate certificate balance of the principal balance certificates after giving effect to distributions of principal on that distribution date. The Non-Retained Certificates’ Percentage Allocation Entitlement of such amount will be applied to the Class J, Class H, Class G, Class F, Class E and Class D certificates and the Class C, Class B and Class A-S trust components, in that order, in each case until the related certificate or principal balance has been reduced to zero, and then to the Class A-1, Class A-2, Class A-3 and Class A-SB certificates and the Class A-4 and Class A-5 trust components, pro rata based upon their respective certificate or principal balances, until their respective certificate or principal balances have been reduced to zero. The RR Interest’s Percentage Allocation Entitlement of such amount will be applied to the RR Interest until the related RR Interest balance has been reduced to zero.
Any portion of such amount applied to the Class A-4, Class A-5, Class A-S, Class B or Class C trust component will reduce the certificate balance or notional amount of each class of certificates in the related group of Exchangeable Certificates by an amount equal to the product of (x) its certificate balance or notional amount, divided by the principal balance of such trust component prior to the applicable reduction, and (y) the amount applied to such trust component.
| |
| Serviced Whole Loans: | There will be no serviced whole loans or servicing shift mortgage loans related to the trust as of the Closing Date.
| |
| Non-Serviced Whole Loans: | Each of the following mortgaged properties or portfolios of mortgaged properties secures a mortgage loan (each, a “non-serviced mortgage loan”), one or more pari passu promissory notes and, in some cases, one or more generally subordinate promissory notes (each such promissory note, a “non-serviced companion loan”) that will be serviced pursuant to the related intercreditor agreement and the pooling and servicing agreement or trust and servicing agreement (referred to herein as a related “pooling and servicing agreement”) for another securitization transaction: One North Wacker, Park Avenue Plaza, CX – 350 & 450 Water Street and 1201 Lake Robbins. With respect to each such mortgaged property or portfolio of mortgaged properties, the related mortgage loan, together with the related non-serviced companion loan(s), is referred to herein (for so long as it is serviced under the pooling and servicing agreement for another securitization transaction) as a “non-serviced whole loan.” Each non-serviced companion loan is not part of the mortgage pool and may be contributed to one or more future securitization transactions (if not already securitized) or may be otherwise transferred at any time, subject to compliance with the related intercreditor agreement. Servicing of each non-serviced whole loan will generally be directed by the holder of the related control note (or, if such control note is included in a securitization, the directing certificateholder thereunder (or other party designated thereunder to exercise the rights of such control note)), and such holder will have the right to replace the special servicer with respect to the related whole loan with or without cause. See the tables below entitled “Mortgage Loans with Pari Passu Companion Loans” and “Mortgage Loans with Subordinate Debt,” as well as “Description of the Mortgage Pool—The Whole Loans” in the Preliminary Prospectus, for additional information regarding each such whole loan.
| |
| Directing Certificateholder/ Controlling Class: |
The “Directing Certificateholder” will be (i) with respect to a servicing shift mortgage loan, the related Loan-Specific Directing Certificateholder, and (ii) with respect to each other mortgage loan, the Controlling Class Certificateholder (or its representative) selected by more than 50% (by certificate balance) of the Controlling Class Certificateholders; provided, that (1) absent that selection, (2) until a Directing Certificateholder is so selected or (3) upon receipt of a notice from a majority of the Controlling Class Certificateholders (by certificate balance) that a Directing Certificateholder is no longer designated, the Controlling Class Certificateholder that owns the largest aggregate certificate balance of the Controlling Class (or its representative) will be the Directing Certificateholder; provided, that (a) in the case of clause (3), if no one holder owns the largest aggregate certificate balance of the Controlling Class, then there will be no Directing Certificateholder until appointed in accordance with the terms of the pooling and servicing agreement, and (b) the certificate administrator and the other parties to the pooling and servicing agreement will be entitled to assume that the identity of the Directing Certificateholder has not changed until such parties receive written notice of a replacement of the Directing Certificateholder from a party holding the requisite interest in the Controlling Class (as confirmed by the certificate registrar), or the resignation of the then current Directing Certificateholder.
As used herein, the term “Directing Certificateholder,” unless used in relation to a Servicing Shift Mortgage Loan, means the entity determined pursuant to clause (ii) of the definition of such term.
The “Loan-Specific Directing Certificateholder” with respect to a servicing shift mortgage loan is the “controlling holder”, the “directing certificateholder”, the “directing holder”, “directing lender” or any analogous |
This is not a research report and was not prepared by any Underwriter’s research department. Please see additional important information and qualifications at the end of this Term Sheet. |
T-14
| BANK 2021-BNK38 | Structural Overview |
concept under the related intercreditor agreement. Prior to the securitization of the related control note, the Loan-Specific Directing Certificateholder with respect to a servicing shift mortgage loan will be the holder of the related control note. On and after the securitization of the related control note, there will be no Loan-Specific Directing Certificateholder under the PSA with respect to such servicing shift mortgage loan.
The “Controlling Class” will be, as of any time of determination, the most subordinate class of Control Eligible Certificates then outstanding that has an aggregate certificate balance (as notionally reduced by any Cumulative Appraisal Reduction Amounts (as defined below) allocable to such class) at least equal to 25% of the initial certificate balance of that class; provided, that if at any time the certificate balances of the certificates other than the Control Eligible Certificates and the RR Interest have been reduced to zero as a result of principal payments on the mortgage loans, then the Controlling Class will be the most subordinate class of Control Eligible Certificates that has a certificate balance greater than zero without regard to any Cumulative Appraisal Reduction Amounts. The Controlling Class as of the closing date will be the Class J certificates.
The “Control Eligible Certificates” will be any of the Class H and Class J certificates. | ||
| Control Rights: | Prior to a Control Termination Event, the Directing Certificateholder will have certain consent and consultation rights under the pooling and servicing agreement with respect to certain major decisions and other matters. A “Control Termination Event” will occur when (i) the Class H certificates have a certificate balance (taking into account the application of the allocable portion of any Cumulative Appraisal Reduction Amounts to notionally reduce the certificate balance thereof) of less than 25% of the initial certificate balance of that class or (ii) a holder of the Class H certificates is the majority Controlling Class Certificateholder and has irrevocably waived its right, in writing, to exercise any of the rights of the Controlling Class Certificateholder and such rights have not been reinstated to a successor controlling class certificateholder; provided that no Control Termination Event may occur with respect to the Loan-Specific Directing Certificateholder, and the term “Control Termination Event” will not be applicable to the Loan-Specific Directing Certificateholder; provided, further, that a Control Termination Event will be deemed not continuing in the event that the certificate balances of the principal balance certificates other than the Control Eligible Certificates and the RR Interest have been reduced to zero as a result of principal payments on the mortgage loans.
After the occurrence of a Control Termination Event but prior to the occurrence of a Consultation Termination Event, the Directing Certificateholder will not have any consent rights, but the Directing Certificateholder will have certain non-binding consultation rights under the pooling and servicing agreement with respect to certain major decisions and other matters. A “Consultation Termination Event” will occur when (i) no class of Control Eligible Certificates has a certificate balance (without regard to the application of the allocable portion of any Cumulative Appraisal Reduction Amounts) at least equal to 25% of the initial certificate balance of that class; or (ii) a holder of the Class H certificates is the majority Controlling Class Certificateholder and has irrevocably waived its right, in writing, to exercise any of the rights of the Controlling Class Certificateholder and such rights have not been reinstated to a successor controlling class certificateholder; provided that no Consultation Termination Event resulting solely from the operation of clause (ii) will be deemed to have existed or be in continuance with respect to a successor holder of the Class H certificates that has not irrevocably waived its right to exercise any of the rights of the Controlling Class Certificateholder; provided, further, that no Consultation Termination Event may occur with respect to the Loan-Specific Directing Certificateholder, and the term “Consultation Termination Event” will not be applicable to the Loan-Specific Directing Certificateholder; provided, further, that a Consultation Termination Event will be deemed not continuing in the event that the certificate balances of the principal balance certificates other than the Control Eligible Certificates and the RR Interest have been reduced to zero as a result of principal payments on the mortgage loans.
In the event of any transfer of the Class H certificates by a Controlling Class Certificateholder that had irrevocably waived its rights, the successor Controlling Class Certificateholder that purchased such Class H certificates, even if it does not waive its rights, will not have any consent rights with respect to any Mortgage Loan that became a Specially Serviced Loan prior to such successor Controlling Class Certificateholder’s purchase of such Class H certificates and had not become a Corrected Loan prior to such purchase until such Mortgage Loan becomes a Corrected Loan.
After the occurrence of a Consultation Termination Event, the Directing Certificateholder will not have any consent or consultation rights, except with respect to any rights expressly set forth in the pooling and servicing agreement, and the operating advisor will retain certain non-binding consultation rights under the pooling and servicing agreement with respect to certain major decisions and other matters.
Notwithstanding the proviso to the definitions of “Control Termination Event” and “Consultation Termination Event”, a Control Termination Event and a Consultation Termination Event will each be deemed to have occurred with respect to any Excluded Loan with respect to the Directing Certificateholder or the holder of the majority of the Controlling Class, and neither the Directing Certificateholder nor any Controlling Class Certificateholder will have any consent or consultation rights with respect to the servicing of such Excluded Loan.
An “Excluded Loan” means (a) with respect to the Directing Certificateholder or the holder of the majority of the Controlling Class, a mortgage loan or whole loan with respect to which, as of any date of determination, the Directing Certificateholder or the holder of the majority of the Controlling Class is a Borrower Party or (b) with respect to the Risk Retention Consultation Party or the holder of the majority of the RR Interest, a mortgage loan or whole loan with respect to which, as of any date of determination, the Risk Retention Consultation Party or the holder of the majority of the RR Interest is a Borrower Party. It is expected that there will be no Excluded Loans with respect to this securitization on the closing date.
“Borrower Party” means a borrower, a mortgagor, a manager of a mortgaged property, the holder of a mezzanine loan that has been accelerated or as to which foreclosure or enforcement proceedings have been |
This is not a research report and was not prepared by any Underwriter’s research department. Please see additional important information and qualifications at the end of this Term Sheet. |
T-15
| BANK 2021-BNK38 | Structural Overview |
commenced against the equity collateral pledged to secure the related mezzanine loan, or any Borrower Party Affiliate. With respect to a mortgage loan secured by a residential cooperative property, a person will not be considered a “Borrower Party” solely by reason of such person holding one or more cooperative unit loans that are secured by direct equity interests in the related borrower or owning one or more residential cooperative units comprising the related mortgaged property as a result of any foreclosure, transfer in lieu of foreclosure or other exercise of remedies with respect to any such unit loan(s).
“Borrower Party Affiliate” means, with respect to a borrower, a mortgagor, a manager of a mortgaged property or the holder of a mezzanine loan that has been accelerated or as to which foreclosure or enforcement proceedings have been commenced against the equity collateral pledged to secure the related mezzanine loan, (a) any other person controlling or controlled by or under common control with such borrower, mortgagor, manager or mezzanine lender, as applicable, or (b) any other person owning, directly or indirectly, 25% or more of the beneficial interests in such borrower, mortgagor, manager or mezzanine lender, as applicable. For the purposes of this definition, “control” when used with respect to any specified person means the power to direct the management and policies of such person, directly or indirectly, whether through the ownership of voting securities, by contract or otherwise and the terms “controlling” and “controlled” have meanings correlative to the foregoing.
Notwithstanding any of the foregoing to the contrary, if any mortgage loan is part of a whole loan, the Directing Certificateholder’s consent and/or consultation rights with respect thereto may be limited as described in the Preliminary Prospectus. In particular, with respect to each non-serviced whole loan and each servicing shift whole loan, the Directing Certificateholder (other than a Loan-Specific Directing Certificateholder) will only have certain consultation rights with respect to certain major decisions and other matters related to such whole loan, in each case only prior to a Control Termination Event or Consultation Termination Event, as applicable, and the Loan-Specific Directing Certificateholder will be entitled to similar consent and/or consultation rights with respect to such whole loan. In addition, with respect to any serviced A/B whole loan, for so long as the holder of the related subordinate companion loan is the controlling note holder, the holder of such subordinate companion loan (rather than the Directing Certificateholder) will be entitled to exercise such consent and consultation rights with respect to such whole loan.
| ||
| Appraisal Reduction Amounts and Collateral Deficiency Amounts: |
An “Appraisal Reduction Amount” generally will be created in the amount, if any, by which the principal balance of a required appraisal loan (which is a mortgage loan with respect to which certain defaults, modifications or insolvency events have occurred as further described in the Preliminary Prospectus) plus other amounts overdue or advanced in connection with such mortgage loan exceeds 90% of the appraised value of the related mortgaged property plus certain escrows and reserves (including letters of credit) held with respect to the mortgage loan.
A mortgage loan will cease to be subject to an Appraisal Reduction Amount when it has been brought current for at least three consecutive months, no additional event of default is foreseeable in the reasonable judgment of the applicable special servicer and no other circumstances exist that would cause such mortgage loan or any related companion loan to be a specially serviced loan; however, a “Collateral Deficiency Amount” may exist with respect to any mortgage loan that is modified into an AB loan structure (an “AB Modified Loan”) and remains a corrected mortgage loan and, if so, will generally equal the excess of (i) the stated principal balance of such AB Modified Loan (taking into account the related junior note(s) and any pari passu notes included therein), over (ii) the sum of (in the case of a whole loan, solely to the extent allocable to the subject mortgage loan) (x) the most recent appraised value for the related mortgaged property or mortgaged properties, plus (y) solely to the extent not reflected or taken into account in such appraised value (or in the calculation of any related Appraisal Reduction Amount) and to the extent on deposit with, or otherwise under the control of, the lender as of the date of such determination, any capital or additional collateral contributed by the related borrower at the time the mortgage loan became (and as part of the modification related thereto) such AB Modified Loan for the benefit of the related mortgaged property or mortgaged properties (provided that in the case of an non-serviced mortgage loan, the amounts set forth in this clause (y) will be taken into account solely to the extent relevant information is received by the applicable master servicer), plus (z) any other escrows or reserves (in addition to any amounts set forth in the immediately preceding clause (y) and solely to the extent not reflected or taken into account in the calculation of any related Appraisal Reduction Amount) held by the lender in respect of such AB Modified Loan as of the date of such determination, which such excess, for the avoidance of doubt, will be determined separately from and exclude any related Appraisal Reduction Amounts.
As used herein, a “Cumulative Appraisal Reduction Amount” will be the sum of any Appraisal Reduction Amounts and any Collateral Deficiency Amounts.
Any Appraisal Reduction Amount in respect of any non-serviced mortgage loan generally will be calculated in accordance with the other servicing agreement pursuant to which such mortgage loan is being serviced, which calculations are expected to be generally similar to those provided for in the pooling and servicing agreement for this transaction.
If any mortgage loan is part of a whole loan, any Appraisal Reduction Amount or Collateral Deficiency Amount will (or effectively will) be calculated in respect of such whole loan taken as a whole and allocated, to the extent provided in the related intercreditor agreement and the related pooling and servicing agreement, first, to any related subordinate companion loan, and second, to the related mortgage loan and any pari passu companion loan on a pro rata basis by unpaid principal balance. |
This is not a research report and was not prepared by any Underwriter’s research department. Please see additional important information and qualifications at the end of this Term Sheet. |
T-16
| BANK 2021-BNK38 | Structural Overview |
Appraisal Reduction Amounts will proportionately reduce the interest portion of debt service advances required to be made in respect of the related mortgage loan. Appraisal Reduction Amounts and Collateral Deficiency Amounts (in each case, to the extent of the Non-Retained Certificates’ Percentage Allocation Entitlement thereof) will be (i) taken into account in determining the identity of the controlling class entitled to appoint the Directing Certificateholder, the existence of a Control Termination Event and the allocation and/or exercise of voting rights for certain purposes (see “Directing Certificateholder/Controlling Class” above) and (ii) allocated to the following classes of certificates and trust components, in each case to notionally reduce their certificate balances or principal balances until the certificate balance or principal balance of each such class or trust component is notionally reduced to zero: the Class J, Class H, Class G, Class F, Class E and Class D certificates and the Class C, Class B and Class A-S trust components, in that order, and then pro rata to the Class A-1, Class A-2, Class A-3 and Class A-SB certificates and the Class A-4 and Class A-5 trust components. Appraisal Reduction Amounts and Collateral Deficiency Amounts allocated to the Class A-4, Class A-5, Class A-S, Class B or Class C trust component will be allocated to the corresponding classes of Exchangeable Certificates with certificate balances pro rata to notionally reduce their certificate balances in accordance with their Class Percentage Interests therein.
Neither (i) a Payment Accommodation with respect to any mortgage loan or serviced whole loan nor (ii) any default or delinquency that would have existed but for such Payment Accommodation will constitute an appraisal reduction event, for so long as the related borrower is complying with the terms of such Payment Accommodation.
A “Payment Accommodation” for any mortgage loan or serviced whole loan means the entering into of any temporary forbearance agreement as a result of the COVID-19 emergency relating to payment obligations or operating covenants under the related mortgage loan documents or the use of funds on deposit in any reserve account or escrow account for any purpose other than the explicit purpose described in the related mortgage loan documents, that in each case requires full repayment of deferred payments, reserves and escrows by the date that is 24 months following the date of the first Payment Accommodation for such mortgage loan or serviced whole loan.
| ||
| Appraised-Out Class: | An “Appraised-Out Class” is any class of Control Eligible Certificates, the certificate balance of which (taking into account the application of the Non-Retained Certificates’ Percentage Allocation Entitlement of any Appraisal Reduction Amounts or Collateral Deficiency Amounts to notionally reduce the certificate balance of such class) has been reduced to less than 25% of its initial certificate balance. Any Appraised-Out Class may not exercise any direction, control, consent and/or similar rights of the Controlling Class until such time, if any, as such class is reinstated as the Controlling Class, and the rights of the Controlling Class will be exercised by the next most senior class of Control Eligible Certificates that is not an Appraised-Out Class, if any, during such period.
| |
| Appraisal Remedy: | The holders of the majority (by certificate balance) of an Appraised-Out Class (such holders, the “Requesting Holders”) will have the right, at their sole expense, to require the applicable special servicer to order (or, with respect to a non-serviced mortgage loan, require the applicable master servicer to request from the applicable non-serviced special servicer) a second appraisal of any mortgage loan (or serviced whole loan) for which an appraisal reduction event has occurred or as to which there exists a Collateral Deficiency Amount. With respect to any serviced mortgage loan, the applicable special servicer will be required to use its reasonable efforts to cause such appraisal to be delivered within 30 days from receipt of the Requesting Holders’ written request and will cause such appraisal to be prepared on an “as-is” basis by an MAI appraiser. With respect to any non-serviced mortgage loan, the applicable master servicer will be required to use commercially reasonable efforts to obtain such second appraisal from the applicable non-serviced special servicer and to forward such second appraisal to the applicable special servicer. Upon receipt of such supplemental appraisal, the applicable master servicer (for Collateral Deficiency Amounts on non-serviced mortgage loans), the non-serviced special servicer (for Appraisal Reduction Amounts on non-serviced mortgage loans to the extent provided for in the applicable Non-Serviced PSA and applicable intercreditor agreement) and the applicable special servicer (for any serviced mortgage loan) will be required to determine, in accordance with the Servicing Standard, whether, based on its assessment of such supplemental appraisal, any recalculation of the applicable Appraisal Reduction Amount or Collateral Deficiency Amount is warranted and, if so warranted, such person will be required to recalculate such Appraisal Reduction Amount or Collateral Deficiency Amount, as applicable, based upon such supplemental appraisal and (for any serviced mortgage loan) receipt of information reasonably requested by such special servicer from the applicable master servicer as described above. If required by any such recalculation, the applicable Appraised-Out Class will be reinstated as the Controlling Class and each Appraised-Out Class will, if applicable, have its related certificate balance notionally restored to the extent required by such recalculation of the Appraisal Reduction Amount or Collateral Deficiency Amount, if applicable.
| |
| Sale of Defaulted Loans: | Under certain circumstances the applicable special servicer may be required to use reasonable efforts to solicit offers for a defaulted serviced mortgage loan that is a specially serviced mortgage loan (and any related companion loan (to the extent provided under the related intercreditor agreement) and/or related REO properties).
The Directing Certificateholder will not have a right of first refusal to purchase a defaulted loan.
If the applicable special servicer does not receive an offer at least equal to the outstanding principal balance plus all accrued and unpaid interest and outstanding costs and expenses and certain other amounts specified in the pooling and servicing agreement (the “Par Purchase Price”), the applicable special servicer may purchase the defaulted loan or REO property at the Par Purchase Price or may accept the first cash offer received from any person that is determined to be a fair price for such defaulted loan or REO property. If |
This is not a research report and was not prepared by any Underwriter’s research department. Please see additional important information and qualifications at the end of this Term Sheet. |
T-17
| BANK 2021-BNK38 | Structural Overview |
multiple offers are received during the period designated by the applicable special servicer for receipt of offers, such special servicer is generally required to select the highest offer. The applicable special servicer will be required to determine whether any cash offer constitutes a fair price for any defaulted loan or REO property if the highest offeror is a person other than a party to the pooling and servicing agreement for this transaction (the “PSA”), the Directing Certificateholder, the Risk Retention Consultation Party, any sponsor, any Borrower Party, any independent contractor engaged by a special servicer, the trustee for the securitization of a related companion loan (with respect to a whole loan if it is a defaulted loan), any related companion loan holder or its representative, any holder of a related mezzanine loan or any known affiliate of any of the preceding entities (each, an “Interested Person”). If an offer is made by an Interested Person, the trustee will be required to determine (based upon the most recent appraisal conducted in accordance with the terms of the PSA) whether the offer constitutes a fair price for the defaulted loan or REO property unless (i) the offer is equal to or greater than the applicable Par Purchase Price and (ii) the offer is the highest offer received. Absent an offer at least equal to the Par Purchase Price, no offer from an Interested Person will constitute a fair price unless (x) it is the highest offer received and (y) at least two other offers are received from independent third parties. Neither the trustee nor any of its affiliates may make an offer for or purchase any specially serviced loan or REO property.
Notwithstanding any of the foregoing to the contrary, the applicable special servicer is not required to accept the highest offer and may accept a lower offer for a defaulted loan or REO property if such special servicer determines, in accordance with the Servicing Standard (and subject to the requirements of any related intercreditor agreement), that a rejection of such offer would be in the best interests of the certificateholders and any related companion loan holders as a collective whole as if they constituted a single lender (and with respect to a serviced A/B whole loan, taking into account the subordinate nature of any related subordinate companion loan), so long as such lower offer was not made by such special servicer or any of its affiliates.
If title to any mortgaged property is acquired by the trust fund, the applicable special servicer will generally be required to sell such mortgaged property prior to the close of the third calendar year beginning after the year of acquisition.
The foregoing applies to mortgage loans serviced under the PSA. With respect to any non-serviced whole loan, if the special servicer under the applicable pooling and servicing agreement determines to sell the related controlling companion loan if it becomes a defaulted loan, then the applicable special servicer will be required to sell the related whole loan, including the related mortgage loan included in the BANK 2021-BNK38 securitization trust and the related pari passu companion loan(s) and, under certain circumstances, any subordinate companion loan(s), as a single loan. In connection with any such sale, the special servicer under the applicable pooling and servicing agreement will be required to follow procedures substantially similar to those set forth above.
| ||
| Risk Retention Consultation Party: |
A risk retention consultation party may be appointed by the holder or holders of more than 50% of the RR Interest, by certificate balance. The majority RR Interest holder will have a continuing right to appoint, remove or replace the risk retention consultation party in its sole discretion. This right may be exercised at any time and from time to time. Except with respect to an Excluded Loan as to such party or the holder of the majority of the RR Interest, the risk retention consultation party will be entitled to consult with the applicable special servicer, upon request of the risk retention consultation party, with respect to certain material servicing actions proposed by such special servicer; provided, that prior to the occurrence and continuance of a Consultation Termination Event, such mortgage loan must also be a specially serviced mortgage loan.
| |
| Appointment and Replacement of each Special Servicer: |
The Directing Certificateholder will appoint each initial special servicer as of the closing date. Prior to the occurrence and continuance of a Control Termination Event, any special servicer may generally be replaced by the Directing Certificateholder with or without cause at any time.
After the occurrence and during the continuance of a Control Termination Event and upon (a) the written direction of holders of principal balance certificates evidencing not less than 25% of the voting rights of all classes of certificates (other than the RR Interest) entitled to principal (taking into account the application of Cumulative Appraisal Reduction Amounts to notionally reduce the certificate balances of classes to which such Cumulative Appraisal Reduction Amounts are allocable) requesting a vote to replace the applicable special servicer with a replacement special servicer, (b) payment by such requesting holders to the certificate administrator of all reasonable fees and expenses to be incurred by the certificate administrator in connection with administering such vote and (c) delivery by such holders of a rating agency confirmation from each applicable rating agency, the certificate administrator will be required to promptly post such notice on its internet website and by mail and conduct the solicitation of votes of all certificates in such regard, which requisite affirmative votes must be received within 180 days of the posting of such notice. Upon the written direction of holders of at least 66 2/3% of a Certificateholder Quorum, the trustee will be required to immediately replace the applicable special servicer with a qualified replacement special servicer designated by such holders of certificates.
After the occurrence and during the continuance of a Consultation Termination Event, if the operating advisor determines that the applicable special servicer is not performing its duties as required under the pooling and servicing agreement or is otherwise not acting in accordance with the Servicing Standard, the operating advisor may also recommend the replacement of such special servicer. The operating advisor’s recommendation to replace such special servicer must be confirmed by an affirmative vote of holders of principal balance certificates evidencing at least a majority of the aggregate voting rights (taking into account the application of any Cumulative Appraisal Reduction Amounts to notionally reduce the respective certificate balances) of all principal balance certificates on an aggregate basis (which requisite affirmative vote must be |
This is not a research report and was not prepared by any Underwriter’s research department. Please see additional important information and qualifications at the end of this Term Sheet. |
T-18
| BANK 2021-BNK38 | Structural Overview |
received within 180 days of posting of the notice of the operating advisor’s recommendation to the certificate administrator’s website).
A “Certificateholder Quorum” means, in connection with any solicitation of votes in connection with the replacement of a special servicer or the asset representations reviewer, the holders of certificates evidencing at least 50% of the aggregate voting rights (taking into account the application of realized losses and, other than with respect to the termination of the asset representations reviewer, any Cumulative Appraisal Reduction Amounts to notionally reduce the certificate balance of the certificates) of all classes of certificates entitled to principal (other than the RR Interest) on an aggregate basis.
With respect to each serviced whole loan, any holder of a related pari passu companion loan, following a servicer termination event with respect to the applicable special servicer that affects such holder, will be entitled to direct the trustee (and the trustee will be required) to terminate such special servicer solely with respect to such serviced whole loan. A replacement special servicer will be selected by the trustee or, prior to a Control Termination Event, by the Directing Certificateholder; provided, that any successor special servicer appointed to replace the special servicer with respect to such whole loan cannot be the entity (or its affiliate) that was terminated at the direction of the holder of the related pari passu companion loan.
Notwithstanding any of the foregoing to the contrary, with respect to each servicing shift whole loan and any serviced A/B whole loans as to which a subordinate companion loan holder is the related controlling note holder, the holder of the related control note will be entitled to replace the applicable special servicer with respect to such whole loan at any time, with or without cause, and while it is a serviced whole loan, no other party may replace the applicable special servicer for such whole loan unless there is a servicer termination event with respect thereto.
With respect to any non-serviced whole loan, subject to conditions or restrictions in the applicable intercreditor agreement, the BANK 2021-BNK38 trust, as holder of the related mortgage loan, has the right to terminate the applicable special servicer under the related pooling and servicing agreement if a servicer termination event occurs with respect to such special servicer that affects the trust in its capacity as such holder. Such rights may be exercised by the Directing Certificateholder prior to a Consultation Termination Event (or the applicable special servicer, following the occurrence and during the continuance of a Consultation Termination Event). The successor special servicer will be selected pursuant to the applicable pooling and servicing agreement by the related directing holder prior to a control termination event under such pooling and servicing agreement.
| ||
| Servicing Standard: | Each applicable master servicer and each applicable special servicer is obligated to service and administer the mortgage loans (and, if applicable, the serviced companion loans) in accordance with the definition of the “Servicing Standard” described in the Preliminary Prospectus and the terms of the pooling and servicing agreement, provided that each non-serviced mortgage loan, if any, will be serviced by another master servicer or special servicer under the pooling and servicing agreement with respect to the securitization of a related companion loan, which entities will be obligated to service and administer such non-serviced mortgage loan pursuant to a similar standard set forth in the related pooling and servicing agreement.
| |
| Excluded Special Servicer: | If a special servicer obtains knowledge that it has become a Borrower Party with respect to any mortgage loan (an “Excluded Special Servicer Loan”), such special servicer will be required to resign as special servicer of that Excluded Special Servicer Loan. Prior to the occurrence and continuance of a Control Termination Event, the Directing Certificateholder will be required to appoint (and may remove and replace with or without cause) a separate special servicer that is not a Borrower Party (an “Excluded Special Servicer”) with respect to any Excluded Special Servicer Loan, unless such Excluded Special Servicer Loan is also an Excluded Loan with respect to the Directing Certificateholder or the holder of the majority of the Controlling Class. After the occurrence and during the continuance of a Control Termination Event, if at any time the applicable Excluded Special Servicer Loan is also an Excluded Loan with respect to the Directing Certificateholder or the holder of the majority of the Controlling Class or if the Directing Certificateholder is entitled to appoint the Excluded Special Servicer but does not so appoint within 30 days of notice of such resignation, the resigning special servicer will be required to use reasonable efforts to select the related Excluded Special Servicer. Any Excluded Special Servicer will be required to perform all of the obligations of the applicable special servicer and will be entitled to all special servicing compensation with respect to such Excluded Special Servicer Loan earned while the related mortgage loan is an Excluded Special Servicer Loan.
| |
| Liquidated Loan Waterfall: | On liquidation of any mortgage loan, all net liquidation proceeds related to the mortgage loan (but not any related companion loan) will be applied so that amounts allocated as a recovery of accrued and unpaid interest will not, in the first instance, include any delinquent interest that was not advanced as a result of Appraisal Reduction Amounts (or would not have been advanced in the absence of a non-recoverability determination) or accrued on the portion of the stated principal balance thereof equal to any related Collateral Deficiency Amount in effect from time to time and as to which no advance was made (collectively, the “Subordinated Interest Amount”). After the adjusted interest amount is so allocated, any remaining liquidation proceeds will be allocated to pay principal on the mortgage loan until the unpaid principal amount of the mortgage loan has been reduced to zero. Any remaining liquidation proceeds will then be allocated to pay the Subordinated Interest Amount.
| |
| Operating Advisor: | The operating advisor will be required to perform certain review duties if a Control Termination Event has occurred and is continuing, which will generally include a limited annual review of, and the preparation of a report regarding, certain actions of the applicable special servicer with respect to the resolution and/or |
This is not a research report and was not prepared by any Underwriter’s research department. Please see additional important information and qualifications at the end of this Term Sheet. |
T-19
| BANK 2021-BNK38 | Structural Overview |
liquidation of specially serviced loans. The review and report generally will be based on any asset status reports and additional information delivered to the operating advisor by such special servicer. In addition, if a Control Termination Event has occurred and is continuing, the applicable special servicer must consult with the operating advisor (in addition to the Directing Certificateholder if no Consultation Termination Event has occurred and is continuing) in connection with major decisions with respect to mortgage loans. Furthermore, under certain circumstances, but only if a Consultation Termination Event has occurred and is continuing, the operating advisor may recommend the replacement of the applicable special servicer as described above under “—Appointment and Replacement of each Special Servicer”; however, the operating advisor will not have any rights or obligations with respect to a non-serviced whole loan.
If a Consultation Termination Event has occurred and is continuing, the operating advisor may be removed and replaced without cause upon the affirmative direction of certificates owners holding not less than 75% of the voting rights of all certificates (taking into account the application of Cumulative Appraisal Reduction Amounts), following a proposal from certificate owners holding not less than 25% of the voting rights of all certificates (taking into account the application of Cumulative Appraisal Reduction Amounts). The certificateholders who initiate a vote on a termination and replacement of the operating advisor without cause must cause the payment of the fees and expenses incurred in the replacement. In addition, in the event there are no classes of certificates outstanding other than the Control Eligible Certificates, the RR Interest and the Class X-F, Class X-G, Class X-H, Class X-J, Class F, Class G, Class V and Class R certificates, then all of the rights and obligations of the operating advisor under the PSA will terminate without payment of any penalty or termination fee (other than any rights or obligations that accrued prior to the date of such termination (including accrued and unpaid compensation) and other than indemnification rights arising out of events occurring prior to such termination). See “Pooling and Servicing Agreement—The Operating Advisor—Termination of the Operating Advisor Without Cause” in the Preliminary Prospectus.
| ||
| Asset Representations Reviewer: | The asset representations reviewer will be required to review certain delinquent mortgage loans (excluding a mortgage loan for which a Payment Accommodation has been made and the related borrower is complying with the terms of such Payment Accommodation) after a specified delinquency threshold has been met and the required percentage of certificateholders vote to direct a review as described below. The asset representations reviewer will be entitled to the Asset Representations Reviewer Fee with respect to such review. See “Pooling and Servicing Agreement—The Asset Representations Reviewer” in the Preliminary Prospectus.
The certificate administrator will be required to notify certificateholders if the specified delinquency threshold has been met as described in the Preliminary Prospectus under “—The Asset Representations Reviewer”.
If certificateholders evidencing not less than 5.0% of the voting rights request a vote to commence an asset review, and if subsequently (i) a majority of those certificateholders who cast votes and (ii) a majority of an Asset Review Quorum authorizes an asset review within 150 days of the request for a vote, the asset representations reviewer will be required to conduct an asset review of delinquent loans.
The asset representations reviewer may be terminated and replaced without cause. Upon (i) the written direction of certificateholders evidencing not less than 25% of the voting rights (without regard to the application of any Cumulative Appraisal Reduction Amounts) requesting a vote to terminate and replace the asset representations reviewer with a proposed successor asset representations reviewer that is an eligible asset representations reviewer, and (ii) payment by such holders to the certificate administrator of the reasonable fees and expenses to be incurred by the certificate administrator in connection with administering such vote, the certificate administrator will be required to promptly provide notice to all certificateholders and the asset representations reviewer of such request by posting such notice on its internet website, and by mailing such notice to all certificateholders and the asset representations reviewer. Upon the written direction of certificateholders evidencing at least 75% of a Certificateholder Quorum (without regard to the application of any Cumulative Appraisal Reduction Amounts), the trustee will be required to terminate all of the rights and obligations of the asset representations reviewer under the pooling and servicing agreement (other than any rights or obligations that accrued prior to the date of such termination and other than indemnification rights arising out of events occurring prior to such termination) by written notice to the asset representations reviewer, and the proposed successor asset representations reviewer will be appointed. See “Pooling and Servicing Agreement—The Asset Representations Reviewer” in the Preliminary Prospectus.
An “Asset Review Quorum” means, in connection with any solicitation of votes to authorize an Asset Review as described above, the holders of certificates evidencing at least 5.0% of the aggregate voting rights represented by all certificates that have voting rights.
| |
| Dispute Resolution Provisions: | The mortgage loan sellers will be subject to the dispute resolution provisions set forth in the PSA to the extent those provisions are triggered with respect to any mortgage loan sold to the depositor by a mortgage loan seller, and such mortgage loan seller will be obligated under the related mortgage loan purchase agreement to comply with all applicable provisions and to take part in any mediation or arbitration proceedings that may result. Generally, in the event that a Repurchase Request is not “Resolved” within 180 days after the related mortgage loan seller receives such Repurchase Request, then the enforcing servicer will be required to send a notice to the first certificateholder (or beneficial owner) to deliver a certificateholder repurchase request with respect to the mortgage loan (the “Initial Requesting Certificateholder”) (if any) and to the certificate administrator (which will be required to make such notice available to certificateholders via the certificate administrator’s website) indicating the enforcing servicer’s intended course of action with respect to the Repurchase Request. If (a) the enforcing servicer’s intended course of action with respect to the Repurchase Request does not involve pursuing further action to exercise rights against the related mortgage loan seller with respect to the Repurchase Request and the Initial Requesting Certificateholder, if any, or any other |
This is not a research report and was not prepared by any Underwriter’s research department. Please see additional important information and qualifications at the end of this Term Sheet. |
T-20
| BANK 2021-BNK38 | Structural Overview |
certificateholder or certificate owner wishes to exercise its right to refer the matter to mediation (including nonbinding arbitration) or arbitration, or (b) the enforcing servicer’s intended course of action is to pursue further action to exercise rights against the related mortgage loan seller with respect to the Repurchase Request but the Initial Requesting Certificateholder, if any, or any other certificateholder or certificate owner does not agree with the dispute resolution method selected by the enforcing servicer, then the Initial Requesting Certificateholder, if any, or such other certificateholder or certificate owner may deliver a written notice to the enforcing servicer indicating its intent to exercise its right to refer the matter to either mediation or arbitration.
“Resolved” means, with respect to a Repurchase Request, (i) that the related material defect or breach has been cured, (ii) the related mortgage loan has been repurchased in accordance with the related mortgage loan purchase agreement, (iii) a mortgage loan has been substituted for the related mortgage loan in accordance with the related mortgage loan purchase agreement, (iv) the applicable mortgage loan seller has made a loss of value payment, (v) a contractually binding agreement has been entered into between the enforcing servicer, on behalf of the issuing entity, and the related mortgage loan seller that settles the related mortgage loan seller’s obligations under the related mortgage loan purchase agreement, or (vi) the related mortgage loan is no longer property of the issuing entity as a result of a sale or other disposition in accordance with the pooling and servicing agreement. See “Pooling and Servicing Agreement—Dispute Resolution Provisions” in the Preliminary Prospectus.
| ||
| Investor Communications: | The certificate administrator is required to include on any Form 10-D any request received from a certificateholder to communicate with other certificateholders related to certificateholders exercising their rights under the terms of the PSA. Any certificateholder wishing to communicate with other certificateholders regarding the exercise of its rights under the terms of the PSA will be able to deliver a written request signed by an authorized representative of the requesting investor to the certificate administrator.
| |
| Deal Website: | The certificate administrator will be required to maintain a deal website which will include, among other items: (a) summaries of asset status reports prepared by a special servicer, (b) inspection reports, (c) appraisals, (d) various “special notices” described in the Preliminary Prospectus, (e) the “Investor Q&A Forum” and (f) a voluntary “Investor Registry”. Investors may access the deal website following execution of a certification and confidentiality agreement. |
This is not a research report and was not prepared by any Underwriter’s research department. Please see additional important information and qualifications at the end of this Term Sheet. |
T-21
| BANK 2021-BNK38 | Collateral Overview |
| Mortgage Loan Sellers | No. of Mortgage Loans | No. of Mortgaged Properties | Aggregate Cut-off Date Balance | % of Pool(1) | ||||
| Morgan Stanley Mortgage Capital Holdings LLC | 18 | 26 | $296,898,500 | 40.7% | ||||
| Bank of America, National Association | 15 | 23 | $217,400,000 | 29.8% | ||||
| Wells Fargo Bank, National Association | 11 | 14 | $148,338,107 | 20.3% | ||||
| National Cooperative Bank, N.A.(2) | 21 | 21 | $66,377,557 | 9.1% | ||||
| Total: | 65 | 84 | $729,014,163 | 100.0% |
Pool Statistics
| Aggregate Cut-off Date Balance: | $729,014,163 | |
| Number of Mortgage Loans: | 65 | |
| Average Cut-off Date Balance per Mortgage Loan: | $11,215,603 | |
| Number of Mortgaged Properties: | 84 | |
| Average Cut-off Date Balance per Mortgaged Property: | $8,678,740 | |
| Weighted Average Mortgage Rate: | 3.2456% | |
| % of Pool Secured by 5 Largest Mortgage Loans: | 41.7% | |
| % of Pool Secured by 11 Largest Mortgage Loans: | 59.2% | |
| % of Pool Secured by ARD Loans(3): | 10.2% | |
| Weighted Average Original Term to Maturity (months)(3): | 118 | |
| Weighted Average Remaining Term to Maturity (months)(3): | 117 | |
| Weighted Average Seasoning (months): | 1 | |
| % of Pool Secured by Single Tenant Mortgaged Properties: | 20.3% | |
| % of Pool Secured by Refinance Loans: | 73.9% | |
| % of Pool Secured by Acquisition Loans: | 18.1% | |
| % of Pool Secured by Recapitalization Loans: | 7.5% | |
| % of Pool Secured by Refinance & Recapitalization Loans: | 0.4% |
Additional Debt
| % of Pool with Pari Passu Mortgage Debt: | 34.6% | |
| % of Pool with Subordinate Debt(4): | 17.1% | |
| % of Pool with Mezzanine Mortgage Debt: | 9.6% |
Credit Statistics(5)(6)
| Weighted Average UW NOI DSCR: | 4.00x | |
| Weighted Average UW NOI Debt Yield: | 14.1% | |
| Weighted Average UW NCF DSCR: | 3.85x | |
| Weighted Average UW NCF Debt Yield: | 13.6% | |
| Weighted Average Cut-off Date LTV Ratio(7): | 49.2% | |
| Weighted Average Maturity Date LTV Ratio(3)(7): | 48.6% |
Footnotes are set forth on the following page.
This is not a research report and was not prepared by any Underwriter’s research department. Please see additional important information and qualifications at the end of this Term Sheet. |
T-22
| BANK 2021-BNK38 | Collateral Overview |
Amortization
| Weighted Average Original Amortization Term (months)(8): | 372 | |
| Weighted Average Remaining Amortization Term (months)(8): | 371 | |
| % of Pool Interest Only through Maturity: | 78.7% | |
| % of Pool Amortizing Balloon: | 7.5% | |
| % of Pool Interest Only, ARD: | 7.5% | |
| % of Pool Interest Only, Amortizing Balloon: | 3.5% | |
| % of Pool Interest Only, Amortizing ARD: | 2.7% |
Lockboxes
| % of Pool with Hard Lockboxes: | 53.5% | |
| % of Pool with Springing Lockboxes: | 37.4% | |
| % of Pool with No Lockboxes: | 9.1% |
Reserves
| % of Pool Requiring Tax Reserves: | 64.0% | |
| % of Pool Requiring Insurance Reserves: | 10.2% | |
| % of Pool Requiring Replacement Reserves: | 51.8% | |
| % of Pool Requiring TI/LC Reserves(9): | 64.8% |
Call Protection
| % of Pool with lockout period, followed by defeasance until open period: | 58.7% | |
| % of Pool with lockout period, followed by defeasance or the greater of a prepayment premium and yield maintenance until open period: | 9.9% | |
| % of Pool with no lockout period. The greater of a prepayment premium and yield maintenance, followed by defeasance or the greater of a prepayment premium and yield maintenance until open period: | 9.6% | |
| % of Pool with no lockout period. Greater of a prepayment premium and yield maintenance followed by prepayment premium until open period | 9.1% | |
| % of Pool with lockout period. The greater of a prepayment premium and yield maintenance, followed by defeasance or the greater of a prepayment premium and yield maintenance until open period: | 7.5% | |
| % of Pool with lockout period, followed by the greater of a prepayment premium and yield maintenance until open period: | 5.2% |
| (1) | Unless otherwise indicated, all references to “% of Pool” in this Term Sheet reflect a percentage of the aggregate principal balance of the mortgage pool as of the Cut-off Date, after application of all payments of principal due during or prior to December 2021. |
| (2) | Twenty (20) of the twenty-one (21) mortgage loans for which National Cooperative Bank, N.A. is the mortgage loan seller were originated by its parent company, National Consumer Cooperative Bank, and transferred to National Cooperative Bank, N.A. Each such mortgage loan originated by National Consumer Cooperative Bank was underwritten pursuant to National Cooperative Bank, N.A.’s underwriting guidelines. |
| (3) | With respect to any ARD Loan, unless otherwise indicated, references in this Term Sheet to the applicable “maturity date” or “maturity” refer to the applicable anticipated repayment date with respect to such ARD Loan, and such applicable anticipated repayment date is treated as its maturity date for all purposes hereof. |
| (4) | Nineteen (19) of the mortgage loans, each of which is secured by a residential cooperative property, currently have subordinate secured lines of credit to the related mortgage borrowers that permit future advances (such loans, collectively, the “Subordinate Coop LOCs”). The percentage figure expressed as “% of Pool with Subordinate Mortgage Debt” is determined as a percentage of the initial pool balance and does not take into account any Subordinate Coop LOCs and future subordinate debt (whether or not secured by the mortgaged property), if any, that may be permitted under the terms of any mortgage loan or the pooling and servicing agreement. See “Description of the Mortgage Pool—Additional Indebtedness—Other Secured Indebtedness” and “Description of the Mortgage Pool—Additional Debt Financing for Mortgage Loans Secured by Residential Cooperatives” in the Preliminary Prospectus. |
| (5) | With respect to any mortgage loan that is part of a whole loan, unless otherwise indicated, all LTV, DSCR and Debt Yield calculations in this Term Sheet include any related pari passu companion loans and exclude any subordinate companion loans, as applicable. Additionally, LTV, DSCR and Debt Yield figures in this Term Sheet are calculated for mortgage loans without regard to any additional indebtedness that may be incurred at a future date. For mortgaged properties securing residential cooperative mortgage loans all LTV, DSCR and Debt Yield calculations do not take into account any subordinate debt (whether or not secured by the related mortgaged property), that currently exists or is allowed under the terms of any mortgage loan. The information for each mortgaged property that relates to a mortgage loan that is cross-collateralized or cross-defaulted with one or more other mortgage loans is based upon the principal balance of that mortgage loan, except that the applicable loan-to-value ratio, debt service coverage ratio, and debt yield for each such mortgage loan is based upon the ratio or yield (as applicable) for the aggregate indebtedness evidenced by all loans in the group (without regard to any limitation on the amount of indebtedness secured by any mortgaged property in such cross-collateralized group). |
| (6) | For mortgaged properties securing residential cooperative mortgage loans, all DSCR and Debt Yield calculations for each such mortgaged property is calculated using underwritten net operating Income or underwritten net cash flow, as applicable, for the related residential cooperative property which is the projected net operating income or net cash flow, as applicable, reflected in the most recent appraisal obtained by or otherwise in the possession of the related mortgage loan seller as of the Cut-off Date. All LTV ratio calculations are based upon the appraised value of the residential cooperative property determined as if such residential cooperative property is operated as a residential cooperative, inclusive of the amount of the underlying debt encumbering such residential cooperative property. |
| (7) | The LTV ratios set forth in this Term Sheet are generally based on the “as-is” values of the related mortgaged properties; provided that the “as-is” value for a portfolio of mortgaged properties may include a premium relating to the valuation of the mortgaged properties as a whole rather than as the sum of individually valued mortgaged properties; provided, further, that such LTV ratios may be based on “as-stabilized”, “as complete” or other contingent values in certain cases in which reserves have been established at origination for the applicable condition or circumstance that is expected to result in stabilization provided, further, that such LTV ratios may have been calculated based on a principal balance that is net of a holdback or earnout reserve. See the definition of “Appraised Value” under “Description of the Mortgage Pool—Certain Calculations and Definitions” in the Preliminary Prospectus. |
| (8) | Excludes mortgage loans that provide for payments of interest only through the related maturity date or anticipated repayment date, as applicable. |
| (9) | Excludes multifamily, self storage and manufactured housing properties. |
This is not a research report and was not prepared by any Underwriter’s research department. Please see additional important information and qualifications at the end of this Term Sheet. |
T-23
| BANK 2021-BNK38 | Characteristics of the Mortgage Loans |
| Top 11 Mortgage Loans or Groups of Cross-Collateralized Mortgage Loans(1) | ||||||||||||||||||||||||||
| Loan No. | Mortgage Loan Seller | Property Name | City | State | Property Type | Cut-off Date Balance | % of Pool | SF/Units | Cut-off Date Balance per SF/Unit | UW NCF DSCR | UW NOI Debt Yield | Cut-off Date LTV | Maturity Date LTV | |||||||||||||
| 1 | BANA | One North Wacker | Chicago | IL | Office | $72,000,000 | 9.9% | 1,412,035 | $249.99 | 2.96x | 8.9% | 53.2% | 53.2% | |||||||||||||
| 2 | MSMCH | Park Avenue Plaza | New York | NY | Office | $70,000,000 | 9.6% | 1,159,593 | $292.49 | 5.84x | 17.4% | 31.9% | 31.9% | |||||||||||||
| 3 | BANA | CX - 350 & 450 Water Street | Cambridge | MA | Mixed Use | $55,000,000 | 7.5% | 915,233 | $889.39 | 3.50x | 9.9% | 41.7% | 41.7% | |||||||||||||
| 4 | WFB | 1201 Lake Robbins | The Woodlands | TX | Office | $55,000,000 | 7.5% | 807,586 | $309.56 | 2.26x | 9.2% | 55.3% | 55.3% | |||||||||||||
| 5 | MSMCH | Bella Terra | Richmond | TX | Retail | $52,250,000 | 7.2% | 309,254 | $168.95 | 2.70x | 10.3% | 65.1% | 65.1% | |||||||||||||
| 6 | WFB | Storquest - Richmond, CA | Richmond | CA | Self Storage | $34,000,000 | 4.7% | 143,409 | $237.08 | 2.20x | 8.2% | 60.4% | 60.4% | |||||||||||||
| 7 | MSMCH | 153 Kearny Street | San Francisco | CA | Office | $30,000,000 | 4.1% | 54,746 | $547.99 | 3.98x | 12.6% | 52.0% | 52.0% | |||||||||||||
| 8 | MSMCH | Storage Stables Jackson | Jackson | WY | Self Storage | $25,000,000 | 3.4% | 131,396 | $190.26 | 2.59x | 8.7% | 66.5% | 66.5% | |||||||||||||
| 9 | MSMCH | Twin Ridge Apartments | Baltimore | MD | Multifamily | $20,000,000 | 2.7% | 314 | $63,694.27 | 5.35x | 15.2% | 31.7% | 31.7% | |||||||||||||
| 10 | WFB | Norwood Business Park(2) | Sacramento | CA | Industrial | $9,250,000 | 1.3% | 168,232 | $57.08 | 3.63x | 11.0% | 54.7% | 54.7% | |||||||||||||
| 11 | WFB | Madison West Business Park(2) | North Highlands | CA | Industrial | $8,750,000 | 1.2% | 147,089 | $57.08 | 3.63x | 11.0% | 54.7% | 54.7% | |||||||||||||
| Total/Wtd. Avg. | $431,250,000 | 59.2% | 3.50x | 11.2% | 50.3% | 50.3% | ||||||||||||||||||||
| (1) | With respect to any mortgage loan that is part of a whole loan, unless otherwise indicated, all LTV, DSCR, Debt Yield and Balance per SF/Unit calculations in this Term Sheet include any related pari passu companion loans and exclude any subordinate companion loans, as applicable. Additionally, LTV, DSCR, Debt Yield and Balance per SF/Unit figures in this Term Sheet are calculated for mortgage loans without regard to any additional indebtedness that may be incurred at a future date. |
| (2) | With respect to any mortgage loan that is cross-collateralized or cross-defaulted with other mortgage loans, the loan-to-value ratio, debt service coverage ratio and debt yield for such mortgage loan is based upon the ratio or yield (as applicable) for the aggregate indebtedness evidence by all loans in the group (without regard to any limitation on the amount of indebtedness secured by any mortgaged property in such cross-collateralized group). On an individual basis, without regard to the cross-collateralization feature, any mortgage loan that is part of a cross-collateralized group of mortgage loans may have a higher loan to value ratio, lower debt service coverage ratio, and/or lower debt yield than is presented herein. |
This is not a research report and was not prepared by Underwriter’s research department. Please see additional important information and qualifications at the end of this Term Sheet. |
T-24
| BANK 2021-BNK38 | Characteristics of the Mortgage Loans |
| Mortgage Loans with Pari Passu Companion Loans | ||||||||||||
| Loan No. | Mortgage Loan Seller | Property Name | Mortgage Loan Cut-off Date Balance | Aggregate Pari Passu Companion Loan Cut-off Date Balance | Combined Cut-off Date Balance | Lead Servicing Agreement | Master Servicer | Special Servicer | Control Rights | Combined UW NCF DSCR(1) | Combined UW NOI Debt Yield(1) | Combined Cut-off Date LTV(1) |
| 1 | BANA | One North Wacker | $72,000,000 | $281,000,000 | $353,000,000 | BANK 2021-BNK36 | Wells Fargo | Rialto Capital | BANK 2021-BNK36 | 2.96x | 8.9% | 53.2% |
| 2 | MSMCH | Park Avenue Plaza | $70,000,000 | $269,170,000 | $339,170,000 | MSC 2021-PLZA | Wells Fargo | Wells Fargo | MSC 2021-PLZA | 5.84x | 17.4% | 31.9% |
| 3 | BANA | CX - 350 & 450 Water Street | $55,000,000 | $759,000,000 | $814,000,000 | CAMB 2021-CX2 | KeyBank | Situs | (2) | 3.50x | 9.9% | 41.7% |
| 4 | WFB | 1201 Lake Robbins | $55,000,000 | $195,000,000 | $250,000,000 | BANK 2021-BNK37 | Wells Fargo | CWCapital | BANK 2021-BNK37 | 2.26x | 9.2% | 55.3% |
| (1) | DSCR, Debt Yield and LTV calculations include any related pari passu companion loans and exclude any subordinate companion loans, as applicable. |
| (2) | The controlling class under the CAMB 2021-CX2 securitization has the right to appoint the directing holder for the CX – 350 & 450 Water Street Whole Loan under the CAMB 2021-CX2 trust and servicing agreement. However, the current holder of the controlling class, 3650 Cal Bridge Cambridge Crossing LLC, is a borrower related party under the CAMB 2021-CX2 trust and servicing agreement, therefore until such time as there is a holder of the controlling class that is not a borrower related party under the CAMB 2021-CX2 trust and servicing agreement, neither a subordinate control period or a subordinate consultation period will be deemed to exist and furthermore no directing holder will have consent or consultation rights under the CAMB 2021-CX2 trust and servicing agreement. See “Description of the Mortgage Pool—The Whole Loans—The CX – 350 & 450 Water Street Pari Passu-A/B Whole Loan” in the Preliminary Prospectus. |
| Mortgage Loans with Subordinate Debt(1) | |||||||||||
| Loan No. | Mortgage Loan Seller | Property Name | Mortgage Loan Cut-off Date Balance | Cut-off Date Balance per SF | Subordinate Debt Cut-off Date Balance | UW NCF DSCR | UW NOI Debt Yield | Cut-off Date LTV | Whole Loan UW NCF DSCR(2) | Whole Loan UW NOI Debt Yield(2) | Whole Loan Cut-off Date LTV(2) |
| 2 | MSMCH | Park Avenue Plaza | $70,000,000 | $292.49 | $120,830,000 | 5.84x | 17.4% | 31.9% | 4.31x | 12.8% | 43.3% |
| 3 | BANA | CX - 350 & 450 Water Street | $55,000,000 | $889.39 | $411,000,000 | 3.50x | 9.9% | 41.7% | 2.32x | 6.6% | 62.7% |
| (1) | In addition, nineteen (19) of the mortgage loans, each of which is secured by a residential cooperative property, currently have in place Subordinate Coop LOCs that permit future advances. See “Description of the Mortgage Pool—Additional Indebtedness—Other Secured Indebtedness” and “Description of the Mortgage Pool—Additional Debt Financing for Mortgage Loans Secured by Residential Cooperatives” in the Preliminary Prospectus. |
| (2) | Whole Loan UW NCF DSCR, Whole Loan UW NOI Debt Yield and Whole Loan Cut-off Date LTV figures shown above are calculated based on any related pari passu notes and any related subordinate note(s). |
| Mortgage Loans with Mezzanine Debt | |||||||||||
| Loan No. | Mortgage Loan Seller | Property Name | Mortgage Loan Cut-off Date Balance | Cut-off Date Balance per SF | Mezzanine Debt Cut-off Date Balance | UW NCF DSCR | UW NOI Debt Yield | Cut-off Date LTV | Total Debt UW NCF DSCR(1) | Total Debt UW NOI Debt Yield(1) | Total Debt Cut-off Date LTV(1) |
| 2 | MSMCH | Park Avenue Plaza | $70,000,000 | $292.49 | $115,000,000 | 5.84x | 17.4% | 31.9% | 3.27x | 10.3% | 54.1% |
| (1) | Total Debt UW NCF DSCR, Total Debt UW NOI Debt Yield and Total Debt Cut-off Date LTV figures shown above are calculated based on any related pari passu notes, any related subordinate note(s) and the mezzanine debt. |
This is not a research report and was not prepared by Underwriter’s research department. Please see additional important information and qualifications at the end of this Term Sheet. |
T-25
| BANK 2021-BNK38 | Characteristics of the Mortgage Loans |
Mortgage Loans with Scheduled Balloon Payments and Related Classes(1)
| Class A-2 ($11,800,000) | ||||||||||||||||
| Loan No. | Mortgage Loan Seller | Property Name | State | Property Type | Cut-off Date Balance | % of Pool | Maturity Date Balance | % of Class A-2 Certificate Principal Balance | SF | Cut-off Date Balance per SF | UW NCF DSCR | UW NOI Debt Yield | Cut-off Date LTV | Maturity Date LTV | Rem. IO Period (mos.) | Rem. Term to Maturity (mos.) |
| 19 | WFB | The Meadows | CA | Office | $9,500,000 | 1.3% | $9,500,000 | 80.5% | 65,501 | $145.04 | 2.92x | 10.7% | 59.4% | 59.4% | 59 | 59 |
| 46 | MSMCH | All Around Storage | AR | Self Storage | $2,800,000 | 0.4% | $2,800,000 | 23.7% | 45,700 | $61.27 | 1.64x | 8.9% | 59.6% | 59.6% | 60 | 60 |
| Total/Wtd. Avg. | $12,300,000 | 1.7% | $12,300,000 | 104.2% | 2.63x | 10.3% | 59.4% | 59.4% | 59 | 59 | ||||||
| (1) | The table above reflects the mortgage loans whose balloon payments will be applied to pay down the Class A-2 certificates, assuming (i) that none of the mortgage loans experience prepayments, defaults or losses; (ii) there are no extensions of maturity dates; and (iii) each mortgage loan is paid in full on its stated maturity date or, in the case of any mortgage loan with an anticipated repayment date, on such anticipated repayment date. The table above is otherwise based on the Structuring Assumptions set forth under “Yield and Maturity Considerations—Weighted Average Life” in the Preliminary Prospectus. |
Mortgage Loans with Scheduled Balloon Payments and Related Classes(1)
| Class A-3 ($17,100,000) | ||||||||||||||||
| Loan No. | Mortgage Loan Seller | Property Name | State | Property Type | Cut-off Date Balance | % of Pool | Maturity Date Balance | % of Class A-3 Certificate Principal Balance | SF | Cut-off Date Balance per SF | UW NCF DSCR | UW NOI Debt Yield | Cut-off Date LTV | Maturity Date LTV | Rem. IO Period (mos.) | Rem. Term to Maturity (mos.) |
| 12 | BANA | Oregon Self Storage Portfolio | OR | Self Storage | $18,000,000 | 2.5% | $18,000,000 | 105.3% | 308,800 | $58.29 | 2.72x | 9.4% | 65.5% | 65.5% | 84 | 84 |
| Total/Wtd. Avg. | $18,000,000 | 2.5% | $18,000,000 | 105.3% | 2.72x | 9.4% | 65.5% | 65.5% | 84 | 84 | ||||||
| (1) | The table above reflects the mortgage loans whose balloon payments will be applied to pay down the Class A-3 certificates, assuming (i) that none of the mortgage loans experience prepayments, defaults or losses; (ii) there are no extensions of maturity dates; and (iii) each mortgage loan is paid in full on its stated maturity date or, in the case of any mortgage loan with an anticipated repayment date, on such anticipated repayment date. The table above is otherwise based on the Structuring Assumptions set forth under “Yield and Maturity Considerations—Weighted Average Life” in the Preliminary Prospectus. |
This is not a research report and was not prepared by Underwriter’s research department. Please see additional important information and qualifications at the end of this Term Sheet. |
T-26
| BANK 2021-BNK38 | Characteristics of the Mortgage Loans |
| Prior Securitization History(1) | ||||||||||||||
| Loan No. | Mortgage Loan Seller | Property Name | City | State | Property Type | Cut-off Date Balance | % of Pool | SF/Units | Cut-off Date Balance per SF/Unit | UW NCF DSCR(2) | UW NOI Debt Yield(2) | Cut-off Date LTV(2) | Maturity Date LTV(2) | Prior Securitization |
| 6 | WFB | Storquest - Richmond, CA | Richmond | CA | Self Storage | $34,000,000 | 4.7% | 143,409 | $237.08 | 2.20x | 8.2% | 60.4% | 60.4% | WFCM 2015-NXS4 |
| 7 | MSMCH | 153 Kearny Street | San Francisco | CA | Office | $30,000,000 | 4.1% | 54,746 | $547.99 | 3.98x | 12.6% | 52.0% | 52.0% | MSBAM 2012-C5 |
| 9 | MSMCH | Twin Ridge Apartments | Baltimore | MD | Multifamily | $20,000,000 | 2.7% | 314 | $63,694.27 | 5.35x | 15.2% | 31.7% | 31.7% | FREMF 2013-K26 |
| 16 | MSMCH | Wilmington Ohio Industrial Park | Wilmington | OH | Industrial | $11,500,000 | 1.6% | 404,419 | $28.44 | 2.70x | 10.2% | 59.4% | 59.4% | BBCMS 2019-C4 |
| 17 | WFB | The Plaza Retail Center | Buford | GA | Retail | $10,000,000 | 1.4% | 106,434 | $93.95 | 4.21x | 16.1% | 46.5% | 46.5% | UBSC 2011-C1 |
| 33 | BANA | Fenton Self Storage Portfolio | Fenton | MI | Self Storage | $6,000,000 | 0.8% | 85,554 | $70.13 | 1.63x | 9.4% | 58.5% | 53.1% | WFCM 2017-C40 |
| 37 | NCB | Regency Park Owners Corp. | White Plains | NY | Multifamily | $4,700,000 | 0.6% | 65 | $72,307.69 | 3.90x | 20.2% | 28.3% | 21.8% | WFCM 2015-C29 |
| 48 | NCB | East Hampton Mews Tenants Corp. | East Hampton | NY | Multifamily | $2,600,000 | 0.4% | 48 | $54,166.67 | 23.98x | 75.7% | 8.7% | 8.7% | WFCM 2016-C32 |
| 51 | NCB | Tanglewood Gardens Owners Corp. | White Plains | NY | Multifamily | $2,300,000 | 0.3% | 80 | $28,750.00 | 15.49x | 49.7% | 13.0% | 13.0% | WFRBS 2014-C20 |
| 58 | NCB | 76 Remsen Street, Inc. | Brooklyn | NY | Multifamily | $1,747,048 | 0.2% | 23 | $75,958.61 | 9.29x | 49.1% | 5.9% | 4.5% | WFRBS 2013-C15 |
| 62 | NCB | Broad Hollow Owners, Inc. | Amityville | NY | Multifamily | $1,422,666 | 0.2% | 53 | $26,842.75 | 4.80x | 25.9% | 17.9% | 13.9% | WFRBS 2013-C12 |
| Total | $124,269,714 | 17.0% | ||||||||||||
| (1) | Includes mortgage loans for which all or a portion of the previously existing debt was most recently securitized in conduit securitizations, based on information provided by the related borrower or obtained through searches of a third-party database. The information has not otherwise been confirmed by the mortgage loan sellers. With respect to any mortgage loan that is part of a whole loan, unless otherwise indicated, all LTV, DSCR, Debt Yield and Cut-off Date Balance per SF/Unit calculations include any related pari passu companion loans and exclude any related subordinate companion loans, as applicable. |
| (2) | For mortgaged properties securing residential cooperative mortgage loans, the UW NCF DSCR and UW NOI Debt Yield for each such mortgaged property is calculated using underwritten net operating income or underwritten net cash flow, as applicable, for the related residential cooperative property which is the projected net operating income or net cash flow, as applicable, reflected in the most recent appraisal obtained by or otherwise in the possession of the related mortgage loan seller as of the Cut-off Date. LTV calculations are based upon the appraised value of the residential cooperative property determined as if such residential cooperative property is operated as a residential cooperative, inclusive of the amount of the underlying debt encumbering such residential cooperative property. The UW NCF DSCR, UW NOI Debt Yield and LTV calculations do not take into account any subordinate debt (whether or not secured by the related mortgaged property), that currently exists or is allowed under the terms of any mortgage loan. |
This is not a research report and was not prepared by Underwriter’s research department. Please see additional important information and qualifications at the end of this Term Sheet. |
T-27
| BANK 2021-BNK38 | Characteristics of the Mortgage Loans |
![[PIE CHART]](https://capedge.com/proxy/FWP/0001539497-21-002030/n2847tsimg004.jpg)
| Property Type Distribution(1)(2) | ||||||||||||||||
| Property Type | Number of Mortgaged Properties | Aggregate Cut-off Date Balance | % of Pool | Wtd. Avg. Mortgage Rate | Wtd. Avg. UW NCF DSCR | Wtd. Avg. UW NOI Debt Yield | Wtd. Avg. Cut-off Date LTV | Wtd. Avg. Maturity Date LTV | ||||||||
| Office | 6 | $240,260,000 | 33.0% | 3.0748% | 3.77x | 12.1% | 47.4% | 47.4% | ||||||||
| CBD | 3 | $172,000,000 | 23.6% | 2.7934% | 4.31x | 13.0% | 44.3% | 44.3% | ||||||||
| Suburban | 2 | $64,500,000 | 8.8% | 3.7912% | 2.36x | 9.4% | 55.9% | 55.9% | ||||||||
| Medical | 1 | $3,760,000 | 0.5% | 3.6600% | 3.45x | 14.5% | 42.7% | 42.7% | ||||||||
| Self Storage | 23 | $141,577,500 | 19.4% | 3.6346% | 2.38x | 9.2% | 61.8% | 60.4% | ||||||||
| Self Storage | 23 | $141,577,500 | 19.4% | 3.6346% | 2.38x | 9.2% | 61.8% | 60.4% | ||||||||
| Mixed Use | 8 | $97,495,000 | 13.4% | 3.0599% | 3.25x | 10.2% | 46.5% | 46.5% | ||||||||
| Office/Lab | 1 | $55,000,000 | 7.5% | 2.7920% | 3.50x | 9.9% | 41.7% | 41.7% | ||||||||
| Office/Retail | 2 | $18,550,000 | 2.5% | 3.4428% | 2.54x | 9.5% | 56.7% | 56.7% | ||||||||
| Multifamily/Retail | 3 | $13,750,000 | 1.9% | 3.3136% | 3.09x | 10.2% | 48.5% | 48.5% | ||||||||
| Industrial/Retail | 1 | $7,920,000 | 1.1% | 3.2350% | 3.76x | 13.8% | 47.7% | 47.7% | ||||||||
| Self Storage/Retail | 1 | $2,275,000 | 0.3% | 4.2700% | 2.14x | 10.2% | 65.0% | 65.0% | ||||||||
| Multifamily | 24 | $93,087,557 | 12.8% | 2.9862% | 8.55x | 36.4% | 18.9% | 17.7% | ||||||||
| Cooperative | 21 | $66,377,557 | 9.1% | 2.9982% | 10.14x | 45.6% | 10.8% | 9.1% | ||||||||
| Garden | 2 | $22,700,000 | 3.1% | 2.8130% | 5.02x | 14.6% | 36.0% | 36.0% | ||||||||
| Low Rise | 1 | $4,010,000 | 0.6% | 3.7680% | 2.10x | 8.2% | 56.5% | 56.5% | ||||||||
| Retail | 7 | $80,090,607 | 11.0% | 3.5601% | 2.77x | 10.9% | 60.5% | 59.6% | ||||||||
| Anchored | 3 | $68,240,607 | 9.4% | 3.4917% | 2.85x | 11.2% | 61.6% | 60.5% | ||||||||
| Single Tenant | 4 | $11,850,000 | 1.6% | 3.9540% | 2.27x | 9.0% | 54.1% | 54.1% | ||||||||
| Industrial | 8 | $59,503,500 | 8.2% | 3.0893% | 3.19x | 10.6% | 58.7% | 58.7% | ||||||||
| Warehouse | 3 | $26,350,000 | 3.6% | 3.1328% | 3.09x | 10.5% | 59.4% | 59.4% | ||||||||
| Light Manufacturing | 1 | $13,303,500 | 1.8% | 2.9550% | 3.30x | 10.1% | 63.4% | 63.4% | ||||||||
| Warehouse Distribution | 1 | $7,100,000 | 1.0% | 3.2490% | 2.74x | 10.0% | 59.7% | 59.7% | ||||||||
| Flex | 3 | $12,750,000 | 1.7% | 3.0506% | 3.53x | 11.7% | 51.7% | 51.7% | ||||||||
| Manufactured Housing | 8 | $17,000,000 | 2.3% | 3.9700% | 2.39x | 9.9% | 63.4% | 63.4% | ||||||||
| Manufactured Housing / RV Park | 7 | $15,795,225 | 2.2% | 3.9700% | 2.39x | 9.9% | 63.4% | 63.4% | ||||||||
| RV Park | 1 | $1,204,775 | 0.2% | 3.9700% | 2.39x | 9.9% | 63.4% | 63.4% | ||||||||
| Total/Wtd. Avg. | 84 | $729,014,163 | 100.0% | 3.2456% | 3.85x | 14.1% | 49.2% | 48.6% | ||||||||
| (1) | All numerical information concerning the mortgage loans is approximate and, in the case of mortgage loans secured by multiple properties, is based on allocated loan amounts with respect to such properties. All weighted average information regarding the mortgage loans reflects the weighting of the mortgage loans based on their outstanding principal balances as of the Cut-off Date or, in the case of mortgage loans secured by multiple properties, allocated loan amounts. The sum of numbers and percentages in columns may not match the “Total” due to rounding. With respect to any mortgage loan that is part of a whole loan, unless otherwise indicated, all LTV, DSCR and Debt Yield calculations include any related pari passu companion loans and exclude any related subordinate companion loans, as applicable. For mortgaged properties securing residential cooperative mortgage loans, the UW NCF DSCR and UW NOI Debt Yield for each such mortgaged property is calculated using underwritten net operating income or underwritten net cash flow, as applicable, for the related residential cooperative property which is the projected net operating income or net cash flow, as applicable, reflected in the most recent appraisal obtained by or otherwise in the possession of the related mortgage loan seller as of the Cut-off Date. LTV calculations are based upon the appraised value of the residential cooperative property determined as if such residential cooperative property is operated as a residential cooperative, inclusive of the amount of the underlying debt encumbering such residential cooperative property. The UW NCF DSCR, UW NOI Debt Yield and LTV calculations do not take into account any subordinate debt (whether or not secured by the related mortgaged property), that currently exists or is allowed under the terms of any mortgage loan. |
| (2) | With respect to any mortgage loan that is cross-collateralized or cross-defaulted with other mortgage loans, the loan-to-value ratio, debt service coverage ratio and debt yield for such mortgage loan is based upon the ratio or yield (as applicable) for the aggregate indebtedness evidence by all loans in the group (without regard to any limitation on the amount of indebtedness secured by any mortgaged property in such cross-collateralized group). On an individual basis, without regard to the cross-collateralization feature, any mortgage loan that is part of a cross-collateralized group of mortgage loans may have a higher loan to value ratio, lower debt service coverage ratio, and/or lower debt yield than is presented herein. |
This is not a research report and was not prepared by any Underwriter’s research department. Please see additional important information and qualifications at the end of this Term Sheet. |
T-28
| BANK 2021-BNK38 | Characteristics of the Mortgage Loans |
![[MAP]](https://capedge.com/proxy/FWP/0001539497-21-002030/n2847tsimg005.jpg)
| Geographic Distribution(1)(2) | ||||||||||||||||
| State or Other Jurisdiction | Number of Mortgaged Properties | Aggregate Cut-off Date Balance | % of Pool | Wtd. Avg. Mortgage Rate | Wtd. Avg. UW NCF DSCR | Wtd. Avg. UW NOI Debt Yield | Wtd. Avg. Cut-off Date LTV | Wtd. Avg. Maturity Date LTV | ||||||||
| New York | 27 | $165,847,557 | 22.7% | 2.9957% | 7.08x | 27.6% | 26.5% | 25.8% | ||||||||
| Texas | 8 | $131,291,200 | 18.0% | 3.7087% | 2.42x | 9.7% | 60.8% | 60.5% | ||||||||
| California | 7 | $104,760,000 | 14.4% | 3.2640% | 3.11x | 10.5% | 55.4% | 55.4% | ||||||||
| California – Northern(3) | 4 | $82,000,000 | 11.2% | 3.1946% | 3.17x | 10.4% | 56.1% | 56.1% | ||||||||
| California – Southern(3) | 3 | $22,760,000 | 3.1% | 3.5142% | 2.91x | 10.7% | 53.1% | 53.1% | ||||||||
| Illinois | 2 | $81,950,000 | 11.2% | 2.8371% | 2.85x | 8.8% | 54.6% | 54.6% | ||||||||
| Massachusetts | 2 | $59,010,000 | 8.1% | 2.8583% | 3.40x | 9.8% | 42.7% | 42.7% | ||||||||
| Wyoming | 1 | $25,000,000 | 3.4% | 3.2950% | 2.59x | 8.7% | 66.5% | 66.5% | ||||||||
| Maryland | 1 | $20,000,000 | 2.7% | 2.7000% | 5.35x | 15.2% | 31.7% | 31.7% | ||||||||
| Oregon | 4 | $18,000,000 | 2.5% | 3.3070% | 2.72x | 9.4% | 65.5% | 65.5% | ||||||||
| Arizona | 8 | $17,000,000 | 2.3% | 3.9700% | 2.39x | 9.9% | 63.4% | 63.4% | ||||||||
| Pennsylvania | 3 | $16,100,000 | 2.2% | 3.3110% | 3.08x | 10.8% | 57.1% | 57.1% | ||||||||
| North Carolina | 2 | $15,578,500 | 2.1% | 3.1470% | 3.13x | 10.1% | 63.6% | 63.6% | ||||||||
| Ohio | 2 | $15,137,500 | 2.1% | 3.4121% | 2.56x | 10.7% | 63.1% | 59.3% | ||||||||
| Georgia | 2 | $11,283,850 | 1.5% | 3.6580% | 3.93x | 15.2% | 47.8% | 47.8% | ||||||||
| Arkansas | 2 | $9,300,000 | 1.3% | 3.7054% | 3.13x | 11.0% | 50.2% | 50.2% | ||||||||
| Colorado | 1 | $8,150,000 | 1.1% | 3.9400% | 2.12x | 8.6% | 58.7% | 58.7% | ||||||||
| Mississippi | 4 | $7,120,000 | 1.0% | 3.7150% | 1.54x | 8.7% | 68.3% | 58.8% | ||||||||
| Michigan | 2 | $6,000,000 | 0.8% | 3.8450% | 1.63x | 9.4% | 58.5% | 53.1% | ||||||||
| Utah | 1 | $5,990,607 | 0.8% | 3.5300% | 1.94x | 11.3% | 56.5% | 44.3% | ||||||||
| Washington | 2 | $5,294,950 | 0.7% | 3.9484% | 2.97x | 12.7% | 47.2% | 47.2% | ||||||||
| Nevada | 2 | $3,500,000 | 0.5% | 3.5940% | 3.27x | 13.4% | 43.6% | 43.6% | ||||||||
| Connecticut | 1 | $2,700,000 | 0.4% | 3.6500% | 2.57x | 10.0% | 68.2% | 68.2% | ||||||||
| Total/Wtd. Avg. | 84 | $729,014,163 | 100.0% | 3.2456% | 3.85x | 14.1% | 49.2% | 48.6% | ||||||||
| (1) | All numerical information concerning the mortgage loans is approximate and, in the case of mortgage loans secured by multiple properties, is based on allocated loan amounts with respect to such properties. All weighted average information regarding the mortgage loans reflects the weighting of the mortgage loans based on their outstanding principal balances as of the Cut-off Date or, in the case of mortgage loans secured by multiple properties, allocated loan amounts. The sum of numbers and percentages in columns may not match the “Total” due to rounding. With respect to any mortgage loan that is part of a whole loan, unless otherwise indicated, all LTV, DSCR and Debt Yield calculations include any related pari passu companion loans and exclude any related subordinate companion loans, as applicable. For mortgaged properties securing residential cooperative mortgage loans, the UW NCF DSCR and UW NOI Debt Yield for each such mortgaged property is calculated using underwritten net operating income or underwritten net cash flow, as applicable, for the related residential cooperative property which is the projected net operating income or net cash flow, as applicable, reflected in the most recent appraisal obtained by or otherwise in the possession of the related mortgage loan seller as of the Cut-off Date. LTV calculations are based upon the appraised value of the residential cooperative property determined as if such residential cooperative property is operated as a residential cooperative, inclusive of the amount of the underlying debt encumbering such residential cooperative property. The UW NCF DSCR, UW NOI Debt Yield and LTV calculations do not take into account any subordinate debt (whether or not secured by the related mortgaged property), that currently exists or is allowed under the terms of any mortgage loan. The information for each mortgaged property that relates to a mortgage loan that is cross-collateralized or cross-defaulted with one or more other mortgage loans is based upon the principal balance of that mortgage loan, except that the applicable loan-to-value ratio, debt service coverage ratio, and debt yield for each such mortgage loan is based upon the ratio or yield (as applicable) for the aggregate indebtedness evidenced by all loans in the group (without regard to any limitation on the amount of indebtedness secured by any mortgaged property in such cross-collateralized group). |
| (2) | With respect to any mortgage loan that is cross-collateralized or cross-defaulted with other mortgage loans, the loan-to-value ratio, debt service coverage ratio and debt yield for such mortgage loan is based upon the ratio or yield (as applicable) for the aggregate indebtedness evidence by all loans in the group (without regard to any limitation on the amount of indebtedness secured by any mortgaged property in such cross-collateralized group). On an individual basis, without regard to the cross-collateralization feature, any mortgage loan that is part of a cross-collateralized group of mortgage loans may have a higher loan to value ratio, lower debt service coverage ratio, and/or lower debt yield than is presented herein. |
| (3) | “California – Northern” includes zip codes above 93600, and “California – Southern” includes zip codes at or below 93600. |
This is not a research report and was not prepared by any Underwriter’s research department. Please see additional important information and qualifications at the end of this Term Sheet. |
T-29
| BANK 2021-BNK38 | Collateral Statistics |
Collateral Statistics(1)
Cut-off Date Balance ($)
| No. of Mortgage Loans | Aggregate Cut-off Date Balance ($) | % of Pool | |
| 1,000,000 - 5,000,000 | 29 | 73,470,057 | 10.1 |
| 5,000,001 - 15,000,000 | 24 | 190,394,107 | 26.1 |
| 15,000,001 - 25,000,000 | 5 | 96,900,000 | 13.3 |
| 25,000,001 - 35,000,000 | 2 | 64,000,000 | 8.8 |
| 35,000,001 - 55,000,000 | 3 | 162,250,000 | 22.3 |
| 55,000,001 - 72,000,000 | 2 | 142,000,000 | 19.5 |
| Total: | 65 | $729,014,163 | 100.0% |
Min: $1,000,000 | Max: $72,000,000 Avg: $11,215,603 | ||
State or Other Jurisdiction(2)
| No. of Mortgaged Properties | Aggregate Cut-off Date Balance ($) | % of Pool | |
| New York | 27 | 165,847,557 | 22.7 |
| Texas | 8 | 131,291,200 | 18.0 |
| California | 7 | 104,760,000 | 14.4 |
| California – Northern(3) | 4 | 82,000,000 | 11.2 |
| California – Southern (3) | 3 | 22,760,000 | 3.1 |
| Illinois | 2 | 81,950,000 | 11.2 |
| Massachusetts | 2 | 59,010,000 | 8.1 |
| Wyoming | 1 | 25,000,000 | 3.4 |
| Maryland | 1 | 20,000,000 | 2.7 |
| Oregon | 4 | 18,000,000 | 2.5 |
| Arizona | 8 | 17,000,000 | 2.3 |
| Pennsylvania | 3 | 16,100,000 | 2.2 |
| North Carolina | 2 | 15,578,500 | 2.1 |
| Ohio | 2 | 15,137,500 | 2.1 |
| Georgia | 2 | 11,283,850 | 1.5 |
| Arkansas | 2 | 9,300,000 | 1.3 |
| Colorado | 1 | 8,150,000 | 1.1 |
| Mississippi | 4 | 7,120,000 | 1.0 |
| Michigan | 2 | 6,000,000 | 0.8 |
| Utah | 1 | 5,990,607 | 0.8 |
| Washington | 2 | 5,294,950 | 0.7 |
| Nevada | 2 | 3,500,000 | 0.5 |
| Connecticut | 1 | 2,700,000 | 0.4 |
| Total: | 84 | $729,014,163 | 100.0% |
Property Type(2)
| No. of Mortgaged Properties | Aggregate Cut-off Date Balance ($) | % of Pool | |
| Office | 6 | 240,260,000 | 33.0 |
| CBD | 3 | 172,000,000 | 23.6 |
| Suburban | 2 | 64,500,000 | 8.8 |
| Medical | 1 | 3,760,000 | 0.5 |
| Self Storage | 23 | 141,577,500 | 19.4 |
| Self Storage | 23 | 141,577,500 | 19.4 |
| Mixed Use | 8 | 97,495,000 | 13.4 |
| Office/Lab | 1 | 55,000,000 | 7.5 |
| Office/Retail | 2 | 18,550,000 | 2.5 |
| Multifamily/Retail | 3 | 13,750,000 | 1.9 |
| Industrial/Retail | 1 | 7,920,000 | 1.1 |
| Self Storage/Retail | 1 | 2,275,000 | 0.3 |
| Multifamily | 24 | 93,087,557 | 12.8 |
| Cooperative | 21 | 66,377,557 | 9.1 |
| Garden | 2 | 22,700,000 | 3.1 |
| Low Rise | 1 | 4,010,000 | 0.6 |
| Retail | 7 | 80,090,607 | 11.0 |
| Anchored | 3 | 68,240,607 | 9.4 |
| Single Tenant | 4 | 11,850,000 | 1.6 |
| Industrial | 8 | 59,503,500 | 8.2 |
| Warehouse | 3 | 26,350,000 | 3.6 |
| Light Manufacturing | 1 | 13,303,500 | 1.8 |
| Warehouse Distribution | 1 | 7,100,000 | 1.0 |
| Flex | 3 | 12,750,000 | 1.7 |
| Manufactured Housing | 8 | 17,000,000 | 2.3 |
| Manufactured Housing / RV Park | 7 | 15,795,225 | 2.2 |
| RV Park | 1 | 1,204,775 | 0.2 |
| Total/Wtd. Avg. | 84 | $729,014,163 | 100.0% |
Mortgage Rate (%)
| No. of Mortgage Loans | Aggregate Cut-off Date Balance ($) | % of Pool | |
| 2.7000 - 3.2490 | 32 | 384,978,391 | 52.8 |
| 3.2500 - 3.4990 | 8 | 119,672,666 | 16.4 |
| 3.5000 - 3.9990 | 17 | 193,868,107 | 26.6 |
| 4.0000 - 5.2500 | 8 | 30,495,000 | 4.2 |
| Total: | 65 | $729,014,163 | 100.0% |
| Min: 2.700% | Max: 5.2500% Wtd Avg: 3.2456% | ||
Original Term to Maturity or ARD (mos.)
| No. of Mortgage Loans | Aggregate Cut-off Date Balance ($) | % of Pool | |
| 60 | 2 | 12,300,000 | 1.7 |
| 84 | 1 | 18,000,000 | 2.5 |
| 115 | 1 | 13,303,500 | 1.8 |
| 120 | 61 | 685,410,663 | 94.0 |
| Total: | 65 | $729,014,163 | 100.0% |
| Min: 60 mos. | Max: 120 mos. Wtd Avg: 118 mos. | ||
Remaining Term to Maturity or ARD (mos.)
| No. of Mortgage Loans | Aggregate Cut-off Date Balance ($) | % of Pool | |
| 59 - 119 | 23 | 360,671,663 | 49.5 |
| 120 | 42 | 368,342,500 | 50.5 |
| Total: | 65 | $729,014,163 | 100.0% |
| Min: 59 mos. | Max: 120 mos. Wtd Avg: 117 mos. | ||
Original Amortization Term (mos.)
| No. of Mortgage Loans | Aggregate Cut-off Date Balance ($) | % of Pool | |
| Interest Only | 45 | 648,328,500 | 88.9 |
| 240 | 1 | 1,600,000 | 0.2 |
| 360 | 15 | 69,594,782 | 9.5 |
| 480 | 4 | 9,490,881 | 1.3 |
| Total: | 65 | $729,014,163 | 100.0% |
| Min: 240 mos. | Max: 480 mos. Wtd Avg: 372 mos. | ||
Remaining Amortization Term (mos.)
| No. of Mortgage Loans | Aggregate Cut-off Date Balance ($) | % of Pool | |
| Interest Only | 45 | 648,328,500 | 88.9 |
| 240 - 360 | 16 | 71,194,782 | 9.8 |
| 361 - 480 | 4 | 9,490,881 | 1.3 |
| Total: | 65 | $729,014,163 | 100.0% |
| Min: 240 mos. | Max: 480 mos. Wtd Avg: 371 mos. | ||
Mortgage Loan Sellers
| No. of Mortgage Loans | Aggregate Cut-off Date Balance ($) | % of Pool | |
| MSMCH | 18 | 296,898,500 | 40.7 |
| BANA | 15 | 217,400,000 | 29.8 |
| WFB | 11 | 148,338,107 | 20.3 |
| NCB | 21 | 66,377,557 | 9.1 |
| Total: | 65 | $729,014,163 | 100.0% |
Amortization Type
| No. of Mortgage Loans | Aggregate Cut-off Date Balance ($) | % of Pool | |
| Interest Only | 42 | 573,925,000 | 78.7 |
| Amortizing Balloon | 16 | 55,005,663 | 7.5 |
| Interest Only - ARD | 1 | 55,000,000 | 7.5 |
| Interest Only, Amortizing Balloon | 4 | 25,680,000 | 3.5 |
| Interest Only - Amortizing ARD | 2 | 19,403,500 | 2.7 |
| Total/Wtd. Avg. | 65 | $729,014,16 | 100.0% |
Cut-off Date LTV Ratio (%)
| No. of Mortgage Loans | Aggregate Cut-off Date Balance ($) | % of Pool | |
| 1.8 - 45.0 | 27 | 226,637,557 | 31.1 |
| 45.1 - 50.0 | 4 | 33,020,000 | 4.5 |
| 50.1 - 55.0 | 6 | 132,460,000 | 18.2 |
| 55.1 - 60.0 | 12 | 128,850,607 | 17.7 |
| 60.1 – 75.0 | 16 | 208,046,000 | 28.5 |
| Total: | 65 | $729,014,163 | 100.0% |
| Min: 1.8% | Max: 75.0% Wtd Avg: 49.2% | ||
Maturity Date or ARD LTV Ratio (%)
| No. of Mortgage Loans | Aggregate Cut-off Date Balance ($) | % of Pool | |
| 1.4 - 30.0 | 21 | 66,377,557 | 9.1 |
| 30.1 - 40.0 | 2 | 90,000,000 | 12.3 |
| 40.1 - 45.0 | 5 | 76,250,607 | 10.5 |
| 45.1 - 50.0 | 4 | 33,020,000 | 4.5 |
| 50.1 - 55.0 | 7 | 138,460,000 | 19.0 |
| 55.1 - 68.2 | 26 | 324,906,000 | 44.6 |
| Total: | 65 | $729,014,163 | 100.0% |
| Min: 1.4% | Max: 68.2% Wtd Avg: 48.6% | ||
UW NCF DSCR (x)
| No. of Mortgage Loans | Aggregate Cut-off Date Balance ($) | % of Pool | |
| 1.39 - 1.60 | 2 | 13,430,000 | 1.8 |
| 1.61 - 1.80 | 4 | 14,850,000 | 2.0 |
| 1.81 - 2.00 | 2 | 11,740,607 | 1.6 |
| 2.01 - 2.20 | 6 | 62,022,500 | 8.5 |
| 2.21 - 2.40 | 4 | 80,400,000 | 11.0 |
| 2.41 - 26.32 | 47 | 546,571,057 | 75.0 |
| Total: | 65 | $729,014,163 | 100.0% |
| Min: 1.39x | Max: 26.32x Wtd Avg: 3.85x | ||
UW NOI Debt Yield (%)
| No. of Mortgage Loans | Aggregate Cut-off Date Balance ($) | % of Pool | |
| 7.6 - 9.0 | 12 | 181,140,000 | 24.8 |
| 9.1 – 10.0 | 8 | 168,600,000 | 23.1 |
| 10.1 - 12.0 | 15 | 156,079,107 | 21.4 |
| 12.1 - 13.0 | 3 | 41,637,500 | 5.7 |
| 13.1 - 15.0 | 3 | 15,180,000 | 2.1 |
| 15.1 – 137.0 | 24 | 166,377,557 | 22.8 |
| Total: | 65 | $729,014,163 | 100.0% |
| Min: 7.6% | Max: 137.0% Wtd Avg: 14.1% | ||
| (1) | All numerical information concerning the mortgage loans is approximate. All weighted average information regarding the mortgage loans reflects the weighting of the mortgage loans based on their outstanding principal balances as of the Cut-off Date. The sum of numbers and percentages in columns may not match the “Total” due to rounding. With respect to any mortgage loan that is part of a whole loan, unless otherwise indicated, all LTV, DSCR and Debt Yield calculations include any related pari passu companion loans and exclude any related subordinate companion loans, as applicable. For mortgaged properties securing residential cooperative mortgage loans, the UW DSCR and UW NOI Debt Yield for each such mortgaged property is calculated using underwritten net operating income or underwritten net cash flow, as applicable, for the related residential cooperative property which is the projected net operating income or net cash flow, as applicable, reflected in the most recent appraisal obtained by or otherwise in the possession of the related mortgage loan seller as of the Cut-off Date. LTV calculations are based upon the appraised value of the residential cooperative property determined as if such residential cooperative property is operated as a residential cooperative, inclusive of the amount of the underlying debt encumbering such residential cooperative property. The UW NCF DSCR, UW NOI Debt Yield and LTV calculations do not take into account any subordinate debt (whether or not secured by the related mortgaged property), that currently exists or is allowed under the terms of any mortgage loan. The information for each mortgaged property that relates to a mortgage loan that is cross-collateralized or cross-defaulted with one or more other mortgage loans is based upon the principal balance of that mortgage loan, except that the applicable loan-to-value ratio, debt service coverage ratio, and debt yield for each such mortgage loan is based upon the ratio or yield (as applicable) for the aggregate indebtedness evidenced by all loans in the group (without regard to any limitation on the amount of indebtedness secured by any mortgaged property in such cross-collateralized group). |
| (2) | In the case of mortgage loans secured by multiple properties, cut-off date balance information is based on allocated loan amounts with respect to such properties. |
| (3) | “California – Northern” includes zip codes above 93600, and “California – Southern” includes zip codes at or below 93600. |
This is not a research report and was not prepared by any Underwriter’s research department. Please see additional important information and qualifications at the end of this Term Sheet. |
T-30
(THIS PAGE INTENTIONALLY LEFT BLANK)
T-31
| Office – CBD | Loan # 1 | Cut-off Date Balance: | $72,000,000 | |
| 1 North Wacker Drive | One North Wacker | Cut-off Date LTV: | 53.2% | |
| Chicago, IL 60606 | UW NCF DSCR: | 2.96x | ||
| UW NOI Debt Yield: | 8.9% |
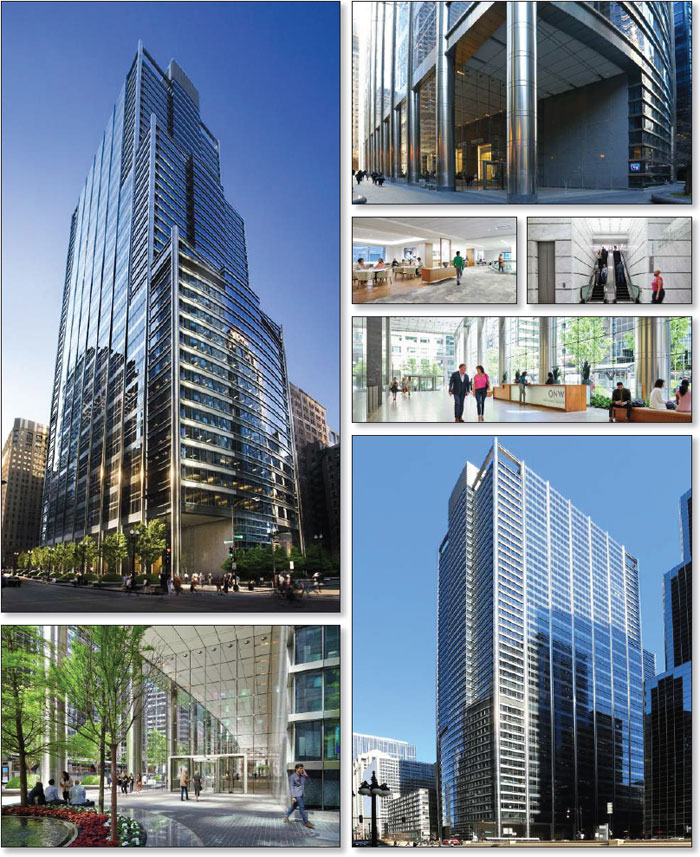
This is not a research report and was not prepared by any Underwriter’s research department. Please see additional important information and qualifications at the end of this Term Sheet. |
T-32
| Office – CBD | Loan # 1 | Cut-off Date Balance: | $72,000,000 | |
| 1 North Wacker Drive | One North Wacker | Cut-off Date LTV: | 53.2% | |
| Chicago, IL 60606 | UW NCF DSCR: | 2.96x | ||
| UW NOI Debt Yield: | 8.9% |
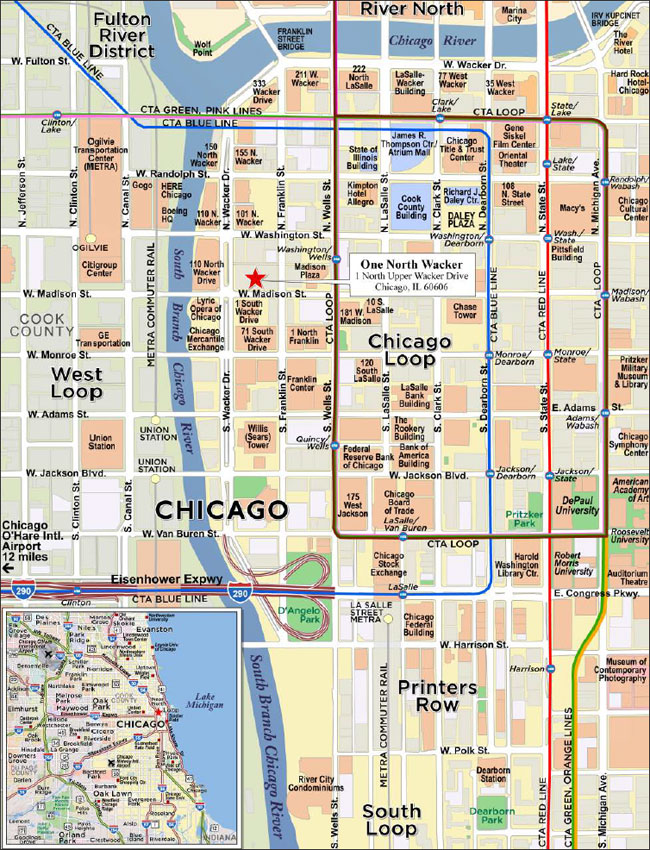
This is not a research report and was not prepared by any Underwriter’s research department. Please see additional important information and qualifications at the end of this Term Sheet. |
T-33
| Mortgage Loan No. 1 – One North Wacker |
| Mortgage Loan Information | Property Information | ||||||
| Mortgage Loan Seller: | BANA | Single Asset/Portfolio: | Single Asset | ||||
| Credit Assessment (Fitch/KBRA/S&P): | NR/NR/NR | Location: | Chicago, IL 60606 | ||||
| Original Balance(1): | $72,000,000 | General Property Type: | Office | ||||
| Cut-off Date Balance(1): | $72,000,000 | Detailed Property Type: | CBD | ||||
| % of Initial Pool Balance: | 9.9% | Title Vesting: | Fee | ||||
| Loan Purpose: | Refinance | Year Built/Renovated: | 2001 / NAP | ||||
| Borrower Sponsor: | The Irvine Company | Size: | 1,412,035 SF | ||||
| Guarantor: | 71 South Wacker Drive Holdings LLC | Cut-off Date Balance Per SF(1): | $250 | ||||
| Mortgage Rate: | 2.7185% | Maturity Date Balance Per SF(1): | $250 | ||||
| Note Date: | 9/10/2021 | Property Manager: | Hines Interests Limited Partnership | ||||
| First Payment Date: | 11/1/2021 | ||||||
| Maturity Date: | 10/1/2031 | ||||||
| Original Term to Maturity: | 120 months | ||||||
| Original Amortization Term: | 0 months | Underwriting and Financial Information(5) | |||||
| IO Period: | 120 months | UW NOI: | $31,276,370 | ||||
| Seasoning: | 2 months | UW NOI Debt Yield(1): | 8.9% | ||||
| Prepayment Provisions(2): | L(26),DorYM1(89),O(5) | UW NOI Debt Yield at Maturity(1): | 8.9% | ||||
| Lockbox/Cash Mgmt Status: | Hard/Springing | UW NCF DSCR(1): | 2.96x | ||||
| Additional Debt Type(1): | Pari Passu | Most Recent NOI: | $30,737,245 (7/31/2021) | ||||
| Additional Debt Balance(1): | $281,000,000 | 2nd Most Recent NOI: | $36,156,466 (6/30/2020) | ||||
| Future Debt Permitted (Type): | No (NAP) | 3rd Most Recent NOI: | $32,913,965 (6/30/2019) | ||||
| Reserves(3) | Most Recent Occupancy: | 81.3% (9/1/2021) | |||||
| Type | Initial | Monthly | Cap | 2nd Most Recent Occupancy: | 91.0% (6/30/2020) | ||
| RE Taxes: | $0 | Springing | NAP | 3rd Most Recent Occupancy: | 87.0% (6/30/2019) | ||
| Insurance: | $0 | Springing | NAP | Appraised Value (as of): | $664,000,000 (8/10/2021) | ||
| Replacement Reserve: | $0 | Springing | $299,964 | Appraised Value Per SF: | $470 | ||
| TI/LC Reserve: | $0 | Springing | $5,600,000 | Cut-off Date LTV Ratio(1): | 53.2% | ||
| Other Reserve(4): | $6,501,426 | $0 | NAP | Maturity Date LTV Ratio(1): | 53.2% | ||
| Sources and Uses | ||||||
| Sources | Proceeds | % of Total | Uses | Proceeds | % of Total | |
| Whole Loan Amount(1): | $353,000,000 | 98.1% | Loan Payoff: | $352,858,833 | 98.0% | |
| Borrower Equity: | $6,961,961 | 1.9% | Reserves: | $6,501,426 | 1.8% | |
| Closing Costs: | $601,702 | 0.2% | ||||
| Total Sources: | $359,961,961 | 100.0% | Total Uses: | $359,961,961 | 100.0% | |
| (1) | The One North Wacker Mortgage Loan (as defined below) is part of the One North Wacker Whole Loan (as defined below), which is evidenced by eight pari passu promissory notes with an aggregate principal balance of $353,000,000. The Cut-off Date Balance Per SF, Maturity Date Balance Per SF, UW NOI Debt Yield, UW NOI Debt Yield at Maturity, UW NCF DSCR, Cut-off Date LTV Ratio and Maturity Date LTV Ratio numbers presented above are based on the aggregate principal balance of the promissory notes comprising the One North Wacker Whole Loan. |
| (2) | Defeasance of the One North Wacker Whole Loan is permitted at any time after the earlier to occur of (a) the end of the two-year period commencing on the closing date of the securitization of the last portion of the One North Wacker Whole Loan to be securitized and (b) November 1, 2024. The assumed prepayment lockout period of 26 payments is based on the closing date of this transaction in December 2021. |
| (3) | See “Escrows and Reserves” below for further discussion of reserve information. The borrower is permitted to provide a letter of credit or guaranty in lieu of certain monthly reserves. |
| (4) | Other Reserve consists of a free rent reserve ($1,915,596) and a landlord obligations reserve ($4,585,830). |
| (5) | The novel coronavirus pandemic is an evolving situation and could impact the One North Wacker Whole Loan more severely than assumed in the underwriting of the One North Wacker Whole Loan and could adversely affect the NOI, NCF and occupancy information, as well as the appraised value and the DSCR, LTV and Debt Yield metrics presented above and herein. See "Risk Factors-—Risks Related to Market Conditions and Other External Factors—The Coronavirus Pandemic Has Adversely Affected the Global Economy and Will Likely Adversely Affect the Performance of the Mortgage Loans" in the prospectus. |
The Mortgage Loan. The largest mortgage loan (the “One North Wacker Mortgage Loan”) is part of a whole loan (the “One North Wacker Whole Loan”) that is evidenced by eight pari passu promissory notes in the aggregate original principal amount of $353,000,000 and secured by a first priority fee mortgage encumbering a 1,412,035 SF Class A office tower located in Chicago, Illinois (the “One North Wacker Property”). The One North Wacker Mortgage Loan is evidenced by the non-controlling Note A-2-1 with an original principal amount of $72,000,000. The remaining promissory notes comprising the One North Wacker Whole Loan are summarized in the below table. The One North Wacker Whole Loan will be serviced pursuant to the pooling and servicing agreement for the BANK 2021-BNK36 securitization. See “Description of the Mortgage Pool—The Whole Loans—The Non-Serviced Pari Passu Whole Loans” and “Pooling and Servicing Agreement—Servicing of the Non-Serviced Mortgage Loans” in the prospectus.
This is not a research report and was not prepared by any Underwriter’s research department. Please see additional important information and qualifications at the end of this Term Sheet. |
T-34
| Office – CBD | Loan # 1 | Cut-off Date Balance: | $72,000,000 | |
| 1 North Wacker Drive | One North Wacker | Cut-off Date LTV: | 53.2% | |
| Chicago, IL 60606 | UW NCF DSCR: | 2.96x | ||
| UW NOI Debt Yield: | 8.9% |
| One North Wacker Whole Loan Summary | ||||
Note | Original Balance | Cut-off Date Balance | Note Holder | Controlling Piece |
| A-1 | $122,000,000 | $122,000,000 | BANK 2021-BNK36 | Yes |
| A-2-1 | $72,000,000 | $72,000,000 | BANK 2021-BNK38 | No |
| A-2-2 | $23,000,000 | $23,000,000 | Bank of America, N.A. | No |
| A-3 | $80,000,000 | $80,000,000 | BANK 2021-BNK37 | No |
| A-4 | $20,500,000 | $20,500,000 | BANK 2021-BNK37 | No |
| A-5 | $15,500,000 | $15,500,000 | Bank of America, N.A. | No |
| A-6 | $15,000,000 | $15,000,000 | BANK 2021-BNK37 | No |
| A-7 | $5,000,000 | $5,000,000 | BANK 2021-BNK36 | No |
| Total | $353,000,000 | $353,000,000 | ||
The Borrower and the Borrower Sponsor. The borrower is One North Wacker LLC, a Delaware limited liability company and single purpose entity with two independent directors.
The borrower sponsor is The Irvine Company, a private real estate developer, operator and investor headquartered in Newport Beach, California. The Irvine Company acquired the One North Wacker Property in two transactions in 2011 and 2015 for a purchase price of approximately $539 million and, after capital expenditures and leasing costs, maintains a current cost basis of $805 million. The non-recourse carveout guarantor is 71 South Wacker Drive Holdings LLC, an affiliate of the borrower sponsor.
The Property. The One North Wacker Property is a 51-story, 1,412,035 SF, Class A, LEED Platinum certified office tower located in Chicago, Illinois. Originally constructed in 2001, the One North Wacker Property features a three story glass atrium lobby, column-free floor plates with floor-to-ceiling glass windows, a landscaped plaza, an on-site sundry shop, a 9,597 SF conference center, a private fitness center and the One North Kitchen restaurant and bar. The One North Wacker Property also includes a two-story, 210-space below grade parking garage.
As of September 1, 2021, the One North Wacker Property was 81.3% leased to a granular rent roll of 48 tenants from a wide range of industries. The One North Wacker Property’s two largest tenants by NRA, Pricewaterhouse Coopers, LLP and UBS Americas Inc, are established, multinational corporations that have occupied the One North Wacker Property since its original construction in 2001. None of the remaining tenants contribute more than 9.5% to the underwritten base rent at the One North Wacker Property. Between 2013 and 2021, the property has maintained an average occupancy of 90%.
Major Tenants.
Pricewaterhouse Coopers, LLP (316,840 SF, 22.4% of NRA, 27.9% of underwritten base rent). Pricewaterhouse Coopers, LLP (“PWC”) is one of the world’s largest accounting firms and one of the largest privately held firms in the United States. PWC employs over 284,000 employees in 155 countries. PWC’s professional services include audit, tax and consulting in various industries. PWC occupies 316,840 SF at the One North Wacker Property on a lease that expires in October 2028, with three, five-year renewal options. PWC has the option to terminate its lease effective October 31, 2025, if notice is given by April 30, 2024 together with payment of a termination fee comprised of the unamortized amount of allowances, rent abatement, commissions and capital expenses, plus interest. PWC is reportedly currently seeking to sublease 70,082 SF (22.1% of its space). The One North Wacker Whole Loan is structured with a cash sweep period that will commence upon the earlier of (i) PWC’s failure to exercise its extension option for all of its leased space prior to the earlier of (x) the date that PWC is required to exercise such option under its lease and (y) the date that is 15 months prior to the then applicable expiration date of its lease; and (ii) PWC providing formal written notice that it relinquishes its lease renewal option with respect to all or a portion of its leased space. See “Lockbox and Cash Management” below.
UBS Americas Inc (138,445 SF, 9.8% of NRA, 14.9% of underwritten base rent). Founded in 1862 and headquartered in Zurich, Switzerland, UBS Group AG is an international financial services company offering a full range of wealth management and investment services. UBS Americas Inc, a subsidiary of UBS Group AG, has been a tenant at the One North Wacker Property since 2001 and currently occupies 138,445 SF. UBS Americas Inc recently renewed its lease through September 2032, which renewal will be effective October 1, 2022, and has two, five-year renewal options remaining. In connection with the ten-year renewal, UBS Americas Inc committed to a 2.5% annual rent increase and received $40.00 PSF in tenant improvement allowances from the landlord and five months of abated rent from October 1, 2022 through February 28, 2023.
Barnes & Thornburg LLP (95,475 SF, 6.8% of NRA, 9.5% of underwritten base rent). Barnes & Thornburg LLP is a national, full-service law firm that employs approximately 600 attorneys and operates 19 offices in the continental United States. Barnes & Thornburg LLP occupies 95,475 SF at the One North Wacker Property on a lease that expires in February 2030, with two, five-year renewal options. Barnes & Thornburg currently subleases 27,747 SF to Baker & Hostetler through April 30, 2024.
This is not a research report and was not prepared by any Underwriter’s research department. Please see additional important information and qualifications at the end of this Term Sheet. |
T-35
| Office – CBD | Loan # 1 | Cut-off Date Balance: | $72,000,000 | |
| 1 North Wacker Drive | One North Wacker | Cut-off Date LTV: | 53.2% | |
| Chicago, IL 60606 | UW NCF DSCR: | 2.96x | ||
| UW NOI Debt Yield: | 8.9% |
The following table presents certain information relating to the tenancy at the One North Wacker Property:
| Tenant Summary(1) | |||||||||
| Tenant Name | Credit Rating (Fitch/Moody’s/S&P)(2) | Tenant SF | Approx. % of SF | Annual UW Rent | % of Total Annual UW Rent | Annual UW Rent PSF | Lease Exp. | Renewal Options | Term. Option (Y/N) |
| Pricewaterhouse Coopers, LLP | NR/NR/NR | 316,840 | 22.4% | $10,354,159 | 27.9% | $32.68 | 10/31/2028 | 3 x 5 yr | Y(3) |
| UBS Americas Inc(4) | NR/Aa3/A+ | 138,445 | 9.8% | $5,543,627 | 14.9% | $40.04 | 9/30/2032 | 2 x 5 yr | N |
| Barnes & Thornburg LLP(5) | NR/NR/NR | 95,475 | 6.8% | $3,528,008 | 9.5% | $36.95 | 2/28/2030 | 2 x 5 yr | N |
| Fitch Group, Inc. | NR/NR/NR | 65,392 | 4.6% | $1,923,828 | 5.2% | $29.42 | 12/31/2031 | 2 x 5 yr | Y(6) |
| The McQuade Financial Group(7) | NR/NR/NR | 50,342 | 3.6% | $2,043,885 | 5.5% | $40.60 | 8/31/2027 | 2 x 5 yr | N |
| Adams Street Partners, LLC | NR/NR/NR | 40,444 | 2.9% | $1,250,124 | 3.4% | $30.91 | 9/30/2030 | 2 x 5 yr | Y(8) |
| B.C. Ziegler and Company | NR/NR/NR | 32,445 | 2.3% | $966,960 | 2.6% | $29.80 | 7/31/2030 | 2 x 5 yr | Y(9) |
| Stifel, Nicolaus & Company | BBB/NR/BBB- | 29,477 | 2.1% | $840,095 | 2.3% | $28.50 | 6/30/2034 | NAP | Y(10) |
| The Irvine Company(11) | NR/NR/NR | 25,116 | 1.8% | $0 | 0.0% | $0.00 | Various(4) | NAP | N |
| Wipfli | NR/NR/NR | 24,359 | 1.7% | $682,052 | 1.8% | $28.00 | 11/30/2029 | 2 x 5 yr +1 x 10 yr | Y(12) |
| Subtotal/Wtd. Avg. | 818,335 | 58.0% | $27,132,738 | 73.0% | $33.16 | ||||
| Other Tenants | 330,251 | 23.4% | $10,032,085 | 27.0% | $30.38 | ||||
| Vacant Space | 263,449 | 18.7% | $0 | 0.0% | $0.00 | ||||
| Total/Wtd. Avg. | 1,412,035 | 100.0% | $37,164,823 | 100.0% | $32.36(13) | ||||
| (1) | Information is based on the underwritten rent roll dated September 1, 2021. |
| (2) | Certain ratings are those of the parent company whether or not the parent guarantees the lease. |
| (3) | Pricewaterhouse Coopers, LLP has the option to terminate its lease effective October 31, 2025, if notice is given by April 30, 2024 together with payment of a termination fee comprised of the unamortized amount of allowances, rent abatement, commissions and capital expenses, plus interest. |
| (4) | In connection with its lease renewal, UBS Americas Inc received five months of abated rent from October 1, 2022 through February 28, 2023. |
| (5) | Barnes & Thornburg currently subleases 27,747 SF to Baker & Hostetler through April 30, 2024. |
| (6) | Fitch Group, Inc. has the option to terminate its lease effective December 31, 2029, with 12 months’ notice and payment of a termination fee equal to $3,734,090. |
| (7) | The McQuade Financial Group currently subleases 3,456 SF to Waitzman Voigt, D’Aquila through August 31, 2027. |
| (8) | Adams Street Partners, LLC has the option to terminate its lease effective September 30, 2027, with 12 months’ notice and payment of a termination fee equal to $1,929,294. |
| (9) | B.C. Ziegler and Company has the option to terminate its lease effective July 31, 2025, with 12 months’ notice and payment of a termination fee equal to $3,618,303. |
| (10) | Stifel, Nicolaus & Company has the option to terminate its lease effective December 31, 2030, with 12 months’ notice and payment of a termination fee equal to $2,240,918. |
| (11) | The Irvine Company is sponsor affiliated. The Irvine Company occupies 17,379 SF expiring on July 31, 2024 and 7,737 SF expiring on October 31, 2026. |
| (12) | Wipfli has the option to terminate its lease effective May 31, 2026, with 12 months’ notice and payment of a termination fee equal to $2,032,058. |
| (13) | Wtd. Avg. Annual UW Rent PSF excludes vacant space. |
The following table presents certain information relating to the lease rollover schedule at the One North Wacker Property:
| Lease Rollover Schedule(1)(2) | ||||||||
| Year | # of Leases Rolling | SF Rolling | UW Rent PSF Rolling | Approx. % of Total SF Rolling | Approx. Cumulative % of SF Rolling | Total UW Rent Rolling | Approx. % of Total Rent Rolling | Approx. Cumulative % of Total Rent Rolling |
| MTM / 2021 | 2 | 2,528 | $34.80 | 0.2% | 0.2% | $87,974 | 0.2% | 0.2% |
| 2022 | 6 | 33,154 | $29.63 | 2.3% | 2.5% | $982,472 | 2.6% | 2.9% |
| 2023 | 2 | 8,964 | $29.54 | 0.6% | 3.2% | $264,779 | 0.7% | 3.6% |
| 2024 | 9 | 66,083 | $24.53 | 4.7% | 7.8% | $1,621,042 | 4.4% | 8.0% |
| 2025 | 7 | 47,400 | $30.42 | 3.4% | 11.2% | $1,441,822 | 3.9% | 11.8% |
| 2026 | 5 | 56,331 | $27.31 | 4.0% | 15.2% | $1,538,595 | 4.1% | 16.0% |
| 2027 | 6 | 80,313 | $38.72 | 5.7% | 20.9% | $3,109,650 | 8.4% | 24.3% |
| 2028 | 7 | 363,072 | $32.55 | 25.7% | 46.6% | $11,817,770 | 31.8% | 56.1% |
| 2029 | 2 | 32,112 | $29.74 | 2.3% | 48.9% | $954,926 | 2.6% | 58.7% |
| 2030 | 8 | 203,448 | $34.59 | 14.4% | 63.3% | $7,038,243 | 18.9% | 77.6% |
| 2031 | 1 | 65,392 | $29.42 | 4.6% | 67.9% | $1,923,828 | 5.2% | 82.8% |
| 2032 & Beyond | 4 | 189,789 | $33.64 | 13.4% | 81.3% | $6,383,722 | 17.2% | 100.0% |
| Vacant | 0 | 263,449 | $0.00 | 18.7% | 100.0% | $0 | 0.0% | 100.0% |
| Total/Wtd. Avg. | 59 | 1,412,035 | $32.36(3) | 100.0% | $37,164,823 | 100.0% | ||
| (1) | Information is based on the underwritten rent roll dated September 1, 2021. |
| (2) | Certain tenants may have lease termination options that are exercisable prior to the originally stated expiration date of the related lease and are not considered in the rollover schedule. |
| (3) | Wtd. Avg. UW Rent PSF Rolling excludes vacant space. |
This is not a research report and was not prepared by any Underwriter’s research department. Please see additional important information and qualifications at the end of this Term Sheet. |
T-36
| Office – CBD | Loan # 1 | Cut-off Date Balance: | $72,000,000 | |
| 1 North Wacker Drive | One North Wacker | Cut-off Date LTV: | 53.2% | |
| Chicago, IL 60606 | UW NCF DSCR: | 2.96x | ||
| UW NOI Debt Yield: | 8.9% |
COVID-19 Update. As of September 9, 2021, the borrower sponsor had reported no collection issues. The borrower sponsor granted COVID-19 related rent relief to two food-service tenants, which rent relief is no longer outstanding other than approximately $10,260 of abated rent due to Munchies as of the closing date of the One North Wacker Whole Loan.
The Market. The One North Wacker Property is situated at the northeast corner of Wacker Drive and Madison Street along the west side of North Franklin Street in the West Loop submarket of Chicago. The site is within walking distance of several public transportation options, including Chicago Transit Authority bus and “L” systems, Union Station and Ogilvie Transportation Center. Additionally, two interstates, I-90 and I-290, are accessible in close proximity to the One North Wacker Property.
The One North Wacker Property is located in the West Loop office submarket, within the Downtown Chicago office market. At the end of the second quarter of 2021, the West Loop office submarket was 84.9% Class A space, with inventory of 52,058 SF, a vacancy rate of 15.2% and average asking rent of $44.69 PSF. From 2016 to 2020, the Class A submarket added 6,332 SF, vacancy ranged from 11.75% to 13.63% and asking rent increased by 17.0%.
The One North Wacker Property benefits from the area’s population density. The estimated 2021 population within a 1-, 3- and 5-mile radius of the One North Wacker Property was 80,323, 375,627 and 850,278, respectively. The estimated 2021 average household income within the same radii was $165,806, $145,096 and $124,630, respectively.
The following table presents the comparable office properties to the One North Wacker Property:
| Comparable Property Summary | |||||
Property Name Address | Year Built | Rentable Area (SF) | Occupancy | Asking Rent | Major Tenants |
One North Wacker 1 North Wacker Drive | 2001 | 1,412,035(1) | 81.3%(1) | $32.36(1) | Pricewaterhouse Coopers, LLP, UBS Americas Inc, Barnes & Thornburg LLP, Fitch Group, Inc., The McQuade Financial Group |
Bank of America Tower 110 North Wacker Drive | 2020 | 1,546,909 | 76.4% | - | Bank of America, Lincoln International, Regus 18, Perkins Coie |
River Point 444 West Lake Street | 2016 | 1,081,702 | 99.4% | $46.05 | McDermott Will and Emery, DLA Piper, LLP, Mead Johnson, Harrison Street Capital |
| 300 North LaSalle Street(2) | 2009 | 1,302,901 | 97.7% | $40.04 | Aviva USA Corporation, Hub International, PSP Capital Partners |
Mesirow Financial Building 353 North Clark Street | 2009 | 1,184,255 | 91.6% | - | Intercontinental Exchange, Inc., Insight Global LLC, American Board of Medical Specialties |
| 155 North Wacker Drive | 2009 | 1,152,953 | 92.3% | $38.34 | The Savo Group Ltd, Broker’s Risk Placement Service, Ogletree, Deakins, Nash |
Hyatt Center 71 South Wacker Drive(2) | 2005 | 1,687,710 | 95.9% | $30.16 | Mayer Brown, LLP, IBM Corporation, iManage, Towers Watson, Milliman |
One Eleven South Wacker 111 South Wacker Drive | 2004 | 1,213,322 | 95% | $28.79 | Houlihan Lokey, Harris Associates, RBC Wealth Management |
Source: Appraisal
| (1) | Information is based on the underwritten rent roll dated September 1, 2021. |
| (2) | 300 North LaSalle Street and Hyatt Center are also owned by the borrower sponsor. |
The following table presents certain information relating to the appraisal’s market rent conclusion for the One North Wacker Property:
| Market Rent Summary | ||||
| Market Rent PSF | Lease Term (Mos.) | Rent Increase Projection | Lease Type | |
| Low-Rise Office <10k SF | $26.00 | 60 | 2.5% per annum | NNN |
| Low-Rise Office >10k SF | $26.00 | 120 | 2.5% per annum | NNN |
| Mid-Rise Office <10k SF | $27.00 | 84 | 2.5% per annum | NNN |
| Mid-Rise Office >10k SF | $27.00 | 120 | 2.5% per annum | NNN |
| High-Rise Office <10k SF | $33.00 | 84 | 2.5% per annum | NNN |
| High-Rise Office >10k SF | $33.00 | 120 | 2.5% per annum | NNN |
| Retail | $50.00 | 120 | None | NNN |
This is not a research report and was not prepared by any Underwriter’s research department. Please see additional important information and qualifications at the end of this Term Sheet. |
T-37
| Office – CBD | Loan # 1 | Cut-off Date Balance: | $72,000,000 | |
| 1 North Wacker Drive | One North Wacker | Cut-off Date LTV: | 53.2% | |
| Chicago, IL 60606 | UW NCF DSCR: | 2.96x | ||
| UW NOI Debt Yield: | 8.9% |
Operating History and Underwritten Net Cash Flow. The following table presents certain information relating to the historical operating performance and Underwritten Net Cash Flow at the One North Wacker Property:
| Cash Flow Analysis | ||||||
2018(1) | 2019(1) | 2020(1) | TTM 7/31/2021 | UW | UW PSF | |
| Gross Potential Rent(2) | $36,368,825 | $37,210,886 | $39,255,102 | $37,501,013 | $44,602,883 | $31.59 |
| Reimbursements | $27,554,940 | $26,297,908 | $28,082,091 | $28,380,399 | $39,387,779 | $27.89 |
| Parking Income | $885,253 | $854,306 | $687,047 | $262,917 | $450,597 | $0.32 |
| Other Income | $1,415,339 | $1,189,211 | $1,029,114 | $598,902 | $1,110,080 | $0.79 |
| (Vacancy & Concessions) | $0 | $0 | $0 | $0 | ($14,779,360) | (10.47) |
| Effective Gross Income | $66,224,357 | $65,552,311 | $69,053,354 | $66,743,231 | $70,771,979 | $50.12 |
| Real Estate Taxes | $20,814,040 | $20,212,039 | $20,586,725 | $24,744,256 | $25,436,918 | $18.01 |
| Insurance | $473,195 | $494,509 | $502,621 | $555,747 | $698,712 | $0.49 |
| Other Operating Expenses | $12,059,082 | $11,931,798 | $11,807,543 | $10,705,982 | $13,359,979 | $9.46 |
| Total Operating Expenses | $33,346,317 | $32,638,346 | $32,896,888 | $36,005,986 | $39,495,609 | $27.97 |
| Net Operating Income | $32,878,040 | $32,913,965 | $36,156,466 | $30,737,245 | $31,276,370 | $22.15 |
| Replacement Reserves | $0 | $0 | $0 | $0 | $299,964 | $0.21 |
| TI/LC | $0 | $0 | $0 | $0 | $2,142,602 | $1.52 |
| Net Cash Flow | $32,878,040 | $32,913,965 | $36,156,466 | $30,737,245 | $28,833,804 | $20.42 |
| Occupancy % | 86.0% | 87.0% | 91.0% | 81.3%(3) | 82.4%(4) | |
| NOI DSCR(5) | 3.38x | 3.38x | 3.72x | 3.16x | 3.21x | |
| NCF DSCR(5) | 3.38x | 3.38x | 3.72x | 3.16x | 2.96x | |
| NOI Debt Yield(5) | 9.3% | 9.3% | 10.2% | 8.7% | 8.9% | |
| NCF Debt Yield(5) | 9.3% | 9.3% | 10.2% | 8.7% | 8.2% | |
| (1) | Represents trailing 12 months as of June 30 for each respective year. |
| (2) | UW Gross Potential Rent includes contractual rent steps through October 1, 2022 ($751,146) and straight line averaged rent for investment grade rated tenants ($542,907). |
| (3) | Represents occupancy as of September 1, 2021. |
| (4) | Represents economic occupancy. |
| (5) | Debt service coverage ratios and debt yields are based on the One North Wacker Whole Loan. |
Escrows and Reserves.
Real Estate Taxes – The borrower is required to deposit monthly to a real estate tax reserve 1/12 of the annual estimated real estate taxes (i) during a Cash Trap Event Period (as defined below), (ii) during a DSCR Trigger Event Period (as defined below), or (iii) upon the borrower’s failure to provide the lender evidence of timely payment of taxes. Provided no event of default is continuing, in lieu of monthly deposits to the real estate tax reserve, the borrower is permitted to provide a letter of credit or a guaranty for such amounts from a borrower affiliate approved by the lender.
Insurance – The borrower is required to deposit monthly 1/12 of the annual estimated insurance premiums to the insurance reserve (i) during a Cash Trap Event Period, (ii) during a DSCR Trigger Event Period, or (iii) upon the borrower’s failure to provide the lender evidence of the renewal of a blanket policy to the extent the borrower maintains insurance pursuant to a blanket policy. Provided no event of default is continuing, in lieu of monthly deposits to the insurance reserve, the borrower is permitted to provide a letter of credit or a guaranty for such amounts from a borrower affiliate approved by the lender.
Replacement Reserve – During either a Cash Trap Event Period or a DSCR Trigger Event Period, the borrower is required to deposit monthly $24,997 to a reserve for replacements to the One North Wacker Property, subject to a cap of $299,964. Provided no event of default is continuing, in lieu of monthly deposits to the replacement reserve, the borrower is permitted to provide a letter of credit or a guaranty for such amounts from a borrower affiliate approved by the lender.
TI/LC Reserve – During a DSCR Trigger Event Period, the borrower is required to deposit monthly $178,550 for future tenant improvements and leasing commissions, subject to a cap of $5,600,000. Provided no event of default is continuing, in lieu of monthly deposits to the TI/LC reserve, the borrower is permitted to provide a letter of credit or a guaranty for such amounts from a borrower affiliate approved by the lender.
Free Rent Reserve – At loan origination, the borrower deposited $1,915,596 into a free rent reserve for outstanding obligations relating to The Alexander Group, Inc through April 1, 2022 and to Stifel, Nicolaus & Company through October 1, 2022. Funds in the free rent reserve account are required to be disbursed monthly as rent becomes due under each applicable lease.
Landlord Obligations Reserve – At loan origination, the borrower deposited $4,585,830 into a landlord obligation reserve for outstanding obligations to The Alexander Group, Inc, Stifel, Nicolaus & Company, Boyd Watterson Asset Management LLC and The Jordan Company, L.P. Upon request from the borrower, the lender will be required to disburse funds to reimburse the borrower for costs and expenses incurred in the performance of certain unfunded landlord obligations set forth in the One North Wacker Whole Loan documents.
This is not a research report and was not prepared by any Underwriter’s research department. Please see additional important information and qualifications at the end of this Term Sheet. |
T-38
| Office – CBD | Loan # 1 | Cut-off Date Balance: | $72,000,000 | |
| 1 North Wacker Drive | One North Wacker | Cut-off Date LTV: | 53.2% | |
| Chicago, IL 60606 | UW NCF DSCR: | 2.96x | ||
| UW NOI Debt Yield: | 8.9% |
A “DSCR Trigger Event Period” will commence upon the date, tested quarterly, that the amortizing debt service coverage ratio is less than 1.15x and will expire on the date, tested quarterly, that the amortizing debt service coverage ratio is equal to or greater than 1.15x for two consecutive calendar quarters.
Lockbox and Cash Management. The One North Wacker Whole Loan is structured with a hard lockbox and springing cash management. All rents from the One North Wacker Property are required to be deposited directly to the lockbox account and, so long as a Cash Trap Event Period is not continuing, funds in the lockbox account will be transferred to the borrower’s operating account. During a Cash Trap Event Period, the borrower will not have access to the funds in the lockbox account and such funds will be transferred to the lender-controlled cash management account and disbursed according to the One North Wacker Whole Loan documents. During a Cash Trap Event Period, all excess cash is required to be held by the lender as additional security for the One North Wacker Whole Loan; provided that excess cash will be disbursed at the direction of the borrower if a PWC Excess Cash Flow Sweep Stop (as defined below) is in effect.
A “Cash Trap Event Period” will (a) commence upon (i) the occurrence of an event of default, (ii) PWC failing to exercise its extension option with respect to all of the PWC space prior to the earlier of (x) the date by which PWC is required to exercise such option pursuant to the lease and (y) 15 months prior to the then applicable lease expiration date, (iii) PWC providing notice that it is relinquishing its option to renew its lease with respect to all or a portion of the PWC space, (iv) PWC defaulting in the payment of rent for more than 45 days, or (v) PWC becoming the subject of any proceedings as a debtor and (b) terminate when (i) with respect to clause (a)(i), the lender accepts a cure of such event of default, (ii) with respect to clause (a)(ii), PWC exercises its renewal option or one or more replacement tenants lease its space, (iii) with respect to clause (a)(iii), one or more replacement tenants lease PWC’s space, (iv) with respect to clause (a)(iv), PWC has cured such default or one or more tenants lease its space, (v) with respect to clause (a)(v), PWC is no longer subject to any proceedings as a debtor or one or more tenants lease its space.
A “PWC Excess Cash Flow Sweep Stop” will be in effect if, as of any monthly payment date during a Cash Trap Event Period, (a) no event of default exists and (b) total undisbursed funds then on deposit in the excess cash flow account on such monthly payment date are not less than an amount equal to the product of (x) the applicable square footage impacted by PWC’s non-renewal, default or bankruptcy multiplied by (y) $30.
Additional Secured Indebtedness (not including trade debts). The One North Wacker Property also secures notes A-1, A-2-2, A-3, A-4, A-5, A-6 and A-7 (the “One North Wacker Non-Serviced Pari Passu Companion Loans”), which have a Cut-off Date principal balance of $281,000,000. The One North Wacker Non-Serviced Pari Passu Companion Loans accrue interest at the same rate as the One North Wacker Mortgage Loan. The One North Wacker Mortgage Loan is entitled to payments of principal and interest on a pro rata and pari passu basis with the One North Wacker Non-Serviced Pari Passu Companion Loans. The holders of the One North Wacker Mortgage Loan and the One North Wacker Non-Serviced Pari Passu Companion Loans have entered into a co-lender agreement which sets forth the allocation of collections on the One North Wacker Whole Loan. See “Description of the Mortgage Pool—The Whole Loans—The Non-Serviced Pari Passu Whole Loans” in the prospectus.
Mezzanine Loan and Preferred Equity. None.
Release of Property. None.
Letter of Credit. None.
Right of First Offer/Right of First Refusal. None.
Ground Lease. None.
Terrorism Insurance. The borrower is required to obtain and maintain property insurance and business interruption insurance for 24 months plus a 365-day extended period of indemnity. Such insurance is required to cover perils of terrorism and acts of terrorism; provided that the borrower is permitted to maintain terrorism coverage with a licensed captive insurance company that is affiliated with the borrower sponsor if certain conditions set forth in the related Whole Loan documents are satisfied, and if the Terrorism Risk Insurance Program Reauthorization Act of 2019 is not in effect, the borrowers will only be required to pay for terrorism insurance through such captive insurance company a maximum of two times the annual insurance premiums payable for the One North Wacker Property at the time with respect to the property and business interruption policies (excluding the terrorism, named storm and earthquake components of such premiums). See “Risk Factors—Risks Relating to the Mortgage Loans—Terrorism Insurance May Not Be Available for All Mortgaged Properties” in the prospectus.
This is not a research report and was not prepared by any Underwriter’s research department. Please see additional important information and qualifications at the end of this Term Sheet. |
T-39
| Office – CBD | Loan #2 | Cut-off Date Balance: | $70,000,000 | |
| 55 East 52nd Street | Park Avenue Plaza | Cut-off Date LTV: | 31.9% | |
| New York, NY 10055 | UW NCF DSCR: | 5.84x | ||
| UW NOI Debt Yield: | 17.4% |

This is not a research report and was not prepared by any Underwriter’s research department. Please see additional important information and qualifications at the end of this Term Sheet. |
T-40
| Office – CBD | Loan #2 | Cut-off Date Balance: | $70,000,000 | |
| 55 East 52nd Street | Park Avenue Plaza | Cut-off Date LTV: | 31.9% | |
| New York, NY 10055 | UW NCF DSCR: | 5.84x | ||
| UW NOI Debt Yield: | 17.4% |
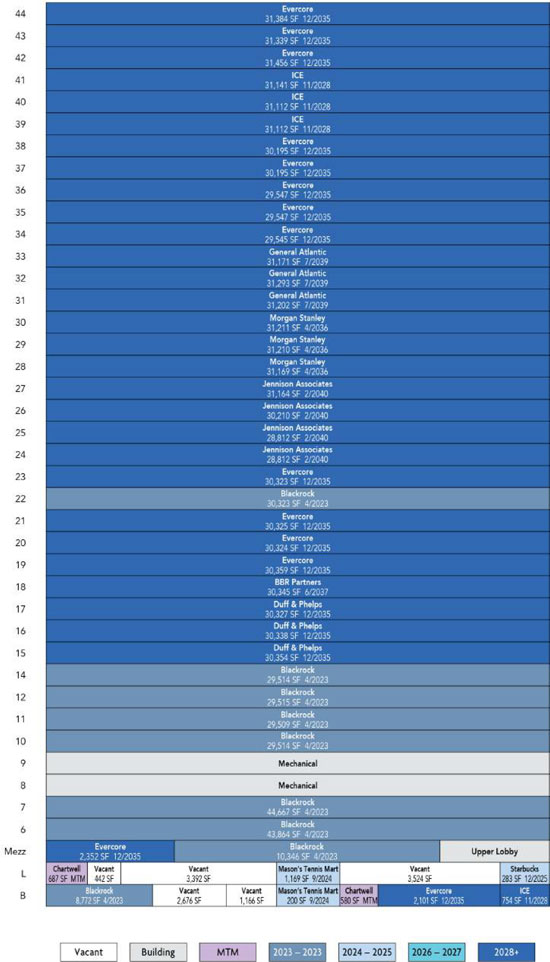
This is not a research report and was not prepared by any Underwriter’s research department. Please see additional important information and qualifications at the end of this Term Sheet. |
T-41
| Office – CBD | Loan #2 | Cut-off Date Balance: | $70,000,000 | |
| 55 East 52nd Street | Park Avenue Plaza | Cut-off Date LTV: | 31.9% | |
| New York, NY 10055 | UW NCF DSCR: | 5.84x | ||
| UW NOI Debt Yield: | 17.4% |
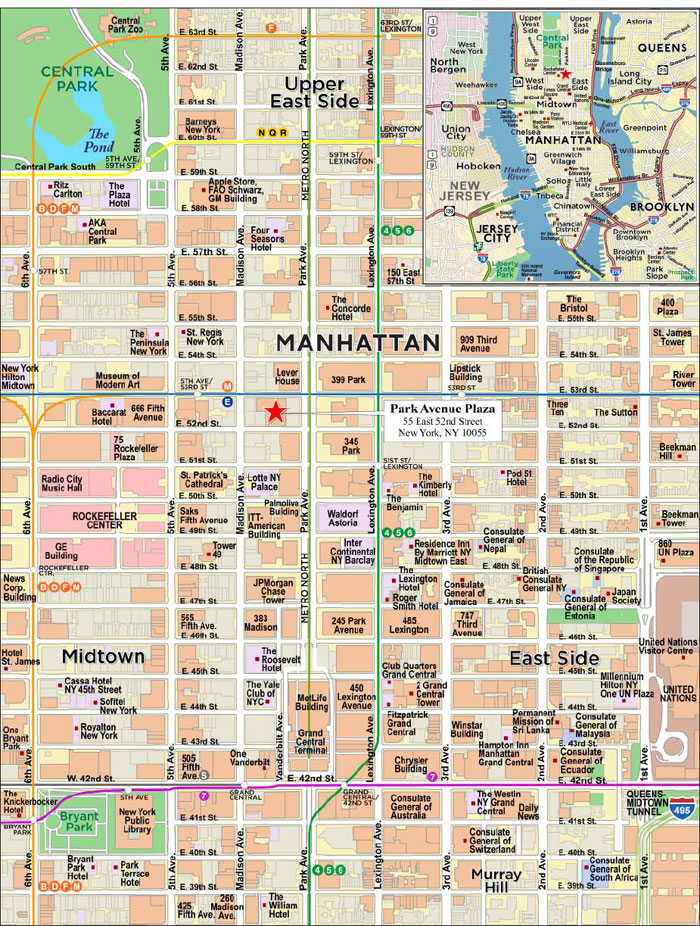
This is not a research report and was not prepared by any Underwriter’s research department. Please see additional important information and qualifications at the end of this Term Sheet. |
T-42
| Mortgage Loan No. 2 – Park Avenue Plaza |
| Mortgage Loan Information | Mortgaged Property Information | ||||||
| Mortgage Loan Seller: | MSMCH | Single Asset/Portfolio: | Single Asset | ||||
| Credit Assessment (Fitch/KBRA/S&P): | BBB-sf/AA-(sf)/NR | Location: | New York, NY 10055 | ||||
| Original Balance(1): | $70,000,000 | General Property Type: | Office | ||||
| Cut-off Date Balance(1): | $70,000,000 | Detailed Property Type: | CBD | ||||
| % of Initial Pool Balance: | 9.6% | Title Vesting: | Fee | ||||
| Loan Purpose: | Refinance | Year Built/Renovated: | 1980/2015 | ||||
| Borrower Sponsor: | Park Avenue Plaza Company L.P. | Size: | 1,159,593 SF | ||||
| and The Sungate Park Avenue | Cut-off Date Balance Per SF(1): | $292 | |||||
| Delaware Trust | Maturity Date Balance Per SF(1): | $292 | |||||
| Guarantor(2): | NAP | Property Manager: | 55 East 52nd Street Management | ||||
| Mortgage Rate: | 2.8375% | L.P. | |||||
| Note Date: | 10/8/2021 | ||||||
| First Payment Date: | 12/5/2021 | ||||||
| Maturity Date: | 11/5/2031 | Underwriting and Financial Information(6) | |||||
| Original Term to Maturity: | 120 months | UW NOI(7): | $59,005,151 | ||||
| Original Amortization Term: | 0 months | UW NOI Debt Yield(1): | 17.4% | ||||
| IO Period: | 120 months | UW NOI Debt Yield at Maturity(1): | 17.4% | ||||
| Seasoning: | 1 months | UW NCF DSCR(1): | 5.84x | ||||
| Prepayment Provisions: | YM1(25),DorYM1(88),O(7) | Most Recent NOI(7): | $48,269,811 (6/30/2021 TTM) | ||||
| Lockbox/Cash Mgmt Status(3): | Hard/In Place | 2nd Most Recent NOI: | $37,355,736 (12/31/2020) | ||||
| Additional Debt Type(1): | Pari Passu/ Subordinate/ Mezzanine | 3rd Most Recent NOI: | $43,307,357 (12/31/2019) | ||||
| Additional Debt Balance(1): | $269,170,000 / $120,830,000 / | Most Recent Occupancy: | 99.0% (10/1/2021) | ||||
| $115,000,000 | 2nd Most Recent Occupancy: | 98.7% (12/31/2020) | |||||
| Future Debt Permitted (Type) (4): | Yes (Mezzanine) | 3rd Most Recent Occupancy: | 98.5% (12/31/2019) | ||||
| Reserves(5) | Appraised Value (as of): | $1,063,000,000 (8/18/2021) | |||||
| Type | Initial | Monthly | Cap | Appraised Value per SF: | $917 | ||
| RE Tax: | $8,606,069 | $2,238,800 | NAP | Cut-off Date LTV Ratio(1): | 31.9% | ||
| Insurance: | $0 | Springing | NAP | Maturity Date LTV Ratio(1): | 31.9% | ||
| Capital Expenditures: | $0 | Springing | $463,837 | ||||
| TI/LC Reserve: | $43,543,892 | Springing | $6,000,000 | ||||
| Sources and Uses | ||||||
| Sources | Proceeds | % of Total | Uses | Proceeds | % of Total | |
| Senior Loan Amount: | $339,170,000 | 58.8% | Refinance Existing Debt: | $512,914,175 | 89.0% | |
| Subordinate Loan Amount: | $120,830,000 | 21.0% | Reserves: | $52,149,961 | 9.0% | |
| Mezzanine Loan: | $115,000,000 | 20.0% | Closing Costs: | $11,324,028 | 2.0% | |
| Borrower Equity: | $1,388,164 | 0.20% | ||||
| Total Sources: | $576,388,164 | 100.0% | Total Uses: | $576,388,164 | 100.0% | |
| (1) | The Park Avenue Plaza Mortgage Loan (as defined below) is part of the Park Avenue Plaza Whole Loan (as defined below), which is comprised of eight pari passu senior promissory notes with an aggregate original principal balance of $339,170,000 (collectively, the “Park Avenue Plaza Senior Loans”) and one promissory note that is subordinate to the Park Avenue Plaza Senior Loans with an aggregate original principal balance of $120,830,000 ( the “Park Avenue Plaza Subordinate Companion Loan”, and together with the Park Avenue Plaza Senior Loans, the “Park Avenue Plaza Whole Loan”). The Cut-off Date Balance Per SF, Maturity Date Balance Per SF, UW NCF DSCR, UW NOI Debt Yield, UW NOI Debt Yield at Maturity, Cut-off Date LTV Ratio and Maturity Date LTV Ratio numbers presented above are based on the aggregate Cut-off Date principal balance of the Park Avenue Plaza Senior Loans, without regard to the Park Avenue Plaza Subordinate Companion Loan or the Park Avenue Plaza Mezzanine Loan (as defined below). The Cut-off Date Balance Per SF, Maturity Date Balance Per SF, UW NCF DSCR, UW NOI Debt Yield, UW NOI Debt Yield at Maturity, Cut-off Date LTV Ratio and Maturity Date LTV Ratio numbers based on the entire Park Avenue Plaza Whole Loan are $396.69, $396.69, 4.31x, 12.8%, 12.8%, 43.3% and 43.3%, respectively. The Cut-off Date Balance Per SF, Maturity Date Balance Per SF, UW NCF DSCR, UW NOI Debt Yield, UW NOI Debt Yield at Maturity, Cut-off Date LTV Ratio and Maturity Date LTV Ratio numbers based on the combined balance of the Park Avenue Plaza Whole Loan and the Park Avenue Plaza Mezzanine Loan are $495.86, $495.86, 3.27x, 10.3%, 10.3%, 54.1% and 54.1%, respectively. |
| (2) | There is no non-recourse carveout guarantor or separate environmental indemnitor with respect to the Park Avenue Plaza Whole Loan. |
| (3) | A cash management period is in place from origination through December 31, 2024. After December 31, 2024, the Park Avenue Plaza Whole Loan will revert to a hard lockbox with springing cash management. |
| (4) | See “Subordinate and Mezzanine Indebtedness” section below. |
| (5) | See “Escrows and Reserves” below for further discussion of reserve requirements. |
| (6) | The novel coronavirus pandemic is an evolving situation and could impact the Park Avenue Plaza Whole Loan more severely than assumed in the underwriting of the Park Avenue Plaza Whole Loan and could adversely affect the NOI, NCF and occupancy information, as well as the appraised value and the DSCR, LTV and Debt Yield metrics presented above and herein. See “Risk Factors—Risks Related to Market Conditions and Other External Factors—The Coronavirus Pandemic Has Adversely Affected the Global Economy and Will Likely Adversely Affect the Performance of the Mortgage Loans” in the prospectus. |
| (7) | The increase in Net Operating Income from TTM NOI (6/30/2021) to UW NOI was due to the expiration of free rent periods. |
The Mortgage Loan. The second largest mortgage loan (the “Park Avenue Plaza Mortgage Loan”) is part of the Park Avenue Plaza Whole Loan in the original principal balance of $460,000,000. The Park Avenue Plaza Whole Loan is secured by a first priority fee mortgage encumbering a 1,159,593 SF Class A office property in New York, NY (the “Park Avenue Plaza Property”). The Park Avenue Plaza Whole Loan is comprised of the Park Avenue Plaza Senior Loans, consisting of eight pari passu senior promissory notes in the aggregate original principal balance of $339,170,000, and the Park Avenue Plaza Subordinate Companion Loan, consisting of one subordinate promissory note in the original principal balance of $120,830,000. The non-controlling senior Note A-4, Note A-7 and Note A-8, with an aggregate original principal balance of $70,000,000, represent the Park Avenue Plaza Mortgage Loan
This is not a research report and was not prepared by any Underwriter’s research department. Please see additional important information and qualifications at the end of this Term Sheet. |
T-43
| Office – CBD | Loan #2 | Cut-off Date Balance: | $70,000,000 | |
| 55 East 52nd Street | Park Avenue Plaza | Cut-off Date LTV: | 31.9% | |
| New York, NY 10055 | UW NCF DSCR: | 5.84x | ||
| UW NOI Debt Yield: | 17.4% |
and will be included in the BANK 2021-BNK38 securitization trust. The controlling promissory Note A-1 and non-controlling Note A-3 in the aggregate original principal balance of $159,170,000 and the Park Avenue Plaza Subordinate Companion Loan have been contributed to the MSC 2021-PLZA securitization trust. The non-controlling promissory Note A-2 and Note A-5, in the aggregate original principal balance of $75,000,000, have been contributed to the BANK 2021-BNK37 securitization trust. The remaining Park Avenue Plaza Senior Loan, evidenced by non-controlling promissory Note A-6, with an original principal balance of $35,000,000 is currently held by Morgan Stanley Bank, N.A. and is expected to be contributed to one or more future securitization transactions. The Park Avenue Plaza Whole Loan will be serviced pursuant to the trust and servicing agreement for the MSC 2021-PLZA securitization trust. See “Description of the Mortgage Pool—The Whole Loans—The Park Avenue Plaza Pari Passu A/B Whole Loan” and “Pooling and Servicing Agreement—Servicing of the Non-Serviced Mortgage Loans” in the prospectus.
| Park Avenue Plaza Whole Loan Summary | ||||
| Notes | Original Balance | Cut-off Date Balance | Note Holder | Controlling Piece |
| A-1 | $139,170,000 | $139,170,000 | MSC 2021-PLZA | Yes |
| A-2 | $50,000,000 | $50,000,000 | BANK 2021-BNK37 | No |
| A-3 | $20,000,000 | $20,000,000 | MSC 2021-PLZA | No |
| A-4 | $10,000,000 | $10,000,000 | BANK 2021-BNK38 | No |
| A-5 | $25,000,000 | $25,000,000 | BANK 2021-BNK37 | No |
| A-6 | $35,000,000 | $35,000,000 | Morgan Stanley Bank, N.A. | No |
| A-7 | $10,000,000 | $10,000,000 | BANK 2021-BNK38 | No |
| A-8 | $50,000,000 | $50,000,000 | BANK 2021-BNK38 | No |
| B-1 | $120,830,000 | $120,830,000 | MSC 2021-PLZA | No |
| Total | $460,000,000 | $460,000,000 | ||
The Borrower and the Borrower Sponsor. The borrower is Park Avenue Plaza Owner LLC, a single-purpose Delaware limited liability company with two independent directors in its organizational structure. There is no non-recourse carveout guarantor or separate environmental indemnitor with respect to the Park Avenue Plaza Whole Loan. The borrower is indirectly owned and controlled by Park Avenue Plaza Company L.P. (the “Fisher Brothers Sponsor”) and The Sungate Park Avenue Delaware Trust (“Sungate” and collectively with the Fisher Brothers Sponsor, the “Borrower Sponsor”). The Fisher Brothers Sponsor is owned by affiliates of Fisher Brothers, a family-owned, multi-generational real estate investment company with experience in owning and managing Class A office space, as well as developing both residential and commercial space, with a focus on urban markets on the East Coast. Founded in 1915, the firm has developed over 10 million SF of Class A office space. Fisher Brothers’ portfolio includes assets such as 1345 Avenue of the Americas, 605 Third Avenue, and 299 Park Avenue in Manhattan and Station Place in Washington, DC.
The Property. The Park Avenue Plaza Property is a Class A, 44-story office property totaling 1,159,593 SF located in New York, New York. The Park Avenue Plaza Property was built in 1980 on a 0.88 acre site by Fisher Brothers and has been continuously owned by the family since its construction. The Park Avenue Plaza Property is located on Park Avenue between 52nd and 53rd Street in the Park Avenue office submarket of Midtown Manhattan, just behind a four-floor landmarked building, the Racquet and Tennis Club. Park Avenue Plaza is a LEED Platinum, Energy Star-certified glass and steel office tower with a green façade and approximately 31,000 SF floor plates. Due to its position behind the Racquet and Tennis Club and south of Lever House, the Park Avenue Plaza Property benefits from unobstructed views up Park Avenue. Since January 2020, the Borrower Sponsor has invested approximately $38.8 million in capital expenditures at the Park Avenue Plaza Property, including tenant improvement work and lobby renovations. The Park Avenue Plaza Property is 99.0% leased as of October 1, 2021, by a number of financial services, fund management and consulting firms. Notable tenants at the Park Avenue Plaza Property include BlackRock, which is currently headquartered at the Park Avenue Plaza Property (32.3% of net rentable area, 29.6% of underwritten base rent), Evercore, which is headquartered at the Park Avenue Plaza Property (29.3% of NRA, 30.4% of underwritten base rent), Intercontinental Exchange (8.1% of NRA, 9.9% of underwritten base rent), Morgan Stanley (8.1% of NRA, 8.8% of underwritten base rent) and Duff & Phelps (7.8% of NRA, 8.5% of underwritten base rent). The Park Avenue Plaza Property benefits from many long-term leases, with an average lease term of 16.3 years. The Park Avenue Plaza Property has averaged over 99% occupancy dating back to 2011.
Major Tenants.
BlackRock (375,022 SF, 32.3% of NRA, 29.6% of underwritten rent). BlackRock is a public investment management firm that specializes in equity and fixed income products, as well as alternative and money market instruments, which it invests in on behalf of institutional and retail investors worldwide. The firm has offices in more than 30 countries and is currently headquartered at the Park Avenue Plaza Property. BlackRock has given notice that it will vacate all 375,022 SF of its space upon its lease expiration in April 2023 to relocate to its new global headquarters at 50 Hudson Yards. The borrower has executed a lease with Jennison Associates commencing upon BlackRock’s lease expiration to take 118,998 square feet (floors 24 through 27) of BlackRock’s existing space with a lease expiration date of February 28, 2040.
Evercore (339,447 SF, 29.3% of NRA, 30.4% of underwritten rent). Evercore is an independent investment banking advisory firm founded in 1995. The company provides advisory services on merges and mergers and acquisitions, strategic shareholder advisory, restructurings and capital structure to corporate clients. Evercore has offices in 28 cities around the globe and generates approximately 75% of its revenue in the United States. Evercore is headquartered at the Park Avenue Plaza Property. Evercore has been a tenant at the Park Avenue Plaza Property since 2006 and has extended and expanded its space at the Park Avenue Plaza Property multiple times. As of October 1, 2021, Evercore occupies 339,447 SF (of which 119,484 SF of space is subleased from Aon through April 30, 2023) through December 31, 2035 and has one, five-year extension option remaining.
Intercontinental Exchange (94,119 SF, 8.1% of NRA, 9.9% of underwritten rent). Intercontinental Exchange (“ICE”) is a leading provider of regulated marketplaces and clearing services for global commodity trading, primarily of electricity, and agricultural commodities, metals, interest rates, equities, exchange traded funds, or ETFs, credit derivatives, digital assets, bonds and currencies, and also offers mortgage and technology services. It manages a handful of global over-the-counter (OTC) markets and regulated futures exchanges. The firm also owns ICE Futures Europe, a European energy futures and options platform, as well as NYSE Holdings (including the New York Stock Exchange). The company serves clients in over 150 countries. ICE's largest
This is not a research report and was not prepared by any Underwriter’s research department. Please see additional important information and qualifications at the end of this Term Sheet. |
T-44
| Office – CBD | Loan #2 | Cut-off Date Balance: | $70,000,000 | |
| 55 East 52nd Street | Park Avenue Plaza | Cut-off Date LTV: | 31.9% | |
| New York, NY 10055 | UW NCF DSCR: | 5.84x | ||
| UW NOI Debt Yield: | 17.4% |
geographical market is the United States with nearly 65% of the company's revenue. ICE has been a tenant at the Park Avenue Plaza Property since 2012 and as of October 1, 2021, occupies 94,119 SF at the Park Avenue Plaza Property, through November 30, 2028. ICE has two, five-year extension options remaining.
Morgan Stanley (93,590 SF, 8.1% of NRA, 8.8% of underwritten rent). Morgan Stanley is a bank holding company, that provides diversified financial services on a worldwide basis. Morgan Stanley operates a global securities business which serves individual and institutional investors and investment banking clients. Morgan Stanley also operates a global asset management business and was a top five loan contributor to United States commercial mortgage-backed securities deals in 2020. Morgan Stanley has been a tenant at the Park Avenue Plaza Property since 2008 and has extended and expanded its space at the Park Avenue Plaza Property multiple times. As of October 1, 2021, Morgan Stanley occupies 93,590 SF through April 30, 2036. Morgan Stanley has the option to terminate its lease on July 31, 2033 with eighteen months prior notice (no later than January 31, 2032).
General Atlantic (91,666 SF, 7.9% of NRA, 7.6% of underwritten rent). General Atlantic is a private growth equity firm which offers portfolio management, financial planning and investment advisory services to customers worldwide. General Atlantic has been a tenant at the Park Avenue Plaza Property since 2007, as of October 1, 2021 occupies 91,666 SF (of which 60,464 SF is subleased from Aon through April 30, 2023) and has a lease expiration of July 31, 2039. General Atlantic has one, five-year extension option remaining.
The following table presents a summary regarding the tenants at the Park Avenue Plaza Property:
| Tenant Summary(1) | |||||||||
| Tenant Name | Credit Ratings (Moody’s/S&P/ Fitch)(2) | Tenant SF | Approx. % of SF | Annual UW Rent | % of Total Annual UW Rent | Annual UW Rent PSF | Lease Expiration | Termination Option (Y/N) | Renewal Options |
| BlackRock(3) | NR/Aa3/AA- | 375,022 | 32.3% | $28,562,646 | 29.6% | $76.16 | 4/30/2023 | N | (3) |
| Evercore(4) | NR/NR/NR | 339,447 | 29.3% | $29,302,485 | 30.4% | $86.32 | 12/31/2035(4) | N | 1, 5-year |
| ICE | NR/A3/BBB+ | 94,119 | 8.1% | $9,561,684 | 9.9% | $101.59 | 11/30/2028 | N | 2, 5-year |
| Morgan Stanley(5) | A/A1/BBB+ | 93,590 | 8.1% | $8,516,690 | 8.8% | $91.00 | 4/30/2036 | Y(5) | (5) |
| General Atlantic(6) | NR/NR/NR | 91,666 | 7.9% | $7,286,396 | 7.6% | $79.49 | 7/31/2039(6) | N | 1, 5-year |
| Duff & Phelps | NR/NR/NR | 91,019 | 7.8% | $8,191,710 | 8.5% | $90.00 | 12/31/2035 | N | 1, 5-year |
| BBR Partners | NR/NR/NR | 30,345 | 2.6% | $2,579,325 | 2.7% | $85.00 | 6/30/2037 | N | 1, 5-year |
| Court Square(7) | NR/NR/NR | 29,545 | 2.5% | $2,127,240 | 2.2% | $72.00 | 4/30/2023(7) | N | None |
| Subtotal/Wtd. Avg. | 1,144,753 | 98.7% | $96,128,176 | 99.6% | $83.97 | ||||
| Other Tenants | 3,640 | 0.3% | $351,005 | 0.4% | $96.43 | ||||
| Vacant Space | 11,200 | 1.0% | $0 | 0.0% | $0.00 | ||||
| Total/Wtd. Avg. | 1,159,593 | 100.0% | $96,479,181 | 100.0% | $84.01 | ||||
| (1) | Information is based on the underwritten rent roll. |
| (2) | Certain ratings are those of the parent company whether or not the parent company guarantees the lease. |
| (3) | BlackRock has given notice that it will vacate its space upon its natural lease expiration of April 30, 2023. The borrower has already executed a lease with Jennison Associates commencing upon BlackRock’s lease expiration to take 118,998 SF (floors 24 through 27) of BlackRock’s existing 375,022 SF of space with a lease expiration date of February 28, 2040. |
| (4) | Evercore commenced occupancy as a subtenant of Aon on floors 35 through 38 (119,484 SF) on July 25, 2006 with a lease expiration coterminous with Aon’s natural lease expiration of April 30, 2023. Evercore executed a lease as of July 1, 2018 with a commencement of May 1, 2023 (after Aon’s tenancy expires) and a lease expiration of December 31, 2035 (coterminous with the rest of its space). |
| (5) | Morgan Stanley has the right to extend the term of its lease for either one, five-year option or one, ten-year option. Morgan Stanley has the option to terminate its lease on July 31, 2033 with eighteen months prior notice (no later than January 31, 2032). |
| (6) | General Atlantic commenced occupancy as a subtenant of Aon on floor 32 (30,293 SF) on August 1, 2007 and floor 33 (30,171 SF) on January 15, 2010 with a lease expiration date coterminous with Aon’s natural lease expiration of April 30, 2023. On July 8, 2016 General Atlantic executed a lease with a lease commencement on May 1, 2023 (after Aon’s tenancy expires) with a lease expiration on July 31, 2039 (coterminous with the rest of its space). |
| (7) | Court Square commenced occupancy as a subtenant of Aon on floor 34 (29,545 SF) on February 22, 2012 with a lease expiration coterminous with Aon’s natural lease expiration of April 30, 2023. Evercore executed a lease on July 1, 2018 with a commencement of May 1, 2023 (after Aon’s/Court Square’s tenancy expires) and a lease expiration of December 31, 2035 (coterminous with the rest of its space). |
This is not a research report and was not prepared by any Underwriter’s research department. Please see additional important information and qualifications at the end of this Term Sheet. |
T-45
| Office – CBD | Loan #2 | Cut-off Date Balance: | $70,000,000 | |
| 55 East 52nd Street | Park Avenue Plaza | Cut-off Date LTV: | 31.9% | |
| New York, NY 10055 | UW NCF DSCR: | 5.84x | ||
| UW NOI Debt Yield: | 17.4% |
The following table presents certain information with respect to the lease rollover at the Park Avenue Plaza Property:
| Lease Rollover Schedule(1) | ||||||||
| Year | # of Leases Rolling | SF Rolling | Annual UW Rent PSF Rolling | % of Total SF Rolling | Cumulative % of SF Rolling | Annual UW Rent Rolling | % of Annual UW Rent Rolling | Cumulative % of Annual UW Rent Rolling |
| MTM | 0 | 0 | $0.00 | 0.0% | 0.0% | $0 | 0.0% | 0.0% |
| 2021 | 0 | 0 | $0.00 | 0.0% | 0.0% | $0 | 0.0% | 0.0% |
| 2022 | 0 | 0 | $0.00 | 0.0% | 0.0% | $0 | 0.0% | 0.0% |
| 2023(2) | 1 | 256,024 | $70.03 | 22.1% | 22.1% | $17,928,534 | 18.6% | 18.6% |
| 2024 | 1 | 1,369 | $146.10 | 0.1% | 22.2% | $200,004 | 0.2% | 18.8% |
| 2025 | 1 | 283 | $345.41 | 0.0% | 22.2% | $97,751 | 0.1% | 18.9% |
| 2026 | 0 | 0 | $0.00 | 0.0% | 22.2% | $0 | 0.0% | 18.9% |
| 2027 | 0 | 0 | $0.00 | 0.0% | 22.2% | $0 | 0.0% | 18.9% |
| 2028 | 1 | 94,119 | $101.59 | 8.1% | 30.3% | $9,561,684 | 9.9% | 28.8% |
| 2029 | 0 | 0 | $0.00 | 0.0% | 30.3% | $0 | 0.0% | 28.8% |
| 2030 | 0 | 0 | $0.00 | 0.0% | 30.3% | $0 | 0.0% | 28.8% |
| 2031 | 0 | 0 | $0.00 | 0.0% | 30.3% | $0 | 0.0% | 28.8% |
| 2032 & Beyond | 9 | 796,598 | $86.23 | 68.7% | 99.0% | $68,691,208 | 71.2% | 100.0% |
| Vacant | 0 | 11,200 | $0.00 | 1.0% | 100.0% | $0 | 0.0% | 100.0% |
| Total/Wtd. Avg.(3) | 13 | 1,159,593 | $84.01 | 100.0% | $96,479,181 | 100.0% | ||
| (1) | Information is based on the underwritten rent roll. Certain tenants may have lease termination options that are exercisable prior to the stated expiration date of the subject lease or leases that are not considered in the lease expiration schedule. |
| (2) | 2023 rollover has been adjusted to reflect signed leases that will take effect upon BlackRock’s and Aon’s planned vacancy. Jennison Associates has signed a lease to take 118,998 SF of BlackRock’s space through February 2040. All of the remaining Aon subleased space currently occupied by General Atlantic (60,464 SF), Court Square (29,545 SF) and Evercore (119,484 SF) will convert to prime leases upon the existing tenants’ lease expiration dates as described above. |
| (3) | Wtd. Avg. Underwritten Base Rent Per SF and Underwritten Base Rent excludes vacant space. |
COVID-19 Update. The Park Avenue Plaza Mortgage Loan was originated on October 8, 2021 and as of October 21, 2021, the Borrower Sponsor has reported that the Park Avenue Plaza Property is open and operating and no lease modification or rent relief requests have been received and tenants have generally remained current on all rent and lease obligations.
The Market. The Park Avenue Plaza Property is located in New York, New York, within the Park Avenue submarket of the Manhattan office market. Access to the Park Avenue Plaza Property is provided by the Lexington Avenue - 53rd Street Subway Station, the Fifth Avenue – 53rd Street Subway station and Grand Central Terminal. According to the appraisal, as of the fourth quarter of 2021, the vacancy rate in the Park Avenue submarket was approximately 10.3%, with average asking rents of $103.52 per SF and inventory of approximately 26.0 million SF. According to the appraisal, as of the second quarter of 2021, the vacancy rate in the Manhattan office market was approximately 9.7%, with average asking rents of $73.89 per SF and inventory of approximately 468.0 million SF. According to the appraisal, the 2020 population within a quarter-, half- and one-mile radius of the Park Avenue Plaza Property was 3,418, 36,164 and 174,471, respectively. The 2020 median household income within the same quarter-, half- and one-mile radius was $188,743, $210,372 and $194,585, respectively.
The appraisal noted that the Manhattan office market continues to suffer from the effects of the COVID-19 pandemic. As of the second quarter of 2021,the availability rate increased for the fifth consecutive quarter, to 18.7%, a record high. The increases were consistent across the three major markets (Midtown, Midtown South and Downtown), with changes between 30 and 160 basis points. Seventeen contiguous large blocks of 100,000 SF and above drove the 140-basis-point increase from last quarter. Following the minimal leasing totals and increased availability, quarterly absorption closed at negative 9.5 million SF, a slight increase from the first quarter. Available sublease space increased by 1.1 million SF quarter-over-quarter and was up to 22.0 million SF by quarter’s end. Despite this increase, approximately 2.2 million SF of sublease space has been removed from the market since October 2020.
Overall asking rents in Manhattan fell in the second quarter of 2021 by 0.2% to $73.89 Per SF, representing the smallest quarter-over-quarter decrease since the onset of the pandemic. Rents remain 9.6% below pre-pandemic levels, reaching their lowest point in more than five years.
This is not a research report and was not prepared by any Underwriter’s research department. Please see additional important information and qualifications at the end of this Term Sheet. |
T-46
| Office – CBD | Loan #2 | Cut-off Date Balance: | $70,000,000 | |
| 55 East 52nd Street | Park Avenue Plaza | Cut-off Date LTV: | 31.9% | |
| New York, NY 10055 | UW NCF DSCR: | 5.84x | ||
| UW NOI Debt Yield: | 17.4% |
The following table presents certain information relating to the appraisal’s market rent conclusion for the Park Avenue Plaza Property:
| Market Rent Summary | ||||||||
| Category | Market Rent (PSF) | Reimbursements | Annual Escalation | Tenant Improvements PSF (New/Renewal) | Free Rent (months) (New/Renewal) | Lease Term | Leasing Commissions (New) | Leasing Commissions (Renewal) |
| Office (Floors Mezz-14) | $85.00 | Mod. Gross | 10.0% every 5 years | $125.00 / $93.75 | 15 / 7.5 | 15 Years | 3.50% | 1.75% |
| Office (Floors 15-21) | $87.00 | Mod. Gross | 10.0% every 5 years | $125.00 / $93.75 | 15 / 7.5 | 15 Years | 3.50% | 1.75% |
| Office (Floors 22-29) | $90.00 | Mod. Gross | 10.0% every 5 years | $125.00 / $93.75 | 15 / 7.5 | 15 Years | 3.50% | 1.75% |
| Office (Floors 30-38) | $95.00 | Mod. Gross | 10.0% every 5 years | $125.00 / $93.75 | 15 / 7.5 | 15 Years | 3.50% | 1.75% |
| Office (Floors 39-41) | $100.00 | Mod. Gross | 10.0% every 5 years | $125.00 / $93.75 | 15 / 7.5 | 15 Years | 3.50% | 1.75% |
| Office (Floors 42-44) | $110.00 | Mod. Gross | 10.0% every 5 years | $125.00 / $93.75 | 15 / 7.5 | 15 Years | 3.50% | 1.75% |
Source: Appraisal
The following table presents recent leasing data at comparable office properties with respect to the Park Avenue Plaza Property:
| Comparable Leases Summary | |||||||
| Property/Location | Year Built | SF | Tenant Name | Tenant Size (SF) | Lease Date | Rent PSF | Lease Type |
Park Avenue Plaza (subject)(1) New York, NY | 1980 | 1,159,593 | BlackRock | 375,022 | Various | $76.16 | Mod. Gross |
399 Park Avenue New York, NY | 1961 | 1,576,437 | Blue Owl Capital | 25,096 | Aug. 2021 | $107.00 | Mod. Gross |
280 Park Avenue New York, NY | 1968 | 1,307,746 | GQG Partners | 8,996 | Jul. 2021 | $92.00 | Mod. Gross |
499 Park Avenue New York, NY | 1981 | 303,000 | Deutsche Bundesbank | 5,684 | Jun. 2021 | $110.00 | Mod. Gross |
888 Seventh Avenue New York, NY | 1969 | 908,299 | QVT Financial LP | 12,503 | Jun. 2021 | $110.00 | Mod. Gross |
280 Park Avenue New York, NY | 1968 | 1307,746 | Kyndryl | 49,751 | Jun. 2021 | $85.00 | Mod. Gross |
345 Park Avenue New York, NY | 1969 | 1,983,246 | Blackstone | 718,845 | Mar. 2021 | $85.00 | Mod. Gross |
40 West 57th Street New York, NY | 1972 | 779,017 | Lightyear Capital | 13,500 | Mar. 2021 | $92.50 | Mod. Gross |
399 Park Avenue New York, NY | 1961 | 1,576,437 | Capital Group Companies | 25,107 | Feb. 2021 | $107.00 | Mod. Gross |
Source: Appraisal, unless otherwise indicated.
| (1) | Information based on the underwritten rent roll other than year built. |
This is not a research report and was not prepared by any Underwriter’s research department. Please see additional important information and qualifications at the end of this Term Sheet. |
T-47
| Office – CBD | Loan #2 | Cut-off Date Balance: | $70,000,000 | |
| 55 East 52nd Street | Park Avenue Plaza | Cut-off Date LTV: | 31.9% | |
| New York, NY 10055 | UW NCF DSCR: | 5.84x | ||
| UW NOI Debt Yield: | 17.4% |
Operating History and Underwritten Net Cash Flow. The following table presents certain information relating to the historical operating performance and Underwritten Net Cash Flow at the Park Avenue Plaza Property:
| Cash Flow Analysis | ||||||||||||
| 2018 | 2019 | 2020 | 6/31/2021 TTM | UW | UW PSF | |||||||
| Gross Potential Rent | $81,458,357 | $86,426,028 | $96,255,809 | $97,592,006 | $96,479,181(1) | $83.20 | ||||||
| Reimbursements | $17,839,630 | $20,477,198 | $15,436,088 | $15,727,742 | $13,616,686 | $11.74 | ||||||
| Other Income | $3,958,645 | $5,432,930 | $5,353,738 | $4,985,339 | $3,453,995 | $2.98 | ||||||
| Free Rent | ($6,991,487) | ($11,418,703) | ($24,918,133) | ($15,862,263) | $0 | $0.00 | ||||||
| SL Rent | $0 | $0 | $0 | $0 | $817,867 | $0.71 | ||||||
| Net Rental Income | $96,265,145 | $100,917,453 | $92,127,502 | $102,442,824 | $114,367,729 | $98.63 | ||||||
| Less Vacancy & Credit Loss | $0 | $0 | $0 | $0 | ($1,147,008) | ($0.99) | ||||||
| Effective Gross Income | $96,265,145 | $100,917,453 | $92,127,502 | $102,442,824 | $113,220,721 | $97.64 | ||||||
| Real Estate Taxes | $25,158,799 | $26,773,563 | $26,865,584 | $26,865,584 | $26,865,584 | $23.17 | ||||||
| Insurance | $972,416 | $963,034 | $1,064,621 | $1,118,388 | $1,118,388 | $0.96 | ||||||
| Management Fee | $914,148 | $929,585 | $950,006 | $957,443 | $1,000,000 | $0.86 | ||||||
| Other Operating Expenses | $28,159,565 | $28,943,914 | $25,891,555 | $25,231,598 | $25,231,598 | $21.76 | ||||||
| Total Operating Expenses | $55,204,928 | $57,610,096 | $54,771,766 | $54,173,013 | $54,215,570 | $46.75 | ||||||
| Net Operating Income(2) | $41,060,217 | $43,307,357 | $37,355,736 | $48,269,811 | $59,005,151 | $50.88 | ||||||
| Replacement Reserves | $0 | $0 | $0 | $0 | $289,898 | $0.25 | ||||||
| TI/LC | $0 | $0 | $0 | $0 | $1,739,390 | $1.50 | ||||||
| Net Cash Flow | $41,060,217 | $43,307,357 | $37,355,736 | $48,269,811 | $56,975,864 | $49.13 | ||||||
| Occupancy % | 96.1% | 98.5% | 98.7% | 99.0% | 98.0% | |||||||
| NOI DSCR | 4.21x | 4.44x | 3.83x | 4.95x | 6.05x | |||||||
| NCF DSCR | 4.21x | 4.44x | 3.83x | 4.95x | 5.84x | |||||||
| NOI Debt Yield | 12.1% | 12.8% | 11.0% | 14.2% | 17.4% | |||||||
| NCF Debt Yield | 12.1% | 12.8% | 11.0% | 14.2% | 16.8% | |||||||
| (1) | Underwritten Gross Potential Rent Revenue is based on the rent roll as of October 1, 2021 and includes rent steps of $1,576 through September 30, 2022. |
| (2) | The increase in Net Operating Income from 6/31/2021 TTM to UW was due to the expiration of free rent periods. |
Escrows and Reserves.
Real Estate Taxes – At origination, $8,606,069 was required to be deposited into a reserve for real estate taxes. During a Cash Trap Period (as defined below) or Trigger Period (as defined below), the Park Avenue Plaza Whole Loan documents provide for ongoing monthly deposits into a reserve for real estate taxes in an amount equal to 1/6 of the real estate taxes that the lender estimates will be payable during the next six months for the Park Avenue Plaza Property (initially, $2,238,800). Monthly real estate tax collections are in place.
Insurance – During a Cash Trap Period or a Trigger Period, the Park Avenue Plaza Whole Loan documents provide for ongoing monthly deposits into a reserve for insurance premiums in an amount equal to 1/12 of the insurance premiums that the lender estimates will be payable for the renewal of coverage upon the expiration of the insurance policies; provided that such monthly deposits are not required so long as either (i) the borrower pays the insurance premiums directly on a monthly basis and provides written evidence of such payment to lender within five business days of payment, or (ii) a blanket insurance policy acceptable to the lender is in effect with respect to the policies required under the Park Avenue Plaza Whole Loan documents.
Replacement Reserve – During a Trigger Period, the Park Avenue Plaza Whole Loan documents provide for ongoing monthly deposits of approximately $19,327 into a reserve for capital expenditures; provided that such monthly deposits are not required at any time that the funds in such reserve exceed $463,837.
Rollover Reserve – At origination, approximately $43,543,892 was required to be deposited into a reserve for outstanding tenant improvement and/or leasing commission expenses with respect to the tenants Jennison Associates, Morgan Stanley, Evercore, and BBR Partners. During a Trigger Period, the Park Avenue Plaza Whole Loan documents provide for ongoing monthly deposits of approximately $120,791 into a reserve for future tenant improvement and leasing commission expenses; provided that such monthly deposits are not required at any time that the funds in such reserve (excluding the initial deposit, the proceeds of any Park Avenue Plaza Permitted Junior Mezzanine Loan (as defined below) deposited into such account, and lease termination fees deposited into such account) exceed $6,000,000. During the continuance of a Trust Fund Expense Deposit Period (as defined below), to the extent there is not sufficient funds on deposit in the Trust Fund Expense Account (as described below) or excess cash flow to pay the Trust Fund Expenses (as defined below), the lender is required to utilize funds in the rollover reserve for the payment of any Trust Fund Expenses outstanding for more than ten business days following written notice from the lender demanding payment of the same. If the lender applies funds in the rollover reserve to any Trust Fund Expenses in accordance with the immediately preceding sentence, then, after an aggregate amount equal to the Trust Fund Expense Cap (as defined below) has been deposited into the Trust Fund Expense Account, any such funds in the rollover reserve utilized to pay Trust Fund
This is not a research report and was not prepared by any Underwriter’s research department. Please see additional important information and qualifications at the end of this Term Sheet. |
T-48
| Office – CBD | Loan #2 | Cut-off Date Balance: | $70,000,000 | |
| 55 East 52nd Street | Park Avenue Plaza | Cut-off Date LTV: | 31.9% | |
| New York, NY 10055 | UW NCF DSCR: | 5.84x | ||
| UW NOI Debt Yield: | 17.4% |
Expenses are required to be replenished with excess cash flow in accordance with the priority of payments described below under “Lockbox and Cash Management.”
Trust Fund Expense Account – If a Trust Fund Expense Deposit Period Exists, excess cash flow is required to be funded into a reserve for the payment of Trust Fund Expenses in accordance with the priority of payments set forth under “Lockbox and Cash Management” below.
“Trust Fund Expenses” means all actual fees and out-of-pocket costs and expenses of (w) the lender, (x) the master servicer of the MSC 2021-PLZA securitization (the “PLZA Master Servicer”) (other than monthly master servicing fees), (y) the special servicer of the MSC 2021-PLZA securitization (the “PLZA Special Servicer”) and (z) the trustee of the MSC 2021-PLZA securitization (the “PLZA Trustee”), but in each case only to the extent resulting from any event of default, or a good faith determination of an imminent event of default or good faith pursuit of an enforcement action in respect of a default under the Park Avenue Plaza Whole Loan (for the avoidance of doubt, the foregoing will include a good faith pursuit of an alleged default) (including, without limitation, any enforcement expenses and any liquidation fees, workout fees, special servicing fees or any other similar fees and interest payable on advances made by the PLZA Master Servicer, the PLZA Special Servicer or the PLZA Trustee with respect to delinquent debt service payments or expenses of curing any default under the Park Avenue Plaza Whole Loan and any expenses paid by the PLZA Master Servicer, the PLZA Special Servicer or the PLZA Trustee in respect of the protection and preservation of the Park Avenue Plaza Property (including, without limitation, the payment of (x) taxes to the extent amounts in the tax reserve account are insufficient to pay amounts then-due and (y) insurance premiums, to the extent amounts in the insurance premium reserve account are insufficient to pay amounts then-due)) and the costs of all property inspections, appraisals, property condition reports and environmental assessments in connection with the Park Avenue Plaza Property (and any updates of the existing property inspection, appraisal, property condition report and/or environmental assessment) that the PLZA Master Servicer, the PLZA Special Servicer or the PLZA Trustee obtain in connection with any event of default, or a good faith determination of an imminent event of default or the good faith pursuit of an enforcement action in respect of a default under the Park Avenue Plaza Whole Loan (for the avoidance of doubt, the foregoing include a good faith pursuit of an alleged default).
“Trust Fund Expense Deposit Period” means the period commencing upon any Trust Fund Expenses having been incurred and not paid by the borrower within 10 business days after written demand for the same from the lender and ending when an amount equal to the Trust Fund Expense Cap (as defined below) has been deposited into the Trust Fund Expense Account. If the borrower pays Trust Fund Expenses in accordance with the related loan documents in an amount equal to or greater than $1,500,000, then a Trust Fund Expense Deposit Period will never exist under the loan documents.
“Trust Fund Expense Cap” means $1,500,000, less the amount of Trust Fund Expenses paid for by the borrower prior to the commencement of a Trust Fund Expense Deposit Period.
Lockbox and Cash Management. The Park Avenue Plaza Whole Loan is structured with a hard lockbox and in place cash management (provided cash management becomes springing after December 31, 2024 as described below). The borrower is required to establish and maintain a lockbox account for the benefit of the lender, to cause all tenants of the Park Avenue Plaza Property to deposit all rents directly into the lockbox account, and to deposit any rents or other income received by the borrower or property manager into the lockbox account within two business days of receipt. If no Cash Trap Period or Trigger Period exists, all funds in the lockbox account are required to be disbursed to the borrower’s operating account. During the existence of a Cash Trap Period or Trigger Period, all funds in the lockbox account are required to be swept to a lender-controlled cash management account, and, provided no event of default is continuing, applied on each monthly payment date: (i) to make the monthly deposits into the real estate tax and insurance reserves, if any, as described above under “Escrows and Reserves,” (ii) to pay debt service on the Park Avenue Plaza Whole Loan, (iii) during a Trigger Period, to make the monthly deposits into the rollover reserve and replacement reserve as described above under “Escrows and Reserves,” (iv) to pay operating expenses set forth in the annual budget (which, following the end of the Cash Trap Period, the lender has the right to reasonably approve if a Trigger Period exists) and lender-approved extraordinary expenses, (v) to pay debt service on the Park Avenue Plaza Mezzanine Loan (as defined below), (vi) if the Park Avenue Plaza Permitted Junior Mezzanine Loan has been incurred, to pay debt service on the Park Avenue Plaza Permitted Junior Mezzanine Loan, (vii) if a Trust Fund Expense Deposit Period exists, to the Trust Fund Expense Account, provided that funds deposited into the Trust Fund Expense Account must not, in the aggregate, exceed the Trust Fund Expense Cap, (viii) if a Trust Fund Expense Deposit Period is not in effect, to the rollover reserve, to the extent to replenish any funds therein that were used to pay Trust Fund Expenses, and (ix) if a Trust Fund Expense Deposit Period is not in effect, to pay all remaining funds into an excess cash flow reserve to be held as additional security for the Park Avenue Plaza Whole Loan during the continuance of such Cash Trap Period or Trigger Period. If no event of default exists, at the written request of the borrower, the lender is required to apply funds in the excess cash flow reserve to pay shortfalls in required reserves deposits, debt service and mezzanine debt service, and property level expenses, provided that the lender will not be required to release amounts in such reserve if the balance of such reserve, when aggregated with the balance of the rollover reserve, would be less than the aggregate amount of approved leasing expenses (unless such disbursement is for approved leasing expenses).
“Cash Trap Period” means the period commencing on the origination date and ending on December 31, 2024 ("Cash Trap End Date").
“Trigger Period” at any time after the Cash Trap End Date means a period:
| (i) | commencing upon an event of default under the Park Avenue Plaza Whole Loan documents, and ending upon the cure of such event of default and the lender’s acceptance of such cure; or |
| (ii) | commencing upon an event of default under the Park Avenue Plaza Mezzanine Loan documents, and ending upon the cure of such event of default and the mezzanine lender’s acceptance of such cure; or |
| (iii) | commencing upon the date that, as of the last day of any calendar quarter, the debt yield on the Park Avenue Plaza Whole Loan is less than 8.25% and ending upon the date that such debt yield has been at least 8.25% as of the last day of two consecutive calendar quarters; or |
| (iv) | commencing upon the date that, as of the last day of any calendar quarter, the aggregate debt yield on the Park Avenue Plaza Whole Loan, the Park Avenue Plaza Mezzanine Loan, and (if then incurred or to be incurred) the Park Avenue Plaza Permitted Junior Mezzanine Loan, is less than 6.60% and ending upon the date that such aggregate debt yield has been at least 6.60% as of the last day of two consecutive calendar quarters; or |
| (v) | commencing upon a Trust Fund Expense Deposit Period and ending when the Trust Fund Deposit Period has ended pursuant to the definition thereof. |
Additional Secured Indebtedness (not including trade debts). The Park Avenue Plaza Property also secures the remaining Park Avenue Plaza Senior Notes (the “Park Avenue Plaza Non-Serviced Pari Passu Companion Loans”) which have an aggregate Cut-off Date principal balance of $269,170,000 and the Park Avenue Plaza Subordinate Companion Loan, which has a Cut-off Date Principal Balance of $120,830,000. The Park Avenue Plaza Non-
This is not a research report and was not prepared by any Underwriter’s research department. Please see additional important information and qualifications at the end of this Term Sheet. |
T-49
| Office – CBD | Loan #2 | Cut-off Date Balance: | $70,000,000 | |
| 55 East 52nd Street | Park Avenue Plaza | Cut-off Date LTV: | 31.9% | |
| New York, NY 10055 | UW NCF DSCR: | 5.84x | ||
| UW NOI Debt Yield: | 17.4% |
Serviced Pari Passu Companion Loans and the Park Avenue Plaza Subordinate Companion Loan accrue interest at the same rate as the Park Avenue Plaza Mortgage Loan. The Park Avenue Plaza Mortgage Loan and the Park Avenue Plaza Non-Serviced Pari Passu Companion Loans are pari passu in right of payment, and are generally senior in right of payment to the Park Avenue Plaza Subordinate Companion Loan. The holders of the Park Avenue Plaza Mortgage Loan, the Park Avenue Plaza Serviced Pari Passu Companion Loans and the Park Avenue Plaza Subordinate Companion Loan have entered into a co-lender agreement which sets forth the allocation of collections on the Park Avenue Plaza Whole Loan. See “Description of the Mortgage Pool—The Whole Loans—The Park Avenue Plaza Pari Passu-A/B Whole Loan” in the prospectus.
Mezzanine Loan and Preferred Equity.
At origination, Morgan Stanley Mortgage Capital Holdings LLC made a mezzanine loan to the sole member of the borrower (the “Park Avenue Plaza Mezzanine Borrower”) in the amount of $115,000,000 (the “Park Avenue Plaza Mezzanine Loan”) secured by 100% of the equity interests in the borrower. The Park Avenue Plaza Mezzanine Loan accrues interest at the rate of 3.60% per annum, requires payments of interest only until its maturity date, and is coterminous with the Park Avenue Plaza Whole Loan. The Park Avenue Plaza Mezzanine Loan was sold to a third party, New York Life Insurance Company.
The Park Avenue Plaza total debt as of the origination date is summarized in the following table:
| Park Avenue Plaza Total Debt Summary | |||||
| Note | Original Balance | Interest Rate | Cumulative UW NCF DSCR | Cumulative UW NOI Debt Yield | Cumulative Cut-off Date LTV |
| Senior Loans | $339,170,000 | 2.8375% | 5.84x | 17.4% | 31.9% |
| Subordinate Companion Loan | $120,830,000 | 2.8375% | 4.31x | 12.8% | 43.3% |
| Mezzanine Loan | $115,000,000 | 3.6000% | 3.27x | 10.3% | 54.1% |
| Total Debt | $575,000,000 | 2.9900% | 3.27x | 10.3% | 54.1% |
In connection with certain transfers of the Park Avenue Plaza Property, the owner of the equity interests in the Park Avenue Plaza Mezzanine Borrower is permitted to obtain a junior mezzanine loan (the “Park Avenue Plaza Permitted Junior Mezzanine Loan”) secured by 100% of the direct equity interests in the Park Avenue Plaza Mezzanine Borrower, provided that, among other conditions, the aggregate loan-to-value ratio of the Park Avenue Plaza Whole Loan, the Park Avenue Plaza Mezzanine Loan and the Park Avenue Plaza Permitted Junior Mezzanine Loan does not exceed 54.1%, the aggregate debt service coverage ratio of the Park Avenue Plaza Whole Loan, the Park Avenue Plaza Mezzanine Loan and the Park Avenue Plaza Permitted Junior Mezzanine Loan is at least 2.00x, the debt yield of the Park Avenue Plaza Whole Loan is at least 12.6% and the aggregate debt yield of the Park Avenue Plaza Whole Loan, the Park Avenue Plaza Mezzanine Loan and the Park Avenue Plaza Permitted Junior Mezzanine Loan is at least 10.0%, the Park Avenue Plaza Permitted Junior Mezzanine Loan has a term coterminous with the Park Avenue Plaza Whole Loan, and the related mezzanine lender enters into a customary intercreditor agreement with the lender in form reasonably acceptable to the lender and acceptable to each rating agency rating securities backed by the Park Avenue Plaza Whole Loan.
Release of Property. Not permitted.
Letter of Credit. None.
Right of First Offer / Right of First Refusal. None.
Ground Lease. None.
Terrorism Insurance. The borrower is required to obtain and maintain an “all risk” property insurance policy that covers terrorist acts in an amount equal to the “full replacement cost” of the Park Avenue Plaza Property together with 24 months of business income insurance, provided that such coverage is commercially available. For so long as the Terrorism Risk Insurance Program Reauthorization Act of 2015 or any replacement, reauthorization or extension thereof (“TRIPRA”) is in effect, the lender is required to accept terrorism insurance which covers against “certified” acts within the meaning of TRIPRA but only in the event that TRIPRA continues to cover both domestic and foreign acts of terrorism. In the event that TRIPRA is no longer in effect, the borrower will not be required to pay terrorism insurance premiums in excess of two times the amount of the insurance premium payable in respect of the property and business interruption/rental loss insurance required under the Park Avenue Plaza Whole Loan documents (without giving effect to the cost of terrorism and earthquake and fire following components of such property and business interruption/rental loss insurance) at the time that terrorism coverage is excluded from the applicable policy. See “Risk Factors—Risks Relating to the Mortgage Loans—Terrorism Insurance May Not Be Available for All Mortgaged Properties” in the prospectus.
This is not a research report and was not prepared by any Underwriter’s research department. Please see additional important information and qualifications at the end of this Term Sheet. |
T-50
(THIS PAGE INTENTIONALLY LEFT BLANK)
T-51
| Mixed Use – Office/Lab | Loan #3 | Cut-off Date Balance: | $55,000,000 | |
| 350 & 450 Water Street | CX - 350 & 450 Water Street | Cut-off Date LTV: | 41.7% | |
| Cambridge, MA 02141 | UW NCF DSCR: | 3.50x | ||
| UW NOI Debt Yield: | 9.9% |
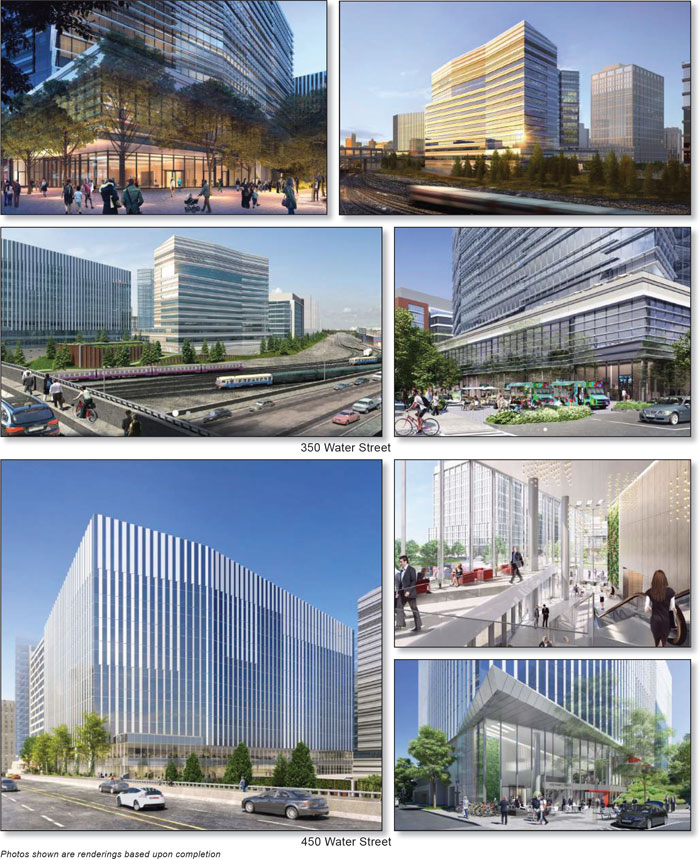
This is not a research report and was not prepared by any Underwriter’s research department. Please see additional important information and qualifications at the end of this Term Sheet. |
T-52
| Mixed Use – Office/Lab | Loan #3 | Cut-off Date Balance: | $55,000,000 | |
| 350 & 450 Water Street | CX - 350 & 450 Water Street | Cut-off Date LTV: | 41.7% | |
| Cambridge, MA 02141 | UW NCF DSCR: | 3.50x | ||
| UW NOI Debt Yield: | 9.9% |

This is not a research report and was not prepared by any Underwriter’s research department. Please see additional important information and qualifications at the end of this Term Sheet. |
T-53
| Mortgage Loan No. 3 – CX - 350 & 450 Water Street |
| Mortgage Loan Information | Property Information | ||||||
| Mortgage Loan Seller: | BANA | Single Asset/Portfolio: | Single Asset | ||||
| Credit Assessment (Fitch/KBRA/S&P): | BBB-sf/BBB-(sf)/NR | Location: | Cambridge, MA 02141 | ||||
| Original Balance(1): | $55,000,000 | General Property Type: | Mixed Use | ||||
| Cut-off Date Balance(1): | $55,000,000 | Detailed Property Type: | Office/Lab | ||||
| % of Initial Pool Balance: | 7.5% | Title Vesting: | Fee | ||||
| Loan Purpose: | Refinance | Year Built/Renovated: | 2021 / NAP | ||||
| Borrower Sponsors: | DivcoWest, California State Teachers’ | Size: | 915,233 SF | ||||
| Retirement System and Teacher | Cut-off Date Balance Per SF(1): | $889 | |||||
| Retirement System of Texas | Maturity Date Balance Per SF(1)(3): | $889 | |||||
| Guarantors(2): | DW PropCo G, LLC; DW PropCo H, | Property Manager: | Divco West Real Estate Services, Inc. | ||||
| LLC | (borrower-related) | ||||||
| Mortgage Rate: | 2.7920% | ||||||
| Note Date: | 10/14/2021 | ||||||
| First Payment Date: | 12/6/2021 | ||||||
| Maturity Date(3): | 11/6/2031 | ||||||
| Original Term to Maturity(3): | 120 months | Underwriting and Financial Information(7) | |||||
| Original Amortization Term: | 0 months | UW NOI: | $80,703,532 | ||||
| IO Period(3): | 120 months | UW NOI Debt Yield(1): | 9.9% | ||||
| Seasoning: | 1 months | UW NOI Debt Yield at Maturity(1)(3): | 9.9% | ||||
| Prepayment Provisions(3)(4): | L(24),YM1(1),DorYM1(88),O(7) | UW NCF DSCR(1): | 3.50x | ||||
| Lockbox/Cash Mgmt Status: | Hard/Springing | Most Recent NOI(8): | NAV | ||||
| Additional Debt Type(1): | Pari Passu / B Notes | 2nd Most Recent NOI(8): | NAV | ||||
| Additional Debt Balance(1): | $759,000,000 / $411,000,000 | 3rd Most Recent NOI(8): | NAV | ||||
| Future Debt Permitted (Type): | No (NAP) | Most Recent Occupancy: | 100.0% (11/1/2021) | ||||
| Reserves(5) | 2nd Most Recent Occupancy(8): | NAV | |||||
| Type | Initial | Monthly | Cap | 3rd Most Recent Occupancy(8): | NAV | ||
| RE Taxes: | $0 | Springing | NAP | Appraised Value (as of)(9): | $1,954,000,000 (4/1/2023) | ||
| Insurance: | $0 | Springing | NAP | Appraised Value PSF: | $2,135 | ||
| TI/LC Reserve: | $52,062,079 | Springing | NAP | Cut-off Date LTV Ratio(1)(9): | 41.7% | ||
| Other Reserve(6): | $97,383,122 | $0 | NAP | Maturity Date LTV Ratio(1)(3)(9): | 41.7% | ||
| Sources and Uses | ||||||
| Sources | Proceeds | % of Total | Uses | Proceeds | % of Total | |
| Senior Loan Amount(1): | $814,000,000 | 66.4% | Loan Payoff: | $617,846,136 | 50.4% | |
| Subordinate Loan Amount(1): | $411,000,000 | 33.6% | Return of Equity: | $451,939,764 | 36.9% | |
| Upfront Reserves: | $149,445,201 | 12.2% | ||||
| Closing Costs: | $5,768,900 | 0.5% | ||||
| Total Sources: | $1,225,000,000 | 100.0% | Total Uses: | $1,225,000,000 | 100.0% | |
| (1) | The CX - 350 & 450 Water Street Mortgage Loan (as defined below) is part of the CX - 350 & 450 Water Street Whole Loan (as defined below), which is comprised of twenty pari passu senior promissory notes and four subordinate notes. The Cut-off Date Balance Per SF, Maturity Date Balance Per SF, UW NOI Debt Yield, UW NOI Debt Yield at Maturity, UW NCF DSCR, Cut-off Date LTV Ratio and Maturity Date LTV Ratio numbers presented above are based on the principal balance of the CX - 350 & 450 Water Street Senior Loan (as defined below). The Cut-off Date Balance Per SF, Maturity Date Balance Per SF, UW NOI Debt Yield, UW NOI Debt Yield at Maturity, UW NCF DSCR, Cut-off Date LTV Ratio and Maturity Date LTV Ratio based on the principal balance of the CX - 350 & 450 Water Street Whole Loan are $1,338, $1,338, 6.6%, 6.6%, 2.32x, 62.7% and 62.7%, respectively. |
| (2) | There is no non-recourse carveout guarantor or environmental indemnitor for the CX - 350 & 450 Water Street Whole Loan separate from the borrower. The entities identified above under “Guarantor” are the borrowers. |
| (3) | The CX - 350 & 450 Water Street Whole Loan is structured with an Anticipated Repayment Date (“ARD”) of November 6, 2031 and a final maturity date of November 6, 2036. The initial interest rate for the CX – 350 & 450 Water Street Whole Loan is 2.79200% per annum. After the ARD, the interest rate will increase by 2.0000% over the greater of (x) 2.792000%, and (y) (1) the swap rate in effect on the ARD plus (2) 1.26000%. The metrics presented above are calculated based on the ARD. |
| (4) | The CX - 350 & 450 Water Street Whole Loan may be voluntarily prepaid in whole beginning on or after the payment date in December 2023 with the payment of the yield maintenance premium if such prepayment occurs prior to the payment date in May 2031. In addition, the CX – 350 & 450 Water Street Whole Loan may be defeased in whole at any time after the earlier to occur of (i) October 14, 2024 or (ii) the date that is two years from the closing date of the securitization that includes the last pari passu note to be securitized. |
| (5) | See “Escrows and Reserves” section below for further discussion of reserve requirements. |
| (6) | Other Reserve represents a Base Building Work Reserve of approximately $86,650,891 and an Aventis Rent Reserve of approximately $10,732,231. |
| (7) | The novel coronavirus pandemic is an evolving situation and could impact the CX - 350 & 450 Water Street Whole Loan more severely than assumed in the underwriting of the CX - 350 & 450 Water Street Whole Loan and could adversely affect the NOI, NCF and occupancy information, as well as the appraised value and the DSCR, LTV and Debt Yield metrics presented above and herein. See “Risk Factors-—Risks Related to Market Conditions and Other External Factors—The Coronavirus Pandemic Has Adversely Affected the Global Economy and Will Likely Adversely Affect the Performance of the Mortgage Loans” in the prospectus. |
| (8) | Historical financial information and occupancy is not available because the CX - 350 & 450 Water Street Property (as defined below) is currently being built. The 350 Water Street building is expected to be substantially completed in the second quarter of 2022 and the 450 Water Street building is expected to be substantially completed by the end of 2021. |
| (9) | The Appraised Value shown is the “Prospective Market Value Upon Completion & Stabilization”, which assumes that the outstanding capital expenditures of approximately $56 million for the 350 Water Street building and $80 million for the 450 Water Street building are fully funded and reserved by the lender, and that these reserved funds would pass with title to any purchaser of the CX – 350 & 450 Water Street Property. The appraisal concluded to an “as-is” appraised value of $1.778 billion as of September 8, 2021. The “as-is” appraised value results in a Cut-off Date LTV Ratio and Maturity Date LTV Ratio of 45.8% for the CX - 350 & 450 Water Street Senior Loan, and a Cut-off Date LTV Ratio and Maturity Date LTV Ratio of 68.9% for the CX - 350 & 450 Water Street Whole Loan. The appraisal concluded to an “as dark” appraised value of $1.901 billion. The “as dark” appraised value results in a Cut-off Date LTV Ratio and Maturity Date LTV Ratio of 42.8% for the CX - 350 & 450 Water Street Senior Loan, and a Cutoff Date LTV Ratio and Maturity Date LTV Ratio of 64.4% for the CX - 350 & 450 Water Street Whole Loan. |
This is not a research report and was not prepared by any Underwriter’s research department. Please see additional important information and qualifications at the end of this Term Sheet. |
T-54
| Mixed Use – Office/Lab | Loan #3 | Cut-off Date Balance: | $55,000,000 | |
| 350 & 450 Water Street | CX - 350 & 450 Water Street | Cut-off Date LTV: | 41.7% | |
| Cambridge, MA 02141 | UW NCF DSCR: | 3.50x | ||
| UW NOI Debt Yield: | 9.9% |
The Mortgage Loan. The third largest mortgage loan (the “CX - 350 & 450 Water Street Mortgage Loan”) is part of a whole loan (the “CX - 350 & 450 Water Street Whole Loan”) evidenced by twenty pari passu senior promissory notes in the aggregate original principal amount of $814,000,000 (collectively, the “CX - 350 & 450 Water Street Senior Loan” and “CX - 350 & 450 Water Street Senior Notes”) and four junior pari passu notes in the aggregate original principal amount of $411,000,000 (collectively, the “CX - 350 & 450 Water Street Subordinate Companion Loan” and the “350 & 450 Water Street Junior Notes”) that are subordinate to the CX - 350 & 450 Water Street Senior Loan. The CX - 350 & 450 Water Street Whole Loan was originated by Bank of America, N.A., DBR Investments Co. Limited, JPMorgan Chase Bank, National Association and 3650 Cal Bridge Lending, LLC. The CX - 350 & 450 Water Street Whole Loan is secured by a first priority fee mortgage encumbering two sciences laboratory and office buildings aggregating 915,233 SF located in Cambridge, Massachusetts (the “CX - 350 & 450 Water Street Property”).
The CX - 350 & 450 Water Street Mortgage Loan is evidenced by the non-controlling senior Notes A-2-3 and A-2-4 with an aggregate original principal amount of $55,000,000. The remaining promissory notes comprising the CX - 350 & 450 Water Street Whole Loan are summarized in the below table. The CX - 350 & 450 Water Street Whole Loan will be serviced pursuant to the trust and servicing agreement for the CAMB 2021-CX2 securitization trust. See “Description of the Mortgage Pool—The Whole Loans—The CX - 350 & 450 Water Street Pari Passu-A/B Whole Loan” and “Pooling and Servicing Agreement—Servicing of the Non-Serviced Mortgage Loans” in the prospectus.
The CX - 350 & 450 Water Street Whole Loan has a 10-year interest-only term through the ARD of November 6, 2031 and a final maturity date of November 6, 2036. After the ARD, through and including November 6, 2036, the following structure will apply: the interest rate will increase (such new rate, the “Adjusted Interest Rate”) by 2.0000% over the greater of (x) 2.79200%, and (y)(1) the swap rate in effect on the ARD plus (2) 1.26000%; however, interest accrued at the excess of the Adjusted Interest Rate over the initial interest rate will be deferred as described below under “Lockbox and Cash Management.” For the period from the origination date through the ARD, the CX - 350 & 450 Water Street Whole Loan accrues interest at the rate of 2.79200% per annum.
| CX - 350 & 450 Water Street Whole Loan Summary | |||||||
| Note | Original Balance | Cut-off Date Balance | Note Holder | Controlling Piece | |||
| A-1-1, A-2-1, A-3-1, A-4-1 | $285,000,000 | $285,000,000 | CAMB 2021-CX2 | Yes | |||
| A-1-3, A-3-2 | $94,000,000 | $94,000,000 | Benchmark 2021-B30 | No | |||
| A-1-2, A-1-4, A-1-5, A-1-6, A-1-7, A-1-8, A-1-9 | $250,161,224 | $250,161,224 | DBR Investments Co. Limited | No | |||
| A-2-3, A-2-4 | $55,000,000 | $55,000,000 | BANK 2021-BNK38 | No | |||
| A-2-2, A-2-5 | $52,959,184 | $52,959,184 | Bank of America, N.A. | No | |||
| A-3-3 | $23,979,592 | $23,979,592 | JPMorgan Chase Bank, National Association | No | |||
| A-4-2, A-4-3 | $52,900,000 | $52,900,000 | 3650 Cal Bridge Lending, LLC | No | |||
| Total Senior Notes | $814,000,000 | $814,000,000 | |||||
| B-1, B-2, B-3, B-4 | $411,000,000 | $411,000,000 | CAMB 2021-CX2 | No | |||
| Whole Loan | $1,225,000,000 | $1,225,000,000 | |||||
The Borrowers and the Borrower Sponsors. The borrowers are DW PropCo G, LLC and DW PropCo H, LLC, each a Delaware limited liability company and single purpose entity with two independent directors. Legal counsel to the borrowers delivered a non-consolidation opinion in connection with the origination of the CX - 350 & 450 Water Street Whole Loan. There is no non-recourse carveout guarantor or environmental indemnitor for the CX – 350 & 540 Water Street Whole Loan. The borrower sponsors are a joint venture between DivcoWest (“Divco”), California State Teachers’ Retirement System (“CalSTRS”) and Teacher Retirement System of Texas (“TRS”).
Founded in 1993, Divco is a multidisciplinary investment firm headquartered in San Francisco, California with over 160 employees across six investment offices. Divco is a developer, owner and operator of real estate throughout the United States, with expertise in Boston, having invested in and managed over 22 commercial properties in the area, including offices in the Seaport, Financial District, and East Cambridge submarkets. Most notably, Divco owned and operated One Kendall Square, a life sciences office campus in the Kendall Square submarket. As of June 30, 2021, Divco had over $13.7 billion in assets under management. Since inception, Divco has acquired approximately 55.0 million SF.
CalSTRS is reported to be the nation’s second largest public pension fund with assets totaling approximately $321.9 billion as of October 31, 2021. Their investment portfolio is diversified into nine asset categories, approximately including 11.7% (approximately $37.8 billion as of June 30, 2021) which is allocated towards real estate investments in institutional Class A commercial assets across the United States. Divco and CalSTRS have an 18-year history of investing together with Divco and CalSTRS investing over $1.5 billion into various Divco sponsored investment vehicles.
Established in 1937, TRS provides retirement and related benefits for those employed by the public schools, colleges, and universities supported by the State of Texas. As of August 31, 2020, the agency is serving nearly 1.7 million participants and had assets under management of nearly $187 billion. TRS is the largest public retirement system in Texas in both membership and assets.
The Property. The CX – 350 & 450 Water Street Property consists of two Class A, LEED Gold (targeted), life sciences laboratory and office buildings totaling 915,233 SF located in Cambridge, Massachusetts. The 350 Water Street building (Parcel G) is a laboratory building consisting of 511,157 SF. The 450 Water Street building (Parcel H) is a contemporary office building consisting of 404,076 SF. Designed by Perkins + Will (350 Water Street) and NBBJ (450 Water Street), the CX – 350 & 450 Water Street Property has views of both the Cambridge and Boston skylines. The CX – 350 & 450 Water Street Property has an adjacent open space with playing field, a plaza to host food trucks and nearby access to two MBTA stops (Green and Orange line). The Community College MBTA orange line is a 5-minute walk away. The CX – 350 & 450 Water Street Property is 100% leased to Aventis Inc. (wholly owned by Sanofi).
The 350 Water Street building is a 12-story building featuring laboratory space, ground floor retail, a third-floor terrace, three below-grade parking levels with 377 parking spaces (0.74 per 1,000 SF), bike storage with showers, an adjacent open space with playing field and fitness center. The 350 Water Street building has 15’ - 19’ ceiling heights and eight passenger elevators. The 350 Water Street building is anticipated to be Wired Score Platinum and LEED Gold certified upon completion.
This is not a research report and was not prepared by any Underwriter’s research department. Please see additional important information and qualifications at the end of this Term Sheet. |
T-55
| Mixed Use – Office/Lab | Loan #3 | Cut-off Date Balance: | $55,000,000 | |
| 350 & 450 Water Street | CX - 350 & 450 Water Street | Cut-off Date LTV: | 41.7% | |
| Cambridge, MA 02141 | UW NCF DSCR: | 3.50x | ||
| UW NOI Debt Yield: | 9.9% |
The 450 Water Street building is a 9-story building featuring office space, ground floor retail, a two-story mezzanine, three above-grade and two below-grade parking levels with 440 parking spaces (1.09 per 1,000 SF) and bike storage. The 450 Water Street building has 14’ - 16’ ceiling heights and six passenger elevators. The 450 Water Street building is anticipated to be Wired Score Platinum, WELL Gold and LEED Gold certified upon completion.
The CX – 350 & 450 Water Street Property is currently in the process of finishing construction. The 350 Water Street building is expected to be substantially completed in the second quarter of 2022 and the 450 Water Street building is expected to be substantially completed by the end of 2021. At loan origination, the borrowers reserved the following with the lender: (i) $86,650,891 for base building work related to hard costs, hard cost contingency, soft costs and soft cost contingency for the CX – 350 & 450 Water Street Property, (ii) approximately $15,483,880 of tenant improvement allowance related to the 350 Water Street building and $28,254,233 of tenant improvement allowance related to the 450 Water Street building and (iii) approximately $8,323,966 of leasing commissions related to the 450 Water Street building. The below is a chart which details the borrower sponsors’ development budgets, which do not include land allocations or financing costs. We cannot assure you either the 350 Water Street building or the 450 Water Street building will be completed as expected or at all.
| Development Budget Summary | ||||
| 350 Water Street (Parcel G) | 450 Water Street (Parcel H) | |||
| Budget | Remaining Cost | Budget | Remaining Cost | |
| Hard Costs | $221,627,140 | $35,507,711 | $181,926,397 | $28,882,890 |
| HC Contingency | $915,139 | $1,065,231 | $866,487 | $866,487 |
| Soft Costs | $43,854,255 | $8,357,324 | $42,547,726 | $11,379,153 |
| SC Contingency | $210,241 | $250,720 | $410,417 | $341,375 |
| TI Allowance | $139,789,250 | $15,483,880 | $64,916,764 | $28,254,233 |
| Leasing Commissions | $26,886,858 | $0 | $21,254,398 | $8,323,966 |
| Total | $433,282,883 | $60,664,866 | $311,922,189 | $78,048,104 |
Sole Tenant.
Aventis Inc. (915,233 SF, 100.0% of NRA, 100.0% of underwritten base rent). Aventis Inc., is a wholly owned subsidiary of Sanofi S.A. (“Sanofi”) (rated A+/A1/AA by Fitch/Moody’s/S&P), which is the guarantor under the Aventis Inc. leases. Founded in 1973, Sanofi is a multinational pharmaceutical company headquartered in Paris, France. Sanofi engages in the research and development, manufacturing, and marketing of pharmaceutical drugs principally in the prescription market. Sanofi (NASDAQ:SNY) is publicly traded on the NASDAQ stock exchange and had a market cap of approximately $123.1 billion as of October 20, 2021.
The CX – 350 & 450 Water Street Property is expected to serve as Sanofi’s North American Research headquarters, where it is expected to consolidate approximately 3,000 employees from a number of local offices in the Boston area. Additionally, Sanofi is expected to consolidate approximately 400 employees from various sites at the Cambridge Crossing development and in Lyon, France to form a Center of Excellence at the CX – 350 & 450 Water Street Property dedicated to mRNA vaccine research. Sanofi plans to invest more than $476.0 million per year to develop vaccines against infectious diseases.
The CX – 350 & 450 Water Street Property is currently undergoing a tenant buildout with expected completion dates of the fourth quarter of 2021 for the 450 Water Street building and the second quarter of 2022 for the 350 Water Street building. We cannot assure you the buildouts will be completed as expected or at all. Aventis Inc. tenant buildout contract and base building changes total approximately $304.3 million ($595 PSF) for the 350 Water Street building and approximately $92.2 million ($228 PSF) for the 450 Water Street building. Aventis Inc. is entitled to receive an approximate $139.8 million ($273 PSF) tenant improvement allowance for the 350 Water Street building and an approximate $73.7 million ($181 PSF) tenant improvement allowance for the 450 Water Street building. In total, the approximate $396.5 million ($433 PSF) tenant buildout contract and base building changes do not include any tenant investment for soft costs. Additionally, the approximate $396.5 million ($433 PSF) can be paid from the tenant improvement allowance to the extent available. In addition to the tenant buildout contract and base building changes, Sanofi is expected to invest approximately $194.8 million ($213 PSF) into the CX – 350 & 450 Water Street Property, not including FF&E.
Aventis Inc. executed two, 15-year term leases at the CX – 350 & 450 Water Street Property in late 2018. The rent commencement date of the lease at 350 Water Street was July 1, 2021. The rent commencement date of the lease at 450 Water Street is tied to substantial completion, with it occurring the date that is 46 days prior to the substantial completion date for the base building work. The 450 Water Street building is expected to be substantially completed by the end of 2021.The sole tenant, Aventis Inc. is not yet in occupancy of either the 350 Water Street building or the 450 Water Street building, pending the buildout of its space. We cannot assure you that the buildout of the CX – 350 & 450 Water Street Property will be completed as expected or at all, or that Aventis Inc. will take occupancy as expected or at all. At loan origination, the borrowers reserved approximately $10,732,231 into a gap rent reserve for the Aventis Inc. lease related to the 450 Water Street building. Aventis Inc. has the right to terminate each of its respective leases effective as of the end of its 14th lease year subject to a termination fee equal to 12 months base rent.
The blended starting base rent for the Aventis Inc. leases are $71.53 PSF (NNN) for 350 Water Street and 450 Water Street. Base rent for the laboratory building, 350 Water Street, is $75.90 PSF and base rent for the office building, 450 Water Street, is $66.00 PSF, with both leases including approximately 2.5% annual rent steps. Aventis Inc. did not receive any free rent as part of its lease. The in-place rent at the 350 Water Street building is approximately 31.0% below the appraisal’s concluded market rent of $110.00 PSF (NNN) for the laboratory space and the in-place rent at the 450 Water Street building is approximately 22.4% below the appraisal’s concluded market rent of $85.00 PSF (NNN) for the office space. Sanofi’s guarantees of the leases at the 350 Water Street and 450 Water Street buildings have guaranty caps of $207.5 million and $142.5 million, respectively.
This is not a research report and was not prepared by any Underwriter’s research department. Please see additional important information and qualifications at the end of this Term Sheet. |
T-56
| Mixed Use – Office/Lab | Loan #3 | Cut-off Date Balance: | $55,000,000 | |
| 350 & 450 Water Street | CX - 350 & 450 Water Street | Cut-off Date LTV: | 41.7% | |
| Cambridge, MA 02141 | UW NCF DSCR: | 3.50x | ||
| UW NOI Debt Yield: | 9.9% |
The following table presents certain information relating to the tenancy at the CX - 350 & 450 Water Street Property:
| Tenant Summary(1) | |||||||||
| Tenant Name | Credit Rating (Moody’s/Fitch/S&P)(2) | Tenant SF | Approx. % of SF | Annual UW Rent | % of Total Annual UW Rent | Annual UW Rent PSF | Lease Exp. | Renewal Options | Term. Option (Y/N) |
| Aventis Inc. (350 Water Street)(3) | A1 / A+ / AA | 511,157(4) | 55.8% | $38,796,816 | 59.3% | $75.90 | 6/30/2036 | 2 x 10 yr | Y(5) |
| Aventis Inc. (450 Water Street)(3) | A1 / A+ / AA | 404,076(4) | 44.2% | $26,669,016 | 40.7% | $66.00 | 11/30/2036(6) | 2 x 10 yr | Y(5) |
| Total/Wtd. Avg. | 915,233 | 100.0% | $65,465,832 | 100.0% | $71.53 | ||||
| (1) | Information is based on the underwritten rent roll dated November 1, 2021. |
| (2) | The credit ratings are those of the direct parent company, Sanofi, which is the guarantor under the leases. |
| (3) | Aventis Inc. is currently not in occupancy, pending the substantial completion of the buildout out of its spaces at the CX- 350 & 450 Water Street Property. The CX – 350 & 450 Water Street Property is currently undergoing a buildout with expected completion dates of the fourth quarter of 2021 for the 450 Water Street building and the second quarter of 2022 for the 350 Water Street building. The lease at 350 Water Street commenced on July 1, 2021. The commencement of the lease at 450 Water Street is tied to substantial completion, with it occurring the date that is 46 days prior to the substantial completion date for the base building work. The 450 Water Street building is expected to be substantially completed by the end of 2021. |
| (4) | Tenant SF includes up to 10,000 SF of terrace space for 350 Water Street and up to 4,000 SF of terrace space for 450 Water Street. |
| (5) | Aventis Inc. has the right to terminate each of the leases, with a termination fee, effective as of the end of its 14th lease year. If Aventis Inc. is to exercise the early termination right, it must deliver to the landlord between 24 and 36 months prior to the early termination date (a) notice that the early termination right has been exercised and (b) the early termination payment. The early termination payment equals the sum of (i) the 12 monthly installments of base rent that would have been due for the 12-month period immediately following the early termination date in the absence of such termination and (ii) the stipulated operating expenses/tax component per the lease. |
| (6) | Based on an anticipated rent commencement of November 10, 2021. The actual rent commencement date, anniversary date, and expiration date to be determined as provided in the 450 Water Street lease and amendments, related to the substantial completion of the base building work at the 450 Water Street building. |
The following table presents certain information relating to the lease rollover schedule at the CX - 350 & 450 Water Street Property:
| Lease Rollover Schedule(1) | ||||||||
| Year | # of Leases Rolling | SF Rolling | UW Rent PSF Rolling | Approx. % of Total SF Rolling | Approx. Cumulative % of SF Rolling | Total UW Rent Rolling | Approx. % of Total Rent Rolling | Approx. Cumulative % of Total Rent Rolling |
| MTM / 2021 | 0 | 0 | $0.00 | 0.0% | 0.0% | $0 | 0.0% | 0.0% |
| 2022 | 0 | 0 | $0.00 | 0.0% | 0.0% | $0 | 0.0% | 0.0% |
| 2023 | 0 | 0 | $0.00 | 0.0% | 0.0% | $0 | 0.0% | 0.0% |
| 2024 | 0 | 0 | $0.00 | 0.0% | 0.0% | $0 | 0.0% | 0.0% |
| 2025 | 0 | 0 | $0.00 | 0.0% | 0.0% | $0 | 0.0% | 0.0% |
| 2026 | 0 | 0 | $0.00 | 0.0% | 0.0% | $0 | 0.0% | 0.0% |
| 2027 | 0 | 0 | $0.00 | 0.0% | 0.0% | $0 | 0.0% | 0.0% |
| 2028 | 0 | 0 | $0.00 | 0.0% | 0.0% | $0 | 0.0% | 0.0% |
| 2029 | 0 | 0 | $0.00 | 0.0% | 0.0% | $0 | 0.0% | 0.0% |
| 2030 | 0 | 0 | $0.00 | 0.0% | 0.0% | $0 | 0.0% | 0.0% |
| 2031 | 0 | 0 | $0.00 | 0.0% | 0.0% | $0 | 0.0% | 0.0% |
| 2032 & Thereafter | 2 | 915,233 | $71.53 | 100.0% | 100.0% | $65,465,832 | 100.0% | 100.0% |
| Vacant | 0 | 0 | $0.00 | 0.0% | 100.0% | $0 | 0.0% | 100.0% |
| Total/Wtd. Avg. | 2 | 915,233 | $71.53 | 100.0% | $65,465,832 | 100.0% | ||
| (1) | Information is based on the underwritten rent roll dated November 1, 2021. |
COVID-19 Update. As of October 14, 2021, the borrower sponsors had reported no collection issues. The first payment date for the CX – 350 & 450 Water Street Whole Loan is December 6, 2021.
The Market. The CX – 350 & 450 Water Street Property is located in the Cambridge market within the Greater Boston area. The city of Cambridge is located in the Boston core-based statistical area directly north of the city of Boston and separated from Boston’s central business district (“CBD”) by the Charles River. Cambridge is bordered by Somerville to the north and Watertown to the west. The city is acclaimed for its mix of venture capital, National Institutes of Health (NIH) funding and state investments. In recent years, Cambridge has become a life sciences and biotechnology hub not only for the northeast, but for the entire United States. Cambridge is home to over 5,000 private business establishments with major companies including Watson Health, Amgen, Facebook and Apple, among others.
The Cambridge market is best known for its innovation and high concentration of research and development operations. Cambridge has one of the highest densities of educated people in the world with 42 colleges, universities and community colleges in the Boston/Cambridge area, including being home to Harvard University and Massachusetts Institute of Technology (MIT). There are over 11,000 undergraduate students and over 11,000 graduate students living in Cambridge.
The CX – 350 & 450 Water Street Property is part of a larger 4.5 million SF master-planned mixed-use-transit-oriented development known as Cambridge Crossing which is an innovation community in East Cambridge, proximate to Kendall Square. Cambridge Crossing is spread across 43 acres and is expected to total over 16 buildings consisting of over 2.1 million SF of science and technology space, 2.4 million SF of residential space, 100,000 SF of
This is not a research report and was not prepared by any Underwriter’s research department. Please see additional important information and qualifications at the end of this Term Sheet. |
T-57
| Mixed Use – Office/Lab | Loan #3 | Cut-off Date Balance: | $55,000,000 | |
| 350 & 450 Water Street | CX - 350 & 450 Water Street | Cut-off Date LTV: | 41.7% | |
| Cambridge, MA 02141 | UW NCF DSCR: | 3.50x | ||
| UW NOI Debt Yield: | 9.9% |
retail space and 11 acres of open space. The development of Cambridge Crossing has approximately 2.5 million SF completed or under construction and recent leases to Philips, Sanofi, and Bristol Myers Squibb.
Cambridge Crossing benefits from its various forms of transit, including one MBTA (Green Line) station soon to be on site, and one MBTA (Orange Line) station a short walk away, four Hubway stations, designated bike lanes, an EZ ride and private Cambridge Crossing shuttle, walking paths and acres of green spaces. In addition, Cambridge Crossing is approximately 3.5 miles from the Boston Logan International Airport.
The below table presents the submarket statistics for the laboratory and office space in the Cambridge market.
| Laboratory Submarket Statistics | ||||||||
| Submarket | Inventory (SF) | Overall Vacancy Rate | Direct Vacancy Rate | YTD Construction Completions (SF) | YTD Overall Absorptions (SF) | Under Construction (SF) | Direct Avg. Rent | Direct Avg. Rent (Class A) |
| Alewife | 1,192,000 | 1.0% | 0.0% | 0 | 100,681 | 3,100,000 | $71.00 | N/A |
| East Cambridge | 7,397,000 | 1.3% | 0.0% | 0 | (56,745) | 2,304,000 | $105.81 | $105.81 |
| Mid Cambridge | 3,934,000 | 1.3% | 0.0% | 0 | (41,966) | 0 | $82.88 | $81.07 |
| Total/Wtd. Avg. | 12,523,000 | 1.0% | 0.0% | 0 | 1,970 | 5,404,000 | $100.40 | $104.14 |
Source: Appraisal
| Office Submarket Statistics | ||||||||
| Submarket | Inventory (SF) | Overall Vacancy Rate | Direct Vacancy Rate | YTD Construction Completions (SF) | YTD Overall Absorptions (SF) | Under Construction (SF) | Direct Avg. Rent | Direct Avg. Rent (Class A) |
| Alewife | 1,652,770 | 5.6% | 3.6% | 0 | 37,442 | 0 | $59.92 | $60.22 |
| East Cambridge | 8,207,363 | 7.2% | 2.8% | 0 | 196,420 | 1,235,423 | $82.60 | $82.29 |
| Mid Cambridge | 2,175,363 | 6.8% | 3.7% | 0 | (40,073) | 0 | $65.07 | $80.56 |
| Total/Wtd. Avg. | 12,035,496 | 6.9% | 3.0% | 0 | 193,789 | 1,235,423 | $75.07 | $79.92 |
Source: Appraisal
The following table summarizes the comparable laboratory leases in the surrounding market.
| Summary of Comparable Laboratory Leases | ||||||||||
| Property | Location | Year | Tenant Name | Lease Start Date | Term (yrs.) | Lease Type | Tenant Size (SF) | Base Rent PSF | Rent Steps /yr | TI PSF |
| 350 Water Street(1) | Cambridge, MA | 2021(2) | Aventis Inc. | Jul-21 | 15.0 | Net | 511,157 | $75.90 | 2.50% | $250.00 |
| Seaport Labs | Boston, MA | 2023 | Eli Lilly LOI | Jan-23 | 15.0 | Net | 165,000 | $103.00 | 3.00% | $210.00 |
| 201 Brookline Avenue | Boston, MA | 2022 | Verve Therapeutics | Jun-22 | 15.0 | Net | 105,000 | $91.00 | 3.00% | $225.00 |
| Cambridge Crossing EF | Cambridge, MA | 2023 | Bristol Myers Squibb | May-22 | 15.0 | Net | 40,000 | $105.00 | 2.75% | $225.00 |
| 238 Main Street | Cambridge, MA | 2021 | Beam Therapeutics | Aug-21 | 12.0 | Net | 122,620 | $96.50 | 3.00% | $190.00 |
| 65 Landsdowne Street | Cambridge, MA | 2001 | Brigham and Women’s | Feb-21 | 5.0 | Net | 112,410 | $100.00 | 3.00% | $0.00 |
| Cambridge Crossing EF | Cambridge, MA | 2023 | Bristol Myers Squibb | Aug-20 | 15.0 | Net | 260,000 | $88.50 | 2.50% | $225.00 |
| Cambridge Crossing | Cambridge, MA | 2019 | Cereval | Feb-20 | 10.0 | Net | 59,865 | $92.00 | 3.00% | $200.00 |
| Total/Wtd. Avg.(3) | 12.4 | 123,556 | $95.20 | $186.20 | ||||||
Source: Appraisal
| (1) | Information is based on the underwritten rent roll dated November 1, 2021. |
| (2) | The 350 Water Street building is in the process of finishing construction with the base building substantial completion date expected in the second quarter of 2022. We cannot assure you the base building construction will be completed as expected or at all. |
| (3) | The Total/Wtd. Avg. excludes the 350 Water Street building. |
The laboratory lease comparables range in size from 40,000 SF to 260,000 SF with lease terms ranging from 5 to 15 years. The comparables exhibit a range in rents from $88.50 to $105.00 PSF, with an average of $95.20 PSF on a net basis. Free rent concessions ranged from 0 to 12 months, averaging 1.71 months with tenant improvement allowances ranging from $0.00 to $225.00 PSF, an average of $182.14 PSF. The appraiser concluded to a market rent of $110.00 PSF at 350 Water Street, which is a 44.9% premium to the in-place rent of $75.90 PSF.
This is not a research report and was not prepared by any Underwriter’s research department. Please see additional important information and qualifications at the end of this Term Sheet. |
T-58
| Mixed Use – Office/Lab | Loan #3 | Cut-off Date Balance: | $55,000,000 | |
| 350 & 450 Water Street | CX - 350 & 450 Water Street | Cut-off Date LTV: | 41.7% | |
| Cambridge, MA 02141 | UW NCF DSCR: | 3.50x | ||
| UW NOI Debt Yield: | 9.9% |
The following table summarizes the comparable office leases in the surrounding market.
| Summary of Comparable Office Leases | ||||||||||
| Property | Location | Year Built | Tenant Name | Lease Start Date | Term (yrs.) | Lease Type | Tenant Size (SF) | Base Rent PSF | Rent Steps | TI PSF |
| 450 Water Street(1) | Cambridge, MA | 2021(2) | Aventis Inc. | Nov-21(3) | 15.0 | Net | 404,076 | $66.00 | 2.50%/yr | $181.00 |
| Seaport Labs I | Boston, MA | 2023 | Foundation Medicine (Shell) | Sep-23 | 15.0 | Net | 581,538 | $69.50 | 2.50%/yr | $0.00 |
| 1001 Boylston Street | Boston, MA | 2022 | CarGurus | Jun-23 | 15.0 | Net | 225,428 | $64.95 | $1.30/SF | $161.00 |
| Google HQ | Cambridge, MA | 2022 | Apr-22 | 15.0 | Net | 385,423 | $88.50 | $1.00/SF | $84.00 | |
| 222 Berkeley Street | Boston, MA | 1991 | GW&K Investments | Feb-21 | 10.0 | Net | 47,304 | $72.00 | 2.00%/yr | $85.00 |
| Alexandria Center | Cambridge, MA | 2017 | Bluebird Bio | Jan-21 | 10.0 | Net | 267,000 | $100.00 | 3.00%/yr | $0.00 |
| Total/Wtd. Avg.(4) | 13.0 | 301,339 | $79.16 | $48.24 | ||||||
Source: Appraisal
| (1) | Information is based on the underwritten rent roll dated November 1, 2021. |
| (2) | The 450 Water Street building is currently in the process of finishing its construction with the base building substantial completion date expected in the fourth quarter of 2021. We cannot assure you that the base building work will be completed as expected or at all. |
| (3) | The commencement of the lease at 450 Water Street is tied to base building substantial completion, with it beginning on the date that is 46 days prior to the substantial completion date for the base building work. The 450 Water Street building is expected to be substantially completed by the end of 2021. |
| (4) | The Total/Wtd. Avg. excludes the 450 Water Street building. |
The office lease comparables range in size from 47,304 SF to 581,538 SF and have lease terms ranging from 10 to 15 years. The lease comparables exhibit a range in rents from $64.95 to $100.00 PSF, with an average of $79.16 PSF on a net basis. Free rent concessions ranged from 0 to 8 months, averaging two months with tenant improvement allowances ranging from $0.00 to $161 PSF, an average of $66.00 PSF. The appraiser concluded to a market rent of $85.00 PSF at 450 Water Street, which is a 28.8% premium to the in-place rent of $66.00 PSF.
The following table presents certain information relating to the appraisal’s market rent conclusion for the CX – 350 & 450 Water Street Property:
| Market Rent Summary | ||
| Laboratory | Office | |
| Market Rent PSF (NNN) | $110.00 | $85.00 |
| Lease Term (Years) | 15 | 15 |
| Rent Increase Projection | 3% per annum | 3% per annum |
This is not a research report and was not prepared by any Underwriter’s research department. Please see additional important information and qualifications at the end of this Term Sheet. |
T-59
| Mixed Use – Office/Lab | Loan #3 | Cut-off Date Balance: | $55,000,000 | |
| 350 & 450 Water Street | CX - 350 & 450 Water Street | Cut-off Date LTV: | 41.7% | |
| Cambridge, MA 02141 | UW NCF DSCR: | 3.50x | ||
| UW NOI Debt Yield: | 9.9% |
Underwritten Net Cash Flow. The following table presents certain information relating to the Underwritten Net Cash Flow at the CX - 350 & 450 Water Street Property:
| Cash Flow Analysis(1) | |||||
UW | UW PSF | ||||
| Base Rent(2) | $65,465,832 | $71.53 | |||
| Straight Line Rent(3) | $13,436,165 | $14.68 | |||
| Tenant Recoveries | $11,768,903 | $12.86 | |||
| Other Income | $3,673,555 | $4.01 | |||
| (Vacancy) | ($1,415,167) | ($1.55) | |||
| Effective Gross Income | $92,929,288 | $101.54 | |||
| Real Estate Taxes | $6,540,712 | $7.15 | |||
| Insurance | $457,617 | $0.50 | |||
| Other Operating Expenses | $5,227,428 | $5.71 | |||
| Total Operating Expenses | $12,225,756 | $13.36 | |||
| Net Operating Income | $80,703,532 | $88.18 | |||
| Replacement Reserves | $137,285 | $0.15 | |||
| TI/LC | $0 | $0.00 | |||
| Net Cash Flow | $80,566,247 | $88.03 | |||
| Occupancy %(4) | 98.5% | ||||
| NOI DSCR(5) | 3.50x | ||||
| NCF DSCR(5) | 3.50x | ||||
| NOI Debt Yield(5) | 9.9% | ||||
| NCF Debt Yield(5) | 9.9% | ||||
| (1) | Historical financial information and occupancy is not available because the CX - 350 & 450 Water Street Property is currently being built. The 350 Water Street building is expected to be substantially completed in the second quarter of 2022 and the 450 Water Street building is expected to be substantially completed by the end of 2021. | |
| (2) | Based on the in-place rent roll dated November 1, 2021 for contractual leases. The rent commencement date for the 350 Water Street property was in July 2021. The rent commencement date of the lease at 450 Water Street is tied to substantial completion, with it occurring on the date that is 46 days prior to the substantial completion date for the base building work. The 450 Water Street building is expected to be substantially completed by the end of 2021. At loan origination, the borrowers reserved approximately $10,732,231 into a gap rent reserve for the Aventis Inc. lease related to the 450 Water Street property. |
| (3) | Straight-line average rent credit for Aventis Inc. (Sanofi, investment grade rated parent company) through its lease term, including parking income rent adjusted for increases of 2.0% adjusted for CPI. The straight-line rent averages result in an average NNN base rent of $90.99 PSF for the 350 Water Street lease and $78.98 PSF for the 450 Water Street lease over the life of the lease. |
| (4) | Represents economic occupancy. |
| (5) | Based on the CX - 350 & 450 Water Street Senior Loan. |
Escrows and Reserves.
Real Estate Taxes – During a Trigger Period (as defined below), the borrowers are required to deposit into a real estate tax reserve, on a monthly basis, 1/12 of the estimated annual real estate taxes.
Insurance – During a Trigger Period, the borrowers are required to deposit into an insurance reserve, on a monthly basis, 1/12 of estimated insurance premiums, unless an acceptable blanket policy is in effect.
TI/LC Reserve – At loan origination, the borrowers deposited approximately $52,062,079 into an existing TI/LC reserve. During a Lease Sweep Period (as defined below), all available cash will be swept into the deposit account held by the lender, which will be transferred to the rollover reserve.
Base Building Work Reserve – At loan origination, the borrowers deposited $86,650,891 into a reserve for the completion of construction of the CX – 350 & 450 Water Street Property.
Aventis Rent Reserve – At loan origination, the borrowers deposited $10,732,231 into a gap rent reserve for the Aventis Inc. lease related to the 450 Water Street building.
This is not a research report and was not prepared by any Underwriter’s research department. Please see additional important information and qualifications at the end of this Term Sheet. |
T-60
| Mixed Use – Office/Lab | Loan #3 | Cut-off Date Balance: | $55,000,000 | |
| 350 & 450 Water Street | CX - 350 & 450 Water Street | Cut-off Date LTV: | 41.7% | |
| Cambridge, MA 02141 | UW NCF DSCR: | 3.50x | ||
| UW NOI Debt Yield: | 9.9% |
Lockbox and Cash Management. The CX - 350 & 450 Water Street Whole Loan is structured with a hard lockbox and springing cash management. The borrowers are required to deliver tenant direction letters instructing all tenants to deposit rents into a lender-controlled lockbox account. The borrowers are required to cause all rents to be deposited directly into the lender-controlled lockbox account. All funds received by the borrowers or the manager are required to be deposited in the lockbox account within two business days following receipt. During the continuance of a Trigger Period (as defined below), funds on deposit in the lockbox account are required to be swept on a daily basis into a lender-controlled cash management account. Prior to the ARD, all excess cash is required to be transferred to a lender-controlled account as additional collateral for the CX - 350 & 450 Water Street Whole Loan, subject to certain permitted uses by the borrowers described in the loan documents, and except as described below with respect to a Lease Sweep Period. If the CX - 350 & 450 Water Street Whole Loan is not paid by the ARD, from and after the ARD, the CX - 350 & 450 Water Street Whole Loan will accrue interest at the Adjusted Interest Rate; however, interest accrued at the excess of the Adjusted Interest Rate over the initial interest rate will be deferred.
After the ARD, all amounts on deposit in the cash management account after payment of debt service, required reserves and budgeted operating expenses will be required to be applied to the prepayment of the outstanding principal balance of the CX – 350 & 450 Water Street Whole Loan, first to the CX - 350 & 450 Water Street Senior Loan and then to the CX - 350 & 450 Water Street Subordinate Companion Loan, until the outstanding principal balance has been reduced to zero, then to any excess interest until the excess interest has been reduced to zero and then to any other indebtedness due under the CX – 350 & 450 Water Street Whole Loan until the other indebtedness has been reduced to zero.
A “Trigger Period” will occur:
(i) commencing upon the ARD;
(ii) commencing upon the occurrence of an event of default under the CX - 350 & 450 Water Street Whole Loan until cured;
(iii) on any date from and after December 31, 2022, commencing when the debt service coverage ratio is less than 1.75x based on the CX - 350 & 450 Water Street Whole Loan as of two consecutive calendar quarters, and ending upon the earlier to occur of (a) the debt service coverage ratio based on the CX - 350 & 450 Water Street Whole Loan is equal to or greater than 1.75x for two consecutive calendar quarters or (b) the funds on deposit in the cash collateral account are equal to the sum of (x) $25,557,850, to the extent the 350 Water Street property has not been released and (y) $20,203,800, to the extent the 450 Water Street property has not been released; or
(iv) during a Lease Sweep Period.
A “Lease Sweep Period” will commence (prior to the ARD), upon:
(i) the earliest to occur of:
(a) the date that is 12 months prior to the earliest stated expiration of the Lease Sweep Lease (as defined below);
(b) the last date under such Lease Sweep Lease that the tenant has the right to give notice of its exercise of a renewal option; or
(c) with respect to any Lease Sweep Lease that is a Short Term Qualifying Lease (as defined below), the date that is 12 months prior to the ARD or the date that the lender reasonably determines that a Lease Sweep Period should commence in order for the aggregate amount of projected deposits into the rollover account for the period commencing on such date through the ARD is equal to the Lease Sweep Deposit Amount (as defined below);
(ii) the date of the early termination, early cancellation or early surrender of a Lease Sweep Lease (or any material portion thereof) prior to its then current expiration date or the receipt by the applicable borrower or manager of written notice from the tenant under a Lease Sweep Lease of its intent to effect an early termination, early cancellation or early surrender of such Lease Sweep Lease prior to its then current expiration date;
(iii) solely with respect to any Lease Sweep Lease under which neither the tenant thereunder, nor any guarantor of all of the tenant’s obligations thereunder, is an investment grade entity, if such tenant has ceased operating its business (i.e., “goes dark”) in a majority of its leased space at the applicable property and the same has not been subleased in accordance with the terms of the loan documents, pursuant to a sublease on the same or substantially similar or better terms as the applicable Lease Sweep Lease;
(iv) a monetary or material non-monetary default under a Lease Sweep Lease by the tenant; or
(v) the occurrence of an insolvency proceeding.
A Lease Sweep Period will end upon:
(A) if triggered in the case of clause (i) above, the entirety of the Lease Sweep Lease space is leased pursuant to one or more qualified leases and in the lender’s reasonable judgment, sufficient funds have been accumulated in the rollover account;
(B) if triggered in the case of clause (i) above, the date on which the tenant under the Lease Sweep Lease irrevocably exercises its renewal or extension option or otherwise extends its Lease Sweep Lease in accordance with the terms of the loan documents with respect to all of its Lease Sweep Space, and, in the lender’s reasonable judgment, sufficient funds have been accumulated in the rollover account;
(C) if triggered in the case of clause (ii) above, if the tenant under the applicable Lease Sweep Lease rescinds in writing the exercise of its notice exercising its early termination, cancellation or surrender right or option;
(D) if triggered in the case of clause (iii) above, the circumstances giving rise to a Lease Sweep Period under clause (iii) no longer exist;
(E) if triggered in the case of clause (iv) above, the date on which the subject default has been cured;
(F) if triggered in the case of clause (v) above, either (1) the applicable insolvency proceeding has terminated or (2) the applicable Lease Sweep Lease has been assumed or assumed and assigned to a third party in a manner reasonably satisfactory to the lender;
(G) if triggered in the case of clauses (i), (ii), (iii), (iv) and/or (v) above, the CX - 350 & 450 Water Street Property has achieved a debt yield of not less than 6.0% and, in the lender’s reasonable judgment, sufficient funds have been accumulated in the rollover account; or
(H) if triggered in in the case of clauses (i), (ii), (iii), (iv) and/or (v) above, the date on which funds in the rollover account collected with respect to the Lease Sweep Space in question is equal to the Lease Sweep Deposit Amount applicable to such Lease Sweep space.
A “Lease Sweep Lease” means (i) the Aventis Inc. lease at 350 Water Street property, (ii) the Aventis Inc. lease at the 450 Water Street property or (iii) any replacement lease that, either individually, or when taken together with any other lease with the same tenant or its affiliates covers the majority of the Lease Sweep Lease space.
A “Lease Sweep Tenant” means any tenant under a Lease Sweep Lease.
A “Lease Sweep Deposit Amount” means an amount equal to the total rentable SF of the applicable Lease Sweep Lease space that is the subject of a Lease Sweep Period multiplied by $50.00.
This is not a research report and was not prepared by any Underwriter’s research department. Please see additional important information and qualifications at the end of this Term Sheet. |
T-61
| Mixed Use – Office/Lab | Loan #3 | Cut-off Date Balance: | $55,000,000 | |
| 350 & 450 Water Street | CX - 350 & 450 Water Street | Cut-off Date LTV: | 41.7% | |
| Cambridge, MA 02141 | UW NCF DSCR: | 3.50x | ||
| UW NOI Debt Yield: | 9.9% |
A “Short Term Qualifying Lease” means any qualified lease that has an initial term which does not extend at least two years beyond the ARD.
Additional Secured Indebtedness (not including trade debts). The CX - 350 & 450 Water Street Property also secures the remaining CX - 350 & 450 Water Street Senior Notes (the “CX - 350 & 450 Water Street Non-Serviced Pari Passu Companion Loans”) which have an aggregate Cut-off Date principal balance of $759,000,000 and the CX - 350 & 450 Water Street Subordinate Companion Loan, which has a Cut-off Date Principal Balance of $411,000,000. The CX - 350 & 450 Water Street Non-Serviced Pari Passu Companion Loans and the CX - 350 & 450 Water Street Subordinate Companion Loan accrue interest at the same rate as the CX - 350 & 450 Water Street Mortgage Loan. The CX - 350 & 450 Water Street Mortgage Loan and the CX - 350 & 450 Water Street Non-Serviced Pari Passu Companion Loans are pari passu in right of payment, and are generally senior in right of payment to the CX - 350 & 450 Water Street Subordinate Companion Loan. The holders of the CX - 350 & 450 Water Street Mortgage Loan, CX - 350 & 450 Water Street Non-Serviced Pari Passu Companion Loans and CX 350 & 450 Water Street Subordinate Companion Loan have entered into a co-lender agreement, which sets forth the allocation of collections on the CX - 350 & 450 Water Street Whole Loan. See “Description of the Mortgage Pool—The Whole Loans—The CX - 350 & 450 Water Street Pari Passu-A/B Whole Loan” in the prospectus.
Mezzanine Loan and Preferred Equity. None.
Release of Property. The CX - 350 & 450 Water Street Whole Loan documents allow, on any business day on or after (A) December 6, 2023 (with respect to a partial release through partial prepayment) or (B) after the expiration of the related defeasance lockout period (with respect to a partial release through partial defeasance), as applicable, any borrower to obtain the release of its respective property in connection with a bona fide third-party sale provided the borrowers must partially prepay (with the prepayment fee) or partially defease the CX – 350 & 450 Water Street Whole Loan in an amount equal to, with respect to the release of the 350 Water Street property, 110% of the allocated loan amount and (b) with respect to the release of the 450 Water Street property, 105% of the allocated loan amount, and so long as after giving effect to such release, (a) the debt service coverage ratio is equal to or greater than the greater of the debt service coverage ratio on the CX – 350 & 450 Water Street Whole Loan preceding such release and 1.90x and (b) certain REMIC related conditions are satisfied. The allocated loan amount for the 350 Water Street property is $720,300,000 and the allocated loan amount for the 450 Water Street property is $504,700,000.
Letter of Credit. None.
Right of First Offer/Right of First Refusal. None.
Ground Lease. None.
Terrorism Insurance. The borrowers are required to obtain and maintain property insurance that covers perils and acts of terrorism and is required to obtain and maintain business interruption insurance for 24 months plus a 12-month extended period of indemnity (provided that if TRIPRA or a similar statute is not in effect, the borrower will not be obligated to pay terrorism insurance premiums in excess of two times the annual premium for the property and business interruption/rental loss insurance coverage). See “Risk Factors—Risks Relating to the Mortgage Loans—Terrorism Insurance May Not Be Available for All Mortgaged Properties” in the prospectus.
This is not a research report and was not prepared by any Underwriter’s research department. Please see additional important information and qualifications at the end of this Term Sheet. |
T-62
(THIS PAGE INTENTIONALLY LEFT BLANK)
T-63
| Office – Suburban | Loan #4 | Cut-off Date Balance: | $55,000,000 | |
| 1201 Lake Robbins Drive | 1201 Lake Robbins | Cut-off Date LTV: | 55.3% | |
| The Woodlands, TX 77380 | UW NCF DSCR: | 2.26x | ||
| UW NOI Debt Yield: | 9.2% |

This is not a research report and was not prepared by any Underwriter’s research department. Please see additional important information and qualifications at the end of this Term Sheet. |
T-64
| Office – Suburban | Loan #4 | Cut-off Date Balance: | $55,000,000 | |
| 1201 Lake Robbins Drive | 1201 Lake Robbins | Cut-off Date LTV: | 55.3% | |
| The Woodlands, TX 77380 | UW NCF DSCR: | 2.26x | ||
| UW NOI Debt Yield: | 9.2% |
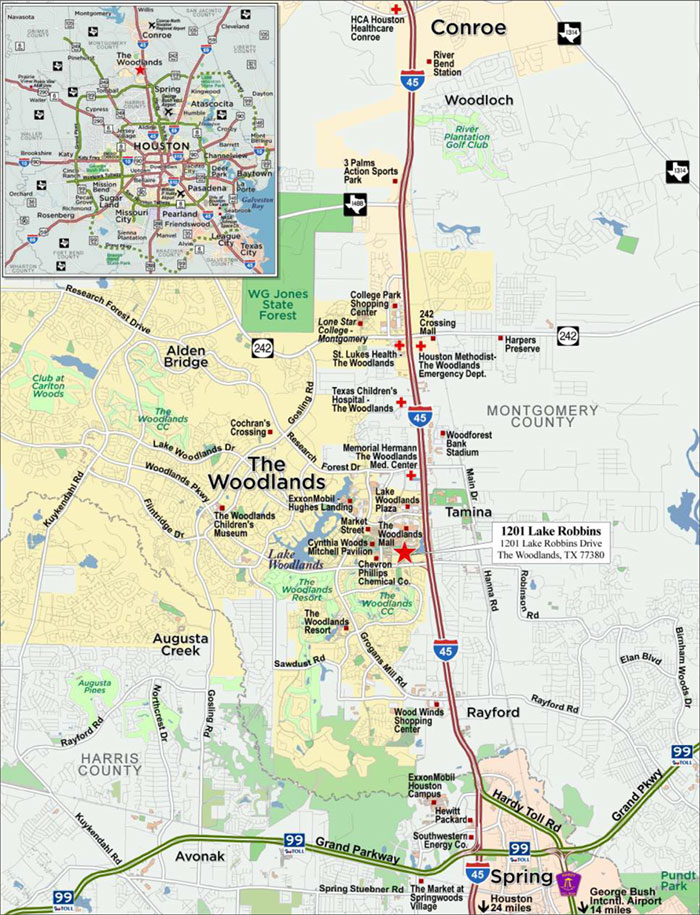
This is not a research report and was not prepared by any Underwriter’s research department. Please see additional important information and qualifications at the end of this Term Sheet. |
T-65
| Mortgage Loan No. 4 – 1201 Lake Robbins |
| Mortgage Loan Information | Property Information | |||||
| Mortgage Loan Seller: | WFB | Single Asset/Portfolio: | Single Asset | |||
| Credit Assessment (Fitch/KBRA/S&P): | NR/NR/NR | Location: | The Woodlands, TX 77380 | |||
| Original Balance(1): | $55,000,000 | General Property Type: | Office | |||
| Cut-off Date Balance(1): | $55,000,000 | Detailed Property Type: | Suburban | |||
| % of Initial Pool Balance: | 7.5% | Title Vesting: | Fee | |||
| Loan Purpose: | Recapitalization | Year Built/Renovated: | 2002/NAP | |||
| Sponsor: | The Howard Hughes Corporation | Size: | 807,586 SF | |||
| Guarantor: | The Woodlands Land Development | Cut-off Date Balance per SF(1): | $310 | |||
| Company, L.P. | Maturity Balance per SF(1): | $310 | ||||
| Mortgage Rate: | 3.8270% | Property Manager: | Howard Hughes Management | |||
| Note Date: | 10/8/2021 | Services Company, LLC | ||||
| First Payment Date: | 11/11/2021 | (borrower related) | ||||
| Maturity Date: | 10/11/2031 | |||||
| Original Term to Maturity: | 120 months | |||||
| Original Amortization Term: | 0 months | Underwriting and Financial Information(5) | ||||
| IO Period: | 120 months | UW NOI(6): | $22,923,465 | |||
| Seasoning: | 2 months | UW NOI Debt Yield(1): | 9.2% | |||
| Prepayment Provisions(2): | L(26),D(87),O(7) | UW NOI Debt Yield at Maturity(1): | 9.2% | |||
| Lockbox/Cash Mgmt Status: | Hard/In Place | UW NCF DSCR(1): | 2.26x | |||
| Additional Debt Type(1)(3): | Pari Passu | Most Recent NOI: | $24,086,187 (8/31/2021) | |||
| Additional Debt Balance(1)(3): | $195,000,000 | 2nd Most Recent NOI: | $24,374,004 (12/31/2020) | |||
| Future Debt Permitted (Type): | No (NAP) | 3rd Most Recent NOI(6): | NAV | |||
| Reserves(4) | Most Recent Occupancy: | 100.0% (12/1/2021) | ||||
| 2nd Most Recent Occupancy: | 100.0% (12/31/2020) | |||||
| Type | Initial | Monthly | Cap | 3rd Most Recent Occupancy: | 100.0% (12/31/2019) | |
| RE Taxes: | $0 | Springing | NAP | Appraised Value (as of): | $452,000,000 (8/25/2021) | |
| Insurance: | $0 | Springing | NAP | Appraised Value per SF: | $560 | |
| Replacement Reserves: | $0 | Springing | NAP | Cut-off Date LTV Ratio(1): | 55.3% | |
| TI/LC Reserve: | $0 | Springing | NAP | Maturity Date LTV Ratio(1): | 55.3% | |
| Sources and Uses | ||||||
| Sources | Proceeds | % of Total | Uses | Proceeds | % of Total | |
| Whole Loan Amount(1): | $250,000,000 | 100.0% | Closing Costs: | $1,866,197 | 0.7% | |
| Return of Equity(7): | $248,133,803 | 99.3% | ||||
| Total Sources: | $250,000,000 | 100.0% | Total Uses: | $250,000,000 | 100.0% | |
| (1) | The 1201 Lake Robbins Mortgage Loan (as defined below) is part of the 1201 Lake Robbins Whole Loan (as defined below) with an original aggregate principal balance of $250,000,000. The Cut-off Date Balance per SF, Maturity Date Balance per SF, UW NOI Debt Yield, UW NOI Debt Yield at Maturity, UW NCF DSCR, Cut-off Date LTV Ratio and Maturity Date LTV Ratio numbers presented above are based on the 1201 Lake Robbins Whole Loan. |
| (2) | At any time after the earlier of (i) October 8, 2024 and (ii) two years from the closing date of the securitization that includes the last pari passu note of the 1201 Lake Robbins Whole Loan to be securitized, the borrower has the right to defease the 1201 Lake Robbins Whole Loan in whole, but not in part. Additionally, the borrower may prepay the 1201 Lake Robbins Whole Loan with 30 days’ notice on or after April 11, 2031. |
| (3) | See “The Mortgage Loan” and “Additional Secured Indebtedness (not including trade debts)” below for further discussion of additional mortgage debt. |
| (4) | See “Escrows and Reserves” below for further discussion of reserve requirements. |
| (5) | The novel coronavirus pandemic is an evolving situation and could impact the 1201 Lake Robbins Whole Loan more severely than assumed in the underwriting of the 1201 Lake Robbins Whole Loan and could adversely affect the NOI, NCF and occupancy information, as well as the appraised value and the DSCR, LTV and Debt Yield metrics presented above and herein. See “Risk Factors—Risks Related to Market Conditions and Other External Factors—The Coronavirus Pandemic Has Adversely Affected the Global Economy and Will Likely Adversely Affect the Performance of the Mortgage Loans” in the prospectus. |
| (6) | The borrower purchased the property in December 2019. No prior historical financials are available. |
| (7) | The borrower purchased the property in December 2019 as part of a portfolio acquired by The Howard Hughes Corporation, and was unencumbered. |
The Mortgage Loan. The fourth largest mortgage loan (the “1201 Lake Robbins Mortgage Loan”) is part of a whole loan (the “1201 Lake Robbins Whole Loan”) that is evidenced by four pari passu promissory notes in the aggregate original principal amount of $250,000,000. The 1201 Lake Robbins Whole Loan is secured by a first priority fee mortgage encumbering an 807,586 SF office building, located in The Woodlands, Texas (the “1201 Lake Robbins Property”). The 1201 Lake Robbins Whole Loan will be serviced under the pooling and servicing agreement for the BANK 2021-BNK37 securitization trust. See “Description of the Mortgage Pool—The Whole Loans—The Non-Serviced Pari Passu Whole Loans” and “Pooling and Servicing Agreement—Servicing of the Non-Serviced Mortgage Loans” in the prospectus. The proceeds of the 1201 Lake Robbins Whole Loan were primarily used to recapitalize the borrower sponsor’s December 2019 purchase of the 1201 Lake Robbins Property and pay closing costs.
This is not a research report and was not prepared by any Underwriter’s research department. Please see additional important information and qualifications at the end of this Term Sheet. |
T-66
| Office – Suburban | Loan #4 | Cut-off Date Balance: | $55,000,000 | |
| 1201 Lake Robbins Drive | 1201 Lake Robbins | Cut-off Date LTV: | 55.3% | |
| The Woodlands, TX 77380 | UW NCF DSCR: | 2.26x | ||
| UW NOI Debt Yield: | 9.2% |
| 1201 Lake Robbins Whole Loan Summary | ||||
| Notes | Original Balance | Cut-off Date Balance | Note Holder | Controlling Piece |
| A-1 | $100,000,000 | $100,000,000 | BANK 2021-BNK37 | Yes |
| A-2 | $70,000,000 | $70,000,000 | WFCM 2021-C61 | No |
| A-3 | $55,000,000 | $55,000,000 | BANK 2021-BNK38 | No |
| A-4 | $25,000,000 | $25,000,000 | WFB | No |
| Total Whole Loan | $250,000,000 | $250,000,000 | ||
The Borrower and the Borrower Sponsors. The borrower is HH Woodlands Tower Holdings, LLC, a Delaware limited liability company with two independent directors. Legal counsel to the borrower delivered a non-consolidation opinion in connection with the origination of the 1201 Lake Robbins Mortgage Loan. The non-recourse carveout guarantor is The Woodlands Land Development Company, L.P. (the “1201 Lake Robbins Guarantor”).
The borrower sponsor is The Howard Hughes Corporation. Founded in 2010, the company owns, manages, and develops commercial, residential and mixed-use real estate throughout the United States. Through its Operating Assets segment, the company owns 15 retail, 32 office, 12 multi-family, and 13 other operating assets.
The Property. The 1201 Lake Robbins Property is a 30-story, Class A office building consisting of 807,586 rentable square feet situated on 5.1 acres of land. The property was originally built as the corporate headquarters for Anadarko and includes a fitness center, deli, and a 45,000 square foot annex which includes a large cafeteria and conference space. In 2019, Occidental Petroleum Corporation (“Occidental”) acquired Anadarko, and The Howard Hughes Corporation purchased both the 1201 Lake Robbins Property and an adjacent office building. Subsequently Occidental signed a new 13-year lease and consolidated its space from the adjacent building into the 1201 Lake Robbins Property. As of December 1, 2021, the 1201 Lake Robbins Property is 100% leased to Occidental.
The 1201 Lake Robbins Property is subject to a shared parking agreement with the adjacent building, whereby the borrower and the owner of the adjacent building reallocated parking spaces in each building’s garage such that the 1201 Lake Robbins Property is entitled to the use of 2,019 parking spaces as required under the Occidental lease. Expenses are shared between the two property owners based on each owner’s share of the total available parking spaces.
Major Tenant.
Occidental (BB/Ba2/BB: F/M/S&P; 807,586 square feet; 100.0% of net rentable area; 100.0% of underwritten base rent; December 31, 2032 lease expiration): Occidental is an international energy company with assets in the United States, Middle East, Africa and Latin America. Founded in 1920, Occidental is one of the largest oil producers in the Unites States, including being a leading producer in the Permian and DJ Basins and offshore Gulf of Mexico. As of October 14, 2021, the company has a market capitalization of $30.0 billion and employs 11,800 people.
Occidental signed a new 13-year lease in December 2019 and has either two, 5-year or one, 10-year extension options for at least 250,000 square feet, with 12 months’ notice at 95% of fair market rent. The lease includes 2% annual rent increases and no termination or contraction options.
The following table presents certain information relating to the tenancy at the 1201 Lake Robbins Property:
| Tenant Summary | |||||||||
| Tenant Name | Credit Rating (Fitch/Moody’s/S&P) | Tenant SF | Approx. % of SF | Annual UW Rent(1) | % of Total Annual UW Rent | Annual UW Rent PSF(1) | Termination Option (Y/N) | Lease Expiration | Renewal Options(2) |
| Occidental | BB/Ba2/BB | 807,586 | 100.0% | $24,784,815 | 100.0% | $30.69 | N | 12/31/2032 | Various |
| Subtotal/Wtd. Avg. | 807,586 | 100.0% | $24,784,815 | 100.0% | $30.69 | ||||
| Other Tenants | 0 | 0.0% | $0 | 0.0% | $0.00 | ||||
| Vacant Space | 0 | 0.0% | $0 | 0.0% | $0.00 | ||||
| Total/Wtd. Avg. | 807,586 | 100.0% | $24,784,815 | 100.0% | $30.69 | ||||
| (1) | The Annual UW Base Rent PSF and Annual UW Base Rent shown above represent the January 1, 2022 rent step. |
| (2) | Tenant has the option of two, 5-year or one, 10-year renewal option for at least 250,000 square feet at 95% of fair market rent. |
This is not a research report and was not prepared by any Underwriter’s research department. Please see additional important information and qualifications at the end of this Term Sheet. |
T-67
| Office – Suburban | Loan #4 | Cut-off Date Balance: | $55,000,000 | |
| 1201 Lake Robbins Drive | 1201 Lake Robbins | Cut-off Date LTV: | 55.3% | |
| The Woodlands, TX 77380 | UW NCF DSCR: | 2.26x | ||
| UW NOI Debt Yield: | 9.2% |
The following table presents certain information relating to the lease rollover schedule at the 1201 Lake Robbins Property:
| Lease Rollover Schedule(1) | ||||||||
| Year | # of Leases Rolling | SF Rolling | Annual UW Rent PSF Rolling | Approx. % of Total SF Rolling | Approx. Cumulative % of SF Rolling | Total UW Rent Rolling | Approx. % of Total Rent Rolling | Approx. Cumulative % of Total Rent Rolling |
| MTM | 0 | 0 | $0.00 | 0.0% | 0.0% | $0 | 0.0% | 0.0% |
| 2021 | 0 | 0 | $0.00 | 0.0% | 0.0% | $0 | 0.0% | 0.0% |
| 2022 | 0 | 0 | $0.00 | 0.0% | 0.0% | $0 | 0.0% | 0.0% |
| 2023 | 0 | 0 | $0.00 | 0.0% | 0.0% | $0 | 0.0% | 0.0% |
| 2024 | 0 | 0 | $0.00 | 0.0% | 0.0% | $0 | 0.0% | 0.0% |
| 2025 | 0 | 0 | $0.00 | 0.0% | 0.0% | $0 | 0.0% | 0.0% |
| 2026 | 0 | 0 | $0.00 | 0.0% | 0.0% | $0 | 0.0% | 0.0% |
| 2027 | 0 | 0 | $0.00 | 0.0% | 0.0% | $0 | 0.0% | 0.0% |
| 2028 | 0 | 0 | $0.00 | 0.0% | 0.0% | $0 | 0.0% | 0.0% |
| 2029 | 0 | 0 | $0.00 | 0.0% | 0.0% | $0 | 0.0% | 0.0% |
| 2030 | 0 | 0 | $0.00 | 0.0% | 0.0% | $0 | 0.0% | 0.0% |
| 2031 | 0 | 0 | $0.00 | 0.0% | 0.0% | $0 | 0.0% | 0.0% |
| 2032 & Beyond | 1 | 807,586 | $30.69 | 100.0% | 100.0% | $24,784,815 | 100.0% | 100.0% |
| Vacant | 0 | 0 | $0.00 | 0.0% | 100.0% | $0.00 | 0.0% | 100.0% |
| Total/Wtd. Avg. | 1 | 807,586 | $30.69 | 100.0% | $24,784,815 | 100.0% | ||
| (1) | Information is based on the underwritten rent roll. |
COVID-19 Update. As of October 7, 2021, the 1201 Lake Robbins Property is open and operating with no outstanding tenant rent relief agreements.
The Market. The 1201 Lake Robbins Property is located in The Woodlands, Texas, approximately 29.5 miles north of Houston. The Woodlands is a mixed-use master-planned development that contains approximately 27,000 acres, of which approximately 20-25% is expected to remain forest preserves, parks, golf courses, lakes and open space. The Woodlands includes over 1,650 companies including major corporations such as Chevron Phillips, Occidental, and Baker Hughes, and employs an estimated 22,629 people. Currently, The Woodlands is home to more than 60,000 residents, contains 3.9 million square feet of retail and commercial space and approximately 6.3 million square feet of office and industrial space. At full build out, the community is expected to have 132,500 residents and approximately 82,000 employees. The 1201 Lake Robbins Property is located directly adjacent to The Woodlands Waterway, which winds through the township and connects attractions along the way such as dining, hotels, nightlife and outdoor green space. According to the appraisal, the estimated 2020 population within a one, three and five-mile radius was approximately 5,552, 62,548 and 160,703, respectively and the estimated 2020 average household income within the same radii was approximately $133,550, $132,792 and $141,072, respectively.
The 1201 Lake Robbins Property is located approximately 4.9 miles from the Grand Parkway, the outermost loop around Houston and provides accessibility throughout the area, and 1.1 miles from Interstate 45, a major north south thoroughfare. Additionally, the 1201 Lake Robbins Property is located 0.9 miles from The Woodlands Mall, featuring various dining and entertainment options and tenants such as Apple, Coach, Peloton and Nordstrom. The 1201 Lake Robbins Property is also located approximately 22.5 miles from the George Bush Intercontinental Airport.
According to the appraisal, the property is situated within in the Woodlands/Conroe submarket within the greater Houston office market. As of the second quarter of 2021, the submarket reported a total inventory of approximately 11.0 million square feet with a 19.1% vacancy rate and an average asking rent of $40.24 per square foot, net. The appraiser identified nine comparable buildings located within The Woodlands with rents ranging from $21.00 to $30.75 per square foot, net. The appraiser concluded a market rent for the 1201 Lake Robbins Property of $29.00 per square foot, net.
The following table presents certain information relating to the appraisal’s market rent conclusions for the 1201 Lake Robbins Property:
| Market Rent Summary(1) | |
| Office | |
| Market Rent (PSF) | $29.00 |
| Lease Term (Years) | 10 |
| Lease Type | Net |
| Rent Increase Projection | $0.50 per annum |
| Tenant Improvements (New/Renewal) | $75.00 / $25.00 |
| Leasing Commissions (New/Renewal) | 6.0% / 6.0% |
| Free Rent | 12 months |
| (1) | Information obtained from the appraisal. |
This is not a research report and was not prepared by any Underwriter’s research department. Please see additional important information and qualifications at the end of this Term Sheet. |
T-68
| Office – Suburban | Loan #4 | Cut-off Date Balance: | $55,000,000 | |
| 1201 Lake Robbins Drive | 1201 Lake Robbins | Cut-off Date LTV: | 55.3% | |
| The Woodlands, TX 77380 | UW NCF DSCR: | 2.26x | ||
| UW NOI Debt Yield: | 9.2% |
The table below presents certain information relating to comparable sales pertaining to the 1201 Lake Robbins Property identified by the appraiser:
| Comparable Sales | |||||
Property Name | Location | Year Built/Renovated | Rentable Area (SF) | Sale Date | Sale Price (PSF) |
Apple at Capital Ridge 320 South Capital of Texas Highway | Austin, TX | 2015/NAP | 216,511 | Aug-2021 | $647 |
Waterway Plaza 1 10003 Woodloch Forest Drive | The Woodlands, TX | 2000/NAP | 223,516 | Jan-2021 | $488 |
Helios Plaza 201 Helios Way | Houston, TX | 2009/NAP | 377,185 | Aug-2021 | $472 |
HP Inc. Plaza in City Place 10300 Energy Drive | Spring, TX | 2018/NAP | 378,402 | Aug-2021 | $575 |
Ten West One 17420 Katy Freeway | Houston, TX | 1998/NAP | 199,000 | Aug-2021 | $337 |
Source: Appraisal.
The following table presents certain information relating to comparable office leases for the 1201 Lake Robbins Property:
| Comparable Building Leases(1) | ||||||
| Property Name/Location | Year Built/ Renovated | Total GLA (SF) | Occupancy(2) | Term | Annual Base Rent PSF(3) | Lease Type |
1201 Lake Robbins (Subject) 1201 Lake Robbins Drive The Woodlands, TX | 2002/NAP | 807,586(4) | 100%(4) | 13 Yrs. | $30.69(5) | NNN |
One, Two & Three Hughes Landing 1780, 1790 & 1800 Hughes Landing Boulevard The Woodlands, TX | 2015/NAP | 716,230 | 86% | 5-10 Yrs. | $30.00 | NNN |
Woodlands Town Center 1 & 2 1330 & 1450 Lake Robbins Drive The Woodlands, TX | 1999/NAP | 280,415 | 82% | 5-10 Yrs. | $24.50 | NNN |
3 Waterway Square Place 3 Waterway Avenue The Woodlands, TX | 2013/NAP | 232,045 | 87% | 3-10 Yrs. | $29.00 | NNN |
4 Waterway Square Place 4 Waterway Avenue The Woodlands, TX | 2008/NAP | 218,551 | 100% | 5 Yrs. | $29.00 | NNN |
21 Waterway 21 Waterway Avenue The Woodlands, TX | 2005/NAP | 102,816 | 99% | 3-10 Yrs. | $30.50 | NNN |
24 Waterway 24 Waterway Avenue The Woodlands, TX | 2008/NAP | 308,000 | 91% | 3-10 Yrs. | $29.00 | NNN |
Waterway Plaza Two 10001 Woodloch Forest Drive The Woodlands, TX | 2000/NAP | 142,270 | 60% | 3-10 Yrs. | $26.50 | NNN |
Wildwood Corporate Centre II 480 WildWood Forest Drive The Woodlands, TX | 2016/NAP | 201,933 | 89% | 5-10 Yrs. | $21.00 | NNN |
The Woodlands Tower 9950 Woodloch Forest Drive The Woodlands, TX | 2014/NAP | 595,854 | 34% | 5-10 Yrs. | $30.75 | NNN |
(1) Information obtained from the appraisal. Includes comparable buildings located in The Woodlands, TX.
(2) Represents building occupancy as of September 2021, with the exception of the 1201 Lake Robbins Property.
(3) Represents quoted rental rates as of September 2021, with the exception of the 1201 Lake Robbins Property.
(4) Information obtained from the underwritten rent roll.
(5) Represents the underwritten base rent.
This is not a research report and was not prepared by any Underwriter’s research department. Please see additional important information and qualifications at the end of this Term Sheet. |
T-69
| Office – Suburban | Loan #4 | Cut-off Date Balance: | $55,000,000 | |
| 1201 Lake Robbins Drive | 1201 Lake Robbins | Cut-off Date LTV: | 55.3% | |
| The Woodlands, TX 77380 | UW NCF DSCR: | 2.26x | ||
| UW NOI Debt Yield: | 9.2% |
Operating History and Underwritten Net Cash Flow. The following table presents certain information relating to the historical operating performance and Underwritten Net Cash Flow at the 1201 Lake Robbins Property:
| Cash Flow Analysis | ||||
| 2020 | TTM (8/31/2021) | UW | UW PSF | |
| Gross Potential Base Rent | $23,823,787 | $24,141,438 | $24,784,815(1) | $30.69 |
| Total Recoveries | $12,027,957 | $11,856,395 | $11,820,073 | $14.64 |
| Other Income | $0 | $0 | $0 | $0.00 |
| Less Vacancy & Credit Loss | $0 | $0 | $(1,239,241) | ($1.53) |
| Effective Gross Income | $35,851,744 | $35,997,833 | $35,365,647 | $43.79 |
| Real Estate Taxes | $4,906,836 | $4,571,446 | $5,138,179 | $6.36 |
| Insurance | $635,236 | $647,661 | $697,633 | $0.86 |
| Other Operating Expenses | $5,935,668 | $6,692,539 | $6,606,370 | $8.18 |
| Total Expenses | $11,477,740 | $11,911,646 | $12,442,182 | $15.41 |
| Net Operating Income | $24,374,004 | $24,086,187 | $22,923,465 | $28.39 |
| CapEx | $0 | $0 | $161,517 | $0.20 |
| TI/LC | $0 | $0 | $807,586 | $1.00 |
| Net Cash Flow | $24,374,004 | $24,086,187 | $21,954,362 | $27.19 |
| Occupancy %(2) | 100.0% | 100.0% | 95.0% | |
| NOI DSCR(3) | 2.51x | 2.48x | 2.36x | |
| NCF DSCR(3) | 2.51x | 2.48x | 2.26x | |
| NOI Debt Yield(3) | 9.7% | 9.6% | 9.2% | |
| NCF Debt Yield(3) | 9.7% | 9.6% | 8.8% | |
| (1) | The UW Base Rent represents the January 1, 2022 rent step. |
| (2) | The 1201 Lake Robbins Property is 100% leased. The 1201 Lake Robbins Property is underwritten with 5% vacancy. |
| (3) | The debt service coverage ratios and debt yields are based on the 1201 Lake Robbins Whole Loan. |
Escrows.
Real Estate Taxes – During a Cash Trap Event Period (as defined below), the loan documents require ongoing monthly real estate tax reserves in an amount equal to 1/12th of the real estate taxes that the lender estimates will be payable during the next 12 months.
Insurance – During a Cash Trap Event Period, the loan documents require ongoing monthly insurance reserves in an amount equal to 1/12th of the insurance premiums that the lender estimates will be payable for the renewal of the coverage afforded by the policies upon the expiration thereof.
Notwithstanding the above, the borrower’s obligation to make insurance reserve payments will be waived so long as (i) no event of default is continuing, (ii) the insurance policies maintained by the borrower are part of a blanket or umbrella policy approved by the lender in its reasonable discretion, and (iii) the lender is provided with paid receipts for the payment of the insurance premiums no later than ten business days prior to the expiration dates of said policies.
Replacement Reserve – During a Cash Trap Event Period, the loan documents require an ongoing monthly replacement reserve deposit of $10,095.
TI/LC Reserve – During a Cash Trap Event Period, the loan documents require an ongoing monthly TI/LC reserve deposit of $134,598.
Lockbox and Cash Management. The 1201 Lake Robbins Mortgage Loan is structured with a hard lockbox and in-place cash management. The borrower and property manager are required to direct the tenant to pay rent directly into the lockbox account, and to deposit any rents otherwise received in such account within two business days after receipt. On each business day, the lockbox bank is required to transfer amounts on deposit in the lockbox account into the cash management account, to be applied in accordance with the loan documents. If no Cash Trap Event Period exists, all excess cash flow will be disbursed to, or at the written direction, of the borrower. During the continuance of a Cash Trap Event Period, excess cash flow will be held by the lender as additional collateral.
A “Cash Trap Event Period” will commence upon the earlier of the following:
| (i) | the occurrence of an event of default under the loan documents; |
| (ii) | the net cash flow debt yield being less than 6.0% for any calendar quarter; |
| (iii) | the occurrence of a Material Tenant Event (as defined below). |
This is not a research report and was not prepared by any Underwriter’s research department. Please see additional important information and qualifications at the end of this Term Sheet. |
T-70
| Office – Suburban | Loan #4 | Cut-off Date Balance: | $55,000,000 | |
| 1201 Lake Robbins Drive | 1201 Lake Robbins | Cut-off Date LTV: | 55.3% | |
| The Woodlands, TX 77380 | UW NCF DSCR: | 2.26x | ||
| UW NOI Debt Yield: | 9.2% |
A Cash Trap Event Period will end upon the occurrence of the following:
| ● | with regard to clause (i), the cure of such event of default; |
| ● | with regard to clause (ii), the net cash flow debt yield being equal to or greater than 6.0%, tested quarterly, or the borrower delivers cash or a letter of credit in an amount which, if applied to the then principal balance of the 1201 Lake Robbins Mortgage Loan, would result in the debt yield threshold being satisfied; |
| ● | with regard to clause (iii), a Material Tenant Event Cure (as defined below) occurs. |
A “Material Tenant Event” will commence upon the occurrence of any of the following:
| (i) | Occidental defaults under the lease beyond any notice and cure periods; |
| (ii) | Occidental becomes a debtor in a bankruptcy, insolvency or similar proceeding; |
| (iii) | Occidental goes dark in 50% or more of the 1201 Lake Robbins Property, unless it is caused by COVID-19 or any other pandemic event; |
| (iv) | The credit rating of Occidental is downgraded below “B” or the equivalent by any rating agency; |
| (v) | Occidental has not renewed its lease for a minimum of a five-year term on then-current market terms reasonably approved by lender, at least 12 months prior to loan maturity; or |
| (vi) | Occidental terminates, surrenders, or cancels its lease. |
A “Material Tenant Event Cure” will commence upon the occurrence of any of the following:
| ● | with regard to clause (i), either the event of default has been cured or the borrower has entered into one or more replacement leases for at least a five year term, for either the entire Occidental space or a portion of the space if the aggregate base rent is at least 90% of the base rent otherwise payable under the Occidental lease, and the tenant has taken occupancy and commenced paying full unabated rent as evidenced by an estoppel (“Replacement Lease Condition”); |
| ● | if caused solely by clause (ii), either the bankruptcy has been discharged or dismissed, Occidental has assumed the lease and the bankruptcy trustee has approved the assumption or the occurrence of a Replacement Lease Condition; |
| ● | if caused solely by clause (iii), Occidental has been continuously operating in more than 50% of the 1201 Lake Robbins Property for more than 90 days or if a sublease exists for more than 50% of the space, the sublease occupancy sweep cap of $50.00 PSF for the sublease square footage has been met, and Occidental is operating in the remainder of the 1201 Lake Robbins Property; |
| ● | if caused solely by clause (iv), Occidental has a credit rating of “B” or higher by each rating agency that rates it; |
| ● | if caused solely by clause (v), a binding and enforceable renewal of the Occidental lease approved by the lender has been delivered by Occidental; or |
| ● | if caused solely by clause (vi) the occurrence of a Replacement Lease Condition. |
Additional Secured Indebtedness (not including trade debts). The 1201 Lake Robbins Property also secures notes A-1, A-2, and A-4 (the “1201 Lake Robbins Non-Serviced Pari Passu Companion Loans”), which have a Cut-off Date principal balance of $195,000,000. The 1201 Lake Robbins Non-Serviced Pari Passu Companion Loans accrue interest at the same rate as the 1201 Lake Robbins Mortgage Loan. The 1201 Lake Robbins Mortgage Loan is entitled to payments of principal and interest on a pro rata and pari passu basis with the 1201 Lake Robbins Non-Serviced Pari Passu Companion Loans. The holders of the 1201 Lake Robbins Mortgage Loan and the 1201 Lake Robbins Non-Serviced Pari Passu Companion Loans have entered into a co-lender agreement which sets forth the allocation of collections on the 1201 Lake Robbins Whole Loan. See “Description of the Mortgage Pool—The Whole Loans—The Non-Serviced Pari Passu Whole Loans”.
Release of Property. Not permitted.
Letter of Credit. None.
Ground Lease. None.
Right of First Offer/Right of First Refusal. None.
Terrorism Insurance. The loan documents require that the “all risk” insurance policy required to be maintained by the borrower provides coverage for terrorism in an amount equal to the full replacement cost of the property, as well as business interruption insurance covering no less than the 18-month period following the occurrence of a casualty event, together with a 6-month extended period of indemnity. Provided, however, if TRIPRA is not in effect, the borrower is not required to pay premiums in excess of two times the premium for a separate all risk policy insuring the 1201 Lake Robbins Property on a stand alone basis.
This is not a research report and was not prepared by any Underwriter’s research department. Please see additional important information and qualifications at the end of this Term Sheet. |
T-71
| Retail – Anchored | Loan #5 | Cut-off Date Balance: | $52,250,000 | |
| 5472 West Grand Parkway South | Bella Terra | Cut-off Date LTV: | 65.1% | |
| Richmond, TX 77406 | UW NCF DSCR: | 2.70x | ||
| UW NOI Debt Yield: | 10.3% |
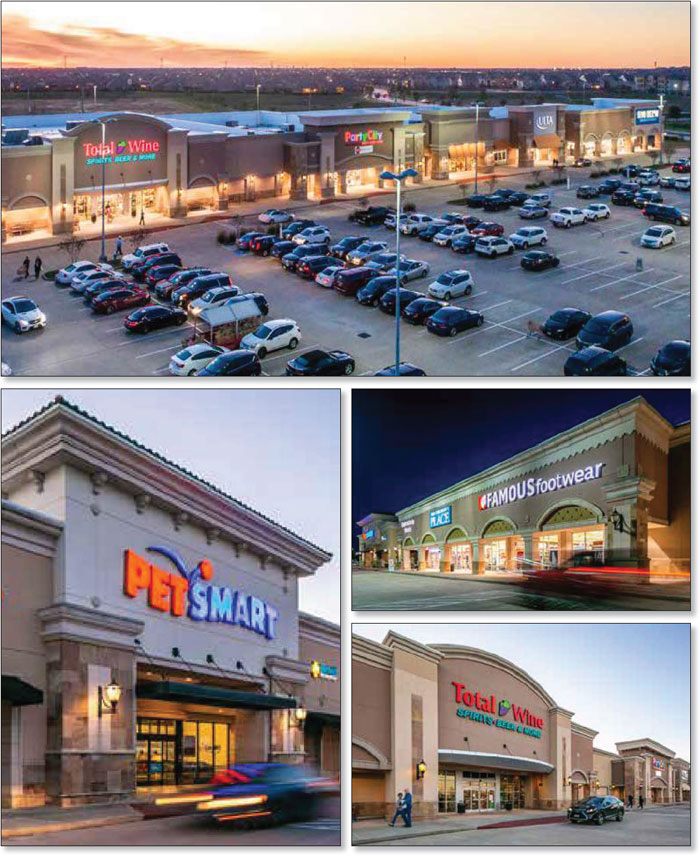
This is not a research report and was not prepared by any Underwriter’s research department. Please see additional important information and qualifications at the end of this Term Sheet. |
T-72
| Retail – Anchored | Loan #5 | Cut-off Date Balance: | $52,250,000 | |
| 5472 West Grand Parkway South | Bella Terra | Cut-off Date LTV: | 65.1% | |
| Richmond, TX 77406 | UW NCF DSCR: | 2.70x | ||
| UW NOI Debt Yield: | 10.3% |

This is not a research report and was not prepared by any Underwriter’s research department. Please see additional important information and qualifications at the end of this Term Sheet. |
T-73
| Retail – Anchored | Loan #5 | Cut-off Date Balance: | $52,250,000 | |
| 5472 West Grand Parkway South | Bella Terra | Cut-off Date LTV: | 65.1% | |
| Richmond, TX 77406 | UW NCF DSCR: | 2.70x | ||
| UW NOI Debt Yield: | 10.3% |
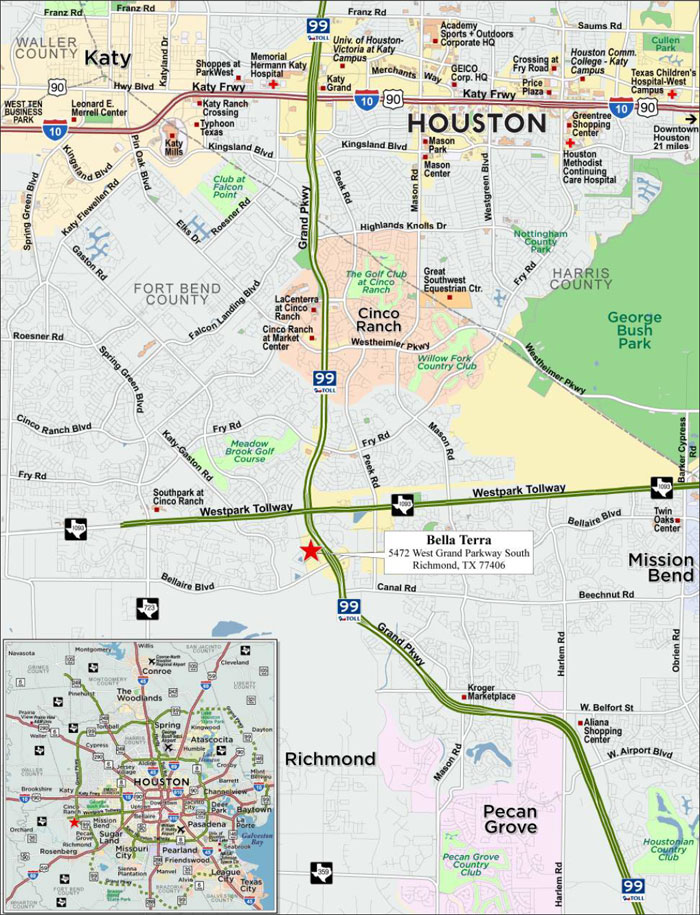
This is not a research report and was not prepared by any Underwriter’s research department. Please see additional important information and qualifications at the end of this Term Sheet. |
T-74
| Mortgage Loan No. 5 – Bella Terra |
| Mortgage Loan Information | Property Information | ||||||
| Mortgage Loan Seller: | MSMCH | Single Asset/Portfolio: | Single Asset | ||||
| Credit Assessment (Fitch/KBRA/S&P): | NR/NR/NR | Location: | Richmond, TX 77406 | ||||
| Original Balance: | $52,250,000 | General Property Type: | Retail | ||||
| Cut-off Date Balance: | $52,250,000 | Detailed Property Type: | Anchored | ||||
| % of Initial Pool Balance: | 7.2% | Title Vesting: | Fee | ||||
| Loan Purpose: | Acquisition | Year Built/Renovated: | 2008-2013/NAP | ||||
| Borrower Sponsor: | Fidelis Retail Opportunity Fund I, LP | Size: | 309,254 SF | ||||
| Guarantor: | Fidelis Retail Opportunity Fund I, LP | Cut-off Date Balance Per SF: | $169 | ||||
| Mortgage Rate: | 3.4800% | Maturity Date Balance Per SF: | $169 | ||||
| Note Date: | 11/12/2021 | Property Manager: | Fidelis Realty Partners, Ltd. | ||||
| First Payment Date: | 1/1/2022 | (borrower-related) | |||||
| Maturity Date: | 12/1/2031 | ||||||
| Original Term to Maturity: | 120 months | Underwriting and Financial Information(2) | |||||
| Original Amortization Term: | 0 months | UW NOI: | $5,363,332 | ||||
| IO Period: | 120 months | UW NOI Debt Yield: | 10.3% | ||||
| Seasoning: | 0 months | UW NOI Debt Yield at Maturity: | 10.3% | ||||
| Prepayment Provisions: | L(24),D(91),O(5) | UW NCF DSCR: | 2.70x | ||||
| Lockbox/Cash Mgmt Status: | Hard/In Place | Most Recent NOI: | $5,777,477 (8/31/2021 TTM) | ||||
| Additional Debt Type: | No | 2nd Most Recent NOI: | $6,313,739 (12/31/2020) | ||||
| Additional Debt Balance: | NAP | 3rd Most Recent NOI: | $6,361,626 (12/31/2019) | ||||
| Future Debt Permitted (Type): | No (NAP) | Most Recent Occupancy: | 88.1% (9/17/2021) | ||||
| Reserves(1) | 2nd Most Recent Occupancy: | 93.2% (12/31/2020) | |||||
| Type | Initial | Monthly | Cap | 3rd Most Recent Occupancy: | 96.8% (12/31/2019) | ||
| RE Tax: | $0 | $88,375 | NAP | Appraised Value (as of): | $80,280,000 (9/16/2021) | ||
| Insurance: | $0 | Springing | NAP | Appraised Value Per SF: | $260 | ||
| Replacement Reserves: | $0 | $3,866 | $92,784 | Cut-off Date LTV Ratio: | 65.1% | ||
| TI/LC Reserves: | $500,000 | Springing | $500,000 | Maturity Date LTV Ratio: | 65.1% | ||
| Sources and Uses | ||||||
| Sources | Proceeds | % of Total | Uses | Proceeds | % of Total | |
| Mortgage Loan Amount: | $52,250,000 | 64.7% | Purchase Price: | $79,500,000 | 98.4% | |
| Borrower Equity: | $28,552,514 | 35.3% | Closing Costs: | $802,514 | 1.0% | |
| Reserves: | $500,000 | 0.6% | ||||
| Total Sources: | $80,802,514 | 100.0% | Total Uses: | $80,802,514 | 100.0% | |
| (1) | See “Escrows and Reserves” section below for further discussion of reserve requirements. |
| (2) | The novel coronavirus pandemic is an evolving situation and could impact the Bella Terra Mortgage Loan (as defined below) more severely than assumed in the underwriting of the Bella Terra Mortgage Loan and could adversely affect the NOI, NCF and occupancy information, as well as the appraised value and the DSCR, LTV and Debt Yield metrics presented above and herein. See “Risk Factors-—Risks Related to Market Conditions and Other External Factors—The Coronavirus Pandemic Has Adversely Affected the Global Economy and Will Likely Adversely Affect the Performance of the Mortgage Loans” in the prospectus. |
The Mortgage Loan. The fifth largest mortgage loan (the “Bella Terra Mortgage Loan”) is evidenced by a promissory note in the original principal amount of $52,250,000 and secured by a first priority fee mortgage encumbering a 309,254 SF anchored retail shopping center located in Richmond, Texas (the “Bella Terra Property”).
The Borrower and the Borrower Sponsor. The borrower for the Bella Terra Mortgage Loan is Bella Terra Retail Associates, LLC, a single-purpose Delaware limited liability company with one independent director in its organizational structure. The borrower sponsor and non-recourse carveout guarantor is Fidelis Retail Opportunity Fund I, LP (“Fidelis”), a closed end fund which was formed in June 2021 and has a ten-year term with three one-year extension options. Fidelis was founded in 2003 in Houston, Texas. Fidelis has approximately 14 million SF of retail property in 5 states and 9 cities with offices in Houston and Dallas, Texas and Santa Fe, New Mexico. Fidelis has been an owner, acquirer, developer, re-developer, and operator focusing specifically on the retail sector throughout the South and Southwestern United States. The California State Teachers Retirement System indirectly owns approximately 66.0% of the borrower.
The Property. The Bella Terra Property is a 309,254 SF retail shopping center on an approximately 41.65-acre site in Richmond, Texas. The Bella Terra Property is comprised of eight multi-tenant retail buildings, two freestanding big box stores, one free standing vacant medical office and seven ground leased pads, one of which is a dark Carl’s Jr. The Bella Terra Property was built in 2008-2013 and is anchored by 24 Hour Fitness (14.6% of NRA), Best Buy (9.7% of NRA) and Ross Dress for Less (9.0% of NRA). In addition, an adjacent Walmart and Kohl’s, which are not part of the collateral, are shadow anchors for the Bella Terra Property. As of September 17, 2021, the Bella Terra Property was 88.1% leased to 38 tenants. One tenant, Famous Footwear (1.9% of NRA), which is still in occupancy and open for business, is paying 5% of its sales in lieu of base rent and pro rata share of expenses. The Bella Terra Property contains 1,812 parking spaces (5.9 spaces per 1,000 SF).
This is not a research report and was not prepared by any Underwriter’s research department. Please see additional important information and qualifications at the end of this Term Sheet. |
T-75
| Retail – Anchored | Loan #5 | Cut-off Date Balance: | $52,250,000 | |
| 5472 West Grand Parkway South | Bella Terra | Cut-off Date LTV: | 65.1% | |
| Richmond, TX 77406 | UW NCF DSCR: | 2.70x | ||
| UW NOI Debt Yield: | 10.3% |
Major Tenants.
24 Hour Fitness (45,050 SF, 14.6% of NRA, 22.1% of underwritten rent). 24 Hour Fitness is a fitness gym chain founded over 35 years ago with over 280 clubs in 11 states. 24 Hour Fitness has been a tenant at the Bella Terra Property since 2011, has a lease expiration of December 31, 2026 and has three, 5-year renewal options remaining. 24 Hour Fitness filed for Chapter 11 bankruptcy in June 2020 and emerged from bankruptcy in December 2020.
Total Wine (34,950 SF, 11.3% of NRA, 10.6% of underwritten rent). Total Wine is an independent retailer of fine wine, founded in 1991. Total Wine operates 225 superstores across 27 states. Total Wine has been a tenant at the Bella Terra Property since 2017, has a lease expiration of January 31, 2028 and has three, five-year renewal options remaining.
Best Buy (30,108 SF, 9.7% of NRA, 5.8% of underwritten rent). Best Buy, founded in 1966, is a provider of technology products, services and solutions in the United States and Canada, offering products and services to customers visiting its stores, engaging with Geek Squad agents, or using its websites or mobile applications. Best Buy has more than 1,000 stores in the United States and Canada and approximately 100,000 employees. Best Buy has been a tenant at the Bella Terra Property since 2010, and has a lease expiration of January 31, 2025, with four, 5-year renewal options remaining.
Ross Dress for Less (27,692 SF, 9.0% of NRA, 5.0% of underwritten rent). Ross Dress for Less is a chain of off-price department stores that offers a selection of women’s and men’s apparel, accessories, footwear and furniture. Ross Dress for Less has more than 100,000 employees and 1,585 stores in 40 states, District of Columbia and Guam. Ross Dress for Less has been a tenant at the Bella Terra Property since 2010, has a lease expiration of January 31, 2025 and has three, five-year renewal options remaining.
PetSmart (20,151 SF, 6.5% of NRA, 5.1% of underwritten rent). PetSmart is a large pet specialty retailer providing products and services including grooming, dog training, PetsHotel and Everyday Adoption Centers. Based in Arizona, PetSmart has approximately 55,000 employees and approximately 1,650 pet stores in the United States, Canada and Puerto Rico. PetSmart has been a tenant at the Bella Terra Property since 2010, has a lease expiration of April 30, 2025 and has four, 5-year renewal options remaining.
The following table presents a summary regarding the major tenants at the Bella Terra Property:
| Tenant Summary(1) | |||||||||
| Tenant Name | Credit Rating (Fitch/Moody’s/ S&P)(2) | Tenant SF | Approx.% of SF | Annual UW Rent | Annual UW Rent PSF(3) | App. % of Total Annual UW Rent | Term. Option | Renewal Options | Lease Expiration |
| 24 Hour Fitness(4) | NR/NR/NR | 45,050 | 14.6% | $1,313,703 | $29.16 | 22.1% | N | 3 x 5 year | 12/31/2026 |
| Total Wine | NR/NR/NR | 34,950 | 11.3% | $629,100 | $18.00 | 10.6% | N | 3 x 5 year | 1/31/2028 |
| Best Buy | NR/A3/BBB+ | 30,108 | 9.7% | $345,437 | $11.47 | 5.8% | N | 4 x 5 year | 1/31/2025 |
| Ross Dress For Less | NR/A2/BBB+ | 27,692 | 9.0% | $297,689 | $10.75 | 5.0% | N | 3 x 5 year | 1/31/2025 |
| PetSmart | NR/B2/B | 20,151 | 6.5% | $303,000 | $15.04 | 5.1% | N | 4 x 5 year | 4/30/2025 |
| Subtotal/Wtd. Avg. | 157,951 | 51.1% | $2,888,929 | $18.29 | 48.6% | ||||
| Other Tenants | 114,520 | 37.0% | $3,059,163 | $26.71 | 51.4% | ||||
| Vacant Space | 36,783 | 11.9% | $0 | $0.00 | 0.0% | ||||
| Total/Wtd. Avg. | 309,254 | 100.0% | $5,948,092 | $21.83 | 100.0% | ||||
| (1) | Information is based on the underwritten rent roll as of September 17, 2021. |
| (2) | Certain ratings are those of the parent company whether or not the parent company guarantees the lease. |
| (3) | Total Wtd. Avg. Annual UW Rent PSF excludes vacant space. |
| (4) | 24 Hour Fitness filed for Chapter 11 bankruptcy in June 2020 and emerged from bankruptcy in December 2020. |
This is not a research report and was not prepared by any Underwriter’s research department. Please see additional important information and qualifications at the end of this Term Sheet. |
T-76
| Retail – Anchored | Loan #5 | Cut-off Date Balance: | $52,250,000 | |
| 5472 West Grand Parkway South | Bella Terra | Cut-off Date LTV: | 65.1% | |
| Richmond, TX 77406 | UW NCF DSCR: | 2.70x | ||
| UW NOI Debt Yield: | 10.3% |
The following table presents certain information relating to the lease rollover at the Bella Terra Property:
| Lease Rollover Schedule(1)(2) | ||||||||
| Year | # of Leases Rolling | SF Rolling | Annual UW Rent PSF Rolling(3) | Approx. % of Total SF Rolling | Approx. Cumulative % of SF Rolling | Total UW Rent Rolling | Approx. % of Total Rent Rolling | Approx. Cumulative % of Total Rent Rolling |
| MTM | 0 | 0 | $0.00 | 0.0% | 0.0% | $0 | 0.0% | 0.0% |
| 2021 | 0 | 0 | $0.00 | 0.0% | 0.0% | $0 | 0.0% | 0.0% |
| 2022 | 2 | 7,667 | $12.06 | 2.5% | 2.5% | $92,481 | 1.6% | 1.6% |
| 2023 | 14 | 45,276 | $25.86 | 14.6% | 17.1% | $1,170,615 | 19.7% | 21.2% |
| 2024 | 6 | 24,030 | $27.33 | 7.8% | 24.9% | $656,756 | 11.0% | 32.3% |
| 2025 | 6 | 87,137 | $13.97 | 28.2% | 53.1% | $1,217,278 | 20.5% | 52.7% |
| 2026 | 1 | 45,050 | $29.16 | 14.6% | 67.6% | $1,313,703 | 22.1% | 74.8% |
| 2027 | 1 | 1,839 | $35.72 | 0.6% | 68.2% | $65,689 | 1.1% | 75.9% |
| 2028 | 1 | 34,950 | $18.00 | 11.3% | 79.5% | $629,100 | 10.6% | 86.5% |
| 2029 | 4 | 16,122 | $28.58 | 5.2% | 84.7% | $460,837 | 7.7% | 94.3% |
| 2030 | 1 | 2,784 | $28.25 | 0.9% | 85.6% | $78,648 | 1.3% | 95.6% |
| 2031 | 1 | 4,621 | $35.61 | 1.5% | 87.1% | $164,536 | 2.8% | 98.3% |
| 2032 & Beyond | 1 | 2,995 | $32.87 | 1.0% | 88.1% | $98,450 | 1.7% | 100.0% |
| Vacant | 0 | 36,783 | $0.00 | 11.9% | 100.0% | $0 | 0.0% | 100.0% |
| Total/Wtd. Avg.(3) | 38 | 309,254 | $21.83 | 100.0% | $5,948,092 | 100.0% | ||
| (1) | Information is based on the underwritten rent roll as of September 17, 2021. |
| (2) | Certain tenants may have lease termination options that are exercisable prior to the stated expiration date of the subject lease or leases which are not considered in the lease rollover schedule. |
| (3) | Total Wtd. Avg. Annual UW Rent PSF Rolling excludes vacant space. |
COVID-19 Update. The first debt service payment for the Bella Terra Mortgage Loan is due January 1, 2022. As of November 12, 2021 the borrower has reported that the Bella Terra Property is open and operating. One tenant, Famous Footwear (1.9% of NRA), which is still in occupancy and open for business is paying 5% of its sales in lieu of base rent and pro rata share of expenses. Various tenants received rent abatements and deferrals due to the COVID-19 pandemic, of which Ross Dress for Less has $40,406 outstanding.
The Market. The Bella Terra Property is located in Richmond, Texas, in the Far Southwest Retail submarket within the Houston metropolitan statistical area (“MSA”). Primary access is provided by Highway 99, Grand Parkway and Westpark Tollway and major thoroughfares include Bellaire Boulevard, Katy-Gaston Road, Mason Road and Fry Road. According to the appraisal, as of the second quarter of 2021, the Far Southwest Retail submarket had approximately 12.7 million SF of retail space inventory, overall vacancy in the submarket was approximately 6.1% and asking rent was $24.65 PSF. According to the appraisal, as of the second quarter of 2021, the Houston MSA had approximately 414.0 million SF of retail space inventory, overall vacancy in the MSA was approximately 5.9% and asking rent was $18.93 PSF. According to the appraisal, the 2021 estimated population within a one-, three- and five-mile radius of the Bella Terra Property was 8,355, 93,859 and 222,001 respectively. The 2021 estimated average household income within a one-, three- and five-mile radius of the Bella Terra Property was $144,537, $152,486 and $152,869, respectively.
The following table presents recent leasing data for in line retail tenants at comparable retail properties with respect to the Bella Terra Property:
| Comparable In Line Retail Lease Summary | ||||||
| Subject/Location | Tenant Name | Size (SF) | Lease Size (SF) | Lease Date | Rent PSF | Lease Term (Mos.) |
Bella Terra (subject)(1) Richmond, TX | Mattress Firm | 309,254 | 4,703 | Mar. 2015 | $32.67 | 120 |
Shops at Harvest Green Richmond, TX | Burgerim | 14,333 | 1,770 | July 18 | $31.50 | 120 |
Shoppes at Cross Creek Katy, TX | Shipley Leasing | 16,533 | 1,788 | Feb. 20 | $35.00 | 120 |
Crossing at Katy Fulshear Katy, TX | Jersey Mikes | 187,545 | 1,440 | Feb. 19 | $35.00 | 60 |
Grand Crossing Katy, TX | Confidential | 10,072 | 2,600 | Aug. 19 | $38.00 | 120 |
Shops at Aliana Richmond, TX | BLVD Dentistry | 12,054 | 2,500 | Feb. 19 | $28.00 | 120 |
The Grand at Aliana Richmond, TX | Dr. Marieda DDS | 340,978 | 2,100 | July 21 | $35.00 | 120 |
Source: Appraisal, unless otherwise noted.
| (1) | Information is based on the underwritten rent roll as of September 17, 2021. |
This is not a research report and was not prepared by any Underwriter’s research department. Please see additional important information and qualifications at the end of this Term Sheet. |
T-77
| Retail – Anchored | Loan #5 | Cut-off Date Balance: | $52,250,000 | |
| 5472 West Grand Parkway South | Bella Terra | Cut-off Date LTV: | 65.1% | |
| Richmond, TX 77406 | UW NCF DSCR: | 2.70x | ||
| UW NOI Debt Yield: | 10.3% |
The following table presents recent leasing data for anchor retail tenants at comparable retail properties with respect to the Bella Terra Property:
| Comparable Anchor Retail Lease Summary | |||||
| Location | SF | Tenant Name | Lease Date | Rent PSF | Lease Type |
Bella Terra (subject)(1) | 30,108 | Best Buy | Feb. 2020 | $11.47 | NNN |
| Southwest | 35,396 | Burlington | Sept. 2020 | $10.50 | NNN |
| Southwest | 21,788 | Michaels | Dec. 2020 | $12.50 | NNN |
| Southwest | 21,988 | Ross Dress For Less | Dec. 2020 | $12.00 | NNN |
| Cypress | 22,000 | Ross Dress For Less | Oct. 2019 | $10.50 | NNN |
| West | 36,823 | O’Reilly | Jun. 2020 | $9.78 | NNN |
| Laredo | 25,680 | dd’s Discounts | May 2020 | $11.50 | NNN |
| Laredo | 45,000 | Ross Dress For Less | Jan. 2020 | $13.00 | NNN |
| South | 22,432 | Northern Tool | Sept. 2020 | $12.50 | NNN |
| Near Northwest | 22,000 | Ross Dress For Less | Jan. 2020 | $14.00 | NNN |
| Near Northwest | 21,500 | TJ Maxx | Jan. 2020 | $13.50 | NNN |
| Near Northwest | 22,062 | Michaels | Jan. 2020 | $14.00 | NNN |
| Near Northwest | 40,000 | Burlington | Jan. 2020 | $11.00 | NNN |
| West | 35,000 | PGA Tour Superstore | May 2018 | $12.00 | NNN |
| Arlington | 20,472 | Urban Air Adventure Park | Apr. 2018 | $18.00 | NNN |
| Southeast | 24,780 | Total Wine & More | Jan. 2017 | $17.69 | NNN |
| West | 37,500 | Glowzone | Feb. 2018 | $10.00 | NNN |
Source: Appraisal, unless otherwise noted.
| (1) | Information is based on the underwritten rent roll as of September 17, 2021. |
The following table presents certain information relating to the appraisal’s market rent conclusion for the Bella Terra Property:
| Market Rent Summary | ||||
| Market Rent PSF | Lease Term (Mos.) | Rent Escalations | Lease Type | |
| MLA $34 In Line Space: | $34.00 | 60 | None | NNN |
| MLA $30 In Line Low Visibility Space: | $30.00 | 60 | None | NNN |
| MLA $12 Anchor Space: | $12.00 | 120 | Mid Lease | NNN |
| MLA $18 Junior Anchor Space: | $18.00 | 120 | Mid Lease | NNN |
| MLA $25 Large In Line Space: | $25.00 | 60 | None | NNN |
| MLA $28 Health Club Space: | $28.00 | 120 | Mid Lease | NNN |
| MLA $35 Ground Lease Space: | $35.00 | 240 | Mid Lease | NNN |
| MLA $18 Anchor Space: | $12.00 | 120 | Mid Lease | NNN |
| MLA $22 Ground Lease Space: | $22.00 | 240 | Mid Lease | NNN |
| MLA $25 Medical Space: | $25.00 | 120 | None | NNN |
Source: Appraisal.
This is not a research report and was not prepared by any Underwriter’s research department. Please see additional important information and qualifications at the end of this Term Sheet. |
T-78
| Retail – Anchored | Loan #5 | Cut-off Date Balance: | $52,250,000 | |
| 5472 West Grand Parkway South | Bella Terra | Cut-off Date LTV: | 65.1% | |
| Richmond, TX 77406 | UW NCF DSCR: | 2.70x | ||
| UW NOI Debt Yield: | 10.3% |
Operating History and Underwritten Net Cash Flow. The following table presents certain information relating to the historical operating performance and the Underwritten Net Cash Flow at the Bella Terra Property:
| Cash Flow Analysis | |||||||
| 2017 | 2018 | 2019 | 2020 | 8/31/2021 TTM | UW | UW PSF | |
| Gross Potential Rent(1) | $6,229,614 | $6,554,253 | $6,730,139 | $6,697,279 | $6,486,175 | $6,919,645 | $22.38 |
| Reimbursements | $1,450,980 | $1,636,108 | $1,595,832 | $1,495,525 | $1,317,502 | $2,110,164 | $6.82 |
| Other Income(2) | $41,023 | $37,618 | $50,777 | $41,944 | $38,974 | $39,360 | $0.13 |
| Discounts Concessions | $0 | ($6,908) | ($12,589) | $3,894 | ($5,612) | $0 | $0.00 |
| Less Vacancy & Credit Loss | $0 | $0 | $0 | $0 | $0 | ($1,305,773) | ($4.22) |
| Effective Gross Income | $7,721,617 | $8,221,071 | $8,364,159 | $8,238,642 | $7,837,040 | $7,763,396 | $25.10 |
| Real Estate Taxes | $1,030,811 | $1,040,445 | $1,089,461 | $1,025,662 | $1,031,079 | $1,397,359 | $4.52 |
| Insurance | $35,016 | $34,528 | $37,536 | $43,767 | $48,747 | $63,397 | $0.20 |
| Other Expenses | $801,259 | $838,543 | $875,536 | $855,475 | $979,736 | $939,308 | $3.04 |
| Total Expenses | $1,867,086 | $1,913,517 | $2,002,533 | $1,924,903 | $2,059,562 | $2,400,064 | $7.76 |
| Net Operating Income | $5,854,531 | $6,307,554 | $6,361,626 | $6,313,739 | $5,777,477 | $5,363,332 | $17.34 |
| Capital Expenditures | $0 | $0 | $0 | $0 | $0 | $42,404 | $0.14 |
| TI/LC | $0 | $0 | $0 | $0 | $0 | $336,568 | $1.09 |
| Net Cash Flow | $5,854,531 | $6,307,554 | $6,361,626 | $6,313,739 | $5,777,477 | $4,984,360 | $16.12 |
| Occupancy % | 96.9% | 98.8% | 96.8% | 93.2% | 88.1%(3) | 86.0% | |
| NOI DSCR | 3.18x | 3.42x | 3.45x | 3.42x | 3.13x | 2.91x | |
| NCF DSCR | 3.18x | 3.42x | 3.45x | 3.42x | 3.13x | 2.70x | |
| NOI Debt Yield | 11.2% | 12.1% | 12.2% | 12.1% | 11.1% | 10.3% | |
| NCF Debt Yield | 11.2% | 12.1% | 12.2% | 12.1% | 11.1% | 9.5% | |
| (1) | The tenant Famous Footwear (1.9% of NRA), which is still in occupancy and open for business, is paying 5% of its sales in lieu of base rent and pro rata share of expenses. The tenant was underwritten based on annualized sales for the trailing three months ending 7/31/2021, which equals $849,416. |
| (2) | Other Income includes antenna income, late charges and NSF fees. |
| (3) | 8/31/2021 TTM Occupancy is based off the 9/17/2021 rent roll. |
Escrows and Reserves.
Taxes – The Bella Terra Mortgage Loan documents provide for ongoing monthly deposits into a reserve for real estate taxes in an amount equal to 1/12 of the real estate taxes (initially, approximately $88,375) that the lender estimates will be payable during the next twelve months.
Insurance – The Bella Terra Mortgage Loan documents provide for ongoing monthly deposits into a reserve for insurance premiums in an amount equal to 1/12 of the insurance premiums that the lender estimates will be payable for the renewal of coverage upon the expiration of the insurance policies; provided that such monthly deposits are not required so long as (i) no event of default is continuing, (ii) the liability and casualty insurance coverage for the Bella Terra Property is included in a blanket policy approved by the lender in its reasonable discretion, and (iii) the borrower provides the lender with evidence of payment of the insurance premiums and renewals of the insurance policies, no later than ten days prior to the expiration of the current policy.
Replacement Reserve – The Bella Terra Mortgage Loan documents provide for ongoing monthly deposits of approximately $3,866 into a reserve for approved capital expenditures, provided that such reserve fund may not exceed $92,784.
TI/LC Reserve – The Bella Terra Mortgage Loan documents provide for an upfront reserve of $500,000 and springing monthly deposits of $27,060 for tenant improvement and leasing commission costs incurred by the borrower, provided that such reserve fund may not exceed $500,000.
Lockbox and Cash Management. The Bella Terra Mortgage Loan is structured with a hard lockbox and in place cash management. The borrower is required to direct all tenants to deposit rents directly into a lender-controlled lockbox account, and to deposit any rents received by the borrower or the property manager into such account within one business day of receipt. On each business day, all funds in the lockbox account are required to be transferred to a lender-controlled cash management account. Provided no event of default under the Bella Terra Mortgage Loan documents is continuing, all funds in the cash management account are required to be applied on each monthly payment date: (i) to make the monthly deposits into the real estate tax and insurance reserves as described above under “Escrows and Reserves” (ii) to pay debt service on the Bella Terra Mortgage Loan, (iii) to make the monthly deposits into the replacement reserve and TI/LC reserve, if any, as described above under “Escrows and Reserves,” (iv) to pay operating expenses set forth in the annual budget (which is required to be reasonably approved by the lender) and lender-approved extraordinary expenses, and (v) to deposit any remainder into an excess cash flow reserve to be held as additional security for the Bella Terra Mortgage Loan during the continuance of such Cash Sweep Event Period. If no Cash Sweep Event Period is continuing, all funds in the excess cash flow reserve are required to be disbursed to the borrower.
“Cash Sweep Event Period” means a period:
| (i) | Commencing upon an event of default under the Bella Terra Mortgage Loan documents and ending upon the cure (if applicable) of such event of default; |
This is not a research report and was not prepared by any Underwriter’s research department. Please see additional important information and qualifications at the end of this Term Sheet. |
T-79
| Retail – Anchored | Loan #5 | Cut-off Date Balance: | $52,250,000 | |
| 5472 West Grand Parkway South | Bella Terra | Cut-off Date LTV: | 65.1% | |
| Richmond, TX 77406 | UW NCF DSCR: | 2.70x | ||
| UW NOI Debt Yield: | 10.3% |
| (ii) | Commencing upon the occurrence of a DSCR Event (as defined below), and ending upon a DSCR Cure (as defined below); or |
| (iii) | Commencing upon the occurrence of a Major Tenant Trigger Event (as defined below), and ending upon the occurrence of a Major Tenant Trigger Event Cure (as defined below). |
“DSCR Event” means the debt service coverage ratio on the Bella Terra Mortgage Loan (assuming a 30 year amortization schedule) is less than 1.20x at the end of any calendar quarter based upon the trailing 12 months’ operating statement and current in-place rent roll.
“DSCR Cure” means the debt service coverage ratio on the Bella Terra Mortgage Loan (assuming a 30 year amortization schedule) is at least 1.20x for the immediately preceding two calendar quarters based upon the trailing 12 months’ operating statement and current in-place rent roll.
“Major Tenant Trigger Event” means the period commencing on the earlier to occur of (i) a bankruptcy action of 24 Hour Fitness, (ii) the date on which 24 Hour Fitness “goes dark” or vacates its demised space at the Bella Terra Property or (iii) the earlier of (x) the date on which 24 Hour Fitness gives written notice that it will not be renewing its lease in accordance with its terms, and (y) the date that is six months prior to the date of 24 Hour Fitness’s lease expiration, unless such lease has been renewed or extended in accordance with such lease or on terms reasonably approved in writing by the lender.
“Major Tenant Trigger Event Cure” means the period ending on (i), in the case of clause (i) of the definition of Major Tenant Trigger Event, the assumption and affirmation of such assumption by any applicable bankruptcy court of 24 Hour Fitness’s lease, and 24 Hour Fitness being in occupancy of its full space and open for business, (ii), in the case of clause (ii) of the definition of Major Tenant Trigger Event, either (a) 24 Hour Fitness continuously occupies and operates its business at the Bella Terra Property for a period of no less than 60 consecutive days during normal business hours and is paying full rent as required under its lease or (b) the space demised to 24 Hour Fitness has been leased to one or more new tenants pursuant to leases entered into in accordance with the terms of the Bella Terra Loan documents and such new tenant is in occupancy, open for business and paying unabated base rent, and the borrower has provided the lender evidence reasonably acceptable to the lender of the same (a “Retenanting Cure”), or (iii), in the case of clause (iii) of the definition of Major Tenant Trigger Event, either (a) the date on which 24 Hour Fitness renews and/or extends its lease pursuant to the terms thereof or on terms reasonably approved in writing by the lender or (b) a Retenanting Cure occurs.
Partial Release. Not permitted.
Real Estate Substitution. Not permitted.
Subordinate and Mezzanine Debt. Not permitted.
Letter of Credit. None.
Right of First Offer / Right of First Refusal. Chick-Fil-A has a right of first refusal to purchase its demised premises at the Bella Terra Property in the event that the related borrower intends to sell such demised premises or receives an offer to purchase such demised premises separate and apart from a sale of the related shopping center. The related lease provides that such right will not apply in connection with a judicial or non-judicial foreclosure or deed-in-lieu. However, such right would be effective in connection with subsequent transfers of the Bella Terra Property.
Ground Lease. None.
Terrorism Insurance. The borrower is required to obtain and maintain an “all risk” property insurance policy that covers acts of terrorism in an amount equal to the “full replacement cost” of the Bella Terra Property together with business income insurance covering not less than the 18-month period commencing at the time of loss, together with an extended period of indemnity endorsement of up to 12 months. Notwithstanding the foregoing, for so long as the Terrorism Risk Insurance Act of 2002, as extended and modified by the Terrorism Risk Insurance Program Reauthorization Act of 2015 (“TRIPRA”) is in effect (including any extensions thereof or if another federal governmental program is in effect relating to “acts of terrorism” which provides substantially similar protections as TRIPRA), the lender is required to accept terrorism insurance which covers against “covered acts” as defined by TRIPRA (or such other program) as full compliance with the loan documents, but only in the event that TRIPRA (or such other program) continues to cover both domestic and foreign acts of terrorism. See “Risk Factors—Risks Relating to the Mortgage Loans—Terrorism Insurance May Not Be Available for All Mortgaged Properties” in the prospectus.
This is not a research report and was not prepared by any Underwriter’s research department. Please see additional important information and qualifications at the end of this Term Sheet. |
T-80
(THIS PAGE INTENTIONALLY LEFT BLANK)
T-81
| Self Storage – Self Storage | Loan #6 | Cut-off Date Balance: | $34,000,000 | |
| 321 Canal Boulevard | StorQuest - Richmond, CA | Cut-off Date LTV: | 60.4% | |
| Richmond, CA 94804 | UW NCF DSCR: | 2.20x | ||
| UW NOI Debt Yield: | 8.2% |
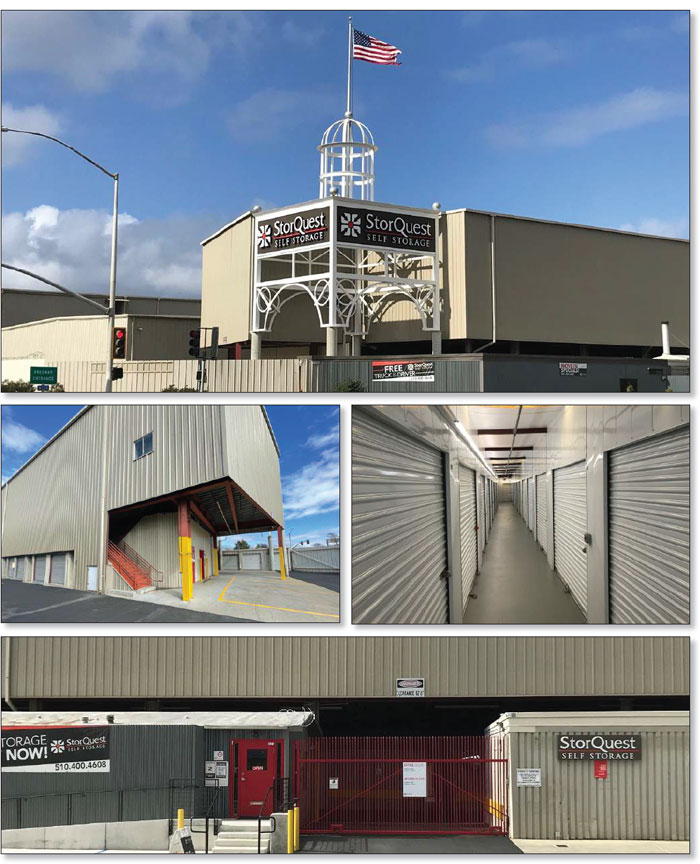
This is not a research report and was not prepared by any Underwriter’s research department. Please see additional important information and qualifications at the end of this Term Sheet. |
T-82
| Self Storage – Self Storage | Loan #6 | Cut-off Date Balance: | $34,000,000 | |
| 321 Canal Boulevard | StorQuest - Richmond, CA | Cut-off Date LTV: | 60.4% | |
| Richmond, CA 94804 | UW NCF DSCR: | 2.20x | ||
| UW NOI Debt Yield: | 8.2% |
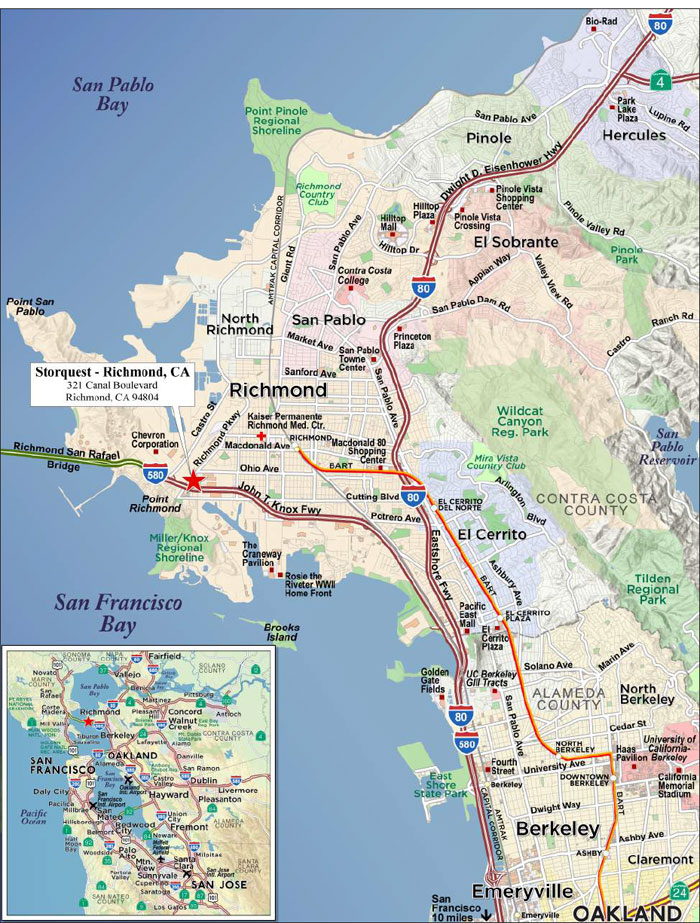
This is not a research report and was not prepared by any Underwriter’s research department. Please see additional important information and qualifications at the end of this Term Sheet. |
T-83
| Mortgage Loan No. 6 – StorQuest – Richmond, CA |
| Mortgage Loan Information | Mortgaged Property Information | ||||||
| Mortgage Loan Seller: | WFB | Single Asset/Portfolio: | Single Asset | ||||
| Credit Assessment (Fitch/KBRA/S&P): | NR/NR/NR | Location: | Richmond, CA | ||||
| Original Balance: | $34,000,000 | General Property Type: | Self Storage | ||||
| Cut-off Date Balance: | $34,000,000 | Detailed Property Type: | Self Storage | ||||
| % of Initial Pool Balance: | 4.7% | Title Vesting: | Fee | ||||
| Loan Purpose: | Refinance | Year Built/Renovated: | 1980, 1993, 1996, 2003/ NAP | ||||
| Borrower Sponsor: | Paul L. Butler | Size: | 143,409 SF | ||||
| Guarantor: | Paul L. Butler | Cut-off Date Balance per SF: | $237 | ||||
| Mortgage Rate: | 3.6660% | Maturity Date Balance per SF: | $237 | ||||
| Note Date: | 11/24/2021 | Property Manager: | William Warren Properties, Inc. | ||||
| First Payment Date: | 1/11/2022 | ||||||
| Maturity Date: | 12/11/2031 | Underwriting and Financial Information(2) | |||||
| Original Term to Maturity: | 120 months | UW NOI: | $2,795,840 | ||||
| Original Amortization Term: | 0 months | UW NOI Debt Yield: | 8.2% | ||||
| IO Period: | 120 months | UW NOI Debt Yield at Maturity: | 8.2% | ||||
| Seasoning: | 0 months | UW NCF DSCR: | 2.20x | ||||
| Prepayment Provisions: | L(24),D(92),O(4) | Most Recent NOI(3): | $2,924,736 (10/31/2021 TTM) | ||||
| Lockbox/Cash Mgmt Status: | Springing/Springing | 2nd Most Recent NOI(3): | $2,237,519 (12/31/2020) | ||||
| Additional Debt Type: | NAP | 3rd Most Recent NOI(3): | $1,755,213 (12/31/2019) | ||||
| Additional Debt Balance: | NAP | Most Recent Occupancy: | 93.9% (11/11/2021) | ||||
| Future Debt Permitted (Type): | No (NAP) | 2nd Most Recent Occupancy(4): | 89.4% (12/31/2020) | ||||
| Reserves(1) | 3rd Most Recent Occupancy(4): | 90.1% (12/31/2019) | |||||
| Type | Initial | Monthly | Cap | Appraised Value (as of): | $56,280,000 (10/13/2021) | ||
| RE Tax: | $32,550 | $10,850 | NAP | Appraised Value per SF: | $392 | ||
| Insurance: | $0 | Springing | NAP | Cut-off Date LTV Ratio: | 60.4% | ||
| Replacement Reserve: | $0 | $1,195 | $43,023 | Maturity Date LTV Ratio: | 60.4% | ||
| Sources and Uses | ||||||
| Sources | Proceeds | % of Total | Uses | Proceeds | % of Total | |
| Loan Amount: | $34,000,000 | 100.0% | Loan Payoff: | $24,794,587 | 72.9% | |
| Closing Costs: | $480,184 | 1.4% | ||||
| Reserves: | $32,550 | 0.1% | ||||
| Return of Equity: | $8,692,679 | 25.6% | ||||
| Total Sources: | $34,000,000 | 100.0% | Total Uses: | $34,000,000 | 100.0% | |
| (1) | See “Escrows and Reserves” section below. |
| (2) | The novel coronavirus pandemic is an evolving situation and could impact the StorQuest - Richmond, CA Mortgage Loan more severely than assumed in the underwriting of the StorQuest - Richmond, CA Mortgage Loan and could adversely affect the NOI, NCF and occupancy information, as well as the appraised value and the DSCR, LTV and Debt Yield metrics presented above and herein. See " Risk Factors—Risks Related to Market Conditions and Other External Factors—Coronavirus Pandemic Has Adversely Affected the Global Economy and Will Likely Adversely Affect the Performance of the Mortgage Loans" in the prospectus. |
| (3) | The increase in Net Operating Income from 2019 to 2020 was primarily due to a decrease in expenses (primarily management fee, payroll and marketing). The increase in Net Operating Income from 2020 to 10/31/2021 TTM was primarily due to (i) an increase in Effective Gross Income (driven by an increase in occupancy) and (ii) a decrease in expenses (primarily management fee, payroll and marketing). The borrower hired William Warren Properties, Inc. (dba StorQuest Self Storage) to manage the property beginning in February 2020. |
| (4) | Represents the average occupancy rate over the course of each year. |
The Mortgage Loan. The sixth largest mortgage loan (the “StorQuest - Richmond, CA Mortgage Loan”) is evidenced by a promissory note secured by a first mortgage encumbering the fee simple interest in an 1,828 unit self storage property located in Richmond, California (the “StorQuest - Richmond, CA Property”).
The Borrower and the Borrower Sponsor. The borrower is Richmond Associates, LTD, a California limited partnership and single purpose entity with one independent director. Legal counsel to the borrower delivered a non-consolidation opinion in connection with the origination of the StorQuest – Richmond, CA Mortgage Loan. The borrower sponsor and non-recourse carveout guarantor of the StorQuest - Richmond, CA Mortgage Loan is Paul L. Butler, who has over 40 years of commercial real estate experience. Mr. Butler purchased his first self storage property in 1980 and his current portfolio comprises the StorQuest – Richmond, CA Property, three industrial properties, and a residential rental property in California.
This is not a research report and was not prepared by any Underwriter’s research department. Please see additional important information and qualifications at the end of this Term Sheet. |
T-84
| Self Storage – Self Storage | Loan #6 | Cut-off Date Balance: | $34,000,000 | |
| 321 Canal Boulevard | StorQuest - Richmond, CA | Cut-off Date LTV: | 60.4% | |
| Richmond, CA 94804 | UW NCF DSCR: | 2.20x | ||
| UW NOI Debt Yield: | 8.2% |
The Property. The StorQuest - Richmond, CA Property comprises a 1,828 unit self storage facility totaling 143,409 SF of NRA located on a 3.0-acre site in Richmond, California. The StorQuest - Richmond, CA Property comprises 5, one to three-story buildings constructed between 1980 and 2003. The property is managed by William Warren Properties, Inc. and is operated under the StorQuest brand. Amenities include electronic gate access, video surveillance, exterior lighting, on-site management and 26.1% of the units are climate controlled. As of November 11, 2021, the StorQuest - Richmond, CA Property was 93.9% occupied and has averaged 90.4% occupancy since 2018.
COVID 19 Update. As of December 1, 2021 the StorQuest – Richmond, CA Property is open and operating. The first debt service payment is due in January 2022.
The Market. The StorQuest – Richmond, CA Property is located in Richmond, California, approximately 18.8 miles northeast of San Francisco. The property is located along Canal Boulevard (also known as Richmond Parkway) within one mile of Interstate 580 and within four miles of Interstate 80. Richmond is home to Port of Richmond, with the third largest annual volume of tonnage in California. The city’s largest employers include Chevron Refinery, West Contra Costa Unified School District, and Blue Apron Incorporated. According to the appraisal, the estimated 2020 population within a 1-, 3- and 5-mile radius of the property was approximately 9,806, 84,790 and 175,254, respectively; and the estimated 2020 average household income within the same radii was approximately $92,932, $80,529 and $96,075, respectively.
According to the appraisal, the StorQuest – Richmond, CA Property is located within the West Contra Costa submarket of the Oakland – East Bay market. According to a third party market research report, as of the second quarter of 2021, the submarket reported total inventory of 12,679 storage units with an average vacancy of 11.6%, which is down from 12.5% in 2020 and 13.0% in 2019. According to the appraisal, the supply ratio (rentable SF / population) within a 3-mile radius is 6.93, which is within the range of 6.0 to 7.0, indicating an above average market to build.
The following table presents certain information relating to certain self storage lease comparables provided in the appraisal for the StorQuest – Richmond, CA Property:
| Competitive Set | ||||||
| Property Name | Distance From Subject | Year Built | Total Units | Average Unit Size | 10x10 Average Rent (non-climate controlled) | Occupancy |
| StorQuest - Richmond, CA (subject) | NAP | 1980-2003 | 1,828 | 78 SF | $244 | 93.9% |
| Interstate Storage, Richmond, CA | 0.4 miles | 2007 | 575 | 178 SF | NAP | 100% |
| Point Richmond Self-Storage, Richmond, CA | 0.4 miles | 2007 | 626 | 127 SF | $375 | 98% |
| Bridge Self Storage, Richmond, CA | 0.5 miles | 2000 | 600 | 105 SF | $215 | 95% |
| Storage Pro of Richmond Self-Storage, Richmond CA | 0.5 miles | 1999 | 502 | 114 SF | $281 | 93% |
| Extra Space of Meeker Ave, Richmond, CA | 1.8 miles | 2000 | 692 | 110 SF | $366 | 94% |
| Public Storage, Richmond, CA | 2.2 miles | 1982 | 569 | 115 SF | $280 | 96% |
Source: Appraisal
The following table presents certain information relating to certain self storage sales comparables for the StorQuest – Richmond, CA Property:
| Comparable Property Sale Summary | ||||||||
| Property Name/Location | Sale Date | Year Built/ Renovated | Total NRA (SF) | Occupancy | Sale Price | Adjusted Sale Price(1) | Sale Price PSF | Appraiser’s Adjusted Sale Price PSF(1) |
| Lockaway Storage 220 W Ahwanee Avenue Sunnyvale, CA | Feb. 2021 | 1987/NAP | 44,782 | 85.0% | $18,000,000 | $17,420,198 | $402 | $389 |
| Morena Storage 908 Sherman Street San Diego, CA | Jul. 2020 | 1980/1999 | 95,489 | 90.0% | $34,000,000 | $37,145,221 | $356 | $389 |
| The Storage Place 6835 & 6836 Canby Avenue Reseda, CA | Jun. 2021 | 1974/NAP | 46,026 | 90.4% | $15,700,000 | $17,443,854 | $341 | $379 |
| Stoway Mini Storage 2172 Wyandotte Street Mountain View, CA | Apr. 2021 | 1980/NAP | 25,551 | 88.0% | $8,500,000 | $9,862,686 | $333 | $386 |
| Extra Space Storage 1145 Golden Gate Drive Napa, CA | Jan. 2020 | 2003/NAP | 143,466 | 95.0% | 40,500,000 | $55,234,410 | $282 | $385 |
| ExtraSpace 2391 Fenton Street Chula Vista, CA | Mar. 2020 | 1992/NAP | 68,471 | 90.0% | $27,500,000 | $27,456,871 | $402 | $401 |
Source: Appraisal
(1) Adjusted sale price was adjusted for location, size, age/condition, features/amenities and economic characteristics (as applicable).
This is not a research report and was not prepared by any Underwriter’s research department. Please see additional important information and qualifications at the end of this Term Sheet. |
T-85
| Self Storage – Self Storage | Loan #6 | Cut-off Date Balance: | $34,000,000 | |
| 321 Canal Boulevard | StorQuest - Richmond, CA | Cut-off Date LTV: | 60.4% | |
| Richmond, CA 94804 | UW NCF DSCR: | 2.20x | ||
| UW NOI Debt Yield: | 8.2% |
Operating History and Underwritten Net Cash Flow. The following table presents certain information relating to the historic operating performance and Underwritten Net Cash Flow at the StorQuest - Richmond, CA Property:
| Cash Flow Analysis | |||||||||||||
| 2018 | 2019 | 2020 | 10/31/2021 TTM | UW | UW PSF | ||||||||
| Gross Potential Rent | $2,928,579 | $3,354,759 | $3,703,325 | $4,085,229 | $4,380,300 | $30.54 | |||||||
| Other Income(1) | $252,171 | $250,182 | $192,968 | $197,372 | $197,372 | $1.38 | |||||||
| Less Vacancy | $0 | ($330,185) | ($386,985) | ($297,495) | ($301,332)(2) | ($2.10) | |||||||
| Less Concessions & Credit Loss | $0 | ($41,986) | ($228,608) | ($232,233) | ($209,880) | ($1.46) | |||||||
| Effective Gross Income | $3,180,750 | $3,232,769 | $3,280,700 | $3,752,873 | $4,066,460 | $28.36 | |||||||
| Real Estate Taxes | $112,400 | $115,076 | $117,158 | $100,218 | $508,145(3) | $3.54 | |||||||
| Insurance | $21,614 | $21,700 | $14,206 | $15,329 | $17,074 | $0.12 | |||||||
| Management Fee | $472,141 | $426,442 | $287,491 | $215,846 | $243,988 | $1.70 | |||||||
| Other Operating Expenses | $668,389 | $914,338 | $624,325 | $496,744 | $501,413 | $3.50 | |||||||
| Total Expenses | $1,274,544 | $1,477,556 | $1,043,180 | $828,138 | $1,270,620 | $8.86 | |||||||
| Net Operating Income | $1,906,206 | $1,755,213(4) | $2,237,519(4) | $2,924,736(4) | $2,795,840 | $19.50 | |||||||
| Capital Expenditures | $0 | $0 | $0 | $0 | $14,341 | $0.10 | |||||||
| TI/LC | $0 | $0 | $0 | $0 | $0 | $0.00 | |||||||
| Net Cash Flow | $1,906,206 | $1,755,213 | $2,237,519 | $2,924,736 | $2,781,499 | $19.40 | |||||||
| Occupancy %(5) | 89.1% | 90.1% | 89.4% | 93.2% | 93.9%(2) | ||||||||
| NOI DSCR | 1.51x | 1.39x | 1.77x | 2.31x | 2.21x | ||||||||
| NCF DSCR | 1.51x | 1.39x | 1.77x | 2.31x | 2.20x | ||||||||
| NOI Debt Yield | 5.6% | 5.2% | 6.6% | 8.6% | 8.2% | ||||||||
| NCF Debt Yield | 5.6% | 5.2% | 6.6% | 8.6% | 8.2% | ||||||||
| (1) | Other Income includes rental income from a cell tower lease and miscellaneous revenues such as administrative fees, late fees, merchandise sales, and minor miscellaneous income. |
| (2) | The underwritten economic vacancy is 6.9% which is based on the November 11, 2021 rent roll. The StorQuest - Richmond, CA Property were 93.9% physically occupied as of November 11, 2021. |
| (3) | Underwritten Real Estate Taxes are based on a Proposition 13 adjustment equal to the loan amount multiplied by the current tax rate plus special assessments. |
| (4) | The increase in Net Operating Income from 2019 to 2020 was primarily due to a decrease in expenses (primarily management fee, payroll and marketing). The increase in Net Operating Income from 2020 to 10/31/2021 TTM was primarily due to (i) an increase in Effective Gross Income (driven by an increase in occupancy) and (ii) a decrease in expenses (primarily management fee, payroll and marketing). The borrower hired William Warren Properties (dba StorQuest Self Storage) to manage the property beginning in February 2020. |
| (5) | Represents the average occupancy rate over the course of each year. |
Escrows and Reserves.
Real Estate Taxes – The loan documents require an upfront reserve of $32,550 for real estate taxes plus ongoing monthly reserves in an amount equal to 1/12 of the real estate taxes that the lender estimates will be payable during the next twelve months, initially $10,850.
Insurance – The loan documents do not require ongoing monthly escrows for insurance premiums as long as (i) no event of default or other Cash Trap Event Period is continuing, (ii) the StorQuest – Richmond, CA Property is covered under a blanket policy acceptable to the lender, and (iii) the borrower provides proof of renewal and receipts for the payment of insurance premiums no later than 10 business days prior to policy expiration.
Replacement Reserve – The loan documents require ongoing monthly replacement reserve deposits of $1,195 subject to a cap of $43,023, provided no event of default is continuing and the property is being properly maintained as reasonably determined by the lender.
Lockbox and Cash Management. Within 30 days from receipt of written notice from the lender that a Cash Trap Event Period (as defined below) has commenced, the borrower is required to establish a lender-controlled lockbox account and the borrower and property managers are required to deposit, and direct all credit card processing companies to deposit, all rents directly into the lockbox account. During a Cash Trap Event Period, funds in the lockbox accounts are required to be swept to a lender-controlled cash management account, and all excess funds are required to be swept to an excess cash flow subaccount controlled by the lender.
A “Cash Trap Event Period” will commence upon the earlier of the following:
| (i) | the occurrence and continuance of an event of default; or |
| (ii) | the hypothetical amortizing net cash flow debt service coverage ratio (based on a 30-year amortization schedule) falling below 1.10x (tested quarterly). |
A Cash Trap Event Period will end upon the occurrence of the following:
| ● | with regard to clause (i) above, the cure of such event of default |
| ● | with regard to clause (ii) above, the hypothetical amortizing net cash flow debt service coverage ratio (based on a 30-year amortization schedule) being at least 1.15, for two consecutive calendar quarters. |
This is not a research report and was not prepared by any Underwriter’s research department. Please see additional important information and qualifications at the end of this Term Sheet. |
T-86
| Self Storage – Self Storage | Loan #6 | Cut-off Date Balance: | $34,000,000 | |
| 321 Canal Boulevard | StorQuest - Richmond, CA | Cut-off Date LTV: | 60.4% | |
| Richmond, CA 94804 | UW NCF DSCR: | 2.20x | ||
| UW NOI Debt Yield: | 8.2% |
Additional Secured Indebtedness (not including trade debts). None.
Mezzanine Loan and Preferred Equity. None.
Release of Property. Not permitted.
Letter of Credit. None.
Right of First Offer/Right of First Refusal. None.
Ground Lease. None.
Terrorism Insurance. The loan documents require that the “all risk” insurance policy required to be maintained by the borrower provides coverage for terrorism in an amount equal to the full replacement cost of the StorQuest – Richmond, CA Property, as well as business interruption insurance covering no less than the 18-month period following the occurrence of a casualty event, together with a 6-month extended period of indemnity.
This is not a research report and was not prepared by any Underwriter’s research department. Please see additional important information and qualifications at the end of this Term Sheet. |
T-87
| Office – CBD | Loan #7 | Cut-off Date Balance: | $30,000,000 | |
| 153 Kearny Street | 153 Kearny Street | Cut-off Date LTV: | 52.0% | |
| San Francisco, CA 94108 | UW NCF DSCR: | 3.98x | ||
| UW NOI Debt Yield: | 12.6% |
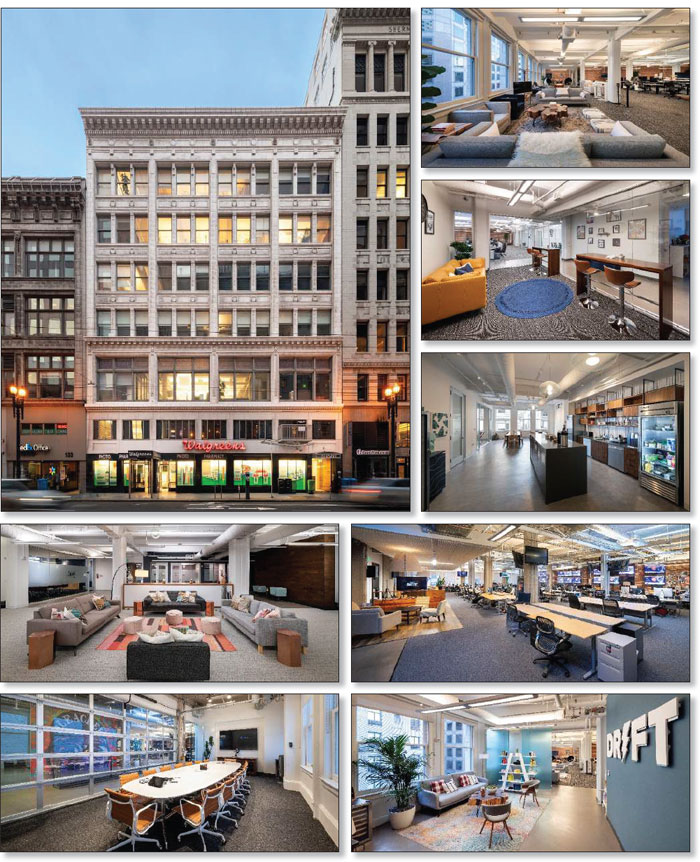
This is not a research report and was not prepared by any Underwriter’s research department. Please see additional important information and qualifications at the end of this Term Sheet. |
T-88
| Office – CBD | Loan #7 | Cut-off Date Balance: | $30,000,000 | |
| 153 Kearny Street | 153 Kearny Street | Cut-off Date LTV: | 52.0% | |
| San Francisco, CA 94108 | UW NCF DSCR: | 3.98x | ||
| UW NOI Debt Yield: | 12.6% |
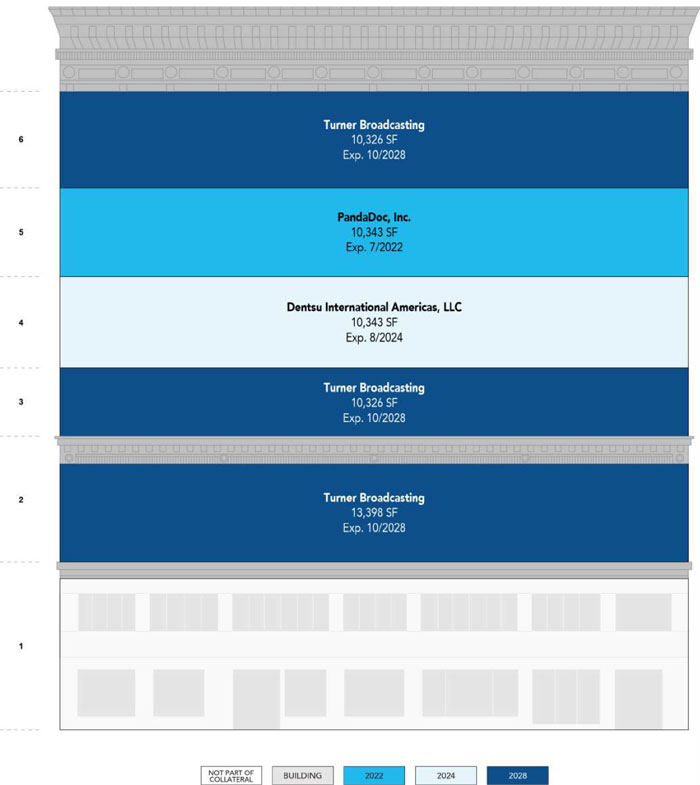
This is not a research report and was not prepared by any Underwriter’s research department. Please see additional important information and qualifications at the end of this Term Sheet. |
T-89
| Office – CBD | Loan #7 | Cut-off Date Balance: | $30,000,000 | |
| 153 Kearny Street | 153 Kearny Street | Cut-off Date LTV: | 52.0% | |
| San Francisco, CA 94108 | UW NCF DSCR: | 3.98x | ||
| UW NOI Debt Yield: | 12.6% |

This is not a research report and was not prepared by any Underwriter’s research department. Please see additional important information and qualifications at the end of this Term Sheet. |
T-90
| Mortgage Loan No. 7 – 153 Kearny Street |
| Mortgage Loan Information | Property Information | ||||||
| Mortgage Loan Seller: | MSMCH | Single Asset/Portfolio: | Single Asset | ||||
| Credit Assessment (Fitch/KBRA/S&P): | NR/NR/NR | Location: | San Francisco, CA 94108 | ||||
| Original Balance: | $30,000,000 | General Property Type: | Office | ||||
| Cut-off Date Balance: | $30,000,000 | Detailed Property Type: | CBD | ||||
| % of Initial Pool Balance: | 4.1% | Title Vesting: | Fee | ||||
| Loan Purpose: | Refinance | Year Built/Renovated: | 1909/2017 | ||||
| Borrower Sponsor: | Scott Haskins | Size: | 54,746 SF | ||||
| Guarantor: | Scott Haskins | Cut-off Date Balance Per SF: | $548 | ||||
| Mortgage Rate: | 2.8700% | Maturity Date Balance Per SF: | $548 | ||||
| Note Date: | 11/16/2021 | Property Manager: | Sierra Maestra Properties, Ltd. | ||||
| First Payment Date: | 1/1/2022 | (borrower-related) | |||||
| Maturity Date: | 12/1/2031 | ||||||
| Original Term to Maturity: | 120 months | Underwriting and Financial Information(2) | |||||
| Original Amortization Term: | 0 months | UW NOI: | $3,769,412 | ||||
| IO Period: | 120 months | UW NOI Debt Yield: | 12.6% | ||||
| Seasoning: | 0 months | UW NOI Debt Yield at Maturity: | 12.6% | ||||
| Prepayment Provisions: | L(24),D(89),O(7) | UW NCF DSCR: | 3.98x | ||||
| Lockbox/Cash Mgmt Status: | Hard/Springing | Most Recent NOI: | $3,717,920 (8/31/2021 TTM) | ||||
| Additional Debt Type: | No | 2nd Most Recent NOI: | $3,143,865 (12/31/2020) | ||||
| Additional Debt Balance: | NAP | 3rd Most Recent NOI: | $2,963,512 (12/31/2019) | ||||
| Future Debt Permitted (Type): | No (NAP) | Most Recent Occupancy: | 100.0% (9/30/2021) | ||||
| Reserves(1) | 2nd Most Recent Occupancy: | 100.0% (12/31/2020) | |||||
| Type | Initial | Monthly | Cap | 3rd Most Recent Occupancy: | 100.0% (12/31/2019) | ||
| RE Tax: | $20,373 | $6,791 | NAP | Appraised Value (as of): | $57,700,000 (9/7/2021) | ||
| Insurance: | $0 | Springing | NAP | Appraised Value Per SF: | $1,054 | ||
| Replacement Reserve | $0 | $912 | $10,949 | Cut-off Date LTV Ratio: | 52.0% | ||
| TI/LC Reserve | $750,000 | Springing | $750,000 | Maturity Date LTV Ratio: | 52.0% | ||
| Sources and Uses | ||||||
| Sources | Proceeds | % of Total | Uses | Proceeds | % of Total | |
| Loan Amount | $30,000,000 | 100.0% | Loan Payoff: | $9,273,611 | 30.9% | |
| Return of Equity: | $20,161,056 | 67.2% | ||||
| Closing Costs: | $544,960 | 1.8% | ||||
| Reserves: | $20,373 | 0.1% | ||||
| Total Sources: | $30,000,000 | 100.0% | Total Uses: | $30,000,000 | 100.0% | |
| (1) | See “Escrows and Reserves” below for further discussion of reserve requirements. |
| (2) | The novel coronavirus pandemic is an evolving situation and could impact the 153 Kearny Street Mortgage Loan more severely than assumed in the underwriting of the 153 Kearny Street Mortgage Loan and could adversely affect the NOI, NCF and occupancy information, as well as the appraised value and the DSCR, LTV and Debt Yield metrics presented above and herein. See “Risk Factors—Risks Related to Market Conditions and Other External Factors—The Coronavirus Pandemic Has Adversely Affected the Global Economy and Will Likely Adversely Affect the Performance of the Mortgage Loans” in the prospectus. |
The Mortgage Loan. The seventh largest mortgage loan (the “153 Kearny Street Mortgage Loan”) is evidenced by a promissory note in the original principal balance of $30,000,000. The 153 Kearny Street Mortgage Loan is secured by a first priority fee mortgage encumbering a 54,746 SF office property located in San Francisco, California (the “153 Kearny Street Property”).
The Borrower and the Borrower Sponsor. The borrower is MPC Kearny Capital, LLC, a California limited liability company and single purpose entity with one independent director in its organizational structure. The 0.5% managing member of the borrower is Moncada Associates, Inc., a Delaware corporation. The non-recourse carveout guarantor and the borrower sponsor is Scott Haskins. Scott Haskins is the president, founder and owner of Sierra Maestra Properties, a San Francisco based real estate development, investment, and management firm. Scott Haskins has over 30 years of commercial real estate experience including development, redevelopment, finance, leasing, asset management, and project management. Scott Haskins founded Sierra Maestra Properties in 1996 to own, manage, lease, and reposition properties. Sierra Maestra Properties currently owns interests in the 153 Kearny Property and in another 65,000 SF office property located approximately a mile from the 153 Kearny Property. Mr. Haskins and his spouse own the managing member of the borrower, and Mr. Haskins indirectly owns the remaining equity in the borrower.
The Property. The 153 Kearny Street Property is an office airspace parcel totaling 54,746 SF located in downtown San Francisco. The 153 Kearny Street Property is located within a 90,600 SF six-story building (the “153 Kearny Street Building”), of which the 153 Kearny Street Property comprises a portion thereof as described below. The 153 Kearny Street Building was built in 1909 on a 0.26-acre site and underwent renovations in 2017. Following the borrower sponsor’s purchase, renovations consisted of HVAC improvements on floors 3, 5, and 6, a lobby refurbishment, ADA bathroom upgrades, elevator modernization, façade upgrades and fire sprinkler/alarm/security upgrades. The 153 Kearny Street Property is 100.0% leased as of September 30, 2021 to three office tenants. The largest tenant at the 153 Kearny Street Property is Turner Broadcasting, comprising 62.2% of the net rentable area. No other tenant at the 153 Kearny Street Property occupies more than 18.9% of the net rentable area.
This is not a research report and was not prepared by any Underwriter’s research department. Please see additional important information and qualifications at the end of this Term Sheet. |
T-91
| Office – CBD | Loan #7 | Cut-off Date Balance: | $30,000,000 | |
| 153 Kearny Street | 153 Kearny Street | Cut-off Date LTV: | 52.0% | |
| San Francisco, CA 94108 | UW NCF DSCR: | 3.98x | ||
| UW NOI Debt Yield: | 12.6% |
In 2006, the 153 Kearny Street Building was subdivided into four airspace parcels (“Parcels”) governed by a declaration of covenants, conditions and restrictions (the “Declaration”), which provides for an Owner’s Association (the “Association”) comprised of the owners of such Parcels. The Association has retained a third party manager to perform certain obligations of the Association with respect to the 153 Kearny Street Building. The two ground floor spaces and basement at the 153 Kearny Street Building make up two ground floor retail parcels which consist of a 23,162 SF Parcel leased to Walgreens (including the basement and a small portion of the mezzanine) and a 3,781 SF Parcel leased to a 7-Eleven. Both retail Parcels are owned by a third party retail owner and are not part of the collateral. The third Parcel is the 153 Kearny Street Property which consists of the office space located on floors 2 through 6 and a portion of the mezzanine space. The fourth Parcel is the 1,079 SF lobby which is owned by the Association. The borrower has the right to make unilateral building maintenance decisions within the office Parcel, elevator, and lobby without the consent of the owners of the retail Parcels. The Association has a five member board, of which the owner of the office Parcel (i.e. the 153 Kearny Street Property) has the right to appoint three directors, and the owner of each retail Parcel has the right to appoint one director. Certain actions that affect the retail Parcels require the individual votes of the directors appointed by the retail Parcels. The Declaration allocates the following percentage interests in the Association to the Parcels: 66.72% to the office Parcel (the 153 Kearny Street Property), 27.88% to the owner of the 23,162 SF retail Parcel, 4.21% to the owner of the 3,781 SF retail Parcel and 1.19% to the owner of the lobby Parcel (i.e., the Association). Assessments against the Parcel owners by the Association are generally made in accordance with such percentage interests, except that the borrower, as owner of the office Parcel, is required to pay the expenses of the lobby Parcel.
Major Tenants.
Turner Broadcasting (34,060 SF, 62.2% of NRA, 65.7% of underwritten rent). The largest tenant is the Bleacher Report Division of Turner Broadcasting. Turner Broadcasting offers television broadcasting, cable television productions, program syndication and licensing, professional sports, and real estate operations. The Bleacher Report is a sports website founded in 2005, which moved its headquarters to the 153 Kearny Street Property in 2011 and was acquired by Turner Broadcasting in 2012. Bleacher extended its lease in April 2020 for an additional 8 years, expiring October 31, 2028, with one, six-year renewal option remaining.
Dentsu International Americas, LLC (10,343 SF, 18.9% of NRA, 17.4% of underwritten rent). Dentsu International Americas, LLC (“Dentsu”) is an international advertising and telecommunications company. Dentsu is currently subleasing its space at a premium to Swoop for the remainder of its lease term. The borrower’s consent to Dentsu’s sublease required that all subtenant rent collected in excess of tenant base rent be allocated 75% to the borrower and 25% to Dentsu. The borrower receives $7,788.36 per month which is 75% of net effective subtenant rent premium averaged over the sublease term. Dentsu’s base rent is underwritten at $73.03 PSF while Swoop’s net effective rent over the sublease term is $85.08 PSF. The lender has separately underwritten the borrower’s sublease profit as other income. The current lease expires August 31, 2024.
PandaDoc, Inc (10,343 SF, 18.9% of NRA, 16.9% of underwritten rent). PandaDoc, Inc. (“PandaDoc”) is a SaaS software company that works in the areas of electronic signatures, creating, tracking and executing digital documents as well as workplace productivity. It was formed in 2012 in Belarus and moved its corporate headquarters to the Silicon Valley in 2014. PandaDoc is currently subleasing its space at a premium to Drift.com for the remainder of its lease term. Pursuant to the terms of the PandaDoc lease, all subtenant rent collected in excess of base rent as set forth in the lease is to be allocated equally between the tenant and the landlord. The sublease profit currently being paid is $3,013.80 per month. PandaDoc’s base rent is underwritten at $70.91 PSF while Drift.com sublease rent is $80.63 PSF. The lender has separately underwritten the borrower’s sublease profit as other income. The current lease expires July 31, 2022.
The following table presents a summary regarding the major tenants at the 153 Kearny Street Property:
| Tenant Summary(1) | |||||||||
| Tenant Name | Credit Rating (Fitch/Moody’s/ S&P)(2) | Tenant SF | Approx.% of SF | Annual UW Rent | Annual UW Rent PSF | App. % of Total Annual UW Rent | Term. Option | Renewal Options | Lease Expiration |
| Turner Broadcasting | NR/NR/NR | 34,060 | 62.2% | $2,854,606 | $83.81 | 65.7% | N | 1 x 6 Yrs | 10/31/2028 |
| Dentsu International Americas, LLC(3) | NR/NR/NR | 10,343 | 18.9% | $755,392 | $73.03 | 17.4% | N | None | 8/31/2024 |
| PandaDoc, Inc (4) | NR/NR/NR | 10,343 | 18.9% | $733,392 | $70.91 | 16.9% | N | None | 7/31/2022 |
| Subtotal/Wtd. Avg. | 54,746 | 100.0% | $4,343,390 | $79.34 | 100.0% | ||||
| Other Tenant | 0 | 0.0% | $0 | $0.00 | 0.0% | ||||
| Vacant Space | 0 | 0.0% | $0 | $0.00 | 0.0% | ||||
| Total/Wtd. Avg. | 54,746 | 100.0% | $4,343,390 | $79.34 | 100.0% | ||||
| (1) | Information is based on the underwritten rent roll as of September 30, 2021. |
| (2) | Certain ratings are those of the parent company whether or not the parent company guarantees the lease. |
| (3) | Dentsu subleases all of its space to Swoop, as described above under “Major Tenants.” |
| (4) | PandaDoc subleases all of its space to Drift.com, as described above under “Major Tenants.” |
This is not a research report and was not prepared by any Underwriter’s research department. Please see additional important information and qualifications at the end of this Term Sheet. |
T-92
| Office – CBD | Loan #7 | Cut-off Date Balance: | $30,000,000 | |
| 153 Kearny Street | 153 Kearny Street | Cut-off Date LTV: | 52.0% | |
| San Francisco, CA 94108 | UW NCF DSCR: | 3.98x | ||
| UW NOI Debt Yield: | 12.6% |
The following table presents certain information relating to the lease rollover at the 153 Kearny Street Property:
| Lease Rollover Schedule(1)(2) | ||||||||
| Year | # of Leases Rolling | SF Rolling | Annual UW Rent PSF Rolling | Approx. % of Total SF Rolling | Approx. Cumulative % of SF Rolling | Total UW Rent Rolling | Approx. % of Total Rent Rolling | Approx. Cumulative % of Total Rent Rolling |
| 2021 | 0 | 0 | $0.00 | 0.0% | 0.0% | $0 | 0.0% | 0.0% |
| 2022 | 1 | 10,343 | $70.91 | 18.9% | 18.9% | $733,392 | 16.9% | 16.9% |
| 2023 | 0 | 0 | $0.00 | 0.0% | 18.9% | $0 | 0.0% | 16.9% |
| 2024 | 1 | 10,343 | $73.03 | 18.9% | 37.8% | $755,392 | 17.4% | 34.3% |
| 2025 | 0 | 0 | $0.00 | 0.0% | 37.8% | $0 | 0.0% | 34.3% |
| 2026 | 0 | 0 | $0.00 | 0.0% | 37.8% | $0 | 0.0% | 34.3% |
| 2027 | 0 | 0 | $0.00 | 0.0% | 37.8% | $0 | 0.0% | 34.3% |
| 2028 | 1 | 34,060 | $83.81 | 62.2% | 100.0% | $2,854,606 | 65.7% | 100.0% |
| 2029 | 0 | 0 | $0.00 | 0.0% | 100.0% | $0 | 0.0% | 100.0% |
| 2030 | 0 | 0 | $0.00 | 0.0% | 100.0% | $0 | 0.0% | 100.0% |
| 2031 | 0 | 0 | $0.00 | 0.0% | 100.0% | $0 | 0.0% | 100.0% |
| 2032 & Beyond | 0 | 0 | $0.00 | 0.0% | 100.0% | $0 | 0.0% | 100.0% |
| Vacant | 0 | 0 | $0.00 | 0.0% | 100.0% | $0 | 0.0% | 100.0% |
| Total/Wtd. Avg. | 3 | 54,746 | $79.34 | 100.0% | $4,343,390 | 100.0% | ||
| (1) | Information is based on the underwritten rent roll as of September 30, 2021. |
| (2) | Certain tenants may have lease termination options that are exercisable prior to the stated expiration date of the subject lease or leases which are not considered in the lease rollover schedule. |
COVID-19 Update. The first debt service payment for the 153 Kearny Street Mortgage Loan is due in January 2022. As of November 16, 2021 the borrower has reported that the 153 Kearny Street Property is open and operating, and all tenants have remained current on rent throughout the pandemic and none have received or requested any deferred or abated rent.
The Market. The 153 Kearny Street Property is located in San Francisco, California within the San Francisco office market and the North Financial District submarket. Downtown San Francisco is a hub for regional public transportation systems in the San Francisco Bay Area. BART runs along Market Street, bus lines serving Marin County are available within one block and freeway access is located approximately one-half mile south of the Financial District. CalTrain, which serves San Mateo and Santa Clara Counties, is also located in close proximity to the 153 Kearny Street Property. According to the appraisal, as of the trailing four quarters ended in the second quarter of 2021, the San Francisco office market had approximately 102.8 million SF of office space inventory, overall vacancy in the market was approximately 12.5% and asking rent was $64.66 PSF. According to the appraisal, as of the trailing four quarters ended in the second quarter of 2021, the North Financial District submarket had approximately 30.3 million SF of office space inventory, overall vacancy in the submarket was approximately 8.9% and average asking rent was $69.12 PSF. According to the appraisal, the 2021 population within a one-, three- and five-mile radius of the 153 Kearny Street Property was 137,138, 420,614 and 685,300, respectively, and the 2021 median household income within the same one-, three- and five-mile radius was $76,586, $125,930 and $126,878, respectively.
The following table presents certain information relating to the appraisal’s market rent conclusion for the 153 Kearny Street Property:
| Market Rent Summary | ||||
| Market Rent (PSF) | Lease Term (Months) | Lease Type (Reimbursements) | Escalations | |
| Office | $80.00 | 60 | Modified | 3.0% per year |
Source: Appraisal.
This is not a research report and was not prepared by any Underwriter’s research department. Please see additional important information and qualifications at the end of this Term Sheet. |
T-93
| Office – CBD | Loan #7 | Cut-off Date Balance: | $30,000,000 | |
| 153 Kearny Street | 153 Kearny Street | Cut-off Date LTV: | 52.0% | |
| San Francisco, CA 94108 | UW NCF DSCR: | 3.98x | ||
| UW NOI Debt Yield: | 12.6% |
The following table presents comparable office leases with respect to the 153 Kearny Street Property:
| Comparable Office Lease Summary | |||||||
| Property/Location | Total SF | Term (Months) | Size (SF) | Lease Date | Rent PSF | Lease Type | |
| 153 Kearny Street(1) 153 Kearny Street San Francisco, CA | 54,746 | Turner Broadcasting Dentsu PandaDoc | 96 86 61 | 34,060 10,343 10,343 | Nov. 2020 July 2017 July 2017 | $83.81 $73.03 $70.91 | MG MG MG |
| 710 Sansome Street San Francisco, CA | 24,500 | Engine No. 1, LP | 84 | 12,600 | April 2021 | $78.00 | MG |
| 300 Montgomery Street San Francisco, CA | 194,023 | Divvy Homes, Inc | 21 | 6,061 | Feb. 2021 | $73.00 | Full Service |
| 20 California Street San Francisco, CA | 59,472 | Etsy Inc | 25 | 15,753 | Nov. 2020 | $75.00 | MG |
| Harold Dollar Building 351 California Street San Francisco, CA | 138,303 | AlphaSights | 53 | 8,435 | Oct. 2020 | $80.00 | MG |
| 747 Front Street San Francisco, CA | 86,171 | IVP | 100 | 9,000 | Sept. 2020 | $87.00 | MG |
Source: Appraisal.
| (1) | Information is based on the underwritten rent roll as of September 30, 2021. |
Operating History and Underwritten Net Cash Flow. The following table presents certain information relating to the historical operating performance and the Underwritten Net Cash Flow at the 153 Kearny Street Property:
| Cash Flow Analysis | |||||||||||||||
| 2017 | 2018 | 2019 | 2020 | 8/31/2021 TTM | UW | UW per Unit | |||||||||
| Gross Potential Rent | $2,218,544 | $3,166,053 | $3,239,762 | $3,439,517 | $3,991,701 | $4,343,390 | $79.34 | ||||||||
| Other Income(1) | $0 | $0 | $43,958 | $129,626 | $129,626 | $143,727 | $2.63 | ||||||||
| Reimbursements(2) | $189,319 | $181,739 | $455,342 | $349,277 | $254,084 | $688,004 | $12.57 | ||||||||
| Vacancy & Credit Loss | $0 | $0 | $0 | $0 | $0 | ($251,570) | ($4.60) | ||||||||
| Effective Gross Income | $2,407,863 | $3,347,793 | $3,739,062 | $3,918,420 | $4,375,411 | $4,923,551 | $89.93 | ||||||||
| Real Estate Taxes | $68,395 | $76,380 | $174,867 | $81,453 | $98,229 | $370,407 | $6.77 | ||||||||
| Insurance | $21,202 | $22,601 | $23,197 | $25,539 | $30,618 | $44,375 | $0.81 | ||||||||
| Other Expenses | $375,497 | $537,804 | $577,486 | $667,563 | $528,644 | $739,357 | $13.51 | ||||||||
| Total Expenses | $465,093 | $636,785 | $775,550 | $774,555 | $657,491 | $1,154,139 | $21.08 | ||||||||
| Net Operating Income | $1,942,770 | $2,711,007 | $2,963,512 | $3,143,865 | $3,717,920 | $3,769,412 | $68.85 | ||||||||
| Capital Expenditures | $0 | $0 | $0 | $0 | $0 | $10,949 | $0.20 | ||||||||
| TI/LC | $0 | $0 | $0 | $0 | $0 | $280,849 | $5.13 | ||||||||
| Net Cash Flow | $1,942,770 | $2,711,007 | $2,963,512 | $3,143,865 | $3,717,920 | $3,477,614 | $63.52 | ||||||||
| Occupancy %(3) | 100.0% | 100.0% | 100.0% | 100.0% | 100.0% | 95.0% | |||||||||
| NOI DSCR | 2.23x | 3.11x | 3.39x | 3.60x | 4.26x | 4.32x | |||||||||
| NCF DSCR | 2.23x | 3.11x | 3.39x | 3.60x | 4.26x | 3.98x | |||||||||
| NOI Debt Yield | 6.5% | 9.0% | 9.9% | 10.5% | 12.4% | 12.6% | |||||||||
| NCF Debt Yield | 6.5% | 9.0% | 9.9% | 10.5% | 12.4% | 11.6% | |||||||||
| (1) | Other Income is comprised of sublease profits as described in the “Major Tenants” section. |
| (2) | Increases in Reimbursements from 8/31/2021 TTM to UW are due to high UW taxes and Turner Broadcasting now paying pro-rata shares of utilities. Effective November 1, 2020, Turner Broadcasting pays pro rata share of janitorial and utilities and pro rata share of taxes, insurance, R&M, management fee, and other common area costs over a 2020 base year. Previously, Turner Broadcasting paid all common area expenses over a 2017 base year. PandaDoc and Dentsu pay pro rata share of taxes, insurance, R&M, management fee, utilities, and other common area costs over a 2017 base year. |
| (3) | 8/31/2021 TTM Occupancy % is as of September 30, 2021. |
This is not a research report and was not prepared by any Underwriter’s research department. Please see additional important information and qualifications at the end of this Term Sheet. |
T-94
| Office – CBD | Loan #7 | Cut-off Date Balance: | $30,000,000 | |
| 153 Kearny Street | 153 Kearny Street | Cut-off Date LTV: | 52.0% | |
| San Francisco, CA 94108 | UW NCF DSCR: | 3.98x | ||
| UW NOI Debt Yield: | 12.6% |
Escrows and Reserves
Real Estate Taxes – The 153 Kearny Street Mortgage Loan documents provide for an upfront reserve of $20,373 for real estate taxes, and ongoing monthly deposits into a reserve for real estate taxes in an amount equal to 1/12 of the real estate taxes that the lender estimates will be payable during the next twelve months for the 153 Kearny Street Property (initially, $6,791).
Insurance – The 153 Kearny Street Mortgage Loan documents provide for ongoing monthly deposits into a reserve for insurance premiums in an amount equal to 1/12 of the insurance premiums that the lender estimates will be payable for the renewal of coverage upon the expiration of the insurance policies; provided that such monthly deposits are not required so long as either (i) a blanket insurance policy is in effect with respect to the policies required under the 153 Kearny Street Mortgage Loan documents or (ii) the insurance premiums are timely paid through the Association (or a combination of the foregoing clauses (i) and (ii)) and evidence of such timely payment is provided to the lender. The 153 Kearny Street Mortgage Loan documents contain an acknowledgement that insurance premiums for the 153 Kearny Street Property are paid by the Association.
Replacement Reserve – The 153 Kearny Street Mortgage Loan documents provide for ongoing monthly deposits of approximately $912 into a reserve for approved capital expenditures until such time as the amount on deposit in such reserve fund equals and maintains a balance of $10,949.
TI/LC Reserve – The 153 Kearny Street Mortgage Loan documents provide for an upfront reserve of $750,000 into a reserve for future tenant improvements and leasing commissions, and, in the event that the balance of such reserve falls below $750,000, ongoing monthly deposits of approximately $11,405, until such time that the amount in such reserve equals and maintains a balance of $750,000. The 153 Kearny Street Mortgage Loan documents permitted the borrower to provide a letter of credit in lieu of cash to fund the TI/LC Reserve, and the borrower did provide a letter of credit for the upfront reserve.
Lockbox and Cash Management The 153 Kearny Street Mortgage Loan is structured with a hard lockbox and springing cash management. The borrower is required to establish and maintain a lockbox account for the benefit of the lender, and within 10 days of the loan origination date, to direct all tenants to send all payments of rents at the 153 Kearny Street Property directly into the lockbox account, and to deposit any funds received by the borrower or property manager into the lockbox account within one business day of receipt. If no Cash Sweep Event Period (as defined below) exists, all funds in the lockbox account will be transferred to the borrower’s account. Upon the occurrence of a Cash Sweep Event Period, the borrower is required to establish a lender-controlled cash management account. During a Cash Sweep Event Period, all funds in the lockbox account are required to be swept to the cash management account, and, provided no event of default is continuing, applied on each monthly payment date: (i) to make the monthly deposits into the real estate tax reserve, if any, as described above under “Escrows and Reserves,” (ii) to pay the monthly dues owed under to the Association, as described above under “The Property”, (iii) to pay debt service on the 153 Kearny Street Mortgage Loan, (iv) to make the monthly deposit into the replacement reserve and the TI/LC reserve, if any as described above under “Escrows and Reserves,” (v) to pay operating expenses set forth in the lender-approved annual budget and lender-approved extraordinary expenses, and (vi) to deposit any remainder into an excess cash flow reserve to be held as additional security for the 153 Kearny Street Mortgage Loan during such Cash Sweep Event Period, provided that if no event of default is continuing, such excess cash flow reserve may be used to pay additional operating expenses approved by the lender in its reasonable discretion and tenant improvements, capital expenditures and leasing commissions owed by the borrower under leases approved or deemed approved by the lender pursuant to the loan documents.
“Cash Sweep Event Period” means a period:
| (i) | commencing upon an event of default under the 153 Kearny Street Mortgage Loan documents, and ending upon the cure, if applicable, of such event of default to the lender’s reasonable satisfaction; or |
| (ii) | commencing upon the debt service coverage ratio on the 153 Kearny Street Mortgage Loan (assuming a 30 year amortization schedule, and based on the trailing twelve months operating statement and current in-place rent roll) falling below 1.15x at the end of any calendar quarter, and ending on the date such debt service coverage ratio (assuming a 30 year amortization schedule, and based on the trailing twelve months operating statement and current in-place rent roll) equals or exceeds 1.25x for the immediately preceding calendar quarter; or |
| (iii) | commencing upon (A) a bankruptcy or insolvency proceeding is filed by or against a Major Tenant (as defined below) or (B) the “going dark” by a Major Tenant and ending upon (I) the applicable lease is affirmed in connection with any applicable bankruptcy event, (II) the applicable Major Tenant is open for business and in occupancy of all of its space, (III) the Major Tenant’s space is re-leased in full to one or more new tenants on terms and conditions acceptable to the lender in its reasonable discretion, and the new tenant(s), or in lender’s discretion, the borrower, delivers to the lender an estoppel certificate certifying that such new tenant(s) is in occupancy, open for business and paying full, unabated rent (a “Re-tenanting Cure”) or (IV) the borrower has deposited a total of $2,100,000 in cash into the TI/LC Reserve or provided a letter of credit in said amount in lieu thereof (a “Deposit Cure”); or |
| (iv) | commencing upon, for any Major Tenant, the date which is the earlier to occur of (A) the date Major Tenant gives notice to vacate or actually vacates and stops paying rent and (B) the date which is (1) if the debt yield is less than 7.5% as of the most recent quarterly calculation date, 18 months prior to the expiration date of the Major Tenant’s lease; or (2) if the debt yield is equal to or greater than 7.5% as of the most recent quarterly calculation date, 12 months prior to the expiration date of the Major Tenant’s lease and ending upon (x) the applicable Major Tenant has renewed or extended its lease on terms and conditions approved by the lender, (y) a Re-tenanting Cure occurs or (z) a Deposit Cure occurs. |
“Major Tenant” means: (i) Turner Broadcasting and (ii) any tenant that is a party to a Major Lease.
“Major Lease” means any lease which, individually or when aggregated with all other leases at the 153 Kearny Street Property with the same tenant or its affiliate, demises 26% or more of the 153 Kearny Street Property’s net rentable square footage, (ii) any lease which contains any option, offer, right of first refusal or other similar entitlement to acquire all or any portion of the 153 Kearny Street Property, (iii) any lease entered, or to be entered, into during the continuance of an event of default, (iv) any lease with an affiliate of the borrower, as tenant, or (v) any instrument guaranteeing or providing credit support for any lease meeting the requirements of clauses (i) through (iv) above.
Additional Secured Indebtedness (not including trade debts). None.
This is not a research report and was not prepared by any Underwriter’s research department. Please see additional important information and qualifications at the end of this Term Sheet. |
T-95
| Office – CBD | Loan #7 | Cut-off Date Balance: | $30,000,000 | |
| 153 Kearny Street | 153 Kearny Street | Cut-off Date LTV: | 52.0% | |
| San Francisco, CA 94108 | UW NCF DSCR: | 3.98x | ||
| UW NOI Debt Yield: | 12.6% |
Mezzanine Loan and Preferred Equity. Not permitted.
Release of Property. Not permitted.
Letter of Credit. A letter of credit was provided in lieu of cash for the TI/LC Reserve, as described above under “Escrows and Reserves.” In addition, in certain cases a letter of credit may be provided in lieu of cash to avoid triggering a Cash Sweep Event Period, as described above under “Lockbox and Cash Management”.
Right of First Offer/Right of First Refusal. None.
Ground Lease. None. The 153 Kearney Street Property constitutes an air space parcel as described under “The Property” above.
Terrorism Insurance. The borrower is required to obtain and maintain an “all risk” property insurance policy that covers perils of terrorism and acts of terrorism in an amount equal to the “full replacement cost” of the 153 Kearny Street Property together with 18 months of business income insurance. For so long as the Terrorism Risk Insurance Act of 2002, as amended and modified by the Terrorism Risk Insurance Program Reauthorization Act of 2015 (“TRIPRA”) (including any extensions thereof or if another federal governmental program is in effect relating to "acts of terrorism" which provides substantially similar protections) is in effect, the lender is required to accept terrorism insurance which covers against “covered acts” as defined by TRIPRA but only in the event that TRIPRA continues to cover both domestic and foreign acts of terrorism. See “Risk Factors—Risks Relating to the Mortgage Loans—Terrorism Insurance May Not Be Available for All Mortgaged Properties” in the prospectus.
This is not a research report and was not prepared by any Underwriter’s research department. Please see additional important information and qualifications at the end of this Term Sheet. |
T-96
(THIS PAGE INTENTIONALLY LEFT BLANK)
T-97
| Self Storage – Self Storage | Loan #8 | Cut-off Date Balance: | $25,000,000 | |
| 3400 US Highway 89, 3945 US-89 | Storage Stables Jackson | Cut-off Date LTV: | 66.5% | |
| and 670 Roice Lane | UW NCF DSCR: | 2.59x | ||
| Jackson, WY 83001 | UW NOI Debt Yield: | 8.7% |
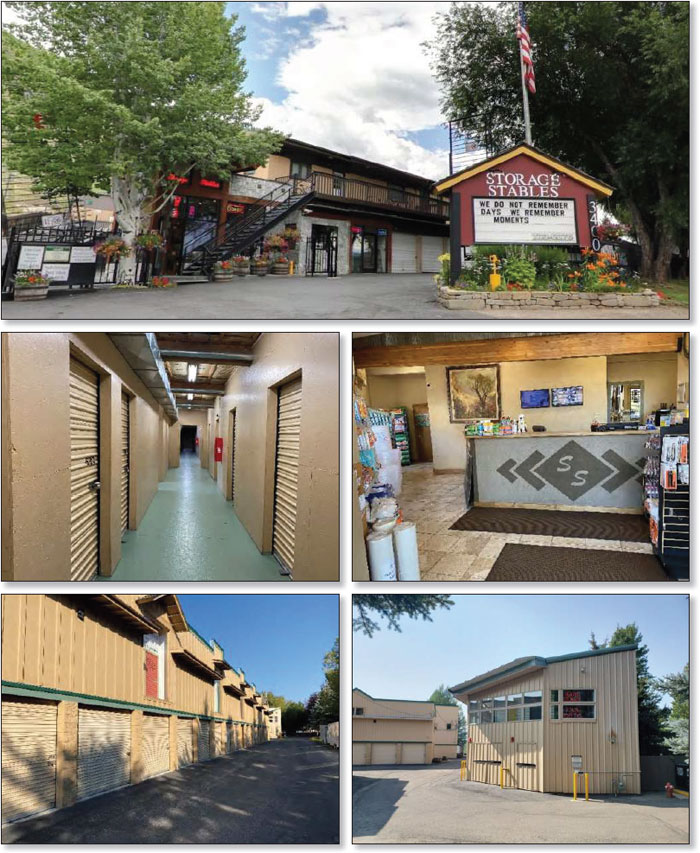
This is not a research report and was not prepared by any Underwriter’s research department. Please see additional important information and qualifications at the end of this Term Sheet. |
T-98
| Self Storage – Self Storage | Loan #8 | Cut-off Date Balance: | $25,000,000 | |
| 3400 US Highway 89, 3945 US-89 | Storage Stables Jackson | Cut-off Date LTV: | 66.5% | |
| and 670 Roice Lane | UW NCF DSCR: | 2.59x | ||
| Jackson, WY 83001 | UW NOI Debt Yield: | 8.7% |
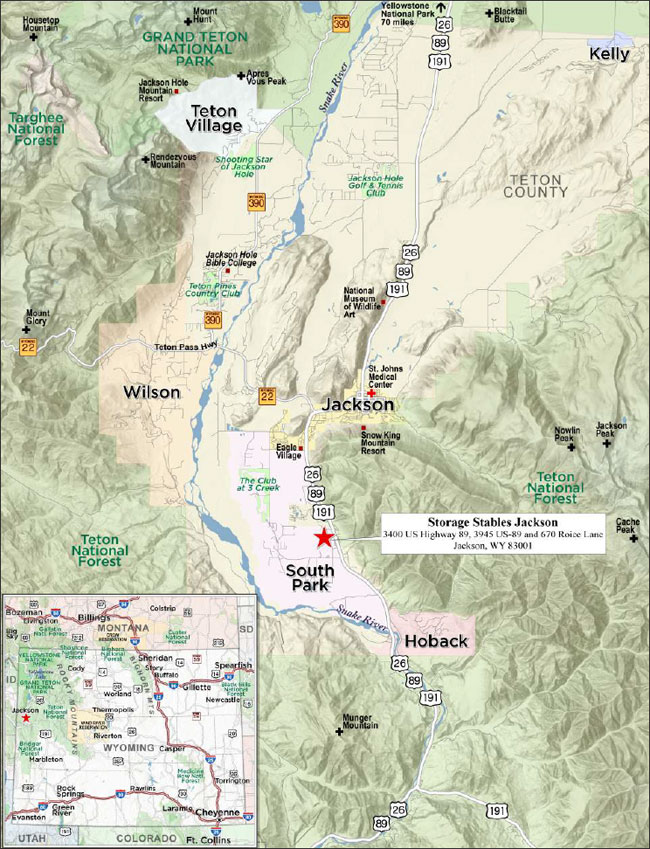
This is not a research report and was not prepared by any Underwriter’s research department. Please see additional important information and qualifications at the end of this Term Sheet. |
T-99
| Mortgage Loan No. 8 – Storage Stables Jackson |
| Mortgage Loan Information | Property Information | ||||||
| Mortgage Loan Seller: | MSMCH | Single Asset/Portfolio: | Single Asset | ||||
| Credit Assessment (Fitch/KBRA/S&P): | NR/NR/NR | Location: | Jackson, WY | ||||
| Original Balance: | $25,000,000 | General Property Type: | Self Storage | ||||
| Cut-off Date Balance: | $25,000,000 | Detailed Property Type: | Self Storage | ||||
| % of Initial Pool Balance: | 3.4% | Title Vesting: | Fee | ||||
| Loan Purpose: | Refinance | Year Built/Renovated: | Various(2)/ NAP | ||||
| Borrower Sponsor: | Barry Reese | Size: | 131,396 SF | ||||
| Guarantor: | Barry Reese | Cut-off Date Balance per SF: | $190 | ||||
| Mortgage Rate: | 3.2950% | Maturity Date Balance per SF: | $190 | ||||
| Note Date: | 11/23/2021 | Property Manager(3): | Tina Lyman and Corey Lyman | ||||
| First Payment Date: | 1/1/2022 | Lyman | |||||
| Maturity Date: | 12/1/2031 | ||||||
| Original Term to Maturity: | 120 months | ||||||
| Original Amortization Term: | 0 months | ||||||
| IO Period: | 120 months | ||||||
| Seasoning: | 0 months | Underwriting and Financial Information(4) | |||||
| Prepayment Provisions: | L(24),D(92),O(4) | UW NOI: | $2,180,355 | ||||
| Lockbox/Cash Mgmt Status: | Springing/Springing | UW NOI Debt Yield: | 8.7% | ||||
| Additional Debt Type: | No | UW NOI Debt Yield at Maturity: | 8.7% | ||||
| Additional Debt Balance: | NAP | UW NCF DSCR: | 2.59x | ||||
| Future Debt Permitted (Type): | No (NAP) | Most Recent NOI: | $2,482,072 (8/31/2021 TTM) | ||||
| Reserves(1) | 2nd Most Recent NOI: | $2,314,943 (12/31/2020) | |||||
| Type | Initial | Monthly | Cap | 3rd Most Recent NOI: | $2,208,087 (12/31/2019) | ||
| RE Tax: | $36,277 | $9,069 | NAP | Most Recent Occupancy: | 100.0% (9/20/2021) | ||
| Insurance: | $0 | Springing | NAP | 2nd Most Recent Occupancy: | 99.3% (12/31/2020) | ||
| Deferred Maintenance: | $73,563 | $0 | NAP | 3rd Most Recent Occupancy: | 97.6% (12/31/2019) | ||
| Recurring Replacements: | $0 | $1,491 | NAP | Appraised Value (as of): | $37,600,000 (9/27/2021) | ||
| Environmental Reserve: | $3,125 | $0 | NAP | Appraised Value per SF: | $286 | ||
| Cut-off Date LTV Ratio: | 66.5% | ||||||
| Maturity Date LTV Ratio: | 66.5% | ||||||
| Sources and Uses | ||||||
| Sources | Proceeds | % of Total | Uses | Proceeds | % of Total | |
| Mortgage Loan Amount: | $25,000,000 | 100.0% | Loan Payoff: | $15,039,483 | 60.2% | |
| Return of Equity: | $9,620,136 | 38.5% | ||||
| Closing Costs: | $227,415 | 0.9% | ||||
| Upfront Reserves: | $112,965 | 0.5% | ||||
| Total Sources: | $25,000,000 | 100.0% | Total Uses: | $25,000,000 | 100.0% | |
| (1) | See “Escrows and Reserves” below. |
| (2) | The Storage Stables Jackson Property (as defined below) was built in 1971, 1980, 1981, 1983, 1985, 1990, 1991, 1992, 1996, 1998, 2000 and 2007. |
| (3) | Tina Lyman and Corey Lyman are the prior owners of the Storage Stables Jackson Property. |
| (4) | The novel coronavirus pandemic is an evolving situation and could impact the Storage Stables Jackson Mortgage Loan (as defined below) more severely than assumed in the underwriting of the Storage Stables Jackson Mortgage Loan and could adversely affect the NOI, NCF and occupancy information, as well as the appraised value and the DSCR, LTV and Debt Yield metrics presented above and herein. See "Risk Factors—Risks Related to Market Conditions and Other External Factors—The Coronavirus Pandemic Has Adversely Affected the Global Economy and Will Likely Adversely Affect the Performance of the Mortgage Loans" in the prospectus. |
The Mortgage Loan. The eighth largest mortgage loan (the “Storage Stables Jackson Mortgage Loan”) is evidenced by a promissory note in the original principal balance of $25,000,000. The Storage Stables Jackson Mortgage Loan is secured by a first priority fee mortgage encumbering a 131,396 SF self storage property located in Jackson, Wyoming (the “Storage Stables Jackson Property”).
The Borrower and the Borrower Sponsor. The borrower is Monroe Partners Real Estate LLC, a Wyoming limited liability company structured to be bankruptcy-remote with one independent director. Monroe Partners Real Estate LLC is wholly owned by Monroe Partners, LLC, which is owned by Monroe Partners Headquarters, LLC. Ownership interest in Monroe Partners Headquarters, LLC is equally split by its three members including John Davidson (33.3%), Ryan Fowler (33.3%) and Barry Reese (33.3%). The borrower sponsor and nonrecourse carve-out guarantor is Barry Reese. Barry Reese has established three opportunity zone investment funds, and has interests in various real estate investments including commercial buildings primarily in Tennessee, as well as residential developments including multifamily and student housing projects. In addition, Mr. Reese holds ownership interest in approximately 3,000 acres of land for future development.
The Property. The Storage Stables Jackson Property is a self storage property comprised of nineteen, one to three story buildings, located across three non-contiguous separate sites (located within one mile of each other), totaling 131,396 SF located in Jackson, Wyoming. The Storage Stables Jackson
This is not a research report and was not prepared by any Underwriter’s research department. Please see additional important information and qualifications at the end of this Term Sheet. |
T-100
| Self Storage – Self Storage | Loan #8 | Cut-off Date Balance: | $25,000,000 | |
| 3400 US Highway 89, 3945 US-89 | Storage Stables Jackson | Cut-off Date LTV: | 66.5% | |
| and 670 Roice Lane | UW NCF DSCR: | 2.59x | ||
| Jackson, WY 83001 | UW NOI Debt Yield: | 8.7% |
property was built between 1971 and 2007 on a 6.9-acre site and is 100.0% occupied. The Storage Stables Jackson Property contains 7 locker units, 159 climate controlled units, 782 non-climate controlled units, all totaling 119,296 SF, 40 portable storage units, 3 apartment units, totaling 12,000 SF and 41 outdoor parking spaces. In-place monthly rents for the storage units range from $51 to $1,125 per unit. The Storage Stables Jackson Property storage units range in size from approximately 1 SF to 800 SF and the portable units are all 170 SF. The Storage Stables Jackson Property is managed by Tina and Corey Lyman, who were the previous owners of the Storage Stables Jackson Property. Primary access to the Storage Stables Jackson Property is provided by Highway 191 and Highway 22. The Storage Stables Jackson Property was acquired by the borrower for $27,500,000 in 2018.
The following table presents the unit mix with respect to the Storage Stables Jackson Property:
| Storage Stables Jackson Property Summary | |||||||
| Property Name | City, State | SF | Climate Controlled | Non-Climate Controlled | Locker Units | Portable Units | Apartment Units |
| Storage Stables Jackson | Jackson, Wyoming | 131,396 | 159 | 782 | 7 | 40 | 3 |
The following table presents historical occupancy for the Storage Stables Jackson Property:
| Historical Occupancy | ||||
| Property Name | 2018 Average Occupancy | 2019 Average Occupancy | 2020 Average Occupancy | 9/20/2021 Occupancy |
| Storage Stables Jackson | 98.1% | 97.6% | 99.3% | 100.0% |
Source: Borrower rent roll.
The Market. The Storage Stables Jackson Property is located in Jackson, Wyoming. Primary access to the Storage Stables Jackson Property is provided by Highway 191, which runs north/south through the Jackson area, and Highway 22, which runs east/west through the area and connects Jackson to the state of Idaho. Jackson, Wyoming is less than 25 miles from Yellowstone National Park and Grand Teton National Park and is proximate to three ski resorts – Jackson Hole Mountain Resort, Grand Targhee and Snow King. According to the appraisal, based on a 10-mile radius, the vacancy rate for self storage properties is less than 1% and there is inventory of approximately 235,549 SF. According to the appraisal, the 2021 population within a one-, three- and ten-mile radius of the Storage Stables Jackson Property was 1,560, 8,169 and 20,492, respectively. The 2021 median household income within the same one-, three- and ten-mile radius of the Storage Stables Jackson Property was $109,538, $87,796 and $88,934, respectively.
The following table presents comparable self storage properties with respect to the Storage Stables Jackson Property:
| Comparable Self Storage Property Summary | |||||||||||
| Property Name/Location | Built | Occupancy | Number of Units | 5x5 | 5x10 | 5x15 | 10x10 | 10x15 | 10x20 | 10x25 | 10x30 |
Storage Stables Jackson (subject) Jackson, WY | 1971-2007 | 100.0% | 991(1) | $90(2) | $191(3) | $144(2) | $197(2)(4) | $294(2) | $319(2)(4) | $454(3) | $425(2) |
Storage Stables II (Old West Storage) (5) Jackson, WY | 1969 | 99.0% | 295 | $90 | $135 | $170 | $225 | NAV | $320 | NAV | $425 |
South Side Self Storage Jackson, WY | 1979 | 100.0% | 137 | NAV | $105 | NAV | $130 | $180 | $225 | NAV | $295 |
Summit Self-Storage (7527 Lupine Lane) Victor, ID | 2005 | 97.0% | 245 | $67 | $89 | NAV | $137 | NAV | $207 | NAV | NAV |
Summit Self-Storage (535 Peak View Estates Road) Victor, ID | 2019 | 99.0% | 400 | $67 | $89 | NAV | $137 | NAV | $207 | NAV | NAV |
Storage in Victor Victor, ID | 2006 | 100.0% | 181 | NAV | NAV | NAV | $88 | NAV | $120 | NAV | $125 |
The Storehouse Alpine, WY | 1998 | 99.0% | 126 | NAV | NAV | NAV | $85 | NAV | $130 | $135 | $160 |
Source: Appraisal.
| (1) | This value excludes parking spots. |
| (2) | The Storage Stables 5x5, 5x15, 10x10, 10x15, 10x20 and 10x30 rates are for the non-climate controlled units. |
| (3) | The Storage Stables 5x10 and 10x25 rates are for the climate controlled units. |
| (4) | The weighted average was used for the Storage Stables 10x10 and 10x20 rates. |
| (5) | Storage Stables II (Old West Storage) is owned by Barry Reese, the borrower sponsor. |
COVID-19 Update. The first payment date for the Storage Stables Jackson Mortgage Loan is January 1, 2022. As of November 23, 2021, the Storage Stables Jackson Mortgage Loan is not subject to any forbearance, modification or debt service relief request, and generally tenants have remained current on rent throughout the pandemic and have not received or requested deferred or abated rent.
This is not a research report and was not prepared by any Underwriter’s research department. Please see additional important information and qualifications at the end of this Term Sheet. |
T-101
| Self Storage – Self Storage | Loan #8 | Cut-off Date Balance: | $25,000,000 | |
| 3400 US Highway 89, 3945 US-89 | Storage Stables Jackson | Cut-off Date LTV: | 66.5% | |
| and 670 Roice Lane | UW NCF DSCR: | 2.59x | ||
| Jackson, WY 83001 | UW NOI Debt Yield: | 8.7% |
Operating History and Underwritten Net Cash Flow. The following table presents certain information relating to the historical operating performance and Underwritten Net Cash Flow at the Storage Stables Jackson Property:
| Cash Flow Analysis | |||||
| 2019 | 2020 | 8/31/2021 TTM | UW | UW per SF | |
| Gross Potential Rent | $2,776,058 | $2,871,436 | $3,011,590 | $2,906,040 | $22.12 |
| Other Income(1) | $27,213 | $28,804 | $33,967 | $28,804 | $0.22 |
| Vacancy & Credit Loss | $0 | $0 | $0 | ($145,302) | ($1.11) |
| Effective Gross Income | $2,803,271 | $2,900,240 | $3,045,557 | $2,789,542 | $21.23 |
| Real Estate Taxes | $90,655 | $107,893 | $107,037 | $104,278 | $0.79 |
| Insurance | $41,759 | $49,968 | $42,548 | $49,968 | $0.38 |
| Other Expenses | $462,771 | $427,436 | $413,900 | $454,942 | $3.46 |
| Total Expenses | $595,184 | $585,297 | $563,485 | $609,188 | $4.64 |
| Net Operating Income | $2,208,087 | $2,314,943 | $2,482,072 | $2,180,355 | $16.59 |
| Capital Expenditures | $0 | $0 | $0 | $19,939 | $0.15 |
| TI/LC | $0 | $0 | $0 | $0 | $0.00 |
| Net Cash Flow | $2,208,087 | $2,314,943 | $2,482,072 | $2,160,415 | $16.44 |
| Occupancy %(2) | 97.6% | 99.3% | 100.0% | 95.0% | |
| NOI DSCR | 2.64x | 2.77x | 2.97x | 2.61x | |
| NCF DSCR | 2.64x | 2.77x | 2.97x | 2.59x | |
| NOI Debt Yield | 8.8% | 9.3% | 9.9% | 8.7% | |
| NCF Debt Yield | 8.8% | 9.3% | 9.9% | 8.6% | |
| (1) | Other Income is comprised of ancillary income. |
| (2) | The UW occupancy is the economic occupancy and physical occupancy is 100% as of 9/20/2021. |
Escrows and Reserves.
Real Estate Taxes –The Storage Stables Jackson Mortgage Loan documents provide for an upfront deposit of approximately $36,277 for real estate taxes, and for ongoing monthly deposits into a reserve for real estate taxes in an amount equal to 1/12 of the real estate taxes that the lender estimates will be payable during the next twelve months for the Storage Stables Jackson Property.
Insurance – The Storage Stables Jackson Mortgage Loan documents provide for ongoing monthly deposits into a reserve for insurance premiums in an amount equal to 1/12 of the insurance premiums that the lender estimates will be payable for the renewal of coverage upon the expiration of the insurance policies; provided that such monthly deposits are not required so long as (i) no event of default is continuing, (ii) the liability and casualty insurance coverage for the Storage Stables Jackson Property is included in a blanket policy approved by the lender in its reasonable discretion, and (iii) the borrower provides the lender with paid receipts for payment of the insurance premiums and provides evidence of renewals of the insurance policies, no later than ten days prior to the expiration of the current policy.
Deferred Maintenance – The Storage Stables Jackson Mortgage Loan documents provide for an upfront deposit of approximately $73,563 for repairs which are required to be completed within 270 days from the origination date, including repairs relating to flooring, pavement, elevators, fire systems inspections and ADA compliance.
Recurring Replacements – The Storage Stables Jackson Mortgage Loan documents provide for ongoing monthly deposits of $1,491 into a reserve for capital expenditures.
Lockbox and Cash Management. The Storage Stables Jackson Mortgage Loan is structured with a springing lockbox and springing cash management. Upon the first occurrence of a Cash Sweep Event Period (as defined below), the borrower is required to establish and maintain a lockbox account for the benefit of the lender, and the borrower and property manager are required to direct all commercial tenants (if any) to deposit rents, and to direct all credit card banks with respect to which the borrower has entered into agreements for the clearance of credit card receipts, to deposit credit card receipts (net of processing expenses) cleared by such banks, directly into the lockbox account. In addition, upon the first occurrence of a Cash Sweep Event Period the borrower and property manager are required to deposit all rents received by them directly into the lockbox account within two business days of receipt. Upon the first occurrence of a Cash Sweep Event Period, the lender is required to establish, and the borrower is required to cooperate with the cash management bank to establish, a lender-controlled cash management account, into which all funds in the lockbox account will be required to be deposited, so long as the Cash Sweep Event Period is continuing. During the continuance of a Cash Sweep Event Period, provided no event of default under the Storage Stables Jackson Mortgage Loan documents is continuing, all funds in the cash management account are required to be applied on each monthly payment date: (i) to make the monthly deposits into the real estate tax and insurance reserves as described above under “Escrows and Reserves,” (ii) to pay debt service on the Storage Stables Jackson Mortgage Loan, (iii) to make the monthly deposit into the recurring replacement reserve as described above under “Escrows and Reserves”, (iv) to pay operating expenses set forth in the lender-approved annual budget and lender-approved extraordinary expenses, and (v) to deposit any remainder into an excess cash flow reserve to be held as additional security for the Storage Stables Jackson Mortgage Loan during the continuance of such Cash Sweep Event Period. If no Cash Sweep Event Period is continuing, all funds in the excess cash flow reserve are required to be disbursed to the borrower.
This is not a research report and was not prepared by any Underwriter’s research department. Please see additional important information and qualifications at the end of this Term Sheet. |
T-102
| Self Storage – Self Storage | Loan #8 | Cut-off Date Balance: | $25,000,000 | |
| 3400 US Highway 89, 3945 US-89 | Storage Stables Jackson | Cut-off Date LTV: | 66.5% | |
| and 670 Roice Lane | UW NCF DSCR: | 2.59x | ||
| Jackson, WY 83001 | UW NOI Debt Yield: | 8.7% |
“Cash Sweep Event Period” means a period:
| (i) | commencing upon an event of default under the Storage Stables Jackson Mortgage Loan documents and ending upon the cure, if applicable, of such event of default; |
| (ii) | commencing upon any bankruptcy filing (whether voluntary or involuntary), or insolvency of the borrower, the non-recourse carveout guarantor or the property manager and ending upon, in the case of bankruptcy or insolvency of the property manager only, if the borrower replaces the property manager with a qualified manager acceptable to the lender under a replacement management agreement acceptable to the lender; and |
| (iii) | commencing upon the debt service coverage ratio of the Storage Stables Jackson Mortgage Loan (calculated assuming a 30-year amortization schedule) falling below 1.20x at the end of any calendar quarter and ending upon the date the debt service coverage ratio (calculated assuming a 30-year amortization schedule) is equal to or greater than 1.20x for the immediately preceding two consecutive calendar quarters. |
Additional Secured Indebtedness (not including trade debts). None.
Mezzanine Loan and Preferred Equity. Not permitted.
Release of Property. Not permitted.
Letter of Credit. None.
Right of First Offer / Right of First Refusal. None.
Ground Lease. None.
Terrorism Insurance. The borrower is required to obtain and maintain an “all risk” or “special form” property insurance policy that covers acts of terrorism in an amount equal to the “full replacement cost” of the Storage Stables Jackson Property, together with business income insurance covering the 18-month period commencing at the time of loss. Notwithstanding the foregoing, for so long as the Terrorism Risk Insurance Act of 2002, as extended and modified by the Terrorism Risk Insurance Program Reauthorization Act of 2015 (“TRIPRA”), is in effect (including any extensions thereof or if another federal governmental program is in effect relating to “acts of terrorism” which provides substantially similar protections as TRIPRA), the lender is required to accept terrorism insurance which covers against “covered acts” as defined by TRIPRA (or such other program) but only in the event that TRIPRA (or such other program) continues to cover both domestic and foreign acts of terrorism. See “Risk Factors—Risks Relating to the Mortgage Loans—Terrorism Insurance May Not Be Available for All Mortgaged Properties” in the prospectus.
This is not a research report and was not prepared by any Underwriter’s research department. Please see additional important information and qualifications at the end of this Term Sheet. |
T-103
| Multifamily – Garden | Loan #9 | Cut-off Date Balance: | $20,000,000 | |
| 1901 Snow Meadow Lane | Twin Ridge Apartments | Cut-off Date LTV: | 31.7% | |
| Baltimore, MD 21209 | UW NCF DSCR: | 5.35x | ||
| UW NOI Debt Yield: | 15.2% |
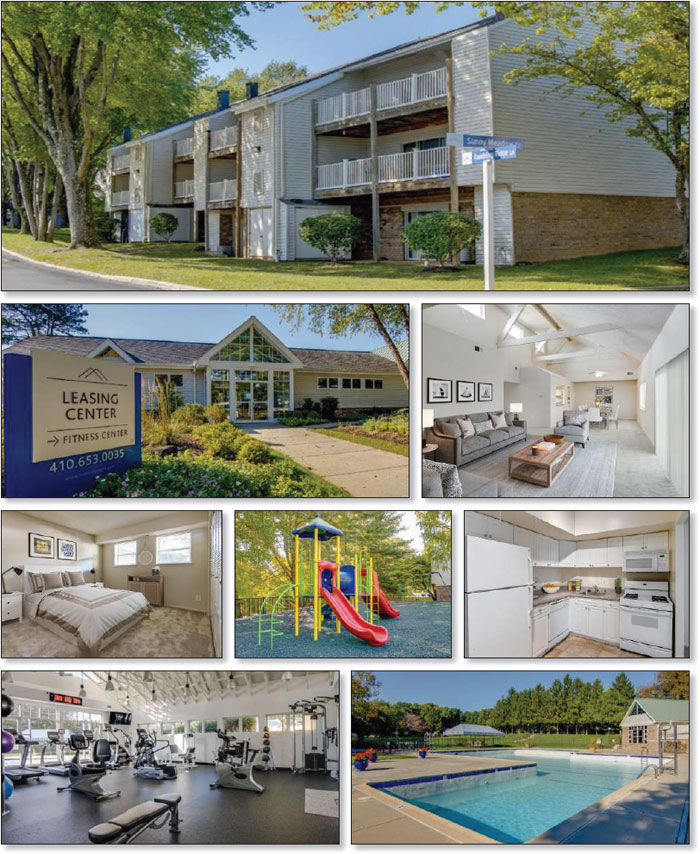
This is not a research report and was not prepared by any Underwriter’s research department. Please see additional important information and qualifications at the end of this Term Sheet. |
T-104
| Multifamily – Garden | Loan #9 | Cut-off Date Balance: | $20,000,000 | |
| 1901 Snow Meadow Lane | Twin Ridge Apartments | Cut-off Date LTV: | 31.7% | |
| Baltimore, MD 21209 | UW NCF DSCR: | 5.35x | ||
| UW NOI Debt Yield: | 15.2% |

This is not a research report and was not prepared by any Underwriter’s research department. Please see additional important information and qualifications at the end of this Term Sheet. |
T-105
| Mortgage Loan No. 9 – Twin Ridge Apartments |
| Mortgage Loan Information | Property Information | ||||||
| Mortgage Loan Seller: | MSMCH | Single Asset/Portfolio: | Single Asset | ||||
| Credit Assessment (Fitch/KBRA/S&P): | BBB-sf/AA+(sf)/NR | Location: | Baltimore, MD 21209 | ||||
| Original Balance: | $20,000,000 | General Property Type: | Multifamily | ||||
| Cut-off Date Balance: | $20,000,000 | Detailed Property Type: | Garden | ||||
| % of Initial Pool Balance: | 2.7% | Title Vesting: | Fee | ||||
| Loan Purpose: | Refinance | Year Built/Renovated: | 1972/2002; 2012 | ||||
| Borrower Sponsor: | Brian A. Goldman | Size: | 314 Units | ||||
| Guarantors: | Brian A. Goldman | Cut-off Date Balance per Unit: | $63,694 | ||||
| Mortgage Rate: | 2.7000% | Maturity Date Balance per Unit: | $63,694 | ||||
| Note Date: | 11/16/2021 | Property Manager: | WP&M Real Estate Group, LLC, | ||||
| First Payment Date: | 1/1/2022 | d/b/a WPM Real Estate | |||||
| Maturity Date: | 12/1/2031 | Management | |||||
| Original Term to Maturity: | 120 months | Underwriting and Financial Information(2) | |||||
| Original Amortization Term: | 0 months | UW NOI: | $3,031,501 | ||||
| IO Period: | 120 months | UW NOI Debt Yield: | 15.2% | ||||
| Seasoning: | 0 months | UW NOI Debt Yield at Maturity: | 15.2% | ||||
| Prepayment Provisions: | L(24),D(91),O(5) | UW NCF DSCR: | 5.35x | ||||
| Lockbox/Cash Mgmt Status: | Springing/Springing | Most Recent NOI: | $3,126,301 (8/31/2021 TTM) | ||||
| Additional Debt Type: | No | 2nd Most Recent NOI: | $2,993,164 (12/31/2020) | ||||
| Additional Debt Balance: | NAP | 3rd Most Recent NOI: | $2,970,179 (12/31/2019) | ||||
| Future Debt Permitted (Type): | No (NAP) | Most Recent Occupancy: | 98.4% (10/6/2021) | ||||
| 2nd Most Recent Occupancy: | 94.3% (12/31/2020) | ||||||
| Reserves(1) | 3rd Most Recent Occupancy: | 91.7% (12/31/2019) | |||||
| Type | Initial | Monthly | Cap | Appraised Value (as of): | $63,000,000 (9/23/2021) | ||
| RE Taxes: | $227,214 | $37,869 | NAP | Appraised Value per Unit: | $200,637 | ||
| Insurance: | $0 | Springing | NAP | Cut-off Date LTV Ratio: | 31.7% | ||
| Maturity Date LTV Ratio: | 31.7% | ||||||
| Sources and Uses | ||||||
| Sources | Proceeds | % of Total | Uses | Proceeds | % of Total | |
| Mortgage Loan Amount: | $20,000,000 | 100.0% | Loan Payoff: | $10,332,113 | 51.7% | |
| Return of Equity: | $9,223,344 | 46.1% | ||||
| Reserves: | $227,214 | 1.1% | ||||
| Closing Costs: | $217,329 | 1.1% | ||||
| Total Sources: | $20,000,000 | 100.0% | Total Uses: | $20,000,000 | 100.0% | |
| (1) | See “Escrows and Reserves” below. |
| (2) | The novel coronavirus pandemic is an evolving situation and could impact the Twin Ridge Apartments Mortgage Loan (as defined below) more severely than assumed in the underwriting of Twin Ridge Apartments Mortgage Loan and could adversely affect the NOI, NCF and occupancy information, as well as the appraised value and the DSCR, LTV and Debt Yield metrics presented above and herein. See "Risk Factors—Risks Related to Market Conditions and Other External Factors—The Coronavirus Pandemic Has Adversely Affected the Global Economy and Will Likely Adversely Affect the Performance of the Mortgage Loans" in the prospectus. |
The Mortgage Loan. The ninth largest mortgage loan (the “Twin Ridge Apartments Mortgage Loan”) is evidenced by a promissory note in the original principal amount of $20,000,000. The Twin Ridge Apartments Mortgage Loan is secured by a first priority fee mortgage encumbering a multifamily property located in Baltimore, Maryland (the “Twin Ridge Apartments Property”).
The Borrowers and the Borrower Sponsor. The borrowers are TR-I Limited Partnership and TR-II Limited Partnership, each a single-purpose Maryland limited partnership with two independent directors in its organizational structure. The borrowers acquired the Twin Ridge Apartments Property in two phases, with TR-I Limited Partnership acquiring 214 units in 1974 and TR-II Limited Partnership acquiring 100 units in 1977. The borrower sponsor and the non-recourse carveout guarantor is Brian A. Goldman. In addition to the Twin Ridge Apartments Property, Brian A. Goldman currently has ownership interest in two retail centers in Pikesville, Maryland.
The Property. The Twin Ridge Apartments Property is a 314-unit garden multifamily apartment complex totaling 377,071 SF with 43 apartment buildings including a clubhouse with a leasing center, situated on an approximately 16.08-acre site in Baltimore, Maryland. The Twin Ridge Apartments Property was built during 1972 and renovated in 2002 and 2012. The apartment unit mix is comprised of one-, two- and three-bedroom units ranging in size from 818 – 1,450 SF with an average of 1,201 SF. As of October 6, 2021, the Twin Ridge Apartments Property is currently 98.4% occupied at an average contract rent of $1,495 per unit per month. Building amenities include an outdoor pool, clubhouse, fitness center, tennis court, playground, dog park, and grilling area with seating. Unit amenities include in-unit washer/dryer, patio or balcony, refrigerator with ice maker, microwave, dishwasher, disposal, wood-burning fireplaces in some units, and vaulted cathedral ceilings in most top-level units. The Twin Ridge Apartments Property contains 473 parking spaces (1.51 spaces per unit).
The table below shows the residential apartment unit mix at the Twin Ridge Apartments Property:
This is not a research report and was not prepared by any Underwriter’s research department. Please see additional important information and qualifications at the end of this Term Sheet. |
T-106
| Multifamily – Garden | Loan #9 | Cut-off Date Balance: | $20,000,000 | |
| 1901 Snow Meadow Lane | Twin Ridge Apartments | Cut-off Date LTV: | 31.7% | |
| Baltimore, MD 21209 | UW NCF DSCR: | 5.35x | ||
| UW NOI Debt Yield: | 15.2% |
| Apartment Unit Mix | ||||||
| Unit Mix / Type | Total Units | Leased Units | % Leased | Average SF per Unit | Monthly Average Rent per Unit | Monthly Average Rent PSF |
| One Bedroom | 63 | 62 | 98.4% | 821 | $1,199 | $1.46 |
| Two Bedroom | 209 | 206 | 98.6% | 1,275 | $1,518 | $1.19 |
| Three Bedroom | 42 | 41 | 97.6% | 1,400 | $1,824 | $1.30 |
| Total/Average | 314 | 309 | 98.4% | 1,201 | $1,495 | $1.24 |
Source: Borrower rent roll dated October 6, 2021.
COVID-19 Update. The Twin Ridge Apartments Mortgage Loan’s first debt service payment is in January 2022. As of November 16, 2021, the borrower sponsor has reported that there have been no rent collection issues at the Twin Ridge Apartments Property.
The Market. The Twin Ridge Apartments Property is located in Baltimore, Maryland in the Pikesville/Randallstown/Owings Mills multifamily submarket in the Baltimore multifamily market. The Baltimore Beltway (I-695) provides primary access to the neighborhood. Access to the Twin Ridge Apartments Property from I-695 is provided by Greenspring Avenue or Falls Road to Old Pimlico Road. Public transportation is provided by MTA bus and Metrorail services. The nearest commuter bus stop is along Falls Road (MD 25), about three-quarters of a mile east of the Twin Ridge Apartments Property, and connects with the Falls Road Light Rail station, about 1.4 miles southeast of the Twin Ridge Apartments Property. Major employers include Black and Decker, Lafarge, Allied Bendix, AT&T Capital Corporation, VIPS Inc., and the Whiting Turner Construction Company. According to the appraisal, as of the second quarter of 2021, the vacancy rate in the Pikesville/Randallstown/Owings Mills multifamily submarket was approximately 3.2%, with average asking rents of $1,358 per unit and inventory of approximately 27,106 units. According to the appraisal, as of the second quarter of 2021, the vacancy rate in the Baltimore multifamily market was approximately 3.9%, with average asking rents of $1,307 per unit and inventory of approximately 166,566 units. According to the appraisal, the estimated 2021 population within a one-, three- and five-mile radius of the Twin Ridge Apartments Property was 10,096, 93,658 and 320,132, respectively. The estimated 2021 average household income within the same radii was $133,494, $127,823 and $105,328, respectively.
The following table presents certain information relating to comparable multifamily rental properties to the Twin Ridge Apartments Property:
| Comparable Rental Properties | ||||||
| Property | Year Built | # Units | Unit Mix | Average SF per Unit | Average Monthly Rent per Unit | Average Monthly Rent PSF |
Twin Ridge Apartments(1) Baltimore, MD (subject property) | 1972 | 314 | 1BR 2BR 3BR | 821 1,275 1,400 | $1,199 $1,518 $1,824 | $1.46 $1.19 $1.30 |
Elkridge Estates Baltimore, MD | 1964 | 286 | 1BR 2BR 3BR | 863 1,102 1,300 | $1,771 $2,167 $2,589 | $2.05 $1.97 $1.99 |
Ruxton Village Apartments Towson, MD | 1973 | 96 | 1BR 2BR 3BR | 998 1,312 1,537 | $1,506 $1,768 $2,025 | $1.51 $1.35 $1.32 |
The Brittany Apartments Pikesville, MD | 1968 | 210 | 1BR 2BR 3BR | 963 1,300 1,400 | $1,355 $1,641 $1,834 | $1.41 $1.26 $1.31 |
Volterra Apartments Pikesville, MD | 1989 | 208 | 1BR 2BR | 793 1,100 | $1,528 $1,795 | $1.93 $1.63 |
Source: Appraisal, unless otherwise indicated.
| (1) | Based on the borrower rent roll dated October 6, 2021. |
The following table presents certain information relating to the appraisal’s market rent conclusion for the Twin Ridge Apartments Property:
| Market Rent Summary | ||||||
| Building | Units(1) | Average Size (SF) (1) | Avg. Monthly Rent per Unit(1) | Avg. Monthly Rent PSF(1) | Avg. Monthly Market Rent per Unit(2) | Avg. Monthly Market Rent PSF(2) |
| One Bedroom | 63 | 821 | $1,199 | $1.46 | $1,363 | $1.66 |
| Two Bedroom | 209 | 1,275 | $1,518 | $1.19 | $1,641 | $1.31 |
| Three Bedroom | 42 | 1,400 | $1,824 | $1.30 | $2,070 | $1.55 |
| (1) | Based on the borrower rent roll dated October 6, 2021. |
| (2) | Based on the appraisal. |
This is not a research report and was not prepared by any Underwriter’s research department. Please see additional important information and qualifications at the end of this Term Sheet. |
T-107
| Multifamily – Garden | Loan #9 | Cut-off Date Balance: | $20,000,000 | |
| 1901 Snow Meadow Lane | Twin Ridge Apartments | Cut-off Date LTV: | 31.7% | |
| Baltimore, MD 21209 | UW NCF DSCR: | 5.35x | ||
| UW NOI Debt Yield: | 15.2% |
Operating History and Underwritten Net Cash Flow. The following table presents certain information relating to the historical operating performance and Underwritten Net Cash Flow at the Twin Ridge Apartments Property:
| Cash Flow Analysis(1) | ||||||
| 2018 | 2019 | 2020 | 8/31/2021 TTM | UW | UW per Unit | |
| Gross Potential Rent(1) | $5,380,000 | $5,473,489 | $5,576,337 | $5,624,157 | $5,644,152 | $17,975.01 |
| Other Income(2) | $148,698 | $97,836 | $105,559 | $118,060 | $118,060 | $375.99 |
| Discounts Concessions | ($78,378) | ($77,459) | ($115,631) | ($85,793) | ($84,662) | ($269.63) |
| Vacancy & Credit Loss | ($315,609) | ($297,315) | ($414,069) | ($294,538) | ($282,208) | ($898.75) |
| Effective Gross Income | $5,134,710 | $5,196,552 | $5,152,196 | $5,361,886 | $5,395,342 | $17,182.62 |
| Real Estate Taxes | $474,155 | $455,271 | $441,782 | $454,446 | $500,579 | $1,594.20 |
| Insurance | $135,996 | $109,959 | $133,171 | $163,871 | $164,850 | $525.00 |
| Other Expenses | $1,710,575 | $1,661,143 | $1,584,079 | $1,617,269 | $1,698,412 | $5,408.96 |
| Total Expenses | $2,320,726 | $2,226,373 | $2,159,033 | $2,235,585 | $2,363,841 | $7,528.16 |
| Net Operating Income | $2,813,984 | $2,970,179 | $2,993,164 | $3,126,301 | $3,031,501 | $9,654.46 |
| Capital Expenditures | $0 | $0 | $0 | $0 | $102,945 | $327.85 |
| TI/LC | $0 | $0 | $0 | $0 | $0 | $0.00 |
| Net Cash Flow | $2,813,984 | $2,970,179 | $2,993,164 | $3,126,301 | $2,928,556 | $9,326.61 |
| Occupancy %(1) | 92.0% | 91.7% | 94.3% | 98.4% | 95.0% | |
| NOI DSCR | 5.14x | 5.42x | 5.47x | 5.71x | 5.54x | |
| NCF DSCR | 5.14x | 5.42x | 5.47x | 5.71x | 5.35x | |
| NOI Debt Yield | 14.1% | 14.9% | 15.0% | 15.6% | 15.2% | |
| NCF Debt Yield | 14.1% | 14.9% | 15.0% | 15.6% | 14.6% | |
| (1) | UW Gross Potential Rent and 8/31/2021 TTM Occupancy % are based on the borrower rent roll dated October 6, 2021. |
| (2) | Other Income is comprised of application fees, late fees, check fees, pet fees, fitness center fees and cable income fees. |
Escrows and Reserves.
Real Estate Taxes –The Twin Ridge Apartments Mortgage Loan documents provide for an upfront deposit of approximately $227,214 for real estate taxes, and for ongoing monthly deposits into a reserve for real estate taxes in an amount equal to 1/12 of the real estate taxes that the lender estimates will be payable during the next twelve months for The Twin Ridge Apartments Property.
Insurance – The Twin Ridge Apartments Mortgage Loan documents provide for ongoing monthly deposits into a reserve for insurance premiums in an amount equal to 1/12 of the insurance premiums that the lender estimates will be payable for the renewal of coverage upon the expiration of the insurance policies; provided that such monthly deposits are not required so long as (i) no event of default is continuing, (ii) the liability and casualty insurance coverage for The Twin Ridge Apartments Property is included in a blanket policy approved by the lender in its reasonable discretion, and (iii) the borrowers provide the lender with paid receipts for payment of the insurance premiums and provide evidence of renewals of the insurance policies, no later than ten days prior to the expiration of the current policy.
Lockbox and Cash Management. The Twin Ridge Apartments Mortgage Loan is structured with a springing lockbox and springing cash management. Upon the first occurrence of a Cash Sweep Event Period (as defined below), the borrowers are required to establish and maintain a lockbox account for the benefit of the lender, and the borrowers and property manager are required to deposit all rents directly into the lockbox account within two business days of receipt. Upon the first occurrence of a Cash Sweep Event Period, the lender is required to establish, and the borrowers are required to cooperate with the cash management bank to establish, a lender-controlled cash management account, into which all funds in the lockbox account will be required to be deposited, so long as the Cash Sweep Event Period is continuing. During the continuance of a Cash Sweep Event Period, provided no event of default under The Twin Ridge Apartments Mortgage Loan documents is continuing, all funds in the cash management account are required to be applied on each monthly payment date: (i) to make the monthly deposits into the real estate tax and insurance reserves as described above under “Escrows and Reserves,” (ii) to pay debt service on The Twin Ridge Apartments Mortgage Loan, (iii) to pay operating expenses set forth in the lender-approved annual budget and lender-approved extraordinary expenses, and (iv) to deposit any remainder into an excess cash flow reserve to be held as additional security for The Twin Ridge Apartments Mortgage Loan during the continuance of such Cash Sweep Event Period. If no Cash Sweep Event Period is continuing, all funds in the excess cash flow subaccount are required to be disbursed to the borrowers.
“Cash Sweep Event Period” means a period:
| (iv) | commencing upon an event of default under The Twin Ridge Apartments Mortgage Loan documents and ending upon the cure, if applicable, of such event of default; and |
| (v) | commencing upon the debt service coverage ratio of The Twin Ridge Apartments Mortgage Loan (calculated assuming a 30-year amortization schedule) falling below 1.30x at the end of any calendar quarter and ending upon the date the debt service coverage ratio (calculated assuming a 30-year amortization schedule) is equal to or greater than 1.30x for the immediately preceding two consecutive calendar quarters. |
This is not a research report and was not prepared by any Underwriter’s research department. Please see additional important information and qualifications at the end of this Term Sheet. |
T-108
| Multifamily – Garden | Loan #9 | Cut-off Date Balance: | $20,000,000 | |
| 1901 Snow Meadow Lane | Twin Ridge Apartments | Cut-off Date LTV: | 31.7% | |
| Baltimore, MD 21209 | UW NCF DSCR: | 5.35x | ||
| UW NOI Debt Yield: | 15.2% |
Additional Secured Indebtedness (not including trade debts). None.
Mezzanine Loan and Preferred Equity. Not permitted.
Release of Property. Not permitted.
Letter of Credit. None.
Right of First Offer / Right of First Refusal. None.
Ground Lease. None.
Terrorism Insurance. The borrowers are required to obtain and maintain an “all risk” or “special form” property insurance policy that covers acts of terrorism in an amount equal to the lesser of (1) the “full replacement cost” of The Twin Ridge Apartments Property or $43,000,000 and (2) The Twin Ridge Mortgage Loan amount, together with business income insurance covering the 18-month period commencing at the time of loss. Notwithstanding the foregoing, for so long as the Terrorism Risk Insurance Act of 2002, as extended and modified by the Terrorism Risk Insurance Program Reauthorization Act of 2015 (“TRIPRA”), is in effect (including any extensions thereof or if another federal governmental program is in effect relating to “acts of terrorism” which provides substantially similar protections as TRIPRA), the lender is required to accept terrorism insurance which covers against “covered acts” as defined by TRIPRA (or such other program) but only in the event that TRIPRA (or such other program) continues to cover both domestic and foreign acts of terrorism. See “Risk Factors—Risks Relating to the Mortgage Loans—Terrorism Insurance May Not Be Available for All Mortgaged Properties” in the prospectus.
This is not a research report and was not prepared by any Underwriter’s research department. Please see additional important information and qualifications at the end of this Term Sheet. |
T-109
| Industrial-Various | Loan #10-11 | Cut-off Date Balance: | $18,000,000 | |
| Various | Norwood Business Park and Madison West Business | Cut-off Date LTV: | 54.7% | |
| Various, CA | Park Crossed Group | UW NCF DSCR: | 3.63x | |
| UW NOI Debt Yield: | 11.0% |
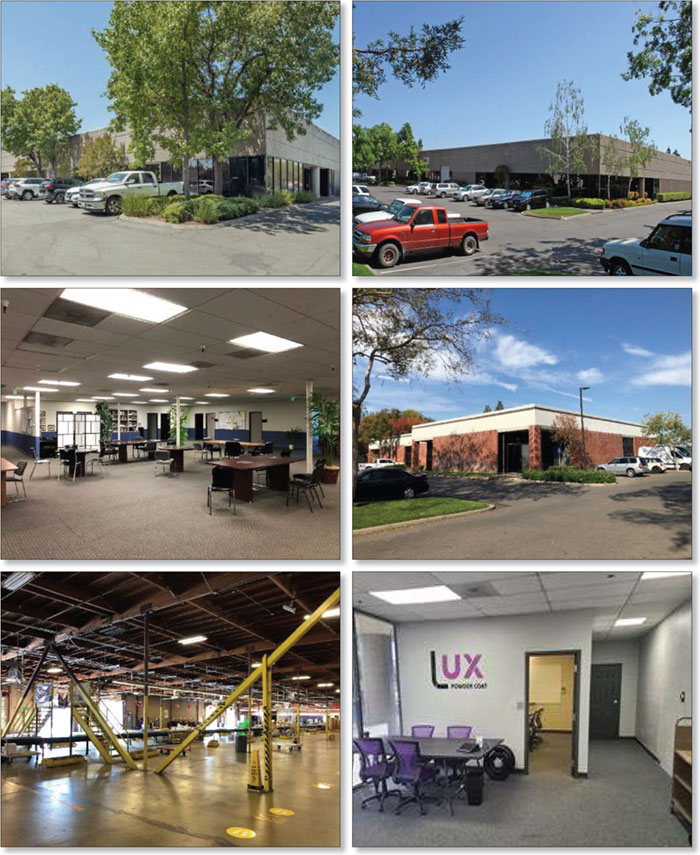
This is not a research report and was not prepared by any Underwriter’s research department. Please see additional important information and qualifications at the end of this Term Sheet. |
T-110
| Industrial-Various | Loan #10-11 | Cut-off Date Balance: | $18,000,000 | |
| Various | Norwood Business Park and Madison West Business | Cut-off Date LTV: | 54.7% | |
| Various, CA | Park Crossed Group | UW NCF DSCR: | 3.63x | |
| UW NOI Debt Yield: | 11.0% |
This is not a research report and was not prepared by any Underwriter’s research department. Please see additional important information and qualifications at the end of this Term Sheet. |
T-111
| Mortgage Loan No. 10-11 – Norwood Business Park and Madison West Business Park Crossed Group(1) |
| Mortgage Loan Information | Property Information | ||||||
| Mortgage Loan Seller: | WFB | Single Asset/Portfolio: | Portfolio | ||||
| Credit Assessment (Fitch/KBRA/S&P): | NR/NR/NR | Location(3): | Various, CA | ||||
| Original Balance: | $18,000,000 | General Property Type: | Industrial | ||||
| Cut-off Date Balance: | $18,000,000 | Detailed Property Type(3): | Various | ||||
| % of Initial Pool Balance: | 2.5% | Title Vesting: | Fee | ||||
| Loan Purpose: | Refinance | Year Built/Renovated(3): | Various/NAP | ||||
| Borrower Sponsor: | Steve Glusker and Edward S. Franklin | Size(3): | 315,321 SF | ||||
| Guarantor: | Steve Glusker and Edward S. Franklin | Cut-off Date Balance Per SF(3): | $57 | ||||
| Mortgage Rate: | 2.845% | Maturity Balance Per SF(3): | $57 | ||||
| Note Date: | 11/30/2021 | Property Manager: | Pacific Properties Group, Inc. | ||||
| First Payment Date: | 1/11/2022 | (borrower-related) | |||||
| Maturity Date: | 12/11/2031 | ||||||
| Original Term to Maturity: | 120 months | ||||||
| Original Amortization Term: | 0 months | Underwriting and Financial Information(4)(5) | |||||
| IO Period: | 120 months | UW NOI: | $1,986,275 | ||||
| Seasoning: | 0 months | UW NOI Debt Yield(1): | 11.0% | ||||
| Prepayment Provisions: | L(24),D(92),O(4) | UW NOI Debt Yield at Maturity(1): | 11.0% | ||||
| Lockbox/Cash Mgmt Status: | Springing/Springing | UW NCF DSCR(1): | 3.63x | ||||
| Additional Debt Type: | NAP | Most Recent NOI: | $1,839,623 (9/30/2021 TTM) | ||||
| Additional Debt Balance: | NAP | 2nd Most Recent NOI(6): | $1,687,567 (12/31/2020) | ||||
| Future Debt Permitted (Type): | No (NAP) | 3rd Most Recent NOI(6): | $1,437,498 (12/31/2019) | ||||
| Reserves(2) | Most Recent Occupancy: | 92.7% (11/23/2021) | |||||
| Type | Initial | Monthly | Cap | 2nd Most Recent Occupancy: | 91.0% (12/31/2020) | ||
| RE Taxes: | $55,864 | $15,722 | NAP | 3rd Most Recent Occupancy: | 90.5% (12/31/2019) | ||
| Insurance: | $0 | Springing | NAP | Appraised Value (as of) (3)(7): | $32,890,000 (Various) | ||
| Replacement Reserve: | $0 | $3,484 | $126,000 | Appraised Value Per SF(3): | $104 | ||
| TI/LC Reserve: | $100,000 | $9,197 | $350,000 | Cut-off Date LTV Ratio(1)(3): | 54.7% | ||
| Immediate Repairs: | $45,625 | $0 | NAP | Maturity Date LTV Ratio(1)(3): | 54.7% | ||
| Sources and Uses | ||||||
| Sources | Proceeds | % of Total | Uses | Proceeds | % of Total | |
| Norwood Business Park Mortgage Loan: | $9,250,000 | 51.4% | Loan Payoff: | $8,560,605 | 47.6% | |
| Madison West Business Park Mortgage Loan: | $8,750,000 | 48.6% | Reserves: | $201,489 | 1.1% | |
| Closing Costs: | $193,014 | 1.1% | ||||
| Return of Equity: | $9,044,892 | 50.2% | ||||
| Total Sources: | $18,000,000 | 100.0% | Total Uses: | $18,000,000 | 100.0% | |
| (1) | The Norwood and Madison Business Park Crossed Mortgage Loans (as defined below) are cross-collateralized and cross-defaulted with one another. All information herein presents the Norwood and Madison Business Park Crossed Mortgage Loans as one mortgage loan, except as otherwise specified. With respect to each of the individual Norwood and Madison Business Park Crossed Mortgage Loans, the applicable loan-to-value ratios, debt service coverage ratios and debt yields are based upon the indebtedness evidenced by both mortgage loans. On an individual basis, without regard to the cross-collateralization feature, a related mortgage loan may have a higher loan-to-value ratio, lower debt service coverage ratio and/or lower debt yield than is presented in the table above. |
| (2) | See “Escrows and Reserves” section below. |
| (3) | See “The Properties” section below for property-level information. |
| (4) | The underwriting and financial information shown represents the Norwood and Madison Business Park Crossed Mortgage Loans in aggregate. |
| (5) | The novel coronavirus pandemic is an evolving situation and could impact the Norwood and Madison Business Park Crossed Mortgage Loans more severely than assumed in the underwriting of the Norwood and Madison Business Park Crossed Mortgage Loans and could adversely affect the NOI, NCF and occupancy information, as well as the appraised value and the DSCR, LTV and Debt Yield metrics presented above. See “Risk Factors—Risks Related to Market Conditions and Other External Factors—The Coronavirus Pandemic Has Adversely Affected the Global Economy and Will Likely Adversely Affect the Performance of the Mortgage Loans” in the prospectus. |
| (6) | See “Operating History and Underwritten Cash Flow” section below for information regarding the increase in NOI from 2019 to 2020. |
| (7) | Represents the as-is appraised values as of September 27, 2021 for the Norwood Business Park Property (as defined below) and October 7, 2021 for the Madison West Business Park Property (as defined below) |
The Mortgage Loan. The mortgage loans (individually, the “Norwood Business Park Mortgage Loan” and the “Madison West Business Park Mortgage Loan; and collectively, the “Norwood and Madison Business Park Crossed Mortgage Loans”) are cross-collateralized and cross-defaulted with one another. The Norwood Business Park Mortgage Loan is evidenced by a single promissory note secured by a first mortgage encumbering the fee interest in a 168,232 SF industrial property located in Sacramento, California (the “Norwood Business Park Property”). The Madison West Business Park Mortgage Loan is evidenced by a single promissory note secured by a first mortgage encumbering the fee interest in a 147,089 SF industrial property located in North Highlands, California (the “Madison West Business Park Property”).
This is not a research report and was not prepared by any Underwriter’s research department. Please see additional important information and qualifications at the end of this Term Sheet. |
T-112
| Industrial-Various | Loan #10-11 | Cut-off Date Balance: | $18,000,000 | |
| Various | Norwood Business Park and Madison West Business | Cut-off Date LTV: | 54.7% | |
| Various, CA | Park Crossed Group | UW NCF DSCR: | 3.63x | |
| UW NOI Debt Yield: | 11.0% |
The Borrowers and the Borrower Sponsor. The borrowers are comprised of two entities, SACNOR, LLC and SACMAD, LLC, each a California limited liability company and single purpose entity. The non-recourse carve-out guarantors and borrower sponsors of the Norwood and Madison Business Park Crossed Mortgage Loans are Steve Glusker and Edward S. Franklin.
In 1990, Steve Glusker and Edward S. Franklin formed Pacific Properties Group, a private real estate firm headquartered in Los Angeles. Their current real estate portfolio includes 31 properties, including 23 retail properties, 7 industrial properties, and 1 office property, totaling 2.4 million SF.
The Properties. The Norwood Business Park Property and the Madison West Business Park Property (collectively, the “Norwood and Madison Business Park Properties”) comprise eight industrial buildings totaling 315,321 square feet located in the Sacramento, California MSA. Built in 1985 and 1987, the net rentable area (“NRA”) of the properties is approximately 70.0% warehouse and 30.0% office space. As of November 23, 2021, the Norwood and Madison Business Park Properties were 92.7% occupied by 42 tenants, and only one tenant accounts for more than 6.0% of the NRA or 5.8% of underwritten base rent.
Norwood Business Park
The Norwood Business Park Property is a four-building, 168,232 square foot, industrial flex property located in Sacramento, California. Originally constructed in 1985, the NRA contains approximately 65% warehouse space with 16’-18’ clear heights, 5 dock-height loading doors and 27 drive-in doors. The remaining 35% of the building is office space. The Norwood Business Park Property is situated on an approximately 11.1-acre site and includes 272 surface parking spaces (1.6 spaces per 1,000 SF). As of November 23, 2021, the Norwood Business Park Property was 95.6% leased to 16 tenants.
Madison West Business Park
The Madison West Business Park Property is a four-building, 147,089 square foot, industrial warehouse property located in North Highlands, California. Originally constructed in 1987, the NRA contains approximately 75% warehouse space with 16’ clear heights and 46 grade doors. The remaining 25% of the building is office space. The Madison West Business Park Property is situated on an approximately 9.7-acre site and includes 580 surface parking spaces (3.9 spaces per 1,000 SF). As of November 23, 2021, the Madison West Business Park Property was 89.4% leased to 26 tenants.
The following table presents certain information relating to the Norwood and Madison Business Park Properties:
| Norwood and Madison Business Park Properties Summary | ||||||||||
| Property Name – Location | Year Built/Renovated | Total NRA (SF) | Property Sub-Type | Cut-off Date Balance | Cut-off Date Balance PSF | % of Total Balance | Appraised Value | Cut-off Date LTV Ratio | UW NCF | % Total UW NCF |
| Norwood Business Park – Sacramento, CA | 1985/NAP | 168,232 | Flex | $9,250,000 | $54.98 | 51.4% | $16,140,000 | 57.3% | $967,011 | 51.3% |
| Madison West Business Park – North Highlands, CA | 1987/NAP | 147,089 | Warehouse | $8,750,000 | $59.49 | 48.6% | $16,750,000 | 52.2% | $917,868 | 48.7% |
| Total/Weighted Average | 315,321 | $18,000,000 | $57.08 | 100.0% | $32,890,000 | 54.7% | $1,884,879 | 100.0% | ||
COVID-19 Update. As of December 1, 2021, the Norwood and Madison Business Park Properties were fully open and operational. The borrower sponsor reported that only one tenant received rent relief during the pandemic (7,395 SF, 2.3% of NRA, 2.5% of underwritten base rent), consisting of $19,000 of base rent deferral to be amortized and paid back over the remainder of the lease term (March 2024 lease expiration).
Major Tenants.
Federal Express Corp. (53,668 SF, 17.0% of NRA, 13.9% of underwritten rent, rated ‘Baa2’/’BBB’ by Moody’s/S&P). Federal Express Corp. (“FedEx”) is the largest tenant at the Norwood Business Park Property comprising 31.9% of NRA and 27.0% of underwritten base rent at the property-level. Founded in 1973, FedEx is a global transportation and e-commerce company headquartered in Memphis, Tennessee. Today, the company has approximately 600,000 employees and, as of fiscal year end 2020, the company reported $69.2 billion in revenue. FedEx has been at the Norwood Business Park Property since 1985 and most recently renewed in April 2018 for a 10-year term through March 2028. The tenant has 1, 5-year renewal option with 6 months’ notice and does not have any termination options. The entity on the lease is Federal Express Corporation, which is the rated entity.
Community Integrated Work Program (18,947 SF, 6.0% of NRA, 5.8% of underwritten rent). Community Integrated Work Program (“CIWP”) is the largest tenant at the Madison West Business Park Property comprising 12.9% of NRA and 12.0% of underwritten base rent at the property-level. Founded in 1987, CIWP supports individuals with developmental disabilities and mental disabilities by providing work and behavioral day-programs, independent living supports, and crisis intervention. CIWP has been a tenant at the Madison West Business Park Property since 2001 and most recently renewed in May 2020 for a 5-year term through April 2025. The tenant does not have any renewal or termination options.
Vortex Industries, Inc. (14,709 SF, 4.7% of NRA, 5.1% of underwritten rent). Vortex Industries, Inc. (“Vortex”) is the second largest tenant at the Norwood Business Park Property comprising 8.7% of NRA and 9.8% of underwritten base rent at the property-level. Founded in 1937, Vortex offers an extensive range of commercial and industrial doors, and installation, repair, maintenance, and emergency services for commercial and industrial doors. Vortex has been a tenant at the Norwood Business Park Property since 2004 and renewed most recently in August 2020 for a 5-year term through July 2025. The tenant has 1, 3-year renewal option with 6 months’ notice and does not have any termination options.
This is not a research report and was not prepared by any Underwriter’s research department. Please see additional important information and qualifications at the end of this Term Sheet. |
T-113
| Industrial-Various | Loan #10-11 | Cut-off Date Balance: | $18,000,000 | |
| Various | Norwood Business Park and Madison West Business | Cut-off Date LTV: | 54.7% | |
| Various, CA | Park Crossed Group | UW NCF DSCR: | 3.63x | |
| UW NOI Debt Yield: | 11.0% |
The following table presents certain information relating to the tenancy at the Norwood and Madison Industrial Properties:
| Tenant Summary | |||||||||
| Tenant Name | Credit Rating (Fitch/Moody’s/S&P) | Tenant SF | Approx. % of SF | Annual UW Rent(1) | % of Total Annual UW Rent | Annual UW Rent PSF(1) | Lease Expiration | Renewal Options | Term. Options |
| FedEx | NR/Baa2/BBB(2) | 53,668 | 17.0% | $289,077 | 13.9% | $5.39 | 3/31/2028 | 1, 5-year(3) | N |
| CIWP | NR/NR/NR | 18,947 | 6.0% | $120,605 | 5.8% | $6.37 | 4/30/2025 | None | N |
| Vortex | NR/NR/NR | 14,709 | 4.7% | $104,864 | 5.1% | $7.13 | 7/31/2025 | 1, 3-year(4) | N |
| QualTek USA | NR/NR/NR | 10,988 | 3.5% | $63,861 | 3.1% | $5.81 | 6/30/2022 | 1, 3-year(5) | N |
| Bradford & Barthel, LLP | NR/NR/NR | 10,736 | 3.4% | $83,059 | 4.0% | $7.74 | 5/31/2024 | None | N |
| Subtotal/Wtd. Avg. | 109,048 | 34.6% | $661,466 | 31.9% | $6.07 | ||||
| Other Tenants | 183,255 | 58.1% | $1,414,480 | 68.1% | $7.72 | ||||
| Vacant Space | 23,018 | 7.3% | $0 | 0.0% | $0.00 | ||||
| Total/Wtd. Avg.(6) | 315,321 | 100.0% | $2,075,946 | 100.0% | $7.10 | ||||
| (1) | The Annual UW Rent and Annual UW Rent PSF shown above include rent steps through November 2022 totaling $44,094 and credit for straight-line rent averaging for investment grade tenants totaling $26,518. |
| (2) | The entity on the lease is Federal Express Corporation, which is the rated entity. |
| (3) | FedEx has one 5-year option to renew with at least six months’ notice at market rent. |
| (4) | Vortex Industries has one 3-year option to renew with at least six months’ notice with a 3% increase to the rent at lease expiration. |
| (5) | QualTek USA has one 3-year option to renew with nine months’ notice with a 3% increase to the rent at lease expiration. |
| (6) | Wtd. Avg. Annual UW Rent PSF excludes vacant space. |
The following table presents certain information relating to the lease rollover schedule at the Norwood and Madison Business Park Properties:
| Lease Rollover Schedule(1)(2) | ||||||||
| Year | # of Leases Rolling | SF Rolling | Annual UW Rent PSF Rolling | Approx. % of Total SF Rolling | Approx. Cumulative % of SF Rolling | Total UW Rent Rolling | Approx. % of Total Rent Rolling | Approx. Cumulative % of Total Rent Rolling |
| MTM | 0 | 0 | $0.00 | 0.0% | 0.0% | $0 | 0.0% | 0.0% |
| 2021 | 1 | 3,598 | $7.17 | 1.1% | 1.1% | $25,793 | 1.2% | 1.2% |
| 2022 | 10 | 47,798 | $7.19 | 15.2% | 16.3% | $343,708 | 16.6% | 17.8% |
| 2023 | 6 | 36,357 | $6.98 | 11.5% | 27.8% | $253,701 | 12.2% | 30.0% |
| 2024 | 10 | 46,500 | $8.35 | 14.7% | 42.6% | $388,460 | 18.7% | 48.7% |
| 2025 | 9 | 78,224 | $7.14 | 24.8% | 67.4% | $558,872 | 26.9% | 75.7% |
| 2026 | 4 | 18,538 | $8.24 | 5.9% | 73.3% | $152,798 | 7.4% | 83.0% |
| 2027 | 0 | 0 | $0.00 | 0.0% | 73.3% | $0 | 0.0% | 83.0% |
| 2028 | 1 | 53,668 | $5.39 | 17.0% | 90.3% | $289,077 | 13.9% | 96.9% |
| 2029 | 1 | 7,620 | $8.34 | 2.4% | 92.7% | $63,536 | 3.1% | 100.0% |
| 2030 | 0 | 0 | $0.00 | 0.0% | 92.7% | $0 | 0.0% | 100.0% |
| 2031 | 0 | 0 | $0.00 | 0.0% | 92.7% | $0 | 0.0% | 100.0% |
| 2032 & Beyond | 0 | 0 | $0.00 | 0.0% | 92.7% | $0 | 0.0% | 100.0% |
| Vacant | 0 | 23,018 | $0.00 | 7.3% | 100.0% | $0 | 0.0% | 100.0% |
| Total/Wtd. Avg.(3) | 42 | 315,321 | $7.10 | 100.0% | $2,075,946 | 100.0% | ||
| (1) | Information is based on the underwritten rent roll. |
| (2) | Certain tenants may have lease termination options that are exercisable prior to the originally stated expiration date of the subject lease and that are not considered in the Lease Rollover Schedule. |
| (3) | Wtd. Avg. Annual UW Rent PSF excludes vacant space. |
This is not a research report and was not prepared by any Underwriter’s research department. Please see additional important information and qualifications at the end of this Term Sheet. |
T-114
| Industrial-Various | Loan #10-11 | Cut-off Date Balance: | $18,000,000 | |
| Various | Norwood Business Park and Madison West Business | Cut-off Date LTV: | 54.7% | |
| Various, CA | Park Crossed Group | UW NCF DSCR: | 3.63x | |
| UW NOI Debt Yield: | 11.0% |
The Markets. The Norwood and Madison Business Park Properties are located 5.8 miles from one another within the Sacramento MSA.
Norwood Business Park
The Norwood Business Park Property is located along Opportunity Street, just west of Interstate 80, approximately 5.5 miles north of downtown Sacramento. According to the appraisal, the area is 95% developed and the property’s neighborhood consists of a mix of residential, retail, office, public and light industrial properties. According to a third-party market research report, the Norwood Business Park Property is situated within the Natomas/Northgate submarket of the Sacramento industrial market. As of November 23, 2021, the submarket reported a total inventory of approximately 18.9 million SF with a 2.2% vacancy rate and asking rents of $9.12 PSF. The appraisal identified seven comparable small industrial leases, which reported recent rental rates ranging from $7.80 PSF to $9.00 PSF with an average of $8.45 PSF. The appraisal identified five comparable large industrial leases, which reported recent rental rates ranging from $5.40 PSF to $9.60 PSF with an average of $6.84 PSF. The appraiser concluded to market rent for the Norwood Business Park Property of $6.60 PSF for large industrial space and $7.80 PSF for small industrial space.
According to a third-party market research report, the 2021 estimated population within a one-, three- and five-mile radius of the Norwood Business Park Property was 17,622, 119,989, and 304,772, respectively. The 2021 estimated average household income within the same radii was $63,123, $69,308 and $80,819, respectively.
Madison West Business Park
The Madison West Business Park Property is located along Madison Avenue, which provides close access to Interstate 80, approximately 9.6 miles north of downtown Sacramento. According to the appraisal, the property is located near a predominantly industrial pocket and is just east of the Sacramento McClellan Airport. According to a third-party market research report, the Madison West Business Park Property is situated within the McClellan submarket of the Sacramento industrial market. As of November 23, 2021 the submarket reported a total inventory of approximately 17.9 million SF with a 4.1% vacancy rate and asking rents of $9.73 PSF. The appraisal identified six comparable leases, which reported recent rental rates ranging from $7.80 PSF to $10.80 PSF with an average of $9.00 PSF. The appraiser concluded to market rent for the Madison West Business Park Property of $7.92 PSF.
According to a third-party market research report, the 2021 estimated population within a one-, three- and five-mile radius of the Madison West Business Park Property was 13,391, 117,985, and 364,103, respectively. The 2021 estimated average household income within the same radii was $54,203, $72,216 and $79,813, respectively.
The following table presents certain information relating to the appraisal’s market rent conclusions for the Norwood Business Park Property:
| Market Rent Summary | ||
| Industrial (Large) | Industrial (Small) | |
| Market Rent (PSF) | $6.60 | $7.80 |
| Lease Term (Years) | 10 | 5 |
| Lease Type (Reimbursements) | NNN | NNN |
| Rent Increase Projection | 3.00% per annum | 3.00% per annum |
| Tenant Improvements (New) | $2.00 PSF | $2.00 PSF |
| Tenant Improvements (Renew) | $1.00 PSF | $1.00 PSF |
| Source: Appraisal |
The following table presents certain information relating to the appraisal’s market rent conclusions for the Madison West Business Park Property:
| Market Rent Summary | |
| Flex | |
| Market Rent (PSF) | $7.92 |
| Lease Term (Years) | 5 |
| Lease Type (Reimbursements) | NNN |
| Rent Increase Projection | Various |
| Tenant Improvements (New) | $5.00 |
| Tenant Improvements (Renew) | $2.50 |
| Source: Appraisal |
This is not a research report and was not prepared by any Underwriter’s research department. Please see additional important information and qualifications at the end of this Term Sheet. |
T-115
| Industrial-Various | Loan #10-11 | Cut-off Date Balance: | $18,000,000 | |
| Various | Norwood Business Park and Madison West Business | Cut-off Date LTV: | 54.7% | |
| Various, CA | Park Crossed Group | UW NCF DSCR: | 3.63x | |
| UW NOI Debt Yield: | 11.0% |
The following table presents information relating to comparable industrial property sales for the Norwood Business Park Property:
| Comparable Property Sale Summary | ||||||||
| Property Name/Location | Sale Date | Year Built/ Renovated | Total NRA (SF) | Occupancy | Sale Price | Adjusted Sale Price(1) | Sale Price PSF | Appraiser’s Adjusted Sale Price |
901-915 N B St. 901-915 N B St. Sacramento, CA | Jul. 2021 | 1944/N/A | 110,000 | 100% | $8,535,000 | $9,310,400 | $78 | $85 |
5980 88th St. 5980 88th St. Sacramento, CA | Apr. 2021 | 1998/N/A | 100,000 | 25% | $9,975,000 | $9,873,000 | $100 | $99 |
1701 W. National Dr. 1701 W. National Dr. Sacramento, CA | Dec. 2020 | 2004/N/A | 209,993 | 0% | $15,749,500 | $16,064,465 | $75 | $77 |
1635 Main Ave. 1635 Main Ave. Sacramento, CA | Oct. 2020 | 1992/N/A | 127,080 | 100% | $10,200,000 | $11,766,337 | $80 | $93 |
Source: Appraisal.
| (1) | Adjusted sale price was adjusted for location, size, age/condition, features/amenities and economic characteristics (as applicable). |
The following table presents information relating to comparable industrial property sales for the Madison West Business Park Property:
| Comparable Property Sale Summary | ||||||||
| Property Name/Location | Sale Date | Year Built/ Renovated | Total NRA (SF) | Occupancy | Sale Price | Adjusted Sale Price(1) | Sale Price PSF | Appraiser’s Adjusted Sale Price |
Builders Firstsource 4339 Jetway Court North Highlands, CA | Listing | 1969/N/A | 107,908 | 100% | $12,053,000 | $12,517,328 | $112 | $116 |
California OES 600 N 5th Street Sacramento, CA | Sept. 2021 | 1985/ N/A | 159,875 | 100% | $28,500,000 | $20,464,000 | $178 | $128 |
Tri Tool Industrial 3041 Sunrise Boulevard Rancho Cordova, CA | Apr. 2021 | 1988/ N/A | 130,156 | 100% | $15,000,000 | $14,056,848 | $115 | $108 |
Roseville Commerce Center 10560 & 10600 Industrial Avenue Roseville, CA | Jan. 2021 | 2008/ N/A | 44,910 | 100% | $5,838,500 | $5,209,560 | $130 | $116 |
JMVZ Industrial Complex 9820 Dino Drive Elk Grove, CA | Mar. 2019 | 2002/N/A | 41,756 | 100% | $4,710,000 | $4,968,964 | $113 | $119 |
Source: Appraisal.
| (1) | Adjusted sale price was adjusted for location, size, age/condition, features/amenities and economic characteristics (as applicable). |
This is not a research report and was not prepared by any Underwriter’s research department. Please see additional important information and qualifications at the end of this Term Sheet. |
T-116
| Industrial-Various | Loan #10-11 | Cut-off Date Balance: | $18,000,000 | |
| Various | Norwood Business Park and Madison West Business | Cut-off Date LTV: | 54.7% | |
| Various, CA | Park Crossed Group | UW NCF DSCR: | 3.63x | |
| UW NOI Debt Yield: | 11.0% |
Operating History and Underwritten Net Cash Flow. The following table presents certain information relating to the historical operating performance and Underwritten Net Cash Flow at the Norwood and Madison Business Park Properties:
| Cash Flow Analysis | ||||||
| 2018 | 2019 | 2020 | 9/30/2021 TTM | UW | UW PSF | |
| Gross Potential Base Rent | $1,514,426 | $1,545,195 | $1,786,519 | $1,883,180 | $2,005,334 | $6.36 |
| Contractual Rent Steps | $0 | $0 | $0 | $0 | $44,094(1) | $0.14 |
| Rent Average Benefit | $0 | $0 | $0 | $0 | $26,518(2) | $0.08 |
| Grossed Up Vacant Space | $0 | $0 | $0 | $0 | $181,413 | $0.58 |
| Total Recoveries | $601,459 | $609,891 | $599,002 | $620,312 | $684,752 | $2.17 |
| Other Income(3) | $500 | $2,332 | $15,024 | $15,127 | $15,127 | $0.05 |
| Less Vacancy & Credit Loss | $0 | $0 | $0 | $0 | ($181,413)(4) | ($0.58) |
| Effective Gross Income | $2,116,385 | $2,157,419 | $2,400,545 | $2,518,619 | $2,775,825 | $8.80 |
| Real Estate Taxes | $196,497 | $196,272 | $202,692 | $204,580 | $238,312 | $0.76 |
| Insurance | $36,095 | $37,393 | $44,654 | $51,960 | $45,508 | $0.14 |
| Management Fee | $0 | $0 | $0 | $0 | $83,275(5) | $0.26 |
| Other Operating Expenses | $420,498 | $486,255 | $465,632 | $422,456 | $422,456 | $1.34 |
| Total Expenses | $653,091 | $719,921 | $712,978 | $678,995 | $789,551 | $2.50 |
| Net Operating Income(6) | $1,463,294 | $1,437,498 | $1,687,567 | $1,839,623 | $1,986,275 | $6.30 |
| CapEx | $0 | $0 | $0 | $0 | $41,817 | $0.13 |
| TI/LC | $0 | $0 | $0 | $0 | $59,578 | $0.19 |
| Net Cash Flow | $1,463,294 | $1,437,498 | $1,687,567 | $1,839,623 | $1,884,879 | $5.98 |
| Occupancy % | 95.2% | 90.5% | 91.0% | 92.7%(7) | 92.7%(7) | |
| NOI DSCR | 2.82x | 2.77x | 3.25x | 3.54x | 3.83x | |
| NCF DSCR | 2.82x | 2.77x | 3.25x | 3.54x | 3.63x | |
| NOI Debt Yield | 8.1% | 8.0% | 9.4% | 10.2% | 11.0% | |
| NCF Debt Yield | 8.1% | 8.0% | 9.4% | 10.2% | 10.5% | |
| (1) | Represents rent steps through November 2022. |
| (2) | Represents straight-line rent averaging for investment grade tenants. |
| (3) | Other Income represents late fees, administrative fees, and miscellaneous income. |
| (4) | Occupancy % is based on the in-place rent roll dated November 23, 2021. UW Vacancy of 8.0% represents the economic vacancy. |
| (5) | The borrower did not charge a management fee historically because the properties are managed by a borrower affiliate. |
| (6) | The increase from 2019 to 2020 NOI was primarily due to 13 new and renewal leases (32.1% of NRA and 34.7% of underwritten base rent) being signed in 2020. |
| (7) | Based on the underwritten rent roll dated November 23, 2021. |
Escrows and Reserves.
Real Estate Taxes – The loan documents for both of the Norwood and Madison Business Park Crossed Mortgage Loans require upfront real estate tax reserves in an aggregate amount of $55,864 and ongoing monthly real estate tax reserves in an aggregate amount equal to one-twelfth of the real estate taxes that the lender estimates will be payable during the next 12 months (initially totaling $15,722).
Insurance – The loan documents do not require ongoing monthly escrows for insurance premiums as long as (i) no event of default is continuing, (ii) the Norwood and Madison Business Park Properties are covered under a blanket policy acceptable to the lender, and (iii) the borrowers provide proof of renewal and receipts for the payment of insurance premiums no later than 10 business days prior to policy expiration.
Replacement Reserve – The loan documents for the Norwood Business Park Mortgage Loan require ongoing monthly replacement reserves in an amount of $1,849 (subject to a cap of $67,000). The loan documents for the Madison West Business Park Mortgage Loan require ongoing monthly replacement reserves in an amount of $1,635 (subject to a cap of $59,000).
TI/LC Reserve – The loan documents for the Norwood Business Park Mortgage Loan require ongoing monthly TI/LC reserves of $4,907 ($0.35 PSF) subject to a cap of $150,000 ($0.89 PSF). The loan documents for the Madison West Business Park Mortgage Loan require an upfront TI/LC reserve of $100,000 ($0.68 PSF) and ongoing monthly reserves of $4,290 ($0.35 PSF annually) subject to an aggregate cap of $200,000 ($1.36 PSF).
Immediate Repair Reserve – The loan documents require an upfront immediate repair reserve of $45,625 related to paving and concrete walkway repairs at the Norwood Business Park Property.
Lockbox and Cash Management. Within 30 days from receipt of written notice from lender that a Cash Trap Event Period (as defined below) has commenced, the borrowers are required to establish lender-controlled lockbox accounts and the borrowers and property managers must direct all rents to be deposited directly into the lockbox account. During a Cash Trap Event Period, funds in the lockbox accounts are required to be swept to a lender-controlled cash management account, and all excess funds are required to be swept to excess cash flow subaccounts controlled by the lender.
This is not a research report and was not prepared by any Underwriter’s research department. Please see additional important information and qualifications at the end of this Term Sheet. |
T-117
| Industrial-Various | Loan #10-11 | Cut-off Date Balance: | $18,000,000 | |
| Various | Norwood Business Park and Madison West Business | Cut-off Date LTV: | 54.7% | |
| Various, CA | Park Crossed Group | UW NCF DSCR: | 3.63x | |
| UW NOI Debt Yield: | 11.0% |
A “Cash Trap Event Period” will commence upon the earlier of the following:
| (i) | the occurrence and continuance of an event of default under either of the Norwood and Madison Business Park Crossed Mortgage Loans; or |
| (ii) | the hypothetical amortizing net cash flow debt service coverage ratio (based on a 30-year amortization schedule) falling below 1.20x (tested quarterly) at either of the Norwood and Madison Business Park Properties. |
A Cash Trap Event Period will end upon the occurrence of the following:
| ● | with regard to clause (i) above, the cure of such event of default under both of the Norwood and Madison Business Park Crossed Mortgage Loans; or |
| ● | with regard to clause (ii) above, the net cash flow debt service coverage ratio being at least 1.20x, for two consecutive calendar quarters at each of the Norwood and Madison Business Park Properties. |
Additional Secured Indebtedness (not including trade debts). None.
Mezzanine Loan and Preferred Equity. Not permitted.
Letter of Credit. Not permitted.
Release of Property. Not permitted.
Ground Lease. None.
Right of First Refusal/Right of First Offer. None.
Terrorism Insurance. The Norwood and Madison Business Park Crossed Mortgage Loan documents require that the “all risk” insurance policy required to be maintained by the borrowers provide coverage for terrorism in an amount equal to the full replacement cost of the Norwood and Madison Business Park Properties as well as business interruption insurance covering no less than the 12-month period following the occurrence of a casualty event, together with a 6-month extended period of indemnity.
This is not a research report and was not prepared by any Underwriter’s research department. Please see additional important information and qualifications at the end of this Term Sheet. |
T-118
(THIS PAGE INTENTIONALLY LEFT BLANK)
T-119
| Mortgage Loan No. 12 – Oregon Self Storage Portfolio |
| Mortgage Loan Information | Property Information | ||||||
| Mortgage Loan Seller: | BANA | Single Asset/Portfolio: | Portfolio | ||||
| Credit Assessment (Fitch/KBRA/S&P): | NR/NR/NR | Location(3): | Various, OR | ||||
| Original Balance: | $18,000,000 | General Property Type: | Self Storage | ||||
| Cut-off Date Balance: | $18,000,000 | Detailed Property Type: | Self Storage | ||||
| % of Initial Pool Balance: | 2.5% | Title Vesting: | Fee | ||||
| Loan Purpose: | Acquisition | Year Built/Renovated(3): | Various / Various | ||||
| Borrower Sponsor: | The Tobin Family | Size: | 308,800 SF | ||||
| Guarantor: | Joseph O. Tobin II | Cut-off Date Balance PSF: | $58 | ||||
| Mortgage Rate: | 3.3070% | Maturity Date Balance PSF: | $58 | ||||
| Note Date: | 11/2/2021 | Property Manager: | West Coast Mobile Home Parks, Inc. | ||||
| First Payment Date: | 1/1/2022 | ||||||
| Maturity Date: | 12/1/2028 | ||||||
| Original Term to Maturity: | 84 months | Underwriting and Financial Information(5) | |||||
| Original Amortization Term: | 0 months | UW NOI: | $1,690,332 | ||||
| IO Period: | 84 months | UW NOI Debt Yield: | 9.4% | ||||
| Seasoning: | 0 months | UW NOI Debt Yield at Maturity: | 9.4% | ||||
| Prepayment Provisions(1): | L(24),YM1(56),O(4) | UW NCF DSCR: | 2.72x | ||||
| Lockbox/Cash Mgmt Status: | Springing/Springing | Most Recent NOI: | $1,521,250 (9/30/2021 TTM) | ||||
| Additional Debt Type: | NAP | 2nd Most Recent NOI: | $1,423,862 (12/31/2020) | ||||
| Additional Debt Balance: | NAP | 3rd Most Recent NOI: | $1,383,766 (12/31/2019) | ||||
| Future Debt Permitted (Type)(2): | Yes (Mezzanine) | Most Recent Occupancy: | 95.3% (9/30/2021) | ||||
| Reserves | 2nd Most Recent Occupancy: | 90.0% (12/31/2020) | |||||
| Type | Initial | Monthly | Cap | 3rd Most Recent Occupancy: | 87.4% (12/31/2019) | ||
| RE Taxes: | $39,758 | $13,253 | NAP | Appraised Value (as of): | $27,500,000 (10/4/2021) | ||
| Insurance: | $0 | Springing(4) | NAP | Appraised Value PSF: | $89 | ||
| Replacement Reserve: | $0 | $4,120 | $148,320 | Cut-off Date LTV Ratio: | 65.5% | ||
| Immediate Repairs: | $7,813 | $0 | NAP | Maturity Date LTV Ratio: | 65.5% | ||
| Sources and Uses | ||||||
| Sources | Proceeds | % of Total | Uses | Proceeds | % of Total | |
| Mortgage Loan Amount: | $18,000,000 | 65.4% | Purchase Price: | $27,000,000 | 98.2% | |
| Cash Equity Contribution: | $9,507,300 | 34.6% | Closing Costs: | $459,730 | 1.7% | |
| Reserves: | $47,570 | 0.2% | ||||
| Total Sources: | $27,507,300 | 100.0% | Total Uses: | $27,507,300 | 100.0% | |
| (1) | Following the defeasance lockout period, the borrowers may obtain the release of an individual property upon the satisfaction of conditions set forth in the loan documents, including but not limited to: (i) partial defeasance of the Oregon Self Storage Portfolio Mortgage Loan (as defined below) in an amount that equals or exceeds 115% of the related allocated loan amount, (ii) the loan-to-value ratio after the release does not exceed 65.5%, (iii) the debt service coverage ratio after the release is greater than or equal to the greater of the debt service coverage ratio for all properties prior to the release and 1.73x, (iv) the debt yield after the release is greater than or equal to the greater of the debt yield for all properties prior to the release and 9.11% and (v) the vacancy rate after the release is not greater than the lesser of the vacancy rate for all properties prior to the release and 4.2%. |
| (2) | The borrowers are permitted to incur future mezzanine debt secured by a pledge of equity interests in the borrowers (an “Oregon Self Storage Portfolio Permitted Future Mezzanine Loan”); provided that, among other conditions: (i) no event of default is continuing; (ii) the aggregate loan-to-value ratio of the Oregon Self Storage Portfolio Mortgage Loan (as defined below) and Oregon Self Storage Portfolio Permitted Future Mezzanine Loan (collectively, the “Oregon Self Storage Portfolio Total Debt”) is less than or equal to 65.5%; (iii) the aggregate debt service coverage ratio of the Oregon Self Storage Portfolio Total Debt (assuming 30 year amortization on the Oregon Self Storage Portfolio Mortgage Loan) is at least 1.73x; (iv) the terms of the Oregon Self Storage Portfolio Permitted Future Mezzanine Loan would be acceptable to a prudent commercial mortgage lender; (v) an intercreditor agreement is executed that would be acceptable to a prudent commercial mortgage lender and is acceptable to the rating agencies rating the certificates; and (vi) if requested by the lender, a rating agency confirmation is delivered by each rating agency rating the certificates. |
| (3) | See “Property Summary” below. |
| (4) | The Oregon Self Storage Portfolio Mortgage Loan documents do not require ongoing monthly escrows for insurance premiums as long as the Oregon Self Storage Portfolio Properties (as defined below) are covered under a blanket policy acceptable to the lender. |
| (5) | The novel coronavirus pandemic is an evolving situation and could impact the Oregon Self Storage Portfolio Mortgage Loan more severely than assumed in the underwriting of the Oregon Self Storage Portfolio Mortgage Loan and could also adversely affect the NOI, NCF and occupancy information, as well as the appraised value and DSCR, LTV and Debt Yield metrics presented above and herein. See "Risk Factors—Risks Related to Market Conditions and Other External Factors—The Coronavirus Pandemic Has Adversely Affected the Global Economy and Will Likely Adversely Affect the Performance of the Mortgage Loans" in the prospectus. |
The Mortgage Loan. The 12th largest mortgage loan (the “Oregon Self Storage Portfolio Mortgage Loan”) is evidenced by a promissory note in the original principal balance of $18,000,000. The Oregon Self Storage Portfolio Mortgage Loan is secured by a first priority fee mortgage encumbering four self storage properties totaling 308,800 SF located within the state of Oregon (the “Oregon Self Storage Portfolio Properties”).
The Borrowers and the Borrower Sponsor. The borrowers are Buxbear Storage Medford 3030 Bullock Rd. LLC, Buxbear Storage Medford 2020 W. Main St. LLC, Buxbear Storage Medford 1630 Sky Park Dr. LLC and Buxbear Storage Springfield 633 Shelley St. LLC, each an Oregon limited liability company structured to be bankruptcy-remote. The non-recourse carveout guarantor is Joseph O. Tobin II.
Joseph O. Tobin II is an owner and operator of various commercial real estate properties having been in the commercial real estate industry for more than 30 years. Mr. Tobin’s current real estate portfolio consists of 6 self-storage facilities (totaling 3,288 units) located in 5 states and 42 manufactured housing communities (totaling more than 2,100 pads) in 7 states including California, Colorado, Idaho, Nevada, Oklahoma, Oregon, and Washington.
This is not a research report and was not prepared by any Underwriter’s research department. Please see additional important information and qualifications at the end of this Term Sheet. |
T-120
| Self Storage – Self Storage | Loan # 12 | Cut-off Date Balance: | $18,000,000 | |
| Various | Oregon Self Storage Portfolio | Cut-off Date LTV: | 65.5% | |
| Various, OR | UW NCF DSCR: | 2.72x | ||
| UW NOI Debt Yield: | 9.4% |
The Properties. The Oregon Self Storage Portfolio Properties consist of four self storage facilities totaling 308,800 SF (2,018 units). Three of the properties are located in Medford, Oregon while the fourth is located in Springfield, Oregon.
The following table presents certain information relating to the Oregon Self Storage Portfolio Properties:
| Property Summary | |||||||
| Property Name – Location | Allocated Cut-off Date Balance | Cut-off Date Balance PSF | % of ALA | Year Built/ Renovated | Appraised Value | U/W NCF | % Total U/W NCF |
| Pad-N-Lock Mini Storage - Springfield, OR | $5,334,545 | $74.08 | 29.6% | 1950 / 1974, 2005 | $8,150,000 | $499,597 | 30.4% |
| All Your Treasures Mini Storage - Medford, OR | $5,190,545 | $54.99 | 28.8% | 1990 / NAP | $7,930,000 | $474,824 | 28.9% |
| Airport Mini-Storage - Medford, OR | $4,699,636 | $46.88 | 26.1% | 1990 / NAP | $7,180,000 | $417,409 | 25.4% |
| Skypark Mini Storage - Medford, OR | $2,775,273 | $65.84 | 15.4% | 1985 / NAP | $4,240,000 | $252,414 | 15.4% |
| Total/Weighted Average | $18,000,000 | $58.29 | 100.0% | $27,500,000 | $1,644,244 | 100.0% | |
Pad-N-Lock Mini Storage
The Pad-N-Lock Mini Storage property is located in Springfield, Lane County, Oregon, on a 3.85-acre site. The Pad-N-Lock Mini Storage property was developed in 1950 and it was renovated and expanded in 1974 and 2005. The Pad-N-Lock Mini Storage property consists of 552 typical self-storage units (70,090 SF) and 12 container units (1,920 SF). The Pad-N-Lock Mini Storage property consists of 12 one-story storage buildings and one two-story building used as a manager’s office and residence. The Pad-N-Lock Mini Storage property amenities include electronic access gate, 24-hour video surveillance, key-pad entry, wide aisles, 24/7 access, outdoor lighting, and an on-site resident manager.
| Pad-N-Lock Mini Storage - Unit Mix(1) | |||||||
| Unit Type | Net Rentable Area (SF) | % NRA | # of Units | Current Occupancy | % Gross Potential Rent | Actual | Market Rent/Unit(2) |
| Storage Units | 70,090 | 97.3% | 552 | 95.9% | 97.6% | $109 | $113 |
| Container Units | 1,920 | 2.7% | 12 | 100.0% | 2.4% | $117 | $117 |
| Total/Weighted Average | 72,010 | 100.0% | 564 | 96.0% | 100.0% | $109 | $113 |
| (1) | Based on the borrower rent roll dated September 30, 2021. |
| (2) | Source: Appraisal. |
All Your Treasures Mini Storage
The All Your Treasures Mini Storage property is located in Medford, Jackson County, Oregon, on a 5.61-acre site. The All Your Treasures Mini Storage property was developed in 1990. The All Your Treasures Mini Storage property consists of 615 units in nine buildings, of which 552 are standard self storage units (77,260 SF) and another 63 are recreational vehicle (“RV”) (17,130 SF). The All Your Treasures Mini Storage property consists of ten buildings, one of which is used as a manager’s office and residence. The All Your Treasures Mini Storage property amenities include oversized doors on larger units, security fencing, keypad entry, 24-hour video surveillance, and an on-site resident manager.
| All Your Treasures Mini Storage - Unit Mix(1) | |||||||
| Unit Type | Net Rentable Area (SF) | % NRA | # of Units | Current Occupancy | % Gross | Actual Rent/Unit(2) | Market Rent/Unit(2) |
| Storage Units | 77,260 | 81.9% | 552 | 98.5% | 96.0% | $97 | $99 |
| Parking Spaces | 17,130 | 18.1% | 63 | 95.3% | 4.0% | $48 | $48 |
| Total/Weighted Average | 94,390 | 100.0% | 615 | 97.9% | 100.0% | $92 | $94 |
| (1) | Based on the borrower rent roll dated September 30, 2021. |
| (2) | Source: Appraisal. |
This is not a research report and was not prepared by any Underwriter’s research department. Please see additional important information and qualifications at the end of this Term Sheet. |
T-121
| Self Storage – Self Storage | Loan # 12 | Cut-off Date Balance: | $18,000,000 | |
| Various | Oregon Self Storage Portfolio | Cut-off Date LTV: | 65.5% | |
| Various, OR | UW NCF DSCR: | 2.72x | ||
| UW NOI Debt Yield: | 9.4% |
Airport Mini Storage
The Airport Mini Storage property is located in Medford, Jackson County, Oregon, on a 5.08-acre site. The Airport Mini Storage property was developed in 1990. The Airport Mini Storage property consists of 528 units, of which 427 are standard storage units (69,250 SF) and 101 are parking (31,000 SF). The Airport Mini Storage property consists of eight buildings, one of which is used as a manager’s office and residence. The outdoor parking spaces are for RV, boat and auto storage. The Airport Mini Storage property amenities include humidity-controlled units, large spaces for RV, boat and auto storage, security fencing, keypad entry, 24-hour video surveillance, and an on-site resident manager.
| Airport Mini Storage - Unit Mix(1) | |||||||
| Unit Type | Net Rentable Area (SF) | % NRA | # of Units | Current Occupancy | % Gross Potential Rent | Actual Rent/Unit(2) | Market Rent/Unit(2) |
| Storage Units | 69,250 | 69.1% | 427 | 97.6% | 89.9% | $104 | $113 |
| Parking Spaces | 31,000 | 30.9% | 101 | 77.7% | 10.1% | $66 | $65 |
| Total/Weighted Average | 100,250 | 100.0% | 528 | 91.4% | 100.0% | $97 | $104 |
| (1) | Based on the borrower rent roll dated September 30, 2021. |
| (2) | Source: Appraisal. |
Skypark Mini Storage
The Skypark Mini Storage property is located in Medford, Jackson County, Oregon, on a 2.15-acre site. The Skypark Mini Storage property was developed in 1985. The Skypark Mini Storage property consists of 311 units, of which 309 are standard storage units (40,400 SF) and two are office spaces (1,750 SF). The Skypark Mini Storage property consists of six buildings, one of which includes two rentable office units and the manager’s leasing office. The Skypark Mini Storage property amenities include security fencing, keypad entry, and 24-hour video surveillance.
| Skypark Mini Storage - Unit Mix(1) | |||||||
| Unit Type | Net Rentable Area (SF) | % NRA | # of Units | Current Occupancy | % Gross Potential Rent | Actual Rent/Unit(2) | Market Rent/Unit(2) |
| Storage Units | 40,400 | 95.8% | 309 | 97.6% | 98.0% | $101 | $104 |
| Office Spaces(2) | 1,750 | 4.2% | 2 | 100.0% | 2.0% | $528 | $528 |
| Total/Weighted Average | 42,150 | 100.0% | 311 | 97.7% | 100.0% | $104 | $107 |
| (1) | Based on the borrower rent roll dated September 30, 2021. |
| (2) | Source: Appraisal. |
The following table presents additional information with respect to the individual Oregon Self Storage Portfolio Properties:
| Oregon Self Storage Properties | ||||
| Property Name – Location | Net Rentable Area (SF) | % NRA | # of Units | Current Occupancy (9/30/2021) |
| Pad-N-Lock Mini Storage | 72,010 | 23.3% | 564 | 96.0% |
| All Your Treasures Mini Storage | 94,390 | 30.6% | 615 | 97.9% |
| Airport Mini Storage | 100,250 | 32.5% | 528 | 91.4% |
| Skypark Mini Storage | 42,150 | 13.6% | 311 | 97.7% |
| Total/Weighted Average | 308,800 | 100.0% | 2,018 | 95.3% |
The borrowers are permitted to install prefabricated, portable moving and storage containers ("Modular Storage Units") in designated areas identified in the related Oregon Self Storage Portfolio Mortgage Loan documents with a total SF of not more than 30,000 at the All Your Treasures Mini Storage property and a total SF of not more than 55,000 at the Airport Mini Storage property. The borrowers are required to provide evidence reasonably acceptable to the lender (including but not limited to) the following: (a) prior to such installation, all requisite zoning and or building approvals of governmental authorities, if any, have been granted, (b) no acts relating to development, installation, construction or use of the Modular Storage Units will cause the related individual property to fail to comply, in any material respect, with any applicable governmental rule or regulation, (c) during and after such installation, all storage units at the related individual property will have available to them all necessary utility and other services for their use, occupancy and operation, and adequate, free, unimpeded and unencumbered access for pedestrian and vehicular ingress and egress onto all adjacent public roads at such locations as are reasonably necessary for the use, occupancy and its present operation of the related individual property and such installation of Modular Storage Units should not reasonably be expected to reduce revenues at the individual property, (d) the related individual property, including, without limitation, all improvements thereon, will, after giving effect to the installation of such Modular Storage Units, be in compliance with all applicable zoning laws (including parking ordinances and requirements), land use and other governmental rules and regulations and (e) if reasonably required by the lender, the borrower will be required to deliver such additional or supplemental legal opinions as the lender may deem necessary (including, without limitation, a REMIC opinion) relating to the installation of the Modular Storage Units.
The Market.
The Oregon Self Storage Portfolio Properties are located in Medford (3 properties) and Springfield, Oregon (1 property).
The Pad-N-Lock Mini Storage property is located in the Lane County market and the Eugene-Springfield submarket (Eugene MSA). The MSA is the third largest in the state following Portland and Salem. The population within 3 miles of the Pad-N-Lock Mini Storage property grew 9.86% from 2010-2020. The unemployment rates as of 2020 are 7.9% and 7.6% for the Eugene MSA and the state of Oregon, respectively.
This is not a research report and was not prepared by any Underwriter’s research department. Please see additional important information and qualifications at the end of this Term Sheet. |
T-122
| Self Storage – Self Storage | Loan # 12 | Cut-off Date Balance: | $18,000,000 | |
| Various | Oregon Self Storage Portfolio | Cut-off Date LTV: | 65.5% | |
| Various, OR | UW NCF DSCR: | 2.72x | ||
| UW NOI Debt Yield: | 9.4% |
The All Your Treasures Mini Storage property, Airport Mini Storage property and Skypark Mini Storage property are located in the Medford/Klamath Falls market and the Jackson County submarket. The 2020 population of the Medford MSA was 222,985. The unemployment rate for the Medford MSA was 4.8% (as of August 2021) and the state of Oregon was 7.6% (as of 2020), respectively.
The following table presents certain local demographic data related to the Oregon Self Storage Portfolio Properties:
| Oregon Self Storage Portfolio Demographics | |||
| Property Name | Radius (miles) | 2020 Population(1) | 2020 Average Household Income(1) |
| Pad-N-Lock Mini Storage | One / Three / Five | 16,846 / 91,482 / 179,125 | $54,315 / $62,756 / $66,756 |
| All Your Treasures Mini Storage | One / Three / Five | 11,297 / 59,579 / 115,744 | $56,138 / $57,716 / $68,927 |
| Airport Mini Storage | One / Three / Five | 6,505 / 69,011 / 117,396 | $56,530 / $64,259 / $70,849 |
| Skypark Mini Storage | One / Three / Five | 9,924 / 69,727 / 117,155 | $62,299 / $64,753 / $70,749 |
| (1) | Source: Appraisal. |
The following table presents certain information relating to certain self storage lease comparables provided in the appraisals for the Oregon Self Storage Portfolio Properties:
| Competitive Set | ||||
| Property Name | Occupancy (9/30/2021)(1) | Average Occupancy Rate(2) | Actual Rent/Unit(2) | Market Rent/Unit(2) |
| Pad-N-Lock Mini Storage | 96.0% | 90.8% | $109 | $113 |
| All Your Treasures Mini Storage | 97.9% | 99.0% | $92 | $94 |
| Airport Mini Storage | 91.4% | 98.6% | $97 | $104 |
| Skypark Mini Storage | 97.7% | 98.6% | $104 | $107 |
| (1) | Based on the borrower rent roll dated September 30, 2021. |
| (2) | Source: Appraisal. |
Operating History and Underwritten Net Cash Flow. The following table presents certain information relating to the historical operating performance and Underwritten Net Cash Flow at the Oregon Self Storage Portfolio Properties:
| Cash Flow Analysis | |||||||||||||
| 2018 | 2019 | 2020 | 9/30/2021 TTM | UW | UW PSF | ||||||||
| Gross Potential Rent(1) | $1,852,314 | $1,976,264 | $2,031,026 | $2,206,745 | $2,456,793 | $7.96 | |||||||
| Other Income | $107,608 | $93,867 | $69,664 | $64,414 | $79,742 | $0.26 | |||||||
| (Vacancy) | $0 | $0 | $0 | $0 | ($148,553) | ($0.48) | |||||||
| Effective Gross Income | $1,959,922 | $2,070,131 | $2,100,690 | $2,271,159 | $2,387,982 | $7.73 | |||||||
| Real Estate Taxes | $139,236 | $146,343 | $149,541 | $151,010 | $154,232 | $0.50 | |||||||
| Insurance | $19,531 | $23,552 | $44,111 | $62,730 | $22,317 | $0.07 | |||||||
| Other Operating Expenses | $543,452 | $516,470 | $483,176 | $536,169 | $521,101 | $1.69 | |||||||
| Total Operating Expenses | $702,219 | $686,365 | $676,828 | $749,909 | $697,650 | $2.26 | |||||||
| Net Operating Income | $1,257,703 | $1,383,766 | $1,423,862 | $1,521,250 | $1,690,332 | $5.47 | |||||||
| Replacement Reserves | $30,518 | $156,099 | $4,600 | $84,494 | $46,088 | $0.15 | |||||||
| Net Cash Flow | $1,227,185 | $1,227,667 | $1,419,262 | $1,436,756 | $1,644,244 | $5.32 | |||||||
| Occupancy % | 83.1% | 87.4% | 90.0% | 95.3% | 94.0%(2) | ||||||||
| NOI DSCR | 2.08x | 2.29x | 2.36x | 2.52x | 2.80x | ||||||||
| NCF DSCR | 2.03x | 2.03x | 2.35x | 2.38x | 2.72x | ||||||||
| NOI Debt Yield | 7.0% | 7.7% | 7.9% | 8.5% | 9.4% | ||||||||
| NCF Debt Yield | 6.8% | 6.8% | 7.9% | 8.0% | 9.1% | ||||||||
| (1) | Underwritten to the September 2021 rent roll grossed up to full occupancy. |
| (2) | Based on the economic vacancy. |
This is not a research report and was not prepared by any Underwriter’s research department. Please see additional important information and qualifications at the end of this Term Sheet. |
T-123
| Mortgage Loan No. 13 – Skyline Mobile Home and RV Portfolio |
| Mortgage Loan Information | Property Information | ||||||
| Mortgage Loan Seller: | MSMCH | Single Asset/Portfolio: | Portfolio | ||||
| Credit Assessment (Fitch/KBRA/S&P): | NR/NR/NR | Location: | Various, AZ | ||||
| Original Balance: | $17,000,000 | General Property Type: | Manufactured Housing | ||||
| Cut-off Date Balance: | $17,000,000 | Detailed Property Type: | Various | ||||
| % of Initial Pool Balance: | 2.3% | Title Vesting: | Fee | ||||
| Loan Purpose: | Refinance | Year Built/Renovated: | Various / NAP | ||||
| Borrower Sponsor: | Skyline Real Estate | Size: | 1,437 Pads | ||||
| Guarantors: | Michael Yamin, Allen Aaron Yadgari, | Cut-off Date Balance Per Pad: | $11,830 | ||||
| The Yamin Irrevocable Grantor Trust and | Maturity Balance Per Pad: | $11,830 | |||||
| The Allen A. Yadgari Trust | Property Manager: | Self-managed | |||||
| Mortgage Rate: | 3.9700% | ||||||
| Note Date: | 11/17/2021 | ||||||
| First Payment Date: | 1/1/2022 | ||||||
| Maturity Date: | 12/1/2031 | ||||||
| Original Term to Maturity: | 120 months | ||||||
| Original Amortization Term: | 0 months | ||||||
| IO Period: | 120 months | Underwriting and Financial Information(1) | |||||
| Seasoning: | 0 months | UW NOI: | $1,675,842 | ||||
| Prepayment Provisions: | L(24),D(92),O(4) | UW NOI Debt Yield: | 9.9% | ||||
| Lockbox/Cash Mgmt Status: | Springing/Springing | UW NOI Debt Yield at Maturity: | 9.9% | ||||
| Additional Debt Type: | No | UW NCF DSCR: | 2.39x | ||||
| Additional Debt Balance: | NAP | Most Recent NOI: | $1,841,396 (10/31/2021 TTM) | ||||
| Future Debt Permitted (Type): | No (NAP) | 2nd Most Recent NOI: | $1,669,201 (12/31/2020) | ||||
| Reserves | 3rd Most Recent NOI: | $1,478,957(12/31/2019) | |||||
| Type | Initial | Monthly | Cap | Most Recent Occupancy: | 56.0% (8/1/2021) | ||
| RE Taxes: | $35,564 | $8,891 | NAP | 2nd Most Recent Occupancy: | 62.7% (12/31/2020) | ||
| Insurance: | $71,070 | $7,107 | NAP | 3rd Most Recent Occupancy: | 59.8% (12/31/2019) | ||
| Deferred Maintenance: | $38,376 | $0 | NAP | Appraised Value (as of): | $26,810,000 (Various) | ||
| Capital Expenditures: | $0 | $3,922 | NAP | Appraised Value Per Pad: | $18,657 | ||
| Rent Collections: | $150,000 | $0 | NAP | Cut-off Date LTV Ratio: | 63.4% | ||
| Environmental Reserve(2): | $7,500 | $0 | NAP | Maturity Date LTV Ratio: | 63.4% | ||
| Sources and Uses | ||||||
| Sources | Proceeds | % of Total | Uses | Proceeds | % of Total | |
| Loan Amount: | $17,000,000 | 100.0% | Loan Payoff: | $12,204,849 | 71.8% | |
| Borrower Equity: | $4,043,839 | 23.8% | ||||
| Closing Costs: | $448,802 | 2.6% | ||||
| Reserves: | $302,510 | 1.8% | ||||
| Total Sources: | $17,000,000 | 100.0% | Total Sources: | $17,000,000 | 100.0% | |
| (1) | The novel coronavirus pandemic is an evolving situation and could impact the Skyline Mobile Home and RV Portfolio Whole Loan more severely than assumed in the underwriting of the Skyline Mobile Home and RV Portfolio Whole Loan and could adversely affect the NOI, NCF and occupancy information, as well as the appraised value and the DSCR, LTV and Debt Yield metrics presented above and herein. See "Risk Factors—Risks Related to Market Conditions and Other External Factors—The Coronavirus Pandemic Has Adversely Affected the Global Economy and Will Likely Adversely Affect the Performance of the Mortgage Loans" in the prospectus. |
| (2) | The environmental reserve will be released to the borrower upon delivery of acceptable well testing results for the Black Rock RV Park Mortgaged Property and, if required, installation of a water filtration system. |
The Mortgage Loan. The thirteenth largest mortgage loan (the “Skyline Mobile Home and RV Portfolio Mortgage Loan”) is evidenced by a promissory note in the original principal balance of $17,000,000, secured by the fee interests in a portfolio of eight manufactured housing communities and recreational vehicle (“RV”) park properties located across six cities in Arizona, totaling 1,437 pads (the “Skyline Mobile Home and RV Portfolio Properties”).
The Borrowers and the Borrower Sponsors. The borrowers are Black Canyon Ranch LLC, Black Rock RV Resort LLC, Blue Sky Estates LLC, Garden Oasis Estates LLC, Goldwater Estates LLC, Holiday Palms Resort LLC, Mountain View RV Resort LLC and Sun Country Estates LLC, each a single purpose Arizona limited liability company structured to be bankruptcy remote, with no independent directors in its organizational structure. The borrower sponsor is Skyline Real Estate. Founded in 2003, Skyline Real Estate has been operating mobile home parks since 2007. Skyline Real Estate is headquartered in Beverly Hills, California and focuses on real estate investments and management of manufactured home communities across the nation, particularly the Southwest. The nonrecourse carve-out guarantors are Allen Aaron Yadgari, the founder and president of Skyline Real Estate, Michael Yamin, a real estate investor with interests in 36 manufactured housing/ RV properties, The Allen A. Yadgari Trust and The Yamin Irrevocable Grantor Trust.
The Properties. The Skyline Mobile Home and RV Portfolio Properties are comprised of a portfolio of eight manufactured housing communities and RV park properties located across six cities in Arizona, totaling 1,437 pads. Of the 1,437 pads comprising the properties, 970 pads (67.5% of pads) are RV sites and 467 pads (32.5% of pads) are manufactured housing community sites. Of the total 1,437 pads, 1,126 pads (78.4% of total pads) are dedicated
This is not a research report and was not prepared by any Underwriter’s research department. Please see additional important information and qualifications at the end of this Term Sheet. |
T-124
| Manufactured Housing – Various | Loan #13 | Cut-off Date Balance: | $17,000,000 | |
| Property Addresses - Various | Skyline Mobile Home and RV Portfolio | Cut-off Date LTV: | 63.4% | |
| UW NCF DSCR: | 2.39x | |||
| UW NOI Debt Yield: | 9.9% |
for monthly use, 186 pads (12.9% of total pads) are dedicated for weekly use, and 125 pads (8.7% of total pads) are dedicated for daily use. The Skyline Mobile Home and RV Portfolio Properties were built between 1983 and 1999 and encompass a combined approximately 162 acres. The weighted average occupancy for the Skyline Mobile Home and RV Portfolio Properties was 56.0% occupied, as of August 1, 2021. The weighted average of monthly asking rates for the Skyline Mobile Home and RV Portfolio Properties is $492.90, the weighted average of the weekly asking rates for the Skyline Mobile Home and RV Portfolio Properties is $240.94 and the weighted average of the daily asking rates for the Skyline Mobile Home and RV Portfolio is $41.30. Two of the Skyline Mobile Home and RV Portfolio Properties, Garden Oasis Estates and Goldwater Estates, are age restricted to persons 55 years-old and above. Since 2018, the borrower has spent approximately $1.1 million on capital expenditures.
The following table presents detailed information with respect to each of the Skyline Mobile Home and RV Portfolio Properties.
| Skyline Mobile Home and RV Portfolio Properties Summary | ||||||||
| Property Name | City, State | RV Pads | MHC Pads | Allocated Loan Amount (“ALA”) | % of ALA | Appraised Value | % of Appraised Value | |
| Black Canyon Ranch | Black Canyon City, AZ | 80 | 32 | $3,969,414 | 23.3% | $6,260,000 | 23.3% | |
| Blue Sky RV Resort | Yuma, AZ | 164 | 70 | $3,595,300 | 21.1% | $5,670,000 | 21.1% | |
| Black Rock RV Park | Salome, AZ | 223 | 185 | $3,011,936 | 17.7% | $4,750,000 | 17.7% | |
| Holiday Palms RV Resort | Quartzsite, AZ | 200 | 43 | $2,460,276 | 14.5% | $3,880,000 | 14.5% | |
| Mountain View RV Park | Huachuca City, AZ | 82 | 0 | $1,204,775 | 7.1% | $1,900,000 | 7.1% | |
| Goldwater Estates | Yuma, AZ | 48 | 51 | $1,096,978 | 6.5% | $1,730,000 | 6.5% | |
| Garden Oasis Estates | Yuma, AZ | 39 | 39 | $894,069 | 5.3% | $1,410,000 | 5.3% | |
| Sun Country Estates RV | Wellton, AZ | 134 | 47 | $767,252 | 4.5% | $1,210,000 | 4.5% | |
| Total | 970 | 467 | $17,000,000 | 100.0% | $26,810,000 | 100.0% | ||
The following table presents detailed information with respect to the individual performance of the Skyline Mobile Home and RV Portfolio Properties.
| Skyline Mobile Home and RV Portfolio Properties Performance Summary | |||||||
| Property Name | Total Pads | % of Total Pads | Year Built | Occupancy(1) | TTM Occupancy(2) | UW NOI | % UW NOI |
| Black Canyon Ranch | 112 | 7.8% | 1999 | 81.8% | 89.2% | $408,190 | 24.4% |
| Blue Sky RV Resort | 234 | 16.3% | 1986 | 64.3% | 69.0% | $314,991 | 18.8% |
| Black Rock RV Park | 408 | 28.4% | 1990 | 57.3% | 62.3% | $334,094 | 19.9% |
| Holiday Palms RV Resort | 243 | 16.9% | 1986 | 46.5% | 57.5% | $253,678 | 15.1% |
| Mountain View RV Park | 82 | 5.7% | 1992 | 62.0% | 71.3% | $124,973 | 7.5% |
| Goldwater Estates | 99 | 6.9% | 1983; 1985-1986 | 65.6% | 66.1% | $91,885 | 5.5% |
| Garden Oasis Estates | 78 | 5.4% | 1986 | 78.7% | 82.3% | $65,115 | 3.9% |
| Sun Country Estates RV | 181 | 12.6% | 1983 | 21.0% | 29.1% | $82,916 | 4.9% |
| Total / Wtd. Avg. | 1,437 | 100% | 56.0% | 62.4% | $1,675,842 | 100.0% | |
| (1) | Occupancy is as of August 1, 2021. |
| (2) | TTM Occupancy is as of August 1, 2021 for Black Canyon Ranch, September 1, 2021 for Black Rock RV Park, Blue Sky RV Resort, Goldwater Estates, Holiday Palms RV Resort, Mountain View RV Park, Sun Country Estates RV and October 1, 2021 for Garden Oasis Estates. |
The following table presents historical occupancy for the Skyline Mobile Home and RV Portfolio Properties.
| Historical Occupancy(1) | |||
| Property Name | 2019 Average Occupancy | 2020 Average Occupancy | 8/1/2021 Occupancy |
| Black Canyon Ranch | 90.6% | 91.9% | 81.8% |
| Blue Sky RV Resort | 69.5% | 73.3% | 64.3% |
| Black Rock RV Park | 61.0% | 63.2% | 57.3% |
| Holiday Palms RV Resort | 54.8% | 55.8% | 46.5% |
| Mountain View RV Park | 45.0% | 60.9% | 62.0% |
| Goldwater Estates | 63.2% | 65.4% | 65.6% |
| Garden Oasis Estates | 83.1% | 84.4% | 78.7% |
| Sun Country Estates RV | 26.9% | 28.8% | 21.0% |
| Total/Wtd. Avg. | 59.8% | 62.7% | 56.0% |
| (1) | Historical occupancy prior to 2019 is not available as the Skyline Mobile Home and RV Portfolio Properties were acquired between 2018 and 2019. |
This is not a research report and was not prepared by any Underwriter’s research department. Please see additional important information and qualifications at the end of this Term Sheet. |
T-125
| Manufactured Housing – Various | Loan #13 | Cut-off Date Balance: | $17,000,000 | |
| Property Addresses - Various | Skyline Mobile Home and RV Portfolio | Cut-off Date LTV: | 63.4% | |
| UW NCF DSCR: | 2.39x | |||
| UW NOI Debt Yield: | 9.9% |
The Market.
The following table presents detailed information for the Skyline Mobile Home and RV Portfolio Properties by market.
| Skyline Mobile Home and RV Portfolio Demographic Summary | |||||||||
| Property Name | City, State | 1-mile Population(1) | 3-mile Population(1) | 5-mile Population(1) | 1-mile Average Household Income(1) | 3-mile Average Household Income(1) | 5-mile Average Household Income(1) | ||
| Black Canyon Ranch | Black Canyon City, AZ | 2,050 | 3,246 | 3,290 | $52,968 | $52,410 | $52,406 | ||
| Blue Sky RV Resort | Yuma, AZ | 8,505 | 30,166 | 49,790 | $59,365 | $62,922 | $62,448 | ||
| Black Rock RV Park | Salome, AZ | 543 | 710 | 856 | $49,609 | $49,756 | $49,835 | ||
| Holiday Palms RV Resort | Quartzsite, AZ | 2,302 | 3,811 | 4,428 | $50,888 | $45,177 | $44,120 | ||
| Mountain View RV Park | Huachuca City, AZ | 560 | 3,406 | 5,402 | $60,004 | $54,580 | $52,792 | ||
| Goldwater Estates | Yuma, AZ | 11,762 | 65,386 | 96,873 | $43,053 | $53,940 | $55,822 | ||
| Garden Oasis Estates | Yuma, AZ | 18,586 | 77,363 | 97,171 | $47,026 | $54,193 | $55,941 | ||
| Sun Country Estates RV | Wellton, AZ | 1,940 | 3,336 | 3,807 | $50,793 | $50,438 | $51,924 | ||
| Total / Wtd. Avg.(2) | 4,570 | 16,495 | 24,007 | $52,873 | $53,373 | $53,287 | |||
Source: Appraisals.
| (1) | Numbers are as of 2021. |
| (2) | The Wtd. Avg. figures are based on allocated loan amounts for the individual properties. |
The following table presents certain information relating to the appraisal’s market rent conclusions for the Skyline Mobile Home and RV Portfolio Properties:
| Market Rent Summary | ||||||
| Property Name | Monthly RV Pad Asking Rent(1) | Weekly RV Pad Asking Rent(1) | Daily RV Pad Asking Rent(1) | Monthly RV Pads Market Rent(2) | Weekly RV Pads Market Rent(2) | Daily RV Pads Market Rent(2) |
| Black Canyon Ranch | $675 | $350 | $65 | $675 | $350 | $65 |
| Blue Sky RV Resort | $490 | $265 | $44 | $500 | $250 | $45 |
| Black Rock RV Park | $525 | $255 | $40 | $350 | $200 | $35 |
| Holiday Palms RV Resort | $535 | $245 | $39 | $325 | $245 | $39 |
| Mountain View RV Park | $365 | $175 | $32 | $365 | $175 | $32 |
| Goldwater Estates | $540 | $174 | $30 | $375 | $174 | $30 |
| Garden Oasis Estates | $518 | $215 | $36 | $450 | $215 | $36 |
| Sun Country Estates RV | $300 | $135 | $27 | $275 | $135 | $25 |
(1) Based on the borrower rent roll dated August 1, 2021.
(2) Based on the appraisal.
COVID-19 Update. The first payment date for the Skyline Mobile Home and RV Portfolio Mortgage Loan is January 1, 2022. As of November 17, 2021, the Skyline Mobile Home and RV Portfolio Properties are open and operating and not subject to any material forbearance, modification or debt service relief requests and collection levels have not changed materially from that of pre-COVID collection levels.
This is not a research report and was not prepared by any Underwriter’s research department. Please see additional important information and qualifications at the end of this Term Sheet. |
T-126
| Manufactured Housing – Various | Loan #13 | Cut-off Date Balance: | $17,000,000 | |
| Property Addresses - Various | Skyline Mobile Home and RV Portfolio | Cut-off Date LTV: | 63.4% | |
| UW NCF DSCR: | 2.39x | |||
| UW NOI Debt Yield: | 9.9% |
Operating History and Underwritten Net Cash Flow. The following table presents certain information relating to the historic operating performance and Underwritten Net Cash Flow at the Skyline Mobile Home and RV Portfolio Properties:
| Cash Flow Analysis | |||||||||||
| 2019 | 2020 | 10/31/2021 TTM | UW | UW PSF | |||||||
| Gross Potential Rent | $2,653,627 | $2,958,998 | $3,185,930 | $9,247,310 | $6,435.15 | ||||||
| Expense Reimbursement | $385,139 | $479,983 | $429,542 | $429,542 | $298.92 | ||||||
| Other Income(1) | $119,668 | $197,053 | $218,427 | $218,427 | $152.00 | ||||||
| Vacancy | $0 | $0 | $0 | ($6,061,380) | ($4,218.08) | ||||||
| Effective Gross Income | $3,158,434 | $3,636,034 | $3,833,899 | $3,833,899 | $2,667.99 | ||||||
| Real Estate Taxes | $73,391 | $116,545 | $108,039 | $102,042 | $71.01 | ||||||
| Insurance | $42,630 | $66,847 | $64,604 | $82,799 | $57.62 | ||||||
| Other Operating Expenses(2) | $1,563,455 | $1,783,440 | $1,819,860 | $1,973,216 | $1,373.15 | ||||||
| Total Operating Expenses | $1,679,477 | $1,966,833 | $1,992,503 | $2,158,057 | $1,501.78 | ||||||
| Net Operating Income | $1,478,957 | $1,669,201 | $1,841,396 | $1,675,842 | $1,166.21 | ||||||
| TI/LC | $0 | $0 | $0 | $0 | $0.00 | ||||||
| Capital Expenditures | $0 | $0 | $0 | $41,309 | $28.75 | ||||||
| Net Cash Flow | $1,478,957 | $1,669,201 | $1,841,396 | $1,634,533 | $1,137.46 | ||||||
| Occupancy % | 59.8% | 62.7% | 62.4%(3) | 34.5% | |||||||
| NOI DSCR | 2.16x | 2.44x | 2.69x | 2.45x | |||||||
| NCF DSCR | 2.16x | 2.44x | 2.69x | 2.39x | |||||||
| NOI Debt Yield | 8.7% | 9.8% | 10.8% | 9.9% | |||||||
| NCF Debt Yield | 8.7% | 9.8% | 10.8% | 9.6% | |||||||
| (1) | Other Income includes propane sales, late fees, pet fees, laundry facilities and storage income. |
| (2) | Other Operating Expenses include management fee, repairs and maintenance, marketing, and general and administrative expenses. |
| (3) | TTM Occupancy is as of August 1, 2021 for Black Canyon Ranch, September 1, 2021 for Black Rock RV Park, Blue Sky RV Resort, Goldwater Estates, Holiday Palms RV Resort, Mountain View RV Park, Sun Country Estates RV and October 1, 2021 for Garden Oasis Estates. |
This is not a research report and was not prepared by any Underwriter’s research department. Please see additional important information and qualifications at the end of this Term Sheet. |
T-127
| Mortgage Loan No. 14 – Forest Hills South Owners, Inc. |
| Mortgage Loan Information | Property Information | ||||||
| Mortgage Loan Seller: | NCB | Single Asset/Portfolio: | Single Asset | ||||
| Credit Assessment (Fitch/KBRA/S&P): | NR/AAA/NR | Location: | Forest Hills, NY 11375 | ||||
| Original Balance: | $16,900,000 | General Property Type: | Multifamily | ||||
| Cut-off Date Balance: | $16,900,000 | Detailed Property Type: | Cooperative | ||||
| % of Initial Pool Balance: | 2.3% | Title Vesting: | Fee | ||||
| Loan Purpose: | Refinance | Year Built/Renovated: | 1939 / 2012 | ||||
| Borrower Sponsor(1): | NAP | Size(5): | 605 Units | ||||
| Guarantor(1): | NAP | Cut-off Date Balance per Unit: | $27,934 | ||||
| Mortgage Rate: | 2.8500% | Maturity Date Balance per Unit: | $21,298 | ||||
| Note Date: | 11/18/2021 | Property Manager: | John B. Lovett & Associates, Ltd. | ||||
| First Payment Date: | 1/1/2022 | ||||||
| Maturity Date: | 12/1/2031 | Underwriting and Financial Information(6) | |||||
| Original Term to Maturity: | 120 months | UW NOI(7): | $8,879,410 | ||||
| Original Amortization Term: | 360 months | UW NOI Debt Yield(7): | 52.5% | ||||
| IO Period: | 0 months | UW NOI Debt Yield at Maturity(7): | 68.9% | ||||
| Seasoning: | 0 months | UW NCF DSCR(7): | 10.40x | ||||
| Prepayment Provisions: | YM1(113),1%(3), O(4) | Most Recent NOI(8): | NAP | ||||
| Lockbox/Cash Mgmt Status: | None | 2nd Most Recent NOI(8): | NAP | ||||
| Additional Debt Type(2): | Revolving Line of Credit | 3rd Most Recent NOI(8): | NAP | ||||
| Additional Debt Balance(2): | $0 | Most Recent Occupancy(9): | 96.9% (9/23/2021) | ||||
| Future Debt Permitted (Type)(3): | Yes (Secured) | 2nd Most Recent Occupancy(9): | NAP | ||||
| 3rd Most Recent Occupancy(9): | NAP | ||||||
| Reserves(4) | Appraised Value (as of)(10): | $253,000,000 (9/23/2021) | |||||
| Type | Initial | Monthly | Cap | Appraised Value per Unit(10): | $418,182 | ||
| Taxes: | $0 | Springing | NAP | Cut-off Date LTV Ratio(10): | 6.7% | ||
| Insurance: | $0 | Springing | NAP | Maturity Date LTV Ratio(10): | 5.1% | ||
| Coop-Rental Value(11): | $173,000,000 (9/23/2021) | ||||||
| Coop-LTV as Rental(11): | 9.8% | ||||||
| Sources and Uses | ||||||
| Sources | Proceeds | % of Total | Uses | Proceeds | % of Total | |
| Loan Amount: | $16,900,000 | 100.0% | Loan Payoff: | $12,208,515 | 72.2% | |
| Proceeds to Borrower: | $4,434,721 | 26.2% | ||||
| Closing Costs: | $256,764 | 1.5% | ||||
| Total Sources: | $16,900,000 | 100.0% | Total Uses: | $16,900,000 | 100.0% | |
| (1) | The Forest Hills South Owners, Inc. Property (as defined below) is owned by the borrower, Forest Hills South Owners, Inc., which is a cooperative housing corporation. No individual or entity (other than the borrower) has recourse obligations with respect to the Forest Hills South Owners, Inc. Mortgage Loan (as defined below), including pursuant to any guaranty or environmental indemnity. |
| (2) | The Forest Hills South Owners, Inc. Property also secures a subordinate second lien mortgage loan to the borrower in the amount of up to $1,000,000 (the “Forest Hills South Owners, Inc. Subordinate Loan”) which permits advances from time to time. The outstanding balance of the Forest Hills South Owners, Inc. Subordinate Loan as of the cut-off date is $0. National Cooperative Bank, N.A. is the holder of the Forest Hills South Owners, Inc. Subordinate Loan. With regard to the interest rate, term, payment terms and other statistical information relating to the Forest Hills South Owners, Inc. Subordinate Loan, see “Description of the Mortgage Pool—Additional Indebtedness—Other Secured Indebtedness—Additional Debt Financing For Mortgage Loans Secured by Residential Cooperatives” in the prospectus. All statistical information presented above relating to balances per unit, debt yields, debt service coverage ratios and loan-to-value ratios are based solely on the Forest Hills South Owners, Inc. Mortgage Loan. |
| (3) | In addition to the Forest Hills South Owners, Inc. Subordinate Loan as described in footnote (2) above, National Cooperative Bank, N.A., the applicable master servicer of the Forest Hills South Owners, Inc. Mortgage Loan, will be permitted to waive the enforcement of the “due-on-encumbrance” clause in the related mortgage instrument to permit subordinate debt secured by the Forest Hills South Owners, Inc. Property, subject to the satisfaction of various conditions and subject to certain parameters set forth in the pooling and servicing agreement for the BANK 2021-BNK38 securitization. See “Description of the Mortgage Pool—Additional Indebtedness—Other Secured Indebtedness—Additional Debt Financing For Mortgage Loans Secured by Residential Cooperatives” in the prospectus. |
| (4) | The borrower is required to deposit, simultaneously with each monthly loan payment, 1/12 of the estimated annual real estate tax payments upon (i) failure to provide evidence of the payment of such taxes within 60 days following the date on which such payment is due to the applicable taxing authority or (ii) the occurrence of an event of default under the applicable loan documents. In addition, the borrower may be required to deposit, simultaneously with each monthly loan payment, 1/12 of the annual insurance premiums upon the occurrence of an event of default under the applicable loan documents. |
| (5) | Based solely on residential units with shares and excludes (i) 18 commercial units without shares, (ii) one professional unit without shares and (iii) three superintendent’s units without shares, all of which are owned by the borrower. |
| (6) | The novel coronavirus pandemic is an evolving situation and could impact the Forest Hills South Owners, Inc. Mortgage Loan more severely than assumed in the underwriting of the Forest Hills South Owners, Inc. Mortgage Loan and could adversely affect the NOI, NCF and occupancy information, as well as the appraised value and the DSCR, LTV and Debt Yield metrics presented above and herein. See “Risk Factors—Risks Related to Market Conditions and Other External Factors—The Coronavirus Pandemic Has Adversely Affected the Global Economy and Will Likely Adversely Affect the Performance of the Mortgage Loans” in the prospectus. |
| (7) | See “Underwritten Net Cash Flow” section below. |
| (8) | Most Recent NOI, 2nd Most Recent NOI and 3rd Most Recent NOI are not available. Residential cooperatives are not-for-profit entities that set maintenance fees to cover current expenses and plan for future capital needs. A residential cooperative can increase or decrease maintenance fees according to its anticipated expenses and level of cash reserves. The historical NOI figures are not representative of the cash flow generated by the Forest Hills South Owners, Inc. Property if it were operated as a multifamily rental property. |
| (9) | Most Recent Occupancy, 2nd Most Recent Occupancy and 3rd Most Recent Occupancy are not reported as all residential units are owned by tenant-shareholders or the cooperative sponsor. |
| (10) | For purposes of determining the Appraised Value, the Appraised Value per Unit, the Cut-off Date LTV Ratio and the Maturity Date LTV Ratio, the value estimate reflected in the appraisal of the Forest Hills South Owners, Inc. Property is determined as if such residential cooperative property is operated as a residential cooperative and, such value equals the sum of (i) the gross share value of all cooperative units in such residential cooperative property, based in part on various comparable sales of cooperative apartment units in the market, plus (ii) the amount of the underlying debt encumbering such residential cooperative property. See “Description of the Mortgage Pool-Certain Characteristics of Mortgage Loans Secured by Residential Cooperatives” in the prospectus. |
| (11) | The Coop-Rental Value and the Coop-LTV as Rental assumes the Forest Hills South Owners, Inc. Property is operated as a multifamily rental property. See “Risk Factors—Risks Relating to the Mortgage Loans—Residential Cooperative Properties Have Special Risks,” and “Description of the Mortgage Pool—Property Types—Multifamily Properties” in the prospectus. |
This is not a research report and was not prepared by any Underwriter’s research department. Please see additional important information and qualifications at the end of this Term Sheet. |
T-128
| Multifamily – Cooperative | Loan #14 | Cut-off Date Balance: | $16,900,000 | |
| Various | Forest Hills South Owners, Inc. | Cut-off Date LTV: | 6.7% | |
| Forest Hills, NY 11375 | UW NCF DSCR: | 10.40x | ||
| UW NOI Debt Yield: | 52.5% |
The Mortgage Loan. The fourteenth largest mortgage loan (the “Forest Hills South Owners, Inc. Mortgage Loan”) is evidenced by a promissory note in the original principal amount of $16,900,000 and secured by a first priority fee mortgage encumbering the underlying fee and improvements of a cooperative apartment complex comprised of 605 residential units with shares and 18 commercial units without shares, in seven, six-story cooperative buildings located in Forest Hills, New York (the “Forest Hills South Owners, Inc. Property”). The proceeds of the Forest Hills South Owners, Inc. Mortgage Loan were used to refinance existing debt, fund reserves and pay closing costs.
The Borrower. The borrower is Forest Hills South Owners, Inc., a cooperative housing corporation organized under the laws of the State of New York. The borrower has no independent directors. The Forest Hills South Owners, Inc. Property is owned in fee simple by the borrower. No individual or entity (other than the borrower) has recourse obligations with respect to the Forest Hills South Owners, Inc. Mortgage Loan, including pursuant to any guaranty or environmental indemnity.
The Property. The Forest Hills South Owners, Inc. Property is comprised of the land and improvements of seven six-story residential cooperative buildings constructed from 1939-1940 and converted to cooperative ownership in 1984. The Forest Hills South Owners, Inc. Property consists of 605 residential units with shares and 18 commercial units without shares, and is located in the Forest Hills neighborhood of Queens, New York. The 605 residential units with shares consist of 599,805 SF of total NRA and the 18 commercial units consist of approximately 23,828 SF of total NRA. The cooperative is 96.5% sold with 584 tenant-shareholders, and 3.5% unsold with 20 units owned by the cooperative sponsor and one unit owned by the cooperative. The cooperative’s sponsor, Pickman Realty Corporation, owns 20 units (all of which have shares), and currently realizes a positive annual carry of $18,452. The principals of the Pickman Realty Corporation are comprised of nine members of the Pickman family. Four of the sponsor’s units are currently vacant and 16 are occupied by rent regulated tenants. Amenities at the Forest Hills South Owners, Inc. Property include a fitness center, a laundry room, elevators in each building and a parking garage with 270 spaces.
As of October 31, 2021, the cooperative had a reserve balance of $3,174,449 ($5,247/unit). The cooperative received $4,434,721 ($7,330/unit) at loan origination to strengthen reserves. As of November 3, 2021, the cooperative had a minimal shareholder maintenance arrears balance of $24,336, or 0.3% of annual maintenance.
The 18 commercial units at the Forest Hills South Owners, Inc. Property are owned by the borrower. The leases for the commercial tenants have various expiration dates ranging from April, 2022 to December, 2026. The tenants at the commercial units are all open for business and are paying rent. The commercial tenants pay an annual aggregate rent of $894,973. The cooperative’s three largest commercial tenants are (i) Sleepy’s, Inc. - 6,122 SF, (ii) 116FH Suite Realty, LLC - 1,500 SF and (iii) Illuminating Minds, LLC – 2,178 SF. As of November 19, 2021, the cooperative’s commercial rent arrears (which are associated with two tenants) were approximately $378.
The table below shows the residential apartment unit mix at the Forest Hills South Owners, Inc. Property:
| Unit Mix | |||
| Unit Type | Units | SF | % of Total Units |
| Studio | 62 | 579 | 10.2% |
| 1 Bedroom | 322 | 906 | 53.2% |
| 2 Bedroom | 164 | 1,133 | 27.1% |
| 3 Bedroom | 57 | 1,542 | 9.4% |
| Total/Wtd. Avg. | 605 | 994 | 100.0% |
| Source: Certified Maintenance Schedule | ||
COVID-19 Update. The first debt service payment on the Forest Hills South Owners, Inc. Mortgage Loan is due in January 2022 and the Forest Hills South Owners, Inc. Mortgage Loan is not subject to any forbearance, modification or debt service relief request. The borrower has incurred a Paycheck Protection Program loan in the original principal amount of $564,982.50. As of November 3, 2021, the cooperative’s arrears were $24,336 or 0.3% of current annual maintenance representing 1.8% of total units with shares. As of November 19, 2021, the cooperative’s commercial rent arrears were $378, associated with two tenants.
This is not a research report and was not prepared by any Underwriter’s research department. Please see additional important information and qualifications at the end of this Term Sheet. |
T-129
| Multifamily – Cooperative | Loan #14 | Cut-off Date Balance: | $16,900,000 | |
| Various | Forest Hills South Owners, Inc. | Cut-off Date LTV: | 6.7% | |
| Forest Hills, NY 11375 | UW NCF DSCR: | 10.40x | ||
| UW NOI Debt Yield: | 52.5% |
The Market. The Forest Hills South Owners, Inc. Property is located in Forest Hills, New York, which is within the Central Queens submarket. The Forest Hills South Owners, Inc. Property is located in close proximity to the 71st Street and Continental Avenue subway stations, which provide access to the E, F, M and R lines as well as easy access to nearby highways and local bus routes. According to a third-party research report, as of the third quarter of 2021, the Central Queens submarket had an inventory of 45,012 units, with a vacancy rate of 1.0% and an average asking rent of $2,014/month.
The following table presents certain information relating to multifamily rental properties comparable to the Forest Hills South Owners, Inc. Property:
| Comparable Rental Properties(1) | |||||
| Property | Year Built(2) | Unit Type | Size (SF)(2) | Average Monthly Rent per Unit | Average Annual Rent Per SF |
| Forest Hills South Owners, Inc. | 1939 | Studio | 579 | $1,751 | $36.27 |
| 1 BR | 906 | $2,042 | $27.03 | ||
| 2 BR | 1,133 | $2,531 | $26.81 | ||
| 3 BR | 1,542 | $3,291 | $25.61 | ||
| 104-20 Queens Boulevard | 1960 | Studio | 550 | $1,785 | $38.95 |
| Studio | 578 | $1,845 | $38.30 | ||
| 1 BR | 875 | $2,325 | $31.89 | ||
| 3 BR | 1327 | $3,640 | $32.92 | ||
| 110-45 Queens Boulevard | 1951 | Studio | 450 | $1,725 | $46.00 |
| 1 BR | 825 | $2,175 | $31.64 | ||
| 107-40 Queens Boulevard | 1965 | 1 BR | 750 | $1,995 | $31.92 |
| 73-20 Austin Street | NAV | 1 BR | 822 | $1,950 | $28.47 |
| 110-07 73rd Road | NAV | 1 BR | 825 | $2,100 | $30.55 |
| 69-39 Yellowstone Boulevard | 1948 | 2 BR | NAV | $2,300 | NAV |
| 108-25 72nd Avenue | NAV | 2 BR | 1200 | $2,895 | $28.95 |
| 103-25 68th Avenue | NAV | 2 BR | 1000 | $2,400 | $28.80 |
| 110-20 73rd Road | 1937 | 2 BR | 1500 | $2,800 | $22.40 |
| 3 BR | 1650 | $3,500 | $25.45 | ||
| 67-15 102nd Street | NAV | 3 BR | 1500 | $3,200 | $25.60 |
| 83-09 Talbot Street | 1923 | 3 BR | 1583 | $3,000 | $22.74 |
| 66-25 103rd Street | 1964 | 3 BR | 1800 | $3,300 | $22.00 |
Source: Appraisal.
| (1) | The rents for the comparable properties are based on unit rents used by the appraiser in the income capitalization approach, prior to adjustments. Rents used for the Forest Hills South Owners, Inc. Property are based on the appraisal’s concluded market rents, as well as rents being achieved from units owned by the sponsor of the cooperative, Pickman Realty Corporation. There are currently 16 rent regulated sponsor units at the Forest Hills South Owners, Inc. Property. All or a portion of the units will be subject to rent restrictions if the Forest Hills South Owners, Inc. Property is operated as a multifamily rental property. |
| (2) | Square Footage and Year Built were sourced from various internet resources. |
This is not a research report and was not prepared by any Underwriter’s research department. Please see additional important information and qualifications at the end of this Term Sheet. |
T-130
| Multifamily – Cooperative | Loan #14 | Cut-off Date Balance: | $16,900,000 | |
| Various | Forest Hills South Owners, Inc. | Cut-off Date LTV: | 6.7% | |
| Forest Hills, NY 11375 | UW NCF DSCR: | 10.40x | ||
| UW NOI Debt Yield: | 52.5% |
Underwritten Net Cash Flow. The following table presents certain information relating to the Underwritten Net Cash Flow at the Forest Hills South Owners, Inc. Property:
| Cash Flow Analysis(1)(2) | ||
| UW | UW Per Unit | |
| Gross Potential Rent | $16,399,563 | $27,107 |
| Gross Commercial Income(3) | $908,232 | $1,501 |
| Other Income(4) | $848,306 | $1,402 |
| Less Vacancy & Credit Loss(5) | $(558,764) | $(924) |
| Effective Gross Income | $17,597,337 | $29,087 |
| Real Estate Taxes | $2,913,103 | $4,815 |
| Insurance | $285,354 | $472 |
| Other Expenses | $5,519,470 | $9,123 |
| Total Expenses | $8,717,927 | $14,410 |
| Net Operating Income | $8,879,410 | $14,677 |
| Replacement Reserves | $156,500 | $259 |
| Net Cash Flow | $8,722,910 | $14,418 |
| Occupancy %(5) | 96.9% | |
| NOI DSCR(6) | 10.59x | |
| NCF DSCR(6) | 10.40x | |
| NOI Debt Yield(6) | 52.5% | |
| NCF Debt Yield(6) | 51.6% | |
| (1) | For the avoidance of doubt, no COVID-19 specific adjustments have been incorporated in the lender underwriting. | |
| (2) | Residential cooperatives are generally organized and operated as not-for-profit entities that set maintenance fees to cover current expenses and plan for future capital needs. The UW Net Operating Income and the UW Net Cash Flow for the Forest Hills South Owners, Inc. Property are the projected net operating income and the projected net cash flow, respectively, reflected in the appraisal. The projected net operating income, in general, equals projected effective gross income at the Forest Hills South Owners, Inc. Property assuming that it is operated as a multifamily rental property with rents and other income set at the prevailing market rates, reduced by underwritten property operating expenses and a market-rate vacancy assumption, in each case as determined by the appraiser. While such projected net operating income assumes the Forest Hills South Owners, Inc. Property is rented at market rates, all or a portion of the residential cooperative units at the Forest Hills South Owners, Inc. Property were rent restricted prior to the cooperative conversion and accordingly would again be subject to rent restrictions if the Forest Hills South Owners, Inc. Property were operated as a multifamily rental property. The projected net cash flow equals the projected net operating income reduced by the projected replacement reserves as determined by the appraiser. The projected rental income used in such determinations differs materially from the scheduled monthly maintenance payments from the tenant-shareholders at the Forest Hills South Owners, Inc. Property. See “Risk Factors—Risks Relating to the Mortgage Loans—Residential Cooperative Properties Have Special Risks” in the prospectus. |
| (3) | Commercial Income includes 18 commercial units owned by the cooperative. |
| (4) | Other Income includes Office Unit Income, Fitness Center Income, Laundry Income, Parking Income and Storage Income. |
| (5) | Occupancy % and Vacancy & Credit Loss reported reflect the vacancy assumption in the related appraisal for purposes of determining the appraised value of the Forest Hills South Owners, Inc. Property as a multifamily rental property, including commercial income and other income. |
| (6) | Debt service coverage ratios and debt yields are based on the Forest Hills South Owners, Inc. Mortgage Loan only and do not include any subordinate debt. |
This is not a research report and was not prepared by any Underwriter’s research department. Please see additional important information and qualifications at the end of this Term Sheet. |
T-131
| Mortgage Loan No. 15 – JCI Sanford |
| Mortgage Loan Information | Property Information | ||||||
| Mortgage Loan Seller: | MSMCH | Single Asset/Portfolio: | Single Asset | ||||
| Credit Assessment (Fitch/KBRA/S&P): | NR/NR/NR | Location: | Sanford, NC 27330 | ||||
| Original Balance: | $13,303,500 | General Property Type: | Industrial | ||||
| Cut-off Date Balance: | $13,303,500 | Detailed Property Type: | Light Manufacturing | ||||
| % of Initial Pool Balance: | 1.8% | Title Vesting: | Fee | ||||
| Loan Purpose: | Acquisition | Year Built/Renovated: | 1967; 2006/NAP | ||||
| Borrower Sponsor: | Zell Kravinsky | Size: | 270,017 SF | ||||
| Guarantor: | Zell Kravinsky | Cut-off Date Balance PSF: | $49 | ||||
| Mortgage Rate(1): | 2.9550% | Maturity Date/ARD Balance PSF: | $49 | ||||
| Note Date: | 11/17/2021 | Property Manager: | Self-Managed | ||||
| First Payment Date: | 1/1/2022 | ||||||
| Anticipated Repayment Date(1): | 7/1/2031 | ||||||
| Maturity Date: | 7/1/2034 | ||||||
| Original Term to Maturity/ARD: | 115 months | ||||||
| Original Amortization Term(1): | 0 months | Underwriting and Financial Information (4) | |||||
| IO Period: | 115 months | UW NOI: | $1,342,907 | ||||
| Seasoning: | 0 months | UW NOI Debt Yield: | 10.1% | ||||
| Prepayment Provisions: | L(24),D(87),O(4) | UW NOI Debt Yield at Maturity/ARD: | 10.1% | ||||
| Lockbox/Cash Mgmt Status: | Hard/Springing | UW NCF DSCR: | 3.30x | ||||
| Additional Debt Type: | No | Most Recent NOI(5): | NAV | ||||
| Additional Debt Balance: | NAP | 2nd Most Recent NOI(5): | NAV | ||||
| Future Debt Permitted (Type): | No (NAP) | 3rd Most Recent NOI(5): | NAV | ||||
| Reserves | Most Recent Occupancy: | 100.0% (12/1/2021) | |||||
| Type | Initial | Monthly | Cap | 2nd Most Recent Occupancy(5): | NAV | ||
| RE Tax: | $0 | Springing(2) | NAP | 3rd Most Recent Occupancy(5): | NAV | ||
| Insurance: | $0 | Springing(2) | NAP | Appraised Value (as of): | $21,000,000 (9/24/2021) | ||
| Replacement Reserve: | $0 | $2,251 | $27,007 | Appraised Value PSF: | $78 | ||
| TI/LC Reserve: | $0 | Springing(2) | NAP | Cut-off Date LTV Ratio: | 63.4% | ||
| Environmental Reserve(3): | $54,120 | $0 | NAP | Maturity Date/ARD LTV Ratio: | 63.4% | ||
| Sources and Uses | ||||||
| Sources | Proceeds | % of Total | Uses | Proceeds | % of Total | |
| Loan Amount: | $13,303,500 | 65.7% | Purchase Price(6): | $20,001,259 | 98.8% | |
| Borrower Equity(6): | $6,944,783 | 34.3% | Closing Costs: | $192,904 | 1.0% | |
| Reserves: | $54,120 | 0.3% | ||||
| Total Sources: | $20,248,283 | 100.0% | Total Uses: | $20,248,283 | 100.0% | |
| (1) | The JCI Sanford Mortgage Loan (as defined below) has an initial term of 115 months to the anticipated repayment date (“ARD”) of July 1, 2031 (the “Maturity Date”), with a final maturity date of July 1, 2034. Prior to the ARD, the JCI Sanford Mortgage Loan will accrue interest at a rate equal to the Initial Interest Rate (as defined below). From and after the ARD, the JCI Sanford Mortgage Loan will accrue interest at a rate equal to the Adjusted Interest Rate (as defined below), however, interest at the excess of the Adjusted Interest Rate over the initial interest rate will be deferred as described below. The JCI Sanford Mortgage Loan requires payments of interest only through the ARD, and payments of interest and principal based on a 30- year amortization schedule thereafter. (See “The Mortgage Loan” below). |
| (2) | The JCI Sanford Mortgage Loan documents do not require ongoing monthly escrows for real estate taxes so long as (i) no event of default is continuing, and (ii) taxes are being paid by Air System Components (as defined below) pursuant to the Air System Components lease, directly to the appropriate taxing authority and the borrower provides evidence of such payment prior to the delinquency date for the payment of such taxes. The JCI Sanford Mortgage Loan documents do not require ongoing monthly escrows for insurance premiums as long as (i) no event of default is continuing, (ii) the borrower provides written evidence that all required insurance coverages are being maintained in full force and effect through one or more blanket insurance policies or by Air System Components. The JCI Sanford Mortgage Loan documents require springing monthly deposits of $22,506 into the TI/LC Reserve upon (i) the debt service coverage ratio for the JCI Sanford Property (as defined below) falling below 1.85x or (ii) the occurrence of a Tenant Credit Event as defined in the loan documents. |
| (3) | The environmental reserve is required to be disbursed to the borrower upon the borrower’s completion of remediation obligations related to groundwater impacted by various compounds and chemicals above applicable standards, and provision of evidence satisfactory to the lender of such completion of remediation, including a “No Further Action” or closure letter or equivalent certification from the North Carolina Department of Environmental Quality. |
| (4) | The novel coronavirus pandemic is an evolving situation and could impact the JCI Sanford Mortgage Loan more severely than assumed in the underwriting of the JCI Sanford Mortgage Loan and could adversely affect the NOI, NCF and occupancy information, as well as the appraised value and the DSCR, LTV and Debt Yield metrics presented above and herein. See “Risk Factors-—Risks Related to Market Conditions and Other External Factors—The Coronavirus Pandemic Has Adversely Affected the Global Economy and Will Likely Adversely Affect the Performance of the Mortgage Loans” in the prospectus. |
| (5) | The borrower acquired the JCI Sanford Property from the sole tenant in June 2021. Accordingly, historical net operating income and occupancy information is not available. |
| (6) | The borrower acquired the JCI Sanford Property on an all cash basis in a sale-leaseback transaction in June 2021. The loan proceeds, along with approximately $7.0 million of cash equity from the borrower, were used to recapitalize the borrower after its acquisition of the JCI Sanford Property, fund reserves, and pay closing costs. |
The Mortgage Loan. The fifteenth largest mortgage loan (the “JCI Sanford Mortgage Loan”) is evidenced by a promissory note in the original principal amount of $13,303,500 and secured by a first priority fee mortgage encumbering a 270,017 SF industrial property located in Sanford, North Carolina (the “JCI Sanford Property”).
The JCI Sanford Mortgage Loan has an initial term of 115 months to an ARD of July 1, 2031. Prior to the ARD, the JCI Sanford Mortgage Loan will accrue interest at a rate equal to 2.9550% per annum (the “Initial Interest Rate”). From and after the ARD the JCI Sanford Mortgage loan will accrue interest at a rate per annum (the “Adjusted Interest Rate”) equal to the greater of (i) 3.0% plus the Initial Interest Rate and (ii) 3.0% plus the Treasury Rate. The
This is not a research report and was not prepared by any Underwriter’s research department. Please see additional important information and qualifications at the end of this Term Sheet. |
T-132
| Industrial – Light Manufacturing | Loan #15 | Cut-off Date Balance: | $13,303,500 | |
| 101 McNeill Road | JCI Sanford | Cut-off Date LTV: | 63.4% | |
| Sanford, NC 27330 | UW NCF DSCR: | 3.30x | ||
| UW NOI Debt Yield: | 10.1% |
“Treasury Rate” means, as of the ARD, the yield, calculated by the lender by linear interpolation (rounded to the nearest one-thousandth of one percent) of the yields of non-inflation adjusted noncallable United States Treasury obligations with terms (one longer and one shorter) most nearly approximating the period from such date of determination to the Maturity Date. From and after the ARD, interest payments will continue to be made as provided prior to the ARD, with amounts accrued at the excess of the Adjusted Interest Rate over the Initial Interest Rate (“Excess Interest”) being deferred and added to the outstanding principal balance, and payable on the Maturity Date, or such earlier date on which the principal balance is repaid in full. The JCI Sanford Mortgage Loan requires payments of interest only through the ARD, and payments of interest (at the Initial Interest Rate) and principal based on a 30-year amortization schedule thereafter. In addition, from and after the ARD, all excess cash flow from the JCI Sanford Property after payment of debt service, required reserve deposits and operating expenses, will be collected by the lender and applied to reduce the principal balance of the JCI Sanford Mortgage Loan until the entire outstanding principal balance is paid in full, and then, to pay any Excess Interest on the JCI Sanford Mortgage Loan.
The Borrower and Borrower Sponsor. The borrower is HA Sanford Holdings LLC, a single-purpose Delaware limited liability company with no independent directors. The borrower sponsor and non-recourse carveout guarantor is Zell Kravinsky. The borrower is an affiliate of the borrower of the mortgage loan identified on Annex A-1 to the prospectus as JCI El Paso, which is secured by a property leased to the same sole tenant as the JCI Sanford Property.
Zell Kravinsky is a real estate investor, who is currently the general partner and lead investor in a portfolio, comprised of approximately 2,377 multifamily units and over 1.5 million SF of commercial space located across nine states.
The Property. The JCI Sanford Property consists of one, single-story industrial building comprising 270,017 SF in Sanford, North Carolina. Built in 1967, the JCI Sanford Property is situated on a 25.2 acre site, and is 100% leased to the sole tenant, Air System Components, Inc. (“Air System Components”), on a 13-year lease that is scheduled to expire in June 2034. A laboratory was added onto the warehouse in 2006, which has metal exterior walls and a roof. The JCI Sanford Property contains approximately 17.0% office finish and features 14 dock high doors, one grade door, and clear heights of 14-26 feet and contains 210 surface parking spaces, resulting in a parking ratio of 0.8 spaces per 1,000 SF of net rentable area. The borrower acquired the JCI Sanford Property from the sole tenant in a sale-leaseback transaction in June 2021.
Major Tenant.
Air System Components (270,017 SF, 100.0% of NRA, 100.0% of underwritten rent). Air System Components is a supplier of heating, air conditioning and ventilation system components, and is a subsidiary of Johnson Controls International (NYSE: JCI), a multinational conglomerate within the technology/industrial space, with a current market capitalization in excess of $50.0 billion. Johnson Controls International currently employs approximately 100,000 employees at 2,000 worldwide locations, earning $22.3 billion in revenue and $1.7 billion in net income. Air System Components has occupied space at the JCI Sanford Property since 1996, and utilizes the space as its headquarters for the company’s Air Filtration Group. Air System Components manufactures components such as grilles, registers, diffusers, terminals for air conditioning, heating, ventilation systems, and other air distribution products. Air System Components manufactures products used in industrial facilities, institutions, commercial and residential buildings. Air System Components has a lease expiration of June 30, 2034 and has four, five-year renewal options remaining.
The following table presents certain information relating to the leases at the JCI Sanford Property:
| Tenant Summary(1) | |||||||||
| Tenant Name | Credit Rating (Fitch/Moody’s/S&P)(2) | Tenant SF | Approx.% of SF | Annual UW Base Rent | Annual UW Base Rent PSF | % of Total Annual UW Base Rent | Lease Expiration | Renewal Option | Term. Option (Y/N) |
| Air System Components | BBB/Baa2/BBB+ | 270,017 | 100.0% | $1,412,488 | $5.23 | 100.0% | 6/30/2034 | 4 x 5 yr | N |
| Subtotal/Wtd. Avg. | 270,017 | 100.0% | $1,412,488 | $5.23 | 100.0% | ||||
| Vacant Space | 0 | 0.0% | $0 | $0.00 | 0.0% | ||||
| Total/Wtd. Avg. | 270,017 | 100.0% | $1,412,488 | $5.23 | 100.0% | ||||
| (1) | Information is based on the underwritten rent roll. |
| (2) | Air System Components is a subsidiary of Johnson Controls International (NYSE: JCI). Ratings shown above are ratings of Johnson Controls International. |
This is not a research report and was not prepared by any Underwriter’s research department. Please see additional important information and qualifications at the end of this Term Sheet. |
T-133
| Industrial – Light Manufacturing | Loan #15 | Cut-off Date Balance: | $13,303,500 | |
| 101 McNeill Road | JCI Sanford | Cut-off Date LTV: | 63.4% | |
| Sanford, NC 27330 | UW NCF DSCR: | 3.30x | ||
| UW NOI Debt Yield: | 10.1% |
The following table presents certain information relating to the lease rollover schedule at the JCI Sanford Property:
| Lease Rollover Schedule(1) | ||||||||
| Year | # of Leases Rolling | SF Rolling | UW Base Rent PSF Rolling | Approx. % of Total SF Rolling | Approx. Cumulative % of SF Rolling | Total UW Base Rent Rolling | Approx. % of Total Rent Rolling | Approx. Cumulative % of Total Rent Rolling |
| 2021 | 0 | 0 | $0.00 | 0.0% | 0.0% | $0 | 0.0% | 0.0% |
| 2022 | 0 | 0 | $0.00 | 0.0% | 0.0% | $0 | 0.0% | 0.0% |
| 2023 | 0 | 0 | $0.00 | 0.0% | 0.0% | $0 | 0.0% | 0.0% |
| 2024 | 0 | 0 | $0.00 | 0.0% | 0.0% | $0 | 0.0% | 0.0% |
| 2025 | 0 | 0 | $0.00 | 0.0% | 0.0% | $0 | 0.0% | 0.0% |
| 2026 | 0 | 0 | $0.00 | 0.0% | 0.0% | $0 | 0.0% | 0.0% |
| 2027 | 0 | 0 | $0.00 | 0.0% | 0.0% | $0 | 0.0% | 0.0% |
| 2028 | 0 | 0 | $0.00 | 0.0% | 0.0% | $0 | 0.0% | 0.0% |
| 2029 | 0 | 0 | $0.00 | 0.0% | 0.0% | $0 | 0.0% | 0.0% |
| 2030 | 0 | 0 | $0.00 | 0.0% | 0.0% | $0 | 0.0% | 0.0% |
| 2031 | 0 | 0 | $0.00 | 0.0% | 0.0% | $0 | 0.0% | 0.0% |
| 2032 & Beyond | 1 | 270,017 | $5.23 | 100.0% | 100.0% | $1,412,488 | 100.0% | 100.0% |
| Vacant | 0 | 0 | $0.00 | 0.0% | 100.0% | $0 | 0.0% | 100.0% |
| Total/Wtd. Avg. | 1 | 270,017 | $5.23 | 100.0% | $1,412,488 | 100.0% | ||
| (1) | Information is based on the underwritten rent roll. |
COVID-19 Update. The first debt service payment date for the JCI Sanford Mortgage Loan is January 1, 2022. As of November 17, 2021, the borrower has reported that the JCI Sanford Property is open and operating, with the sole tenant paying 100.0% of the previous month’s rent payments. The sole tenant has not received rent relief.
The Market. The JCI Sanford Property is located in Sanford, North Carolina, within the Lee County industrial submarket, of the Lee and Chatham counties industrial market. The JCI Sanford Property benefits from a location that is approximately 42 miles southwest of Raleigh, 37 miles southwest of Chapel Hill, and 36 miles northwest of Fayetteville. Primary access to the neighborhood is provided by U.S. Routes 1, 421, and 501. The JCI Sanford Property is in close proximity to the Sanford central business district, and the Raleigh Executive Jetport. According to the appraisal, as of the second quarter of 2021, the vacancy rate in the Lee County industrial submarket was approximately 8.5%, with average asking rents of $3.41 PSF and inventory of approximately 11.3 million SF. According to the appraisal, the 2020 population within a one-, three- and five-mile radius was 856, 13,563, and 30,868, respectively. The 2020 median household income within the same one-, three- and five-mile radius was $91,041, $62,586, and $51,026, respectively.
The following table presents certain information relating to the appraisal’s market rent conclusions for the JCI Sanford Property:
| Market Rent Summary | |||
| Category | Market Rent (PSF) | Lease Term (Yrs) | Rental Increase Projection |
| Industrial | $5.00 | 7 | 3% per annum |
This is not a research report and was not prepared by any Underwriter’s research department. Please see additional important information and qualifications at the end of this Term Sheet. |
T-134
| Industrial – Light Manufacturing | Loan #15 | Cut-off Date Balance: | $13,303,500 | |
| 101 McNeill Road | JCI Sanford | Cut-off Date LTV: | 63.4% | |
| Sanford, NC 27330 | UW NCF DSCR: | 3.30x | ||
| UW NOI Debt Yield: | 10.1% |
The following table presents comparable industrial leases with respect to the JCI Sanford Property:
| Comparable Industrial Lease Summary | |||||||
| Property Name/Location | Year Built / Renovated | Total SF | Tenant Name | Lease SF | Lease Term (Mos.) | Rent PSF | Lease Type |
JCI Sanford Property Sanford, NC | 1967; 2006 / NAP | 270,017(1) | Air System Components(1) | 270,017(1) | 156(1) | $5.23(1) | NNN(1) |
Arhaus BTS Conover, NC | 2021 / NAP | 497,977 | Arhaus LLC | 497,977 | 144 | $5.97 | NNN |
3301 North Main Street Tarboro, NC | 1970 / 2007 | 192,878 | Air System | 192,878 | 372 | $6.38 | Absolute Net |
370 Spectrum Drive Knightdale, NC | 2021 / NAP | 159,600 | PCX Holding LLC | 159,600 | 96 | $6.35 | NNN |
Woodlake 1200 Morrisville, NC | 1995 / 2020 | 303,587 | Amazon | 175,951 | NAP | $6.25 | NNN |
200 Business Park Drive Butner, NC | 2015 / NAP | 93,685 | Nugget Confort | 93,685 | 72 | $5.10 | NNN |
Walnut Creek III Raleigh, NC | 2001 / NAP | 131,640 | TRANE | 89,000 | 60 | $6.25 | NNN |
Source: Appraisal, unless otherwise noted.
| (1) | Information is based on the underwritten rent roll. |
Underwritten Net Cash Flow. The following table presents certain information relating to the Underwritten Net Cash Flow at the JCI Sanford Property:
| Cash Flow Analysis(1) | |||||
| UW | UW PSF | ||||
| Gross Potential Rent(2) | $1,412,488 | $5.23 | |||
| Total Recoveries | $41,533 | $0.15 | |||
| Other Income | $0 | $0 | |||
| Discounts Concessions | $0 | $0 | |||
| Less Vacancy & Credit Loss | $69,581 | $0.26 | |||
| Effective Gross Income | $1,384,440 | $5.13 | |||
| Real Estate Taxes | $0 | $0 | |||
| Insurance | $0 | $0 | |||
| Other Operating Expenses | $41,533 | $0.15 | |||
| Total Operating Expenses | $41,533 | $0.15 | |||
| Net Operating Income | $1,342,907 | $4.97 | |||
| Capital Expenditures | $27,007 | $0.10 | |||
| TI/LC | $0 | $0 | |||
| Net Cash Flow | $1,315,899 | $4.87 | |||
| Occupancy % | 100.0% | ||||
| NOI DSCR | 3.37x | ||||
| NCF DSCR | 3.30x | ||||
| NOI Debt Yield | 10.1% | ||||
| NCF Debt Yield | 9.9% | ||||
| (1) | The borrower acquired the JCI Sanford Property from the sole tenant in a sale-leaseback transaction in June 2021. Accordingly, historical net operating income and occupancy information is not available. | |
| (2) | Gross Potential Rent has been underwritten based on Air System Components’ average contractual lease rent over the loan term and includes $62,403 of straight line rent. The tenant currently pays an annual base rent of $1,350,085 ($5.00 PSF) which will be subject to 1.0% annual rent escalations. |
This is not a research report and was not prepared by any Underwriter’s research department. Please see additional important information and qualifications at the end of this Term Sheet. |
T-135
| BANK 2021-BNK38 |
This material was prepared by sales, trading, banking or other non-research personnel of one of the following: Morgan Stanley & Co. LLC, Morgan Stanley & Co. International Limited, Morgan Stanley Japan Limited and/or Morgan Stanley Dean Witter Asia Limited (together with their affiliates, hereinafter “Morgan Stanley”), BofA Securities, Inc. (together with its affiliates, “BofA Securities”), Wells Fargo Securities, LLC (together with its affiliates, “Wells Fargo”), Academy Securities, Inc. (together with its affiliates, “Academy”) and Drexel Hamilton, LLC (together with its affiliates, “Drexel”, and collectively with Morgan Stanley, BofA Securities, Wells Fargo and Academy, the “Underwriters”). This material was not produced by an Underwriter’s research analyst, although it may refer to an Underwriter’s research analyst or research report. Unless otherwise indicated, these views (if any) are the author’s and may differ from those of the fixed income or equity research departments of the Underwriters or others in those firms.
This material may have been prepared by or in conjunction with the respective trading desks of the Underwriters that may deal as principal in or own or act as market maker or liquidity provider for the securities/instruments (or related derivatives) mentioned herein. The trading desk may have accumulated a position in the subject securities/instruments based on the information contained herein. Trading desk materials are not independent of the proprietary interests of the Underwriters, which may conflict with your interests. Each of the Underwriters may also perform or seek to perform investment banking services for the issuers of the securities and instruments mentioned herein.
The information contained in this material is preliminary as of the date hereof. This material is subject to change, completion or amendment from time to time. The information in this material supersedes information in any other communication relating to the securities referred to in this material; provided, that the information in this material will be superseded by similar information delivered to you as part of a preliminary prospectus. This material is not a solicitation to participate in any trading strategy, and is not an offer to sell any security or instrument or a solicitation of an offer to buy or sell any security or instrument in any jurisdiction where an offer, solicitation or sale is not permitted. Unless otherwise set forth in this material, any securities referred to in this material may not have been registered under the U.S. Securities Act of 1933, as amended, and, if not, may not be offered or sold absent an exemption therefrom. Recipients are required to comply with any legal or contractual restrictions on their purchase, holding, sale, exercise of rights or performance of obligations under any securities/instruments transaction.
The securities/instruments discussed in this material may not be suitable for all investors. This material has been prepared and issued by the Underwriters for intended distribution to market professionals and institutional investor clients. Other recipients should seek independent investment advice prior to making any investment decision based on this material. This material does not provide individually tailored investment advice or offer tax, regulatory, accounting or legal advice. Prior to entering into any proposed transaction, recipients should determine, in consultation with their own investment, legal, tax, regulatory and accounting advisors, the economic risks and merits, as well as the legal, tax, regulatory and accounting characteristics and consequences, of the transaction. You should consider this material as only a single factor in making an investment decision.
The value of and income from investments may vary because of changes in interest rates, foreign exchange rates, default rates, prepayment rates, securities/instruments prices, market indexes, operational or financial conditions of companies or other factors. There may be time limitations on the exercise of options or other rights in securities/instruments transactions. Past performance is not necessarily a guide to future performance. Estimates of future performance are based on assumptions that may not be realized. Actual events may differ from those assumed and changes to any assumptions may have a material impact on any projections or estimates. Other events not taken into account may occur and may significantly affect the projections or estimates. Certain assumptions may have been made for modeling purposes only to simplify the presentation and/or calculation of any projections or estimates, and the Underwriters do not represent that any such assumptions will reflect actual future events. Accordingly, there can be no assurance that estimated returns or projections will be realized or that actual returns or performance results will not materially differ from those estimated herein. Some of the information contained in this document may be aggregated data of transactions in securities or other financial instruments executed by an Underwriter that has been compiled so as not to identify the underlying transactions of any particular customer.
Notwithstanding anything herein to the contrary, the Underwriters and each recipient hereof (and their employees, representatives, and other agents) may disclose to any and all persons, without limitation of any kind from the commencement of discussions, the U.S. federal and state income tax treatment and tax structure of the transaction and all materials of any kind (including opinions or other tax analyses) that are provided to it relating to the tax treatment and tax structure (as such terms are defined in Treasury Regulation 1.6011-4). For this purpose, "tax structure" is limited to facts relevant to the U.S. federal and state income tax treatment of the transaction and does not include information relating to the identity of the parties, their affiliates, agents or advisors. This authorization of tax disclosure is retroactively effective to the commencement of discussions with prospective investors regarding the transactions contemplated herein.
THE DISTRIBUTION OF THIS MATERIAL (A) IF MADE BY A PERSON WHO IS NOT AN AUTHORIZED PERSON UNDER THE FINANCIAL SERVICES AND MARKETS ACT 2000 (“FSMA”), IS BEING MADE ONLY TO, OR DIRECTED ONLY AT, PERSONS WHO (I) ARE OUTSIDE THE UNITED KINGDOM, OR (II) HAVE PROFESSIONAL EXPERIENCE IN MATTERS RELATING TO INVESTMENTS AND QUALIFY AS INVESTMENT PROFESSIONALS IN ACCORDANCE WITH ARTICLE 19(5) OF THE FINANCIAL SERVICES AND MARKETS ACT 2000 (FINANCIAL PROMOTION) ORDER 2005 (AS AMENDED, THE “FINANCIAL PROMOTION ORDER”), OR (III) ARE PERSONS FALLING WITHIN ARTICLE 49(2)(A) THROUGH (D) (“HIGH NET WORTH COMPANIES, UNINCORPORATED ASSOCIATIONS, ETC.”) OF THE FINANCIAL PROMOTION ORDER OR, (IV) ARE PERSONS TO WHOM THIS MATERIAL MAY OTHERWISE LAWFULLY BE COMMUNICATED OR DIRECTED; AND (B) IF MADE BY A PERSON WHO IS AN AUTHORIZED PERSON UNDER THE FSMA, IS BEING MADE ONLY TO, OR DIRECTED ONLY AT, PERSONS WHO (I) ARE OUTSIDE THE UNITED KINGDOM, OR (II) HAVE PROFESSIONAL EXPERIENCE OF PARTICIPATING IN UNREGULATED SCHEMES (AS DEFINED FOR PURPOSES OF THE FINANCIAL SERVICES AND MARKETS ACT 2000 (PROMOTION OF COLLECTIVE INVESTMENT SCHEMES) (EXEMPTIONS) ORDER 2001 (AS AMENDED, THE “PROMOTION OF COLLECTIVE INVESTMENT SCHEMES EXEMPTIONS ORDER”)) AND QUALIFY AS INVESTMENT PROFESSIONALS IN ACCORDANCE WITH ARTICLE 14(5) OF THE PROMOTION OF COLLECTIVE INVESTMENT SCHEMES EXEMPTIONS ORDER, OR (III) ARE PERSONS FALLING WITHIN ARTICLE 22(2)(A) THROUGH (D) (HIGH NET WORTH COMPANIES, UNINCORPORATED ASSOCIATIONS, ETC.) OF THE PROMOTION OF COLLECTIVE INVESTMENT SCHEMES EXEMPTIONS ORDER, OR (IV) ARE PERSONS TO WHOM THE ISSUING ENTITY MAY LAWFULLY BE PROMOTED IN ACCORDANCE WITH SECTION 4.12 OF THE FCA HANDBOOK CONDUCT OF BUSINESS SOURCEBOOK.
THE OFFERED CERTIFICATES HAVE NOT BEEN AND WILL NOT BE REGISTERED UNDER THE FINANCIAL INSTRUMENTS AND EXCHANGE LAW OF JAPAN, AS AMENDED (THE “FIEL”), AND DISCLOSURE UNDER THE FIEL HAS NOT BEEN AND WILL NOT BE MADE WITH RESPECT TO THE OFFERED CERTIFICATES. ACCORDINGLY, EACH OF MORGAN STANLEY & CO. LLC, BOFA SECURITIES, INC., WELLS FARGO SECURITIES, LLC, Academy Securities, Inc. AND Drexel Hamilton, LLC HAS REPRESENTED AND AGREED THAT IT HAS NOT, DIRECTLY OR INDIRECTLY, OFFERED OR SOLD AND WILL NOT, DIRECTLY OR INDIRECTLY, OFFER OR SELL ANY OFFERED CERTIFICATES IN JAPAN OR TO, OR FOR THE BENEFIT OF, ANY RESIDENT OF JAPAN (WHICH TERM AS USED IN THIS MATERIAL MEANS ANY PERSON RESIDENT IN JAPAN, INCLUDING ANY CORPORATION OR OTHER ENTITY ORGANIZED UNDER THE LAWS OF JAPAN) OR TO OTHERS FOR REOFFERING OR RE SALE, DIRECTLY OR INDIRECTLY, IN JAPAN OR TO, OR FOR THE BENEFIT OF, ANY RESIDENT OF JAPAN EXCEPT PURSUANT TO AN EXEMPTION FROM THE REGISTRATION REQUIREMENTS OF, AND OTHERWISE IN COMPLIANCE WITH, THE FIEL AND OTHER RELEVANT LAWS, REGULATIONS AND MINISTERIAL GUIDELINES OF JAPAN. AS PART OF THIS OFFERING OF THE OFFERED CERTIFICATES, THE UNDERWRITERS MAY OFFER THE OFFERED CERTIFICATES IN JAPAN TO UP TO 49 OFFEREES IN ACCORDANCE WITH THE ABOVE PROVISIONS.
© 2021 Morgan Stanley