UNITED STATES
SECURITIES AND EXCHANGE COMMISSION
Washington, D.C. 20549
FORM N-CSR
CERTIFIED SHAREHOLDER REPORT OF REGISTERED
MANAGEMENT INVESTMENT COMPANIES
Investment Company Act file number 811-23762
Fidelity Greenwood Street Trust
(Exact name of registrant as specified in charter)
245 Summer St., Boston, Massachusetts 02210
(Address of principal executive offices) (Zip code)
Margaret Carey, Secretary
245 Summer St.
Boston, Massachusetts 02210
(Name and address of agent for service)
Registrant's telephone number, including area code:
617-563-7000
Date of fiscal year end: | January 31 |
Date of reporting period: | January 31, 2024 |
Item 1.
Reports to Stockholders
Fidelity® Hedged Equity Fund
Annual Report
January 31, 2024
Includes Fidelity and Fidelity Advisor share classes


Contents
To view a fund's proxy voting guidelines and proxy voting record for the 12-month period ended June 30, visit http://www.fidelity.com/proxyvotingresults or visit the Securities and Exchange Commission's (SEC) web site at http://www.sec.gov.
You may also call 1-800-544-8544 if you're an individual investing directly with Fidelity, call 1-800-835-5092 if you're a plan sponsor or participant with Fidelity as your recordkeeper or call 1-877-208-0098 on institutional accounts or if you're an advisor or invest through one to request a free copy of the proxy voting guidelines.
Standard & Poor's, S&P and S&P 500 are registered service marks of The McGraw-Hill Companies, Inc. and have been licensed for use by Fidelity Distributors Corporation.
Other third-party marks appearing herein are the property of their respective owners.
All other marks appearing herein are registered or unregistered trademarks or service marks of FMR LLC or an affiliated company. © 2024 FMR LLC. All rights reserved.
This report and the financial statements contained herein are submitted for the general information of the shareholders of the Fund. This report is not authorized for distribution to prospective investors in the Fund unless preceded or accompanied by an effective prospectus.
A fund files its complete schedule of portfolio holdings with the SEC for the first and third quarters of each fiscal year on Form N-PORT. Forms N-PORT are available on the SEC's web site at http://www.sec.gov. A fund's Forms N-PORT may be reviewed and copied at the SEC's Public Reference Room in Washington, DC. Information regarding the operation of the SEC's Public Reference Room may be obtained by calling 1-800-SEC-0330.
For a complete list of a fund's portfolio holdings, view the most recent holdings listing, semiannual report, or annual report on Fidelity's web site at http://www.fidelity.com, http://www.institutional.fidelity.com, or http://www.401k.com, as applicable.
NOT FDIC INSURED •MAY LOSE VALUE •NO BANK GUARANTEE
Neither the Fund nor Fidelity Distributors Corporation is a bank.
Average annual total return reflects the change in the value of an investment, assuming reinvestment of distributions from dividend income and capital gains (the profits earned upon the sale of securities that have grown in value, if any) and assuming a constant rate of performance each year. The hypothetical investment and the average annual total returns do not reflect the deduction of taxes that a shareholder would pay on fund distributions or the redemption of fund shares. During periods of reimbursement by Fidelity, a fund's total return will be greater than it would be had the reimbursement not occurred. How a fund did yesterday is no guarantee of how it will do tomorrow.
| Average Annual Total Returns | |||
Periods ended January 31, 2024 | Past 1 year | Life of Fund A |
Class A (incl. 5.75% sales charge) | 7.40% | 4.73% |
Class M (incl. 3.50% sales charge) | 9.66% | 6.19% |
Class C (incl. contingent deferred sales charge) | 12.13% | 8.35% |
| Fidelity® Hedged Equity Fund | 14.22% | 9.42% |
| Class I | 14.22% | 9.42% |
| Class Z | 14.30% | 9.47% |
A From September 1, 2022
Class C shares' contingent deferred sales charges included in the past one year and life of fund total return figures are 1% and 0%, respectively.
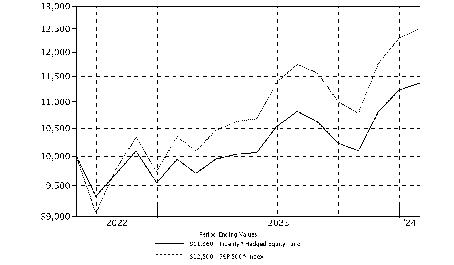
| $10,000 Over Life of Fund |
Let's say hypothetically that $10,000 was invested in Fidelity® Hedged Equity Fund, a class of the fund, on September 1, 2022, when the fund started. The chart shows how the value of your investment would have changed, and also shows how the S&P 500® Index performed over the same period. |
 |
Market Recap:
U.S. equities gained 20.82% for the 12 months ending January 31, 2024, according to the S&P 500® index, as a slowing in the pace of inflation and resilient late-cycle expansion of the U.S. economy provided a favorable backdrop for higher-risk assets for much of the period. The upturn was driven by a narrow set of firms in the information technology and communication services sectors, largely due to excitement for generative artificial intelligence. Monetary tightening by the U.S. Federal Reserve continued until late July, when the Fed said it was too soon to tell if its latest hike would conclude a series of increases aimed at cooling the economy and bringing down inflation. Since March 2022, the Fed has raised its benchmark interest rate 11 times before pausing and four times deciding to hold rates at a 22-year high while it observes inflation and the economy. After the Fed's November 1 meeting, when the central bank hinted it might be done raising rates, the S&P 500® reversed a three-month decline and gained 14.09% through year-end. The index added 1.68% in January, finishing the period just shy of a record close set on January 29. By sector for the full 12 months, tech (+53%) and communication services (+43%) led the way, followed by consumer discretionary (+20%). Industrials rose about 13% and the rate-sensitive financials sector gained 10%. In sharp contrast, utilities (-8%) and energy (-4%) lagged most, with the latter hampered by lower oil prices. Real estate (-2%) and materials (-1%) also lost ground.
Comments from Co-Portfolio Managers Eric Granat, Mitch Livstone and Zach Dewhirst:
For the year ending January 31, 2024, the fund's share classes gained 13% to 14%, about in line with the 14.80% return for the CBOE S&P 500 5% Put Protection Index and underperforming the 20.82% advance of the broad-based S&P 500 Index. The fund's slight underperformance relative to its supplemental benchmark, CBOE Put Protection Index, was attributable to its typically larger allocation to the protective put options compared to the index, which resulted in higher carrying cost during the period. The fund's relative underperformance against the S&P 500 Index was primarily due to the on-going cost to hedge the downside risk of the portfolio during a period of strong appreciation for the broader market. However, during the volatile month of October, the fund's defensive allocation to put options reduced unwanted exposure to market downside and dampened overall portfolio volatility.
Note to Shareholders:
On November 30, 2023, the Cboe S&P 500 5% Put Protection Index was added as a supplemental benchmark. This benchmark better reflects the fund's hedged S&P 500 strategy and will help investors assess fund performance. The Cboe S&P 500 5% Put Protection Index is designed to track the performance of a hypothetical risk-management strategy that consists of a long position indexed to the S&P 500 Index and a long position in the monthly 5% Out-of-the-Money SPX Put options.
The views expressed above reflect those of the portfolio manager(s) only through the end of the period as stated on the cover of this report and do not necessarily represent the views of Fidelity or any other person in the Fidelity organization. Any such views are subject to change at any time based upon market or other conditions and Fidelity disclaims any responsibility to update such views. These views may not be relied on as investment advice and, because investment decisions for a Fidelity fund are based on numerous factors, may not be relied on as an indication of trading intent on behalf of any Fidelity fund.
Top Holdings (% of Fund's net assets) | ||
| Microsoft Corp. | 7.2 | |
| Apple, Inc. | 6.7 | |
| NVIDIA Corp. | 3.8 | |
| Alphabet, Inc. Class A | 3.8 | |
| Amazon.com, Inc. | 3.4 | |
| Meta Platforms, Inc. Class A | 2.1 | |
| Berkshire Hathaway, Inc. Class B | 1.9 | |
| JPMorgan Chase & Co. | 1.5 | |
| iShares S&P 500 Index ETF | 1.4 | |
| Broadcom, Inc. | 1.4 | |
| 33.2 | ||
| Market Sectors (% of Fund's net assets) | ||
| Information Technology | 29.1 | |
| Financials | 12.9 | |
| Health Care | 12.3 | |
| Consumer Discretionary | 9.8 | |
| Communication Services | 8.5 | |
| Industrials | 8.0 | |
| Consumer Staples | 6.0 | |
| Energy | 3.6 | |
| Utilities | 2.3 | |
| Real Estate | 2.2 | |
| Materials | 2.1 | |
| Investment Companies | 1.4 | |
Asset Allocation (% of Fund's net assets) |
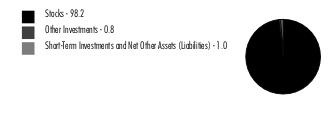 |
Showing Percentage of Net Assets
| Common Stocks - 96.8% | |||
| Shares | Value ($) | ||
| COMMUNICATION SERVICES - 8.5% | |||
| Diversified Telecommunication Services - 0.8% | |||
| Frontier Communications Parent, Inc. (a) | 2,693 | 66,329 | |
| Iridium Communications, Inc. | 795 | 28,827 | |
| Verizon Communications, Inc. | 37,618 | 1,593,122 | |
| 1,688,278 | |||
| Entertainment - 1.2% | |||
| Liberty Media Corp. Liberty Formula One Class A | 983 | 60,051 | |
| Madison Square Garden Sports Corp. (a) | 255 | 47,201 | |
| Netflix, Inc. (a) | 2,432 | 1,371,916 | |
| Spotify Technology SA (a) | 248 | 53,407 | |
| The Walt Disney Co. | 12,514 | 1,201,970 | |
| TKO Group Holdings, Inc. | 571 | 47,787 | |
| 2,782,332 | |||
| Interactive Media & Services - 5.9% | |||
| Alphabet, Inc. Class A (a) | 59,778 | 8,374,898 | |
| IAC, Inc. (a) | 583 | 29,272 | |
| Meta Platforms, Inc. Class A | 12,083 | 4,714,062 | |
| Pinterest, Inc. Class A (a) | 1,463 | 54,819 | |
| 13,173,051 | |||
| Media - 0.6% | |||
| Comcast Corp. Class A | 26,732 | 1,244,107 | |
| Liberty Media Corp. Liberty SiriusXM Class A | 2,109 | 64,093 | |
| Nexstar Media Group, Inc. Class A | 345 | 61,310 | |
| The Trade Desk, Inc. (a) | 470 | 32,162 | |
| 1,401,672 | |||
TOTAL COMMUNICATION SERVICES | 19,045,333 | ||
| CONSUMER DISCRETIONARY - 9.8% | |||
| Automobile Components - 0.1% | |||
| Autoliv, Inc. | 587 | 62,879 | |
| Gentex Corp. | 1,694 | 56,122 | |
| Lear Corp. | 660 | 87,714 | |
| Visteon Corp. (a) | 258 | 29,745 | |
| 236,460 | |||
| Automobiles - 1.4% | |||
| Ford Motor Co. | 37,010 | 433,757 | |
| Rivian Automotive, Inc. (a) | 1,109 | 16,979 | |
| Tesla, Inc. (a) | 14,818 | 2,775,263 | |
| 3,225,999 | |||
| Broadline Retail - 3.4% | |||
| Amazon.com, Inc. (a) | 48,559 | 7,536,357 | |
| Distributors - 0.2% | |||
| Genuine Parts Co. | 2,150 | 301,495 | |
| LKQ Corp. | 4,855 | 226,583 | |
| 528,078 | |||
| Diversified Consumer Services - 0.1% | |||
| H&R Block, Inc. | 1,158 | 54,241 | |
| Service Corp. International | 1,529 | 102,626 | |
| 156,867 | |||
| Hotels, Restaurants & Leisure - 1.9% | |||
| Aramark | 3,127 | 90,933 | |
| Booking Holdings, Inc. (a) | 206 | 722,539 | |
| Boyd Gaming Corp. | 2,314 | 146,916 | |
| Choice Hotels International, Inc. (b) | 732 | 88,660 | |
| Churchill Downs, Inc. | 747 | 90,365 | |
| Domino's Pizza, Inc. | 601 | 256,158 | |
| Doordash, Inc. (a) | 635 | 66,167 | |
| Draftkings Holdings, Inc. (a) | 901 | 35,184 | |
| Hyatt Hotels Corp. Class A | 1,190 | 152,760 | |
| Light & Wonder, Inc. Class A (a) | 1,089 | 87,534 | |
| Marriott Vacations Worldwide Corp. | 490 | 41,106 | |
| McDonald's Corp. | 5,829 | 1,706,265 | |
| MGM Resorts International (a) | 4,488 | 194,645 | |
| Penn Entertainment, Inc. (a) | 1,548 | 34,907 | |
| Planet Fitness, Inc. (a) | 554 | 37,539 | |
| Texas Roadhouse, Inc. Class A | 1,587 | 199,518 | |
| Vail Resorts, Inc. | 295 | 65,490 | |
| Wendy's Co. | 4,668 | 89,065 | |
| Wingstop, Inc. | 249 | 69,996 | |
| Wyndham Hotels & Resorts, Inc. | 1,023 | 79,722 | |
| Wynn Resorts Ltd. | 1,134 | 107,084 | |
| 4,362,553 | |||
| Household Durables - 0.4% | |||
| Leggett & Platt, Inc. | 1,780 | 41,314 | |
| NVR, Inc. (a) | 70 | 495,270 | |
| Taylor Morrison Home Corp. (a) | 790 | 41,191 | |
| Tempur Sealy International, Inc. | 1,898 | 94,691 | |
| Toll Brothers, Inc. | 1,454 | 144,455 | |
| TopBuild Corp. (a) | 158 | 58,323 | |
| 875,244 | |||
| Specialty Retail - 1.9% | |||
| AutoNation, Inc. (a) | 454 | 63,406 | |
| Burlington Stores, Inc. (a) | 411 | 78,563 | |
| Five Below, Inc. (a) | 207 | 37,148 | |
| Floor & Decor Holdings, Inc. Class A (a) | 609 | 61,241 | |
| Gap, Inc. | 1,783 | 33,324 | |
| Lithia Motors, Inc. Class A (sub. vtg.) | 212 | 62,508 | |
| Murphy U.S.A., Inc. | 276 | 97,296 | |
| Penske Automotive Group, Inc. | 617 | 91,544 | |
| RH (a) | 266 | 67,426 | |
| Ross Stores, Inc. | 4,770 | 669,136 | |
| The Home Depot, Inc. | 6,929 | 2,445,660 | |
| Ulta Beauty, Inc. (a) | 660 | 331,353 | |
| Valvoline, Inc. (a) | 1,265 | 46,160 | |
| Williams-Sonoma, Inc. | 318 | 61,498 | |
| 4,146,263 | |||
| Textiles, Apparel & Luxury Goods - 0.4% | |||
| NIKE, Inc. Class B | 7,831 | 795,081 | |
| Ralph Lauren Corp. | 1,159 | 166,514 | |
| 961,595 | |||
TOTAL CONSUMER DISCRETIONARY | 22,029,416 | ||
| CONSUMER STAPLES - 6.0% | |||
| Beverages - 1.8% | |||
| Brown-Forman Corp. Class B (non-vtg.) | 5,714 | 313,699 | |
| Keurig Dr. Pepper, Inc. | 16,591 | 521,621 | |
| PepsiCo, Inc. | 9,744 | 1,642,156 | |
| The Coca-Cola Co. | 27,505 | 1,636,272 | |
| 4,113,748 | |||
| Consumer Staples Distribution & Retail - 1.9% | |||
| Albertsons Companies, Inc. | 2,508 | 53,220 | |
| BJ's Wholesale Club Holdings, Inc. (a) | 1,232 | 79,267 | |
| Casey's General Stores, Inc. | 348 | 94,433 | |
| Costco Wholesale Corp. | 2,619 | 1,819,891 | |
| Performance Food Group Co. (a) | 876 | 63,668 | |
| Target Corp. | 3,930 | 546,584 | |
| U.S. Foods Holding Corp. (a) | 1,701 | 78,263 | |
| Walmart, Inc. | 8,490 | 1,402,973 | |
| 4,138,299 | |||
| Food Products - 0.8% | |||
| Campbell Soup Co. | 8,352 | 372,750 | |
| Darling Ingredients, Inc. (a) | 609 | 26,370 | |
| Flowers Foods, Inc. | 3,536 | 80,621 | |
| Ingredion, Inc. | 407 | 43,781 | |
| Kellanova | 10,952 | 599,732 | |
| Post Holdings, Inc. (a) | 1,561 | 144,970 | |
| The Hershey Co. | 3,202 | 619,715 | |
| 1,887,939 | |||
| Household Products - 1.5% | |||
| Colgate-Palmolive Co. | 12,046 | 1,014,273 | |
| Procter & Gamble Co. | 14,521 | 2,281,830 | |
| 3,296,103 | |||
TOTAL CONSUMER STAPLES | 13,436,089 | ||
| ENERGY - 3.6% | |||
| Energy Equipment & Services - 0.3% | |||
| Championx Corp. | 1,568 | 42,979 | |
| Schlumberger Ltd. | 10,722 | 522,161 | |
| TechnipFMC PLC | 2,871 | 55,525 | |
| Valaris Ltd. (a) | 776 | 48,011 | |
| Weatherford International PLC (a) | 657 | 58,834 | |
| 727,510 | |||
| Oil, Gas & Consumable Fuels - 3.3% | |||
| Antero Midstream GP LP | 5,075 | 62,118 | |
| Antero Resources Corp. (a) | 1,888 | 42,178 | |
| Cheniere Energy, Inc. | 663 | 108,725 | |
| Chesapeake Energy Corp. | 623 | 48,040 | |
| Chevron Corp. | 12,418 | 1,830,786 | |
| Chord Energy Corp. | 502 | 77,188 | |
| CNX Resources Corp. (a) | 2,265 | 45,753 | |
| Diamondback Energy, Inc. | 3,812 | 586,057 | |
| DT Midstream, Inc. | 742 | 39,838 | |
| Exxon Mobil Corp. | 27,115 | 2,787,693 | |
| Kinder Morgan, Inc. | 37,173 | 628,967 | |
| Marathon Oil Corp. | 18,312 | 418,429 | |
| Matador Resources Co. | 1,353 | 74,266 | |
| Murphy Oil Corp. | 2,511 | 97,176 | |
| Occidental Petroleum Corp. | 6,023 | 346,744 | |
| Ovintiv, Inc. | 2,149 | 91,161 | |
| Range Resources Corp. | 1,648 | 47,858 | |
| Southwestern Energy Co. (a) | 6,407 | 41,325 | |
| 7,374,302 | |||
TOTAL ENERGY | 8,101,812 | ||
| FINANCIALS - 12.9% | |||
| Banks - 3.0% | |||
| Bank of America Corp. | 56,568 | 1,923,878 | |
| Bank OZK | 1,057 | 47,681 | |
| BOK Financial Corp. | 467 | 39,153 | |
| Columbia Banking Systems, Inc. | 2,432 | 49,029 | |
| Commerce Bancshares, Inc. | 1,086 | 56,602 | |
| Cullen/Frost Bankers, Inc. | 518 | 54,970 | |
| First Citizens Bancshares, Inc. | 31 | 46,810 | |
| First Horizon National Corp. | 4,122 | 58,697 | |
| JPMorgan Chase & Co. | 19,029 | 3,317,896 | |
| New York Community Bancorp, Inc. | 4,348 | 28,132 | |
| Old National Bancorp, Indiana | 2,480 | 40,846 | |
| Pinnacle Financial Partners, Inc. | 1,192 | 105,349 | |
| Prosperity Bancshares, Inc. | 1,028 | 65,699 | |
| Synovus Financial Corp. | 1,320 | 49,711 | |
| U.S. Bancorp | 15,722 | 653,092 | |
| Wintrust Financial Corp. | 841 | 81,560 | |
| 6,619,105 | |||
| Capital Markets - 1.9% | |||
| Affiliated Managers Group, Inc. | 274 | 40,782 | |
| Ameriprise Financial, Inc. | 1,480 | 572,508 | |
| Ares Management Corp. | 1,553 | 188,658 | |
| Blackstone, Inc. | 5,287 | 657,967 | |
| Carlyle Group LP | 2,931 | 117,299 | |
| Charles Schwab Corp. | 9,491 | 597,174 | |
| Evercore, Inc. Class A | 671 | 115,231 | |
| Franklin Resources, Inc. | 8,639 | 230,057 | |
| Houlihan Lokey | 383 | 45,876 | |
| Interactive Brokers Group, Inc. | 944 | 83,780 | |
| Jefferies Financial Group, Inc. | 3,143 | 128,109 | |
| KKR & Co. LP | 2,150 | 186,147 | |
| Lazard, Inc. Class A | 1,192 | 46,464 | |
| LPL Financial | 270 | 64,581 | |
| Morgan Stanley | 12,122 | 1,057,523 | |
| SEI Investments Co. | 1,508 | 95,366 | |
| Stifel Financial Corp. | 1,138 | 83,017 | |
| Virtu Financial, Inc. Class A | 2,042 | 34,285 | |
| 4,344,824 | |||
| Consumer Finance - 0.5% | |||
| Ally Financial, Inc. | 3,161 | 115,945 | |
| American Express Co. | 4,913 | 986,236 | |
| OneMain Holdings, Inc. | 856 | 40,746 | |
| SLM Corp. | 2,459 | 48,885 | |
| 1,191,812 | |||
| Financial Services - 5.1% | |||
| Apollo Global Management, Inc. | 1,265 | 127,006 | |
| Berkshire Hathaway, Inc. Class B (a) | 11,269 | 4,324,366 | |
| Block, Inc. Class A (a) | 570 | 37,056 | |
| Equitable Holdings, Inc. | 3,573 | 116,801 | |
| Fidelity National Information Services, Inc. | 5,146 | 320,390 | |
| FleetCor Technologies, Inc. (a) | 1,103 | 319,793 | |
| MasterCard, Inc. Class A | 5,909 | 2,654,500 | |
| PayPal Holdings, Inc. (a) | 7,666 | 470,309 | |
| Visa, Inc. Class A | 10,891 | 2,976,075 | |
| Voya Financial, Inc. | 1,244 | 90,028 | |
| WEX, Inc. (a) | 213 | 43,535 | |
| 11,479,859 | |||
| Insurance - 2.2% | |||
| AFLAC, Inc. | 8,591 | 724,565 | |
| American Financial Group, Inc. | 979 | 117,872 | |
| Arch Capital Group Ltd. (a) | 4,618 | 380,662 | |
| Arthur J. Gallagher & Co. | 3,863 | 896,834 | |
| Fidelity National Financial, Inc. | 1,744 | 87,252 | |
| Loews Corp. | 5,857 | 426,741 | |
| Markel Group, Inc. (a) | 113 | 169,210 | |
| Old Republic International Corp. | 2,928 | 82,101 | |
| Prudential Financial, Inc. | 8,286 | 869,450 | |
| Reinsurance Group of America, Inc. | 304 | 52,863 | |
| RenaissanceRe Holdings Ltd. | 228 | 52,173 | |
| Unum Group | 1,038 | 50,177 | |
| W.R. Berkley Corp. | 6,613 | 541,472 | |
| Willis Towers Watson PLC | 1,539 | 379,056 | |
| 4,830,428 | |||
| Mortgage Real Estate Investment Trusts - 0.2% | |||
| AGNC Investment Corp. (b) | 5,703 | 54,064 | |
| Annaly Capital Management, Inc. | 4,008 | 76,914 | |
| Rithm Capital Corp. | 8,135 | 87,045 | |
| Starwood Property Trust, Inc. | 9,311 | 189,293 | |
| 407,316 | |||
TOTAL FINANCIALS | 28,873,344 | ||
| HEALTH CARE - 12.3% | |||
| Biotechnology - 2.1% | |||
| AbbVie, Inc. | 10,737 | 1,765,163 | |
| Alnylam Pharmaceuticals, Inc. (a) | 288 | 49,798 | |
| BioMarin Pharmaceutical, Inc. (a) | 1,147 | 101,028 | |
| Exelixis, Inc. (a) | 1,802 | 39,212 | |
| Gilead Sciences, Inc. | 10,788 | 844,269 | |
| Moderna, Inc. (a) | 2,578 | 260,507 | |
| Neurocrine Biosciences, Inc. (a) | 527 | 73,659 | |
| Regeneron Pharmaceuticals, Inc. (a) | 810 | 763,652 | |
| Sarepta Therapeutics, Inc. (a) | 338 | 40,219 | |
| United Therapeutics Corp. (a) | 205 | 44,030 | |
| Vertex Pharmaceuticals, Inc. (a) | 1,518 | 657,871 | |
| 4,639,408 | |||
| Health Care Equipment & Supplies - 2.5% | |||
| Abbott Laboratories | 12,216 | 1,382,240 | |
| Align Technology, Inc. (a) | 610 | 163,065 | |
| Boston Scientific Corp. (a) | 18,795 | 1,188,972 | |
| DexCom, Inc. (a) | 2,726 | 330,800 | |
| Envista Holdings Corp. (a) | 1,258 | 29,563 | |
| GE Healthcare Holding LLC | 3,997 | 293,220 | |
| Globus Medical, Inc. (a) | 1,115 | 58,861 | |
| Haemonetics Corp. (a) | 677 | 51,763 | |
| Hologic, Inc. (a) | 4,604 | 342,722 | |
| ICU Medical, Inc. (a) | 272 | 24,896 | |
| Inspire Medical Systems, Inc. (a) | 117 | 24,672 | |
| Intuitive Surgical, Inc. (a) | 2,089 | 790,102 | |
| Masimo Corp. (a) | 278 | 35,845 | |
| Penumbra, Inc. (a) | 159 | 40,098 | |
| ResMed, Inc. | 2,011 | 382,492 | |
| Shockwave Medical, Inc. (a) | 278 | 62,898 | |
| The Cooper Companies, Inc. | 872 | 325,282 | |
| 5,527,491 | |||
| Health Care Providers & Services - 2.6% | |||
| Acadia Healthcare Co., Inc. (a) | 779 | 63,987 | |
| Centene Corp. (a) | 5,629 | 423,920 | |
| Chemed Corp. | 137 | 81,212 | |
| CVS Health Corp. | 10,842 | 806,320 | |
| DaVita, Inc. (a) | 909 | 98,317 | |
| Encompass Health Corp. | 752 | 53,422 | |
| HCA Holdings, Inc. | 2,397 | 730,845 | |
| Humana, Inc. | 1,361 | 514,540 | |
| Tenet Healthcare Corp. (a) | 557 | 46,086 | |
| UnitedHealth Group, Inc. | 5,945 | 3,042,294 | |
| 5,860,943 | |||
| Health Care Technology - 0.0% | |||
| Veeva Systems, Inc. Class A (a) | 449 | 93,127 | |
| Life Sciences Tools & Services - 1.3% | |||
| Avantor, Inc. (a) | 2,956 | 67,958 | |
| Bruker Corp. | 509 | 36,399 | |
| Danaher Corp. | 4,552 | 1,092,070 | |
| ICON PLC (a) | 310 | 80,870 | |
| Medpace Holdings, Inc. (a) | 247 | 72,020 | |
| QIAGEN NV | 2,292 | 100,069 | |
| Thermo Fisher Scientific, Inc. | 2,567 | 1,383,562 | |
| 2,832,948 | |||
| Pharmaceuticals - 3.8% | |||
| Eli Lilly & Co. | 4,527 | 2,922,676 | |
| Jazz Pharmaceuticals PLC (a) | 383 | 47,002 | |
| Johnson & Johnson | 15,841 | 2,517,135 | |
| Merck & Co., Inc. | 16,467 | 1,988,884 | |
| Pfizer, Inc. | 33,702 | 912,650 | |
| Royalty Pharma PLC | 2,805 | 79,634 | |
| 8,467,981 | |||
TOTAL HEALTH CARE | 27,421,898 | ||
| INDUSTRIALS - 8.0% | |||
| Aerospace & Defense - 1.6% | |||
| BWX Technologies, Inc. | 737 | 60,051 | |
| Curtiss-Wright Corp. | 278 | 61,874 | |
| HEICO Corp. | 800 | 143,672 | |
| Howmet Aerospace, Inc. | 8,553 | 481,192 | |
| Lockheed Martin Corp. | 2,346 | 1,007,396 | |
| RTX Corp. | 10,391 | 946,828 | |
| The Boeing Co. (a) | 3,681 | 776,838 | |
| Woodward, Inc. | 413 | 56,899 | |
| 3,534,750 | |||
| Air Freight & Logistics - 0.5% | |||
| GXO Logistics, Inc. (a) | 676 | 36,761 | |
| United Parcel Service, Inc. Class B | 7,842 | 1,112,780 | |
| 1,149,541 | |||
| Building Products - 0.5% | |||
| Advanced Drain Systems, Inc. | 329 | 42,908 | |
| Allegion PLC (b) | 2,569 | 318,273 | |
| Builders FirstSource, Inc. (a) | 1,071 | 186,065 | |
| Carlisle Companies, Inc. | 523 | 164,358 | |
| Fortune Brands Innovations, Inc. | 1,455 | 112,893 | |
| Lennox International, Inc. | 391 | 167,411 | |
| Owens Corning | 806 | 122,133 | |
| Trex Co., Inc. (a) | 882 | 71,865 | |
| 1,185,906 | |||
| Commercial Services & Supplies - 0.9% | |||
| Cintas Corp. | 1,587 | 959,453 | |
| Clean Harbors, Inc. (a) | 285 | 47,869 | |
| RB Global, Inc. | 809 | 51,752 | |
| Republic Services, Inc. | 4,813 | 823,601 | |
| Tetra Tech, Inc. | 658 | 104,082 | |
| 1,986,757 | |||
| Construction & Engineering - 0.1% | |||
| AECOM | 1,099 | 96,921 | |
| EMCOR Group, Inc. | 251 | 57,256 | |
| Willscot Mobile Mini Holdings (a) | 889 | 42,050 | |
| 196,227 | |||
| Electrical Equipment - 0.4% | |||
| AMETEK, Inc. | 3,596 | 582,732 | |
| nVent Electric PLC | 2,188 | 131,368 | |
| Regal Rexnord Corp. | 491 | 65,529 | |
| Sensata Technologies, Inc. PLC | 1,710 | 61,851 | |
| 841,480 | |||
| Ground Transportation - 0.9% | |||
| J.B. Hunt Transport Services, Inc. | 2,011 | 404,171 | |
| Knight-Swift Transportation Holdings, Inc. Class A | 2,548 | 146,204 | |
| Landstar System, Inc. | 989 | 189,611 | |
| Ryder System, Inc. | 594 | 67,461 | |
| Saia, Inc. (a) | 221 | 99,578 | |
| Uber Technologies, Inc. (a) | 14,495 | 946,089 | |
| XPO, Inc. (a) | 758 | 64,764 | |
| 1,917,878 | |||
| Industrial Conglomerates - 0.6% | |||
| Honeywell International, Inc. | 6,690 | 1,353,119 | |
| Machinery - 1.8% | |||
| AGCO Corp. | 313 | 38,289 | |
| Caterpillar, Inc. | 3,818 | 1,146,584 | |
| CNH Industrial NV | 2,609 | 31,308 | |
| Donaldson Co., Inc. | 594 | 38,366 | |
| Dover Corp. | 4,557 | 682,547 | |
| Graco, Inc. | 1,903 | 162,326 | |
| IDEX Corp. | 1,918 | 405,657 | |
| ITT, Inc. | 901 | 108,823 | |
| Lincoln Electric Holdings, Inc. | 676 | 150,221 | |
| Middleby Corp. (a) | 840 | 118,499 | |
| Oshkosh Corp. | 460 | 50,646 | |
| PACCAR, Inc. | 6,375 | 639,986 | |
| Timken Co. | 670 | 54,880 | |
| Toro Co. | 372 | 34,403 | |
| Watts Water Technologies, Inc. Class A | 324 | 64,155 | |
| Westinghouse Air Brake Tech Co. | 2,325 | 305,900 | |
| 4,032,590 | |||
| Passenger Airlines - 0.2% | |||
| American Airlines Group, Inc. (a) | 18,503 | 263,298 | |
| United Airlines Holdings, Inc. (a) | 3,217 | 133,119 | |
| 396,417 | |||
| Professional Services - 0.3% | |||
| Booz Allen Hamilton Holding Corp. Class A | 1,079 | 151,891 | |
| CACI International, Inc. Class A (a) | 223 | 76,652 | |
| Clarivate PLC (a)(b) | 3,968 | 35,474 | |
| Genpact Ltd. | 1,397 | 50,152 | |
| KBR, Inc. | 1,453 | 75,716 | |
| Paylocity Holding Corp. (a) | 253 | 40,078 | |
| Science Applications International Corp. | 676 | 86,298 | |
| SS&C Technologies Holdings, Inc. | 3,083 | 188,125 | |
| TransUnion | 1,114 | 77,078 | |
| 781,464 | |||
| Trading Companies & Distributors - 0.2% | |||
| Air Lease Corp. Class A | 890 | 37,211 | |
| Ferguson PLC | 1,167 | 219,233 | |
| GATX Corp. | 547 | 67,090 | |
| MSC Industrial Direct Co., Inc. Class A | 384 | 37,893 | |
| SiteOne Landscape Supply, Inc. (a) | 219 | 33,846 | |
| Watsco, Inc. | 241 | 94,226 | |
| WESCO International, Inc. | 317 | 55,006 | |
| 544,505 | |||
TOTAL INDUSTRIALS | 17,920,634 | ||
| INFORMATION TECHNOLOGY - 29.1% | |||
| Communications Equipment - 0.8% | |||
| Ciena Corp. (a) | 1,047 | 55,491 | |
| Cisco Systems, Inc. | 32,919 | 1,651,875 | |
| Ubiquiti, Inc. (b) | 213 | 26,783 | |
| 1,734,149 | |||
| Electronic Equipment, Instruments & Components - 0.5% | |||
| Amphenol Corp. Class A | 9,707 | 981,378 | |
| Arrow Electronics, Inc. (a) | 646 | 71,803 | |
| TD SYNNEX Corp. | 708 | 70,786 | |
| 1,123,967 | |||
| IT Services - 1.6% | |||
| Accenture PLC Class A | 4,259 | 1,549,765 | |
| Amdocs Ltd. | 972 | 89,113 | |
| Cloudflare, Inc. (a) | 858 | 67,825 | |
| Cognizant Technology Solutions Corp. Class A | 5,490 | 423,389 | |
| GoDaddy, Inc. (a) | 1,189 | 126,819 | |
| IBM Corp. | 6,636 | 1,218,768 | |
| MongoDB, Inc. Class A (a) | 106 | 42,455 | |
| Snowflake, Inc. (a) | 242 | 47,345 | |
| Twilio, Inc. Class A (a) | 831 | 58,444 | |
| 3,623,923 | |||
| Semiconductors & Semiconductor Equipment - 8.5% | |||
| Advanced Micro Devices, Inc. (a) | 10,008 | 1,678,242 | |
| Amkor Technology, Inc. | 1,240 | 39,258 | |
| Broadcom, Inc. | 2,632 | 3,105,760 | |
| Cirrus Logic, Inc. (a) | 813 | 62,764 | |
| Entegris, Inc. | 1,317 | 155,011 | |
| GlobalFoundries, Inc. (a) | 583 | 32,053 | |
| Intel Corp. | 25,578 | 1,101,900 | |
| Lam Research Corp. | 1,531 | 1,263,335 | |
| Lattice Semiconductor Corp. (a) | 1,378 | 83,865 | |
| MACOM Technology Solutions Holdings, Inc. (a) | 448 | 38,631 | |
| Micron Technology, Inc. | 9,006 | 772,265 | |
| MKS Instruments, Inc. | 763 | 81,221 | |
| NVIDIA Corp. | 13,662 | 8,405,819 | |
| Onto Innovation, Inc. (a) | 467 | 75,421 | |
| Power Integrations, Inc. | 859 | 64,391 | |
| Qualcomm, Inc. | 8,052 | 1,195,803 | |
| Rambus, Inc. (a) | 990 | 67,845 | |
| Skyworks Solutions, Inc. | 3,944 | 411,990 | |
| Synaptics, Inc. (a) | 439 | 46,890 | |
| Teradyne, Inc. | 3,748 | 362,019 | |
| Universal Display Corp. | 372 | 63,154 | |
| Wolfspeed, Inc. (a) | 456 | 14,843 | |
| 19,122,480 | |||
| Software - 11.0% | |||
| Adobe, Inc. (a) | 2,615 | 1,615,495 | |
| Atlassian Corp. PLC (a) | 270 | 67,438 | |
| Bentley Systems, Inc. Class B | 718 | 36,187 | |
| Bill Holdings, Inc. (a) | 503 | 39,259 | |
| Crowdstrike Holdings, Inc. (a) | 510 | 149,175 | |
| Datadog, Inc. Class A (a) | 449 | 55,874 | |
| DocuSign, Inc. (a) | 1,001 | 60,981 | |
| Dolby Laboratories, Inc. Class A | 398 | 33,106 | |
| Dropbox, Inc. Class A (a) | 3,746 | 118,673 | |
| Dynatrace, Inc. (a) | 1,024 | 58,368 | |
| Five9, Inc. (a) | 469 | 35,578 | |
| Guidewire Software, Inc. (a) | 560 | 62,541 | |
| HubSpot, Inc. (a) | 192 | 117,312 | |
| Intuit, Inc. | 1,720 | 1,085,888 | |
| Manhattan Associates, Inc. (a) | 590 | 143,110 | |
| Microsoft Corp. | 40,541 | 16,118,272 | |
| Oracle Corp. | 10,093 | 1,127,388 | |
| Palantir Technologies, Inc. (a) | 2,895 | 46,581 | |
| Palo Alto Networks, Inc. (a) | 2,082 | 704,778 | |
| Qualys, Inc. (a) | 373 | 70,560 | |
| Salesforce, Inc. (a) | 5,540 | 1,557,239 | |
| ServiceNow, Inc. (a) | 1,291 | 988,131 | |
| Splunk, Inc. (a) | 425 | 65,182 | |
| Unity Software, Inc. (a) | 843 | 27,313 | |
| Workday, Inc. Class A (a) | 482 | 140,296 | |
| Zoom Video Communications, Inc. Class A (a) | 936 | 60,475 | |
| Zscaler, Inc. (a) | 377 | 88,848 | |
| 24,674,048 | |||
| Technology Hardware, Storage & Peripherals - 6.7% | |||
| Apple, Inc. | 80,907 | 14,919,251 | |
TOTAL INFORMATION TECHNOLOGY | 65,197,818 | ||
| MATERIALS - 2.1% | |||
| Chemicals - 1.5% | |||
| Ashland, Inc. | 638 | 59,730 | |
| Axalta Coating Systems Ltd. (a) | 4,311 | 139,763 | |
| Celanese Corp. Class A | 2,280 | 333,541 | |
| Dow, Inc. | 11,153 | 597,801 | |
| Eastman Chemical Co. | 2,935 | 245,219 | |
| Element Solutions, Inc. | 2,073 | 46,083 | |
| Linde PLC | 3,982 | 1,612,033 | |
| Olin Corp. | 1,087 | 56,600 | |
| RPM International, Inc. | 1,302 | 138,871 | |
| Westlake Corp. | 396 | 54,787 | |
| 3,284,428 | |||
| Construction Materials - 0.1% | |||
| Eagle Materials, Inc. | 673 | 152,286 | |
| Containers & Packaging - 0.2% | |||
| Aptargroup, Inc. | 638 | 82,863 | |
| Berry Global Group, Inc. | 1,293 | 84,640 | |
| Crown Holdings, Inc. | 1,244 | 110,094 | |
| Graphic Packaging Holding Co. | 2,996 | 76,428 | |
| Sealed Air Corp. | 2,025 | 69,964 | |
| Silgan Holdings, Inc. | 934 | 42,908 | |
| Sonoco Products Co. | 1,063 | 60,485 | |
| 527,382 | |||
| Metals & Mining - 0.3% | |||
| Alcoa Corp. | 1,397 | 41,561 | |
| Cleveland-Cliffs, Inc. (a) | 2,471 | 49,544 | |
| Newmont Corp. | 10,627 | 366,738 | |
| Reliance Steel & Aluminum Co. | 206 | 58,797 | |
| Royal Gold, Inc. | 264 | 30,199 | |
| Southern Copper Corp. | 1,075 | 88,258 | |
| United States Steel Corp. (b) | 1,634 | 76,831 | |
| 711,928 | |||
TOTAL MATERIALS | 4,676,024 | ||
| REAL ESTATE - 2.2% | |||
| Equity Real Estate Investment Trusts (REITs) - 2.2% | |||
| Agree Realty Corp. | 906 | 54,007 | |
| American Homes 4 Rent Class A | 4,584 | 160,669 | |
| American Tower Corp. | 3,912 | 765,383 | |
| Americold Realty Trust | 1,432 | 39,380 | |
| Apartment Income (REIT) Corp. | 1,207 | 39,457 | |
| Brixmor Property Group, Inc. | 3,190 | 71,584 | |
| Camden Property Trust (SBI) | 3,592 | 337,073 | |
| CubeSmart | 1,502 | 64,916 | |
| EastGroup Properties, Inc. | 406 | 72,037 | |
| Equity Lifestyle Properties, Inc. | 2,309 | 156,296 | |
| Federal Realty Investment Trust (SBI) | 2,114 | 215,057 | |
| First Industrial Realty Trust, Inc. | 1,294 | 66,667 | |
| Gaming & Leisure Properties | 4,056 | 185,156 | |
| Healthcare Trust of America, Inc. | 2,797 | 45,060 | |
| Healthpeak Properties, Inc. | 18,511 | 342,454 | |
| Kite Realty Group Trust | 2,104 | 45,026 | |
| Lamar Advertising Co. Class A | 922 | 96,515 | |
| Medical Properties Trust, Inc. (b) | 4,276 | 13,256 | |
| Mid-America Apartment Communities, Inc. | 3,783 | 478,096 | |
| NNN (REIT), Inc. | 2,967 | 119,689 | |
| Omega Healthcare Investors, Inc. | 2,007 | 58,203 | |
| Prologis, Inc. | 8,343 | 1,056,975 | |
| Realty Income Corp. | 873 | 47,482 | |
| Rexford Industrial Realty, Inc. | 1,458 | 76,676 | |
| Stag Industrial, Inc. | 3,013 | 111,300 | |
| Sun Communities, Inc. | 1,118 | 140,141 | |
| WP Carey, Inc. | 2,159 | 133,772 | |
| 4,992,327 | |||
| Real Estate Management & Development - 0.0% | |||
| Jones Lang LaSalle, Inc. (a) | 82 | 14,519 | |
TOTAL REAL ESTATE | 5,006,846 | ||
| UTILITIES - 2.3% | |||
| Electric Utilities - 1.1% | |||
| Exelon Corp. | 18,936 | 659,162 | |
| NextEra Energy, Inc. | 15,656 | 917,911 | |
| OGE Energy Corp. | 5,489 | 182,454 | |
| Xcel Energy, Inc. | 12,561 | 752,027 | |
| 2,511,554 | |||
| Gas Utilities - 0.0% | |||
| National Fuel Gas Co. | 773 | 36,455 | |
| Independent Power and Renewable Electricity Producers - 0.0% | |||
| Vistra Corp. | 1,283 | 52,641 | |
| Multi-Utilities - 1.1% | |||
| Ameren Corp. | 8,986 | 625,156 | |
| CMS Energy Corp. | 11,327 | 647,451 | |
| DTE Energy Co. | 6,519 | 687,233 | |
| NiSource, Inc. | 17,545 | 455,644 | |
| 2,415,484 | |||
| Water Utilities - 0.1% | |||
| Essential Utilities, Inc. | 4,539 | 162,769 | |
TOTAL UTILITIES | 5,178,903 | ||
| TOTAL COMMON STOCKS (Cost $188,676,100) | 216,888,117 | ||
| Money Market Funds - 1.2% | |||
| Shares | Value ($) | ||
| Fidelity Cash Central Fund 5.39% (c) | 1,999,877 | 2,000,277 | |
| Fidelity Securities Lending Cash Central Fund 5.39% (c)(d) | 585,216 | 585,275 | |
| TOTAL MONEY MARKET FUNDS (Cost $2,585,552) | 2,585,552 | ||
| Equity Funds - 1.4% | |||
| Shares | Value ($) | ||
| Domestic Equity Funds - 1.4% | |||
iShares S&P 500 Index ETF (Cost $2,979,503) | 6,407 | 3,108,676 | |
| Purchased Options - 0.8% | ||||||
| Counterparty | Number of Contracts | Notional Amount($) | Exercise Price ($) | Expiration Date | Value ($) | |
| Put Options | ||||||
| S&P 500 Index | Chicago Board Options Exchange | 171 | 82,860,615 | 3,100 | 11/15/24 | 294,975 |
| S&P 500 Index | Chicago Board Options Exchange | 177 | 85,768,005 | 4,340 | 02/16/24 | 34,958 |
| S&P 500 Index | Chicago Board Options Exchange | 155 | 75,107,575 | 3,200 | 12/20/24 | 347,975 |
| S&P 500 Index | Chicago Board Options Exchange | 184 | 89,159,960 | 4,490 | 03/15/24 | 240,120 |
| S&P 500 Index | Chicago Board Options Exchange | 141 | 68,323,665 | 3,250 | 01/17/25 | 365,895 |
| S&P 500 Index | Chicago Board Options Exchange | 170 | 82,376,050 | 4,560 | 04/19/24 | 574,600 |
| 1,858,523 | ||||||
TOTAL PURCHASED OPTIONS (Cost $4,226,131) | 1,858,523 | |||||
For the period, the average monthly notional amount at value for purchased options in the aggregate was $343,830,579.
| TOTAL INVESTMENT IN SECURITIES - 100.2% (Cost $198,467,286) | 224,440,868 |
NET OTHER ASSETS (LIABILITIES) - (0.2)% | (454,791) |
| NET ASSETS - 100.0% | 223,986,077 |
Security Type Abbreviations
| ETF | - | EXCHANGE-TRADED FUND |
Legend
| (a) | Non-income producing |
| (b) | Security or a portion of the security is on loan at period end. |
| (c) | Affiliated fund that is generally available only to investment companies and other accounts managed by Fidelity Investments. The rate quoted is the annualized seven-day yield of the fund at period end. A complete unaudited listing of the fund's holdings as of its most recent quarter end is available upon request. In addition, each Fidelity Central Fund's financial statements, which are not covered by the Fund's Report of Independent Registered Public Accounting Firm, are available on the SEC's website or upon request. |
| (d) | Investment made with cash collateral received from securities on loan. |
Affiliated Central Funds
Fiscal year to date information regarding the Fund's investments in Fidelity Central Funds, including the ownership percentage, is presented below.
| Affiliate | Value, beginning of period ($) | Purchases ($) | Sales Proceeds ($) | Dividend Income ($) | Realized Gain (loss) ($) | Change in Unrealized appreciation (depreciation) ($) | Value, end of period ($) | % ownership, end of period |
| Fidelity Cash Central Fund 5.39% | 575,547 | 166,377,517 | 164,952,787 | 66,330 | - | - | 2,000,277 | 0.0% |
| Fidelity Securities Lending Cash Central Fund 5.39% | - | 28,150,251 | 27,564,976 | 10,454 | - | - | 585,275 | 0.0% |
| Total | 575,547 | 194,527,768 | 192,517,763 | 76,784 | - | - | 2,585,552 | |
Amounts in the dividend income column in the above table include any capital gain distributions from underlying funds, which are presented in the corresponding line item in the Statement of Operations, if applicable.
Amounts in the dividend income column for Fidelity Securities Lending Cash Central Fund represents the income earned on investing cash collateral, less rebates paid to borrowers and any lending agent fees associated with the loan, plus any premium payments received for lending certain types of securities.
Amounts included in the purchases and sales proceeds columns may include in-kind transactions, if applicable.
Investment Valuation
The following is a summary of the inputs used, as of January 31, 2024, involving the Fund's assets and liabilities carried at fair value. The inputs or methodology used for valuing securities may not be an indication of the risk associated with investing in those securities. For more information on valuation inputs, and their aggregation into the levels used below, please refer to the Investment Valuation section in the accompanying Notes to Financial Statements.
| Valuation Inputs at Reporting Date: | ||||
| Description | Total ($) | Level 1 ($) | Level 2 ($) | Level 3 ($) |
Investments in Securities: | ||||
| Equities: | ||||
Communication Services | 19,045,333 | 19,045,333 | - | - |
Consumer Discretionary | 22,029,416 | 22,029,416 | - | - |
Consumer Staples | 13,436,089 | 13,436,089 | - | - |
Energy | 8,101,812 | 8,101,812 | - | - |
Financials | 28,873,344 | 28,873,344 | - | - |
Health Care | 27,421,898 | 27,421,898 | - | - |
Industrials | 17,920,634 | 17,920,634 | - | - |
Information Technology | 65,197,818 | 65,197,818 | - | - |
Materials | 4,676,024 | 4,676,024 | - | - |
Real Estate | 5,006,846 | 5,006,846 | - | - |
Utilities | 5,178,903 | 5,178,903 | - | - |
| Money Market Funds | 2,585,552 | 2,585,552 | - | - |
| Equity Funds | 3,108,676 | 3,108,676 | - | - |
| Purchased Options | 1,858,523 | 1,858,523 | - | - |
| Total Investments in Securities: | 224,440,868 | 224,440,868 | - | - |
Value of Derivative Instruments
The following table is a summary of the Fund's value of derivative instruments by primary risk exposure as of January 31, 2024. For additional information on derivative instruments, please refer to the Derivative Instruments section in the accompanying Notes to Financial Statements.
Primary Risk Exposure / Derivative Type | Value | |
| Asset ($) | Liability ($) | |
| Equity Risk | ||
Purchased Options (a) | 1,858,523 | 0 |
| Total Equity Risk | 1,858,523 | 0 |
| Total Value of Derivatives | 1,858,523 | 0 |
(a)Gross value is presented in the Statement of Assets and Liabilities in the Investments in Securities at value line-item.
| Statement of Assets and Liabilities | ||||
| January 31, 2024 | ||||
| Assets | ||||
| Investment in securities, at value (including securities loaned of $560,939) - See accompanying schedule: | ||||
Unaffiliated issuers (cost $195,881,734) | $ | 221,855,316 | ||
Fidelity Central Funds (cost $2,585,552) | 2,585,552 | |||
| Total Investment in Securities (cost $198,467,286) | $ | 224,440,868 | ||
| Cash | 6 | |||
| Receivable for fund shares sold | 89,167 | |||
| Dividends receivable | 141,470 | |||
| Distributions receivable from Fidelity Central Funds | 6,945 | |||
| Receivable from investment adviser for expense reductions | 6,803 | |||
| Other receivables | 171 | |||
Total assets | 224,685,430 | |||
| Liabilities | ||||
| Payable for fund shares redeemed | $ | 7,083 | ||
| Accrued management fee | 100,897 | |||
| Distribution and service plan fees payable | 1,068 | |||
| Other affiliated payables | 5,030 | |||
| Collateral on securities loaned | 585,275 | |||
| Total Liabilities | 699,353 | |||
| Net Assets | $ | 223,986,077 | ||
| Net Assets consist of: | ||||
| Paid in capital | $ | 202,796,609 | ||
| Total accumulated earnings (loss) | 21,189,468 | |||
| Net Assets | $ | 223,986,077 | ||
| Net Asset Value and Maximum Offering Price | ||||
| Class A : | ||||
Net Asset Value and redemption price per share ($1,292,316 ÷ 115,006 shares)(a) | $ | 11.24 | ||
| Maximum offering price per share (100/94.25 of $11.24) | $ | 11.93 | ||
| Class M : | ||||
Net Asset Value and redemption price per share ($644,871 ÷ 57,420 shares)(a) | $ | 11.23 | ||
| Maximum offering price per share (100/96.50 of $11.23) | $ | 11.64 | ||
| Class C : | ||||
Net Asset Value and offering price per share ($678,318 ÷ 60,556 shares)(a) | $ | 11.20 | ||
| Fidelity Hedged Equity Fund : | ||||
Net Asset Value, offering price and redemption price per share ($219,075,549 ÷ 19,500,754 shares) | $ | 11.23 | ||
| Class I : | ||||
Net Asset Value, offering price and redemption price per share ($984,292 ÷ 87,616 shares) | $ | 11.23 | ||
| Class Z : | ||||
Net Asset Value, offering price and redemption price per share ($1,310,731 ÷ 116,570 shares) | $ | 11.24 | ||
(a)Redemption price per share is equal to net asset value less any applicable contingent deferred sales charge. | ||||
| Statement of Operations | ||||
Year ended January 31, 2024 | ||||
| Investment Income | ||||
| Dividends | $ | 2,284,805 | ||
| Income from Fidelity Central Funds (including $10,454 from security lending) | 76,784 | |||
| Total Income | 2,361,589 | |||
| Expenses | ||||
| Management fee | $ | 804,545 | ||
| Distribution and service plan fees | 11,681 | |||
| Independent trustees' fees and expenses | 97,955 | |||
| Total expenses before reductions | 914,181 | |||
| Expense reductions | (98,515) | |||
| Total expenses after reductions | 815,666 | |||
| Net Investment income (loss) | 1,545,923 | |||
| Realized and Unrealized Gain (Loss) | ||||
| Net realized gain (loss) on: | ||||
| Investment Securities: | ||||
| Unaffiliated issuers | (3,975,632) | |||
| Total net realized gain (loss) | (3,975,632) | |||
| Change in net unrealized appreciation (depreciation) on investment securities | 23,819,426 | |||
| Net gain (loss) | 19,843,794 | |||
| Net increase (decrease) in net assets resulting from operations | $ | 21,389,717 | ||
| Statement of Changes in Net Assets | ||||
Year ended January 31, 2024 | For the period September 1, 2022 (commencement of operations) through January 31, 2023 | |||
| Increase (Decrease) in Net Assets | ||||
| Operations | ||||
| Net investment income (loss) | $ | 1,545,923 | $ | 183,275 |
| Net realized gain (loss) | (3,975,632) | (831,002) | ||
| Change in net unrealized appreciation (depreciation) | 23,819,426 | 2,154,156 | ||
| Net increase (decrease) in net assets resulting from operations | 21,389,717 | 1,506,429 | ||
| Distributions to shareholders | (1,544,823) | (161,856) | ||
| Share transactions - net increase (decrease) | 153,894,084 | 48,902,526 | ||
| Total increase (decrease) in net assets | 173,738,978 | 50,247,099 | ||
| Net Assets | ||||
| Beginning of period | 50,247,099 | - | ||
| End of period | $ | 223,986,077 | $ | 50,247,099 |
Financial Highlights
| Fidelity Advisor® Hedged Equity Fund Class A |
| Years ended January 31, | 2024 | 2023 A | ||
Selected Per-Share Data | ||||
| Net asset value, beginning of period | $ | 9.91 | $ | 10.00 |
| Income from Investment Operations | ||||
Net investment income (loss) B,C | .08 | .04 | ||
| Net realized and unrealized gain (loss) | 1.30 | (.10) | ||
| Total from investment operations | 1.38 | (.06) | ||
| Distributions from net investment income | (.05) | (.03) | ||
| Total distributions | (.05) | (.03) | ||
| Net asset value, end of period | $ | 11.24 | $ | 9.91 |
Total Return D,E,F | 13.95% | (.59)% | ||
Ratios to Average Net Assets C,G,H | ||||
| Expenses before reductions | .89% | 1.34% I | ||
| Expenses net of fee waivers, if any | .80% | .80% I | ||
| Expenses net of all reductions | .80% | .79% I | ||
| Net investment income (loss) | .81% | .90% I | ||
| Supplemental Data | ||||
| Net assets, end of period (000 omitted) | $ | 1,292 | $ | 1,317 |
Portfolio turnover rate J | 38% | 21% K |
AFor the period September 1, 2022 (commencement of operations) through January 31, 2023.
BCalculated based on average shares outstanding during the period.
CNet investment income (loss) is affected by the timing of the declaration of dividends by any underlying mutual funds or exchange-traded funds (ETFs). Net investment income (loss) of any mutual funds or ETFs is not included in the Fund's net investment income (loss) ratio.
DTotal returns for periods of less than one year are not annualized.
ETotal returns would have been lower if certain expenses had not been reduced during the applicable periods shown.
FTotal returns do not include the effect of the sales charges.
GFees and expenses of any underlying mutual funds or exchange-traded funds (ETFs) are not included in the Fund's expense ratio. The Fund indirectly bears its proportionate share of these expenses. For additional expense information related to investments in Fidelity Central Funds, please refer to the "Investments in Fidelity Central Funds" note found in the Notes to Financial Statements section of the most recent Annual or Semi-Annual report.
HExpense ratios reflect operating expenses of the class. Expenses before reductions do not reflect amounts reimbursed, waived, or reduced through arrangements with the investment adviser, brokerage services, or other offset arrangements, if applicable, and do not represent the amount paid by the class during periods when reimbursements, waivers or reductions occur.
IAnnualized.
JAmount does not include the portfolio activity of any underlying mutual funds or exchange-traded funds (ETFs).
KAmount not annualized.
| Fidelity Advisor® Hedged Equity Fund Class M |
| Years ended January 31, | 2024 | 2023 A | ||
Selected Per-Share Data | ||||
| Net asset value, beginning of period | $ | 9.91 | $ | 10.00 |
| Income from Investment Operations | ||||
Net investment income (loss) B,C | .06 | .03 | ||
| Net realized and unrealized gain (loss) | 1.29 | (.10) | ||
| Total from investment operations | 1.35 | (.07) | ||
| Distributions from net investment income | (.03) | (.02) | ||
| Total distributions | (.03) | (.02) | ||
| Net asset value, end of period | $ | 11.23 | $ | 9.91 |
Total Return D,E,F | 13.64% | (.71)% | ||
Ratios to Average Net Assets C,G,H | ||||
| Expenses before reductions | 1.14% | 1.54% I | ||
| Expenses net of fee waivers, if any | 1.05% | 1.05% I | ||
| Expenses net of all reductions | 1.05% | 1.04% I | ||
| Net investment income (loss) | .56% | .65% I | ||
| Supplemental Data | ||||
| Net assets, end of period (000 omitted) | $ | 645 | $ | 509 |
Portfolio turnover rate J | 38% | 21% K |
AFor the period September 1, 2022 (commencement of operations) through January 31, 2023.
BCalculated based on average shares outstanding during the period.
CNet investment income (loss) is affected by the timing of the declaration of dividends by any underlying mutual funds or exchange-traded funds (ETFs). Net investment income (loss) of any mutual funds or ETFs is not included in the Fund's net investment income (loss) ratio.
DTotal returns for periods of less than one year are not annualized.
ETotal returns would have been lower if certain expenses had not been reduced during the applicable periods shown.
FTotal returns do not include the effect of the sales charges.
GFees and expenses of any underlying mutual funds or exchange-traded funds (ETFs) are not included in the Fund's expense ratio. The Fund indirectly bears its proportionate share of these expenses. For additional expense information related to investments in Fidelity Central Funds, please refer to the "Investments in Fidelity Central Funds" note found in the Notes to Financial Statements section of the most recent Annual or Semi-Annual report.
HExpense ratios reflect operating expenses of the class. Expenses before reductions do not reflect amounts reimbursed, waived, or reduced through arrangements with the investment adviser, brokerage services, or other offset arrangements, if applicable, and do not represent the amount paid by the class during periods when reimbursements, waivers or reductions occur.
IAnnualized.
JAmount does not include the portfolio activity of any underlying mutual funds or exchange-traded funds (ETFs).
KAmount not annualized.
| Fidelity Advisor® Hedged Equity Fund Class C |
| Years ended January 31, | 2024 | 2023 A | ||
Selected Per-Share Data | ||||
| Net asset value, beginning of period | $ | 9.90 | $ | 10.00 |
| Income from Investment Operations | ||||
Net investment income (loss) B,C | .01 | .01 | ||
| Net realized and unrealized gain (loss) | 1.29 | (.11) | ||
| Total from investment operations | 1.30 | (.10) | ||
| Distributions from net investment income | - | - D | ||
| Net asset value, end of period | $ | 11.20 | $ | 9.90 |
Total Return E,F,G | 13.13% | (.97)% | ||
Ratios to Average Net Assets C,H,I | ||||
| Expenses before reductions | 1.64% | 2.04% J | ||
| Expenses net of fee waivers, if any | 1.55% | 1.55% J | ||
| Expenses net of all reductions | 1.55% | 1.54% J | ||
| Net investment income (loss) | .06% | .15% J | ||
| Supplemental Data | ||||
| Net assets, end of period (000 omitted) | $ | 678 | $ | 526 |
Portfolio turnover rate K | 38% | 21% L |
AFor the period September 1, 2022 (commencement of operations) through January 31, 2023.
BCalculated based on average shares outstanding during the period.
CNet investment income (loss) is affected by the timing of the declaration of dividends by any underlying mutual funds or exchange-traded funds (ETFs). Net investment income (loss) of any mutual funds or ETFs is not included in the Fund's net investment income (loss) ratio.
DAmount represents less than $.005 per share.
ETotal returns for periods of less than one year are not annualized.
FTotal returns would have been lower if certain expenses had not been reduced during the applicable periods shown.
GTotal returns do not include the effect of the contingent deferred sales charge.
HFees and expenses of any underlying mutual funds or exchange-traded funds (ETFs) are not included in the Fund's expense ratio. The Fund indirectly bears its proportionate share of these expenses. For additional expense information related to investments in Fidelity Central Funds, please refer to the "Investments in Fidelity Central Funds" note found in the Notes to Financial Statements section of the most recent Annual or Semi-Annual report.
IExpense ratios reflect operating expenses of the class. Expenses before reductions do not reflect amounts reimbursed, waived, or reduced through arrangements with the investment adviser, brokerage services, or other offset arrangements, if applicable, and do not represent the amount paid by the class during periods when reimbursements, waivers or reductions occur.
JAnnualized.
KAmount does not include the portfolio activity of any underlying mutual funds or exchange-traded funds (ETFs).
LAmount not annualized.
| Fidelity® Hedged Equity Fund |
| Years ended January 31, | 2024 | 2023 A | ||
Selected Per-Share Data | ||||
| Net asset value, beginning of period | $ | 9.91 | $ | 10.00 |
| Income from Investment Operations | ||||
Net investment income (loss) B,C | .11 | .05 | ||
| Net realized and unrealized gain (loss) | 1.30 | (.10) | ||
| Total from investment operations | 1.41 | (.05) | ||
| Distributions from net investment income | (.09) | (.04) | ||
| Total distributions | (.09) | (.04) | ||
| Net asset value, end of period | $ | 11.23 | $ | 9.91 |
Total Return D,E | 14.22% | (.54)% | ||
Ratios to Average Net Assets C,F,G | ||||
| Expenses before reductions | .61% | 1.12% H | ||
| Expenses net of fee waivers, if any | .55% | .55% H | ||
| Expenses net of all reductions | .55% | .54% H | ||
| Net investment income (loss) | 1.06% | 1.15% H | ||
| Supplemental Data | ||||
| Net assets, end of period (000 omitted) | $ | 219,076 | $ | 46,678 |
Portfolio turnover rate I | 38% | 21% J |
AFor the period September 1, 2022 (commencement of operations) through January 31, 2023.
BCalculated based on average shares outstanding during the period.
CNet investment income (loss) is affected by the timing of the declaration of dividends by any underlying mutual funds or exchange-traded funds (ETFs). Net investment income (loss) of any mutual funds or ETFs is not included in the Fund's net investment income (loss) ratio.
DTotal returns for periods of less than one year are not annualized.
ETotal returns would have been lower if certain expenses had not been reduced during the applicable periods shown.
FFees and expenses of any underlying mutual funds or exchange-traded funds (ETFs) are not included in the Fund's expense ratio. The Fund indirectly bears its proportionate share of these expenses. For additional expense information related to investments in Fidelity Central Funds, please refer to the "Investments in Fidelity Central Funds" note found in the Notes to Financial Statements section of the most recent Annual or Semi-Annual report.
GExpense ratios reflect operating expenses of the class. Expenses before reductions do not reflect amounts reimbursed, waived, or reduced through arrangements with the investment adviser, brokerage services, or other offset arrangements, if applicable, and do not represent the amount paid by the class during periods when reimbursements, waivers or reductions occur.
HAnnualized.
IAmount does not include the portfolio activity of any underlying mutual funds or exchange-traded funds (ETFs).
JAmount not annualized.
| Fidelity Advisor® Hedged Equity Fund Class I |
| Years ended January 31, | 2024 | 2023 A | ||
Selected Per-Share Data | ||||
| Net asset value, beginning of period | $ | 9.91 | $ | 10.00 |
| Income from Investment Operations | ||||
Net investment income (loss) B,C | .11 | .05 | ||
| Net realized and unrealized gain (loss) | 1.30 | (.10) | ||
| Total from investment operations | 1.41 | (.05) | ||
| Distributions from net investment income | (.09) | (.04) | ||
| Total distributions | (.09) | (.04) | ||
| Net asset value, end of period | $ | 11.23 | $ | 9.91 |
Total Return D,E | 14.22% | (.54)% | ||
Ratios to Average Net Assets C,F,G | ||||
| Expenses before reductions | .63% | 1.04% H | ||
| Expenses net of fee waivers, if any | .55% | .55% H | ||
| Expenses net of all reductions | .55% | .55% H | ||
| Net investment income (loss) | 1.06% | 1.15% H | ||
| Supplemental Data | ||||
| Net assets, end of period (000 omitted) | $ | 984 | $ | 497 |
Portfolio turnover rate I | 38% | 21% J |
AFor the period September 1, 2022 (commencement of operations) through January 31, 2023.
BCalculated based on average shares outstanding during the period.
CNet investment income (loss) is affected by the timing of the declaration of dividends by any underlying mutual funds or exchange-traded funds (ETFs). Net investment income (loss) of any mutual funds or ETFs is not included in the Fund's net investment income (loss) ratio.
DTotal returns for periods of less than one year are not annualized.
ETotal returns would have been lower if certain expenses had not been reduced during the applicable periods shown.
FFees and expenses of any underlying mutual funds or exchange-traded funds (ETFs) are not included in the Fund's expense ratio. The Fund indirectly bears its proportionate share of these expenses. For additional expense information related to investments in Fidelity Central Funds, please refer to the "Investments in Fidelity Central Funds" note found in the Notes to Financial Statements section of the most recent Annual or Semi-Annual report.
GExpense ratios reflect operating expenses of the class. Expenses before reductions do not reflect amounts reimbursed, waived, or reduced through arrangements with the investment adviser, brokerage services, or other offset arrangements, if applicable, and do not represent the amount paid by the class during periods when reimbursements, waivers or reductions occur.
HAnnualized.
IAmount does not include the portfolio activity of any underlying mutual funds or exchange-traded funds (ETFs).
JAmount not annualized.
| Fidelity Advisor® Hedged Equity Fund Class Z |
| Years ended January 31, | 2024 | 2023 A | ||
Selected Per-Share Data | ||||
| Net asset value, beginning of period | $ | 9.91 | $ | 10.00 |
| Income from Investment Operations | ||||
Net investment income (loss) B,C | .12 | .05 | ||
| Net realized and unrealized gain (loss) | 1.29 | (.10) | ||
| Total from investment operations | 1.41 | (.05) | ||
| Distributions from net investment income | (.08) | (.04) | ||
| Total distributions | (.08) | (.04) | ||
| Net asset value, end of period | $ | 11.24 | $ | 9.91 |
Total Return D,E | 14.30% | (.54)% | ||
Ratios to Average Net Assets C,F,G | ||||
| Expenses before reductions | .59% | 1.01% H | ||
| Expenses net of fee waivers, if any | .50% | .50% H | ||
| Expenses net of all reductions | .50% | .50% H | ||
| Net investment income (loss) | 1.11% | 1.20% H | ||
| Supplemental Data | ||||
| Net assets, end of period (000 omitted) | $ | 1,311 | $ | 720 |
Portfolio turnover rate I | 38% | 21% J |
AFor the period September 1, 2022 (commencement of operations) through January 31, 2023.
BCalculated based on average shares outstanding during the period.
CNet investment income (loss) is affected by the timing of the declaration of dividends by any underlying mutual funds or exchange-traded funds (ETFs). Net investment income (loss) of any mutual funds or ETFs is not included in the Fund's net investment income (loss) ratio.
DTotal returns for periods of less than one year are not annualized.
ETotal returns would have been lower if certain expenses had not been reduced during the applicable periods shown.
FFees and expenses of any underlying mutual funds or exchange-traded funds (ETFs) are not included in the Fund's expense ratio. The Fund indirectly bears its proportionate share of these expenses. For additional expense information related to investments in Fidelity Central Funds, please refer to the "Investments in Fidelity Central Funds" note found in the Notes to Financial Statements section of the most recent Annual or Semi-Annual report.
GExpense ratios reflect operating expenses of the class. Expenses before reductions do not reflect amounts reimbursed, waived, or reduced through arrangements with the investment adviser, brokerage services, or other offset arrangements, if applicable, and do not represent the amount paid by the class during periods when reimbursements, waivers or reductions occur.
HAnnualized.
IAmount does not include the portfolio activity of any underlying mutual funds or exchange-traded funds (ETFs).
JAmount not annualized.
For the period ended January 31, 2024
1. Organization.
Fidelity Hedged Equity Fund (the Fund) is a fund of Fidelity Greenwood Street Trust (the Trust) and is authorized to issue an unlimited number of shares. The Trust is registered under the Investment Company Act of 1940, as amended (the 1940 Act), as an open-end management investment company organized as a Delaware statutory trust. The Fund offers Class A, Class M, Class C, Fidelity Hedged Equity Fund, Class I and Class Z shares, each of which has equal rights as to assets and voting privileges. Class A, Class M, Class C, and Class I and Class Z are Fidelity Advisor classes. Each class has exclusive voting rights with respect to matters that affect that class. Class C shares will automatically convert to Class A shares after a holding period of eight years from the initial date of purchase, with certain exceptions.
2. Investments in Fidelity Central Funds.
Funds may invest in Fidelity Central Funds, which are open-end investment companies generally available only to other investment companies and accounts managed by the investment adviser and its affiliates. The Schedule of Investments lists any Fidelity Central Funds held as an investment as of period end, but does not include the underlying holdings of each Fidelity Central Fund. An investing fund indirectly bears its proportionate share of the expenses of the underlying Fidelity Central Funds.
Based on its investment objective, each Fidelity Central Fund may invest or participate in various investment vehicles or strategies that are similar to those of the investing fund. These strategies are consistent with the investment objectives of the investing fund and may involve certain economic risks which may cause a decline in value of each of the Fidelity Central Funds and thus a decline in the value of the investing fund.
| Fidelity Central Fund | Investment Manager | Investment Objective | Investment Practices | Expense RatioA |
| Fidelity Money Market Central Funds | Fidelity Management & Research Company LLC (FMR) | Each fund seeks to obtain a high level of current income consistent with the preservation of capital and liquidity. | Short-term Investments | Less than .005% |
A Expenses expressed as a percentage of average net assets and are as of each underlying Central Fund's most recent annual or semi-annual shareholder report.
A complete unaudited list of holdings for each Fidelity Central Fund is available upon request or at the Securities and Exchange Commission website at www.sec.gov. In addition, the financial statements of the Fidelity Central Funds which contain the significant accounting policies (including investment valuation policies) of those funds, and are not covered by the Report of Independent Registered Public Accounting Firm, are available on the Securities and Exchange Commission website or upon request.
3. Significant Accounting Policies.
The Fund is an investment company and applies the accounting and reporting guidance of the Financial Accounting Standards Board (FASB) Accounting Standards Codification Topic 946 Financial Services - Investment Companies. The financial statements have been prepared in conformity with accounting principles generally accepted in the United States of America (GAAP), which require management to make certain estimates and assumptions at the date of the financial statements. Actual results could differ from those estimates. Subsequent events, if any, through the date that the financial statements were issued have been evaluated in the preparation of the financial statements. The Fund's Schedule of Investments lists any underlying mutual funds or exchange-traded funds (ETFs) but does not include the underlying holdings of these funds. The following summarizes the significant accounting policies of the Fund:
Investment Valuation. Investments are valued as of 4:00 p.m. Eastern time on the last calendar day of the period. The Board of Trustees (the Board) has designated the Fund's investment adviser as the valuation designee responsible for the fair valuation function and performing fair value determinations as needed. The investment adviser has established a Fair Value Committee (the Committee) to carry out the day-to-day fair valuation responsibilities and has adopted policies and procedures to govern the fair valuation process and the activities of the Committee. In accordance with these fair valuation policies and procedures, which have been approved by the Board, the Fund attempts to obtain prices from one or more third party pricing services or brokers to value its investments. When current market prices, quotations or currency exchange rates are not readily available or reliable, investments will be fair valued in good faith by the Committee, in accordance with the policies and procedures. Factors used in determining fair value vary by investment type and may include market or investment specific events, transaction data, estimated cash flows, and market observations of comparable investments. The frequency that the fair valuation procedures are used cannot be predicted and they may be utilized to a significant extent. The Committee manages the Fund's fair valuation practices and maintains the fair valuation policies and procedures. The Fund's investment adviser reports to the Board information regarding the fair valuation process and related material matters.
The Fund categorizes the inputs to valuation techniques used to value its investments into a disclosure hierarchy consisting of three levels as shown below:
Level 1 - unadjusted quoted prices in active markets for identical investments
Level 2 - other significant observable inputs (including quoted prices for similar investments, interest rates, prepayment speeds, etc.)
Level 3 - unobservable inputs (including the Fund's own assumptions based on the best information available)
Valuation techniques used to value the Fund's investments by major category are as follows:
Equity securities, including restricted securities, for which market quotations are readily available, are valued at the last reported sale price or official closing price as reported by a third party pricing service on the primary market or exchange on which they are traded and are categorized as Level 1 in the hierarchy. In the event there were no sales during the day or closing prices are not available, securities are valued at the last quoted bid price or may be valued using the last available price and are generally categorized as Level 2 in the hierarchy. For foreign equity securities, when market or security specific events arise, comparisons to the valuation of American Depositary Receipts (ADRs), futures contracts, Exchange-Traded Funds (ETFs) and certain indexes as well as quoted prices for similar securities may be used and would be categorized as Level 2 in the hierarchy. For equity securities, including restricted securities, where observable inputs are limited, assumptions about market activity and risk are used and these securities may be categorized as Level 3 in the hierarchy.
Exchange-Traded Funds (ETFs) are valued at their last sale price or official closing price as reported by a third party pricing service on the primary market or exchange on which they are traded and are categorized as Level 1 in the hierarchy. In the event there were no sales during the day but the exchange reports a closing bid level, ETFs are valued at the closing bid and would be categorized as Level 1 in the hierarchy. In the event there was no closing bid, ETFs may be valued by another method that the Board believes reflects fair value in accordance with the Board's fair value pricing policies and may be categorized as Level 2 in the hierarchy.
Exchange-traded options are valued using the last sale price or, in the absence of a sale, the last offering price and are categorized as Level 1 in the hierarchy. Investments in open-end mutual funds, including the Fidelity Central Funds, are valued at their closing net asset value (NAV) each business day and are categorized as Level 1 in the hierarchy.
Changes in valuation techniques may result in transfers in or out of an assigned level within the disclosure hierarchy. The aggregate value of investments by input level as of January 31, 2024 is included at the end of the Fund's Schedule of Investments.
Investment Transactions and Income. For financial reporting purposes, the Fund's investment holdings and NAV include trades executed through the end of the last business day of the period. The NAV per share for processing shareholder transactions is calculated as of the close of business of the New York Stock Exchange (NYSE), normally 4:00 p.m. Eastern time and includes trades executed through the end of the prior business day. Gains and losses on securities sold are determined on the basis of identified cost. Commissions paid to certain brokers with whom the investment adviser, or its affiliates, places trades on behalf of a fund include an amount in addition to trade execution, which may be rebated back to a fund. Any such rebates are included in net realized gain (loss) on investments in the Statement of Operations. Dividend income is recorded on the ex-dividend date, except for certain dividends from foreign securities where the ex-dividend date may have passed, which are recorded as soon as the Fund is informed of the ex-dividend date. Non-cash dividends included in dividend income, if any, are recorded at the fair market value of the securities received. Income and capital gain distributions from Fidelity Central Funds, if any, are recorded on the ex-dividend date. Certain distributions received by the Fund represent a return of capital or capital gain. The Fund determines the components of these distributions subsequent to the ex-dividend date, based upon receipt of tax filings or other correspondence relating to the underlying investment. These distributions are recorded as a reduction of cost of investments and/or as a realized gain.
Class Allocations and Expenses. Investment income, realized and unrealized capital gains and losses, common expenses of a fund, and certain fund-level expense reductions, if any, are allocated daily on a pro-rata basis to each class based on the relative net assets of each class to the total net assets of a fund. Each class differs with respect to transfer agent and distribution and service plan fees incurred, as applicable. Certain expense reductions may also differ by class, if applicable. For the reporting period, the allocated portion of income and expenses to each class as a percent of its average net assets may vary due to the timing of recording these transactions in relation to fluctuating net assets of the classes. Expenses directly attributable to a fund are charged to that fund. Expenses attributable to more than one fund are allocated among the respective funds on the basis of relative net assets or other appropriate methods. Expenses included in the accompanying financial statements reflect the expenses of that fund and do not include any expenses associated with any underlying mutual funds or exchange-traded funds (ETFs). Although not included in a fund's expenses, a fund indirectly bears its proportionate share of these expenses through the net asset value of each underlying mutual fund or exchange-traded fund (ETF). Expense estimates are accrued in the period to which they relate and adjustments are made when actual amounts are known.
Income Tax Information and Distributions to Shareholders. Each year, the Fund intends to qualify as a regulated investment company under Subchapter M of the Internal Revenue Code, including distributing substantially all of its taxable income and realized gains. As a result, no provision for U.S. Federal income taxes is required. As of January 31, 2024, the Fund did not have any unrecognized tax benefits in the financial statements; nor is the Fund aware of any tax positions for which it is reasonably possible that the total amounts of unrecognized tax benefits will significantly change in the next twelve months. The Fund files a U.S. federal tax return, in addition to state and local tax returns as required. The Fund's federal income tax returns are subject to examination by the Internal Revenue Service (IRS) for a period of three fiscal years after they are filed. State and local tax returns may be subject to examination for an additional fiscal year depending on the jurisdiction.
Distributions are declared and recorded on the ex-dividend date. Income and capital gain distributions are declared separately for each class. Income and capital gain distributions are determined in accordance with income tax regulations, which may differ from GAAP.
Capital accounts within the financial statements are adjusted for permanent book-tax differences. These adjustments have no impact on net assets or the results of operations. Capital accounts are not adjusted for temporary book-tax differences which will reverse in a subsequent period.
Book-tax differences are primarily due to options, partnerships, capital loss carryforwards and losses deferred due to option transactions and wash sales.
As of period end, the cost and unrealized appreciation (depreciation) in securities, and derivatives if applicable, for federal income tax purposes were as follows:
| Gross unrealized appreciation | $33,090,465 |
| Gross unrealized depreciation | (4,952,930) |
| Net unrealized appreciation (depreciation) | $28,137,535 |
| Tax Cost | $196,303,333 |
The tax-based components of distributable earnings as of period end were as follows:
| Undistributed ordinary income | $21,842 |
| Capital loss carryforward | $(6,844,800) |
| Net unrealized appreciation (depreciation) on securities and other investments | $28,012,426 |
Capital loss carryforwards are only available to offset future capital gains of the Fund to the extent provided by regulations and may be limited. The capital loss carryforward information presented below, including any applicable limitation, is estimated as of fiscal period end and is subject to adjustment.
| Short-term | $(1,879,602) |
| Long-term | (4,965,198) |
Total capital loss carryforward | $(6,844,800) |
The tax character of distributions paid was as follows:
| January 31, 2024 | January 31, 2023A | |
| Ordinary Income | $1,544,823 | $161,856 |
A For the period September 1, 2022 (commencement of operations) through January 31, 2023.
4. Derivative Instruments.
Risk Exposures and the Use of Derivative Instruments. The Fund's investment objectives allow for various types of derivative instruments, including options. Derivatives are investments whose value is primarily derived from underlying assets, indices or reference rates and may be transacted on an exchange or over-the-counter (OTC). Derivatives may involve a future commitment to buy or sell a specified asset based on specified terms, to exchange future cash flows at periodic intervals based on a notional principal amount, or for one party to make one or more payments upon the occurrence of specified events in exchange for periodic payments from the other party.
Derivatives were used to increase returns and to manage exposure to certain risks as defined below. The success of any strategy involving derivatives depends on analysis of numerous economic factors, and if the strategies for investment do not work as intended, the objectives may not be achieved.
Derivatives were used to increase or decrease exposure to the following risk(s):
| Equity Risk | Equity risk relates to the fluctuations in the value of financial instruments as a result of changes in market prices (other than those arising from interest rate risk or foreign exchange risk), whether caused by factors specific to an individual investment, its issuer, or all factors affecting all instruments traded in a market or market segment. |
Funds are also exposed to additional risks from investing in derivatives, such as liquidity risk and counterparty credit risk. Liquidity risk is the risk that a fund will be unable to close out the derivative in the open market in a timely manner. Counterparty credit risk is the risk that the counterparty will not be able to fulfill its obligation to a fund. Counterparty credit risk related to exchange-traded contracts may be mitigated by the protection provided by the exchange on which they trade.
Investing in derivatives may involve greater risks than investing in the underlying assets directly and, to varying degrees, may involve risk of loss in excess of any initial investment and collateral received and amounts recognized in the Statement of Assets and Liabilities. In addition, there may be the risk that the change in value of the derivative contract does not correspond to the change in value of the underlying instrument.
Options. Options give the purchaser the right, but not the obligation, to buy (call) or sell (put) an underlying security or financial instrument at an agreed exercise or strike price between or on certain dates. Options obligate the seller (writer) to buy (put) or sell (call) an underlying instrument at the exercise or strike price or cash settle an underlying derivative instrument if the holder exercises the option on or before the expiration date. Exchange-traded options were used to manage exposure to the market.
Upon entering into an options contract, a fund will pay or receive a premium. Premiums paid on purchased options are reflected as cost of investments and premiums received on written options are reflected as a liability on the Statement of Assets and Liabilities. Certain options may be purchased or written with premiums to be paid or received on a future date. Options are valued daily and any unrealized appreciation (depreciation) is reflected in total accumulated earnings (loss) in the Statement of Assets and Liabilities. When an option is exercised, the cost or proceeds of the underlying instrument purchased or sold is adjusted by the amount of the premium. When an option is closed, a gain or loss is realized depending on whether the proceeds or amount paid for the closing sale transaction is greater or less than the premium received or paid. When an option expires, gains and losses are realized to the extent of premiums received and paid, respectively. The net realized and unrealized gains (losses) on purchased options are included in the Statement of Operations in net realized gain (loss) and change in net unrealized appreciation (depreciation) on investment securities. The net realized gain (loss) and change in net unrealized appreciation (depreciation) on written options are presented in the Statement of Operations.
Any open options at period end are presented in the Schedule of Investments under the captions "Purchased Options," "Purchased Swaptions," "Written Options" and "Written Swaptions," as applicable, and are representative of volume of activity during the period unless an average notional amount is presented.
Writing puts and buying calls tend to increase exposure to the underlying instrument while buying puts and writing calls tend to decrease exposure to the underlying instrument. For purchased options, risk of loss is limited to the premium paid, and for written options, risk of loss is the change in value in excess of the premium received.
5. Purchases and Sales of Investments.
Purchases and sales of securities, other than short-term securities and in-kind transactions, as applicable, are noted in the table below.
| Purchases ($) | Sales ($) | |
| Fidelity Hedged Equity Fund | 200,791,777 | 55,486,266 |
6. Fees and Other Transactions with Affiliates.
Management Fee. Fidelity Diversifying Solutions LLC (the investment adviser) and its affiliates provide the Fund with investment management related services for which each class of the Fund pays a monthly management fee. Under the management contract, the investment adviser pays all other operating expenses, except the compensation of the independent Trustees, distribution and service plan fees, and certain miscellaneous expenses such as proxy and shareholder meeting expenses. During the period, the management fee for each class of the Fund was as follows:
| Annual % of Class-Level Average Net Assets | |
| Class A | .55% |
| Class M | .55% |
| Class C | .55% |
| Fidelity Hedged Equity Fund | .55% |
| Class I | .55% |
| Class Z | .50% |
Distribution and Service Plan Fees. In accordance with Rule 12b-1 of the 1940 Act, the Fund has adopted separate Distribution and Service Plans for each class of shares. Certain classes pay Fidelity Distributors Company LLC (FDC), an affiliate of the investment adviser, separate Distribution and Service Fees, each of which is based on an annual percentage of each class' average net assets. In addition, FDC may pay financial intermediaries for selling shares of the Fund and providing shareholder support services. For the period, the Distribution and Service Fee rates, total fees and amounts retained by FDC were as follows:
| Distribution Fee | Service Fee | Total Fees | Retained by FDC | |
| Class A | -% | .25% | $3,285 | $1,406 |
| Class M | .25% | .25% | 2,740 | 2,586 |
| Class C | .75% | .25% | 5,656 | 5,452 |
| $11,681 | $9,444 |
Sales Load. FDC may receive a front-end sales charge of up to 5.75% for selling Class A shares and 3.50% for selling Class M shares, some of which is paid to financial intermediaries for selling shares of the Fund. Depending on the holding period, FDC may receive contingent deferred sales charges levied on Class A, Class M and Class C redemptions. The deferred sales charges are 1.00% for Class C shares, 1.00% for certain purchases of Class A shares and .25% for certain purchases of Class M shares.
For the period, sales charge amounts retained by FDC were as follows:
| Retained by FDC | |
| Class A | $949 |
| Class M | 212 |
| $1,161 |
Brokerage Commissions. A portion of portfolio transactions were placed with brokerage firms which are affiliates of the investment adviser. Brokerage commissions are included in net realized gain (loss) and change in net unrealized appreciation (depreciation) in the Statement of Operations. The commissions paid to these affiliated firms were as follows:
| Amount | |
| Fidelity Hedged Equity Fund | $1,568 |
Interfund Trades. Funds may purchase from or sell securities to other Fidelity Funds under procedures adopted by the Board. The procedures have been designed to ensure these interfund trades are executed in accordance with Rule 17a-7 of the 1940 Act. Any interfund trades are included within the respective purchases and sales amounts shown in the Purchases and Sales of Investments note. Interfund trades during the period are noted in the table below.
| Purchases ($) | Sales ($) | Realized Gain (Loss) ($) | |
| Fidelity Hedged Equity Fund | 504,245 | 3,038,267 | (7,496) |
7. Committed Line of Credit.
Certain Funds participate with other funds managed by the investment adviser or an affiliate in a $4.25 billion credit facility (the "line of credit") to be utilized for temporary or emergency purposes to fund shareholder redemptions or for other short-term liquidity purposes. The participating funds have agreed to pay commitment fees on their pro-rata portion of the line of credit, which are reflected in Miscellaneous expenses on the Statement of Operations, and are listed below. During the period, there were no borrowings on this line of credit.
8. Security Lending.
Funds lend portfolio securities from time to time in order to earn additional income. Lending agents are used, including National Financial Services (NFS), an affiliate of the investment adviser. Pursuant to a securities lending agreement, NFS will receive a fee, which is capped at 9.9% of a fund's daily lending revenue, for its services as lending agent. A fund may lend securities to certain qualified borrowers, including NFS. On the settlement date of the loan, a fund receives collateral (in the form of U.S. Treasury obligations, letters of credit and/or cash) against the loaned securities and maintains collateral in an amount not less than 100% of the market value of the loaned securities during the period of the loan. The market value of the loaned securities is determined at the close of business of a fund and any additional required collateral is delivered to a fund on the next business day. A fund or borrower may terminate the loan at any time, and if the borrower defaults on its obligation to return the securities loaned because of insolvency or other reasons, a fund may apply collateral received from the borrower against the obligation. A fund may experience delays and costs in recovering the securities loaned. Any cash collateral received is invested in the Fidelity Securities Lending Cash Central Fund. Any loaned securities are identified as such in the Schedule of Investments, and the value of loaned securities and cash collateral at period end, as applicable, are presented in the Statement of Assets and Liabilities. Security lending income represents the income earned on investing cash collateral, less rebates paid to borrowers and any lending agent fees associated with the loan, plus any premium payments received for lending certain types of securities. Security lending income is presented in the Statement of Operations as a component of income from Fidelity Central Funds. Affiliated security lending activity, if any, was as follows:
| Total Security Lending Fees Paid to NFS | Security Lending Income From Securities Loaned to NFS | Value of Securities Loaned to NFS at Period End | |
| Fidelity Hedged Equity Fund | $1,054 | $- | $- |
9. Expense Reductions.
The investment adviser contractually agreed to reimburse expenses of each class to the extent annual operating expenses exceeded certain levels of class-level average net assets as noted in the table below. This reimbursement will remain in place through May 31, 2025. Some expenses, for example certain miscellaneous expenses such as proxy and shareholder meeting expenses, are excluded from this reimbursement.
The following classes were in reimbursement during the period:
| Expense Limitations | Reimbursement | |
| Class A | .80% | $1,240 |
| Class M | 1.05% | 504 |
| Class C | 1.55% | 523 |
| Fidelity Hedged Equity Fund | .55% | 94,033 |
| Class I | .55% | 548 |
| Class Z | .50% | 821 |
| $97,669 |
Through arrangements with the Fund's custodian, credits realized as a result of certain uninvested cash balances were used to reduce the Fund's expenses. During the period, custodian credits reduced the Fund's expenses by $846.
10. Distributions to Shareholders.
Distributions to shareholders of each class were as follows:
Year ended January 31, 2024 | Year ended January 31, 2023A | |
| Fidelity Hedged Equity Fund | ||
| Distributions to shareholders | ||
| Class A | $6,146 | $2,528 |
| Class M | 1,668 | 958 |
| Class C | - | 150 |
| Fidelity Hedged Equity Fund | 1,521,057 | 154,020 |
| Class I | 7,129 | 1,750 |
| Class Z | 8,823 | 2,450 |
Total | $1,544,823 | $161,856 |
A For the period September 1, 2022 (commencement of operations) through January 31, 2023.
11. Share Transactions.
Share transactions for each class were as follows and may contain in-kind transactions, automatic conversions between classes or exchanges between affiliated funds:
| Shares | Shares | Dollars | Dollars | |
Year ended January 31, 2024 | Year ended January 31, 2023A | Year ended January 31, 2024 | Year ended January 31, 2023A | |
| Fidelity Hedged Equity Fund | ||||
| Class A | ||||
| Shares sold | 21,779 | 133,546 | $227,205 | $1,303,675 |
| Reinvestment of distributions | 576 | 260 | 6,146 | 2,528 |
| Shares redeemed | (40,298) | (857) | (425,903) | (8,250) |
| Net increase (decrease) | (17,943) | 132,949 | $(192,552) | $1,297,953 |
| Class M | ||||
| Shares sold | 7,667 | 51,229 | $82,888 | $511,835 |
| Reinvestment of distributions | 156 | 98 | 1,668 | 958 |
| Shares redeemed | (1,730) | - | (18,904) | - |
| Net increase (decrease) | 6,093 | 51,327 | $65,652 | $512,793 |
| Class C | ||||
| Shares sold | 12,925 | 53,128 | $136,244 | $530,661 |
| Reinvestment of distributions | - | 15 | - | 150 |
| Shares redeemed | (5,512) | - | (57,957) | - |
| Net increase (decrease) | 7,413 | 53,143 | $78,287 | $530,811 |
| Fidelity Hedged Equity Fund | ||||
| Shares sold | 16,485,931 | 4,777,239 | $171,136,667 | $45,999,665 |
| Reinvestment of distributions | 137,835 | 15,347 | 1,483,791 | 149,478 |
| Shares redeemed | (1,832,355) | (83,243) | (19,523,269) | (808,623) |
| Net increase (decrease) | 14,791,411 | 4,709,343 | $153,097,189 | $45,340,520 |
| Class I | ||||
| Shares sold | 46,971 | 50,000 | $492,760 | $500,000 |
| Reinvestment of distributions | 664 | 180 | 7,129 | 1,750 |
| Shares redeemed | (10,199) | - | (110,354) | - |
| Net increase (decrease) | 37,436 | 50,180 | $389,535 | $501,750 |
| Class Z | ||||
| Shares sold | 45,118 | 72,944 | $467,939 | $721,934 |
| Reinvestment of distributions | 823 | 252 | 8,823 | 2,450 |
| Shares redeemed | (1,976) | (591) | (20,789) | (5,685) |
| Net increase (decrease) | 43,965 | 72,605 | $455,973 | $718,699 |
A For the period September 1, 2022 (commencement of operations) through January 31, 2023.
12. Other.
A fund's organizational documents provide former and current trustees and officers with a limited indemnification against liabilities arising in connection with the performance of their duties to the fund. In the normal course of business, a fund may also enter into contracts that provide general indemnifications. A fund's maximum exposure under these arrangements is unknown as this would be dependent on future claims that may be made against a fund. The risk of material loss from such claims is considered remote.
In addition, at the end of the period, the following mutual funds managed by the investment adviser or its affiliates were the owners of record of 10% or more of the total outstanding shares.
| VIP FundsManager 50% Portfolio | VIP FundsManager 60% Portfolio | VIP FundsManager 70% Portfolio | |
| Fidelity Hedged Equity Fund | 25% | 36% | 12% |
Mutual funds managed by the investment adviser or its affiliates, in aggregate, were the owners of record of more than 20% of the total outstanding shares.
| Fund | % of shares held |
| Fidelity Hedged Equity Fund | 82% |
13. Risk and Uncertainties.
Many factors affect a fund's performance. Developments that disrupt global economies and financial markets, such as pandemics, epidemics, outbreaks of infectious diseases, war, terrorism, and environmental disasters, may significantly affect a fund's investment performance. The effects of these developments to a fund will be impacted by the types of securities in which a fund invests, the financial condition, industry, economic sector, and geographic location of an issuer, and a fund's level of investment in the securities of that issuer. Significant concentrations in security types, issuers, industries, sectors, and geographic locations may magnify the factors that affect a fund's performance.
To the Board of Trustees of Fidelity Greenwood Street Trust and the Shareholders of Fidelity Hedged Equity Fund:
Opinion on the Financial Statements and Financial Highlights
We have audited the accompanying statement of assets and liabilities of Fidelity Hedged Equity Fund (the "Fund"), a fund of Fidelity Greenwood Street Trust, including the schedule of investments, as of January 31, 2024, the related statement of operations for the year then ended, and the statement of changes in net assets and the financial highlights for the year then ended and for the period from September 1, 2022 (commencement of operations) through January 31, 2023, and the related notes. In our opinion, the financial statements and financial highlights present fairly, in all material respects, the financial position of the Fund as of January 31, 2024, and the results of its operations for the year then ended, and the changes in its net assets and the financial highlights for the year then ended and for the period from September 1, 2022 (commencement of operations) through January 31, 2023, in conformity with accounting principles generally accepted in the United States of America.
Basis for Opinion
These financial statements and financial highlights are the responsibility of the Fund's management. Our responsibility is to express an opinion on the Fund's financial statements and financial highlights based on our audits. We are a public accounting firm registered with the Public Company Accounting Oversight Board (United States) (PCAOB) and are required to be independent with respect to the Fund in accordance with the U.S. federal securities laws and the applicable rules and regulations of the Securities and Exchange Commission and the PCAOB.
We conducted our audits in accordance with the standards of the PCAOB. Those standards require that we plan and perform the audit to obtain reasonable assurance about whether the financial statements and financial highlights are free of material misstatement, whether due to error or fraud. The Fund is not required to have, nor were we engaged to perform, an audit of its internal control over financial reporting. As part of our audits, we are required to obtain an understanding of internal control over financial reporting but not for the purpose of expressing an opinion on the effectiveness of the Fund's internal control over financial reporting. Accordingly, we express no such opinion.
Our audits included performing procedures to assess the risks of material misstatement of the financial statements and financial highlights, whether due to error or fraud, and performing procedures that respond to those risks. Such procedures included examining, on a test basis, evidence regarding the amounts and disclosures in the financial statements and financial highlights. Our audits also included evaluating the accounting principles used and significant estimates made by management, as well as evaluating the overall presentation of the financial statements and financial highlights. Our procedures included confirmation of securities owned as of January 31, 2024, by correspondence with the custodian and brokers; when replies were not received from brokers, we performed other auditing procedures. We believe that our audits provide a reasonable basis for our opinion.
/s/ Deloitte & Touche LLP
Boston, Massachusetts
March 12, 2024
We have served as the auditor of one or more of the Fidelity investment companies since 1999.
TRUSTEES AND OFFICERS
The Trustees, Members of the Advisory Board (if any), and officers of the trust and fund, as applicable, are listed below. The Board of Trustees governs the fund and is responsible for protecting the interests of shareholders. The Trustees are experienced executives who meet periodically throughout the year to oversee the fund's activities, review contractual arrangements with companies that provide services to the fund, oversee management of the risks associated with such activities and contractual arrangements, and review the fund's performance. Each of the Trustees oversees 10 funds.
The Trustees hold office without limit in time except that (a) any Trustee may resign; (b) any Trustee may be removed by written instrument, signed by at least two-thirds of the number of Trustees prior to such removal; (c) any Trustee who requests to be retired or who has become incapacitated by illness or injury may be retired by written instrument signed by a majority of the other Trustees; and (d) any Trustee may be removed at any special meeting of shareholders by a two-thirds vote of the outstanding voting securities of the trust. Each Trustee who is not an interested person (as defined in the 1940 Act) of the trust and the fund is referred to herein as an Independent Trustee. Each Independent Trustee shall retire not later than the last day of the calendar year in which his or her 75th birthday occurs. The Independent Trustees may waive this mandatory retirement age policy with respect to individual Trustees. Officers and Advisory Board Members hold office without limit in time, except that any officer or Advisory Board Member may resign or may be removed by a vote of a majority of the Trustees at any regular meeting or any special meeting of the Trustees. Except as indicated, each individual has held the office shown or other offices in the same company for the past five years.
The fund's Statement of Additional Information (SAI) includes more information about the Trustees. To request a free copy, call Fidelity at 1-800-544-8544 if you're an individual investing directly with Fidelity, call 1-800-835-5092 if you're a plan sponsor or participant with Fidelity as your recordkeeper or call 1-877-208-0098 on institutional accounts or if you're an advisor or invest through one.
Experience, Skills, Attributes, and Qualifications of the Trustees. The Board of Trustees has adopted a statement of policy that describes the experience, qualifications, attributes, and skills that are necessary and desirable for potential Independent Trustee candidates (Statement of Policy). The Board believes that each Trustee satisfied at the time he or she was initially elected or appointed a Trustee, and continues to satisfy, the standards contemplated by the Statement of Policy. The Board of Trustees also engages professional search firms to help identify potential Independent Trustee candidates who have the experience, qualifications, attributes, and skills consistent with the Statement of Policy. From time to time, additional criteria based on the composition and skills of the current Independent Trustees, as well as experience or skills that may be appropriate in light of future changes to board composition, business conditions, and regulatory or other developments, have also been considered by the professional search firms and the Board of Trustees. In addition, the Board takes into account the Trustees' commitment and participation in Board and committee meetings, as well as their leadership of standing and ad hoc committees throughout their tenure.
In determining that a particular Trustee was and continues to be qualified to serve as a Trustee, the Board has considered a variety of criteria, none of which, in isolation, was controlling. The Board believes that, collectively, the Trustees have balanced and diverse experience, qualifications, attributes, and skills, which allow the Board to operate effectively in governing the fund and protecting the interests of shareholders. Information about the specific experience, skills, attributes, and qualifications of each Trustee, which in each case led to the Board's conclusion that the Trustee should serve (or continue to serve) as a trustee of the fund, is provided below.
Board Structure and Oversight Function. David B. Jones is an interested person and currently serves as Chair. The Trustees have determined that an interested Chair is appropriate and benefits shareholders because an interested Chair has a personal and professional stake in the quality and continuity of services provided to the fund. Independent Trustees exercise their informed business judgment to appoint an individual of their choosing to serve as Chair, regardless of whether the Trustee happens to be independent or a member of management. The Independent Trustees have determined that they can act independently and effectively without having an Independent Trustee serve as Chair and that a key structural component for assuring that they are in a position to do so is for the Independent Trustees to constitute a substantial majority for the Board. The Independent Trustees also regularly meet in executive session.
Fidelity® funds are overseen by different Boards of Trustees. The fund's Board oversees Fidelity's alternative investment funds, and other Boards oversee Fidelity's investment-grade bond, money market, asset allocation, high income, and equity funds. The asset allocation funds may invest in Fidelity® funds overseen by the fund's Board. The use of separate Boards, each with its own committee structure, allows the Trustees of each group of Fidelity® funds to focus on the unique issues of the funds they oversee, including common research, investment, and operational issues. On occasion, the separate Boards establish joint committees to address issues of overlapping consequences for the Fidelity® funds overseen by each Board.
The Trustees primarily operate as a full Board, but have also established one standing committee, the Audit Committee, to facilitate the timely and efficient consideration of all matters of importance to the Trustees, the fund, and fund shareholders and to facilitate compliance with legal and regulatory requirements and oversight of the fund's activities and associated risks. The Board has charged Fidelity Diversifying Solutions LLC (FDS) and its affiliates with (i) identifying events or circumstances the occurrence of which could have demonstrably adverse effects on the fund's business and/or reputation; (ii) implementing processes and controls to lessen the possibility that such events or circumstances occur or to mitigate the effects of such events or circumstances if they do occur; and (iii) creating and maintaining a system designed to evaluate continuously business and market conditions in order to facilitate the identification and implementation processes described in (i) and (ii) above. Because the day-to-day operations and activities of the fund are carried out by or through FDS, its affiliates, and other service providers, the fund's exposure to risks is mitigated but not eliminated by the processes overseen by the Trustees. Board oversight of different aspects of the fund's activities is exercised primarily through the full Board, but also through the Audit Committee. Appropriate personnel, including but not limited to the fund's Chief Compliance Officer (CCO), FDS's internal auditor, the independent accountants, the fund's Treasurer and portfolio management personnel, make periodic reports to the Board and Audit Committee, as appropriate, including an annual review of Fidelity's risk management program for the Fidelity® funds. The responsibilities of the Audit Committee, including its oversight responsibilities, are described further under "Standing Committees of the Trustees."
Interested Trustees*:
Correspondence intended for a Trustee who is an interested person may be sent to Fidelity Investments, 245 Summer Street, Boston, Massachusetts 02210.
Name, Year of Birth; Principal Occupations and Other Relevant Experience+
David B. Jones (1962)
Year of Election or Appointment: 2021
Trustee
Chair of the Board of Trustees
Mr. Jones also serves as Trustee of other Fidelity® funds. Prior to his retirement, Mr. Jones served in a variety of positions at Fidelity Investments (1982-2008), retiring as a Senior Vice President. His duties included new product development, serving as a liaison to the board of trustees of various Fidelity® funds, and development of policies and procedures for fund investments in derivatives and complex securities. He also served on the FMR Fair Value Committee, which is responsible for day-to-day valuation activities for various Fidelity® funds
* Determined to be an "Interested Trustee" by virtue of, among other things, his or her affiliation with the trust or various entities under common control with FDS.
+ The information includes the Trustee's principal occupation during the last five years and other information relating to the experience, attributes, and skills relevant to the Trustee's qualifications to serve as a Trustee, which led to the conclusion that the Trustee should serve as a Trustee for the fund.
Independent Trustees:
Correspondence intended for an Independent Trustee may be sent to Fidelity Investments, P.O. Box 55235, Boston, Massachusetts 02205-5235.
Name, Year of Birth; Principal Occupations and Other Relevant Experience+
Jennifer M. Birmingham (1971)
Year of Election or Appointment: 2021
Trustee
Ms. Birmingham also serves as Trustee of other Fidelity® funds. Ms. Birmingham serves as Managing Director of Princeton University Investment Company (PRINCO) (2010-present). Previously, Ms. Birmingham served in a variety of positions at Deutsche Bank Asset Management (2002-2010), including Managing Director, Global CFO of DB Advisors and Deutsche Insurance Asset Management, Americas CFO of DWS Americas and various legal entities (2005-2010). Prior to Deutsche Bank, Ms. Birmingham was an employee of Investors Bank and Trust Company (1997-2002) and Deloitte & Touche LLP (1993-1997).
Matthew J. Conti (1966)
Year of Election or Appointment: 2021
Trustee
Mr. Conti also serves as Trustee of other Fidelity® funds. Prior to his retirement, Mr. Conti served in a variety of positions at Fidelity Investments, including as a portfolio manager to certain Fidelity® funds (2000-2018) and research analyst (1995-2003). Mr. Conti serves as a member of the Board of Directors of the Rose Kennedy Greenway Conservancy (2021-present).
Tara C. Kenney (1960)
Year of Election or Appointment: 2021
Trustee
Ms. Kenney also serves as Trustee of other Fidelity® funds. Prior to her retirement, Ms. Kenney served as Senior Vice President of Boston Common Asset Management (2017-2020). Previously, Ms. Kenney served as Managing Director in a variety of roles for Deutsche Asset Management (2003-2016) as well as Scudder Investments where she was a Portfolio Manager (1995-2003). Currently, Ms. Kenney serves as a Board member for a number of non-profit organizations and academic institutions, including Catholic Charities USA (2017-present) and the Kellogg Institute for International Studies at the University of Notre Dame (2002-present). Ms. Kenney is also an adjunct professor of finance at the University of Notre Dame.
+ The information includes the Trustee's principal occupation during the last five years and other information relating to the experience, attributes, and skills relevant to the Trustee's qualifications to serve as a Trustee, which led to the conclusion that the Trustee should serve as a Trustee for the fund.
Advisory Board Members and Officers:
Correspondence intended for a Member of the Advisory Board (if any) may be sent to Fidelity Investments, P.O. Box 55235, Boston, Massachusetts 02205-5235. Correspondence intended for an officer may be sent to Fidelity Investments, 245 Summer Street, Boston, Massachusetts 02210.
Name, Year of Birth; Principal Occupation
Joseph Benedetti (1965)
Year of Election or Appointment: 2021
Assistant Secretary
Mr. Benedetti also serves as Assistant Secretary of other funds. Mr. Benedetti is a Senior Vice President, Deputy General Counsel (2020-present) and is an employee of Fidelity Investments (2020-present). Mr. Benedetti serves as Assistant Secretary of Fidelity Diversifying Solutions LLC (investment adviser firm, 2022-present) and Secretary of certain other Fidelity entities. Previously, Mr. Benedetti served as Secretary of Fidelity Diversifying Solutions LLC (2021-2022). Prior to joining Fidelity, Mr. Benedetti was Assistant General Counsel at Invesco (investment adviser firm, 2019-2020) and Senior Vice President and Managing Counsel at OppenheimerFunds Inc. (investment adviser firm, 2017-2019).
Heather Bonner (1977)
Year of Election or Appointment: 2023
President and Treasurer
Ms. Bonner also serves as an officer of other funds. Ms. Bonner is a Senior Vice President (2022-present) and is an employee of Fidelity Investments (2022-present). Ms. Bonner serves as Vice President or Treasurer of certain Fidelity entities. Prior to joining Fidelity, Ms. Bonner served as Managing Director at AQR Capital Management (2013-2022) and was the Treasurer and Principal Financial Officer of the AQR Funds (2013-2022).
Craig S. Brown (1977)
Year of Election or Appointment: 2021
Assistant Treasurer
Mr. Brown also serves as an officer of other funds. Mr. Brown is a Vice President (2015-present) and is an employee of Fidelity Investments. Mr. Brown serves as Assistant Treasurer of FIMM, LLC (2021-present). Previously, Mr. Brown served as Assistant Treasurer of certain Fidelity® funds (2019-2022).
John J. Burke III (1964)
Year of Election or Appointment: 2021
Chief Financial Officer
Mr. Burke also serves as Chief Financial Officer of other funds. Mr. Burke is Head of Fidelity Fund and Investment Operations (2018-present) and is an employee of Fidelity Investments. Mr. Burke serves as President, Executive Vice President, or Director of certain Fidelity entities. Previously Mr. Burke served as head of Asset Management Investment Operations (2012-2018).
Margaret Carey (1973)
Year of Election or Appointment: 2023
Secretary and Chief Legal Officer (CLO)
Ms. Carey also serves as an officer of other funds and as CLO of certain Fidelity entities. Ms. Carey is a Senior Vice President, Deputy General Counsel (2019-present) and is an employee of Fidelity Investments.
Nati Davidi (1971)
Year of Election or Appointment: 2021
Assistant Secretary
Ms. Davidi also serves as Assistant Secretary of other funds. Ms. Davidi is a Vice President, Associate General Counsel (2013-present) and is an employee of Fidelity Investments. Previously, Ms. Davidi served as Assistant Secretary of the North Carolina Capital Management Trust (2016-2022).
Jonathan Davis (1968)
Year of Election or Appointment: 2021
Assistant Treasurer
Mr. Davis also serves as an officer of other funds. Mr. Davis is a Vice President (2006-present) and is an employee of Fidelity Investments. Mr. Davis serves as Assistant Treasurer of certain Fidelity entities.
Laura M. Del Prato (1964)
Year of Election or Appointment: 2021
Assistant Treasurer
Ms. Del Prato also serves as an officer of other funds. Ms. Del Prato is a Senior Vice President (2017-present) and is an employee of Fidelity Investments. Ms. Del Prato serves as Vice President or Assistant Treasurer of certain Fidelity entities. Previously, Ms. Del Prato served as President and Treasurer of The North Carolina Capital Management Trust: Cash Portfolio and Term Portfolio (2018-2020).
Colm A. Hogan (1973)
Year of Election or Appointment: 2021
Assistant Treasurer
Mr. Hogan also serves as an officer of other funds. Mr. Hogan is a Vice President (2016-present) and is an employee of Fidelity Investments. Mr. Hogan serves as Assistant Treasurer of certain Fidelity entities. Previously, Mr. Hogan served as Deputy Treasurer of certain Fidelity® funds (2016-2020) and Assistant Treasurer of certain Fidelity® funds (2016-2018).
William Irving (1964)
Year of Election or Appointment: 2023
Vice President
Mr. Irving also serves as Vice President of other funds. Mr. Irving is Head of Fidelity Asset Management Solutions (2022-present) and is an employee of Fidelity Investments. Mr. Irving serves as President and Director of Fidelity Diversifying Solutions LLC (investment adviser firm, 2023-present) and President or Director of certain other Fidelity entities. Previously, Mr. Irving served as Chief Investment Officer (CIO) in the Global Asset Allocation division (2020-2022). Prior to that, he was Managing Director of Research in the Global Asset Allocation division (2018-2020) and portfolio manager of certain Fidelity® funds (2004-2018).
Chris Maher (1972)
Year of Election or Appointment: 2021
Assistant Treasurer
Mr. Maher also serves as an officer of other funds. Mr. Maher is a Vice President (2008-present) and is an employee of Fidelity Investments. Mr. Maher serves as Assistant Treasurer of certain Fidelity entities. Previously, Mr. Maher served as Assistant Treasurer of certain funds (2013-2020).
Ksenia Portnoy (1980)
Year of Election or Appointment: 2021
Chief Compliance Officer
Ms. Portnoy also serves as Chief Compliance Officer of other funds. Ms. Portnoy is a Senior Vice President of Asset Management Compliance (2021-present) and is an employee of Fidelity Investments (2021-present). Prior to joining Fidelity, Ms. Portnoy worked in the asset management divisions of Morgan Stanley Investment Management (investment adviser firm, 2020-2021) and Mizuho (investment adviser firm, 2015-2020).
Brett Segaloff (1972)
Year of Election or Appointment: 2021
Anti-Money Laundering (AML) Officer
Mr. Segaloff also serves as AML Officer of other funds. Mr. Segaloff is a Vice President (2022-present) and is an employee of Fidelity Investments. Mr. Segaloff serves as Anti Money Laundering Compliance Officer or Anti Money Laundering/Bank Secrecy Act Compliance Officer of certain Fidelity entities.
Stacie M. Smith (1974)
Year of Election or Appointment: 2021
Assistant Treasurer
Ms. Smith also serves as an officer of other funds. Ms. Smith is a Senior Vice President (2016-present) and is an employee of Fidelity Investments. Ms. Smith serves as Assistant Treasurer of certain Fidelity entities and has served in other fund officer roles.
Jim Wegmann (1979)
Year of Election or Appointment: 2021
Assistant Treasurer
Mr. Wegmann also serves as an officer of other funds. Mr. Wegmann is a Vice President (2016-present) and is an employee of Fidelity Investments. Mr. Wegmann serves as Assistant Treasurer of FIMM, LLC (2021-present). Previously, Mr. Wegmann served as Assistant Treasurer of certain Fidelity® funds (2019-2021).
As a shareholder, you incur two types of costs: (1) transaction costs, which may include sales charges (loads) on purchase payments or redemption proceeds, as applicable and (2) ongoing costs, which generally include management fees, distribution and/or service (12b-1) fees and other Fund expenses. This Example is intended to help you understand your ongoing costs (in dollars) of investing in a fund and to compare these costs with the ongoing costs of investing in other mutual funds.
| The Example is based on an investment of $1,000 invested at the beginning of the period and held for the entire period (August 1, 2023 to January 31, 2024). |
Actual Expenses
The first line of the accompanying table provides information about actual account values and actual expenses. You may use the information in this line, together with the amount you invested, to estimate the expenses that you paid over the period. Simply divide your account value by $1,000.00 (for example, an $8,600 account value divided by $1,000.00 = 8.6), then multiply the result by the number in the first line for a class/Fund under the heading entitled "Expenses Paid During Period" to estimate the expenses you paid on your account during this period. If any fund is a shareholder of any underlying mutual funds or exchange-traded funds (ETFs) (the Underlying Funds), such fund indirectly bears its proportional share of the expenses of the Underlying Funds in addition to the direct expenses incurred presented in the table. These fees and expenses are not included in the annualized expense ratio used to calculate the expense estimate in the table below.
Hypothetical Example for Comparison Purposes
The second line of the accompanying table provides information about hypothetical account values and hypothetical expenses based on the actual expense ratio and an assumed rate of return of 5% per year before expenses, which is not the actual return. The hypothetical account values and expenses may not be used to estimate the actual ending account balance or expenses you paid for the period. You may use this information to compare the ongoing costs of investing in the Fund and other funds. To do so, compare this 5% hypothetical example with the 5% hypothetical examples that appear in the shareholder reports of the other funds. If any fund is a shareholder of any Underlying Funds, such fund indirectly bears its proportional share of the expenses of the Underlying Funds in addition to the direct expenses as presented in the table. These fees and expenses are not included in the annualized expense ratio used to calculate the expense estimate in the table below.
Please note that the expenses shown in the table are meant to highlight your ongoing costs only and do not reflect any transaction costs. Therefore, the second line of the table is useful in comparing ongoing costs only, and will not help you determine the relative total costs of owning different funds. In addition, if these transactional costs were included, your costs would have been higher.
Annualized Expense Ratio- A | Beginning Account Value August 1, 2023 | Ending Account Value January 31, 2024 | Expenses Paid During Period- C August 1, 2023 to January 31, 2024 | |||||||
| Fidelity® Hedged Equity Fund | ||||||||||
| Class A | .80% | |||||||||
| Actual | $ 1,000 | $ 1,050.10 | $ 4.13 | |||||||
Hypothetical-B | $ 1,000 | $ 1,021.17 | $ 4.08 | |||||||
| Class M | 1.05% | |||||||||
| Actual | $ 1,000 | $ 1,048.30 | $ 5.42 | |||||||
Hypothetical-B | $ 1,000 | $ 1,019.91 | $ 5.35 | |||||||
| Class C | 1.55% | |||||||||
| Actual | $ 1,000 | $ 1,045.80 | $ 7.99 | |||||||
Hypothetical-B | $ 1,000 | $ 1,017.39 | $ 7.88 | |||||||
| Fidelity® Hedged Equity Fund | .55% | |||||||||
| Actual | $ 1,000 | $ 1,050.30 | $ 2.84 | |||||||
Hypothetical-B | $ 1,000 | $ 1,022.43 | $ 2.80 | |||||||
| Class I | .55% | |||||||||
| Actual | $ 1,000 | $ 1,050.30 | $ 2.84 | |||||||
Hypothetical-B | $ 1,000 | $ 1,022.43 | $ 2.80 | |||||||
| Class Z | .50% | |||||||||
| Actual | $ 1,000 | $ 1,051.10 | $ 2.58 | |||||||
Hypothetical-B | $ 1,000 | $ 1,022.68 | $ 2.55 | |||||||
A Annualized expense ratio reflects expenses net of applicable fee waivers.
B 5% return per year before expenses
C Expenses are equal to the annualized expense ratio, multiplied by the average account value over the period, multiplied by 184/ 365 (to reflect the one-half year period). The fees and expenses of any Underlying Funds are not included in each annualized expense ratio.
Distributions (Unaudited)
The dividend and capital gains distributions for the fund(s) are available on Fidelity.com or Institutional.Fidelity.com.
Class A, Class M, Class C, Retail Class, Class I and Class Z designate 100% of the dividends distributed during the fiscal year as qualifying for the dividends-received deduction for corporate shareholders.
Class A, Class M, Class C, Retail Class, Class I and Class Z designate 100% of the dividends distributed during the fiscal year as amounts which may be taken into account as a dividend for the purposes of the maximum rate under section 1(h)(11) of the Internal Revenue Code.
The fund will notify shareholders in January 2025 of amounts for use in preparing 2024 income tax returns.
Board Approval of Investment Advisory Contracts and Management Fees
Fidelity Hedged Equity Fund
Each year, the Board of Trustees, including the Independent Trustees (together, the Board), considers the renewal of the fund's management contract with Fidelity Diversifying Solutions LLC (FDS) and the sub-advisory agreements (together, the Advisory Contracts) for the fund. FDS and the sub-advisers are referred to herein as the Investment Advisers. The Board, assisted by the advice of fund counsel and Independent Trustees' counsel, requests and considers a broad range of information relevant to the renewal of the Advisory Contracts throughout the year.
The Board meets regularly and, at each of its meetings, covers an extensive agenda of topics and materials and considers factors that are relevant to its annual consideration of the renewal of the fund's Advisory Contracts, including the services and support provided to the fund and its shareholders. The Board requests and receives information concerning the annual consideration of the renewal of the fund's Advisory Contracts. The Board also meets as needed to review matters specifically related to the Board's annual consideration of the renewal of the Advisory Contracts.
At its November 2023 meeting, the Board unanimously determined to renew the fund's Advisory Contracts. In reaching its determination, the Board considered all factors it believed relevant and reached a determination, with the assistance of fund counsel and Independent Trustees' counsel and through the exercise of its business judgment, that the renewal of the Advisory Contracts was in the best interests of the fund and its shareholders and the fact that no fee is payable under the management contract was fair and reasonable in light of all of the surrounding circumstances.
Nature, Extent, and Quality of Services Provided. The Board considered staffing as it relates to the fund, including the backgrounds and experience of investment personnel of the Investment Advisers, and also considered the Investment Advisers' implementation of the fund's investment program.
Resources Dedicated to Investment Management and Support Services. The Board reviewed the general qualifications and capabilities of Fidelity's investment staff, including its size, education, experience, and resources, as well as Fidelity's approach to training and managing investment personnel. The Board noted the resources devoted to Fidelity's global investment organization and that Fidelity's analysts have extensive resources, tools and capabilities that allow them to conduct sophisticated quantitative and fundamental analysis, as well as credit analysis of issuers, counterparties and guarantors. Further, the Board considered that Fidelity's investment professionals have sufficient access to global information and data so as to provide competitive investment results over time, and that those professionals also have access to sophisticated tools that permit them to assess portfolio construction and risk and performance attribution characteristics continuously, as well as to transmit new information and research conclusions rapidly around the world. Additionally, in its deliberations, the Board considered Fidelity's trading, risk management, compliance, cybersecurity, and technology and operations capabilities and resources, which are integral parts of the investment management process.
Shareholder and Administrative Services. The Board considered the nature, extent, quality, and cost of advisory, administrative, and shareholder services to be performed by the Investment Advisers and their affiliates under the Advisory Contracts and under separate agreements covering transfer agency, pricing and bookkeeping, and securities lending services for the fund. The Board also considered the nature and extent of the supervision of third-party service providers, principally custodians, subcustodians, and pricing vendors. The Board also considered the fund's securities lending activities and any payments made to Fidelity relating to securities lending.
The Board noted that the growth of fund assets over time across the complex allows Fidelity to reinvest in the development of services designed to enhance the value and convenience of the Fidelity funds as investment vehicles. These services include 24-hour access to account information and market information over the Internet and through telephone representatives, investor education materials and asset allocation tools.
Investment Performance. The Board took into account discussions that occur with representatives of the Investment Advisers, and reports that it receives, at Board meetings throughout the year, relating to fund investment performance. In this regard the Board noted that as part of regularly scheduled fund reviews and other reports to the Board on fund performance, the Board considered annualized return information for the fund for different time periods, measured against an appropriate securities market index (benchmark index). The Board also considered information about performance attribution. In its ongoing evaluation of fund investment performance, the Board gives particular attention to information indicating changes in performance of the funds over different time periods and discussed with the Investment Advisers the reasons for any overperformance or underperformance.
In addition to reviewing absolute and relative fund performance, the Independent Trustees periodically consider the appropriateness of fund performance metrics in evaluating the results achieved. The Independent Trustees generally give greater weight to fund performance over longer time periods than over shorter time periods. Depending on the circumstances, the Independent Trustees may be satisfied with a fund's performance notwithstanding that it lags its benchmark index for certain periods.
Based on its review, the Board concluded that the nature, extent, and quality of services to be provided to the fund under the Advisory Contracts should benefit the shareholders of the fund.
Competitiveness of Management Fee and Total Expense Ratio. In its review of the fund's management fee and the total expense ratio of a representative class of the fund (the retail class), the Board considered the fund's class-level unitary management fees rate as well as other fund or class expenses, as applicable, such as fund-paid 12b-1 fees. The Board noted that differences among the classes' net expenses are the result of separate arrangements for class level services and/or waivers of certain expenses (if any). It is not the result of any difference in advisory or custodial fees or other expenses related to the management of a fund's assets, which do not vary by class. The Board noted that Fidelity may agree to waive fees or reimburse expenses from time to time, and the extent to which, if any, it has done so for the fund.
Comparisons of Management Fees and Total Expense Ratios. Among other things, the Board reviewed data for selected groups of competitive funds and classes (referred to as "mapped groups") that were compiled by Fidelity based on combining similar investment objective categories (as classified by Lipper) that have comparable investment mandates. The data reviewed by the Board included (i) gross management fee comparisons (before taking into account expense reimbursements or caps) relative to the total universe of funds within the mapped group; and (ii) net total expense comparisons (including acquired fund fees and expenses) of the retail class of the fund relative to funds and classes in the mapped group that have a similar sales load structure to the retail class of the fund (referred to as the "similar sales load structure group").
The information provided to the Board indicated that the fund's management fee rate ranked below the competitive median of the mapped group for the 12-month period ended March 31, 2023. Further, the information provided to the Board indicated that the total expense ratio of the retail class of the fund ranked below the competitive median of the similar sales load structure group for the 12-month period ended March 31, 2023.
Other Contractual Arrangements. The Board further considered that FDS has contractually agreed to reimburse Class A, Class M, Class C, Class I, Class Z and the retail class of the fund to the extent that total operating expenses, with certain exceptions, as a percentage of their respective average net assets, exceed 0.80%, 1.05%, 1.55%, 0.55%, 0.50%, and 0.55% through May 31, 2024.
Based on its review, the Board concluded that the fund's management fee is fair and reasonable in light of the services that the fund receives and the other factors considered. Further based on its review of total expense ratios and fees charged to other Fidelity clients, the Board concluded that the total expense ratio of each class of the fund was reasonable in light of the services that the fund and its shareholders receive and the other factors considered.
Costs of the Services and Profitability. The Board considered the revenues earned and the expenses incurred by Fidelity in conducting the business of developing, marketing, distributing, managing, administering and servicing the fund and servicing the fund's shareholders. The Board considered the level of Fidelity's profits in respect of all the Fidelity funds it oversees. The Board noted that the profitability information reflects the relatively small size of the funds overseen by the Board and their short history given that the period for the profitability report was calendar year 2022.
The Board also reviewed Fidelity's non-fund businesses and potential indirect benefits such businesses may have received as a result of their association with Fidelity's fund business (i.e., fall-out benefits) as well as cases where Fidelity's affiliates may benefit from the funds' business. The Board considered areas where potential indirect benefits to the Fidelity funds from their relationships with Fidelity may exist.
The Board considered the costs of the services provided by and the lack of meaningful profits realized by Fidelity in connection with the operation of the funds overseen by the Board and was satisfied that the profitability was not excessive.
Economies of Scale. The Board will consider economies of scale when there is operating experience to permit assessment thereof. It noted that, notwithstanding the entrepreneurial risk associated with a new fund, the management fee was at a level normally associated, by comparison with competitors, with very high fund net assets, and Fidelity asserted to the Board that the level of the fee anticipated economies of scale at lower asset levels even before, if ever, economies of scale are achieved. The Board also noted that the fund and its shareholders would have access to the very considerable number and variety of services available through Fidelity and its affiliates.
Conclusion. Based on its evaluation of all of the conclusions noted above, and after considering all factors it believed relevant, the Board concluded that the advisory fee arrangements are fair and reasonable in light of all of the surrounding circumstances, and that the fund's Advisory Contracts should be approved through November 30, 2024.
The Securities and Exchange Commission adopted Rule 22e-4 under the Investment Company Act of 1940 (the Liquidity Rule) to promote effective liquidity risk management throughout the open-end investment company industry, thereby reducing the risk that funds will be unable to meet their redemption obligations and mitigating dilution of the interests of fund shareholders.
The Fund has adopted and implemented a liquidity risk management program (the Program) reasonably designed to assess and manage the Fund's liquidity risk and to comply with the requirements of the Liquidity Rule. The Fund's Board of Trustees (the Board) has designated the Fund's investment adviser as administrator of the Program. The Fidelity advisers have established a Liquidity Risk Management Committee (the LRM Committee) to manage the Program for each of the Fidelity Funds. The LRM Committee monitors the adequacy and effectiveness of implementation of the Program and on a periodic basis assesses each Fund's liquidity risk based on a variety of factors including (1) the Fund's investment strategy, (2) portfolio liquidity and cash flow projections during normal and reasonably foreseeable stressed conditions, (3) shareholder redemptions, (4) borrowings and other funding sources and (5) certain factors specific to ETFs including the effect of the Fund's prices and spreads, market participants, and basket compositions on the overall liquidity of the Fund's portfolio, as applicable.
In accordance with the Program, each of the Fund's portfolio investments is classified into one of four defined liquidity categories based on a determination of a reasonable expectation for how long it would take to convert the investment to cash (or sell or dispose of the investment) without significantly changing its market value.
- Highly liquid investments - cash or convertible to cash within three business days or less
- Moderately liquid investments - convertible to cash in three to seven calendar days
- Less liquid investments - can be sold or disposed of, but not settled, within seven calendar days
- Illiquid investments - cannot be sold or disposed of within seven calendar days
Liquidity classification determinations take into account a variety of factors including various market, trading and investment-specific considerations, as well as market depth, and generally utilize analysis from a third-party liquidity metrics service.
The Liquidity Rule places a 15% limit on a fund's illiquid investments and requires funds that do not primarily hold assets that are highly liquid investments to determine and maintain a minimum percentage of the fund's net assets to be invested in highly liquid investments (highly liquid investment minimum or HLIM). The Program includes provisions reasonably designed to comply with the 15% limit on illiquid investments and for determining, periodically reviewing and complying with the HLIM requirement as applicable.
At a recent meeting of the Fund's Board of Trustees, the LRM Committee provided a written report to the Board pertaining to the operation, adequacy, and effectiveness of the Program for the period December 1, 2022 through November 30, 2023. The report concluded that the Program is operating effectively and is reasonably designed to assess and manage the Fund's liquidity risk.
 |
1.9905820.101
FHE-ANN-0324
Fidelity® Macro Opportunities Fund
Annual Report
January 31, 2024
Includes Fidelity and Fidelity Advisor share classes


Contents
To view a fund's proxy voting guidelines and proxy voting record for the 12-month period ended June 30, visit http://www.fidelity.com/proxyvotingresults or visit the Securities and Exchange Commission's (SEC) web site at http://www.sec.gov.
You may also call 1-800-544-8544 if you're an individual investing directly with Fidelity, call 1-800-835-5092 if you're a plan sponsor or participant with Fidelity as your recordkeeper or call 1-877-208-0098 on institutional accounts or if you're an advisor or invest through one to request a free copy of the proxy voting guidelines.
Standard & Poor's, S&P and S&P 500 are registered service marks of The McGraw-Hill Companies, Inc. and have been licensed for use by Fidelity Distributors Corporation.
Other third-party marks appearing herein are the property of their respective owners.
All other marks appearing herein are registered or unregistered trademarks or service marks of FMR LLC or an affiliated company. © 2024 FMR LLC. All rights reserved.
This report and the financial statements contained herein are submitted for the general information of the shareholders of the Fund. This report is not authorized for distribution to prospective investors in the Fund unless preceded or accompanied by an effective prospectus.
A fund files its complete schedule of portfolio holdings with the SEC for the first and third quarters of each fiscal year on Form N-PORT. Forms N-PORT are available on the SEC's web site at http://www.sec.gov. A fund's Forms N-PORT may be reviewed and copied at the SEC's Public Reference Room in Washington, DC. Information regarding the operation of the SEC's Public Reference Room may be obtained by calling 1-800-SEC-0330.
For a complete list of a fund's portfolio holdings, view the most recent holdings listing, semiannual report, or annual report on Fidelity's web site at http://www.fidelity.com, http://www.institutional.fidelity.com, or http://www.401k.com, as applicable.
NOT FDIC INSURED •MAY LOSE VALUE •NO BANK GUARANTEE
Neither the Fund nor Fidelity Distributors Corporation is a bank.
Average annual total return reflects the change in the value of an investment, assuming reinvestment of distributions from dividend income and capital gains (the profits earned upon the sale of securities that have grown in value, if any) and assuming a constant rate of performance each year. The hypothetical investment and the average annual total returns do not reflect the deduction of taxes that a shareholder would pay on fund distributions or the redemption of fund shares. During periods of reimbursement by Fidelity, a fund's total return will be greater than it would be had the reimbursement not occurred. How a fund did yesterday is no guarantee of how it will do tomorrow.
| Average Annual Total Returns | |||
Periods ended January 31, 2024 | Past 1 year | Life of Fund A |
Class A (incl. 5.75% sales charge) | -10.38% | -10.53% |
Class M (incl. 3.50% sales charge) | -8.45% | -9.43% |
Class C (incl. contingent deferred sales charge) | -6.62% | -7.82% |
| Fidelity® Macro Opportunities Fund | -4.70% | -6.22% |
| Class I | -4.59% | -6.89% |
| Class Z | -4.58% | -6.82% |
A From July 7, 2022 for Class A, Class M, Class C, Class I and Class Z, and from September 1, 2022 for Fidelity® Macro Opportunities Fund
Class C shares' contingent deferred sales charges included in the past one year and life of fund total return figures are 1% and 0%, respectively.
| $10,000 Over Life of Fund |
Let's say hypothetically that $10,000 was invested in Fidelity Advisor® Macro Opportunities Fund - Class A, a class of the fund, on July 7, 2022, when the fund started, and the current 5.75% sales charge was paid. The chart shows how the value of your investment would have changed, and also shows how the Bloomberg US 3 Month Treasury Bellwether Index performed over the same period. |
 |
Market Recap:
For the 12 months ending January 31, 2024, continued global economic expansion and a slowing in the pace of inflation contributed to a favorable backdrop for risk assets. U.S. large-cap stocks led strong performance among many asset categories, driven partly by a narrow set of companies in the information technology and communication services sectors amid excitement for generative artificial intelligence. Assets broadly gained in the final two months of 2023 after investor sentiment largely shifted to a view that policy interest rates had peaked in most countries following historic monetary tightening cycles by the U.S. Federal Reserve and other central banks.
International equities rose 6.06% for the 12 months, according to the MSCI ACWI (All Country World Index) ex USA Index, coming off a 9.78% advance in the final quarter of 2023, as many investors surmised that U.S. central bank rate cuts weren't imminent. By region, Japan (+19%) led the way, whereas Asia Pacific ex Japan (-5%) and emerging markets (-3%) lagged by the widest margin. By sector, tech (+21%), industrials (+14%) and energy (+12%) were top performers. Conversely, real estate (-6%) and communication services (-5%) lagged most.
U.S. stocks gained 19.14% for the period, as measured by the Dow Jones U.S. Total Stock Market Index. The information technology (+51%) and communication services (+39%) sectors were the only two sectors to outpace the broader index. Consumer discretionary (+17%) and industrials (+14%) each had a solid double-digit gain. Conversely, utilities (-9%), energy (-4%) and real estate (-3%) lagged most. Growth stocks broadly outpaced value, while larger-caps topped small-caps. Commodities returned -7.09%, according to the Bloomberg Commodity Index Total Return.
U.S. taxable investment-grade bonds gained 2.10% for the 12 months, per the Bloomberg U.S. Aggregate Bond Index, as the Fed slowed the pace of, and eventually paused, interest rate increases. Since March 2022, the Fed has hiked its benchmark interest rate 11 times, by 5.25 percentage points, while allowing up to billions in bonds to mature each month without investing the proceeds. Short-term U.S. Treasuries (+5.22%), topped investment-grade corporate bonds (+4.02%), while commercial mortgage-backed securities gained 3.45% and agencies rose 3.87%. Outside the index, leveraged loans (+11.45%), U.S. high-yield bonds (+7.95%), emerging-markets debt (+5.86%) and Treasury Inflation-Protected Securities.
Comments from Co-Portfolio Managers Jordan Alexiev and Brett Sumsion:
For the year ending January 31, 2024, the fund's share classes (excluding sales charges, if applicable) recorded a loss of approximately -4.70%, underperforming the primary Bloomberg 3M T-bill Bellwether benchmark, which recorded a gain of 5.25%. The fund was relatively defensively positioned during the period, expecting an environment of falling growth and inflation. The fund profited from long positions in gold and non-U.S. equities, while the short positions in credit spreads and long positions in duration were the largest detractors. During the period, the fund continued to increase exposure to diversifying positions such as yield curve steepeners, foreign bonds, commodities, and foreign currencies.
Note to Shareholders:
On July 3, 2023, Brett Sumsion assumed co-management responsibilities for the fund.
The views expressed above reflect those of the portfolio manager(s) only through the end of the period as stated on the cover of this report and do not necessarily represent the views of Fidelity or any other person in the Fidelity organization. Any such views are subject to change at any time based upon market or other conditions and Fidelity disclaims any responsibility to update such views. These views may not be relied on as investment advice and, because investment decisions for a Fidelity fund are based on numerous factors, may not be relied on as an indication of trading intent on behalf of any Fidelity fund.
The information in the following tables is based on the consolidated investments of the Fund.
Top Holdings (% of Fund's net assets) | ||
| iShares 7-10 Year Treasury Bond ETF | 7.7 | |
| SPDR Gold Shares | 6.0 | |
| iPath Bloomberg Commodity Index Total Return ETN (issued by Barclays Bank PLC, maturity date 6/12/36) | 4.1 | |
| Vanguard Health Care ETF | 2.8 | |
| Vanguard Consumer Staples ETF | 2.8 | |
| iShares Russell 2000 Index ETF | 2.6 | |
| iShares MSCI Brazil Index ETF | 1.3 | |
| 27.3 | ||
Asset Allocation (% of Fund's net assets) |
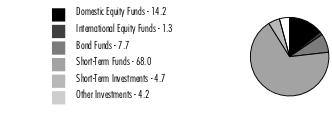 |
Net Other Assets (Liabilities) - (0.1)% |
Written Options - (0.0)% |
Futures and Swaps - 85.7% |
Forward foreign currency contracts - 17.3% |
Percentages shown as 0.0% may reflect amounts less than 0.05%. |
Showing Percentage of Net Assets
| U.S. Treasury Obligations - 4.7% | |||
Principal Amount (a) | Value ($) | ||
U.S. Treasury Bills, yield at date of purchase 5.26% to 5.32% 2/15/24 to 5/2/24 (b)(c) (Cost $576,119) | 583,000 | 576,117 | |
| Fixed-Income Funds - 7.7% | |||
| Shares | Value ($) | ||
iShares 7-10 Year Treasury Bond ETF (Cost $987,358) | 9,667 | 932,478 | |
| Other - 4.1% | |||
| Shares | Value ($) | ||
| Exchange - Traded Notes - Commodities - 4.1% | |||
iPath Bloomberg Commodity Index Total Return ETN (issued by Barclays Bank PLC, maturity date 6/12/36) (d) (Cost $530,134) | 16,475 | 502,652 | |
| Money Market Funds - 68.0% | |||
| Shares | Value ($) | ||
Fidelity Cash Central Fund 5.39% (e) (Cost $8,258,897) | 8,257,246 | 8,258,897 | |
| Equity Funds - 15.5% | |||
| Shares | Value ($) | ||
| Domestic Equity Funds - 11.6% | |||
| SPDR Gold Shares (d) | 3,869 | 729,113 | |
| Vanguard Consumer Staples ETF | 1,752 | 337,716 | |
| Vanguard Health Care ETF | 1,348 | 345,951 | |
TOTAL DOMESTIC EQUITY FUNDS | 1,412,780 | ||
| International Equity Funds - 1.3% | |||
| iShares MSCI Brazil Index ETF | 4,727 | 155,613 | |
| Small Blend Funds - 2.6% | |||
| iShares Russell 2000 Index ETF (f) | 1,598 | 308,222 | |
| TOTAL EQUITY FUNDS (Cost $1,789,138) | 1,876,615 | ||
| Purchased Options - 0.1% | ||||||
| Counterparty | Number of Contracts | Notional Amount($) | Exercise Price ($) | Expiration Date | Value ($) | |
| Call Options | ||||||
| Xtrackers Harvest CSI 300 China ETF A Shares | Chicago Board Options Exchange | 165 | 365,475 | 27 | 04/19/24 | 2,228 |
| Xtrackers Harvest CSI 300 China ETF A Shares | Chicago Board Options Exchange | 115 | 254,725 | 24 | 07/19/24 | 8,050 |
| 10,278 | ||||||
| Put Options | ||||||
| SPDR S&P 500 ETF Trust | Chicago Board Options Exchange | 2 | 96,576 | 487 | 06/28/24 | 2,970 |
| 2,970 | ||||||
TOTAL PURCHASED OPTIONS (Cost $26,423) | 13,248 | |||||
| TOTAL INVESTMENT IN SECURITIES - 100.1% (Cost $12,168,069) | 12,160,007 |
NET OTHER ASSETS (LIABILITIES) - (0.1)% | (6,120) |
| NET ASSETS - 100.0% | 12,153,887 |
| Futures Contracts | |||||
Number of contracts | Expiration Date | Notional Amount ($) | Value ($) | Unrealized Appreciation/ (Depreciation) ($) | |
| Purchased | |||||
| Treasury Contracts | |||||
| CBOT 2-Year U.S. Treasury Note Contracts (United States) | 38 | Mar 2024 | 7,814,938 | 63,164 | 63,164 |
| CBOT 5-Year U.S. Treasury Note Contracts (United States) | 108 | Mar 2024 | 11,706,188 | 219,717 | 219,717 |
| TOTAL PURCHASED | 282,881 | ||||
| Sold | |||||
| Equity Index Contracts | |||||
| CME E-mini S&P 500 Index Contracts (United States) | 32 | Mar 2024 | 779,280 | (33,684) | (33,684) |
| Treasury Contracts | |||||
| CBOT Ultra Long Term U.S. Treasury Bond Contracts (United States) | 12 | Mar 2024 | 1,550,625 | (89,769) | (89,769) |
| SGX 10-year Mini Japanese Government Bond Contracts (Singapore) | 10 | Mar 2024 | 994,021 | (373) | (373) |
| TOTAL TREASURY CONTRACTS | (90,142) | ||||
| TOTAL SOLD | (123,826) | ||||
| TOTAL FUTURES CONTRACTS | 159,055 | ||||
| The notional amount of futures purchased as a percentage of Net Assets is 160.6% | |||||
| The notional amount of futures sold as a percentage of Net Assets is 27.3% | |||||
For the period, the average monthly notional amount at value for futures contracts in the aggregate was $18,673,714.
| Written Options | ||||||
| Counterparty | Number of Contracts | Notional Amount ($) | Exercise Price ($) | Expiration Date | Value ($) | |
| Put Options | ||||||
| iShares Russell 2000 Index ETF | Chicago Board Options Exchange | 5 | 96,440 | 197.00 | 06/28/24 | (5,243) |
| Forward Foreign Currency Contracts | ||||||
Currency Purchased | Currency Sold | Counterparty | Settlement Date | Unrealized Appreciation/ (Depreciation) ($) | ||
| BRL | 3,029,224 | USD | 616,799 | Bank of America, N.A. | 2/26/24 | (6,599) |
| GBP | 498,000 | USD | 622,396 | Bank of America, N.A. | 2/26/24 | 8,842 |
| JPY | 92,200,000 | USD | 630,806 | BNP Paribas S.A. | 2/26/24 | (1,926) |
| JPY | 34,753,000 | USD | 247,379 | Brown Brothers Harriman & Co | 2/26/24 | (10,335) |
| TOTAL FORWARD FOREIGN CURRENCY CONTRACTS | (10,018) | |||||
| Unrealized Appreciation | 8,842 | |||||
| Unrealized Depreciation | (18,860) | |||||
For the period, the average contract value for forward foreign currency contracts was $1,513,781. Contract value represents contract amount in United States dollars plus or minus unrealized appreciation or depreciation, respectively.
| Credit Default Swaps | ||||||||||
| Underlying Reference | Maturity Date | Clearinghouse / Counterparty(1) | Fixed Payment Received/ (Paid) | Payment Frequency | Notional Amount(2) | Value ($) | Upfront Premium Received/ (Paid) ($)(3) | Unrealized Appreciation/ (Depreciation) ($) | ||
| Buy Protection | ||||||||||
| 5-Year CDX N.A. HY Series 41 | Dec 2028 | ICE | (5%) | Quarterly | 4,900,500 | (252,975) | 0 | (252,975) | ||
| Republic of Italy | Dec 2028 | BNP Paribas S.A. | (1%) | Quarterly | 450,000 | (5,407) | 474 | (4,933) | ||
| Republic of Italy | Dec 2028 | Barclays Bank PLC | (1%) | Quarterly | 700,000 | (8,411) | 814 | (7,597) | ||
| TOTAL CREDIT DEFAULT SWAPS | (266,793) | 1,288 | (265,505) | |||||||
(1)Swaps with Intercontinental Exchange (ICE) are centrally cleared swaps.
(2)Notional amount is stated in U.S. Dollars unless otherwise noted.
(3)Any premiums for centrally cleared swaps are recorded periodically throughout the term of the swap to variation margin and included in unrealized appreciation (depreciation).
For the period, the average monthly notional amount at value for swaps in the aggregate was $5,614,042.
Currency Abbreviations
| BRL | - | Brazilian real |
| GBP | - | British pound sterling |
| JPY | - | Japanese yen |
| USD | - | U.S. dollar |
Security Type Abbreviations
| ETF | - | EXCHANGE-TRADED FUND |
| ETN | - | EXCHANGE-TRADED NOTE |
Legend
| (a) | Amount is stated in United States dollars unless otherwise noted. |
| (b) | Security or a portion of the security was pledged to cover margin requirements for futures contracts. At period end, the value of securities pledged amounted to $217,631. |
| (c) | Security or a portion of the security was pledged to cover margin requirements for centrally cleared swaps. At period end, the value of securities pledged amounted to $256,842. |
| (d) | Non-income producing |
| (e) | Affiliated fund that is generally available only to investment companies and other accounts managed by Fidelity Investments. The rate quoted is the annualized seven-day yield of the fund at period end. A complete unaudited listing of the fund's holdings as of its most recent quarter end is available upon request. In addition, each Fidelity Central Fund's financial statements, which are not covered by the Fund's Report of Independent Registered Public Accounting Firm, are available on the SEC's website or upon request. |
| (f) | Security or a portion of the security is pledged as collateral for options written. At period end, the value of securities pledged amounted to $96,440. |
Affiliated Central Funds
Fiscal year to date information regarding the Fund's investments in Fidelity Central Funds, including the ownership percentage, is presented below.
| Affiliate | Value, beginning of period ($) | Purchases ($) | Sales Proceeds ($) | Dividend Income ($) | Realized Gain (loss) ($) | Change in Unrealized appreciation (depreciation) ($) | Value, end of period ($) | % ownership, end of period |
| Fidelity Cash Central Fund 5.39% | 4,281,993 | 10,171,615 | 6,194,711 | 389,567 | - | - | 8,258,897 | 0.0% |
| Total | 4,281,993 | 10,171,615 | 6,194,711 | 389,567 | - | - | 8,258,897 | |
Amounts in the dividend income column in the above table include any capital gain distributions from underlying funds, which are presented in the corresponding line item in the Consolidated Statement of Operations, if applicable.
Amounts included in the purchases and sales proceeds columns may include in-kind transactions, if applicable.
Investment Valuation
The following is a summary of the inputs used, as of January 31, 2024, involving the Fund's assets and liabilities carried at fair value. The inputs or methodology used for valuing securities may not be an indication of the risk associated with investing in those securities. For more information on valuation inputs, and their aggregation into the levels used below, please refer to the Investment Valuation section in the accompanying Notes to Consolidated Financial Statements.
| Valuation Inputs at Reporting Date: | ||||
| Description | Total ($) | Level 1 ($) | Level 2 ($) | Level 3 ($) |
Investments in Securities: | ||||
| U.S. Government and Government Agency Obligations | 576,117 | - | 576,117 | - |
| Fixed-Income Funds | 932,478 | 932,478 | - | - |
| Other | 502,652 | 502,652 | - | - |
| Money Market Funds | 8,258,897 | 8,258,897 | - | - |
| Equity Funds | 1,876,615 | 1,876,615 | - | - |
| Purchased Options | 13,248 | 13,248 | - | - |
| Total Investments in Securities: | 12,160,007 | 11,583,890 | 576,117 | - |
Derivative Instruments: Assets | ||||
Futures Contracts | 282,881 | 282,881 | - | - |
Forward Foreign Currency Contracts | 8,842 | - | 8,842 | - |
| Total Assets | 291,723 | 282,881 | 8,842 | - |
| Liabilities | ||||
Futures Contracts | (123,826) | (123,826) | - | - |
Forward Foreign Currency Contracts | (18,860) | - | (18,860) | - |
Swaps | (266,793) | - | (266,793) | - |
Written Options | (5,243) | (5,243) | - | - |
| Total Liabilities | (414,722) | (129,069) | (285,653) | - |
| Total Derivative Instruments: | (122,999) | 153,812 | (276,811) | - |
Value of Derivative Instruments
The following table is a summary of the Fund's value of derivative instruments by primary risk exposure as of January 31, 2024. For additional information on derivative instruments, please refer to the Derivative Instruments section in the accompanying Notes to Consolidated Financial Statements.
Primary Risk Exposure / Derivative Type | Value | |
| Asset ($) | Liability ($) | |
| Credit Risk | ||
Swaps (a)(b) | 0 | (266,793) |
| Total Credit Risk | 0 | (266,793) |
| Equity Risk | ||
Futures Contracts (c) | 0 | (33,684) |
Purchased Options (d) | 13,248 | 0 |
Written Options (e) | 0 | (5,243) |
| Total Equity Risk | 13,248 | (38,927) |
| Foreign Exchange Risk | ||
Forward Foreign Currency Contracts (f) | 8,842 | (18,860) |
| Total Foreign Exchange Risk | 8,842 | (18,860) |
| Interest Rate Risk | ||
Futures Contracts (c) | 282,881 | (90,142) |
| Total Interest Rate Risk | 282,881 | (90,142) |
| Total Value of Derivatives | 304,971 | (414,722) |
(a)For centrally cleared swaps, reflects gross cumulative appreciation (depreciation) as presented in the Consoidated Schedule of Investments. In the Consolidated Statement of Assets and Liabilities, the period end daily variation margin for centrally cleared swaps is included in receivable or payable for daily variation margin on centrally cleared swaps, and the net cumulative appreciation (depreciation) for centrally cleared swaps is included in Total accumulated earnings (loss).
(b)For bi-lateral over-the-counter (OTC) swaps, reflects gross value which is presented in the Consolidated Statement of Assets and Liabilities in the bi-lateral OTC swaps, at value line-items.
(c)Reflects gross cumulative appreciation (depreciation) on futures contracts as presented in the Consolidated Schedule of Investments. In the Consolidated Statement of Assets and Liabilities, the period end daily variation margin is included in receivable or payable for daily variation margin on futures contracts, and the net cumulative appreciation (depreciation) is included in Total accumulated earnings (loss).
(d)Gross value is presented in the Consolidated Statement of Assets and Liabilities in the Investments in Securities at value line-item.
(e)Gross value is presented in the Consolidated Statement of Assets and Liabilities in the written options, at value line-item.
(f)Gross value is presented in the Consolidated Statement of Assets and Liabilities in the unrealized appreciation/depreciation on forward foreign currency contracts line-items.
| Consolidated Statement of Assets and Liabilities | ||||
| January 31, 2024 | ||||
| Assets | ||||
| Investment in securities, at value - See accompanying schedule: | ||||
Unaffiliated issuers (cost $3,909,172) | $ | 3,901,110 | ||
Fidelity Central Funds (cost $8,258,897) | 8,258,897 | |||
| Total Investment in Securities (cost $12,168,069) | $ | 12,160,007 | ||
| Receivable for investments sold | 4,429 | |||
| Unrealized appreciation on forward foreign currency contracts | 8,842 | |||
| Distributions receivable from Fidelity Central Funds | 38,088 | |||
| Receivable for daily variation margin on futures contracts | 71,024 | |||
| Receivable for daily variation margin on centrally cleared swaps | 19,290 | |||
| Receivable from investment adviser for expense reductions | 388 | |||
| Other receivables | 5 | |||
Total assets | 12,302,073 | |||
| Liabilities | ||||
| Payable to custodian bank | $ | 97,931 | ||
| Payable for investments purchased | 2,710 | |||
| Unrealized depreciation on forward foreign currency contracts | 18,860 | |||
| Payable for fund shares redeemed | 9 | |||
| Bi-lateral OTC swaps, at value | 13,818 | |||
| Accrued management fee | 8,062 | |||
| Distribution and service plan fees payable | 1,266 | |||
| Written options, at value (premium received $4,429) | 5,243 | |||
| Other affiliated payables | 287 | |||
| Total Liabilities | 148,186 | |||
| Net Assets | $ | 12,153,887 | ||
| Net Assets consist of: | ||||
| Paid in capital | $ | 12,876,362 | ||
| Total accumulated earnings (loss) | (722,475) | |||
| Net Assets | $ | 12,153,887 | ||
| Net Asset Value and Maximum Offering Price | ||||
| Class A : | ||||
Net Asset Value and redemption price per share ($889,589 ÷ 99,867 shares)(a) | $ | 8.91 | ||
| Maximum offering price per share (100/94.25 of $8.91) | $ | 9.45 | ||
| Class M : | ||||
Net Asset Value and redemption price per share ($875,324 ÷ 98,653 shares)(a) | $ | 8.87 | ||
| Maximum offering price per share (100/96.50 of $8.87) | $ | 9.19 | ||
| Class C : | ||||
Net Asset Value and offering price per share ($864,535 ÷ 98,206 shares)(a) | $ | 8.80 | ||
| Fidelity Macro Opportunities Fund : | ||||
Net Asset Value, offering price and redemption price per share ($6,946,939 ÷ 760,620 shares) | $ | 9.13 | ||
| Class I : | ||||
Net Asset Value, offering price and redemption price per share ($1,697,069 ÷ 189,888 shares) | $ | 8.94 | ||
| Class Z : | ||||
Net Asset Value, offering price and redemption price per share ($880,431 ÷ 98,394 shares) | $ | 8.95 | ||
(a)Redemption price per share is equal to net asset value less any applicable contingent deferred sales charge. | ||||
| Consolidated Statement of Operations | ||||
Year ended January 31, 2024 | ||||
| Investment Income | ||||
| Dividends | $ | 63,112 | ||
| Interest | 32,496 | |||
| Income from Fidelity Central Funds | 389,567 | |||
| Total Income | 485,175 | |||
| Expenses | ||||
| Management fee | $ | 85,893 | ||
| Distribution and service plan fees | 15,661 | |||
| Independent trustees' fees and expenses | 9,607 | |||
| Total expenses before reductions | 111,161 | |||
| Expense reductions | (9,947) | |||
| Total expenses after reductions | 101,214 | |||
| Net Investment income (loss) | 383,961 | |||
| Realized and Unrealized Gain (Loss) | ||||
| Net realized gain (loss) on: | ||||
| Investment Securities: | ||||
| Unaffiliated issuers | (84,036) | |||
| Forward foreign currency contracts | (76,108) | |||
| Foreign currency transactions | (75) | |||
| Futures contracts | (407,816) | |||
| Swaps | (313,276) | |||
| Total net realized gain (loss) | (881,311) | |||
| Change in net unrealized appreciation (depreciation) on: | ||||
| Investment Securities: | ||||
| Unaffiliated issuers | (7,892) | |||
| Forward foreign currency contracts | (16,909) | |||
| Assets and liabilities in foreign currencies | (1) | |||
| Futures contracts | 125,449 | |||
| Swaps | (71,468) | |||
| Written options | (814) | |||
| Total change in net unrealized appreciation (depreciation) | 28,365 | |||
| Net gain (loss) | (852,946) | |||
| Net increase (decrease) in net assets resulting from operations | $ | (468,985) | ||
| Consolidated Statement of Changes in Net Assets | ||||
Year ended January 31, 2024 | For the period July 7, 2022 (commencement of operations) through January 31, 2023 | |||
| Increase (Decrease) in Net Assets | ||||
| Operations | ||||
| Net investment income (loss) | $ | 383,961 | $ | 63,360 |
| Net realized gain (loss) | (881,311) | (279,601) | ||
| Change in net unrealized appreciation (depreciation) | 28,365 | (153,710) | ||
| Net increase (decrease) in net assets resulting from operations | (468,985) | (369,951) | ||
| Share transactions - net increase (decrease) | 5,507,622 | 7,485,201 | ||
| Total increase (decrease) in net assets | 5,038,637 | 7,115,250 | ||
| Net Assets | ||||
| Beginning of period | 7,115,250 | - | ||
| End of period | $ | 12,153,887 | $ | 7,115,250 |
Consolidated Financial Highlights
| Fidelity Advisor® Macro Opportunities Fund Class A |
| Years ended January 31, | 2024 | 2023 A | ||
Selected Per-Share Data | ||||
| Net asset value, beginning of period | $ | 9.37 | $ | 10.00 |
| Income from Investment Operations | ||||
Net investment income (loss) B,C | .31 | .11 | ||
| Net realized and unrealized gain (loss) | (.77) | (.74) | ||
| Total from investment operations | (.46) | (.63) | ||
| Net asset value, end of period | $ | 8.91 | $ | 9.37 |
Total Return D,E,F | (4.91)% | (6.30)% | ||
Ratios to Average Net Assets C,G,H | ||||
| Expenses before reductions | 1.15% | 2.51% I | ||
| Expenses net of fee waivers, if any | 1.05% | 1.05% I | ||
| Expenses net of all reductions | 1.05% | 1.05% I | ||
| Net investment income (loss) | 3.44% | 2.04% I | ||
| Supplemental Data | ||||
| Net assets, end of period (000 omitted) | $ | 890 | $ | 971 |
Portfolio turnover rate J | 22% | 68% I |
AFor the period July 7, 2022 (commencement of operations) through January 31, 2023.
BCalculated based on average shares outstanding during the period.
CNet investment income (loss) is affected by the timing of the declaration of dividends by any underlying mutual funds or exchange-traded funds (ETFs). Net investment income (loss) of any mutual funds or ETFs is not included in the Fund's net investment income (loss) ratio.
DTotal returns for periods of less than one year are not annualized.
ETotal returns would have been lower if certain expenses had not been reduced during the applicable periods shown.
FTotal returns do not include the effect of the sales charges.
GFees and expenses of any underlying mutual funds or exchange-traded funds (ETFs) are not included in the Fund's expense ratio. The Fund indirectly bears its proportionate share of these expenses. For additional expense information related to investments in Fidelity Central Funds, please refer to the "Investments in Fidelity Central Funds" note found in the Notes to Consolidated Financial Statements section of the most recent Annual or Semi-Annual report.
HExpense ratios reflect operating expenses of the class. Expenses before reductions do not reflect amounts reimbursed, waived, or reduced through arrangements with the investment adviser, brokerage services, or other offset arrangements, if applicable, and do not represent the amount paid by the class during periods when reimbursements, waivers or reductions occur.
IAnnualized.
JAmount does not include the portfolio activity of any underlying mutual funds or exchange-traded funds (ETFs).
| Fidelity Advisor® Macro Opportunities Fund Class M |
| Years ended January 31, | 2024 | 2023 A | ||
Selected Per-Share Data | ||||
| Net asset value, beginning of period | $ | 9.35 | $ | 10.00 |
| Income from Investment Operations | ||||
Net investment income (loss) B,C | .29 | .10 | ||
| Net realized and unrealized gain (loss) | (.77) | (.75) | ||
| Total from investment operations | (.48) | (.65) | ||
| Net asset value, end of period | $ | 8.87 | $ | 9.35 |
Total Return D,E,F | (5.13)% | (6.50)% | ||
Ratios to Average Net Assets C,G,H | ||||
| Expenses before reductions | 1.40% | 2.78% I | ||
| Expenses net of fee waivers, if any | 1.30% | 1.30% I | ||
| Expenses net of all reductions | 1.30% | 1.30% I | ||
| Net investment income (loss) | 3.19% | 1.79% I | ||
| Supplemental Data | ||||
| Net assets, end of period (000 omitted) | $ | 875 | $ | 921 |
Portfolio turnover rate J | 22% | 68% I |
AFor the period July 7, 2022 (commencement of operations) through January 31, 2023.
BCalculated based on average shares outstanding during the period.
CNet investment income (loss) is affected by the timing of the declaration of dividends by any underlying mutual funds or exchange-traded funds (ETFs). Net investment income (loss) of any mutual funds or ETFs is not included in the Fund's net investment income (loss) ratio.
DTotal returns for periods of less than one year are not annualized.
ETotal returns would have been lower if certain expenses had not been reduced during the applicable periods shown.
FTotal returns do not include the effect of the sales charges.
GFees and expenses of any underlying mutual funds or exchange-traded funds (ETFs) are not included in the Fund's expense ratio. The Fund indirectly bears its proportionate share of these expenses. For additional expense information related to investments in Fidelity Central Funds, please refer to the "Investments in Fidelity Central Funds" note found in the Notes to Consolidated Financial Statements section of the most recent Annual or Semi-Annual report.
HExpense ratios reflect operating expenses of the class. Expenses before reductions do not reflect amounts reimbursed, waived, or reduced through arrangements with the investment adviser, brokerage services, or other offset arrangements, if applicable, and do not represent the amount paid by the class during periods when reimbursements, waivers or reductions occur.
IAnnualized.
JAmount does not include the portfolio activity of any underlying mutual funds or exchange-traded funds (ETFs).
| Fidelity Advisor® Macro Opportunities Fund Class C |
| Years ended January 31, | 2024 | 2023 A | ||
Selected Per-Share Data | ||||
| Net asset value, beginning of period | $ | 9.33 | $ | 10.00 |
| Income from Investment Operations | ||||
Net investment income (loss) B,C | .24 | .07 | ||
| Net realized and unrealized gain (loss) | (.77) | (.74) | ||
| Total from investment operations | (.53) | (.67) | ||
| Net asset value, end of period | $ | 8.80 | $ | 9.33 |
Total Return D,E,F | (5.68)% | (6.70)% | ||
Ratios to Average Net Assets C,G,H | ||||
| Expenses before reductions | 1.90% | 3.28% I | ||
| Expenses net of fee waivers, if any | 1.80% | 1.80% I | ||
| Expenses net of all reductions | 1.80% | 1.80% I | ||
| Net investment income (loss) | 2.69% | 1.28% I | ||
| Supplemental Data | ||||
| Net assets, end of period (000 omitted) | $ | 865 | $ | 914 |
Portfolio turnover rate J | 22% | 68% I |
AFor the period July 7, 2022 (commencement of operations) through January 31, 2023.
BCalculated based on average shares outstanding during the period.
CNet investment income (loss) is affected by the timing of the declaration of dividends by any underlying mutual funds or exchange-traded funds (ETFs). Net investment income (loss) of any mutual funds or ETFs is not included in the Fund's net investment income (loss) ratio.
DTotal returns for periods of less than one year are not annualized.
ETotal returns would have been lower if certain expenses had not been reduced during the applicable periods shown.
FTotal returns do not include the effect of the contingent deferred sales charge.
GFees and expenses of any underlying mutual funds or exchange-traded funds (ETFs) are not included in the Fund's expense ratio. The Fund indirectly bears its proportionate share of these expenses. For additional expense information related to investments in Fidelity Central Funds, please refer to the "Investments in Fidelity Central Funds" note found in the Notes to Consolidated Financial Statements section of the most recent Annual or Semi-Annual report.
HExpense ratios reflect operating expenses of the class. Expenses before reductions do not reflect amounts reimbursed, waived, or reduced through arrangements with the investment adviser, brokerage services, or other offset arrangements, if applicable, and do not represent the amount paid by the class during periods when reimbursements, waivers or reductions occur.
IAnnualized.
JAmount does not include the portfolio activity of any underlying mutual funds or exchange-traded funds (ETFs).
| Fidelity® Macro Opportunities Fund |
| Years ended January 31, | 2024 | 2023 A | ||
Selected Per-Share Data | ||||
| Net asset value, beginning of period | $ | 9.58 | $ | 10.00 |
| Income from Investment Operations | ||||
Net investment income (loss) B,C | .34 | .10 | ||
| Net realized and unrealized gain (loss) | (.79) | (.52) | ||
| Total from investment operations | (.45) | (.42) | ||
| Net asset value, end of period | $ | 9.13 | $ | 9.58 |
Total Return D,E | (4.70)% | (4.20)% | ||
Ratios to Average Net Assets C,F,G | ||||
| Expenses before reductions | .88% | 1.50% H | ||
| Expenses net of fee waivers, if any | .80% | .80% H | ||
| Expenses net of all reductions | .80% | .80% H | ||
| Net investment income (loss) | 3.69% | 2.66% H | ||
| Supplemental Data | ||||
| Net assets, end of period (000 omitted) | $ | 6,947 | $ | 1,699 |
Portfolio turnover rate I | 22% | 68% H |
AFor the period September 1, 2022 (commencement of sale of shares) through January 31, 2023.
BCalculated based on average shares outstanding during the period.
CNet investment income (loss) is affected by the timing of the declaration of dividends by any underlying mutual funds or exchange-traded funds (ETFs). Net investment income (loss) of any mutual funds or ETFs is not included in the Fund's net investment income (loss) ratio.
DTotal returns for periods of less than one year are not annualized.
ETotal returns would have been lower if certain expenses had not been reduced during the applicable periods shown.
FFees and expenses of any underlying mutual funds or exchange-traded funds (ETFs) are not included in the Fund's expense ratio. The Fund indirectly bears its proportionate share of these expenses. For additional expense information related to investments in Fidelity Central Funds, please refer to the "Investments in Fidelity Central Funds" note found in the Notes to Consolidated Financial Statements section of the most recent Annual or Semi-Annual report.
GExpense ratios reflect operating expenses of the class. Expenses before reductions do not reflect amounts reimbursed, waived, or reduced through arrangements with the investment adviser, brokerage services, or other offset arrangements, if applicable, and do not represent the amount paid by the class during periods when reimbursements, waivers or reductions occur.
HAnnualized.
IAmount does not include the portfolio activity of any underlying mutual funds or exchange-traded funds (ETFs).
| Fidelity Advisor® Macro Opportunities Fund Class I |
| Years ended January 31, | 2024 | 2023 A | ||
Selected Per-Share Data | ||||
| Net asset value, beginning of period | $ | 9.37 | $ | 10.00 |
| Income from Investment Operations | ||||
Net investment income (loss) B,C | .34 | .12 | ||
| Net realized and unrealized gain (loss) | (.77) | (.75) | ||
| Total from investment operations | (.43) | (.63) | ||
| Net asset value, end of period | $ | 8.94 | $ | 9.37 |
Total Return D,E | (4.59)% | (6.30)% | ||
Ratios to Average Net Assets C,F,G | ||||
| Expenses before reductions | .90% | 2.35% H | ||
| Expenses net of fee waivers, if any | .80% | .80% H | ||
| Expenses net of all reductions | .80% | .79% H | ||
| Net investment income (loss) | 3.69% | 2.14% H | ||
| Supplemental Data | ||||
| Net assets, end of period (000 omitted) | $ | 1,697 | $ | 1,691 |
Portfolio turnover rate I | 22% | 68% H |
AFor the period July 7, 2022 (commencement of operations) through January 31, 2023.
BCalculated based on average shares outstanding during the period.
CNet investment income (loss) is affected by the timing of the declaration of dividends by any underlying mutual funds or exchange-traded funds (ETFs). Net investment income (loss) of any mutual funds or ETFs is not included in the Fund's net investment income (loss) ratio.
DTotal returns for periods of less than one year are not annualized.
ETotal returns would have been lower if certain expenses had not been reduced during the applicable periods shown.
FFees and expenses of any underlying mutual funds or exchange-traded funds (ETFs) are not included in the Fund's expense ratio. The Fund indirectly bears its proportionate share of these expenses. For additional expense information related to investments in Fidelity Central Funds, please refer to the "Investments in Fidelity Central Funds" note found in the Notes to Consolidated Financial Statements section of the most recent Annual or Semi-Annual report.
GExpense ratios reflect operating expenses of the class. Expenses before reductions do not reflect amounts reimbursed, waived, or reduced through arrangements with the investment adviser, brokerage services, or other offset arrangements, if applicable, and do not represent the amount paid by the class during periods when reimbursements, waivers or reductions occur.
HAnnualized.
IAmount does not include the portfolio activity of any underlying mutual funds or exchange-traded funds (ETFs).
| Fidelity Advisor® Macro Opportunities Fund Class Z |
| Years ended January 31, | 2024 | 2023 A | ||
Selected Per-Share Data | ||||
| Net asset value, beginning of period | $ | 9.38 | $ | 10.00 |
| Income from Investment Operations | ||||
Net investment income (loss) B,C | .34 | .12 | ||
| Net realized and unrealized gain (loss) | (.77) | (.74) | ||
| Total from investment operations | (.43) | (.62) | ||
| Net asset value, end of period | $ | 8.95 | $ | 9.38 |
Total Return D,E | (4.58)% | (6.20)% | ||
Ratios to Average Net Assets C,F,G | ||||
| Expenses before reductions | .85% | 2.36% H | ||
| Expenses net of fee waivers, if any | .75% | .75% H | ||
| Expenses net of all reductions | .75% | .75% H | ||
| Net investment income (loss) | 3.74% | 2.20% H | ||
| Supplemental Data | ||||
| Net assets, end of period (000 omitted) | $ | 880 | $ | 919 |
Portfolio turnover rate I | 22% | 68% H |
AFor the period July 7, 2022 (commencement of operations) through January 31, 2023.
BCalculated based on average shares outstanding during the period.
CNet investment income (loss) is affected by the timing of the declaration of dividends by any underlying mutual funds or exchange-traded funds (ETFs). Net investment income (loss) of any mutual funds or ETFs is not included in the Fund's net investment income (loss) ratio.
DTotal returns for periods of less than one year are not annualized.
ETotal returns would have been lower if certain expenses had not been reduced during the applicable periods shown.
FFees and expenses of any underlying mutual funds or exchange-traded funds (ETFs) are not included in the Fund's expense ratio. The Fund indirectly bears its proportionate share of these expenses. For additional expense information related to investments in Fidelity Central Funds, please refer to the "Investments in Fidelity Central Funds" note found in the Notes to Consolidated Financial Statements section of the most recent Annual or Semi-Annual report.
GExpense ratios reflect operating expenses of the class. Expenses before reductions do not reflect amounts reimbursed, waived, or reduced through arrangements with the investment adviser, brokerage services, or other offset arrangements, if applicable, and do not represent the amount paid by the class during periods when reimbursements, waivers or reductions occur.
HAnnualized.
IAmount does not include the portfolio activity of any underlying mutual funds or exchange-traded funds (ETFs).
For the period ended January 31, 2024
1. Organization.
Fidelity Macro Opportunities Fund (the Fund) is a non-diversified fund of Fidelity Greenwood Street Trust (the Trust) and is authorized to issue an unlimited number of shares. The Trust is registered under the Investment Company Act of 1940, as amended (the 1940 Act), as an open-end management investment company organized as a Delaware statutory trust. The Fund offers Class A, Class M, Class C, Fidelity Macro Opportunities Fund, Class I and Class Z shares, each of which has equal rights as to assets and voting privileges. Class A, Class M, Class C, Class I and Class Z are Fidelity Advisor classes. Each class has exclusive voting rights with respect to matters that affect that class. Class C shares will automatically convert to Class A shares after a holding period of eight years from the initial date of purchase, with certain exceptions.
2. Consolidated Subsidiary.
The Funds included in the table below hold certain commodity-related investments through a wholly owned subsidiary (the "Subsidiary"). As of period end, the investments in the Subsidiaries were as follows:
| Subsidiary Name | Net Assets of Subsidiary | % of Fund's Net Assets | |
| Fidelity Macro Opportunities Fund | Fidelity Global Macro Opportunities Cayman Ltd. | 1,253,862 | 10.3 |
The financial statements have been consolidated to include the Subsidiary accounts where applicable. Accordingly, all inter-company transactions and balances have been eliminated.
3. Investments in Fidelity Central Funds.
Funds may invest in Fidelity Central Funds, which are open-end investment companies generally available only to other investment companies and accounts managed by the investment adviser and its affiliates. The Consolidated Schedule of Investments lists any Fidelity Central Funds held as an investment as of period end, but does not include the underlying holdings of each Fidelity Central Fund. An investing fund indirectly bears its proportionate share of the expenses of the underlying Fidelity Central Funds.
Based on its investment objective, each Fidelity Central Fund may invest or participate in various investment vehicles or strategies that are similar to those of the investing fund. These strategies are consistent with the investment objectives of the investing fund and may involve certain economic risks which may cause a decline in value of each of the Fidelity Central Funds and thus a decline in the value of the investing fund.
| Fidelity Central Fund | Investment Manager | Investment Objective | Investment Practices | Expense RatioA |
| Fidelity Money Market Central Funds | Fidelity Management & Research Company LLC (FMR) | Each fund seeks to obtain a high level of current income consistent with the preservation of capital and liquidity. | Short-term Investments | Less than .005% |
A Expenses expressed as a percentage of average net assets and are as of each underlying Central Fund's most recent annual or semi-annual shareholder report.
A complete unaudited list of holdings for each Fidelity Central Fund is available upon request or at the Securities and Exchange Commission website at www.sec.gov. In addition, the financial statements of the Fidelity Central Funds which contain the significant accounting policies (including investment valuation policies) of those funds, and are not covered by the Report of Independent Registered Public Accounting Firm, are available on the Securities and Exchange Commission website or upon request.
4. Significant Accounting Policies.
The Fund is an investment company and applies the accounting and reporting guidance of the Financial Accounting Standards Board (FASB) Accounting Standards Codification Topic 946 Financial Services - Investment Companies. The consolidated financial statements have been prepared in conformity with accounting principles generally accepted in the United States of America (GAAP), which require management to make certain estimates and assumptions at the date of the consolidated financial statements. Actual results could differ from those estimates. Subsequent events, if any, through the date that the consolidated financial statements were issued have been evaluated in the preparation of the consolidated financial statements. The Fund's Consolidated Schedule of Investments lists any underlying mutual funds or exchange-traded funds (ETFs) but does not include the underlying holdings of these funds. The following summarizes the significant accounting policies of the Fund:
Investment Valuation. Investments are valued as of 4:00 p.m. Eastern time on the last calendar day of the period. The Board of Trustees (the Board) has designated the Fund's investment adviser as the valuation designee responsible for the fair valuation function and performing fair value determinations as needed. The investment adviser has established a Fair Value Committee (the Committee) to carry out the day-to-day fair valuation responsibilities and has adopted policies and procedures to govern the fair valuation process and the activities of the Committee. In accordance with these fair valuation policies and procedures, which have been approved by the Board, the Fund attempts to obtain prices from one or more third party pricing services or brokers to value its investments. When current market prices, quotations or currency exchange rates are not readily available or reliable, investments will be fair valued in good faith by the Committee, in accordance with the policies and procedures. Factors used in determining fair value vary by investment type and may include market or investment specific events, transaction data, estimated cash flows, and market observations of comparable investments. The frequency that the fair valuation procedures are used cannot be predicted and they may be utilized to a significant extent. The Committee manages the Fund's fair valuation practices and maintains the fair valuation policies and procedures. The Fund's investment adviser reports to the Board information regarding the fair valuation process and related material matters.
The Fund categorizes the inputs to valuation techniques used to value its investments into a disclosure hierarchy consisting of three levels as shown below:
Level 1 - unadjusted quoted prices in active markets for identical investments
Level 2 - other significant observable inputs (including quoted prices for similar investments, interest rates, prepayment speeds, etc.)
Level 3 - unobservable inputs (including the Fund's own assumptions based on the best information available)
Valuation techniques used to value the Fund's investments by major category are as follows:
Equity securities, including restricted securities, for which market quotations are readily available, are valued at the last reported sale price or official closing price as reported by a third party pricing service on the primary market or exchange on which they are traded and are categorized as Level 1 in the hierarchy. In the event there were no sales during the day or closing prices are not available, securities are valued at the last quoted bid price or may be valued using the last available price and are generally categorized as Level 2 in the hierarchy. For foreign equity securities, when market or security specific events arise, comparisons to the valuation of American Depositary Receipts (ADRs), futures contracts, ETFs and certain indexes as well as quoted prices for similar securities may be used and would be categorized as Level 2 in the hierarchy. For equity securities, including restricted securities, where observable inputs are limited, assumptions about market activity and risk are used and these securities may be categorized as Level 3 in the hierarchy.
Debt securities, including restricted securities, are valued based on evaluated prices received from third party pricing services or from brokers who make markets in such securities. U.S. government and government agency obligations are valued by pricing services who utilize matrix pricing which considers yield or price of bonds of comparable quality, coupon, maturity and type or by broker-supplied prices. Swaps are marked-to-market daily based on valuations from third party pricing services, registered derivatives clearing organizations (clearinghouses) or broker-supplied valuations. These pricing sources may utilize inputs such as interest rate curves, credit spread curves, default possibilities and recovery rates. When independent prices are unavailable or unreliable, debt securities and swaps may be valued utilizing pricing methodologies which consider similar factors that would be used by third party pricing services. Debt securities and swaps are generally categorized as Level 2 in the hierarchy but may be Level 3 depending on the circumstances. ETFs and Exchange-Traded Notes (ETNs) are valued at their last sale price or official closing price as reported by a third party pricing service on the primary market or exchange on which they are traded and are categorized as Level 1 in the hierarchy. In the event there were no sales during the day but the exchange reports a closing bid level, ETFs and ETNs are valued at the closing bid and would be categorized as Level 1 in the hierarchy. In the event there was no closing bid, ETFs and ETNs may be valued by another method that the Board believes reflects fair value in accordance with the Board's fair value pricing policies and may be categorized as Level 2 in the hierarchy.
The U.S. dollar value of forward foreign currency contracts is determined using currency exchange rates supplied by a pricing service and are categorized as Level 2 in the hierarchy. Futures contracts are valued at the settlement price established each day by the board of trade or exchange on which they are traded and are categorized as Level 1 in the hierarchy. Exchange-traded options are valued using the last sale price or, in the absence of a sale, the last offering price and are categorized as Level 1 in the hierarchy. Investments in open-end mutual funds, including the Fidelity Central Funds, are valued at their closing net asset value (NAV) each business day and are categorized as Level 1 in the hierarchy.
Changes in valuation techniques may result in transfers in or out of an assigned level within the disclosure hierarchy. The aggregate value of investments by input level as of January 31, 2024 is included at the end of the Fund's Consolidated Schedule of Investments.
Foreign Currency. Certain Funds may use foreign currency contracts to facilitate transactions in foreign-denominated securities. Gains and losses from these transactions may arise from changes in the value of the foreign currency or if the counterparties do not perform under the contracts' terms.
Foreign-denominated assets, including investment securities, and liabilities are translated into U.S. dollars at the exchange rates at period end. Purchases and sales of investment securities, income and dividends received, and expenses denominated in foreign currencies are translated into U.S. dollars at the exchange rate in effect on the transaction date.
The effects of exchange rate fluctuations on investments are included with the net realized and unrealized gain (loss) on investment securities. Other foreign currency transactions resulting in realized and unrealized gain (loss) are disclosed separately.
Investment Transactions and Income. For financial reporting purposes, the Fund's investment holdings and NAV include trades executed through the end of the last business day of the period. The NAV per share for processing shareholder transactions is calculated as of the close of business of the New York Stock Exchange (NYSE), normally 4:00 p.m. Eastern time and includes trades executed through the end of the prior business day. Gains and losses on securities sold are determined on the basis of identified cost. Commissions paid to certain brokers with whom the investment adviser, or its affiliates, places trades on behalf of a fund include an amount in addition to trade execution, which may be rebated back to a fund. Any such rebates are included in net realized gain (loss) on investments in the Consolidated Statement of Operations. Dividend income is recorded on the ex-dividend date, except for certain dividends from foreign securities where the ex-dividend date may have passed, which are recorded as soon as the Fund is informed of the ex-dividend date. Non-cash dividends included in dividend income, if any, are recorded at the fair market value of the securities received. Income and capital gain distributions from Fidelity Central Funds, if any, are recorded on the ex-dividend date. Interest income is accrued as earned and includes coupon interest and amortization of premium and accretion of discount on debt securities as applicable. Investment income is recorded net of foreign taxes withheld where recovery of such taxes is uncertain.
Class Allocations and Expenses. Investment income, realized and unrealized capital gains and losses, common expenses of a fund, and certain fund-level expense reductions, if any, are allocated daily on a pro-rata basis to each class based on the relative net assets of each class to the total net assets of a fund. Each class differs with respect to transfer agent and distribution and service plan fees incurred, as applicable. Certain expense reductions may also differ by class, if applicable. For the reporting period, the allocated portion of income and expenses to each class as a percent of its average net assets may vary due to the timing of recording these transactions in relation to fluctuating net assets of the classes. Expenses directly attributable to a fund are charged to that fund. Expenses attributable to more than one fund are allocated among the respective funds on the basis of relative net assets or other appropriate methods. Expenses included in the accompanying consolidated financial statements reflect the expenses of that fund and do not include any expenses associated with any underlying mutual funds or exchange-traded funds (ETFs). Although not included in a fund's expenses, a fund indirectly bears its proportionate share of these expenses through the net asset value of each underlying mutual fund or exchange-traded fund (ETF). Expense estimates are accrued in the period to which they relate and adjustments are made when actual amounts are known.
Income Tax Information and Distributions to Shareholders. Each year, the Fund intends to qualify as a regulated investment company under Subchapter M of the Internal Revenue Code, including distributing substantially all of its taxable income and realized gains. As a result, no provision for U.S. Federal income taxes is required. As of January 31, 2024, the Fund did not have any unrecognized tax benefits in the consolidated financial statements; nor is the Fund aware of any tax positions for which it is reasonably possible that the total amounts of unrecognized tax benefits will significantly change in the next twelve months. The Fund files a U.S. federal tax return, in addition to state and local tax returns as required. The Fund's federal income tax returns are subject to examination by the Internal Revenue Service (IRS) for a period of three fiscal years after they are filed. State and local tax returns may be subject to examination for an additional fiscal year depending on the jurisdiction. Foreign taxes are provided for based on the Fund's understanding of the tax rules and rates that exist in the foreign markets in which it invests.
The Subsidiary is classified as a controlled foreign corporation under Subchapter N of the Internal Revenue Code. Therefore, the Fund is required to increase its taxable income by its share of the Subsidiary's income. Net investment losses of the Subsidiary cannot be deducted by the Fund in the current period nor carried forward to offset taxable income in future periods.
Distributions are declared and recorded on the ex-dividend date. Income and capital gain distributions are declared separately for each class. Income and capital gain distributions are determined in accordance with income tax regulations, which may differ from GAAP.
Capital accounts within the consolidated financial statements are adjusted for permanent book-tax differences. These adjustments have no impact on net assets or the results of operations. Capital accounts are not adjusted for temporary book-tax differences which will reverse in a subsequent period.
Book-tax differences are primarily due to swaps, futures, foreign currency transactions, capital loss carryforwards and losses deferred due to excise tax regulations.
As of period end, the cost and unrealized appreciation (depreciation) in securities, and derivatives if applicable, for federal income tax purposes were as follows:
| Gross unrealized appreciation | $- |
| Gross unrealized depreciation | (247,870) |
| Net unrealized appreciation (depreciation) | $(247,870) |
| Tax Cost | $12,166,685 |
The tax-based components of distributable earnings as of period end were as follows:
| Undistributed ordinary income | $49,458 |
| Capital loss carryforward | $(524,062) |
| Net unrealized appreciation (depreciation) on securities and other investments | $(247,871) |
Capital loss carryforwards are only available to offset future capital gains of the Fund to the extent provided by regulations and may be limited. The capital loss carryforward information presented below, including any applicable limitation, is estimated as of fiscal period end and is subject to adjustment.
| Short-term | $(250,593) |
| Long-term | (273,469) |
| Total capital loss carryforward | $(524,062) |
5. Derivative Instruments.
Risk Exposures and the Use of Derivative Instruments. The Fund's investment objectives allow for various types of derivative instruments, including futures contracts, forward foreign currency contracts, options and swaps. Derivatives are investments whose value is primarily derived from underlying assets, indices or reference rates and may be transacted on an exchange or over-the-counter (OTC). Derivatives may involve a future commitment to buy or sell a specified asset based on specified terms, to exchange future cash flows at periodic intervals based on a notional principal amount, or for one party to make one or more payments upon the occurrence of specified events in exchange for periodic payments from the other party.
Derivatives were used to increase returns, to gain exposure to certain types of assets, to facilitate transactions in foreign-denominated securities and to manage exposure to certain risks as defined below. The success of any strategy involving derivatives depends on analysis of numerous economic factors, and if the strategies for investment do not work as intended, the objectives may not be achieved.
Derivatives were used to increase or decrease exposure to the following risk(s):
| Credit Risk | Credit risk relates to the ability of the issuer of a financial instrument to make further principal or interest payments on an obligation or commitment that it has to a fund. |
| Equity Risk | Equity risk relates to the fluctuations in the value of financial instruments as a result of changes in market prices (other than those arising from interest rate risk or foreign exchange risk), whether caused by factors specific to an individual investment, its issuer, or all factors affecting all instruments traded in a market or market segment. |
| Foreign Exchange Risk | Foreign exchange rate risk relates to fluctuations in the value of an asset or liability due to changes in currency exchange rates. |
| Interest Rate Risk | Interest rate risk relates to the fluctuations in the value of interest-bearing securities due to changes in the prevailing levels of market interest rates. |
Funds are also exposed to additional risks from investing in derivatives, such as liquidity risk and counterparty credit risk. Liquidity risk is the risk that a fund will be unable to close out the derivative in the open market in a timely manner. Counterparty credit risk is the risk that the counterparty will not be able to fulfill its obligation to a fund. Derivative counterparty credit risk is managed through formal evaluation of the creditworthiness of all potential counterparties. On certain OTC derivatives such as forward foreign currency contracts and bi-lateral swaps, a fund attempts to reduce its exposure to counterparty credit risk by entering into an International Swaps and Derivatives Association, Inc. (ISDA) Master Agreement with each of its counterparties. The ISDA Master Agreement gives a fund the right to terminate all transactions traded under such agreement upon the deterioration in the credit quality of the counterparty beyond specified levels. The ISDA Master Agreement gives each party the right, upon an event of default by the other party or a termination of the agreement, to close out all transactions traded under such agreement and to net amounts owed under each transaction to one net payable by one party to the other. To mitigate counterparty credit risk on bi-lateral OTC derivatives, a fund receives collateral in the form of cash or securities once net unrealized appreciation on outstanding derivative contracts under an ISDA Master Agreement exceeds certain applicable thresholds, subject to certain minimum transfer provisions. The collateral received is held in segregated accounts with the custodian bank in accordance with the collateral agreements entered into between a fund, the counterparty and the custodian bank. A fund could experience delays and costs in gaining access to the collateral even though it is held by the custodian bank. The maximum risk of loss to a fund from counterparty credit risk related to bi-lateral OTC derivatives is generally the aggregate unrealized appreciation and unpaid counterparty payments in excess of any collateral pledged by the counterparty to a fund. A fund may be required to pledge collateral for the benefit of the counterparties on bi-lateral OTC derivatives in an amount not less than each counterparty's unrealized appreciation on outstanding derivative contracts, subject to certain minimum transfer provisions, and any such pledged collateral is identified in the Consolidated Schedule of Investments. Exchange-traded contracts are not covered by the ISDA Master Agreement; however counterparty credit risk related to these contracts may be mitigated by the protection provided by the exchange on which they trade. Counterparty credit risk related to centrally cleared swaps may be mitigated by the protection provided by the clearinghouse.
Investing in derivatives may involve greater risks than investing in the underlying assets directly and, to varying degrees, may involve risk of loss in excess of any initial investment and collateral received and amounts recognized in the Consolidated Statement of Assets and Liabilities. In addition, there may be the risk that the change in value of the derivative contract does not correspond to the change in value of the underlying instrument.
Net Realized Gain (Loss) and Change in Net Unrealized Appreciation (Depreciation) on Derivatives. The table below, which reflects the impacts of derivatives on the financial performance, summarizes the net realized gain (loss) and change in net unrealized appreciation (depreciation) for derivatives during the period as presented in the Consolidated Statement of Operations.
| Primary Risk Exposure / Derivative Type | Net Realized Gain (Loss)($) | Change in Net Unrealized Appreciation (Depreciation)($) |
| Fidelity Macro Opportunities Fund | ||
| Credit Risk | ||
| Swaps | (313,276) | (71,468) |
| Total Credit Risk | (313,276) | (71,468) |
| Equity Risk | ||
| Futures Contracts | (44,558) | (23,977) |
| Purchased Options | (17,213) | (21,284) |
| Written Options | - | (814) |
| Total Equity Risk | (61,771) | (46,075) |
| Foreign Exchange Risk | ||
| Forward Foreign Currency Contracts | (76,108) | (16,909) |
| Total Foreign Exchange Risk | (76,108) | (16,909) |
| Interest Rate Risk | ||
| Futures Contracts | (363,258) | 149,426 |
| Total Interest Rate Risk | (363,258) | 149,426 |
| Totals | (814,413) | 14,974 |
If there are any open positions at period end, a summary of the value of derivatives by primary risk exposure is included at the end of the Consolidated Schedule of Investments.
Forward Foreign Currency Contracts. Forward foreign currency contracts represent obligations to purchase or sell foreign currency on a specified future date at a price fixed at the time the contracts are entered into. Forward foreign currency contracts were used to facilitate transactions in foreign-denominated securities and to manage exposure to certain foreign currencies.
Forward foreign currency contracts are valued daily and fluctuations in exchange rates on open contracts are recorded as unrealized appreciation or (depreciation) and reflected in total accumulated earnings (loss) in the Consolidated Statement of Assets and Liabilities. When the contract is closed, a gain or loss is realized equal to the difference between the closing value and the value at the time it was opened. Non-deliverable forward foreign currency exchange contracts are settled with the counterparty in cash without the delivery of foreign currency. The net realized gain (loss) and change in net unrealized appreciation (depreciation) on forward foreign currency contracts during the period is presented in the Consolidated Statement of Operations.
Any open forward foreign currency contracts at period end are presented in the Consolidated Schedule of Investments under the caption "Forward Foreign Currency Contracts." The contract amount and unrealized appreciation (depreciation) reflects each contract's exposure to the underlying currency at period end, and is representative of volume of activity during the period unless an average contract value is presented.
Futures Contracts. A futures contract is an agreement between two parties to buy or sell a specified underlying instrument for a fixed price at a specified future date. Futures contracts were used to manage exposure to the stock market, bond market and fluctuations in interest rates.
Upon entering into a futures contract, a fund is required to deposit either cash or securities (initial margin) with a clearing broker in an amount equal to a certain percentage of the face value of the contract. Futures contracts are marked-to-market daily and subsequent daily payments are made or received by a fund depending on the daily fluctuations in the value of the futures contracts and are recorded as unrealized appreciation or (depreciation). This receivable and/or payable, if any, is included in daily variation margin on futures contracts in the Consolidated Statement of Assets and Liabilities. Realized gain or (loss) is recorded upon the expiration or closing of a futures contract. The net realized gain (loss) and change in net unrealized appreciation (depreciation) on futures contracts during the period is presented in the Consolidated Statement of Operations.
Any open futures contracts at period end are presented in the Consolidated Schedule of Investments under the caption "Futures Contracts". The notional amount at value reflects each contract's exposure to the underlying instrument or index at period end, and is representative of volume of activity during the period unless an average notional amount is presented. Any securities deposited to meet initial margin requirements are identified in the Consolidated Schedule of Investments. Any cash deposited to meet initial margin requirements is presented as segregated cash with brokers for derivative instruments in the Consolidated Statement of Assets and Liabilities.
Options. Options give the purchaser the right, but not the obligation, to buy (call) or sell (put) an underlying security or financial instrument at an agreed exercise or strike price between or on certain dates. Options obligate the seller (writer) to buy (put) or sell (call) an underlying instrument at the exercise or strike price or cash settle an underlying derivative instrument if the holder exercises the option on or before the expiration date. Exchange-traded options were used to manage exposure to the market.
Upon entering into an options contract, a fund will pay or receive a premium. Premiums paid on purchased options are reflected as cost of investments and premiums received on written options are reflected as a liability on the Consolidated Statement of Assets and Liabilities. Certain options may be purchased or written with premiums to be paid or received on a future date. Options are valued daily and any unrealized appreciation (depreciation) is reflected in total accumulated earnings (loss) in the Consolidated Statement of Assets and Liabilities. When an option is exercised, the cost or proceeds of the underlying instrument purchased or sold is adjusted by the amount of the premium. When an option is closed, a gain or loss is realized depending on whether the proceeds or amount paid for the closing sale transaction is greater or less than the premium received or paid. When an option expires, gains and losses are realized to the extent of premiums received and paid, respectively. The net realized and unrealized gains (losses) on purchased options are included in the Consolidated Statement of Operations in net realized gain (loss) and change in net unrealized appreciation (depreciation) on investment securities. The net realized gain (loss) and change in net unrealized appreciation (depreciation) on written options are presented in the Consolidated Statement of Operations.
Any open options at period end are presented in the Consolidated Schedule of Investments under the captions "Purchased Options," "Purchased Swaptions," "Written Options" and "Written Swaptions," as applicable, and are representative of volume of activity during the period unless an average notional amount is presented.
Writing puts and buying calls tend to increase exposure to the underlying instrument while buying puts and writing calls tend to decrease exposure to the underlying instrument. For purchased options, risk of loss is limited to the premium paid, and for written options, risk of loss is the change in value in excess of the premium received.
Swaps. A swap is a contract between two parties to exchange future cash flows at periodic intervals based on a notional principal amount. A bi-lateral OTC swap is a transaction between a fund and a dealer counterparty where cash flows are exchanged between the two parties for the life of the swap. A centrally cleared swap is a transaction executed between a fund and a dealer counterparty, then cleared by a futures commission merchant (FCM) through a clearinghouse. Once cleared, the clearinghouse serves as a central counterparty, with whom a fund exchanges cash flows for the life of the transaction, similar to transactions in futures contracts.
Bi-lateral OTC swaps are marked-to-market daily and changes in value are reflected in the Consolidated Statement of Assets and Liabilities in the bi-lateral OTC swaps at value line items. Any upfront premiums paid or received upon entering a bi-lateral OTC swap to compensate for differences between stated terms of the swap and prevailing market conditions (e.g. credit spreads, interest rates or other factors) are recorded in total accumulated earnings (loss) in the Consolidated Statement of Assets and Liabilities and amortized to realized gain or (loss) ratably over the term of the swap. Any unamortized upfront premiums are presented in the Consolidated Schedule of Investments.
Centrally cleared swaps require a fund to deposit either cash or securities (initial margin) with the FCM, at the instruction of and for the benefit of the clearinghouse. Any securities deposited to meet initial margin requirements are identified in the Consolidated Schedule of Investments. Any cash deposited to meet initial margin requirements is presented in segregated cash with brokers for derivative instruments in the Consolidated Statement of Assets and Liabilities. Centrally cleared swaps are marked-to-market daily and subsequent payments (variation margin) are made or received depending on the daily fluctuations in the value of the swaps and are recorded as unrealized appreciation or (depreciation). These daily payments, if any, are included in receivable or payable for daily variation margin on centrally cleared swaps in the Consolidated Statement of Assets and Liabilities. Any premiums for centrally cleared swaps are recorded periodically throughout the term of the swap to variation margin and included in total accumulated earnings (loss) in the Consolidated Statement of Assets and Liabilities. Any premiums are recognized as realized gain (loss) upon termination or maturity of the swap.
For both bi-lateral and centrally cleared swaps, payments are exchanged at specified intervals, accrued daily commencing with the effective date of the contract and recorded as realized gain or (loss). Some swaps may be terminated prior to the effective date and realize a gain or loss upon termination. The net realized gain (loss) and change in net unrealized appreciation (depreciation) on swaps during the period is presented in the Consolidated Statement of Operations.
Any open swaps at period end are included in the Consolidated Schedule of Investments under the caption "Swaps", and are representative of volume of activity during the period unless an average notional amount is presented.
Credit Default Swaps. Credit default swaps enable a fund to buy or sell protection against specified credit events on a single-name issuer or a traded credit index. Under the terms of a credit default swap the buyer of protection (buyer) receives credit protection in exchange for making periodic payments to the seller of protection (seller) based on a fixed percentage applied to a notional principal amount. In return for these payments, the seller will be required to make a payment upon the occurrence of one or more specified credit events. A fund enters into credit default swaps as a seller to gain credit exposure to an issuer and/or as a buyer to obtain a measure of protection against defaults of an issuer. Periodic payments are made over the life of the contract by the buyer provided that no credit event occurs.
For credit default swaps on most corporate and sovereign issuers, credit events include bankruptcy, failure to pay or repudiation/moratorium. For credit default swaps on corporate or sovereign issuers, the obligation that may be put to the seller is not limited to the specific reference obligation described in the Consolidated Schedule of Investments. For credit default swaps on asset-backed securities, a credit event may be triggered by events such as failure to pay principal, maturity extension, rating downgrade or write-down. For credit default swaps on asset-backed securities, the reference obligation described represents the security that may be put to the seller. For credit default swaps on a traded credit index, a specified credit event may affect all or individual underlying securities included in the index.
As a seller, if an underlying credit event occurs, a fund will pay a net settlement amount of cash equal to the notional amount of the swap less the recovery value of the reference obligation or underlying securities comprising an index. Only in the event of the industry's inability to value the underlying asset will a fund be required to take delivery of the reference obligation or underlying securities comprising an index and pay an amount equal to the notional amount of the swap.
As a buyer, if an underlying credit event occurs, a fund will receive a net settlement amount of cash equal to the notional amount of the swap less the recovery value of the reference obligation or underlying securities comprising an index. Only in the event of the industry's inability to value the underlying asset will a fund be required to deliver the reference obligation or underlying securities comprising an index in exchange for payment of an amount equal to the notional amount of the swap.
Typically, the value of each credit default swap and credit rating disclosed for each reference obligation in the Consolidated Schedule of Investments, where a fund is the seller, can be used as measures of the current payment/performance risk of the swap. As the value of the swap changes as a positive or negative percentage of the total notional amount, the payment/performance risk may decrease or increase, respectively. In addition to these measures, the investment adviser monitors a variety of factors including cash flow assumptions, market activity and market sentiment as part of its ongoing process of assessing payment/performance risk.
6. Purchases and Sales of Investments.
Purchases and sales of securities, other than short-term securities, U.S. government securities and in-kind transactions, as applicable, are noted in the table below.
| Purchases ($) | Sales ($) | |
| Fidelity Macro Opportunities Fund | 1,654,403 | 612,665 |
7. Fees and Other Transactions with Affiliates.
Management Fee. Fidelity Diversifying Solutions LLC (the investment adviser) and its affiliates provide the Fund with investment management related services for which each class of the Fund pays a monthly management fee. Under the management contract, the investment adviser pays all other operating expenses, except the compensation of the independent Trustees, distribution and service plan fees, and certain miscellaneous expenses such as proxy and shareholder meeting expenses. During the period, the management fee for each class of the Fund was as follows:
| Annual % of Class-Level Average Net Assets | |
| Class A | .80% |
| Class M | .80% |
| Class C | .80% |
| Fidelity Macro Opportunities Fund | .80% |
| Class I | .80% |
| Class Z | .75% |
The investment adviser also provides investment management services to the Subsidiary. The Subsidiary does not pay the investment adviser a fee for these services. The Subsidiary pays certain other expenses, such as custody fees.
Distribution and Service Plan Fees. In accordance with Rule 12b-1 of the 1940 Act, the Fund has adopted separate Distribution and Service Plans for each class of shares. Certain classes pay Fidelity Distributors Company LLC (FDC), an affiliate of the investment adviser, separate Distribution and Service Fees, each of which is based on an annual percentage of each class' average net assets. In addition, FDC may pay financial intermediaries for selling shares of the Fund and providing shareholder support services. For the period, the Distribution and Service Fee rates, total fees and amounts retained by FDC were as follows:
| Distribution Fee | Service Fee | Total Fees | Retained by FDC | |
| Class A | - % | .25% | $2,372 | $2,223 |
| Class M | .25% | .25% | 4,456 | 4,434 |
| Class C | .75% | .25% | 8,833 | 8,833 |
| $15,661 | $15,490 |
Sales Load. FDC may receive a front-end sales charge of up to 5.75% for selling Class A shares and 3.50% for selling Class M shares, some of which is paid to financial intermediaries for selling shares of the Fund. Depending on the holding period, FDC may receive contingent deferred sales charges levied on Class A, Class M and Class C redemptions. The deferred sales charges are 1.00% for Class C shares, 1.00% for certain purchases of Class A shares and .25% for certain purchases of Class M shares.
For the period, sales charge amounts retained by FDC were as follows:
| Retained by FDC | |
| Class A | $10 |
| Class M | 5 |
| $15 |
Interfund Trades. Funds may purchase from or sell securities to other Fidelity Funds under procedures adopted by the Board. The procedures have been designed to ensure these interfund trades are executed in accordance with Rule 17a-7 of the 1940 Act. Any interfund trades are included within the respective purchases and sales amounts shown in the Purchases and Sales of Investments note. Interfund trades during the period are noted in the table below.
| Purchases ($) | Sales ($) | Realized Gain (Loss) ($) | |
| Fidelity Macro Opportunities Fund | 149,623 | - | - |
8. Committed Line of Credit.
Certain Funds participate with other funds managed by the investment adviser or an affiliate in a $4.25 billion credit facility (the "line of credit") to be utilized for temporary or emergency purposes to fund shareholder redemptions or for other short-term liquidity purposes. The participating funds have agreed to pay commitment fees on their pro-rata portion of the line of credit, which are reflected in Miscellaneous expenses on the Consolidated Statement of Operations, and are listed below. During the period, there were no borrowings on this line of credit.
9. Expense Reductions.
The investment adviser contractually agreed to reimburse expenses of each class to the extent annual operating expenses exceeded certain levels of class-level average net assets as noted in the table below. This reimbursement will remain in place through May 31, 2025. Some expenses, for example certain miscellaneous expenses such as proxy and shareholder meeting expenses, are excluded from this reimbursement.
The following classes were in reimbursement during the period:
| Expense Limitations | Reimbursement | |
| Class A | 1.05% | $952 |
| Class M | 1.30% | 896 |
| Class C | 1.80% | 888 |
| Fidelity Macro Opportunities Fund | .80% | 4,178 |
| Class I | .80% | 1,715 |
| Class Z | .75% | 896 |
| $9,525 |
Through arrangements with the Fund's custodian, credits realized as a result of certain uninvested cash balances were used to reduce the Fund's expense by $422.
10. Share Transactions.
Share transactions for each class were as follows and may contain in-kind transactions, automatic conversions between classes or exchanges between affiliated funds:
| Shares | Shares | Dollars | Dollars | |
Year ended January 31, 2024 | Year ended January 31, 2023 A | Year ended January 31, 2024 | Year ended January 31, 2023 A | |
| Fidelity Macro Opportunities Fund | ||||
| Class A | ||||
| Shares sold | 3,872 | 103,669 | $36,640 | $1,033,368 |
| Shares redeemed | (7,674) | - | (67,876) | - |
| Net increase (decrease) | (3,802) | 103,669 | $(31,236) | $1,033,368 |
| Class M | ||||
| Shares sold | 230 | 98,423 | $2,047 | $983,956 |
| Net increase (decrease) | 230 | 98,423 | $2,047 | $983,956 |
| Class C | ||||
| Shares sold | 147 | 98,059 | $1,323 | $980,551 |
| Net increase (decrease) | 147 | 98,059 | $1,323 | $980,551 |
| Fidelity Macro Opportunities Fund | ||||
| Shares sold | 803,369 | 182,920 | $7,445,942 | $1,760,545 |
| Shares redeemed | (220,093) | (5,576) | (2,004,822) | (53,383) |
| Net increase (decrease) | 583,276 | 177,344 | $5,441,120 | $1,707,162 |
| Class I | ||||
| Shares sold | 10,493 | 180,457 | $100,000 | $1,790,750 |
| Shares redeemed | (1,009) | (53) | (9,152) | (500) |
| Net increase (decrease) | 9,484 | 180,404 | $90,848 | $1,790,250 |
| Class Z | ||||
| Shares sold | 394 | 119,054 | $3,520 | $1,188,529 |
| Shares redeemed | - | (21,054) | - | (198,615) |
| Net increase (decrease) | 394 | 98,000 | $3,520 | $989,914 |
A Share transactions for Class A, Class, Class C, Class I and Class Z are for the period July 7, 2022 (commencement of operations) through January 31, 2023, and for Fidelity Macro Opportunities Fund for the period September 1, 2022 (commencement of sale of shares) through January 31, 2023.
11. Other.
A fund's organizational documents provide former and current trustees and officers with a limited indemnification against liabilities arising in connection with the performance of their duties to the fund. In the normal course of business, a fund may also enter into contracts that provide general indemnifications. A fund's maximum exposure under these arrangements is unknown as this would be dependent on future claims that may be made against a fund. The risk of material loss from such claims is considered remote.
At the end of the period, the investment adviser or its affiliates were owners of record of more than 10% of the outstanding shares as follows:
| Fund | Affiliated % |
| Fidelity Macro Opportunities Fund | 37% |
12. Risk and Uncertainties.
Many factors affect a fund's performance. Developments that disrupt global economies and financial markets, such as pandemics, epidemics, outbreaks of infectious diseases, war, terrorism, and environmental disasters, may significantly affect a fund's investment performance. The effects of these developments to a fund will be impacted by the types of securities in which a fund invests, the financial condition, industry, economic sector, and geographic location of an issuer, and a fund's level of investment in the securities of that issuer. Significant concentrations in security types, issuers, industries, sectors, and geographic locations may magnify the factors that affect a fund's performance.
To the Board of Trustees of Fidelity Greenwood Street Trust and the Shareholders of Fidelity Macro Opportunities Fund:
Opinion on the Financial Statements and Financial Highlights
We have audited the accompanying consolidated statement of assets and liabilities of Fidelity Macro Opportunities Fund (the "Fund"), a fund of Fidelity Greenwood Street Trust, including the consolidated schedule of investments, as of January 31, 2024, the related consolidated statement of operations for the year then ended, and the consolidated statement of changes in net assets and the consolidated financial highlights for the year then ended and for the period from July 7, 2022 (commencement of operations) through January 31, 2023, and the related notes. In our opinion, the consolidated financial statements and consolidated financial highlights present fairly, in all material respects, the financial position of the Fund as of January 31, 2024, and the results of its operations for the year then ended, and the changes in its net assets and the financial highlights for the year then ended and for the period from July 7, 2022 (commencement of operations) through January 31, 2023, in conformity with accounting principles generally accepted in the United States of America.
Basis for Opinion
These financial statements and financial highlights are the responsibility of the Fund's management. Our responsibility is to express an opinion on the Fund's financial statements and financial highlights based on our audits. We are a public accounting firm registered with the Public Company Accounting Oversight Board (United States) (PCAOB) and are required to be independent with respect to the Fund in accordance with the U.S. federal securities laws and the applicable rules and regulations of the Securities and Exchange Commission and the PCAOB.
We conducted our audits in accordance with the standards of the PCAOB. Those standards require that we plan and perform the audit to obtain reasonable assurance about whether the financial statements and financial highlights are free of material misstatement, whether due to error or fraud. The Fund is not required to have, nor were we engaged to perform, an audit of its internal control over financial reporting. As part of our audits, we are required to obtain an understanding of internal control over financial reporting but not for the purpose of expressing an opinion on the effectiveness of the Fund's internal control over financial reporting. Accordingly, we express no such opinion.
Our audits included performing procedures to assess the risks of material misstatement of the financial statements and financial highlights, whether due to error or fraud, and performing procedures that respond to those risks. Such procedures included examining, on a test basis, evidence regarding the amounts and disclosures in the financial statements and financial highlights. Our audits also included evaluating the accounting principles used and significant estimates made by management, as well as evaluating the overall presentation of the financial statements and financial highlights. Our procedures included confirmation of securities owned as of January 31, 2024, by correspondence with the custodian and brokers; when replies were not received from brokers, we performed other auditing procedures. We believe that our audits provide a reasonable basis for our opinion.
/s/ Deloitte & Touche LLP
Boston, Massachusetts
March 15, 2024
We have served as the auditor of one or more of the Fidelity investment companies since 1999.
TRUSTEES AND OFFICERS
The Trustees, Members of the Advisory Board (if any), and officers of the trust and fund, as applicable, are listed below. The Board of Trustees governs the fund and is responsible for protecting the interests of shareholders. The Trustees are experienced executives who meet periodically throughout the year to oversee the fund's activities, review contractual arrangements with companies that provide services to the fund, oversee management of the risks associated with such activities and contractual arrangements, and review the fund's performance. Each of the Trustees oversees 10 funds.
The Trustees hold office without limit in time except that (a) any Trustee may resign; (b) any Trustee may be removed by written instrument, signed by at least two-thirds of the number of Trustees prior to such removal; (c) any Trustee who requests to be retired or who has become incapacitated by illness or injury may be retired by written instrument signed by a majority of the other Trustees; and (d) any Trustee may be removed at any special meeting of shareholders by a two-thirds vote of the outstanding voting securities of the trust. Each Trustee who is not an interested person (as defined in the 1940 Act) of the trust and the fund is referred to herein as an Independent Trustee. Each Independent Trustee shall retire not later than the last day of the calendar year in which his or her 75th birthday occurs. The Independent Trustees may waive this mandatory retirement age policy with respect to individual Trustees. Officers and Advisory Board Members hold office without limit in time, except that any officer or Advisory Board Member may resign or may be removed by a vote of a majority of the Trustees at any regular meeting or any special meeting of the Trustees. Except as indicated, each individual has held the office shown or other offices in the same company for the past five years.
The fund's Statement of Additional Information (SAI) includes more information about the Trustees. To request a free copy, call Fidelity at 1-800-544-8544 if you're an individual investing directly with Fidelity, call 1-800-835-5092 if you're a plan sponsor or participant with Fidelity as your recordkeeper or call 1-877-208-0098 on institutional accounts or if you're an advisor or invest through one.
Experience, Skills, Attributes, and Qualifications of the Trustees. The Board of Trustees has adopted a statement of policy that describes the experience, qualifications, attributes, and skills that are necessary and desirable for potential Independent Trustee candidates (Statement of Policy). The Board believes that each Trustee satisfied at the time he or she was initially elected or appointed a Trustee, and continues to satisfy, the standards contemplated by the Statement of Policy. The Board of Trustees also engages professional search firms to help identify potential Independent Trustee candidates who have the experience, qualifications, attributes, and skills consistent with the Statement of Policy. From time to time, additional criteria based on the composition and skills of the current Independent Trustees, as well as experience or skills that may be appropriate in light of future changes to board composition, business conditions, and regulatory or other developments, have also been considered by the professional search firms and the Board of Trustees. In addition, the Board takes into account the Trustees' commitment and participation in Board and committee meetings, as well as their leadership of standing and ad hoc committees throughout their tenure.
In determining that a particular Trustee was and continues to be qualified to serve as a Trustee, the Board has considered a variety of criteria, none of which, in isolation, was controlling. The Board believes that, collectively, the Trustees have balanced and diverse experience, qualifications, attributes, and skills, which allow the Board to operate effectively in governing the fund and protecting the interests of shareholders. Information about the specific experience, skills, attributes, and qualifications of each Trustee, which in each case led to the Board's conclusion that the Trustee should serve (or continue to serve) as a trustee of the fund, is provided below.
Board Structure and Oversight Function. David B. Jones is an interested person and currently serves as Chair. The Trustees have determined that an interested Chair is appropriate and benefits shareholders because an interested Chair has a personal and professional stake in the quality and continuity of services provided to the fund. Independent Trustees exercise their informed business judgment to appoint an individual of their choosing to serve as Chair, regardless of whether the Trustee happens to be independent or a member of management. The Independent Trustees have determined that they can act independently and effectively without having an Independent Trustee serve as Chair and that a key structural component for assuring that they are in a position to do so is for the Independent Trustees to constitute a substantial majority for the Board. The Independent Trustees also regularly meet in executive session.
Fidelity® funds are overseen by different Boards of Trustees. The fund's Board oversees Fidelity's alternative investment funds, and other Boards oversee Fidelity's investment-grade bond, money market, asset allocation, high income, and equity funds. The asset allocation funds may invest in Fidelity® funds overseen by the fund's Board. The use of separate Boards, each with its own committee structure, allows the Trustees of each group of Fidelity® funds to focus on the unique issues of the funds they oversee, including common research, investment, and operational issues. On occasion, the separate Boards establish joint committees to address issues of overlapping consequences for the Fidelity® funds overseen by each Board.
The Trustees primarily operate as a full Board, but have also established one standing committee, the Audit Committee, to facilitate the timely and efficient consideration of all matters of importance to the Trustees, the fund, and fund shareholders and to facilitate compliance with legal and regulatory requirements and oversight of the fund's activities and associated risks. The Board has charged Fidelity Diversifying Solutions LLC (FDS) and its affiliates with (i) identifying events or circumstances the occurrence of which could have demonstrably adverse effects on the fund's business and/or reputation; (ii) implementing processes and controls to lessen the possibility that such events or circumstances occur or to mitigate the effects of such events or circumstances if they do occur; and (iii) creating and maintaining a system designed to evaluate continuously business and market conditions in order to facilitate the identification and implementation processes described in (i) and (ii) above. Because the day-to-day operations and activities of the fund are carried out by or through FDS, its affiliates, and other service providers, the fund's exposure to risks is mitigated but not eliminated by the processes overseen by the Trustees. Board oversight of different aspects of the fund's activities is exercised primarily through the full Board, but also through the Audit Committee. Appropriate personnel, including but not limited to the fund's Chief Compliance Officer (CCO), FDS's internal auditor, the independent accountants, the fund's Treasurer and portfolio management personnel, make periodic reports to the Board and Audit Committee, as appropriate, including an annual review of Fidelity's risk management program for the Fidelity® funds. The responsibilities of the Audit Committee, including its oversight responsibilities, are described further under "Standing Committees of the Trustees."
Interested Trustees*:
Correspondence intended for a Trustee who is an interested person may be sent to Fidelity Investments, 245 Summer Street, Boston, Massachusetts 02210.
Name, Year of Birth; Principal Occupations and Other Relevant Experience+
David B. Jones (1962)
Year of Election or Appointment: 2021
Trustee
Chair of the Board of Trustees
Mr. Jones also serves as Trustee of other Fidelity® funds. Prior to his retirement, Mr. Jones served in a variety of positions at Fidelity Investments (1982-2008), retiring as a Senior Vice President. His duties included new product development, serving as a liaison to the board of trustees of various Fidelity® funds, and development of policies and procedures for fund investments in derivatives and complex securities. He also served on the FMR Fair Value Committee, which is responsible for day-to-day valuation activities for various Fidelity® funds
* Determined to be an "Interested Trustee" by virtue of, among other things, his or her affiliation with the trust or various entities under common control with FDS.
+ The information includes the Trustee's principal occupation during the last five years and other information relating to the experience, attributes, and skills relevant to the Trustee's qualifications to serve as a Trustee, which led to the conclusion that the Trustee should serve as a Trustee for the fund.
Independent Trustees:
Correspondence intended for an Independent Trustee may be sent to Fidelity Investments, P.O. Box 55235, Boston, Massachusetts 02205-5235.
Name, Year of Birth; Principal Occupations and Other Relevant Experience+
Jennifer M. Birmingham (1971)
Year of Election or Appointment: 2021
Trustee
Ms. Birmingham also serves as Trustee of other Fidelity® funds. Ms. Birmingham serves as Managing Director of Princeton University Investment Company (PRINCO) (2010-present). Previously, Ms. Birmingham served in a variety of positions at Deutsche Bank Asset Management (2002-2010), including Managing Director, Global CFO of DB Advisors and Deutsche Insurance Asset Management, Americas CFO of DWS Americas and various legal entities (2005-2010). Prior to Deutsche Bank, Ms. Birmingham was an employee of Investors Bank and Trust Company (1997-2002) and Deloitte & Touche LLP (1993-1997).
Matthew J. Conti (1966)
Year of Election or Appointment: 2021
Trustee
Mr. Conti also serves as Trustee of other Fidelity® funds. Prior to his retirement, Mr. Conti served in a variety of positions at Fidelity Investments, including as a portfolio manager to certain Fidelity® funds (2000-2018) and research analyst (1995-2003). Mr. Conti serves as a member of the Board of Directors of the Rose Kennedy Greenway Conservancy (2021-present).
Tara C. Kenney (1960)
Year of Election or Appointment: 2021
Trustee
Ms. Kenney also serves as Trustee of other Fidelity® funds. Prior to her retirement, Ms. Kenney served as Senior Vice President of Boston Common Asset Management (2017-2020). Previously, Ms. Kenney served as Managing Director in a variety of roles for Deutsche Asset Management (2003-2016) as well as Scudder Investments where she was a Portfolio Manager (1995-2003). Currently, Ms. Kenney serves as a Board member for a number of non-profit organizations and academic institutions, including Catholic Charities USA (2017-present) and the Kellogg Institute for International Studies at the University of Notre Dame (2002-present). Ms. Kenney is also an adjunct professor of finance at the University of Notre Dame.
+ The information includes the Trustee's principal occupation during the last five years and other information relating to the experience, attributes, and skills relevant to the Trustee's qualifications to serve as a Trustee, which led to the conclusion that the Trustee should serve as a Trustee for the fund.
Advisory Board Members and Officers:
Correspondence intended for a Member of the Advisory Board (if any) may be sent to Fidelity Investments, P.O. Box 55235, Boston, Massachusetts 02205-5235. Correspondence intended for an officer may be sent to Fidelity Investments, 245 Summer Street, Boston, Massachusetts 02210.
Name, Year of Birth; Principal Occupation
Joseph Benedetti (1965)
Year of Election or Appointment: 2021
Assistant Secretary
Mr. Benedetti also serves as Assistant Secretary of other funds. Mr. Benedetti is a Senior Vice President, Deputy General Counsel (2020-present) and is an employee of Fidelity Investments (2020-present). Mr. Benedetti serves as Assistant Secretary of Fidelity Diversifying Solutions LLC (investment adviser firm, 2022-present) and Secretary of certain other Fidelity entities. Previously, Mr. Benedetti served as Secretary of Fidelity Diversifying Solutions LLC (2021-2022). Prior to joining Fidelity, Mr. Benedetti was Assistant General Counsel at Invesco (investment adviser firm, 2019-2020) and Senior Vice President and Managing Counsel at OppenheimerFunds Inc. (investment adviser firm, 2017-2019).
Heather Bonner (1977)
Year of Election or Appointment: 2023
President and Treasurer
Ms. Bonner also serves as an officer of other funds. Ms. Bonner is a Senior Vice President (2022-present) and is an employee of Fidelity Investments (2022-present). Ms. Bonner serves as Vice President or Treasurer of certain Fidelity entities. Prior to joining Fidelity, Ms. Bonner served as Managing Director at AQR Capital Management (2013-2022) and was the Treasurer and Principal Financial Officer of the AQR Funds (2013-2022).
Craig S. Brown (1977)
Year of Election or Appointment: 2021
Assistant Treasurer
Mr. Brown also serves as an officer of other funds. Mr. Brown is a Vice President (2015-present) and is an employee of Fidelity Investments. Mr. Brown serves as Assistant Treasurer of FIMM, LLC (2021-present). Previously, Mr. Brown served as Assistant Treasurer of certain Fidelity® funds (2019-2022).
John J. Burke III (1964)
Year of Election or Appointment: 2021
Chief Financial Officer
Mr. Burke also serves as Chief Financial Officer of other funds. Mr. Burke is Head of Fidelity Fund and Investment Operations (2018-present) and is an employee of Fidelity Investments. Mr. Burke serves as President, Executive Vice President, or Director of certain Fidelity entities. Previously Mr. Burke served as head of Asset Management Investment Operations (2012-2018).
Margaret Carey (1973)
Year of Election or Appointment: 2023
Secretary and Chief Legal Officer (CLO)
Ms. Carey also serves as an officer of other funds and as CLO of certain Fidelity entities. Ms. Carey is a Senior Vice President, Deputy General Counsel (2019-present) and is an employee of Fidelity Investments.
Nati Davidi (1971)
Year of Election or Appointment: 2021
Assistant Secretary
Ms. Davidi also serves as Assistant Secretary of other funds. Ms. Davidi is a Vice President, Associate General Counsel (2013-present) and is an employee of Fidelity Investments. Previously, Ms. Davidi served as Assistant Secretary of the North Carolina Capital Management Trust (2016-2022).
Jonathan Davis (1968)
Year of Election or Appointment: 2021
Assistant Treasurer
Mr. Davis also serves as an officer of other funds. Mr. Davis is a Vice President (2006-present) and is an employee of Fidelity Investments. Mr. Davis serves as Assistant Treasurer of certain Fidelity entities.
Laura M. Del Prato (1964)
Year of Election or Appointment: 2021
Assistant Treasurer
Ms. Del Prato also serves as an officer of other funds. Ms. Del Prato is a Senior Vice President (2017-present) and is an employee of Fidelity Investments. Ms. Del Prato serves as Vice President or Assistant Treasurer of certain Fidelity entities. Previously, Ms. Del Prato served as President and Treasurer of The North Carolina Capital Management Trust: Cash Portfolio and Term Portfolio (2018-2020).
Colm A. Hogan (1973)
Year of Election or Appointment: 2021
Assistant Treasurer
Mr. Hogan also serves as an officer of other funds. Mr. Hogan is a Vice President (2016-present) and is an employee of Fidelity Investments. Mr. Hogan serves as Assistant Treasurer of certain Fidelity entities. Previously, Mr. Hogan served as Deputy Treasurer of certain Fidelity® funds (2016-2020) and Assistant Treasurer of certain Fidelity® funds (2016-2018).
William Irving (1964)
Year of Election or Appointment: 2023
Vice President
Mr. Irving also serves as Vice President of other funds. Mr. Irving is Head of Fidelity Asset Management Solutions (2022-present) and is an employee of Fidelity Investments. Mr. Irving serves as President and Director of Fidelity Diversifying Solutions LLC (investment adviser firm, 2023-present) and President or Director of certain other Fidelity entities. Previously, Mr. Irving served as Chief Investment Officer (CIO) in the Global Asset Allocation division (2020-2022). Prior to that, he was Managing Director of Research in the Global Asset Allocation division (2018-2020) and portfolio manager of certain Fidelity® funds (2004-2018).
Chris Maher (1972)
Year of Election or Appointment: 2021
Assistant Treasurer
Mr. Maher also serves as an officer of other funds. Mr. Maher is a Vice President (2008-present) and is an employee of Fidelity Investments. Mr. Maher serves as Assistant Treasurer of certain Fidelity entities. Previously, Mr. Maher served as Assistant Treasurer of certain funds (2013-2020).
Ksenia Portnoy (1980)
Year of Election or Appointment: 2021
Chief Compliance Officer
Ms. Portnoy also serves as Chief Compliance Officer of other funds. Ms. Portnoy is a Senior Vice President of Asset Management Compliance (2021-present) and is an employee of Fidelity Investments (2021-present). Prior to joining Fidelity, Ms. Portnoy worked in the asset management divisions of Morgan Stanley Investment Management (investment adviser firm, 2020-2021) and Mizuho (investment adviser firm, 2015-2020).
Brett Segaloff (1972)
Year of Election or Appointment: 2021
Anti-Money Laundering (AML) Officer
Mr. Segaloff also serves as AML Officer of other funds. Mr. Segaloff is a Vice President (2022-present) and is an employee of Fidelity Investments. Mr. Segaloff serves as Anti Money Laundering Compliance Officer or Anti Money Laundering/Bank Secrecy Act Compliance Officer of certain Fidelity entities.
Stacie M. Smith (1974)
Year of Election or Appointment: 2021
Assistant Treasurer
Ms. Smith also serves as an officer of other funds. Ms. Smith is a Senior Vice President (2016-present) and is an employee of Fidelity Investments. Ms. Smith serves as Assistant Treasurer of certain Fidelity entities and has served in other fund officer roles.
Jim Wegmann (1979)
Year of Election or Appointment: 2021
Assistant Treasurer
Mr. Wegmann also serves as an officer of other funds. Mr. Wegmann is a Vice President (2016-present) and is an employee of Fidelity Investments. Mr. Wegmann serves as Assistant Treasurer of FIMM, LLC (2021-present). Previously, Mr. Wegmann served as Assistant Treasurer of certain Fidelity® funds (2019-2021).
As a shareholder, you incur two types of costs: (1) transaction costs, which may include sales charges (loads) on purchase payments or redemption proceeds, as applicable and (2) ongoing costs, which generally include management fees, distribution and/or service (12b-1) fees and other Fund expenses. This Example is intended to help you understand your ongoing costs (in dollars) of investing in a fund and to compare these costs with the ongoing costs of investing in other mutual funds.
| The Example is based on an investment of $1,000 invested at the beginning of the period and held for the entire period (August 1, 2023 to January 31, 2024). |
Actual Expenses
The first line of the accompanying table provides information about actual account values and actual expenses. You may use the information in this line, together with the amount you invested, to estimate the expenses that you paid over the period. Simply divide your account value by $1,000.00 (for example, an $8,600 account value divided by $1,000.00 = 8.6), then multiply the result by the number in the first line for a class/Fund under the heading entitled "Expenses Paid During Period" to estimate the expenses you paid on your account during this period. If any fund is a shareholder of any underlying mutual funds or exchange-traded funds (ETFs) (the Underlying Funds), such fund indirectly bears its proportional share of the expenses of the Underlying Funds in addition to the direct expenses incurred presented in the table. These fees and expenses are not included in the annualized expense ratio used to calculate the expense estimate in the table below.
Hypothetical Example for Comparison Purposes
The second line of the accompanying table provides information about hypothetical account values and hypothetical expenses based on the actual expense ratio and an assumed rate of return of 5% per year before expenses, which is not the actual return. The hypothetical account values and expenses may not be used to estimate the actual ending account balance or expenses you paid for the period. You may use this information to compare the ongoing costs of investing in the Fund and other funds. To do so, compare this 5% hypothetical example with the 5% hypothetical examples that appear in the shareholder reports of the other funds. If any fund is a shareholder of any Underlying Funds, such fund indirectly bears its proportional share of the expenses of the Underlying Funds in addition to the direct expenses as presented in the table. These fees and expenses are not included in the annualized expense ratio used to calculate the expense estimate in the table below.
Please note that the expenses shown in the table are meant to highlight your ongoing costs only and do not reflect any transaction costs. Therefore, the second line of the table is useful in comparing ongoing costs only, and will not help you determine the relative total costs of owning different funds. In addition, if these transactional costs were included, your costs would have been higher.
Annualized Expense Ratio- A | Beginning Account Value August 1, 2023 | Ending Account Value January 31, 2024 | Expenses Paid During Period- C August 1, 2023 to January 31, 2024 | |||||||
| Fidelity® Macro Opportunities Fund | ||||||||||
| Class A | 1.05% | |||||||||
| Actual | $ 1,000 | $ 992.20 | $ 5.27 | |||||||
Hypothetical-B | $ 1,000 | $ 1,019.91 | $ 5.35 | |||||||
| Class M | 1.30% | |||||||||
| Actual | $ 1,000 | $ 991.10 | $ 6.52 | |||||||
Hypothetical-B | $ 1,000 | $ 1,018.65 | $ 6.61 | |||||||
| Class C | 1.80% | |||||||||
| Actual | $ 1,000 | $ 987.70 | $ 9.02 | |||||||
Hypothetical-B | $ 1,000 | $ 1,016.13 | $ 9.15 | |||||||
| Fidelity® Macro Opportunities Fund | .80% | |||||||||
| Actual | $ 1,000 | $ 993.50 | $ 4.02 | |||||||
Hypothetical-B | $ 1,000 | $ 1,021.17 | $ 4.08 | |||||||
| Class I | .80% | |||||||||
| Actual | $ 1,000 | $ 993.30 | $ 4.02 | |||||||
Hypothetical-B | $ 1,000 | $ 1,021.17 | $ 4.08 | |||||||
| Class Z | .75% | |||||||||
| Actual | $ 1,000 | $ 994.40 | $ 3.77 | |||||||
Hypothetical-B | $ 1,000 | $ 1,021.42 | $ 3.82 | |||||||
A Annualized expense ratio reflects expenses net of applicable fee waivers.
B 5% return per year before expenses
C Expenses are equal to the annualized expense ratio, multiplied by the average account value over the period, multiplied by 184/ 365 (to reflect the one-half year period). The fees and expenses of any Underlying Funds are not included in each annualized expense ratio.
Distributions (Unaudited)
The dividend and capital gains distributions for the fund(s) are available on Fidelity.com or Institutional.Fidelity.com.
The fund will notify shareholders in January 2025 of amounts for use in preparing 2024 income tax returns.
Board Approval of Investment Advisory Contracts and Management Fees
Fidelity Macro Opportunities Fund
Each year, the Board of Trustees, including the Independent Trustees (together, the Board), considers the renewal of the fund's management contract with Fidelity Diversifying Solutions LLC (FDS) and the sub-advisory agreements (together, the Advisory Contracts) for the fund. FDS and the sub-advisers are referred to herein as the Investment Advisers. The Board, assisted by the advice of fund counsel and Independent Trustees' counsel, requests and considers a broad range of information relevant to the renewal of the Advisory Contracts throughout the year.
The Board meets regularly and, at each of its meetings, covers an extensive agenda of topics and materials and considers factors that are relevant to its annual consideration of the renewal of the fund's Advisory Contracts, including the services and support provided to the fund and its shareholders. The Board requests and receives information concerning the annual consideration of the renewal of the fund's Advisory Contracts. The Board also meets as needed to review matters specifically related to the Board's annual consideration of the renewal of the Advisory Contracts.
At its November 2023 meeting, the Board unanimously determined to renew the fund's Advisory Contracts. In reaching its determination, the Board considered all factors it believed relevant and reached a determination, with the assistance of fund counsel and Independent Trustees' counsel and through the exercise of its business judgment, that the renewal of the Advisory Contracts was in the best interests of the fund and its shareholders and the fact that no fee is payable under the management contract was fair and reasonable in light of all of the surrounding circumstances.
Nature, Extent, and Quality of Services Provided. The Board considered staffing as it relates to the fund, including the backgrounds and experience of investment personnel of the Investment Advisers, and also considered the Investment Advisers' implementation of the fund's investment program.
Resources Dedicated to Investment Management and Support Services. The Board reviewed the general qualifications and capabilities of Fidelity's investment staff, including its size, education, experience, and resources, as well as Fidelity's approach to training and managing investment personnel. The Board noted the resources devoted to Fidelity's global investment organization and that Fidelity's analysts have extensive resources, tools and capabilities that allow them to conduct sophisticated quantitative and fundamental analysis, as well as credit analysis of issuers, counterparties and guarantors. Further, the Board considered that Fidelity's investment professionals have sufficient access to global information and data so as to provide competitive investment results over time, and that those professionals also have access to sophisticated tools that permit them to assess portfolio construction and risk and performance attribution characteristics continuously, as well as to transmit new information and research conclusions rapidly around the world. Additionally, in its deliberations, the Board considered Fidelity's trading, risk management, compliance, cybersecurity, and technology and operations capabilities and resources, which are integral parts of the investment management process.
Shareholder and Administrative Services. The Board considered the nature, extent, quality, and cost of advisory, administrative, and shareholder services to be performed by the Investment Advisers and their affiliates under the Advisory Contracts and under separate agreements covering transfer agency, pricing and bookkeeping, and securities lending services for the fund. The Board also considered the nature and extent of the supervision of third-party service providers, principally custodians, subcustodians, and pricing vendors. The Board also considered the fund's securities lending activities and any payments made to Fidelity relating to securities lending.
The Board noted that the growth of fund assets over time across the complex allows Fidelity to reinvest in the development of services designed to enhance the value and convenience of the Fidelity funds as investment vehicles. These services include 24-hour access to account information and market information over the Internet and through telephone representatives, investor education materials and asset allocation tools.
Investment Performance. The Board took into account discussions that occur with representatives of the Investment Advisers, and reports that it receives, at Board meetings throughout the year, relating to fund investment performance. In this regard the Board noted that as part of regularly scheduled fund reviews and other reports to the Board on fund performance, the Board considered annualized return information for the fund for different time periods, measured against an appropriate securities market index (benchmark index). The Board also considered information about performance attribution. In its ongoing evaluation of fund investment performance, the Board gives particular attention to information indicating changes in performance of the funds over different time periods and discussed with the Investment Advisers the reasons for any overperformance or underperformance.
In addition to reviewing absolute and relative fund performance, the Independent Trustees periodically consider the appropriateness of fund performance metrics in evaluating the results achieved. The Independent Trustees generally give greater weight to fund performance over longer time periods than over shorter time periods. Depending on the circumstances, the Independent Trustees may be satisfied with a fund's performance notwithstanding that it lags its benchmark index for certain periods.
Based on its review, the Board concluded that the nature, extent, and quality of services to be provided to the fund under the Advisory Contracts should benefit the shareholders of the fund.
Competitiveness of Management Fee and Total Expense Ratio. In its review of the fund's management fee and the total expense ratio of a representative class of the fund (Class I), the Board considered the fund's class-level unitary management fees rate as well as other fund or class expenses, as applicable, such as fund-paid 12b-1 fees. The Board noted that differences among the classes' net expenses are the result of separate arrangements for class level services and/or waivers of certain expenses (if any). It is not the result of any difference in advisory or custodial fees or other expenses related to the management of a fund's assets, which do not vary by class.The Board noted that Fidelity may agree to waive fees or reimburse expenses from time to time, and the extent to which, if any, it has done so for the fund.
Comparisons of Management Fees and Total Expense Ratios. Among other things, the Board reviewed data for selected groups of competitive funds and classes (referred to as "mapped groups") that were compiled by Fidelity based on combining similar investment objective categories (as classified by Lipper) that have comparable investment mandates. The data reviewed by the Board included (i) gross management fee comparisons (before taking into account expense reimbursements or caps) relative to the total universe of funds within the mapped group; and (ii) net total expense comparisons (including acquired fund fees and expenses) of Class I of the fund relative to funds and classes in the mapped group that have a similar sales load structure to Class I of the fund (referred to as the "similar sales load structure group").
The information provided to the Board indicated that the fund's management fee rate ranked below the competitive median of the mapped group for the 12-month period ended March 31, 2023. Further, the information provided to the Board indicated that the total expense ratio of Class I of the fund ranked below the competitive median of the similar sales load structure group for the 12-month period ended March 31, 2023.
Other Contractual Arrangements. The Board further considered that FDS has contractually agreed to reimburse Class A, Class M, Class C, Class I, Class Z, and the retail class of the fund to the extent that total operating expenses, with certain exceptions, as a percentage of their respective average net assets, exceed 1.05%, 1.30%, 1.80%, 0.80%, 0.75%, and 0.80% through May 31, 2024.
Based on its review, the Board concluded that the fund's management fee is fair and reasonable in light of the services that the fund receives and the other factors considered. Further based on its review of total expense ratios and fees charged to other Fidelity clients, the Board concluded that the total expense ratio of each class of the fund was reasonable in light of the services that the fund and its shareholders receive and the other factors considered.
Costs of the Services and Profitability. The Board considered the revenues earned and the expenses incurred by Fidelity in conducting the business of developing, marketing, distributing, managing, administering and servicing the fund and servicing the fund's shareholders. The Board considered the level of Fidelity's profits in respect of all the Fidelity funds it oversees. The Board noted that the profitability information reflects the relatively small size of the funds overseen by the Board and their short history given that the period for the profitability report was calendar year 2022.
The Board also reviewed Fidelity's non-fund businesses and potential indirect benefits such businesses may have received as a result of their association with Fidelity's fund business (i.e., fall-out benefits) as well as cases where Fidelity's affiliates may benefit from the funds' business. The Board considered areas where potential indirect benefits to the Fidelity funds from their relationships with Fidelity may exist.
The Board considered the costs of the services provided by and the lack of meaningful profits realized by Fidelity in connection with the operation of the funds overseen by the Board and was satisfied that the profitability was not excessive.
Economies of Scale. The Board will consider economies of scale when there is operating experience to permit assessment thereof. It noted that, notwithstanding the entrepreneurial risk associated with a new fund, the management fee was at a level normally associated, by comparison with competitors, with very high fund net assets, and Fidelity asserted to the Board that the level of the fee anticipated economies of scale at lower asset levels even before, if ever, economies of scale are achieved. The Board also noted that the fund and its shareholders would have access to the very considerable number and variety of services available through Fidelity and its affiliates.
Conclusion. Based on its evaluation of all of the conclusions noted above, and after considering all factors it believed relevant, the Board concluded that the advisory fee arrangements are fair and reasonable in light of all of the surrounding circumstances, and that the fund's Advisory Contracts should be approved through November 30, 2024.
The Securities and Exchange Commission adopted Rule 22e-4 under the Investment Company Act of 1940 (the Liquidity Rule) to promote effective liquidity risk management throughout the open-end investment company industry, thereby reducing the risk that funds will be unable to meet their redemption obligations and mitigating dilution of the interests of fund shareholders.
The Fund has adopted and implemented a liquidity risk management program (the Program) reasonably designed to assess and manage the Fund's liquidity risk and to comply with the requirements of the Liquidity Rule. The Fund's Board of Trustees (the Board) has designated the Fund's investment adviser as administrator of the Program. The Fidelity advisers have established a Liquidity Risk Management Committee (the LRM Committee) to manage the Program for each of the Fidelity Funds. The LRM Committee monitors the adequacy and effectiveness of implementation of the Program and on a periodic basis assesses each Fund's liquidity risk based on a variety of factors including (1) the Fund's investment strategy, (2) portfolio liquidity and cash flow projections during normal and reasonably foreseeable stressed conditions, (3) shareholder redemptions, (4) borrowings and other funding sources and (5) certain factors specific to ETFs including the effect of the Fund's prices and spreads, market participants, and basket compositions on the overall liquidity of the Fund's portfolio, as applicable.
In accordance with the Program, each of the Fund's portfolio investments is classified into one of four defined liquidity categories based on a determination of a reasonable expectation for how long it would take to convert the investment to cash (or sell or dispose of the investment) without significantly changing its market value.
- Highly liquid investments - cash or convertible to cash within three business days or less
- Moderately liquid investments - convertible to cash in three to seven calendar days
- Less liquid investments - can be sold or disposed of, but not settled, within seven calendar days
- Illiquid investments - cannot be sold or disposed of within seven calendar days
Liquidity classification determinations take into account a variety of factors including various market, trading and investment-specific considerations, as well as market depth, and generally utilize analysis from a third-party liquidity metrics service.
The Liquidity Rule places a 15% limit on a fund's illiquid investments and requires funds that do not primarily hold assets that are highly liquid investments to determine and maintain a minimum percentage of the fund's net assets to be invested in highly liquid investments (highly liquid investment minimum or HLIM). The Program includes provisions reasonably designed to comply with the 15% limit on illiquid investments and for determining, periodically reviewing and complying with the HLIM requirement as applicable.
At a recent meeting of the Fund's Board of Trustees, the LRM Committee provided a written report to the Board pertaining to the operation, adequacy, and effectiveness of the Program for the period December 1, 2022 through November 30, 2023. The report concluded that the Program is operating effectively and is reasonably designed to assess and manage the Fund's liquidity risk.
 |
1.9904681.101
GMO-ANN-0324
Fidelity® Risk Parity Fund
Annual Report
January 31, 2024
Includes Fidelity and Fidelity Advisor share classes


Contents
To view a fund's proxy voting guidelines and proxy voting record for the 12-month period ended June 30, visit http://www.fidelity.com/proxyvotingresults or visit the Securities and Exchange Commission's (SEC) web site at http://www.sec.gov.
You may also call 1-800-544-8544 if you're an individual investing directly with Fidelity, call 1-800-835-5092 if you're a plan sponsor or participant with Fidelity as your recordkeeper or call 1-877-208-0098 on institutional accounts or if you're an advisor or invest through one to request a free copy of the proxy voting guidelines.
Standard & Poor's, S&P and S&P 500 are registered service marks of The McGraw-Hill Companies, Inc. and have been licensed for use by Fidelity Distributors Corporation.
Other third-party marks appearing herein are the property of their respective owners.
All other marks appearing herein are registered or unregistered trademarks or service marks of FMR LLC or an affiliated company. © 2024 FMR LLC. All rights reserved.
This report and the financial statements contained herein are submitted for the general information of the shareholders of the Fund. This report is not authorized for distribution to prospective investors in the Fund unless preceded or accompanied by an effective prospectus.
A fund files its complete schedule of portfolio holdings with the SEC for the first and third quarters of each fiscal year on Form N-PORT. Forms N-PORT are available on the SEC's web site at http://www.sec.gov. A fund's Forms N-PORT may be reviewed and copied at the SEC's Public Reference Room in Washington, DC. Information regarding the operation of the SEC's Public Reference Room may be obtained by calling 1-800-SEC-0330.
For a complete list of a fund's portfolio holdings, view the most recent holdings listing, semiannual report, or annual report on Fidelity's web site at http://www.fidelity.com, http://www.institutional.fidelity.com, or http://www.401k.com, as applicable.
NOT FDIC INSURED •MAY LOSE VALUE •NO BANK GUARANTEE
Neither the Fund nor Fidelity Distributors Corporation is a bank.
Average annual total return reflects the change in the value of an investment, assuming reinvestment of distributions from dividend income and capital gains (the profits earned upon the sale of securities that have grown in value, if any) and assuming a constant rate of performance each year. The hypothetical investment and the average annual total returns do not reflect the deduction of taxes that a shareholder would pay on fund distributions or the redemption of fund shares. During periods of reimbursement by Fidelity, a fund's total return will be greater than it would be had the reimbursement not occurred. How a fund did yesterday is no guarantee of how it will do tomorrow.
| Average Annual Total Returns | |||
Periods ended January 31, 2024 | Past 1 year | Life of Fund A |
Class A (incl. 5.75% sales charge) | -5.28% | -1.62% |
Class M (incl. 3.50% sales charge) | -3.36% | -0.43% |
Class C (incl. contingent deferred sales charge) | -1.27% | 1.40% |
| Fidelity® Risk Parity Fund | 0.70% | 2.35% |
| Class I | 0.76% | 2.41% |
| Class Z | 0.70% | 2.44% |
A From July 7, 2022 for Class A, Class M, Class C, Class I and Class Z, and from September 1, 2022 for Fidelity® Risk Parity Fund
Class C shares' contingent deferred sales charges included in the past one year and life of fund total return figures are 1% and 0%, respectively.
| $10,000 Over Life of Fund |
Let's say hypothetically that $10,000 was invested in Fidelity Advisor® Risk Parity Fund - Class A, a class of the fund, on July 7, 2022, when the fund started, and the current 5.75% sales charge was paid. The chart shows how the value of your investment would have changed, and also shows how the MSCI ACWI (All Country World Index) Index performed over the same period. |
 |
Market Recap:
For the 12 months ending January 31, 2024, continued global economic expansion and a slowing in the pace of inflation contributed to a favorable backdrop for risk assets. U.S. large-cap stocks led strong performance among many asset categories, driven partly by a narrow set of companies in the information technology and communication services sectors amid excitement for generative artificial intelligence. Assets broadly gained in the final two months of 2023 after investor sentiment largely shifted to a view that policy interest rates had peaked in most countries following historic monetary tightening cycles by the U.S. Federal Reserve and other central banks.
International equities rose 6.06% for the 12 months, according to the MSCI ACWI (All Country World Index) ex USA Index, coming off a 9.78% advance in the final quarter of 2023, as many investors surmised that U.S. central bank rate cuts weren't imminent. By region, Japan (+19%) led the way, whereas Asia Pacific ex Japan (-5%) and emerging markets (-3%) lagged by the widest margin. By sector, tech (+21%), industrials (+14%) and energy (+12%) were top performers. Conversely, real estate (-6%) and communication services (-5%) lagged most.
U.S. stocks gained 19.14% for the period, as measured by the Dow Jones U.S. Total Stock Market Index. The information technology (+51%) and communication services (+39%) sectors were the only two sectors to outpace the broader index. Consumer discretionary (+17%) and industrials (+14%) each had a solid double-digit gain. Conversely, utilities (-9%), energy (-4%) and real estate (-3%) lagged most. Growth stocks broadly outpaced value, while larger-caps topped small-caps. Commodities returned -7.09%, according to the Bloomberg Commodity Index Total Return.
U.S. taxable investment-grade bonds gained 2.10% for the 12 months, per the Bloomberg U.S. Aggregate Bond Index, as the Fed slowed the pace of, and eventually paused, interest rate increases. Since March 2022, the Fed has hiked its benchmark interest rate 11 times, by 5.25 percentage points, while allowing up to billions in bonds to mature each month without investing the proceeds. Short-term U.S. Treasuries (+5.22%), topped investment-grade corporate bonds (+4.02%), while commercial mortgage-backed securities gained 3.45% and agencies rose 3.87%. Outside the index, leveraged loans (+11.45%), U.S. high-yield bonds (+7.95%), emerging-markets debt (+5.86%) and Treasury Inflation-Protected Securities.
Comments from Co-Portfolio Managers Avishek Hazrachoudhury and Christopher Kelliher:
For the year ending January 31, 2024, the fund's share classes (excluding sales charges, if applicable) returned about 0.70%, underperforming the 15.11% return for the broad-based MSCI All Country World Index. The fund, which employs a diversified multi-asset risk parity strategy, generated profits from its equity exposure, including U.S. and non-U.S. positions. Investments in domestic high yield bonds and emerging markets debt also contributed positively during the period. However, these profits were largely offset by losses in real estate and commodities.
Note to Shareholders:
On March 1, 2023, Christopher Kelliher assumed co-management responsibilities for the fund.
The views expressed above reflect those of the portfolio manager(s) only through the end of the period as stated on the cover of this report and do not necessarily represent the views of Fidelity or any other person in the Fidelity organization. Any such views are subject to change at any time based upon market or other conditions and Fidelity disclaims any responsibility to update such views. These views may not be relied on as investment advice and, because investment decisions for a Fidelity fund are based on numerous factors, may not be relied on as an indication of trading intent on behalf of any Fidelity fund.
The information in the following tables is based on the consolidated investments of the Fund.
Top Holdings (% of Fund's net assets) | ||
| Fidelity Inflation-Protected Bond Index Fund | 13.3 | |
| Fidelity International Index Fund | 11.1 | |
| Fidelity Commodity Strategy Fund | 9.5 | |
| Fidelity Emerging Markets Index Fund | 7.9 | |
| Fidelity Total Market Index Fund | 7.4 | |
| Fidelity Small Cap Value Index Fund | 6.7 | |
| iShares J.P. Morgan EM Local Currency Bond ETF | 6.7 | |
| Fidelity Long-Term Treasury Bond Index Fund | 6.1 | |
| iShares U.S. Treasury Bond ETF | 5.5 | |
| Fidelity Small Cap Index Fund | 4.5 | |
| 78.7 | ||
Asset Allocation (% of Fund's net assets) |
 |
Net Other Assets (Liabilities) - (0.1)% |
Domestic Equity Funds category includes Fidelity Commodity Strategy Fund of 9.5%.
Futures and Swaps 55.5%
Showing Percentage of Net Assets
| Equity Funds - 51.4% | |||
| Shares | Value ($) | ||
| Domestic Equity Funds - 32.4% | |||
| Fidelity Commodity Strategy Fund (a) | 7,902 | 718,317 | |
| Fidelity Real Estate Index Fund (a) | 14,536 | 218,192 | |
| Fidelity Small Cap Index Fund (a) | 14,269 | 343,463 | |
| Fidelity Small Cap Value Index Fund (a) | 22,169 | 509,657 | |
| Fidelity Total Market Index Fund (a) | 4,203 | 559,895 | |
| iShares Gold Trust ETF (b) | 2,722 | 104,770 | |
TOTAL DOMESTIC EQUITY FUNDS | 2,454,294 | ||
| International Equity Funds - 19.0% | |||
| Fidelity Emerging Markets Index Fund (a) | 62,701 | 600,671 | |
| Fidelity International Index Fund (a) | 17,885 | 843,816 | |
TOTAL INTERNATIONAL EQUITY FUNDS | 1,444,487 | ||
| TOTAL EQUITY FUNDS (Cost $3,793,787) | 3,898,781 | ||
| Fixed-Income Funds - 33.1% | |||
| Shares | Value ($) | ||
| Fixed-Income Funds - 33.1% | |||
| Fidelity Inflation-Protected Bond Index Fund (a) | 111,088 | 1,007,571 | |
| Fidelity Long-Term Treasury Bond Index Fund (a) | 46,842 | 464,673 | |
| Invesco Senior Loan ETF | 1,588 | 33,364 | |
| iShares J.P. Morgan EM Local Currency Bond ETF | 14,017 | 505,173 | |
| iShares JPMorgan USD Emerging Markets Bond ETF | 986 | 86,748 | |
| iShares U.S. Treasury Bond ETF | 18,199 | 418,577 | |
| TOTAL FIXED-INCOME FUNDS (Cost $2,540,791) | 2,516,106 | ||
| U.S. Treasury Obligations - 1.3% | |||
Principal Amount (c) | Value ($) | ||
U.S. Treasury Bills, yield at date of purchase 5.27% to 5.28% 4/25/24 (d)(e) (Cost $98,786) | 100,000 | 98,785 | |
| Cash Equivalents - 14.3% | |||
| Shares | Value ($) | ||
Fidelity Cash Central Fund 5.39% (f) (Cost $1,082,291) | 1,082,075 | 1,082,291 | |
| TOTAL INVESTMENT IN SECURITIES - 100.1% (Cost $7,515,655) | 7,595,963 |
NET OTHER ASSETS (LIABILITIES) - (0.1)% | (5,829) |
| NET ASSETS - 100.0% | 7,590,134 |
| Futures Contracts | |||||
Number of contracts | Expiration Date | Notional Amount ($) | Value ($) | Unrealized Appreciation/ (Depreciation) ($) | |
| Purchased | |||||
| Equity Index Contracts | |||||
| ICE MSCI EAFE Index Contracts (United States) | 1 | Mar 2024 | 111,650 | 3,326 | 3,326 |
| The notional amount of futures purchased as a percentage of Net Assets is 1.5% | |||||
For the period, the average monthly notional amount at value for futures contracts in the aggregate was $348,571.
| Total Return Swaps | ||||||||||||
| Underlying Reference | Pay/ Receive Reference | Reference Payment Frequency | Financing Rate | Financing Frequency | Counterparty | Maturity Date | Units | Notional Amount | Value ($) | Upfront Premium Received/ (Paid) ($) | Unrealized Appreciation/ (Depreciation) ($) | |
| Invesco Senior Loan ETF | Receives | Monthly | U.S. Secured Overnight Fin. Rate (SOFR) Index minus 90 basis points | Monthly | BNP Paribas S.A. | Apr 2024 | 39,443 | 835,008 | (9,290) | 0 | (9,290) | |
| Invesco Senior Loan ETF | Receives | Monthly | U.S. Secured Overnight Fin. Rate (SOFR) Index minus 150 basis points | Monthly | BNP Paribas S.A. | May 2024 | 5,896 | 124,818 | (1,328) | 0 | (1,328) | |
| Invesco Senior Loan ETF | Receives | Monthly | U.S. Secured Overnight Fin. Rate (SOFR) Index minus 120 basis points | Monthly | BNP Paribas S.A. | Dec 2024 | 3,579 | 75,767 | (825) | 0 | (825) | |
| iShares iBoxx $ High Yield Corporate Bond ETF | Receives | Monthly | U.S. Secured Overnight Fin. Rate (SOFR) Index minus 25 basis points | Monthly | Bank of America, N.A. | Jul 2024 | 2,176 | 167,420 | 563 | 0 | 563 | |
| iShares iBoxx $ High Yield Corporate Bond ETF | Receives | Monthly | U.S. Secured Overnight Fin. Rate (SOFR) Index minus 100 basis points | Monthly | Goldman Sachs International | Apr 2024 | 10,454 | 806,317 | 847 | 0 | 847 | |
| iShares TIPS Bond ETF | Receives | Monthly | U.S. Secured Overnight Fin. Rate (SOFR) Index plus 35 basis points | Monthly | Goldman Sachs International | May 2024 | 4,100 | 440,094 | 78 | 0 | 78 | |
| iShares TIPS Bond ETF | Receives | Monthly | U.S. Secured Overnight Fin. Rate (SOFR) Index plus 35 basis points | Monthly | Goldman Sachs International | Jul 2024 | 10,321 | 1,108,057 | 348 | 0 | 348 | |
| SPDR Gold Shares | Receives | Monthly | U.S. Secured Overnight Fin. Rate (SOFR) Index plus 30 basis points | Monthly | Goldman Sachs International | Jul 2024 | 2,941 | 560,908 | (9,041) | 0 | (9,041) | |
| TOTAL RETURN SWAPS | (18,648) | 0 | (18,648) | |||||||||
For the period, the average monthly notional amount at value for swaps in the aggregate was $4,464,753.
Security Type Abbreviations
| ETF | - | EXCHANGE-TRADED FUND |
Legend
| (a) | Affiliated Fund |
| (b) | Non-income producing |
| (c) | Amount is stated in United States dollars unless otherwise noted. |
| (d) | Security or a portion of the security was pledged to cover margin requirements for futures contracts. At period end, the value of securities pledged amounted to $19,757. |
| (e) | Security or a portion of the security has been segregated as collateral for open bi-lateral over the counter (OTC) swaps. At period end, the value of securities pledged amounted to $78,041. |
| (f) | Affiliated fund that is generally available only to investment companies and other accounts managed by Fidelity Investments. The rate quoted is the annualized seven-day yield of the fund at period end. A complete unaudited listing of the fund's holdings as of its most recent quarter end is available upon request. In addition, each Fidelity Central Fund's financial statements, which are not covered by the Fund's Report of Independent Registered Public Accounting Firm, are available on the SEC's website or upon request. |
Affiliated Central Funds
Fiscal year to date information regarding the Fund's investments in Fidelity Central Funds, including the ownership percentage, is presented below.
| Affiliate | Value, beginning of period ($) | Purchases ($) | Sales Proceeds ($) | Dividend Income ($) | Realized Gain (loss) ($) | Change in Unrealized appreciation (depreciation) ($) | Value, end of period ($) | % ownership, end of period |
| Fidelity Cash Central Fund 5.39% | 1,336,627 | 2,989,356 | 3,243,692 | 72,094 | - | - | 1,082,291 | 0.0% |
| Total | 1,336,627 | 2,989,356 | 3,243,692 | 72,094 | - | - | 1,082,291 | |
Amounts in the dividend income column in the above table include any capital gain distributions from underlying funds, which are presented in the corresponding line item in the Consolidated Statement of Operations, if applicable.
Amounts included in the purchases and sales proceeds columns may include in-kind transactions, if applicable.
Affiliated Underlying Funds
Fiscal year to date information regarding the Fund's investments in affiliated Underlying Funds is presented below. Exchanges between classes of the same affiliated Underlying Funds may occur. If an Underlying Funds changes its name, the name presented below is the name in effect at period end.
| Affiliate | Value, beginning of period ($) | Purchases ($) | Sales Proceeds ($) | Dividend Income ($) | Realized Gain (loss) ($) | Change in Unrealized appreciation (depreciation) ($) | Value, end of period ($) |
| Fidelity Commodity Strategy Fund | 1,314,000 | 227,244 | 713,971 | 23,697 | (384,694) | 275,738 | 718,317 |
| Fidelity Emerging Markets Index Fund | 172,064 | 719,774 | 274,081 | 17,398 | (1,188) | (15,898) | 600,671 |
| Fidelity Inflation-Protected Bond Index Fund | 442,321 | 850,140 | 275,811 | 34,154 | (10,131) | 1,052 | 1,007,571 |
| Fidelity International Bond Index Fund | - | 428,027 | 428,295 | 3,335 | 268 | - | - |
| Fidelity International Index Fund | 833,192 | 293,026 | 330,049 | 22,077 | 3,486 | 44,161 | 843,816 |
| Fidelity Long-Term Treasury Bond Index Fund | 636,668 | 344,508 | 450,814 | 15,887 | (48,895) | (16,794) | 464,673 |
| Fidelity Real Estate Index Fund | 237,762 | 55,037 | 63,441 | 6,571 | (1,401) | (9,765) | 218,192 |
| Fidelity Small Cap Index Fund | 370,660 | 101,741 | 139,872 | 5,462 | 5,199 | 5,735 | 343,463 |
| Fidelity Small Cap Value Index Fund | 555,772 | 169,317 | 216,962 | 11,371 | 3,230 | (1,700) | 509,657 |
| Fidelity Total Market Index Fund | 176,997 | 637,109 | 303,825 | 5,747 | 10,871 | 38,743 | 559,895 |
| 4,739,436 | 3,825,923 | 3,197,121 | 145,699 | (423,255) | 321,272 | 5,266,255 |
Amounts in the dividend income column in the above table include any capital gain distributions from underlying funds, which are presented in the corresponding line item in the Consolidated Statement of Operations, if applicable.
Amounts included in the purchases and sales proceeds columns may include in-kind transactions, if applicable.
Investment Valuation
The following is a summary of the inputs used, as of January 31, 2024, involving the Fund's assets and liabilities carried at fair value. The inputs or methodology used for valuing securities may not be an indication of the risk associated with investing in those securities. For more information on valuation inputs, and their aggregation into the levels used below, please refer to the Investment Valuation section in the accompanying Notes to Consolidated Financial Statements.
| Valuation Inputs at Reporting Date: | ||||
| Description | Total ($) | Level 1 ($) | Level 2 ($) | Level 3 ($) |
Investments in Securities: | ||||
| Equity Funds | 3,898,781 | 3,898,781 | - | - |
| Fixed-Income Funds | 2,516,106 | 2,516,106 | - | - |
| Other Short-Term Investments | 98,785 | - | 98,785 | - |
| Money Market Funds | 1,082,291 | 1,082,291 | - | - |
| Total Investments in Securities: | 7,595,963 | 7,497,178 | 98,785 | - |
Derivative Instruments: Assets | ||||
Futures Contracts | 3,326 | 3,326 | - | - |
Swaps | 1,836 | - | 1,836 | - |
| Total Assets | 5,162 | 3,326 | 1,836 | - |
| Liabilities | ||||
Swaps | (20,484) | - | (20,484) | - |
| Total Liabilities | (20,484) | - | (20,484) | - |
| Total Derivative Instruments: | (15,322) | 3,326 | (18,648) | - |
Value of Derivative Instruments
The following table is a summary of the Fund's value of derivative instruments by primary risk exposure as of January 31, 2024. For additional information on derivative instruments, please refer to the Derivative Instruments section in the accompanying Notes to Consolidated Financial Statements.
Primary Risk Exposure / Derivative Type | Value | |
| Asset ($) | Liability ($) | |
| Commodity Risk | ||
Swaps (a) | 0 | (9,041) |
| Total Commodity Risk | 0 | (9,041) |
| Credit Risk | ||
Swaps (a) | 1,410 | (11,443) |
| Total Credit Risk | 1,410 | (11,443) |
| Equity Risk | ||
Futures Contracts (b) | 3,326 | 0 |
| Total Equity Risk | 3,326 | 0 |
| Interest Rate Risk | ||
Swaps (a) | 426 | 0 |
| Total Interest Rate Risk | 426 | 0 |
| Total Value of Derivatives | 5,162 | (20,484) |
(a)For bi-lateral over-the-counter (OTC) swaps, reflects gross value which is presented in the Consolidated Statement of Assets and Liabilities in the bi-lateral OTC swaps, at value line-items.
(b)Reflects gross cumulative appreciation (depreciation) on futures contracts as presented in the Consolidated Schedule of Investments. In the Consolidated Statement of Assets and Liabilities, the period end daily variation margin is included in receivable or payable for daily variation margin on futures contracts, and the net cumulative appreciation (depreciation) is included in Total accumulated earnings (loss).
| Consolidated Statement of Assets and Liabilities | ||||
| January 31, 2024 | ||||
| Assets | ||||
| Investment in securities, at value - See accompanying schedule: | ||||
Unaffiliated issuers (cost $1,231,576) | $ | 1,247,417 | ||
Fidelity Central Funds (cost $1,082,291) | 1,082,291 | |||
Other affiliated issuers (cost $5,201,788) | 5,266,255 | |||
| Total Investment in Securities (cost $7,515,655) | $ | 7,595,963 | ||
| Cash | 10,343 | |||
| Receivable for investments sold | 3,001 | |||
| Receivable for fund shares sold | 295 | |||
| Distributions receivable from Fidelity Central Funds | 4,896 | |||
| Bi-lateral OTC swaps, at value | 1,836 | |||
| Receivable from investment adviser for expense reductions | 244 | |||
Total assets | 7,616,578 | |||
| Liabilities | ||||
| Payable for fund shares redeemed | $ | 8 | ||
| Bi-lateral OTC swaps, at value | 20,484 | |||
| Accrued management fee | 3,740 | |||
| Distribution and service plan fees payable | 1,466 | |||
| Payable for daily variation margin on futures contracts | 575 | |||
| Other affiliated payables | 171 | |||
| Total Liabilities | 26,444 | |||
| Net Assets | $ | 7,590,134 | ||
| Net Assets consist of: | ||||
| Paid in capital | $ | 7,994,993 | ||
| Total accumulated earnings (loss) | (404,859) | |||
| Net Assets | $ | 7,590,134 | ||
| Net Asset Value and Maximum Offering Price | ||||
| Class A : | ||||
Net Asset Value and redemption price per share ($1,014,854 ÷ 108,581 shares)(a) | $ | 9.35 | ||
| Maximum offering price per share (100/94.25 of $9.35) | $ | 9.92 | ||
| Class M : | ||||
Net Asset Value and redemption price per share ($1,013,448 ÷ 108,339 shares)(a) | $ | 9.35 | ||
| Maximum offering price per share (100/96.50 of $9.35) | $ | 9.69 | ||
| Class C : | ||||
Net Asset Value and offering price per share ($1,002,400 ÷ 107,021 shares)(a) | $ | 9.37 | ||
| Fidelity Risk Parity Fund : | ||||
Net Asset Value, offering price and redemption price per share ($2,402,608 ÷ 258,692 shares) | $ | 9.29 | ||
| Class I : | ||||
Net Asset Value, offering price and redemption price per share ($1,139,012 ÷ 122,010 shares) | $ | 9.34 | ||
| Class Z : | ||||
Net Asset Value, offering price and redemption price per share ($1,017,812 ÷ 108,967 shares) | $ | 9.34 | ||
(a)Redemption price per share is equal to net asset value less any applicable contingent deferred sales charge. | ||||
| Consolidated Statement of Operations | ||||
Year ended January 31, 2024 | ||||
| Investment Income | ||||
| Dividends (including $145,699 earned from affiliated issuers) | $ | 172,168 | ||
| Interest | 11,124 | |||
| Income from Fidelity Central Funds | 72,094 | |||
| Total Income | 255,386 | |||
| Expenses | ||||
| Management fee | $ | 42,423 | ||
| Distribution and service plan fees | 17,057 | |||
| Independent trustees' fees and expenses | 7,404 | |||
| Total expenses before reductions | 66,884 | |||
| Expense reductions | (8,218) | |||
| Total expenses after reductions | 58,666 | |||
| Net Investment income (loss) | 196,720 | |||
| Realized and Unrealized Gain (Loss) | ||||
| Net realized gain (loss) on: | ||||
| Investment Securities: | ||||
| Unaffiliated issuers | (1,040) | |||
| Affiliated issuers | (423,255) | |||
| Futures contracts | (15,900) | |||
| Swaps | 97,740 | |||
| Total net realized gain (loss) | (342,455) | |||
| Change in net unrealized appreciation (depreciation) on: | ||||
| Investment Securities: | ||||
| Unaffiliated issuers | 8,059 | |||
| Affiliated issuers | 321,272 | |||
| Futures contracts | (6,804) | |||
| Swaps | (124,624) | |||
| Total change in net unrealized appreciation (depreciation) | 197,903 | |||
| Net gain (loss) | (144,552) | |||
| Net increase (decrease) in net assets resulting from operations | $ | 52,168 | ||
| Consolidated Statement of Changes in Net Assets | ||||
Year ended January 31, 2024 | For the period July 7, 2022 (commencement of operations) through January 31, 2023 | |||
| Increase (Decrease) in Net Assets | ||||
| Operations | ||||
| Net investment income (loss) | $ | 196,720 | $ | 467,283 |
| Net realized gain (loss) | (342,455) | (171,038) | ||
| Change in net unrealized appreciation (depreciation) | 197,903 | (132,917) | ||
| Net increase (decrease) in net assets resulting from operations | 52,168 | 163,328 | ||
| Distributions to shareholders | (249,670) | (370,684) | ||
| Share transactions - net increase (decrease) | 575,397 | 7,419,595 | ||
| Total increase (decrease) in net assets | 377,895 | 7,212,239 | ||
| Net Assets | ||||
| Beginning of period | 7,212,239 | - | ||
| End of period | $ | 7,590,134 | $ | 7,212,239 |
Consolidated Financial Highlights
| Fidelity Advisor® Risk Parity Fund Class A |
| Years ended January 31, | 2024 | 2023 A | ||
Selected Per-Share Data | ||||
| Net asset value, beginning of period | $ | 9.64 | $ | 10.00 |
| Income from Investment Operations | ||||
Net investment income (loss) B,C | .25 | .86 | ||
| Net realized and unrealized gain (loss) | (.22) | (.60) | ||
| Total from investment operations | .03 | .26 | ||
| Distributions from net investment income | (.32) | (.62) | ||
| Total distributions | (.32) | (.62) | ||
| Net asset value, end of period | $ | 9.35 | $ | 9.64 |
Total Return D,E,F | .50% | 2.90% | ||
Ratios to Average Net Assets C,G,H | ||||
| Expenses before reductions | .95% | 2.40% I | ||
| Expenses net of fee waivers, if any | .85% | .85% I | ||
| Expenses net of all reductions | .84% | .84% I | ||
| Net investment income (loss) | 2.74% | 15.39% I | ||
| Supplemental Data | ||||
| Net assets, end of period (000 omitted) | $ | 1,015 | $ | 1,009 |
Portfolio turnover rate J | 84% | 163% I |
AFor the period July 7, 2022 (commencement of operations) through January 31, 2023.
BCalculated based on average shares outstanding during the period.
CNet investment income (loss) is affected by the timing of the declaration of dividends by any underlying mutual funds or exchange-traded funds (ETFs). Net investment income (loss) of any mutual funds or ETFs is not included in the Fund's net investment income (loss) ratio.
DTotal returns for periods of less than one year are not annualized.
ETotal returns would have been lower if certain expenses had not been reduced during the applicable periods shown.
FTotal returns do not include the effect of the sales charges.
GFees and expenses of any underlying mutual funds or exchange-traded funds (ETFs) are not included in the Fund's expense ratio. The Fund indirectly bears its proportionate share of these expenses. For additional expense information related to investments in Fidelity Central Funds, please refer to the "Investments in Fidelity Central Funds" note found in the Notes to Consolidated Financial Statements section of the most recent Annual or Semi-Annual report.
HExpense ratios reflect operating expenses of the class. Expenses before reductions do not reflect amounts reimbursed, waived, or reduced through arrangements with the investment adviser, brokerage services, or other offset arrangements, if applicable, and do not represent the amount paid by the class during periods when reimbursements, waivers or reductions occur.
IAnnualized.
JAmount does not include the portfolio activity of any underlying mutual funds or exchange-traded funds (ETFs).
| Fidelity Advisor® Risk Parity Fund Class M |
| Years ended January 31, | 2024 | 2023 A | ||
Selected Per-Share Data | ||||
| Net asset value, beginning of period | $ | 9.64 | $ | 10.00 |
| Income from Investment Operations | ||||
Net investment income (loss) B,C | .23 | .84 | ||
| Net realized and unrealized gain (loss) | (.23) | (.60) | ||
| Total from investment operations | - D | .24 | ||
| Distributions from net investment income | (.29) | (.60) | ||
| Total distributions | (.29) | (.60) | ||
| Net asset value, end of period | $ | 9.35 | $ | 9.64 |
Total Return E,F,G | .15% | 2.77% | ||
Ratios to Average Net Assets C,H,I | ||||
| Expenses before reductions | 1.20% | 2.65% J | ||
| Expenses net of fee waivers, if any | 1.10% | 1.10% J | ||
| Expenses net of all reductions | 1.09% | 1.09% J | ||
| Net investment income (loss) | 2.49% | 15.09% J | ||
| Supplemental Data | ||||
| Net assets, end of period (000 omitted) | $ | 1,013 | $ | 1,008 |
Portfolio turnover rate K | 84% | 163% J |
AFor the period July 7, 2022 (commencement of operations) through January 31, 2023.
BCalculated based on average shares outstanding during the period.
CNet investment income (loss) is affected by the timing of the declaration of dividends by any underlying mutual funds or exchange-traded funds (ETFs). Net investment income (loss) of any mutual funds or ETFs is not included in the Fund's net investment income (loss) ratio.
DAmount represents less than $.005 per share.
ETotal returns for periods of less than one year are not annualized.
FTotal returns would have been lower if certain expenses had not been reduced during the applicable periods shown.
GTotal returns do not include the effect of the sales charges.
HFees and expenses of any underlying mutual funds or exchange-traded funds (ETFs) are not included in the Fund's expense ratio. The Fund indirectly bears its proportionate share of these expenses. For additional expense information related to investments in Fidelity Central Funds, please refer to the "Investments in Fidelity Central Funds" note found in the Notes to Consolidated Financial Statements section of the most recent Annual or Semi-Annual report.
IExpense ratios reflect operating expenses of the class. Expenses before reductions do not reflect amounts reimbursed, waived, or reduced through arrangements with the investment adviser, brokerage services, or other offset arrangements, if applicable, and do not represent the amount paid by the class during periods when reimbursements, waivers or reductions occur.
JAnnualized.
KAmount does not include the portfolio activity of any underlying mutual funds or exchange-traded funds (ETFs).
| Fidelity Advisor® Risk Parity Fund Class C |
| Years ended January 31, | 2024 | 2023 A | ||
Selected Per-Share Data | ||||
| Net asset value, beginning of period | $ | 9.64 | $ | 10.00 |
| Income from Investment Operations | ||||
Net investment income (loss) B,C | .18 | .82 | ||
| Net realized and unrealized gain (loss) | (.22) | (.60) | ||
| Total from investment operations | (.04) | .22 | ||
| Distributions from net investment income | (.23) | (.58) | ||
| Total distributions | (.23) | (.58) | ||
| Net asset value, end of period | $ | 9.37 | $ | 9.64 |
Total Return D,E,F | (.30)% | 2.52% | ||
Ratios to Average Net Assets C,G,H | ||||
| Expenses before reductions | 1.70% | 3.15% I | ||
| Expenses net of fee waivers, if any | 1.60% | 1.60% I | ||
| Expenses net of all reductions | 1.59% | 1.59% I | ||
| Net investment income (loss) | 1.99% | 14.60% I | ||
| Supplemental Data | ||||
| Net assets, end of period (000 omitted) | $ | 1,002 | $ | 1,008 |
Portfolio turnover rate J | 84% | 163% I |
AFor the period July 7, 2022 (commencement of operations) through January 31, 2023.
BCalculated based on average shares outstanding during the period.
CNet investment income (loss) is affected by the timing of the declaration of dividends by any underlying mutual funds or exchange-traded funds (ETFs). Net investment income (loss) of any mutual funds or ETFs is not included in the Fund's net investment income (loss) ratio.
DTotal returns for periods of less than one year are not annualized.
ETotal returns would have been lower if certain expenses had not been reduced during the applicable periods shown.
FTotal returns do not include the effect of the contingent deferred sales charge.
GFees and expenses of any underlying mutual funds or exchange-traded funds (ETFs) are not included in the Fund's expense ratio. The Fund indirectly bears its proportionate share of these expenses. For additional expense information related to investments in Fidelity Central Funds, please refer to the "Investments in Fidelity Central Funds" note found in the Notes to Consolidated Financial Statements section of the most recent Annual or Semi-Annual report.
HExpense ratios reflect operating expenses of the class. Expenses before reductions do not reflect amounts reimbursed, waived, or reduced through arrangements with the investment adviser, brokerage services, or other offset arrangements, if applicable, and do not represent the amount paid by the class during periods when reimbursements, waivers or reductions occur.
IAnnualized.
JAmount does not include the portfolio activity of any underlying mutual funds or exchange-traded funds (ETFs).
| Fidelity® Risk Parity Fund |
| Years ended January 31, | 2024 | 2023 A | ||
Selected Per-Share Data | ||||
| Net asset value, beginning of period | $ | 9.60 | $ | 10.00 |
| Income from Investment Operations | ||||
Net investment income (loss) B,C | .27 | .27 | ||
| Net realized and unrealized gain (loss) | (.22) | (.04) | ||
| Total from investment operations | .05 | .23 | ||
| Distributions from net investment income | (.36) | (.63) | ||
| Total distributions | (.36) | (.63) | ||
| Net asset value, end of period | $ | 9.29 | $ | 9.60 |
Total Return D,E | .70% | 2.63% | ||
Ratios to Average Net Assets C,F,G | ||||
| Expenses before reductions | .70% | 1.26% H | ||
| Expenses net of fee waivers, if any | .60% | .60% H | ||
| Expenses net of all reductions | .59% | .58% H | ||
| Net investment income (loss) | 2.98% | 7.06% H | ||
| Supplemental Data | ||||
| Net assets, end of period (000 omitted) | $ | 2,403 | $ | 2,036 |
Portfolio turnover rate I | 84% | 163% H |
AFor the period September 1, 2022 (commencement of sale of shares) through January 31, 2023.
BCalculated based on average shares outstanding during the period.
CNet investment income (loss) is affected by the timing of the declaration of dividends by any underlying mutual funds or exchange-traded funds (ETFs). Net investment income (loss) of any mutual funds or ETFs is not included in the Fund's net investment income (loss) ratio.
DTotal returns for periods of less than one year are not annualized.
ETotal returns would have been lower if certain expenses had not been reduced during the applicable periods shown.
FFees and expenses of any underlying mutual funds or exchange-traded funds (ETFs) are not included in the Fund's expense ratio. The Fund indirectly bears its proportionate share of these expenses. For additional expense information related to investments in Fidelity Central Funds, please refer to the "Investments in Fidelity Central Funds" note found in the Notes to Consolidated Financial Statements section of the most recent Annual or Semi-Annual report.
GExpense ratios reflect operating expenses of the class. Expenses before reductions do not reflect amounts reimbursed, waived, or reduced through arrangements with the investment adviser, brokerage services, or other offset arrangements, if applicable, and do not represent the amount paid by the class during periods when reimbursements, waivers or reductions occur.
HAnnualized.
IAmount does not include the portfolio activity of any underlying mutual funds or exchange-traded funds (ETFs).
| Fidelity Advisor® Risk Parity Fund Class I |
| Years ended January 31, | 2024 | 2023 A | ||
Selected Per-Share Data | ||||
| Net asset value, beginning of period | $ | 9.64 | $ | 10.00 |
| Income from Investment Operations | ||||
Net investment income (loss) B,C | .27 | .88 | ||
| Net realized and unrealized gain (loss) | (.21) | (.61) | ||
| Total from investment operations | .06 | .27 | ||
| Distributions from net investment income | (.36) | (.63) | ||
| Total distributions | (.36) | (.63) | ||
| Net asset value, end of period | $ | 9.34 | $ | 9.64 |
Total Return D,E | .76% | 3.02% | ||
Ratios to Average Net Assets C,F,G | ||||
| Expenses before reductions | .70% | 2.18% H | ||
| Expenses net of fee waivers, if any | .60% | .60% H | ||
| Expenses net of all reductions | .59% | .59% H | ||
| Net investment income (loss) | 2.99% | 15.81% H | ||
| Supplemental Data | ||||
| Net assets, end of period (000 omitted) | $ | 1,139 | $ | 1,141 |
Portfolio turnover rate I | 84% | 163% H |
AFor the period July 7, 2022 (commencement of operations) through January 31, 2023.
BCalculated based on average shares outstanding during the period.
CNet investment income (loss) is affected by the timing of the declaration of dividends by any underlying mutual funds or exchange-traded funds (ETFs). Net investment income (loss) of any mutual funds or ETFs is not included in the Fund's net investment income (loss) ratio.
DTotal returns for periods of less than one year are not annualized.
ETotal returns would have been lower if certain expenses had not been reduced during the applicable periods shown.
FFees and expenses of any underlying mutual funds or exchange-traded funds (ETFs) are not included in the Fund's expense ratio. The Fund indirectly bears its proportionate share of these expenses. For additional expense information related to investments in Fidelity Central Funds, please refer to the "Investments in Fidelity Central Funds" note found in the Notes to Consolidated Financial Statements section of the most recent Annual or Semi-Annual report.
GExpense ratios reflect operating expenses of the class. Expenses before reductions do not reflect amounts reimbursed, waived, or reduced through arrangements with the investment adviser, brokerage services, or other offset arrangements, if applicable, and do not represent the amount paid by the class during periods when reimbursements, waivers or reductions occur.
HAnnualized.
IAmount does not include the portfolio activity of any underlying mutual funds or exchange-traded funds (ETFs).
| Fidelity Advisor® Risk Parity Fund Class Z |
| Years ended January 31, | 2024 | 2023 A | ||
Selected Per-Share Data | ||||
| Net asset value, beginning of period | $ | 9.65 | $ | 10.00 |
| Income from Investment Operations | ||||
Net investment income (loss) B,C | .28 | .97 | ||
| Net realized and unrealized gain (loss) | (.23) | (.69) | ||
| Total from investment operations | .05 | .28 | ||
| Distributions from net investment income | (.36) | (.63) | ||
| Total distributions | (.36) | (.63) | ||
| Net asset value, end of period | $ | 9.34 | $ | 9.65 |
Total Return D,E | .70% | 3.13% | ||
Ratios to Average Net Assets C,F,G | ||||
| Expenses before reductions | .65% | 2.23% H | ||
| Expenses net of fee waivers, if any | .55% | .55% H | ||
| Expenses net of all reductions | .54% | .54% H | ||
| Net investment income (loss) | 3.04% | 17.34% H | ||
| Supplemental Data | ||||
| Net assets, end of period (000 omitted) | $ | 1,018 | $ | 1,011 |
Portfolio turnover rate I | 84% | 163% H |
AFor the period July 7, 2022 (commencement of operations) through January 31, 2023.
BCalculated based on average shares outstanding during the period.
CNet investment income (loss) is affected by the timing of the declaration of dividends by any underlying mutual funds or exchange-traded funds (ETFs). Net investment income (loss) of any mutual funds or ETFs is not included in the Fund's net investment income (loss) ratio.
DTotal returns for periods of less than one year are not annualized.
ETotal returns would have been lower if certain expenses had not been reduced during the applicable periods shown.
FFees and expenses of any underlying mutual funds or exchange-traded funds (ETFs) are not included in the Fund's expense ratio. The Fund indirectly bears its proportionate share of these expenses. For additional expense information related to investments in Fidelity Central Funds, please refer to the "Investments in Fidelity Central Funds" note found in the Notes to Consolidated Financial Statements section of the most recent Annual or Semi-Annual report.
GExpense ratios reflect operating expenses of the class. Expenses before reductions do not reflect amounts reimbursed, waived, or reduced through arrangements with the investment adviser, brokerage services, or other offset arrangements, if applicable, and do not represent the amount paid by the class during periods when reimbursements, waivers or reductions occur.
HAnnualized.
IAmount does not include the portfolio activity of any underlying mutual funds or exchange-traded funds (ETFs).
For the period ended January 31, 2024
1. Organization.
Fidelity Risk Parity Fund (the Fund) is a fund of Fidelity Greenwood Street Trust (the Trust) and is authorized to issue an unlimited number of shares. The Trust is registered under the Investment Company Act of 1940, as amended (the 1940 Act), as an open-end management investment company organized as a Delaware statutory trust. The Fund offers Class A, Class M, Class C, Fidelity Risk Parity Fund, Class I and Class Z shares, each of which has equal rights as to assets and voting privileges. Class A, Class M, Class C, Class I and Class Z are Fidelity Advisor classes. Each class has exclusive voting rights with respect to matters that affect that class. Class C shares will automatically convert to Class A shares after a holding period of eight years from the initial date of purchase, with certain exceptions.
2. Consolidated Subsidiary.
The Funds included in the table below hold certain commodity-related investments through a wholly owned subsidiary (the "Subsidiary"). As of period end, the investments in the Subsidiaries, were as follows:
| Subsidiary Name | Net Assets of Subsidiary | % of Fund's Net Assets | |
| Fidelity Risk Parity Fund | Fidelity Risk Parity Cayman Ltd. | 308,786 | 4.1 |
The financial statements have been consolidated to include the Subsidiary accounts where applicable. Accordingly, all inter-company transactions and balances have been eliminated.
3. Investments in Fidelity Central Funds.
Funds may invest in Fidelity Central Funds, which are open-end investment companies generally available only to other investment companies and accounts managed by the investment adviser and its affiliates. The Consolidated Schedule of Investments lists any Fidelity Central Funds held as an investment as of period end, but does not include the underlying holdings of each Fidelity Central Fund. An investing fund indirectly bears its proportionate share of the expenses of the underlying Fidelity Central Funds.
Based on its investment objective, each Fidelity Central Fund may invest or participate in various investment vehicles or strategies that are similar to those of the investing fund. These strategies are consistent with the investment objectives of the investing fund and may involve certain economic risks which may cause a decline in value of each of the Fidelity Central Funds and thus a decline in the value of the investing fund.
| Fidelity Central Fund | Investment Manager | Investment Objective | Investment Practices | Expense RatioA |
| Fidelity Money Market Central Funds | Fidelity Management & Research Company LLC (FMR) | Each fund seeks to obtain a high level of current income consistent with the preservation of capital and liquidity. | Short-term Investments | Less than .005% |
A Expenses expressed as a percentage of average net assets and are as of each underlying Central Fund's most recent annual or semi-annual shareholder report.
A complete unaudited list of holdings for each Fidelity Central Fund is available upon request or at the Securities and Exchange Commission website at www.sec.gov. In addition, the financial statements of the Fidelity Central Funds which contain the significant accounting policies (including investment valuation policies) of those funds, and are not covered by the Report of Independent Registered Public Accounting Firm, are available on the Securities and Exchange Commission website or upon request.
4. Significant Accounting Policies.
The Fund is an investment company and applies the accounting and reporting guidance of the Financial Accounting Standards Board (FASB) Accounting Standards Codification Topic 946 Financial Services - Investment Companies. The consolidated financial statements have been prepared in conformity with accounting principles generally accepted in the United States of America (GAAP), which require management to make certain estimates and assumptions at the date of the consolidated financial statements. Actual results could differ from those estimates. Subsequent events, if any, through the date that the consolidated financial statements were issued have been evaluated in the preparation of the consolidated financial statements. The Fund's Consolidated Schedule of Investments lists any underlying mutual funds or exchange-traded funds (ETFs) but does not include the underlying holdings of these funds. The following summarizes the significant accounting policies of the Fund:
Investment Valuation. Investments are valued as of 4:00 p.m. Eastern time on the last calendar day of the period. The Board of Trustees (the Board) has designated the Fund's investment adviser as the valuation designee responsible for the fair valuation function and performing fair value determinations as needed. The investment adviser has established a Fair Value Committee (the Committee) to carry out the day-to-day fair valuation responsibilities and has adopted policies and procedures to govern the fair valuation process and the activities of the Committee. In accordance with these fair valuation policies and procedures, which have been approved by the Board, the Fund attempts to obtain prices from one or more third party pricing services or brokers to value its investments. When current market prices, quotations or currency exchange rates are not readily available or reliable, investments will be fair valued in good faith by the Committee, in accordance with the policies and procedures. Factors used in determining fair value vary by investment type and may include market or investment specific events, transaction data, estimated cash flows, and market observations of comparable investments. The frequency that the fair valuation procedures are used cannot be predicted and they may be utilized to a significant extent. The Committee manages the Fund's fair valuation practices and maintains the fair valuation policies and procedures. The Fund's investment adviser reports to the Board information regarding the fair valuation process and related material matters.
The Fund categorizes the inputs to valuation techniques used to value its investments into a disclosure hierarchy consisting of three levels as shown below:
Level 1 - unadjusted quoted prices in active markets for identical investments
Level 2 - other significant observable inputs (including quoted prices for similar investments, interest rates, prepayment speeds, etc.)
Level 3 - unobservable inputs (including the Fund's own assumptions based on the best information available)
Valuation techniques used to value the Fund's investments by major category are as follows:
Equity securities, including restricted securities, for which market quotations are readily available, are valued at the last reported sale price or official closing price as reported by a third party pricing service on the primary market or exchange on which they are traded and are categorized as Level 1 in the hierarchy. In the event there were no sales during the day or closing prices are not available, securities are valued at the last quoted bid price or may be valued using the last available price and are generally categorized as Level 2 in the hierarchy. For foreign equity securities, when market or security specific events arise, comparisons to the valuation of American Depositary Receipts (ADRs), futures contracts, ETFs and certain indexes as well as quoted prices for similar securities may be used and would be categorized as Level 2 in the hierarchy. For equity securities, including restricted securities, where observable inputs are limited, assumptions about market activity and risk are used and these securities may be categorized as Level 3 in the hierarchy.
Debt securities, including restricted securities, are valued based on evaluated prices received from third party pricing services or from brokers who make markets in such securities. U.S. government and government agency obligations are valued by pricing services who utilize matrix pricing which considers yield or price of bonds of comparable quality, coupon, maturity and type or by broker-supplied prices. Swaps are marked-to-market daily based on valuations from third party pricing services, registered derivatives clearing organizations (clearinghouses) or broker-supplied valuations. These pricing sources may utilize inputs such as interest rate curves, credit spread curves, default possibilities and recovery rates. When independent prices are unavailable or unreliable, debt securities and swaps may be valued utilizing pricing methodologies which consider similar factors that would be used by third party pricing services. Debt securities and swaps are generally categorized as Level 2 in the hierarchy but may be Level 3 depending on the circumstances. ETFs are valued at their last sale price or official closing price as reported by a third party pricing service on the primary market or exchange on which they are traded and are categorized as Level 1 in the hierarchy. In the event there were no sales during the day but the exchange reports a closing bid level, ETFs are valued at the closing bid and would be categorized as Level 1 in the hierarchy. In the event there was no closing bid, ETFs may be valued by another method that the Board believes reflects fair value in accordance with the Board's fair value pricing policies and may be categorized as Level 2 in the hierarchy.
Futures contracts are valued at the settlement price established each day by the board of trade or exchange on which they are traded and are categorized as Level 1 in the hierarchy. Investments in open-end mutual funds, including the Fidelity Central Funds, are valued at their closing net asset value (NAV) each business day and are categorized as Level 1 in the hierarchy.
Changes in valuation techniques may result in transfers in or out of an assigned level within the disclosure hierarchy. The aggregate value of investments by input level as of January 31, 2024 is included at the end of the Fund's Consolidated Schedule of Investments.
Investment Transactions and Income. For financial reporting purposes, the Fund's investment holdings and NAV include trades executed through the end of the last business day of the period. The NAV per share for processing shareholder transactions is calculated as of the close of business of the New York Stock Exchange (NYSE), normally 4:00 p.m. Eastern time and includes trades executed through the end of the prior business day. Gains and losses on securities sold are determined on the basis of identified cost. Commissions paid to certain brokers with whom the investment adviser, or its affiliates, places trades on behalf of a fund include an amount in addition to trade execution, which may be rebated back to a fund. Any such rebates are included in net realized gain (loss) on investments in the Consolidated Statement of Operations. Dividend income is recorded on the ex-dividend date, except for certain dividends from foreign securities where the ex-dividend date may have passed, which are recorded as soon as the Fund is informed of the ex-dividend date. Non-cash dividends included in dividend income, if any, are recorded at the fair market value of the securities received. Income and capital gain distributions from Fidelity Central Funds, if any, are recorded on the ex-dividend date. Interest income is accrued as earned and includes coupon interest and amortization of premium and accretion of discount on debt securities as applicable.
Class Allocations and Expenses. Investment income, realized and unrealized capital gains and losses, common expenses of a fund, and certain fund-level expense reductions, if any, are allocated daily on a pro-rata basis to each class based on the relative net assets of each class to the total net assets of a fund. Each class differs with respect to transfer agent and distribution and service plan fees incurred, as applicable. Certain expense reductions may also differ by class, if applicable. For the reporting period, the allocated portion of income and expenses to each class as a percent of its average net assets may vary due to the timing of recording these transactions in relation to fluctuating net assets of the classes. Expenses directly attributable to a fund are charged to that fund. Expenses attributable to more than one fund are allocated among the respective funds on the basis of relative net assets or other appropriate methods. Expenses included in the accompanying consolidated financial statements reflect the expenses of that fund and do not include any expenses associated with any underlying mutual funds or exchange-traded funds (ETFs). Although not included in a fund's expenses, a fund indirectly bears its proportionate share of these expenses through the net asset value of each underlying mutual fund or exchange-traded fund (ETF). Expense estimates are accrued in the period to which they relate and adjustments are made when actual amounts are known.
Income Tax Information and Distributions to Shareholders. Each year, the Fund intends to qualify as a regulated investment company under Subchapter M of the Internal Revenue Code, including distributing substantially all of its taxable income and realized gains. As a result, no provision for U.S. Federal income taxes is required. As of January 31, 2024, the Fund did not have any unrecognized tax benefits in the consolidated financial statements; nor is the Fund aware of any tax positions for which it is reasonably possible that the total amounts of unrecognized tax benefits will significantly change in the next twelve months. The Fund files a U.S. federal tax return, in addition to state and local tax returns as required. The Fund's federal income tax returns are subject to examination by the Internal Revenue Service (IRS) for a period of three fiscal years after they are filed. State and local tax returns may be subject to examination for an additional fiscal year depending on the jurisdiction.
The Subsidiary is classified as a controlled foreign corporation under Subchapter N of the Internal Revenue Code. Therefore, the Fund is required to increase its taxable income by its share of the Subsidiary's income. Net investment losses of the Subsidiary cannot be deducted by the Fund in the current period nor carried forward to offset taxable income in future periods.
Distributions are declared and recorded on the ex-dividend date. Income and capital gain distributions are declared separately for each class. Income and capital gain distributions are determined in accordance with income tax regulations, which may differ from GAAP.
Capital accounts within the consolidated financial statements are adjusted for permanent book-tax differences. These adjustments have no impact on net assets or the results of operations. Capital accounts are not adjusted for temporary book-tax differences which will reverse in a subsequent period.
Book-tax differences are primarily due to futures contracts, swaps, controlled foreign corporations, capital loss carryforwards and losses deferred due to wash sales.
As of period end, the cost and unrealized appreciation (depreciation) in securities, and derivatives if applicable, for federal income tax purposes were as follows:
| Gross unrealized appreciation | $260,900 |
| Gross unrealized depreciation | (292,056) |
| Net unrealized appreciation (depreciation) | $(31,156) |
| Tax Cost | $7,619,171 |
The tax-based components of distributable earnings as of period end were as follows:
| Undistributed ordinary income | $99,263 |
| Capital loss carryforward | $(472,966) |
| Net unrealized appreciation (depreciation) on securities and other investments | $(31,156) |
Capital loss carryforwards are only available to offset future capital gains of the Fund to the extent provided by regulations and may be limited. The capital loss carryforward information presented below, including any applicable limitation, is estimated as of fiscal period end and is subject to adjustment.
| Short-term | $(421,753) |
| Long-term | (51,213) |
| Total capital loss carryforward | $(472,966) |
The tax character of distributions paid was as follows:
| January 31, 2024 | January 31, 2023 A | |
| Ordinary Income | $249,670 | $370,684 |
A For the period July 7, 2022 (commencement of operations) through January 31, 2023.
5. Derivative Instruments.
Risk Exposures and the Use of Derivative Instruments. The Fund's investment objectives allow for various types of derivative instruments, including futures contracts and swaps. Derivatives are investments whose value is primarily derived from underlying assets, indices or reference rates and may be transacted on an exchange or over-the-counter (OTC). Derivatives may involve a future commitment to buy or sell a specified asset based on specified terms, to exchange future cash flows at periodic intervals based on a notional principal amount, or for one party to make one or more payments upon the occurrence of specified events in exchange for periodic payments from the other party.
Derivatives were used to increase returns, to gain exposure to certain types of assets and to manage exposure to certain risks as defined below. The success of any strategy involving derivatives depends on analysis of numerous economic factors, and if the strategies for investment do not work as intended, the objectives may not be achieved.
Derivatives were used to increase or decrease exposure to the following risk(s):
| Commodity Risk | Commodity risk is the risk that the value of a commodity will fluctuate as a result of changes in market prices. |
| Credit Risk | Credit risk relates to the ability of the issuer of a financial instrument to make further principal or interest payments on an obligation or commitment that it has to a fund. |
| Equity Risk | Equity risk relates to the fluctuations in the value of financial instruments as a result of changes in market prices (other than those arising from interest rate risk or foreign exchange risk), whether caused by factors specific to an individual investment, its issuer, or all factors affecting all instruments traded in a market or market segment. |
| Interest Rate Risk | Interest rate risk relates to the fluctuations in the value of interest-bearing securities due to changes in the prevailing levels of market interest rates. |
Funds are also exposed to additional risks from investing in derivatives, such as liquidity risk and counterparty credit risk. Liquidity risk is the risk that a fund will be unable to close out the derivative in the open market in a timely manner. Counterparty credit risk is the risk that the counterparty will not be able to fulfill its obligation to a fund. Derivative counterparty credit risk is managed through formal evaluation of the creditworthiness of all potential counterparties. On certain OTC derivatives such as bi-lateral swaps, a fund attempts to reduce its exposure to counterparty credit risk by entering into an International Swaps and Derivatives Association, Inc. (ISDA) Master Agreement with each of its counterparties. The ISDA Master Agreement gives a fund the right to terminate all transactions traded under such agreement upon the deterioration in the credit quality of the counterparty beyond specified levels. The ISDA Master Agreement gives each party the right, upon an event of default by the other party or a termination of the agreement, to close out all transactions traded under such agreement and to net amounts owed under each transaction to one net payable by one party to the other. To mitigate counterparty credit risk on bi-lateral OTC derivatives, a fund receives collateral in the form of cash or securities once net unrealized appreciation on outstanding derivative contracts under an ISDA Master Agreement exceeds certain applicable thresholds, subject to certain minimum transfer provisions. The collateral received is held in segregated accounts with the custodian bank in accordance with the collateral agreements entered into between a fund, the counterparty and the custodian bank. A fund could experience delays and costs in gaining access to the collateral even though it is held by the custodian bank. The maximum risk of loss to a fund from counterparty credit risk related to bi-lateral OTC derivatives is generally the aggregate unrealized appreciation and unpaid counterparty payments in excess of any collateral pledged by the counterparty to a fund. A fund may be required to pledge collateral for the benefit of the counterparties on bi-lateral OTC derivatives in an amount not less than each counterparty's unrealized appreciation on outstanding derivative contracts, subject to certain minimum transfer provisions, and any such pledged collateral is identified in the Consolidated Schedule of Investments. Exchange-traded contracts are not covered by the ISDA Master Agreement; however counterparty credit risk related to these contracts may be mitigated by the protection provided by the exchange on which they trade.
Investing in derivatives may involve greater risks than investing in the underlying assets directly and, to varying degrees, may involve risk of loss in excess of any initial investment and collateral received and amounts recognized in the Consolidated Statement of Assets and Liabilities. In addition, there may be the risk that the change in value of the derivative contract does not correspond to the change in value of the underlying instrument.
Net Realized Gain (Loss) and Change in Net Unrealized Appreciation (Depreciation) on Derivatives. The table below, which reflects the impacts of derivatives on the financial performance, summarizes the net realized gain (loss) and change in net unrealized appreciation (depreciation) for derivatives during the period as presented in the Consolidated Statement of Operations.
| Primary Risk Exposure / Derivative Type | Net Realized Gain (Loss)($) | Change in Net Unrealized Appreciation (Depreciation)($) |
| Fidelity Risk Parity Fund | ||
| Commodity Risk | ||
| Swaps | 28,926 | (32,430) |
| Total Commodity Risk | 28,926 | (32,430) |
| Credit Risk | ||
| Swaps | 127,005 | (64,997) |
| Total Credit Risk | 127,005 | (64,997) |
| Equity Risk | ||
| Futures Contracts | (24,537) | (1,068) |
| Total Equity Risk | (24,537) | (1,068) |
| Interest Rate Risk | ||
| Futures Contracts | 8,637 | (5,736) |
| Swaps | (58,191) | (27,197) |
| Total Interest Rate Risk | (49,554) | (32,933) |
| Totals | 81,840 | (131,428) |
If there are any open positions at period end, a summary of the value of derivatives by primary risk exposure is included at the end of the Consolidated Schedule of Investments.
Futures Contracts. A futures contract is an agreement between two parties to buy or sell a specified underlying instrument for a fixed price at a specified future date. Futures contracts were used to manage exposure to the stock market, bond market and fluctuations in interest rates.
Upon entering into a futures contract, a fund is required to deposit either cash or securities (initial margin) with a clearing broker in an amount equal to a certain percentage of the face value of the contract. Futures contracts are marked-to-market daily and subsequent daily payments are made or received by a fund depending on the daily fluctuations in the value of the futures contracts and are recorded as unrealized appreciation or (depreciation). This receivable and/or payable, if any, is included in daily variation margin on futures contracts in the Consolidated Statement of Assets and Liabilities. Realized gain or (loss) is recorded upon the expiration or closing of a futures contract. The net realized gain (loss) and change in net unrealized appreciation (depreciation) on futures contracts during the period is presented in the Consolidated Statement of Operations.
Any open futures contracts at period end are presented in the Consolidated Schedule of Investments under the caption "Futures Contracts". The notional amount at value reflects each contract's exposure to the underlying instrument or index at period end, and is representative of volume of activity during the period unless an average notional amount is presented. Any securities deposited to meet initial margin requirements are identified in the Consolidated Schedule of Investments. Any cash deposited to meet initial margin requirements is presented as segregated cash with brokers for derivative instruments in the Consolidated Statement of Assets and Liabilities.
Swaps. A swap is a contract between two parties to exchange future cash flows at periodic intervals based on a notional principal amount. A bi-lateral OTC swap is a transaction between a fund and a dealer counterparty where cash flows are exchanged between the two parties for the life of the swap.
Bi-lateral OTC swaps are marked-to-market daily and changes in value are reflected in the Consolidated Statement of Assets and Liabilities in the bi-lateral OTC swaps at value line items. Any upfront premiums paid or received upon entering a bi-lateral OTC swap to compensate for differences between stated terms of the swap and prevailing market conditions (e.g. credit spreads, interest rates or other factors) are recorded in total accumulated earnings (loss) in the Consolidated Statement of Assets and Liabilities and amortized to realized gain or (loss) ratably over the term of the swap. Any unamortized upfront premiums are presented in the Consolidated Schedule of Investments.
Payments are exchanged at specified intervals, accrued daily commencing with the effective date of the contract and recorded as realized gain or (loss). Some swaps may be terminated prior to the effective date and realize a gain or loss upon termination. The net realized gain (loss) and change in net unrealized appreciation (depreciation) on swaps during the period is presented in the Consolidated Statement of Operations.
Any open swaps at period end are included in the Consolidated Schedule of Investments under the caption "Swaps", and are representative of volume of activity during the period unless an average notional amount is presented.
Total Return Swaps. Total return swaps are agreements between counterparties to exchange cash flows, one based on a market-linked return of an individual asset or a basket of assets (i.e., an index), and the other on a fixed or floating rate. To the extent the total return of the instrument or index underlying the transaction exceeds or falls short of the offsetting payment obligation, a fund will receive a payment from or make a payment to the counterparty. A fund enters into total return swaps to manage its market exposure.
6. Purchases and Sales of Investments.
Purchases and sales of securities, other than short-term securities, U.S. government securities and in-kind transactions, as applicable, are noted in the table below.
| Purchases ($) | Sales ($) | |
| Fidelity Risk Parity Fund | 5,724,872 | 4,632,297 |
7. Fees and Other Transactions with Affiliates.
Management Fee. Fidelity Diversifying Solutions LLC (the investment adviser) and its affiliates provide the Fund with investment management related services for which each class of the Fund pays a monthly management fee. Under the management contract, the investment adviser pays all other operating expenses, except the compensation of the independent Trustees, distribution and service plan fees, and certain miscellaneous expenses such as proxy and shareholder meeting expenses. During the period, the management fee for each class of the Fund was as follows:
| Annual % of Class-Level Average Net Assets | |
| Class A | .60% |
| Class M | .60% |
| Class C | .60% |
| Fidelity Risk Parity Fund | .60% |
| Class I | .60% |
| Class Z | .55% |
The investment adviser also provides investment management services to the Subsidiary. The Subsidiary does not pay the investment adviser a fee for these services. The Subsidiary pays certain other expenses, such as custody fees.
Distribution and Service Plan Fees. In accordance with Rule 12b-1 of the 1940 Act, the Fund has adopted separate Distribution and Service Plans for each class of shares. Certain classes pay Fidelity Distributors Company LLC (FDC), an affiliate of the investment adviser, separate Distribution and Service Fees, each of which is based on an annual percentage of each class' average net assets. In addition, FDC may pay financial intermediaries for selling shares of the Fund and providing shareholder support services. For the period, the Distribution and Service Fee rates, total fees and amounts retained by FDC were as follows:
| Distribution Fee | Service Fee | Total Fees | Retained by FDC | |
| Class A | - % | .25% | $2,446 | $2,444 |
| Class M | .25% | .25% | 4,886 | 4,874 |
| Class C | .75% | .25% | 9,725 | 9,720 |
| $17,057 | $17,038 |
Sales Load. FDC may receive a front-end sales charge of up to 5.75% for selling Class A shares and 3.50% for selling Class M shares, some of which is paid to financial intermediaries for selling shares of the Fund. Depending on the holding period, FDC may receive contingent deferred sales charges levied on Class A, Class M and Class C redemptions. The deferred sales charges are 1.00% for Class C shares, 1.00% for certain purchases of Class A shares and .25% for certain purchases of Class M shares.
For the period, sales charge amounts retained by FDC were as follows:
| Retained by FDC | |
| Class A | $17 |
| Class M | 10 |
Class CA | 8 |
| $35 |
A When Class C shares are initially sold, FDC pays commissions from its own resources to financial intermediaries through which the sales are made.
Brokerage Commissions. A portion of portfolio transactions were placed with brokerage firms which are affiliates of the investment adviser. Brokerage commissions are included in net realized gain (loss) and change in net unrealized appreciation (depreciation) in the Consolidated Statement of Operations. The commissions paid to these affiliated firms were as follows:
| Amount | |
| Fidelity Risk Parity Fund | $25 |
Interfund Trades. Funds may purchase from or sell securities to other Fidelity Funds under procedures adopted by the Board. The procedures have been designed to ensure these interfund trades are executed in accordance with Rule 17a-7 of the 1940 Act. Any interfund trades are included within the respective purchases and sales amounts shown in the Purchases and Sales of Investments note. During the period, there were no interfund trades.
8. Committed Line of Credit.
Certain Funds participate with other funds managed by the investment adviser or an affiliate in a $4.25 billion credit facility (the "line of credit") to be utilized for temporary or emergency purposes to fund shareholder redemptions or for other short-term liquidity purposes. The participating funds have agreed to pay commitment fees on their pro-rata portion of the line of credit, which are reflected in Miscellaneous expenses on the Consolidated Statement of Operations, and are listed below. During the period, there were no borrowings on this line of credit.
9. Expense Reductions.
The investment adviser contractually agreed to reimburse expenses of each class to the extent annual operating expenses exceeded certain levels of class-level average net assets as noted in the table below. This reimbursement will remain in place through May 31, 2025. Some expenses, for example certain miscellaneous expenses such as proxy and shareholder meeting expenses, are excluded from this reimbursement.
The following classes were in reimbursement during the period:
| Expense Limitations | Reimbursement | |
| Class A | .85% | $1,027 |
| Class M | 1.10% | 1,028 |
| Class C | 1.60% | 1,028 |
| Fidelity Risk Parity Fund | .60% | 2,205 |
| Class I | .60% | 1,157 |
| Class Z | .55% | 1,027 |
| $7,472 |
Through arrangements with the Fund's custodian, credits realized as a result of certain uninvested cash balances were used to reduce the Fund's expense by $746.
10. Distributions to Shareholders.
Distributions to shareholders of each class were as follows:
Year ended January 31, 2024 | Year ended January 31, 2023 A | |
| Fidelity Risk Parity Fund | ||
| Distributions to shareholders | ||
| Class A | $34,079 | $60,367 |
| Class M | 30,555 | 59,224 |
| Class C | 23,943 | 56,987 |
| Fidelity Risk Parity Fund | 80,347 | 63,034 |
| Class I | 42,566 | 69,528 |
| Class Z | 38,180 | 61,544 |
Total | $249,670 | $370,684 |
A Distributions for Class A, Class M, Class C, Class I and Class Z are for the period July 7, 2022 (commencement of operations) through January 31, 2023, and for Fidelity Risk Parity Fund for the period September 1, 2022 (commencement of sales of shares) through January 31, 2023.
11. Share Transactions.
Share transactions for each class were as follows and may contain in-kind transactions, automatic conversions between classes or exchanges between affiliated funds:
| Shares | Shares | Dollars | Dollars | |
Year ended January 31, 2024 | Year ended January 31, 2023 A | Year ended January 31, 2024 | Year ended January 31, 2023 A | |
| Fidelity Risk Parity Fund | ||||
| Class A | ||||
| Shares sold | 193 | 98,825 | $1,756 | $988,808 |
| Reinvestment of distributions | 3,788 | 6,606 | 34,079 | 60,367 |
| Shares redeemed | (6) | (825) | (60) | (8,067) |
| Net increase (decrease) | 3,975 | 104,606 | $35,775 | $1,041,108 |
| Class M | ||||
| Shares sold | 371 | 98,083 | $3,325 | $980,805 |
| Reinvestment of distributions | 3,404 | 6,481 | 30,555 | 59,224 |
| Net increase (decrease) | 3,775 | 104,564 | $33,880 | $1,040,029 |
| Class C | ||||
| Shares sold | 110 | 98,298 | $1,000 | $982,961 |
| Reinvestment of distributions | 2,687 | 6,236 | 23,943 | 56,987 |
| Shares redeemed | (310) | - | (2,729) | - |
| Net increase (decrease) | 2,487 | 104,534 | $22,214 | $1,039,948 |
| Fidelity Risk Parity Fund | ||||
| Shares sold | 107,679 | 219,651 | $961,233 | $2,116,923 |
| Reinvestment of distributions | 2,124 | 2,577 | 19,219 | 23,447 |
| Shares redeemed | (63,187) | (10,152) | (568,009) | (93,338) |
| Net increase (decrease) | 46,616 | 212,076 | $412,443 | $2,047,032 |
| Class I | ||||
| Shares sold | - | 110,712 | $ - | $1,115,000 |
| Reinvestment of distributions | 4,724 | 7,608 | 42,566 | 69,528 |
| Shares redeemed | (1,034) | - | (9,661) | - |
| Net increase (decrease) | 3,690 | 118,320 | $32,905 | $1,184,528 |
| Class Z | ||||
| Shares sold | - | 117,657 | $ - | $1,188,529 |
| Reinvestment of distributions | 4,233 | 6,734 | 38,180 | 61,544 |
| Shares redeemed | - | (19,657) | - | (183,123) |
| Net increase (decrease) | 4,233 | 104,734 | $38,180 | $1,066,950 |
A Share transactions for Class A, Class M, Class C, Class I and Class Z are for the period July 7, 2022 (commencement of operations) through January 31, 2023, and for Fidelity Risk Parity Fund for the period September 1, 2022 (commencement of sales of shares) through January 31, 2023.
12. Other.
A fund's organizational documents provide former and current trustees and officers with a limited indemnification against liabilities arising in connection with the performance of their duties to the fund. In the normal course of business, a fund may also enter into contracts that provide general indemnifications. A fund's maximum exposure under these arrangements is unknown as this would be dependent on future claims that may be made against a fund. The risk of material loss from such claims is considered remote.
At the end of the period, the investment adviser or its affiliates were owners of record of more than 10% of the outstanding shares as follows:
| Fund | Affiliated % |
| Fidelity Risk Parity Fund | 68% |
13. Risk and Uncertainties.
Many factors affect a fund's performance. Developments that disrupt global economies and financial markets, such as pandemics, epidemics, outbreaks of infectious diseases, war, terrorism, and environmental disasters, may significantly affect a fund's investment performance. The effects of these developments to a fund will be impacted by the types of securities in which a fund invests, the financial condition, industry, economic sector, and geographic location of an issuer, and a fund's level of investment in the securities of that issuer. Significant concentrations in security types, issuers, industries, sectors, and geographic locations may magnify the factors that affect a fund's performance.
To the Board of Trustees of Fidelity Greenwood Street Trust and the Shareholders of Fidelity Risk Parity Fund:
Opinion on the Financial Statements and Financial Highlights
We have audited the accompanying consolidated statement of assets and liabilities of Fidelity Risk Parity Fund (the "Fund"), a fund of Fidelity Greenwood Street Trust, including the consolidated schedule of investments, as of January 31, 2024, the related consolidated statement of operations for the year then ended, and the consolidated statement of changes in net assets and the consolidated financial highlights for the year then ended and for the period from July 7, 2022 (commencement of operations) through January 31, 2023, and the related notes. In our opinion, the consolidated financial statements and consolidated financial highlights present fairly, in all material respects, the financial position of the Fund as of January 31, 2024, and the results of its operations for the year then ended, and the changes in its net assets and the financial highlights for the year then ended and for the period from July 7, 2022 (commencement of operations) through January 31, 2023, in conformity with accounting principles generally accepted in the United States of America.
Basis for Opinion
These financial statements and financial highlights are the responsibility of the Fund's management. Our responsibility is to express an opinion on the Fund's financial statements and financial highlights based on our audits. We are a public accounting firm registered with the Public Company Accounting Oversight Board (United States) (PCAOB) and are required to be independent with respect to the Fund in accordance with the U.S. federal securities laws and the applicable rules and regulations of the Securities and Exchange Commission and the PCAOB.
We conducted our audits in accordance with the standards of the PCAOB. Those standards require that we plan and perform the audit to obtain reasonable assurance about whether the financial statements and financial highlights are free of material misstatement, whether due to error or fraud. The Fund is not required to have, nor were we engaged to perform, an audit of its internal control over financial reporting. As part of our audits, we are required to obtain an understanding of internal control over financial reporting but not for the purpose of expressing an opinion on the effectiveness of the Fund's internal control over financial reporting. Accordingly, we express no such opinion.
Our audits included performing procedures to assess the risks of material misstatement of the financial statements and financial highlights, whether due to error or fraud, and performing procedures that respond to those risks. Such procedures included examining, on a test basis, evidence regarding the amounts and disclosures in the financial statements and financial highlights. Our audits also included evaluating the accounting principles used and significant estimates made by management, as well as evaluating the overall presentation of the financial statements and financial highlights. Our procedures included confirmation of securities owned as of January 31, 2024, by correspondence with the custodian and brokers; when replies were not received from brokers, we performed other auditing procedures. We believe that our audits provide a reasonable basis for our opinion.
/s/ Deloitte & Touche LLP
Boston, Massachusetts
March 15, 2024
We have served as the auditor of one or more of the Fidelity investment companies since 1999.
TRUSTEES AND OFFICERS
The Trustees, Members of the Advisory Board (if any), and officers of the trust and fund, as applicable, are listed below. The Board of Trustees governs the fund and is responsible for protecting the interests of shareholders. The Trustees are experienced executives who meet periodically throughout the year to oversee the fund's activities, review contractual arrangements with companies that provide services to the fund, oversee management of the risks associated with such activities and contractual arrangements, and review the fund's performance. If the interests of the fund and an underlying Fidelity® fund were to diverge, a conflict of interest could arise and affect how the Trustees and Members of the Advisory Board fulfill their fiduciary duties to the affected funds. Fidelity Diversifying Solutions LLC (FDS) has structured the fund to avoid these potential conflicts, although there may be situations where a conflict of interest is unavoidable. In such instances, FDS, the Trustees, and Members of the Advisory Board would take reasonable steps to minimize and, if possible, eliminate the conflict. Each of the Trustees oversees 10 funds.
The Trustees hold office without limit in time except that (a) any Trustee may resign; (b) any Trustee may be removed by written instrument, signed by at least two-thirds of the number of Trustees prior to such removal; (c) any Trustee who requests to be retired or who has become incapacitated by illness or injury may be retired by written instrument signed by a majority of the other Trustees; and (d) any Trustee may be removed at any special meeting of shareholders by a two-thirds vote of the outstanding voting securities of the trust. Each Trustee who is not an interested person (as defined in the 1940 Act) of the trust and the fund is referred to herein as an Independent Trustee. Each Independent Trustee shall retire not later than the last day of the calendar year in which his or her 75th birthday occurs. The Independent Trustees may waive this mandatory retirement age policy with respect to individual Trustees. Officers and Advisory Board Members hold office without limit in time, except that any officer or Advisory Board Member may resign or may be removed by a vote of a majority of the Trustees at any regular meeting or any special meeting of the Trustees. Except as indicated, each individual has held the office shown or other offices in the same company for the past five years.
The fund's Statement of Additional Information (SAI) includes more information about the Trustees. To request a free copy, call Fidelity at 1-800-544-8544 if you're an individual investing directly with Fidelity, call 1-800-835-5092 if you're a plan sponsor or participant with Fidelity as your recordkeeper or call 1-877-208-0098 on institutional accounts or if you're an advisor or invest through one.
Experience, Skills, Attributes, and Qualifications of the Trustees. The Board of Trustees has adopted a statement of policy that describes the experience, qualifications, attributes, and skills that are necessary and desirable for potential Independent Trustee candidates (Statement of Policy). The Board believes that each Trustee satisfied at the time he or she was initially elected or appointed a Trustee, and continues to satisfy, the standards contemplated by the Statement of Policy. The Board of Trustees also engages professional search firms to help identify potential Independent Trustee candidates who have the experience, qualifications, attributes, and skills consistent with the Statement of Policy. From time to time, additional criteria based on the composition and skills of the current Independent Trustees, as well as experience or skills that may be appropriate in light of future changes to board composition, business conditions, and regulatory or other developments, have also been considered by the professional search firms and the Board of Trustees. In addition, the Board takes into account the Trustees' commitment and participation in Board and committee meetings, as well as their leadership of standing and ad hoc committees throughout their tenure.
In determining that a particular Trustee was and continues to be qualified to serve as a Trustee, the Board has considered a variety of criteria, none of which, in isolation, was controlling. The Board believes that, collectively, the Trustees have balanced and diverse experience, qualifications, attributes, and skills, which allow the Board to operate effectively in governing the fund and protecting the interests of shareholders. Information about the specific experience, skills, attributes, and qualifications of each Trustee, which in each case led to the Board's conclusion that the Trustee should serve (or continue to serve) as a trustee of the fund, is provided below.
Board Structure and Oversight Function. David B. Jones is an interested person and currently serves as Chair. The Trustees have determined that an interested Chair is appropriate and benefits shareholders because an interested Chair has a personal and professional stake in the quality and continuity of services provided to the fund. Independent Trustees exercise their informed business judgment to appoint an individual of their choosing to serve as Chair, regardless of whether the Trustee happens to be independent or a member of management. The Independent Trustees have determined that they can act independently and effectively without having an Independent Trustee serve as Chair and that a key structural component for assuring that they are in a position to do so is for the Independent Trustees to constitute a substantial majority for the Board. The Independent Trustees also regularly meet in executive session.
Fidelity® funds are overseen by different Boards of Trustees. The fund's Board oversees Fidelity's alternative investment funds, and other Boards oversee Fidelity's investment-grade bond, money market, asset allocation, high income, and equity funds. The asset allocation funds may invest in Fidelity® funds overseen by the fund's Board. The use of separate Boards, each with its own committee structure, allows the Trustees of each group of Fidelity® funds to focus on the unique issues of the funds they oversee, including common research, investment, and operational issues. On occasion, the separate Boards establish joint committees to address issues of overlapping consequences for the Fidelity® funds overseen by each Board.
The Trustees primarily operate as a full Board, but have also established one standing committee, the Audit Committee, to facilitate the timely and efficient consideration of all matters of importance to the Trustees, the fund, and fund shareholders and to facilitate compliance with legal and regulatory requirements and oversight of the fund's activities and associated risks. The Board has charged FDS and its affiliates with (i) identifying events or circumstances the occurrence of which could have demonstrably adverse effects on the fund's business and/or reputation; (ii) implementing processes and controls to lessen the possibility that such events or circumstances occur or to mitigate the effects of such events or circumstances if they do occur; and (iii) creating and maintaining a system designed to evaluate continuously business and market conditions in order to facilitate the identification and implementation processes described in (i) and (ii) above. Because the day-to-day operations and activities of the fund are carried out by or through FDS, its affiliates, and other service providers, the fund's exposure to risks is mitigated but not eliminated by the processes overseen by the Trustees. Board oversight of different aspects of the fund's activities is exercised primarily through the full Board, but also through the Audit Committee. Appropriate personnel, including but not limited to the fund's Chief Compliance Officer (CCO), FDS's internal auditor, the independent accountants, the fund's Treasurer and portfolio management personnel, make periodic reports to the Board and Audit Committee, as appropriate, including an annual review of Fidelity's risk management program for the Fidelity® funds. The responsibilities of the Audit Committee, including its oversight responsibilities, are described further under "Standing Committees of the Trustees."
Interested Trustees*:
Correspondence intended for a Trustee who is an interested person may be sent to Fidelity Investments, 245 Summer Street, Boston, Massachusetts 02210.
Name, Year of Birth; Principal Occupations and Other Relevant Experience+
David B. Jones (1962)
Year of Election or Appointment: 2021
Trustee
Chair of the Board of Trustees
Mr. Jones also serves as Trustee of other Fidelity® funds. Prior to his retirement, Mr. Jones served in a variety of positions at Fidelity Investments (1982-2008), retiring as a Senior Vice President. His duties included new product development, serving as a liaison to the board of trustees of various Fidelity® funds, and development of policies and procedures for fund investments in derivatives and complex securities. He also served on the FMR Fair Value Committee, which is responsible for day-to-day valuation activities for various Fidelity® funds
* Determined to be an "Interested Trustee" by virtue of, among other things, his or her affiliation with the trust or various entities under common control with FDS.
+ The information includes the Trustee's principal occupation during the last five years and other information relating to the experience, attributes, and skills relevant to the Trustee's qualifications to serve as a Trustee, which led to the conclusion that the Trustee should serve as a Trustee for the fund.
Independent Trustees:
Correspondence intended for an Independent Trustee may be sent to Fidelity Investments, P.O. Box 55235, Boston, Massachusetts 02205-5235.
Name, Year of Birth; Principal Occupations and Other Relevant Experience+
Jennifer M. Birmingham (1971)
Year of Election or Appointment: 2021
Trustee
Ms. Birmingham also serves as Trustee of other Fidelity® funds. Ms. Birmingham serves as Managing Director of Princeton University Investment Company (PRINCO) (2010-present). Previously, Ms. Birmingham served in a variety of positions at Deutsche Bank Asset Management (2002-2010), including Managing Director, Global CFO of DB Advisors and Deutsche Insurance Asset Management, Americas CFO of DWS Americas and various legal entities (2005-2010). Prior to Deutsche Bank, Ms. Birmingham was an employee of Investors Bank and Trust Company (1997-2002) and Deloitte & Touche LLP (1993-1997).
Matthew J. Conti (1966)
Year of Election or Appointment: 2021
Trustee
Mr. Conti also serves as Trustee of other Fidelity® funds. Prior to his retirement, Mr. Conti served in a variety of positions at Fidelity Investments, including as a portfolio manager to certain Fidelity® funds (2000-2018) and research analyst (1995-2003). Mr. Conti serves as a member of the Board of Directors of the Rose Kennedy Greenway Conservancy (2021-present).
Tara C. Kenney (1960)
Year of Election or Appointment: 2021
Trustee
Ms. Kenney also serves as Trustee of other Fidelity® funds. Prior to her retirement, Ms. Kenney served as Senior Vice President of Boston Common Asset Management (2017-2020). Previously, Ms. Kenney served as Managing Director in a variety of roles for Deutsche Asset Management (2003-2016) as well as Scudder Investments where she was a Portfolio Manager (1995-2003). Currently, Ms. Kenney serves as a Board member for a number of non-profit organizations and academic institutions, including Catholic Charities USA (2017-present) and the Kellogg Institute for International Studies at the University of Notre Dame (2002-present). Ms. Kenney is also an adjunct professor of finance at the University of Notre Dame.
+ The information includes the Trustee's principal occupation during the last five years and other information relating to the experience, attributes, and skills relevant to the Trustee's qualifications to serve as a Trustee, which led to the conclusion that the Trustee should serve as a Trustee for the fund.
Advisory Board Members and Officers:
Correspondence intended for a Member of the Advisory Board (if any) may be sent to Fidelity Investments, P.O. Box 55235, Boston, Massachusetts 02205-5235. Correspondence intended for an officer may be sent to Fidelity Investments, 245 Summer Street, Boston, Massachusetts 02210.
Name, Year of Birth; Principal Occupation
Joseph Benedetti (1965)
Year of Election or Appointment: 2021
Assistant Secretary
Mr. Benedetti also serves as Assistant Secretary of other funds. Mr. Benedetti is a Senior Vice President, Deputy General Counsel (2020-present) and is an employee of Fidelity Investments (2020-present). Mr. Benedetti serves as Assistant Secretary of Fidelity Diversifying Solutions LLC (investment adviser firm, 2022-present) and Secretary of certain other Fidelity entities. Previously, Mr. Benedetti served as Secretary of Fidelity Diversifying Solutions LLC (2021-2022). Prior to joining Fidelity, Mr. Benedetti was Assistant General Counsel at Invesco (investment adviser firm, 2019-2020) and Senior Vice President and Managing Counsel at OppenheimerFunds Inc. (investment adviser firm, 2017-2019).
Heather Bonner (1977)
Year of Election or Appointment: 2023
President and Treasurer
Ms. Bonner also serves as an officer of other funds. Ms. Bonner is a Senior Vice President (2022-present) and is an employee of Fidelity Investments (2022-present). Ms. Bonner serves as Vice President or Treasurer of certain Fidelity entities. Prior to joining Fidelity, Ms. Bonner served as Managing Director at AQR Capital Management (2013-2022) and was the Treasurer and Principal Financial Officer of the AQR Funds (2013-2022).
Craig S. Brown (1977)
Year of Election or Appointment: 2021
Assistant Treasurer
Mr. Brown also serves as an officer of other funds. Mr. Brown is a Vice President (2015-present) and is an employee of Fidelity Investments. Mr. Brown serves as Assistant Treasurer of FIMM, LLC (2021-present). Previously, Mr. Brown served as Assistant Treasurer of certain Fidelity® funds (2019-2022).
John J. Burke III (1964)
Year of Election or Appointment: 2021
Chief Financial Officer
Mr. Burke also serves as Chief Financial Officer of other funds. Mr. Burke is Head of Fidelity Fund and Investment Operations (2018-present) and is an employee of Fidelity Investments. Mr. Burke serves as President, Executive Vice President, or Director of certain Fidelity entities. Previously Mr. Burke served as head of Asset Management Investment Operations (2012-2018).
Margaret Carey (1973)
Year of Election or Appointment: 2023
Secretary and Chief Legal Officer (CLO)
Ms. Carey also serves as an officer of other funds and as CLO of certain Fidelity entities. Ms. Carey is a Senior Vice President, Deputy General Counsel (2019-present) and is an employee of Fidelity Investments.
Nati Davidi (1971)
Year of Election or Appointment: 2021
Assistant Secretary
Ms. Davidi also serves as Assistant Secretary of other funds. Ms. Davidi is a Vice President, Associate General Counsel (2013-present) and is an employee of Fidelity Investments. Previously, Ms. Davidi served as Assistant Secretary of the North Carolina Capital Management Trust (2016-2022).
Jonathan Davis (1968)
Year of Election or Appointment: 2021
Assistant Treasurer
Mr. Davis also serves as an officer of other funds. Mr. Davis is a Vice President (2006-present) and is an employee of Fidelity Investments. Mr. Davis serves as Assistant Treasurer of certain Fidelity entities.
Laura M. Del Prato (1964)
Year of Election or Appointment: 2021
Assistant Treasurer
Ms. Del Prato also serves as an officer of other funds. Ms. Del Prato is a Senior Vice President (2017-present) and is an employee of Fidelity Investments. Ms. Del Prato serves as Vice President or Assistant Treasurer of certain Fidelity entities. Previously, Ms. Del Prato served as President and Treasurer of The North Carolina Capital Management Trust: Cash Portfolio and Term Portfolio (2018-2020).
Colm A. Hogan (1973)
Year of Election or Appointment: 2021
Assistant Treasurer
Mr. Hogan also serves as an officer of other funds. Mr. Hogan is a Vice President (2016-present) and is an employee of Fidelity Investments. Mr. Hogan serves as Assistant Treasurer of certain Fidelity entities. Previously, Mr. Hogan served as Deputy Treasurer of certain Fidelity® funds (2016-2020) and Assistant Treasurer of certain Fidelity® funds (2016-2018).
William Irving (1964)
Year of Election or Appointment: 2023
Vice President
Mr. Irving also serves as Vice President of other funds. Mr. Irving is Head of Fidelity Asset Management Solutions (2022-present) and is an employee of Fidelity Investments. Mr. Irving serves as President and Director of Fidelity Diversifying Solutions LLC (investment adviser firm, 2023-present) and President or Director of certain other Fidelity entities. Previously, Mr. Irving served as Chief Investment Officer (CIO) in the Global Asset Allocation division (2020-2022). Prior to that, he was Managing Director of Research in the Global Asset Allocation division (2018-2020) and portfolio manager of certain Fidelity® funds (2004-2018).
Chris Maher (1972)
Year of Election or Appointment: 2021
Assistant Treasurer
Mr. Maher also serves as an officer of other funds. Mr. Maher is a Vice President (2008-present) and is an employee of Fidelity Investments. Mr. Maher serves as Assistant Treasurer of certain Fidelity entities. Previously, Mr. Maher served as Assistant Treasurer of certain funds (2013-2020).
Ksenia Portnoy (1980)
Year of Election or Appointment: 2021
Chief Compliance Officer
Ms. Portnoy also serves as Chief Compliance Officer of other funds. Ms. Portnoy is a Senior Vice President of Asset Management Compliance (2021-present) and is an employee of Fidelity Investments (2021-present). Prior to joining Fidelity, Ms. Portnoy worked in the asset management divisions of Morgan Stanley Investment Management (investment adviser firm, 2020-2021) and Mizuho (investment adviser firm, 2015-2020).
Brett Segaloff (1972)
Year of Election or Appointment: 2021
Anti-Money Laundering (AML) Officer
Mr. Segaloff also serves as AML Officer of other funds. Mr. Segaloff is a Vice President (2022-present) and is an employee of Fidelity Investments. Mr. Segaloff serves as Anti Money Laundering Compliance Officer or Anti Money Laundering/Bank Secrecy Act Compliance Officer of certain Fidelity entities.
Stacie M. Smith (1974)
Year of Election or Appointment: 2021
Assistant Treasurer
Ms. Smith also serves as an officer of other funds. Ms. Smith is a Senior Vice President (2016-present) and is an employee of Fidelity Investments. Ms. Smith serves as Assistant Treasurer of certain Fidelity entities and has served in other fund officer roles.
Jim Wegmann (1979)
Year of Election or Appointment: 2021
Assistant Treasurer
Mr. Wegmann also serves as an officer of other funds. Mr. Wegmann is a Vice President (2016-present) and is an employee of Fidelity Investments. Mr. Wegmann serves as Assistant Treasurer of FIMM, LLC (2021-present). Previously, Mr. Wegmann served as Assistant Treasurer of certain Fidelity® funds (2019-2021).
As a shareholder, you incur two types of costs: (1) transaction costs, which may include sales charges (loads) on purchase payments or redemption proceeds, as applicable and (2) ongoing costs, which generally include management fees, distribution and/or service (12b-1) fees and other Fund expenses. This Example is intended to help you understand your ongoing costs (in dollars) of investing in a fund and to compare these costs with the ongoing costs of investing in other mutual funds.
| The Example is based on an investment of $1,000 invested at the beginning of the period and held for the entire period (August 1, 2023 to January 31, 2024). |
Actual Expenses
The first line of the accompanying table provides information about actual account values and actual expenses. You may use the information in this line, together with the amount you invested, to estimate the expenses that you paid over the period. Simply divide your account value by $1,000.00 (for example, an $8,600 account value divided by $1,000.00 = 8.6), then multiply the result by the number in the first line for a class/Fund under the heading entitled "Expenses Paid During Period" to estimate the expenses you paid on your account during this period. If any fund is a shareholder of any underlying mutual funds or exchange-traded funds (ETFs) (the Underlying Funds), such fund indirectly bears its proportional share of the expenses of the Underlying Funds in addition to the direct expenses incurred presented in the table. These fees and expenses are not included in the annualized expense ratio used to calculate the expense estimate in the table below.
Hypothetical Example for Comparison Purposes
The second line of the accompanying table provides information about hypothetical account values and hypothetical expenses based on the actual expense ratio and an assumed rate of return of 5% per year before expenses, which is not the actual return. The hypothetical account values and expenses may not be used to estimate the actual ending account balance or expenses you paid for the period. You may use this information to compare the ongoing costs of investing in the Fund and other funds. To do so, compare this 5% hypothetical example with the 5% hypothetical examples that appear in the shareholder reports of the other funds. If any fund is a shareholder of any Underlying Funds, such fund indirectly bears its proportional share of the expenses of the Underlying Funds in addition to the direct expenses as presented in the table. These fees and expenses are not included in the annualized expense ratio used to calculate the expense estimate in the table below.
Please note that the expenses shown in the table are meant to highlight your ongoing costs only and do not reflect any transaction costs. Therefore, the second line of the table is useful in comparing ongoing costs only, and will not help you determine the relative total costs of owning different funds. In addition, if these transactional costs were included, your costs would have been higher.
Annualized Expense Ratio- A | Beginning Account Value August 1, 2023 | Ending Account Value January 31, 2024 | Expenses Paid During Period- C August 1, 2023 to January 31, 2024 | |||||||
| Fidelity® Risk Parity Fund | ||||||||||
| Class A | .85% | |||||||||
| Actual | $ 1,000 | $ 1,001.50 | $ 4.29 | |||||||
Hypothetical-B | $ 1,000 | $ 1,020.92 | $ 4.33 | |||||||
| Class M | 1.10% | |||||||||
| Actual | $ 1,000 | $ 999.40 | $ 5.54 | |||||||
Hypothetical-B | $ 1,000 | $ 1,019.66 | $ 5.60 | |||||||
| Class C | 1.60% | |||||||||
| Actual | $ 1,000 | $ 997.90 | $ 8.06 | |||||||
Hypothetical-B | $ 1,000 | $ 1,017.14 | $ 8.13 | |||||||
| Fidelity® Risk Parity Fund | .60% | |||||||||
| Actual | $ 1,000 | $ 1,002.00 | $ 3.03 | |||||||
Hypothetical-B | $ 1,000 | $ 1,022.18 | $ 3.06 | |||||||
| Class I | .60% | |||||||||
| Actual | $ 1,000 | $ 1,002.60 | $ 3.03 | |||||||
Hypothetical-B | $ 1,000 | $ 1,022.18 | $ 3.06 | |||||||
| Class Z | .55% | |||||||||
| Actual | $ 1,000 | $ 1,002.00 | $ 2.78 | |||||||
Hypothetical-B | $ 1,000 | $ 1,022.43 | $ 2.80 | |||||||
A Annualized expense ratio reflects expenses net of applicable fee waivers.
B 5% return per year before expenses
C Expenses are equal to the annualized expense ratio, multiplied by the average account value over the period, multiplied by 184/ 365 (to reflect the one-half year period). The fees and expenses of any Underlying Funds are not included in each annualized expense ratio.
Distributions (Unaudited)
The dividend and capital gains distributions for the fund(s) are available on Fidelity.com or Institutional.Fidelity.com.
A total of 28.79% of the dividends distributed during the fiscal year was derived from interest on U.S. Government securities which is generally exempt from state income tax.
The fund designates $89,515 of distributions paid in the calendar year 2023 as qualifying to be taxed as interest-related dividends for nonresident alien shareholders.
The fund designates $39,930 of distributions paid during the fiscal year ended 2024 as qualifying to be taxed as section 163(j) interest dividends.
Class A designates 37%; Class M designates 55%; Fidelity Risk Parity Fund designates 26%; Class I designates 27%; and Class Z designates 26% of the dividends distributed in December, respectively during the fiscal year as qualifying for the dividends-received deduction for corporate shareholders.
Class A designates 0.48% and 100%; Class M designates 0.50% and 100%; Class C designates 0.56% and 0.00%; Fidelity Risk Parity Fund designates 0.46% and 83.88%; Class I designates 0.46% and 88.02%; and Class Z designates 0.46% and 83.88%; of dividends distributed in March and December respectively, during the fiscal year as amounts which may be taken into account as a dividend for purposes of the maximum rate under section 1(h)(11) of the Internal Revenue Code.
Class A designates 0.03% and 0.00%; Class M designates 0.03% and 0.00%; Class C designates 0.03% and 0.00%; Fidelity Risk Parity Fund designates 0.03%, and 2.94%; Class I designates 0.03% and 3.09% and Class Z designates 0.03% and 2.94%; of the dividends distributed in March and December, respectively during the fiscal year as a section 199A dividend.
The amounts per share which represent income derived from sources within, and taxes paid to, foreign countries or possessions of the United States are as follows:
| Pay Date | Income | Taxes | |
| Insert Fund Name | |||
| Class A | 03/13/2023 | $0.0076 | $0.0015 |
| Class A | 12/29/2023 | $0.0103 | $0.0050 |
| Class M | 03/13/2023 | $0.0073 | $0.0015 |
| Class M | 12/29/2023 | $0.0069 | $0.0050 |
| Class C | 03/13/2023 | $0.0065 | $0.0015 |
| Class C | 12/29/2023 | $0.0000 | $0.0000 |
| Fidelity Risk Parity Fund | 03/13/2023 | $0.0080 | $0.0015 |
| Fidelity Risk Parity Fund | 12/29/2023 | $0.0146 | $0.0050 |
| Class I | 03/13/2023 | $0.0080 | $0.0015 |
| Class I | 12/29/2023 | $0.0139 | $0.0050 |
| Class Z | 03/13/2023 | $0.0080 | $0.0015 |
| Class Z | 12/29/2023 | $0.0146 | $0.0050 |
The fund will notify shareholders in January 2025 of amounts for use in preparing 2024 income tax returns.
Board Approval of Investment Advisory Contracts and Management Fees
Fidelity Risk Parity Fund
Each year, the Board of Trustees, including the Independent Trustees (together, the Board), considers the renewal of the fund's management contract with Fidelity Diversifying Solutions LLC (FDS) and the sub-advisory agreements (together, the Advisory Contracts) for the fund. FDS and the sub-advisers are referred to herein as the Investment Advisers. The Board, assisted by the advice of fund counsel and Independent Trustees' counsel, requests and considers a broad range of information relevant to the renewal of the Advisory Contracts throughout the year.
The Board meets regularly and, at each of its meetings, covers an extensive agenda of topics and materials and considers factors that are relevant to its annual consideration of the renewal of the fund's Advisory Contracts, including the services and support provided to the fund and its shareholders. The Board requests and receives information concerning the annual consideration of the renewal of the fund's Advisory Contracts. The Board also meets as needed to review matters specifically related to the Board's annual consideration of the renewal of the Advisory Contracts.
At its November 2023 meeting, the Board unanimously determined to renew the fund's Advisory Contracts. In reaching its determination, the Board considered all factors it believed relevant and reached a determination, with the assistance of fund counsel and Independent Trustees' counsel and through the exercise of its business judgment, that the renewal of the Advisory Contracts was in the best interests of the fund and its shareholders and the fact that no fee is payable under the management contract was fair and reasonable in light of all of the surrounding circumstances.
Nature, Extent, and Quality of Services Provided. The Board considered staffing as it relates to the fund, including the backgrounds and experience of investment personnel of the Investment Advisers, and also considered the Investment Advisers' implementation of the fund's investment program.
Resources Dedicated to Investment Management and Support Services. The Board reviewed the general qualifications and capabilities of Fidelity's investment staff, including its size, education, experience, and resources, as well as Fidelity's approach to training and managing investment personnel. The Board noted the resources devoted to Fidelity's global investment organization and that Fidelity's analysts have extensive resources, tools and capabilities that allow them to conduct sophisticated quantitative and fundamental analysis, as well as credit analysis of issuers, counterparties and guarantors. Further, the Board considered that Fidelity's investment professionals have sufficient access to global information and data so as to provide competitive investment results over time, and that those professionals also have access to sophisticated tools that permit them to assess portfolio construction and risk and performance attribution characteristics continuously, as well as to transmit new information and research conclusions rapidly around the world. Additionally, in its deliberations, the Board considered Fidelity's trading, risk management, compliance, cybersecurity, and technology and operations capabilities and resources, which are integral parts of the investment management process.
Shareholder and Administrative Services. The Board considered the nature, extent, quality, and cost of advisory, administrative, and shareholder services to be performed by the Investment Advisers and their affiliates under the Advisory Contracts and under separate agreements covering transfer agency, pricing and bookkeeping, and securities lending services for the fund. The Board also considered the nature and extent of the supervision of third-party service providers, principally custodians, subcustodians, and pricing vendors. The Board also considered the fund's securities lending activities and any payments made to Fidelity relating to securities lending.
The Board noted that the growth of fund assets over time across the complex allows Fidelity to reinvest in the development of services designed to enhance the value and convenience of the Fidelity funds as investment vehicles. These services include 24-hour access to account information and market information over the Internet and through telephone representatives, investor education materials and asset allocation tools.
Investment Performance. The Board took into account discussions that occur with representatives of the Investment Advisers, and reports that it receives, at Board meetings throughout the year, relating to fund investment performance. In this regard the Board noted that as part of regularly scheduled fund reviews and other reports to the Board on fund performance, the Board considered annualized return information for the fund for different time periods, measured against an appropriate securities market index (benchmark index). The Board also considered information about performance attribution. In its ongoing evaluation of fund investment performance, the Board gives particular attention to information indicating changes in performance of the funds over different time periods and discussed with the Investment Advisers the reasons for any overperformance or underperformance.
In addition to reviewing absolute and relative fund performance, the Independent Trustees periodically consider the appropriateness of fund performance metrics in evaluating the results achieved. The Independent Trustees generally give greater weight to fund performance over longer time periods than over shorter time periods. Depending on the circumstances, the Independent Trustees may be satisfied with a fund's performance notwithstanding that it lags its benchmark index for certain periods.
Based on its review, the Board concluded that the nature, extent, and quality of services to be provided to the fund under the Advisory Contracts should benefit the shareholders of the fund.
Competitiveness of Management Fee and Total Expense Ratio. In its review of the fund's management fee and the total expense ratio of a representative class of the fund (Class I), the Board considered the fund's class-level unitary management fees rate as well as other fund or class expenses, as applicable, such as fund-paid 12b-1 fees. The Board noted that differences among the classes' net expenses are the result of separate arrangements for class level services and/or waivers of certain expenses (if any). It is not the result of any difference in advisory or custodial fees or other expenses related to the management of a fund's assets, which do not vary by class.The Board noted that Fidelity may agree to waive fees or reimburse expenses from time to time, and the extent to which, if any, it has done so for the fund.
Comparisons of Management Fees and Total Expense Ratios. Among other things, the Board reviewed data for selected groups of competitive funds and classes (referred to as "mapped groups") that were compiled by Fidelity based on combining similar investment objective categories (as classified by Lipper) that have comparable investment mandates. The data reviewed by the Board included (i) gross management fee comparisons (before taking into account expense reimbursements or caps) relative to the total universe of funds within the mapped group; and (ii) net total expense comparisons (including acquired fund fees and expenses) of Class I of the fund relative to funds and classes in the mapped group that have a similar sales load structure to Class I of the fund (referred to as the "similar sales load structure group").
The information provided to the Board indicated that the fund's management fee rate ranked below the competitive median of the mapped group for the 12-month period ended March 31, 2023. Further, the information provided to the Board indicated that the total expense ratio of Class I of the fund ranked above the competitive median of the similar sales load structure group for the 12-month period ended March 31, 2023.
The Board considered that, in general, various factors can affect total expense ratios. The Board noted that, although Class I is categorized by Lipper as an institutional class, Class I has no investment minimum, unlike most other funds and classes categorized as institutional. As a result, FMR believes Class I is generally more comparable to retail funds and classes. The Board considered that, when compared to retail funds and classes, Class I would not be above the similar sales load structure growth competitive median for the twelve-month period ended March 31, 2023.
Other Contractual Arrangements. The Board further considered that FDS has contractually agreed to reimburse Class A, Class M, Class C, Class I, Class Z and the retail class of the fund to the extent that total operating expenses, with certain exceptions, as a percentage of their respective average net assets, exceed 0.85%, 1.10%, 1.60%, 0.60%, 0.55% and 0.60% through May 31, 2024.
Based on its review, the Board concluded that the fund's management fee is fair and reasonable in light of the services that the fund receives and the other factors considered. Further based on its review of total expense ratios and fees charged to other Fidelity clients, the Board concluded that the total expense ratio of each class of the fund was reasonable in light of the services that the fund and its shareholders receive and the other factors considered.
Costs of the Services and Profitability. The Board considered the revenues earned and the expenses incurred by Fidelity in conducting the business of developing, marketing, distributing, managing, administering and servicing the fund and servicing the fund's shareholders. The Board considered the level of Fidelity's profits in respect of all the Fidelity funds it oversees. The Board noted that the profitability information reflects the relatively small size of the funds overseen by the Board and their short history given that the period for the profitability report was calendar year 2022.
The Board also reviewed Fidelity's non-fund businesses and potential indirect benefits such businesses may have received as a result of their association with Fidelity's fund business (i.e., fall-out benefits) as well as cases where Fidelity's affiliates may benefit from the funds' business. The Board considered areas where potential indirect benefits to the Fidelity funds from their relationships with Fidelity may exist.
The Board considered the costs of the services provided by and the lack of meaningful profits realized by Fidelity in connection with the operation of the funds overseen by the Board and was satisfied that the profitability was not excessive.
Economies of Scale. The Board will consider economies of scale when there is operating experience to permit assessment thereof. It noted that, notwithstanding the entrepreneurial risk associated with a new fund, the management fee was at a level normally associated, by comparison with competitors, with very high fund net assets, and Fidelity asserted to the Board that the level of the fee anticipated economies of scale at lower asset levels even before, if ever, economies of scale are achieved. The Board also noted that the fund and its shareholders would have access to the very considerable number and variety of services available through Fidelity and its affiliates.
Conclusion. Based on its evaluation of all of the conclusions noted above, and after considering all factors it believed relevant, the Board concluded that the advisory fee arrangements are fair and reasonable in light of all of the surrounding circumstances, and that the fund's Advisory Contracts should be approved through November 30, 2024.
The Securities and Exchange Commission adopted Rule 22e-4 under the Investment Company Act of 1940 (the Liquidity Rule) to promote effective liquidity risk management throughout the open-end investment company industry, thereby reducing the risk that funds will be unable to meet their redemption obligations and mitigating dilution of the interests of fund shareholders.
The Fund has adopted and implemented a liquidity risk management program (the Program) reasonably designed to assess and manage the Fund's liquidity risk and to comply with the requirements of the Liquidity Rule. The Fund's Board of Trustees (the Board) has designated the Fund's investment adviser as administrator of the Program. The Fidelity advisers have established a Liquidity Risk Management Committee (the LRM Committee) to manage the Program for each of the Fidelity Funds. The LRM Committee monitors the adequacy and effectiveness of implementation of the Program and on a periodic basis assesses each Fund's liquidity risk based on a variety of factors including (1) the Fund's investment strategy, (2) portfolio liquidity and cash flow projections during normal and reasonably foreseeable stressed conditions, (3) shareholder redemptions, (4) borrowings and other funding sources and (5) certain factors specific to ETFs including the effect of the Fund's prices and spreads, market participants, and basket compositions on the overall liquidity of the Fund's portfolio, as applicable.
In accordance with the Program, each of the Fund's portfolio investments is classified into one of four defined liquidity categories based on a determination of a reasonable expectation for how long it would take to convert the investment to cash (or sell or dispose of the investment) without significantly changing its market value.
- Highly liquid investments - cash or convertible to cash within three business days or less
- Moderately liquid investments - convertible to cash in three to seven calendar days
- Less liquid investments - can be sold or disposed of, but not settled, within seven calendar days
- Illiquid investments - cannot be sold or disposed of within seven calendar days
Liquidity classification determinations take into account a variety of factors including various market, trading and investment-specific considerations, as well as market depth, and generally utilize analysis from a third-party liquidity metrics service.
The Liquidity Rule places a 15% limit on a fund's illiquid investments and requires funds that do not primarily hold assets that are highly liquid investments to determine and maintain a minimum percentage of the fund's net assets to be invested in highly liquid investments (highly liquid investment minimum or HLIM). The Program includes provisions reasonably designed to comply with the 15% limit on illiquid investments and for determining, periodically reviewing and complying with the HLIM requirement as applicable.
At a recent meeting of the Fund's Board of Trustees, the LRM Committee provided a written report to the Board pertaining to the operation, adequacy, and effectiveness of the Program for the period December 1, 2022 through November 30, 2023. The report concluded that the Program is operating effectively and is reasonably designed to assess and manage the Fund's liquidity risk.
 |
1.9906092.101
RPF-ANN-0324
Fidelity® SAI Convertible Arbitrage Fund
Annual Report
January 31, 2024
Offered exclusively to certain clients of the Adviser, or its affiliates, including Strategic Advisers LLC (Strategic Advisers) - not available for sale to the general public. Fidelity® SAI is a product name of Fidelity® funds dedicated to certain programs affiliated with Strategic Advisers.


Contents
To view a fund's proxy voting guidelines and proxy voting record for the 12-month period ended June 30, visit http://www.fidelity.com/proxyvotingresults or visit the Securities and Exchange Commission's (SEC) web site at http://www.sec.gov.
You may also call 1-800-544-3455 to request a free copy of the proxy voting guidelines.
Standard & Poor's, S&P and S&P 500 are registered service marks of The McGraw-Hill Companies, Inc. and have been licensed for use by Fidelity Distributors Corporation.
Other third-party marks appearing herein are the property of their respective owners.
All other marks appearing herein are registered or unregistered trademarks or service marks of FMR LLC or an affiliated company. © 2024 FMR LLC. All rights reserved.
This report and the financial statements contained herein are submitted for the general information of the shareholders of the Fund. This report is not authorized for distribution to prospective investors in the Fund unless preceded or accompanied by an effective prospectus.
A fund files its complete schedule of portfolio holdings with the SEC for the first and third quarters of each fiscal year on Form N-PORT. Forms N-PORT are available on the SEC's web site at http://www.sec.gov. A fund's Forms N-PORT may be reviewed and copied at the SEC's Public Reference Room in Washington, DC. Information regarding the operation of the SEC's Public Reference Room may be obtained by calling 1-800-SEC-0330.
For a complete list of a fund's portfolio holdings, view the most recent holdings listing, semiannual report, or annual report on Fidelity's web site at http://www.fidelity.com, http://www.institutional.fidelity.com, or http://www.401k.com, as applicable.
NOT FDIC INSURED •MAY LOSE VALUE •NO BANK GUARANTEE
Neither the Fund nor Fidelity Distributors Corporation is a bank.
Top Holdings (% of Fund's net assets) | ||
| U.S. Treasury Bills, yield at date of purchase 5.32% to 5.36% 2/15/24 to 3/14/24 | 65.4 | |
| Royal Caribbean Cruises Ltd. 6% 8/15/25 | 5.1 | |
| Varonis Systems, Inc. 1.25% 8/15/25 | 4.0 | |
| Enovis Corp. 3.875% 10/15/28 | 3.2 | |
| Middleby Corp. 1% 9/1/25 | 2.7 | |
| Alteryx, Inc. 0.5% 8/1/24 | 2.6 | |
| Gannett Media Corp. 4.75% 4/15/24 | 2.1 | |
| NuVasive, Inc. 0.375% 3/15/25 | 1.9 | |
| Akamai Technologies, Inc. 0.125% 5/1/25 | 1.7 | |
| Ironwood Pharmaceuticals, Inc. 0.75% 6/15/24 | 1.5 | |
| 90.2 | ||
| Market Sectors (% of Fund's net assets) | ||
| Health Care | 9.5 | |
| Information Technology | 9.3 | |
| Consumer Discretionary | 7.0 | |
| Industrials | 3.9 | |
| Communication Services | 2.1 | |
Quality Diversification (% of Fund's net assets) |
 |
| We have used ratings from Moody's Investors Service, Inc. Where Moody's® ratings are not available, we have used S&P® ratings. All ratings are as of the date indicated and do not reflect subsequent changes. |
Asset Allocation (% of Fund's net assets) |
 |
Futures - 10.1% |
Swaps - 208.7% |
Showing Percentage of Net Assets
| Convertible Bonds - 31.8% | |||
Principal Amount (a) | Value ($) | ||
| COMMUNICATION SERVICES - 2.1% | |||
| Media - 2.1% | |||
| Gannett Media Corp. 4.75% 4/15/24 | 3,300,000 | 3,219,008 | |
| CONSUMER DISCRETIONARY - 7.0% | |||
| Automobiles - 0.9% | |||
| Rivian Automotive, Inc. 3.625% 10/15/30 (b) | 1,500,000 | 1,377,150 | |
| Broadline Retail - 1.0% | |||
| Etsy, Inc. 0.125% 10/1/26 | 1,500,000 | 1,565,250 | |
| Hotels, Restaurants & Leisure - 5.1% | |||
| Royal Caribbean Cruises Ltd. 6% 8/15/25 | 2,965,000 | 7,740,227 | |
TOTAL CONSUMER DISCRETIONARY | 10,682,627 | ||
| HEALTH CARE - 9.5% | |||
| Biotechnology - 1.5% | |||
| Ironwood Pharmaceuticals, Inc. 0.75% 6/15/24 | 2,000,000 | 2,332,047 | |
| Health Care Equipment & Supplies - 5.1% | |||
| Enovis Corp. 3.875% 10/15/28 (b) | 4,000,000 | 4,934,000 | |
| NuVasive, Inc. 0.375% 3/15/25 | 3,000,000 | 2,819,080 | |
| 7,753,080 | |||
| Health Care Technology - 1.4% | |||
| Evolent Health, Inc. 3.5% 12/1/29 (b) | 2,000,000 | 2,184,000 | |
| Pharmaceuticals - 1.5% | |||
| Pacira Biosciences, Inc. 0.75% 8/1/25 | 2,500,000 | 2,304,688 | |
TOTAL HEALTH CARE | 14,573,815 | ||
| INDUSTRIALS - 3.9% | |||
| Construction & Engineering - 1.2% | |||
| Granite Construction, Inc. 3.75% 5/15/28 (b) | 1,500,000 | 1,762,800 | |
| Machinery - 2.7% | |||
| Middleby Corp. 1% 9/1/25 | 3,500,000 | 4,127,698 | |
TOTAL INDUSTRIALS | 5,890,498 | ||
| INFORMATION TECHNOLOGY - 9.3% | |||
| Electronic Equipment, Instruments & Components - 1.0% | |||
| Advanced Energy Industries, Inc. 2.5% 9/15/28 (b) | 1,500,000 | 1,551,600 | |
| IT Services - 1.7% | |||
| Akamai Technologies, Inc. 0.125% 5/1/25 | 2,000,000 | 2,632,000 | |
| Software - 6.6% | |||
| Alteryx, Inc. 0.5% 8/1/24 | 4,000,000 | 3,910,000 | |
| Varonis Systems, Inc. 1.25% 8/15/25 | 4,000,000 | 6,058,000 | |
| 9,968,000 | |||
TOTAL INFORMATION TECHNOLOGY | 14,151,600 | ||
| TOTAL CONVERTIBLE BONDS (Cost $45,739,715) | 48,517,548 | ||
| U.S. Treasury Obligations - 65.4% | |||
Principal Amount (a) | Value ($) | ||
U.S. Treasury Bills, yield at date of purchase 5.32% to 5.36% 2/15/24 to 3/14/24 (c)(d) (Cost $99,631,611) | 100,000,000 | 99,631,283 | |
| Money Market Funds - 3.3% | |||
| Shares | Value ($) | ||
Fidelity Cash Central Fund 5.39% (e) (Cost $5,110,094) | 5,109,072 | 5,110,094 | |
| TOTAL INVESTMENT IN SECURITIES - 100.5% (Cost $150,481,420) | 153,258,925 |
NET OTHER ASSETS (LIABILITIES) - (0.5)% | (826,951) |
| NET ASSETS - 100.0% | 152,431,974 |
| Futures Contracts | |||||
Number of contracts | Expiration Date | Notional Amount ($) | Value ($) | Unrealized Appreciation/ (Depreciation) ($) | |
| Sold | |||||
| Treasury Contracts | |||||
| CBOT 2-Year U.S. Treasury Note Contracts (United States) | 69 | Mar 2024 | 14,190,281 | (124,662) | (124,662) |
| CBOT 5-Year U.S. Treasury Note Contracts (United States) | 11 | Mar 2024 | 1,192,297 | (22,452) | (22,452) |
| TOTAL FUTURES CONTRACTS | (147,114) | ||||
| The notional amount of futures sold as a percentage of Net Assets is 10.1% | |||||
For the period, the average monthly notional amount at value for futures contracts in the aggregate was $14,174,133.
| Total Return Swaps | ||||||
| Description | Counterparty | Maturity Date | Absolute Notional Amount ($) | Value ($) | Net Cash and Other Receivables/(Payables) ($) | Unrealized Appreciation/(Depreciation) ($) |
| The Fund receives the total return on a portfolio of long and short equity positions and fixed income positions and pays or receives the Secured Overnight Fin. Rate (SOFR)plus or minus a specified spread ranging from (0.20)% to 0.50% , which is denominated in U.S. dollars based on the local currencies of the positions within the swap as applicable. | Bank of Montreal | Sep 2024 | 90,404,112 | (120,018) | (106,120) | (226,138) |
| The following table represents disclosures associated with the underlying components of the total return basket swap at period end. | ||||||
| Description | Principal Amount / (Shares) | Notional Amount ($) | Unrealized Appreciation / (Depreciation) ($) | Percentage of Swap Value (%) | Investment Type | |
| Airbnb, Inc. Class A | (1,700) | (245,038) | (15,082) | (0.07) | Common Stock | |
| American Airlines Group, Inc. | (136,000) | (1,935,280) | (138,126) | (0.55) | Common Stock | |
| Ascendis Pharma A/S sponsored ADR | (15,600) | (2,026,908) | 59,538 | 0.26 | Common Stock | |
| BlackLine, Inc. | (9,000) | (528,120) | (8,582) | (0.04) | Common Stock | |
| Cable One, Inc. | (300) | (164,679) | (2,049) | (0.01) | Common Stock | |
| Camtek Ltd. | (35,000) | (2,724,400) | (128,564) | (0.57) | Common Stock | |
| Cracker Barrel Old Country Store, Inc. | (6,400) | (495,040) | (37,413) | (0.17) | Common Stock | |
| Datadog, Inc. Class A | (35,000) | (4,355,400) | (14,747) | (0.07) | Common Stock | |
| Enphase Energy, Inc. | (2,100) | (218,673) | 10,123 | 0.04 | Common Stock | |
| FirstEnergy Corp. | (13,500) | (495,180) | 16,738 | 0.07 | Common Stock | |
| InterDigital, Inc. | (17,000) | (1,785,850) | (23,769) | (0.11) | Common Stock | |
| Jazz Pharmaceuticals PLC | (500) | (61,360) | (1,684) | (0.01) | Common Stock | |
| Liberty Media Corp. Liberty Formula One Class C | (21,700) | (1,459,325) | (87,308) | (0.39) | Common Stock | |
| Lumentum Holdings, Inc. | (8,050) | (442,267) | (17,651) | (0.08) | Common Stock | |
| MACOM Technology Solutions Holdings, Inc. | (18,500) | (1,595,255) | 1,834 | 0.01 | Common Stock | |
| MannKind Corp. | (135,000) | (450,900) | (519) | 0.00 | Common Stock | |
| Mesa Laboratories, Inc. | (500) | (45,810) | 1,958 | 0.01 | Common Stock | |
| Mirum Pharmaceuticals, Inc. | (47,300) | (1,251,558) | 14,632 | 0.06 | Common Stock | |
| National Vision Holdings, Inc. | (16,500) | (313,665) | 24,217 | 0.11 | Common Stock | |
| Okta, Inc. | (2,000) | (165,300) | 325 | 0.00 | Common Stock | |
| PG&E Corp. | (42,500) | (716,975) | 11,608 | 0.05 | Common Stock | |
| Progress Software Corp. | (44,600) | (2,533,726) | (138,303) | (0.61) | Common Stock | |
| The GEO Group, Inc. | (82,500) | (917,400) | (29,713) | (0.13) | Common Stock | |
| Turning Point Brands, Inc. | (2,800) | (68,012) | 2,117 | 0.01 | Common Stock | |
| Winnebago Industries, Inc. | (14,000) | (920,080) | 15,452 | 0.07 | Common Stock | |
| Airbnb, Inc. 0% 3/15/26 | 2,000,000 | 1,815,000 | 6,350 | 0.03 | Convertible Corporate Bond | |
| American Airlines Group, Inc. 6.5% 7/1/25 | 4,000,000 | 4,521,666 | 137,602 | 0.61 | Convertible Corporate Bond | |
| Ascendis Pharma A/S 2.25% 4/1/28 | 4,000,000 | 4,290,000 | (39,782) | (0.18) | Convertible Corporate Bond | |
| BlackLine, Inc. 0.125% 8/1/24 | 1,500,000 | 1,504,650 | (5,799) | (0.03) | Convertible Corporate Bond | |
| Cable One, Inc. 0% 3/15/26 | 3,000,000 | 2,563,500 | (9,350) | (0.04) | Convertible Corporate Bond | |
| Camtek Ltd. 0% 12/1/26 | 2,500,000 | 3,555,000 | 134,031 | 0.59 | Convertible Corporate Bond | |
| Cracker Barrel Old Country Store, Inc. 0.625% 6/15/26 | 3,500,000 | 3,049,545 | 36,659 | 0.16 | Convertible Corporate Bond | |
| Datadog, Inc. 0.125% 6/15/25 | 4,000,000 | 5,662,638 | (3,652) | (0.02) | Convertible Corporate Bond | |
| Enphase Energy, Inc. 0% 3/1/26 | 2,000,000 | 1,784,000 | (18,256) | (0.08) | Convertible Corporate Bond | |
| FirstEnergy Corp. 4% 5/1/26 | 2,000,000 | 1,998,000 | (21,201) | (0.09) | Convertible Corporate Bond | |
| GEO Corrections Holdings, Inc. 6.5% 2/23/26 | 1,000,000 | 1,438,083 | 29,205 | 0.13 | Convertible Corporate Bond | |
| InterDigital, Inc. 2% 6/1/24 | 1,500,000 | 1,933,437 | 3,376 | 0.01 | Convertible Corporate Bond | |
| Jazz Investments I Ltd. 1.5% 8/15/24 | 4,000,000 | 3,931,666 | 1,692 | 0.01 | Convertible Corporate Bond | |
| Liberty Media Corp. Liberty Formula One 2.25% 8/15/27 | 3,000,000 | 3,187,402 | 86,818 | 0.38 | Convertible Corporate Bond | |
| Lumentum Holdings, Inc. 0.25% 3/15/24 | 3,250,000 | 3,236,622 | (42,231) | (0.19) | Convertible Corporate Bond | |
| MACOM Technology Solutions Holdings, Inc. 0.25% 3/15/26 | 2,000,000 | 2,354,888 | (1,236) | (0.01) | Convertible Corporate Bond | |
| MannKind Corp. 2.5% 3/1/26 | 2,000,000 | 2,007,033 | (20,803) | (0.09) | Convertible Corporate Bond | |
| Mesa Laboratories, Inc. 1.375% 8/15/25 | 1,000,000 | 923,240 | (6,571) | (0.03) | Convertible Corporate Bond | |
| Mirum Pharmaceuticals, Inc. 4% 5/1/29 | 2,000,000 | 2,304,000 | (27,115) | (0.12) | Convertible Corporate Bond | |
| National Vision Holdings, Inc. 2.5% 5/15/25 | 1,250,000 | 1,241,597 | (19,539) | (0.09) | Convertible Corporate Bond | |
| Okta, Inc. 0.125% 9/1/25 | 1,540,000 | 1,415,292 | (9,630) | (0.04) | Convertible Corporate Bond | |
| PG&E Corp. 4.25% 12/1/27 | 1,630,000 | 1,669,493 | (12,759) | (0.06) | Convertible Corporate Bond | |
| Progress Software Corp. 1% 4/15/26 | 4,000,000 | 4,339,777 | 117,397 | 0.52 | Convertible Corporate Bond | |
| Turning Point Brands, Inc. 2.5% 7/15/24 | 2,360,000 | 2,316,882 | 3,699 | 0.02 | Convertible Corporate Bond | |
| Winnebago Industries, Inc. 1.5% 4/1/25 | 1,250,000 | 1,444,500 | (60,075) | (0.27) | Convertible Corporate Bond | |
| Description | Counterparty | Maturity Date | Absolute Notional Amount ($) | Value ($) | Net Cash and Other Receivables/(Payables) ($) | Unrealized Appreciation/(Depreciation) ($) |
| The Fund receives the total return on a portfolio of long and short equity positions and fixed income positions and pays or receives the Secured Overnight Fin. Rate (SOFR)plus or minus a specified spread ranging from (1.25)% to 0.75% , which is denominated in U.S. dollars based on the local currencies of the positions within the swap as applicable. | BNP Paribas SA | Sep 2024 | 232,083,082 | (625,914) | (25,307) | (651,221) |
| The following table represents disclosures associated with the underlying components of the total return basket swap at period end. | ||||||
| Description | Principal Amount / (Shares) | Notional Amount ($) | Unrealized Appreciation / (Depreciation) ($) | Percentage of Swap Value (%) | Investment Type | |
| Advanced Energy Industries, Inc. | (7,000) | (729,260) | (9,828) | (0.02) | Common Stock | |
| Akamai Technologies, Inc. | (34,500) | (4,251,435) | (156,381) | (0.24) | Common Stock | |
| Alphatec Holdings, Inc. | (95,000) | (1,528,550) | (96,058) | (0.15) | Common Stock | |
| Ares Capital Corp. | (100,000) | (2,023,000) | (2,040) | 0.00 | Common Stock | |
| Assertio Holdings, Inc. | (61,000) | (53,838) | 2,223 | 0.00 | Common Stock | |
| Carnival Corp. | (142,500) | (2,362,650) | 68,779 | 0.11 | Common Stock | |
| Cinemark Holdings, Inc. | (47,000) | (650,010) | (19,002) | (0.03) | Common Stock | |
| Enovis Corp. | (52,000) | (3,052,400) | (21,759) | (0.03) | Common Stock | |
| Etsy, Inc. | (24,000) | (1,597,440) | 34,323 | 0.05 | Common Stock | |
| Evolent Health, Inc. Class A | (38,500) | (1,132,285) | 64,661 | 0.10 | Common Stock | |
| Five9, Inc. | (2,700) | (204,822) | 338 | 0.00 | Common Stock | |
| Freshpet, Inc. | (36,000) | (3,099,600) | (12,090) | (0.02) | Common Stock | |
| Granite Construction, Inc. | (24,500) | (1,105,195) | 32,066 | 0.05 | Common Stock | |
| HubSpot, Inc. | (8,500) | (5,193,500) | (376,509) | (0.58) | Common Stock | |
| Insight Enterprises, Inc. | (36,500) | (6,743,010) | (63,499) | (0.10) | Common Stock | |
| Insmed, Inc. | (100,000) | (2,780,000) | 64,109 | 0.10 | Common Stock | |
| Ironwood Pharmaceuticals, Inc. Class A | (82,000) | (1,163,580) | (199,053) | (0.31) | Common Stock | |
| MannKind Corp. | (200,000) | (668,000) | (722) | 0.00 | Common Stock | |
| Marriott Vacations Worldwide Corp. | (7,900) | (662,731) | (1,182) | 0.00 | Common Stock | |
| Merit Medical Systems, Inc. | (20,000) | (1,566,000) | (3,008) | 0.00 | Common Stock | |
| MicroStrategy, Inc. Class A | (3,000) | (1,503,630) | (54,697) | (0.08) | Common Stock | |
| Middleby Corp. | (20,000) | (2,821,400) | (38,072) | (0.06) | Common Stock | |
| Mirum Pharmaceuticals, Inc. | (52,700) | (1,394,442) | 16,402 | 0.03 | Common Stock | |
| MongoDB, Inc. Class A | (16,500) | (6,608,580) | 94,009 | 0.14 | Common Stock | |
| Natera, Inc. | (11,250) | (741,825) | (32,730) | (0.05) | Common Stock | |
| NICE Ltd. sponsored ADR | (1,750) | (364,175) | (3,492) | (0.01) | Common Stock | |
| Pacira Biosciences, Inc. | (5,000) | (162,950) | (989) | 0.00 | Common Stock | |
| Palo Alto Networks, Inc. | (37,750) | (12,778,752) | (219,825) | (0.34) | Common Stock | |
| PetIQ, Inc. Class A | (38,200) | (686,454) | 10,502 | 0.02 | Common Stock | |
| Repligen Corp. | (15,000) | (2,841,000) | (244,630) | (0.38) | Common Stock | |
| Rivian Automotive, Inc. | (55,000) | (842,050) | 145,421 | 0.22 | Common Stock | |
| Royal Caribbean Cruises Ltd. | (94,100) | (11,997,750) | (420,109) | (0.65) | Common Stock | |
| Shockwave Medical, Inc. | (8,000) | (1,810,000) | (69,308) | (0.11) | Common Stock | |
| Stride, Inc. | (29,900) | (3,608,990) | 75,157 | 0.12 | Common Stock | |
| Topgolf Callaway Brands Corp. | (97,500) | (1,284,075) | 88,427 | 0.14 | Common Stock | |
| TransMedics Group, Inc. | (30,000) | (2,573,100) | (188,193) | (0.29) | Common Stock | |
| Travere Therapeutics, Inc. | (37,500) | (334,875) | (484) | 0.00 | Common Stock | |
| Varonis Systems, Inc. | (101,300) | (4,546,344) | 115,287 | 0.18 | Common Stock | |
| Vishay Intertechnology, Inc. | (73,600) | (1,599,328) | 44,362 | 0.07 | Common Stock | |
| Wayfair LLC Class A | (5,500) | (276,375) | 8,740 | 0.01 | Common Stock | |
| Western Digital Corp. | (22,500) | (1,288,125) | (110,696) | (0.17) | Common Stock | |
| Workiva, Inc. | (10,000) | (929,400) | 26,529 | 0.04 | Common Stock | |
| Ziff Davis, Inc. | (18,700) | (1,260,380) | (35,054) | (0.05) | Common Stock | |
| Zillow Group, Inc. Class C | (70,000) | (3,978,800) | (286,911) | (0.44) | Common Stock | |
| Zscaler, Inc. | (15,500) | (3,652,885) | (47,193) | (0.07) | Common Stock | |
| Akamai Technologies, Inc. 0.125% 5/1/25 | 2,000,000 | 2,632,625 | 82,747 | 0.13 | Convertible Corporate Bond | |
| Alphatec Holdings, Inc. 0.75% 8/1/26 | 2,680,000 | 2,923,880 | 77,814 | 0.12 | Convertible Corporate Bond | |
| Ares Capital Corp. 4.625% 3/1/24 | 2,500,000 | 2,651,302 | (12,541) | (0.02) | Convertible Corporate Bond | |
| Assertio Holdings, Inc. 6.5% 9/1/27 | 500,000 | 388,406 | (120,800) | (0.19) | Convertible Corporate Bond | |
| Carnival Corp. 5.75% 10/1/24 | 1,500,000 | 2,590,000 | (70,442) | (0.11) | Convertible Corporate Bond | |
| Cinemark Holdings, Inc. 4.5% 8/15/25 | 1,000,000 | 1,208,250 | 6,633 | 0.01 | Convertible Corporate Bond | |
| Etsy, Inc. 0.125% 10/1/26 | 1,500,000 | 1,565,875 | (21,186) | (0.03) | Convertible Corporate Bond | |
| Five9, Inc. 0.5% 6/1/25 | 1,500,000 | 1,433,749 | (12,546) | (0.02) | Convertible Corporate Bond | |
| Freshpet, Inc. 3% 4/1/28 | 3,000,000 | 4,302,000 | (6,148) | (0.01) | Convertible Corporate Bond | |
| HubSpot, Inc. 0.375% 6/1/25 | 2,500,000 | 5,451,562 | 368,910 | 0.57 | Convertible Corporate Bond | |
| Insight Enterprises, Inc. 0.75% 2/15/25 | 2,500,000 | 6,772,395 | 50,074 | 0.08 | Convertible Corporate Bond | |
| Insmed, Inc. 0.75% 6/1/28 | 3,500,000 | 3,800,125 | (63,116) | (0.10) | Convertible Corporate Bond | |
| MannKind Corp. 2.5% 3/1/26 | 1,500,000 | 1,505,275 | (15,731) | (0.02) | Convertible Corporate Bond | |
| Marriott Vacations Worldwide Corp. 0% 1/15/26 | 4,000,000 | 3,537,600 | (6,806) | (0.01) | Convertible Corporate Bond | |
| Merit Medical Systems, Inc. 3% 2/1/29 | 2,500,000 | 2,813,541 | (16,762) | (0.03) | Convertible Corporate Bond | |
| MicroStrategy, Inc. 0.75% 12/15/25 | 1,500,000 | 2,111,787 | 58,233 | 0.09 | Convertible Corporate Bond | |
| Mirum Pharmaceuticals, Inc. 4% 5/1/29 | 2,000,000 | 2,304,000 | (27,329) | (0.04) | Convertible Corporate Bond | |
| MongoDB, Inc. 0.25% 1/15/26 | 3,685,000 | 7,117,986 | (135,101) | (0.21) | Convertible Corporate Bond | |
| Natera, Inc. 2.25% 5/1/27 | 500,000 | 897,500 | 37,837 | 0.06 | Convertible Corporate Bond | |
| NICE Ltd. 0% 9/15/25 | 1,693,000 | 1,621,894 | (2,240) | 0.00 | Convertible Corporate Bond | |
| Palo Alto Networks, Inc. 0.375% 6/1/25 | 3,750,000 | 12,752,607 | 198,597 | 0.30 | Convertible Corporate Bond | |
| PetIQ, Inc. 4% 6/1/26 | 2,266,000 | 2,225,816 | (32,376) | (0.05) | Convertible Corporate Bond | |
| Repligen Corp. 1% 12/15/28 | 4,000,000 | 4,635,222 | 219,769 | 0.34 | Convertible Corporate Bond | |
| Royal Caribbean Cruises Ltd. 6% 8/15/25 | 2,000,000 | 5,276,397 | 148,493 | 0.23 | Convertible Corporate Bond | |
| Shockwave Medical, Inc. 1% 8/15/28 | 3,500,000 | 3,684,138 | 52,388 | 0.08 | Convertible Corporate Bond | |
| Stride, Inc. 1.125% 9/1/27 | 2,000,000 | 5,138,875 | (86,736) | (0.13) | Convertible Corporate Bond | |
| Topgolf Callaway Brands Corp. 2.75% 5/1/26 | 3,000,000 | 3,101,625 | (114,149) | (0.18) | Convertible Corporate Bond | |
| TransMedics Group, Inc. 1.5% 6/1/28 | 3,500,000 | 4,165,000 | 138,334 | 0.21 | Convertible Corporate Bond | |
| Travere Therapeutics, Inc. 2.25% 3/1/29 | 1,500,000 | 1,011,562 | (2,394) | 0.00 | Convertible Corporate Bond | |
| Vishay Intertechnology, Inc. 2.25% 9/15/30 | 3,000,000 | 2,844,262 | (31,050) | (0.05) | Convertible Corporate Bond | |
| Wayfair LLC 1% 8/15/26 | 1,500,000 | 1,296,916 | 6,673 | 0.01 | Convertible Corporate Bond | |
| Western Digital Corp. 3% 11/15/28 | 1,500,000 | 1,956,499 | 109,429 | 0.17 | Convertible Corporate Bond | |
| Workiva, Inc. 1.125% 8/15/26 | 1,000,000 | 1,293,687 | (35,547) | (0.05) | Convertible Corporate Bond | |
| Ziff Davis, Inc. 1.75% 11/1/26 | 5,000,000 | 4,734,375 | 7,680 | 0.01 | Convertible Corporate Bond | |
| Zillow Group, Inc. 0.75% 9/1/24 | 4,000,000 | 5,394,478 | 373,472 | 0.57 | Convertible Corporate Bond | |
| Zscaler, Inc. 0.125% 7/1/25 | 2,808,000 | 4,488,880 | 46,875 | 0.07 | Convertible Corporate Bond | |
For the period, the average monthly notional amount at value for swaps in the aggregate was $214,465,750.
Legend
| (a) | Amount is stated in United States dollars unless otherwise noted. |
| (b) | Security exempt from registration under Rule 144A of the Securities Act of 1933. These securities may be resold in transactions exempt from registration, normally to qualified institutional buyers. At the end of the period, the value of these securities amounted to $11,809,550 or 7.7% of net assets. |
| (c) | Security or a portion of the security was pledged to cover margin requirements for futures contracts. At period end, the value of securities pledged amounted to $109,323. |
| (d) | Security or a portion of the security has been segregated as collateral for open bi-lateral over the counter (OTC) swaps. At period end, the value of securities pledged amounted to $29,946,593. |
| (e) | Affiliated fund that is generally available only to investment companies and other accounts managed by Fidelity Investments. The rate quoted is the annualized seven-day yield of the fund at period end. A complete unaudited listing of the fund's holdings as of its most recent quarter end is available upon request. In addition, each Fidelity Central Fund's financial statements, which are not covered by the Fund's Report of Independent Registered Public Accounting Firm, are available on the SEC's website or upon request. |
Affiliated Central Funds
Fiscal year to date information regarding the Fund's investments in Fidelity Central Funds, including the ownership percentage, is presented below.
| Affiliate | Value, beginning of period ($) | Purchases ($) | Sales Proceeds ($) | Dividend Income ($) | Realized Gain (loss) ($) | Change in Unrealized appreciation (depreciation) ($) | Value, end of period ($) | % ownership, end of period |
| Fidelity Cash Central Fund 5.39% | - | 166,060,864 | 160,950,770 | 180,318 | - | - | 5,110,094 | 0.0% |
| Total | - | 166,060,864 | 160,950,770 | 180,318 | - | - | 5,110,094 | |
Amounts in the dividend income column in the above table include any capital gain distributions from underlying funds, which are presented in the corresponding line item in the Statement of Operations, if applicable.
Amounts included in the purchases and sales proceeds columns may include in-kind transactions, if applicable.
Investment Valuation
The following is a summary of the inputs used, as of January 31, 2024, involving the Fund's assets and liabilities carried at fair value. The inputs or methodology used for valuing securities may not be an indication of the risk associated with investing in those securities. For more information on valuation inputs, and their aggregation into the levels used below, please refer to the Investment Valuation section in the accompanying Notes to Financial Statements.
| Valuation Inputs at Reporting Date: | ||||
| Description | Total ($) | Level 1 ($) | Level 2 ($) | Level 3 ($) |
Investments in Securities: | ||||
| Corporate Bonds | 48,517,548 | - | 48,517,548 | - |
| U.S. Government and Government Agency Obligations | 99,631,283 | - | 99,631,283 | - |
| Money Market Funds | 5,110,094 | 5,110,094 | - | - |
| Total Investments in Securities: | 153,258,925 | 5,110,094 | 148,148,831 | - |
Derivative Instruments: Liabilities | ||||
Futures Contracts | (147,114) | (147,114) | - | - |
Swaps | (877,359) | - | (877,359) | - |
| Total Liabilities | (1,024,473) | (147,114) | (877,359) | - |
| Total Derivative Instruments: | (1,024,473) | (147,114) | (877,359) | - |
Value of Derivative Instruments
The following table is a summary of the Fund's value of derivative instruments by primary risk exposure as of January 31, 2024. For additional information on derivative instruments, please refer to the Derivative Instruments section in the accompanying Notes to Financial Statements.
Primary Risk Exposure / Derivative Type | Value | |
| Asset ($) | Liability ($) | |
| Interest Rate Risk | ||
Futures Contracts (a) | 0 | (147,114) |
| Total Interest Rate Risk | 0 | (147,114) |
| Equity Risk | ||
Swaps (b) | 0 | (877,359) |
| Total Equity Risk | 0 | (877,359) |
| Total Value of Derivatives | 0 | (1,024,473) |
(a)Reflects gross cumulative appreciation (depreciation) on futures contracts as presented in the Schedule of Investments. In the Statement of Assets and Liabilities, the period end daily variation margin is included in receivable or payable for daily variation margin on futures contracts, and the net cumulative appreciation (depreciation) is included in Total accumulated earnings (loss).
(b)For bi-lateral over-the-counter (OTC) swaps, reflects gross value which is presented in the Statement of Assets and Liabilities in the bi-lateral OTC swaps, at value line-items.
| Statement of Assets and Liabilities | ||||
| January 31, 2024 | ||||
| Assets | ||||
| Investment in securities, at value - See accompanying schedule: | ||||
Unaffiliated issuers (cost $145,371,326) | $ | 148,148,831 | ||
Fidelity Central Funds (cost $5,110,094) | 5,110,094 | |||
| Total Investment in Securities (cost $150,481,420) | $ | 153,258,925 | ||
| Cash | 11,696 | |||
| Receivable for investments sold | 273,000 | |||
| Interest receivable | 287,655 | |||
| Distributions receivable from Fidelity Central Funds | 17,752 | |||
| Prepaid expenses | 24,521 | |||
| Receivable from investment adviser for expense reductions | 18,469 | |||
Total assets | 153,892,018 | |||
| Liabilities | ||||
| Payable for investments purchased | $ | 260,000 | ||
| Bi-lateral OTC swaps, at value | 877,359 | |||
| Accrued management fee | 177,371 | |||
| Payable for daily variation margin on futures contracts | 39,008 | |||
| Other affiliated payables | 3,562 | |||
| Audit fee payable | 79,509 | |||
| Other payables and accrued expenses | 23,235 | |||
| Total Liabilities | 1,460,044 | |||
| Net Assets | $ | 152,431,974 | ||
| Net Assets consist of: | ||||
| Paid in capital | $ | 150,608,601 | ||
| Total accumulated earnings (loss) | 1,823,373 | |||
| Net Assets | $ | 152,431,974 | ||
Net Asset Value, offering price and redemption price per share ($152,431,974 ÷ 15,030,651 shares) | $ | 10.14 | ||
| Statement of Operations | ||||
| For the period September 12, 2023 (commencement of operations) through January 31, 2024 | ||||
| Investment Income | ||||
| Interest | $ | 1,835,703 | ||
| Income from Fidelity Central Funds | 180,318 | |||
| Total Income | 2,016,021 | |||
| Expenses | ||||
| Management fee | $ | 587,466 | ||
| Custodian fees and expenses | 1,007 | |||
| Independent trustees' fees and expenses | 12,562 | |||
| Registration fees | 34,291 | |||
| Audit | 84,177 | |||
| Legal | 1,460 | |||
| Miscellaneous | 2,747 | |||
| Total expenses before reductions | 723,710 | |||
| Expense reductions | (123,120) | |||
| Total expenses after reductions | 600,590 | |||
| Net Investment income (loss) | 1,415,431 | |||
| Realized and Unrealized Gain (Loss) | ||||
| Net realized gain (loss) on: | ||||
| Investment Securities: | ||||
| Unaffiliated issuers | 1,119,344 | |||
| Futures contracts | 879 | |||
| Swaps | (1,850,993) | |||
| Total net realized gain (loss) | (730,770) | |||
| Change in net unrealized appreciation (depreciation) on: | ||||
| Investment Securities: | ||||
| Unaffiliated issuers | 2,777,505 | |||
| Futures contracts | (147,114) | |||
| Swaps | (877,359) | |||
| Total change in net unrealized appreciation (depreciation) | 1,753,032 | |||
| Net gain (loss) | 1,022,262 | |||
| Net increase (decrease) in net assets resulting from operations | $ | 2,437,693 | ||
| Statement of Changes in Net Assets | ||
| For the period September 12, 2023 (commencement of operations) through January 31, 2024 | ||
| Increase (Decrease) in Net Assets | ||
| Operations | ||
| Net investment income (loss) | $ | 1,415,431 |
| Net realized gain (loss) | (730,770) | |
| Change in net unrealized appreciation (depreciation) | 1,753,032 | |
| Net increase (decrease) in net assets resulting from operations | 2,437,693 | |
| Distributions to shareholders | (614,320) | |
| Share transactions | ||
| Proceeds from sales of shares | 155,010,150 | |
| Reinvestment of distributions | 614,320 | |
| Cost of shares redeemed | (5,015,869) | |
Net increase (decrease) in net assets resulting from share transactions | 150,608,601 | |
| Total increase (decrease) in net assets | 152,431,974 | |
| Net Assets | ||
| Beginning of period | - | |
| End of period | $ | 152,431,974 |
| Other Information | ||
| Shares | ||
| Sold | 15,469,713 | |
| Issued in reinvestment of distributions | 60,955 | |
| Redeemed | (500,017) | |
| Net increase (decrease) | 15,030,651 | |
Financial Highlights
| Fidelity® SAI Convertible Arbitrage Fund |
| Years ended January 31, | 2024 A | |
Selected Per-Share Data | ||
| Net asset value, beginning of period | $ | 10.00 |
| Income from Investment Operations | ||
Net investment income (loss) B,C | .13 | |
| Net realized and unrealized gain (loss) | .05 | |
| Total from investment operations | .18 | |
| Distributions from net investment income | (.04) | |
| Distributions from net realized gain | (.01) | |
| Total distributions | (.04) D | |
| Net asset value, end of period | $ | 10.14 |
Total Return E,F | 1.81% | |
Ratios to Average Net Assets C,G,H | ||
| Expenses before reductions | 1.61% I,J | |
| Expenses net of fee waivers, if any | 1.45% J | |
| Expenses net of all reductions | 1.45% J | |
| Net investment income (loss) | 3.39% J | |
| Supplemental Data | ||
| Net assets, end of period (000 omitted) | $ | 152,432 |
Portfolio turnover rate K | 71% L |
AFor the period September 12, 2023 (commencement of operations) through January 31, 2024.
BCalculated based on average shares outstanding during the period.
CNet investment income (loss) is affected by the timing of the declaration of dividends by any underlying mutual funds or exchange-traded funds (ETFs). Net investment income (loss) of any mutual funds or ETFs is not included in the Fund's net investment income (loss) ratio.
DTotal distributions per share do not sum due to rounding.
ETotal returns for periods of less than one year are not annualized.
FTotal returns would have been lower if certain expenses had not been reduced during the applicable periods shown.
GFees and expenses of any underlying mutual funds or exchange-traded funds (ETFs) are not included in the Fund's expense ratio. The Fund indirectly bears its proportionate share of these expenses. For additional expense information related to investments in Fidelity Central Funds, please refer to the "Investments in Fidelity Central Funds" note found in the Notes to Financial Statements section of the most recent Annual or Semi-Annual report.
HExpense ratios reflect operating expenses of the class. Expenses before reductions do not reflect amounts reimbursed, waived, or reduced through arrangements with the investment adviser, brokerage services, or other offset arrangements, if applicable, and do not represent the amount paid by the class during periods when reimbursements, waivers or reductions occur.
IAudit fees are not annualized.
JAnnualized.
KAmount does not include the portfolio activity of any underlying mutual funds or exchange-traded funds (ETFs).
LAmount not annualized.
For the period ended January 31, 2024
1. Organization.
Fidelity SAI Convertible Arbitrage Fund (the Fund) is a non-diversified fund of Fidelity Greenwood Street Trust (the Trust) and is authorized to issue an unlimited number of shares. Shares are offered exclusively to certain clients of Fidelity Management & Research Company LLC (FMR) or its affiliates. The Trust is registered under the Investment Company Act of 1940, as amended (the 1940 Act), as an open-end management investment company organized as a Delaware statutory trust.
2. Investments in Fidelity Central Funds.
Funds may invest in Fidelity Central Funds, which are open-end investment companies generally available only to other investment companies and accounts managed by the investment adviser and its affiliates. The Schedule of Investments lists any Fidelity Central Funds held as an investment as of period end, but does not include the underlying holdings of each Fidelity Central Fund. An investing fund indirectly bears its proportionate share of the expenses of the underlying Fidelity Central Funds.
Based on its investment objective, each Fidelity Central Fund may invest or participate in various investment vehicles or strategies that are similar to those of the investing fund. These strategies are consistent with the investment objectives of the investing fund and may involve certain economic risks which may cause a decline in value of each of the Fidelity Central Funds and thus a decline in the value of the investing fund.
| Fidelity Central Fund | Investment Manager | Investment Objective | Investment Practices | Expense RatioA |
| Fidelity Money Market Central Funds | Fidelity Management & Research Company LLC (FMR) | Each fund seeks to obtain a high level of current income consistent with the preservation of capital and liquidity. | Short-term Investments | Less than .005% |
A Expenses expressed as a percentage of average net assets and are as of each underlying Central Fund's most recent annual or semi-annual shareholder report.
A complete unaudited list of holdings for each Fidelity Central Fund is available upon request or at the Securities and Exchange Commission website at www.sec.gov. In addition, the financial statements of the Fidelity Central Funds which contain the significant accounting policies (including investment valuation policies) of those funds, and are not covered by the Report of Independent Registered Public Accounting Firm, are available on the Securities and Exchange Commission website or upon request.
3. Significant Accounting Policies.
The Fund is an investment company and applies the accounting and reporting guidance of the Financial Accounting Standards Board (FASB) Accounting Standards Codification Topic 946 Financial Services - Investment Companies. The financial statements have been prepared in conformity with accounting principles generally accepted in the United States of America (GAAP), which require management to make certain estimates and assumptions at the date of the financial statements. Actual results could differ from those estimates. Subsequent events, if any, through the date that the financial statements were issued have been evaluated in the preparation of the financial statements. The Fund's Schedule of Investments lists any underlying mutual funds or exchange-traded funds (ETFs) but does not include the underlying holdings of these funds. The following summarizes the significant accounting policies of the Fund:
Investment Valuation. Investments are valued as of 4:00 p.m. Eastern time on the last calendar day of the period. The Board of Trustees (the Board) has designated the Fund's investment adviser as the valuation designee responsible for the fair valuation function and performing fair value determinations as needed. The investment adviser has established a Fair Value Committee (the Committee) to carry out the day-to-day fair valuation responsibilities and has adopted policies and procedures to govern the fair valuation process and the activities of the Committee. In accordance with these fair valuation policies and procedures, which have been approved by the Board, the Fund attempts to obtain prices from one or more third party pricing services or brokers to value its investments. When current market prices, quotations or currency exchange rates are not readily available or reliable, investments will be fair valued in good faith by the Committee, in accordance with the policies and procedures. Factors used in determining fair value vary by investment type and may include market or investment specific events, transaction data, estimated cash flows, and market observations of comparable investments. The frequency that the fair valuation procedures are used cannot be predicted and they may be utilized to a significant extent. The Committee manages the Fund's fair valuation practices and maintains the fair valuation policies and procedures. The Fund's investment adviser reports to the Board information regarding the fair valuation process and related material matters.
The Fund categorizes the inputs to valuation techniques used to value its investments into a disclosure hierarchy consisting of three levels as shown below:
Level 1 - unadjusted quoted prices in active markets for identical investments
Level 2 - other significant observable inputs (including quoted prices for similar investments, interest rates, prepayment speeds, etc.)
Level 3 - unobservable inputs (including the Fund's own assumptions based on the best information available)
Valuation techniques used to value the Fund's investments by major category are as follows:
Debt securities, including restricted securities, are valued based on evaluated prices received from third party pricing services or from brokers who make markets in such securities. Corporate bonds and U.S. government and government agency obligations are valued by pricing services who utilize matrix pricing which considers yield or price of bonds of comparable quality, coupon, maturity and type or by broker-supplied prices. Swaps are marked-to-market daily based on valuations from third party pricing services, registered derivatives clearing organizations (clearinghouses) or broker-supplied valuations. These pricing sources may utilize inputs such as interest rate curves, credit spread curves, default possibilities and recovery rates. When independent prices are unavailable or unreliable, debt securities and swaps may be valued utilizing pricing methodologies which consider similar factors that would be used by third party pricing services. Debt securities and swaps are generally categorized as Level 2 in the hierarchy but may be Level 3 depending on the circumstances.
Futures contracts are valued at the settlement price established each day by the board of trade or exchange on which they are traded and are categorized as Level 1 in the hierarchy. Investments in open-end mutual funds, including the Fidelity Central Funds, are valued at their closing net asset value (NAV) each business day and are categorized as Level 1 in the hierarchy.
Changes in valuation techniques may result in transfers in or out of an assigned level within the disclosure hierarchy. The aggregate value of investments by input level as of January 31, 2024 is included at the end of the Fund's Schedule of Investments.
Investment Transactions and Income. For financial reporting purposes, the Fund's investment holdings and NAV include trades executed through the end of the last business day of the period. The NAV per share for processing shareholder transactions is calculated as of the close of business of the New York Stock Exchange (NYSE), normally 4:00 p.m. Eastern time and includes trades executed through the end of the prior business day. Gains and losses on securities sold are determined on the basis of identified cost. Income and capital gain distributions from Fidelity Central Funds, if any, are recorded on the ex-dividend date. Interest income is accrued as earned and includes coupon interest and amortization of premium and accretion of discount on debt securities as applicable.
Expenses. Expenses directly attributable to a fund are charged to that fund. Expenses attributable to more than one fund are allocated among the respective funds on the basis of relative net assets or other appropriate methods. Expenses included in the accompanying financial statements reflect the expenses of that fund and do not include any expenses associated with any underlying mutual funds or exchange-traded funds. Although not included in a fund's expenses, a fund indirectly bears its proportionate share of these expenses through the net asset value of each underlying mutual fund or exchange-traded fund. Expense estimates are accrued in the period to which they relate and adjustments are made when actual amounts are known.
Income Tax Information and Distributions to Shareholders. Each year, the Fund intends to qualify as a regulated investment company under Subchapter M of the Internal Revenue Code, including distributing substantially all of its taxable income and realized gains. As a result, no provision for U.S. Federal income taxes is required. As of January 31, 2024, the Fund did not have any unrecognized tax benefits in the financial statements; nor is the Fund aware of any tax positions for which it is reasonably possible that the total amounts of unrecognized tax benefits will significantly change in the next twelve months. The Fund files a U.S. federal tax return, in addition to state and local tax returns as required. The Fund's federal income tax returns are subject to examination by the Internal Revenue Service (IRS) for a period of three fiscal years after they are filed. State and local tax returns may be subject to examination for an additional fiscal year depending on the jurisdiction.
Distributions are declared and recorded on the ex-dividend date. Income and capital gain distributions are determined in accordance with income tax regulations, which may differ from GAAP.
Capital accounts within the financial statements are adjusted for permanent book-tax differences. These adjustments have no impact on net assets or the results of operations. Capital accounts are not adjusted for temporary book-tax differences which will reverse in a subsequent period.
Book-tax differences are primarily due to swaps and certain mark to market elections.
As of period end, the cost and unrealized appreciation (depreciation) in securities, and derivatives if applicable, for federal income tax purposes were as follows:
| Gross unrealized appreciation | $1,507,825 |
| Gross unrealized depreciation | (1,507,825) |
| Net unrealized appreciation (depreciation) | $- |
| Tax Cost | $153,258,925 |
The tax-based components of distributable earnings as of period end were as follows:
| Undistributed ordinary income | $1,823,372 |
The tax character of distributions paid was as follows:
January 31, 2024A | |
| Ordinary Income | $569,411 |
| Long-term Capital Gains | 44,909 |
| Total | $614,320 |
A For the period September 12, 2023 (commencement of operations) through January 31, 2024.
Restricted Securities (including Private Placements). Funds may invest in securities that are subject to legal or contractual restrictions on resale. These securities generally may be resold in transactions exempt from registration or to the public if the securities are registered. Disposal of these securities may involve time-consuming negotiations and expense, and prompt sale at an acceptable price may be difficult. Information regarding restricted securities held at period end is included at the end of the Schedule of Investments, if applicable.
4. Derivative Instruments.
Risk Exposures and the Use of Derivative Instruments. The Fund's investment objectives allow for various types of derivative instruments, including futures contracts and swaps. Derivatives are investments whose value is primarily derived from underlying assets, indices or reference rates and may be transacted on an exchange or over-the-counter (OTC). Derivatives may involve a future commitment to buy or sell a specified asset based on specified terms, to exchange future cash flows at periodic intervals based on a notional principal amount, or for one party to make one or more payments upon the occurrence of specified events in exchange for periodic payments from the other party.
Derivatives were used to increase returns, to gain exposure to certain types of assets and to manage exposure to certain risks as defined below. The success of any strategy involving derivatives depends on analysis of numerous economic factors, and if the strategies for investment do not work as intended, the objectives may not be achieved.
Derivatives were used to increase or decrease exposure to the following risk(s):
| Equity Risk | Equity risk relates to the fluctuations in the value of financial instruments as a result of changes in market prices (other than those arising from interest rate risk or foreign exchange risk), whether caused by factors specific to an individual investment, its issuer, or all factors affecting all instruments traded in a market or market segment. |
| Interest Rate Risk | Interest rate risk relates to the fluctuations in the value of interest-bearing securities due to changes in the prevailing levels of market interest rates. |
Funds are also exposed to additional risks from investing in derivatives, such as liquidity risk and counterparty credit risk. Liquidity risk is the risk that a fund will be unable to close out the derivative in the open market in a timely manner. Counterparty credit risk is the risk that the counterparty will not be able to fulfill its obligation to a fund. Derivative counterparty credit risk is managed through formal evaluation of the creditworthiness of all potential counterparties. On certain OTC derivatives such as bi-lateral swaps, a fund attempts to reduce its exposure to counterparty credit risk by entering into an International Swaps and Derivatives Association, Inc. (ISDA) Master Agreement with each of its counterparties. The ISDA Master Agreement gives a fund the right to terminate all transactions traded under such agreement upon the deterioration in the credit quality of the counterparty beyond specified levels. The ISDA Master Agreement gives each party the right, upon an event of default by the other party or a termination of the agreement, to close out all transactions traded under such agreement and to net amounts owed under each transaction to one net payable by one party to the other. To mitigate counterparty credit risk on bi-lateral OTC derivatives, a fund receives collateral in the form of cash or securities once net unrealized appreciation on outstanding derivative contracts under an ISDA Master Agreement exceeds certain applicable thresholds, subject to certain minimum transfer provisions. The collateral received is held in segregated accounts with the custodian bank in accordance with the collateral agreements entered into between a fund, the counterparty and the custodian bank. A fund could experience delays and costs in gaining access to the collateral even though it is held by the custodian bank. The maximum risk of loss to a fund from counterparty credit risk related to bi-lateral OTC derivatives is generally the aggregate unrealized appreciation and unpaid counterparty payments in excess of any collateral pledged by the counterparty to a fund. A fund may be required to pledge collateral for the benefit of the counterparties on bi-lateral OTC derivatives in an amount not less than each counterparty's unrealized appreciation on outstanding derivative contracts, subject to certain minimum transfer provisions, and any such pledged collateral is identified in the Schedule of Investments. Exchange-traded contracts are not covered by the ISDA Master Agreement; however counterparty credit risk related to these contracts may be mitigated by the protection provided by the exchange on which they trade.
Investing in derivatives may involve greater risks than investing in the underlying assets directly and, to varying degrees, may involve risk of loss in excess of any initial investment and collateral received and amounts recognized in the Statement of Assets and Liabilities. In addition, there may be the risk that the change in value of the derivative contract does not correspond to the change in value of the underlying instrument.
Net Realized Gain (Loss) and Change in Net Unrealized Appreciation (Depreciation) on Derivatives. The table below, which reflects the impacts of derivatives on the financial performance, summarizes the net realized gain (loss) and change in net unrealized appreciation (depreciation) for derivatives during the period as presented in the Statement of Operations.
| Primary Risk Exposure / Derivative Type | Net Realized Gain (Loss)($) | Change in Net Unrealized Appreciation (Depreciation)($) |
| Fidelity SAI Convertible Arbitrage Fund | ||
| Equity Risk | ||
| Swaps | (1,850,993) | (877,359) |
| Total Equity Risk | (1,850,993) | (877,359) |
| Interest Rate Risk | ||
| Futures Contracts | 879 | (147,114) |
| Total Interest Rate Risk | 879 | (147,114) |
| Totals | (1,850,114) | (1,024,473) |
If there are any open positions at period end, a summary of the value of derivatives by primary risk exposure is included at the end of the Schedule of Investments.
Futures Contracts. A futures contract is an agreement between two parties to buy or sell a specified underlying instrument for a fixed price at a specified future date. Futures contracts were used to manage exposure to the bond market and fluctuations in interest rates.
Upon entering into a futures contract, a fund is required to deposit either cash or securities (initial margin) with a clearing broker in an amount equal to a certain percentage of the face value of the contract. Futures contracts are marked-to-market daily and subsequent daily payments are made or received by a fund depending on the daily fluctuations in the value of the futures contracts and are recorded as unrealized appreciation or (depreciation). This receivable and/or payable, if any, is included in daily variation margin on futures contracts in the Statement of Assets and Liabilities. Realized gain or (loss) is recorded upon the expiration or closing of a futures contract. The net realized gain (loss) and change in net unrealized appreciation (depreciation) on futures contracts during the period is presented in the Statement of Operations.
Any open futures contracts at period end are presented in the Schedule of Investments under the caption "Futures Contracts". The notional amount at value reflects each contract's exposure to the underlying instrument or index at period end, and is representative of volume of activity during the period unless an average notional amount is presented. Any securities deposited to meet initial margin requirements are identified in the Schedule of Investments. Any cash deposited to meet initial margin requirements is presented as segregated cash with brokers for derivative instruments in the Statement of Assets and Liabilities.
Swaps. A swap is a contract between two parties to exchange future cash flows at periodic intervals based on a notional principal amount. A bi-lateral OTC swap is a transaction between a fund and a dealer counterparty where cash flows are exchanged between the two parties for the life of the swap.
Bi-lateral OTC swaps are marked-to-market daily and changes in value are reflected in the Statement of Assets and Liabilities in the bi-lateral OTC swaps at value line items. Any upfront premiums paid or received upon entering a bi-lateral OTC swap to compensate for differences between stated terms of the swap and prevailing market conditions (e.g. credit spreads, interest rates or other factors) are recorded in total accumulated earnings (loss) in the Statement of Assets and Liabilities and amortized to realized gain or (loss) ratably over the term of the swap. Any unamortized upfront premiums are presented in the Schedule of Investments.
Payments are exchanged at specified intervals, accrued daily commencing with the effective date of the contract and recorded as realized gain or (loss). Some swaps may be terminated prior to the effective date and realize a gain or loss upon termination. The net realized gain (loss) and change in net unrealized appreciation (depreciation) on swaps during the period is presented in the Statement of Operations.
Any open swaps at period end are included in the Schedule of Investments under the caption "Swaps", and are representative of volume of activity during the period unless an average notional amount is presented.
Total Return Swaps. Total return swaps are agreements between counterparties to exchange cash flows, one based on a market-linked return of an individual asset or a basket of assets (i.e., an index), and the other on a fixed or floating rate. To the extent the total return of the instrument or index underlying the transaction exceeds or falls short of the offsetting payment obligation, a fund will receive a payment from or make a payment to the counterparty. A fund enters into total return swaps to manage its market exposure.
5. Purchases and Sales of Investments.
Purchases and sales of securities, other than short-term securities, U.S. government securities and in-kind transactions, as applicable, are noted in the table below.
| Purchases ($) | Sales ($) | |
| Fidelity SAI Convertible Arbitrage Fund | 55,320,697 | 19,896,537 |
6. Fees and Other Transactions with Affiliates.
Management Fee. Fidelity Diversifying Solutions LLC (the investment adviser) and its affiliates provide the Fund with investment management related services for which the Fund pays a monthly management fee that is based on an annual rate of 1.40% of the Fund's average net assets.
Interfund Trades. Funds may purchase from or sell securities to other Fidelity Funds under procedures adopted by the Board. The procedures have been designed to ensure these interfund trades are executed in accordance with Rule 17a-7 of the 1940 Act. Any interfund trades are included within the respective purchases and sales amounts shown in the Purchases and Sales of Investments note. During the period, there were no interfund trades.
7. Expense Reductions.
The investment adviser contractually agreed to reimburse the Fund to the extent annual operating expenses exceeded 1.45% of average net assets. This reimbursement will remain in place through May 31, 2025. Some expenses, for example certain miscellaneous expenses such as proxy and shareholder meeting expenses, are excluded from this reimbursement. During the period this reimbursement reduced the Fund's expenses by $123,120.
8. Other.
A fund's organizational documents provide former and current trustees and officers with a limited indemnification against liabilities arising in connection with the performance of their duties to the fund. In the normal course of business, a fund may also enter into contracts that provide general indemnifications. A fund's maximum exposure under these arrangements is unknown as this would be dependent on future claims that may be made against a fund. The risk of material loss from such claims is considered remote.
At the end of the period, the following mutual funds managed by the investment adviser or its affiliates were the owners of record of 10% or more of the total outstanding shares.
| Strategic Advisers Alternatives Fund | |
| Fidelity SAI Convertible Arbitrage Fund | 99% |
9. Risk and Uncertainties.
Many factors affect a fund's performance. Developments that disrupt global economies and financial markets, such as pandemics, epidemics, outbreaks of infectious diseases, war, terrorism, and environmental disasters, may significantly affect a fund's investment performance. The effects of these developments to a fund will be impacted by the types of securities in which a fund invests, the financial condition, industry, economic sector, and geographic location of an issuer, and a fund's level of investment in the securities of that issuer. Significant concentrations in security types, issuers, industries, sectors, and geographic locations may magnify the factors that affect a fund's performance.
To the Board of Trustees of Fidelity Greenwood Street Trust and the Shareholders of Fidelity SAI Convertible Arbitrage Fund:
Opinion on the Financial Statements and Financial Highlights
We have audited the accompanying statement of assets and liabilities of Fidelity SAI Convertible Arbitrage Fund (the "Fund"), a fund of Fidelity Greenwood Street Trust, including the schedule of investments, as of January 31, 2024, the related statement of operations, the statement of changes in net assets, and the financial highlights for the period from September 12, 2023 (commencement of operations) through January 31, 2024, and the related notes. In our opinion, the financial statements and financial highlights present fairly, in all material respects, the financial position of the Fund as of January 31, 2024, and the results of its operations, the changes in its net assets and the financial highlights for the period from September 12, 2023 (commencement of operations) through January 31, 2024, in conformity with accounting principles generally accepted in the United States of America.
Basis for Opinion
These financial statements and financial highlights are the responsibility of the Fund's management. Our responsibility is to express an opinion on the Fund's financial statements and financial highlights based on our audit. We are a public accounting firm registered with the Public Company Accounting Oversight Board (United States) (PCAOB) and are required to be independent with respect to the Fund in accordance with the U.S. federal securities laws and the applicable rules and regulations of the Securities and Exchange Commission and the PCAOB.
We conducted our audit in accordance with the standards of the PCAOB. Those standards require that we plan and perform the audit to obtain reasonable assurance about whether the financial statements and financial highlights are free of material misstatement, whether due to error or fraud. The Fund is not required to have, nor were we engaged to perform, an audit of its internal control over financial reporting. As part of our audit, we are required to obtain an understanding of internal control over financial reporting but not for the purpose of expressing an opinion on the effectiveness of the Fund's internal control over financial reporting. Accordingly, we express no such opinion.
Our audit included performing procedures to assess the risks of material misstatement of the financial statements and financial highlights, whether due to error or fraud, and performing procedures that respond to those risks. Such procedures included examining, on a test basis, evidence regarding the amounts and disclosures in the financial statements and financial highlights. Our audit also included evaluating the accounting principles used and significant estimates made by management, as well as evaluating the overall presentation of the financial statements and financial highlights. Our procedures included confirmation of securities owned as of January 31, 2024, by correspondence with the custodian and brokers; when replies were not received from brokers, we performed other auditing procedures. We believe that our audit provides a reasonable basis for our opinion.
/s/ Deloitte & Touche LLP
Boston, Massachusetts
March 18, 2024
We have served as the auditor of one or more of the Fidelity investment companies since 1999.
TRUSTEES AND OFFICERS
The Trustees, Members of the Advisory Board (if any), and officers of the trust and fund, as applicable, are listed below. The Board of Trustees governs the fund and is responsible for protecting the interests of shareholders. The Trustees are experienced executives who meet periodically throughout the year to oversee the fund's activities, review contractual arrangements with companies that provide services to the fund, oversee management of the risks associated with such activities and contractual arrangements, and review the fund's performance. Each of the Trustees oversees 10 funds.
The Trustees hold office without limit in time except that (a) any Trustee may resign; (b) any Trustee may be removed by written instrument, signed by at least two-thirds of the number of Trustees prior to such removal; (c) any Trustee who requests to be retired or who has become incapacitated by illness or injury may be retired by written instrument signed by a majority of the other Trustees; and (d) any Trustee may be removed at any special meeting of shareholders by a two-thirds vote of the outstanding voting securities of the trust. Each Trustee who is not an interested person (as defined in the 1940 Act) of the trust and the fund is referred to herein as an Independent Trustee. Each Independent Trustee shall retire not later than the last day of the calendar year in which his or her 75th birthday occurs. The Independent Trustees may waive this mandatory retirement age policy with respect to individual Trustees. Officers and Advisory Board Members hold office without limit in time, except that any officer or Advisory Board Member may resign or may be removed by a vote of a majority of the Trustees at any regular meeting or any special meeting of the Trustees. Except as indicated, each individual has held the office shown or other offices in the same company for the past five years.
The fund's Statement of Additional Information (SAI) includes more information about the Trustees. To request a free copy, call Fidelity at 1-800-544-3455.
Experience, Skills, Attributes, and Qualifications of the Trustees. The Board of Trustees has adopted a statement of policy that describes the experience, qualifications, attributes, and skills that are necessary and desirable for potential Independent Trustee candidates (Statement of Policy). The Board believes that each Trustee satisfied at the time he or she was initially elected or appointed a Trustee, and continues to satisfy, the standards contemplated by the Statement of Policy. The Board of Trustees also engages professional search firms to help identify potential Independent Trustee candidates who have the experience, qualifications, attributes, and skills consistent with the Statement of Policy. From time to time, additional criteria based on the composition and skills of the current Independent Trustees, as well as experience or skills that may be appropriate in light of future changes to board composition, business conditions, and regulatory or other developments, have also been considered by the professional search firms and the Board of Trustees. In addition, the Board takes into account the Trustees' commitment and participation in Board and committee meetings, as well as their leadership of standing and ad hoc committees throughout their tenure.
In determining that a particular Trustee was and continues to be qualified to serve as a Trustee, the Board has considered a variety of criteria, none of which, in isolation, was controlling. The Board believes that, collectively, the Trustees have balanced and diverse experience, qualifications, attributes, and skills, which allow the Board to operate effectively in governing the fund and protecting the interests of shareholders. Information about the specific experience, skills, attributes, and qualifications of each Trustee, which in each case led to the Board's conclusion that the Trustee should serve (or continue to serve) as a trustee of the fund, is provided below.
Board Structure and Oversight Function. David B. Jones is an interested person and currently serves as Chair. The Trustees have determined that an interested Chair is appropriate and benefits shareholders because an interested Chair has a personal and professional stake in the quality and continuity of services provided to the fund. Independent Trustees exercise their informed business judgment to appoint an individual of their choosing to serve as Chair, regardless of whether the Trustee happens to be independent or a member of management. The Independent Trustees have determined that they can act independently and effectively without having an Independent Trustee serve as Chair and that a key structural component for assuring that they are in a position to do so is for the Independent Trustees to constitute a substantial majority for the Board. The Independent Trustees also regularly meet in executive session.
Fidelity® funds are overseen by different Boards of Trustees. The fund's Board oversees Fidelity's alternative investment funds, and other Boards oversee Fidelity's investment-grade bond, money market, asset allocation, high income, and equity funds. The asset allocation funds may invest in Fidelity® funds overseen by the fund's Board. The use of separate Boards, each with its own committee structure, allows the Trustees of each group of Fidelity® funds to focus on the unique issues of the funds they oversee, including common research, investment, and operational issues. On occasion, the separate Boards establish joint committees to address issues of overlapping consequences for the Fidelity® funds overseen by each Board.
The Trustees primarily operate as a full Board, but have also established one standing committee, the Audit Committee, to facilitate the timely and efficient consideration of all matters of importance to the Trustees, the fund, and fund shareholders and to facilitate compliance with legal and regulatory requirements and oversight of the fund's activities and associated risks. The Board has charged Fidelity Diversifying Solutions LLC (FDS) and its affiliates with (i) identifying events or circumstances the occurrence of which could have demonstrably adverse effects on the fund's business and/or reputation; (ii) implementing processes and controls to lessen the possibility that such events or circumstances occur or to mitigate the effects of such events or circumstances if they do occur; and (iii) creating and maintaining a system designed to evaluate continuously business and market conditions in order to facilitate the identification and implementation processes described in (i) and (ii) above. Because the day-to-day operations and activities of the fund are carried out by or through FDS, its affiliates, and other service providers, the fund's exposure to risks is mitigated but not eliminated by the processes overseen by the Trustees. Board oversight of different aspects of the fund's activities is exercised primarily through the full Board, but also through the Audit Committee. Appropriate personnel, including but not limited to the fund's Chief Compliance Officer (CCO), FDS's internal auditor, the independent accountants, the fund's Treasurer and portfolio management personnel, make periodic reports to the Board and Audit Committee, as appropriate, including an annual review of Fidelity's risk management program for the Fidelity® funds. The responsibilities of the Audit Committee, including its oversight responsibilities, are described further under "Standing Committees of the Trustees."
Interested Trustees*:
Correspondence intended for a Trustee who is an interested person may be sent to Fidelity Investments, 245 Summer Street, Boston, Massachusetts 02210.
Name, Year of Birth; Principal Occupations and Other Relevant Experience+
David B. Jones (1962)
Year of Election or Appointment: 2021
Trustee
Chair of the Board of Trustees
Mr. Jones also serves as Trustee of other Fidelity® funds. Prior to his retirement, Mr. Jones served in a variety of positions at Fidelity Investments (1982-2008), retiring as a Senior Vice President. His duties included new product development, serving as a liaison to the board of trustees of various Fidelity® funds, and development of policies and procedures for fund investments in derivatives and complex securities. He also served on the FMR Fair Value Committee, which is responsible for day-to-day valuation activities for various Fidelity® funds
* Determined to be an "Interested Trustee" by virtue of, among other things, his or her affiliation with the trust or various entities under common control with FDS.
+ The information includes the Trustee's principal occupation during the last five years and other information relating to the experience, attributes, and skills relevant to the Trustee's qualifications to serve as a Trustee, which led to the conclusion that the Trustee should serve as a Trustee for the fund.
Independent Trustees:
Correspondence intended for an Independent Trustee may be sent to Fidelity Investments, P.O. Box 55235, Boston, Massachusetts 02205-5235.
Name, Year of Birth; Principal Occupations and Other Relevant Experience+
Jennifer M. Birmingham (1971)
Year of Election or Appointment: 2021
Trustee
Ms. Birmingham also serves as Trustee of other Fidelity® funds. Ms. Birmingham serves as Managing Director of Princeton University Investment Company (PRINCO) (2010-present). Previously, Ms. Birmingham served in a variety of positions at Deutsche Bank Asset Management (2002-2010), including Managing Director, Global CFO of DB Advisors and Deutsche Insurance Asset Management, Americas CFO of DWS Americas and various legal entities (2005-2010). Prior to Deutsche Bank, Ms. Birmingham was an employee of Investors Bank and Trust Company (1997-2002) and Deloitte & Touche LLP (1993-1997).
Matthew J. Conti (1966)
Year of Election or Appointment: 2021
Trustee
Mr. Conti also serves as Trustee of other Fidelity® funds. Prior to his retirement, Mr. Conti served in a variety of positions at Fidelity Investments, including as a portfolio manager to certain Fidelity® funds (2000-2018) and research analyst (1995-2003). Mr. Conti serves as a member of the Board of Directors of the Rose Kennedy Greenway Conservancy (2021-present).
Tara C. Kenney (1960)
Year of Election or Appointment: 2021
Trustee
Ms. Kenney also serves as Trustee of other Fidelity® funds. Prior to her retirement, Ms. Kenney served as Senior Vice President of Boston Common Asset Management (2017-2020). Previously, Ms. Kenney served as Managing Director in a variety of roles for Deutsche Asset Management (2003-2016) as well as Scudder Investments where she was a Portfolio Manager (1995-2003). Currently, Ms. Kenney serves as a Board member for a number of non-profit organizations and academic institutions, including Catholic Charities USA (2017-present) and the Kellogg Institute for International Studies at the University of Notre Dame (2002-present). Ms. Kenney is also an adjunct professor of finance at the University of Notre Dame.
+ The information includes the Trustee's principal occupation during the last five years and other information relating to the experience, attributes, and skills relevant to the Trustee's qualifications to serve as a Trustee, which led to the conclusion that the Trustee should serve as a Trustee for the fund.
Advisory Board Members and Officers:
Correspondence intended for a Member of the Advisory Board (if any) may be sent to Fidelity Investments, P.O. Box 55235, Boston, Massachusetts 02205-5235. Correspondence intended for an officer may be sent to Fidelity Investments, 245 Summer Street, Boston, Massachusetts 02210.
Name, Year of Birth; Principal Occupation
Joseph Benedetti (1965)
Year of Election or Appointment: 2021
Assistant Secretary
Mr. Benedetti also serves as Assistant Secretary of other funds. Mr. Benedetti is a Senior Vice President, Deputy General Counsel (2020-present) and is an employee of Fidelity Investments (2020-present). Mr. Benedetti serves as Assistant Secretary of Fidelity Diversifying Solutions LLC (investment adviser firm, 2022-present) and Secretary of certain other Fidelity entities. Previously, Mr. Benedetti served as Secretary of Fidelity Diversifying Solutions LLC (2021-2022). Prior to joining Fidelity, Mr. Benedetti was Assistant General Counsel at Invesco (investment adviser firm, 2019-2020) and Senior Vice President and Managing Counsel at OppenheimerFunds Inc. (investment adviser firm, 2017-2019).
Heather Bonner (1977)
Year of Election or Appointment: 2023
President and Treasurer
Ms. Bonner also serves as an officer of other funds. Ms. Bonner is a Senior Vice President (2022-present) and is an employee of Fidelity Investments (2022-present). Ms. Bonner serves as Vice President or Treasurer of certain Fidelity entities. Prior to joining Fidelity, Ms. Bonner served as Managing Director at AQR Capital Management (2013-2022) and was the Treasurer and Principal Financial Officer of the AQR Funds (2013-2022).
Craig S. Brown (1977)
Year of Election or Appointment: 2021
Assistant Treasurer
Mr. Brown also serves as an officer of other funds. Mr. Brown is a Vice President (2015-present) and is an employee of Fidelity Investments. Mr. Brown serves as Assistant Treasurer of FIMM, LLC (2021-present). Previously, Mr. Brown served as Assistant Treasurer of certain Fidelity® funds (2019-2022).
John J. Burke III (1964)
Year of Election or Appointment: 2021
Chief Financial Officer
Mr. Burke also serves as Chief Financial Officer of other funds. Mr. Burke is Head of Fidelity Fund and Investment Operations (2018-present) and is an employee of Fidelity Investments. Mr. Burke serves as President, Executive Vice President, or Director of certain Fidelity entities. Previously Mr. Burke served as head of Asset Management Investment Operations (2012-2018).
Margaret Carey (1973)
Year of Election or Appointment: 2023
Secretary and Chief Legal Officer (CLO)
Ms. Carey also serves as an officer of other funds and as CLO of certain Fidelity entities. Ms. Carey is a Senior Vice President, Deputy General Counsel (2019-present) and is an employee of Fidelity Investments.
Nati Davidi (1971)
Year of Election or Appointment: 2021
Assistant Secretary
Ms. Davidi also serves as Assistant Secretary of other funds. Ms. Davidi is a Vice President, Associate General Counsel (2013-present) and is an employee of Fidelity Investments. Previously, Ms. Davidi served as Assistant Secretary of the North Carolina Capital Management Trust (2016-2022).
Jonathan Davis (1968)
Year of Election or Appointment: 2021
Assistant Treasurer
Mr. Davis also serves as an officer of other funds. Mr. Davis is a Vice President (2006-present) and is an employee of Fidelity Investments. Mr. Davis serves as Assistant Treasurer of certain Fidelity entities.
Laura M. Del Prato (1964)
Year of Election or Appointment: 2021
Assistant Treasurer
Ms. Del Prato also serves as an officer of other funds. Ms. Del Prato is a Senior Vice President (2017-present) and is an employee of Fidelity Investments. Ms. Del Prato serves as Vice President or Assistant Treasurer of certain Fidelity entities. Previously, Ms. Del Prato served as President and Treasurer of The North Carolina Capital Management Trust: Cash Portfolio and Term Portfolio (2018-2020).
Colm A. Hogan (1973)
Year of Election or Appointment: 2021
Assistant Treasurer
Mr. Hogan also serves as an officer of other funds. Mr. Hogan is a Vice President (2016-present) and is an employee of Fidelity Investments. Mr. Hogan serves as Assistant Treasurer of certain Fidelity entities. Previously, Mr. Hogan served as Deputy Treasurer of certain Fidelity® funds (2016-2020) and Assistant Treasurer of certain Fidelity® funds (2016-2018).
William Irving (1964)
Year of Election or Appointment: 2023
Vice President
Mr. Irving also serves as Vice President of other funds. Mr. Irving is Head of Fidelity Asset Management Solutions (2022-present) and is an employee of Fidelity Investments. Mr. Irving serves as President and Director of Fidelity Diversifying Solutions LLC (investment adviser firm, 2023-present) and President or Director of certain other Fidelity entities. Previously, Mr. Irving served as Chief Investment Officer (CIO) in the Global Asset Allocation division (2020-2022). Prior to that, he was Managing Director of Research in the Global Asset Allocation division (2018-2020) and portfolio manager of certain Fidelity® funds (2004-2018).
Chris Maher (1972)
Year of Election or Appointment: 2021
Assistant Treasurer
Mr. Maher also serves as an officer of other funds. Mr. Maher is a Vice President (2008-present) and is an employee of Fidelity Investments. Mr. Maher serves as Assistant Treasurer of certain Fidelity entities. Previously, Mr. Maher served as Assistant Treasurer of certain funds (2013-2020).
Ksenia Portnoy (1980)
Year of Election or Appointment: 2021
Chief Compliance Officer
Ms. Portnoy also serves as Chief Compliance Officer of other funds. Ms. Portnoy is a Senior Vice President of Asset Management Compliance (2021-present) and is an employee of Fidelity Investments (2021-present). Prior to joining Fidelity, Ms. Portnoy worked in the asset management divisions of Morgan Stanley Investment Management (investment adviser firm, 2020-2021) and Mizuho (investment adviser firm, 2015-2020).
Brett Segaloff (1972)
Year of Election or Appointment: 2021
Anti-Money Laundering (AML) Officer
Mr. Segaloff also serves as AML Officer of other funds. Mr. Segaloff is a Vice President (2022-present) and is an employee of Fidelity Investments. Mr. Segaloff serves as Anti Money Laundering Compliance Officer or Anti Money Laundering/Bank Secrecy Act Compliance Officer of certain Fidelity entities.
Stacie M. Smith (1974)
Year of Election or Appointment: 2021
Assistant Treasurer
Ms. Smith also serves as an officer of other funds. Ms. Smith is a Senior Vice President (2016-present) and is an employee of Fidelity Investments. Ms. Smith serves as Assistant Treasurer of certain Fidelity entities and has served in other fund officer roles.
Jim Wegmann (1979)
Year of Election or Appointment: 2021
Assistant Treasurer
Mr. Wegmann also serves as an officer of other funds. Mr. Wegmann is a Vice President (2016-present) and is an employee of Fidelity Investments. Mr. Wegmann serves as Assistant Treasurer of FIMM, LLC (2021-present). Previously, Mr. Wegmann served as Assistant Treasurer of certain Fidelity® funds (2019-2021).
As a shareholder, you incur two types of costs: (1) transaction costs, which may include sales charges (loads) on purchase payments or redemption proceeds, as applicable and (2) ongoing costs, which generally include management fees, distribution and/or service (12b-1) fees and other Fund expenses. This Example is intended to help you understand your ongoing costs (in dollars) of investing in a fund and to compare these costs with the ongoing costs of investing in other mutual funds.
| The actual expense Example is based on an investment of $1,000 invested at the beginning of the period and held for the entire period (September 12, 2023 to January 31, 2024). The hypothetical expense Example is based on an investment of $1,000 invested for the one-half year period (August 1, 2023 to January 31, 2024). |
Actual Expenses
The first line of the accompanying table provides information about actual account values and actual expenses. You may use the information in this line, together with the amount you invested, to estimate the expenses that you paid over the period. Simply divide your account value by $1,000.00 (for example, an $8,600 account value divided by $1,000.00 = 8.6), then multiply the result by the number in the first line for a class/Fund under the heading entitled "Expenses Paid During Period" to estimate the expenses you paid on your account during this period. If any fund is a shareholder of any underlying mutual funds or exchange-traded funds (ETFs) (the Underlying Funds), such fund indirectly bears its proportional share of the expenses of the Underlying Funds in addition to the direct expenses incurred presented in the table. These fees and expenses are not included in the annualized expense ratio used to calculate the expense estimate in the table below.
Hypothetical Example for Comparison Purposes
The second line of the accompanying table provides information about hypothetical account values and hypothetical expenses based on the actual expense ratio and an assumed rate of return of 5% per year before expenses, which is not the actual return. The hypothetical account values and expenses may not be used to estimate the actual ending account balance or expenses you paid for the period. You may use this information to compare the ongoing costs of investing in the Fund and other funds. To do so, compare this 5% hypothetical example with the 5% hypothetical examples that appear in the shareholder reports of the other funds. If any fund is a shareholder of any Underlying Funds, such fund indirectly bears its proportional share of the expenses of the Underlying Funds in addition to the direct expenses as presented in the table. These fees and expenses are not included in the annualized expense ratio used to calculate the expense estimate in the table below.
Please note that the expenses shown in the table are meant to highlight your ongoing costs only and do not reflect any transaction costs. Therefore, the second line of the table is useful in comparing ongoing costs only, and will not help you determine the relative total costs of owning different funds. In addition, if these transactional costs were included, your costs would have been higher.
Annualized Expense Ratio- A | Beginning Account Value | Ending Account Value January 31, 2024 | Expenses Paid During Period | |||||||
| Fidelity® SAI Convertible Arbitrage Fund | 1.45% | |||||||||
| Actual | $ 1,000 | $ 1,018.10 | $ 5.69C | |||||||
Hypothetical-B | $ 1,000 | $ 1,017.90 | $ 7.38D | |||||||
A Annualized expense ratio reflects expenses net of applicable fee waivers.
B 5% return per year before expenses
C Actual expenses are equal to the annualized expense ratio, multiplied by the average account value over the period, multiplied by 142 / 365 (to reflect the period September 12, 2023 to January 31, 2024).
D Hypothetical expenses are equal to the annualized expense ratio, multiplied by the average account value over the period, multiplied by 184/365 (to reflect the one-half year period).
Distributions (Unaudited)
The dividend and capital gains distributions for the fund(s) are available on Fidelity.com or Institutional.Fidelity.com.
A total of 72.41% of the dividends distributed during the fiscal year was derived from interest on U.S. Government securities which is generally exempt from state income tax.
The fund designates $569,411 of distributions paid during the fiscal year ended 2024 as qualifying to be taxed as section 163(j) interest dividends.
The fund will notify shareholders in January 2025 of amounts for use in preparing 2024 income tax returns.
Board Approval of Investment Advisory Contracts
Fidelity SAI Convertible Arbitrage Fund
At its August 2023 meeting, the Board of Trustees, including the Independent Trustees (together, the Board), voted to approve the fund's management contract with Fidelity Diversifying Solutions LLC (FDS) and the sub-advisory agreements with affiliates of FDS (together, the Advisory Contracts) for the fund. FDS and the sub-advisers are collectively referred to herein as the Investment Advisers. The Board, assisted by the advice of fund counsel and Independent Trustees' counsel, considered a broad range of information.
Nature, Extent, and Quality of Services Provided. The Board considered staffing as it relates to the fund, including the backgrounds and experience of investment personnel of the Investment Advisers and also considered the Investment Advisers' implementation of the fund's investment program.
Resources Dedicated to Investment Management and Support Services. The Board reviewed the general qualifications and capabilities of the Investment Advisers' investment staff, including their size, education, experience, and resources, as well as the Investment Advisers' approach to training and managing investment personnel. The Board noted the resources devoted to Fidelity's global investment organization and that the Investment Advisers' analysts have extensive resources, tools and capabilities that allow them to conduct sophisticated quantitative and fundamental analysis, as well as credit analysis of issuers, counterparties and guarantors. Further, the Board considered that Fidelity's investment professionals have sufficient access to global information and data to provide competitive investment results over time, and that those professionals also have access to sophisticated tools that permit them to assess portfolio construction and risk and performance attribution characteristics continuously, as well as to transmit new information and research conclusions rapidly around the world. Additionally, in its deliberations, the Board considered the Investment Advisers' trading, risk management, compliance, cybersecurity, and technology and operations capabilities and resources, which are integral parts of the investment management process.
Shareholder and Administrative Services. The Board considered the nature, extent, quality, and cost of advisory, administrative, and shareholder services to be performed by the Investment Advisers and their affiliates under the Advisory Contracts and by FDS's affiliates under separate agreements covering transfer agency, pricing and bookkeeping, and securities lending services for the fund. The Board also considered the nature and extent of FDS's supervision of third party service providers, principally custodians, subcustodians, and pricing vendors.
The Board noted that the growth of fund assets over time across the complex allows Fidelity to reinvest in the development of services designed to enhance the value and convenience of the Fidelity funds as investment vehicles. These services include 24-hour access to account information and market information over the Internet and through telephone representatives, investor education materials and asset allocation tools.
Investment Performance. The fund is a new fund and therefore had no historical performance for the Board to review at the time it approved the fund's Advisory Contracts. The Board considered the Investment Advisers' strength in managing assets and trading derivatives instruments.
Based on its review, the Board concluded that the nature, extent, and quality of services to be provided to the fund under the Advisory Contracts should benefit the shareholders of the fund.
Competitiveness of Management Fee and Total Expense Ratio. In reviewing the Advisory Contracts, the Board was provided with information regarding industry trends in management fees and expenses. The Board considered the fund's proposed management fee rate under the Advisory Contract. The Board considered that there is a limited number of competitors against which to assess the competitiveness of the fund's fees, but that Fidelity identified a small number of key competitor funds that are similar to the fund. In reviewing the Advisory Contracts, the Board also considered the projected total expense ratio of the fund.
Comparisons of Management Fee and Total Expense Ratio with Competitive Groups. The information provided to the Board indicated that the fund's proposed management fee rate ranked above the competitive median fee rate of funds with a similar Morningstar investment mandate, regardless of whether their management fee structures are comparable. Further, the information provided to the Board indicated that the projected total net expense ratio of the fund ranked above the competitive median of the similar sales load structure group used by the Board for management fee comparisons. The Board noted that there are a small number of similar funds with which to compare fees, making such comparisons less meaningful.
Other Contractual Arrangements. The Board noted that FDS has agreed to contractually limit the fund's total operating expenses, with certain limited exceptions, to 145 basis points.
The Board further noted that the fund pays its non-operating expenses, including brokerage commissions and fees and expenses associated with the fund's securities lending program, if applicable.
Based on its review, the Board concluded that the management fee and the projected total expenses of the fund were reasonable in light of the services that the fund and its shareholders will receive and the other factors considered.
Costs of the Services and Profitability. The fund is a new fund and therefore no revenue, cost, or profitability data was available for the Board to review in respect of the fund at the time it approved the Advisory Contracts. In connection with its future renewal of the fund's Advisory Contracts, the Board will consider the revenues earned and the expenses incurred by Fidelity in conducting the business of developing, marketing, distributing, managing, administering and servicing each fund and servicing the fund's shareholders.
Economies of Scale. The Board will consider economies of scale when there is operating experience to permit assessment thereof. It noted that, notwithstanding the entrepreneurial risk associated with a new fund, the management fee was at a level normally associated, by comparison with competitors, with very high fund net assets, and Fidelity asserted to the Board that the level of the fee anticipated economies of scale at lower asset levels even before, if ever, economies of scale are achieved. The Board also noted that the fund and its shareholders would have access to the very considerable number and variety of services available through Fidelity and its affiliates.
Conclusion. Based on its evaluation of all of the conclusions noted above, and after considering all factors it believed relevant, the Board, including a majority of the Independent Trustees, concluded that the advisory fee arrangements are fair and reasonable in light of all of the surrounding circumstances and that the fund's Advisory Contracts should be approved through November 2024.
The Securities and Exchange Commission adopted Rule 22e-4 under the Investment Company Act of 1940 (the Liquidity Rule) to promote effective liquidity risk management throughout the open-end investment company industry, thereby reducing the risk that funds will be unable to meet their redemption obligations and mitigating dilution of the interests of fund shareholders.
The Fund has adopted and implemented a liquidity risk management program (the Program) reasonably designed to assess and manage the Fund's liquidity risk and to comply with the requirements of the Liquidity Rule. The Fund's Board of Trustees (the Board) has designated the Fund's investment adviser as administrator of the Program. The Fidelity advisers have established a Liquidity Risk Management Committee (the LRM Committee) to manage the Program for each of the Fidelity Funds. The LRM Committee monitors the adequacy and effectiveness of implementation of the Program and on a periodic basis assesses each Fund's liquidity risk based on a variety of factors including (1) the Fund's investment strategy, (2) portfolio liquidity and cash flow projections during normal and reasonably foreseeable stressed conditions, (3) shareholder redemptions, (4) borrowings and other funding sources and (5) certain factors specific to ETFs including the effect of the Fund's prices and spreads, market participants, and basket compositions on the overall liquidity of the Fund's portfolio, as applicable.
In accordance with the Program, each of the Fund's portfolio investments is classified into one of four defined liquidity categories based on a determination of a reasonable expectation for how long it would take to convert the investment to cash (or sell or dispose of the investment) without significantly changing its market value.
- Highly liquid investments - cash or convertible to cash within three business days or less
- Moderately liquid investments - convertible to cash in three to seven calendar days
- Less liquid investments - can be sold or disposed of, but not settled, within seven calendar days
- Illiquid investments - cannot be sold or disposed of within seven calendar days
Liquidity classification determinations take into account a variety of factors including various market, trading and investment-specific considerations, as well as market depth, and generally utilize analysis from a third-party liquidity metrics service.
The Liquidity Rule places a 15% limit on a fund's illiquid investments and requires funds that do not primarily hold assets that are highly liquid investments to determine and maintain a minimum percentage of the fund's net assets to be invested in highly liquid investments (highly liquid investment minimum or HLIM). The Program includes provisions reasonably designed to comply with the 15% limit on illiquid investments and for determining, periodically reviewing and complying with the HLIM requirement as applicable.
At a recent meeting of the Fund's Board of Trustees, the LRM Committee provided a written report to the Board pertaining to the operation, adequacy, and effectiveness of the Program for the period December 1, 2022 through November 30, 2023. The report concluded that the Program is operating effectively and is reasonably designed to assess and manage the Fund's liquidity risk.
 |
1.9909697.100
SCA-ANN-0324
Item 2.
Code of Ethics
As of the end of the period, January 31, 2024, Fidelity Greenwood Street Trust (the trust) has adopted a code of ethics, as defined in Item 2 of Form N-CSR, that applies to its President and Treasurer and its Chief Financial Officer. A copy of the code of ethics is filed as an exhibit to this Form N-CSR.
Item 3.
Audit Committee Financial Expert
The Board of Trustees of the trust has determined that Jennifer M. Birmingham is an audit committee financial expert, as defined in Item 3 of Form N-CSR. Ms. Birmingham is independent for purposes of Item 3 of Form N-CSR.
Item 4.
Principal Accountant Fees and Services
Fees and Services
The following table presents fees billed by Deloitte & Touche LLP, the member firms of Deloitte Touche Tohmatsu, and their respective affiliates (collectively, “Deloitte Entities”) in each of the last two fiscal years for services rendered to Fidelity Hedged Equity Fund, Fidelity Macro Opportunities Fund, Fidelity Risk Parity Fund, and Fidelity SAI Convertible Arbitrage Fund (the “Funds”):
Services Billed by Deloitte Entities
January 31, 2024 FeesA,B
Audit Fees | Audit-Related Fees | Tax Fees | All Other Fees | |
Fidelity Hedged Equity Fund | $56,000 | $- | $9,700 | $2,200 |
Fidelity Macro Opportunities Fund | $84,500 | $- | $9,300 | $3,500 |
Fidelity Risk Parity Fund | $84,500 | $- | $9,300 | $3,500 |
Fidelity SAI Convertible Arbitrage Fund | $74,400 | $- | $9,300 | $800 |
January 31, 2023 FeesA,B,C
Audit Fees | Audit-Related Fees | Tax Fees | All Other Fees | |
Fidelity Hedged Equity Fund | $44,500 | $- | $9,700 | $300 |
Fidelity Macro Opportunities Fund | $74,400 | $- | $9,300 | $500 |
Fidelity Risk Parity Fund | $76,300 | $- | $9,300 | $500 |
Fidelity SAI Convertible Arbitrage Fund | $- | $- | $- | $- |
A Amounts may reflect rounding.
B Fidelity SAI Convertible Arbitrage Fund commenced operations on September 12, 2023.
C Fidelity Macro Opportunities Fund and Fidelity Risk Parity Fund commenced operations on July 7, 2022. Fidelity Hedged Equity Fund commenced operations on September 1, 2022.
The following table(s) present(s) fees billed by Deloitte Entities that were required to be approved by the Audit Committee for services that relate directly to the operations and financial reporting of the Fund(s) and that are rendered on behalf of Fidelity Diversifying Solutions LLC ("FDS") and entities controlling, controlled by, or under common control with FDS (not including any sub-adviser whose role is primarily portfolio management and is subcontracted with or overseen by another investment adviser) that provide ongoing services to the Fund(s) (“Fund Service Providers”):
Services Billed by Deloitte Entities
January 31, 2024A,B | January 31, 2023A,B,C | |
Audit-Related Fees | $- | $- |
Tax Fees | $- | $- |
All Other Fees | $935,000 | $- |
A Amounts may reflect rounding.
B May include amounts billed prior to the Fidelity SAI Convertible Arbitrage Fund’s commencement of operations.
C May include amounts billed prior to the Fidelity Hedged Equity Fund, Fidelity Macro Opportunities Fund, and Fidelity Risk Parity Funds’ commencement of operations.
“Audit-Related Fees” represent fees billed for assurance and related services that are reasonably related to the performance of the fund audit or the review of the fund's financial statements and that are not reported under Audit Fees.
“Tax Fees” represent fees billed for tax compliance, tax advice or tax planning that relate directly to the operations and financial reporting of the fund.
“All Other Fees” represent fees billed for services provided to the fund or Fund Service Provider, a significant portion of which are assurance related, that relate directly to the
operations and financial reporting of the fund, excluding those services that are reported under Audit Fees, Audit-Related Fees or Tax Fees.
Assurance services must be performed by an independent public accountant.
* * *
The aggregate non-audit fees billed by Deloitte Entities for services rendered to the Fund(s), FDS (not including any sub-adviser whose role is primarily portfolio management and is subcontracted with or overseen by another investment adviser), and any Fund Service Provider for each of the last two fiscal years of the Fund(s) are as follows:
Billed By | January 31, 2024A,B | January 31, 2023A,B,C |
Deloitte Entities | $1,237,600 | $272,200 |
A Amounts may reflect rounding.
B May include amounts billed prior to the Fidelity SAI Convertible Arbitrage Fund’s commencement of operations.
C May include amounts billed prior to the Fidelity Hedged Equity Fund, Fidelity Macro Opportunities Fund, and Fidelity Risk Parity Funds’ commencement of operations.
The trust's Audit Committee has considered non-audit services that were not pre-approved that were provided by Deloitte Entities to Fund Service Providers to be compatible with maintaining the independence of Deloitte Entities in its(their) audit of the Fund(s), taking into account representations from Deloitte Entities, in accordance with Public Company Accounting Oversight Board rules, regarding its independence from the Fund(s) and its(their) related entities and FDS’s review of the appropriateness and permissibility under applicable law of such non-audit services prior to their provision to the Fund(s) Service Providers.
Audit Committee Pre-Approval Policies and Procedures
The trust’s Audit Committee must pre-approve all audit and non-audit services provided by a fund’s independent registered public accounting firm relating to the operations or financial reporting of the fund. Prior to the commencement of any audit or non-audit services to a fund, the Audit Committee reviews the services to determine whether they are appropriate and permissible under applicable law.
The Audit Committee has adopted policies and procedures to, among other purposes, provide a framework for the Committee’s consideration of non-audit services by the audit firms that audit the Fidelity funds. The policies and procedures require that any non-audit service provided by a fund audit firm to a Fidelity fund and any non-audit service provided by a fund auditor to a Fund Service Provider that relates directly to the
operations and financial reporting of a Fidelity fund (“Covered Service”) are subject to approval by the Audit Committee before such service is provided.
All Covered Services must be approved in advance of provision of the service either: (i) by formal resolution of the Audit Committee, or (ii) by oral or written approval of the service by the Chair of the Audit Committee (or if the Chair is unavailable, such other member of the Audit Committee as may be designated by the Chair to act in the Chair’s absence). The approval contemplated by (ii) above is permitted where the Treasurer determines that action on such an engagement is necessary before the next meeting of the Audit Committee.
Non-audit services provided by a fund audit firm to a Fund Service Provider that do not relate directly to the operations and financial reporting of a Fidelity fund are reported to the Audit Committee periodically.
Non-Audit Services Approved Pursuant to Rule 2-01(c)(7)(i)(C) and (ii) of Regulation S-X (“De Minimis Exception”)
There were no non-audit services approved or required to be approved by the Audit Committee pursuant to the De Minimis Exception during the Fund’s(s’) last two fiscal years relating to services provided to (i) the Fund(s) or (ii) any Fund Service Provider that relate directly to the operations and financial reporting of the Fund(s).
The Registrant has not retained, for the preparation of the audit report on the financial statements included in the Form N-CSR, a registered public accounting firm that has a branch or office that is located in a foreign jurisdiction and that the Public Company Accounting Oversight Board (the “PCAOB”) has determined that the PCAOB is unable to inspect or investigate completely because of a position taken by an authority in the foreign jurisdiction.
The Registrant is not a “foreign issuer,” as defined in 17 CFR 240.3b-4.
Item 5.
Audit Committee of Listed Registrants
Not applicable.
Item 6.
Investments
(a)
Not applicable.
(b)
Not applicable.
Item 7.
Disclosure of Proxy Voting Policies and Procedures for Closed-End Management Investment Companies
Not applicable.
Item 8.
Portfolio Managers of Closed-End Management Investment Companies
Not applicable.
Item 9.
Purchase of Equity Securities by Closed-End Management Investment Company and Affiliated Purchasers
Not applicable.
Item 10.
Submission of Matters to a Vote of Security Holders
There were no material changes to the procedures by which shareholders may recommend nominees to the trust’s Board of Trustees.
Item 11.
Controls and Procedures
(a)(i) The President and Treasurer and the Chief Financial Officer have concluded that the trust’s disclosure controls and procedures (as defined in Rule 30a-3(c) under the Investment Company Act) provide reasonable assurances that material information relating to the trust is made known to them by the appropriate persons, based on their evaluation of these controls and procedures as of a date within 90 days of the filing date of this report.
(a)(ii) There was no change in the trust’s internal control over financial reporting (as defined in Rule 30a-3(d) under the Investment Company Act) that occurred during the period covered by this report that has materially affected, or is reasonably likely to materially affect, the trust’s internal control over financial reporting.
Item 12.
Disclosure of Securities Lending Activities for Closed-End Management
Investment Companies
Not applicable.
Item 18.
Recovery of Erroneously Awarded Compensation
(a)
Not applicable.
(b)
Not applicable.
Item 19.
Exhibits
(a) | (1) | Code of Ethics pursuant to Item 2 of Form N-CSR is filed and attached hereto as EX-99.CODE ETH. |
(a) | (2) | |
(a) | (3) | Not applicable. |
(b) |
SIGNATURES
Pursuant to the requirements of the Securities Exchange Act of 1934 and the Investment Company Act of 1940, the registrant has duly caused this report to be signed on its behalf by the undersigned, thereunto duly authorized.
Fidelity Greenwood Street Trust
By: | /s/Heather Bonner |
Heather Bonner | |
President and Treasurer | |
Date: | March 21, 2024 |
Pursuant to the requirements of the Securities Exchange Act of 1934 and the Investment Company Act of 1940, this report has been signed below by the following persons on behalf of the registrant and in the capacities and on the dates indicated.
By: | /s/Heather Bonner |
Heather Bonner | |
President and Treasurer | |
Date: | March 21, 2024 |
By: | /s/John J. Burke III |
John J. Burke III | |
Chief Financial Officer | |
Date: | March 21, 2024 |