Filed by Alvotech Lux Holdings S.A.S. (Commission File No. 333-261773) Pursuant to Rule 425 under the Securities Act of 1933 And Deemed Filed pursuant to Rule 14a-12 under the Securities Exchange Act of 1934 Subject Company: Oaktree Acquisition Corp. II ANALYST DAY MARCH 2022
This investor presentation (this “Presentation”) is for informational purposes only to assist interested parties in making their own evaluation with respect to the proposed business combination (the “Business Combination”) between Oaktree Acquisition Corp. II (“SPAC”) and Alvotech Holdings S.A. (together with its subsidiaries, the “Company”). The information contained herein does not purport to be all-inclusive and none of SPAC, the Company or their respective affiliates makes any representation or warranty, express or implied, as to the accuracy, completeness or reliability of the information contained in this Presentation. Neither the Company nor SPAC has verified, or will verify, any part of this Presentation. The recipient should make its own independent investigations and analyses of the Company and its own assessment of all information and material provided, or made available, by the Company, SPAC or any of their respective directors, officers, employees, affiliates, agents, advisors or representatives. This Presentation does not constitute (i) a solicitation of a proxy, consent or authorization with respect to any securities or in respect of the proposed Business Combination or (ii) an offer to sell, a solicitation of an offer to buy, or a recommendation to purchase any security of SPAC, the Company, or any of their respective affiliates. You should not construe the contents of this Presentation as legal, tax, accounting or investment advice or a recommendation. You should consult your own counsel and tax and financial advisors as to legal and related matters concerning the matters described herein, and, by accepting this Presentation, you confirm that you are not relying upon the information contained herein to make any decision. The distribution of this Presentation may also be restricted by law and persons into whose possession this Presentation comes should inform themselves about and observe any such restrictions. The recipient acknowledges that it is (a) aware that the United States securities laws prohibit any person who has material, non-public information concerning a company from purchasing or selling securities of such company or from communicating such information to any other person under circumstances in which it is reasonably foreseeable that such person is likely to purchase or sell such securities, and (b) familiar with the Securities Exchange Act of 1934, as amended, and the rules and regulations promulgated thereunder (collectively, the Exchange Act ), and that the recipient will neither use, nor cause any third party to use, this Presentation or any information contained herein in contravention of the Exchange Act, including, without limitation, Rule 10b-5 thereunder. This Presentation and information contained herein constitutes confidential information and is provided to you on the condition that you agree that you will hold it in strict confidence and not reproduce, disclose, forward or distribute it in whole or in part without the prior written consent of SPAC and the Company and is intended for the recipient hereof only. This investor presentation supersedes all previous investor presentations delivered in connection with the Business Combination. You should only refer to the information in this version of the investor presentation. Forward-Looking Statements Disclaimer Certain statements in this Presentation may be considered forward-looking statements. Forward-looking statements generally relate to future events or SPAC’s or the Company’s future financial or operating performance. For example, projections of future Revenue and Adjusted EBITDA and other metrics are forward-looking statements. In some cases, you can identify forward-looking statements by terminology such as “may”, “should”, “expect”, “intend”, “will”, “estimate”, “anticipate”, “believe”, “predict”, “potential” or “continue”, or the negatives of these terms or variations of them or similar terminology. Such forward-looking statements are subject to risks, uncertainties, and other factors which could cause actual results to differ materially from those expressed or implied by such forward looking statements. These forward-looking statements are based upon estimates and assumptions that, while considered reasonable by SPAC and its management, and the Company and its management, as the case may be, are inherently uncertain and are inherently subject to risks, variability and contingencies, many of which are beyond the Company’s control. Factors that may cause actual results to differ materially from current expectations include, but are not limited to: (1) the occurrence of any event, change or other circumstances that could give rise to the termination of negotiations and any subsequent definitive agreements with respect to the Business Combination; (2) the outcome of any legal proceedings that may be instituted against SPAC, the combined company or others following the announcement of the Business Combination and any definitive agreements with respect thereto; (3) the inability to complete the Business Combination due to the failure to obtain approval of the shareholders of SPAC, to obtain financing to complete the Business Combination or to satisfy other conditions to closing; (4) changes to the proposed structure of the Business Combination that may be required or appropriate as a result of applicable laws or regulations or as a condition to obtaining regulatory approval of the Business Combination; (5) the ability to meet stock exchange listing standards following the consummation of the Business Combination; (6) the risk that the Business Combination disrupts current plans and operations of the Company as a result of the announcement and consummation of the Business Combination; (7) the ability to recognize the anticipated benefits of the Business Combination, which may be affected by, among other things, competition, the ability of the combined company to grow and manage growth profitably, maintain key relationships and retain its management and key employees; (8) costs related to the Business Combination; (9) changes in applicable laws or regulations; (10) the possibility that the Company or the combined company may be adversely affected by other economic, business, and/or competitive factors; (11) the Company’s estimates of expenses and profitability; and (12) other risks and uncertainties set forth in the section entitled “Risk Factors” and “Cautionary Note Regarding Forward-Looking Statements” in SPAC’s final prospectus relating to its initial public offering dated September 16, 2020, in the registration statement on Form F-4, initially filed by the Company with the SEC on December 20, 2021 (as amended or supplemented through the date hereof, the Registration Statement ) or in other documents filed by SPAC or the Company with the SEC. There may be additional risks that neither SPAC nor the Company presently know or that SPAC and the Company currently believe are immaterial that could also cause actual results to differ from those contained in the forward-looking statements. Nothing in this Presentation should be regarded as a representation by any person that the forward-looking statements set forth herein will be achieved or that any of the contemplated results of such forward-looking statements will be achieved. You should not place undue reliance on forward-looking statements, which speak only as of the date they are made. Neither SPAC nor the Company undertakes any duty to update these forward-looking statements or to inform the recipient of any matters of which any of them becomes aware of which may affect any matter referred to in this Presentation. The Company and SPAC disclaim any and all liability for any loss or damage (whether foreseeable or not) suffered or incurred by any person or entity as a result of anything contained or omitted from this Presentation and such liability is expressly disclaimed. The recipient agrees that it shall not seek to sue or otherwise hold the Company, SPAC or any of their respective directors, officers, employees, affiliates, agents, advisors or representatives liable in any respect for the provision of this Presentation, the information contained in this Presentation, or the omission of any information from this Presentation. Only those particular representations and warranties of the Company or SPAC made in a definitive written agreement regarding the transaction (which will not contain any representation or warranty relating to this Presentation) when and if executed, and subject to such limitations and restrictions as specified therein, shall have any legal effect. Non-GAAP Financial Measures This Presentation includes projections of certain financial measures not presented in accordance with generally accepted accounting principles (“GAAP”) including, but not limited to, Adjusted EBITDA and certain ratios and other metrics derived therefrom. These non-GAAP financial measures are not measures of financial performance in accordance with GAAP and may exclude items that are significant in understanding and assessing the Company’s financial results. Therefore, these measures should not be considered in isolation or as an alternative to net income, cash flows from operations or other measures of profitability, liquidity or performance under GAAP. You should be aware that the Company’s presentation of these measures may not be comparable to similarly-titled measures used by other companies. The Company believes these non-GAAP measures of financial results provide useful information to management and investors regarding certain financial and business trends relating to the Company’s financial condition and results of operations. The Company believes that the use of these non-GAAP financial measures provides an additional tool for investors to use in evaluating ongoing operating results and trends in and in comparing the Company’s financial measures with other similar companies, many of which present similar non-GAAP financial measures to investors. These non-GAAP financial measures are subject to inherent limitations as they reflect the exercise of judgments by management about which expense and income are excluded or included in determining these non-GAAP financial measures. Due to the high variability and difficulty in making accurate forecasts and projections of some of the information excluded from these projected measures, together with some of the excluded information not being ascertainable or accessible, the Company is unable to quantify certain amounts that would be required to be included in the most directly comparable GAAP financial measures without unreasonable effort. Consequently, no disclosure of estimated comparable GAAP measures is included and no reconciliation of the forward-looking non-GAAP financial measures is included. For the same reasons, the Company is unable to address the probable significance of the unavailable information, which could be material to future results.
Use of Projections This Presentation contains financial forecasts with respect to the Company’s projected financial results, including Revenue and Adjusted EBITDA, for the Company's fiscal years 2021, 2025 and from 2025-2030. The Company's independent auditors have not audited, reviewed, compiled or performed any procedures with respect to the projections for the purpose of their inclusion in this Presentation, and accordingly, they did not express an opinion or provide any other form of assurance with respect thereto for the purpose of this Presentation. These projections should not be relied upon as being necessarily indicative of future results. The assumptions and estimates underlying the prospective financial information are inherently uncertain and are subject to a wide variety of significant business, economic and competitive risks and uncertainties that could cause actual results to differ materially from those contained in the prospective financial information. Accordingly, there can be no assurance that the prospective results are indicative of the future performance of the Company or that actual results will not differ materially from those presented in the prospective financial information. Inclusion of the prospective financial information in this Presentation should not be regarded as a representation by any person that the results contained in the prospective financial information will be achieved. Industry and Market Data This presentation also contains estimates and other statistical data made by independent parties and by the Company relating to market size and growth and other data about the Company’s industry. This data involves a number of assumptions and limitations, and you are cautioned not to give undue weight to such estimates. In addition, projections, assumptions, and estimates of the future performance of the markets in which the Company operates are necessarily subject to a high degree of uncertainty and risk. This presentation concerns drugs that are in development and which have not yet been approved for marketing by the U.S. Food and Drug Administration (FDA). No representation is made as to the safety or effectiveness of any of the products in development, nor for any products which may have applications pending before the FDA. Any trademarks, servicemarks, trade names and copyrights of the Company and other companies contained in this Presentation are the property of their respective owners. Additional Information Disclaimer In connection with the proposed Business Combination, the parties have filed the Registration Statement with the SEC containing a preliminary proxy statement of SPAC and a preliminary prospectus of the combined company, and after the registration statement is declared effective, SPAC will mail a definitive proxy statement/prospectus relating to the proposed Business Combination to its shareholders. This Presentation does not contain all the information that should be considered concerning the proposed Business Combination and is not intended to form the basis of any investment decision or any other decision in respect of the Business Combination. SPAC’s shareholders and other interested persons are advised to read the preliminary proxy statement/prospectus and the amendments thereto and the definitive proxy statement/prospectus and other (Cont’d) documents filed in connection with the proposed Business Combination, as these materials will contain important information about SPAC, the Company and the Business Combination. When available, the definitive proxy statement/prospectus and other relevant materials for the proposed Business Combination will be mailed to shareholders of SPAC as of a record date to be established for voting on the proposed Business Combination. Shareholders can obtain copies of the preliminary proxy statement/prospectus and will be able to obtain copies of the definitive proxy statement/prospectus and other documents filed with the SEC, without charge, once available, at the SEC’s website at www.sec.gov, or by directing a request to: Oaktree Acquisition Corp. II, 333 South Grand Avenue, 28th Floor, Los Angeles, CA 90071. Participants in the Solicitation SPAC and its directors and executive officers may be deemed participants in the solicitation of proxies from SPAC’s shareholders with respect to the proposed Business Combination. A list of the names of those directors and executive officers and a description of their interests in SPAC is contained in SPAC’s final prospectus related to its initial public offering dated September 16, 2020, which was filed with the SEC and is available free of charge at the SEC’s web site at www.sec.gov, or by directing a request to Oaktree Acquisition Corp. II, 333 South Grand Avenue, 28th Floor, Los Angeles, CA 90071. Additional information regarding the interests of such participants is contained in the Registration Statement. The Company and its directors and executive officers may also be deemed to be participants in the solicitation of proxies from the shareholders of SPAC in connection with the proposed Business Combination. A list of the names of such directors and executive officers and information regarding their interests in the proposed Business Combination is contained in the Registration Statement. INVESTMENT IN ANY SECURITIES DESCRIBED HEREIN HAS NOT BEEN APPROVED OR DISAPPROVED BY THE SEC OR ANY OTHER REGULATORY AUTHORITY NOR HAS ANY AUTHORITY PASSED UPON OR ENDORSED THE MERITS OF THE OFFERING OR THE ACCURACY OR ADEQUACY OF THE INFORMATION CONTAINED HEREIN ANY REPRESENTATION TO THE CONTRARY IS A CRIMINAL OFFENSE. The Company and SPAC reserve the right to negotiate with one or more parties and to enter into a definitive agreement relating to the transaction at any time and without prior notice to the recipient or any other person or entity. The Company and SPAC also reserve the right, at any time and without prior notice and without assigning any reason therefor, (i) to terminate the further participation by the recipient or any other person or entity in the consideration of, and proposed process relating to, the transaction, (ii) to modify any of the rules or procedures relating to such consideration and proposed process and (iii) to terminate entirely such consideration and proposed process. No representation or warranty (whether express or implied) has been made by the Company, the SPAC or any of their respective directors, officers, employees, affiliates, agents, advisors or representatives with respect to the proposed process or the manner in which the proposed process is conducted, and the recipient disclaims any such representation or warranty. The recipient acknowledges that the Company, SPAC and their respective directors, officers, employees, affiliates, agents, advisors or representatives are under no obligation to accept any offer or proposal by any person or entity regarding the transaction. None of the Company, SPAC or any of their respective directors, officers, employees, affiliates, agents, advisors or representatives has any legal, fiduciary or other duty to any recipient with respect to the manner in which the proposed process is conducted.
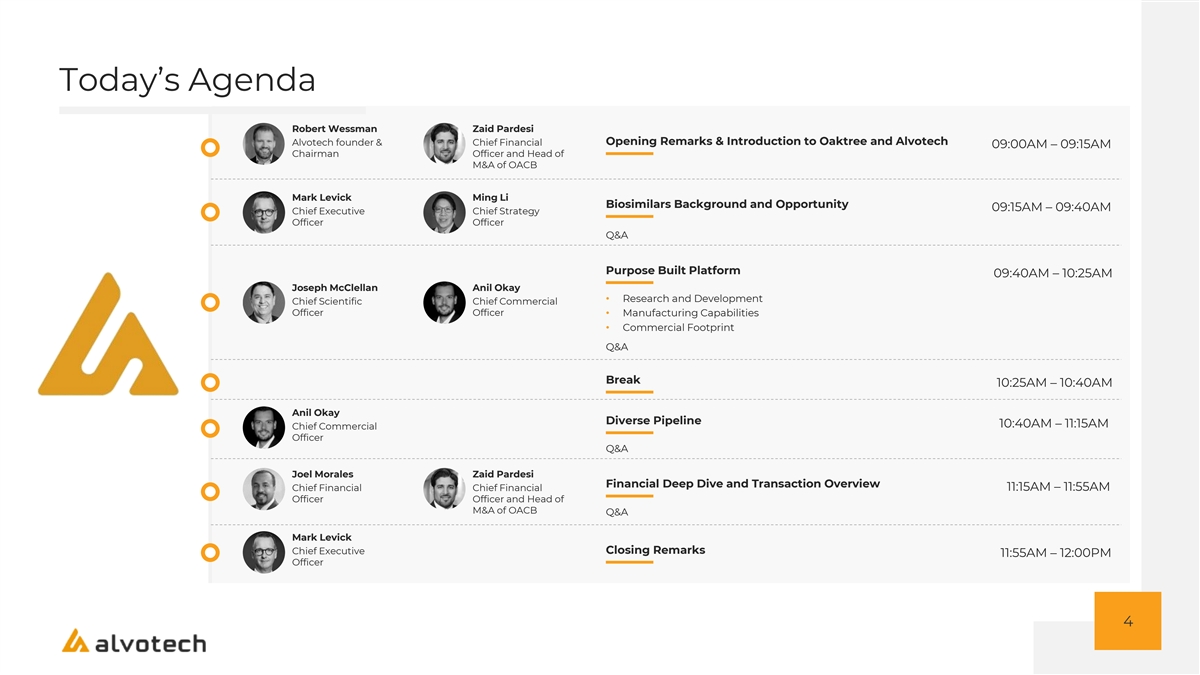
Today’s Agenda Robert Wessman Zaid Pardesi Opening Remarks & Introduction to Oaktree and Alvotech Alvotech founder & Chief Financial 09:00AM – 09:15AM Chairman Officer and Head of M&A of OACB Mark Levick Ming Li Biosimilars Background and Opportunity 09:15AM – 09:40AM Chief Executive Chief Strategy Officer Officer Q&A Purpose Built Platform 09:40AM – 10:25AM Joseph McClellan Anil Okay • Research and Development Chief Scientific Chief Commercial Officer Officer• Manufacturing Capabilities • Commercial Footprint Q&A Break 10:25AM – 10:40AM Anil Okay Diverse Pipeline 10:40AM – 11:15AM Chief Commercial Officer Q&A Joel Morales Zaid Pardesi Financial Deep Dive and Transaction Overview Chief Financial Chief Financial 11:15AM – 11:55AM Officer Officer and Head of M&A of OACB Q&A Mark Levick Closing Remarks Chief Executive 11:55AM – 12:00PM Officer 4

Alvotech: Compelling Platform Providing Pure-Play Access To The Rapidly Growing Biosimilar Market • Pioneers in biosimilar development with a track record of obtaining PROVEN LEADERSHIP TEAM marketing authorization for 17 biosimilars and 8 originator biologics 1 globally • Significant acceleration of originator biologic and biosimilar markets SIGNIFICANT MARKET OPPORTUNITY (1) 2 which are expected to reach ~$580Bn and ~$80Bn by 2026, respectively • End-to-end platform with differentiated R&D and manufacturing PURPOSE-BUILT BIOSIMILAR PLATFORM 3 capabilities; designed to maximize development success • Distribution partnerships with regional champions, including Teva (US), GLOBAL COMMERCIAL PARTNER NETWORK (2) 4 Stada (EU) and Fuji (JP); up to $1.15Bn in potential license fees • Eight differentiated biosimilars currently in development addressing DIVERSE PIPELINE WITH SIGNIFICANT TAM (3) 5 >$85Bn branded biologic opportunity; ability to commercialize globally • $800M+ of revenue at >60% EBITDA margins targeted by 2025; platform ATTRACTIVE FINANCIAL PROFILE 6 provides potential for sustained, long-term growth 5 1. Biologic market size per Evaluate Pharma; biosimilar market size per Frost & Sullivan 2. $1.15Bn in potential milestone revenues from existing partnerships. See slide 35 for more detail 3. Per EvaluatePharma, based on peak sales period range from 2021 – 2026 of pipeline products
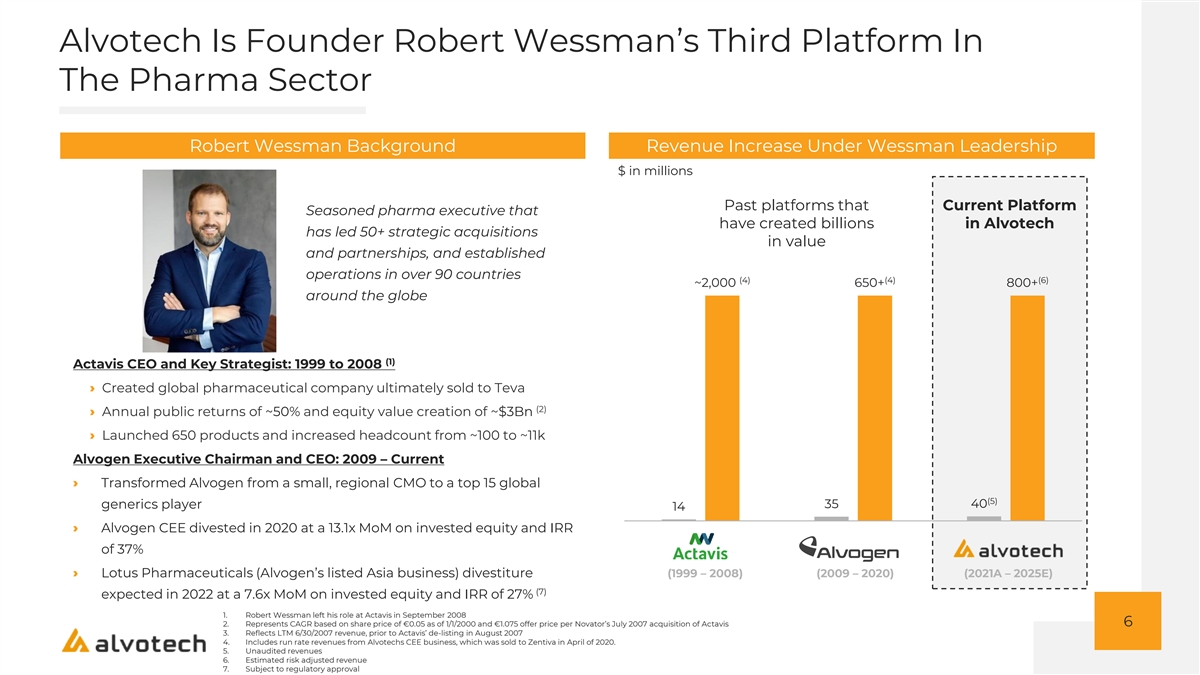
Alvotech Is Founder Robert Wessman’s Third Platform In The Pharma Sector Robert Wessman Background Revenue Increase Under Wessman Leadership $ in millions Past platforms that Current Platform Seasoned pharma executive that have created billions in Alvotech has led 50+ strategic acquisitions in value and partnerships, and established operations in over 90 countries (4) (4) (6) ~2,000 650+ 800+ around the globe (1) Actavis CEO and Key Strategist: 1999 to 2008 › Created global pharmaceutical company ultimately sold to Teva (2) › Annual public returns of ~50% and equity value creation of ~$3Bn › Launched 650 products and increased headcount from ~100 to ~11k Alvogen Executive Chairman and CEO: 2009 – Current › Transformed Alvogen from a small, regional CMO to a top 15 global (5) 40 generics player 35 14 › Alvogen CEE divested in 2020 at a 13.1x MoM on invested equity and IRR of 37% › Lotus Pharmaceuticals (Alvogen’s listed Asia business) divestiture (1999 – 2008) (2009 – 2020) (2021A – 2025E) (7) expected in 2022 at a 7.6x MoM on invested equity and IRR of 27% 1. Robert Wessman left his role at Actavis in September 2008 6 2. Represents CAGR based on share price of €0.05 as of 1/1/2000 and €1.075 offer price per Novator’s July 2007 acquisition of Actavis 3. Reflects LTM 6/30/2007 revenue, prior to Actavis’ de-listing in August 2007 4. Includes run rate revenues from Alvotechs CEE business, which was sold to Zentiva in April of 2020. 5. Unaudited revenues 6. Estimated risk adjusted revenue 7. Subject to regulatory approval
This is Alvotech 7
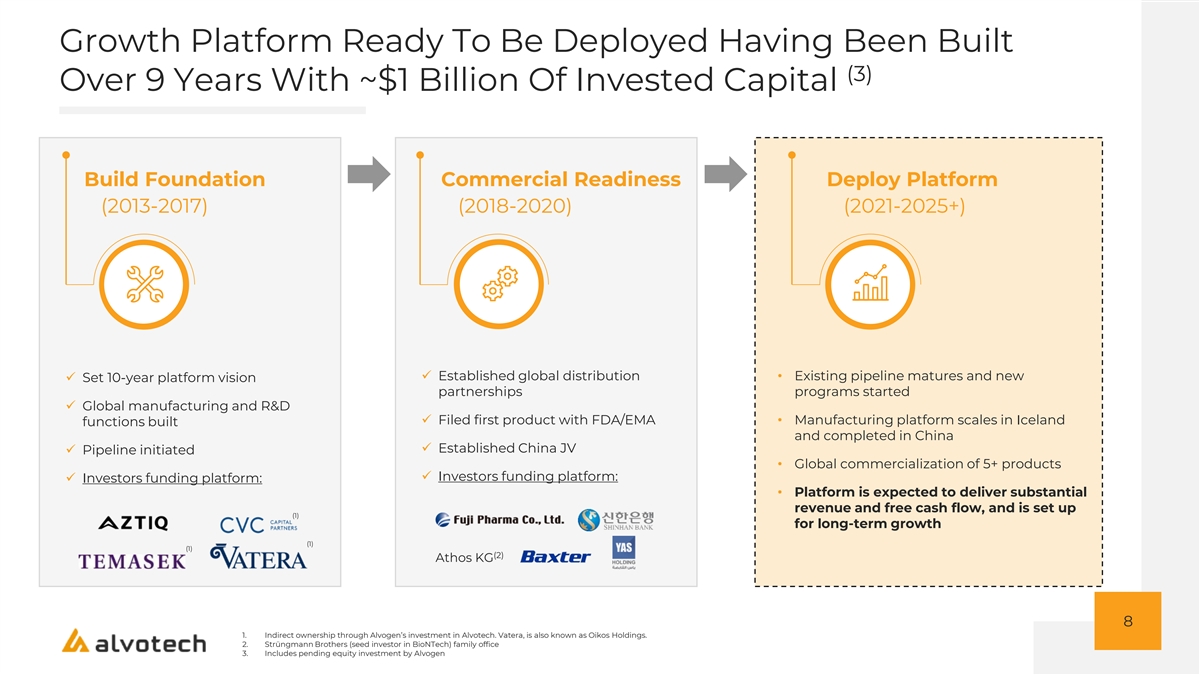
Growth Platform Ready To Be Deployed Having Been Built (3) Over 9 Years With ~$1 Billion Of Invested Capital Build Foundation Commercial Readiness Deploy Platform (2013-2017) (2018-2020) (2021-2025+) ✓ Established global distribution • Existing pipeline matures and new ✓ Set 10-year platform vision partnerships programs started ✓ Global manufacturing and R&D ✓ Filed first product with FDA/EMA• Manufacturing platform scales in Iceland functions built and completed in China ✓ Established China JV ✓ Pipeline initiated • Global commercialization of 5+ products ✓ Investors funding platform: ✓ Investors funding platform: • Platform is expected to deliver substantial revenue and free cash flow, and is set up (1) for long-term growth (1) (1) (2) Athos KG 8 1. Indirect ownership through Alvogen’s investment in Alvotech. Vatera, is also known as Oikos Holdings. 2. Strüngmann Brothers (seed investor in BioNTech) family office 3. Includes pending equity investment by Alvogen
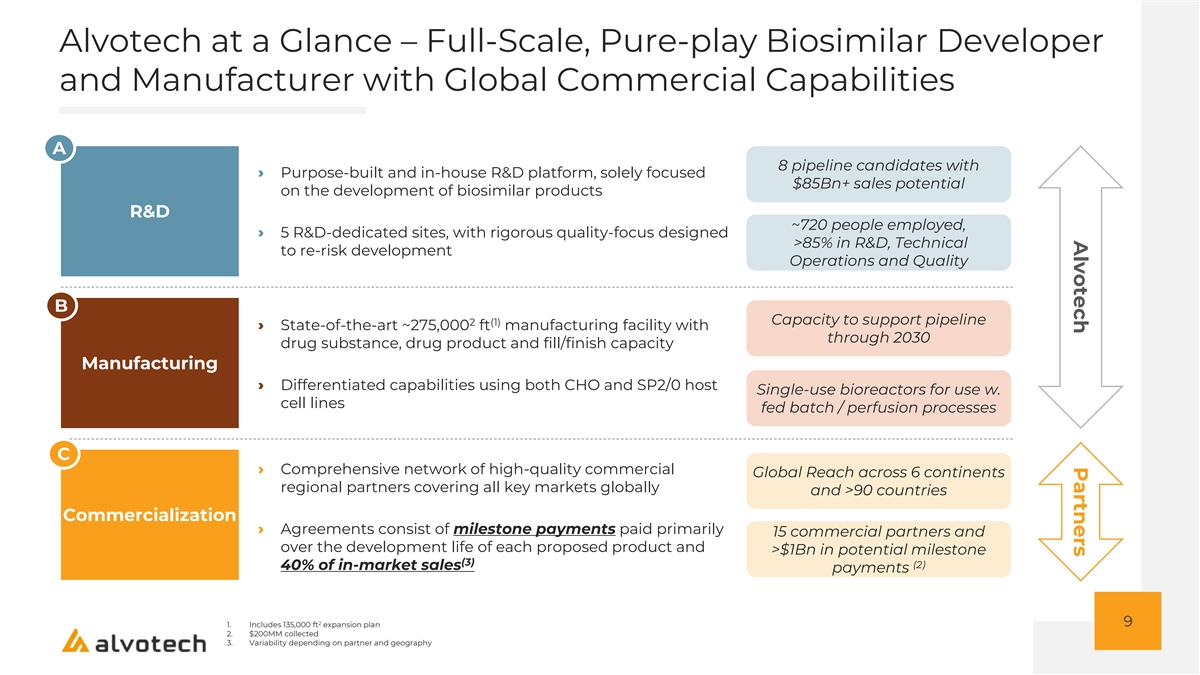
Alvotech Partners Alvotech at a Glance – Full-Scale, Pure-play Biosimilar Developer and Manufacturer with Global Commercial Capabilities A 8 pipeline candidates with › Purpose-built and in-house R&D platform, solely focused $85Bn+ sales potential on the development of biosimilar products R&D ~720 people employed, › 5 R&D-dedicated sites, with rigorous quality-focus designed >85% in R&D, Technical to re-risk development Operations and Quality B Capacity to support pipeline 2 (1) › State-of-the-art ~275,000 ft manufacturing facility with through 2030 drug substance, drug product and fill/finish capacity Manufacturing › Differentiated capabilities using both CHO and SP2/0 host Single-use bioreactors for use w. cell lines fed batch / perfusion processes C › Comprehensive network of high-quality commercial Global Reach across 6 continents regional partners covering all key markets globally and >90 countries Commercialization › Agreements consist of milestone payments paid primarily 15 commercial partners and over the development life of each proposed product and >$1Bn in potential milestone (3) (2) 40% of in-market sales payments 2 9 1. Includes 135,000 ft expansion plan 2. $200MM collected 3. Variability depending on partner and geography
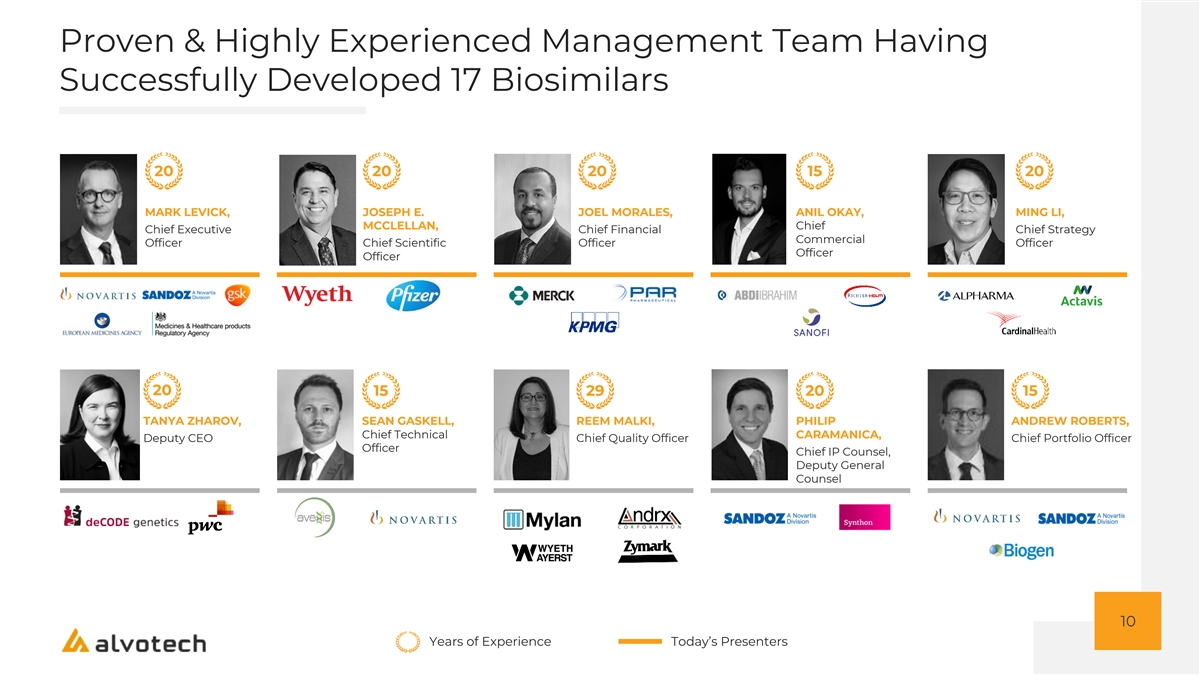
Proven & Highly Experienced Management Team Having Successfully Developed 17 Biosimilars 20 20 20 15 20 MARK LEVICK, JOSEPH E. JOEL MORALES, ANIL OKAY, MING LI, MCCLELLAN, Chief Chief Executive Chief Financial Chief Strategy Commercial Officer Chief Scientific Officer Officer Officer Officer 20 15 29 20 15 TANYA ZHAROV, SEAN GASKELL, REEM MALKI, PHILIP ANDREW ROBERTS, Chief Technical CARAMANICA, Deputy CEO Chief Quality Officer Chief Portfolio Officer Officer Chief IP Counsel, Deputy General Counsel 10 Years of Experience Today’s Presenters
Highly Aligned Social And Corporate Purpose Corporate Purpose Social Purpose Alvotech is dedicated to Alvotech aims to be the making patients’ lives leading supplier of better by improving access biosimilars globally to affordable biosimilar medicines and the sustainability Our corporate purpose is aligned with our social of healthcare systems purpose 11
SIGNIFICANT MARKET OPPORTUNITY
Opportune Timing for Industry and Alvotech • Established regulatory pathway to market including interchangeability for the U.S. market Biosimilar • Significant number of biologic LoEs on the Market horizon • Global biosimilars market estimated to grow to Evolution $79 billion in 2026 (17% CAGR from 2020) Attractive Global • Biosimilar specific platform built over ~10 years Opportunity for • Attractive pipeline of products about to Alvotech Alvotech commercialize • Global network of partners catering to regional Development market nuances • ~1Bn invested over 10 years as a private company 13
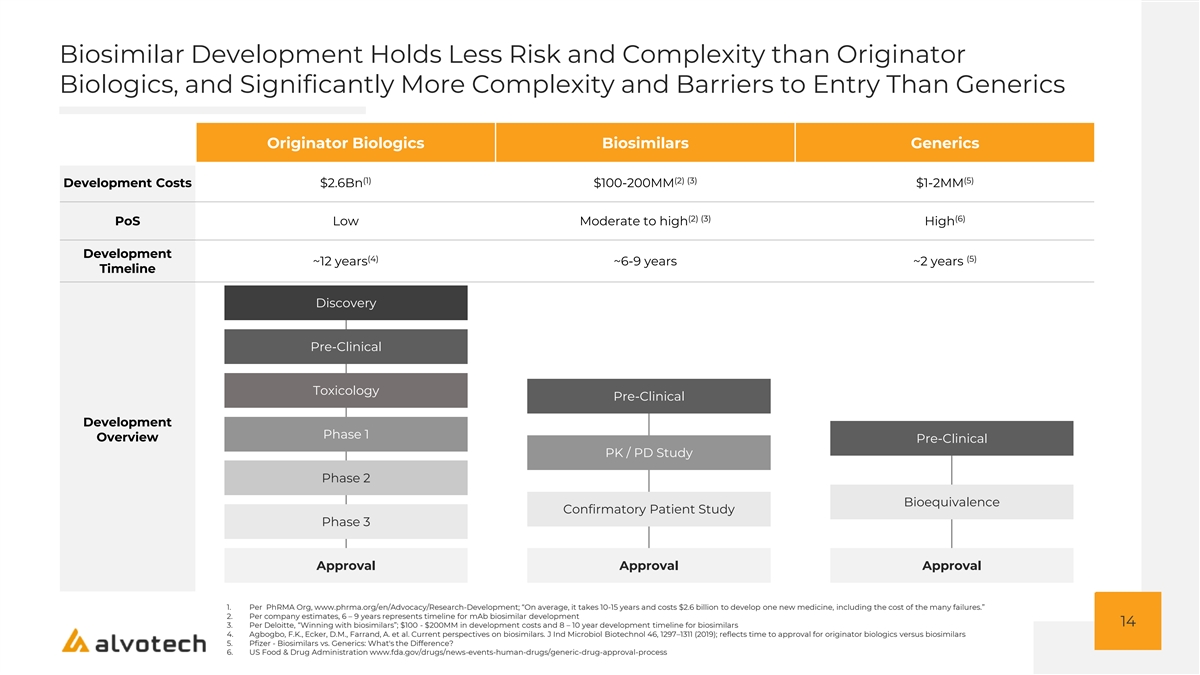
Biosimilar Development Holds Less Risk and Complexity than Originator Biologics, and Significantly More Complexity and Barriers to Entry Than Generics Originator Biologics Biosimilars Generics (1) (2) (3) (5) Development Costs $2.6Bn $100-200MM $1-2MM (2) (3) (6) PoS Low Moderate to high High Development (4) (5) ~12 years ~6-9 years ~2 years Timeline Discovery Pre-Clinical Toxicology Pre-Clinical Development Phase 1 Overview Pre-Clinical PK / PD Study Phase 2 Bioequivalence Confirmatory Patient Study Phase 3 Approval Approval Approval 1. Per PhRMA Org, www.phrma.org/en/Advocacy/Research-Development; “On average, it takes 10-15 years and costs $2.6 billion to develop one new medicine, including the cost of the many failures.” 2. Per company estimates, 6 – 9 years represents timeline for mAb biosimilar development 14 3. Per Deloitte, “Winning with biosimilars”; $100 - $200MM in development costs and 8 – 10 year development timeline for biosimilars 4. Agbogbo, F.K., Ecker, D.M., Farrand, A. et al. Current perspectives on biosimilars. J Ind Microbiol Biotechnol 46, 1297–1311 (2019); reflects time to approval for originator biologics versus biosimilars 5. Pfizer - Biosimilars vs. Generics: What's the Difference? 6. US Food & Drug Administration www.fda.gov/drugs/news-events-human-drugs/generic-drug-approval-process
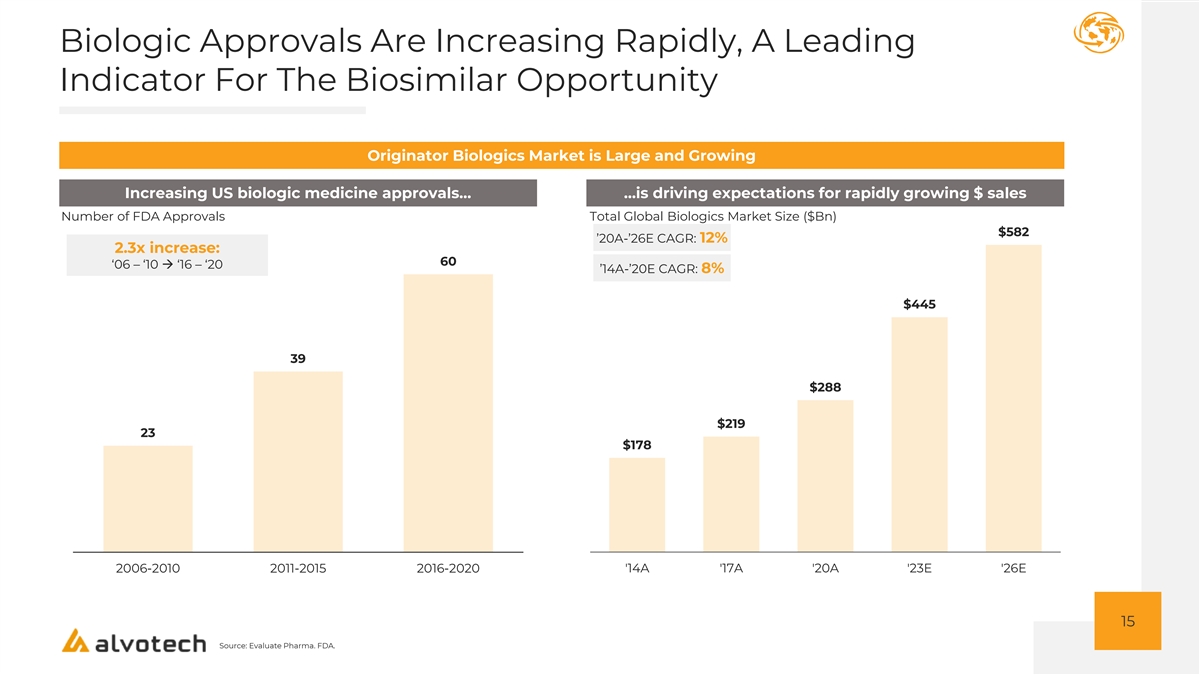
Biologic Approvals Are Increasing Rapidly, A Leading Indicator For The Biosimilar Opportunity Originator Biologics Market is Large and Growing Increasing US biologic medicine approvals… …is driving expectations for rapidly growing $ sales Number of FDA Approvals Total Global Biologics Market Size ($Bn) $582 ’20A-’26E CAGR: 12% 2.3x increase: 60 ‘06 – ‘10 → ‘16 – ‘20 ’14A-’20E CAGR: 8% $445 39 $288 $219 23 $178 2006-2010 2011-2015 2016-2020 '14A '17A '20A '23E '26E 15 Source: Evaluate Pharma. FDA.
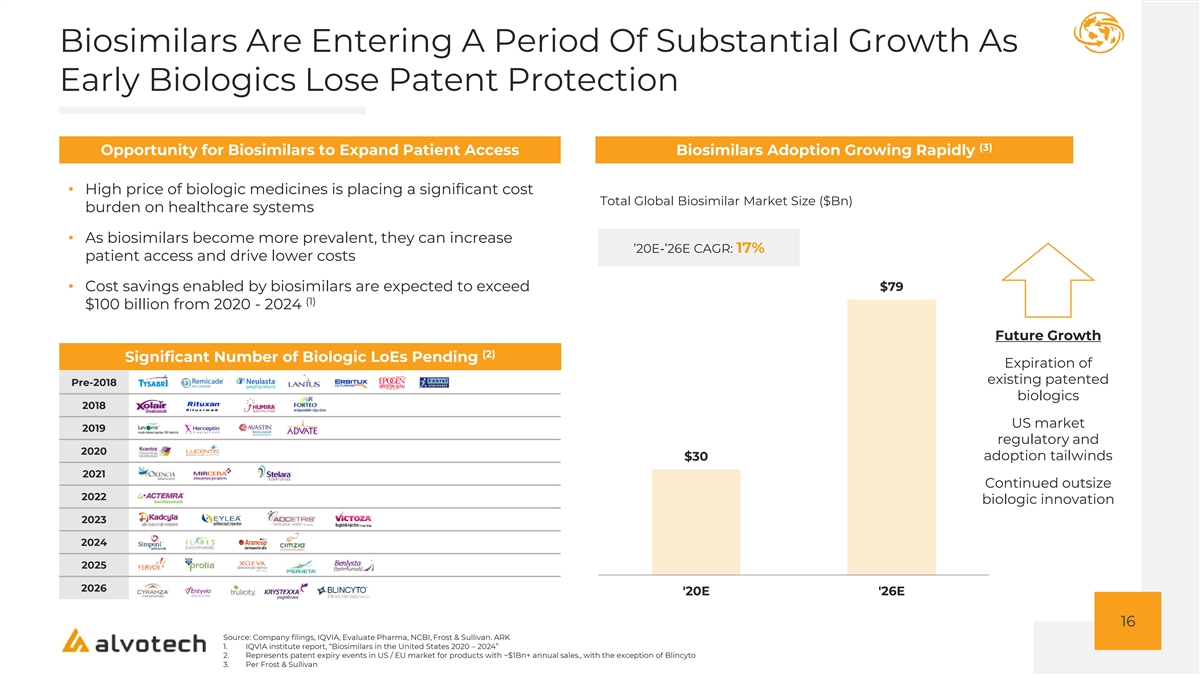
Biosimilars Are Entering A Period Of Substantial Growth As Early Biologics Lose Patent Protection (3) Opportunity for Biosimilars to Expand Patient Access Biosimilars Adoption Growing Rapidly • High price of biologic medicines is placing a significant cost Total Global Biosimilar Market Size ($Bn) burden on healthcare systems • As biosimilars become more prevalent, they can increase ’20E-’26E CAGR: 17% patient access and drive lower costs • Cost savings enabled by biosimilars are expected to exceed $79 (1) $100 billion from 2020 - 2024 Future Growth (2) Significant Number of Biologic LoEs Pending Expiration of existing patented Pre-2018 biologics 2018 US market 2019 regulatory and 2020 adoption tailwinds $30 2021 Continued outsize 2022 biologic innovation 2023 2024 2025 2026 '20E '26E 16 Source: Company filings, IQVIA, Evaluate Pharma, NCBI, Frost & Sullivan. ARK 1. IQVIA institute report, “Biosimilars in the United States 2020 – 2024” 2. Represents patent expiry events in US / EU market for products with ~$1Bn+ annual sales., with the exception of Blincyto 3. Per Frost & Sullivan
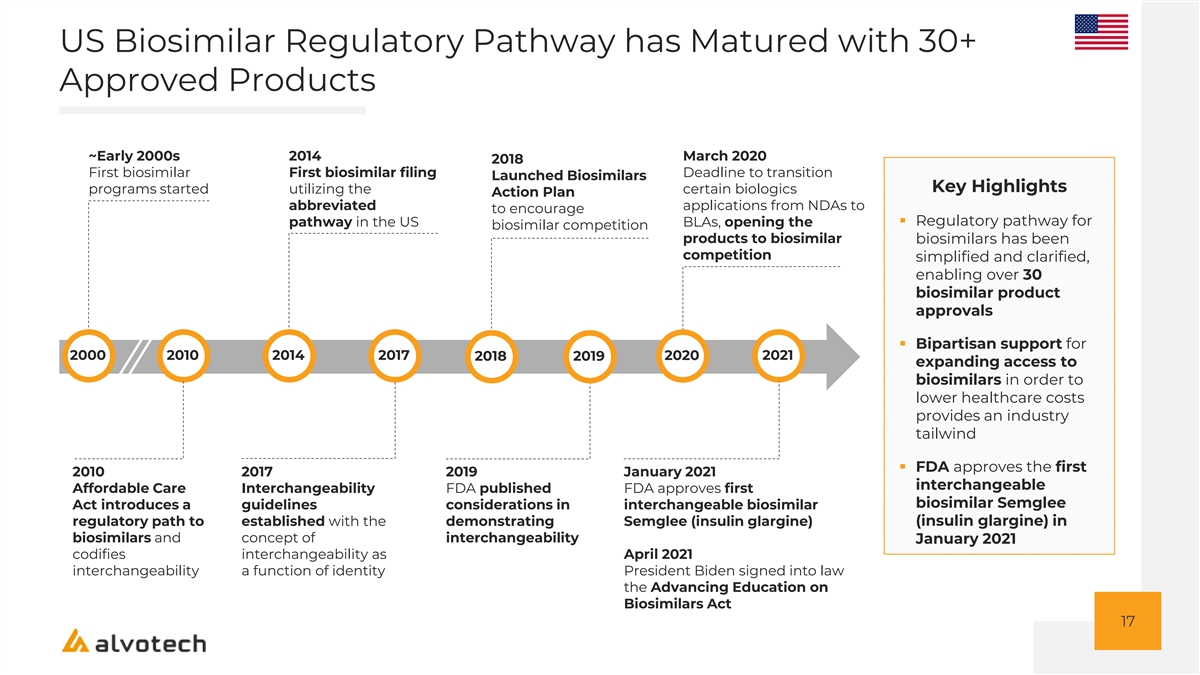
US Biosimilar Regulatory Pathway has Matured with 30+ Approved Products ~Early 2000s 2014 March 2020 2018 First biosimilar First biosimilar filing Deadline to transition Launched Biosimilars Key Highlights programs started utilizing the certain biologics Action Plan abbreviated applications from NDAs to to encourage pathway in the US BLAs, opening the ▪ Regulatory pathway for biosimilar competition products to biosimilar biosimilars has been competition simplified and clarified, enabling over 30 biosimilar product approvals ▪ Bipartisan support for 2000 2010 2014 2017 2020 2021 2018 2019 expanding access to biosimilars in order to lower healthcare costs provides an industry tailwind ▪ FDA approves the first 2010 2017 2019 January 2021 interchangeable Affordable Care Interchangeability FDA published FDA approves first biosimilar Semglee Act introduces a guidelines considerations in interchangeable biosimilar regulatory path to established with the demonstrating Semglee (insulin glargine) (insulin glargine) in biosimilars and concept of interchangeability January 2021 codifies interchangeability as April 2021 interchangeability a function of identity President Biden signed into law the Advancing Education on Biosimilars Act 17
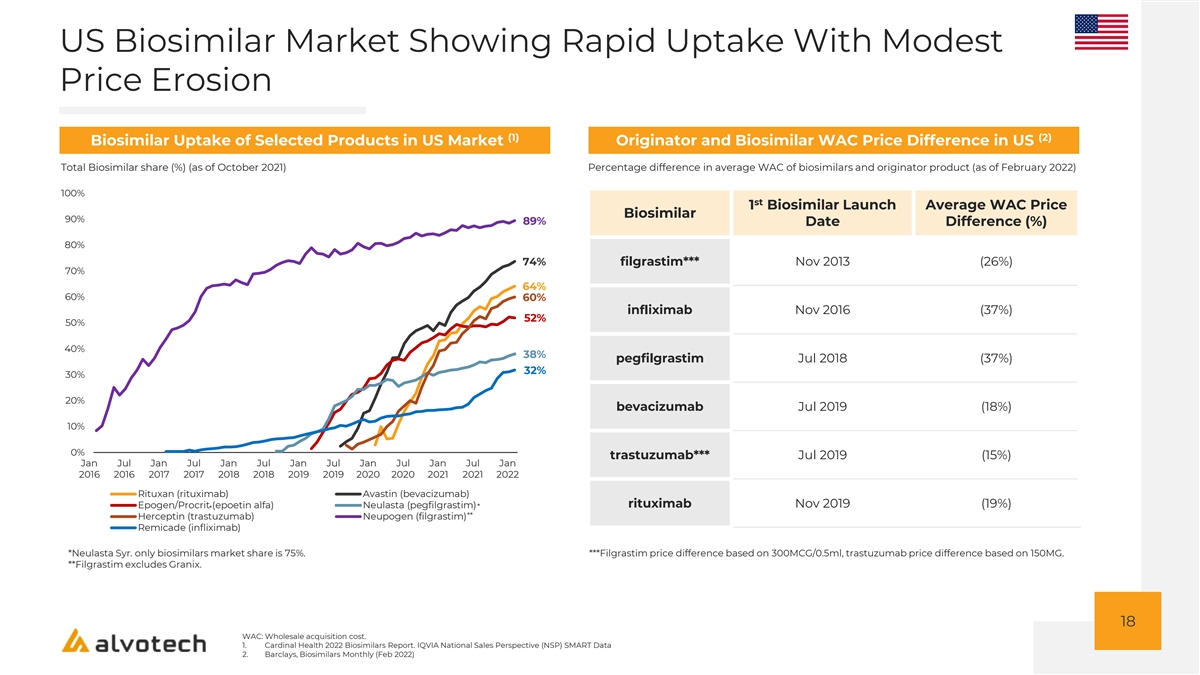
US Biosimilar Market Showing Rapid Uptake With Modest Price Erosion (1) (2) Biosimilar Uptake of Selected Products in US Market Originator and Biosimilar WAC Price Difference in US Total Biosimilar share (%) (as of October 2021) Percentage difference in average WAC of biosimilars and originator product (as of February 2022) 100% st 1 Biosimilar Launch Average WAC Price Biosimilar 90% 89% Date Difference (%) 80% 74% filgrastim*** Nov 2013 (26%) 70% 64% 60% 60% infliximab Nov 2016 (37%) 52% 50% 40% 38% pegfilgrastim Jul 2018 (37%) 32% 30% 20% bevacizumab Jul 2019 (18%) 10% 0% trastuzumab*** Jul 2019 (15%) Jan Jul Jan Jul Jan Jul Jan Jul Jan Jul Jan Jul Jan 2016 2016 2017 2017 2018 2018 2019 2019 2020 2020 2021 2021 2022 Rituxan (rituximab) Avastin (bevacizumab) rituximab Nov 2019 (19%) Epogen/Procrit (epoetin alfa) Neulasta (pegfilgrastim)* * ** Herceptin (trastuzumab) Neupogen (filgrastim) Remicade (infliximab) *Neulasta Syr. only biosimilars market share is 75%. ***Filgrastim price difference based on 300MCG/0.5ml, trastuzumab price difference based on 150MG. **Filgrastim excludes Granix. 18 WAC: Wholesale acquisition cost. 1. Cardinal Health 2022 Biosimilars Report. IQVIA National Sales Perspective (NSP) SMART Data 2. Barclays, Biosimilars Monthly (Feb 2022)
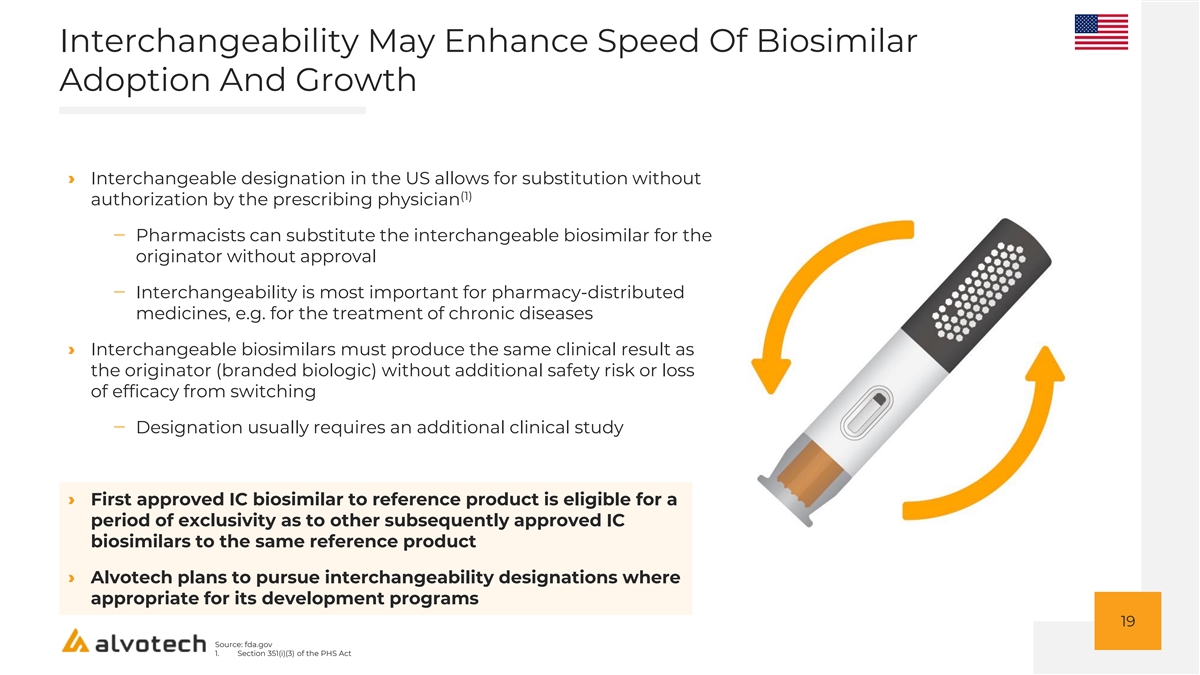
Interchangeability May Enhance Speed Of Biosimilar Adoption And Growth › Interchangeable designation in the US allows for substitution without (1) authorization by the prescribing physician ‒ Pharmacists can substitute the interchangeable biosimilar for the originator without approval ‒ Interchangeability is most important for pharmacy-distributed medicines, e.g. for the treatment of chronic diseases › Interchangeable biosimilars must produce the same clinical result as the originator (branded biologic) without additional safety risk or loss of efficacy from switching ‒ Designation usually requires an additional clinical study › First approved IC biosimilar to reference product is eligible for a period of exclusivity as to other subsequently approved IC biosimilars to the same reference product › Alvotech plans to pursue interchangeability designations where appropriate for its development programs 19 Source: fda.gov 1. Section 351(i)(3) of the PHS Act

EU Has Pioneered the Regulation of Biosimilars and Has 80+ Approved Biosimilars Early 2000s 2005 2007 2015 First biosimilar EMA publishes EMA provides EMA provides revised Key Highlights programs guidelines on comparability general guidelines on started biosimilars guidelines for biosimilars and revised non- ▪ Europe is the most biosimilars clinical and clinical mature biosimilars requirements on biosimilars market and serves as a proof point for emerging markets ▪ First regulatory agency to establish regulatory 2000 2004 2005 2006 2007 2015 pathway and to approve biosimilar, enabling over 80 biosimilar product 2006 - 2018 approvals EMA provides additional product-specific biosimilar guidelines 2004 2006 European regulatory EMA publishes initial quality pathway established and non-clinical / clinical requirements on biosimilars First biosimilar Omnitrope (somatropin) 20
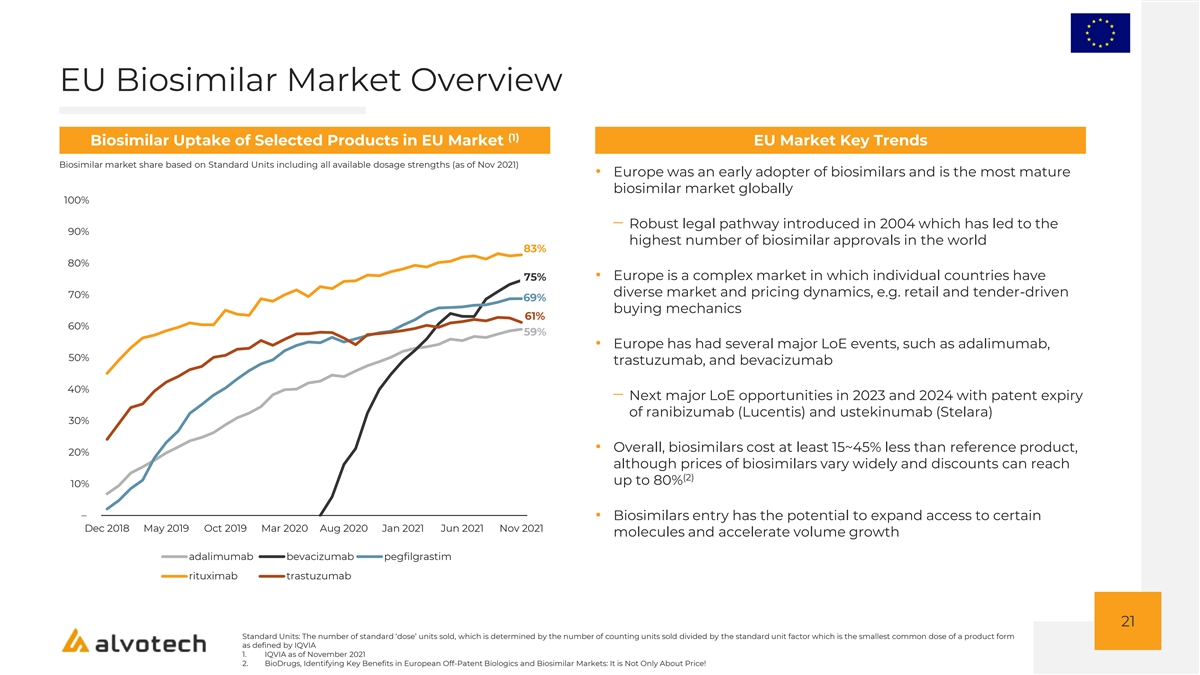
EU Biosimilar Market Overview (1) Biosimilar Uptake of Selected Products in EU Market EU Market Key Trends Biosimilar market share based on Standard Units including all available dosage strengths (as of Nov 2021) • Europe was an early adopter of biosimilars and is the most mature biosimilar market globally 100% ‒ Robust legal pathway introduced in 2004 which has led to the 90% highest number of biosimilar approvals in the world 83% 80% • Europe is a complex market in which individual countries have 75% diverse market and pricing dynamics, e.g. retail and tender-driven 70% 69% buying mechanics 61% 60% 59% • Europe has had several major LoE events, such as adalimumab, 50% trastuzumab, and bevacizumab 40% ‒ Next major LoE opportunities in 2023 and 2024 with patent expiry of ranibizumab (Lucentis) and ustekinumab (Stelara) 30% • Overall, biosimilars cost at least 15~45% less than reference product, 20% although prices of biosimilars vary widely and discounts can reach (2) up to 80% 10% – • Biosimilars entry has the potential to expand access to certain Dec 2018 May 2019 Oct 2019 Mar 2020 Aug 2020 Jan 2021 Jun 2021 Nov 2021 molecules and accelerate volume growth adalimumab bevacizumab pegfilgrastim rituximab trastuzumab 21 Standard Units: The number of standard ‘dose’ units sold, which is determined by the number of counting units sold divided by the standard unit factor which is the smallest common dose of a product form as defined by IQVIA 1. IQVIA as of November 2021 2. BioDrugs, Identifying Key Benefits in European Off-Patent Biologics and Biosimilar Markets: It is Not Only About Price!
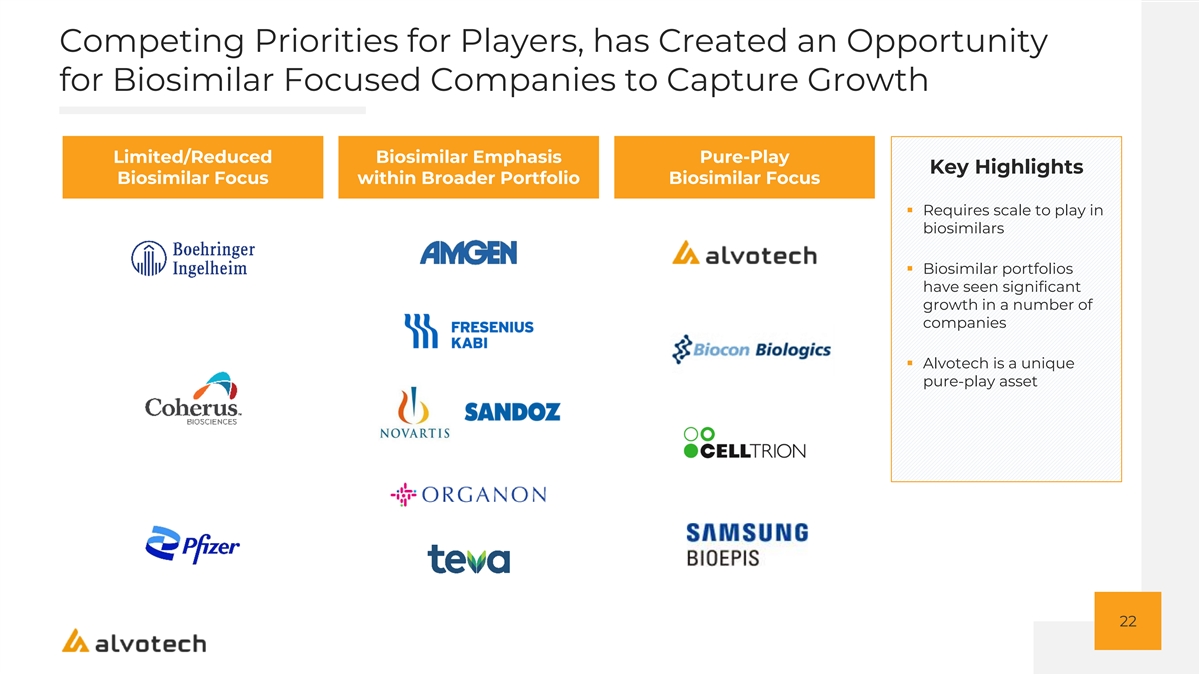
Competing Priorities for Players, has Created an Opportunity for Biosimilar Focused Companies to Capture Growth Limited/Reduced Biosimilar Emphasis Pure-Play Key Highlights Biosimilar Focus within Broader Portfolio Biosimilar Focus ▪ Requires scale to play in biosimilars ▪ Biosimilar portfolios have seen significant growth in a number of companies ▪ Alvotech is a unique pure-play asset 22
Benefits of a Core Focus Strategy on Biosimilars Aligned Corporate Purpose ✓ › Mission driven purpose motivates and attracts high quality team › Provides pure-play exposure in a fast-growing market with limited true comps › Provides unique ESG characteristics Nimble and Adaptable ✓ › Flexibility to quickly adapt to innovator life cycle adjustments › Fast decision making with a focused business model › Lower risk business model as the clinical certainty is much higher than innovative business Limits Competition of Resources ✓ › No internal competition from a branded business segment, all resources can be focused on biosimilars › Portfolio Selection freedom purely focusing on Biosimilars 23
Q&A 24
PURPOSE-BUILT BIOSIMILAR PLATFORM
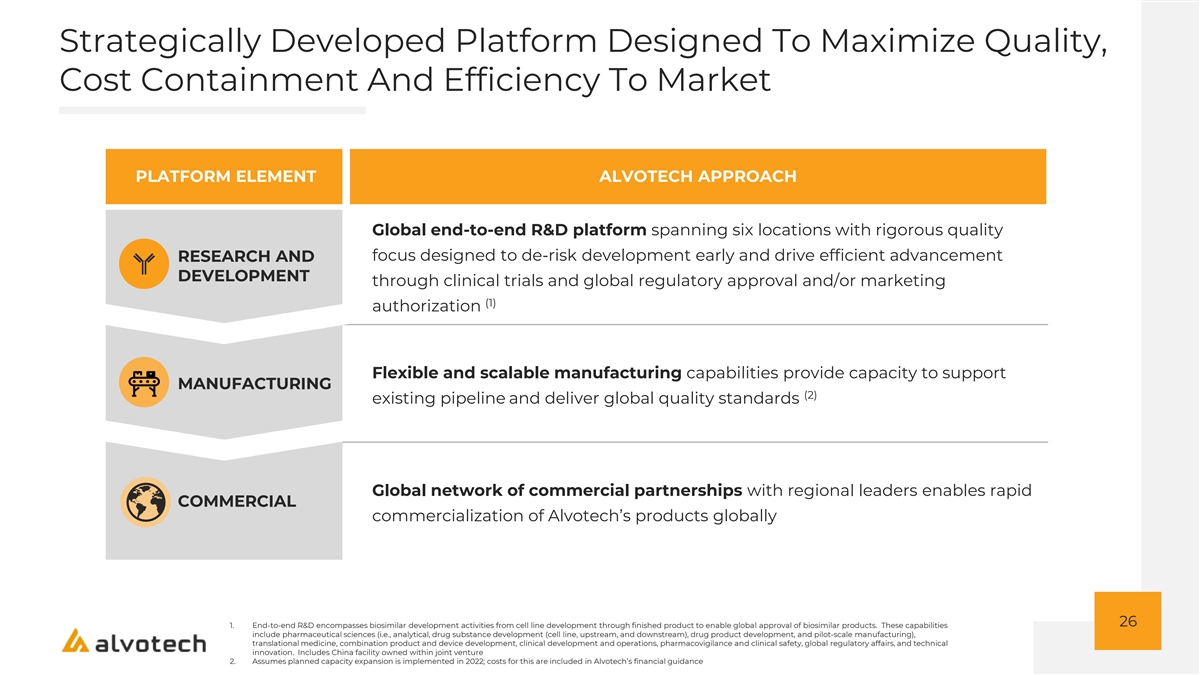
Strategically Developed Platform Designed To Maximize Quality, Cost Containment And Efficiency To Market PLATFORM ELEMENT ALVOTECH APPROACH Global end-to-end R&D platform spanning six locations with rigorous quality focus designed to de-risk development early and drive efficient advancement RESEARCH AND DEVELOPMENT through clinical trials and global regulatory approval and/or marketing (1) authorization Flexible and scalable manufacturing capabilities provide capacity to support MANUFACTURING (2) existing pipeline and deliver global quality standards Global network of commercial partnerships with regional leaders enables rapid COMMERCIAL commercialization of Alvotech’s products globally 26 1. End-to-end R&D encompasses biosimilar development activities from cell line development through finished product to enable global approval of biosimilar products. These capabilities include pharmaceutical sciences (i.e., analytical, drug substance development (cell line, upstream, and downstream), drug product development, and pilot-scale manufacturing), translational medicine, combination product and device development, clinical development and operations, pharmacovigilance and clinical safety, global regulatory affairs, and technical innovation. Includes China facility owned within joint venture 2. Assumes planned capacity expansion is implemented in 2022; costs for this are included in Alvotech’s financial guidance
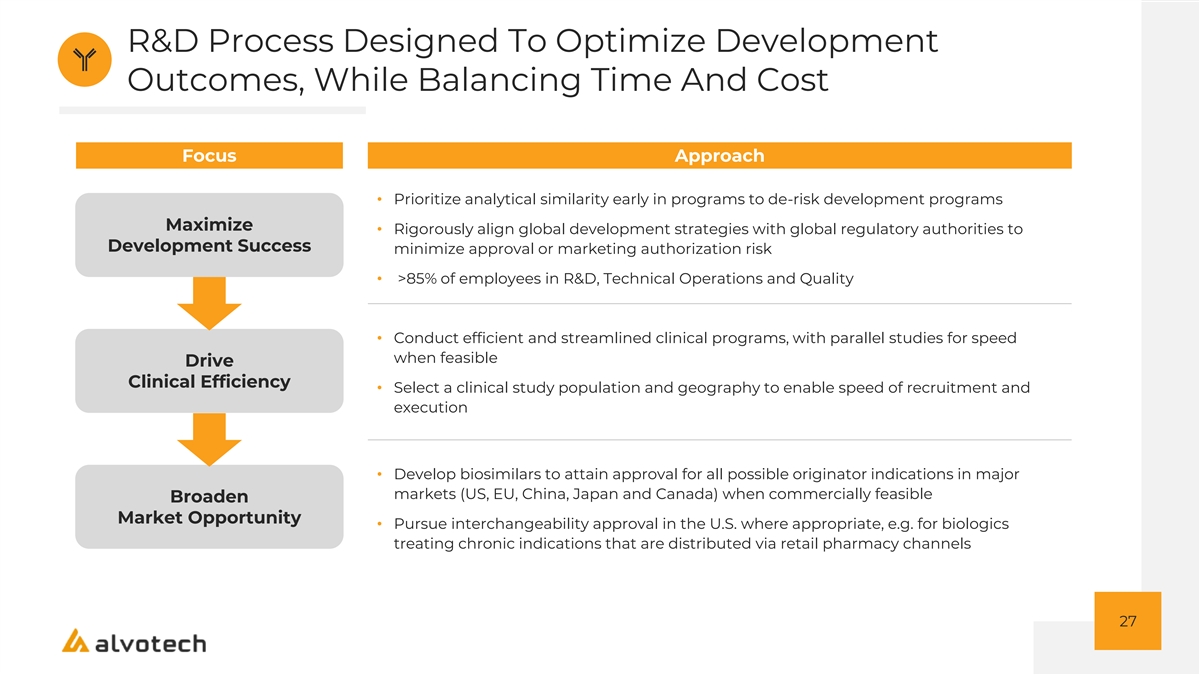
R&D Process Designed To Optimize Development Outcomes, While Balancing Time And Cost Focus Approach • Prioritize analytical similarity early in programs to de-risk development programs Maximize • Rigorously align global development strategies with global regulatory authorities to Development Success minimize approval or marketing authorization risk • >85% of employees in R&D, Technical Operations and Quality • Conduct efficient and streamlined clinical programs, with parallel studies for speed when feasible Drive Clinical Efficiency • Select a clinical study population and geography to enable speed of recruitment and execution • Develop biosimilars to attain approval for all possible originator indications in major markets (US, EU, China, Japan and Canada) when commercially feasible Broaden Market Opportunity • Pursue interchangeability approval in the U.S. where appropriate, e.g. for biologics treating chronic indications that are distributed via retail pharmacy channels 27
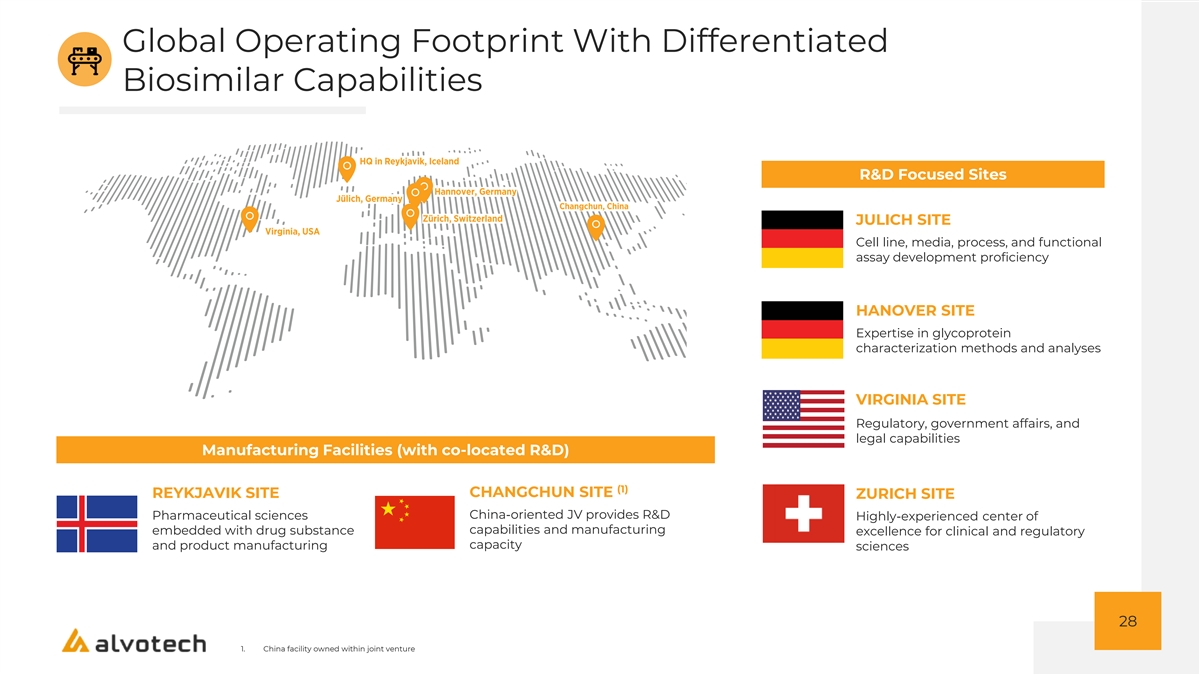
Global Operating Footprint With Differentiated Biosimilar Capabilities R&D Focused Sites JULICH SITE Cell line, media, process, and functional assay development proficiency HANOVER SITE Expertise in glycoprotein characterization methods and analyses VIRGINIA SITE Regulatory, government affairs, and legal capabilities Manufacturing Facilities (with co-located R&D) (1) CHANGCHUN SITE REYKJAVIK SITE ZURICH SITE China-oriented JV provides R&D Pharmaceutical sciences Highly-experienced center of capabilities and manufacturing embedded with drug substance excellence for clinical and regulatory capacity and product manufacturing sciences 28 1. China facility owned within joint venture
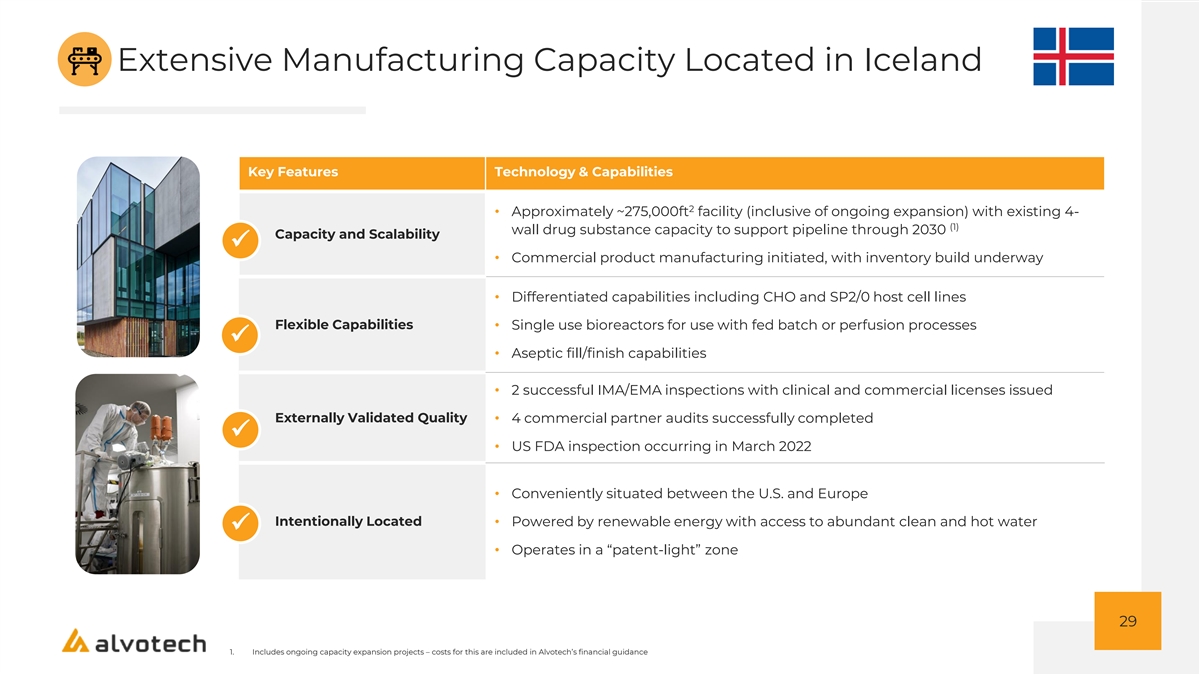
Extensive Manufacturing Capacity Located in Iceland Key Features Technology & Capabilities 2 • Approximately ~275,000ft facility (inclusive of ongoing expansion) with existing 4- (1) wall drug substance capacity to support pipeline through 2030 Capacity and Scalability ✓ • Commercial product manufacturing initiated, with inventory build underway • Differentiated capabilities including CHO and SP2/0 host cell lines Flexible Capabilities • Single use bioreactors for use with fed batch or perfusion processes ✓ • Aseptic fill/finish capabilities • 2 successful IMA/EMA inspections with clinical and commercial licenses issued Externally Validated Quality• 4 commercial partner audits successfully completed ✓ • US FDA inspection occurring in March 2022 • Conveniently situated between the U.S. and Europe Intentionally Located• Powered by renewable energy with access to abundant clean and hot water ✓ • Operates in a “patent-light” zone 29 1. Includes ongoing capacity expansion projects – costs for this are included in Alvotech’s financial guidance
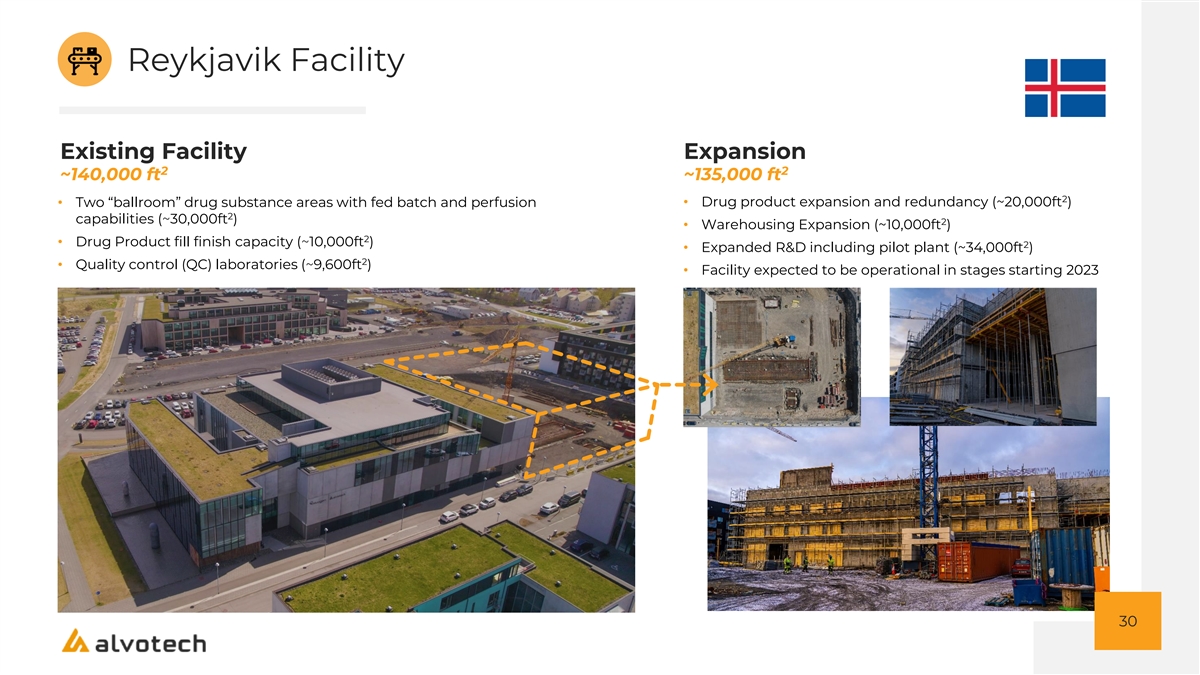
Reykjavik Facility Existing Facility Expansion 2 2 ~140,000 ft ~135,000 ft 2 • Drug product expansion and redundancy (~20,000ft ) • Two “ballroom” drug substance areas with fed batch and perfusion 2 capabilities (~30,000ft ) 2 • Warehousing Expansion (~10,000ft ) 2 • Drug Product fill finish capacity (~10,000ft ) 2 • Expanded R&D including pilot plant (~34,000ft ) 2 • Quality control (QC) laboratories (~9,600ft ) • Facility expected to be operational in stages starting 2023 30
GLOBAL COMMERCIAL PARTNER NETWORK
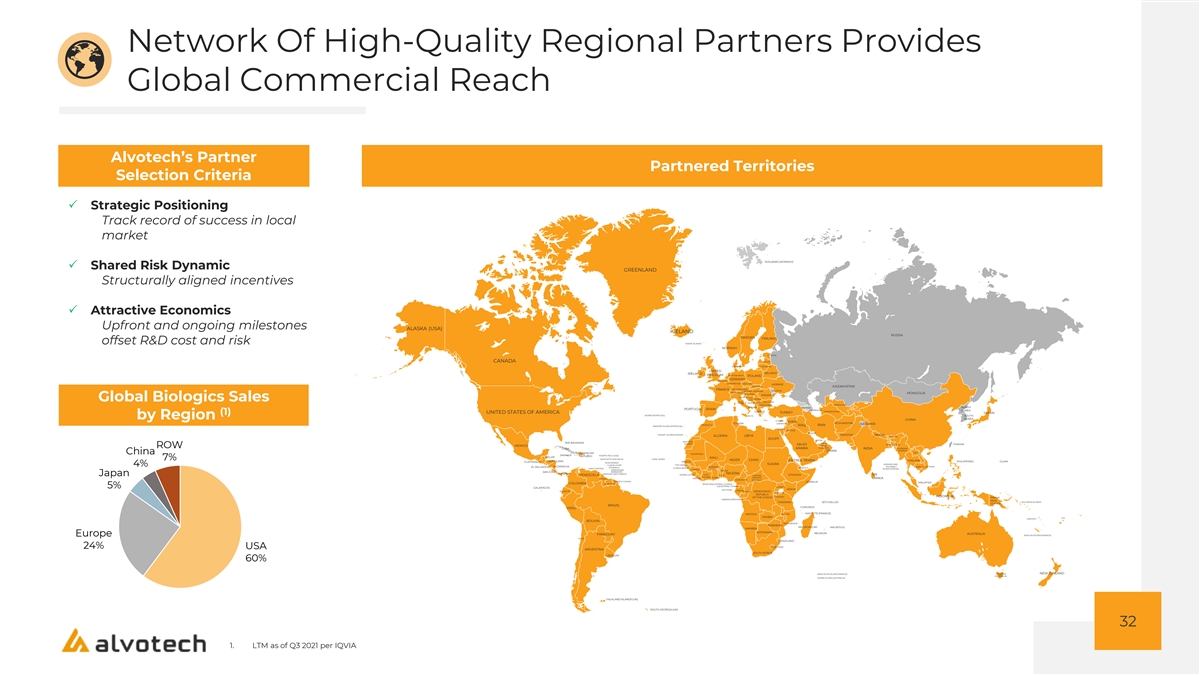
Network Of High-Quality Regional Partners Provides Global Commercial Reach Alvotech’s Partner Partnered Territories Selection Criteria P Strategic Positioning Track record of success in local market SVALBARD (NORWAY) P Shared Risk Dynamic GREENLAND Structurally aligned incentives P Attractive Economics Upfront and ongoing milestones ALASKA (USA) ICELAND RUSSIA SWEDEN FINLAND offset R&D cost and risk FAROE ISLANDS NORWAY ESTONIA CANADA LATVIA DENMARK LITHUANIA UNITED BELARUS IRELAND KINGDOM NETHERLANDS POLAND GERMANY BELGIUM LUXEMBOURG CZECH REP UKRAINE SLOVAKIA KAZAKHSTAN LIECHTENSTEIN FRANCE MOLDOVA AUSTRIA HUNGARY SWITZERLAND SLOVENIA MONGOLIA ROMANIA BOSNIA CROATIA AND SERBIA Global Biologics Sales HERZ. BULGARIA ITALY MONTENEGRO MACEDONIA UZBEKISTAN ALBANIA ARMENIA NORTH PORTUGAL SPAIN AZERBAIJAN KOREA GREECE TURKMENISTAN UNITED STATES OF AMERICA TURKEY JAPAN (1) AZORES (PORTUGAL) MALTA SOUTH by Region KOREA CHINA CYPRUS SYRIA AFGHANISTAN TUNISIA LEBANON KASHMIR MOROCCO IRAQ IRAN MADEIRA ISLAND (PORTUGAL) ISRAEL JORDAN KUWAIT CANARY ISLANDS (SPAIN) PAKISTAN NEPAL ALGERIA LIBYA BHUTAN EGYPT QATAR WESTERN THE BAHAMAS SHARAH UNITED TAIWAN SAUDI ARAB BANGLADESH MEXICO ROW EMIRATES CUBA ARABIA INDIA MYANMAR (BURMA) OMAN HAITI DOMINICAN LAOS China MAURITANIA JAMAICA PUERTO RICO (USA) REPUBLIC BELIZE MALI SAINT KITTS AND NEVIS CAPE VERDE 7% NIGER CHAD ERITREA YEMEN THAILAND GUATEMALA HONDURAS SENEGAL PHILIPPINES GUAM MONTSERRAT SUDAN ADAMAN AND GUADELOUPE THE GAMBIA 4% EL SALVADOR NICARAGUA BURKINA NICOBAR CAMBODIA VIETNAM DOMINICA GUINEA-BISSAU DJIBOUTI SAINT VINCENT GUINEA FASO ISLANDS (INDIA) MARTINIQUE BENIN SAN JOSE BARBADOS PANAMA TRINIDAD AND TOBAGO NIGERIA Japan VENEZUELA SIERRA LEONE COTE TOGO CENTRAL ETHIOPIA SRI D’IVOIRE GHANA AFRICAN GUYANA LIBERIA LANKA CAMEROON REPUBLIC FRENCH GUIANA SOMALIA MALAYSIA COLOMBIA SURINAME BIOKO (EQUATORIAL GUINEA) EQUATORIAL GUINEA UGANDA 5% GALAPAGOS KENYA SAO TOME GABON ECUADOR CONGO DEMOCRATIC RWANDA REPUBLIC BURUNDI INDONESIA OF THE CONGO PAPUA CABINDA (PROVINCE) NEW SOLOMON ISLANDS TANZANIA SEYCHELLES GUINEA BRAZIL COMOROS PERU ANGOLA MALAWI MAYOTTE (FRANCE) ZAMBIA FIJI VANUATU BOLIVIA MOZAMBIQUE ZIMBABWE MADAGASCAR MAURITIUS NAMIBIA BOTSWANA REUNION AUSTRALIA Europe PARAGUAY NEW CALEDONIA (FRANCE) CHILE SWAZILAND 24% LESOTHO USA ARGENTINA SOUTH AFRICA URUGUAY 60% KERGUELEN ISLAND (FRANCE) TASMANIA NEW ZEALAND (AUSTRALIA) HEARD ISLAND (AUSTRALIA) FALKLAND ISLANDS (UK) SOUTH GEORGIA (UK) 32 1. LTM as of Q3 2021 per IQVIA
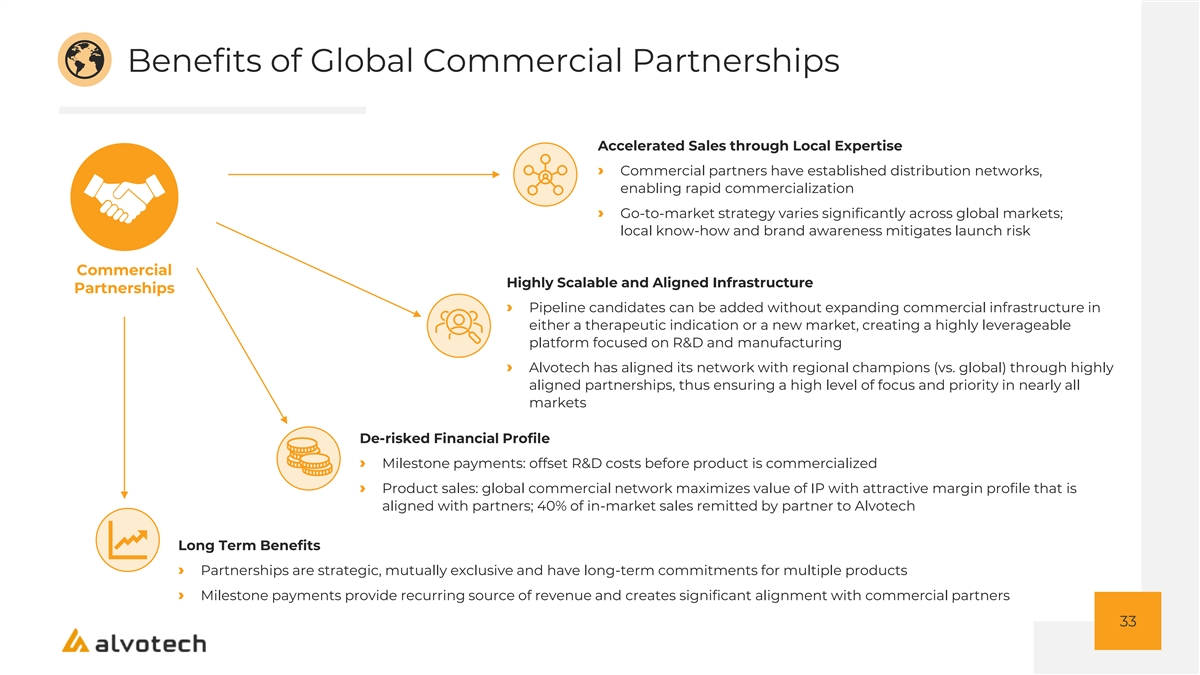
Benefits of Global Commercial Partnerships Accelerated Sales through Local Expertise › Commercial partners have established distribution networks, enabling rapid commercialization › Go-to-market strategy varies significantly across global markets; local know-how and brand awareness mitigates launch risk Commercial Highly Scalable and Aligned Infrastructure Partnerships › Pipeline candidates can be added without expanding commercial infrastructure in either a therapeutic indication or a new market, creating a highly leverageable platform focused on R&D and manufacturing › Alvotech has aligned its network with regional champions (vs. global) through highly aligned partnerships, thus ensuring a high level of focus and priority in nearly all markets De-risked Financial Profile › Milestone payments: offset R&D costs before product is commercialized › Product sales: global commercial network maximizes value of IP with attractive margin profile that is aligned with partners; 40% of in-market sales remitted by partner to Alvotech Long Term Benefits › Partnerships are strategic, mutually exclusive and have long-term commitments for multiple products › Milestone payments provide recurring source of revenue and creates significant alignment with commercial partners 33

Global Reach Through Partnerships 34
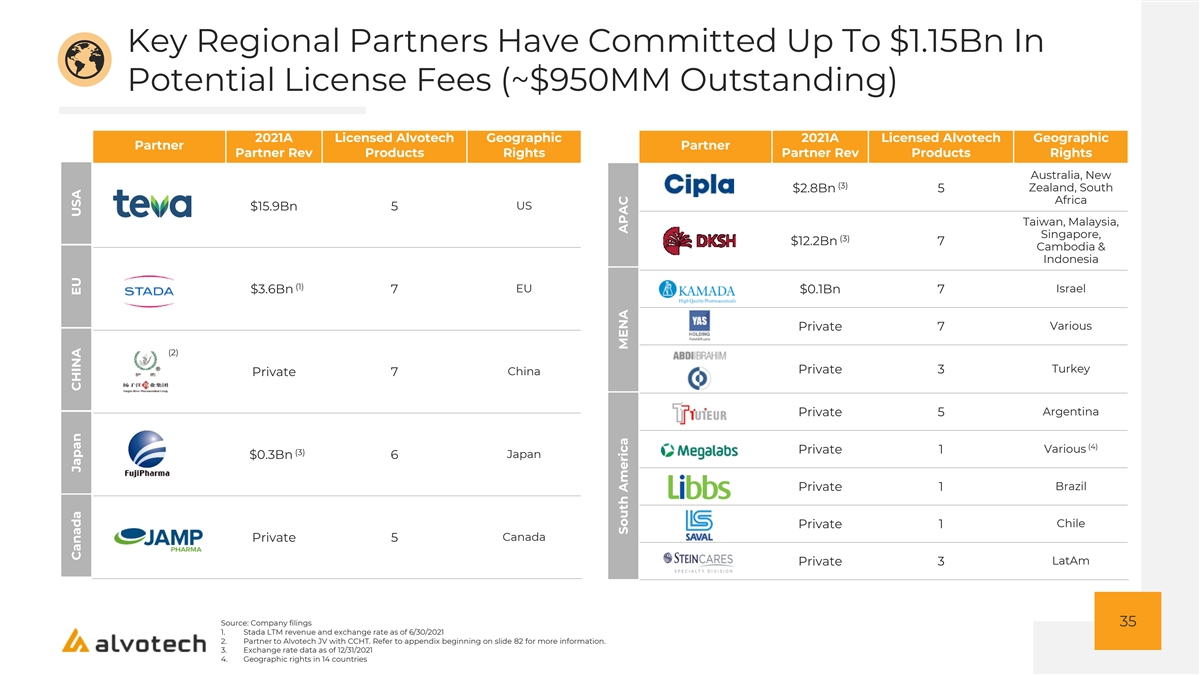
Key Regional Partners Have Committed Up To $1.15Bn In Potential License Fees (~$950MM Outstanding) 2021A Licensed Alvotech Geographic 2021A Licensed Alvotech Geographic Partner Partner Partner Rev Products Rights Partner Rev Products Rights Australia, New (3) Zealand, South $2.8Bn 5 Africa US $15.9Bn 5 Taiwan, Malaysia, Singapore, (3) $12.2Bn 7 Cambodia & Indonesia (1) EU Israel $3.6Bn 7 $0.1Bn 7 Various Private 7 (2) Turkey Private 3 China Private 7 Argentina Private 5 (4) Various Private 1 (3) $0.3Bn 6 Japan Brazil Private 1 Chile Private 1 Canada Private 5 LatAm Private 3 Source: Company filings 35 1. Stada LTM revenue and exchange rate as of 6/30/2021 2. Partner to Alvotech JV with CCHT. Refer to appendix beginning on slide 82 for more information. 3. Exchange rate data as of 12/31/2021 4. Geographic rights in 14 countries Canada Japan CHINA EU USA South America MENA APAC
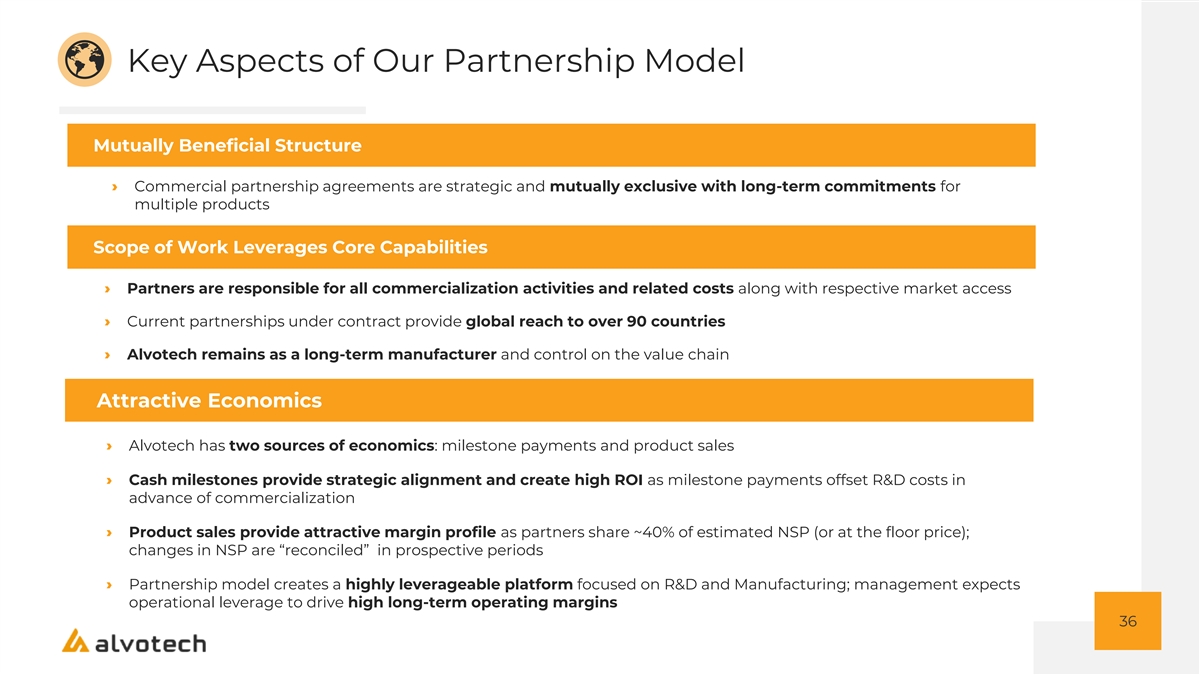
Key Aspects of Our Partnership Model Mutually Beneficial Structure › Commercial partnership agreements are strategic and mutually exclusive with long-term commitments for multiple products Scope of Work Leverages Core Capabilities › Partners are responsible for all commercialization activities and related costs along with respective market access › Current partnerships under contract provide global reach to over 90 countries › Alvotech remains as a long-term manufacturer and control on the value chain Attractive Economics › Alvotech has two sources of economics: milestone payments and product sales › Cash milestones provide strategic alignment and create high ROI as milestone payments offset R&D costs in advance of commercialization › Product sales provide attractive margin profile as partners share ~40% of estimated NSP (or at the floor price); changes in NSP are “reconciled” in prospective periods › Partnership model creates a highly leverageable platform focused on R&D and Manufacturing; management expects operational leverage to drive high long-term operating margins 36
Q&A 37

DIVERSE PIPELINE WITH SIGNIFICANT TAM
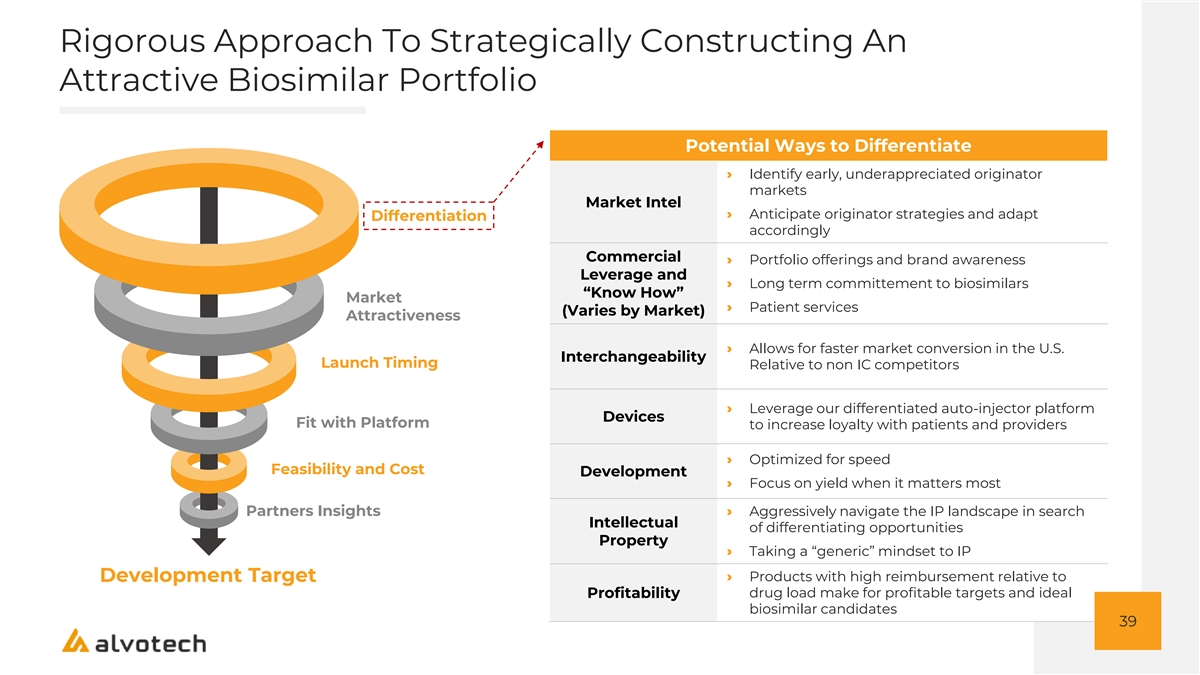
Rigorous Approach To Strategically Constructing An Attractive Biosimilar Portfolio Potential Ways to Differentiate › Identify early, underappreciated originator markets Market Intel › Anticipate originator strategies and adapt Differentiation accordingly Commercial › Portfolio offerings and brand awareness Leverage and › Long term committement to biosimilars “Know How” Market › Patient services (Varies by Market) Attractiveness › Allows for faster market conversion in the U.S. Interchangeability Launch Timing Relative to non IC competitors › Leverage our differentiated auto-injector platform Devices Fit with Platform to increase loyalty with patients and providers › Optimized for speed Feasibility and Cost Development › Focus on yield when it matters most Partners Insights› Aggressively navigate the IP landscape in search Intellectual of differentiating opportunities Property › Taking a “generic” mindset to IP › Products with high reimbursement relative to Development Target drug load make for profitable targets and ideal Profitability biosimilar candidates 39
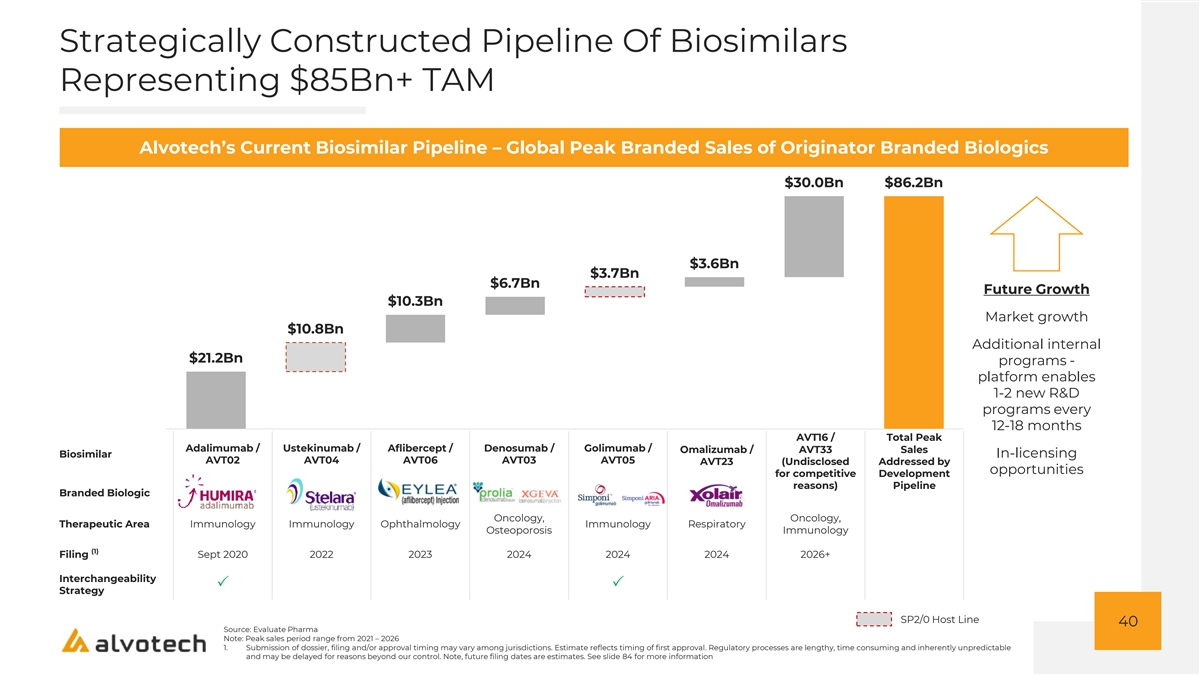
Strategically Constructed Pipeline Of Biosimilars Representing $85Bn+ TAM Alvotech’s Current Biosimilar Pipeline – Global Peak Branded Sales of Originator Branded Biologics $30.0Bn $86.2Bn $3.6Bn $3.7Bn $6.7Bn Future Growth $10.3Bn Market growth $10.8Bn Additional internal $21.2Bn programs - platform enables 1-2 new R&D programs every 12-18 months AVT16 / Total Peak Adalimumab / Ustekinumab / Aflibercept / Denosumab / Golimumab / Omalizumab / AVT33 Sales Biosimilar In-licensing AVT02 AVT04 AVT06 AVT03 AVT05 AVT23 (Undisclosed Addressed by opportunities for competitive Development reasons) Pipeline Branded Biologic Oncology, Oncology, Therapeutic Area Immunology Immunology Ophthalmology Immunology Respiratory Osteoporosis Immunology (1) Filing Sept 2020 2022 2023 2024 2024 2024 2026+ Interchangeability PP Strategy SP2/0 Host Line 40 Source: Evaluate Pharma Note: Peak sales period range from 2021 – 2026 1. Submission of dossier, filing and/or approval timing may vary among jurisdictions. Estimate reflects timing of first approval. Regulatory processes are lengthy, time consuming and inherently unpredictable and may be delayed for reasons beyond our control. Note, future filing dates are estimates. See slide 84 for more information
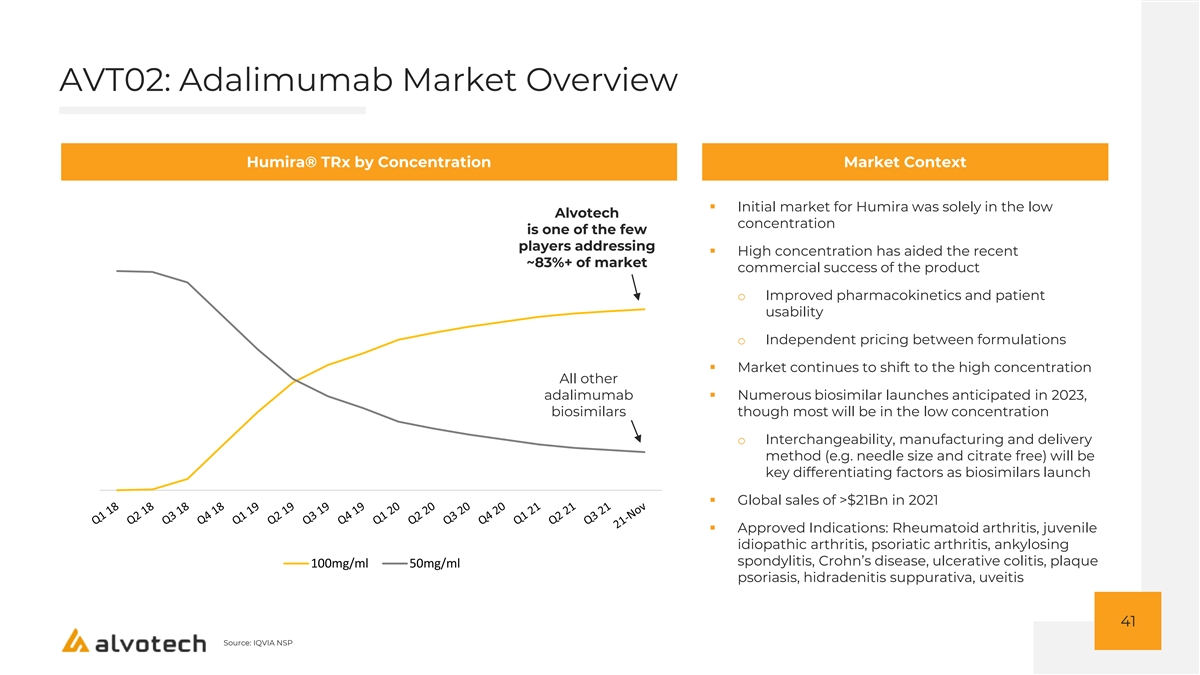
AVT02: Adalimumab Market Overview Humira® TRx by Concentration Market Context ▪ Initial market for Humira was solely in the low Alvotech concentration is one of the few players addressing ▪ High concentration has aided the recent ~83%+ of market commercial success of the product o Improved pharmacokinetics and patient usability o Independent pricing between formulations ▪ Market continues to shift to the high concentration All other adalimumab ▪ Numerous biosimilar launches anticipated in 2023, biosimilars though most will be in the low concentration o Interchangeability, manufacturing and delivery method (e.g. needle size and citrate free) will be key differentiating factors as biosimilars launch ▪ Global sales of >$21Bn in 2021 ▪ Approved Indications: Rheumatoid arthritis, juvenile idiopathic arthritis, psoriatic arthritis, ankylosing spondylitis, Crohn’s disease, ulcerative colitis, plaque 100mg/ml 50mg/ml psoriasis, hidradenitis suppurativa, uveitis 41 Source: IQVIA NSP
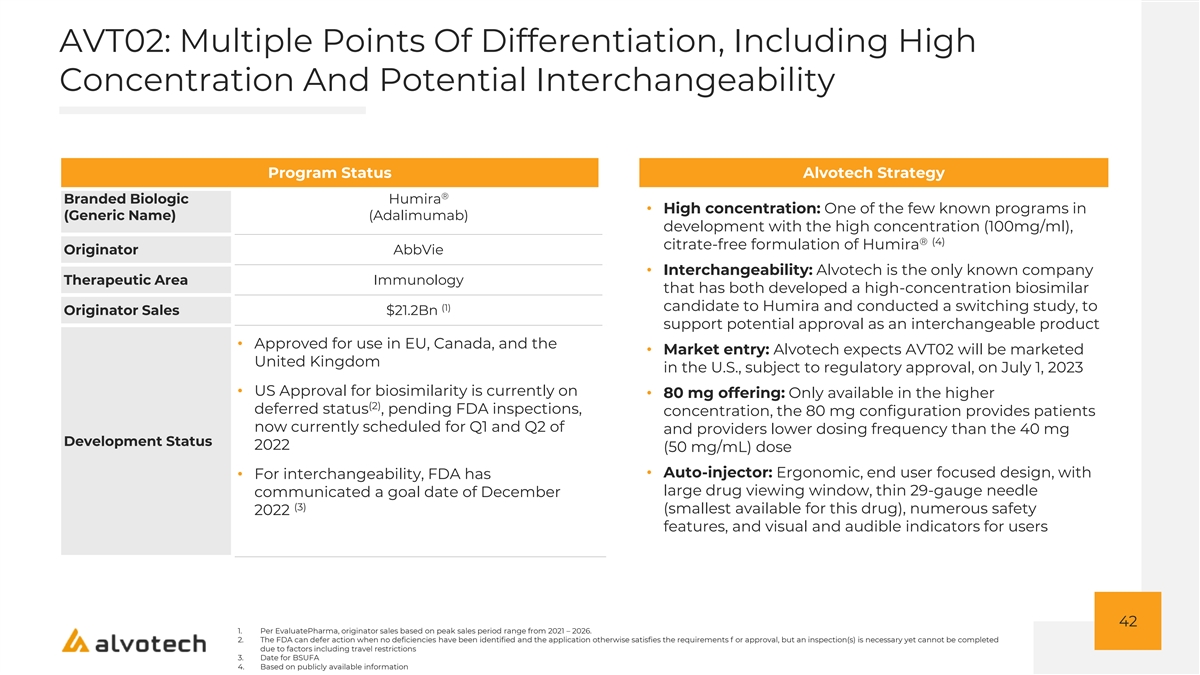
AVT02: Multiple Points Of Differentiation, Including High Concentration And Potential Interchangeability Program Status Alvotech Strategy ® Branded Biologic Humira • High concentration: One of the few known programs in (Generic Name) (Adalimumab) development with the high concentration (100mg/ml), ® (4) citrate-free formulation of Humira Originator AbbVie • Interchangeability: Alvotech is the only known company Therapeutic Area Immunology that has both developed a high-concentration biosimilar (1) candidate to Humira and conducted a switching study, to Originator Sales $21.2Bn support potential approval as an interchangeable product • Approved for use in EU, Canada, and the • Market entry: Alvotech expects AVT02 will be marketed United Kingdom in the U.S., subject to regulatory approval, on July 1, 2023 • US Approval for biosimilarity is currently on • 80 mg offering: Only available in the higher (2) deferred status , pending FDA inspections, concentration, the 80 mg configuration provides patients now currently scheduled for Q1 and Q2 of and providers lower dosing frequency than the 40 mg Development Status 2022 (50 mg/mL) dose • Auto-injector: Ergonomic, end user focused design, with • For interchangeability, FDA has large drug viewing window, thin 29-gauge needle communicated a goal date of December (3) (smallest available for this drug), numerous safety 2022 features, and visual and audible indicators for users 42 1. Per EvaluatePharma, originator sales based on peak sales period range from 2021 – 2026. 2. The FDA can defer action when no deficiencies have been identified and the application otherwise satisfies the requirements f or approval, but an inspection(s) is necessary yet cannot be completed due to factors including travel restrictions 3. Date for BSUFA 4. Based on publicly available information
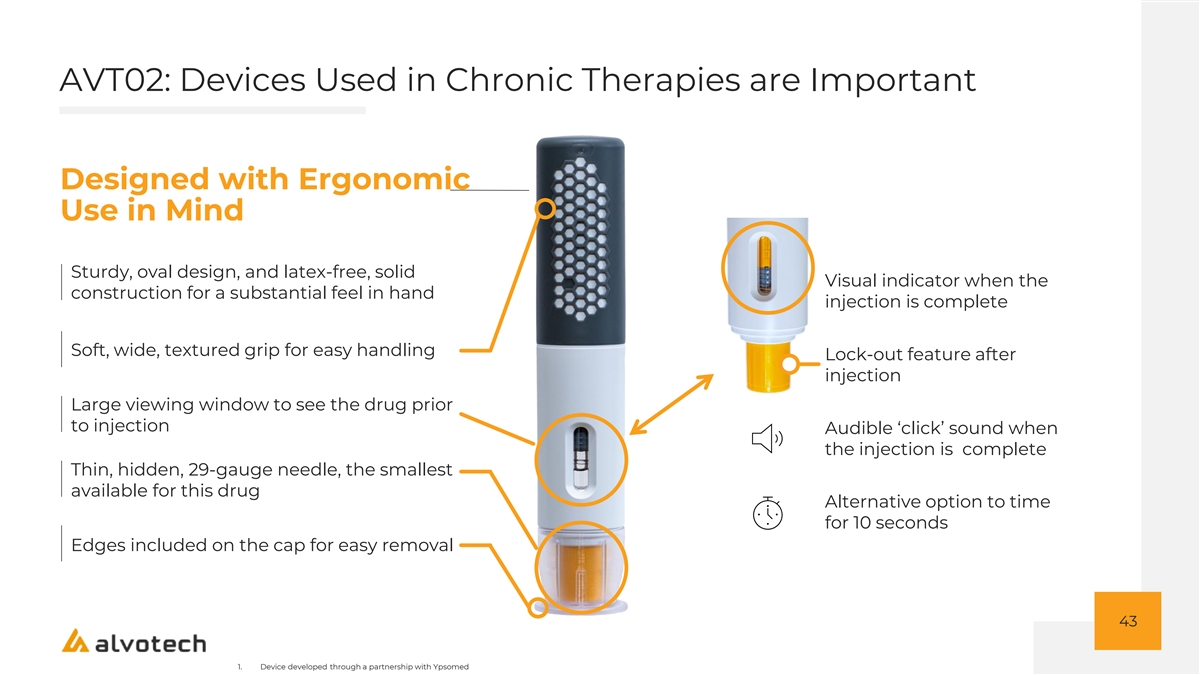
AVT02: Devices Used in Chronic Therapies are Important Designed with Ergonomic Use in Mind Sturdy, oval design, and latex-free, solid Visual indicator when the construction for a substantial feel in hand injection is complete Soft, wide, textured grip for easy handling Lock-out feature after injection Large viewing window to see the drug prior to injection Audible ‘click’ sound when the injection is complete Thin, hidden, 29-gauge needle, the smallest available for this drug Alternative option to time for 10 seconds Edges included on the cap for easy removal 43 1. Device developed through a partnership with Ypsomed
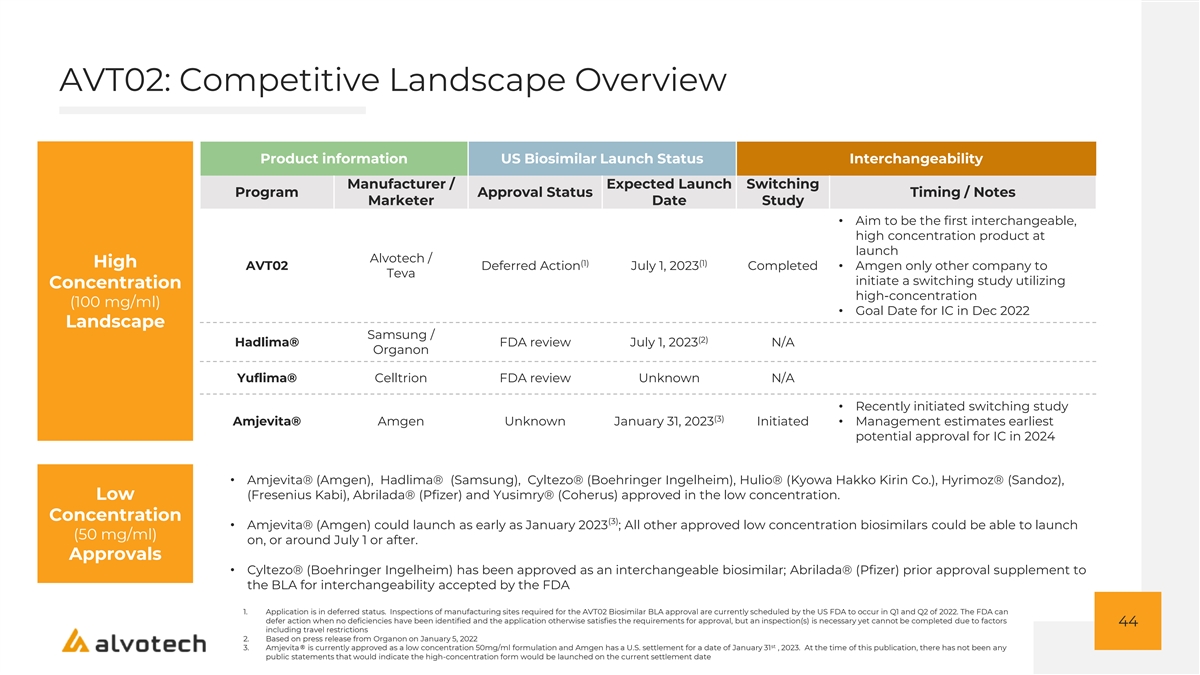
AVT02: Competitive Landscape Overview Product information US Biosimilar Launch Status Interchangeability Manufacturer / Expected Launch Switching Program Approval Status Timing / Notes Marketer Date Study • Aim to be the first interchangeable, high concentration product at launch Alvotech / (1) (1) High AVT02 Deferred Action July 1, 2023 Completed• Amgen only other company to Teva initiate a switching study utilizing Concentration high-concentration (100 mg/ml) • Goal Date for IC in Dec 2022 Landscape Samsung / (2) Hadlima® FDA review July 1, 2023 N/A Organon Yuflima® Celltrion FDA review Unknown N/A • Recently initiated switching study (3) Amjevita® Amgen Unknown January 31, 2023 Initiated• Management estimates earliest potential approval for IC in 2024 • Amjevita® (Amgen), Hadlima® (Samsung), Cyltezo® (Boehringer Ingelheim), Hulio® (Kyowa Hakko Kirin Co.), Hyrimoz® (Sandoz), Low (Fresenius Kabi), Abrilada® (Pfizer) and Yusimry® (Coherus) approved in the low concentration. Concentration (3) • Amjevita® (Amgen) could launch as early as January 2023 ; All other approved low concentration biosimilars could be able to launch (50 mg/ml) on, or around July 1 or after. Approvals • Cyltezo® (Boehringer Ingelheim) has been approved as an interchangeable biosimilar; Abrilada® (Pfizer) prior approval supplement to the BLA for interchangeability accepted by the FDA 1. Application is in deferred status. Inspections of manufacturing sites required for the AVT02 Biosimilar BLA approval are currently scheduled by the US FDA to occur in Q1 and Q2 of 2022. The FDA can defer action when no deficiencies have been identified and the application otherwise satisfies the requirements for approval, but an inspection(s) is necessary yet cannot be completed due to factors 44 including travel restrictions 2. Based on press release from Organon on January 5, 2022 st 3. Amjevita® is currently approved as a low concentration 50mg/ml formulation and Amgen has a U.S. settlement for a date of January 31 , 2023. At the time of this publication, there has not been any public statements that would indicate the high-concentration form would be launched on the current settlement date
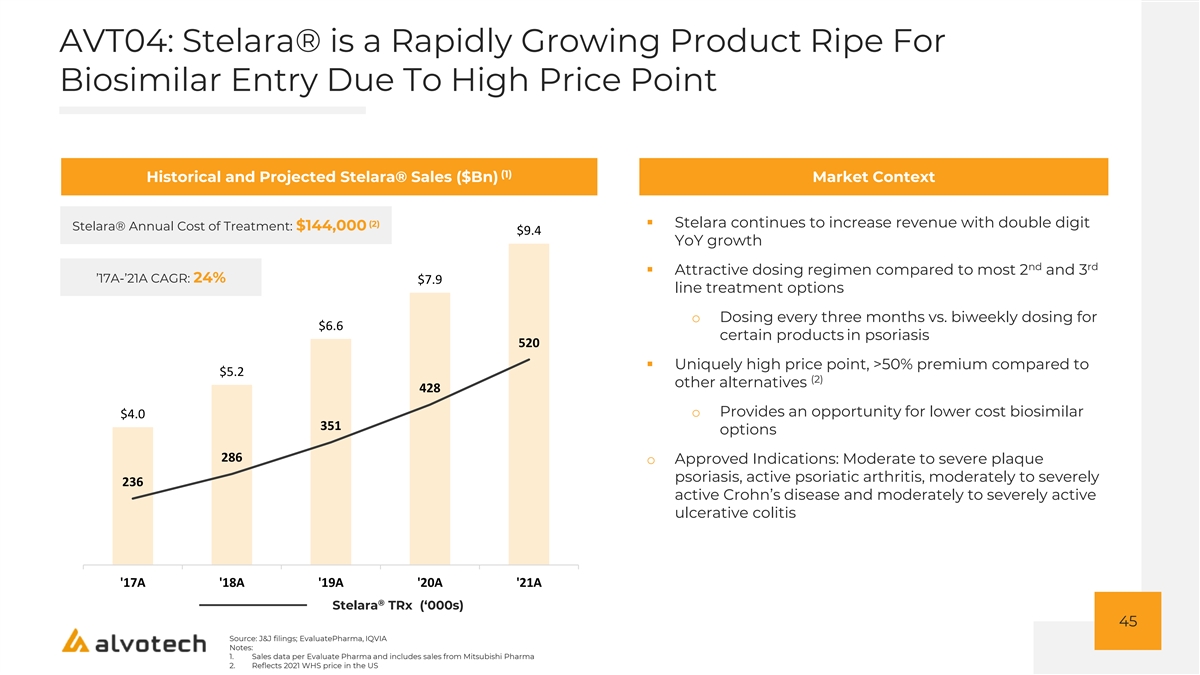
AVT04: Stelara® is a Rapidly Growing Product Ripe For Biosimilar Entry Due To High Price Point (1) Historical and Projected Stelara® Sales ($Bn) Market Context 10.0 (2)▪ Stelara continues to increase revenue with double digit Stelara® Annual Cost of Treatment: $144,000 $9.4 YoY growth 9.0 nd rd ▪ Attractive dosing regimen compared to most 2 and 3 ’17A-’21A CAGR: 24% $7.9 line treatment options 8.0 o Dosing every three months vs. biweekly dosing for 7.0 $6.6 certain products in psoriasis 520 6.0 ▪ Uniquely high price point, >50% premium compared to $5.2 (2) other alternatives 428 5.0 o Provides an opportunity for lower cost biosimilar $4.0 351 4.0 options 286 o Approved Indications: Moderate to severe plaque 3.0 psoriasis, active psoriatic arthritis, moderately to severely 236 2.0 active Crohn’s disease and moderately to severely active ulcerative colitis 1.0 0.0 '17A '18A '19A '20A '21A ® Stelara TRx (‘000s) 45 Source: J&J filings; EvaluatePharma, IQVIA Notes: 1. Sales data per Evaluate Pharma and includes sales from Mitsubishi Pharma 2. Reflects 2021 WHS price in the US
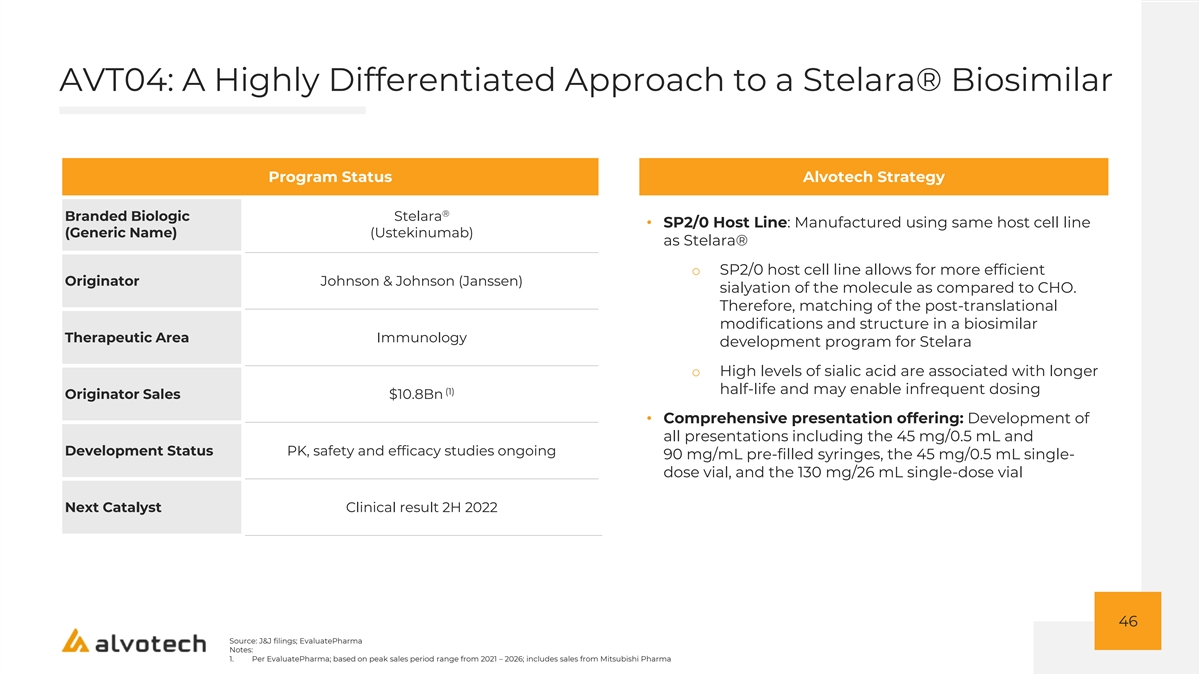
AVT04: A Highly Differentiated Approach to a Stelara® Biosimilar Program Status Alvotech Strategy ® Branded Biologic Stelara • SP2/0 Host Line: Manufactured using same host cell line (Generic Name) (Ustekinumab) as Stelara® o SP2/0 host cell line allows for more efficient Originator Johnson & Johnson (Janssen) sialyation of the molecule as compared to CHO. Therefore, matching of the post-translational modifications and structure in a biosimilar Therapeutic Area Immunology development program for Stelara o High levels of sialic acid are associated with longer half-life and may enable infrequent dosing (1) Originator Sales $10.8Bn • Comprehensive presentation offering: Development of all presentations including the 45 mg/0.5 mL and Development Status PK, safety and efficacy studies ongoing 90 mg/mL pre-filled syringes, the 45 mg/0.5 mL single- dose vial, and the 130 mg/26 mL single-dose vial Next Catalyst Clinical result 2H 2022 46 Source: J&J filings; EvaluatePharma Notes: 1. Per EvaluatePharma; based on peak sales period range from 2021 – 2026; includes sales from Mitsubishi Pharma
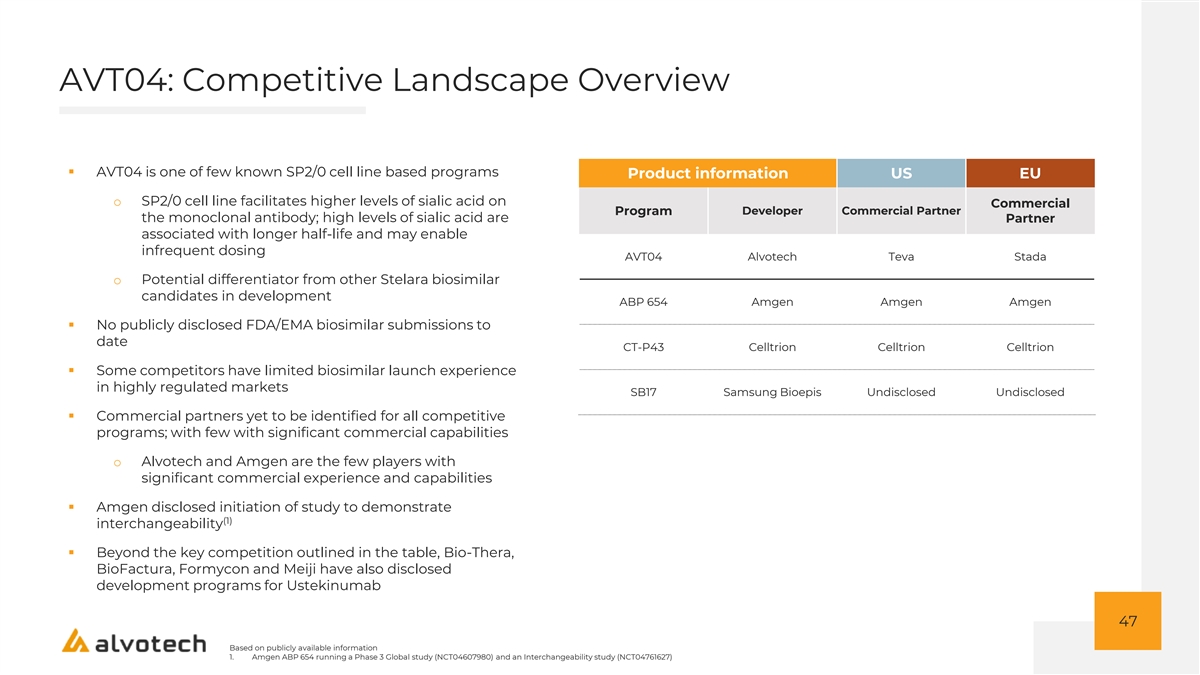
AVT04: Competitive Landscape Overview ▪ AVT04 is one of few known SP2/0 cell line based programs Product information US EU o SP2/0 cell line facilitates higher levels of sialic acid on Commercial Program Developer Commercial Partner the monoclonal antibody; high levels of sialic acid are Partner associated with longer half-life and may enable infrequent dosing AVT04 Alvotech Teva Stada o Potential differentiator from other Stelara biosimilar candidates in development ABP 654 Amgen Amgen Amgen ▪ No publicly disclosed FDA/EMA biosimilar submissions to date CT-P43 Celltrion Celltrion Celltrion ▪ Some competitors have limited biosimilar launch experience in highly regulated markets SB17 Samsung Bioepis Undisclosed Undisclosed ▪ Commercial partners yet to be identified for all competitive programs; with few with significant commercial capabilities o Alvotech and Amgen are the few players with significant commercial experience and capabilities ▪ Amgen disclosed initiation of study to demonstrate (1) interchangeability ▪ Beyond the key competition outlined in the table, Bio-Thera, BioFactura, Formycon and Meiji have also disclosed development programs for Ustekinumab 47 Based on publicly available information 1. Amgen ABP 654 running a Phase 3 Global study (NCT04607980) and an Interchangeability study (NCT04761627)
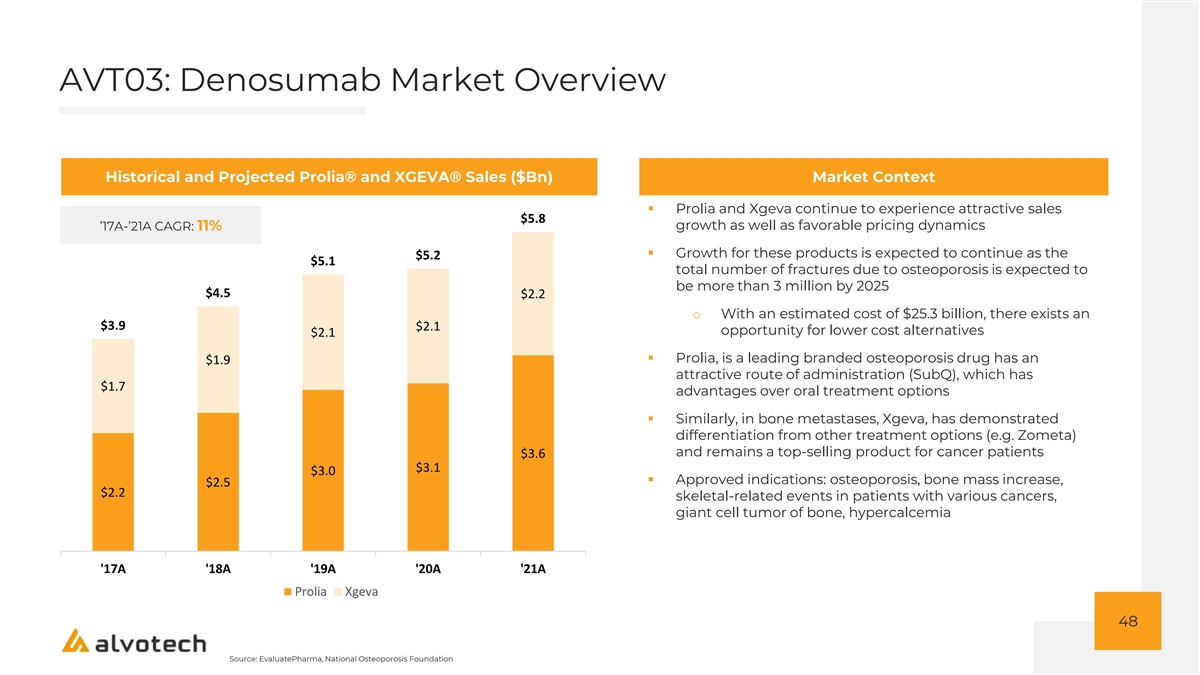
AVT03: Denosumab Market Overview Historical and Projected Prolia® and XGEVA® Sales ($Bn) Market Context ▪ Prolia and Xgeva continue to experience attractive sales $5.8 growth as well as favorable pricing dynamics ’17A-’21A CAGR: 11% ▪ Growth for these products is expected to continue as the $5.2 $5.1 total number of fractures due to osteoporosis is expected to be more than 3 million by 2025 $4.5 $2.2 o With an estimated cost of $25.3 billion, there exists an $3.9 $2.1 opportunity for lower cost alternatives $2.1 ▪ Prolia, is a leading branded osteoporosis drug has an $1.9 attractive route of administration (SubQ), which has $1.7 advantages over oral treatment options ▪ Similarly, in bone metastases, Xgeva, has demonstrated differentiation from other treatment options (e.g. Zometa) and remains a top-selling product for cancer patients $3.6 $3.1 $3.0 ▪ Approved indications: osteoporosis, bone mass increase, $2.5 $2.2 skeletal-related events in patients with various cancers, giant cell tumor of bone, hypercalcemia '17A '18A '19A '20A '21A Prolia Xgeva 48 Source: EvaluatePharma, National Osteoporosis Foundation

AVT03: Novel Formulation for Denosumab Program Status Alvotech Strategy Branded Biologic Prolia® and XGEVA® • Production consistency: Both the reference product as (Generic Name) (Denosumab) well as our proposed biosimilar AVT03, are produced in recombinant Chinese hamster ovary cells Originator Amgen • Global focus for XGEVA and Prolia: Development and clinical planning to enable successful approval of dossiers across all major markets for both Prolia and XGEVA Therapeutic Area Oncology biosimilars • Key Competition: Celltrion, Fresenius, Samsung, Sandoz, (1) Teva Originator Sales $6.7Bn Development Status Preclinical Next Catalyst Trial initiation 2H 2022 49 Source: EvaluatePharma Notes: 1. Per EvaluatePharma; based on peak sales period range from 2021 – 2026
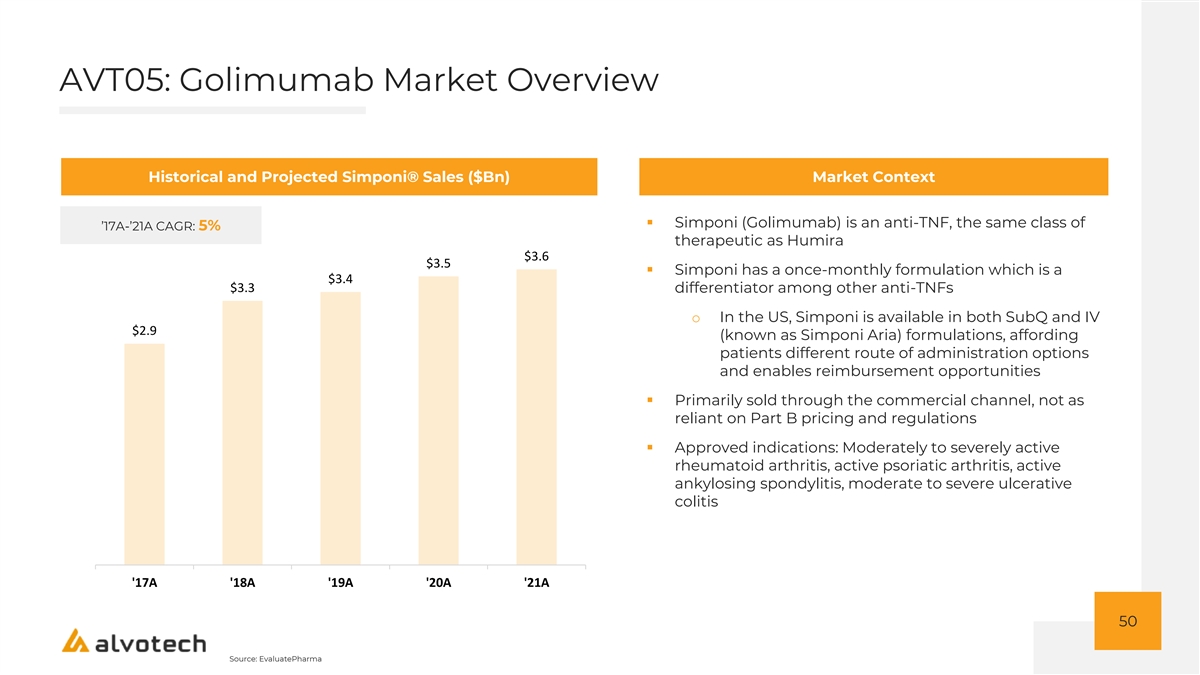
AVT05: Golimumab Market Overview Historical and Projected Simponi® Sales ($Bn) Market Context ▪ Simponi (Golimumab) is an anti-TNF, the same class of ’17A-’21A CAGR: 5% therapeutic as Humira $3.6 $3.5 ▪ Simponi has a once-monthly formulation which is a $3.4 $3.3 differentiator among other anti-TNFs o In the US, Simponi is available in both SubQ and IV $2.9 (known as Simponi Aria) formulations, affording patients different route of administration options and enables reimbursement opportunities ▪ Primarily sold through the commercial channel, not as reliant on Part B pricing and regulations ▪ Approved indications: Moderately to severely active rheumatoid arthritis, active psoriatic arthritis, active ankylosing spondylitis, moderate to severe ulcerative colitis '17A '18A '19A '20A '21A 50 Source: EvaluatePharma
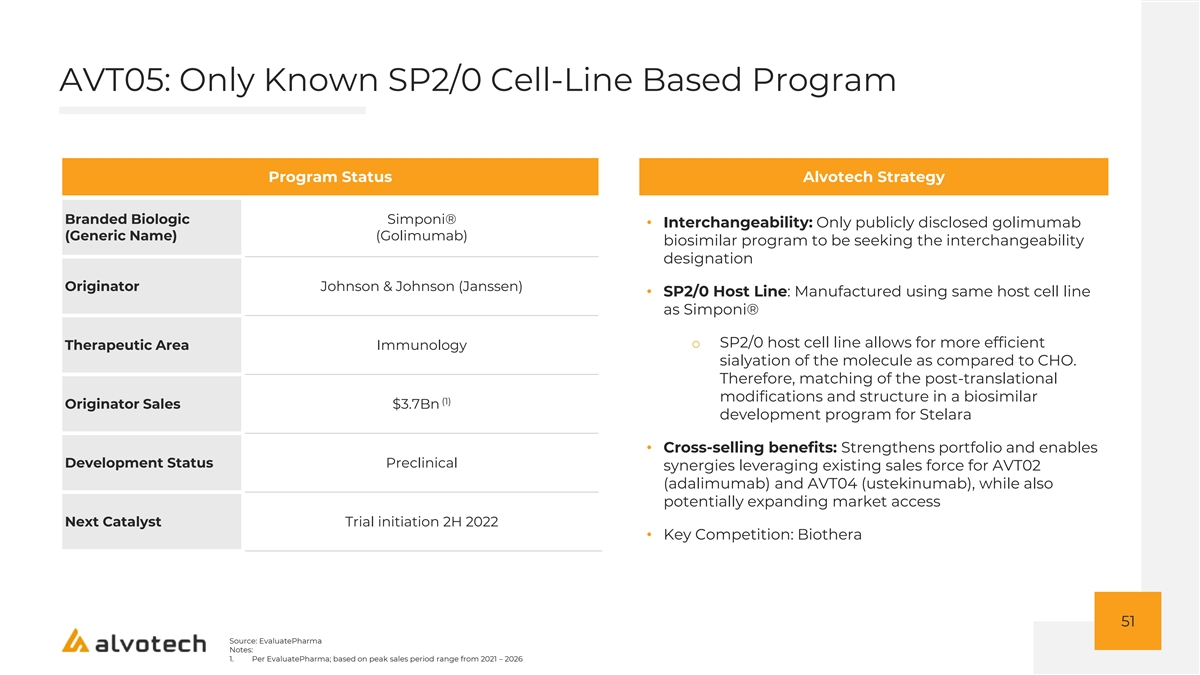
AVT05: Only Known SP2/0 Cell-Line Based Program Alvotech Program Program Status AVT05 Alvotech Strategy Branded Biologic Simponi® • Interchangeability: Only publicly disclosed golimumab (Generic Name) (Golimumab) biosimilar program to be seeking the interchangeability designation Originator Johnson & Johnson (Janssen) • SP2/0 Host Line: Manufactured using same host cell line as Simponi® o SP2/0 host cell line allows for more efficient Therapeutic Area Immunology sialyation of the molecule as compared to CHO. Therefore, matching of the post-translational modifications and structure in a biosimilar (1) Originator Sales $3.7Bn development program for Stelara • Cross-selling benefits: Strengthens portfolio and enables Development Status Preclinical synergies leveraging existing sales force for AVT02 (adalimumab) and AVT04 (ustekinumab), while also potentially expanding market access Next Catalyst Trial initiation 2H 2022 • Key Competition: Biothera 51 Source: EvaluatePharma Notes: 1. Per EvaluatePharma; based on peak sales period range from 2021 – 2026

AVT23: BiosanaPharma Agreement Overview On February 2, 2022, Alvotech and BiosanaPharma entered into an exclusive global licensing agreement to co-develop AVT23 AVT23 Overview 3C Technology Platform ▪ AVT23 (aka BP001) is a late-stage biosimilar candidate for Xolair ▪ High productivity, flexible, small footprint manufacturing platform (1) (omalizumab), a biologic with expected peak sales of $3.4Bn that can cut production costs by at least 90% − Xolair is currently approved for asthma, chronic idiopathic urticaria − Targeted to make 1 kg of drug substance per week at a 50L and severe chronic rhinosinusitis with nasal polyps bioreactor scale − There are currently no approved biosimilars of Xolair ▪ Bespoke process development ▪ PK study of AVT23 has been completed and demonstrated − Upstream Process: proprietary IP based on High Cell Density comparable bioavailability, safety, tolerability and immunogenicity to continuous perfusion culturing with alternating bioreactor use Xolair − Downstream Process: based on Simulated Moving Bed Summary Licensing Terms chromatography combined with flow through filtration ▪ Continuous production platform achieves higher yields while still 1 AVT23 will be jointly developed by Alvotech and BiosanaPharma using the same biochemistry as existing batch processes 2 Alvotech to receive exclusive global rights BiosanaPharma to receive an upfront payment and will be 3 eligible for certain tiered sales royalties AVT23 will be produced using BiosanaPharma’s proprietary 3C 4 process technology 52 Source: EvaluatePharma Notes: 1. Per EvaluatePharma, based on peak sales period range from 2021 - 2026
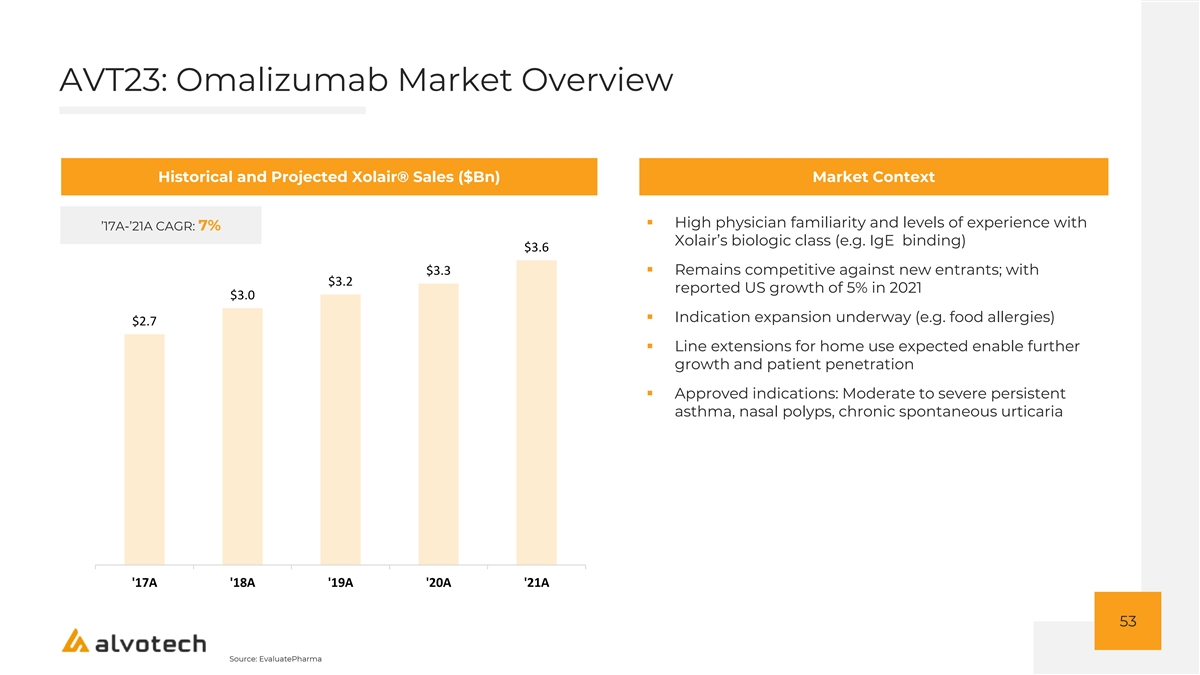
AVT23: Omalizumab Market Overview Historical and Projected Xolair® Sales ($Bn) Market Context ▪ High physician familiarity and levels of experience with ’17A-’21A CAGR: 7% Xolair’s biologic class (e.g. IgE binding) $3.6 $3.3▪ Remains competitive against new entrants; with $3.2 reported US growth of 5% in 2021 $3.0 ▪ Indication expansion underway (e.g. food allergies) $2.7 ▪ Line extensions for home use expected enable further growth and patient penetration ▪ Approved indications: Moderate to severe persistent asthma, nasal polyps, chronic spontaneous urticaria '17A '18A '19A '20A '21A 53 Source: EvaluatePharma
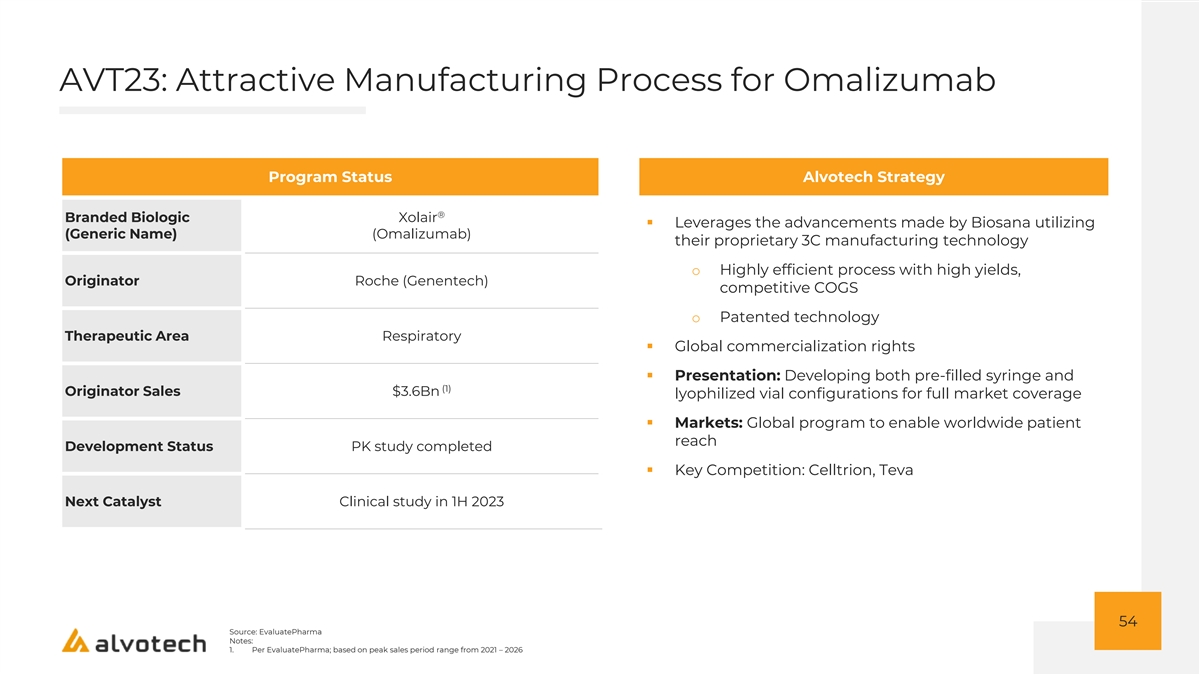
AVT23: Attractive Manufacturing Process for Omalizumab Alvotech Program Program StatusXolair® Alvotech Strategy ® Branded Biologic Xolair ▪ Leverages the advancements made by Biosana utilizing (Generic Name) (Omalizumab) their proprietary 3C manufacturing technology o Highly efficient process with high yields, Originator Roche (Genentech) competitive COGS o Patented technology Therapeutic Area Respiratory ▪ Global commercialization rights ▪ Presentation: Developing both pre-filled syringe and (1) Originator Sales $3.6Bn lyophilized vial configurations for full market coverage ▪ Markets: Global program to enable worldwide patient reach Development Status PK study completed ▪ Key Competition: Celltrion, Teva Next Catalyst Clinical study in 1H 2023 54 Source: EvaluatePharma Notes: 1. Per EvaluatePharma; based on peak sales period range from 2021 – 2026

AVT06: Aflibercept Market Overview Historical and Projected Eylea® Sales ($Bn) Market Context ▪ Eylea continues to be a leading ophthalmology product, ’17A-’21A CAGR: 12% with attractive market share across all approved $9.9 indications ▪ Full year 2021 Eylea US net sales increased 17% versus $8.4 2020 $8.0 o Volumes remain steady and above other VEGFs $7.2 (e.g. Lucentis) $6.3 ▪ More convenient dosing regimen than other leading ophthalmology products ▪ Available in both vials and PFS ▪ Potentially alleviated safety concerns for ophthalmology biosimilars due to launch of Lucentis biosimilar o Continued expected growth despite Lucentis biosimilar launch ▪ Approved indications: Wet AMD, Macular Edema, Diabetic Retinopathy '17A '18A '19A '20A '21A 55 Source: EvaluatePharma
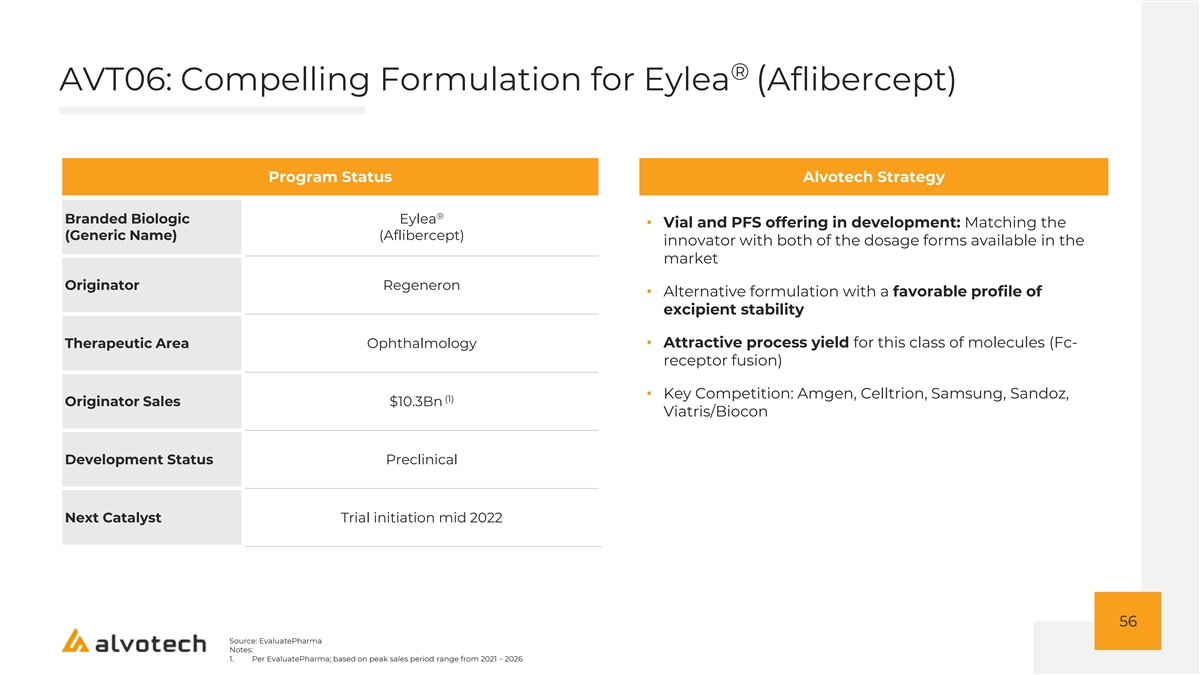
® AVT06: Compelling Formulation for Eylea (Aflibercept) Alvotech Program Program Status AVT06 Alvotech Strategy ® Branded Biologic Eylea • Vial and PFS offering in development: Matching the (Generic Name) (Aflibercept) innovator with both of the dosage forms available in the market Originator Regeneron • Alternative formulation with a favorable profile of excipient stability • Attractive process yield for this class of molecules (Fc- Therapeutic Area Ophthalmology receptor fusion) • Key Competition: Amgen, Celltrion, Samsung, Sandoz, (1) Originator Sales $10.3Bn Viatris/Biocon Development Status Preclinical Next Catalyst Trial initiation mid 2022 56 Source: EvaluatePharma Notes: 1. Per EvaluatePharma; based on peak sales period range from 2021 – 2026
Q&A 57
ATTRACTIVE FINANCIAL PROFILE
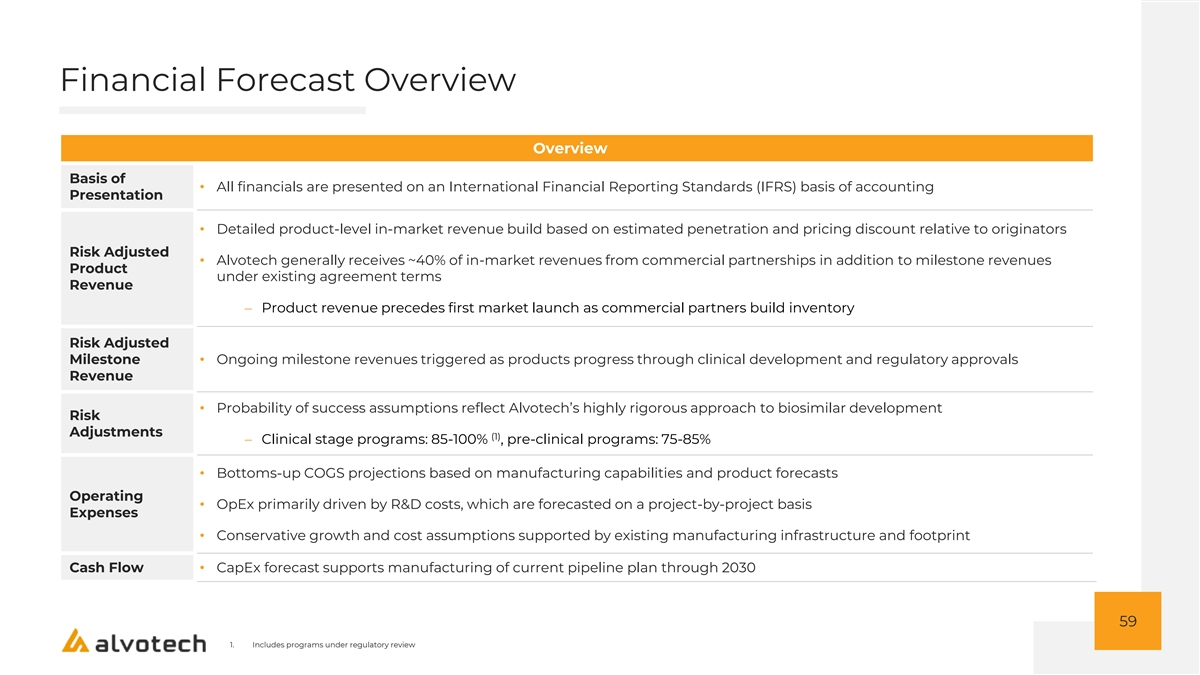
Financial Forecast Overview Overview Basis of • All financials are presented on an International Financial Reporting Standards (IFRS) basis of accounting Presentation • Detailed product-level in-market revenue build based on estimated penetration and pricing discount relative to originators Risk Adjusted • Alvotech generally receives ~40% of in-market revenues from commercial partnerships in addition to milestone revenues Product under existing agreement terms Revenue − Product revenue precedes first market launch as commercial partners build inventory Risk Adjusted Milestone • Ongoing milestone revenues triggered as products progress through clinical development and regulatory approvals Revenue • Probability of success assumptions reflect Alvotech’s highly rigorous approach to biosimilar development Risk Adjustments (1) − Clinical stage programs: 85-100% , pre-clinical programs: 75-85% • Bottoms-up COGS projections based on manufacturing capabilities and product forecasts Operating • OpEx primarily driven by R&D costs, which are forecasted on a project-by-project basis Expenses • Conservative growth and cost assumptions supported by existing manufacturing infrastructure and footprint Cash Flow• CapEx forecast supports manufacturing of current pipeline plan through 2030 59 1. Includes programs under regulatory review
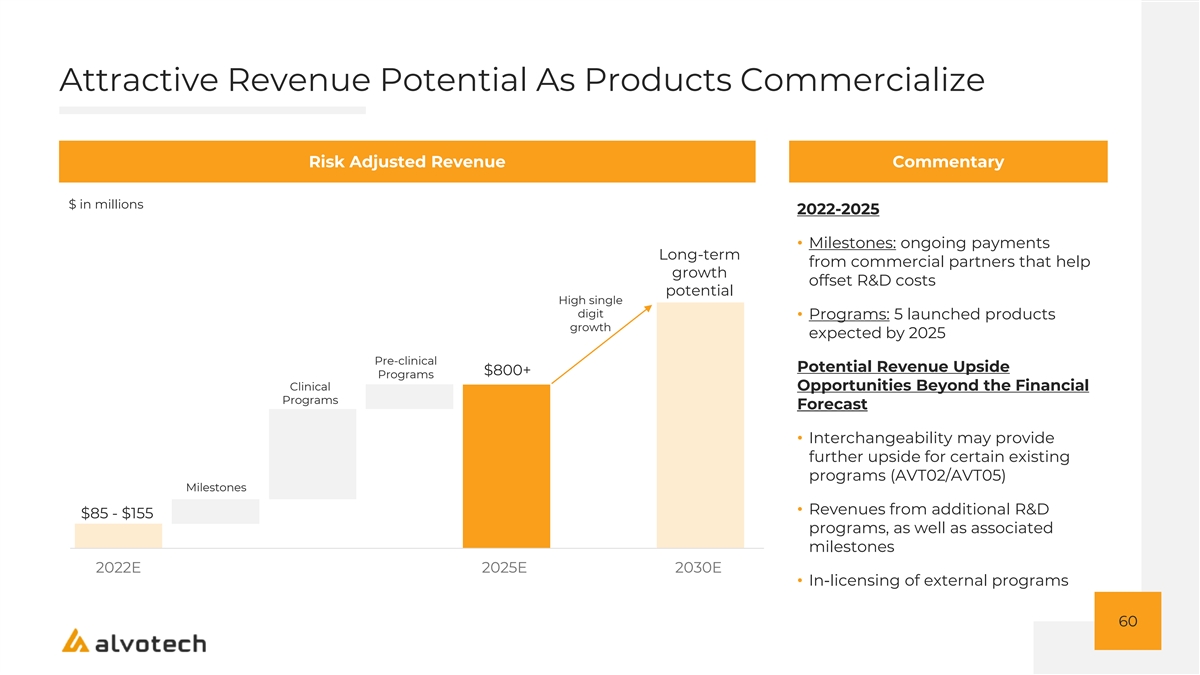
Attractive Revenue Potential As Products Commercialize Risk Adjusted Revenue Commentary $ in millions 2022-2025 • Milestones: ongoing payments Long-term from commercial partners that help growth offset R&D costs potential High single digit • Programs: 5 launched products growth expected by 2025 Pre-clinical Potential Revenue Upside $800+ Programs Clinical Opportunities Beyond the Financial Programs Forecast • Interchangeability may provide further upside for certain existing programs (AVT02/AVT05) Milestones • Revenues from additional R&D $85 - $155 programs, as well as associated milestones 2022E 2025E 2030E • In-licensing of external programs 60
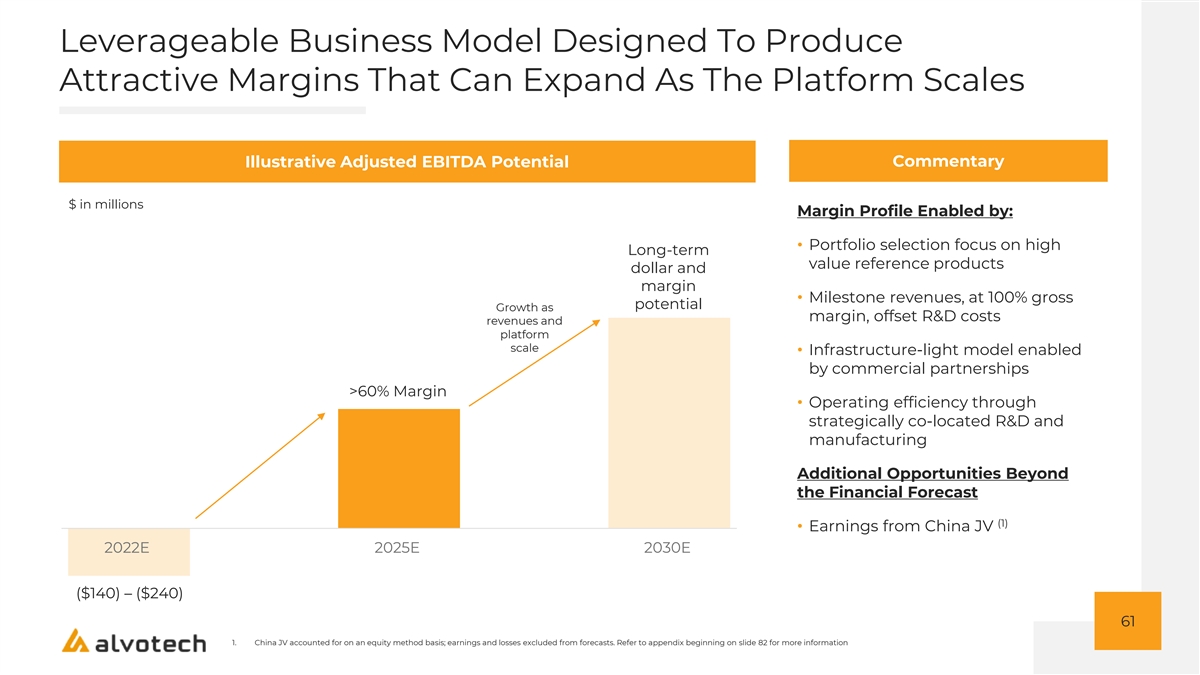
Leverageable Business Model Designed To Produce Attractive Margins That Can Expand As The Platform Scales Illustrative Adjusted EBITDA Potential Commentary $ in millions Margin Profile Enabled by: • Portfolio selection focus on high Long-term value reference products dollar and margin • Milestone revenues, at 100% gross potential Growth as margin, offset R&D costs revenues and platform scale • Infrastructure-light model enabled by commercial partnerships >60% Margin • Operating efficiency through strategically co-located R&D and manufacturing Additional Opportunities Beyond the Financial Forecast (1) • Earnings from China JV 2022E 2025E 2030E ($140) – ($240) 61 1. China JV accounted for on an equity method basis; earnings and losses excluded from forecasts. Refer to appendix beginning on slide 82 for more information
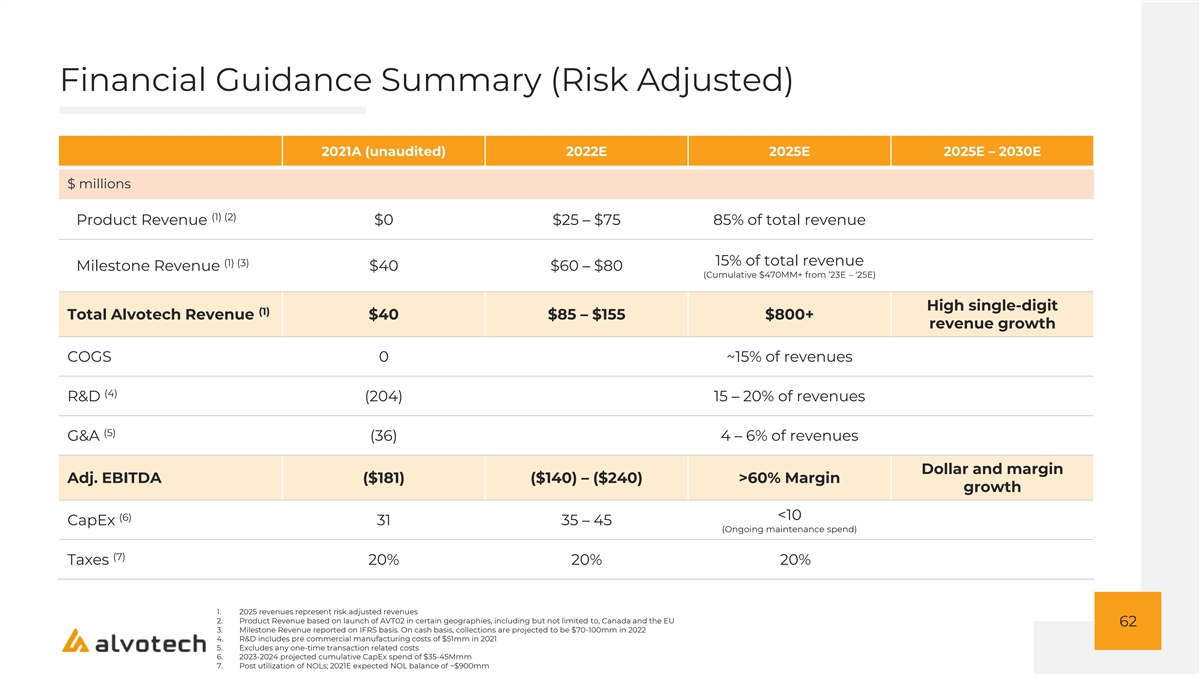
Financial Guidance Summary (Risk Adjusted) 2021A (unaudited) 2022E 2025E 2025E – 2030E $ millions (1) (2) Product Revenue $0 $25 – $75 85% of total revenue (1) (3) 15% of total revenue Milestone Revenue $40 $60 – $80 (Cumulative $470MM+ from ’23E – ‘25E) High single-digit (1) Total Alvotech Revenue $40 $85 – $155 $800+ revenue growth COGS 0 ~15% of revenues (4) R&D (204) 15 – 20% of revenues (5) G&A (36) 4 – 6% of revenues Dollar and margin Adj. EBITDA ($181) ($140) – ($240) >60% Margin growth <10 (6) CapEx 31 35 – 45 (Ongoing maintenance spend) (7) Taxes 20% 20% 20% 1. 2025 revenues represent risk adjusted revenues 2. Product Revenue based on launch of AVT02 in certain geographies, including but not limited to, Canada and the EU 62 3. Milestone Revenue reported on IFRS basis. On cash basis, collections are projected to be $70-100mm in 2022 4. R&D includes pre commercial manufacturing costs of $51mm in 2021 5. Excludes any one-time transaction related costs 6. 2023-2024 projected cumulative CapEx spend of $35-45Mmm 7. Post utilization of NOLs; 2021E expected NOL balance of ~$900mm
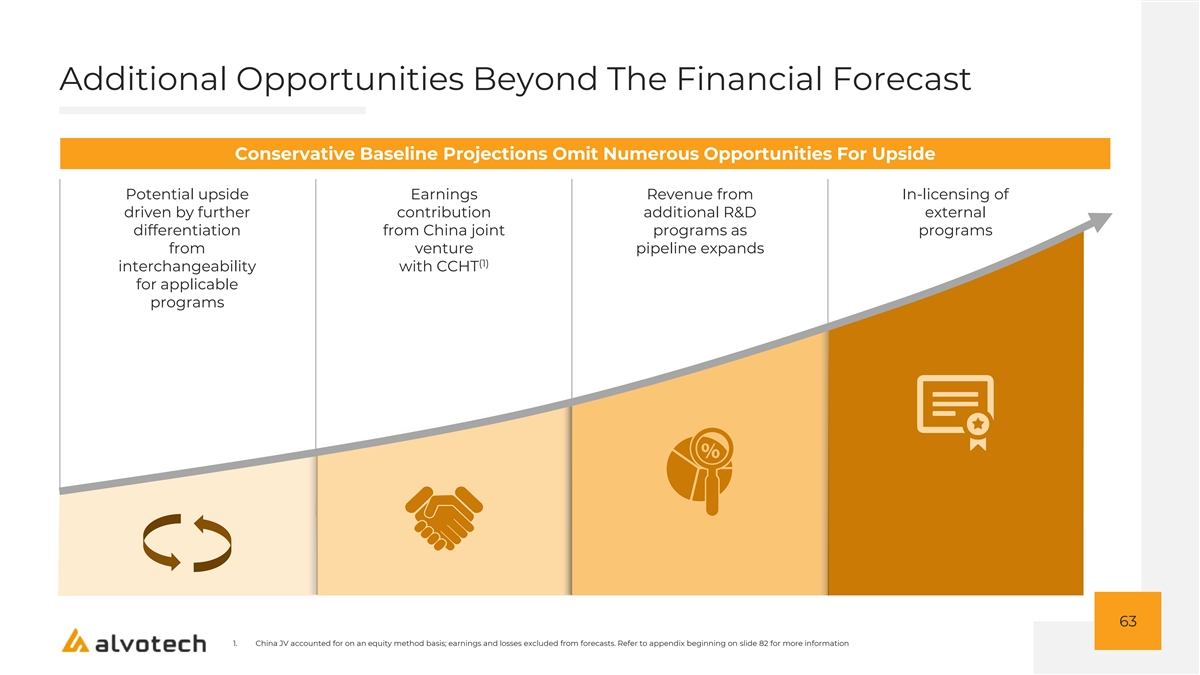
Additional Opportunities Beyond The Financial Forecast Conservative Baseline Projections Omit Numerous Opportunities For Upside Potential upside Earnings Revenue from In-licensing of driven by further contribution additional R&D external differentiation from China joint programs as programs from venture pipeline expands (1) interchangeability with CCHT for applicable programs 63 1. China JV accounted for on an equity method basis; earnings and losses excluded from forecasts. Refer to appendix beginning on slide 82 for more information
TRANSACTION SUMMARY
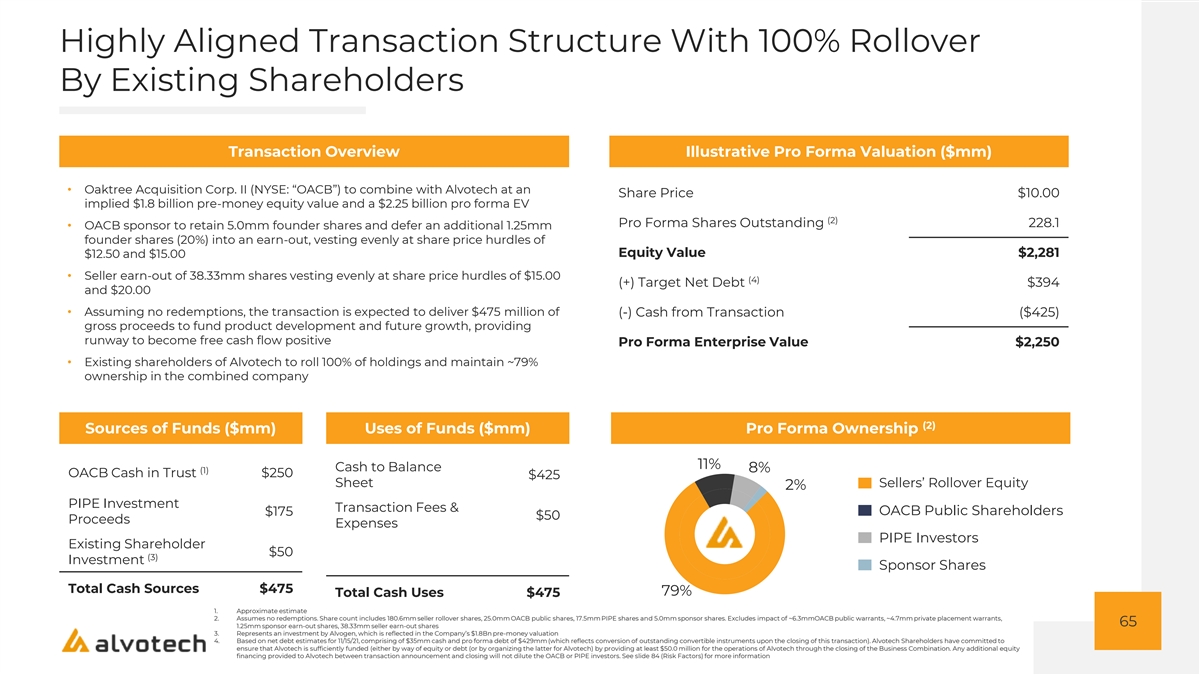
Highly Aligned Transaction Structure With 100% Rollover By Existing Shareholders Transaction Overview Illustrative Pro Forma Valuation ($mm) • Oaktree Acquisition Corp. II (NYSE: “OACB”) to combine with Alvotech at an Share Price $10.00 implied $1.8 billion pre-money equity value and a $2.25 billion pro forma EV (2) Pro Forma Shares Outstanding 228.1 • OACB sponsor to retain 5.0mm founder shares and defer an additional 1.25mm founder shares (20%) into an earn-out, vesting evenly at share price hurdles of Equity Value $2,281 $12.50 and $15.00 • Seller earn-out of 38.33mm shares vesting evenly at share price hurdles of $15.00 (4) (+) Target Net Debt $394 and $20.00 • Assuming no redemptions, the transaction is expected to deliver $475 million of (-) Cash from Transaction ($425) gross proceeds to fund product development and future growth, providing runway to become free cash flow positive Pro Forma Enterprise Value $2,250 • Existing shareholders of Alvotech to roll 100% of holdings and maintain ~79% ownership in the combined company (2) Sources of Funds ($mm) Uses of Funds ($mm) Pro Forma Ownership 11% Cash to Balance 8% (1) OACB Cash in Trust $250 $425 Sheet Sellers’ Rollover Equity 2% PIPE Investment Transaction Fees & OACB Public Shareholders $175 $50 Proceeds Expenses PIPE Investors Existing Shareholder $50 (3) Investment Sponsor Shares Total Cash Sources $475 79% Total Cash Uses $475 1. Approximate estimate 2. Assumes no redemptions. Share count includes 180.6mm seller rollover shares, 25.0mm OACB public shares, 17.5mm PIPE shares and 5.0mm sponsor shares. Excludes impact of ~6.3mmOACB public warrants, ~4.7mm private placement warrants, 65 1.25mm sponsor earn-out shares, 38.33mm seller earn-out shares 3. Represents an investment by Alvogen, which is reflected in the Company’s $1.8Bn pre-money valuation 4. Based on net debt estimates for 11/15/21, comprising of $35mm cash and pro forma debt of $429mm (which reflects conversion of outstanding convertible instruments upon the closing of this transaction). Alvotech Shareholders have committed to ensure that Alvotech is sufficiently funded (either by way of equity or debt (or by organizing the latter for Alvotech) by providing at least $50.0 million for the operations of Alvotech through the closing of the Business Combination. Any additional equity financing provided to Alvotech between transaction announcement and closing will not dilute the OACB or PIPE investors. See slide 84 (Risk Factors) for more information
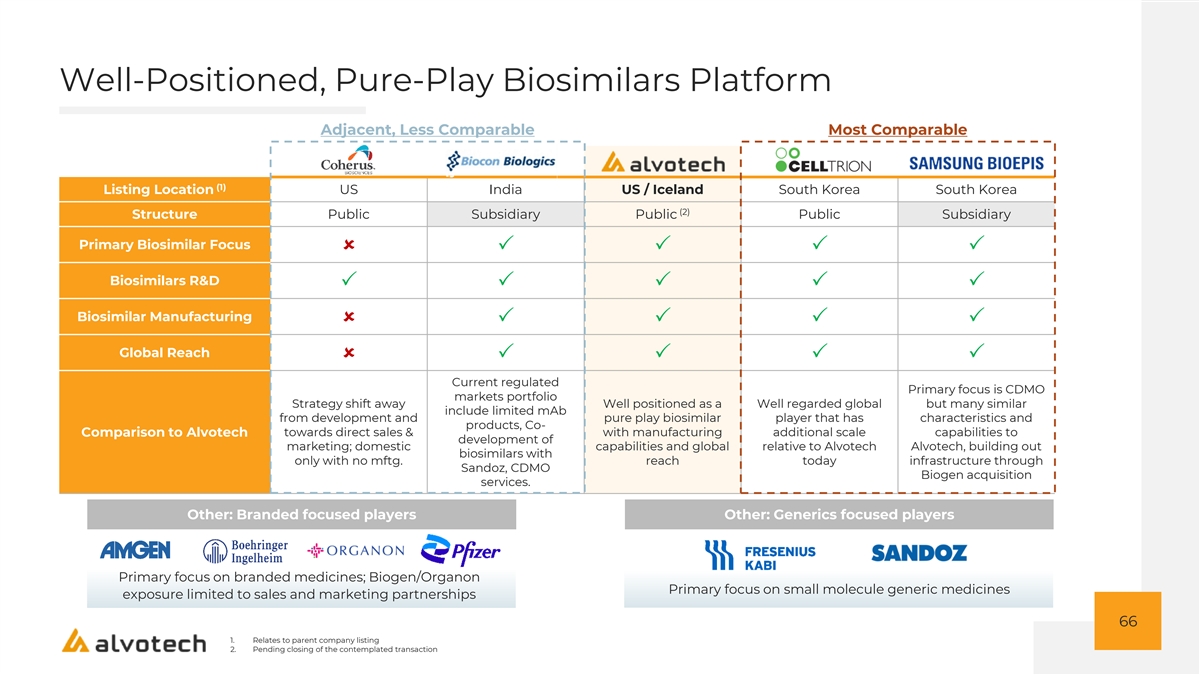
Well-Positioned, Pure-Play Biosimilars Platform Adjacent, Less Comparable Most Comparable (1) Listing Location US India US / Iceland South Korea South Korea (2) Structure Public Subsidiary Public Public Subsidiary Primary Biosimilar Focus ûPPPP Biosimilars R&D PPPPP Biosimilar Manufacturing ûPPPP Global Reach ûPPPP Current regulated Primary focus is CDMO markets portfolio Strategy shift away Well positioned as a Well regarded global but many similar include limited mAb from development and pure play biosimilar player that has characteristics and products, Co- towards direct sales & with manufacturing additional scale capabilities to Comparison to Alvotech development of marketing; domestic capabilities and global relative to Alvotech Alvotech, building out biosimilars with only with no mftg. reach today infrastructure through Sandoz, CDMO Biogen acquisition services. Other: Branded focused players Other: Generics focused players Primary focus on branded medicines; Biogen/Organon Primary focus on small molecule generic medicines exposure limited to sales and marketing partnerships 66 1. Relates to parent company listing 2. Pending closing of the contemplated transaction
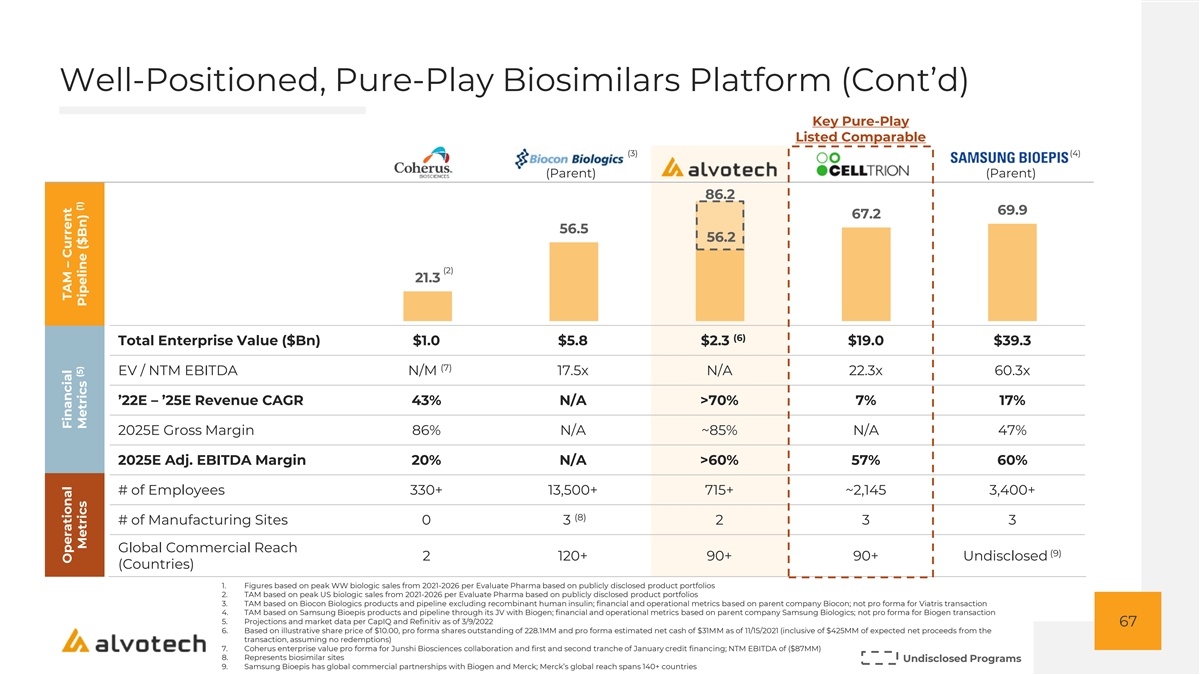
Well-Positioned, Pure-Play Biosimilars Platform (Cont’d) Key Pure-Play Listed Comparable (3) (4) (Parent) (Parent) 86.2 69.9 67.2 56.5 56.2 (2) 21.3 (6) Total Enterprise Value ($Bn) $1.0 $5.8 $2.3 $19.0 $39.3 (7) EV / NTM EBITDA N/M 17.5x N/A 22.3x 60.3x ’22E – ’25E Revenue CAGR 43% N/A >70% 7% 17% 2025E Gross Margin 86% N/A ~85% N/A 47% 2025E Adj. EBITDA Margin 20% N/A >60% 57% 60% # of Employees 330+ 13,500+ 715+ ~2,145 3,400+ (8) # of Manufacturing Sites 0 3 2 3 3 Global Commercial Reach (9) 2 120+ 90+ 90+ Undisclosed (Countries) 1. Figures based on peak WW biologic sales from 2021-2026 per Evaluate Pharma based on publicly disclosed product portfolios 2. TAM based on peak US biologic sales from 2021-2026 per Evaluate Pharma based on publicly disclosed product portfolios 3. TAM based on Biocon Biologics products and pipeline excluding recombinant human insulin; financial and operational metrics based on parent company Biocon; not pro forma for Viatris transaction 4. TAM based on Samsung Bioepis products and pipeline through its JV with Biogen; financial and operational metrics based on parent company Samsung Biologics; not pro forma for Biogen transaction 5. Projections and market data per CapIQ and Refinitiv as of 3/9/2022 67 6. Based on illustrative share price of $10.00, pro forma shares outstanding of 228.1MM and pro forma estimated net cash of $31MM as of 11/15/2021 (inclusive of $425MM of expected net proceeds from the transaction, assuming no redemptions) 7. Coherus enterprise value pro forma for Junshi Biosciences collaboration and first and second tranche of January credit financing; NTM EBITDA of ($87MM) 8. Represents biosimilar sites Undisclosed Programs 9. Samsung Bioepis has global commercial partnerships with Biogen and Merck; Merck’s global reach spans 140+ countries Operational Financial TAM – Current (5) (1) Metrics Metrics Pipeline ($Bn)
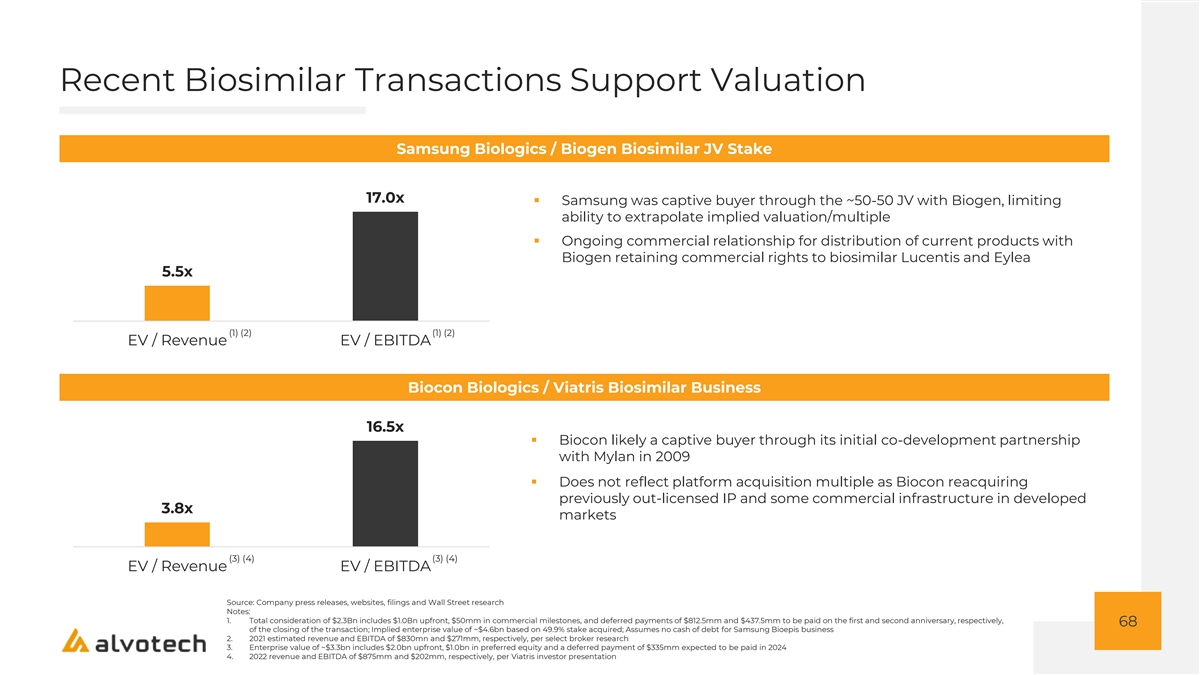
Recent Biosimilar Transactions Support Valuation Samsung Biologics / Biogen Biosimilar JV Stake 17.0x ▪ Samsung was captive buyer through the ~50-50 JV with Biogen, limiting ability to extrapolate implied valuation/multiple ▪ Ongoing commercial relationship for distribution of current products with Biogen retaining commercial rights to biosimilar Lucentis and Eylea 5.5x (1) (2) (1) (2) EV / Revenue EV / EBITDA Biocon Biologics / Viatris Biosimilar Business 16.5x ▪ Biocon likely a captive buyer through its initial co-development partnership with Mylan in 2009 ▪ Does not reflect platform acquisition multiple as Biocon reacquiring previously out-licensed IP and some commercial infrastructure in developed 3.8x markets (3) (4) (3) (4) EV / Revenue EV / EBITDA Source: Company press releases, websites, filings and Wall Street research Notes: 1. Total consideration of $2.3Bn includes $1.0Bn upfront, $50mm in commercial milestones, and deferred payments of $812.5mm and $437.5mm to be paid on the first and second anniversary, respectively, 68 of the closing of the transaction; Implied enterprise value of ~$4.6bn based on 49.9% stake acquired; Assumes no cash of debt for Samsung Bioepis business 2. 2021 estimated revenue and EBITDA of $830mn and $271mm, respectively, per select broker research 3. Enterprise value of ~$3.3bn includes $2.0bn upfront, $1.0bn in preferred equity and a deferred payment of $335mm expected to be paid in 2024 4. 2022 revenue and EBITDA of $875mm and $202mm, respectively, per Viatris investor presentation
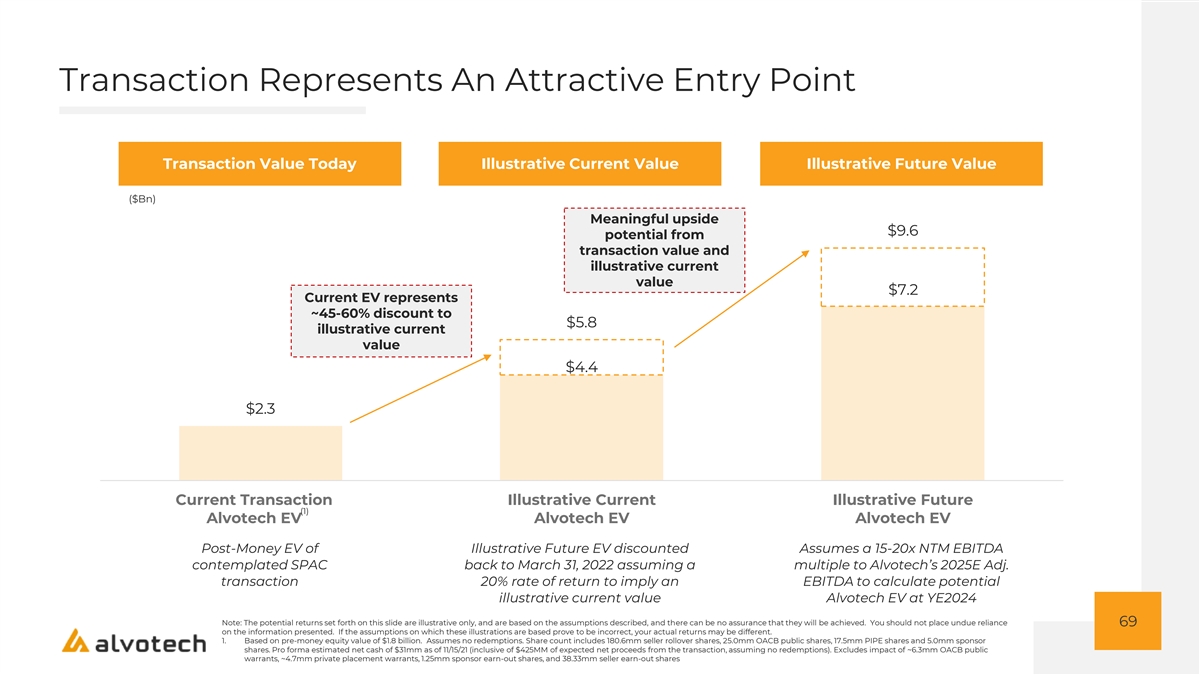
Transaction Represents An Attractive Entry Point Transaction Value Today Illustrative Current Value Illustrative Future Value ($Bn) Meaningful upside $9.6 potential from transaction value and illustrative current value $7.2 Current EV represents ~45-60% discount to $5.8 illustrative current value $4.4 $2.3 Current Transaction Illustrative Current Illustrative Future (1) Alvotech EV Alvotech EV Alvotech EV Post-Money EV of Illustrative Future EV discounted Assumes a 15-20x NTM EBITDA contemplated SPAC back to March 31, 2022 assuming a multiple to Alvotech’s 2025E Adj. transaction 20% rate of return to imply an EBITDA to calculate potential illustrative current value Alvotech EV at YE2024 Note: The potential returns set forth on this slide are illustrative only, and are based on the assumptions described, and there can be no assurance that they will be achieved. You should not place undue reliance 69 on the information presented. If the assumptions on which these illustrations are based prove to be incorrect, your actual returns may be different. 1. Based on pre-money equity value of $1.8 billion. Assumes no redemptions. Share count includes 180.6mm seller rollover shares, 25.0mm OACB public shares, 17.5mm PIPE shares and 5.0mm sponsor shares. Pro forma estimated net cash of $31mm as of 11/15/21 (inclusive of $425MM of expected net proceeds from the transaction, assuming no redemptions). Excludes impact of ~6.3mm OACB public warrants, ~4.7mm private placement warrants, 1.25mm sponsor earn-out shares, and 38.33mm seller earn-out shares
Q&A 70

Alvotech: A Differentiated Global Biosimilars Company PROVEN LEADERSHIP TEAM 1 SIGNIFICANT MARKET OPPORTUNITY 2 PURPOSE-BUILT BIOSIMILAR PLATFORM 3 GLOBAL COMMERCIAL PARTNER NETWORK 4 5 DIVERSE PIPELINE WITH SIGNIFICANT TAM ATTRACTIVE FINANCIAL PROFILE 6 71
APPENDIX SELECT MANAGEMENT TEAM BIOGRAPHIES
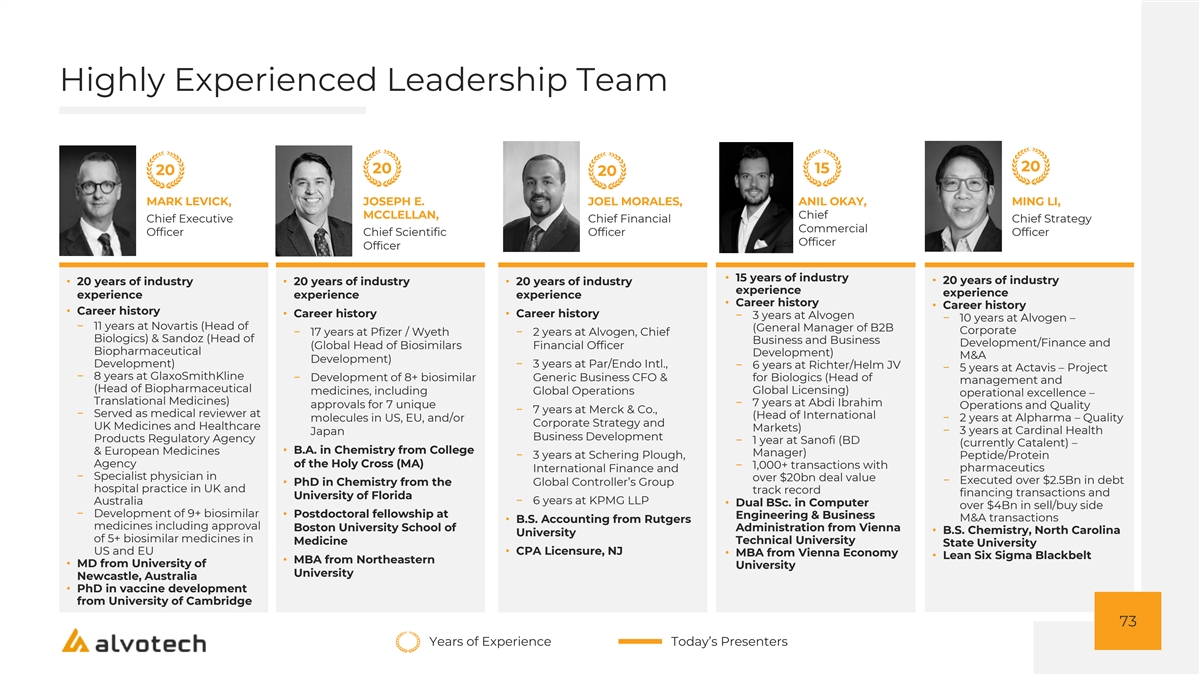
Highly Experienced Leadership Team 20 20 15 20 20 MARK LEVICK, JOSEPH E. JOEL MORALES, ANIL OKAY, MING LI, MCCLELLAN, Chief Chief Executive Chief Financial Chief Strategy Commercial Officer Chief Scientific Officer Officer Officer Officer • 15 years of industry • 20 years of industry • 20 years of industry • 20 years of industry • 20 years of industry experience experience experience experience experience • Career history • Career history • Career history • Career history• Career history − 3 years at Alvogen − 10 years at Alvogen – − 11 years at Novartis (Head of (General Manager of B2B Corporate − 17 years at Pfizer / Wyeth − 2 years at Alvogen, Chief Biologics) & Sandoz (Head of Business and Business Development/Finance and (Global Head of Biosimilars Financial Officer Biopharmaceutical Development) M&A Development) Development)− 3 years at Par/Endo Intl., − 6 years at Richter/Helm JV − 5 years at Actavis – Project − 8 years at GlaxoSmithKline − Development of 8+ biosimilar Generic Business CFO & for Biologics (Head of management and (Head of Biopharmaceutical Global Licensing) medicines, including Global Operations operational excellence – Translational Medicines) − 7 years at Abdi Ibrahim approvals for 7 unique Operations and Quality − 7 years at Merck & Co., − Served as medical reviewer at (Head of International − 2 years at Alpharma – Quality molecules in US, EU, and/or Corporate Strategy and UK Medicines and Healthcare Markets) − 3 years at Cardinal Health Japan Business Development Products Regulatory Agency − 1 year at Sanofi (BD (currently Catalent) – • B.A. in Chemistry from College & European Medicines Manager) − 3 years at Schering Plough, Peptide/Protein Agency of the Holy Cross (MA) − 1,000+ transactions with pharmaceutics International Finance and − Specialist physician in over $20bn deal value − Executed over $2.5Bn in debt • PhD in Chemistry from the Global Controller’s Group hospital practice in UK and track record financing transactions and University of Florida Australia − 6 years at KPMG LLP • Dual BSc. in Computer over $4Bn in sell/buy side − Development of 9+ biosimilar • Postdoctoral fellowship at Engineering & Business M&A transactions • B.S. Accounting from Rutgers medicines including approval Boston University School of Administration from Vienna • B.S. Chemistry, North Carolina University of 5+ biosimilar medicines in Technical University Medicine State University US and EU• CPA Licensure, NJ • MBA from Vienna Economy • Lean Six Sigma Blackbelt • MBA from Northeastern • MD from University of University University Newcastle, Australia • PhD in vaccine development from University of Cambridge 73 Years of Experience Today’s Presenters
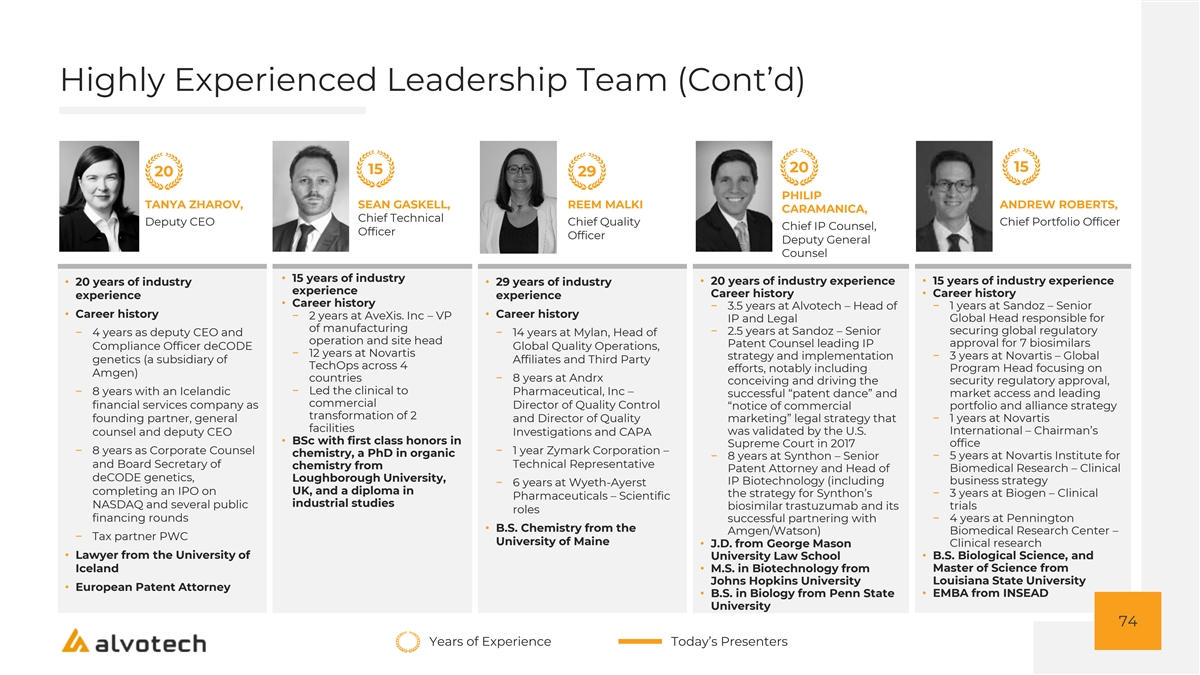
Highly Experienced Leadership Team (Cont’d) 20 15 15 20 29 PHILIP TANYA ZHAROV, SEAN GASKELL, REEM MALKI ANDREW ROBERTS, CARAMANICA, Chief Technical Deputy CEO Chief Quality Chief Portfolio Officer Chief IP Counsel, Officer Officer Deputy General Counsel • 15 years of industry • 20 years of industry experience • 15 years of industry experience • 20 years of industry • 29 years of industry experience Career history• Career history experience experience • Career history − 3.5 years at Alvotech – Head of − 1 years at Sandoz – Senior • Career history• Career history − 2 years at AveXis. Inc – VP IP and Legal Global Head responsible for of manufacturing − 2.5 years at Sandoz – Senior securing global regulatory − 4 years as deputy CEO and − 14 years at Mylan, Head of operation and site head Patent Counsel leading IP approval for 7 biosimilars Compliance Officer deCODE Global Quality Operations, − 12 years at Novartis strategy and implementation − 3 years at Novartis – Global genetics (a subsidiary of Affiliates and Third Party TechOps across 4 efforts, notably including Program Head focusing on Amgen) countries − 8 years at Andrx conceiving and driving the security regulatory approval, − 8 years with an Icelandic − Led the clinical to Pharmaceutical, Inc – successful “patent dance” and market access and leading commercial financial services company as Director of Quality Control “notice of commercial portfolio and alliance strategy transformation of 2 founding partner, general and Director of Quality marketing” legal strategy that − 1 years at Novartis facilities was validated by the U.S. International – Chairman’s counsel and deputy CEO Investigations and CAPA • BSc with first class honors in Supreme Court in 2017 office − 8 years as Corporate Counsel − 1 year Zymark Corporation – chemistry, a PhD in organic − 8 years at Synthon – Senior − 5 years at Novartis Institute for and Board Secretary of Technical Representative chemistry from Patent Attorney and Head of Biomedical Research – Clinical deCODE genetics, Loughborough University, IP Biotechnology (including business strategy − 6 years at Wyeth-Ayerst completing an IPO on UK, and a diploma in the strategy for Synthon’s − 3 years at Biogen – Clinical Pharmaceuticals – Scientific industrial studies NASDAQ and several public biosimilar trastuzumab and its trials roles financing rounds successful partnering with − 4 years at Pennington • B.S. Chemistry from the Amgen/Watson) Biomedical Research Center – − Tax partner PWC University of Maine • J.D. from George Mason Clinical research • Lawyer from the University of University Law School• B.S. Biological Science, and Iceland• M.S. in Biotechnology from Master of Science from Johns Hopkins University Louisiana State University • European Patent Attorney • B.S. in Biology from Penn State • EMBA from INSEAD University 74 Years of Experience Today’s Presenters
APPENDIX BIOSIMILAR BACKGROUND INFORMATION
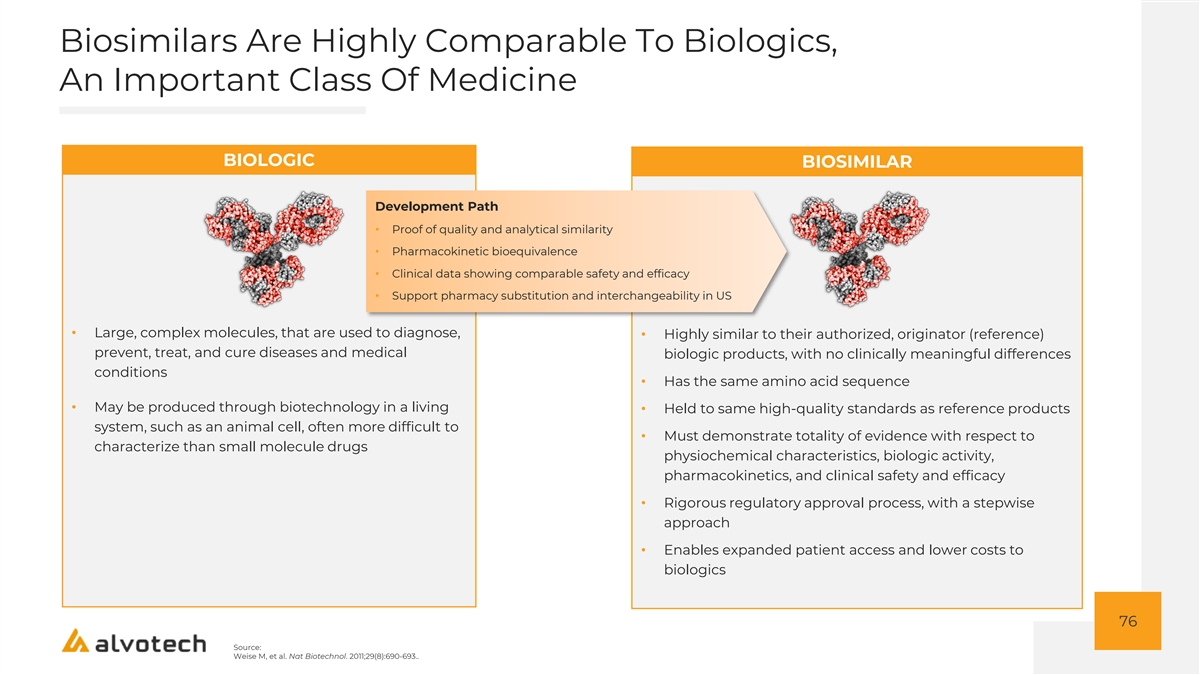
Biosimilars Are Highly Comparable To Biologics, An Important Class Of Medicine BIOLOGIC BIOSIMILAR Development Path • Proof of quality and analytical similarity • Pharmacokinetic bioequivalence • Clinical data showing comparable safety and efficacy • Support pharmacy substitution and interchangeability in US • Large, complex molecules, that are used to diagnose, • Highly similar to their authorized, originator (reference) prevent, treat, and cure diseases and medical biologic products, with no clinically meaningful differences conditions • Has the same amino acid sequence • May be produced through biotechnology in a living • Held to same high-quality standards as reference products system, such as an animal cell, often more difficult to • Must demonstrate totality of evidence with respect to characterize than small molecule drugs physiochemical characteristics, biologic activity, pharmacokinetics, and clinical safety and efficacy • Rigorous regulatory approval process, with a stepwise approach • Enables expanded patient access and lower costs to biologics 76 Source: Weise M, et al. Nat Biotechnol. 2011;29(8):690-693..
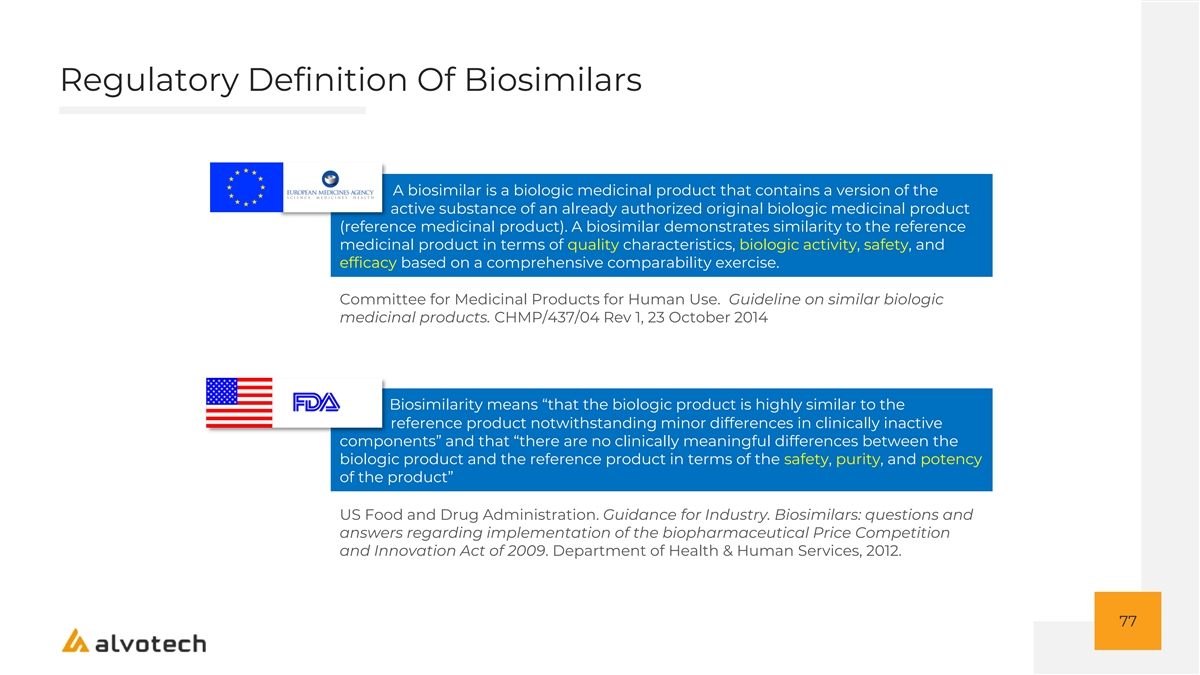
Regulatory Definition Of Biosimilars A biosimilar is a biologic medicinal product that contains a version of the active substance of an already authorized original biologic medicinal product (reference medicinal product). A biosimilar demonstrates similarity to the reference medicinal product in terms of quality characteristics, biologic activity, safety, and efficacy based on a comprehensive comparability exercise. Committee for Medicinal Products for Human Use. Guideline on similar biologic medicinal products. CHMP/437/04 Rev 1, 23 October 2014 Biosimilarity means “that the biologic product is highly similar to the reference product notwithstanding minor differences in clinically inactive components” and that “there are no clinically meaningful differences between the biologic product and the reference product in terms of the safety, purity, and potency of the product” US Food and Drug Administration. Guidance for Industry. Biosimilars: questions and answers regarding implementation of the biopharmaceutical Price Competition and Innovation Act of 2009. Department of Health & Human Services, 2012. 77
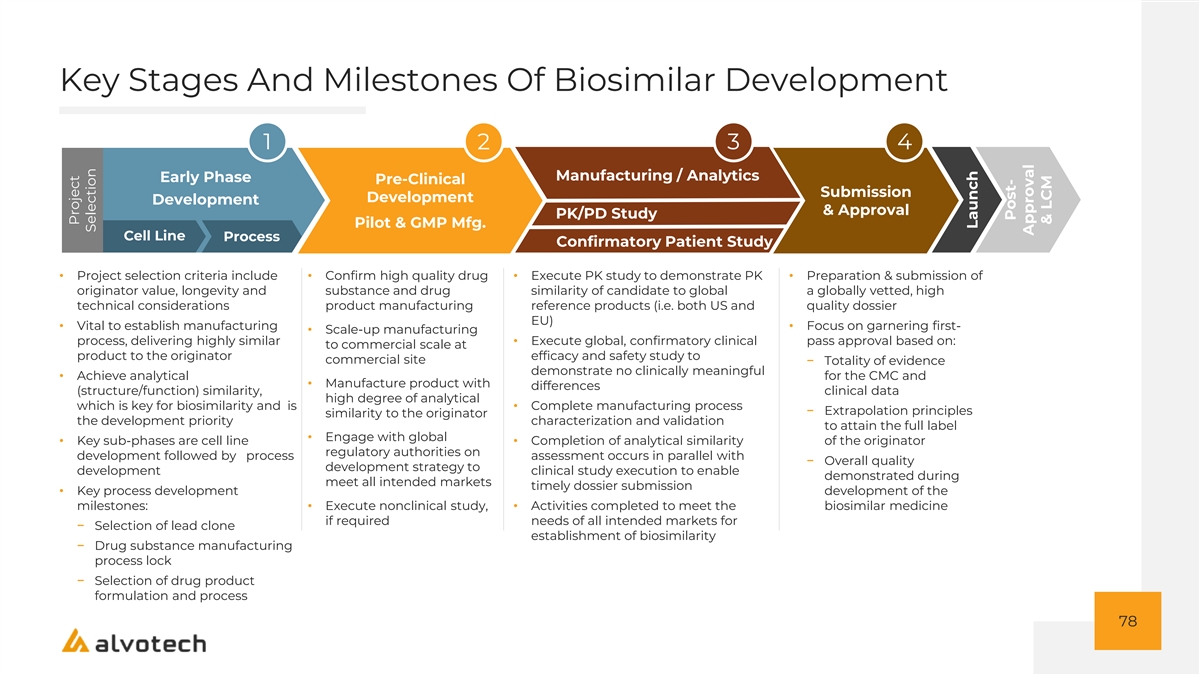
Key Stages And Milestones Of Biosimilar Development 1 2 3 4 Manufacturing / Analytics Early Phase Pre-Clinical Submission Development Development & Approval PK/PD Study Pilot & GMP Mfg. Cell Line Process Confirmatory Patient Study • Project selection criteria include • Confirm high quality drug • Execute PK study to demonstrate PK • Preparation & submission of originator value, longevity and substance and drug similarity of candidate to global a globally vetted, high technical considerations product manufacturing reference products (i.e. both US and quality dossier EU) • Vital to establish manufacturing • Focus on garnering first- • Scale-up manufacturing process, delivering highly similar • Execute global, confirmatory clinical pass approval based on: to commercial scale at product to the originator efficacy and safety study to commercial site − Totality of evidence demonstrate no clinically meaningful • Achieve analytical for the CMC and • Manufacture product with differences (structure/function) similarity, clinical data high degree of analytical which is key for biosimilarity and is • Complete manufacturing process − Extrapolation principles similarity to the originator the development priority characterization and validation to attain the full label • Engage with global • Key sub-phases are cell line • Completion of analytical similarity of the originator regulatory authorities on development followed by process assessment occurs in parallel with − Overall quality development strategy to development clinical study execution to enable demonstrated during meet all intended markets timely dossier submission • Key process development development of the milestones: • Execute nonclinical study, • Activities completed to meet the biosimilar medicine if required needs of all intended markets for − Selection of lead clone establishment of biosimilarity − Drug substance manufacturing process lock − Selection of drug product formulation and process 78 Project Selection Launch Post- Approval & LCM
APPENDIX Additional Product Background
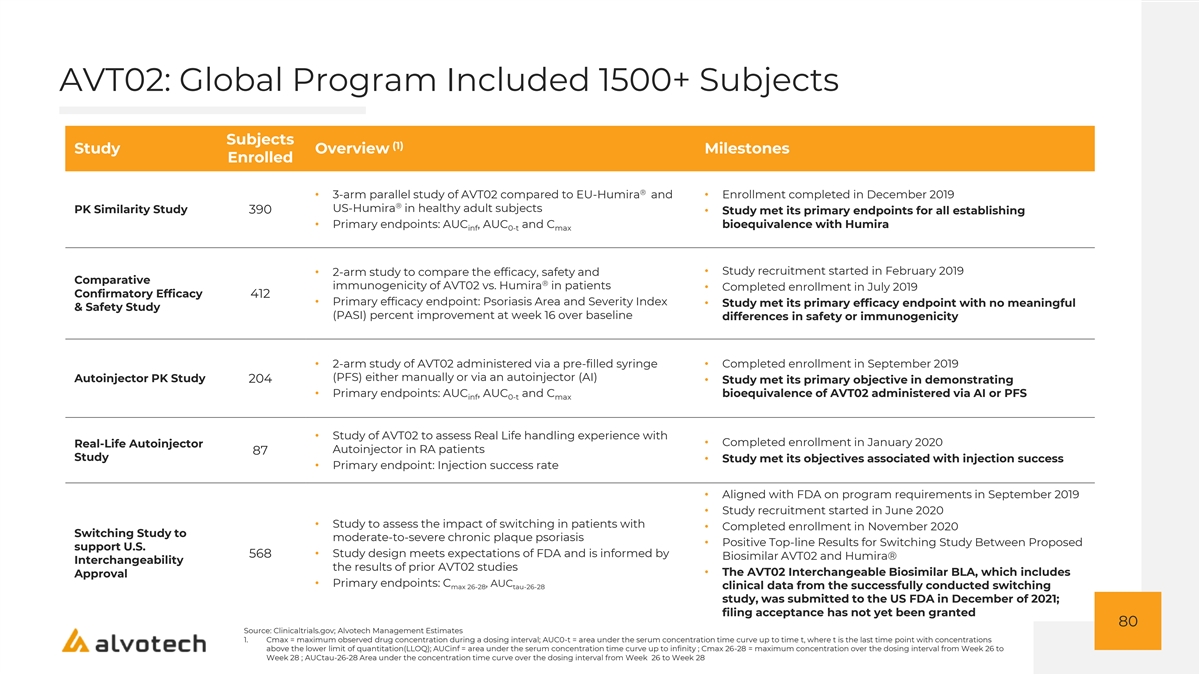
AVT02: Global Program Included 1500+ Subjects Subjects (1) Study Overview Milestones Enrolled ® • 3-arm parallel study of AVT02 compared to EU-Humira and • Enrollment completed in December 2019 ® US-Humira in healthy adult subjects PK Similarity Study 390 • Study met its primary endpoints for all establishing • Primary endpoints: AUC , AUC and C bioequivalence with Humira inf 0-t max • Study recruitment started in February 2019 • 2-arm study to compare the efficacy, safety and Comparative ® immunogenicity of AVT02 vs. Humira in patients • Completed enrollment in July 2019 Confirmatory Efficacy 412 • Primary efficacy endpoint: Psoriasis Area and Severity Index • Study met its primary efficacy endpoint with no meaningful & Safety Study (PASI) percent improvement at week 16 over baseline differences in safety or immunogenicity • 2-arm study of AVT02 administered via a pre-filled syringe • Completed enrollment in September 2019 (PFS) either manually or via an autoinjector (AI) Autoinjector PK Study 204 • Study met its primary objective in demonstrating • Primary endpoints: AUC , AUC and C bioequivalence of AVT02 administered via AI or PFS inf 0-t max • Study of AVT02 to assess Real Life handling experience with • Completed enrollment in January 2020 Real-Life Autoinjector Autoinjector in RA patients 87 Study • Study met its objectives associated with injection success • Primary endpoint: Injection success rate • Aligned with FDA on program requirements in September 2019 • Study recruitment started in June 2020 • Study to assess the impact of switching in patients with • Completed enrollment in November 2020 Switching Study to moderate-to-severe chronic plaque psoriasis • Positive Top-line Results for Switching Study Between Proposed support U.S. 568• Study design meets expectations of FDA and is informed by Biosimilar AVT02 and Humira® Interchangeability the results of prior AVT02 studies • The AVT02 Interchangeable Biosimilar BLA, which includes Approval • Primary endpoints: C , AUC max 26-28 tau-26-28 clinical data from the successfully conducted switching study, was submitted to the US FDA in December of 2021; filing acceptance has not yet been granted 80 Source: Clinicaltrials.gov; Alvotech Management Estimates 1. Cmax = maximum observed drug concentration during a dosing interval; AUC0-t = area under the serum concentration time curve up to time t, where t is the last time point with concentrations above the lower limit of quantitation(LLOQ); AUCinf = area under the serum concentration time curve up to infinity ; Cmax 26-28 = maximum concentration over the dosing interval from Week 26 to Week 28 ; AUCtau-26-28 Area under the concentration time curve over the dosing interval from Week 26 to Week 28
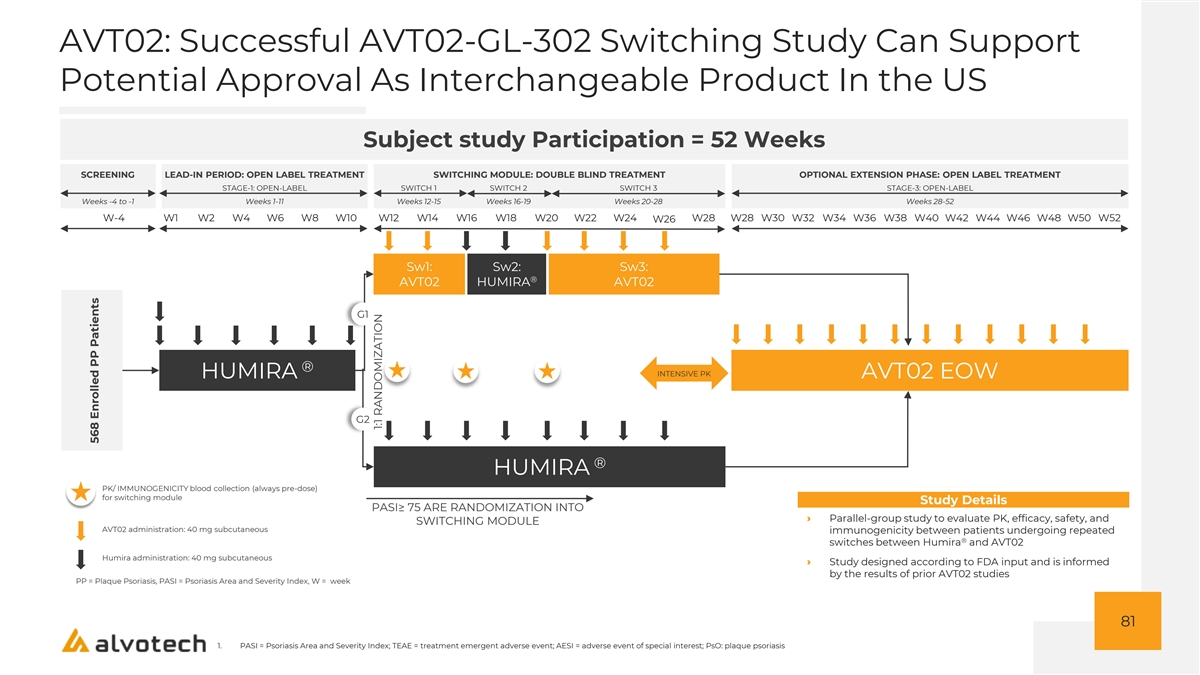
AVT02: Successful AVT02-GL-302 Switching Study Can Support Potential Approval As Interchangeable Product In the US Subject study Participation = 52 Weeks SCREENING LEAD-IN PERIOD: OPEN LABEL TREATMENT SWITCHING MODULE: DOUBLE BLIND TREATMENT OPTIONAL EXTENSION PHASE: OPEN LABEL TREATMENT STAGE-1: OPEN-LABEL SWITCH 1 SWITCH 2 SWITCH 3 STAGE-3: OPEN-LABEL Weeks -4 to -1 Weeks 1-11 Weeks 12-15 Weeks 16-19 Weeks 20-28 Weeks 28-52 W-4 W1 W2 W4 W6 W8 W10 W12 W14 W16 W18 W20 W22 W24 W28 W28 W30 W32 W34 W36 W38 W40 W42 W44 W46 W48 W50 W52 W26 Sw1: Sw2: Sw3: ® AVT02 HUMIRA AVT02 G1 ® INTENSIVE PK HUMIRA AVT02 EOW G2 ® HUMIRA PK/ IMMUNOGENICITY blood collection (always pre-dose) for switching module Study Details PASI≥ 75 ARE RANDOMIZATION INTO › Parallel-group study to evaluate PK, efficacy, safety, and SWITCHING MODULE AVT02 administration: 40 mg subcutaneous immunogenicity between patients undergoing repeated ® switches between Humira and AVT02 Humira administration: 40 mg subcutaneous › Study designed according to FDA input and is informed by the results of prior AVT02 studies PP = Plaque Psoriasis, PASI = Psoriasis Area and Severity Index, W = week 81 1. PASI = Psoriasis Area and Severity Index; TEAE = treatment emergent adverse event; AESI = adverse event of special interest; PsO: plaque psoriasis 568 Enrolled PP Patients 1:1 RANDOMIZATION
APPENDIX CCHT JOINT VENTURE

Alvotech’s China Commercial Partner: Yangtze River Pharmaceutical Group YRPG Network & Infrastructure China Coverage Overview › YRPG has well-established distribution networks cover all districts nationally with more than 10,000 hospitals, 1,200 chain stores, and 20,000 retails, which account for ~80% of the overall pharma sales in China › YRPG also has ~58 products exported to more than 20 countries in Asia, Europe, Latin America, and Africa with more products approved for launch › Currently has more than 16,000 employees national-wide Distribution Channel Coverage 80% 12% 8% Public Hospital Retail Pharmacies Community-Oriented Primary Care 83
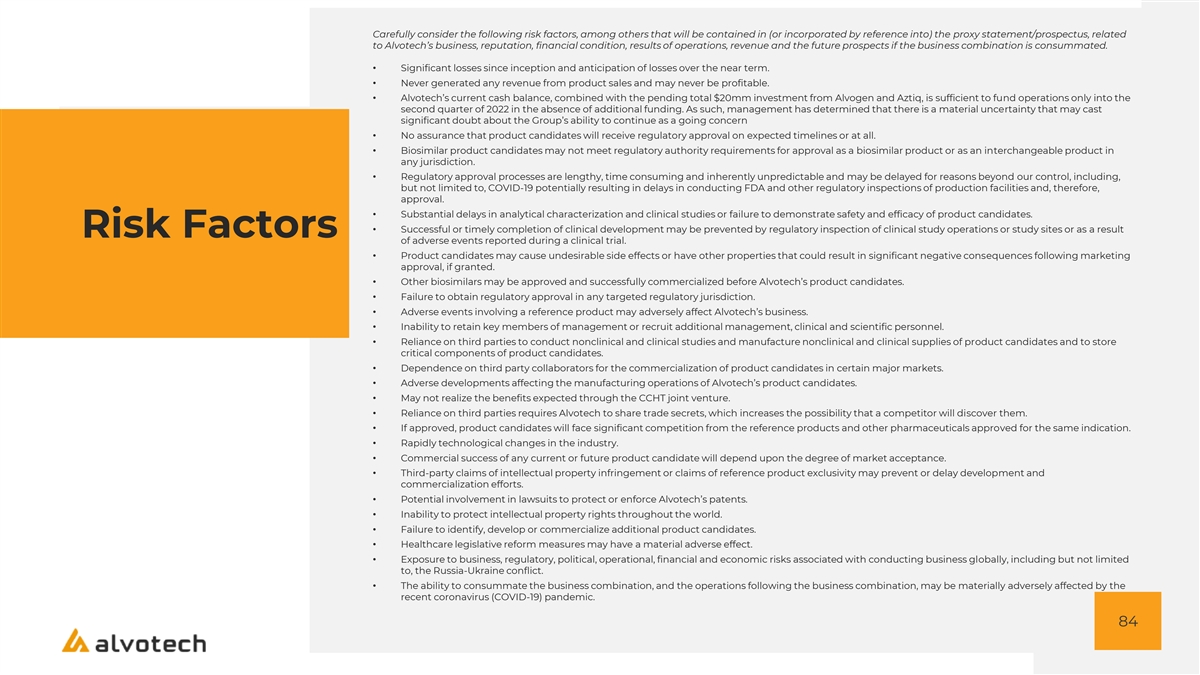
Carefully consider the following risk factors, among others that will be contained in (or incorporated by reference into) the proxy statement/prospectus, related to Alvotech’s business, reputation, financial condition, results of operations, revenue and the future prospects if the business combination is consummated. • Significant losses since inception and anticipation of losses over the near term. • Never generated any revenue from product sales and may never be profitable. • Alvotech’s current cash balance, combined with the pending total $20mm investment from Alvogen and Aztiq, is sufficient to fund operations only into the second quarter of 2022 in the absence of additional funding. As such, management has determined that there is a material uncertainty that may cast significant doubt about the Group’s ability to continue as a going concern • No assurance that product candidates will receive regulatory approval on expected timelines or at all. • Biosimilar product candidates may not meet regulatory authority requirements for approval as a biosimilar product or as an interchangeable product in any jurisdiction. • Regulatory approval processes are lengthy, time consuming and inherently unpredictable and may be delayed for reasons beyond our control, including, but not limited to, COVID-19 potentially resulting in delays in conducting FDA and other regulatory inspections of production facilities and, therefore, approval. • Substantial delays in analytical characterization and clinical studies or failure to demonstrate safety and efficacy of product candidates. • Successful or timely completion of clinical development may be prevented by regulatory inspection of clinical study operations or study sites or as a result Risk Factors of adverse events reported during a clinical trial. • Product candidates may cause undesirable side effects or have other properties that could result in significant negative consequences following marketing approval, if granted. • Other biosimilars may be approved and successfully commercialized before Alvotech’s product candidates. • Failure to obtain regulatory approval in any targeted regulatory jurisdiction. • Adverse events involving a reference product may adversely affect Alvotech’s business. • Inability to retain key members of management or recruit additional management, clinical and scientific personnel. • Reliance on third parties to conduct nonclinical and clinical studies and manufacture nonclinical and clinical supplies of product candidates and to store critical components of product candidates. • Dependence on third party collaborators for the commercialization of product candidates in certain major markets. • Adverse developments affecting the manufacturing operations of Alvotech’s product candidates. • May not realize the benefits expected through the CCHT joint venture. • Reliance on third parties requires Alvotech to share trade secrets, which increases the possibility that a competitor will discover them. • If approved, product candidates will face significant competition from the reference products and other pharmaceuticals approved for the same indication. • Rapidly technological changes in the industry. • Commercial success of any current or future product candidate will depend upon the degree of market acceptance. • Third-party claims of intellectual property infringement or claims of reference product exclusivity may prevent or delay development and commercialization efforts. • Potential involvement in lawsuits to protect or enforce Alvotech’s patents. • Inability to protect intellectual property rights throughout the world. • Failure to identify, develop or commercialize additional product candidates. • Healthcare legislative reform measures may have a material adverse effect. • Exposure to business, regulatory, political, operational, financial and economic risks associated with conducting business globally, including but not limited to, the Russia-Ukraine conflict. • The ability to consummate the business combination, and the operations following the business combination, may be materially adversely affected by the recent coronavirus (COVID-19) pandemic. 84


