Exhibit 99.1
Annual Report 2022 IPERIONX LIMITED ABN 84 618 935 372 Developing a sustainable, low cost U.S. titanium and rare earth supply chain.
Corporate Directory DIRECTORS: Mr. Todd Hannigan – Executive Chairman Mr. Anastasios Arima – CEO & Managing Director Ms. Lorraine Martin – Independent Non-Executive Director Mr. Vaughn Taylor – Independent Non-Executive Director Ms. Melissa Waller – Independent Non-Executive Director Ms. Beverly Wyse – Independent Non-Executive Director COMPANY SECRETARY: Mr. Gregory Swan OFFICES: Head office: 129 West Trade Street, Suite 1405 Charlotte, NC 28202 UNITED STATES Tennessee office: 279 West Main Street Camden, TN 38320 UNITED STATES Utah office: 1782 W 2300 S West Valley City, UT 84119 UNITED STATES Registered office: Level 9, 28 The Esplanade Perth WA 6000 AUSTRALIA WEBSITE: www.iperionx.com STOCK EXCHANGE LISTINGS: Nasdaq Capital Market (NASDAQ: IPX) Australian Securities Exchange (ASX: IPX) SHARE REGISTRY: Automic Pty Ltd Tel: 1300 288 664 Int: +61 2 9698 5414 01 24 25 26 27 28 29 56 57 62 63 64 Table of Contents Directors' Report Auditor's Independence Declaration Consolidated Statement of Profit or Loss and Other Comprehensive Income Consolidated Statement of Financial Position Consolidated Statement of Changes in Equity Consolidated Statement of Cash Flows Notes to the Financial Statements Directors' Declaration Independent Auditor's Report Mineral Resources Statement Corporate Governance ASX Additional Information LAWYERS: United States: Gibson, Dunn & Crutcher Johnston, Allison & Hord Australia: Thomson Geer BANKERS: United States: The Bank of New York Mellon Corp PNC Bank Australia: National Australia Bank AUDITOR: PricewaterhouseCoopers

DIRECTORS' REPORT The Directors of IperionX Limited (formerly Hyperion Metals Limited) present their report on the Consolidated Entity consisting of IperionX Limited (“Company” or “IperionX”) and the entities it controlled at the end of, or during, the year ended June 30, 2022 (“Consolidated Entity” or “Group”). DIRECTORS The names and details of the Company's directors in office at any time during the financial year or since the end of the financial year are: Mr. Todd Hannigan Executive Chairman Mr. Anastasios Arima Chief Executive Officer and Managing Director Ms. Lorraine M. Martin Independent Non-Executive Director (appointed effective September 13, 2021) Mr. Vaughn Taylor Independent Non-Executive Director Ms. Melissa G. Waller Independent Non-Executive Director (appointed effective September 13, 2021) Ms. Beverly M. Wyse Independent Non-Executive Director (appointed effective September 13, 2021) Unless otherwise stated, Directors held their office from July 1, 2021 until the date of this report. CURRENT DIRECTORS AND OFFICERS Mr. Todd Hannigan B.Eng (Hons), MBA Executive Chairman Mr. Hannigan has over 25 years’ of global experience in natural resources as company founder, chief executive officer, private capital investor and non-executive director. In these lead roles Mr. Hannigan has helped build multiple billion-dollar companies in the private and public markets. Mr. Hannigan has worked internationally in the mining and resources sector for Piedmont Lithium, Aston Resources, Xstrata Coal, Hanson PLC, BHP Billiton and MIM. Mr. Hannigan holds a Bachelor of Engineering (Mining) from The University of Queensland and an MBA from INSEAD. Mr. Hannigan was appointed as Non-Executive Chairman of the Company on February 1, 2021, and as Executive Chairman on May 24, 2021. During the three-year period to the end of the financial year, Mr. Hannigan held directorships in Piedmont Lithium Inc. (March 2021 – April 2022), GCX Metals Limited (May 2014 – June 2022), and GreenX Metals Limited (September 2014 – February 2021). Mr. Anastasios (Taso) Arima BCom Chief Executive Officer & Managing Director Mr. Arima has extensive experience in the development of energy and resource projects in North America, establishing outstanding management teams and high-quality projects, and has raised over A$500 million in equity funding over his career. Mr. Arima has been based in the United States since 2014. He was a founder and director of Piedmont Lithium Limited (NASDAQ/ASX: PLL), which has rapidly grown into a A$1 billion company and was instrumental in identifying and securing Piedmont’s lithium project. Mr. Arima is also the founder of Hyperion (Australia) Pty Ltd, which the Company acquired during the 2021 financial period and holds the Company’s Titan Project, a potentially large-scale titanium and zircon minerals sands project in west Tennessee. Mr. Arima attended the University of Western Australia where he earned a Bachelor of Commerce whilst studying for a Bachelor of Engineering. Mr. Arima was appointed as Director of Hyperion (Australia) Pty Ltd on July 20, 2021, as Executive Director of the Company on December 1, 2020, and as Managing Director and Chief Executive Officer on March 1, 2021. During the three-year period to the end of the financial year, Mr. Arima held directorships in Dominion Minerals Limited (November 2021 – present) and Piedmont Lithium Limited (October 2016 – June 2021). IperionX Limited ANNUAL REPORT 2022 1

DIRECTORS' REPORT (CONTINUED) CURRENT DIRECTORS AND OFFICERS (continued) Ms. Lorraine M. Martin B.A. (Computational Mathematics), M.Sc (Computer Science) Independent Non-Executive Director Ms. Martin is President and Chief Executive Officer of the National Safety Council, a non-profit with a century-long legacy of eliminating preventable deaths and injuries from the workplace. Ms. Martin has 35 years of experience in aerospace, including leading and developing complex global aircraft programs as a senior executive at Lockheed Martin. Ms. Martin was Executive Vice President and Deputy of Rotary and Mission Systems where she led a team of 34,000 global employees in the U.S., Canada, Mexico, Taiwan, Japan, United Kingdom, Germany, Poland, the Netherlands, New Zealand and Australia with operations in more than 75 worldwide facilities. In this role, she spearheaded the successful operational and cultural integration of Sikorsky, a global leader in helicopters. Ms. Martin led Lockheed Martin’s largest defense program, the F-35 Lightning II Program, where she was Executive Vice President & General Manager with full P&L responsibility for a program with over $8bn in annual revenue and 9,000 employees. Before this, she was Vice President of the C-130 & C-5 Programs where she led 3,000 employees for a $2bn aircraft mobility portfolio. Ms. Martin has a Masters of Science in computer science from Boston University and a BA in computational mathematics from DePauw University. Ms. Martin was appointed as Non-Executive Director of the Company on September 13, 2021. During the three-year period to the end of the financial year, Ms. Martin held a directorship in Kennametal Inc. (NYSE: KMT) (July 2018 – present). Kennametal is a global materials science firm with a market capitalization of ~US$3 billion that serves customers across aerospace, energy, engineering and transportation. Mr. Vaughn Taylor BBus (Accounting), SAFin Independent Non-Executive Director Mr. Taylor was previously Executive Director and Chief Investment Officer of AMB Capital Partners (“AMB”), the global investment platform of the Western Australian based Bennett Family, whose wealth is tied to the Australian Iron Ore industry. Mr. Taylor was with AMB since the formation of the investment platform over 10 years ago, and was responsible for executing on the investment strategy, expanding the investment platform and portfolio into offshore markets, overseeing the operations and portfolio on a day-to-day basis and sourcing new investment opportunities. Mr. Taylor is a board member of multiple leading organisations both in Australia and internationally, including Cornerstone Health, 4Cyte Pathology, Arrow Capital Partners, Invictus Capital Partners and GB Energy. Mr. Taylor holds a Bachelor of Business (Accounting) and a Master of Business (Real Estate) from RMIT University and gained further accreditation at the Robert H. Smith School of Business at the University of Maryland (USA). Mr. Taylor also holds a Graduate Diploma in Applied Finance and Investment from FINSIA and is a member of FINSIA and the Australian Institute of Company Directors. Mr. Taylor was appointed as Non-Executive Director of the Company on March 3, 2021. During the three-year period to the end of the financial year, Mr. Taylor has not held a directorship in any other listed companies. Ms. Melissa G. Waller B.A. (Journalism and Mass Communications) Independent Non-Executive Director Ms. Waller has over 30 years’ experience as a senior finance executive and is President for the AIF Institute, providing essential education, research and resources to investors and investment firms globally with over $50 trillion assets under management. Ms. Waller is the former Deputy Treasurer and Chief of Staff for the North Carolina Department of State Treasury, where she successfully oversaw Department strategic planning, operations, and public-policy implementation, along with a staff of more than 400 employees, including the North Carolina Retirement Systems, the pension fund for the state and the tenth largest public pension fund in the United States, with assets in excess of $90 billion. Ms. Waller has served as Chair of the Department’s Corporate Governance Committee, as well as on the Council of Institutional Investors Board of Directors and the Governor’s Board of Innovation for the North Carolina University System. She currently serves as Executive Program Director for the National Institute of Public Finance, as well as Director of Public and Private Partnerships for the Kenan Institute. Ms. Waller has a bachelor’s degree in journalism and mass communications from the University of North Carolina. Ms. Waller was appointed as Non-Executive Director of the Company on September 13, 2021. During the three-year period to the end of the financial year, Ms. Waller has not held a directorship in any other listed companies. IperionX Limited ANNUAL REPORT 2022 2
DIRECTORS' REPORT (CONTINUED) CURRENT DIRECTORS AND OFFICERS (continued) Ms. Beverly M. Wyse B.Sc. (Mechanical Engineering), MBA Independent Non-Executive Director Ms. Wyse has over 30 years’ of senior leadership in the aerospace industry with Boeing, the world's largest aerospace company. Ms. Wyse was the President of Shared Services, a +7,000-person, multi-billion dollar operating group that provides internal services across Boeing’s global enterprises in more than 65 countries. Previously, Ms. Wyse was the Vice President & General Manager of Boeing South Carolina, a major engineering design, manufacturing, assembly, and delivery site for Boeing that included the 787 Dreamliner Aft-body and Mid-body operations, 787 final assembly, delivery and test operations. Ms. Wyse was Vice President and General Manager of the 737 Program, from 2010 to 2015, successfully leading the design, development, certification, production and delivery for Boeing’s largest commercial program. Before this, Ms. Wyse was the Vice President & General Manager of the 767 Program. Ms. Wyse has a bachelor’s degree in Mechanical Engineering and a Master’s in Business Administration, from the University of Washington in Seattle. Ms. Wyse was appointed as Non-Executive Director of the Company on September 13, 2021. During the three-year period to the end of the financial year, Ms. Wyse held a directorship in Héroux-Devtek Inc. (TSX: HRX) (February 2019 – present). Héroux-Devtek is an international company specializing in the design, development, manufacture, integration, testing and repair, and overhaul of landing gear, actuation systems and components for the aerospace market. Mr. Gregory Swan BCom, CA, FCIS, FFin Company Secretary Mr. Swan is a Chartered Accountant and Chartered Secretary and is currently Company Secretary and Chief Financial Officer for several listed companies that operate in the resources sector. He commenced his career at a large international Chartered Accounting firm and has since been involved with a number of exploration and development companies, including Piedmont Lithium Limited, Mantra Resources Limited and Papillon Resources Limited. Mr. Swan was appointed as Director of Hyperion (Australia) Pty Ltd on July 20, 2021 and as Company Secretary of the Company on December 16, 2020. PRINCIPAL ACTIVITIES The principal activities of the Group during the year consisted of the exploration and development of resource projects. IperionX Limited ANNUAL REPORT 2022 3
DIRECTORS' REPORT (CONTINUED) OPERATING AND FINANCIAL REVIEW Operations IperionX aims to be a leading developer of sustainable critical mineral and critical material supply chains in the United States, a mission we believe is important for the global transition towards a circular, low-carbon, resource efficient green economy. We aim to achieve this mission through a multi-pronged strategy comprising a variety of technology, integration, and sustainability focused initiatives. Titanium Metal Technologies IperionX aims to commercialize a series of patented titanium manufacturing technologies (the “Technologies”) that have the potential to reduce the cost and carbon emissions of titanium production relative to what is commercially available today. With these Technologies, which we do not currently own but hold an exclusive option to acquire, we plan to enable the widespread use of titanium and possibly displace metals like steel and aluminum which have lower strength-to-weight ratios, inferior corrosion resistance and likely higher net-carbon emissions. IperionX holds an exclusive option to acquire Blacksand Technology, LLC (“Blacksand”), which holds the rights to commercialize the Technologies to produce metal products from titanium and/or its alloy. The Technologies were invented by Dr. Zhigang Zak Fang at the University of Utah with support from the Advanced Research Programs Agency – Energy (“ARPA-E”) within the Department of Energy (“DOE”). The partnership between Dr. Fang and ARPA-E focused largely on reducing vehicular weight through the use of titanium in place of steel to reduce energy consumption and emissions in the transportation sector. The Technologies have successfully produced titanium at a pilot scale level and have shown the potential to be applied to other critical minerals as well. The Technologies offer IperionX the potential to produce U.S.-sourced, low-carbon titanium metal products at potentially reduced cost and carbon emissions relative to what is commercially available today with higher strength-to-weight ratios and superior corrosion resistance. Such titanium is potentially substitutable for stainless steel and aluminum in a wide variety of applications. The Technologies can utilize not only raw titanium minerals, but also titanium metal scrap as feedstock, potentially allowing for a circular titanium process, once commercialized. These Technologies may also be applied to other metals including rare earth elements and zirconium. The Company has secured a prospective source of feedstock for these metals via its wholly owned critical minerals project in Tennessee. Critical Minerals We aim to vertically integrate these Technologies with sustainable, resource-efficient material feedstocks, to develop a U.S. based titanium and critical mineral supply chain. Vertical integration and supply chain transparency are key components to IperionX’s strategy, and we aim to achieve this through the development of IperionX’s 100% interest in the Titan Project in Tennessee, United States (the “Titan Project”). The Titan Project represents a potential secure source of high-quality mineral feedstock for the Technologies, to supplement scrap titanium metal feedstocks. The Titan Project forms part of a large-scale critical mineralization trend in the physiographical area of the United States known as the Mississippi embayment that contains significant potential for critical materials including titanium, zirconium, and rare earth elements. We believe that vertical integration with U.S.-based resource operations would be a major competitive advantage for IperionX, providing a potential source of critical mineral feedstock. Using any potential future mineral feedstock from the Titan Project, if developed, is likely to be a strategic advantage for IperionX, but the commercial success of the Technologies is not reliant upon commercial success at the Titan Project. Sustainability We believe the global transition towards the green economy could drive significant increased demand for sustainable critical minerals and advanced metals. In particular, we believe high demand could arise for those minerals and metals needed for the drive to achieve decarbonization via electrification, especially those that enable advanced technologies including titanium and rare earth elements. We believe that these raw materials have historically been produced without a focus on environmental sustainability, resource scarcity, or social equity. Through the Technologies, the development of a circular and sustainable titanium metal supply chain could be made possible for the first time. IperionX’s efforts to develop the Titan Project (and any future critical mineral operations) would focus on environmental sustainability and improving the well-being of the surrounding communities, setting the standard for future development of similar critical mineral projects. IperionX’s strategy, if successful, could allow for the substitution of titanium metal in structural applications providing for closed-loop recyclability, longer product lifetimes and increased product reusability. Together with the integration of the Titan Project, IperionX’s strategy aims to re-shore a fully integrated mineral-to-metal U.S. titanium supply chain in accordance with sustainable best practices. IperionX Limited ANNUAL REPORT 2022 4

DIRECTORS' REPORT (CONTINUED) OPERATING AND FINANCIAL REVIEW (continued) Operations (continued) Sustainability (continued) The result would be the creation of a domestic U.S. circular titanium metal supply chain that would have a focus on environmental sustainability and social equity whilst also providing sustainable, low-carbon valuable critical minerals including rare earth elements. Why Titanium? Titanium is a strong, lightweight metal with ideal properties for broad applications in defense, aerospace, space exploration, transportation and electric vehicles, unmanned vehicles, and many other advanced manufacturing applications. We believe the global transition towards the green economy could drive significant increased demand for critical materials. This is especially true of those needed to decarbonize and electrify the global economy and enable advanced technologies, like titanium and rare earth elements. These raw materials have historically been produced without a heavy focus on environmental sustainability, resource scarcity, or social equity. We believe titanium has the potential to be a key green economy enabling critical material via its substitution for stainless steel and aluminum. In our opinion, the use of stainless steel or aluminum as structural metals, whether it be for the structural components in an electric vehicle battery pack, case components in consumer electronic devices, or the mounting structures in solar arrays, will increase with the transition to a green economy. We believe the existing production of these metals results in significant global carbon emissions which must be addressed to transition to net-zero economy. We believe titanium is a superior metal to stainless steel and aluminum in many applications due to its combined superior properties including high strength-to-weight ratio and excellent corrosion resistance. In our opinion, only titanium’s historically high production cost has held it back from being widely used in place of stainless steel and aluminum. Titanium metal manufacturing capacity in the U.S. from titanium minerals is almost non-existent. As of 2021, the current U.S. titanium metal demand from the aerospace, medical, space and defense sectors is heavily reliant on international supply chains. We believe these supply chains are not only environmentally and socially unsustainable but could also be a threat to U.S. national security given the reliance on imported titanium feedstocks for use within the U.S. defense sector. The Technologies have the potential to create a cost-competitive production of low-carbon titanium via scrap-to-metal and mineral-to-metal manufacturing processes within the United States that has a focus on recyclability, environmental sustainability and social equity with the ultimate aim of allowing for the proliferation of titanium use across industries. Titanium ingot producers and major U.S aeronautic and space manufacturing facilities IperionX Limited ANNUAL REPORT 2022 5
DIRECTORS' REPORT (CONTINUED) OPERATING AND FINANCIAL REVIEW (continued) Highlights Highlights during and subsequent to the end of the financial year were as follows: Titanium metal production and advanced titanium technologies IperionX is successfully scaling its titanium metal powder production capacity, using 100% recycled titanium scrap as feedstock, at its operational Titanium Pilot Facility in Salt Lake City, Utah. As a result, IperionX has accelerated its plans to develop a Titanium Demonstration Facility with an initial target capacity of ~125 tonnes per annum by the end of 2022. IperionX has plans to build a large Titanium Commercial Facility after the Titanium Demonstration Facility has been commissioned and optimized. Commercial discussions with a wide range of potential customers across the automotive, consumer electronics, consumer luxury goods, defense and additive manufacturing / 3D printing sectors are accelerating. In October 2021, IperionX entered into an option agreement to acquire Blacksand Technology, LLC, establishing a market leader in advanced titanium technologies that offer potentially low cost, low carbon titanium metal and powders from sustainable all-American recycled metal and critical minerals supply chains. The potential future combination of the Company and Blacksand would be transformational and bring together two highly complementary organizations to establish a world-class titanium and critical materials market leader. Qualification of titanium powder for the U.S. Navy IperionX formally partnered with Material Resources LLC (MRL) to qualify and demonstrate the performance of IperionX’s U.S. produced titanium powder for additively manufactured aerospace parts. This partnership supports an MRL project with the U.S. Navy to test titanium flight critical metal replacement components for the DoD. Outstanding progress at the Titan Project In October 2021, IperionX announced a maiden Mineral Resource for the Titan Project confirming the Titan Project as one of the largest and most important critical mineral deposits in the United States. The Mineral Resource comprises 431Mt @ 2.2% Total Heavy Minerals (“THM”), containing 9.5Mt THM at a 0.4% cut-off, which includes a high-grade core of 195Mt @ 3.7% THM, containing 7.1Mt THM at a 2.0% cut-off. In June 2022, IperionX announced the positive results of a Scoping Study on the Titan Project. The Scoping Study results demonstrate the Titan Project’s potential to be a sustainable, low cost and globally significant North American producer of titanium, rare earths and other critical minerals needed for a low carbon future. The shallow, high grade and unconsolidated nature of the sandy mineralization enables the potential for simple mining operations such as dozer push followed by an industry standard mineral processing flowsheet. MoUs for offtake with Chemours and Mario Pilato Memorandum of understanding (“MoU”) signed with Chemours for the potential supply of the titanium feedstocks ilmenite and rutile, as well as the industrial mineral staurolite. Chemours is one of the world’s largest producers of high-quality titanium dioxide products for coatings, plastics, and laminates, including one of the world’s largest facilities at New Johnsonville, Tennessee, located 20 miles from the Company’s Titan Project. IperionX signed an MoU for the potential supply of zircon products to Mario Pilato, a leading international supplier of raw materials for ceramics, glass and refractories, from the Titan Project. The benchmark price for Zircon is currently reported to be over US$3,000 per tonne (CIF China) driven by high levels of global demand and a lack of new supply. IperionX’s Titan Project contains a significant proportion of zircon and has the potential to be the largest U.S. producer of this highly valuable critical mineral. Rare earths testwork Rare earth concentrates flotation test work identified a 97% overall recovery of rare earth minerals from a heavy mineral concentrate, providing the potential for a higher grade rare earth product than could be achieved without flotation. The successful flotation of rare earth minerals as a preliminary processing stage provides the potential for significant benefits to a future mineral separation plant design. Importantly, extraction of the highly valuable rare earths as a preliminary processing stage confirms the potential for significant optionality for product strategy and phased plant development. IperionX Limited ANNUAL REPORT 2022 6

DIRECTORS' REPORT (CONTINUED) OPERATING AND FINANCIAL REVIEW (continued) Highlights (continued) U.S. Rare Earths Venture with Energy Fuels Energy Fuels completed laboratory evaluation of IperionX’s rare earth minerals, including monazite and xenotime, sourced from the Tennessee based Titan Project. This IperionX rare earth mineral sample was confirmed as a high- quality feedstock that would be suitable to feed Energy Fuels’ commercial production of mixed rare earth carbonate, an advanced material ready for rare earth separation. Importantly, IperionX’s Titan Project contains a significant distribution of the highly valuable heavy rare earths, terbium and dysprosium which distinguishes it from most other rare earth projects that lack these important heavy rare earth elements. Continued ESG focus Continued work with PGS Consults on an Environmental, Sustainability and Corporate Governance assessment and subsequent integration study, completing the initial materiality assessment, with a life cycle assessment and creation of a playbook for ESG leadership underway. IperionX and University of Tennessee Institute of Agriculture (“UTIA”) partnered to research the implementation of sustainable operating and rehabilitation practices at the Titan Project. IperionX and UTIA will establish a 10-acre demonstration site at the Titan Project for the initial scope of work, intended to be used for further sustainability investigations, including the use of biochars, gypsum and other soil amendments to aid in higher crop yields and carbon sequestration through the use of selective vegetation and sustainable soil additives. Corporate In June 2022, IperionX commenced trading on the Nasdaq Capital Market (“Nasdaq”) in the U.S. under the ticker symbol “IPX”. Each American depositary shares (“ADS”) represents 10 ordinary shares in the Company. IperionX continues to maintain its existing listing of ordinary shares on the ASX under the same symbol “IPX”. Nasdaq is one of the world’s premier venues for growth companies, with the listing providing the potential for increased liquidity and exposure to institutional and retail investors in the United States. Appointed leading U.S. based independent Non-Executive Directors Lorraine Martin (former VP & GM, Lockheed Martin), Beverly Wyse (former VP & GM, Boeing) and Melissa Waller (former Deputy Treasurer, North Carolina Department of State Treasury) and further additions to the Company’s Scientific and Technology Advisory Board, including Ali Yousefiani (Boeing), Elina Fu (former TIMET & SpaceX) and Tom Witheford (former Allegheny Technologies & GKN Powder Metallurgy). Completed a private placement of 20 million shares at an issue price of A$1.20 per share to institutional, sophisticated and professional investors to raise gross proceeds of A$24.0 million (US$17.6 million). The placement was led by cornerstone investor, Fidelity Management & Research Company, one of the largest investment management firms in the United States. IperionX Limited ANNUAL REPORT 2022 7

DIRECTORS' REPORT (CONTINUED) OPERATING AND FINANCIAL REVIEW (continued) Titanium Metal Technologies Blacksand Technology, LLC (“Blacksand”) invented a series of patented titanium manufacturing technologies (the “Technologies”) at the University of Utah in partnership with the U.S. Department of Energy’s Advanced Research Projects Agency – Energy (ARPA-E) and industry leaders Boeing and Arconic. By combining the Technologies with wide scale industrial advanced manufacturing capabilities such as Additive Manufacturing (AM)/3D printing, MIM and other methods, there is a compelling market opportunity with the potential to produce low-carbon spherical titanium powders at a fraction of current costs. We believe Titanium to be a superior metal to stainless steel and aluminum for a wide range of high-performance applications in the aerospace, medical, space and defense sectors. No metal has the same combined superior properties of light weight, strength and corrosive resistance as titanium. Only titanium’s historically high cost has held it back from being used in larger consumer markets. The Technologies offers IperionX the potential to produce US-sourced, circular, low-carbon titanium that costs less and can reduce the carbon emissions of an advanced economy through replacing inferior metals. The potential exists to apply the Technologies to produce other metals as well. 100% recycled IperionX Ti feedstock HAMR spherical titanium metal powder 3D printed parts from HAMR powder. Blacksand is a materials innovation company founded in 2013 by Dr. Z. Zak Fang, Professor of Materials Science and Engineering of the University of Utah. Blacksand has developed proprietary and patented technologies to produce low-cost, low carbon spherical and non-spherical titanium and its alloys, stainless-steel powders, and refractory metal alloy powders. Core competencies of Blacksand include expertise on metallic materials manufacturing processes, especially metal powders synthesis, characterization, processing, sintering, and mechanical properties. Blacksand expertise covers titanium, refractory metals, hard materials, and other specialty alloys. The patented technology is a potential low-cost, low-carbon titanium powder production process that utilizes hydrogen to destabilize Ti-O, making it possible to turn the reduction of TiO2 with magnesium from thermodynamically impossible to thermodynamically favored. This allows TiO2 to be reduced and deoxygenated directly by magnesium to form TiH2, with low oxygen levels that can meet the needs of the industry. TiH2 can be further processed to titanium metal through standard industry methods. The patented Hydrogen Assisted Magnesiothermic Reduction (“HAMR”) process reduces the energy intensity and resulting carbon emissions and cost of producing titanium metals. The Granulation-Sintering-Deoxygenation (“GSD”) process applies the HAMR technology to a simple process that has the potential to produce spherical titanium powders which can then be used in 3D printing and additive manufacturing. GSD significantly improves the yield of metal powders compared to traditional gas and plasma atomization techniques and produces a spherical powder with low oxygen, controllable particle size and excellent flowability. The Hydrogen Sintering and Phase Transformation (“HSPT”) process is a patented technology that makes it possible to achieve a wrought-like microstructure in Ti-6Al-4V alloy parts without thermo-mechanical working. We believe the ability to leave out thermo-mechanical processing opens the door for potential production of Ti-6Al-4V parts at a fraction of the cost without compromising performance. Importantly, with these Technologies the source material can be recycled titanium scrap material. The manufacturing of titanium components and structures can generate a large amount of titanium machining chips. This ‘scrap’ loss can account for a substantial portion of the weight of complex traditionally milled parts. This scrap titanium can be sorted, cleaned, and prepared for processing as a source material for the GSD process. This recycling pathway can reduce costs and significantly improve the sustainability of titanium metal manufacturing. Integration of these Technologies with sustainable, resource efficient material feedstocks could be accomplished (in part) by the development of a U.S.-based titanium mineral supply chain through the potential future development of IperionX’s 100% interest in the Titan Project in Tennessee, United States. In addition to any future potential IperionX’s supply from the Titan Project, the Technologies can accept scrap metal feedstocks. The Technologies have demonstrated the effectiveness of using both mineral and scrap feedstock at pilot scale and the Company is working to secure additional scrap feedstocks and to potentially develop the Titan Project to secure long-term vertically integrated supply of feedstock for the Technologies. IperionX Limited ANNUAL REPORT 2022 8
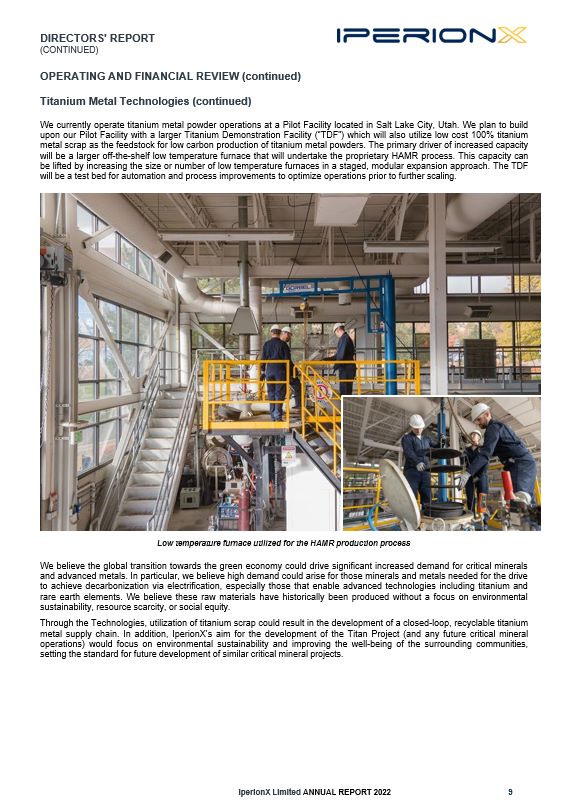
DIRECTORS' REPORT (CONTINUED) OPERATING AND FINANCIAL REVIEW (continued) Titanium Metal Technologies (continued) We currently operate titanium metal powder operations at a Pilot Facility located in Salt Lake City, Utah. We plan to build upon our Pilot Facility with a larger Titanium Demonstration Facility (“TDF”) which will also utilize low cost 100% titanium metal scrap as the feedstock for low carbon production of titanium metal powders. The primary driver of increased capacity will be a larger off-the-shelf low temperature furnace that will undertake the proprietary HAMR process. This capacity can be lifted by increasing the size or number of low temperature furnaces in a staged, modular expansion approach. The TDF will be a test bed for automation and process improvements to optimize operations prior to further scaling. Low temperature furnace utilized for the HAMR production process We believe the global transition towards the green economy could drive significant increased demand for critical minerals and advanced metals. In particular, we believe high demand could arise for those minerals and metals needed for the drive to achieve decarbonization via electrification, especially those that enable advanced technologies including titanium and rare earth elements. We believe these raw materials have historically been produced without a focus on environmental sustainability, resource scarcity, or social equity. Through the Technologies, utilization of titanium scrap could result in the development of a closed-loop, recyclable titanium metal supply chain. In addition, IperionX’s aim for the development of the Titan Project (and any future critical mineral operations) would focus on environmental sustainability and improving the well-being of the surrounding communities, setting the standard for future development of similar critical mineral projects. IperionX Limited ANNUAL REPORT 2022 9
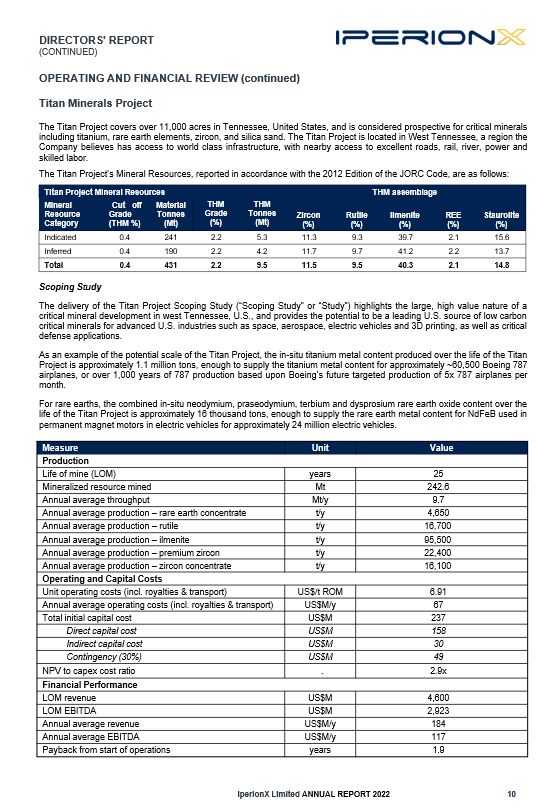
DIRECTORS' REPORT (CONTINUED) OPERATING AND FINANCIAL REVIEW (continued) Titan Minerals Project The Titan Project covers over 11,000 acres in Tennessee, United States, and is considered prospective for critical minerals including titanium, rare earth elements, zircon, and silica sand. The Titan Project is located in West Tennessee, a region the Company believes has access to world class infrastructure, with nearby access to excellent roads, rail, river, power and skilled labor. The Titan Project’s Mineral Resources, reported in accordance with the 2012 Edition of the JORC Code, are as follows: Titan Project Mineral Resources THM assemblage Mineral Resource Category Cut off Grade (THM %) Material Tonnes (Mt) THM Grade (%) THM Tonnes (Mt) Zircon (%) Rutile (%) Ilmenite (%) REE (%) Staurolite (%) Indicated 0.4 241 2.2 5.3 11.3 9.3 39.7 2.1 15.6 Inferred 0.4 190 2.2 4.2 11.7 9.7 41.2 2.2 13.7 Total 0.4 431 2.2 9.5 11.5 9.5 40.3 2.1 14.8 Scoping Study The delivery of the Titan Project Scoping Study (“Scoping Study” or “Study”) highlights the large, high value nature of a critical mineral development in west Tennessee, U.S., and provides the potential to be a leading U.S. source of low carbon critical minerals for advanced U.S. industries such as space, aerospace, electric vehicles and 3D printing, as well as critical defense applications. As an example of the potential scale of the Titan Project, the in-situ titanium metal content produced over the life of the Titan Project is approximately 1.1 million tons, enough to supply the titanium metal content for approximately ~60,500 Boeing 787 airplanes, or over 1,000 years of 787 production based upon Boeing’s future targeted production of 5x 787 airplanes per month. For rare earths, the combined in-situ neodymium, praseodymium, terbium and dysprosium rare earth oxide content over the life of the Titan Project is approximately 16 thousand tons, enough to supply the rare earth metal content for NdFeB used in permanent magnet motors in electric vehicles for approximately 24 million electric vehicles. Measure Unit Value Production Life of mine (LOM) years 25 Mineralized resource mined Mt 242.6 Annual average throughput Mt/y 9.7 Annual average production – rare earth concentrate t/y 4,650 Annual average production – rutile t/y 16,700 Annual average production – ilmenite t/y 95,500 Annual average production – premium zircon t/y 22,400 Annual average production – zircon concentrate t/y 16,100 Operating and Capital Costs Unit operating costs (incl. royalties & transport) US$/t ROM 6.91 Annual average operating costs (incl. royalties & transport) US$M/y 67 Total initial capital cost US$M 237 Direct capital cost US$M 158 Indirect capital cost US$M 30 Contingency (30%) US$M 49 NPV to capex cost ratio 2.9x Financial Performance LOM revenue US$M 4,600 LOM EBITDA US$M 2,923 Annual average revenue US$M/y 184 Annual average EBITDA US$M/y 117 Payback from start of operations years 1.9 IperionX Limited ANNUAL REPORT 2022 10
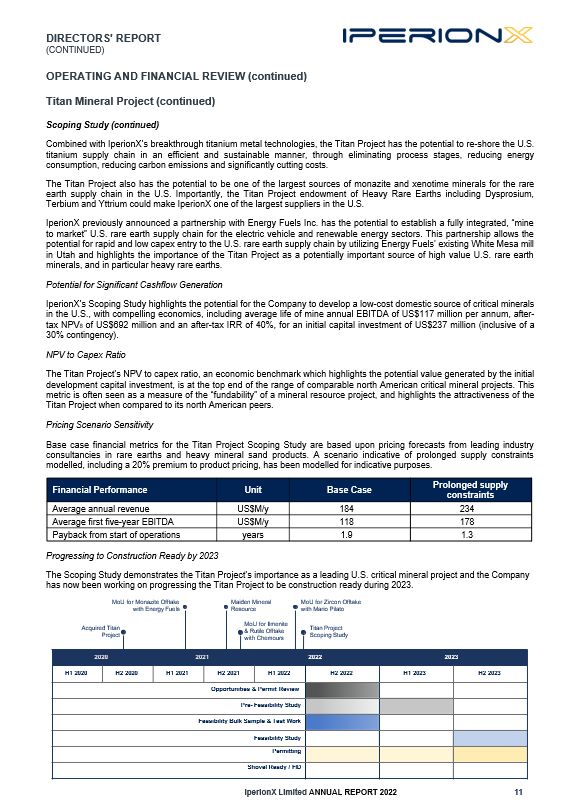
DIRECTORS' REPORT (CONTINUED) OPERATING AND FINANCIAL REVIEW (continued) Titan Mineral Project (continued) Scoping Study (continued) Combined with IperionX’s breakthrough titanium metal technologies, the Titan Project has the potential to re-shore the U.S. titanium supply chain in an efficient and sustainable manner, through eliminating process stages, reducing energy consumption, reducing carbon emissions and significantly cutting costs. The Titan Project also has the potential to be one of the largest sources of monazite and xenotime minerals for the rare earth supply chain in the U.S. Importantly, the Titan Project endowment of Heavy Rare Earths including Dysprosium, Terbium and Yttrium could make IperionX one of the largest suppliers in the U.S. IperionX previously announced a partnership with Energy Fuels Inc. has the potential to establish a fully integrated, “mine to market” U.S. rare earth supply chain for the electric vehicle and renewable energy sectors. This partnership allows the potential for rapid and low capex entry to the U.S. rare earth supply chain by utilizing Energy Fuels’ existing White Mesa mill in Utah and highlights the importance of the Titan Project as a potentially important source of high value U.S. rare earth minerals, and in particular heavy rare earths. Potential for Significant Cashflow Generation IperionX’s Scoping Study highlights the potential for the Company to develop a low-cost domestic source of critical minerals in the U.S., with compelling economics, including average life of mine annual EBITDA of US$117 million per annum, after- tax NPV8 of US$692 million and an after-tax IRR of 40%, for an initial capital investment of US$237 million (inclusive of a 30% contingency). NPV to Capex Ratio The Titan Project’s NPV to capex ratio, an economic benchmark which highlights the potential value generated by the initial development capital investment, is at the top end of the range of comparable north American critical mineral projects. This metric is often seen as a measure of the “fundability” of a mineral resource project, and highlights the attractiveness of the Titan Project when compared to its north American peers. Pricing Scenario Sensitivity Base case financial metrics for the Titan Project Scoping Study are based upon pricing forecasts from leading industry consultancies in rare earths and heavy mineral sand products. A scenario indicative of prolonged supply constraints modelled, including a 20% premium to product pricing, has been modelled for indicative purposes. Financial Performance Unit Base Case Prolonged supply constraints Average annual revenue US$M/y 184 234 Average first five-year EBITDA US$M/y 118 178 Payback from start of operations years 1.9 1.3 Progressing to Construction Ready by 2023 The Scoping Study demonstrates the Titan Project’s importance as a leading U.S. critical mineral project and the Company has now been working on progressing the Titan Project to be construction ready during 2023. MoU for Zircon Offtake with Mario Pilato Maiden Mineral Resource MoU for Monazite Offtake with Energy Fuels Titan Project Scoping Study MoU for Ilmenite & Rutile Offtake with Chemours Acquired Titan Project 2020 IperionX Limited ANNUAL REPORT 2022 11 2021 2022 2023 H1 2020 H2 2020 H1 2021 H2 2022 H1 2023 H2 2023 H2 2021 H1 2022 Opportunities & Permit Review Pre- Feasibility Study Feasibility Bulk Sample & Test Work Feasibility Study Permitting Shovel Ready / FID
DIRECTORS' REPORT (CONTINUED) OPERATING AND FINANCIAL REVIEW (continued) Environmental Regulation and Performance The Group's operations are subject to various environmental laws and regulations under the relevant government's legislation. Full compliance with these laws and regulations is regarded as a minimum standard for all operations to achieve. Instances of environmental non-compliance by an operation are identified either by external compliance audits or inspections by relevant government authorities. There have been no known breaches by the Consolidated Entity during the financial year. Corporate U.S. Listing In June 2022, IperionX commenced trading on the Nasdaq Capital Market (“Nasdaq”) in the U.S. under the ticker symbol “IPX”. Each American depositary shares (“ADS”) represents 10 ordinary shares in the Company. IperionX continues to maintain its existing listing of ordinary shares on the ASX under the same symbol “IPX”. Nasdaq is one of the world’s premier venues for growth companies, with the listing providing the potential for increased liquidity and exposure to institutional and retail investors in the United States. Capital Raising In August 2021, the Company completed a placement of 20 million shares at an issue price of A$1.20 per share to institutional, sophisticated and professional investors to raise gross proceeds of A$24.0 million (US$17.6 million) (“Placement”). The Placement was led by cornerstone investor, Fidelity Management & Research Company, LLC., an American multinational financial services corporation. Board Additions During fiscal 2022, IperionX appointed U.S. based independent Non-Executive Directors Lorraine Martin (former VP & GM, Lockheed Martin), Beverly Wyse (former VP & GM, Boeing) and Melissa Waller (former Deputy Treasurer, North Carolina Department of State Treasury). Results of Operations The Group’s net loss after tax for the financial year ended June 30, 2022 was US$21.5 million (2021:US$13.2 million). This loss is largely attributable to: exploration and evaluation expense of US$7.3 million (2021: US$2.6 million) which is attributable to the Group’s accounting policy of expensing exploration and evaluation expenditure (other than expenditures incurred in the acquisition of the rights to explore, including option payments to landowners) incurred by the Group in the period subsequent to the acquisition of the rights to explore and up to the successful completion of definitive feasibility studies for each separate area of interest; and non-cash share-based payment expense of US$8.3 million (2021: US$4.1 million) which is attributable to expensing the value of unlisted options and performance rights granted to key employees, consultants and advisors, as required under AASB 2. The value is measured at grant date and recognised over the vesting period of the incentive securities. Loss Per Share The basic and diluted loss per share for the year ended June 30, 2022 was US$0.16 per share (2021: US$0.19 per share). Dividends No dividends were paid or declared since the start of the financial year (2021: nil). No recommendation for payment of dividends has been made. Financial Position At June 30, 2022, the Group had cash reserves of US$5.7 million (2021: US$1.7 million) and net assets of US$7.4 million (2021:US$1.8 million). The ongoing operation of the Group remains dependent upon the Group raising additional funding through equity, debt or other means. The financial statements have been prepared on the going concern basis, which contemplates the continuity of normal business activity and the realization of assets and the settlement of liabilities in the normal course of business. However, there is a material uncertainty that may cast significant doubt about the Group’s ability to continue as a going concern and therefore the Group may be unable to realize its assets and discharge its liabilities in the normal course of business. Refer to Note 1(a) for further details. IperionX Limited ANNUAL REPORT 2022 12
DIRECTORS' REPORT (CONTINUED) OPERATING AND FINANCIAL REVIEW (continued) Business Strategies and Prospects for Future Financial Years The objective of the Group is to create long-term shareholder value through the discovery, development and acquisition of technically and economically viable mineral deposits. To date, the Group has not commenced production of any minerals, nor has it identified any Ore Reserves in accordance with the JORC Code. To achieve its objective, the Group currently has the following business strategies and prospects over the medium to long term: continue to research and investigate the scale-up and commercialization of the HAMR & GSD technologies to produce titanium metal powders; continue to expand the Company’s land position in Tennessee and continue to explore the Project’s properties for additional HMS mineralisation; complete a Pre-Feasibility and/or Feasibility Study on the Project to assess the economic potential of the Project and define an initial Mineral Reserve in accordance with the JORC Code; complete the required permitting and zoning applications for construction and operations at the Project in Tennessee; and continue discussions with potential customers for future sale of titanium metal products and other critical minerals, including rare earths and silica sand products. All of these activities are inherently risky and the Board is unable to provide certainty of the expected results of these activities, or that any or all of these likely developments will be achieved. The material business risks faced by the Group that could have an effect on the Group’s future prospects, and how the Group manages these risks, include: The Group’s metal technologies may never be commercialized – The commercialization of new technologies involves a high degree of risk. Our metal technologies have shown the potential to be capable of titanium production at the pilot-scale level, but we have not yet reproduced this process at commercial-scale. Failure to do so may result in material adverse impacts to, or failure to achieve, our growth projections. Further, we do not currently own the metal technologies, which we currently have access to through an exclusive licensing agreement with Blacksand. Separately, the Company and Blacksand have entered into in an option agreement whereby the Company has an exclusive option to purchase 100% of the ownership interests of Blacksand. If we fail to comply with the terms of these agreements, are unable to pay the exercise price of the Blacksand option, or otherwise decide not to exercise the option pursuant to the Blacksand option, we may lose access to the technologies, which would adversely affect our business, prospects, financial condition and operating results; The Group’s exploration properties may never be brought into production – The exploration for, and development of, mineral deposits involves a high degree of risk. Few properties which are explored are ultimately developed into producing mines. To mitigate this risk, the Company will undertake systematic and staged exploration and testing programs on its mineral properties and, subject to the results of these exploration programs, the Company will then progressively undertake a number of technical and economic studies with respect to its projects prior to making a decision to mine. However there can be no guarantee that the studies will confirm the technical and economic viability of the Company’s mineral properties or that the properties will be successfully brought into production; The Group’s activities will require further capital – The exploration of the Company’s mineral properties, operation of the Company’s pilot scale titanium facilities, and any future development of the Company’s mineral properties and/or titanium production facilities will require substantial additional financing. Failure to obtain sufficient financing may result in delaying or indefinite postponement of exploration, pilot operations, and any development of the Company’s mineral properties or titanium facilities or even a loss of property interest. There can be no assurance that additional capital or other types of financing will be available if needed or that, if available, the terms of such financing will be favourable to the Company; The Group may be adversely affected by fluctuations in commodity prices – The price of titanium metal and other critical minerals, including titanium feedstocks, rare earth elements, silica sand and zircon fluctuate widely and are affected by numerous factors beyond the control of the Group. Future production, if any, from the Group’s titanium metal facilities or mineral properties will be dependent upon commodity prices being adequate to make these facilities or properties economic. The Group currently does not engage in any hedging or derivative transactions to manage commodity price risk. As the Group’s operations change, this policy will be reviewed periodically going forward; and The Group may be adversely affected by competition – The Group competes with other domestic and international companies in the titanium technology and critical minerals industries, some of whom have larger financial and operating resources. Increased competition could lead to higher supply or lower overall pricing. There can be no assurance that the Company will not be materially impacted by increased competition. In addition, the Group is continuing to secure additional surface and mineral rights, however there can be no guarantee that the Group will secure additional surface and mineral rights, which could impact on the results of the Group’s operations. IperionX Limited ANNUAL REPORT 2022 13
DIRECTORS' REPORT (CONTINUED) SIGNIFICANT CHANGES IN THE STATE OF AFFAIRS (f) IperionX Limited ANNUAL REPORT 2022 14 (i) On June 30, 2022, the Company announced the positive results of a Scoping Study on its Titan Project located in west Tennessee, U.S. The Scoping Study results demonstrate the Project’s potential to be a sustainable, low cost and globally significant North American producer of titanium, rare earths and other critical minerals needed for a low carbon future; On June 21, 2022, the Company’s American depositary shares (“ADS”) commenced trading on the Nasdaq Capital Market (“Nasdaq”) in the U.S. under the ticker symbol “IPX”. Each ADS represents 10 ordinary shares in the Company. IperionX continues to maintain its existing listing of ordinary shares on the ASX under the same symbol “IPX”; On February 9, 2022, the Company changed its name from ‘Hyperion Metals Limited’ to ‘IperionX Limited’; On December 6, 2021, the Company announced that it had signed a memorandum of understanding with Chemours to investigate the potential supply to Chemours of up to 50,000 metric tons of ilmenite, 10,000 metric tons of rutile, and 10,000 metric tons of staurolite. Chemours operates one of the largest titanium dioxide plants at its New Johnsonville plant which is located approximately 20 miles from the Company’s Titan Project in Tennessee; On October 21, 2021, the Company announced that it had purchased an option to acquire 100% of the ownership interests of Blacksand Technology, LLC on or before December 31, 2022. Blacksand holds the exclusive commercial licensing rights for more than forty global patents through a license agreement with the University of Utah including the global patents for the patented HAMR and GSD technologies that can produce low cost and low carbon titanium metal; On September 9, 2021, the Company announced the appointments of leading U.S.-based directors, Ms. Lorraine Martin, Ms. Beverly Wyse and Ms. Melissa Waller as independent Non-Executive Directors of the Company, effective from September 13, 2021; On August 31, 2021, the Company completed a placement of 20 million shares at an issue price of A$1.20 per share to institutional, sophisticated and professional investors to raise gross proceeds of A$24.0 million (US$17.6 million) (“Placement”). The Placement was led by cornerstone investor, Fidelity Management & Research Company, an American multinational financial services corporation; On July 12, 2021, the Company announced that PricewaterhouseCoopers was appointed as auditor of the Company following the resignation of BDO Audit (WA) Pty Ltd and ASIC’s consent to the resignation in accordance with section 329(5) of the Corporations Act 2001; and The impact of the Coronavirus (COVID-19) pandemic is ongoing and while it has not significantly impacted the Company up to June 30, 2022, it is not practicable to estimate the potential impact, positive or negative, after the reporting date. The situation is rapidly developing and is dependent on measures imposed by the Australian, United States and other governments, such as maintaining social distancing requirements, quarantine, travel restrictions and any economic stimulus that may be provided. There were no significant changes in the state of affairs of the Group during the year ended June 30, 2022 not otherwise disclosed. SIGNIFICANT EVENTS AFTER THE BALANCE DATE As at the date of this report there are no matters or circumstances which have arisen since June 30, 2022 that have significantly affected or may significantly affect: the operations, in financial years subsequent to June 30, 2022, of the Group; the results of those operations, in financial years subsequent to June 30, 2022, of the Group; or the state of affairs, in financial years subsequent to June 30, 2022, of the Group. INDEMNIFICATION AND INSURANCE OF OFFICERS AND AUDITORS The Constitution of the Company requires the Company, to the extent permitted by law, to indemnify any person who is or has been a director or officer of the Company or Group for any liability caused by such a director or officer and any legal costs incurred by a director or officer in defending an action for any liability caused by such a director or officer. During or since the end of the financial year, no amounts have been paid by the Company or Group in relation to the above indemnities. During the financial year, an insurance premium of US$63,435 was paid by the Group to insure against a liability incurred by a person who is or has been a director or officer of the Company or Group. The Company has agreed to indemnify their auditors, PricewaterhouseCoopers, to the extent permitted by law, against any claim by a third party arising from the Company’s breach of their agreement. The indemnity stipulates that the Company will meet the full amount of any such liabilities including a reasonable amount of legal costs.
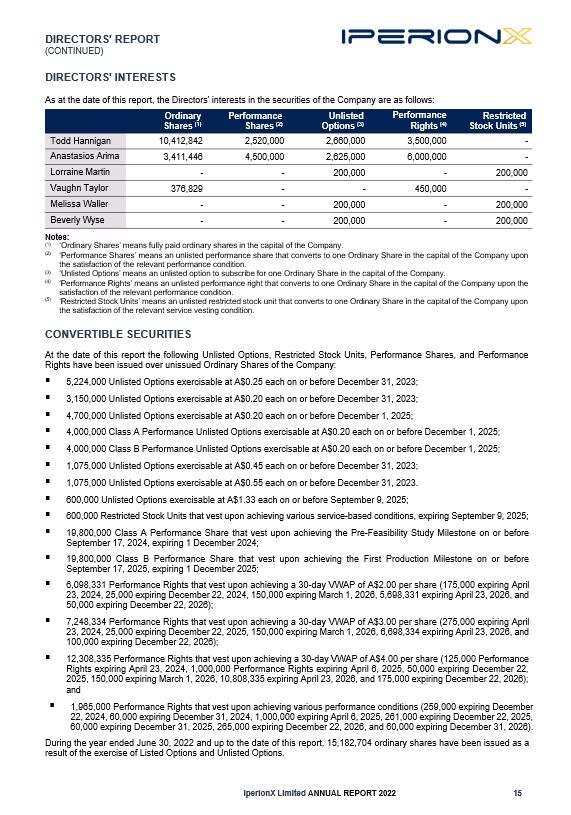
DIRECTORS' REPORT (CONTINUED) DIRECTORS' INTERESTS As at the date of this report, the Directors' interests in the securities of the Company are as follows: IperionX Limited ANNUAL REPORT 2022 15 Ordinary Shares (1) Performance Shares (2) Unlisted Options (3) Performance Rights (4) Restricted Stock Units (5) Todd Hannigan 10,412,842 2,520,000 2,660,000 3,500,000 - Anastasios Arima 3,411,446 4,500,000 2,625,000 6,000,000 - Lorraine Martin - - 200,000 - 200,000 Vaughn Taylor 376,829 - - 450,000 - Melissa Waller - - 200,000 - 200,000 Beverly Wyse - - 200,000 - 200,000 Notes: (1) (2) ‘Ordinary Shares’ means fully paid ordinary shares in the capital of the Company. ‘Performance Shares’ means an unlisted performance share that converts to one Ordinary Share in the capital of the Company upon the satisfaction of the relevant performance condition. ‘Unlisted Options’ means an unlisted option to subscribe for one Ordinary Share in the capital of the Company. ‘Performance Rights’ means an unlisted performance right that converts to one Ordinary Share in the capital of the Company upon the satisfaction of the relevant performance condition. ‘Restricted Stock Units’ means an unlisted restricted stock unit that converts to one Ordinary Share in the capital of the Company upon the satisfaction of the relevant service vesting condition. (3) (4) (5) CONVERTIBLE SECURITIES At the date of this report the following Unlisted Options, Restricted Stock Units, Performance Shares, and Performance Rights have been issued over unissued Ordinary Shares of the Company: 5,224,000 Unlisted Options exercisable at A$0.25 each on or before December 31, 2023; 3,150,000 Unlisted Options exercisable at A$0.20 each on or before December 31, 2023; 4,700,000 Unlisted Options exercisable at A$0.20 each on or before December 1, 2025; 4,000,000 Class A Performance Unlisted Options exercisable at A$0.20 each on or before December 1, 2025; 4,000,000 Class B Performance Unlisted Options exercisable at A$0.20 each on or before December 1, 2025; 1,075,000 Unlisted Options exercisable at A$0.45 each on or before December 31, 2023; 1,075,000 Unlisted Options exercisable at A$0.55 each on or before December 31, 2023. 600,000 Unlisted Options exercisable at A$1.33 each on or before September 9, 2025; 600,000 Restricted Stock Units that vest upon achieving various service-based conditions, expiring September 9, 2025; 19,800,000 Class A Performance Share that vest upon achieving the Pre-Feasibility Study Milestone on or before September 17, 2024, expiring 1 December 2024; 19,800,000 Class B Performance Share that vest upon achieving the First Production Milestone on or before September 17, 2025, expiring 1 December 2025; 6,098,331 Performance Rights that vest upon achieving a 30-day VWAP of A$2.00 per share (175,000 expiring April 23, 2024, 25,000 expiring December 22, 2024, 150,000 expiring March 1, 2026, 5,698,331 expiring April 23, 2026, and 50,000 expiring December 22, 2026); 7,248,334 Performance Rights that vest upon achieving a 30-day VWAP of A$3.00 per share (275,000 expiring April 23, 2024, 25,000 expiring December 22, 2025, 150,000 expiring March 1, 2026, 6,698,334 expiring April 23, 2026, and 100,000 expiring December 22, 2026); 12,308,335 Performance Rights that vest upon achieving a 30-day VWAP of A$4.00 per share (125,000 Performance Rights expiring April 23, 2024, 1,000,000 Performance Rights expiring April 6, 2025, 50,000 expiring December 22, 2025, 150,000 expiring March 1, 2026, 10,808,335 expiring April 23, 2026, and 175,000 expiring December 22, 2026); and 1,965,000 Performance Rights that vest upon achieving various performance conditions (259,000 expiring December 22, 2024, 60,000 expiring December 31, 2024, 1,000,000 expiring April 6, 2025, 261,000 expiring December 22, 2025, 60,000 expiring December 31, 2025, 265,000 expiring December 22, 2026, and 60,000 expiring December 31, 2026). During the year ended June 30, 2022 and up to the date of this report, 15,182,704 ordinary shares have been issued as a result of the exercise of Listed Options and Unlisted Options.

DIRECTORS' REPORT (CONTINUED) REMUNERATION REPORT This Remuneration Report, which forms part of the Directors’ Report, sets out information about the remuneration of Key Management Personnel (“KMP”) of the Group. The Remuneration Report has been audited as required by section 308 (3C) of the Corporations Act 2001. Details of Key Management Personnel The KMP of the Group during or since the end of the financial year were as follows: IperionX Limited ANNUAL REPORT 2022 16 Directors Mr. Todd Hannigan Mr. Anastasios Arima Ms. Lorraine M. Martin Mr. Vaughn Taylor Ms. Melissa G. Waller Ms. Beverly M. Wyse Executive Chairman Chief Executive Officer and Managing Director Independent Non-Executive Director (appointed effective September 13, 2021) Independent Non-Executive Director Independent Non-Executive Director (appointed effective September 13, 2021) Independent Non-Executive Director (appointed effective September 13, 2021) Other KMP Mr. Toby Symonds Mr. Dominic Allen Mr. Lamont Leatherman Ms. Jeanne McMullin Mr. Gregory Swan Chief Strategy Officer (appointed effective September 1, 2021) Chief Commercial Officer Chief Geologist Chief Legal Officer (appointed effective December 6, 2021) Chief Financial Officer and Company Secretary Unless otherwise disclosed, the KMP held their position from July 1, 2021 until the date of this report. Remuneration Policy The Group’s remuneration policy for its KMP has been developed by the Board taking into account the size of the Group, the size of the management team for the Group, the nature and stage of development of the Group’s current operations, and market conditions and comparable salary levels for companies of a similar size and operating in similar sectors. In addition to considering the above general factors, the Board has also placed emphasis on the following specific issues in determining the remuneration policy for KMP: (a) the Group is currently focused on undertaking exploration, appraisal and development activities at the Titan Project; (b) risks associated with small cap resource companies whilst exploring and developing projects; and (c) other than profit which may be generated from asset sales, the Group does not expect to be undertaking profitable operations until sometime after the commencement of commercial production on any of its projects. The objective of the Group’s remuneration structure reward framework is to ensure that reward for performance is competitive and appropriate for the results delivered. The remuneration framework provides a mix of fixed and variable remuneration, which incorporates a blend of short and long-term incentives. There is a deliberate emphasis on lower fixed base and higher variable results-based remuneration to ensure that management focus is aligned with that of shareholders. This has been achieved by ensuring that a significant proportion of executive’s remuneration is ‘at risk’. Long-term incentives are based on Company milestones linked to value drivers of the Titan Project. Executive Remuneration The Group’s remuneration policy is to provide a fixed remuneration component and a performance-based component (short term incentive and long-term incentive). The Board believes that this remuneration policy is appropriate given the considerations discussed in the section above and is appropriate in aligning executives’ objectives with shareholder and business objectives. Fixed Remuneration Fixed remuneration consists of base salaries, as well as employer 401(k) contributions or contributions to superannuation funds and other non-cash benefits. Non-cash benefits may include provision of motor vehicles, rental allowance, health care benefits, health insurance, and life insurance. Fixed remuneration is reviewed annually by the Board. The process consists of a review of company and individual performance, relevant comparative remuneration externally and internally and, where appropriate, external advice on policies and practices.
DIRECTORS' REPORT (CONTINUED) REMUNERATION REPORT (continued) Executive Remuneration (continued) Performance Based Remuneration – Short Term Incentive Some executive KMP are entitled to an annual cash bonus upon achieving various key performance indicators (“KPI’s”), as set by the Board. Having regard to the current size, nature and opportunities of the Group, the Board has determined that these KPI’s will include measures such as successful completion of the acquisition of new projects, exploration activities (e.g. completion of exploration programs within budgeted timeframes and costs), development activities (e.g. completion of scoping and/or feasibility studies), corporate activities (e.g. recruitment of key personnel) and business development activities (e.g. project acquisitions and capital raisings). Prior to the end of each financial year, the Board assesses performance against these criteria. During the 2022 financial year, bonuses of US$492,580 (2021: nil) were paid to executive KMP. Performance Based Remuneration – Long Term Incentive The Group has a long-term incentive plan (“LTIP”) comprising the “IperionX Limited Employee Equity Incentive Plan” (the “Plan”) to reward executive KMP and other key employees and contractors for long-term performance. The Plan provides for the issuance of unlisted options (“Unlisted Options”) and unlisted performance rights (“Performance Rights”) to eligible employees and contractors as part of their remuneration and incentive arrangements in order to attract and retain their services and to provide an incentive linked to the performance of the Group. To achieve its corporate objectives, the Group needs to attract, incentivise, and retain its executive KMP and other key employees and contractors. The Board believes that grants made to eligible participants under the Plan will provide a useful tool to underpin the Group's employment and engagement strategy, and enables the Group to: IperionX Limited ANNUAL REPORT 2022 17 (i) recruit, incentivise and retain KMP and other key employees and contractors needed to achieve the Group's business objectives; link the reward of key staff with the achievement of strategic goals and the long-term performance of the Group; align the financial interest of participants of the Plan with those of Shareholders; and provide incentives to participants of the Plan to focus on superior performance that creates Shareholder value. Performance Rights The Plan provides for the issuance of Performance Rights to eligible participants which, upon satisfaction of the relevant performance conditions attached to the Performance Rights, will result in the issue of an Ordinary Share for each Performance Right. Performance Rights are issued for no consideration and no amount is payable upon conversion thereof. Performance Rights granted under the Plan to eligible participants will be linked to the achievement by the Group of certain performance conditions as determined by the Board from time to time. These performance conditions must be satisfied in order for the Performance Rights to vest. Upon Performance Rights vesting, Ordinary Shares are automatically issued for no consideration. If a performance condition of a Performance Right is not achieved by the expiry date then the Performance Right will lapse. During the financial year, 8,500,000 Performance Rights were granted to executive KMP. No Performance Rights held by executive KMP vested and converted into ordinary shares during the financial year. No Performance Rights held by executive KMP lapsed during the financial year. (ii) Unlisted Options The Plan provides for the issuance of Unlisted Options to eligible participants. The Board’s policy is to grant Unlisted Options to KMP with exercise prices at or above market share price (at the time of agreement). As such, the Unlisted Options granted to KMP are generally only of benefit if the KMP performs to the level whereby the value of the Group increases sufficiently to warrant exercising the Unlisted Options granted. Other than service-based vesting conditions (if any) and the exercise price required to exercise the Unlisted Options, there are no additional performance criteria on the Unlisted Options granted to KMP, as given the speculative nature of the Group’s activities and the small management team responsible for its running, it is considered that the performance of the KMP and the performance and value of the Group are closely related. The Group prohibits executive KMP from entering into arrangements to limit their exposure to Unlisted Options granted as part of their remuneration package. During the financial year, no Unlisted Options were granted to executive KMP. No Unlisted Options were exercised by executive KMP during the financial year. No Unlisted Options held by executive KMP lapsed during the financial year.

DIRECTORS' REPORT (CONTINUED) REMUNERATION REPORT (continued) Non-Executive Director Remuneration The Board’s policy is to remunerate Non-Executive Directors at market rates for comparable companies for time, commitment and responsibilities. Given the current size, nature and risks of the Group, Unlisted Options, Restricted Stock Units (“RSUs”), and Performance Rights have been used to attract and retain Non-Executive Directors, where deemed appropriate. The Board determines payments to the Non-Executive Directors and reviews their remuneration annually, based on market practice, duties and accountability. Independent external advice is sought when required. The maximum aggregate amount of fees that can be paid to Non-Executive Directors is subject to approval by shareholders at a General Meeting. Director’s fees paid to Non-Executive Directors accrue on a daily basis. Fees for Non-Executive Directors are not linked to the performance of the economic entity. However, to align Directors’ interests with shareholder interests, the Directors are encouraged to hold shares in the Company and Non-Executive Directors may in limited circumstances receive grants of restricted stock options, unlisted options or performance rights in order to secure their services. The Company prohibits Non-Executive Directors from entering into arrangements to limit their exposure to options granted as part of their remuneration package. Fees for the Executive Chairman are presently US$170,000 per annum (2021: US$44,808). Fees for Non-Executive Directors are presently US$30,000 per annum (2021: US$22,404 to US$37,340). These fees cover main board activities only. Non-Executive Directors may receive additional remuneration for other services provided to the Company, including but not limited to, membership of committees. Subject to shareholder approval, on an annual basis commencing from the Company’s 2022 annual general meeting of shareholders, the Company will grant each Non-Executive Director: (a) such number of Unlisted Options calculated by dividing US$60,000 by the VWAP of a share on ASX over the 5 trading days immediately prior to the date of the notice of AGM, each exercisable at an exercise price equal to the VWAP of a share on ASX over the 5 trading days immediately prior to the date of the notice of AGM; and (b) such number of RSUs calculated by dividing US$60,000 by the VWAP of a share on ASX over the 5 trading days immediately prior to the date of the notice of AGM. During fiscal 2022, 600,000 Unlisted Options and 600,000 RSUs were granted to Non-Executive Directors. No Unlisted Options or RSUs were exercised by Non-Executive Directors during fiscal 2022. No Unlisted Options or RSUs held by Non- Executive Directors lapsed during fiscal 2022. Relationship between Remuneration of KMP and Shareholder Wealth During the Group’s exploration and development phases of its business, the Board anticipates that the Group will retain earnings (if any) and other cash resources for the exploration and development of its resource projects. Accordingly, the Group does not currently have a policy with respect to the payment of dividends and returns of capital. Therefore, there was no relationship between the Board’s policy for determining, or in relation to, the nature and amount of remuneration of KMP and dividends paid and returns of capital by the Group during the current and previous four financial years. The Board did not determine, and in relation to, the nature and amount of remuneration of the KMP by reference to changes in the price at which shares in the Group traded between the beginning and end of the current and the previous four financial years. Discretionary annual cash bonuses are based upon achieving various non-financial KPI’s that are not based on share price or earnings, such as the successful acquisition of new projects, exploration activities (e.g. completion of exploration programs within budgeted timeframes and costs), development activities (e.g. completion of scoping and/or feasibility studies), corporate activities (e.g. recruitment of key personnel) and business development activities (e.g. project acquisitions and capital raisings). However, as noted above, certain KMP are granted Performance Rights and/or Unlisted Options which generally will be of greater value to KMP if the value of the Group’s shares increases (subject to vesting conditions being met). Relationship between Remuneration of KMP and Earnings As discussed above, the Group is currently undertaking exploration and development activities, and does not expect to be undertaking profitable operations (other than by way of material asset sales, none of which is currently planned) until sometime after the successful commercialisation, production and sales of commodities from one or more of its projects. Accordingly, the Board does not consider earnings during the current and previous four financial years when determining, and in relation to, the nature and amount of remuneration of KMP. IperionX Limited ANNUAL REPORT 2022 18
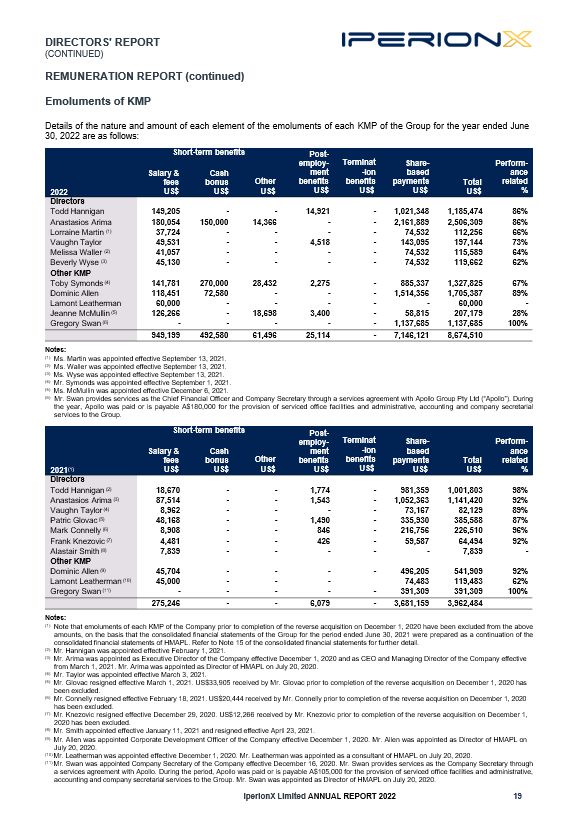
DIRECTORS' REPORT (CONTINUED) REMUNERATION REPORT (continued) Emoluments of KMP Details of the nature and amount of each element of the emoluments of each KMP of the Group for the year ended June 30, 2022 are as follows: IperionX Limited ANNUAL REPORT 2022 19 Short-term benefits Post- employ- ment benefits US$ 2022 Salary & fees US$ Cash bonus US$ Other US$ Terminat -ion benefits US$ Share- based payments US$ Total US$ Perform- ance related % Directors Todd Hannigan 149,205 - - 14,921 - 1,021,348 1,185,474 86% Anastasios Arima 180,054 150,000 14,366 - - 2,161,889 2,506,309 86% Lorraine Martin (1) 37,724 - - - - 74,532 112,256 66% Vaughn Taylor 49,531 - - 4,518 - 143,095 197,144 73% Melissa Waller (2) 41,057 - - - - 74,532 115,589 64% Beverly Wyse (3) 45,130 - - - - 74,532 119,662 62% Other KMP Toby Symonds (4) 141,781 270,000 28,432 2,275 - 885,337 1,327,825 67% Dominic Allen 118,451 72,580 - - - 1,514,356 1,705,387 89% Lamont Leatherman 60,000 - - - - - 60,000 - Jeanne McMullin (5) 126,266 - 18,698 3,400 - 58,815 207,179 28% Gregory Swan (6) - - - - - 1,137,685 1,137,685 100% 949,199 492,580 61,496 25,114 - 7,146,121 8,674,510 Notes: (1) Ms. Martin was appointed effective September 13, 2021. (2) Ms. Waller was appointed effective September 13, 2021. (3) Ms. Wyse was appointed effective September 13, 2021. (4) Mr. Symonds was appointed effective September 1, 2021. (5) Ms. McMullin was appointed effective December 6, 2021. (6) Mr. Swan provides services as the Chief Financial Officer and Company Secretary through a services agreement with Apollo Group Pty Ltd (“Apollo”). During the year, Apollo was paid or is payable A$180,000 for the provision of serviced office facilities and administrative, accounting and company secretarial services to the Group. Short-term benefits Post- employ- ment benefits US$ 2021(1) Salary & fees US$ Cash bonus US$ Other US$ Terminat -ion benefits US$ Share- based payments US$ Total US$ Perform- ance related % Directors Todd Hannigan (2) 18,670 - - 1,774 - 981,359 1,001,803 98% Anastasios Arima (3) 87,514 - - 1,543 - 1,052,363 1,141,420 92% Vaughn Taylor (4) 8,962 - - - - 73,167 82,129 89% Patric Glovac (5) 48,168 - - 1,490 - 335,930 385,588 87% Mark Connelly (6) 8,908 - - 846 - 216,756 226,510 96% Frank Knezovic (7) 4,481 - - 426 - 59,587 64,494 92% Alastair Smith (8) 7,839 - - - - - 7,839 - Other KMP Dominic Allen (9) 45,704 - - - - 496,205 541,909 92% Lamont Leatherman (10) 45,000 - - - 74,483 119,483 62% Gregory Swan (11) - - - - - 391,309 391,309 100% 275,246 - - 6,079 - 3,681,159 3,962,484 Notes: (1) Note that emoluments of each KMP of the Company prior to completion of the reverse acquisition on December 1, 2020 have been excluded from the above amounts, on the basis that the consolidated financial statements of the Group for the period ended June 30, 2021 were prepared as a continuation of the consolidated financial statements of HMAPL. Refer to Note 15 of the consolidated financial statements for further detail. (2) Mr. Hannigan was appointed effective February 1, 2021. (3) Mr. Arima was appointed as Executive Director of the Company effective December 1, 2020 and as CEO and Managing Director of the Company effective from March 1, 2021. Mr. Arima was appointed as Director of HMAPL on July 20, 2020. (4) Mr. Taylor was appointed effective March 3, 2021. (5) Mr. Glovac resigned effective March 1, 2021. US$33,905 received by Mr. Glovac prior to completion of the reverse acquisition on December 1, 2020 has been excluded. (6) Mr. Connelly resigned effective February 18, 2021. US$20,444 received by Mr. Connelly prior to completion of the reverse acquisition on December 1, 2020 has been excluded. (7) Mr. Knezovic resigned effective December 29, 2020. US$12,266 received by Mr. Knezovic prior to completion of the reverse acquisition on December 1, 2020 has been excluded. (8) Mr. Smith appointed effective January 11, 2021 and resigned effective April 23, 2021. (9) Mr. Allen was appointed Corporate Development Officer of the Company effective December 1, 2020. Mr. Allen was appointed as Director of HMAPL on July 20, 2020. (10) Mr. Leatherman was appointed effective December 1, 2020. Mr. Leatherman was appointed as a consultant of HMAPL on July 20, 2020. (11) Mr. Swan was appointed Company Secretary of the Company effective December 16, 2020. Mr. Swan provides services as the Company Secretary through a services agreement with Apollo. During the period, Apollo was paid or is payable A$105,000 for the provision of serviced office facilities and administrative, accounting and company secretarial services to the Group. Mr. Swan was appointed as Director of HMAPL on July 20, 2020.

DIRECTORS' REPORT (CONTINUED) REMUNERATION REPORT (continued) Loans with Key Management Personnel No loans were provided to or received from KMP during the year ended June 30, 2022 (2021: Nil). Options, Rights and RSU’s Granted to Key Management Personnel Details of Unlisted Options, Performance Rights and Restricted Stock Units granted, exercised or lapsed for each KMP of the Group during the 2022 financial year are as follows: IperionX Limited ANNUAL REPORT 2022 20 2022 No. of options, rights and RSU’s granted during year # No. of options, rights and RSU’s vested during year # No. of options, rights and RSU’slapsed during year # Value of options, rightsand RSU’s granted during year (1) US$ Value of options, rightsand RSU’s exercised during year (2) US$ Value of options, rights and RSU’s included in remuneration for year US$ Directors Todd Hannigan 3,500,000 - - 2,254,000 - 1,021,348 Anastasios Arima - - - - - 2,161,889 Lorraine Martin 400,000 - - 282,336 - 74,532 Vaughn Taylor - - - - - 143,095 Melissa Waller 400,000 - - 282,336 - 74,532 Beverly Wyse 400,000 - - 282,336 - 74,532 Other KMP - - Toby Symonds 4,000,000 - - 4,401,000 - 885,337 Dominic Allen - - - - - 1,514,356 Lamont Leatherman - - - - - - Jeanne McMullin 1,000,000 - - 633,250 - 58,815 Gregory Swan - - - - - 1,137,685 9,700,000 - - 8,135,258 - 7,146,121 Notes: (1) Determined at the time of grant per AASB 2, using an exchange rate of US$0.7258=A$1, being the average exchange rate for 2022. (2) Determined at the time of exercise or conversion at the intrinsic value, using an exchange rate of US$0.7258=A$1, being the average exchange rate for 2022. Details of Unlisted Options, Performance Rights and Restricted Stock Units granted by the Company to each KMP of the Group during the financial year are as follows: 2022 Security class Grant date Expiry date Service vesting date Exercise price A$ Vesting hurdle (30- day VWAP) Grant date fair value(1) A$ Number granted Todd Hannigan Rights 25-Nov-21 23-Apr-26 25-Nov-22 - A$4.00 $0.644 3,500,000 Lorraine Martin Options 13-Sep-21 9-Sep-25 13-Sep-22 A$1.33 - $0.775 66,667 Options 13-Sep-21 9-Sep-25 13-Sep-23 A$1.33 - $0.775 66,667 Options 13-Sep-21 9-Sep-25 13-Sep-24 A$1.33 - $0.775 66,666 RSUs 13-Sep-21 9-Sep-25 13-Sep-22 - - $1.170 66,667 RSUs 13-Sep-21 9-Sep-25 13-Sep-23 - - $1.170 66,667 RSUs 13-Sep-21 9-Sep-25 13-Sep-24 - - $1.170 66,666 Melissa Waller Options 13-Sep-21 9-Sep-25 13-Sep-22 A$1.33 - $0.775 66,667 Options 13-Sep-21 9-Sep-25 13-Sep-23 A$1.33 - $0.775 66,667 Options 13-Sep-21 9-Sep-25 13-Sep-24 A$1.33 - $0.775 66,666 RSUs 13-Sep-21 9-Sep-25 13-Sep-22 - - $1.170 66,667 RSUs 13-Sep-21 9-Sep-25 13-Sep-23 - - $1.170 66,667 RSUs 13-Sep-21 9-Sep-25 13-Sep-24 - - $1.170 66,666 Beverly Wyse Options 13-Sep-21 9-Sep-25 13-Sep-22 A$1.33 - $0.775 66,667 Options 13-Sep-21 9-Sep-25 13-Sep-23 A$1.33 - $0.775 66,667 Options 13-Sep-21 9-Sep-25 13-Sep-24 A$1.33 - $0.775 66,666 RSUs 13-Sep-21 9-Sep-25 13-Sep-22 - - $1.170 66,667 RSUs 13-Sep-21 9-Sep-25 13-Sep-23 - - $1.170 66,667 RSUs 13-Sep-21 9-Sep-25 13-Sep-24 - - $1.170 66,666 Toby Symonds Rights 1-Sept-21 6-Apr-25 1-Sept-22 - A$3.00 $1.195 1,000,000 Rights 1-Sept-21 6-Apr-25 1-Sept-22 - A$4.00 $1.131 1,000,000 Rights 29-Mar-22 6-Apr-25 29-Mar-23 - A$4.00 $0.840 1,000,000 Rights 29-Mar-22 6-Apr-25 29-Mar-23 - - $1.235 1,000,000 Jeanne McMullin Rights 6-Dec-21 23-Apr-26 6-Dec-22 - A$2.00 $0.703 250,000 Rights 6-Dec-21 23-Apr-26 6-Dec-22 - A$3.00 $0.642 250,000 Rights 6-Dec-21 23-Apr-26 6-Dec-22 - A$4.00 $0.594 500,000 Notes: (1) For details on the valuation of Unlisted Options and Performance Rights, including models and assumptions used, please refer to Note 18 of the financial statements.
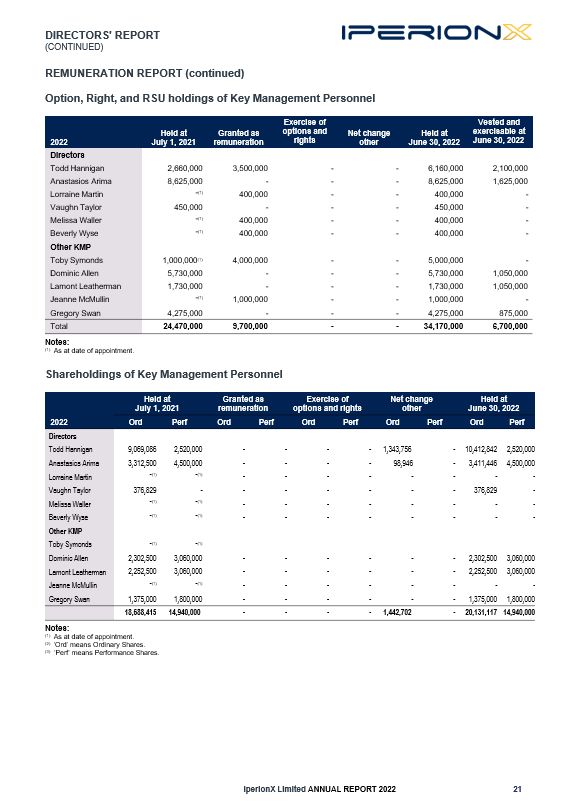
DIRECTORS' REPORT (CONTINUED) REMUNERATION REPORT (continued) Option, Right, and RSU holdings of Key Management Personnel IperionX Limited ANNUAL REPORT 2022 21 2022 Held at July 1, 2021 Granted as remuneration Exercise of options and rights Net change other Held at June 30, 2022 Vested and exercisable at June 30, 2022 Directors Todd Hannigan 2,660,000 3,500,000 - - 6,160,000 2,100,000 Anastasios Arima 8,625,000 - - - 8,625,000 1,625,000 Lorraine Martin -(1) 400,000 - - 400,000 - Vaughn Taylor 450,000 - - - 450,000 - Melissa Waller -(1) 400,000 - - 400,000 - Beverly Wyse -(1) 400,000 - - 400,000 - Other KMP Toby Symonds 1,000,000(1) 4,000,000 - - 5,000,000 - Dominic Allen 5,730,000 - - - 5,730,000 1,050,000 Lamont Leatherman 1,730,000 - - - 1,730,000 1,050,000 Jeanne McMullin -(1) 1,000,000 - - 1,000,000 - Gregory Swan 4,275,000 - - - 4,275,000 875,000 Total 24,470,000 9,700,000 - - 34,170,000 6,700,000 Notes: (1) As at date of appointment. Shareholdings of Key Management Personnel 2022 Held at Granted as Exercise of Net change Held at July 1, 2021 remuneration options and rights other June 30, 2022 Ord Perf Ord Perf Ord Perf Ord Perf Ord Perf Directors Todd Hannigan 9,069,086 2,520,000 - - - - 1,343,756 - 10,412,842 2,520,000 Anastasios Arima 3,312,500 4,500,000 - - - - 98,946 - 3,411,446 4,500,000 Lorraine Martin -(1) -(1) - - - - - - - - Vaughn Taylor 376,829 - - - - - - - 376,829 - Melissa Waller -(1) -(1) - - - - - - - - Beverly Wyse -(1) -(1) - - - - - - - - Other KMP Toby Symonds -(1) -(1) Dominic Allen 2,302,500 3,060,000 - - - - - - 2,302,500 3,060,000 Lamont Leatherman 2,252,500 3,060,000 - - - - - - 2,252,500 3,060,000 Jeanne McMullin -(1) -(1) - - - - - - - - Gregory Swan 1,375,000 1,800,000 - - - - - - 1,375,000 1,800,000 18,688,415 14,940,000 - - - - 1,442,702 - 20,131,117 14,940,000 Notes: (1) As at date of appointment. (2) ‘Ord’ means Ordinary Shares. (3) ‘Perf’ means Performance Shares.
DIRECTORS' REPORT (CONTINUED) REMUNERATION REPORT (continued) Remuneration Advisors The Remuneration and Nomination Committee approved the engagement of Compensation Advisory Partners LLC (“CAP”) during the year to provide remuneration recommendations regarding the remuneration mix and quantum for KMP following the Company’s listing on Nasdaq. CAP provided some remuneration recommendations to the Remuneration and Nomination Committee during the year as an input into decision making only. The Remuneration and Nomination Committee considered the recommendations, along with other factors, in making its remuneration decisions. The fees paid or payable to CAP during the year were US$60,472. Both the Remuneration and Nomination Committee and CAP are satisfied the advice received from CAP is free from undue influence from the KMP to whom the remuneration recommendations apply. Voting on Remuneration Report at last Annual General Meeting At the Company’s 2021 annual general meeting (“AGM”), 46% of the votes cast at that meeting were against the adoption of the remuneration report. Some shareholders expressed the view that incentive options granted to KMP should have exercise prices at or above market share price on the date they are granted. All incentive options granted to KMP had exercise prices at or above market share price at the time of agreement – but in some limited circumstances where prior shareholder approval was required for the option grant the delay between date of agreement and date of shareholder approval meant that some options were granted with exercise prices below market share price at the date of shareholder approval. Following the 2021 AGM, the Company engaged the services of a remuneration consultant (see above) to provide remuneration recommendations regarding the remuneration mix and quantum for KMP following the Company’s listing on Nasdaq. The Company will continue to review its remuneration practices in line with market practices and benchmarks. Employment Contracts with Key Management Personnel Mr. Hannigan, Executive Chairman, has a director appointment letter with the Group. Mr. Hannigan receives a fixed remuneration component of US$170,000 per annum and a discretionary annual bonus of up to US$100,000 to be paid upon the successful completion of KPIs as determined by the Board. Mr. Arima, Chief Executive Officer and Managing Director, has an employment agreement with the Group which may be terminated upon six months’ advance written notice, unless mutually agreed upon with the Company. Mr. Arima receives a fixed remuneration component of US$180,000 per annum and a discretionary annual bonus of up to US$100,000 to be paid upon the successful completion of KPIs as determined by the Board. Mr. Symonds, Chief Strategy Officer, has an employment agreement with the Group which may be terminated upon six months’ advance written notice, unless mutually agreed upon with the Company. Mr. Symonds receives a fixed remuneration component of US$170,000 per annum and a discretionary annual bonus of up to US$100,000 to be paid upon the successful completion of KPIs as determined by the Board. Mr. Allen, Chief Commercial Officer, has a consulting agreement with the Group which may be terminated by either party at any time for any or no reason upon at least 30 days’ prior written notice of termination to the other. Mr. Allen receives a fixed remuneration component of A$163,200 (US$118,451) per annum and a discretionary annual bonus of up to US$100,000 to be paid upon the successful completion of KPIs as determined by the Board. Mr. Leatherman, Chief Geologist, has a consulting agreement with the Group which may be terminated by either party at any time for any or no reason upon at least 30 days’ prior written notice of termination to the other. Mr. Leatherman receives a fixed remuneration component of US$60,000 per annum. Ms. McMullin, Chief Legal Officer, has an employment agreement with the Group which may be terminated upon six months’ advance written notice, unless mutually agreed upon with the Company. Ms. McMullin receives a fixed remuneration component of US$170,000 per annum and a discretionary annual bonus of up to US$100,000 to be paid upon the successful completion of KPIs as determined by the Board. All Non-Executive Directors have a letter of appointment confirming the terms and conditions of their appointment as Director of the Company. End of Remuneration Report. IperionX Limited ANNUAL REPORT 2022 22

DIRECTORS' REPORT (CONTINUED) DIRECTORS' MEETINGS The number of meetings of directors held during the year and the number of meetings attended by each director were as follows: Board Meetings Audit Committee Meetings Remuneration and Nomination Committee Meetings ESG Committee Meetings Number eligible to attend Number attended Number eligible to attend Number attended Number eligible to attend Number attended Number eligible to attend Number attended Anastasios Arima 5 5 - - - - 4 4 Todd Hannigan 5 5 - - - - - - Lorraine Martin 5 5 2 2 - - 4 4 Vaughn Taylor 5 5 2 2 3 3 - - Melissa Waller 5 5 - - 3 3 4 4 Beverly Wyse 5 5 2 2 3 3 4 4 During the year, the Company established an Audit Committee, Remuneration and Nomination Committee, and an Environmental, Social and Governance (“ESG”) Committee of the board of Directors. NON-AUDIT SERVICES There were no non-audit services provided by the Company’s auditor, PricewaterhouseCoopers (“PwC”), or by another person or firm on the auditor's behalf, during the financial year. AUDITOR'S INDEPENDENCE DECLARATION The lead auditor's independence declaration for the year ended June 30, 2022 has been received and can be found on page 24 of the Annual Report. Signed in accordance with a resolution of the directors. ANASTASIOS ARIMA CEO and Managing Director August 26, 2022 IperionX Limited ANNUAL REPORT 2022 23
AUDITOR'S INDEPENDENCE DECLARATION IperionX Limited ANNUAL REPORT 2022 24
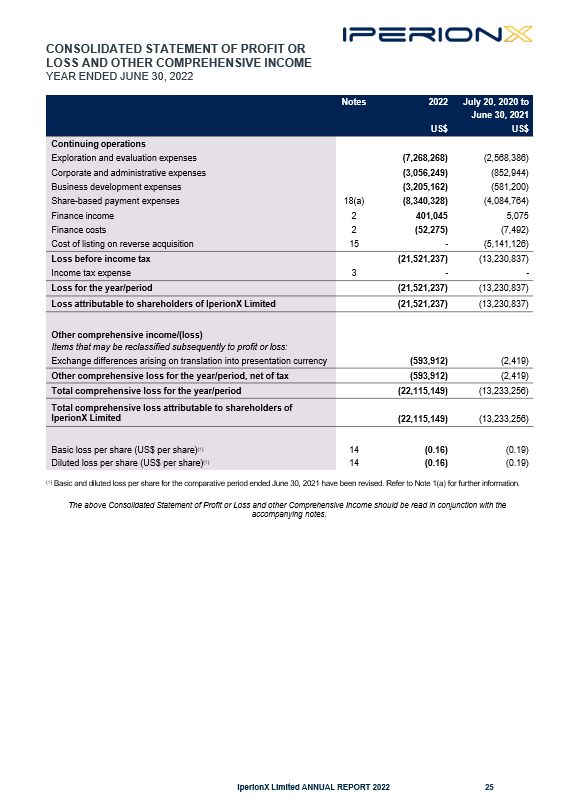
CONSOLIDATED STATEMENT OF PROFIT OR LOSS AND OTHER COMPREHENSIVE INCOME YEAR ENDED JUNE 30, 2022 Notes 2022 July 20, 2020 to June 30, 2021 US$ US$ Continuing operations Exploration and evaluation expenses (7,268,268) (2,568,386) Corporate and administrative expenses (3,056,249) (852,944) Business development expenses (3,205,162) (581,200) Share-based payment expenses 18(a) (8,340,328) (4,084,764) Finance income 2 401,045 5,075 Finance costs 2 (52,275) (7,492) Cost of listing on reverse acquisition 15 - (5,141,126) Loss before income tax (21,521,237) (13,230,837) Income tax expense 3 - - Loss for the year/period (21,521,237) (13,230,837) Loss attributable to shareholders of IperionX Limited (21,521,237) (13,230,837) Other comprehensive income/(loss) Items that may be reclassified subsequently to profit or loss: Exchange differences arising on translation into presentation currency (593,912) (2,419) Other comprehensive loss for the year/period, net of tax (593,912) (2,419) Total comprehensive loss for the year/period (22,115,149) (13,233,256) Total comprehensive loss attributable to shareholders of IperionX Limited (22,115,149) (13,233,256) Basic loss per share (US$ per share)(1) 14 (0.16) (0.19) Diluted loss per share (US$ per share)(1) 14 (0.16) (0.19) IperionX Limited ANNUAL REPORT 2022 25 (1) Basic and diluted loss per share for the comparative period ended June 30, 2021 have been revised. Refer to Note 1(a) for further information. The above Consolidated Statement of Profit or Loss and other Comprehensive Income should be read in conjunction with the accompanying notes.
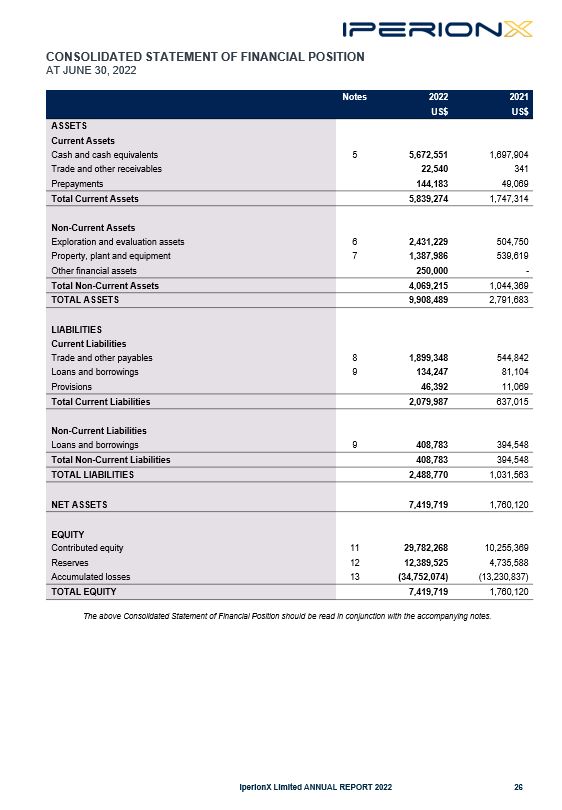
CONSOLIDATED STATEMENT OF FINANCIAL POSITION AT JUNE 30, 2022 Notes 2022 2021 US$ US$ ASSETS Current Assets Cash and cash equivalents 5 5,672,551 1,697,904 Trade and other receivables 22,540 341 Prepayments 144,183 49,069 Total Current Assets 5,839,274 1,747,314 Non-Current Assets Exploration and evaluation assets 6 2,431,229 504,750 Property, plant and equipment 7 1,387,986 539,619 Other financial assets 250,000 - Total Non-Current Assets 4,069,215 1,044,369 TOTAL ASSETS 9,908,489 2,791,683 LIABILITIES Current Liabilities Trade and other payables 8 1,899,348 544,842 Loans and borrowings 9 134,247 81,104 Provisions 46,392 11,069 Total Current Liabilities 2,079,987 637,015 Non-Current Liabilities Loans and borrowings 9 408,783 394,548 Total Non-Current Liabilities 408,783 394,548 TOTAL LIABILITIES 2,488,770 1,031,563 NET ASSETS 7,419,719 1,760,120 EQUITY Contributed equity 11 29,782,268 10,255,369 Reserves 12 12,389,525 4,735,588 Accumulated losses 13 (34,752,074) (13,230,837) TOTAL EQUITY 7,419,719 1,760,120 IperionX Limited ANNUAL REPORT 2022 26 The above Consolidated Statement of Financial Position should be read in conjunction with the accompanying notes.
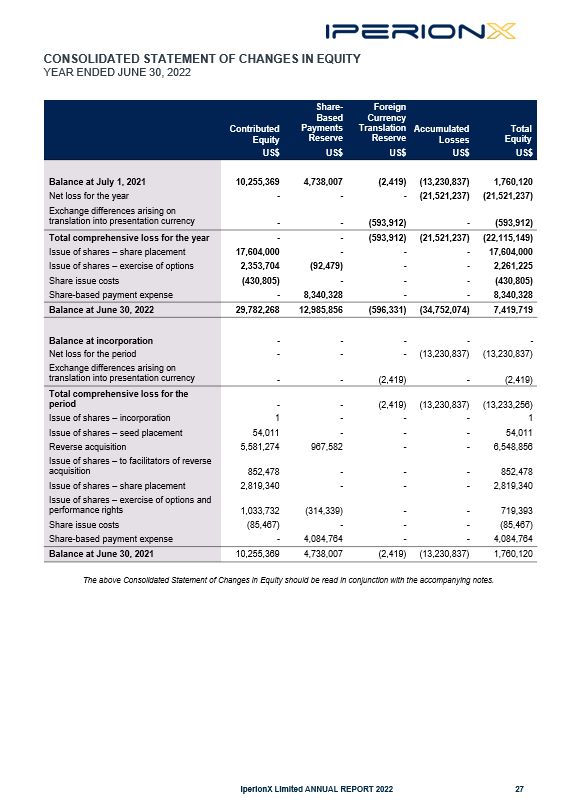
CONSOLIDATED STATEMENT OF CHANGES IN EQUITY YEAR ENDED JUNE 30, 2022 Contributed Equity Share- Based Payments Reserve Foreign Currency Translation Reserve Accumulated Losses Total Equity US$ US$ US$ US$ US$ Balance at July 1, 2021 10,255,369 4,738,007 (2,419) (13,230,837) 1,760,120 Net loss for the year - - - (21,521,237) (21,521,237) Exchange differences arising on translation into presentation currency - - (593,912) - (593,912) Total comprehensive loss for the year - - (593,912) (21,521,237) (22,115,149) Issue of shares – share placement 17,604,000 - - - 17,604,000 Issue of shares – exercise of options 2,353,704 (92,479) - - 2,261,225 Share issue costs (430,805) - - - (430,805) Share-based payment expense - 8,340,328 - - 8,340,328 Balance at June 30, 2022 29,782,268 12,985,856 (596,331) (34,752,074) 7,419,719 Balance at incorporation - - - - - Net loss for the period - - - (13,230,837) (13,230,837) Exchange differences arising on translation into presentation currency - - (2,419) - (2,419) Total comprehensive loss for the period - - (2,419) (13,230,837) (13,233,256) Issue of shares – incorporation 1 - - - 1 Issue of shares – seed placement 54,011 - - - 54,011 Reverse acquisition 5,581,274 967,582 - - 6,548,856 Issue of shares – to facilitators of reverse acquisition 852,478 - - - 852,478 Issue of shares – share placement 2,819,340 - - - 2,819,340 Issue of shares – exercise of options and performance rights 1,033,732 (314,339) - - 719,393 Share issue costs (85,467) - - - (85,467) Share-based payment expense - 4,084,764 - - 4,084,764 Balance at June 30, 2021 10,255,369 4,738,007 (2,419) (13,230,837) 1,760,120 IperionX Limited ANNUAL REPORT 2022 27 The above Consolidated Statement of Changes in Equity should be read in conjunction with the accompanying notes.

CONSOLIDATED STATEMENT OF CASH FLOWS YEAR ENDED JUNE 30, 2022 Notes 2022 July 20, 2020 to June 30, 2021 (restated) US$ US$ Operating activities Payments to suppliers and employees (12,112,577) (3,562,589) Interest paid (45,541) (511) Interest received 24,041 5,075 Net cash flows used in operating activities 5 (12,134,077) (3,558,025) Investing activities Purchase of exploration and evaluation assets 6 (1,926,479) (504,750) Purchase of property, plant and equipment (889,988) (66,818) Purchase of financial assets (250,000) - Net cash flows used in investing activities (3,066,467) (571,568) Financing activities Proceeds from issue of shares 19,865,225 3,592,745 Share issue costs 11(a) (430,805) (85,467) Proceeds from borrowings 38,682 - Repayment of borrowings (2,225) - Payment of principal portion of lease liabilities (78,778) (6,473) Net cash inflow on reverse acquisition 15 - 2,329,111 Net cash flows from financing activities 19,392,099 5,829,916 Net increase in cash and cash equivalents 4,191,555 1,700,323 Net foreign exchange differences (216,908) (2,419) Cash and cash equivalents at beginning of the year/period 1,697,904 - Cash and cash equivalents at the end of the year/period 5 5,672,551 1,697,904 IperionX Limited ANNUAL REPORT 2022 28 Notes: (1) The Consolidated Statement of Cash Flows for the comparative period ended June 30, 2021 has been restated. Refer to Note 1(a) for further information. The above Consolidated Statement of Cash Flows should be read in conjunction with the accompanying notes.

NOTES TO THE FINANCIAL STATEMENTS YEAR ENDED JUNE 30, 2022 STATEMENT OF SIGNIFICANT ACCOUNTING POLICIES The significant accounting policies adopted in preparing the consolidated financial statements of IperionX Limited (“IperionX” or “Company”) and its consolidated entities (“Consolidated Entity” or “Group”) for the year ended June 30, 2022 are stated to assist in a general understanding of the consolidated financial statements. IperionX is a for-profit company limited by shares, incorporated and domiciled in Australia. Our ordinary shares are listed on the Australian Securities Exchange, or ASX, under the symbol “IPX”, and our American Depository Shares, or ADSs, each representing ten (10) of our ordinary shares, are listed on the Nasdaq Capital Market, or Nasdaq, under the symbol “IPX”. The principal activities of the Group during the year ended June 30, 2022 consisted of the exploration and development of mineral resource projects. The consolidated financial statements of the Group for the year ended June 30, 2022 were authorised for issue in accordance with a resolution of the Directors on August 22, 2022. Basis of preparation The financial report is a general purpose financial report, which has been prepared in accordance with Australian Accounting Standards (“AASs”) issued by the Australian Accounting Standards Board (“AASB”) and the Corporations Act 2001. The financial report also complies with International Financial Reporting Standards (“IFRS”) as issued by the International Accounting Standards Board. The consolidated financial report has also been prepared on a historical cost basis, except for other financial assets, which have been measured at fair value. The consolidated financial statements are presented in United States dollars (US$). Going concern The financial statements have been prepared on the going concern basis, which contemplates the continuity of normal business activity and the realization of assets and the settlement of liabilities in the normal course of business. The Group currently has no source of operating cash inflows, other than interest income, and had net outflows from operating and investing activities of US$15,200,544 for fiscal 2022 (2021: US$4,129,593). At June 30, 2022, the Group has cash and cash equivalents of US$5,672,551 (2021: US$1,697,904). The ongoing operation of the Group remains dependent upon raising further additional funding from shareholders or other parties. In light of increasing expenditures to be incurred in executing on the Group’s current strategic plans to commercialize the Group’s titanium metal technologies and develop economically recoverable mineral deposits from the Group’s exploration properties, the Group is dependent on obtaining financing through equity financing, debt financing or other means. In the longer term, if the Group’s exploration, appraisal, and pilot activities are ultimately successful, additional funds will be required to develop the Group’s titanium metal technologies and exploration properties and commence commercial production. The ability to arrange such funding in the future will depend in part upon the prevailing capital market conditions as well as the business performance of the Group. There is no assurance that the Group will be successful in its efforts to raise additional funding on terms satisfactory to the Group. If the Group does not obtain additional funding, it may not be able to continue its operations as a going concern and therefore may not be able to realize its assets and extinguish its liabilities in the ordinary course of operations and at the amounts stated in the financial statements. Alternatively, the Group may be required to delay, reduce the scope of, or eliminate its current or future exploration, appraisal, and pilot activities or relinquish rights to certain of its interests. The Directors are confident that they will be able to raise additional funds as required to meet its obligations as and when they fall due and are of the opinion that the use of the going concern basis remains appropriate. However, there is a material uncertainty that may cast significant doubt about the Group’s ability to continue as a going concern and therefore the Group may be unable to realize its assets and discharge its liabilities in the normal course of business. Comparative figures When applicable, certain comparative figures have been adjusted to conform to the current year’s presentation. In the comparative figures for the period ended June 30, 2021, the Group reclassified the net cash inflow on reverse acquisition from investing to financing cash flows in the consolidated statement of cash flows and revised the loss per share in the consolidated statement of profit or loss. The loss per share was revised to reflect the impact of the reverse acquisition in determining the weighted average number of ordinary shares, which reduces the basic and diluted loss per share from US$0.22 to US$0.19 per share. Whilst the Group considers this change to be immaterial, the Group has revised the previously reported loss per share presented for comparative purposes. These changes had no impact on the Group’s net loss or financial position for the period ended June 30, 2021. IperionX Limited ANNUAL REPORT 2022 29

NOTES TO THE FINANCIAL STATEMENTS YEAR ENDED JUNE 30, 2022 (CONTINUED) 1. STATEMENT OF SIGNIFICANT ACCOUNTING POLICIES (continued) New standards, interpretations and amendments In the current year, the Group has adopted all of the new and revised Accounting Standards and Interpretations effective from July 1, 2021 that are mandatory. The adoption of the aforementioned standards has no impact on the financial statements of the Company as at June 30, 2022. The Group has not early adopted any other standard, interpretation or amendment that has been issued but is not yet effective. Issued standards and interpretations not early adopted Australian Accounting Standards and Interpretations that have recently been issued or amended but are not yet effective have not been adopted by the Group for the year ended June 30, 2022. Those which may be relevant to the Group are set out in the table below, but these are not expected to have any significant impact on the Group's financial statements: IperionX Limited ANNUAL REPORT 2022 30 Standard/Interpretation Application Date of Standard Application Date for the Group AASB 2020-3 Amendments to Australian Accounting Standards – Annual Improvements 2018-2020 and Other Amendments January 1, 2022 July 1, 2022 AASB 2020-1 Amendments to Australian Accounting Standards – Classification of Liabilities as Current or Non-Current January 1, 2023 July 1, 2023 (d) Principles of Consolidation The consolidated financial statements incorporate the assets and liabilities of all subsidiaries of the Company as at June 30, 2022. Control is achieved when the Company has power over the investee, is exposed, or has rights, to variable returns from its involvement with the investee and has the ability to use its power to affect its returns. The Company reassesses whether or not it controls an investee if facts and circumstances indicate that there are changes to one or more of the three elements of control listed above. When the Company has less than a majority of the voting rights of an investee, it has power over the investee when the voting rights are sufficient to give it the practical ability to direct the relevant activities of the investee unilaterally. The Company considers all relevant facts and circumstances in assessing whether or not the Company's voting rights in an investee are sufficient to give it power. Subsidiaries are all those entities (including special purpose entities) over which the Company has the power to govern the financial and operating policies, so as to obtain benefits from its activities, generally accompanying a shareholding of more than one-half of the voting rights. The existence and effect of potential voting rights that are currently exercisable or convertible are considered when assessing whether the Company controls another entity. The financial statements of the subsidiaries are prepared for the same reporting period as the Company, using consistent accounting policies. Accounting policies of subsidiaries have been changed where necessary to ensure consistency with the policies adopted by the Company. Subsidiaries are fully consolidated from the date on which control is transferred to the Company. They are de-consolidated from the date that control ceases. Intercompany transactions and balances, income and expenses and profits and losses between Group companies, are eliminated. Investments in subsidiaries are accounted for at cost in the Statement of Financial Position of the Company.
NOTES TO THE FINANCIAL STATEMENTS YEAR ENDED JUNE 30, 2022 (CONTINUED) 1. STATEMENT OF SIGNIFICANT ACCOUNTING POLICIES (continued) IperionX Limited ANNUAL REPORT 2022 31 (ii) (iii) Foreign Currencies Functional and presentation currency The functional currency of each of the Group's entities is measured using the currency of the primary economic environment in which that entity operates. The Company’s functional currency is Australian dollars. The Group’s financial statements are presented in United States dollars which is the Group's presentation currency. United States dollars has been chosen as the Group’s presentation currency to better reflect the Groupʼs business activities in the United States and to enhance comparability with its industry peer group, the majority of which report in United States dollars. Transactions and balances Foreign currency transactions are translated into functional currency using the exchange rates prevailing at the date of the transaction. Foreign currency monetary items are translated at the year-end exchange rate. Non-monetary items measured at historical cost continue to be carried at the exchange rate at the date of the transaction. Non - monetary items measured at fair value are reported at the exchange rate at the date when fair values were determined. Exchange differences arising on the translation of monetary items are recognised in the income statement, except where deferred in equity as a qualifying cash flow or net investment hedge. Exchange differences arising on the translation of non-monetary items are recognised directly in equity to the extent that the gain or loss is directly recognised in equity, otherwise the exchange difference is recognised in the income statement. Group companies The financial results and position of operations whose functional currency is different from the group's presentation currency are translated as follows: assets and liabilities are translated at year-end exchange rates prevailing at that reporting date; income and expenses are translated at average exchange rates for the year; and retained earnings are translated at the exchange rates prevailing at the date of the transaction. Exchange differences arising on translation into the presentation currency are transferred directly to the group's foreign currency translation reserve in equity. These differences are recognised in profit or loss in the year in which the operation is disposed. Cash and Cash Equivalents Cash and cash equivalents include cash on hand, deposits held at call with banks and other short-term highly liquid investments with original maturities of 3 months or less. Trade and Other Receivables Trade receivables are recognised initially at fair value and subsequently measured at amortised cost using the effective interest method, less allowance for expected credit losses, applying the simplified approach. If collection of the amounts is expected in one year or less, they are classified as current assets. If not, they are presented as non-current assets. Trade receivables are generally due for settlement within 30 days and therefore are all classified as current. As the majority of receivables are short term in nature, their carrying amount is assumed to be the same as their fair value. Property, Plant and Equipment All classes of property, plant and equipment are measured at cost. Depreciation is provided on a straight-line basis over the estimated useful lives of the assets, except for land which is not depreciated. Currently the Group only has plant and equipment which is depreciated over a period of 5 years.
NOTES TO THE FINANCIAL STATEMENTS YEAR ENDED JUNE 30, 2022 (CONTINUED) STATEMENT OF SIGNIFICANT ACCOUNTING POLICIES (continued) Exploration and Development Expenditure Expenditure on exploration and evaluation is accounted for in accordance with the 'area of interest' method and with AASB 6 Exploration for and Evaluation of Mineral Resources. Exploration and evaluation expenditure encompasses expenditures incurred by the Group in connection with the exploration for and evaluation of mineral resources before the technical feasibility and commercial viability of extracting a mineral resource are demonstrable. For each area of interest, expenditure incurred in the acquisition of rights to explore is capitalised and recognised as an exploration and evaluation asset. This includes option payments made to landowners under the Group’s option agreements with local landowners which are considered part of the acquisition costs. Exploration and evaluation assets are measured at cost at recognition and are recorded as an asset if: the rights to tenure of the area of interest are current; and at least one of the following conditions is also met: the exploration and evaluation expenditures are expected to be recouped through successful development and exploitation of the area of interest, or alternatively, by its sale; and exploration and evaluation activities in the area of interest have not at the reporting date reached a stage which permits a reasonable assessment of the existence or otherwise of economically recoverable reserves, and active and significant operations in, or in relation to, the area of interest are continuing. All other exploration and evaluation expenditures are expensed as incurred. Once the technical feasibility and commercial viability of a program or project has been demonstrated with a bankable feasibility study, the carrying amount of the exploration and evaluation expenditure in respect of the area of interest is reclassified as a “mine development property”. Where a decision is made to proceed with development, accumulated expenditure is tested for impairment and transferred to development properties, and then amortised over the life of the reserves associated with the area of interest once mining operations have commenced. Recoverability of the carrying amount of the exploration and evaluation assets is dependent on successful development and commercial exploitation, or alternatively, sale of the respective areas of interest. Impairment Capitalised exploration costs are reviewed each reporting date to establish whether an indication of impairment exists. If any such indication exists, the recoverable amount of the capitalised exploration costs is estimated to determine the extent of the impairment loss (if any). Where an impairment loss subsequently reverses, the carrying amount of the asset is increased to the revised estimate of its recoverable amount, but only to the extent that the increased carrying amount does not exceed the carrying amount that would have been determined had no impairment loss been recognised for the asset. Trade and other payables These amounts represent liabilities for goods and services provided to the Group prior to the end of the financial year which are unpaid. The amounts are unsecured and are usually paid within 60 days of recognition. Trade and other payables are presented as current liabilities unless payment is not due within 12 months from the reporting date. They are recognised initially at their fair value and subsequently measured at amortised cost using the effective interest method. The carrying amounts of trade and other payables are considered to be the same as their fair values, due to their short-term nature. (k) Provisions Provisions are recognised when the Group has a legal or constructive obligation, as a result of past events, for which it is probable that an outflow of economic benefits will result and that outflow can be reliably measured. IperionX Limited ANNUAL REPORT 2022 32
NOTES TO THE FINANCIAL STATEMENTS YEAR ENDED JUNE 30, 2022 (CONTINUED) 1. STATEMENT OF SIGNIFICANT ACCOUNTING POLICIES (continued) Interest income Interest income is recognised on a time proportionate basis that takes into account the effective yield on the financial asset. Income Tax The income tax expense for the year is the tax payable on the current year's taxable income based on the national income tax rate for each jurisdiction adjusted by changes in deferred tax assets and liabilities attributable to temporary differences between the tax bases of assets and liabilities and their carrying amounts in the financial statements, and to unused tax losses. Deferred tax assets and liabilities are recognised for temporary differences at the tax rates expected to apply when the assets are recovered or liabilities are settled, based on those tax rates which are enacted or substantively enacted for each jurisdiction. The relevant tax rates are applied to the cumulative amounts of deductible and taxable temporary differences to measure the deferred tax asset or liability. An exception is made for certain temporary differences arising from the initial recognition of an asset or a liability. No deferred tax asset or liability is recognised in relation to these temporary differences if they arose on goodwill or in a transaction, other than a business combination, that at the time of the transaction did not affect either accounting profit or taxable profit or loss. Deferred tax liabilities and assets are not recognised for temporary differences between the carrying amount and tax bases of investments in controlled entities where the Company is able to control the timing of the reversal of the temporary differences and it is probable that the differences will not reverse in the foreseeable future. Deferred tax assets are recognised for deductible temporary differences and unused tax losses only if it is probable that future taxable amounts will be available to utilise those temporary differences and losses. The carrying amount of deferred income tax assets is reviewed at each reporting date and reduced to the extent that it is no longer probable that sufficient taxable profit will be available to allow all or part of the deferred income tax asset to be utilised. Unrecognised deferred income tax assets are reassessed at each balance date and are recognised to the extent that it has become probable that future taxable profit will allow the deferred tax asset to be recovered. Current and deferred tax balances attributable to amounts recognised directly in equity are also recognised directly in equity. Deferred tax assets and deferred tax liabilities are offset only if a legally enforceable right exists to set off current tax assets against tax liabilities and the deferred tax liabilities relate to the same taxable entity and the same taxation authority. Employee Entitlements Provision is made for the Group's liability for employee benefits arising from services rendered by employees to balance date. Employee benefits that are expected to be settled wholly within 12 months have been measured at the amounts expected to be paid when the liability is settled, plus related on-costs. Earnings per Share Basic earnings per share (“EPS”) is calculated by dividing the net profit attributable to members of the Company for the reporting period, after excluding any costs of servicing equity, by the weighted average number of ordinary shares of the Company, adjusted for any bonus issue. Diluted EPS is calculated by dividing the basic EPS earnings, adjusted by the after tax effect of financing costs associated with dilutive potential Ordinary Shares and the effect on revenues and expenses of conversion to Ordinary Shares associated with dilutive potential Ordinary Shares, by the weighted average number of Ordinary Shares and dilutive Ordinary Shares adjusted for any bonus issue. Goods and Services Tax Revenues, expenses and assets are recognised net of the amount of GST, except where the amount of GST incurred is not recoverable from the Australian Tax Office. In these circumstances the GST is recognised as part of the cost of acquisition of the asset or as part of the expense. Receivables and payables in the Statement of Financial Position are shown inclusive of GST. Cash flows are presented in the Statement of Cash Flows on a gross basis, except for the GST component of investing and financing activities, which are disclosed as operating cash flows. IperionX Limited ANNUAL REPORT 2022 33

NOTES TO THE FINANCIAL STATEMENTS YEAR ENDED JUNE 30, 2022 (CONTINUED) 1. STATEMENT OF SIGNIFICANT ACCOUNTING POLICIES (continued) Use and Revision of Accounting Estimates, Judgements and Assumptions The preparation of the financial report requires management to make judgements, estimates and assumptions that affect the application of accounting policies and the reported amounts of assets, liabilities, income and expenses. Actual results may differ from these estimates. The estimates and underlying assumptions are reviewed on an ongoing basis. Revisions to accounting estimates are recognised in the year in which the estimate is revised if the revision affects only that year, or in the year of the revision and future years if the revision affects both current and future years. In particular, information about significant areas of estimation uncertainty and critical judgements in applying accounting policies that have the most significant effect on the amount recognised in the financial statements are described in the following note: Functional currency (Note 1(e)); Impairment of exploration and evaluation assets (Note 6); and Share-based payments (Note 18). Operating Segments An operating segment is a component of an entity that engages in business activities from which it may earn revenues and incur expenses (including revenues and expenses relating to transactions with other components of the same entity), whose operating results are regularly reviewed by the entity's chief operating decision maker to make decisions about resources to be allocated to the segment and assess its performance and for which discrete financial information is available. This includes start up operations which are yet to earn revenues. Management will also consider other factors in determining operating segments such as the existence of a line manager and the level of segment information presented to the board of directors. Operating segments have been identified based on the information provided to the chief operating decision makers, being the board of directors. The group aggregates two or more operating segments when they have similar economic characteristics, and the segments are similar in each of the following respects: Nature of the products and services, Nature of the production processes, Type or class of customer for the products and services, Methods used to distribute the products or provide the services, and if applicable, Nature of the regulatory environment. Operating segments that meet the quantitative criteria as prescribed by AASB 8 are reported separately. However, an operating segment that does not meet the quantitative criteria is still reported separately where information about the segment would be useful to users of the financial statements. Information about other business activities and operating segments that are below the quantitative criteria are combined and disclosed in a separate category for “all other segments”. Currently, the Group has only one operating segment. IperionX Limited ANNUAL REPORT 2022 34
NOTES TO THE FINANCIAL STATEMENTS YEAR ENDED JUNE 30, 2022 (CONTINUED) 1. STATEMENT OF SIGNIFICANT ACCOUNTING POLICIES (continued) Impairment of Assets The Group assesses at each reporting date whether there is an indication that an asset may be impaired. If any such indication exists, or when annual impairment testing for an asset is required, the Group makes an estimate of the asset's recoverable amount. An asset's recoverable amount is the higher of its fair value less costs to sell and its value in use and is determined for an individual asset, unless the asset does not generate cash inflows that are largely independent of those from other assets or groups of assets and the asset's value in use cannot be estimated to be close to its fair value. In such cases the asset is tested for impairment as part of the cash-generating unit to which it belongs. When the carrying amount of an asset or cash-generating unit exceeds its recoverable amount, the asset or cash-generating unit is considered impaired and is written down to its recoverable amount. In assessing the value in use, the estimated future cash flows are discounted to their present value using a pre-tax discount rate that reflects current market assessments of the time value of money and the risks specific to the asset. An assessment is also made at each reporting date as to whether there is any indication that previously recognised impairment losses may no longer exist or may have decreased. If such indication exists, the recoverable amount is estimated. A previously recognised impairment loss is reversed only if there has been a change in the estimates used to determine the asset's recoverable amount since the last impairment loss was recognised. If that is the case the carrying amount of the asset is increased to its recoverable amount. That increased amount cannot exceed the carrying amount that would have been determined, net of depreciation, had no impairment loss been recognised for the asset in prior years. After such a reversal the depreciation charge is adjusted in future years to allocate the asset's revised carrying amount, less any residual value, on a systematic basis over its remaining useful life. Fair Value Estimation The fair value of financial assets and financial liabilities must be estimated for recognition and measurement or for disclosure purposes. The fair value of financial instruments traded in active markets (such as publicly traded derivatives, and equity securities classified as fair value through other comprehensive income) is based on quoted market prices at the reporting date. The quoted market price used for financial assets held by the Group is the current bid price; the appropriate quoted market price for financial liabilities is the current ask price. The fair value of financial instruments that are not traded in an active market (for example, over the counter derivatives) is determined using valuation techniques. The Group uses a variety of methods and makes assumptions that are based on market conditions existing at each balance date. Quoted market prices or dealer quotes for similar instruments are used for long-term debt instruments held. Other techniques, such as discounted cash flows, are used to determine fair value for the remaining financial instruments. The fair value of interest-rate swaps is calculated as the present value of the estimated future cash flows. The fair value of forward exchange contracts is determined using forward exchange market rates at the reporting date. The nominal value less estimated credit adjustments of trade receivables and payables are assumed to approximate their fair values. The fair value of financial liabilities for disclosure purposes is estimated by discounting the future contractual cash flows at the current market interest rate that is available to the Group for similar financial instruments. Issued and Unissued Capital Ordinary Shares and Performance Shares are classified as equity. Issued and paid up capital is recognised at the fair value of the consideration received by the Company. Incremental costs directly attributable to the issue of new shares or options are shown in equity as a deduction, net of tax, from the proceeds. Dividends Provision is made for the amount of any dividend declared on or before the end of the year but not distributed at balance date. IperionX Limited ANNUAL REPORT 2022 35

NOTES TO THE FINANCIAL STATEMENTS YEAR ENDED JUNE 30, 2022 (CONTINUED) 1. STATEMENT OF SIGNIFICANT ACCOUNTING POLICIES (continued) Share-Based Payments Equity-settled share-based payments are provided to officers, employees, consultants and other advisors. These share- based payments are measured at the fair value of the equity instrument at the grant date. The fair value of options is estimated using the Black Scholes option valuation model. The fair value of performance rights that have market-based vesting conditions is estimated using a trinomial valuation model. The fair value of restricted stock units and performance rights that do not have market-based vesting conditions are estimated based on the underlying share price. The fair value determined at the grant date is expensed on a straight-line basis over the vesting period, based on the Company's estimate of equity instruments that will eventually vest. At each reporting date, the Company revises its estimate of the number of equity instruments expected to vest. The impact of the revision of the original estimates, if any, is recognised in profit or loss over the remaining vesting period, with a corresponding adjustment to the share-based payments reserve. Equity-settled share-based payments may also be provided as consideration for the acquisition of assets. Where ordinary shares are issued, the transaction is recorded at fair value based on the quoted price of the ordinary shares at the date of issue. The acquisition is then recorded as an asset or expensed in accordance with accounting standards. Leases The Group assesses at contract inception whether a contract is, or contains, a lease. That is, if the contract conveys the right to control the use of an identified asset for a period of time in exchange for consideration. The Group applies a single recognition and measurement approach for all leases, except for short-term leases and leases of low-value assets. The Group recognises lease liabilities to make lease payments and right-of-use assets representing the right to use the underlying assets. Right-of-use assets The Group recognises right-of-use assets at the commencement date of the lease (i.e. the date the underlying asset is available for use). Right-of-use assets are measured at cost, less any accumulated depreciation and impairment losses, and adjusted for any remeasurement of lease liabilities. The cost of right-of-use assets includes the amount of lease liabilities recognised, initial direct costs incurred, and lease payments made at or before the commencement date less any lease incentives received. Right-of-use assets are depreciated on a straight-line basis over the shorter of the lease term and the estimated useful lives of the assets. If ownership of the leased asset transfers to the Group at the end of the lease term or the cost reflects the exercise of a purchase option, depreciation is calculated using the estimated useful life of the asset. The right-of-use assets are also subject to impairment. Lease liabilities At the commencement date of the lease, the Group recognises lease liabilities measured at the present value of lease payments to be made over the lease term. The lease payments include fixed payments (including in-substance fixed payments) less any lease incentives receivable, variable lease payments that depend on an index or a rate, and amounts expected to be paid under residual value guarantees. The lease payments also include the exercise price of a purchase option reasonably certain to be exercised by the Group and payments of penalties for terminating the lease, if the lease term reflects the Group exercising the option to terminate. In calculating the present value of lease payments, the Group uses its incremental borrowing rate at the lease commencement date because the interest rate implicit in the lease is not readily determinable. After the commencement date, the amount of lease liabilities is increased to reflect the accretion of interest and reduced for the lease payments made. In addition, the carrying amount of lease liabilities is remeasured if there is a modification, a change in the lease term, a change in the lease payments (e.g. changes to future payments resulting from a change in an index or rate used to determine such lease payments) or a change in the assessment of an option to purchase the underlying asset. Short-term leases and leases of low-value assets The Group applies the short-term lease recognition exemption to its short-term leases of machinery and equipment (i.e. those leases that have a lease term of 12 months or less from the commencement date and do not contain a purchase option). It also applies the lease of low-value assets recognition exemption to leases of office equipment that are considered to be low value. Lease payments on short-term leases and leases of low-value assets are recognised as expense on a straight-line basis over the lease term. IperionX Limited ANNUAL REPORT 2022 36
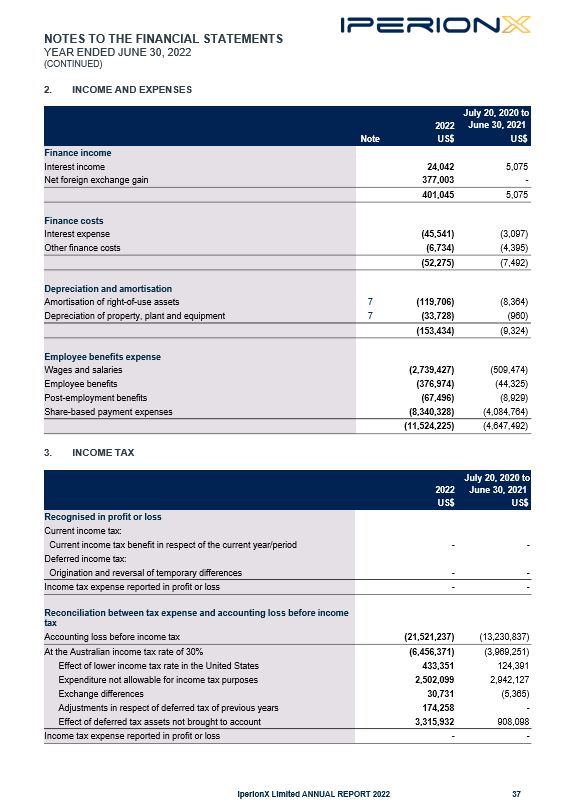
NOTES TO THE FINANCIAL STATEMENTS YEAR ENDED JUNE 30, 2022 (CONTINUED) 2. INCOME AND EXPENSES 2022 July 20, 2020 to June 30, 2021 Note US$ US$ Finance income Interest income 24,042 5,075 Net foreign exchange gain 377,003 - 401,045 5,075 Finance costs Interest expense (45,541) (3,097) Other finance costs (6,734) (4,395) (52,275) (7,492) Depreciation and amortisation Amortisation of right-of-use assets 7 (119,706) (8,364) Depreciation of property, plant and equipment 7 (33,728) (960) (153,434) (9,324) Employee benefits expense Wages and salaries (2,739,427) (509,474) Employee benefits (376,974) (44,325) Post-employment benefits (67,496) (8,929) Share-based payment expenses (8,340,328) (4,084,764) (11,524,225) (4,647,492) IperionX Limited ANNUAL REPORT 2022 37 3. INCOME TAX 2022 July 20, 2020 to June 30, 2021 US$ US$ Recognised in profit or loss Current income tax: Current income tax benefit in respect of the current year/period - - Deferred income tax: Origination and reversal of temporary differences - - Income tax expense reported in profit or loss - - Reconciliation between tax expense and accounting loss before income tax Accounting loss before income tax (21,521,237) (13,230,837) At the Australian income tax rate of 30% (6,456,371) (3,969,251) Effect of lower income tax rate in the United States 433,351 124,391 Expenditure not allowable for income tax purposes 2,502,099 2,942,127 Exchange differences 30,731 (5,365) Adjustments in respect of deferred tax of previous years 174,258 - Effect of deferred tax assets not brought to account 3,315,932 908,098 Income tax expense reported in profit or loss - -
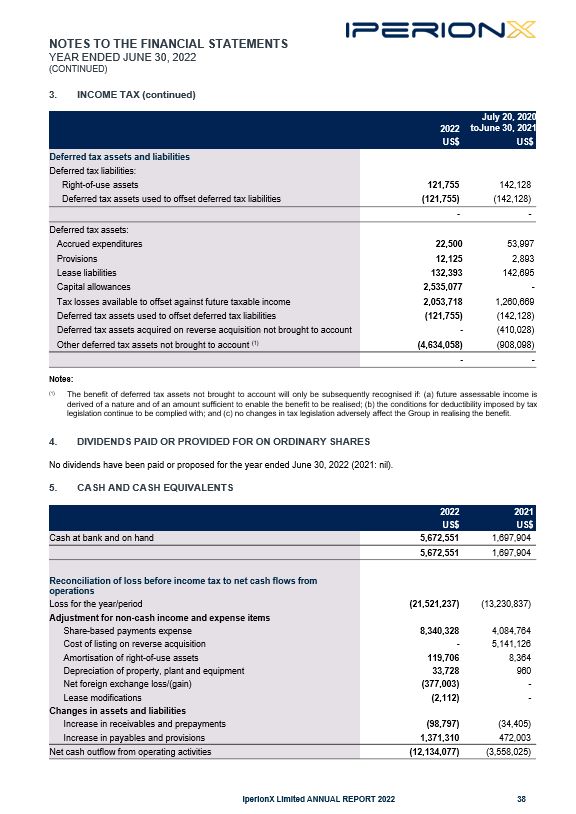
NOTES TO THE FINANCIAL STATEMENTS YEAR ENDED JUNE 30, 2022 (CONTINUED) 3. INCOME TAX (continued) 2022 July 20, 2020 toJune 30, 2021 US$ US$ Deferred tax assets and liabilities Deferred tax liabilities: Right-of-use assets 121,755 142,128 Deferred tax assets used to offset deferred tax liabilities (121,755) (142,128) - - Deferred tax assets: Accrued expenditures 22,500 53,997 Provisions 12,125 2,893 Lease liabilities 132,393 142,695 Capital allowances 2,535,077 - Tax losses available to offset against future taxable income 2,053,718 1,260,669 Deferred tax assets used to offset deferred tax liabilities (121,755) (142,128) Deferred tax assets acquired on reverse acquisition not brought to account - (410,028) Other deferred tax assets not brought to account (1) (4,634,058) (908,098) - - IperionX Limited ANNUAL REPORT 2022 38 Notes: (1) The benefit of deferred tax assets not brought to account will only be subsequently recognised if: (a) future assessable income is derived of a nature and of an amount sufficient to enable the benefit to be realised; (b) the conditions for deductibility imposed by tax legislation continue to be complied with; and (c) no changes in tax legislation adversely affect the Group in realising the benefit. DIVIDENDS PAID OR PROVIDED FOR ON ORDINARY SHARES No dividends have been paid or proposed for the year ended June 30, 2022 (2021: nil). CASH AND CASH EQUIVALENTS 2022 2021 US$ US$ Cash at bank and on hand 5,672,551 1,697,904 5,672,551 1,697,904 Reconciliation of loss before income tax to net cash flows from operations Loss for the year/period (21,521,237) (13,230,837) Adjustment for non-cash income and expense items Share-based payments expense 8,340,328 4,084,764 Cost of listing on reverse acquisition - 5,141,126 Amortisation of right-of-use assets 119,706 8,364 Depreciation of property, plant and equipment 33,728 960 Net foreign exchange loss/(gain) (377,003) - Lease modifications (2,112) - Changes in assets and liabilities Increase in receivables and prepayments (98,797) (34,405) Increase in payables and provisions 1,371,310 472,003 Net cash outflow from operating activities (12,134,077) (3,558,025)
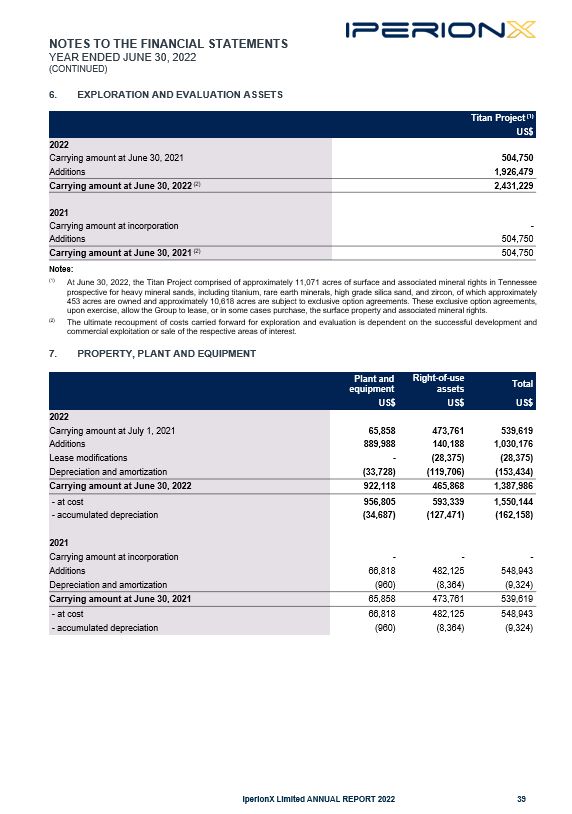
NOTES TO THE FINANCIAL STATEMENTS YEAR ENDED JUNE 30, 2022 (CONTINUED) 6. EXPLORATION AND EVALUATION ASSETS Titan Project (1) US$ 2022 Carrying amount at June 30, 2021 504,750 Additions 1,926,479 Carrying amount at June 30, 2022 (2) 2,431,229 2021 Carrying amount at incorporation - Additions 504,750 Carrying amount at June 30, 2021 (2) 504,750 IperionX Limited ANNUAL REPORT 2022 39 Notes: (1) At June 30, 2022, the Titan Project comprised of approximately 11,071 acres of surface and associated mineral rights in Tennessee prospective for heavy mineral sands, including titanium, rare earth minerals, high grade silica sand, and zircon, of which approximately 453 acres are owned and approximately 10,618 acres are subject to exclusive option agreements. These exclusive option agreements, upon exercise, allow the Group to lease, or in some cases purchase, the surface property and associated mineral rights. The ultimate recoupment of costs carried forward for exploration and evaluation is dependent on the successful development and commercial exploitation or sale of the respective areas of interest. (2) 7. PROPERTY, PLANT AND EQUIPMENT Plant and equipment Right-of-use assets Total US$ US$ US$ 2022 Carrying amount at July 1, 2021 65,858 473,761 539,619 Additions 889,988 140,188 1,030,176 Lease modifications - (28,375) (28,375) Depreciation and amortization (33,728) (119,706) (153,434) Carrying amount at June 30, 2022 922,118 465,868 1,387,986 - at cost 956,805 593,339 1,550,144 - accumulated depreciation (34,687) (127,471) (162,158) 2021 Carrying amount at incorporation - - - Additions 66,818 482,125 548,943 Depreciation and amortization (960) (8,364) (9,324) Carrying amount at June 30, 2021 65,858 473,761 539,619 - at cost 66,818 482,125 548,943 - accumulated depreciation (960) (8,364) (9,324)

NOTES TO THE FINANCIAL STATEMENTS YEAR ENDED JUNE 30, 2022 (CONTINUED) 8. TRADE AND OTHER PAYABLES 2022 2021 US$ US$ Current Trade payables 1,677,757 286,846 Accruals 196,450 255,965 Payroll liabilities 25,141 2,031 Total trade and other payables 1,899,348 544,842 IperionX Limited ANNUAL REPORT 2022 40 9. LOANS AND BORROWINGS 2022 2021 US$ US$ Current Lease liabilities 128,653 81,104 Other loans and borrowings 5,594 - Total current loans and borrowings 134,247 81,104 Non-current Lease liabilities 377,920 394,548 Other loans and borrowings 30,863 - Total non-current loans and borrowings 408,783 394,548 Total loans and borrowings 543,030 475,652 (a) Reconciliation Balance at July 1, 2021 Additions Lease modifications Repayments Balance at June 30, 2022 US$ US$ US$ US$ US$ Lease liabilities 475,652 140,188 (30,489) (78,778) 506,573 Other loans and borrowings - 38,682 - (2,225) 36,457 Total loans and borrowings 475,652 178,870 (30,489) (81,003) 543,030 10. LEASES The Group leases office premises and vehicles in the United States. The carrying amounts of right-of-use assets (included under property, plant and equipment) and the movements during the year are in Note 7. The carrying amounts of lease liabilities (included under financial liabilities) and the movements during the year are set out in Note 9. The following are the amounts recognised in profit or loss in respect of leases: Note 2022 July 20, 2020 to June 30, 2021 US$ US$ Amortisation of right-of-use assets 7 (119,706) (8,364) Interest expense on lease liabilities (44,512) (3,097) Net amount recognised in profit or loss (164,218) (11,461)

NOTES TO THE FINANCIAL STATEMENTS YEAR ENDED JUNE 30, 2022 (CONTINUED) 11. CONTRIBUTED EQUITY 2022 2021 Note US$ US$ Issued capital 140,288,491 (2021: 105,105,787) fully paid ordinary shares 11(a) 29,782,268 10,255,369 Movements in issued capital Number of Ordinary Shares Number of Performance Shares US$ 2022 Opening balance at July 1, 2021 105,105,787 39,600,000 10,255,369 Issue of shares – share placement (August 2021) 20,000,000 - 17,604,000 Issue of shares – exercise of options 15,182,704 - 2,353,704 Share issue costs - - (430,805) Closing balance at June 30, 2022 140,288,491 39,600,000 29,782,268 2021 Opening balance at incorporation - - - Issue of shares – incorporation (July 2020) 265 360 1 Issue of shares – seed placement (August-October 2020) 26,499,735 35,999,640 54,011 Reverse acquisition – shares issued to facilitators of reverse acquisition 2,650,000 3,600,000 852,478 Reverse acquisition – recognition of legal acquirer shares 57,386,667 - 5,581,274 Issue of shares – share placement (January 2021) 12,150,000 - 2,819,340 Issue of shares – exercise of options and performance rights 6,419,120 - 1,033,732 Share issue costs - - (85,467) Closing balance at June 30, 2021 105,105,787 39,600,000 10,255,369 Rights attaching to Ordinary Shares The rights attaching to fully paid ordinary shares (“Ordinary Shares”) arise from a combination of the Company's Constitution, statute and general law: Shares - The issue of shares in the capital of the Company and options over unissued shares by the Company is under the control of the directors, subject to the Corporations Act 2001, ASX Listing Rules and any rights attached to any special class of shares. Meetings of Members - Directors may call a meeting of members whenever they think fit. Members may call a meeting as provided by the Corporations Act 2001.The Constitution contains provisions prescribing the content requirements of notices of meetings of members and all members are entitled to a notice of meeting. A meeting may be held in two or more places linked together by audio-visual communication devices. A quorum for a meeting of members is 2 shareholders. The Company holds annual general meetings in accordance with the Corporations Act 2001 and the Listing Rules. Voting - Subject to any rights or restrictions at the time being attached to any shares or class of shares of the Company, each member of the Company is entitled to receive notice of, attend and vote at a general meeting. Resolutions of members will be decided by a show of hands unless a poll is demanded. On a show of hands each eligible voter present has one vote. However, where a person present at a general meeting represents personally or by proxy, attorney or representative more than one member, on a show of hands the person is entitled to one vote only despite the number of members the person represents. On a poll each eligible member has one vote for each fully paid share held and a fraction of a vote for each partly paid share determined by the amount paid up on that share. Changes to the Constitution - The Company's Constitution can only be amended by a special resolution passed by at least three quarters of the members present and voting at a general meeting of the Company. At least 28 days' written notice specifying the intention to propose the resolution as a special resolution must be given. Listing Rules - Provided the Company remains admitted to the Official List, then despite anything in its Constitution, no act may be done that is prohibited by the Listing Rules, and authority is given for acts required to be done by the Listing Rules. The Company's Constitution will be deemed to comply with the Listing Rules as amended from time to time. IperionX Limited ANNUAL REPORT 2022 41

NOTES TO THE FINANCIAL STATEMENTS YEAR ENDED JUNE 30, 2022 (CONTINUED) CONTRIBUTED EQUITY (continued) Rights attaching to Performance Shares Performance Shares comprise 19,800,000 Class A and 19,800,000 Class B Performance Shares issued in relation to the acquisition of HMAPL (refer Note 15) and are issued based upon the following terms and conditions: The Performance Shareholders are not entitled to a dividend; The Performance Shares are not transferable; The Performance Shareholders shall have no right to vote, subject to the Corporations Act; The Performance Shares will convert into Ordinary Shares as follows: Each Class A Performance Share will convert into one (1) Ordinary Share upon completion of a positive pre- feasibility study (prepared in accordance with the JORC Code and independently verified by a Competent Person) for heavy mineral sands mining and processing on any of the Titan Project area which demonstrates a net present value of at least A$200,000,000 before September 17, 2024 (the “Pre-Feasibility Study Milestone”); Each Class B Performance Share will convert into one (1) Ordinary Share upon the commencement of commercial production from the Titan Project area before September 17, 2025 (the “First Production Milestone”); All Performance Shares shall automatically convert into Ordinary Shares upon the occurrence of certain change of control events; and To the extent that any Performance Shares have not converted into Ordinary Shares by the applicable expiry date, all such Performance Shares for each holder will automatically lapse and be combined into one single Performance Share that will then convert into one single Ordinary Share. If the Class A Performance Shares have not converted into Ordinary Shares by the applicable expiry date, then the 19,800,000 Class A Performance Shares will convert into 30 Ordinary Shares. If the Class B Performance Shares have not converted into Ordinary Shares by the applicable expiry date, then the 19,800,000 Class B Performance Shares will convert into 30 Ordinary Shares. If neither the Class A Performance Shares nor the Class B Performance Shares have converted into Ordinary Shares by the applicable expiry date, then the 39,600,000 Performance Shares will convert into 60 Ordinary Shares. The Ordinary Shares issued on conversion of any Performance Share will rank equally with and confer rights identical with all other Ordinary Shares then on issue and application will be made by the Company to ASX for official quotation of the Ordinary Shares upon the date of conversion. The Company shall allot and issue Ordinary Shares immediately upon conversion of the Performance Shares for no consideration and shall record the allotment and issue in the manner required by the Corporations Act. The Performance Shares are unquoted. No application for quotation of the Performance Shares will be made by the Company. 12. RESERVES 2022 2021 Note US$ US$ Share-based payments reserve 12(b) 12,985,856 4,738,007 Foreign currency translation reserve 12(f) (596,331) (2,419) 12,389,525 4,735,588 Nature and purpose of reserves Share-based payments reserve The share-based payments reserve is used to record the fair value of Unlisted Options, Restricted Stock Units and Performance Rights issued by the Group. Foreign currency translation reserve Exchange differences arising on translation of entities whose functional currency is different to the Group’s presentation currency are taken to the foreign currency translation reserve, as described in Note 1(e). IperionX Limited ANNUAL REPORT 2022 42 (i) (ii)
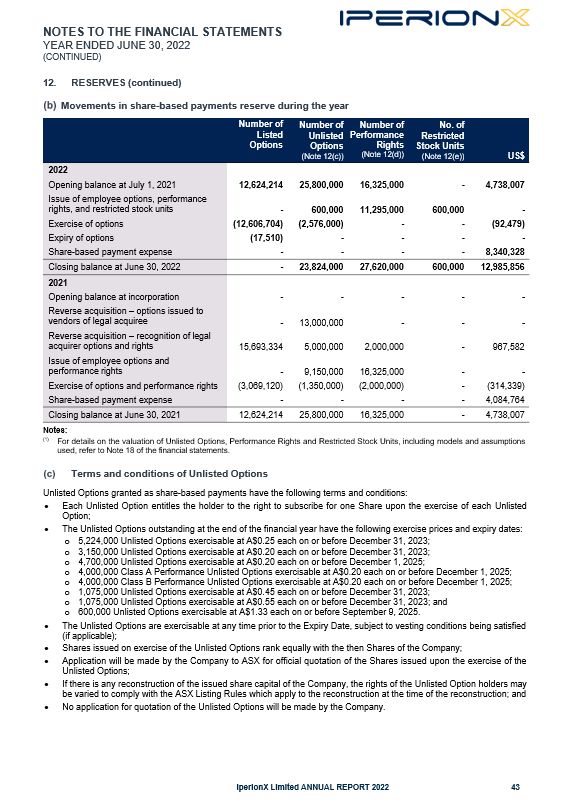
NOTES TO THE FINANCIAL STATEMENTS YEAR ENDED JUNE 30, 2022 (CONTINUED) 12. RESERVES (continued) Movements in share-based payments reserve during the year Number of Listed Options Number of Unlisted Options (Note 12(c)) Number of Performance Rights (Note 12(d)) No. of Restricted Stock Units (Note 12(e)) US$ 2022 Opening balance at July 1, 2021 12,624,214 25,800,000 16,325,000 - 4,738,007 Issue of employee options, performance rights, and restricted stock units - 600,000 11,295,000 600,000 - Exercise of options (12,606,704) (2,576,000) - - (92,479) Expiry of options (17,510) - - - - Share-based payment expense - - - - 8,340,328 Closing balance at June 30, 2022 - 23,824,000 27,620,000 600,000 12,985,856 2021 Opening balance at incorporation - - - - - Reverse acquisition – options issued to vendors of legal acquiree - 13,000,000 - - - Reverse acquisition – recognition of legal acquirer options and rights 15,693,334 5,000,000 2,000,000 - 967,582 Issue of employee options and performance rights - 9,150,000 16,325,000 - - Exercise of options and performance rights (3,069,120) (1,350,000) (2,000,000) - (314,339) Share-based payment expense - - - - 4,084,764 Closing balance at June 30, 2021 12,624,214 25,800,000 16,325,000 - 4,738,007 Notes: (1) For details on the valuation of Unlisted Options, Performance Rights and Restricted Stock Units, including models and assumptions used, refer to Note 18 of the financial statements. Terms and conditions of Unlisted Options Unlisted Options granted as share-based payments have the following terms and conditions: Each Unlisted Option entitles the holder to the right to subscribe for one Share upon the exercise of each Unlisted Option; The Unlisted Options outstanding at the end of the financial year have the following exercise prices and expiry dates: 5,224,000 Unlisted Options exercisable at A$0.25 each on or before December 31, 2023; 3,150,000 Unlisted Options exercisable at A$0.20 each on or before December 31, 2023; 4,700,000 Unlisted Options exercisable at A$0.20 each on or before December 1, 2025; 4,000,000 Class A Performance Unlisted Options exercisable at A$0.20 each on or before December 1, 2025; 4,000,000 Class B Performance Unlisted Options exercisable at A$0.20 each on or before December 1, 2025; 1,075,000 Unlisted Options exercisable at A$0.45 each on or before December 31, 2023; 1,075,000 Unlisted Options exercisable at A$0.55 each on or before December 31, 2023; and 600,000 Unlisted Options exercisable at A$1.33 each on or before September 9, 2025. The Unlisted Options are exercisable at any time prior to the Expiry Date, subject to vesting conditions being satisfied (if applicable); Shares issued on exercise of the Unlisted Options rank equally with the then Shares of the Company; Application will be made by the Company to ASX for official quotation of the Shares issued upon the exercise of the Unlisted Options; If there is any reconstruction of the issued share capital of the Company, the rights of the Unlisted Option holders may be varied to comply with the ASX Listing Rules which apply to the reconstruction at the time of the reconstruction; and No application for quotation of the Unlisted Options will be made by the Company. IperionX Limited ANNUAL REPORT 2022 43
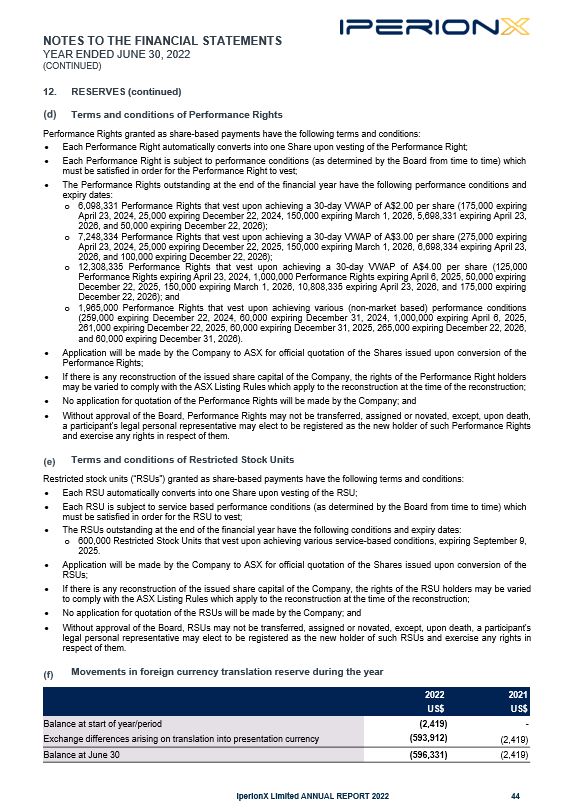
NOTES TO THE FINANCIAL STATEMENTS YEAR ENDED JUNE 30, 2022 (CONTINUED) RESERVES (continued) Terms and conditions of Performance Rights Performance Rights granted as share-based payments have the following terms and conditions: Each Performance Right automatically converts into one Share upon vesting of the Performance Right; Each Performance Right is subject to performance conditions (as determined by the Board from time to time) which must be satisfied in order for the Performance Right to vest; The Performance Rights outstanding at the end of the financial year have the following performance conditions and expiry dates: 6,098,331 Performance Rights that vest upon achieving a 30-day VWAP of A$2.00 per share (175,000 expiring April 23, 2024, 25,000 expiring December 22, 2024, 150,000 expiring March 1, 2026, 5,698,331 expiring April 23, 2026, and 50,000 expiring December 22, 2026); 7,248,334 Performance Rights that vest upon achieving a 30-day VWAP of A$3.00 per share (275,000 expiring April 23, 2024, 25,000 expiring December 22, 2025, 150,000 expiring March 1, 2026, 6,698,334 expiring April 23, 2026, and 100,000 expiring December 22, 2026); 12,308,335 Performance Rights that vest upon achieving a 30-day VWAP of A$4.00 per share (125,000 Performance Rights expiring April 23, 2024, 1,000,000 Performance Rights expiring April 6, 2025, 50,000 expiring December 22, 2025, 150,000 expiring March 1, 2026, 10,808,335 expiring April 23, 2026, and 175,000 expiring December 22, 2026); and 1,965,000 Performance Rights that vest upon achieving various (non-market based) performance conditions (259,000 expiring December 22, 2024, 60,000 expiring December 31, 2024, 1,000,000 expiring April 6, 2025, 261,000 expiring December 22, 2025, 60,000 expiring December 31, 2025, 265,000 expiring December 22, 2026, and 60,000 expiring December 31, 2026). Application will be made by the Company to ASX for official quotation of the Shares issued upon conversion of the Performance Rights; If there is any reconstruction of the issued share capital of the Company, the rights of the Performance Right holders may be varied to comply with the ASX Listing Rules which apply to the reconstruction at the time of the reconstruction; No application for quotation of the Performance Rights will be made by the Company; and Without approval of the Board, Performance Rights may not be transferred, assigned or novated, except, upon death, a participant's legal personal representative may elect to be registered as the new holder of such Performance Rights and exercise any rights in respect of them. Terms and conditions of Restricted Stock Units Restricted stock units (“RSUs”) granted as share-based payments have the following terms and conditions: Each RSU automatically converts into one Share upon vesting of the RSU; Each RSU is subject to service based performance conditions (as determined by the Board from time to time) which must be satisfied in order for the RSU to vest; The RSUs outstanding at the end of the financial year have the following conditions and expiry dates: 600,000 Restricted Stock Units that vest upon achieving various service-based conditions, expiring September 9, 2025. Application will be made by the Company to ASX for official quotation of the Shares issued upon conversion of the RSUs; If there is any reconstruction of the issued share capital of the Company, the rights of the RSU holders may be varied to comply with the ASX Listing Rules which apply to the reconstruction at the time of the reconstruction; No application for quotation of the RSUs will be made by the Company; and Without approval of the Board, RSUs may not be transferred, assigned or novated, except, upon death, a participant's legal personal representative may elect to be registered as the new holder of such RSUs and exercise any rights in respect of them. Movements in foreign currency translation reserve during the year IperionX Limited ANNUAL REPORT 2022 44 2022 2021 US$ US$ Balance at start of year/period (2,419) - Exchange differences arising on translation into presentation currency (593,912) (2,419) Balance at June 30 (596,331) (2,419)
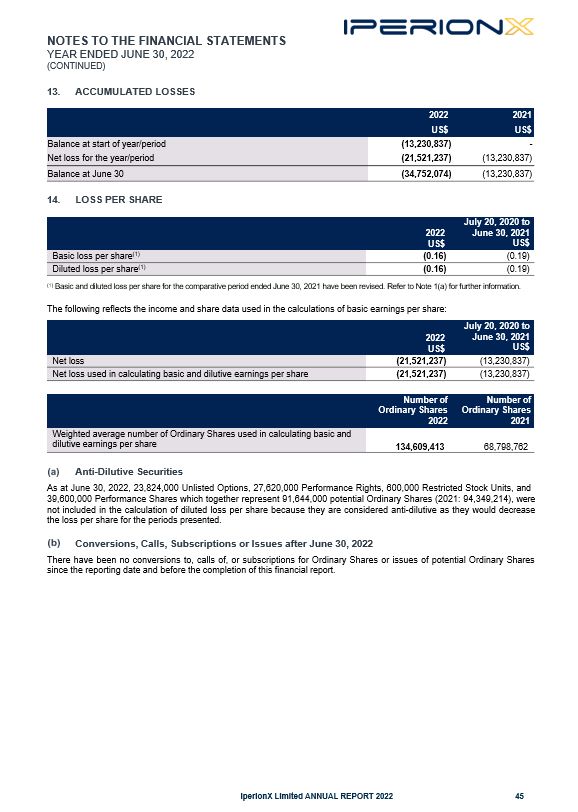
NOTES TO THE FINANCIAL STATEMENTS YEAR ENDED JUNE 30, 2022 (CONTINUED) 13. ACCUMULATED LOSSES 2022 2021 US$ US$ Balance at start of year/period (13,230,837) - Net loss for the year/period (21,521,237) (13,230,837) Balance at June 30 (34,752,074) (13,230,837) 14. LOSS PER SHARE 2022 US$ July 20, 2020 to June 30, 2021 US$ Basic loss per share(1) (0.16) (0.19) Diluted loss per share(1) (0.16) (0.19) (1) Basic and diluted loss per share for the comparative period ended June 30, 2021 have been revised. Refer to Note 1(a) for further information. The following reflects the income and share data used in the calculations of basic earnings per share: 2022 US$ July 20, 2020 to June 30, 2021 US$ Net loss (21,521,237) (13,230,837) Net loss used in calculating basic and dilutive earnings per share (21,521,237) (13,230,837) Number of Ordinary Shares 2022 Number of Ordinary Shares 2021 Weighted average number of Ordinary Shares used in calculating basic and dilutive earnings per share 134,609,413 68,798,762 Anti-Dilutive Securities As at June 30, 2022, 23,824,000 Unlisted Options, 27,620,000 Performance Rights, 600,000 Restricted Stock Units, and 39,600,000 Performance Shares which together represent 91,644,000 potential Ordinary Shares (2021: 94,349,214), were not included in the calculation of diluted loss per share because they are considered anti-dilutive as they would decrease the loss per share for the periods presented. Conversions, Calls, Subscriptions or Issues after June 30, 2022 There have been no conversions to, calls of, or subscriptions for Ordinary Shares or issues of potential Ordinary Shares since the reporting date and before the completion of this financial report. IperionX Limited ANNUAL REPORT 2022 45
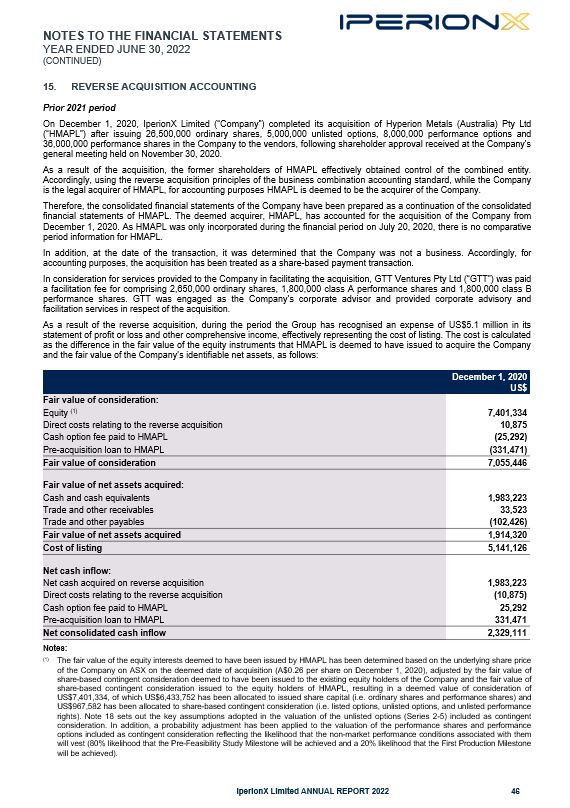
NOTES TO THE FINANCIAL STATEMENTS YEAR ENDED JUNE 30, 2022 (CONTINUED) 15. REVERSE ACQUISITION ACCOUNTING Prior 2021 period On December 1, 2020, IperionX Limited (“Company”) completed its acquisition of Hyperion Metals (Australia) Pty Ltd (“HMAPL”) after issuing 26,500,000 ordinary shares, 5,000,000 unlisted options, 8,000,000 performance options and 36,000,000 performance shares in the Company to the vendors, following shareholder approval received at the Company’s general meeting held on November 30, 2020. As a result of the acquisition, the former shareholders of HMAPL effectively obtained control of the combined entity. Accordingly, using the reverse acquisition principles of the business combination accounting standard, while the Company is the legal acquirer of HMAPL, for accounting purposes HMAPL is deemed to be the acquirer of the Company. Therefore, the consolidated financial statements of the Company have been prepared as a continuation of the consolidated financial statements of HMAPL. The deemed acquirer, HMAPL, has accounted for the acquisition of the Company from December 1, 2020. As HMAPL was only incorporated during the financial period on July 20, 2020, there is no comparative period information for HMAPL. In addition, at the date of the transaction, it was determined that the Company was not a business. Accordingly, for accounting purposes, the acquisition has been treated as a share-based payment transaction. In consideration for services provided to the Company in facilitating the acquisition, GTT Ventures Pty Ltd (“GTT”) was paid a facilitation fee for comprising 2,650,000 ordinary shares, 1,800,000 class A performance shares and 1,800,000 class B performance shares. GTT was engaged as the Company’s corporate advisor and provided corporate advisory and facilitation services in respect of the acquisition. As a result of the reverse acquisition, during the period the Group has recognised an expense of US$5.1 million in its statement of profit or loss and other comprehensive income, effectively representing the cost of listing. The cost is calculated as the difference in the fair value of the equity instruments that HMAPL is deemed to have issued to acquire the Company and the fair value of the Company’s identifiable net assets, as follows: IperionX Limited ANNUAL REPORT 2022 46 December 1, 2020 US$ Fair value of consideration: Equity (1) 7,401,334 Direct costs relating to the reverse acquisition 10,875 Cash option fee paid to HMAPL (25,292) Pre-acquisition loan to HMAPL (331,471) Fair value of consideration 7,055,446 Fair value of net assets acquired: Cash and cash equivalents 1,983,223 Trade and other receivables 33,523 Trade and other payables (102,426) Fair value of net assets acquired 1,914,320 Cost of listing 5,141,126 Net cash inflow: Net cash acquired on reverse acquisition 1,983,223 Direct costs relating to the reverse acquisition (10,875) Cash option fee paid to HMAPL 25,292 Pre-acquisition loan to HMAPL 331,471 Net consolidated cash inflow 2,329,111 Notes: (1) The fair value of the equity interests deemed to have been issued by HMAPL has been determined based on the underlying share price of the Company on ASX on the deemed date of acquisition (A$0.26 per share on December 1, 2020), adjusted by the fair value of share-based contingent consideration deemed to have been issued to the existing equity holders of the Company and the fair value of share-based contingent consideration issued to the equity holders of HMAPL, resulting in a deemed value of consideration of US$7,401,334, of which US$6,433,752 has been allocated to issued share capital (i.e. ordinary shares and performance shares) and US$967,582 has been allocated to share-based contingent consideration (i.e. listed options, unlisted options, and unlisted performance rights). Note 18 sets out the key assumptions adopted in the valuation of the unlisted options (Series 2-5) included as contingent consideration. In addition, a probability adjustment has been applied to the valuation of the performance shares and performance options included as contingent consideration reflecting the likelihood that the non-market performance conditions associated with them will vest (80% likelihood that the Pre-Feasibility Study Milestone will be achieved and a 20% likelihood that the First Production Milestone will be achieved).
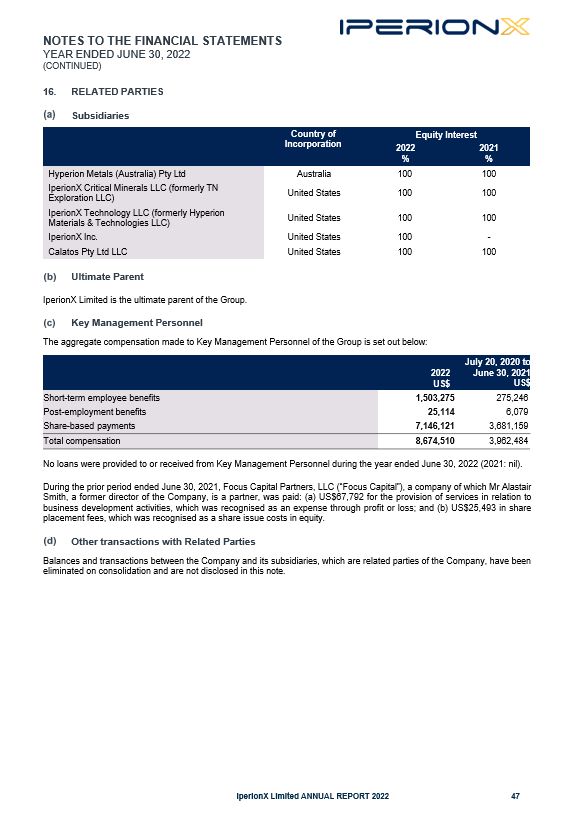
NOTES TO THE FINANCIAL STATEMENTS YEAR ENDED JUNE 30, 2022 (CONTINUED) 16. RELATED PARTIES Subsidiaries Country of Incorporation Equity Interest 2022 % 2021 % Hyperion Metals (Australia) Pty Ltd Australia 100 100 IperionX Critical Minerals LLC (formerly TN Exploration LLC) United States 100 100 IperionX Technology LLC (formerly Hyperion Materials & Technologies LLC) United States 100 100 IperionX Inc. United States 100 - Calatos Pty Ltd LLC United States 100 100 Ultimate Parent IperionX Limited is the ultimate parent of the Group. Key Management Personnel The aggregate compensation made to Key Management Personnel of the Group is set out below: 2022 US$ July 20, 2020 to June 30, 2021 US$ Short-term employee benefits 1,503,275 275,246 Post-employment benefits 25,114 6,079 Share-based payments 7,146,121 3,681,159 Total compensation 8,674,510 3,962,484 No loans were provided to or received from Key Management Personnel during the year ended June 30, 2022 (2021: nil). During the prior period ended June 30, 2021, Focus Capital Partners, LLC (“Focus Capital”), a company of which Mr Alastair Smith, a former director of the Company, is a partner, was paid: (a) US$67,792 for the provision of services in relation to business development activities, which was recognised as an expense through profit or loss; and (b) US$25,493 in share placement fees, which was recognised as a share issue costs in equity. Other transactions with Related Parties Balances and transactions between the Company and its subsidiaries, which are related parties of the Company, have been eliminated on consolidation and are not disclosed in this note. IperionX Limited ANNUAL REPORT 2022 47

NOTES TO THE FINANCIAL STATEMENTS YEAR ENDED JUNE 30, 2022 (CONTINUED) 17. PARENT ENTITY DISCLOSURES 2022 2021 US$ US$ Financial Position Assets Current Assets 5,516,069 1,530,089 Non-Current Assets 2,814,470 340,969 Total Assets 8,330,539 1,871,058 Liabilities Current Liabilities 910,820 110,938 Total Liabilities 910,820 110,938 Equity Contributed equity 32,887,506 13,360,608 Reserves 11,844,139 5,723,616 Accumulated losses (37,311,926) (17,324,104) Total Equity 7,419,719 1,760,120 Financial Performance Loss for the year/period (19,987,822) (15,169,532) Other comprehensive (loss)/income (2,127,327) 96,762 Total comprehensive loss (22,115,149) (15,072,770) Other No guarantees have been entered into by the parent entity in relation to its subsidiaries. Refer to Note 22 for details of contingent assets and liabilities. 18. SHARE-BASED PAYMENTS Recognised share-based payment expense From time to time, the Group grants unlisted options (“Options”), performance rights (“Rights”), and restricted stock units (“RSUs”) to officers, employees, consultants and other key advisors as part of remuneration and incentive arrangements. The number of Options, Rights, and RSUs granted, and the terms of the options or rights granted are determined by the Board. Shareholder approval is sought where required. In the prior 2021 financial period, the Group determined that the deemed consideration in respect of the reverse acquisition of the Company by HMAPL represented a share-based payment in accordance with AASB 2. The Group determined the fair value of the deemed consideration to be US$7,055,446, of which US$1,914,320 of this was allocated to the fair value of the net assets acquired and US$5,141,126 was recognised as a share-based expense in the statement of profit and loss for the period, representing the cost of the listing. See Note 15 for further details. During fiscal 2022 and fiscal 2021, the following equity-settled share-based payments have been recognised: IperionX Limited ANNUAL REPORT 2022 48 2022 US$ July 20, 2020 to June 30, 2021 US$ Expense arising from staff remuneration arrangements (8,340,328) (4,084,764) Expense arising from cost of listing on reverse acquisition - (5,141,126) Total expense arising from equity-settled share-based payment transactions (8,340,328) (9,225,890)
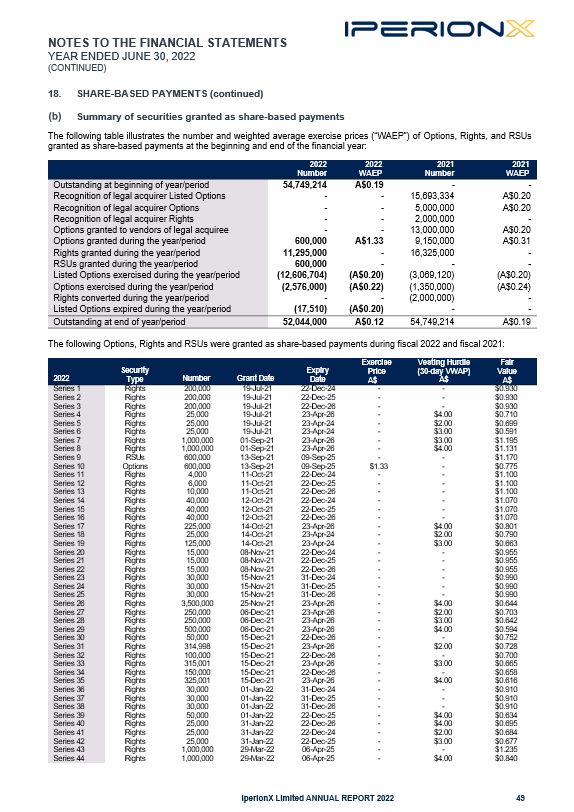
NOTES TO THE FINANCIAL STATEMENTS YEAR ENDED JUNE 30, 2022 (CONTINUED) 18. SHARE-BASED PAYMENTS (continued) Summary of securities granted as share-based payments The following table illustrates the number and weighted average exercise prices (“WAEP”) of Options, Rights, and RSUs granted as share-based payments at the beginning and end of the financial year: IperionX Limited ANNUAL REPORT 2022 49 2022 Number 2022 WAEP 2021 Number 2021 WAEP Outstanding at beginning of year/period 54,749,214 A$0.19 - - Recognition of legal acquirer Listed Options - - 15,693,334 A$0.20 Recognition of legal acquirer Options - - 5,000,000 A$0.20 Recognition of legal acquirer Rights - - 2,000,000 - Options granted to vendors of legal acquiree - - 13,000,000 A$0.20 Options granted during the year/period 600,000 A$1.33 9,150,000 A$0.31 Rights granted during the year/period 11,295,000 - 16,325,000 - RSUs granted during the year/period 600,000 - - - Listed Options exercised during the year/period (12,606,704) (A$0.20) (3,069,120) (A$0.20) Options exercised during the year/period (2,576,000) (A$0.22) (1,350,000) (A$0.24) Rights converted during the year/period - - (2,000,000) - Listed Options expired during the year/period (17,510) (A$0.20) - - Outstanding at end of year/period 52,044,000 A$0.12 54,749,214 A$0.19 The following Options, Rights and RSUs were granted as share-based payments during fiscal 2022 and fiscal 2021: 2022 Security Type Number Grant Date Expiry Date Exercise Price A$ Vesting Hurdle (30-day VWAP) A$ Fair Value A$ Series 1 Rights 200,000 19-Jul-21 22-Dec-24 - - $0.930 Series 2 Rights 200,000 19-Jul-21 22-Dec-25 - - $0.930 Series 3 Rights 200,000 19-Jul-21 22-Dec-26 - - $0.930 Series 4 Rights 25,000 19-Jul-21 23-Apr-26 - $4.00 $0.710 Series 5 Rights 25,000 19-Jul-21 23-Apr-24 - $2.00 $0.699 Series 6 Rights 25,000 19-Jul-21 23-Apr-24 - $3.00 $0.591 Series 7 Rights 1,000,000 01-Sep-21 23-Apr-26 - $3.00 $1.195 Series 8 Rights 1,000,000 01-Sep-21 23-Apr-26 - $4.00 $1.131 Series 9 RSUs 600,000 13-Sep-21 09-Sep-25 - - $1.170 Series 10 Options 600,000 13-Sep-21 09-Sep-25 $1.33 - $0.775 Series 11 Rights 4,000 11-Oct-21 22-Dec-24 - - $1.100 Series 12 Rights 6,000 11-Oct-21 22-Dec-25 - - $1.100 Series 13 Rights 10,000 11-Oct-21 22-Dec-26 - - $1.100 Series 14 Rights 40,000 12-Oct-21 22-Dec-24 - - $1.070 Series 15 Rights 40,000 12-Oct-21 22-Dec-25 - - $1.070 Series 16 Rights 40,000 12-Oct-21 22-Dec-26 - - $1.070 Series 17 Rights 225,000 14-Oct-21 23-Apr-26 - $4.00 $0.801 Series 18 Rights 25,000 14-Oct-21 23-Apr-24 - $2.00 $0.790 Series 19 Rights 125,000 14-Oct-21 23-Apr-24 - $3.00 $0.663 Series 20 Rights 15,000 08-Nov-21 22-Dec-24 - - $0.955 Series 21 Rights 15,000 08-Nov-21 22-Dec-25 - - $0.955 Series 22 Rights 15,000 08-Nov-21 22-Dec-26 - - $0.955 Series 23 Rights 30,000 15-Nov-21 31-Dec-24 - - $0.990 Series 24 Rights 30,000 15-Nov-21 31-Dec-25 - - $0.990 Series 25 Rights 30,000 15-Nov-21 31-Dec-26 - - $0.990 Series 26 Rights 3,500,000 25-Nov-21 23-Apr-26 - $4.00 $0.644 Series 27 Rights 250,000 06-Dec-21 23-Apr-26 - $2.00 $0.703 Series 28 Rights 250,000 06-Dec-21 23-Apr-26 - $3.00 $0.642 Series 29 Rights 500,000 06-Dec-21 23-Apr-26 - $4.00 $0.594 Series 30 Rights 50,000 15-Dec-21 22-Dec-26 - - $0.752 Series 31 Rights 314,998 15-Dec-21 23-Apr-26 - $2.00 $0.728 Series 32 Rights 100,000 15-Dec-21 22-Dec-26 - - $0.700 Series 33 Rights 315,001 15-Dec-21 23-Apr-26 - $3.00 $0.665 Series 34 Rights 150,000 15-Dec-21 22-Dec-26 - - $0.658 Series 35 Rights 325,001 15-Dec-21 23-Apr-26 - $4.00 $0.616 Series 36 Rights 30,000 01-Jan-22 31-Dec-24 - - $0.910 Series 37 Rights 30,000 01-Jan-22 31-Dec-25 - - $0.910 Series 38 Rights 30,000 01-Jan-22 31-Dec-26 - - $0.910 Series 39 Rights 50,000 01-Jan-22 22-Dec-25 - $4.00 $0.634 Series 40 Rights 25,000 31-Jan-22 22-Dec-26 - $4.00 $0.695 Series 41 Rights 25,000 31-Jan-22 22-Dec-24 - $2.00 $0.684 Series 42 Rights 25,000 31-Jan-22 22-Dec-25 - $3.00 $0.677 Series 43 Rights 1,000,000 29-Mar-22 06-Apr-25 - - $1.235 Series 44 Rights 1,000,000 29-Mar-22 06-Apr-25 - $4.00 $0.840
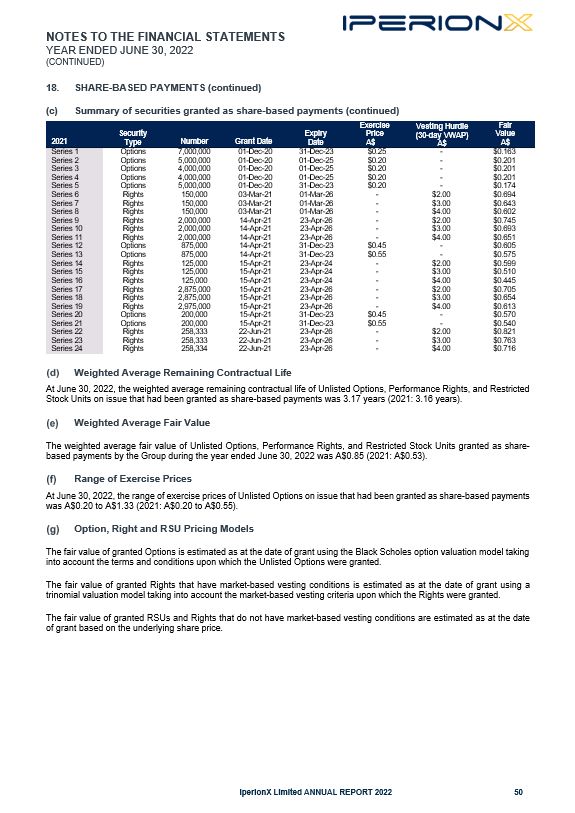
NOTES TO THE FINANCIAL STATEMENTS YEAR ENDED JUNE 30, 2022 (CONTINUED) 18. SHARE-BASED PAYMENTS (continued) (c) Summary of securities granted as share-based payments (continued) 2021 Security Type Number Grant Date Expiry Date Exercise Price A$ Vesting Hurdle (30-day VWAP) A$ Fair Value A$ Series 1 Options 7,000,000 01-Dec-20 31-Dec-23 $0.25 - $0.163 Series 2 Options 5,000,000 01-Dec-20 01-Dec-25 $0.20 - $0.201 Series 3 Options 4,000,000 01-Dec-20 01-Dec-25 $0.20 - $0.201 Series 4 Options 4,000,000 01-Dec-20 01-Dec-25 $0.20 - $0.201 Series 5 Options 5,000,000 01-Dec-20 31-Dec-23 $0.20 - $0.174 Series 6 Rights 150,000 03-Mar-21 01-Mar-26 - $2.00 $0.694 Series 7 Rights 150,000 03-Mar-21 01-Mar-26 - $3.00 $0.643 Series 8 Rights 150,000 03-Mar-21 01-Mar-26 - $4.00 $0.602 Series 9 Rights 2,000,000 14-Apr-21 23-Apr-26 - $2.00 $0.745 Series 10 Rights 2,000,000 14-Apr-21 23-Apr-26 - $3.00 $0.693 Series 11 Rights 2,000,000 14-Apr-21 23-Apr-26 - $4.00 $0.651 Series 12 Options 875,000 14-Apr-21 31-Dec-23 $0.45 - $0.605 Series 13 Options 875,000 14-Apr-21 31-Dec-23 $0.55 - $0.575 Series 14 Rights 125,000 15-Apr-21 23-Apr-24 - $2.00 $0.599 Series 15 Rights 125,000 15-Apr-21 23-Apr-24 - $3.00 $0.510 Series 16 Rights 125,000 15-Apr-21 23-Apr-24 - $4.00 $0.445 Series 17 Rights 2,875,000 15-Apr-21 23-Apr-26 - $2.00 $0.705 Series 18 Rights 2,875,000 15-Apr-21 23-Apr-26 - $3.00 $0.654 Series 19 Rights 2,975,000 15-Apr-21 23-Apr-26 - $4.00 $0.613 Series 20 Options 200,000 15-Apr-21 31-Dec-23 $0.45 - $0.570 Series 21 Options 200,000 15-Apr-21 31-Dec-23 $0.55 - $0.540 Series 22 Rights 258,333 22-Jun-21 23-Apr-26 - $2.00 $0.821 Series 23 Rights 258,333 22-Jun-21 23-Apr-26 - $3.00 $0.763 Series 24 Rights 258,334 22-Jun-21 23-Apr-26 - $4.00 $0.716 Weighted Average Remaining Contractual Life At June 30, 2022, the weighted average remaining contractual life of Unlisted Options, Performance Rights, and Restricted Stock Units on issue that had been granted as share-based payments was 3.17 years (2021: 3.16 years). Weighted Average Fair Value The weighted average fair value of Unlisted Options, Performance Rights, and Restricted Stock Units granted as share- based payments by the Group during the year ended June 30, 2022 was A$0.85 (2021: A$0.53). Range of Exercise Prices At June 30, 2022, the range of exercise prices of Unlisted Options on issue that had been granted as share-based payments was A$0.20 to A$1.33 (2021: A$0.20 to A$0.55). Option, Right and RSU Pricing Models The fair value of granted Options is estimated as at the date of grant using the Black Scholes option valuation model taking into account the terms and conditions upon which the Unlisted Options were granted. The fair value of granted Rights that have market-based vesting conditions is estimated as at the date of grant using a trinomial valuation model taking into account the market-based vesting criteria upon which the Rights were granted. The fair value of granted RSUs and Rights that do not have market-based vesting conditions are estimated as at the date of grant based on the underlying share price. IperionX Limited ANNUAL REPORT 2022 50

NOTES TO THE FINANCIAL STATEMENTS YEAR ENDED JUNE 30, 2022 (CONTINUED) 18. SHARE-BASED PAYMENTS (continued) (h) Option, Right and RSU Pricing Models (continued) The tables below list the inputs to the valuation models used for Options, Rights, and RSUs granted by the Group during fiscal 2022 and fiscal 2021: 2022 2021 Options RSUs and Rights that don’t have market-based vesting conditions Rights that have market- based vesting conditions Options RSUs and Rights that don’t have market-based vesting conditions Rights that have market- based vesting conditions Fair value at grant date (weighted average) A$0.775 A$1.115 A$0.784 A$0.217 - A$0.673 Share price at grant date (weighted average) A$1.170 A$1.115 A$1.022 A$1.008 - A$0.931 Vesting hurdle (30-day VWAP) (weighted average) - - A$3.65 - - A$3.01 Exercise price (weighted average) A$1.33 - - A$0.24 - - Expected life (weighted average) (1) 3.99 years 3.74 years 4.28 years 5.08 years - 4.57 years Risk-free interest rate (weighted average) 0.175% 1.250% 1.317% 1.20% - 1.266% Expected volatility (weighted average) (2) 100% 100% 100% 100% - 100% Expected dividend yield (3) - - - - - - Notes: (1) (2) (3) The expected life is based on the expiry date of the options or rights. The expected volatility reflects the assumption that the historical volatility is indicative of future trends, which may not necessarily be the actual outcome. The dividend yield reflects the assumption that the current dividend payout will remain unchanged. 19. AUDITORS' REMUNERATION 2022 July 20, 2020 to June 30, 2021 US$ US$ PwC and related network firms: Audit or review of financial reports – Group 561,970 103,058 Other services - - BDO and related network firms: Audit or review of financial reports – Group - 10,947 Other services – tax compliance and corporate finance 13,645 7,920 575,615 121,925 On July 12, 2021, the Company announced that PricewaterhouseCoopers (“PwC”) was appointed as auditor of the Company following the resignation of BDO Audit (WA) Pty Ltd (“BDO”) and ASIC’s consent to the resignation in accordance with section 329(5) of the Corporations Act 2001. 20. SEGMENT INFORMATION AASB 8 requires operating segments to be identified on the basis of internal reports about components of the Consolidated Entity that are regularly reviewed by the chief operating decision maker in order to allocate resources to the segment and to assess its performance. The Consolidated Entity operates in one segment, being metal and mineral exploration and evaluation in the United States of America. Reconciliation of non-current assets by geographical location IperionX Limited ANNUAL REPORT 2022 51 2022 2021 US$ US$ United States of America 3,819,215 1,044,369 3,819,215 1,044,369

NOTES TO THE FINANCIAL STATEMENTS YEAR ENDED JUNE 30, 2022 (CONTINUED) 21. FINANCIAL RISK MANAGEMENT OBJECTIVES AND POLICIES Overview The Group's principal financial instruments comprise cash, receivables, other financial assets, payables, loans and borrowings, and lease liabilities. The main risks arising from the Group's financial instruments are interest rate risk, foreign currency risk, credit risk and liquidity risk. This note presents information about the Group's exposure to each of the above risks, its objectives, policies and processes for measuring and managing risk, and the management of capital. The Group manages its exposure to key financial risks in accordance with the Group's financial risk management policy. Key risks are monitored and reviewed as circumstances change and policies are revised as required. The overall objective of the Group's financial risk management policy is to support the delivery of the Group's financial targets whilst protecting future financial security. Given the nature and size of the business and uncertainty as to the timing and amount of cash inflows and outflows, the Group does not enter into derivative transactions to mitigate the financial risks. In addition, the Group's policy is that no trading in financial instruments shall be undertaken for the purposes of making speculative gains. As the Group's operations change, the Directors will review this policy periodically going forward. The Board of Directors has overall responsibility for the establishment and oversight of the risk management framework. The Board reviews and agrees policies for managing the Group's financial risks as summarised below. Credit Risk Credit risk is the risk of financial loss to the Group if a customer or counterparty to a financial instrument fails to meet its contractual obligations. This arises principally from cash and cash equivalents, receivables, and other financial assets. There are no significant concentrations of credit risk within the Group. The carrying amount of the Group's financial assets represents the maximum credit risk exposure, as represented below: 2022 2021 Note US$ US$ Cash and cash equivalents 5 5,672,551 1,697,904 Trade and other receivables 22,540 341 Other financial assets 250,000 - 5,945,091 1,698,245 With respect to credit risk arising from cash and cash equivalents, the Group’s exposure arises from default of the counter party, with a maximum exposure equal to the carrying amount of these instruments. Trade and other receivables comprise primarily deposits, accrued interest and GST refunds due. Where possible the Group trades only with recognised, creditworthy third parties. It is the Group’s policy that all customers who wish to trade on credit terms are subject to credit verification procedures. In addition, receivable balances are monitored on an ongoing basis with the result that the Group’s exposure to bad debts is not significant. At June 30, 2022 none of the Group’s receivables are past due. Liquidity Risk Liquidity risk is the risk that the Group will not be able to meet its financial obligations as they fall due. The Board’s approach to managing liquidity is to ensure, as far as possible, that the Group will always have sufficient liquidity to meet its liabilities when due. At June 30, 2022, the Group had sufficient liquid assets to meet its financial obligations. The Group has complied with all financial covenants during the 2022 and 2021 financial periods, as the Group’s lease liabilities and other loans and borrowings do not impose any financial covenants other than the security interests in the leased assets that are held by the lessor. Leased assets may not be used as security for borrowing purposes. The contractual maturities of financial liabilities, including estimated interest payments, are provided below. There are no netting arrangements in respect of financial liabilities. IperionX Limited ANNUAL REPORT 2022 52

NOTES TO THE FINANCIAL STATEMENTS YEAR ENDED JUNE 30, 2022 (CONTINUED) 21. FINANCIAL RISK MANAGEMENT OBJECTIVES AND POLICIES (continued) Liquidity Risk (continued) ≤1 year 1-5 years ≥5 years Total contractual cash flows Carrying amount of liabilities US$ US$ US$ US$ US$ 2022 Financial liabilities Trade and other payables 1,899,348 - - 1,899,348 1,899,348 Lease liabilities 167,619 421,142 - 588,761 506,573 Other loans and borrowings 7,811 31,242 4,556 43,609 36,457 2,074,778 452,384 4,556 2,531,718 2,442,378 2021 Financial liabilities Trade and other payables 544,842 - - 544,842 544,842 Lease liabilities 115,067 461,903 - 576,970 475,652 659,909 461,903 - 1,121,812 1,020,494 Interest Rate Risk The Group’s exposure to the risk of changes in market interest rates relates primarily to the cash and short-term deposits with a floating interest rate. These financial assets with variable rates expose the Group to cash flow interest rate risk. All other financial assets and liabilities are either non-interest bearing (for example, receivables and payables) or have fixed interest rates (for example, lease liabilities, sub-lease receivables, and loans and borrowings). At the reporting date, the interest rate profile of the Group’s interest-bearing financial instruments was: IperionX Limited ANNUAL REPORT 2022 53 2022 2021 Note US$ US$ Interest-bearing financial instruments Cash at bank and on hand 5 5,672,551 1,697,904 5,672,551 1,697,904 The Group's cash at bank and on hand and short-term deposits had a weighted average floating interest rate at year end of 0.31% (2021: 0.25%). The Group currently does not engage in any hedging or derivative transactions to manage interest rate risk. Interest rate sensitivity A sensitivity of 0.5% (50 basis points) has been selected as this is considered reasonable given the current level of both short term and long-term interest rates. A 0.5% (50 basis points) movement in interest rates at the reporting date would have increased (decreased) equity and profit or loss by the amounts shown below. This analysis assumes that all other variables, in particular foreign currency rates, remain constant. Profit or loss Equity +0.5% US$ -0.5% US$ +0.5% US$ -0.5% US$ 2022 Cash and cash equivalents 28,363 (28,363) 28,363 (28,363) 2021 Cash and cash equivalents 8,490 (8,490) 8,490 (8,490)

NOTES TO THE FINANCIAL STATEMENTS YEAR ENDED JUNE 30, 2022 (CONTINUED) 21. FINANCIAL RISK MANAGEMENT OBJECTIVES AND POLICIES (continued) Foreign Currency Risk Foreign currency risk is the risk that the fair value of future cash outflows of an exposure will fluctuate because of changes in foreign currency exchange rates. The Group’s exposure to the risk of changes in foreign exchange rate relates primarily to assets and liabilities that are denominated in currencies other than the functional currency of the group entity. The Company’s functional currency is Australian dollars. The financial statements are presented in United States dollars which is the Group's presentation currency. The Group also has transactional currency exposures relating to transactions denominated in currencies other than the functional currency of the entity. It is the Group’s policy not to enter into any hedging or derivative transactions to manage foreign currency risk. At the reporting date, the Group’s exposure to financial instruments denominated in currencies other than the functional currency of the group entity: Assets and liabilities denominated in currencies other than the functional currency of the group entity 2022 US$ Equivalent 2021 US$ Equivalent Financial assets Cash and cash equivalents 2,040,266 - Financial liabilities Trade and other payables (438,282) - Net exposure 1,601,984 - Foreign exchange rate sensitivity At the reporting date, had the US$ appreciated or depreciated against the $A, as illustrated in the table below, profit or loss and equity would have been affected by the amounts shown below. This analysis assumes that all other variables remain constant. Profit or loss Equity +10% US$ -10% US$ +10% US$ -10% US$ 2022 Group 160,198 (160,198) 160,198 (160,198) 2021 Group - - - - Commodity Price Risk The Group is exposed to commodity price risk. These commodity prices can be volatile and are influenced by factors beyond the Group's control. As the Group is currently engaged in exploration and development activities, no sales of commodities are forecast for the next 12 months, and accordingly, no hedging or derivative transactions have been used to manage commodity price risk. IperionX Limited ANNUAL REPORT 2022 54
NOTES TO THE FINANCIAL STATEMENTS YEAR ENDED JUNE 30, 2022 (CONTINUED) FINANCIAL RISK MANAGEMENT OBJECTIVES AND POLICIES (continued) Capital Management The Board's policy is to maintain a strong capital base so as to maintain investor, creditor and market confidence and to sustain future development of the business. Given the stage of development of the Group, the Board's objective is to minimise debt and to raise funds as required through the issue of new shares. The Group is not subject to externally imposed capital requirements. There were no changes in the Group's approach to capital management during the year. Fair Value The fair value of financial assets and financial liabilities approximates their carrying value. The methods for estimating fair value are outlined in the relevant notes to the financial statements. CONTINGENT ASSETS AND LIABILITIES Titan Project At June 30, 2022, the Group had entered into exclusive option agreements with local landowners in Tennessee, United States, in relation to its Titan Project, which upon exercise, allows the Group to lease or, in some cases purchase, approximately 10,618 acres of surface property and the associated mineral rights from the local landowners. During the option period, our option agreements provide us with exclusive right to access, enter, occupy and use the surface property for all purposes related to exploring for and evaluating all minerals in return for making annual option payments and bonus payments during periods when we conduct drilling. Upon exercise, in the case of an option to lease, the Company will pay a production royalty to the landowners, subject to a minimum royalty. Upon exercise, in the case of a purchase, the Company will pay cash consideration approximating the fair market value of the property, excluding the value of any minerals, plus a premium. Blacksand At June 30, 2022, the Group had an exclusive option to purchase 100% of the ownership interests of Blacksand Technology, LLC (“Blacksand”). Blacksand holds the exclusive commercial licensing rights for more than forty global patents through a license agreement with the University of Utah including the global patents for patented technologies that can produce low- cost and low-carbon titanium metal. If IperionX chooses to exercise its option, IperionX will: (i) pay US$12,000,000 to Blacksand and its members, of which the Company can elect to pay an amount (between 22.5% to 30%) in shares of the Company subject to IperionX obtaining shareholder approval (based on a share price equal to 75% of the 10-day VWAP of IperionX shares on ASX immediately preceding the closing date, subject to a floor of A$0.85 and a ceiling of A$3.00); (ii) commit to invest US$1,000,000 over a 3 year period towards the establishment of an endowed chair professorship at the University of Utah, which shall be used to support research and development related to Blacksand and IperionX, and other related technologies in the field of titanium, critical metals, and minerals; and (iii) pay the Blacksand members a royalty equal to 0.5% of cumulative net sales that relate to Blacksand assets or properties above US$300,000,000. The option period terminates upon the earliest to occur of (i) the closing of the purchase of Blacksand, (ii) termination of the existing Blacksand research agreements, (iii) December 31, 2022, or (iv) the termination of the Blacksand option agreement. If IperionX chooses not to exercise its option, the existing Blacksand research agreements will continue which provide IperionX with options to enter into license agreements with Blacksand over a suite of patented technologies that can produce low-cost and low- carbon titanium metal. EVENTS SUBSEQUENT TO BALANCE DATE As at the date of this report there are no other matters or circumstances which have arisen since June 30, 2022 that have significantly affected or may significantly affect: the operations, in financial years subsequent to June 30, 2022, of the Group; the results of those operations, in financial years subsequent to June 30, 2022, of the Group; or the state of affairs, in financial years subsequent to June 30, 2022, of the Group. IperionX Limited ANNUAL REPORT 2022 55

DIRECTORS’ DECLARATION In accordance with a resolution of the directors of IperionX Limited: In the opinion of the directors: the attached financial statements, notes and the additional disclosures included in the directors' report designated as audited, are in accordance with the Corporations Act 2001, including: compliance with accounting standards and Corporations Regulations 2001; and (ii) giving a true and fair view of the financial position as at June 30, 2022 and of the performance for the financial year ended on that date of the Group; and (b) there are reasonable grounds to believe that the Company will be able to pay its debts as and when they become due and payable. 2. The attached financial statements are in compliance with International Financial Reporting Standards, as stated in note 1 to the financial statements. 3. The Directors have been given a declaration required by section 295A of the Corporations Act 2001 for the financial year ended June 30, 2022. On behalf of the Board ANASTASIOS ARIMA CEO and Managing Director August 26, 2022 IperionX Limited ANNUAL REPORT 2022 56

INDEPENDENT AUDITOR'S REPORT TO THE MEMBERS OF IPERIONX LIMITED IperionX Limited ANNUAL REPORT 2022 57
INDEPENDENT AUDITOR'S REPORT TO THE MEMBERS OF IPERIONX LIMITED (CONTINUED) IperionX Limited ANNUAL REPORT 2022 58
INDEPENDENT AUDITOR'S REPORT TO THE MEMBERS OF IPERIONX LIMITED (CONTINUED) IperionX Limited ANNUAL REPORT 2022 59
INDEPENDENT AUDITOR'S REPORT TO THE MEMBERS OF IPERIONX LIMITED (CONTINUED) IperionX Limited ANNUAL REPORT 2022 60

INDEPENDENT AUDITOR'S REPORT TO THE MEMBERS OF IPERIONX LIMITED (CONTINUED) IperionX Limited ANNUAL REPORT 2022 61
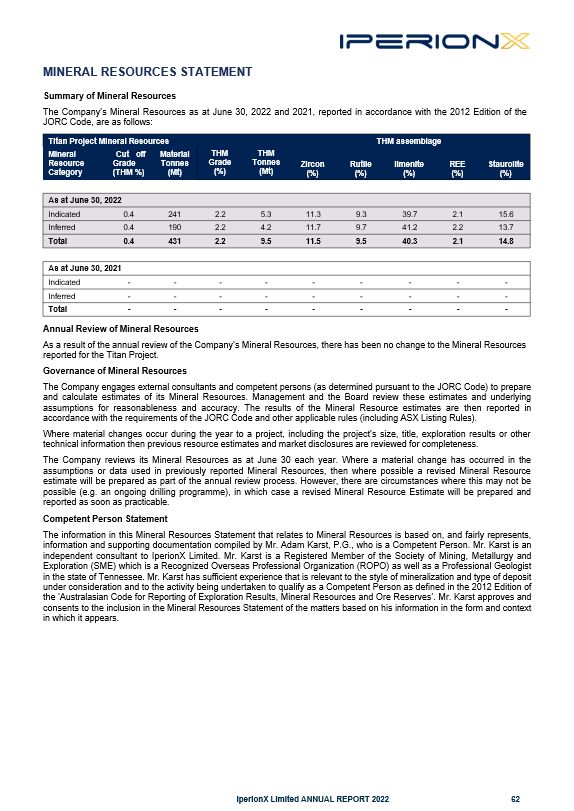
MINERAL RESOURCES STATEMENT Summary of Mineral Resources The Company’s Mineral Resources as at June 30, 2022 and 2021, reported in accordance with the 2012 Edition of the JORC Code, are as follows: IperionX Limited ANNUAL REPORT 2022 62 Titan Project Mineral Resources THM assemblage Mineral Resource Category Cut off Grade (THM %) Material Tonnes (Mt) THM Grade (%) THM Tonnes (Mt) Zircon (%) Rutile (%) Ilmenite (%) REE (%) Staurolite (%) As at June 30, 2022 Indicated 0.4 241 2.2 5.3 11.3 9.3 39.7 2.1 15.6 Inferred 0.4 190 2.2 4.2 11.7 9.7 41.2 2.2 13.7 Total 0.4 431 2.2 9.5 11.5 9.5 40.3 2.1 14.8 As at June 30, 2021 Indicated - - - - - - - - - Inferred - - - - - - - - - Total - - - - - - - - - Annual Review of Mineral Resources As a result of the annual review of the Company’s Mineral Resources, there has been no change to the Mineral Resources reported for the Titan Project. Governance of Mineral Resources The Company engages external consultants and competent persons (as determined pursuant to the JORC Code) to prepare and calculate estimates of its Mineral Resources. Management and the Board review these estimates and underlying assumptions for reasonableness and accuracy. The results of the Mineral Resource estimates are then reported in accordance with the requirements of the JORC Code and other applicable rules (including ASX Listing Rules). Where material changes occur during the year to a project, including the project’s size, title, exploration results or other technical information then previous resource estimates and market disclosures are reviewed for completeness. The Company reviews its Mineral Resources as at June 30 each year. Where a material change has occurred in the assumptions or data used in previously reported Mineral Resources, then where possible a revised Mineral Resource estimate will be prepared as part of the annual review process. However, there are circumstances where this may not be possible (e.g. an ongoing drilling programme), in which case a revised Mineral Resource Estimate will be prepared and reported as soon as practicable. Competent Person Statement The information in this Mineral Resources Statement that relates to Mineral Resources is based on, and fairly represents, information and supporting documentation compiled by Mr. Adam Karst, P.G., who is a Competent Person. Mr. Karst is an independent consultant to IperionX Limited. Mr. Karst is a Registered Member of the Society of Mining, Metallurgy and Exploration (SME) which is a Recognized Overseas Professional Organization (ROPO) as well as a Professional Geologist in the state of Tennessee. Mr. Karst has sufficient experience that is relevant to the style of mineralization and type of deposit under consideration and to the activity being undertaken to qualify as a Competent Person as defined in the 2012 Edition of the ‘Australasian Code for Reporting of Exploration Results, Mineral Resources and Ore Reserves’. Mr. Karst approves and consents to the inclusion in the Mineral Resources Statement of the matters based on his information in the form and context in which it appears.
CORPORATE GOVERNANCE IperionX Limited (IperionX or Company) and the entities it controls believe corporate governance is important for the Company in conducting its business activities. The Board of IperionX has adopted a suite of charters and key corporate governance documents which articulate the policies and procedures followed by the Company. These documents are available in the Corporate Governance section of the Company’s website, www.iperionx.com. These documents are reviewed at least annually to address any changes in governance practices and the law. The Company’s Corporate Governance Statement 2022, which explains how IperionX complies with the ASX Corporate Governance Council’s ‘Corporate Governance Principles and Recommendations – 4th Edition’ in relation to the year ended June 30, 2022, is available in the Corporate Governance section of the Company’s website, www.IperionX.com and will be lodged with ASX together with an Appendix 4G at the same time that this Annual Report is lodged with ASX. In addition to the ASX Corporate Governance Council’s ‘Corporate Governance Principles and Recommendations – 4th Edition’ the Board has taken into account a number of important factors in determining its corporate governance policies and procedures, including the: IperionX Limited ANNUAL REPORT 2022 63 • • • • • • • relatively simple operations of the Company, which currently only undertakes mineral exploration and development activities; cost verses benefit of additional corporate governance requirements or processes; size of the Board; Board’s experience in the resources sector; organisational reporting structure and number of reporting functions, operational divisions and employees; relatively simple financial affairs with limited complexity and quantum; relatively small market capitalisation and economic value of the entity; and direct shareholder feedback.
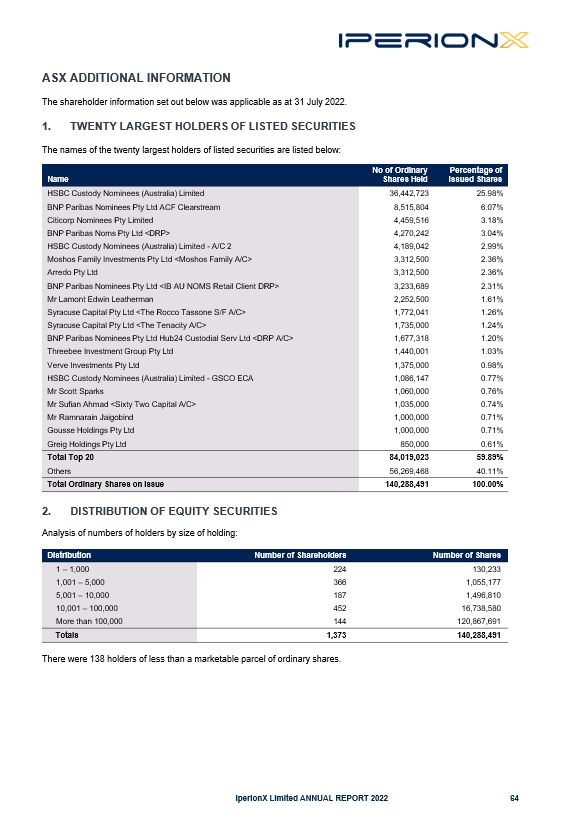
ASX ADDITIONAL INFORMATION The shareholder information set out below was applicable as at 31 July 2022. 1. TWENTY LARGEST HOLDERS OF LISTED SECURITIES The names of the twenty largest holders of listed securities are listed below: IperionX Limited ANNUAL REPORT 2022 64 Name No of Ordinary Shares Held Percentage of Issued Shares HSBC Custody Nominees (Australia) Limited 36,442,723 25.98% BNP Paribas Nominees Pty Ltd ACF Clearstream 8,515,804 6.07% Citicorp Nominees Pty Limited 4,459,516 3.18% BNP Paribas Noms Pty Ltd <DRP> 4,270,242 3.04% HSBC Custody Nominees (Australia) Limited - A/C 2 4,189,042 2.99% Moshos Family Investments Pty Ltd <Moshos Family A/C> 3,312,500 2.36% Arredo Pty Ltd 3,312,500 2.36% BNP Paribas Nominees Pty Ltd <IB AU NOMS Retail Client DRP> 3,233,689 2.31% Mr Lamont Edwin Leatherman 2,252,500 1.61% Syracuse Capital Pty Ltd <The Rocco Tassone S/F A/C> 1,772,041 1.26% Syracuse Capital Pty Ltd <The Tenacity A/C> 1,735,000 1.24% BNP Paribas Nominees Pty Ltd Hub24 Custodial Serv Ltd <DRP A/C> 1,677,318 1.20% Threebee Investment Group Pty Ltd 1,440,001 1.03% Verve Investments Pty Ltd 1,375,000 0.98% HSBC Custody Nominees (Australia) Limited - GSCO ECA 1,086,147 0.77% Mr Scott Sparks 1,060,000 0.76% Mr Sufian Ahmad <Sixty Two Capital A/C> 1,035,000 0.74% Mr Ramnarain Jaigobind 1,000,000 0.71% Gousse Holdings Pty Ltd 1,000,000 0.71% Greig Holdings Pty Ltd 850,000 0.61% Total Top 20 84,019,023 59.89% Others 56,269,468 40.11% Total Ordinary Shares on Issue 140,288,491 100.00% 2. DISTRIBUTION OF EQUITY SECURITIES Analysis of numbers of holders by size of holding: Distribution Number of Shareholders Number of Shares 1 – 1,000 224 130,233 1,001 – 5,000 366 1,055,177 5,001 – 10,000 187 1,496,810 10,001 – 100,000 452 16,738,580 More than 100,000 144 120,867,691 Totals 1,373 140,288,491 There were 138 holders of less than a marketable parcel of ordinary shares.
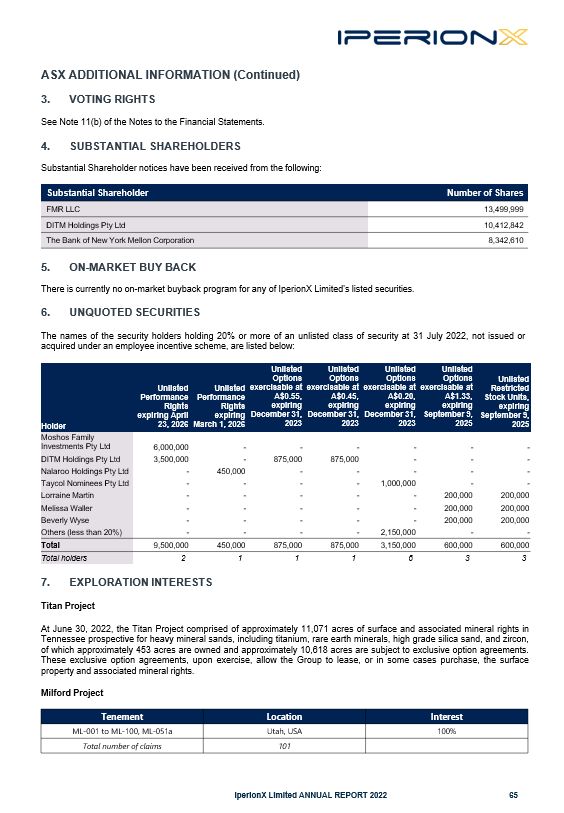
ASX ADDITIONAL INFORMATION (Continued) VOTING RIGHTS See Note 11(b) of the Notes to the Financial Statements. SUBSTANTIAL SHAREHOLDERS Substantial Shareholder notices have been received from the following: IperionX Limited ANNUAL REPORT 2022 65 Substantial Shareholder Number of Shares FMR LLC 13,499,999 DITM Holdings Pty Ltd 10,412,842 The Bank of New York Mellon Corporation 8,342,610 ON-MARKET BUY BACK There is currently no on-market buyback program for any of IperionX Limited's listed securities. UNQUOTED SECURITIES The names of the security holders holding 20% or more of an unlisted class of security at 31 July 2022, not issued or acquired under an employee incentive scheme, are listed below: Holder Unlisted Performance Rights expiring April 23, 2026 Unlisted Performance Rights expiring March 1, 2026 Unlisted Options exercisable at A$0.55, expiring December 31, 2023 Unlisted Options exercisable at A$0.45, expiring December 31, 2023 Unlisted Options exercisable at A$0.20, expiring December 31, 2023 Unlisted Options exercisable at A$1.33, expiring September 9, 2025 Unlisted Restricted Stock Units, expiring September 9, 2025 Moshos Family Investments Pty Ltd 6,000,000 - - - - - - DITM Holdings Pty Ltd 3,500,000 - 875,000 875,000 - - - Nalaroo Holdings Pty Ltd - 450,000 - - - - - Taycol Nominees Pty Ltd - - - - 1,000,000 - - Lorraine Martin - - - - - 200,000 200,000 Melissa Waller - - - - - 200,000 200,000 Beverly Wyse - - - - - 200,000 200,000 Others (less than 20%) - - - - 2,150,000 - - Total 9,500,000 450,000 875,000 875,000 3,150,000 600,000 600,000 Total holders 2 1 1 1 6 3 3 7. EXPLORATION INTERESTS Titan Project At June 30, 2022, the Titan Project comprised of approximately 11,071 acres of surface and associated mineral rights in Tennessee prospective for heavy mineral sands, including titanium, rare earth minerals, high grade silica sand, and zircon, of which approximately 453 acres are owned and approximately 10,618 acres are subject to exclusive option agreements. These exclusive option agreements, upon exercise, allow the Group to lease, or in some cases purchase, the surface property and associated mineral rights. Milford Project Tenement Location Interest ML-001 to ML-100, ML-051a Utah, USA 100% Total number of claims 101

ASX ADDITIONAL INFORMATION (Continued) COMPETENT PERSON STATEMENT The information in this document that relates to Exploration Results, Mineral Resources, Production Targets, Process Design, Mine Design, Cost Estimates, and Financial Analysis is extracted from IperionX’s ASX Announcement dated June 30, 2022 (“Original ASX Announcement”) which is available to view at IperionX’s website at www.iperionx.com. The Company confirms that a) it is not aware of any new information or data that materially affects the information included in the Original ASX Announcement; b) all material assumptions and technical parameters underpinning the Production Target, and related forecast financial information derived from the Production Target included in the Original ASX Announcement continue to apply and have not materially changed; and c) the form and context in which the relevant Competent Persons’ findings are presented in this report have not been materially changed from the Original ASX Announcement. FORWARD LOOKING STATEMENTS This report may include forward-looking statements. These forward-looking statements are based on IperionX’s expectations and beliefs concerning future events. Forward looking statements are necessarily subject to risks, uncertainties and other factors, many of which are outside the control of IperionX, which could cause actual results to differ materially from such statements. IperionX makes no undertaking to subsequently update or revise the forward-looking statements made in this report, to reflect the circumstances or events after the date of that report. IperionX Limited ANNUAL REPORT 2022 66

www.iperionx.com