Free signup for more
- Track your favorite companies
- Receive email alerts for new filings
- Personalized dashboard of news and more
- Access all data and search results
Filing tables
Filing exhibits
NYAX similar filings
- 9 Aug 23 Nayax Reports Second Quarter 2023 Financial Results
- 26 Jul 23 Current report (foreign)
- 22 May 23 Nayax Announces New Leadership Positions
- 10 May 23 Current report (foreign) (amended)
- 10 May 23 Current report (foreign)
- 10 May 23 Nayax Reports First Quarter of 2023 Financial Results
- 1 Mar 23 Current report (foreign)
Filing view
External links
Exhibit 99.1

Nayax Q1 Earnings Presentation May 10, 2023

Important Disclosure This presentation is intended to provide general information only and is not, and should not be considered, as an offer to purchase or sell the Company’s securities, or a proposal to receive such offers. In addition, this presentation is not an offer to the public of the Company’s securities. By attending or viewing this presentation, each attendee (“Attendee”) agrees that he or she (i) has read this disclaimer, (ii) is bound by the restrictions set out herein, (iii) is permitted, in accordance with all applicable laws, to receive such information, (iv) is solely responsible for his or her own assessment of the business and financial position of the Company and (v) will conduct his or her own analysis and be solely responsible for forming the Attendee's view of the potential future performance of the Company’s business. The information in this presentation is provided for convenience only. It does not contain comprehensive information, but merely summary information in a condensed form. This presentation does not and is not intended to replace a careful inspection of the Company's Financial Statements and other public filings, as reported or will be reported to the Israeli Securities Authority and the Securities and Exchange Commission (the "Company's Reports"). In case of any inconsistencies between the information provided in this presentation and the Company's Reports, the latter will prevail. The information in this presentation is not a basis and should not be used as a basis for making any decisions in relation to the Company, including any decision to purchase securities of the Company. Any such decision should be based on the Company's Reports and following the receipt of appropriate professional advice. The information provided in this presentation is not, and should not be considered to be, a recommendation or an opinion of any kind in relation to an investment in the Company, whether legal, financial, tax, economic or otherwise. This presentation does not replace the need for a potential investor to collect and analyze further independent information for their due consideration. Every potential investor must obtain their own independent advice and guidance, in connection with a potential investment in the Company, including tax advice which takes into account the investor’s own tax position. This presentation includes projections, guidance, forecasts, estimates, assessments and other information pertaining to future events and/or matters, whose materialization is uncertain and is beyond the Company’s control, and which constitute forward looking statements (within the meaning of Section 27A of the Securities Act of 1933, as amended, Section 21E of the Securities Exchange Act of 1934, as amended, and the Israeli Securities Law, 5728-1968). Many of the forward-looking statements contained in this presentation can be identified by the use of forward-looking words such as “anticipate,” “believe,” “could,” “expect,” “should,” “plan,” “intend,” “estimate” and “potential,” among others. Forward-looking statements include, but are not limited to, expectations and evaluations relating to the Company’s business targets and strategy, the success of trials and the integration of the Company’s technology in various systems and industries, the advantages of the Company’s existing and future products, timetables regarding completion of the Company’s developments and the expected commencement of production, sales and distribution of the Company’s products and technology, the Company’s intentions in relation to various industries, the Company’s intentions in relation to the creation of collaborations and engagements in licensing agreements, production and distribution in various countries, and other statements regarding our intent, belief or current expectations. Forward-looking statements are based on our management’s beliefs and assumptions and on information currently available to our management. Such statements are subject to risks and uncertainties, and actual results may differ materially from those expressed or implied in the forward-looking statements due to of various factors, including, but not limited to: our expectations regarding general market conditions, including as a result of the COVID-19 pandemic and other global economic trends; changes in consumer tastes and preferences; fluctuations in inflation, interest rate and exchange rates in the global economic environment over the world; the availability of qualified personnel and the ability to retain such personnel; changes in commodity costs, labor, distribution and other operating costs; our ability to implement our growth strategy; changes in government regulation and tax matters; other factors that may affect our financial condition, liquidity and results of operations; general economic, political, demographic and business conditions in Israel; the success of operating initiatives, including advertising and promotional efforts and new product and concept development by us and our competitors; and other risk factors discussed under “Risk Factors” in our annual report on Form 20-F filed with the SEC on March 1, 2023 (our “Annual Report"). The preceding list is not intended to be an exhaustive list of all of our forward-looking statements. These statements are only estimates based upon our current expectations and projections about future events. There are important factors that could cause our actual results, levels of activity, performance or achievements to differ materially from the results, levels of activity, performance or achievements expressed or implied by the forward-looking statements. In particular, you should consider the risks provided under “Risk Factors” in our Annual Report. You should not rely upon forward-looking statements as predictions of future events. Although we believe that the expectations reflected in the forward-looking statements are reasonable, we cannot guarantee that future results, levels of activity, performance and events and circumstances reflected in the forward-looking statements will be achieved or will occur. Each forward-looking statement speaks only as of the date of the particular statement. Except as required by law, we undertake no obligation to update publicly any forward-looking statements for any reason, to conform these statements to actual results or to changes in our expectations. In addition, the presentation includes data published by various bodies, and data provided to the Company in the framework of cooperation engagements, concerning the industry, competitive position and the markets in which the Company operates, whose content was not independently verified by the Company, such that the Company is not responsible for the accuracy or completeness of such date or whether the data is up-to-date, and Company takes no responsibility for any reliance on the data. Management estimates contained in this presentation are derived from publicly available information released by independent industry analysts and other third-party sources, as well as data from the Company's internal research, and are based on assumptions made by the Company upon reviewing such data, and the Company's experience in, and knowledge of, such industry and markets, which the Company believes to be reasonable. In addition, projections, assumptions and estimates of the future performance of the industry in which the Company operates and the Company's future performance are necessarily subject to uncertainty and risk due to a variety of factors, including those described above. These and other factors could cause results to differ materially from those expressed in the estimates made by independent parties and by the Company. Industry publications, research, surveys and studies generally state that the information they contain has been obtained from sources believed to be reliable, but that the accuracy and completeness of such information is not guaranteed. Forecasts and other forward-looking information obtained from these sources are subject to the same qualifications and uncertainties as the other forward-looking statements in this presentation. In addition to various operational metrics and financial measures in accordance with accounting principles generally accepted under International Financial Reporting Standards, or IFRS, this presentation contains Adjusted EBITDA, a non-IFRS financial measure, as a measure to evaluate our past results and future prospects. Please refer to the Appendix for a definition of Adjusted EBITDA and for a reconciliation of Adjusted EBITDA to net income (loss). The Company does not confirm or undertake that the information appearing in this presentation is complete or accurate. The Company, its employees, officers and its shareholders will not be responsible for damages and/or losses which may arise as a result of the use of the information contained in this presentation. The Company is not responsible for any changes to the economic, financial or legal situation relating to the Company and its business. The Company does not undertake to update and/or change forecasts and/or evaluations included in the presentation in order that they will reflect events and/or circumstances which apply after the date of the presentation’s preparations. No persons have been authorized to make any representations regarding the information contained in this presentation, and if given or made, such representations should not be considered as authorized. The content of this presentation does not bind the Company or its managers and they have the right to change any item described in the presentation relating to the Company, at their sole discretion. The Company and its licensors have proprietary rights to trademarks used in this Presentation. Solely for convenience, trademarks and trade names referred to in this Presentation may appear without the “®” or “™” symbols, but the lack of such references is not intended to indicate, in any way, that the Company will not assert, to the fullest extent possible under applicable law, its rights or the rights of the applicable licensor to these trademarks and trade names. This Presentation also contains trademarks, trade names and service marks of other companies, which are the property of their respective owners and are used for reference purposes only. Such use of other parties’ trademarks, trade names or service marks should not be construed to imply, a relationship with, or an endorsement or sponsorship of the Company by any other party. 2

Yair Nechmad CEO and Co-Founder Sagit Manor CFO Today’s Speakers 3

Company Overview
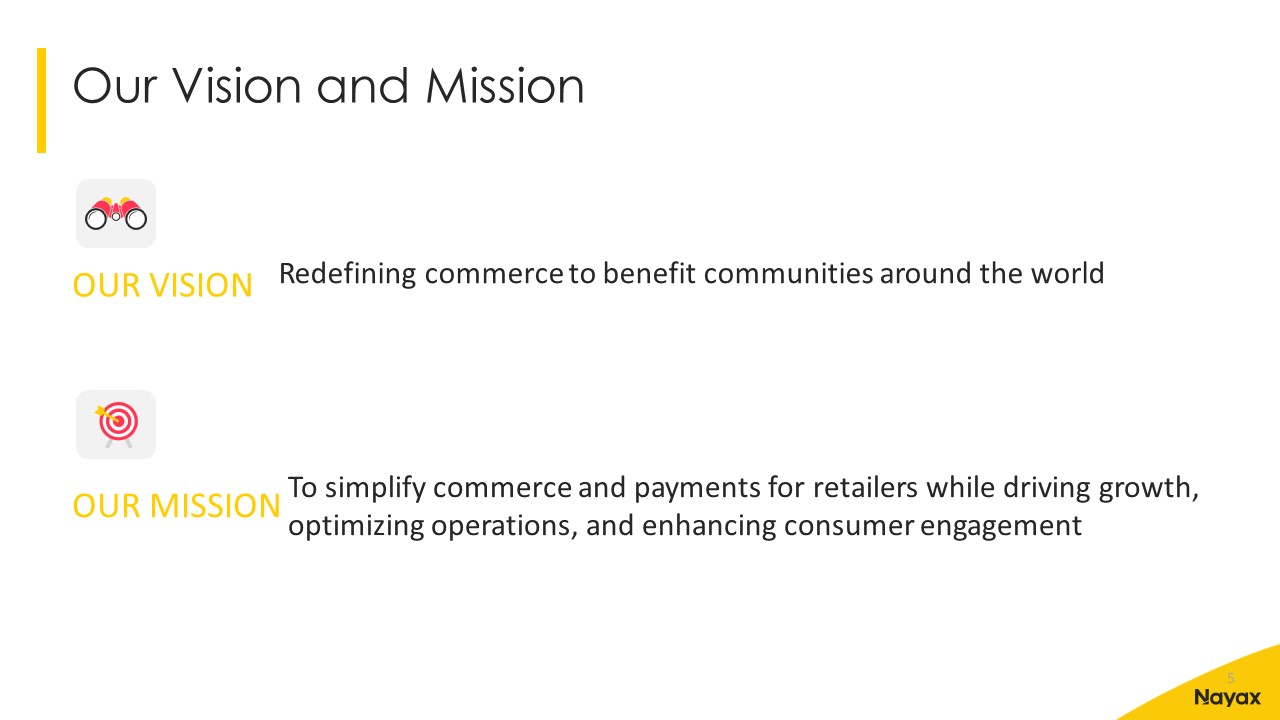
Our Vision and Mission OUR VISION OUR MISSION Redefining commerce to benefit communities around the world To simplify commerce and payments for retailers while driving growth, optimizing operations, and enhancing consumer engagement 5
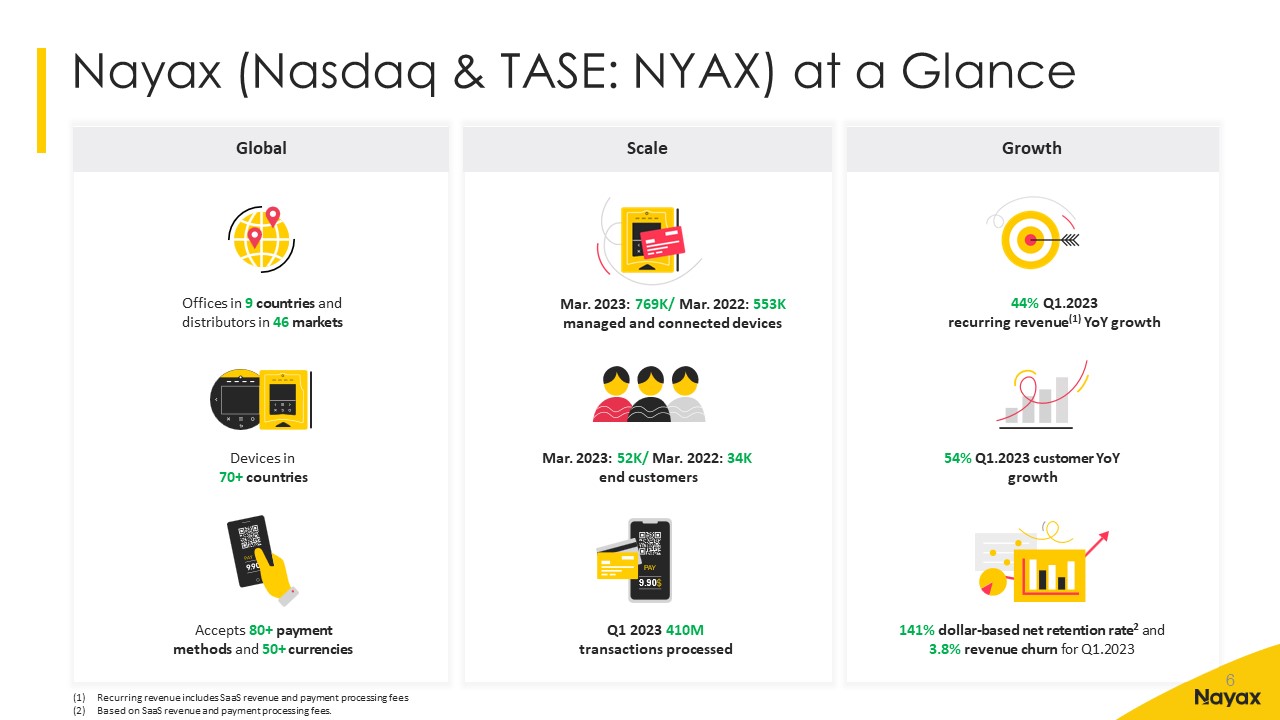
Nayax (Nasdaq & TASE: NYAX) at a Glance Growth 44% Q1.2023 recurring revenue(1) YoY growth 54% Q1.2023 customer YoY growth Global Offices in 9 countries and distributors in 46 markets Devices in 70+ countries Scale Q1 2023 410M transactions processed Mar. 2023: 769K/ Mar. 2022: 553K managed and connected devices Recurring revenue includes SaaS revenue and payment processing fees Based on SaaS revenue and payment processing fees. 141% dollar-based net retention rate2 and 3.8% revenue churn for Q1.2023 Accepts 80+ paymentmethods and 50+ currencies Mar. 2023: 52K/ Mar. 2022: 34K end customers 6

Bringing a Global Solution to the Local Market Low Customer Concentration Strong Track Record of Winning Clients Retaining & Growing Customers Global Reach YoY Revenue Churn Rate YoY Dollar-Based Net Retention Rate1 1 Based on SaaS revenue and payment processing fees Q1 2023 Q1 2023 7

Recent Key Business Highlights Received a DISCOVER card issuing license for the US market Completed CoinBridge Apple Pay integration Signed US infrastructure partners’ agreements to provide the CoinBridge service in the US: US issuer processor, and US Issuing bank IWG Regus Global, signed a global agreement to provide our Payment Solution for Coffee Services, package deliver locker and now EV Tietoset Oy –CPO from Finland –launched a pilot to lead implementation of new charging stations in Finland EV METER started hosting fast DC charging stations using the EVM CORE system - a cloud-based management system that hosts charging stations using OCPP protocol Imperial, a Canteen franchise, chose Nayax as their technology partner for upgrading their cashless devices Developed our strategic partnership with TIBA, a global leader in the parking vertical We have partnered with Pandora, a leading jewelry brand, as a new retail customer in Israel We have launched the first Automated Grocery Store in Israel using our Kiosk 8 8
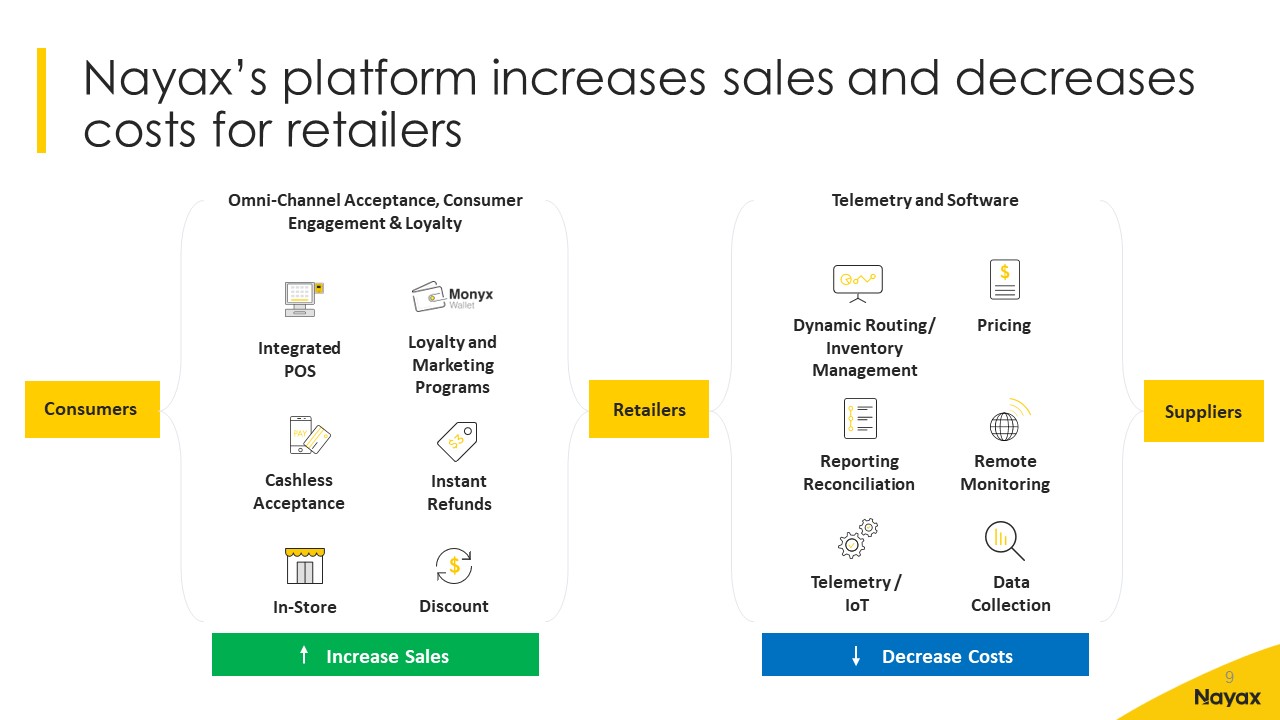
Omni-Channel Acceptance, Consumer Engagement & Loyalty Loyalty and Marketing Programs Instant Refunds Cashless Acceptance Integrated POS In-Store Discount Increase Sales Nayax’s platform increases sales and decreases costs for retailers Consumers Telemetry and Software Pricing Remote Monitoring Reporting Reconciliation Dynamic Routing/ Inventory Management Telemetry / IoT Data Collection Decrease Costs Suppliers Retailers 9

Proven Growth Land and Expand Solving pain points with a scalable, solution-driven sales approach Increase revenue organically through additional penetration and offerings Land Close Expand Existing Customer Expansion ($m) (1) (1) See Appendix for definition of existing customer expansion. For example, revenue from new customers in 2018 grew more than 5 times over the next 4 years 10
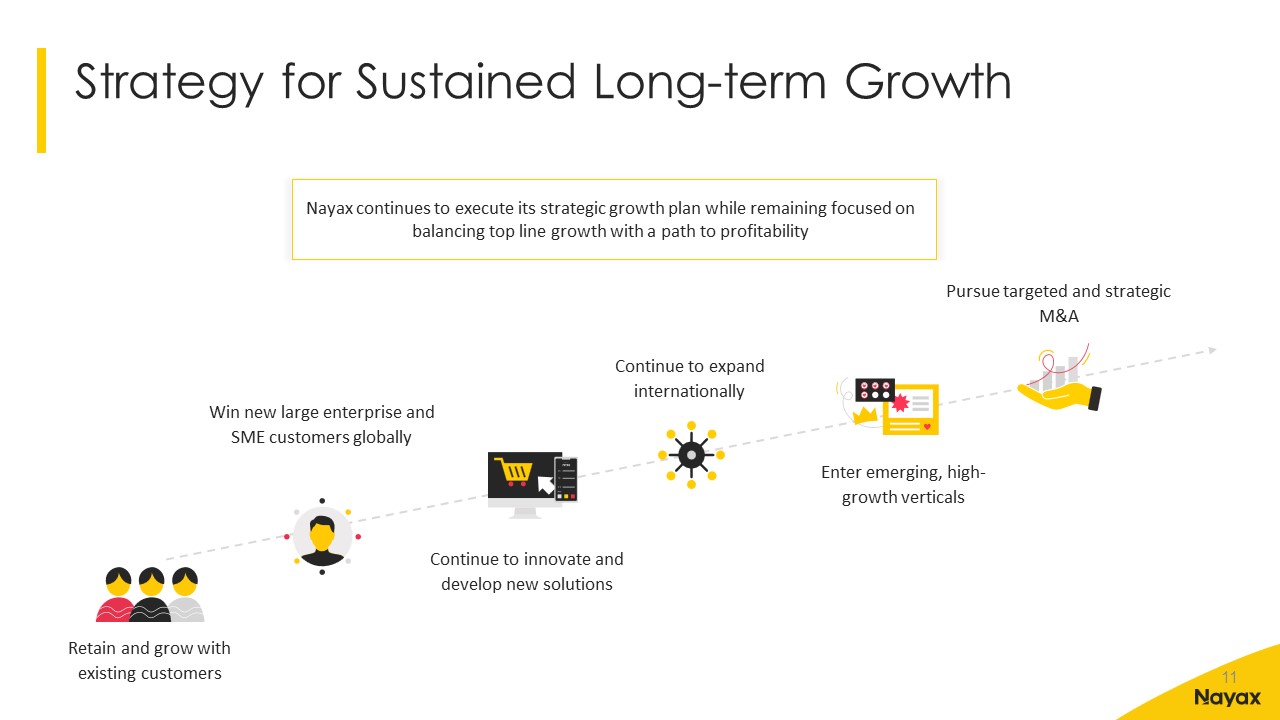
Strategy for Sustained Long-term Growth Retain and grow with existing customers Continue to innovate and develop new solutions Win new large enterprise and SME customers globally Pursue targeted and strategic M&A Continue to expand internationally Enter emerging, high-growth verticals Nayax continues to execute its strategic growth plan while remaining focused on balancing top line growth with a path to profitability 11

"One Nayax" Strategy: End-to-End PlatformExpanding TAM and Driving SaaS "One Nayax" NEW Embedded financing solution Converting loyalty assets to currency Embedded payment solution Omni channel marketing platform Innovative platform for Family Entertainment Centers and amusement Self-checkout platform Electric vehicle platform 12

Financial Overview

Powerful business model built on solid recurring revenue Purchase fee per sold connected POS Processing fee as % of transaction volume Monthly Subscription Fee (SaaS) per connected POS Consistently growing recurring revenue base Superior payment processing economics Embedded Payment Multi Layers of Value Creation Source: company data Hardware SaaS Payments Rapidly Growing Recurring Revenue Base “Lock in” ~60% Recurring Revenue 2.4%+ Take Rate 14

Gross Profit grew 26% YoY Q1 2023 gross margin reflects an increased shift to higher processing fees than SaaS revenue. Highlights Our Business Model is Working Recurring Revenue: SaaS Revenue and Payment processing fees. Strong Revenue Growth ($m) High Recurring Revenue ($m) (1) Q1 2023 margins still reflect the disruption caused by global component shortages, higher POS devices revenue and the shift to higher processing fees than SaaS revenue. Highlights High recurring revenue consisted of SaaS revenue and payment processing fees. Grew by 44% YoY. Highlights Another strong record revenue in Q1. Grew 54% YoY as we continued to benefit from growing hardware and recurring revenue. Highlights 15 Strong Recurring Gross Profit ($m) CAGR: 37% 54% CAGR: 44% 44% Gross Profit ($m) Gross Margin Gross Margin CAGR: 36% 65% 60% 61% 57% 55% 48% 52% 26% CAGR: 30% 44% 42% 47% 40% 38% 34% 35% 37%
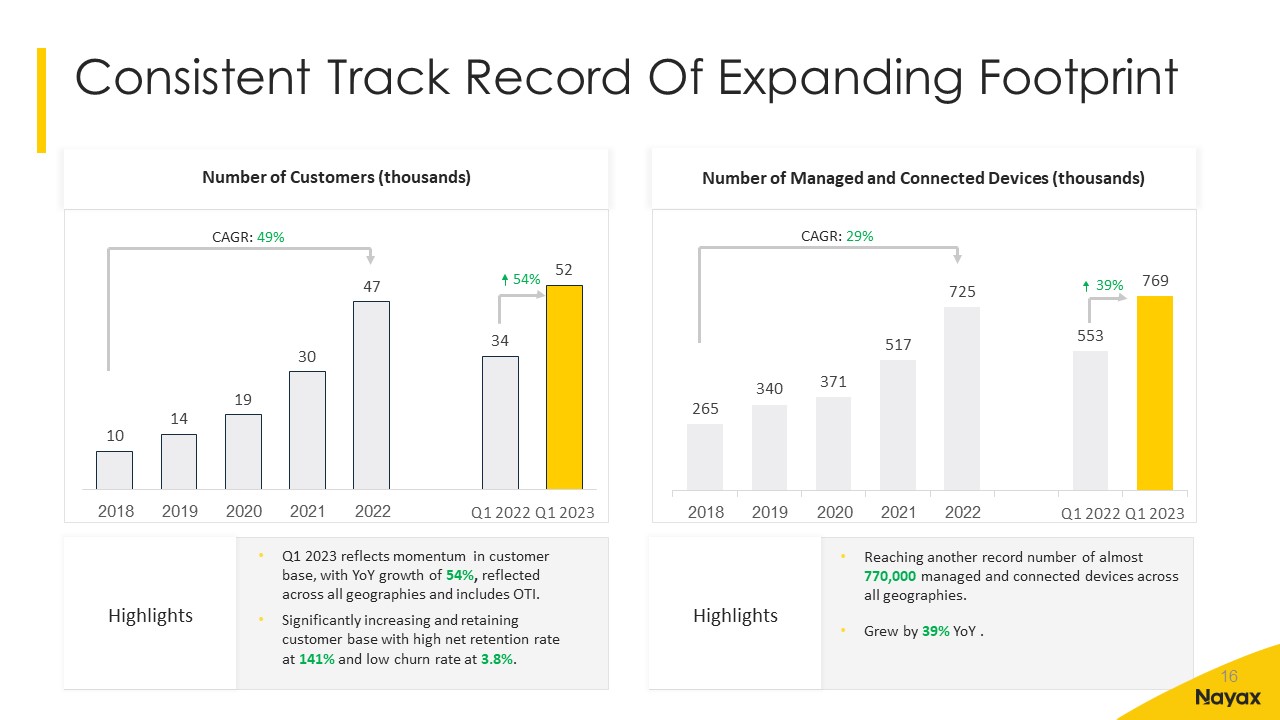
Highlights Reaching another record number of almost 770,000 managed and connected devices across all geographies. Grew by 39% YoY . Consistent Track Record Of Expanding Footprint Number of Managed and Connected Devices (thousands) Highlights Q1 2023 reflects momentum in customer base, with YoY growth of 54%, reflected across all geographies and includes OTI. Significantly increasing and retaining customer base with high net retention rate at 141% and low churn rate at 3.8%. Number of Customers (thousands) 16 CAGR: 49% 54% CAGR: 29% 39%

Global Cashless Payment Trends Driving Transactions Number of Transactions (millions) 63% Growth in 2023 YoY Growth across all geographies driven by consumer behavior trends, and increased transactions processed for our expanding customer base Highlights Highlights 52% Growth in 2023 YoY Growth across all geographies with our strong customer expansion as well as shift in customer behavior toward cashless payments 17 Transaction value ($m) CAGR: 45% 52% CAGR: 50% 63%
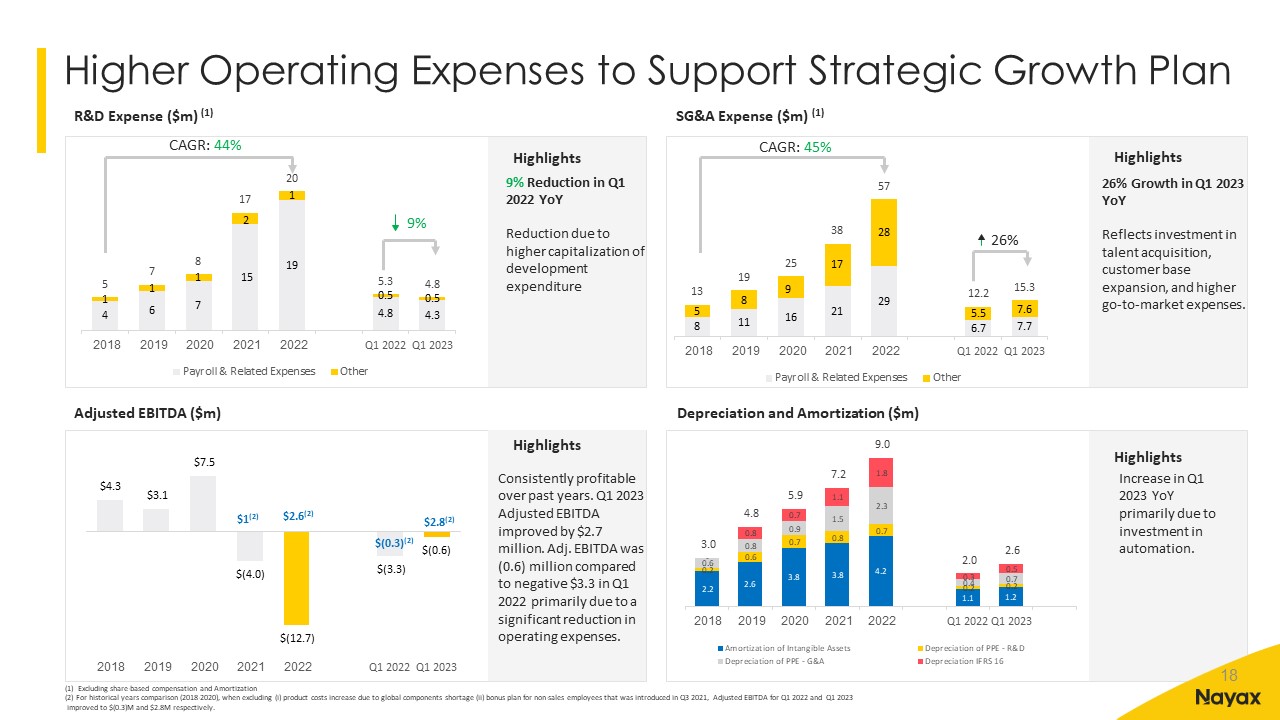
Higher Operating Expenses to Support Strategic Growth Plan Increase in Q1 2023 YoY primarily due to investment in automation. Highlights Consistently profitable over past years. Q1 2023 Adjusted EBITDA improved by $2.7 million. Adj. EBITDA was (0.6) million compared to negative $3.3 in Q1 2022 primarily due to a significant reduction in operating expenses. Highlights Highlights Highlights Adjusted EBITDA ($m) R&D Expense ($m) (1) Depreciation and Amortization ($m) SG&A Expense ($m) (1) (1) Excluding share-based compensation and Amortization (2) For historical years comparison (2018-2020), when excluding (i) product costs increase due to global components shortage (ii) bonus plan for non-sales employees that was introduced in Q3 2021, Adjusted EBITDA for Q1 2022 and Q1 2023 improved to $(0.3)M and $2.8M respectively. 9% Reduction in Q1 2022 YoY Reduction due to higher capitalization of development expenditure 26% Growth in Q1 2023 YoY Reflects investment in talent acquisition, customer base expansion, and higher go-to-market expenses. 18 CAGR: 44% 9% CAGR: 45% 26% $2.6(2) $2.8(2) $(0.3)(2) $1(2)

2023 Outlook 2023 outlook update Revenue Reaffirm revenue guidance - on a constant currency basis, to be in the range of $235 million to $240 million, representing year-over-year growth of at least 35%. Operating Expenses Positively revising guidance - operating expenses to stay flat from Q4 2022 annualized run rate. Adjusted EBITDA Raising guidance - We expect Adjusted EBITDA to be between $3 to $7 million in 2023.(1) (1) We cannot reconcile expected 2023 Adjusted EBITDA to expected net income without unreasonable effort because certain items that impact net income and other reconciling metrics are out of our control and/or cannot be reasonably predicted at this time, which unavailable information could have a significant impact on our IFRS financial results. Guidance as of May 10, 2023. Any usage of slide on a subsequent date does not constitute guidance re-confirmation as of such subsequent date. Refer to Cautionary Statement for a discussion of factors that could cause actual results to differ materially from outlook. See Appendix for details related to constant currency. Continued execution of strategic growth plans; benefits of secular trends in digital payments. Customer demand continues to be strong Assumes no material changes in macroeconomic conditions 19 Guidance Assumptions
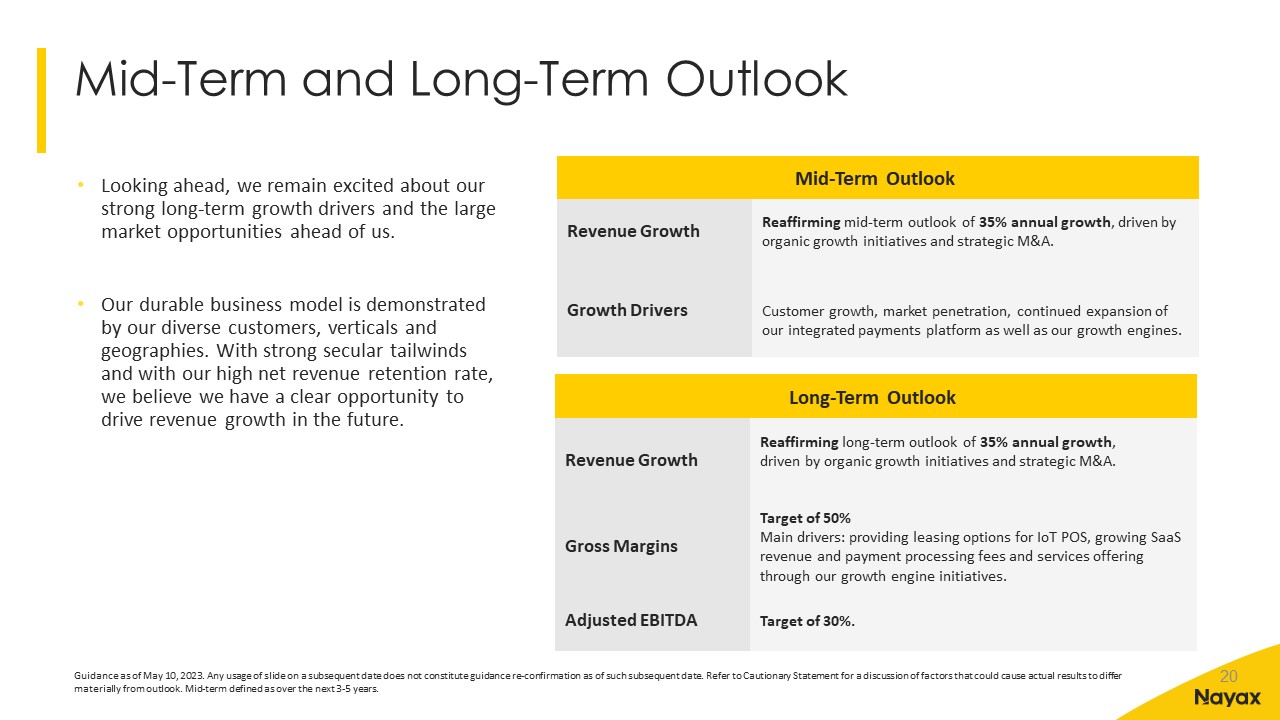
Mid-Term and Long-Term Outlook Mid-Term Outlook Revenue Growth Reaffirming mid-term outlook of 35% annual growth, driven by organic growth initiatives and strategic M&A. Growth Drivers Customer growth, market penetration, continued expansion of our integrated payments platform as well as our growth engines. Guidance as of May 10, 2023. Any usage of slide on a subsequent date does not constitute guidance re-confirmation as of such subsequent date. Refer to Cautionary Statement for a discussion of factors that could cause actual results to differ materially from outlook. Mid-term defined as over the next 3-5 years. Long-Term Outlook Revenue Growth Reaffirming long-term outlook of 35% annual growth, driven by organic growth initiatives and strategic M&A. Gross Margins Target of 50% Main drivers: providing leasing options for IoT POS, growing SaaS revenue and payment processing fees and services offering through our growth engine initiatives. Adjusted EBITDA Target of 30%. Looking ahead, we remain excited about our strong long-term growth drivers and the large market opportunities ahead of us. Our durable business model is demonstrated by our diverse customers, verticals and geographies. With strong secular tailwinds and with our high net revenue retention rate, we believe we have a clear opportunity to drive revenue growth in the future. 20

Summary Leading, best-in-class global payments platform for unattended commerce with a complete end-to-end solution. Highly talented team with focused execution on achieving strategic priorities. Large total addressable market driven by the strong secular tailwinds with multiple growth levers. Strong and consistent growth with high recurring revenues from SaaS and payment processing. Well capitalized with a clear path to profitability. Continue to balance top-line growth with focus on profitability. 21

Appendix 22
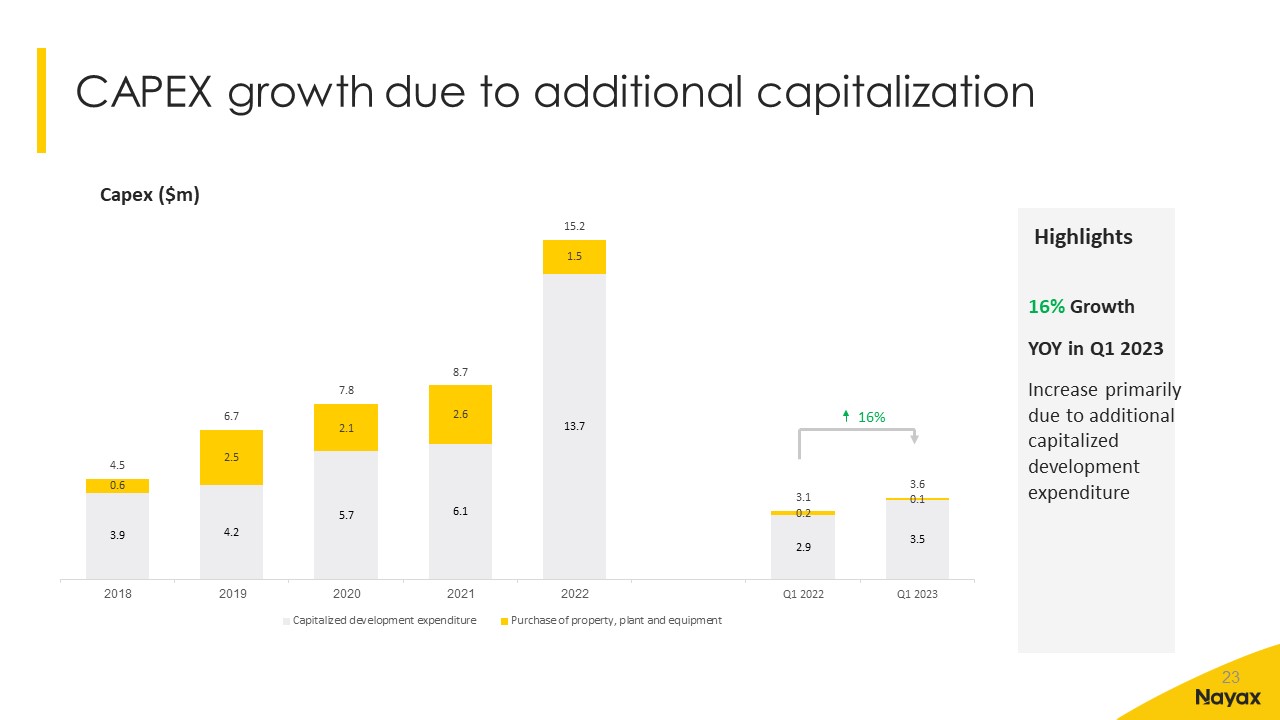
CAPEX growth due to additional capitalization Highlights 16% Growth YOY in Q1 2023 Increase primarily due to additional capitalized development expenditure 23 Capex ($m) 16%
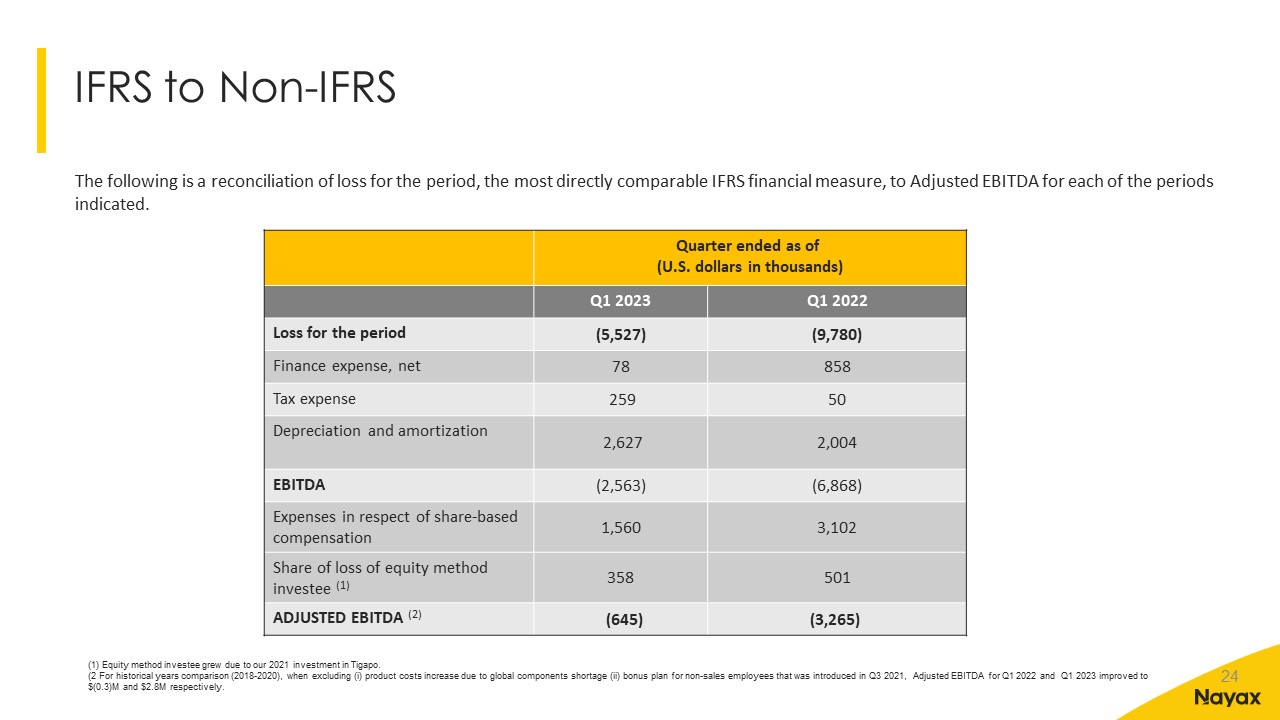
IFRS to Non-IFRS (1) Equity method investee grew due to our 2021 investment in Tigapo. (2 For historical years comparison (2018-2020), when excluding (i) product costs increase due to global components shortage (ii) bonus plan for non-sales employees that was introduced in Q3 2021, Adjusted EBITDA for Q1 2022 and Q1 2023 improved to $(0.3)M and $2.8M respectively. 24 The following is a reconciliation of loss for the period, the most directly comparable IFRS financial measure, to Adjusted EBITDA for each of the periods indicated. Quarter ended as of (U.S. dollars in thousands) Q1 2023 Q1 2022 Loss for the period (5,527) (9,780) Finance expense, net 78 858 Tax expense 259 50 Depreciation and amortization 2,627 2,004 EBITDA (2,563) (6,868) Expenses in respect of share-based compensation 1,560 3,102 Share of loss of equity method investee (1) 358 501 ADJUSTED EBITDA (2) (645) (3,265)

Historical 2018-2022 IFRS to Non-IFRS Consists primarily of (i) fees and expenses, other than underwriter discount and commissions, incurred in connection with our May 2021 initial public offering on the TASE and (ii) expenses incurred in connection with our listing on Nasdaq in September 2022 Equity method investee grew due to our 2021 investment in Tigapo. 25 The following is a reconciliation of loss for the period, the most directly comparable IFRS financial measure, to Adjusted EBITDA for each of the periods indicated. Quarter ended as of (U.S. dollars in thousands) 2018 2019 2020 2021 2022 Loss for the period (3,632) (5,491) (6,083) (24,769) (37,509) Finance expense, net 5,018 2,545 3,874 1,655 3,021 Tax expense (47) (143) (15) 632 451 Depreciation and amortization 2,949 4,817 5,908 7,198 9,028 EBITDA 4,288 1,728 3,684 (15,284) (25,009) Expenses in respect of share-based compensation - 1,400 2,965 8,850 8,747 Non-Recurring Issuance costs(1) - - - 1,879 1,790 Share of loss of equity method investee (2) - - - 538 1,794 ADJUSTED EBITDA 4,288 3,128 6,649 (4,017) (12,678)

Managed and Connected – Devices that are operated by our customers. End Customers – Customers that contributed to Nayax revenue in the last 12 months. Recurring Revenue – SAAS revenue and payment processing fees. Dollar-based net retention rate - Measured as a percentage of revenue from returning customers in a given year as compared to the revenue from such customers in the prior year, which reflects the increase in revenue and the rate of losses from customer churn. Revenue churn - The percentage of revenue lost as a result of customers leaving our platform in the last 12 months. Existing Customer Expansion - Revenue generated within a given cohort over the years presented. Each cohort represents customers from whom we received revenue for the first time, in a given year. Adjusted EBITDA - Adjusted EBITDA is a non-IFRS financial measure that we define as loss for the period plus finance expenses, tax expense (benefit), depreciation and amortization, share-based compensation costs, non-recurring issuance costs and our share in losses of associates accounted for by the equity method. Constant currency - Nayax presents constant currency information to provide a framework for assessing how our underlying businesses performed excluding the effect of foreign currency rate fluctuations. Future expected results for transactions in currencies other than United States dollars are converted into United States dollars using the exchange rates in effect in the last month of the reporting period. Nayax provides this financial information to aid investors in better understanding our performance. These constant currency financial measures presented in this release should not be considered as a substitute for, or superior to, the measures of financial performance prepared in accordance with IFRS. Key Definitions 26

Thank you! IR Contact: ir@nayax.com Website: ir.nayax.com