Free signup for more
- Track your favorite companies
- Receive email alerts for new filings
- Personalized dashboard of news and more
- Access all data and search results
Filing tables
Filing exhibits
NYAX similar filings
- 12 Mar 24 Nayax Announces Pricing of Public Offering
- 6 Mar 24 Nayax Announces Proposed Public Offering
- 6 Mar 24 Nayax Enters Definitive Agreement to Acquire VMtecnologia
- 28 Feb 24 Current report (foreign)
- 28 Feb 24 Nayax Reports Record Fourth Quarter and Full Year 2023 Financial Results
- 1 Feb 24 Nayax Appoints Aaron Greenberg as Chief Strategy Officer
- 4 Dec 23 Nayax Appoints New Chief Information Officer
Filing view
External links
Exhibit 99.1

Nayax Q4 and Full Year 2023 Earnings Presentation Feb 28, 2024

Important Disclosure This presentation is intended to provide general information only and is not, and should not be considered, as an offer to purchase or sell the Company’s securities, or a proposal to receive such offers. In addition, this presentation is not an offer to the public of the Company’s securities. By attending or viewing this presentation, each attendee (“Attendee”) agrees that he or she (i) has read this disclaimer, (ii) is bound by the restrictions set out herein, (iii) is permitted, in accordance with all applicable laws, to receive such information, (iv) is solely responsible for his or her own assessment of the business and financial position of the Company and (v) will conduct his or her own analysis and be solely responsible for forming the Attendee's view of the potential future performance of the Company’s business. The information in this presentation is provided for convenience only. It does not contain comprehensive information, but merely summary information in a condensed form. This presentation does not and is not intended to replace a careful inspection of the Company's Financial Statements and other public filings, as reported or will be reported to the Israeli Securities Authority and the Securities and Exchange Commission (the "Company's Reports"). In case of any inconsistencies between the information provided in this presentation and the Company's Reports, the latter will prevail. The information in this presentation is not a basis and should not be used as a basis for making any decisions in relation to the Company, including any decision to purchase securities of the Company. Any such decision should be based on the Company's Reports and following the receipt of appropriate professional advice. The information provided in this presentation is not, and should not be considered to be, a recommendation or an opinion of any kind in relation to an investment in the Company, whether legal, financial, tax, economic or otherwise. This presentation does not replace the need for a potential investor to collect and analyze further independent information for their due consideration. Every potential investor must obtain their own independent advice and guidance, in connection with a potential investment in the Company, including tax advice which takes into account the investor’s own tax position. This presentation includes projections, guidance, forecasts, estimates, assessments and other information pertaining to future events and/or matters, whose materialization is uncertain and is beyond the Company’s control, and which constitute forward looking statements (within the meaning of Section 27A of the Securities Act of 1933, as amended, Section 21E of the Securities Exchange Act of 1934, as amended, and the Israeli Securities Law, 5728-1968). Many of the forward-looking statements contained in this presentation can be identified by the use of forward-looking words such as “anticipate,” “believe,” “could,” “expect,” “should,” “plan,” “intend,” “estimate” and “potential,” among others. Forward-looking statements include, but are not limited to, expectations and evaluations relating to the Company’s business targets and strategy, the success of trials and the integration of the Company’s technology in various systems and industries, the advantages of the Company’s existing and future products, timetables regarding completion of the Company’s developments and the expected commencement of production, sales and distribution of the Company’s products and technology, the Company’s intentions in relation to various industries, the Company’s intentions in relation to the creation of collaborations and engagements in licensing agreements, production and distribution in various countries, and other statements regarding our intent, belief or current expectations. Forward-looking statements are based on our management’s beliefs and assumptions and on information currently available to our management. Such statements are subject to risks and uncertainties, and actual results may differ materially from those expressed or implied in the forward-looking statements due to of various factors, including, but not limited to: our expectations regarding general market conditions, including as a result of the COVID-19 pandemic and other global economic trends; changes in consumer tastes and preferences; fluctuations in inflation, interest rate and exchange rates in the global economic environment over the world; the availability of qualified personnel and the ability to retain such personnel; changes in commodity costs, labor, distribution and other operating costs; our ability to implement our growth strategy; changes in government regulation and tax matters; other factors that may affect our financial condition, liquidity and results of operations; general economic, political, demographic and business conditions in Israel, including ongoing military conflicts in the region; the success of operating initiatives, including advertising and promotional efforts and new product and concept development by us and our competitors; factors relating to the acquisition of Retail Pro International, including but not limited to the financing for and payment of the acquisition and our ability to effectively and efficiently integrate the acquired business into our existing business; and other risk factors discussed under “Risk Factors” in our annual report on Form 20-F filed with the SEC on February 28, 2024 (our “Annual Report"). The preceding list is not intended to be an exhaustive list of all of our forward-looking statements. These statements are only estimates based upon our current expectations and projections about future events. There are important factors that could cause our actual results, levels of activity, performance or achievements to differ materially from the results, levels of activity, performance or achievements expressed or implied by the forward-looking statements. In particular, you should consider the risks provided under “Risk Factors” in our Annual Report. You should not rely upon forward-looking statements as predictions of future events. Although we believe that the expectations reflected in the forward-looking statements are reasonable, we cannot guarantee that future results, levels of activity, performance and events and circumstances reflected in the forward-looking statements will be achieved or will occur. Each forward-looking statement speaks only as of the date of the particular statement. Except as required by law, we undertake no obligation to update publicly any forward-looking statements for any reason, to conform these statements to actual results or to changes in our expectations. In addition, the presentation includes data published by various bodies, and data provided to the Company in the framework of cooperation engagements, concerning the industry, competitive position and the markets in which the Company operates, whose content was not independently verified by the Company, such that the Company is not responsible for the accuracy or completeness of such date or whether the data is up-to-date, and Company takes no responsibility for any reliance on the data. Management estimates contained in this presentation are derived from publicly available information released by independent industry analysts and other third-party sources, as well as data from the Company's internal research, and are based on assumptions made by the Company upon reviewing such data, and the Company's experience in, and knowledge of, such industry and markets, which the Company believes to be reasonable. In addition, projections, assumptions and estimates of the future performance of the industry in which the Company operates and the Company's future performance are necessarily subject to uncertainty and risk due to a variety of factors, including those described above. These and other factors could cause results to differ materially from those expressed in the estimates made by independent parties and by the Company. Industry publications, research, surveys and studies generally state that the information they contain has been obtained from sources believed to be reliable, but that the accuracy and completeness of such information is not guaranteed. Forecasts and other forward-looking information obtained from these sources are subject to the same qualifications and uncertainties as the other forward-looking statements in this presentation. In addition to various operational metrics and financial measures in accordance with accounting principles generally accepted under International Financial Reporting Standards, or IFRS, this presentation contains Adjusted EBITDA, a non-IFRS financial measure, as a measure to evaluate our past results and future prospects. Please refer to the Appendix for a definition of Adjusted EBITDA and for a reconciliation of Adjusted EBITDA to net income (loss). The Company does not provide a reconciliation of forward-looking Adjusted EBITDA to IFRS net income (loss), due to the inherent difficulty in forecasting, and quantifying certain amounts that are necessary for such reconciliation, in particular, because special items such as, finance expenses and Issuance and acquisition costs, used to calculate projected net income (loss) vary dramatically based on actual events. Therefore, the Company is not able to forecast on an IFRS basis with reasonable certainty all deductions needed in order to provide an IFRS calculation of projected net income (loss) at this time. The amount of these deductions may be material, and therefore could result in projected IFRS net income (loss) being materially less than projected Adjusted EBITDA (non-IFRS). The Company does not confirm or undertake that the information appearing in this presentation is complete or accurate. The Company, its employees, officers and its shareholders will not be responsible for damages and/or losses which may arise as a result of the use of the information contained in this presentation. The Company is not responsible for any changes to the economic, financial or legal situation relating to the Company and its business. The Company does not undertake to update and/or change forecasts and/or evaluations included in the presentation in order that they will reflect events and/or circumstances which apply after the date of the presentation’s preparations. No persons have been authorized to make any representations regarding the information contained in this presentation, and if given or made, such representations should not be considered as authorized. The content of this presentation does not bind the Company or its managers and they have the right to change any item described in the presentation relating to the Company, at their sole discretion. The Company and its licensors have proprietary rights to trademarks used in this Presentation. Solely for convenience, trademarks and trade names referred to in this Presentation may appear without the “®” or “™” symbols, but the lack of such references is not intended to indicate, in any way, that the Company will not assert, to the fullest extent possible under applicable law, its rights or the rights of the applicable licensor to these trademarks and trade names. This Presentation also contains trademarks, trade names and service marks of other companies, which are the property of their respective owners and are used for reference purposes only. Such use of other parties’ trademarks, trade names or service marks should not be construed to imply, a relationship with, or an endorsement or sponsorship of the Company by any other party.

Yair Nechmad CEO and Co-Founder Today’s Speakers Sagit Manor CFO

Company Overview

Our Mission Vending Amusement Self-Service Kiosks Laundromats Car Wash & Air Vac Simplifying commerce and payments for retailers, driving growth while optimizing operations and enhancing consumer engagement

Recurring revenue includes SaaS revenue and payment processing fees Based on SaaS revenue and payment processing fees. Retail Pro P&L figures are included for the first time in Q4 2023. Nayax (Nasdaq & TASE: NYAX) Q4-23 at a Glance Global offices 9 Customer YOY growth 53% Revenue churn 3.4% Markets with distributors 80+ Countries with devices 120+ Payment methods 80+ Currencies 50+ Managed and connected devices 1M Dec. 2022 725K End customers 72k Dec. 2022 47k Transactions processed Dec. 2022 378m 511m Recurring revenue(1)YoY growth 43% Dollar-basednet retention rate(2) 144% Global Growth
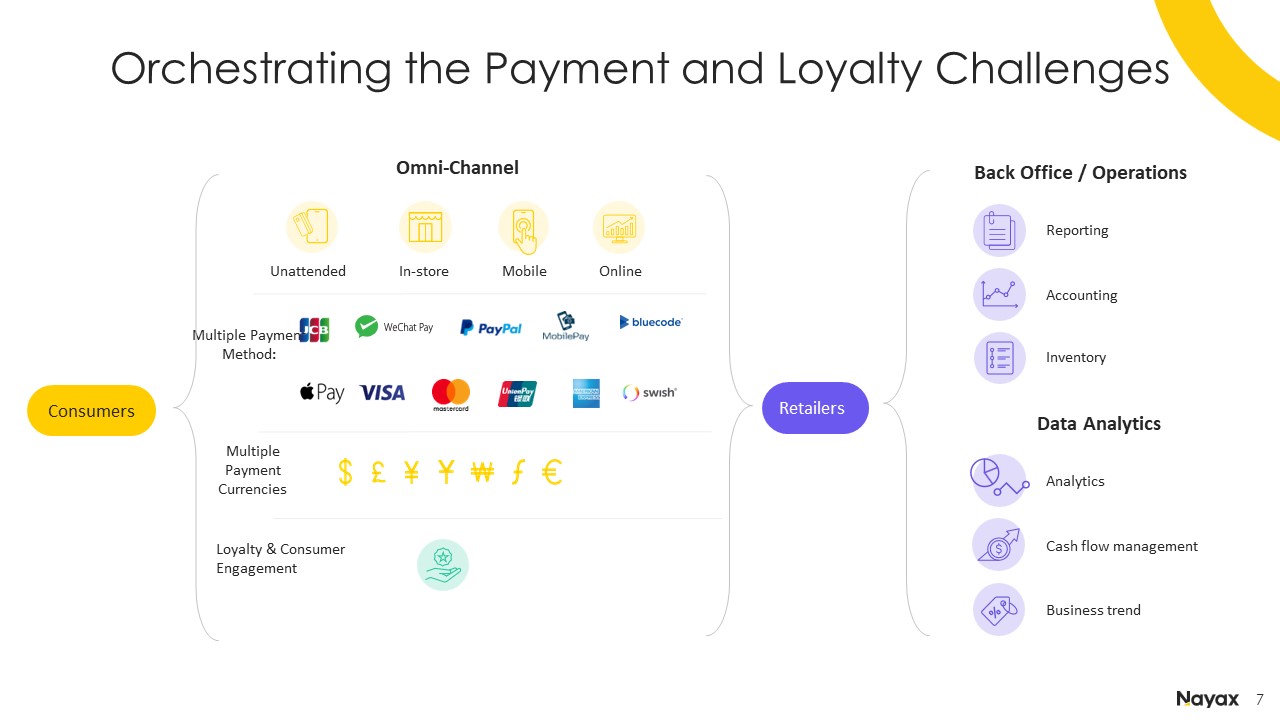
Orchestrating the Payment and Loyalty Challenges Back Office / Operations Data Analytics Multiple Payment Method: Omni-Channel Unattended In-store Mobile Reporting Multiple Payment Currencies Loyalty & Consumer Engagement Consumers Accounting Inventory Analytics Cash flow management Business trend Online Retailers
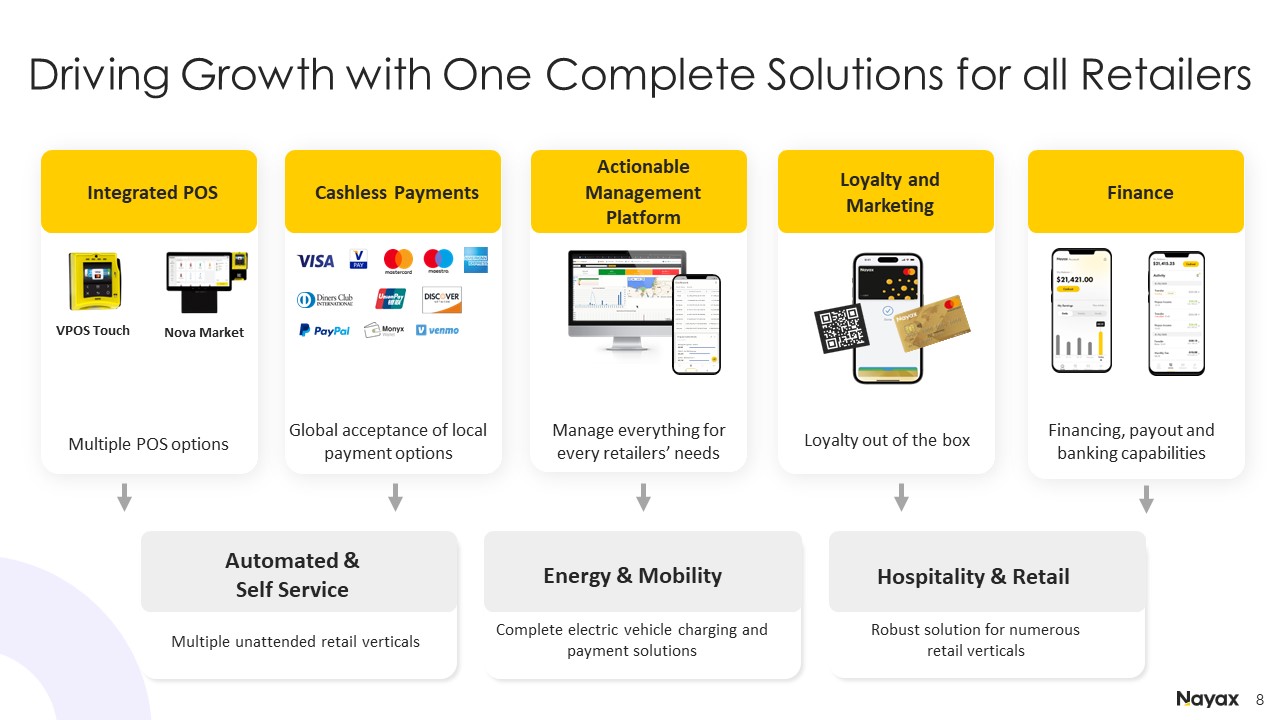
Cashless Payments Integrated POS Driving Growth with One Complete Solutions for all Retailers VPOS Touch Nova Market Actionable Management Platform Loyalty and Marketing Finance Manage everything for every retailers’ needs Loyalty out of the box Financing, payout and banking capabilities Multiple POS options Global acceptance of local payment options Robust solution for numerous retail verticals Complete electric vehicle charging and payment solutions Multiple unattended retail verticals Energy & Mobility Hospitality & Retail Automated &Self Service

Nayax’s platform increases sales & decreases costs Telemetry and Software Consumers Omni-Channel Acceptance, Consumer Engagement & Loyalty Increase Sales Pricing Remote Monitoring Reporting Reconciliation Dynamic Routing/ Inventory Management Telemetry / IoT Data Collection Decrease Costs Instant Refunds In-Store Discount Loyalty and Marketing Programs Cashless Acceptance Integrated POS Retailers Suppliers

Bringing a Global Solution to the Local Market 1 Based on SaaS revenue and payment processing fees. See definition in the Appendix. Retail Pro P&L figures are included for the first time in Q4.2023. YoY Revenue Churn Rate Retaining & Growing Customers YoY Revenue Churn Rate YoY Dollar-Based Net Retention Rate1 Low CustomerConcentration Global Reach Strong Track Record of Winning Clients Q4 2023 Q4 2023
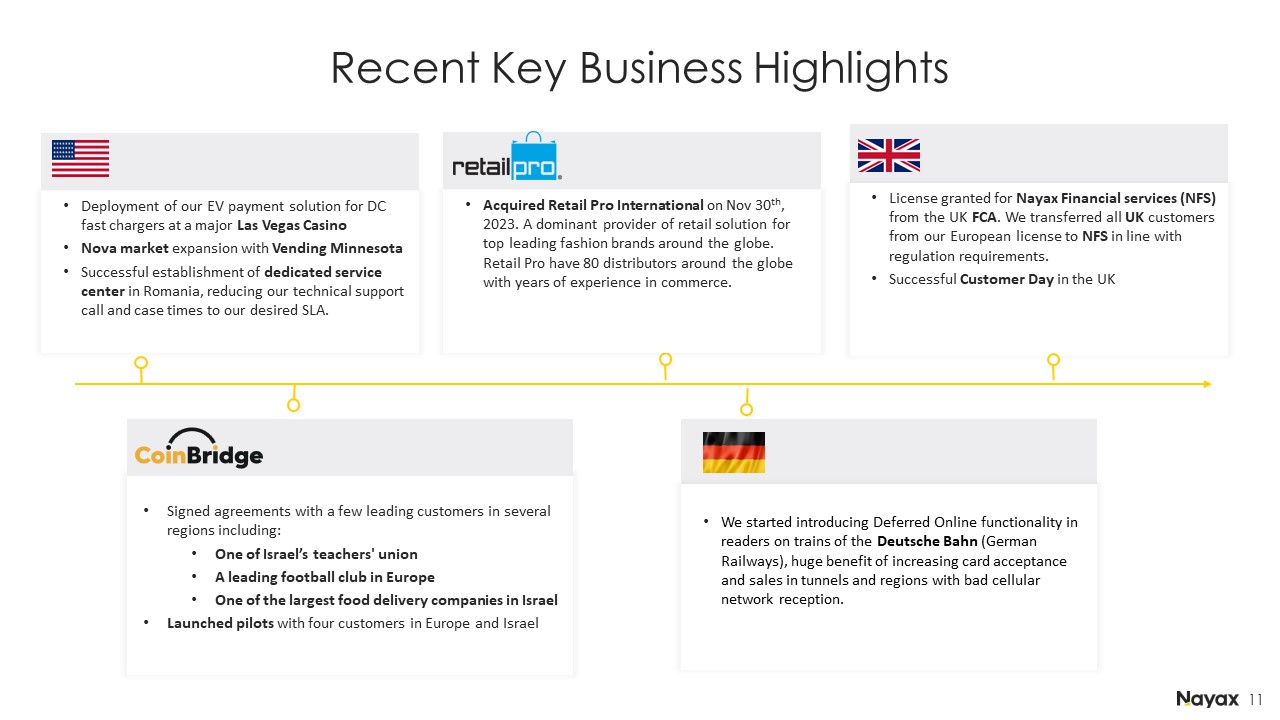
Recent Key Business Highlights License granted for Nayax Financial services (NFS) from the UK FCA. We transferred all UK customers from our European license to NFS in line with regulation requirements. Successful Customer Day in the UK We started introducing Deferred Online functionality in readers on trains of the Deutsche Bahn (German Railways), huge benefit of increasing card acceptance and sales in tunnels and regions with bad cellular network reception. Signed agreements with a few leading customers in several regions including: One of Israel’s teachers' union A leading football club in Europe One of the largest food delivery companies in Israel Launched pilots with four customers in Europe and Israel Deployment of our EV payment solution for DC fast chargers at a major Las Vegas Casino Nova market expansion with Vending Minnesota Successful establishment of dedicated service center in Romania, reducing our technical support call and case times to our desired SLA. Acquired Retail Pro International on Nov 30th, 2023. A dominant provider of retail solution for top leading fashion brands around the globe. Retail Pro have 80 distributors around the globe with years of experience in commerce.

Strategy for Sustained Long-term Growth Retain and grow with existing customers Continue to innovate and develop new solutions Win new large enterprise and SME customers globally Pursue targeted and strategic M&A Continue to expand internationally Enter emerging, high-growth verticals Nayax continues to execute its strategic growth plan while remaining focused on balancing top line growth and increase profitability

Financial Overview

Powerful business model built on solid recurring revenue Source: company data Multi Layers of Value Creation ~60% Recurring Revenue Processing fee as % of transaction volume Monthly Subscription Fee (SaaS) per connected POS Purchase fee per sold connected POS “Lock in” Consistently growing recurring revenue base Superior payment processing economics 2.5%+ Take Rate Embedded Payment Hardware SaaS Payments Rapidly Growing Recurring Revenue Base

Highlights Q4 gross Profit grew 38% YoY An increased shift to higher processing payment fees than SaaS revenue. Highlights Q4 Gross margin grew 56% YoY The improvement is mainly attributed to hardware gross margin. Highlights Q4 recurring revenue grew by 40% YoY. Primarily driven by continued strong payment processing fees with YoY growth of 55%. SaaS revenue grew 27% YoY. Our Business Model is Working Recurring Revenue: SaaS Revenue and Payment processing fees. Retail Pro P&L figures are included for the first time in Q4.2023. Highlights Q4 revenue grew 31% YoY As we continued to benefit from faster growing recurring revenue. Gross Margin Gross Margin Strong Revenue Growth ($m) High Recurring Revenue ($m) (1) Gross Profit ($m) Recurring Gross Profit ($m) 31% CAGR 44% CAGR 51% 40% 61% 57% 51% 49% 52% 38% CAGR 40% 48% 47% 40% 33% 40% 35% 56% CAGR 33% 37%

Highlights Q4 Adj. EBITDA grew 260% YoY Positive $4.0 million in Q4 2023, a marked improvement of $6.5 million compared to negative $2.5 million in Q4 2022. Depreciation and Amortization ($m) Highlights Q4 D&A grew 29% YoY Increase in Q4 2023 YoY primarily due to investment in automation. Highlights Q4 SG&A grew 12% YoY Reflects investment in talent acquisition, customer base expansion, and higher go-to-market expenses. Highlights Q4 R&D grew 21% YoY Primarily due to our investment in talent acquisitions. Improved Profitability from Moderating Expenses and Higher Operating Efficiencies (1) Excluding share-based compensation and Amortization (2) For historical years comparison (2020-2023), when excluding (i) product costs increase due to global components shortage (ii) bonus plan for non-sales employees that was introduced in Q3 2021, Adjusted EBITDA for Q4 2022 and Q4 2023 improved to $1M and $6.4M respectively. R&D Expense ($m) (1) SG&A Expense ($m) (1) Adjusted EBITDA ($m) (2) 21% 12% 260% 29%

Consistent Track Record Of Expanding Footprint Highlights Q4 2023 reflects momentum in customer base, with YoY growth of 52%, across all geographies including 7,500 Retail Pro Customers. Significantly increasing and retaining customer base with high net retention rate at 144% and low churn rate at 3.4% Number of Customers (thousands) Number of Managed and Connected Devices (thousands) Highlights Reaching another record number of 1,044,000 managed and connected devices across all geographies including 130,000 devices of Retail Pro Grew by 44% YoY CAGR 57% Retail Pro P&L figures are included for the first time in Q4.2023. CAGR 41%

Global Cashless Payment Trends Driving Transactions Transaction value ($m) Highlights 43% Growth in Q4 2023 YoY Growth across all geographies driven by consumer behavior trends, and increased transactions processed from our expanding, global customer base Number of Transactions (millions) Highlights 35% Growth in Q4 2023 YoY Growth across all geographies with our strong customer expansion as well as shift in customer behavior toward cashless payments Retail Pro P&L figures are included for the first time in Q4.2023. 35% CAGR 58% 43% CAGR 68%

2024 Outlook (1) The Company does not provide a reconciliation of forward-looking adjusted EBITDA to IFRS net income (loss) due to the inherent difficulty in forecasting and quantifying certain amounts that are necessary for such reconciliation, in particular, because special items such as finance expenses and Issuance and acquisition costs used to calculate projected net income (loss) vary dramatically based on actual events. Therefore, the Company is not able to forecast on an IFRS basis with reasonable certainty all deductions needed in order to provide an IFRS calculation of projected net income (loss) at this time. The amount of these deductions may be material, and therefore could result in projected IFRS net income (loss) being materially less than projected adjusted EBITDA (non-IFRS). Metric FY 2024 Revenue (constant currency) from Organic and Inorganic $325m - $335m Revenue Growth YoY At least 38% Hardware margins 25%-27% Adjusted EBITDA $30m - $35m Free Cash Flow Positive Guidance Assumptions Customer demand continues to be strong Assumes no material changes in macroeconomic conditions

Summary Founder-led mentality with a mission and performance culture. Growth exposure to large and underpenetrated global markets for cashless payment adoption and secular tailwinds driving growth in our core unattended market. Ability to expand total addressable market and drive additional SaaS revenue from our emerging growth engines. Diverse business model across revenue, customer and geography with high recurring revenue. Seasoned management team with deep Payment industry experience. Accelerated path to profitability driven by revenue outperformance and focused cost management.
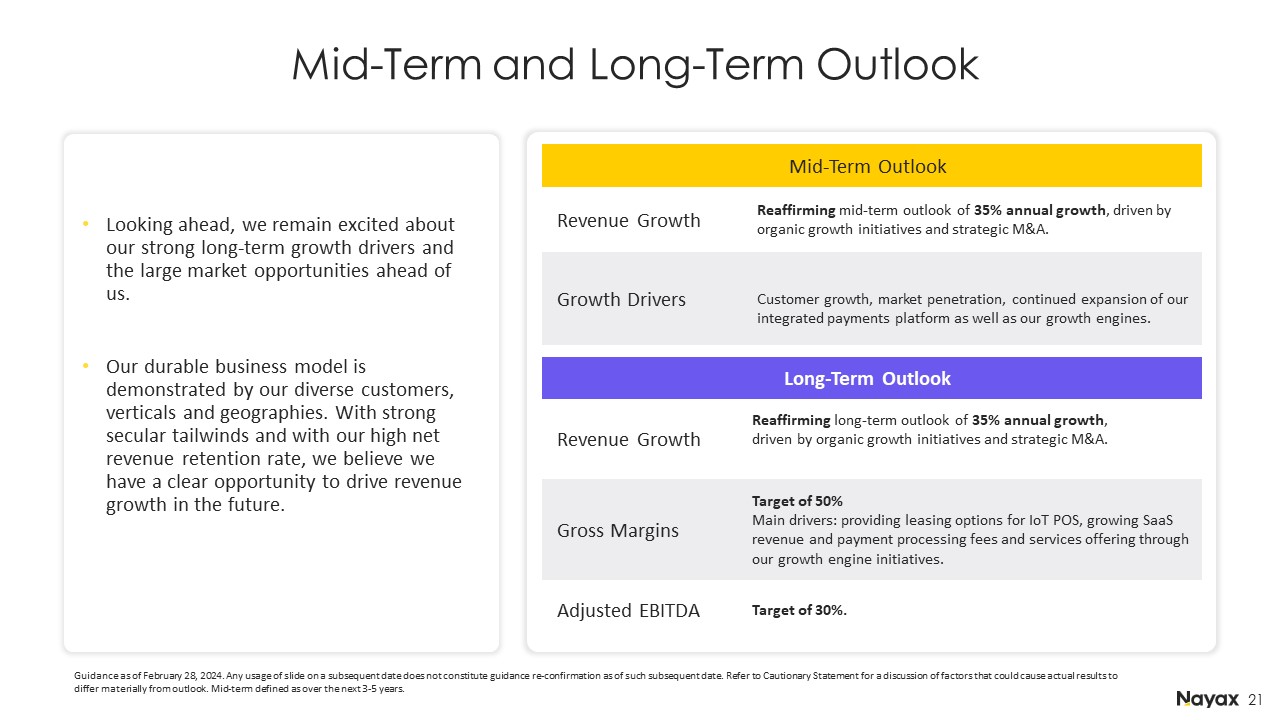
Looking ahead, we remain excited about our strong long-term growth drivers and the large market opportunities ahead of us. Our durable business model is demonstrated by our diverse customers, verticals and geographies. With strong secular tailwinds and with our high net revenue retention rate, we believe we have a clear opportunity to drive revenue growth in the future. Mid-Term and Long-Term Outlook Mid-Term Outlook Revenue Growth Reaffirming mid-term outlook of 35% annual growth, driven by organic growth initiatives and strategic M&A. Growth Drivers Customer growth, market penetration, continued expansion of our integrated payments platform as well as our growth engines. Guidance as of February 28, 2024. Any usage of slide on a subsequent date does not constitute guidance re-confirmation as of such subsequent date. Refer to Cautionary Statement for a discussion of factors that could cause actual results to differ materially from outlook. Mid-term defined as over the next 3-5 years. Long-Term Outlook Revenue Growth Reaffirming long-term outlook of 35% annual growth, driven by organic growth initiatives and strategic M&A. Gross Margins Target of 50% Main drivers: providing leasing options for IoT POS, growing SaaS revenue and payment processing fees and services offering through our growth engine initiatives. Adjusted EBITDA Target of 30%.

Appendix
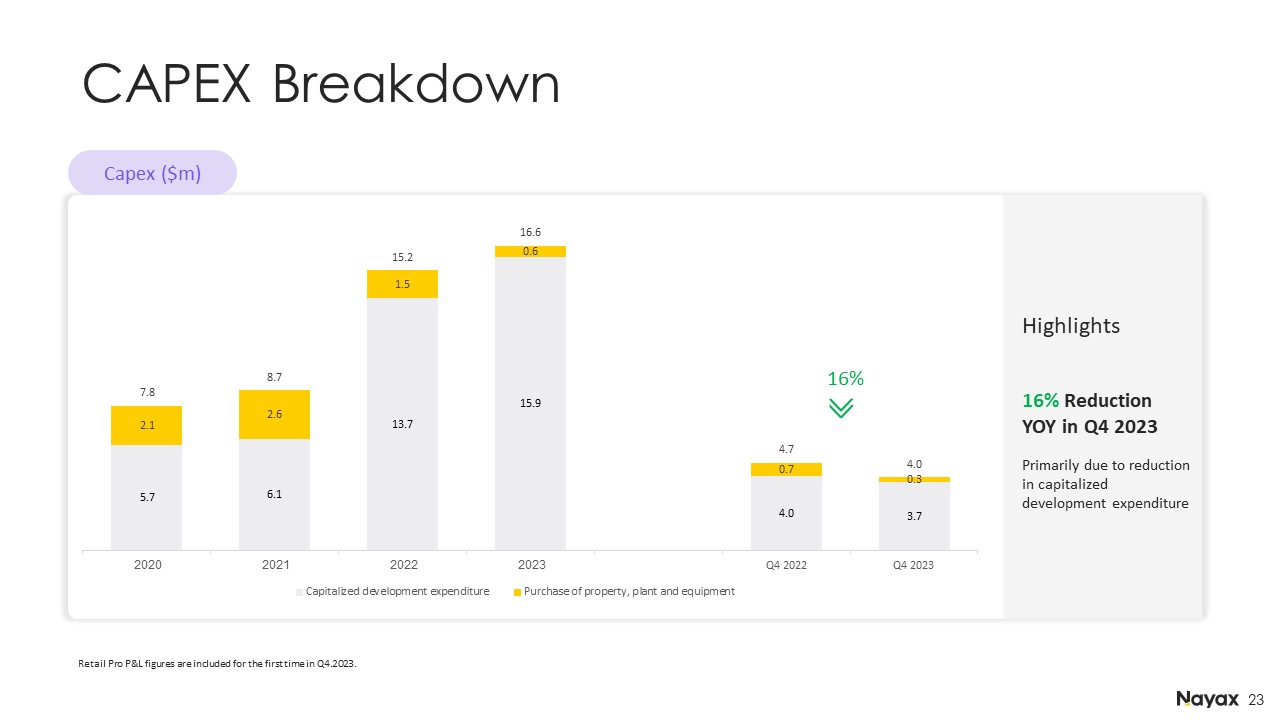
Highlights 16% Reduction YOY in Q4 2023 Primarily due to reduction in capitalized development expenditure CAPEX Breakdown Capex ($m) Retail Pro P&L figures are included for the first time in Q4.2023. 16%
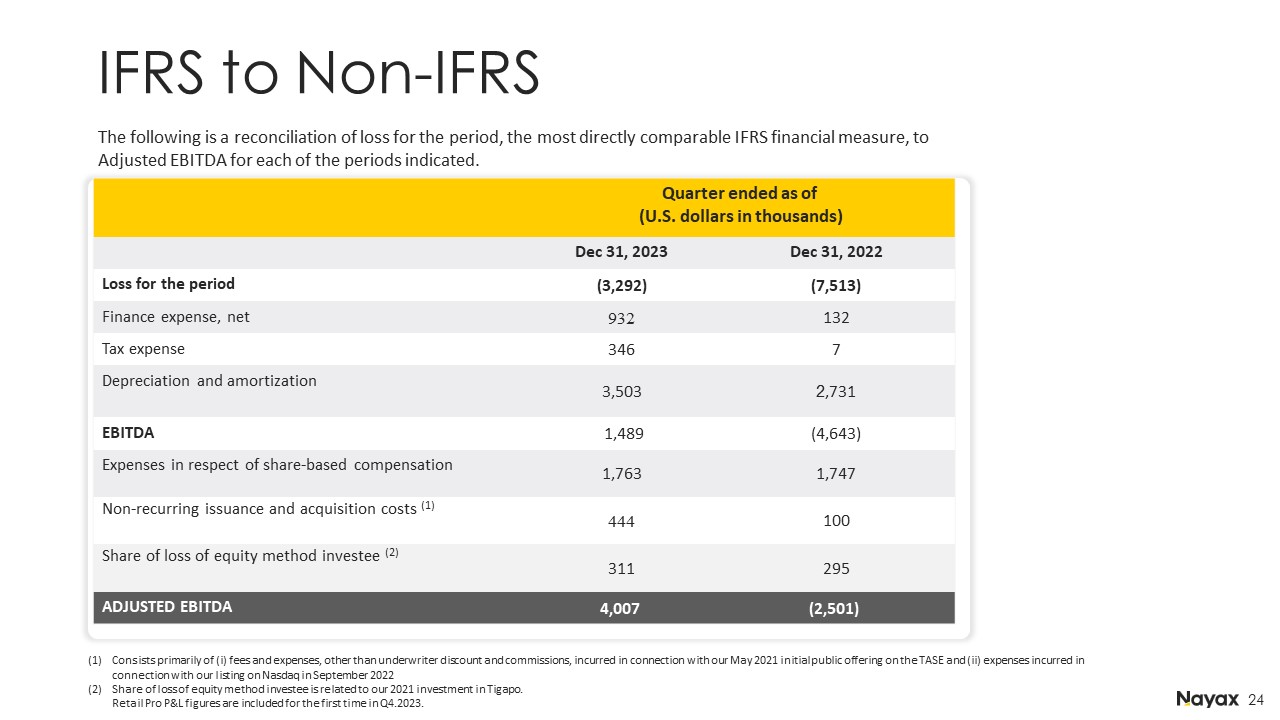
IFRS to Non-IFRS Consists primarily of (i) fees and expenses, other than underwriter discount and commissions, incurred in connection with our May 2021 initial public offering on the TASE and (ii) expenses incurred in connection with our listing on Nasdaq in September 2022 Share of loss of equity method investee is related to our 2021 investment in Tigapo. Retail Pro P&L figures are included for the first time in Q4.2023. The following is a reconciliation of loss for the period, the most directly comparable IFRS financial measure, to Adjusted EBITDA for each of the periods indicated. Quarter ended as of (U.S. dollars in thousands) Dec 31, 2023 Dec 31, 2022 Loss for the period (3,292) (7,513) Finance expense, net 932 132 Tax expense 346 7 Depreciation and amortization 3,503 2,731 EBITDA 1,489 (4,643) Expenses in respect of share-based compensation 1,763 1,747 Non-recurring issuance and acquisition costs (1) 444 100 Share of loss of equity method investee (2) 311 295 ADJUSTED EBITDA 4,007 (2,501)
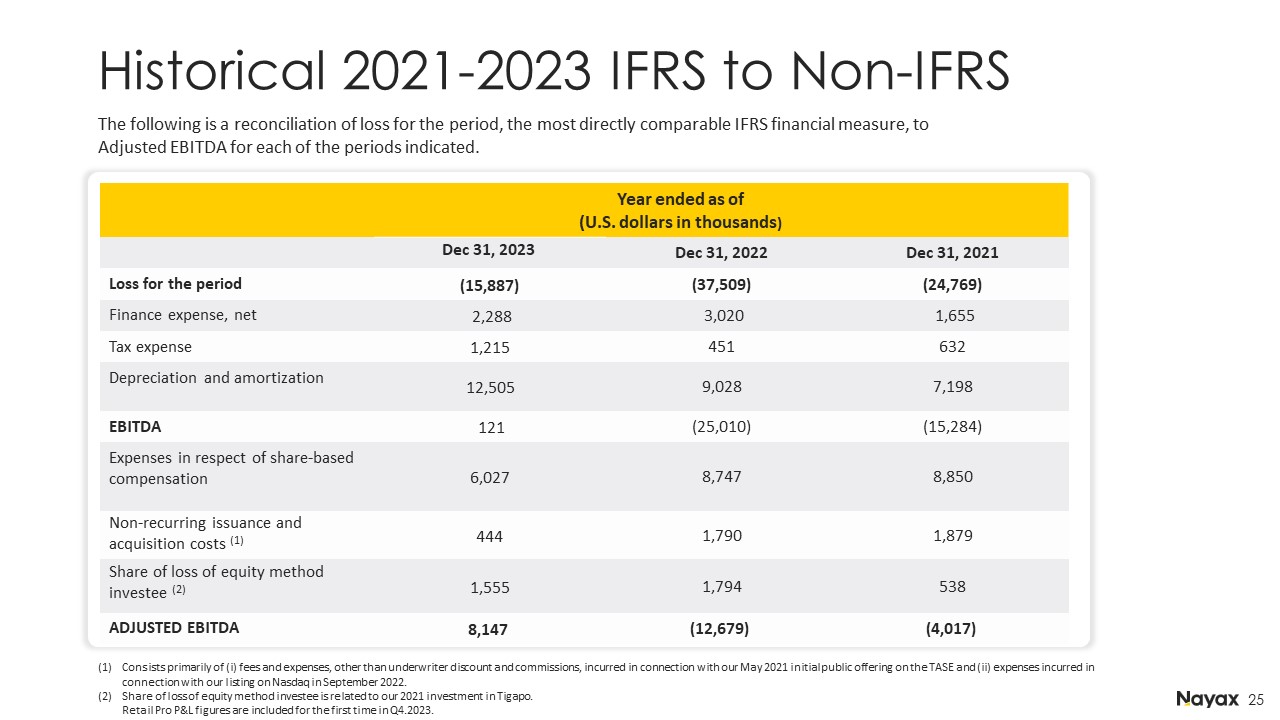
Historical 2021-2023 IFRS to Non-IFRS Consists primarily of (i) fees and expenses, other than underwriter discount and commissions, incurred in connection with our May 2021 initial public offering on the TASE and (ii) expenses incurred in connection with our listing on Nasdaq in September 2022. Share of loss of equity method investee is related to our 2021 investment in Tigapo. Retail Pro P&L figures are included for the first time in Q4.2023. The following is a reconciliation of loss for the period, the most directly comparable IFRS financial measure, to Adjusted EBITDA for each of the periods indicated. Year ended as of (U.S. dollars in thousands) Dec 31, 2023 Dec 31, 2022 Dec 31, 2021 Loss for the period (15,887) (37,509) (24,769) Finance expense, net 2,288 3,020 1,655 Tax expense 1,215 451 632 Depreciation and amortization 12,505 9,028 7,198 EBITDA 121 (25,010) (15,284) Expenses in respect of share-based compensation 6,027 8,747 8,850 Non-recurring issuance and acquisition costs (1) 444 1,790 1,879 Share of loss of equity method investee (2) 1,555 1,794 538 ADJUSTED EBITDA 8,147 (12,679) (4,017)

Key Definitions Managed and ConnectedDevices that are operated by our customers. End CustomersCustomers that contributed to Nayax revenue in the last 12 months. Recurring RevenueSAAS revenue and payment processing fees. Dollar-based net retention rateMeasured as a percentage of revenue from returning customers in a given year as compared to the revenue from such customers in the prior year, which reflects the increase in revenue and the rate of losses from customer churn. Revenue ChurnThe percentage of revenue lost as a result of customers leaving our platform in the last 12 months. Existing Customer ExpansionRevenue generated within a given cohort over the years presented. Each cohort represents customers from whom we received revenue for the first time, in a given year. Constant CurrencyNayax presents constant currency information to provide a framework for assessing how our underlying businesses performed excluding the effect of foreign currency rate fluctuations. Future expected results for transactions in currencies other than United States dollars are converted into United States dollars using the exchange rates in effect in the last month of the reporting period. Nayax provides this financial information to aid investors in better understanding our performance. These constant currency financial measures presented in this release should not be considered as a substitute for, or superior to, the measures of financial performance prepared in accordance with IFRS. Adjusted EBITDAAdjusted EBITDA is a non-IFRS financial measure that we define as loss for the period plus finance expenses, tax expense (benefit), depreciation and amortization, share-based compensation costs, non-recurring issuance costs and our share in losses of associates accounted for by the equity method.

Thank you! IR Contact: Aaron Greenberg Chief Strategy Officer Aarong@nayax.com Virgineas@nayax.com Virgineas@nayax.com Website: Ir.nayax.com