GOLUB CAPITAL BDC 4, INC. EARNINGS PRESENTATION QUARTER ENDED JUNE 30, 2023

2 Such forward-looking statements may include statements preceded by, followed by or that otherwise include the words “may,” “might,” “will,” “intend,” “should,” “could,” “can,” “would,” “expect,” “believe,” “estimate,” “anticipate,” “predict,” “potential,” “plan” or similar words. We have based the forward-looking statements included in this presentation on information available to us on the date of this presentation. Actual results could differ materially from those anticipated in our forward-looking statements and future results could differ materially from historical performance. We undertake no obligation to revise or update any forward-looking statements, whether as a result of new information, future events or otherwise. You are advised to consult any additional disclosures that we make directly to you or through reports that we have filed or in the future file with the Securities and Exchange Commission (“SEC”), including annual reports on Form 10-K, quarterly reports on Form 10-Q and current reports on Form 8-K. This presentation contains statistics and other data that have been obtained from or compiled from information made available by third-party service providers. We have not independently verified such statistics or data. In evaluating prior performance information in this presentation, you should remember that past performance is not a guarantee, prediction, or projection of future results, and there can be no assurance that we will achieve similar results in the future. Some of the statements in this presentation constitute forward-looking statements, which relate to future events or our future performance or financial condition. The forward-looking statements contained in this presentation involve risks and uncertainties, including statements as to: our future operating results; our business prospects and the prospects of our portfolio companies, including our and their ability to achieve our respective objectives due to disruptions, including those caused by global health pandemics, such as the COVID-19 pandemic, or other large scale events; the effect of investments that we expect to make and the competition for those investments; completion of a public offering of our securities or other liquidity event; our contractual arrangements and relationships with third parties; actual and potential conflicts of interest with GC Advisors LLC ("GC Advisors"), our investment adviser, and other affiliates of Golub Capital LLC (collectively, "Golub Capital"); the dependence of our future success on the general economy and its effect on the industries in which we invest; the ability of our portfolio companies to achieve their objectives; the use of borrowed money to finance a portion of our investments; the adequacy of our financing sources and working capital; the timing of cash flows, if any, from the operations of our portfolio companies; general economic and political trends and other external factors, changes in political, economic or industry conditions, the interest rate environment or conditions affecting the financial and capital markets that could result in changes to the value of our assets; elevating levels of inflation, and its impact on us, on our portfolio companies and on the industries in which we invest; the ability of GC Advisors to locate suitable investments for us and to monitor and administer our investments; the ability of GC Advisors or its affiliates to attract and retain highly talented professionals; the ability of GC Advisors to continue to effectively manage our business due to disruptions, including those caused by global health pandemics, such as the COVID-19 pandemic, or other large scale events; turmoil in Ukraine and Russia, including sanctions related to such turmoil, and the potential for volatility in energy prices and other supply chain issues and any impact on the industries in which we invest; our ability to qualify and maintain our qualification as a regulated investment company and as a business development company; the impact of information technology systems and systems failures, including data security breaches, data privacy compliance, network disruptions, and cybersecurity attacks; general price and volume fluctuations in the stock markets; the impact on our business of the Dodd-Frank Wall Street Reform and Consumer Protection Act and the rules and regulations issued thereunder and any actions toward repeal thereof; and the effect of changes to tax legislation and our tax position. Disclaimer

3 Summary of Quarterly Results – GBDC 4 generated an annualized net income return on equity1 of 17.6% and an annualized net investment income return on equity1 of 14.6% during the quarter ended June 30, 2023. – GBDC 4 has achieved an inception-to-date IRR2 on NAV of 11.9% through June 30, 2023. – For the quarter ended June 30, 2023, we made new investment commitments of $27.1 million in 4 portfolio companies. The fair value of investments as of June 30, 2023 was $226.8 million. Overall, total investments in portfolio companies at fair value increased by $28.3 million or 14.3%. – The annualized investment income yield3 for the three months ended June 30, 2023 was 12.3%, an increase from 11.7% for the three months ended March 31, 2023. – As of June 30, 2023, we had total investor capital subscriptions of $719.1 million and contributed capital of $99.4 million (13.8% called capital ratio). In addition, after quarter end, we issued one capital call for proceeds of $22.8 million. – Strong credit performance; over 99% of the investments in our portfolio at fair value have an Internal Performance Rating of 4 as of June 30, 2023 and there were no portfolio company investments on non-accrual. 1. Return on equity calculations are based on daily weighted average of total net assets during the period presented. 2. Internal rate of return (“IRR”) on net asset value (“NAV”) is calculated at the fund level using beginning of period NAV, capital share issuances during the period, distributions paid or payable during the period, and ending period NAV. Period beginning April 1, 2022 and ending June 30, 2023. The first investment in GBDC 4 took place on April 1, 2022. These returns do not represent an actual return to any investor in the Company. 3. Investment income yield is calculated as (a) the actual amount earned on earning investments, including interest and fee income and accrued PIK/non-cash dividend income but excluding amortization of capitalized fees and discounts, divided by the (b) daily average of total earning investments at fair value.

4 Summary of Quarterly Results (cont’d) Quarter Ended June 30, 2022 September 30, 2022 December 31, 2022 March 31, 2023 June 30, 2023 Select Financial Data New investment commitments $69,138,900 $72,863,044 $60,758,681 $39,551,821 $27,050,559 Fair value of investments $52,404,020 $112,535,125 $166,693,746 $198,435,129 $226,769,501 Net income (loss) $179,197 $543,327 $2,110,085 $4,218,711 $4,418,745 Net investment income after tax $184,149 $1,046,219 $2,251,717 $3,030,541 $3,668,071 Earnings (loss) per weighted average share1 $0.15 $0.15 $0.40 $0.69 $0.65 Net investment income per weighted average share1 $0.16 $0.29 $0.43 $0.50 $0.54 Annualized return on equity – net investment income2 4.1% 7.7% 11.4% 13.4% 14.6% Annualized return on equity – net income2 4.0% 4.0% 10.7% 18.7% 17.6% Asset Mix of New Originations Senior Secured 0%* 2% 0%* 0% 0% One Stop 97% 97% 97% 99% 100% Junior Debt3 0% 0% 0%* 0% 0% Equity 3% 1% 3% 1% 0% * Represents an amount less than 1% 1. Per share returns are calculated based on the daily weighted average shares outstanding during the period presented. Due to the significant changes in net assets, net investment income and net income that may occur quarter-to-quarter as a result of Golub Capital BDC 4 Inc. (“we”, “us”, “our”, the “Company” or “GBDC 4”) commencing operations on April 1, 2022, per share amounts may fluctuate significantly from quarter-to-quarter and quarterly comparisons may not be meaningful. 2. Return on equity calculations are based on daily weighted average of total net assets during the period presented. 3. Junior debt consists of second lien and subordinated debt.

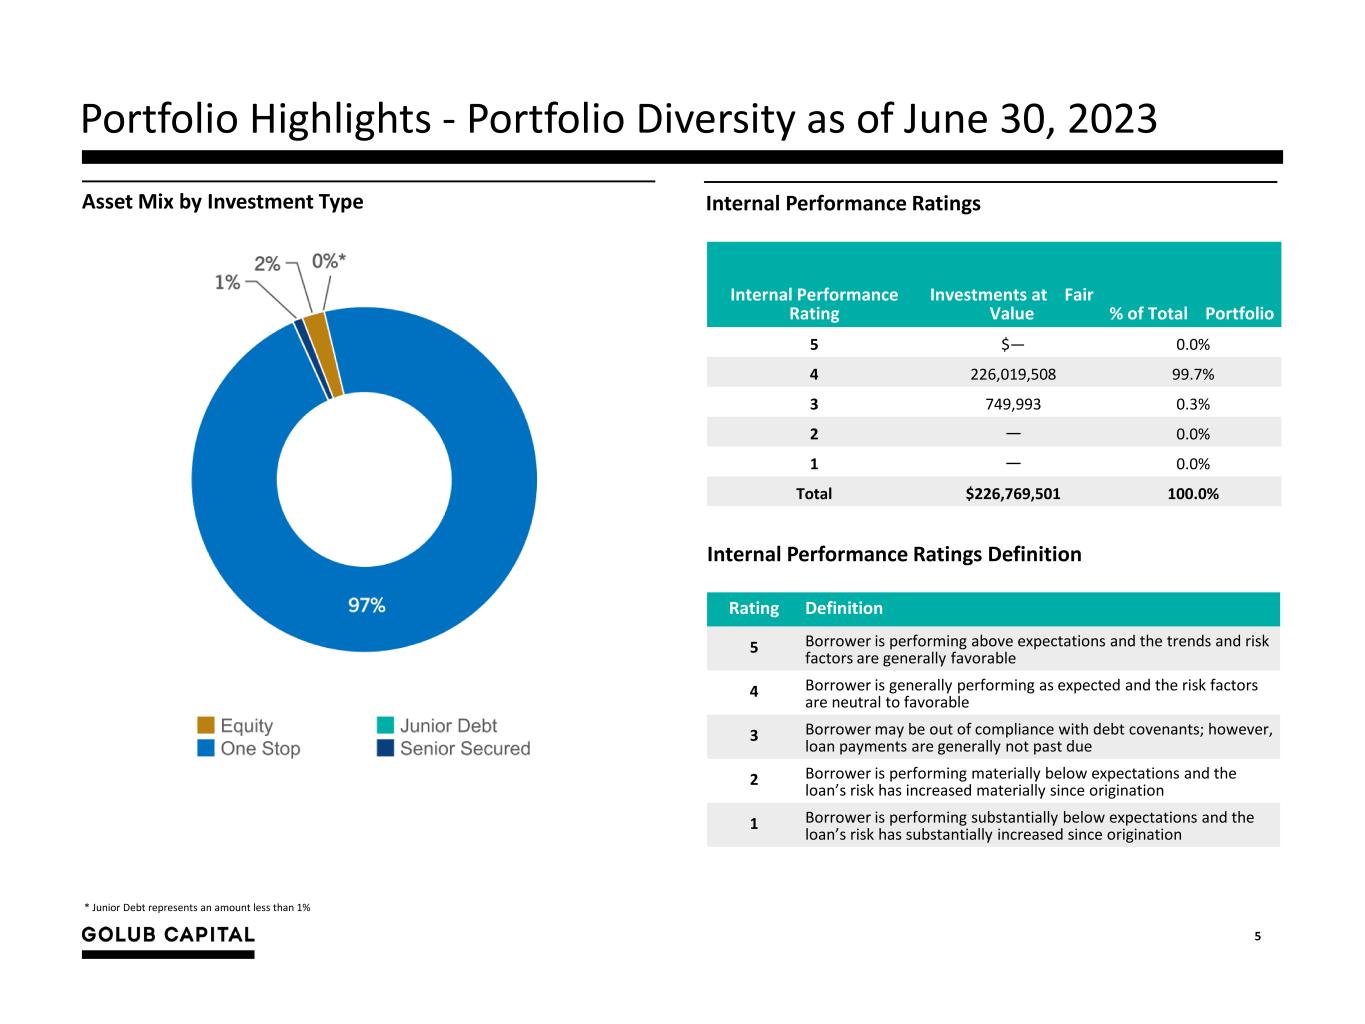
5 Portfolio Highlights - Portfolio Diversity as of June 30, 2023 Asset Mix by Investment Type Internal Performance Ratings Internal Performance Rating Investments at Fair Value % of Total Portfolio 5 $— 0.0% 4 226,019,508 99.7% 3 749,993 0.3% 2 — 0.0% 1 — 0.0% Total $226,769,501 100.0% Internal Performance Ratings Definition Rating Definition 5 Borrower is performing above expectations and the trends and risk factors are generally favorable 4 Borrower is generally performing as expected and the risk factors are neutral to favorable 3 Borrower may be out of compliance with debt covenants; however, loan payments are generally not past due 2 Borrower is performing materially below expectations and the loan’s risk has increased materially since origination 1 Borrower is performing substantially below expectations and the loan’s risk has substantially increased since origination * Junior Debt represents an amount less than 1%

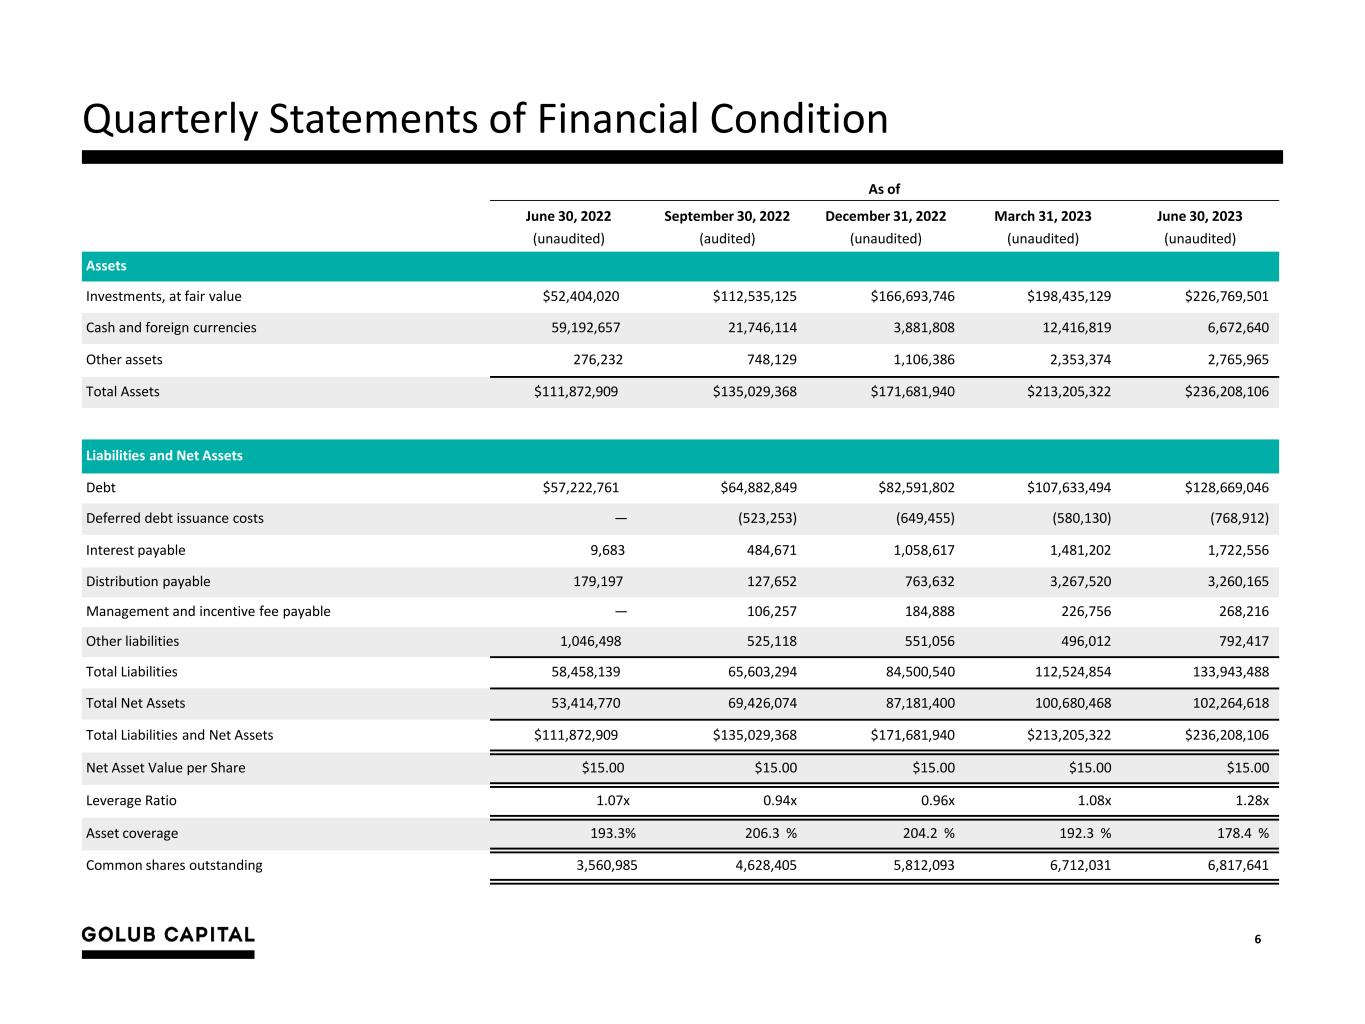
6 Quarterly Statements of Financial Condition As of June 30, 2022 September 30, 2022 December 31, 2022 March 31, 2023 June 30, 2023 (unaudited) (audited) (unaudited) (unaudited) (unaudited) Assets Investments, at fair value $52,404,020 $112,535,125 $166,693,746 $198,435,129 $226,769,501 Cash and foreign currencies 59,192,657 21,746,114 3,881,808 12,416,819 6,672,640 Other assets 276,232 748,129 1,106,386 2,353,374 2,765,965 Total Assets $111,872,909 $135,029,368 $171,681,940 $213,205,322 $236,208,106 Liabilities and Net Assets Debt $57,222,761 $64,882,849 $82,591,802 $107,633,494 $128,669,046 Deferred debt issuance costs — (523,253) (649,455) (580,130) (768,912) Interest payable 9,683 484,671 1,058,617 1,481,202 1,722,556 Distribution payable 179,197 127,652 763,632 3,267,520 3,260,165 Management and incentive fee payable — 106,257 184,888 226,756 268,216 Other liabilities 1,046,498 525,118 551,056 496,012 792,417 Total Liabilities 58,458,139 65,603,294 84,500,540 112,524,854 133,943,488 Total Net Assets 53,414,770 69,426,074 87,181,400 100,680,468 102,264,618 Total Liabilities and Net Assets $111,872,909 $135,029,368 $171,681,940 $213,205,322 $236,208,106 Net Asset Value per Share $15.00 $15.00 $15.00 $15.00 $15.00 Leverage Ratio 1.07x 0.94x 0.96x 1.08x 1.28x Asset coverage 193.3% 206.3 % 204.2 % 192.3 % 178.4 % Common shares outstanding 3,560,985 4,628,405 5,812,093 6,712,031 6,817,641

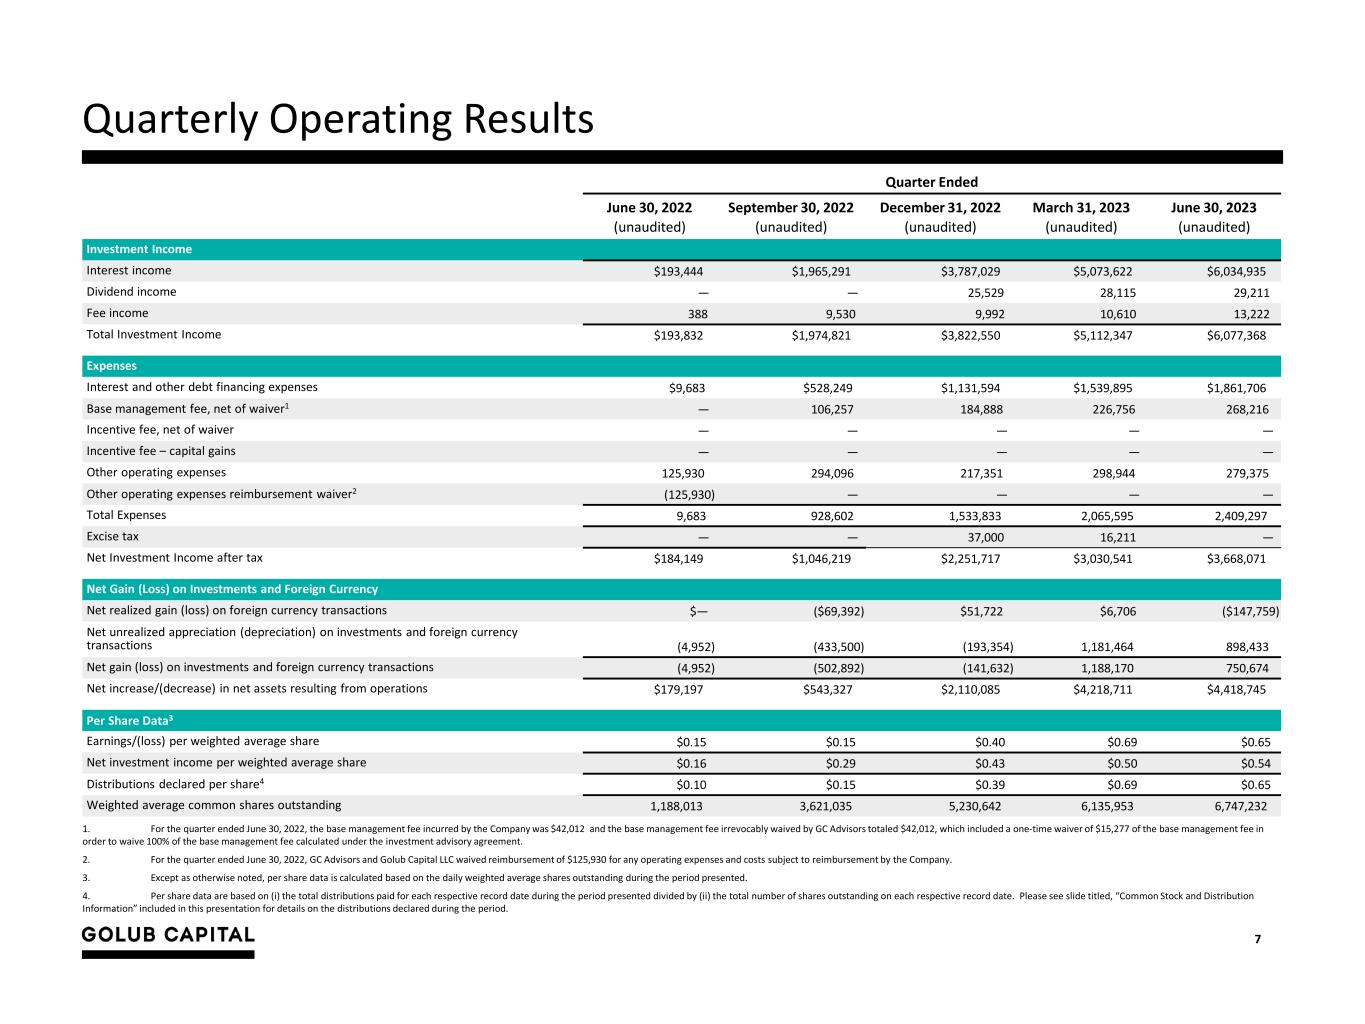
7 Quarterly Operating Results Quarter Ended June 30, 2022 September 30, 2022 December 31, 2022 March 31, 2023 June 30, 2023 (unaudited) (unaudited) (unaudited) (unaudited) (unaudited) Investment Income Interest income $193,444 $1,965,291 $3,787,029 $5,073,622 $6,034,935 Dividend income — — 25,529 28,115 29,211 Fee income 388 9,530 9,992 10,610 13,222 Total Investment Income $193,832 $1,974,821 $3,822,550 $5,112,347 $6,077,368 Expenses Interest and other debt financing expenses $9,683 $528,249 $1,131,594 $1,539,895 $1,861,706 Base management fee, net of waiver1 — 106,257 184,888 226,756 268,216 Incentive fee, net of waiver — — — — — Incentive fee – capital gains — — — — — Other operating expenses 125,930 294,096 217,351 298,944 279,375 Other operating expenses reimbursement waiver2 (125,930) — — — — Total Expenses 9,683 928,602 1,533,833 2,065,595 2,409,297 Excise tax — — 37,000 16,211 — Net Investment Income after tax $184,149 $1,046,219 $2,251,717 $3,030,541 $3,668,071 Net Gain (Loss) on Investments and Foreign Currency Net realized gain (loss) on foreign currency transactions $— ($69,392) $51,722 $6,706 ($147,759) Net unrealized appreciation (depreciation) on investments and foreign currency transactions (4,952) (433,500) (193,354) 1,181,464 898,433 Net gain (loss) on investments and foreign currency transactions (4,952) (502,892) (141,632) 1,188,170 750,674 Net increase/(decrease) in net assets resulting from operations $179,197 $543,327 $2,110,085 $4,218,711 $4,418,745 Per Share Data3 Earnings/(loss) per weighted average share $0.15 $0.15 $0.40 $0.69 $0.65 Net investment income per weighted average share $0.16 $0.29 $0.43 $0.50 $0.54 Distributions declared per share4 $0.10 $0.15 $0.39 $0.69 $0.65 Weighted average common shares outstanding 1,188,013 3,621,035 5,230,642 6,135,953 6,747,232 1. For the quarter ended June 30, 2022, the base management fee incurred by the Company was $42,012 and the base management fee irrevocably waived by GC Advisors totaled $42,012, which included a one-time waiver of $15,277 of the base management fee in order to waive 100% of the base management fee calculated under the investment advisory agreement. 2. For the quarter ended June 30, 2022, GC Advisors and Golub Capital LLC waived reimbursement of $125,930 for any operating expenses and costs subject to reimbursement by the Company. 3. Except as otherwise noted, per share data is calculated based on the daily weighted average shares outstanding during the period presented. 4. Per share data are based on (i) the total distributions paid for each respective record date during the period presented divided by (ii) the total number of shares outstanding on each respective record date. Please see slide titled, “Common Stock and Distribution Information” included in this presentation for details on the distributions declared during the period.

8 Common Stock and Distribution Information Distributions Paid and Payable Date Declared Record Date Earnings Period Shares Outstanding Payment Date Amount Per Share Total Amount May 6, 2022 May 6, 2022 April 2022 790,311.130 July 8, 2022 $0.0016 $1,279 May 6, 2022 May 20, 2022 May 2022 790,311.130 July 8, 2022 0.0267 21,078 May 6, 2022 June 24, 2022 June 2022 2,109,679.461 September 15, 2022 0.0743 156,840 Total for Quarter Ended June 30, 2022 $0.1026 $179,197 May 6, 2022 July 19, 2022 July 2022 3,561,658.364 September 15, 2022 $0.1167 $415,675 August 5, 2022 August 30, 2022 August 2022 3,561,658.364 November 23, 2022 0.0104 37,086 August 5, 2022 September 20, 2022 September 2022 3,573,803.940 November 23, 2022 0.0253 90,566 Total for Quarter Ended September 30, 2022 $0.1524 $543,327 August 5, 2022 October 18, 2022 October 2022 4,628,404.940 December 29, 2022 $0.1396 $646,322 November 18, 2022 November 21, 2022 November 2022 5,778,605.940 December 29, 2022 0.1212 700,131 November 18, 2022 December 15, 2022 December 2022 5,781,263.768 March 1, 2023 0.1321 763,632 Total for Quarter Ended December 31, 2022 $0.3929 $2,110,085 November 18, 2022 January 17, 2023 January 2023 5,812,093.348 March 22, 2023 $0.1637 $951,191 February 7, 2023 February 24, 2023 February 2023 5,812,093.348 May 24, 2023 0.2509 1,458,101 February 7, 2023 March 17, 2023 March 2023 6,689,639.198 May 24, 2023 0.2705 1,809,419 Total for Quarter Ended March 31, 2023 $0.6851 $4,218,711 February 7, 2023 April 28, 2023 April 2023 6,712,031.176 June 22, 2023 $0.1726 $1,158,580 May 5, 2023 May 26, 2023 May 2023 6,789,714.019 August 23, 2023 0.1769 1,200,947 May 5, 2023 June 16, 2023 June 2023 6,789,714.019 August 23, 2023 0.3033 2,059,218 Total for Quarter Ended June 30, 2023 $0.6528 $4,418,745

9 Common Stock and Distribution Information (cont’d) Distributions Declared Date Declared Record Date Earnings Period Shares Outstanding Payment Date Amount Per Share Total Amount May 5, 2023 July 28, 2023 July 20231 6,817,641.186 September 20, 2023 TBD TBD August 3, 2023 August 30, 2023 August 20232 TBD November 21, 2023 TBD TBD August 3, 2023 September 22, 2023 September 20233 TBD November 21, 2023 TBD TBD August 3, 2023 October 20, 2023 October 20234 TBD December 27, 2023 TBD TBD 1. On May 5, 2023, our board of directors declared a distribution in an amount (if positive) such that our net asset value as of July 31, 2023 on a pro forma basis after giving effect to the net increase in net assets resulting from operations earned by us (if positive) as determined in accordance with GAAP for the period July 1, 2023 through July 31, 2023 and the payment of this distribution is $15.00 per share. 2. On August 3, 2023, our board of directors declared a distribution in an amount (if positive) such that our net asset value as of August 31, 2023 on a pro forma basis after giving effect to the net increase in net assets resulting from operations earned by us (if positive) as determined in accordance with GAAP for the period August 1, 2023 through August 31, 2023 and the payment of this distribution is $15.00 per share. 3. On August 3, 2023, our board of directors declared a distribution in an amount (if positive) such that our net asset value as of September 30, 2023 on a pro forma basis after giving effect to the net increase in net assets resulting from operations earned by us (if positive) as determined in accordance with GAAP for the period September 1, 2023 through September 30, 2023 and the payment of this distribution is $15.00 per share. 4. On August 3, 2023, our board of directors declared a distribution in an amount (if positive) such that our net asset value as of October 31, 2023 on a pro forma basis after giving effect to the net increase in net assets resulting from operations earned by us (if positive) as determined in accordance with GAAP for the period October 1, 2023 through October 31, 2023 and the payment of this distribution is $15.00 per share.


