![exhibit991p1i0](https://capedge.com/proxy/8-K/0001562762-22-000320/exhibit991p1i0.jpg)
1
Exhibit 99.1 U.S. CENTURY BANK
![exhibit991p2i0](https://capedge.com/proxy/8-K/0001562762-22-000320/exhibit991p2i0.jpg)
2
Forward-Looking Statements This presentation may contain statements that are not historical in nature and are intended to be, and are hereby identified as, forward-looking statements for purposes of the safe harbor provided by Section 21E of the Securities Exchange Act of 1934, as amended. The words “may,” “will,” “anticipate,” “should,” “would,” “believe,” “contemplate,” “expect ,” “aim,” “plan,” “estimate,” “continue,” and “intend,” as well as other similar words and expressions of the future, are intended to identify forward-looking statements. These forward-looking statements include statements related to our projected growth, anticipated future financial performance, and management’s long-term performance goals, as well as statements relating to the anticipated effects on results of operations and financial condition from expected developments or events, or business and growth strategies, including anticipated internal growth. These forward-looking statements involve significant risks and uncertainties that could cause our actual results to differ materially from those anticipated in such statements. Potential risks and uncertainties include, but are not limited to: • the strength of the United States economy in general and the strength of the local economies in which we conduct operations; • the continuation of the COVID-19 pandemic and its impact on us, our employees, customers and third-party service providers, and the ultimate extent of the impacts of the pandemic and related government stimulus programs; • our ability to successfully manage interest rate risk, credit risk, liquidity risk, and other risks inherent to our industry; • the accuracy of our financial statement estimates and assumptions, including the estimates used for our credit loss reserve and deferred tax asset valuation allowance; • the efficiency and effectiveness of our internal control environment; • our ability to comply with the
extensive laws and regulations to which we are subject, including the laws for each jurisdiction where we operate; • legislative or regulatory changes and changes in accounting principles, policies, practices or guidelines, including the effects of the forthcoming implementation of the Current Expected Credit Losses (“CECL”) standard; • the effects of our lack of a diversified loan portfolio and concentration in the South Florida market, including the risks of geographic, depositor, and industry concentrations, including our concentration in loans secured by real estate; • the concentration of ownership of our Class A common stock; • fluctuations in the price of our Class A common stock; • our ability to fund or access the capital markets at attractive rates and terms and manage our growth, both organic growth as well as growth through other means, such as future acquisitions; • inflation, interest rate, unemployment rate, market, and monetary fluctuations; • increased competition and its effect on the pricing of our products and services as well as our interest rate margin; • the effectiveness of our risk management strategies, including operational risks, including, but not limited to, client, employee, or third-party fraud and security breaches; and • other risks described in this presentation and other filings we make with the Securities and Exchange Commission (“SEC”). All forward-looking statements are necessarily only estimates of future results, and there can be no assurance that actual results will not differ materially from expectations. Therefore, you are cautioned not to place undue reliance on any forward-looking statements. Further, forward -looking statements included in this presentation are made only as of the date hereof, and we undertake no obligation to update or revise any forward-looking statement to reflect events or circumstances after the date on which the statement is made or to reflect the
occurrence of unanticipated events, unless required to do so under the federal securities laws. You should also review the risk factors described in the reports USCB Financial Holdings, Inc. filed or will file with the SEC and, for periods prior to the completion of the bank holding company reorganization in December 
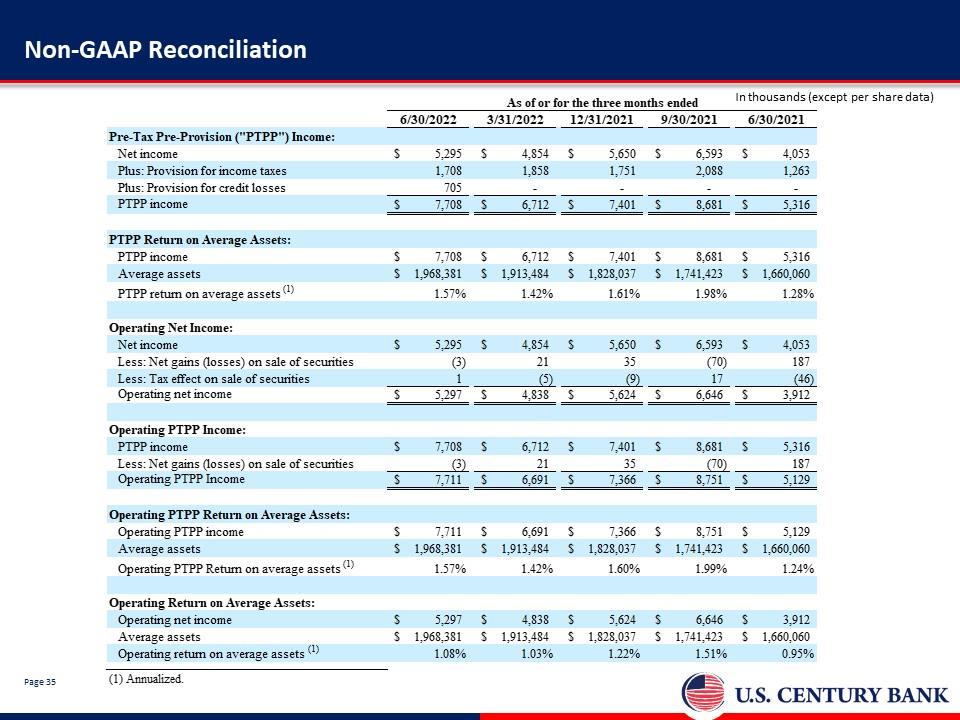
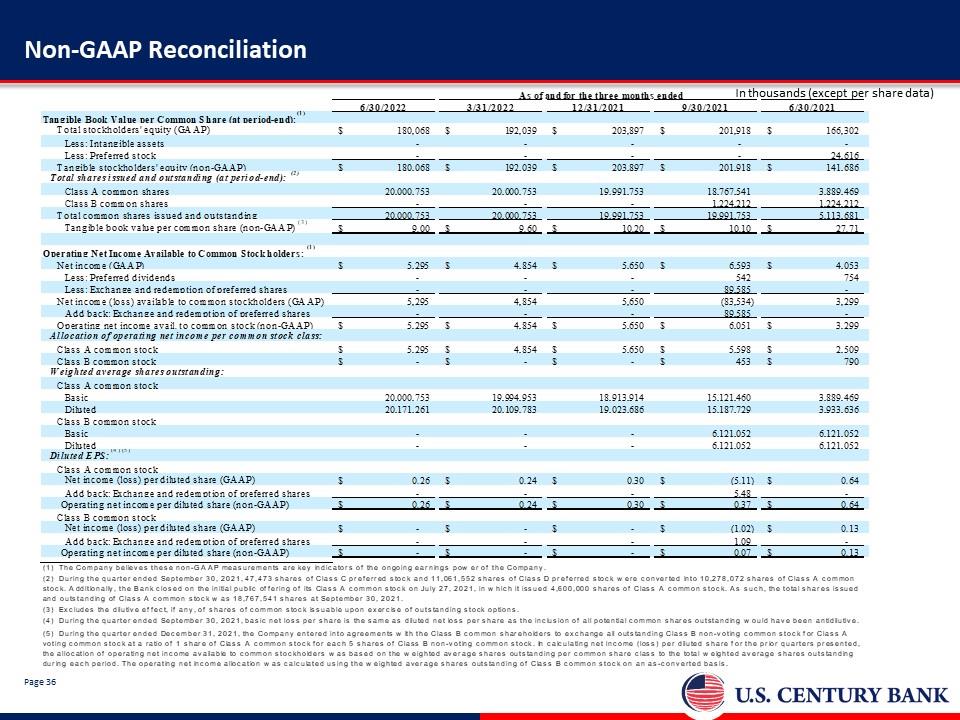
31, 2021, U.S Century Bank filed with the FDIC. Non-GAAP Financial Measures This presentation includes financial information determined by methods other than in accordance with generally accepted accounting principles (“GAAP”). This financial information includes certain operating performance measures. Management has included these non-GAAP measures because it believes these measures may provide useful supplemental information for evaluating the Company’s underlying performance trends. Further, management uses these measures in managing and evaluating the Company’s business and intends to refer to them in discussions about our operations and performance. Operating performance measures should be viewed in addition to, and not as an alternative to or substitute for, measures determined in accordance with GAAP, and are not necessarily comparable to non-GAAP measures that may be presented by other companies. To the extent applicable, reconciliations of these non-GAAP measures to the most directly comparable GAAP measures can be found in the ‘Non-GAAP Reconciliation Tables’ included in the presentation. You should assume that all numbers are unaudited unless otherwise noted. Page 2 U.S. CENTURY BANK
![exhibit991p3i0](https://capedge.com/proxy/8-K/0001562762-22-000320/exhibit991p3i0.jpg)
3
Table of Contents 1 Who We Are 2 Growth Strategy 3 Financial Review 4 Appendix Page 3 U.S. CENTURY BANK
![exhibit991p4i0](https://capedge.com/proxy/8-K/0001562762-22-000320/exhibit991p4i0.jpg)
4
We are a Relationship-First, Business Bank Company Overview Founded in 2002, U.S. Century Bank is a state-chartered bank headquartered in South Florida 6th largest Florida headquartered bank by deposits in Miami Dade County as of June 30, 2021. (1) Full service commercial bank offering products and services tailored to meet the needs of Small-to-Medium Sized Businesses (“SMBs”) and catering to the needs of local business owners, entrepreneurs and professionals in South Florida Relationship-first, business bank that prioritizes building a strong relationship with the owners and operators of SMBs and securing their personal retail deposit relationships in addition to the commercial account Differentiated competitive approach includes specialty banking services offered to homeowner associations, professional services firms, and correspondent banking services offered to financial institutions in Latin America and the Caribbean meeting our risk profile Proven executive management team with extensive local experience and a board of directors with significant banking expertise Designated a Minority Depository Institution (“MDI”) Board of directors is majority Hispanic, management team is predominantly Hispanic, and the majority of employees are bilingual or multilingual, providing U.S. Century Bank with cultural familiarity with its markets and clients Financial Highlights Q2 2022 Balance Sheet (EOP) Total Securities $456,135 Total Loans (1) $1,372,733 Total Assets $2,016,086 Total Deposits $1,738,720 Total Equity $180,068 Net Interest Income $15,642 Non-interest Income $1,617 Revenue $17,259 Provision for Credit Losses $705 Non-interest Expense $9,551 Net Income $5,295 Income Statement Diluted Earning Per Share (EPS) Class A Common Stock $0.26 Diluted Operating EPS (2) Class A Common Stock $0.26 Return On Average Assets (ROAA) (3) 1.08% Return On Average
Equity (ROAE) (3) 11.38% Net Interest Margin (3) 3.37% Efficiency Ratio 55.34% Branch Network Boca Raton Coral Springs Pompano Fort Lauderdale Pembroke Pines Miami Coral Gables Key Largo U.S. Century Bank: 10 Branches (1) FDIC Deposit Market Share Report as of 6/30/21. (2) Non-GAAP Measure. (3) Annualized. Page 4 U.S. CENTURY BANK
![exhibit991p5i0](https://capedge.com/proxy/8-K/0001562762-22-000320/exhibit991p5i0.jpg)
5
We Know Our Markets and Clients Florida is one of the largest business markets in the country Ranked third in the United States in 2020 for the number of businesses employing fewer than 500 people, according to data from the U.S. Small Business Administrat ion’s Office of Advocacy for 2020 Approximately 2.7 million such businesses In a 2020 study, Florida ranked #1 on Kauffman’s Early Stage Entrepreneurship Index Miami-Dade MSA is the premier market within the state of Florida Ranked #1 on the 2017 Kauffman Index for Startup Activity The favorable business environment in Florida has made Miami-Dade a top destination for corporate relocations Blackstone Group Inc., Goldman Sachs Group Inc. and Citadel Advisors LLC., have all established operations in South Florida Our headquarters is Doral, a vibrant and rapidly growing market. Accolades include: Ranked #3 in The Best Small Cities to Start a Small Business: 2021 Report (Verizon) Named the fastest growing city in Florida and 11th in the country: May 2017 (Florida International University’s Metropolitan Center) Best city in Florida for business start-ups: February 2015 (BusinessWeek) South Florida represents an important part of the convergence of Latin America, the Caribbean, Europe, and Asia According to S&P Global Market Intelligence, approximately 68% of Miami-Dade and Broward Counties is Hispanic Cubans represent the greatest percentage of the Hispanic community in Miami-Dade and Broward Counties A diverse and vibrant economy Miami-Dade MSA has a rapidly growing population Business-friendly tax structures, no personal income tax and a reasonable cost of living attract businesses to Florida 18 Fortune 500 companies are located in Florida, with 7 in the Miami-Dade MSA We Know Our Markets We are the 6th largest FL bank in Miami-Dade County by deposits (1) We are one of 32 banks
headquartered in the Miami-Dade MSA We are the ONLY bank headquartered in Doral, Miami-Dade County We Know Our Clients Our Management team is predominantly Hispanic Our Board has strong ties to the Community Most of our associates are bilingual Source: S&P Global Market Intelligence, U.S. Small Business Administration’s Office of Advocacy for 2020, North American Industry Classification System (NAICS) database, U.S. Census Bureau, Fortune Magazine, Bureau of Economic Analysis (1) FDIC Deposit Market Share Report. Page 5 U.S. CENTURY BANK
![exhibit991p6i0](https://capedge.com/proxy/8-K/0001562762-22-000320/exhibit991p6i0.jpg)
6
We Know Our Markets and Clients Household Income Projected Growth 2022-2027 (1) Miami leads expectations of income growth with a 5-year growth rate of 16.98%. 9 cities within the current USCB network are expected to have growth greater than the US and Florida averages Miami-Dade MSA is the premier market within the state of Florida The Miami-Dade metro area is the tenth largest MSA in the United States by total number of businesses, per the North American Industry Classification System (NAICS) database USCB network US A & Florida growth rates 18.00% 17.00% 16.00% 15.00% 14.00% 13.00% 12.00% 11.00% 10.00% 9.00% 8.00% 11.74% 11.90% 11.97% 12.02% 12.05% 12.10% 12.35% 12.39% 12.81% 13.20% 13.24% 13.26% 13.32% 13.37% 13.46% 13.47% 13.78% 13.99% 14.04% 14.16% 15.34% 15.61% 16.98% Tampa Coral Springs Palm Bay Jacksonville Hollywood US Florida Pembroke Pines Hialeah Davie Spring Hill Tallahassee Miramar Cape Coral Pompano Beach West Palm Beach Orlando Clearwater Saint Petersburg Miami Gardens Fort Lauderdale Port Sant Lucie Miami Source: S&P Global Market Intelligence. Page 6 U.S. CENTURY BANK
![exhibit991p7i0](https://capedge.com/proxy/8-K/0001562762-22-000320/exhibit991p7i0.jpg)
7
Evolution of U.S. Century Bank 1st Recapitalization 2014 – 2015 Entered into consent order with regulators in 2011 Significant deterioration in asset quality, capital, and financial performance at that time Recapitalization completed in March 2015 $65 million investment led by Patriot Financial Partners and Priam LLC Approximately $48M of net capital to the Bank, in the form of common and preferred stock Approximately $12.2M paid to the U.S. Treasury for the purchase of TARP securities Rebuild, Repair and Execute 2018 – Today Replaced entire legacy management team and reconstituted the Board with 7 new directors Added key personnel with relevant experience in growing a sound, scalable and profitable bank Average length of service for ~85% of associates is less than six years Reconstructed the credit function of the Bank and implemented robust underwriting standards and procedures All key credit and underwriting personnel were replaced Successfully resolved the Bank’s problem assets balances Consent order terminated in April 2016. Maintained a disciplined expense philosophy with a focus on branch optimization Completed the initial public offering (“IPO”) and issued 4,600,000 shares of Class A common stock, the Bank received total net proceeds of $42 million Formed a bank holding company on December 30, 2021 Simplified capital structure and only have Class A common stock outstanding as of June 30, 2022 Who We Were vs. Who We Are Recapitalization (FY 2014) Q2 2022 DEPOSIT FRANCHISE # of Branches 21 10 Non-interest-Bearing Deposits/Deposits 22.10% 37.60% CAPITAL & ASSET QUALITY Total Risk-Based Capital Ratio 6.60% 13.74% NPAs / Assets 6.04% 0.00% BALANCE SHEET Total Assets $835 $2,016 Total Loans $715 $1,373 Total Deposits $761 $1,739 PROFITABILITY ROAA (0.94%) 1.08% (1) Operating Pre-Tax Pre Provision ROAA (2)
(0.44%) 1.57% (1) Efficiency Ratio 111.20% 55.34% (1) Annualized. (2) Non-GAAP Financial Measure. .Page 7 U.S. CENTURY BANK
![exhibit991p8i0](https://capedge.com/proxy/8-K/0001562762-22-000320/exhibit991p8i0.jpg)
8
Seasoned Management Team with Local Banking Experience Management Team Luis de la Aguilera President, CEO & Director Previously President & CEO of TotalBank 40+ years in banking Rob Anderson Chief Financial Officer Previously CFO of Capstar Financial Holdings 18+ years in banking Benigno Pazos Chief Credit Officer Previously CCO of TotalBank 30+ years in banking Oscar Gomez Head of Global Banking Division Previously at Regions Bank 30+ years in banking Nicholas Bustle Chief Lending Officer Previously at Valley Bank 35+ years in banking Andres Collazo Director of Operations & IT Systems Previously at TotalBank 33+ years in banking Martha Guerra-Kattou Director of Sales & Marketing Previously at TotalBank 30+ years in banking Board of Director s Aida Levitan Chairwoman of the Board Former CEO, Publicis Sanchez & Levitan Director since 2013 Kirk Wycoff Board Member Managing Partner, Patriot Financial Partners, L.P. Director since 2015 Howard Feinglass Board Member Managing Partner, Priam Capital Director since 2015 Robert E. Kafafian Board Member CEO, The Kafafian Group, Inc. Director since 2022 Ramón Abadin Board Member Partner, Ramon A. Abadin P.A. Director since 2017 Bernardo Fernandez, Jr. Board Member CEO, Baptist Health Medical Group Director since 2017 Maria C. Alonso Board Member Business executive & Philanthropic leader Director since 2022 Ramon A. Rodriguez Board Member CEO, Cable Insurance Director since 2022 Highly Accomplished and Aligned Board with Complementary Track Records Page 8 U.S. CENTURY BANK
![exhibit991p9i0](https://capedge.com/proxy/8-K/0001562762-22-000320/exhibit991p9i0.jpg)
9
We Are a Business Bank Commercial Banking Focused on servicing small/medium-sized businesses within branch footprint Offer relationship retail deposit products to owners and operators of SMBs Ability for customers to access accounts through online and mobile banking platforms Credit products include Asset Based Loans, Lines of Credit and Term Loans Provide Treasury Management services to clients Relationship-driven with flexible solutions tailored to each client’s need Loan Mix Global banking 6% Commercial and industrial 10% CRE - Non-owner occupied 51% CRE - Owner occupied 10% Consumer and other 8% Residential real estate 15% Deposit Mix Time Deposits 12% Non-interest-bearing deposits 38% Money market and savings accounts 46% Interest-bearing deposits NOW 4% Private Client Group $178mm Deposits Tailored products & services for law offices, managing partners, associates and other staff members Commercial deposit accounts, treasury management, commercial lending, student loan refinancing, residential loans and credit card services Association Banking $76mm Deposits / $64mm Loans Banking for Homeowner Associations and Property Managers Offer deposit collection services and lending solutions ranging from insurance premium and large capital improvements financing Significant lending capacity to target large credits SBA / Small Business Lending $54mm Loans Relationship-oriented business focused on delivering fast loan commitments to small and medium-sized enterprises Predominately small business line of credits and CD secured loans Affordable SBA loan provider Approved by the SBA to participate in the Preferred Lenders Program Global Banking $150mm Deposits / $85mm Loans Comprehensive range of both domestic and international services with the latest in technology to ensure quick processing Focus on Caribbean and Latin
American countries Correspondent banking services include letters of credit, foreign collections, wire transfers, ForEx and trade finance Yacht Financing $96mm Loans Yacht financing for larger vessels, transaction range is $750k - $7.5MM. Brokered-oriented business, 3 vendor approved brokers Member of the National Marine Lenders Association Balances as of 6/30/2022 Page 9 U.S. CENTURY BANK
![exhibit991p10i0](https://capedge.com/proxy/8-K/0001562762-22-000320/exhibit991p10i0.jpg)
10
Risk Management Risk Management Philosophy and Culture Management has instilled a culture of adherence to well-developed risk management procedures Management is responsible for day-to-day risk management (identifying, evaluating, and addressing potential risks that may exist at the enterprise, strategic, financial, operational, compliance and reporting levels) Risk management division consists of four individuals covering enterprise risk management, cybersecurity, third -party risk, internal audit and loan reviews Compliance division consists of seventeen individuals covering bank secrecy, consumer compliance and investigations Both areas play an active role in assessing corporate risks, compliance and collaborating with management to mitigate identified risks Heightened focus on BSA / AML / KYC compliance due to foreign exposure Individual country loan exposure limited to 0% - 70% of total capital based on individual country risk Global banking services offered exclusively to institutions in countries meeting U.S. Century Bank’s robust risk tolerance framework Highly experienced compliance team with international compliance experience from larger banking institutions Audit Committee consists of 4 members responsible for complete oversight of Company’s risk management process: Bernardo Fernandez, Ramón Abadin, Aida Levitan, and Ramon Rodriguez (Chair). Credit Philosophy Conservative credit culture that encourages prudent and desirable loans over unchecked growth Underwriting strength stems from deep understanding of U.S. Century’s market, long-standing relationships with clients, and disciplined process Focused on maintaining a well-diversified and conservative loan portfolio Robust Credit Administration Underwriting group supported by experienced credit officers with both credit and lending experience Effective and independent loan review Credit Committee
meetings conduct in-depth loan portfolio monitoring, including concentration limits Active monitoring and reporting on existing or emerging concentrations and targeted reviews of any higher risk portfolios COVID-19 Pandemic Response Credit approach proved successful at protecting the balance sheet: currently, no loans are under COVID-19 related deferrals Proactively repositioned three lenders with prior special asset experience to focus on asset work-out strategies for COVID-19 impacted industries Moved expeditiously to provide assistance to clients on a case-by-case basis Source: Bank documents Page 10 U.S. CENTURY BANK
![exhibit991p11i0](https://capedge.com/proxy/8-K/0001562762-22-000320/exhibit991p11i0.jpg)
11
Achieving Our Profitability Targets: Technology Initiatives 2016 2017 2018 2019 2020 2021 Paperless Account Opening lanuary '16- April '16 eTran International letter Of Credit April'16-luly '16 / Reporting Database May '16 - September '16 —— Instant Issue Debit Card ‘ -“■once October '16 - March '17 > r F¡S Cash Management Portal August '16 - March '17 > f (S) Fedlink Anywhere Sentrmher ‘,7 N y V 's / — —\ f —\ ' \ Network In-housing lanuaiy '18 - September '18 e . Secureworks MSSP Secureworks www-^^vw. lanuaiy 18 - May 18 Microsoft Off ICE 36S February '18- September '18 FT Horizon Core Conversion September '18 - September '19 Zelle I Zelle P2P vsrvw 1 lune '19 - November ‘19
✓
![exhibit991p12i0](https://capedge.com/proxy/8-K/0001562762-22-000320/exhibit991p12i0.jpg)
12
Table of Contents 1 Who We are 2 Growth Strategy 3 Financial Review 4 Appendix Page 12 U.S. CENTURY BANK
![exhibit991p13i0](https://capedge.com/proxy/8-K/0001562762-22-000320/exhibit991p13i0.jpg)
13
Growth Strategies and Capital Deployment Opportunities Organic Loan Growth: Take advantage of platform that we have developed post recap, capitalize on fragmented South Florida community banking market, and continue to build market share Capitalize on inherent advantages over smaller community banks which lack our product expertise and breadth of service Due to significant consolidation, there exists a base of potential clients that desire to partner with a bank that is locally headquartered Team Lift-outs: Continue to bring in top tier talent to U.S. Century Bank, with teams attracted to culture, public currency and local decision making Overall growth success will depend upon our ability to attract, retain, develop, incentivize, and reward the human capital necessary to execute growth strategy Public currency may allow U.S. Century Bank to structure attractive stock-based incentive compensation to attract top tier talent Asset Purchases: Portfolio loan purchases from companies exiting non-core lines of business; opportunistic to organic growth initiatives Net capital generated in IPO can serve as dry powder to facilitate meaningfully sized portfolio acquisitions Proactively evaluating portfolio opportunities that are consistent with U.S. Century’s credit philosophy Strategic Acquisitions: Become an active acquirer for Florida banks looking to find a partner Focused on strategic, financially attractive acquisitions which support U.S. Century Bank’s organic growth strategy without compromising the risk profile Numerous potential partners in South Florida that may seek liquidity Public currency will make U.S. Century Bank better positioned to offer stock consideration Page 13 U.S. CENTURY BANK
![exhibit991p14i0](https://capedge.com/proxy/8-K/0001562762-22-000320/exhibit991p14i0.jpg)
14
Table of Contents 1 Who We are 2 Growth Strategy 3 Financial Review 4 Appendix Page 14 U.S. CENTURY BANK
![exhibit991p15i0](https://capedge.com/proxy/8-K/0001562762-22-000320/exhibit991p15i0.jpg)
15
Historical Financial Data Total Loans (1) in Millions $735 $1,373 2016 2017 2018 2019 2020 2021 Q1 Q2 2022 2022 Total Deposits in millions $782 $1,739 2016 2017 2018 2019 2020 2021 Q1 Q2 2022 2022 Total Stockholders’ Equity in millions $86 $180 2016 2017 2018 2019 2020 2021 Q1 Q2 2022 2022 ACL/Total Loans 1.17% 1.15% 2016 2017 2018 2019 2020 2021 Q1 Q2 2022 2022 Net Charge off in thousands (1,019) $180 2016 2017 2018 2019 2020 2021 Q1 Q2 2022 2022 Nonperforming Assets/Total Assets 1.58% 0.00% 2016 2017 2018 2019 2020 2021 Q1 Q2 2022 2022 Total Revenue in millions $37 $63 2016 2017 2018 2019 2020 2021 Efficiency ratio 94.15% 55.34% 2016 2017 2018 2019 2020 2021 Q1 Q2 2022 2022 PTPP ROAA (2) 0.24% 1.57% 2016 2017 2018 2019 2020 2021 Q1 Q2 2022 2022 (1) Loan amounts include deferred fees/costs. (2) Non-GAAP Financial Measure. * As of end of period for Balance Sheet amounts Page 15 U.S. CENTURY BANK
![exhibit991p16i0](https://capedge.com/proxy/8-K/0001562762-22-000320/exhibit991p16i0.jpg)
16
Q2 ‘22 Performance Update Capital/ Credit Credit metrics remain pristine. There were no loans classified as nonperforming. ACL coverage ratio was 1.15%. Tangible Book Value per Share is at $9.00, down $0.60 from prior quarter primarily due to AOCI. No shares repurchased during the quarter; Board approved repurchase program in place covering 750,000 shares of Class A common stock. Profitability Net income was $5.3 million or $0.26 per diluted share. ROAA was 1.08% and ROAE was 11.38%. Efficiency ratio was 55.34%. NIM was 3.37% and NII was $15.6 million, up $3.2 million or 25.4% compared to second quarter 2021. Growth Average deposits increased by $284.5 million or 19.9% compared to second quarter 2021. Total average loans, excluding PPP loans, increased $102.3 million or 34.9% annualized compared to prior quarter and $289.9 million or 29.3% compared to second quarter 2021. Page 16 U.S. CENTURY BANK
![exhibit991p17i0](https://capedge.com/proxy/8-K/0001562762-22-000320/exhibit991p17i0.jpg)
17
Q2 ‘22 Performance Update In thousands (except per share data) Q2 2022 Q1 2022 Q2 2021 Balance Sheet (EOP) Total Securities $456,135 $514,575 $395,804 Total Loans (1) $1,372,733 $1,258,388 $1,145,095 Total Assets $2,016,086 $1,967,252 $1,667,005 Total Deposits $1,738,720 $1,713,294 $1,438,776 Total Equity $180,068 $192,039 $166,302 Income Statement Net Interest Income $15,642 $14,379 $12,474 Non-interest Income $1,617 $1,945 $1,516 Total Revenue $17,259 $16,324 $13,990 Provision for Credit Losses $705 $0 $0 Non-interest Expense $9,551 $9,612 $8,674 Net Income $5,295 $4,854 $4,053 Net Income available to common stockholders (2) $5,295 $4,854 $3,299 Diluted Earning Per Share (EPS) (3) Class A Common Stock $0.26 $0.24 $0.64 Class B Common Stock $0.00 $0.00 $0.13 (1) Loan amounts include deferred fees/costs. (2) No preferred stock outstanding for Q2 and Q1 2022. (3) See footnote disclosure in the Non-GAAP table for common stock activity (redemption and exchange of preferred stock, IPO, and exchange of Class B common stock) which impacted diluted EPS for Q2’22 and Q1’22. Page 17 U.S. CENTURY BANK
![exhibit991p18i0](https://capedge.com/proxy/8-K/0001562762-22-000320/exhibit991p18i0.jpg)
18
Q2 ‘22 Performance Update Q2 2022 Q1 2022 Q2 2021 Credit/Capital Tangible Common Equity/Tangible Assets(1) 8.93% 9.76% 8.50% Total Risk-Based Capital (2) 13.74% 14.49% 12.69% NCO/Avg Loans (3) 0.00% -0.01% 0.06% NPA/Assets 0.00% 0.00% 0.00% Allowance Credit Losses/Loans 1.15% 1.20% 1.30% Profitability Return On Average Assets (ROAA) (3) 1.08% 1.03% 0.98% Return On Average Equity (ROAE) (3) 11.38% 9.75% 9.74% Net Interest Margin (3) 3.37% 3.22% 3.14% Efficiency Ratio 55.34% 58.88% 62.00% PTPP ROAA (1)(3) 1.57% 1.42% 1.28% Growth In thousands (except for TBV/share) Total Assets (EOP) $2,016,086 $1,967,252 $1,667,005 Total Loans (EOP) $1,372,733 $1,258,388 $1,145,095 Total Deposits (EOP) $1,738,720 $1,713,294 $1,438,776 Tangible Book Value/Share (1) $9.00 $9.60 $27.71 (1) Non-GAAP Financial Measures. TBV/Share for Q2’22 and Q1’22, see footnote disclosure in the Non-GAAP table for common stock activity (redemption and exchange of preferred stock, IPO, and exchange of Class B common stock) which impacted TBV/share. (2) The Company was established in Q4 2021. As such, the capital ratios for Q2 2022 and Q1 2022 are for the Bank Holding Company while Q2 2021 is for the Bank only. (3) Annualized. Page 18 U.S. CENTURY BANK
![exhibit991p19i0](https://capedge.com/proxy/8-K/0001562762-22-000320/exhibit991p19i0.jpg)
19
Loan Portfolio Total Loans (AVG) in millions $1,300 $1,200 $1,100 $1,000 $900 $800 $1,088 $1,144 $1,159 $1,211 $1,296 $700 $99 $73 $51 $35 $18 $600 $989 $1,071 $1,108 $1,176 $1,278 Q2 2021 Q3 2021 Q4 2021 Q1 2022 Q2 2022 Loans (Exd PPP) PPP Loans Loan Yields 5.00% 4.50% 4.00% 3.50% 3.00% 2.50% 2.00% 1.50% 1.00% 4.19% 4.29% 4.32% 4.35% 435.00% 0.50% 0.28% 0.32% 0.33% 0.28% 1.30% 0.00% 3.91% 3.97% 399.00% 4.07% 4.22% + 31 bps Q2 2021 Q3 2021 Q4 2021 Q1 2022 Q2 2022 Q2'22 vs Q2'21 Loan coupon Loan fees Commentary Total average loans, excluding PPP loans, increased $102.3 million or 34.9% annualized compared to prior quarter and $289.9 million or 29.3% compared to second quarter 2021. Loan coupon increased 15 bps due to a higher interest rate environment compared to prior quarter and 31 bps increase compared to second quarter 2021. Loan fees decreased 15 bps from prior quarter as most of the PPP loan fees have been recognized, normalizing the loan yield composition. Page 19 U.S. CENTURY BANK
![exhibit991p20i0](https://capedge.com/proxy/8-K/0001562762-22-000320/exhibit991p20i0.jpg)
20
Loan Portfolio Mix Loan Portfolio Mix Residential real estate CRE – Non-owner occupied CRE – Owner occupied Commerical and industrial Global Banking Consumer and other 8% 15% 51% 10% 10% 8% Commentary Total Loan balances at quarter end was $1.373 billion. Commercial Real Estate (owner occupied and non-owner occupied) was 61% or $843.4 million of the total loan portfolio. CRE mix is diversified and granular. Retail makes up 30% of total CRE or $252.6 million. Land/Construction 5% Other 4% Retail 30% - LTV was 56.9% - Average loan size was $3.0 ..million CRE - Owner occupied 17% Multifamily 16% Office 13% Hotels 8% Warehouse 7% As of 6/30/22 Page 20 U.S. CENTURY BANK
![exhibit991p21i0](https://capedge.com/proxy/8-K/0001562762-22-000320/exhibit991p21i0.jpg)
21
Loan Production Net Loan Production Trend in millions $180 $160 $140 $120 $100 $80 $60 $40 $20 $144 $104 $117 $88 $119 $106 $141 $74 $169 $56 0 Q2 2021 Q3 2021 Q4 2021 Q1 2022 Q2 2022 Loan Production/Line changes Loan Amortization/payoffs Commentary Q2 loan growth driven by increased production levels and lower payoffs and paydowns. Payoffs and paydowns slowing with increase in interest rates. $169 million loan production in Q2 2022 is attributable to $158 million in new loans and $11 million in net increase of existing lines of credit. Page 21 U.S. CENTURY BANK
![exhibit991p22i0](https://capedge.com/proxy/8-K/0001562762-22-000320/exhibit991p22i0.jpg)
22
Paycheck Protection Program (PPP) 3 successful rounds of PPP loans, originating $168.4 million. Forgiveness of the last round of PPP loans is in process. SBA PPP Loans In thousands (except for ROAA) Q2 2022 Q1 2022 Q2 2021 Pre-Tax Income $7,003 $6,712 $5,316 Net Income $5,295 $4,854 $4,053 Average Assets $1,968,381 $1,913,484 $1,660,060 ROAA (1) 1.08% 1.03% 0.98% of which PPP Income (2) $484 $1,001 $925 Unrealized PPP Fees EOP $149 $590 $3,169 PPP Balance EOP $13,507 $24,646 $84,240 PPP AVG. Balance $17,643 $34,901 $99,563 (1) Annualized. (2) PPP Income includes loan fees and interest income. Page 22 U.S. CENTURY BANK
![exhibit991p23i0](https://capedge.com/proxy/8-K/0001562762-22-000320/exhibit991p23i0.jpg)
23
Deposit Portfolio Deposits (AVG) in millions $2,000 $1,800 $1,600 $1,400 $1,200 $1,000 $800 $600 $1,432 $1,477 $1,562 $1,650 $1,717 $400 $236 $229 $228 $223 $224 $200 $608 $628 $674 $736 $781 $0 $52 $55 $56 $56 $67 $5,536 $5,565 $5,604 $5,626 $5,645 Q2 2021 Q3 2021 Q4 2021 Q1 2022 Q2 2022 Non-interest-bearing deposits Money market and savings Interest-bearing demand deposits Time deposits Deposit Cost (1) 0.26% 0.22% 0.21% 0.20% 0.21% 0.25% 0.25% 0.25% 0.50% 0.21% Q2 2021 Q3 2021 Q4 2021 Q1 2022 Q2 2022 Commentary Average deposits increased $66.4 million or 16.1% annualized compared to prior quarter and $284.5 million or 19.9% compared to second quarter 2021. Average DDA deposits grew $18.6 million or 11.9% annualized compared to prior quarter and $109.1 million or 20.4% compared to second quarter 2021. DDA balances comprised 37.6% of total deposits as of June 30, 2022. Deposit cost increased 1bps compared to prior quarter and decreased 5 bps compared to second quarter 2021. Page 23 U.S. CENTURY BANK
![exhibit991p24i0](https://capedge.com/proxy/8-K/0001562762-22-000320/exhibit991p24i0.jpg)
24
Net Interest Margin Net Interest Income/Margin (1) in thousands (exceptions) Net Interest Income NIM NIM excluding PPP Loans Interest-Earning Assets Mix (AVG) Total Loans (excluding PPP Loans) Investment Securities PPP Loans Cash Balance & Equivalents Commentary Net interest income increased by $1.3 million or 35.2% annualized compared to prior quarter and $3.2 million or 25.4% compared to second quarter 2021. NIM impacted by an increase in interest rates and a shift in balance sheet mix. Loan production growth shifted assets to a higher yielding asset class and was funded by cash balances, a lower securities portfolio and growth in new deposits. NIM of 3.37% up 15 bps from prior quarter and up 23 bps from second quarter 2021 demonstrating an asset sensitive balance sheet. Page 24 U.S. CENTURY BANK
![exhibit991p25i0](https://capedge.com/proxy/8-K/0001562762-22-000320/exhibit991p25i0.jpg)
25
Interest Rate Sensitivity Loan Portfolio Repricing Profile by Rate Type Hybrid ARM 6% Variable Rate 53% Fixed Rate 41% 22% 18% 60% 22% Loan Repricing Schedule Variable/Hybrid Rate Loans 46% 37% 6% 11% 46% 0-4-1 yrs. 1-2 yrs. 2-4 yrs Static NII Simulation Year 1 & 2 $5,000 $4,000 $3,000 $2,000 3.3% 5.9% $1,000 $2,371 $4,178 $0 0.2% 0.1% Net interst income ($ in thousands) $138 $70 +200 +100 +200 Changes from base (%) Years 1 Years 2 As of 6/30/22 Page 25 U.S. CENTURY BANK
![exhibit991p26i0](https://capedge.com/proxy/8-K/0001562762-22-000320/exhibit991p26i0.jpg)
26
Non-interest Income In thousands (except ratios) Q2 2022 Q1 2022 Q4 2021 Q3 2021 Q2 2021 Service fees $1,083 $900 $961 $856 $903 Gain (loss) on sale of securities available for sale (3) 21 35 (70) 187 Gain on sale of loans held for sale 22 334 107 532 23 Gain on sale of other assets - - 983 - - Loan settlement - 161 - 2,500 - Other income 515 529 558 399 403 Total non-interest income $1,617 $1,945 $2,644 $4,217 $1,516 Average total assets $1,968,381 $1,913,484 $1,828,037 $1,741,423 $1,660,060 Non-interest income / Average assets (1) 0.33% 0.41% 0.57% 0.96% 0.37% Total Revenue $17,259 $16,324 $16,720 $17,688 $13,990 Non-interest income as % of total revenue 9.37% 11.91% 15.81% 23.85% 10.84% Commentary Service fees and other income remain consistent quarter over quarter. Fluctuation of non-interest income primarily impacted by one-time items in prior quarters. Prudently managing securities with minimal losses ($3 thousand) in Q2 2022 as interest rates increase. (1) Annualized. Page 26 U.S. CENTURY BANK
![exhibit991p27i0](https://capedge.com/proxy/8-K/0001562762-22-000320/exhibit991p27i0.jpg)
27
Non-interest Expense In thousands (except ratios and FTE) Q2 2022 Q1 2022 Q4 2021 Q3 2021 Q2 2021 Salaries and employee benefits $5,913 $5,875 $5,634 $5,313 $5,213 Occupancy 1,251 1,270 1,267 1,192 1,411 Regulatory assessment and fees 226 213 93 317 195 Consulting and legal fees 398 517 539 357 373 Network and information technology services 448 387 268 358 332 Other operating expense 1,315 1,350 1,518 1,470 1,150 Total non-interest expenses $9,551 $9,612 $9,319 $9,007 $8,674 Efficiency ratio 55.34% 58.88% 55.74% 50.92% 62.00% Average total assets $1,968,381 $1,913,484 $1,828,037 $1,741,423 $1,660,060 Non-interest expense / Average assets (1) 1.95% 2.04% 2.02% 2.05% 2.10% Full-time equivalent employees 192 190 187 184 183 Commentary Salaries and employee benefits increased primarily due to 2 new FTEs. Consulting and legal fees normalizing after one-time expenses related to the holding company reorganization in Q1 2022 and Q4 2021. Higher revenue and slightly lower non-interest expense improved efficiency ratio to 55.34%. (1) Annualized. Page 27 U.S. CENTURY BANK
![exhibit991p28i0](https://capedge.com/proxy/8-K/0001562762-22-000320/exhibit991p28i0.jpg)
28
Following the 2015 Recapitalization, we undertook a complete reorganization of the Bank, starting with the replacement of the executive management team with individuals who brought with them larger -bank and public company expertise In 2015, Ben Pazos joined as Chief Credit Officer to lead and reconstruct the credit function of the Bank, implementing robust underwriting standards and procedures and developing a problem asset resolution strategy Proactively resolved the Bank’s significant problem assets and imposed enhanced underwriting standards and procedures Based upon our aggregate exposure to any given borrower relationship, we undertake a scaled review of loan originations that may involve senior credit officers, our Chief Credit Officer, our Credit Committee or, ultimately, our Board We manage our credit risk by analyzing metrics related to our lines of business, which allows us to maintain a conservative and well-diversified loan portfolio reflective of our assessment of various industry sectors As a result of these measures, our level of nonperforming assets, or NPAs, improved significantly from 6.04% of total assets as of December 31, 2014 to 0.00% of total assets as of June 30, 2022 As of June 30, 2022, the Bank had no loans under COVID-19 related deferral status Asset Quality Allowance for Credit Losses In thousands except ratios 1.40% 1.33% 1.31% 1.22% 1.16% 1.30% 1.27% 1.27% 1.20% 1.15% $1,848 $14,900 $15,057 $15,074 $15,786 Q2 2021 Q3 2021 Q4 2021 Q1 2022 Q2 2022 Allowance for credit losses ACL/Total loans ACL/Total loans excluding PPP Loans Non-performing Loans In thousands (except ratios) 1400 1200 1000 800 600 400 200 0 $20 0.00% $18 0.00% $1,190 0.10% $0 0.00% $0 0.00% Q2 2021 Q3 2021 Q4 2021 Q1 2022 Q2 2022 Non-accrual TDRs Non-accrual loans less non-accrual TDRs Non-performing loans to total loans Page 28 U.S.
CENTURY BANK
![exhibit991p29i0](https://capedge.com/proxy/8-K/0001562762-22-000320/exhibit991p29i0.jpg)
29
Capital Capital Ratios11*! Q2 2022 Leverage Ratio 9.43% TCE/TA{2) 8.93% Tier 1 Risk Based Capital 12.65% Total Risk Based Capital 13.74% Q1 2022 Q2 2021 Well- Capitalized 9.47% 7.91% 5.00% 9.76% 8.50% NA 13.35% 11.44% 8.00% 12.69% 10.00% 14.49% Commentary All capital ratios remain significantly above “well capitalized” guidelines. Q2 2022 EOP shares outstanding: Class A Common Stock: 20,000,753 No shares repurchased during the quarter; Board approved repurchase program in place covering 750,000 shares of Class A common stock. (1) The Company was established in Q4 2021. As such, the capital ratios for Q2 2022 and Q1 2022 are for the Company while Q2 2021 is for the Bank only. (2) Non-GAAP. Page 29 U.S. CENTURY BANK
![exhibit991p30i0](https://capedge.com/proxy/8-K/0001562762-22-000320/exhibit991p30i0.jpg)
30
Table of Contents 1 Who We are 2 Growth Strategy 3 Financial Review 4 Appendix Page 30 U.S. CENTURY BANK
![exhibit991p31i0](https://capedge.com/proxy/8-K/0001562762-22-000320/exhibit991p31i0.jpg)
31
USCB Highlights U.S. CENTURY BANK Leading Franchise Located in One of the Most Attractive Banking Markets in Florida and the U.S. Experienced and Tested Management Team Robust Organic Balance Sheet Growth Low Risk, Commercially Oriented Loan Portfolio Strong Asset Quality, with Minimal Charge -offs Experienced Since Recapitalization Strong Profitability, with Pathway For Further Enhancement Identified Core Funded Deposit Base with 37.6% Non-Interest Bearing Deposits Balanced Liquidity Profile – 79.0% Loan / Deposit Ratio To Support Future Loan Growth Page 31 U.S. CENTURY BANK
![exhibit991p32i1](https://capedge.com/proxy/8-K/0001562762-22-000320/exhibit991p32i1.gif)
![exhibit991p32i0](https://capedge.com/proxy/8-K/0001562762-22-000320/exhibit991p32i0.gif)
![exhibit991p32i1](https://capedge.com/proxy/8-K/0001562762-22-000320/exhibit991p32i1.gif)
![exhibit991p32i4](https://capedge.com/proxy/8-K/0001562762-22-000320/exhibit991p32i4.gif)
![exhibit991p32i1](https://capedge.com/proxy/8-K/0001562762-22-000320/exhibit991p32i1.gif)
![exhibit991p32i0](https://capedge.com/proxy/8-K/0001562762-22-000320/exhibit991p32i0.gif)
![exhibit991p32i1](https://capedge.com/proxy/8-K/0001562762-22-000320/exhibit991p32i1.gif)
![exhibit991p32i3](https://capedge.com/proxy/8-K/0001562762-22-000320/exhibit991p32i3.gif)
![exhibit991p32i1](https://capedge.com/proxy/8-K/0001562762-22-000320/exhibit991p32i1.gif)
![exhibit991p32i2](https://capedge.com/proxy/8-K/0001562762-22-000320/exhibit991p32i2.jpg)
32
Seasoned Management Team with Local Banking Experience Name Title Years at USCB Prior Experience Luis de la Aguilera President, CEO & Director 6 Former President and CEO of TotalBank Served in management and loan production positions at Ocean Bank from 1989-2000 Served in business development and lending positions at Republic National Bank from 1982-1988 Director of the Florida Banker’s Association from 2012 - present Former Florida Representative for the American Banking Association’s Government Relations Council 40+ years in banking Rob Anderson Chief Financial Officer 1 Former Chief Financial Officer of Capstar Financial Holdings, Inc. Multiple finance roles with larger institutions including Bank of America and Capital One where he served as business line CFO Certified public accountant (CPA) (Inactive) 18+ years in banking Benigno Pazos Chief Credit Officer 5 Former Chief Credit Officer of TotalBank Served as Lender and Relationship Manager for 22 years Served in Credit Administration for 6 years Certified public accountant (CPA) 33+ years in banking Oscar Gomez Head of Global Banking Division 14 Former Executive Vice President of Global Correspondent Banking and International Private Banking at Regions Bank 30+ years in banking Andres Collazo Director of Operations & IT Systems 5 Former Senior Vice President and IT and Bank Operations Manager of TotalBank Handled field operations, item processing, and IT for BB&T, South Florida Express and Regions Bank 33+ years in banking Nicholas Bustle Chief Lending Officer 2 Served in various executive roles with regional and national banks including as Miami Dade County Market President and First Senior Vice President – Commercial Banking at Valley Bank in 2019 35+ years in banking Martha Guerra-Kattou Director of Sales
& Marketing 5 Former Director of Sales of TotalBank Served as Vice President of Branch Administration and Senior Vice President of Project Management at TotalBank 30+ years in banking Page 32 U.S. CENTURY BANK
![exhibit991p32i1](https://capedge.com/proxy/8-K/0001562762-22-000320/exhibit991p32i1.gif)
![exhibit991p33i0](https://capedge.com/proxy/8-K/0001562762-22-000320/exhibit991p33i0.gif)
![exhibit991p33i4](https://capedge.com/proxy/8-K/0001562762-22-000320/exhibit991p33i4.gif)
![exhibit991p32i1](https://capedge.com/proxy/8-K/0001562762-22-000320/exhibit991p32i1.gif)
![exhibit991p32i3](https://capedge.com/proxy/8-K/0001562762-22-000320/exhibit991p32i3.gif)
![exhibit991p32i1](https://capedge.com/proxy/8-K/0001562762-22-000320/exhibit991p32i1.gif)
![exhibit991p32i3](https://capedge.com/proxy/8-K/0001562762-22-000320/exhibit991p32i3.gif)
![exhibit991p32i1](https://capedge.com/proxy/8-K/0001562762-22-000320/exhibit991p32i1.gif)
![exhibit991p32i3](https://capedge.com/proxy/8-K/0001562762-22-000320/exhibit991p32i3.gif)
![exhibit991p32i1](https://capedge.com/proxy/8-K/0001562762-22-000320/exhibit991p32i1.gif)
![exhibit991p33i2](https://capedge.com/proxy/8-K/0001562762-22-000320/exhibit991p33i2.jpg)
33
Highly Accomplished and Aligned Board with Complementary Track Records Name Title Years at USCB Prior Experience Aida Levitan Chairwoman 8 Serves on the boards of the IMPAC Fund, Spanish Cultural Center of Miami, President of ArtesMiami, Inc. and Trustee Emertia of the Perez Art Museum Miami Formerly served as Vice Chair of the national Smithsonian Latino Center, Communications Chair of the National Museum of the American Latino Commission, Chair of the Aetna Latino Advisory Council, and former President of the Association of Hispanic Advertising Agenci es (AHAA) Former Vice Chair/President of Bromley Communications and former CEO of Publicis Sanchez & Levitan Director since 2013, Chairwoman since 2017 Kirk Wycoff Director 6 Founder and Managing Partner of Patriot Financial Partners, L.P. Former Chairman, President and CEO of Continental Bank Holdings, Inc. Former Chairman, President and CEO of Progress Financial Corp. Former Chairman and CEO of Crusader Savings Bank, FSB Serves on the Boards of Banc of California, Inc., Franklin Security Bancorp, Radius Bancorp, Grasshopper Bancorp, Inc., Auxilior Capital Partners, Inc., Numerated Growth Technologies, Progress Leasing Company, Guaranty Bancorp, Porter Bancorp, LendingClub Bank, National Association and Miria Holdings, Inc. Director since 2015 Howard Feinglass Director 6 Founder and Managing Partner of Priam Capital Director of Howard Bancorp, Inc. and Howard Bank since 2018 Director of non-profit Riverside Hawks Former Principal of Odyssey Partners Director since 2015 Ramón Abadin Director 4 Founder and Partner of Ramon A. Abadin P.A. Serves on the Boards of WestCare and Florida Lawyers Mutual Insurance Company Former President of the Florida Bar Former President of the Cuban American Bar
Association Director since 2017 Bernardo Fernandez, Jr. Director 4 CEO of Baptist Health Medical Group Former Chair of the Florida Board of Medicine and Head of Section of Vascular Medicine of Cleveland Clinic Florida Serving as a member of the Orange Bowl Committee and the Board of Trustees of St. Thomas University Former CEO and President of Cleveland Clinic Florida 2013 Recipient of the National Hospital CEO of the Year from The Association of Hispanic Healthcare Executives Director since 2017 Note: Excludes CEO who is also on board of directors; Page 33 U.S. CENTURY BANK
![exhibit991p32i1](https://capedge.com/proxy/8-K/0001562762-22-000320/exhibit991p32i1.gif)
![exhibit991p33i0](https://capedge.com/proxy/8-K/0001562762-22-000320/exhibit991p33i0.gif)
![exhibit991p32i3](https://capedge.com/proxy/8-K/0001562762-22-000320/exhibit991p32i3.gif)
![exhibit991p32i1](https://capedge.com/proxy/8-K/0001562762-22-000320/exhibit991p32i1.gif)
![exhibit991p32i3](https://capedge.com/proxy/8-K/0001562762-22-000320/exhibit991p32i3.gif)
![exhibit991p32i1](https://capedge.com/proxy/8-K/0001562762-22-000320/exhibit991p32i1.gif)
![exhibit991p34i3](https://capedge.com/proxy/8-K/0001562762-22-000320/exhibit991p34i3.gif)
![exhibit991p32i1](https://capedge.com/proxy/8-K/0001562762-22-000320/exhibit991p32i1.gif)
![exhibit991p34i2](https://capedge.com/proxy/8-K/0001562762-22-000320/exhibit991p34i2.jpg)
34
Highly Accomplished and Aligned Board with Complementary Track Records Name Title Years at USCB Prior Experience Ramon A. Rodriguez Director Less than 1 Chairman and CEO of Cable Insurance, a property and casualty insurer dedicated to the commercial automotive market Former CEO of Madsen Sapp Mena Rodriguez & Co. Founder and board member of DME Corporation Served on the board of Republic Services, Inc. Director since 2022 Robert E. Kafafian Director Less than 1 Founder, Chairman and Chief Executive Officer (“CEO”) of The Kafafian Group, Inc. 40-year career consulting and advising more than 500 financial institutions across the United States Mr. Kafafian is a frequent speaker and writer on a variety of banking subjects and is often quoted in banking periodicals He teaches at numerous state, regional, and national banking schools Director since 2022 Maria C. Alonso Director Less than 1 Served as the President and CEO of United Way Miami Record spanning more than 25 years across banking, marketing, social responsibility, and community engagement Involvement in community organizations has included: New World School of the Arts (past Executive Committee Chair), Leadership Florida, International Women’s Forum, Greater Miami Chamber of Commerce (past Board Chair), Miami -Dade Beacon Council (past One Community, One Goal Co-Chair), Camillus House, Miami Dade College Foundation, The Miami Foundation, and Teach for America. Recognized community leader having received numerous awards celebrating her civic, business, and philanthropic contributions to the South Florida community. Director since 2022 Note: Excludes CEO who is also on board of directors; Page 34 U.S. CENTURY BANK
![exhibit991p35i0](https://capedge.com/proxy/8-K/0001562762-22-000320/exhibit991p35i0.jpg)
35
Non-GAAP Reconciliation In thousands (except ratios) 6/30/2022 Pre-Tax Pre-Provis ion f TIPP") Income: Netincora?$5.295 Rus: Provision forincone taxes 1.708 Rus: Revision for credit losses 705 PIPP incone _S 7,708 PTPP Return on Average As sets: PIPP incone$7.708 Average assets$1,96S,3S1 PIPP return on average assets 1.57% Oner at in g Net Inc ome: Net incone$5.295 Less: Net gains (tosses) on sale of securities (3) Less: Tax effect on sale of securities 1_ Operating net income _S 5.297 Operating PTPP Income: PIPP incone$7,708 Less: Net gains (tosses) on sale of securities (3) Operating PTPP Incone _S 7.711 Operating PTPP Return on Average Assets: Operating PIPP incone$7,711 Average assets$1,968,381 Operating PIPP Return on average assets 1.57% Oper at in g Return on Aver ag e Assets : Operating net income$5.297 Average assets$1,968,381 Operating return on average assets ' ' 1.08% As of or for the three months ended 3/31/2022 12/31/2021 9/30/2021 6/30/2021 S 4.854 S 5.650 S 6.593 S 4.053 1.S58 1.751 2088 1.263 S 6.712 S 7.401 S 8.681 S 5.316 S 6.712 S 7.401 S 8.681 S 5.316 S 1,913,484$1,828,037$1,741,423$1,660,060 1.42% 1.61% 1.98% 1.28% s 4.854 S 5.650 S 6.593 S 4.053 21 35 (70) 187 ÍSL <2L 17 S 4.S3S S 5.624 $ 6.646 S 3.912 S 6,712$7,401$8,681$5,316 21 35 JTC^ 181 S 6.691$7,366$S.751$5.129 S 6,691 S 7,366 S 8,751 S 5,129 S 1,913,484$1,828,037$1,741,423$1,660,060 1.42% 1.60% 1.99% 1.24% S 4.838 S 5.624 S 6.616 S 3.912 S 1,913,484$1,828,037$1,741,423$1,660,060 1.03% 1.22% 1.51% 0.95% (1) Annualized Page 35 U.S. CENTURY BANK
![exhibit991p36i0](https://capedge.com/proxy/8-K/0001562762-22-000320/exhibit991p36i0.jpg)
36
Non-GAAP Reconciliation In thousands (except per share data) In thousands (except per A. of i»d for ike ar»ao»a-. tided fl 1 6 30.2022 3 31 2022 12 3 1 2021 9 30 2021 6 30.2021 Ti agible Bock Va lie per Cor* noi Shire (it period-ead): loulclockholdcrc'eoas v (GA AP| S ISXObS s 192019 S 201 *9 7 s 201.918 S 166.102 lecc : Inundóle jccclc ----- Less : Preferred cioc k 24016 tangible cioc (holders'equity (non-GAA Pk S 180.068 s 192019 s 201*97 S 201.918 S 141086 Toral iteres lifted and ontiB nding (at period-end): ('lice A commcn shares 20.0C0.TSJ 20.000.TS.1 19.991.75.1 18767041 .1*89.469 Giles (¡common chares 1.224.2 12 1-Î24J2I2 1 oialcomm.cn chares issued and ou island mg 200CO .75 l 20.000.7S 1 1.7SJ I.TSJ 5.1110*1 1 angible book vatac percommon chare (non-GA AP) ' ' V s s 10.20 s s yj 0 penda* Net I»coa e Available nCcauM S lock k olden : Sel meóme (GAA P> S s 4*54 s 5/k50 s 6091 s 4.0 S.1 Lecc : Preferred dividende - 542 754 Lecc: (-«change and red cmpu.cn of preferred charec . . . 89085 . Sel meóme (bee) available a> common stockholders (GA AP> SJ9S 4ÃS4 SOSO (8.10.14) 1.299 Add back: (exchange and redemplicn ofpreferred charec 89085 Operatmg nel mcom: avail lo comnun clock (non-GAA P| s SJ9S s 4*34 s SOSO s 6031 s 1’99 A lie cation of operating net income per comm on ¡to ci cia n: £ « *o \ s s < V«4 s S « /-*.» s S « <ú« s s Glass (¡comm.cn clock$ ***** 4SI 790 Weighed average liarei on a tan ding: Gla.cc A common clock llacK 20.000.75! 19.994.95.1 I&.9I.1.9I4 IS. 12 1.460 .1*89.469 Dialed 20171.261 20.109.7* J 19.021086 15.187.729 1.911016 Glass (¡ commcn clock Hack: . . . 6.121052 6.121052 Dialed - - - 6121052 6.121052 Dita ted I PS: "*"* ' (Jan \ common c lock Sel income (fc>cc)perdiluted share«"; A AP)$0.26 S 0.24 S 0-10 S (5.11) S 0X4 A dd back: Met an»e and redcmptmn of pie ferret] cha res ; ; ; • 4» • Operating nel mcom:
per dita led chare (non -<t\ Aft Class licommcn clock Nel income (toee)perdiluted chare(GA AP)$s$S (1.02) S 0.11 Add back: (--«change and redcmptmn ofpre ferred charec 1.09 Operating nel mcom: perditaled chare (non-GA AP) 4 «$ (t) The Company belbves these non GAAP measurements are key bdicaars of iie ongaing earnbgs pc» er of the Conjjany. 2. During the quarter ended Sept entier 30. 2021.47.473 shares of Class C preferred sack and 11.061.552 shares of Class D preferred sack * ere comer ad bto 10278.072 shares of Class A com non stock. AcMitbnally. the Bank closed on iie initial pubic dieting of is Cass A common sack on July 27. 2021. in which it issued 4.600.COO shares of Class A common stock. As such, the toal shares issued rad outstanding d Class A com non sack* as 18.767.541 shares at Scptentier 30. 2021. 3. EjcIjJcs iie dlutivc effect, if any. of shares of com moi sack ¿suable upon eiocBc of outsanding stock options. 4. During the quarter ended Septentier 30. 2021. basic net loss per share is the same as dluad net bss per share as the inebsion of all poanaal common shacs outstanding would have been anadiuáve. 5. During the quarter ended December 31.2021. iie Company entered into agreements * ih the Class B common shrr ehobers a cachangc el outsanding Class B non-votbg common stockfer Class A voting common stockât a ratio of 1 shrre of Cbss A common stockfor each 5 shares of Class B non-votbg common stock, h catulaang net income (Ices) per dluad share for the prbr quarters presented., iie allocrsion of operating net income avalabfc a common slockhobers was based on the weighad average shares outsanding per common share class a iie aal w eithted average shares outsand'ng djrbq each period. The operatbq net bcome albcatbn wascalcubted usinq the weiqhad averaqe shares outsandinq of Cbss B common stockon an as converted basis. Page 36 U.S. CENTURY
BANK