Exhibit 99.2 USBC FINANCIAL HOLDINGS
Third Quarter 2022
Earnings Presentation
October 28, 2022
Forward-Looking Statements This presentation may contain statements that are not historical in nature and are intended to be, and are hereby identified as, forward-looking statements for purposes of the safe harbor provided by Section 21E of the Securities Exchange Act of 1934, as amended. The words “may,” “will,” “anticipate,” “should,” “would,” “believe,” “contemplate,” “expect ,” “aim,” “plan,” “estimate,” “continue,” and “intend,” as well as other similar words and expressions of the future, are intended to identi fy forward-looking statements. These forward-looking statements include statements related to our projected growth, anticipated future financial performance, and management’s long-term performance goals, as well as statements relating to the anticipated effects on results of operations and financial condition from expected developments or events, or business and growth strategies, including anticipated internal growth. These forward-looking statements involve significant risks and uncertainties that could cause our actual results to differ materially from those anticipated in such statements. Potential risks and uncertainties include, but are not limited to: • the strength of the United States economy in general and the strength of the local economies in which we conduct operations; • the continuation of the COVID-19 pandemic and its impact on us, our employees, customers and third-party service providers, and the ultimate extent of the impacts of the pandemic and related government stimulus programs; • our ability to successfully manage interest rate risk, credit risk, liquidity risk, and other risks inherent to our industry; • the accu racy of our financial statement estimates and assumptions, including the estimates used for our credit loss reserve and deferred tax asset valuation allowance; • the efficiency and effectiveness of our internal control environment; • our ability to comply with the
extensive laws and regulations to which we are subject, including the laws for each jurisdiction where we operate; • legislative or regulatory changes and changes in accounting principles, policies, practices or guidelines, including the effects of the forthcoming implementation of the Current Expected Credit Losses (“CECL”) standard; • the effects of our lack of a diversified loan portfolio and concentration in the South Florida market, including the risks of geographic, depositor, and industry concentrations, including our concentration in loans secured by real estate; • the concentration of ownership of our Class A common stock; • fluctuations in the price of our Class A common stock; • our ability to fund or access the capital markets at attractive rates and terms and manage our growth, both organic growth as well as growth through other means, such as future acquisitions; • inflation, interest rate, unemployment rate, market, and monetary fluctuations; • increased competition and its effect on the pricing of our products and services as well as our margin; • the effectiveness of our risk management strategies, including operational risks, including, but not limited to, client, employee, or third -party fraud and security breaches; and • other risks described in this presentation and other filings we make with the Securities and Exchange Commission (“SEC”). All forward-looking statements are necessarily only estimates of future results, and there can be no assurance that actual results will not differ materially from expectations. Therefore, you are cautioned not to place undue reliance on any forward-looking statements. Further, forward-looking statements included in this presentation are made only as of the date hereof, and we undertake no obligation to update or revise any forward-looking statement to reflect events or circumstances after the date on which the statement is made or to reflect the occurrence of
unanticipated events, unless required to do so under the federal securities laws. You should also review the risk factors described in the reports USCB Financial Holdings, Inc. filed or will file with the SEC and, for periods prior to the completion of the bank holding company reorganization in December 31, 2021, U.S Century Bank filed with the FDIC. Non-GAAP Financial Measures This presentation includes financial information determined by methods other than in accordance with generally accepted accounting principles (“GAAP”). This financial information includes certain operating performance measures. Management has included these non-GAAP measures because it believes these measures may provide useful supplemental information for evaluating the Company’s underlying performance trends. Further, management uses these measures in managing and evaluating the Company’s business and intends to refer to them in discussions about our operations and performance. Operating performance measures should be viewed in addition to, and not as an alternative to or substitute for, measures determined in accordance with GAAP, and are not necessarily comparable to non-GAAP measures that may be presented by other companies. To the extent applicable, reconciliations of these non-GAAP measures to the most directly comparable GAAP measures can be found in the ‘Non-GAAP Reconciliation Tables’ included in the presentation. You should assume that all numbers are unaudited unless otherwise noted. 2
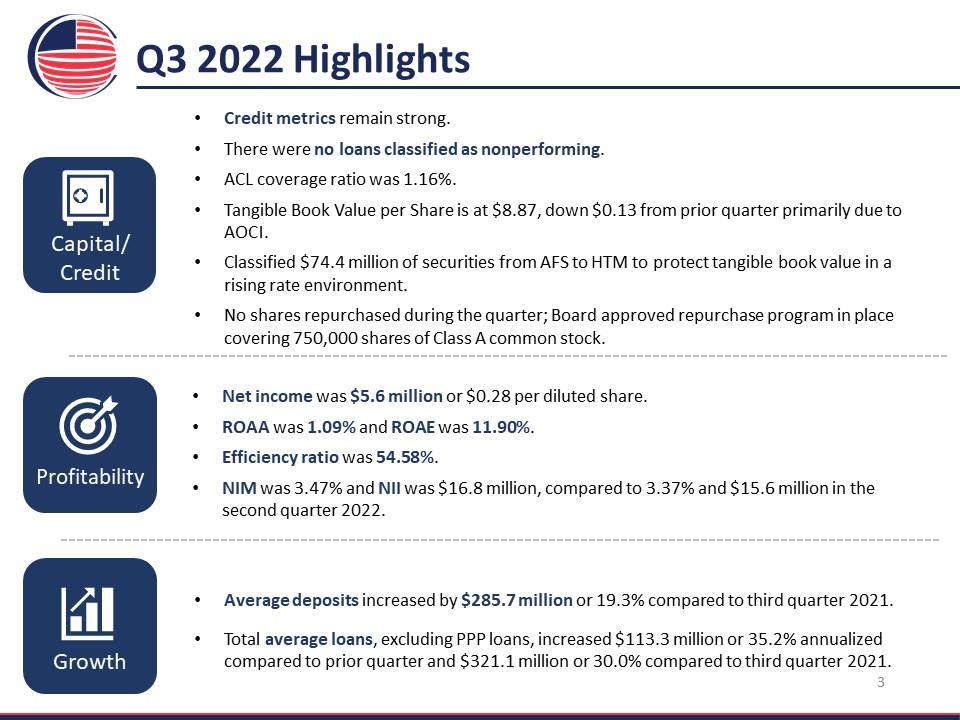
Q3 2022 Highlights Capital/ Credit Credit metrics remain strong. There were no loans classified as nonperforming. ACL coverage ratio was 1.16%. Tangible Book Value per Share is at $8.87, down $0.13 from prior quarter primarily due to AOCI. Classified $74.4 million of securities from AFS to HTM to protect tangible book value in a rising rate environment. No shares repurchased during the quarter; Board approved repurchase program in place covering 750,000 shares of Class A common stock. Profitability Net income was $5.6 million or $0.28 per diluted share. ROAA was 1.09% and ROAE was 11.90%. Efficiency ratio was 54.58%. NIM was 3.47% and NII was $16.8 million, compared to 3.37% and $15.6 million in the second quarter 2022. Growth Average deposits increased by $285.7 million or 19.3% compared to third quarter 2021. Total average loans, excluding PPP loans, increased $113.3 million or 35.2% annualized compared to prior quarter and $321.1 million or 30.0% compared to third quarter 2021. 3
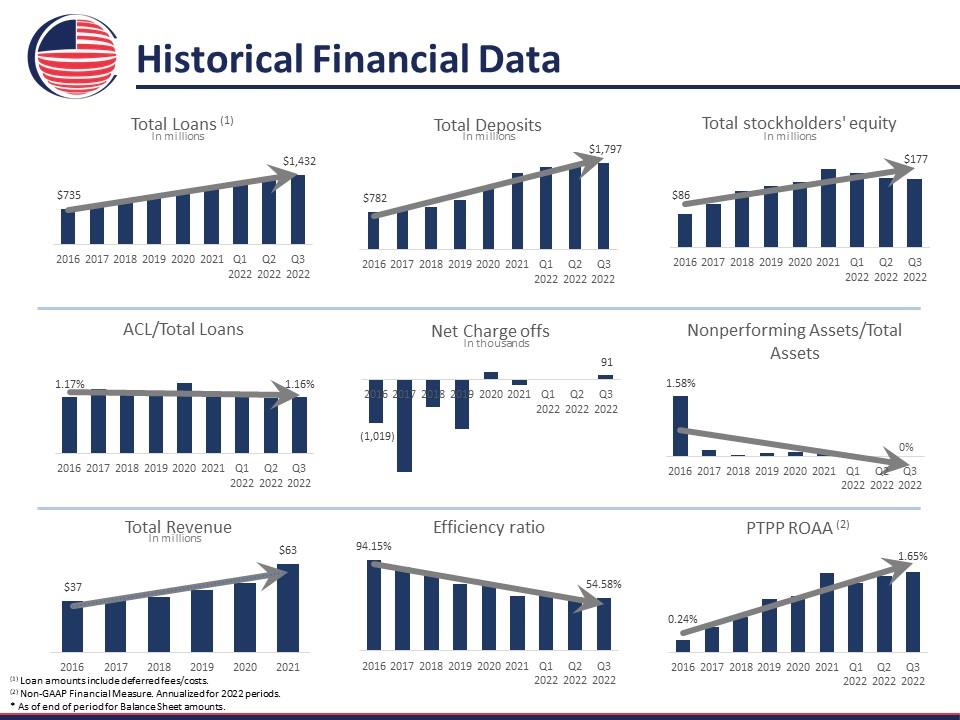
Historical Financial Data Total Loans (1) In millions $735 $1,432 2016 2017 2018 2019 2020 2021 Q1 Q2 Q3 2022 2022 2022 Total Deposits In millions $782 $1,797 2016 2017 2018 2019 2020 2021 Q1 Q2 Q3 2022 2022 2022 Total stockholders' equity In millions $86 $177 2016 2017 2018 2019 2020 2021 Q1 Q2 Q3 2022 2022 2022 ACL/Total Loans 37% 63% 2016 2017 2018 2019 2020 2021 Q1 Q2 Q3 2022 2022 2022 Net Charge offs In thousands (1019) 91 2016 2017 2018 2019 2020 2021 Q1 Q2 Q3 2022 2022 2022 Nonperforming Assets/Total Assets 1.58% 0% 2016 2017 2018 2019 2020 2021 Q1 Q2 Q3 2022 2022 2022 Total Revenue In millions $37 $63 2016 2017 2018 2019 2020 2021 Q1 Q2 Q3 2022 2022 2022 Efficiency ratio 94.15% 54.58% 2016 2017 2018 2019 2020 2021 Q1 Q2 Q3 2022 2022 2022 PTPP ROAA (2) 0.24% 1.65% 2016 2017 2018 2019 2020 2021 Q1 Q2 Q3 2022 2022 2022 (1) Loan amounts include deferred fees/costs. (2) Non-GAAP Financial Measure. Annualized for 2022 periods. * As of end of period for Balance Sheet amounts. 4
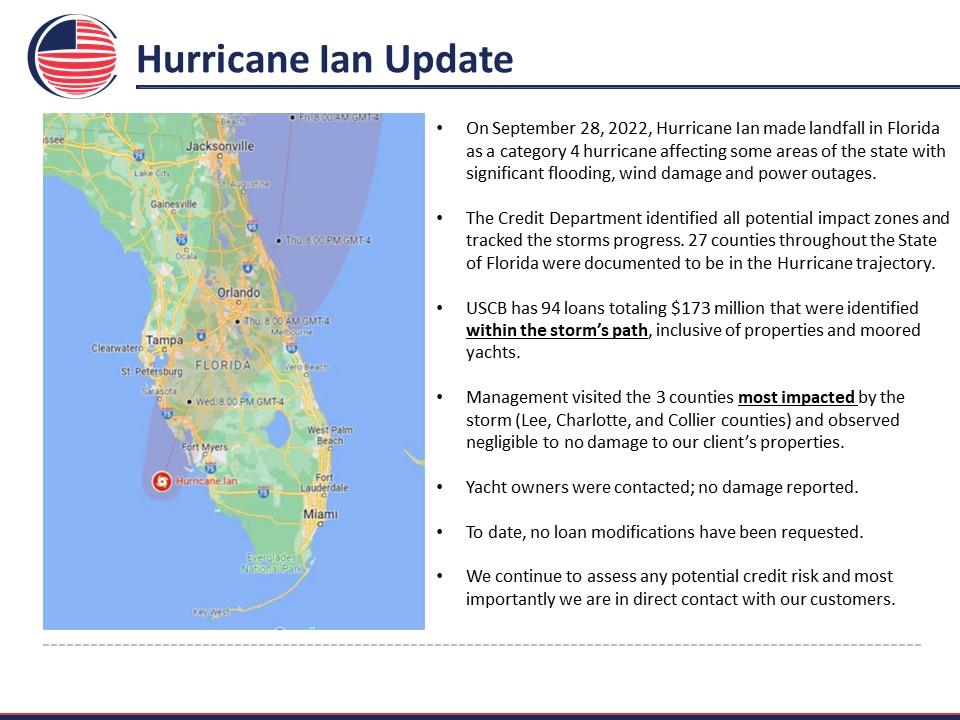
Hurricane Ian Update On September 28, 2022, Hurricane Ian made landfall in Florida as a category 4 hurricane affecting some areas of the state with significant flooding, wind damage and power outages. The Credit Department identified all potential impact zones and tracked the storms progress. 27 counties throughout the State of Florida were documented to be in the Hurricane trajectory. USCB has 94 loans totaling $173 million that were identified within the storm’s path, inclusive of properties and moored yachts. Management visited the 3 counties most impacted by the storm (Lee, Charlotte, and Collier counties) and observed negligible to no damage to our client’s properties. Yacht owners were contacted; no damage reported. To date, no loan modifications have been requested. We continue to assess any potential credit risk and most importantly we are in direct contact with our customers. 5
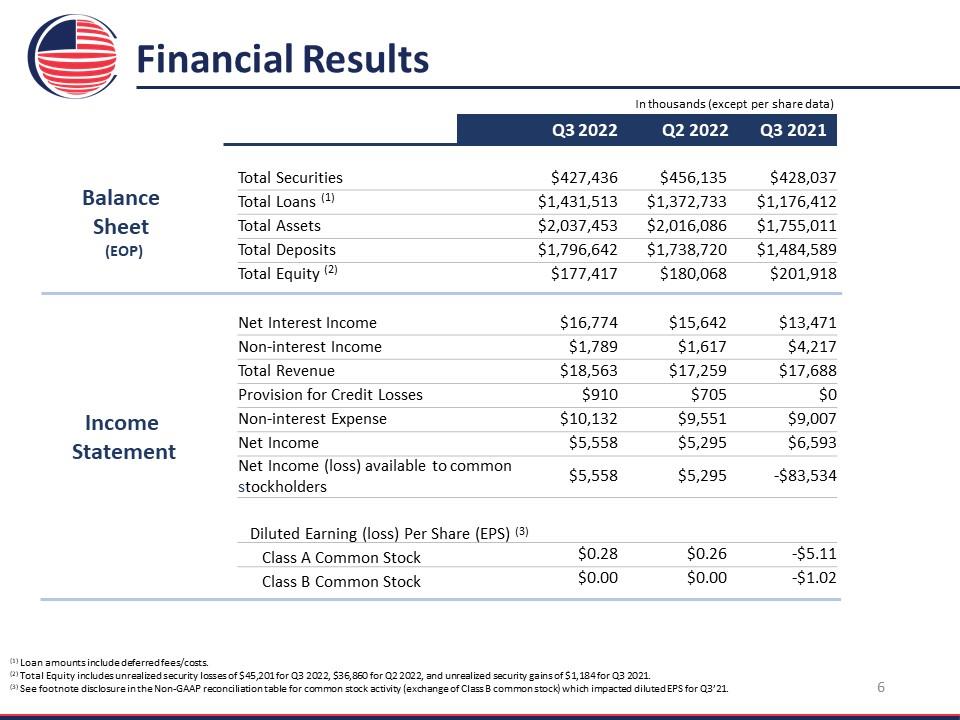
Financial Results In thousands (except per share data) Balance Sheet (EOP) Q3 2022 Q2 2022 Q3 2021 Income Statement Total Securities Total Loans '?) Total Assets Total Deposits Total Equity '2) Net Interest Income Non-interest Income Total Revenue Provision for Credit Losses Non-interest Expense Net Income Net Income (loss) available to common stockholders Diluted Earning (loss) Per Share (EPS) (3) Class A Common Stock Class B Common Stock $427,436 $1,431,513 $2,037,453 $1,796,642 $177,417 $16,774 $1,789 $18,563 $910 $10,132 $5,558 $5,558 $0.28 $0.00 $456,135 $1,372,733 $2,016,086 $1,738,720 $180,068 $15,642 $1,617 $17,259 $705 $9,551 $5,295 $5,295 $0.26 $0.00 $428,037 $1,176,412 $1,755,011 $1,484,589 $201,918 $13,471 $4,217 $17,688 $o $9,007 $6,593 -$83,534 $5.11 -$1.02 (1) Loan amounts include deferred fees/costs. (2) Total Equity includes unrealized security losses of $45,201 for Q3 2022, $36,860 for Q2 2022, and unrealized security gains of $1,184 for Q3 2021. (3) See footnote disclosure in the Non-GAAP reconciliation table for common stock activity (exchange of Class B common stock) which impacted diluted EPS for Q3’21. 6
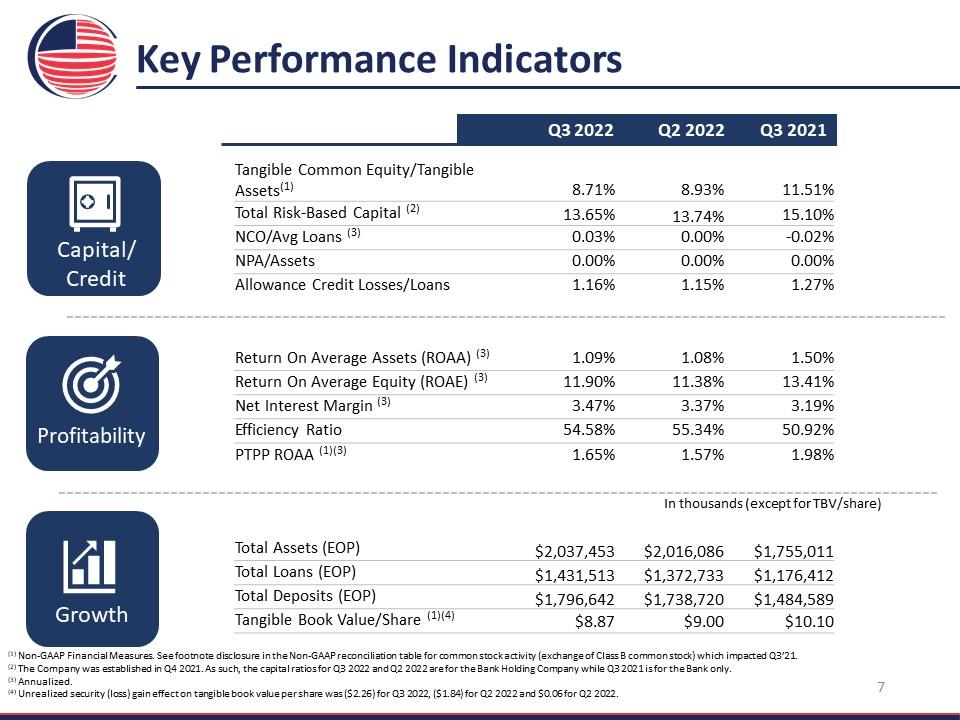
Key Performance Indicators Q3 2022 Q2 2022 Q3 2021 Capital/ Credit Profitability Growth Tangible Common Equity/Tangible Assets!) Total Risk-Based Capital NCO/Avg Loans ©! NPA/Assets Allowance Credit Losses/Loans Return On Average Assets (ROAA) ) Return On Average Equity (ROAE) Net Interest Margin ! Efficiency Ratio PTPP ROAA (18) Total Assets (EOP) Total Loans (EOP) Total Deposits (EOP) Tang ible Book Value/Share ‘4! 8.71% 13.65% 0.03% 0.00% 1.16% 1.09% 11.90% 3.47% 54.58% 1.65% $2,037,453 $1,431,513 $1,796,642 $8.87 8.93% 11.51% 13.74% 15.10% 0.00% 0.02% 0.00% 0.00% 1.15% 1.27% 1.08% 1.50% 11.38% 13.41% 3.37% 3.19% 55.34% 50.92% 1.57% 1.98% In thousands (except for TBV/share) $2,016,086 $4,755,011 $1,372,733 $1,176,412 $1,738,720 $1,484,589 $9.00 $10.10 (1) Non-GAAP Financial Measures. See footnote disclosure in the Non-GAAP reconciliation table for common stock activity (exchange of Class B common stock) which impacted Q3’21. (2) The Company was established in Q4 2021. As such, the capital ratios for Q3 2022 and Q2 2022 are for the Bank Holding Company while Q3 2021 is for the Bank only. (3) Annualized. (4) Unrealized security (loss) gain effect on tangible book value per share was ($2.26) for Q3 2022, ($1.84) for Q2 2022 and $0.06 for Q2 2022. 7
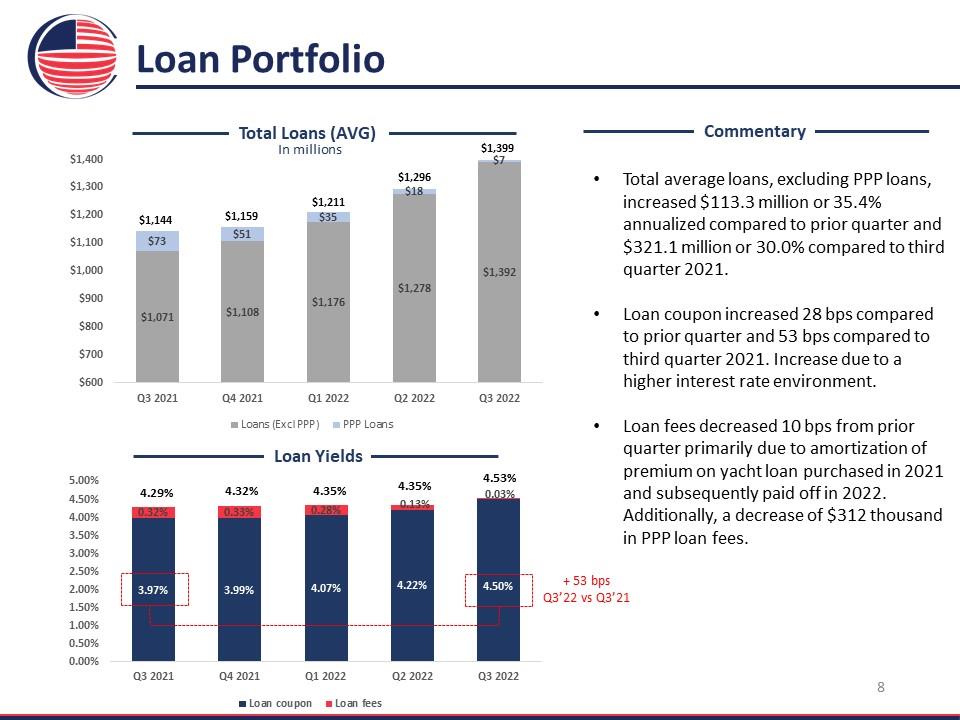
Loan Portfolio Total Loans (AVG) In millions $1,400 $1,300 $1,200 $1,100 $1,000 $900 $800 $1,144 $1,159 $1,211 $1,296 $1,399 $700 $73 $51 $35 $18 $7 $600 $1,071 $1,108 $1,176 $1,278 $1,392 Q3 2021 Q4 2021 Q1 2022 Q2 2022 Q3 2022 Loans (Exd PPP) PPP Loans Loan Yields 5.00% 4.50% 4.00% 3.50% 3.00% 2.50% 2.00% 1.50% 1.00% 4.29% 4.32% 4.35% 4.35% 4.53% 0.50% 0.32% 0.33% 0.28% 1.30% 0.03% 0.00% 3.97% 3.99% 4.07% 4.22% 4.50% Q3 2021 Q4 2021 Q1 2022 Q2 2022 Q3 2022 Commentary Total average loans, excluding PPP loans, increased $113.3 million or 35.4% annualized compared to prior quarter and $321.1 million or 30.0% compared to third quarter 2021. Loan coupon increased 28 bps compared to prior quarter and 53 bps compared to third quarter 2021. Increase due to a higher interest rate environment. Loan fees decreased 10 bps from prior quarter primarily due to amortization of premium on yacht loan purchased in 2021 and subsequently paid off in 2022. Additionally, a decrease of $312 thousand in PPP loan fees. 8
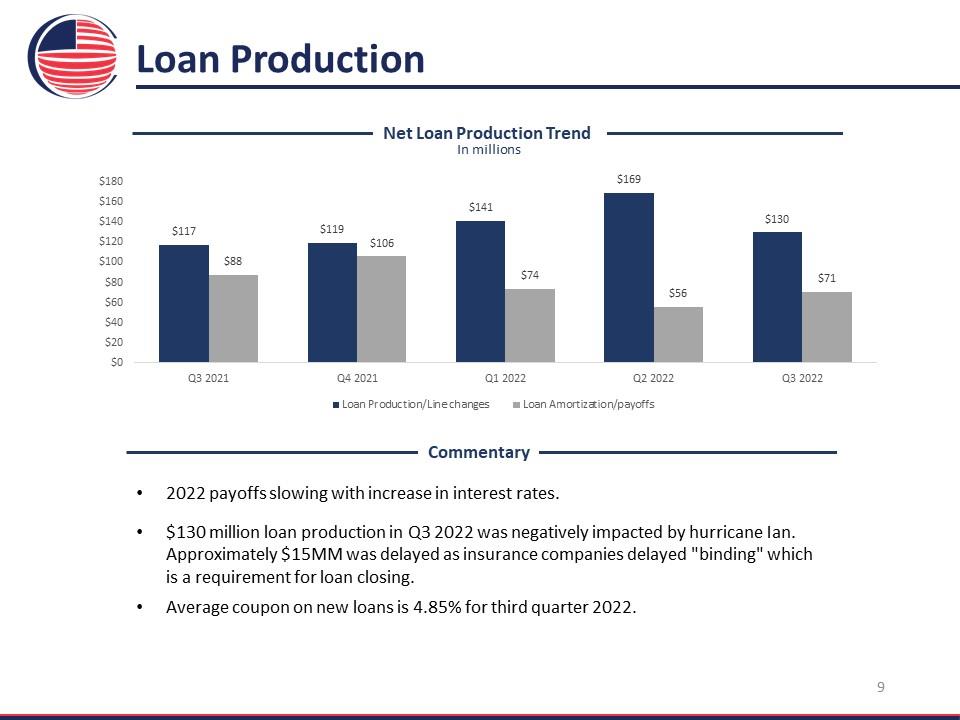
Loan Production Net Loan Production Trend In millions $180 $160 $140 $120 $100 $80 $60 $40 $20 $117 $88 $119 $106 $141 $74 $169 $56 $130 $71 $0 Q3 2021 Q4 2021 Q1 2022 Q2 2022 Q3 2022 Loan Production/Line changes Loan Amortization/payoffs Commentary 2022 payoffs slowing with increase in interest rates. $130 million loan production in Q3 2022 was negatively impacted by hurricane Ian. Approximately $15MM was delayed as insurance companies delayed "binding" which is a requirement for loan closing. Average coupon on new loans is 4.85% for third quarter 2022. 9
Paycheck Protection Program (PPP) 3 successful rounds of PPP loans, originating $168.4 million. Forgiveness of the last round of PPP loans is in process. In thousands (except for ROAA) Q3 2022 Q2 2022 Q3 2021 Pre-Tax Income $7,521 $7,003 $8,681 Net Income $5,558 $5,295 $6,593 Average Assets $2,026,791 $1,968,381 $1,741,423 ROAA (1) 1.09% 1.08% 1.50% of which PPP Income (2) $145 $484 $1,071 Unrealized PPP Fees EOP $19 $149 $2,360 PPP Balance EOP $1,362 $13,507 $57,991 PPP AVG. Balance $6,620 $17,643 $73,215 PPP Loans (1) Annualized. (2) PPP Income includes loan fees and interest income. 10
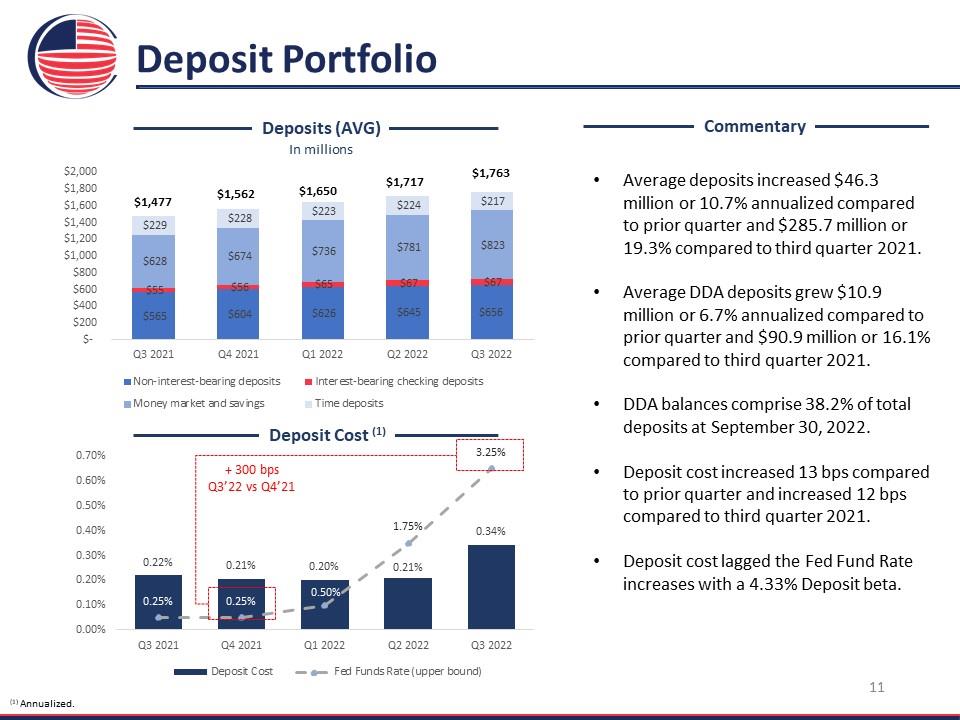
Deposit Portfolio Deposits (AVG) In millions $2,000 $1,800 $1,600 $1,400 $1,200 $1,000 $800 $1,477 $1,562 $1,650 $1,717 $1,763 $600 $229 $228 $223 $224 $217 $400 $628 $674 $736 $781 $823 $200 $55 $56 $65 $67 $67 $- $565 $604 $626 $645 $656 Q3 2021 Q4 2021 Q1 2022 Q2 2022 Q3 2022 Non-interest-bearing deposits Interest-bearing checking deposits Money amrket and savings Time deposits Deposit Cost (1) 0.70% 0.60% + 300 bps 0.50% Q3'22 vs Q4'21 0.40% 0.30% 0.20% 0.10% 0.22% 0.21% 0.20% 1.75% 3.25% 0.00% 0.25% 0.25% 5.00% 0.21% 0.34% Q3 2021 Q4 2021 Q1 2022 Q2 2022 Q3 2022 Deposit Cost Fed Funds Rate (upper bound) Commentary Average deposits increased $46.3 million or 10.7% annualized compared to prior quarter and $285.7 million or 19.3% compared to third quarter 2021. Average DDA deposits grew $10.9 million or 6.7% annualized compared to prior quarter and $90.9 million or 16.1% compared to third quarter 2021. DDA balances comprise 38.2% of total deposits at September 30, 2022. Deposit cost increased 13 bps compared to prior quarter and increased 12 bps compared to third quarter 2021. Deposit cost lagged the Fed Fund Rate increases with a 4.33% Deposit beta. (1) Annualized. 11
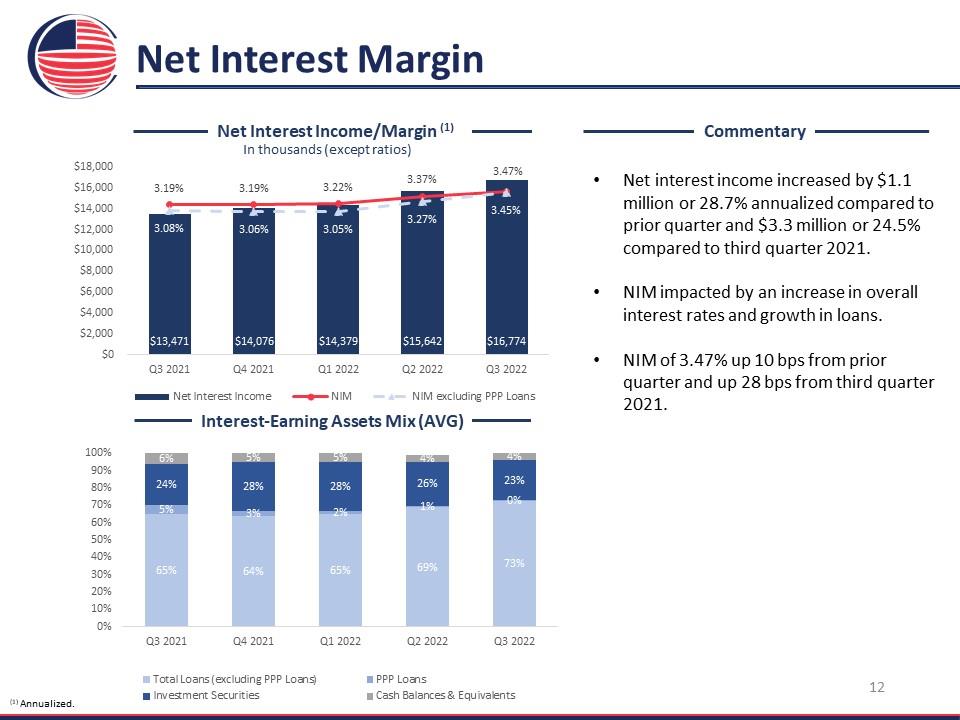
Net Interest Margin Net Interest Income/Margin (1) In thousands (except ratios) $18,000 $16,000 $14,000 $12,000 $10,000 $8,000 $6,000 $4,000 3.19% 3.19% 3.22% 337.00% 3.47% $2,000 3.08% 3.06% 3.05% 3.27% 3.45% $0 $13,471 $14,076 $14,379 $15,642 $16,774 Q3 2021 Q4 2021 Q1 2022 Q2 2022 Q3 2022 Net Interest Income NIM NIM excludign PPP Loans Interest-Earning Assets Mix (AVG) 100% 90% 80% 70% 60% 50% 40% 30% 6% 5% 5% 4% 4% 20% 24% 28% 28% 26% 23% 10% 5% 3% 2% 1% 0% 0% 65% 64% 65% 69% 73% Q3 2021 Q4 2021 Q1 2022 Q2 2022 Q3 2022 Total Loans (excludign PPP Loans) PPP Loans Investment Securities Cash Balances & Equivalents Commentary Net interest income increased by $1.1 million or 28.7% annualized compared to prior quarter and $3.3 million or 24.5% compared to third quarter 2021. NIM impacted by an increase in overall interest rates and growth in loans. NIM of 3.47% up 10 bps from prior quarter and up 28 bps from third quarter 2021. (1) Annualized. 12
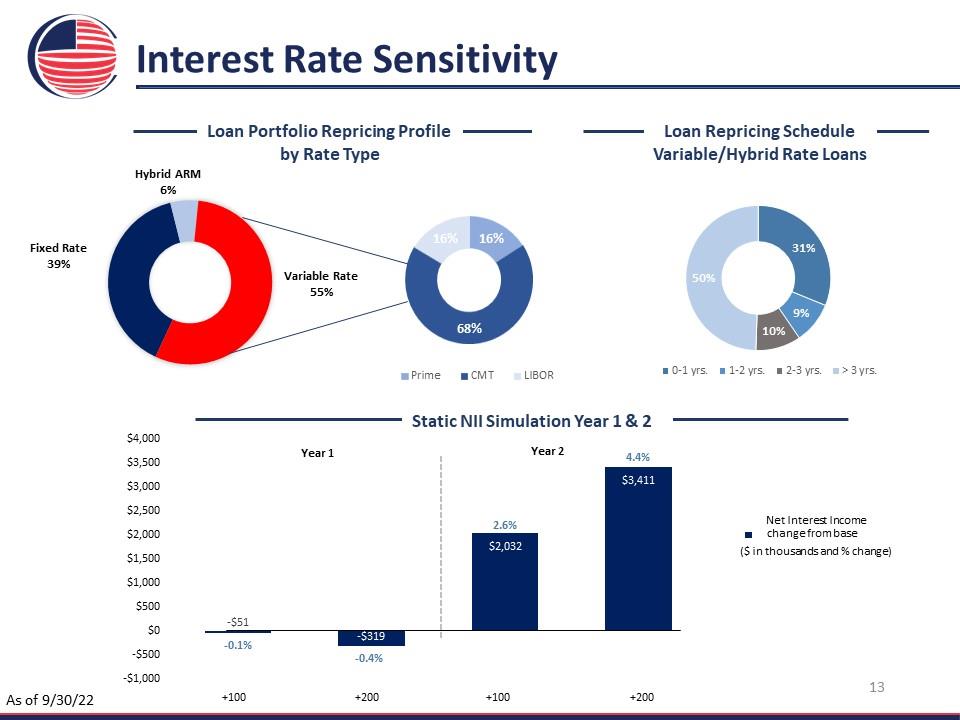
Interest Rate Sensitivity Loan Portfolio Repricing Profile by Rate Type Hybrid ARM 6% Variable Rate 55% Fixed Rate 39% 16% 16% 68% Prime CMT LIBOR Loan Repricing Schedule Variable/Hybrid Rate Loans 31% 9% 10% 50% yrs. 1-2 yrs. 2-3 yrs. >3 yrs Static NII Simulation Year 1 & 2 $4,000 $3,500 $3,000 $2,500 $2,000 $1,500 $1,000 $500 $0 -$500 -$51 -$319 2.6% 4.4% -$1,000 0.1% 0.4% $2,032 $3,411 +100 +200 +100 +200 Net Interest Income change from base ($ in thousands and % change) As of 9/30/22 13
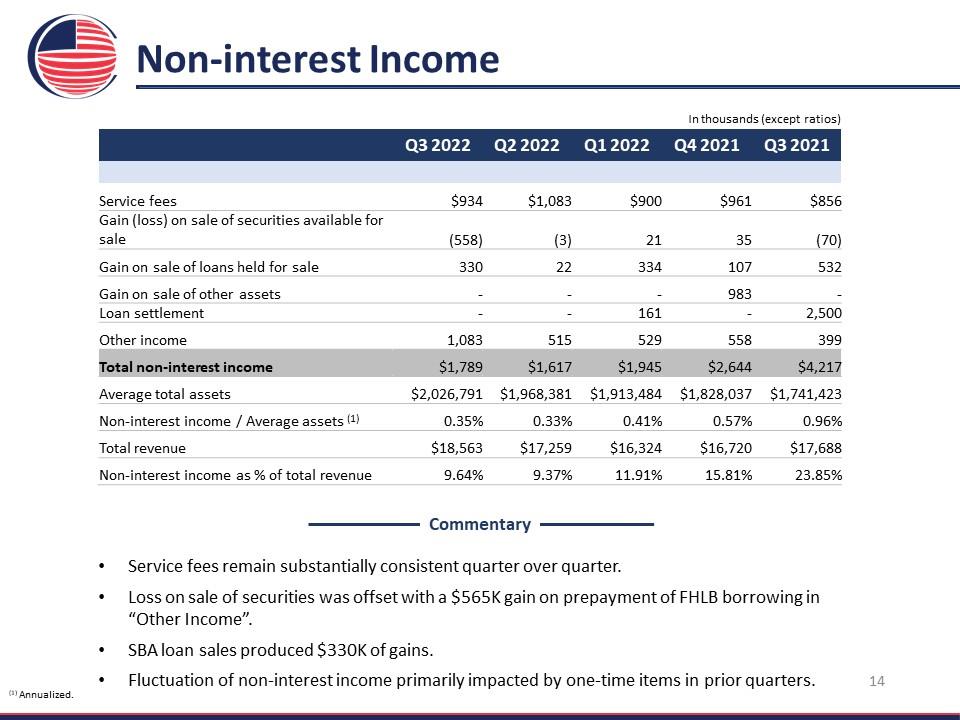
Non-interest Income Q3 2022 Q2 2022 Q1 2022 Q4 2021 Q3 2021 Service fees $934 $1,083 $900 $961 $856 Gain (loss) on sale of securities available for sale (558) (3) 21 35 (70) Gain on sale of loans held for sale 330 22 334 107 532 Gain on sale of other assets - - - 983 - Loan settlement - - 161 - 2,500 Other income 1,083 515 529 558 399 Total non-interest income $1,789 $1,617 $1,945 $2,644 $4,217 Average total assets $2,026,791 $1,968,381 $1,913,484 $1,828,037 $1,741,423 Non-interest income / Average assets (1) 0.35% 0.33% 0.41% 0.57% 0.96% Total revenue $18,563 $17,259 $16,324 $16,720 $17,688 Non-interest income as % of total revenue 9.64% 9.37% 11.91% 15.81% 23.85% Commentary Service fees remain substantially consistent quarter over quarter. Loss on sale of securities was offset with a $565K gain on prepayment of FHLB borrowing in “Other Income”. SBA loan sales produced $330K of gains. Fluctuation of non-interest income primarily impacted by one-time items in prior quarters. (1) Annualized. 14
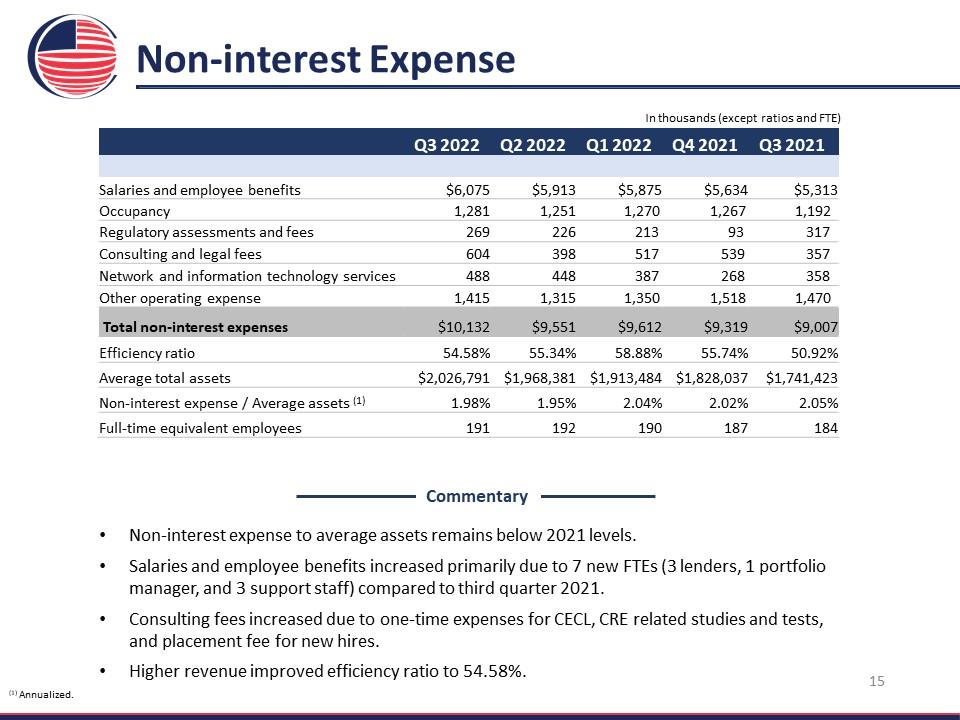
Non-interest Expense In thousands (except ratios and FTE) Q3 2022 Q2 2022 Q1 2022 Q4 2021 Q3 2021 Salaries and employee benefits $6,075 $5,913 $5,875 $5,634 $5,313 Occupancy 1,281 1,251 1,270 1,267 1,192 Regulatory assessments and fees 269 226 213 93 317 Consulting and legal fees 604 398 517 539 357 Network and information technology services 488 448 387 268 358 Other operating expense 1,415 1,315 1,350 1,518 1,470 Total non-interest expenses $10,132 $9,551 $9,612 $9,319 $9,007 Efficiency ratio 54.58% 55.34% 58.88% 55.74% 50.92% Average total asset s $2,026,791 $1,968,381 $1,913,484 $1,828,037 $1,741,423 Non-interest expense / Average assets (1) 1.98% 1.95% 2.04% 2.02% 2.05% Full-time equivalent employees 191 192 190 187 184 Commentary Non-interest expense to average assets remains below 2021 levels. Salaries and employee benefits increased primarily due to 7 new FTEs (3 lenders, 1 portfolio manager, and 3 support staff) compared to third quarter 2021. Consulting fees increased due to one-time expenses for CECL, CRE related studies and tests, and placement fee for new hires. Higher revenue improved efficiency ratio to 54.58%. (1) Annualized. 15
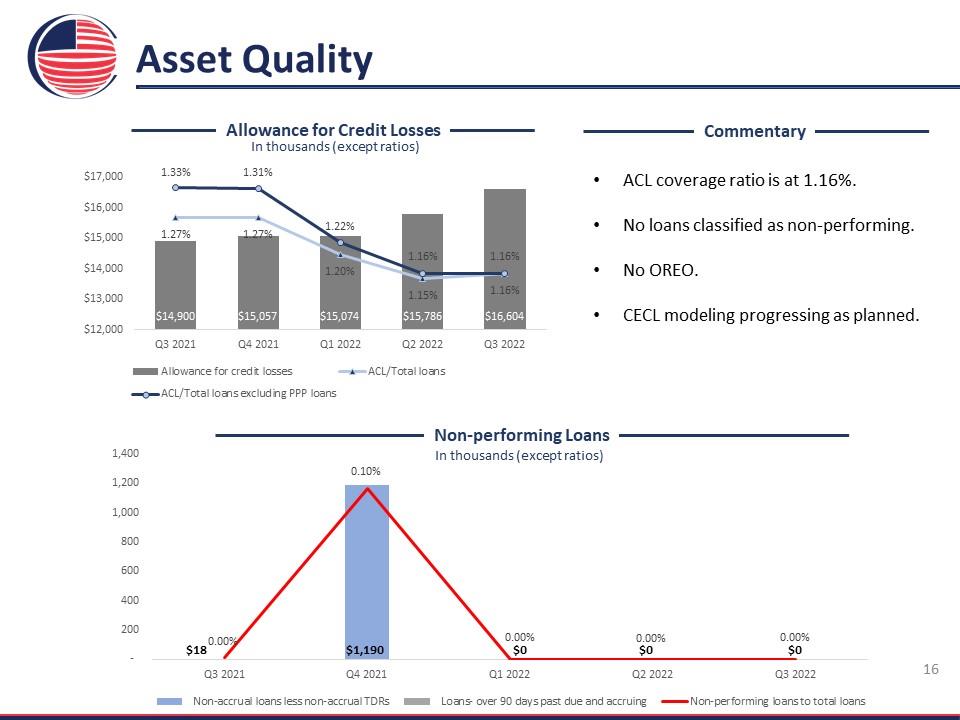
Asset Quality Allowance for Credit Losses In thousands (except ratios) $17,000 $16,000 $15,000 $14,000 1.33% 1.31% 1.22% 1.16% 1.16% $13,000 1.27% 1.27% 1.20% 1.15% 1.16% $12,000 $14,900 $15,057 $15,074 $15,786 $16,604 Q3 2021 Q4 2021 Q1 2022 Q2 2022 Q3 2022 Allowance for credit losses ACL/Total loans ACL/Total loans excluding PPP loans Commentary ACL coverage ratio is at 1.16%. No loans classified as non-performing. No OREO. CECL modeling progressing as planned. Non-performing Loans In thousands (except ratios) 1,400 1,200 1,000 800 600 400 200 0.00% 0.10% 0.00% 0.00% 0.00% - $18 $1,190 $0 $0 $0 Q3 2021 Q4 2021 Q1 2022 Q2 2022 Q3 2022 Non-accrual loans less non-accrual TDRs Loans-over 90 days past due and accruing Non-performing loans to total loans 16
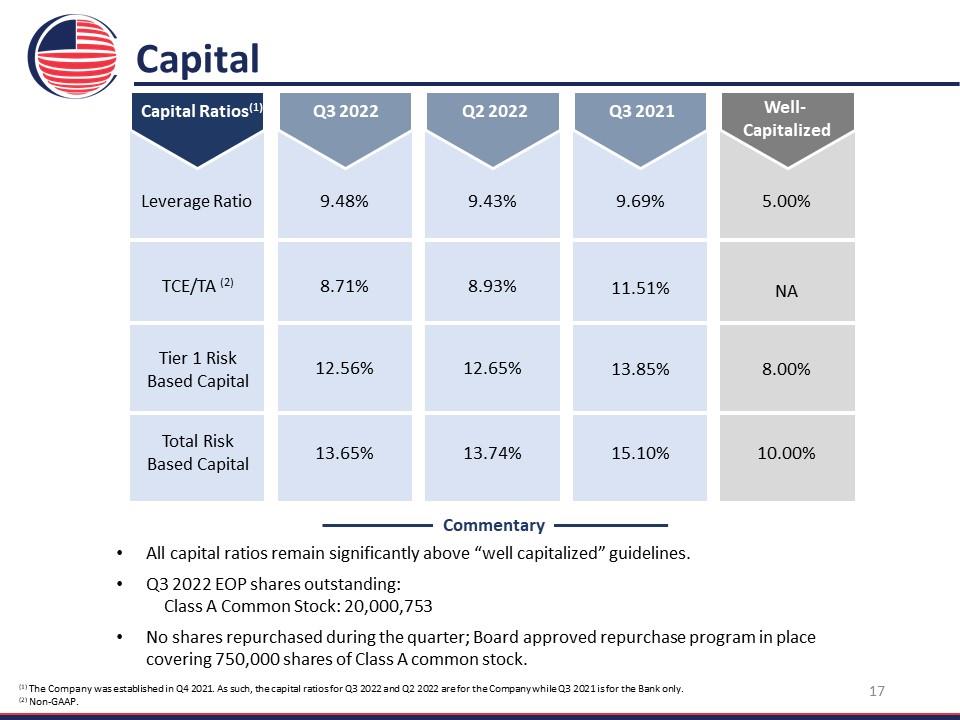
Capital Capital Ratios(1) Leverage Ratio TCE/TA (2) Tier 1 Risk Based Capital Total Risk Based Capital Q3 2022 9.48% 8.71% 12.56% 13.65% Q2 2022 9.43% 8.93% 12.65% 13.74% Q3 2021 9.69% 11.51% 13.85% 15.10% Well- Capitalized 5.00% NA 8.00% 10.00% Commentary All capital ratios remain significantly above “well capitalized” guidelines. Q3 2022 EOP shares outstanding: Class A Common Stock: 20,000,753 No shares repurchased during the quarter; Board approved repurchase program in place covering 750,000 shares of Class A common stock. (1) The Company was established in Q4 2021. As such, the capital ratios for Q3 2022 and Q2 2022 are for the Company while Q3 2021 is for the Bank only. (2) Non-GAAP. 17
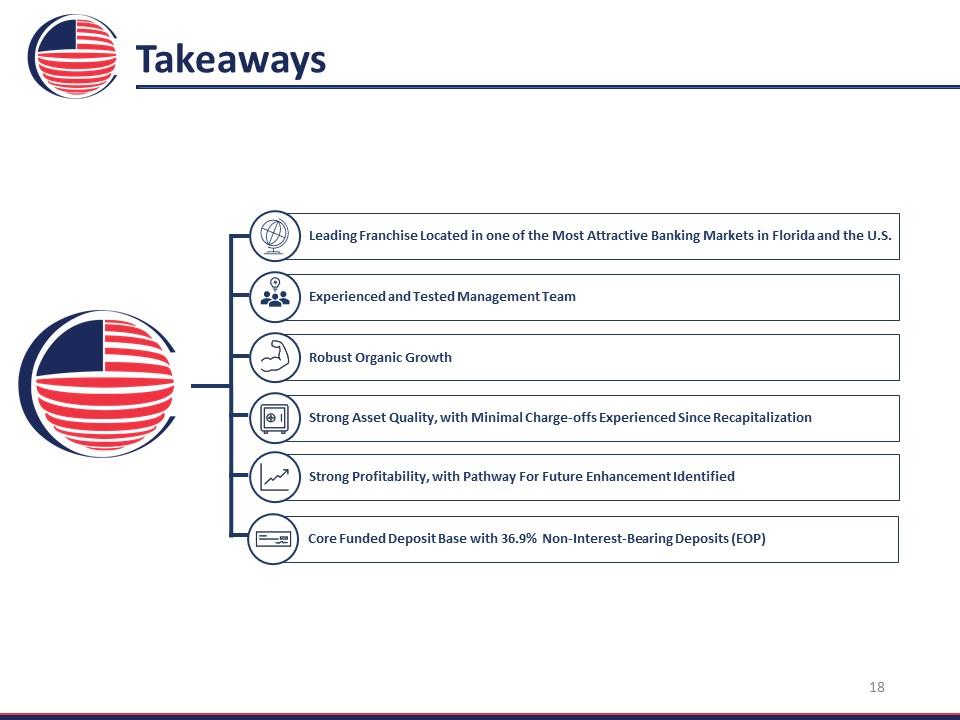
Takeaways Leading Franchise Located in one of the Most Attractive Banking Markets in Florida and the U.S. Experienced and Tested Management Team Robust Organic Growth Strong Asset Quality, with Minimal Charge-offs Experienced Since Recapitalization Strong Profitability, with Pathway For Future Enhancement Identified Core Funded Deposit Base with 36.9% Non-Interest-Bearing Deposits (EOP) 18
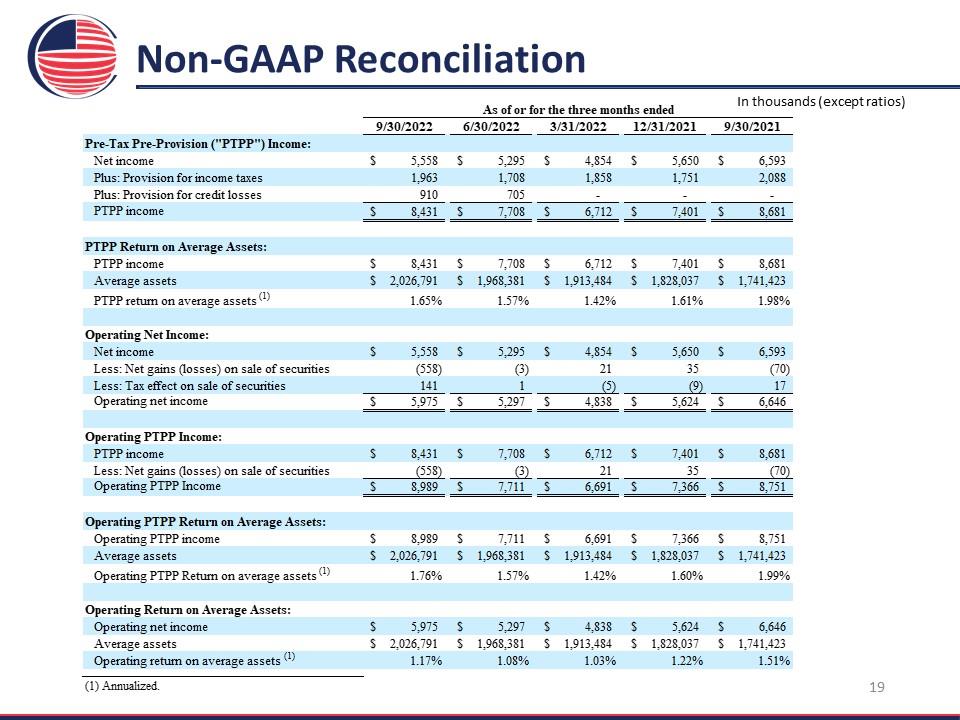
Non-GAAP Reconciliation In thousands (except ratios) Pre-TaxPre Provision ("PTPP") Income: Netincome Plus: Provision forincome taxes Plus: Provision for credit losses PIPP income PIPP Return on Average Assets: PIPP income S 34st 78 $ 6712 $ 7401 $ S681 Average assets S 2679 $ 196381 $ 191344 $ 198087 $ 1741.03 PIPP retum on average assets'"” 165% 15% 1A% 161% 198% Operating Net Income: ‘Net income Less: Net gains (losses) on sale of securities Less: Tax effect on sak of securities Operating net income Operating PTPP Income: PIPP income S84 S$ 7708 $§ «6712 $141 SRL Less: Net gains (losses) on sale of securities G3) @ 4 35 oy Operating PIPPIncome Operating PTPP Return on Average Assets: Operating PTPPincome S77 S$ 6@1 $7366 S$ 7m Average assets S 196381 $ 191344 $ 10807 $ 1741.03 Operating PTPPRetum on average assets! 15% LA% 160% 199% Operating Return on Average Assets: Operating net income S595 $ 527 $ 488 S$ Ses S$ 66m Average assets S$ 206791 S$ 196381 $ 1913484 $ 198087 $ 171.03 Operating retum on average assets"? 11% 108% 105% 12% 151% (1) Ammualized. 19
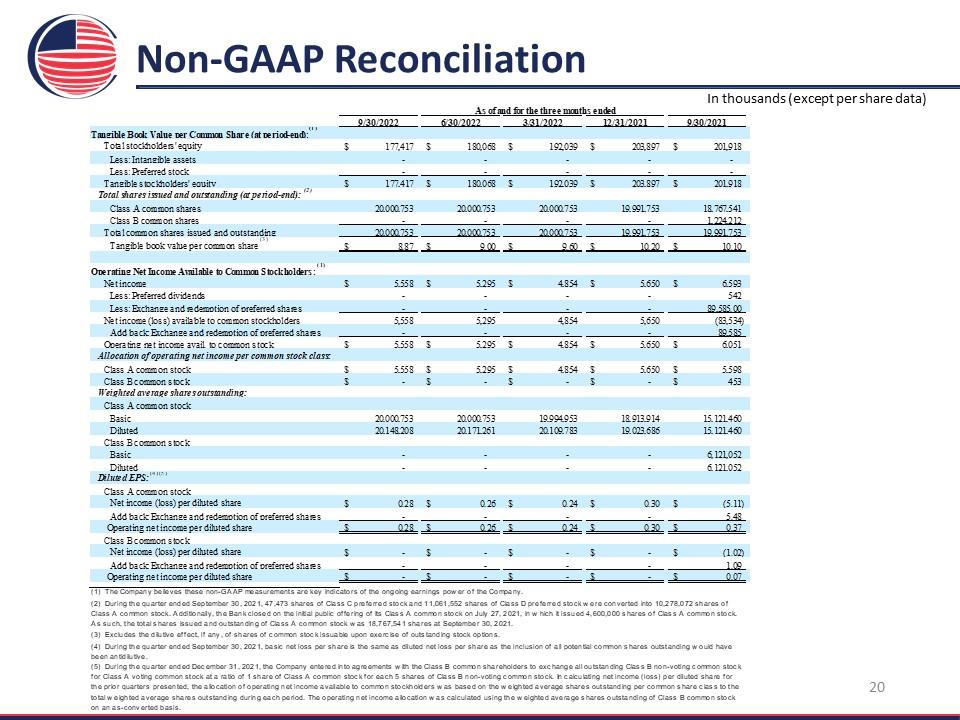
Non-GAAP Reconciliation In thousands (except per share data) As of and for the three months ended 30022 ‘63072022 3312022 12302021 9302021 ‘Tangible Book Value per Common Share (at peried-end):) Total stockholders’ equity s may $ 1006S 192039 S$ 2897S 201918, Less:Intangible assets = e - : Less: Prefered stocie - - - - ‘Tangible stockholm’ equity s ima § iw00e Ss ima maT Ss 201518 Total shares issued and onsstan ding (at period-end): ° Chass A common shares 0.000.753 20.000753, 0.000.753 18767541 Cass B common shares - 7 : 1224212 Totalcommon shares issued and ovtstanding 7201000758 20000735 20,000,753 19.99.73 ‘Tangible book valsepercommoa share") s ss 8 300 $ 20S s 10.10 Operating Net Income Available to Common Stockholders: © Net income s 5558S 5295 458s 560 658 Less: Prefemed dividends a : z as 32 Less: Exchange ané redemption of prefered shares 2 a 89,585.00 ‘Net incom (loss) avaiable to commons tockholées 485 3) Add back Exchang eand edemption of prefered shares 2 5 5 59.585, Operating net income avai. to common stock: s s s 48S 5 6051 Allocation of operating net income per common stock clas Css A conmon stock s s 5295 $ 455s 560 $ 5538 (Clas B common stock: s mans) Ey ae Sat 45 Weighted average shares outstanding Class A common stock Basie 20,000,753 20,000,753, 19.994.953, iss94 1512140 Dilotad 20,148,208 20,171.26 20,10 8,788 19,023,686 15121460 (Class B common stocks Basic . 2 : 2 6121052 Dilotad - : - : 612,052 Diluced EPS:""° Css A conmon stock Netincome (loss) per diluted share s 02s § 026 $ om $s 0x0 en Add back Exchang eand edamption of prefered shares a = : = 548 Opening netincome per diluted share s os 036. 1S om 1s 0300S 037 Class B common stocks Net income (oss) per diluted share s oan Es) a aS a0) Add back Exchanzeand demotion of prefered shares z 7 = = 109 Operating net incom per éilvted
share = ang Sas ae = 007 (1) The Company believes these non-GAAPmeasurements are key indicators of the ongoing earnings power of the Company. (2) During the quarter ended September 30, 2021, 47,473 shares of Class C preferred stock and 11,061,552 shares of Class D preferred stock were converted into 10,278,072 shares of Class A common stock. Additionally, the Bank closed on the initial public offering of ts Class A common stock on July 27, 2021, in which i issued 4,600,000 shares of Class A common stock As such, the total shares issued and outstanding of Class A common stock was 18,767,541 shares at September 30, 2021 (3) Excludes the dilutive effect, if any, of shares of common stock issuable upon exercise of outstanding stock options (4) During the quarter ended September 30, 2021, basic net loss per share is the same as diluted net loss per share as the inclusion of all potential common shares outstanding w ould have been antidilutive. (6) During the quarter ended December 31, 2021, the Corrpany entered into agreements with the Gass B common shareholders to exchange all outstanding Class B non-voting common stock for Class A voting common stock at a ratio of 1 share of Class A common stock for each 5 shares of Class B non-voting common stock. In calculating net income (loss) per diluted share for the prior quarters presented, the allocation of operating net income available to common stockholders was based on the weighted average shares outstanding per common share class to the total weighted average shares outstanding during each period. The operating net income allocation w as calculated using the weighted average shares outstanding of Class B common stock ‘onan as-converted basis. 20
Contact Information Lou de la Aguilera President, CEO & Director (305) 715-5186 laguilera@uscentury.com Rob Anderson Chief Financial Officer (305) 715-5393 rob.anderson@uscentury.com Investor Relations InvestorRelations@uscentury.com 21