Exhibit 99.2
USBC FINANCIAL HOLDINGS Fourth Quarter 2022 Earnings Presentation January 27, 2023
Forward-Looking Statements This presentation may contain statements that are not historical in nature and are intended to be, and are hereby identified as, forward-looking statements for purposes of the safe harbor provided by Section 21E of the Securities Exchange Act of 1934, as amended. The words “may,” “will,” “anticipate,” “should,” “would,” “believe,” “contemplate,” “expect,” “aim,” “plan,” “estimate,” “continue,” and “intend,” as well as other similar words and expressions of the future, are intended to identify forward-looking statements. These forward-looking statements include statements related to our projected growth, anticipated future financial performance, and management’s long-term performance goals, as well as statements relating to the anticipated effects on results of operations and financial condition from expected developments or events, or business and growth strategies, including anticipated internal growth and balance sheet restructuring. These forward-looking statements involve significant risks and uncertainties that could cause our actual results to differ materially from those anticipated in such statements. Potential risks and uncertainties include, but are not limited to: • the strength of the United States economy in general and the strength of the local economies in which we conduct operations; • the continuation of the COVID-19 pandemic and its impact on us, our employees, customers and third-party service providers, and the ultimate extent of the impacts of the pandemic and related government stimulus programs; • our ability to successfully manage interest rate risk, credit risk, liquidity risk, and other risks inherent to our industry; • the accuracy of our financial statement estimates and assumptions, including the estimates used for our credit loss reserve and deferred tax asset valuation allowance; • the efficiency and effectiveness of
our internal control environment; • our ability to comply with the extensive laws and regulations to which we are subject, including the laws for each jurisdicti on where we operate; • legislative or regulatory changes and changes in accounting principles, policies, practices or guidelines, including the effects of the forthcoming implementation of the Current Expected Credit Losses (“CECL”) standard; • the effects of our lack of a diversified loan portfolio and concentration in the South Florida market, including the risks of geographic, depositor, and industry concentrations, including our concentration in loans secured by real estate; effects of climate change • the concentration of ownership of our common stock; • fluctuations in the price of our common stock; • our ability to fund or access the capital markets at attractive rates and terms and manage our growth, both organic growth as well as growth through other means, such as future acquisitions; • inflation, interest rate, unemployment rate, market, and monetary fluctuations; impacts of international hostilities and geopolitical events • increased competition and its effect on the pricing of our products and services as well as our margin; • the effectiveness of our risk management strategies, including operational risks, including, but not limited to, client, employee, or third-party fraud and security breaches; and • other risks described in this presentation and other filings we make with the Securities and Exchange Commission (“SEC”). All forward -looking statements are necessarily only estimates of future results, and there can be no assurance that actual results will not differ materially from expectations. Therefore, you are cautioned not to place undue reliance on any forward-looking statements. Further, forward-looking statements included in this presentation are made only as of the date hereof, and we undertake no obligation
to update or revise any forward-looking statement to reflect events or circumstances after the date on which the statement is made or to reflect the occurrence of unanticipated events, unless required to do so under the federal securities laws. You should also review the risk factors described in the reports USCB Financial Holdings, Inc. filed or will file with the SEC and, for periods prior to the completion of the bank holding company reorganization in December 2021, U.S. Century Bank filed with the FDIC. Non-GAAP Financial Measures This presentation includes financial information determined by methods other than in accordance with generally accepted accounting principles (“GAAP”). This financial information includes certain operating performance measures. Management has included these non-GAAP measures because it believes these measures may provide useful supplemental information for evaluating the Company’s underlying performance trends. Further, management uses these measures in managing and evaluating the Company’s business and intends to refer to them in discussions about our operations and performance. Operating performance measures should be viewed in addition to, and not as an alternative to or substitute for, measures determined in accordance with GAAP, and are not necessarily comparable to non-GAAP measures that may be presented by other companies. To the extent applicable, reconciliations of these non-GAAP measures to the most directly comparable GAAP measures can be found in the ‘Non-GAAP Reconciliation Tables’ included in the presentation. All numbers included in this presentation are unaudited unless otherwise noted. 2
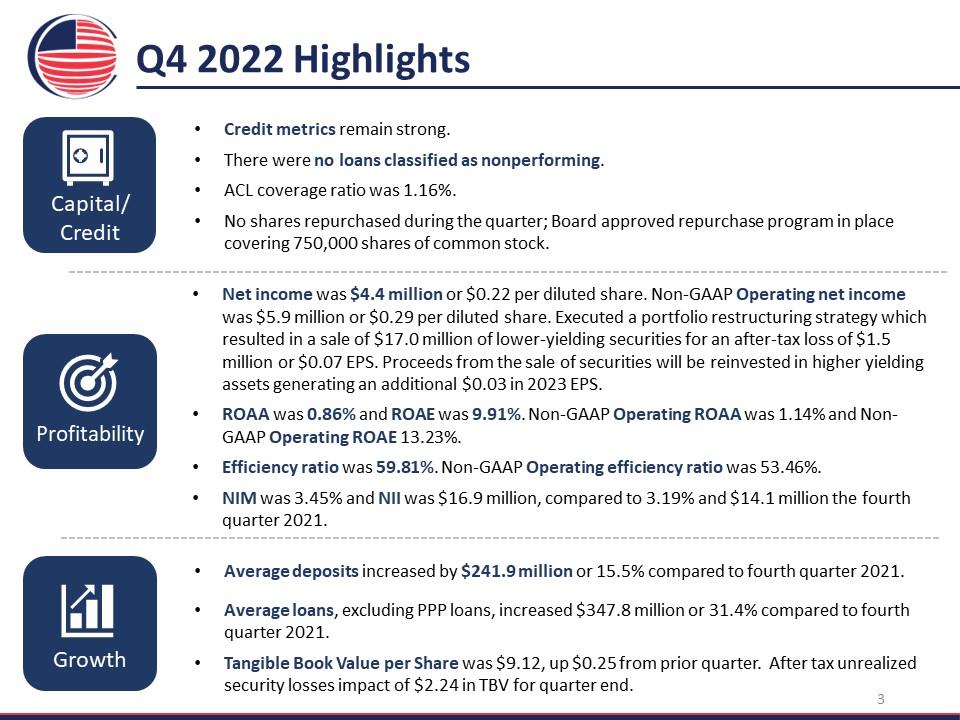
Q4 2022 Highlights Capital/ Credit Credit metrics remain strong. There were no loans classified as nonperforming. ACL coverage ratio was 1.16%. No shares repurchased during the quarter; Board approved repurchase program in place covering 750,000 shares of common stock. Profitability Net income was $4.4 million or $0.22 per diluted share. Non-GAAP Operating net income was $5.9 million or $0.29 per diluted share. Executed a portfolio restructuring strategy which resulted in a sale of $17.0 million of lower-yielding securities for an after-tax loss of $1.5 million or $0.07 EPS. Proceeds from the sale of securities will be reinvested in higher yielding assets generating an additional $0.03 in 2023 EPS. ROAA was 0.86% and ROAE was 9.91%. Non-GAAP Operating ROAA was 1.14% and Non-GAAP Operating ROAE 13.23%. Efficiency ratio was 59.81%. Non-GAAP Operating efficiency ratio was 53.46%. NIM was 3.45% and NII was $16.9 million, compared to 3.19% and $14.1 million the fourth quarter 2021. Growth Average deposits increased by $241.9 million or 15.5% compared to fourth quarter 2021. Average loans, excluding PPP loans, increased $347.8 million or 31.4% compared to fourth quarter 2021. Tangible Book Value per Share was $9.12, up $0.25 from prior quarter. After tax unrealized security losses impact of $2.24 in TBV for quarter end. 3
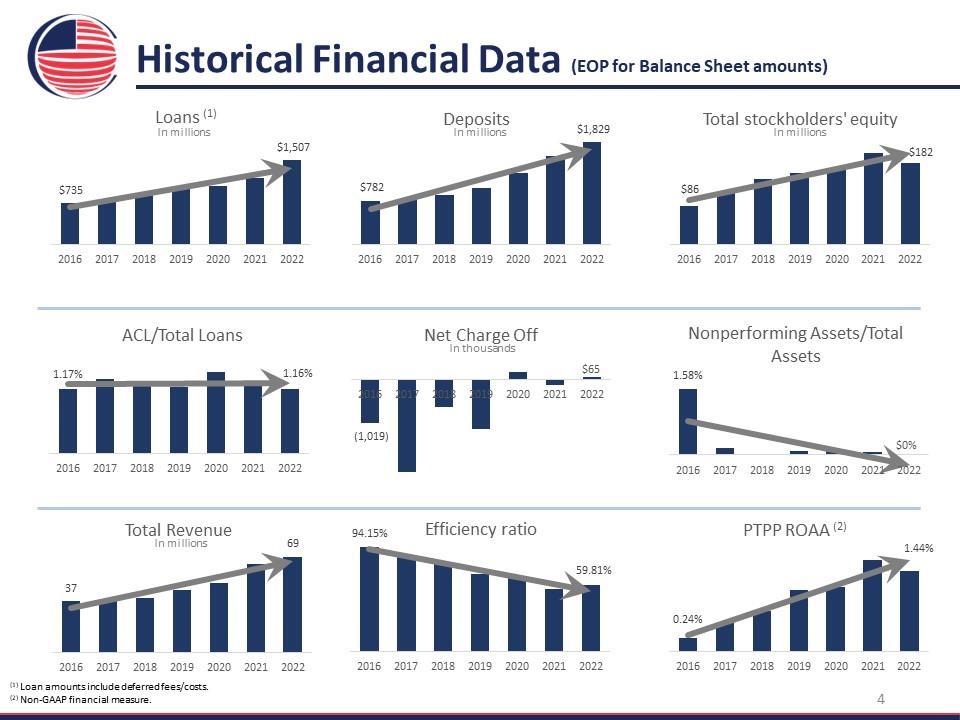
Historical Financial Data (EOP for Balance Sheet amounts) Loans (1) in millions $735 $1,507 Deposits in millions $782 $1,829 Total stockholder’s equity in millions $86 $182 ACL/Total Loans 1.17% 1.16% Net Charge Off in thousands ($1,019) $65 Nonperforming Assets/Total Assets 1.58% 0% Total Revenue in millions 37 69 Efficiency ratio 94.15% 59.81% PTPP ROAA (2) 0.24% 1.44% (1) Loan amounts include deferred fees/costs. (2) Non-GAAP financial measure. 4
Business Verticals JA/PCG(1) Deposits EOP $172 Million 33% Growth
YoY Loans EOP $9 Million 266% Growth YoY HOA(2) Deposits EOP $97 Million 42% Growth YoY Loans EOP $73 Million 59% Growth YoY Global Deposits EOP $177 Million 14% Growth YoY Loans EOP $94 Million 58% Growth YoY Yachts Loans EOP $125 Million 57% Growth YoY - $77MM in loan production in 2022 - 32% of the purchased portfolio was paid off in 2022 SBA(3) Loans EOP $38 Million - $19MM closed in SBA 7As in 2022 - $891K in gain on sale of loans in 2022 (1) JA/PCG: Jurist Advantage/Private Client Group (2) HOA: Homeowners Association (3) Does not include PPP Loans. 5
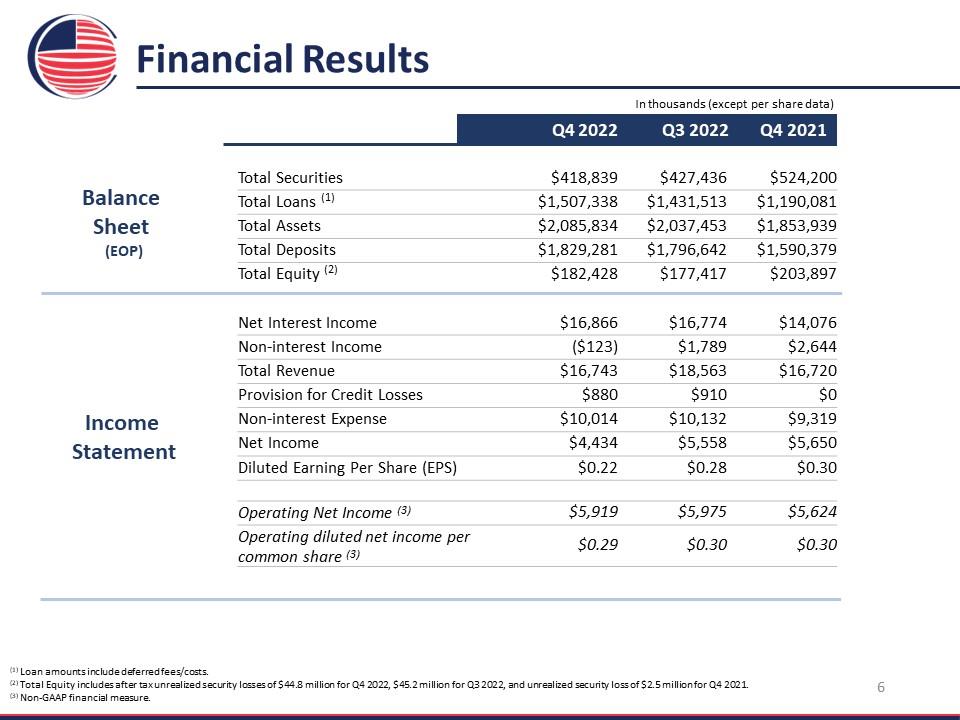
Financial Results In thousands (except per share data) Balance Sheet (EOP) Total Securities $418,839 $427,436 $524,200 Total Loans (1) $1,507,338 $1,431,513 $1,190,081 Total Assets $2,085,834 $2,037,453 $1,853,939 Total Deposits $1,829,281 $1,796,642 $1,590,379 Total Equity (2) $182,428 $177,417 $203,897 Income Statement Net Interest Income $16,866 $16,774 $14,076 Non-interest Income ($123) $1,789 $2,644 Total Revenue $16,743 $18,563 $16,720 Provision for Credit Losses $880 $910 $0 Non-interest Expense $10,014 $10,132 $9,319 Net Income $4,434 $5,558 $5,650 Diluted Earning Per Share (EPS) $0.22 $0.28 $0.30 Operating Net Income (3) $5,919 $5,975 $5,624 Operating diluted net income per common share (3) $0.29 $0.30 $0.30 (1) Loan amounts include deferred fees/costs. (2) Total Equity includes after tax unrealized security losses of $44.8 million for Q4 2022, $45.2 million for Q3 2022, and unrealized security loss of $2.5 million for Q4 2021. (3) Non-GAAP financial measure. 6
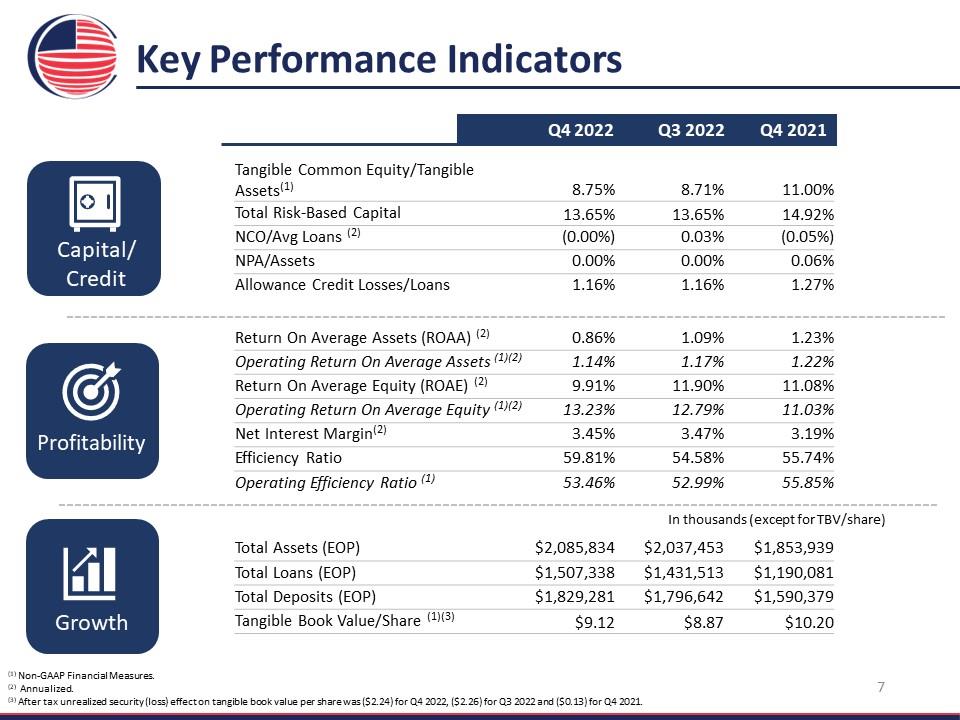
Key Performance Indicators Capital/Credit Profitability Growth Q4 2022 Q3 2022 Q4 2021 Tangible Common Equity/Tangible Assets(1) 8.75% 8.71% 11.00% Total Risk-Based Capital 13.65% 13.65% 14.92% NCO/Avg Loans (2) (0.00%) 0.03% (0.05%) NPA/Assets 0.00% 0.00% 0.06% Allowance Credit Losses/Loans 1.16% 1.16% 1.27% Return On Average Assets (ROAA) (2) 0.86% 1.09% 1.23% Operating Return On Average Assets (1)(2) 1.14% 1.17% 1.22% Return On Average Equity (ROAE) (2) 9.91% 11.90% 11.08% Operating Return On Average Equity (1)(2) 13.23% 12.79% 11.03% Net Interest Margin(2) 3.45% 3.47% 3.19% Efficiency Ratio 59.81% 54.58% 55.74% Operating Efficiency Ratio (1) 53.46% 52.99% 55.85% In thousands (except for TBV/shares) Total Assets (EOP) $2,085,834 $2,037,453 $1,853,939 Total Loans (EOP) $1,507,338 $1,431,513 $1,190,081 Total Deposits (EOP) $1,829,281 $1,796,642 $1,590,379 Tangible Book Value/Share (1)(3) $9.12 $8.87 $10.20 (1) Non-GAAP Financial Measures. (2) Annualized. (3) After tax unrealized security (loss) effect on tangible book value per share was ($2.24) for Q4 2022, ($2.26) for Q3 2022 and ($0.13) for Q4 2021. 7
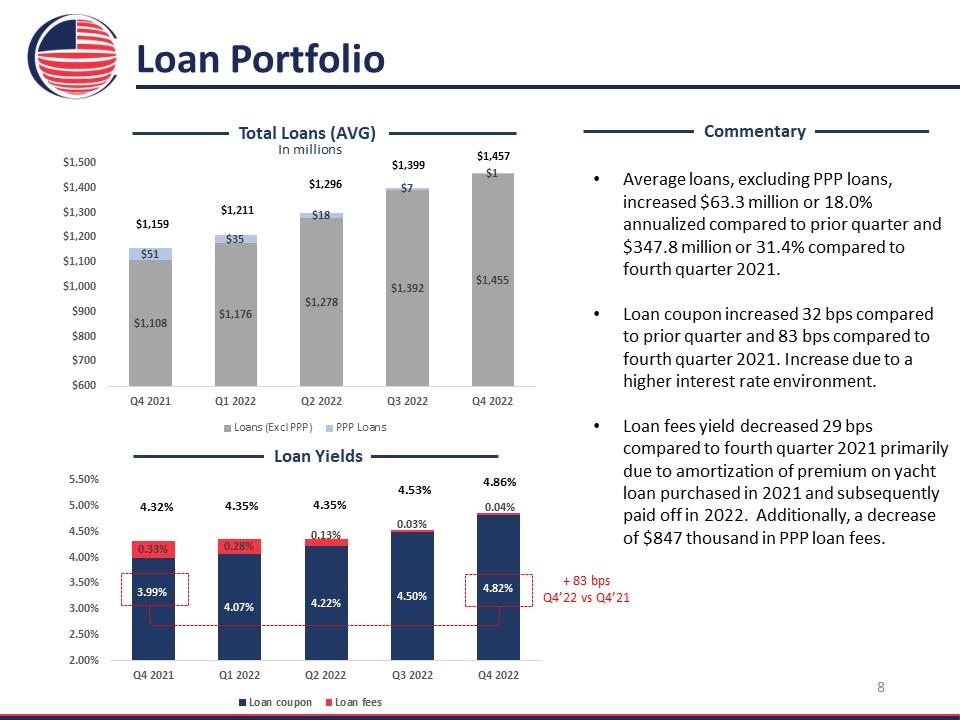
Loan Portfolio Total Loans (AVG) In millions $1,159 $1,211 $1,296 $1,399 $1,457 $51 $35 $18 $7 $1 $1,108 $1,176 $1,278 $1,392 $1,455 Loans (Exd PPP) PPP Loans Loan Yields 4.32% 4.35% 435.00% 4.53% 4.86% 0.33% 0.28% 13.00% 0.03% 0.04% 3.99% 4.07% 4.22% 4.50% 4.82% Loan coupon Loan fees + 83 bps Q4’22 vs Q4’21 Commentary Average loans, excluding PPP loans, increased $63.3 million or 18.0% annualized compared to prior quarter and $347.8 million or 31.4% compared to fourth quarter 2021. Loan coupon increased 32 bps compared to prior quarter and 83 bps compared to fourth quarter 2021. Increase due to a higher interest rate environment. Loan fees yield decreased 29 bps compared to fourth quarter 2021 primarily due to amortization of premium on yacht loan purchased in 2021 and subsequently paid off in 2022. Additionally, a decrease of $847 thousand in PPP loan fees. 8
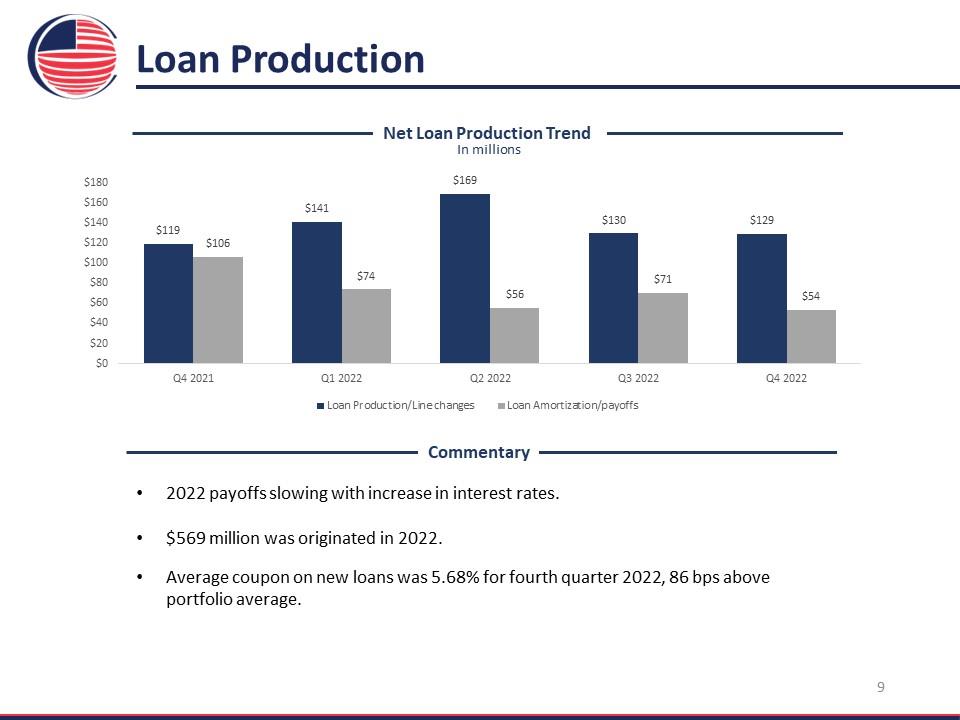
Loan Production Net Loan Production Trend In millions $119 $106 $141 $74 $169 $56 $130 $71 $129 $54 Laon Production/Line changes Loan Amortization/payoffs Commentary 2022 payoffs slowing with increase in interest rates. $569 million was originated in 2022. Average coupon on new loans was 5.68% for fourth quarter 2022, 86 bps above portfolio average. 9
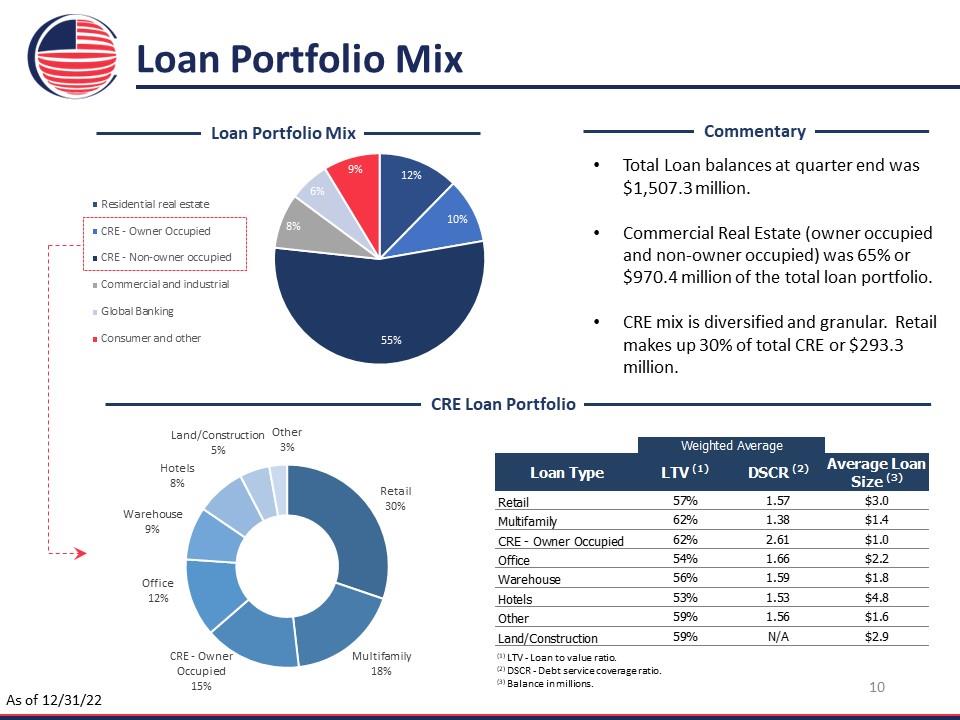
Loan Portfolio Mix Loan Portfolio Mix 9% 12% 10% 55% 8% 6% Residential real estate CRE – Owner Occupied CRE – Non-owner occupied Commercial and industrial Global Banking Consumer and other Commentary Total Loan balances at quarter end was $1,507.3 million. Commercial Real Estate (owner occupied and non-owner occupied) was 65% or $970.4 million of the total loan portfolio. CRE mix is diversified and granular. Retail makes up 30% of total CRE or $293.3 million. CRE Loan Portfolio Other 3% Retail 30% Multifamily 18% CRE - Owner Occupied 15% Office 12%’ Warehouse 9% Hotels 8% Land/Construction 5% Weighted Average Loan Type LTV(1) DSCR Average Loan Size Retail 57% 1.57 $3.0 Multifamily 62% 1.38 $1.4 CRE - Owner Occupied 62% 2.61 $1.0 Office 54% 1.66 $2.2 Warehous e 56% 1.59 $1.8 Hotels 53% 1.53 $4.8 Other 59% 1.56 $1.6 Land/Construction 59% N/A $2.9 (1) LTV - Loan to value ratio. (2) DSCR - Debt service coverage ratio. (3) Balance in millions. 10
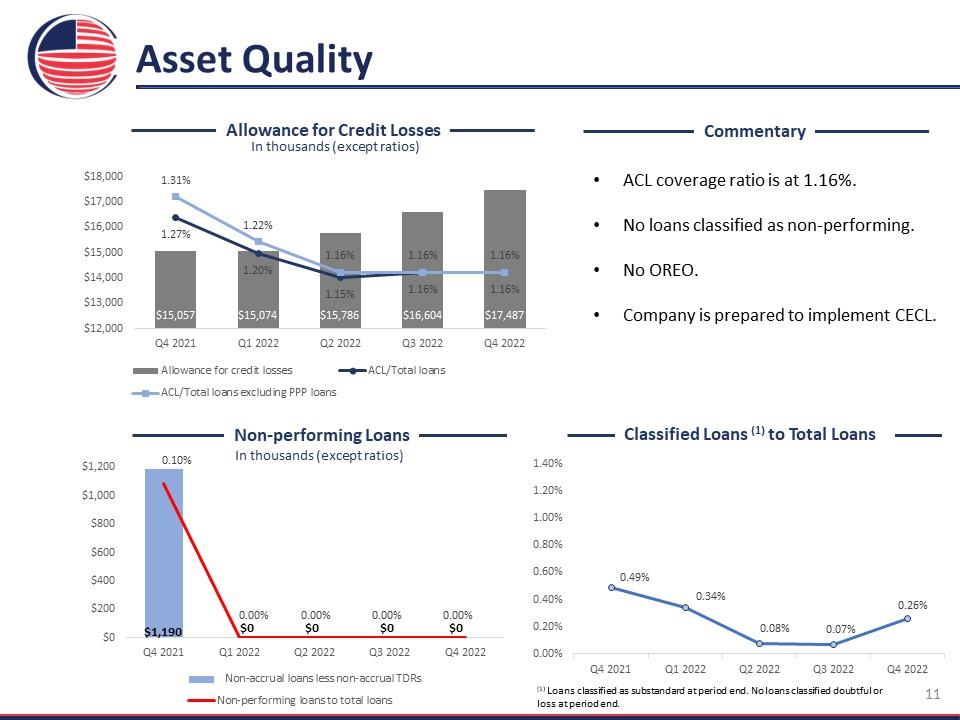
Asset Quality Allowance for Credit Losses In thousands (except ratios) 1.31% 1.22% 1.16% 1.16% 1.16% 1.27% 1.20% 1.15% 1.16% 1.16% $15,057 $15,074 $15,786 $16,604 $17,487 Allowance for credit losses ACL/Total loans ACL/Total loans excluding PPP loans Commentary ACL coverage ratio is at 1.16%. No loans classified as non-performing. No OREO. Company is prepared to implement CECL. Non-performing Loans In thousands (except ratios) 0.10% 0.00% 0.00% 0.00% 0.00% $1,190 $0 $0 $0 $0 Non-accrual loans less non-accrual TDRs Non-performing loans to total loans Classified Loans (1) to Total Loans 0.49% 0.40% 0.08% 0.07% 0.26% (1) Loans classified as substandard at period end. No loans classified doubtful or loss at period end. 11
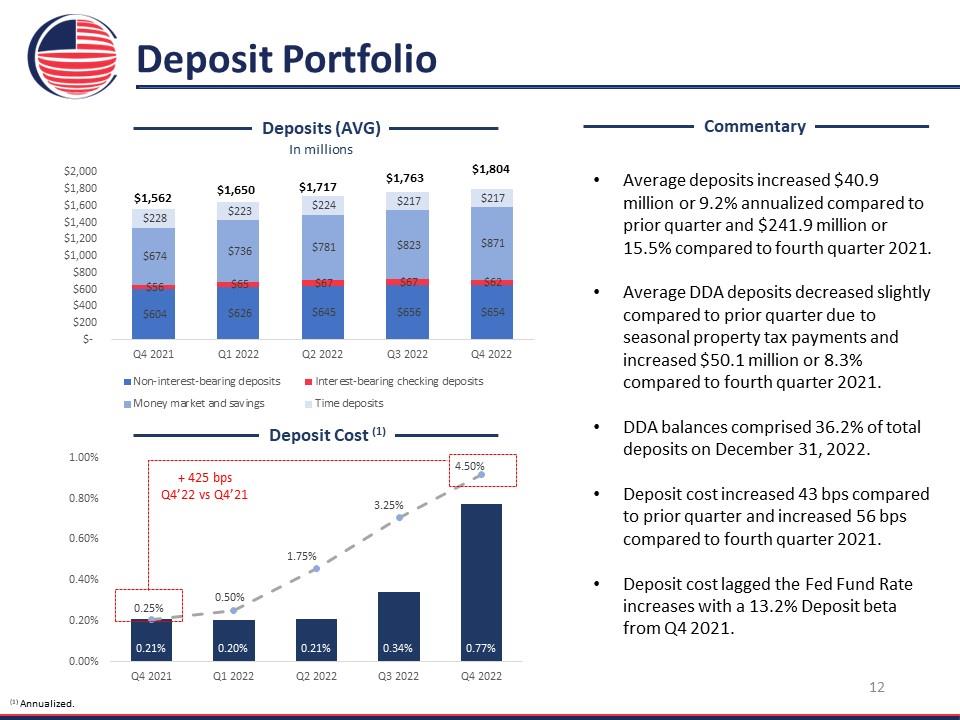
Deposit Portfolio Deposits (AVG) In millions $1,562 $1,650 $1,717 $1,763 $1,804 $228 $223 $224 $217 $217 $674 $736 $781 $823 $871 $56 $65 $67 $67 $62 $604 $626 $645 $656 $654 Non-interest-bearing deposits Money market and savings Interest-bearing checking deposits Time deposits Deposit Cost (1) 0.25% 0.50% 1.75% 3.25% 4.50% 0.21% 0.20% 2.10% 0.34% 0.77% Commentary Average deposits increased $40.9 million or 9.2% annualized compared to prior quarter and $241.9 million or 15.5% compared to fourth quarter 2021. Average DDA deposits decreased slightly compared to prior quarter due to seasonal property tax payments and increased $50.1 million or 8.3% compared to fourth quarter 2021. DDA balances comprised 36.2% of total deposits on December 31, 2022. Deposit cost increased 43 bps compared to prior quarter and increased 56 bps compared to fourth quarter 2021. Deposit cost lagged the Fed Fund Rate increases with a 13.2% Deposit beta from Q4 2021. 12
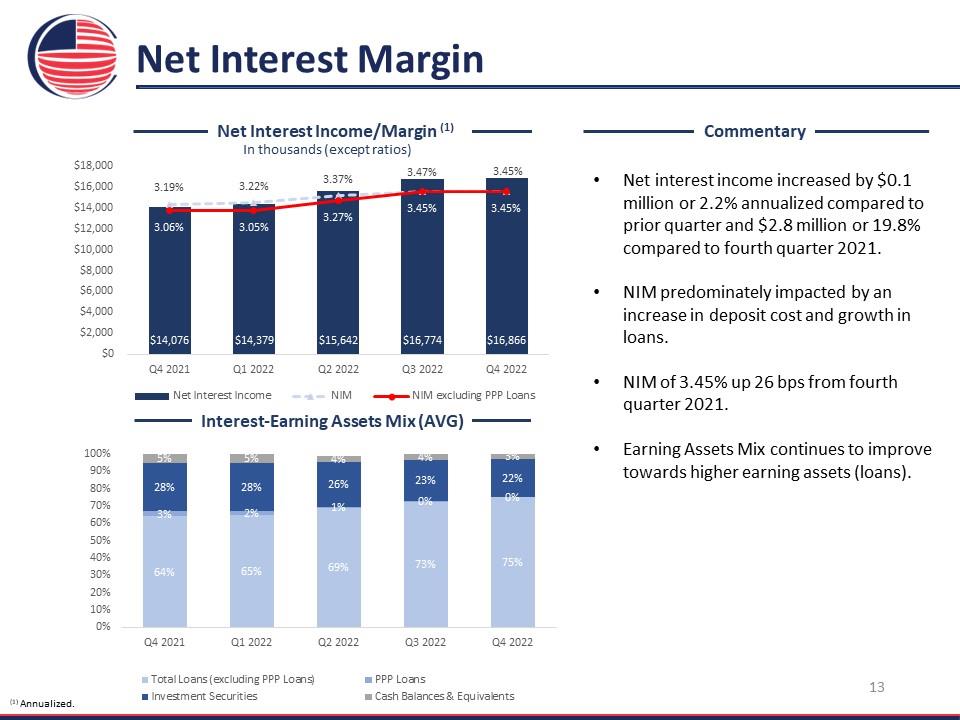
Net Interest Margin Net Interest Income/Margin (1) In thousands (except ratios) 3.19% 3.22% 3.37% 3.47% 3.45% 3.06% 3.05% 3.27% 3.45% 3.45% $14,076 $14,379 $15,642 $16,774 $16,866 Net Interest Income NIM NIM excluding PPP Loans Interest-Earning Assets Mix (AVG) 5% 5% 4% 4% 3% 28% 28% 26% 23% 22% 3% 2% 1% 0% 0% 64% 65% 69% 73% 75% Total Loans (excluding PPP Loans) Investment Securities PPP Loans Cash Balances & Equivalents Commentary Net interest income increased by $0.1 million or 2.2% annualized compared to prior quarter and $2.8 million or 19.8% compared to fourth quarter 2021. NIM predominately impacted by an increase in deposit cost and growth in loans. NIM of 3.45% up 26 bps from fourth quarter 2021. Earning Assets Mix continues to improve towards higher earning assets (loans). (1) Annualized. 13
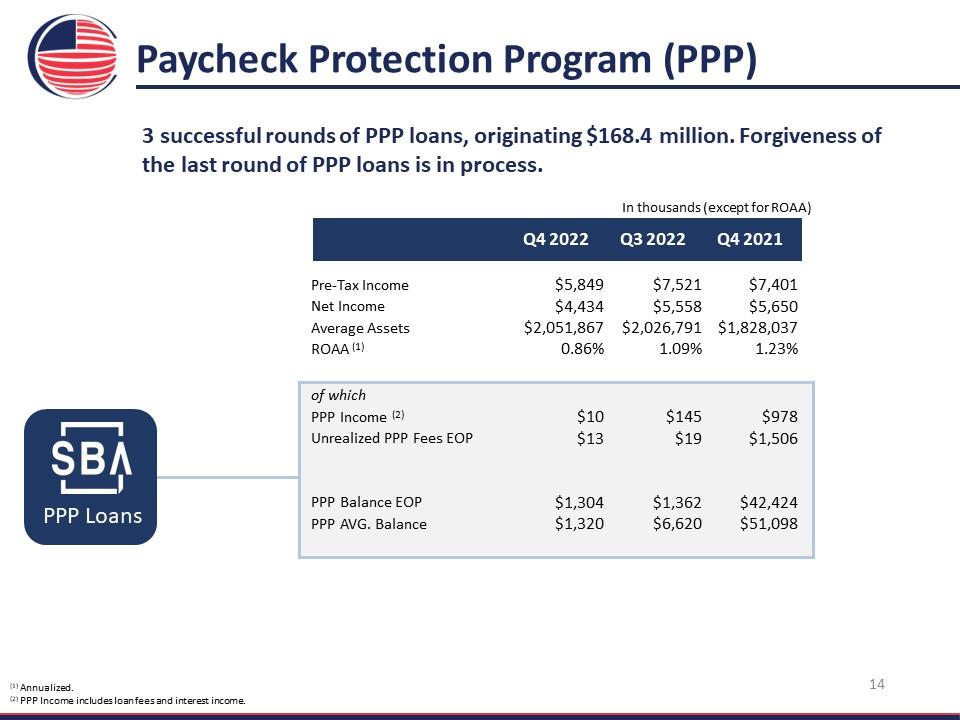
Paycheck Protection Program (PPP) 3 successful rounds of PPP loans, originating $168.4 million. Forgiveness of the last round of PPP loans is in process. In thousands (except for ROAA) Q4 2022 Q3 2022 Q4 2021 Pre-Tax Income $5,849 $7,521 $7,401 Net Income $4,434 $5,558 $5,650 Average Assets $2,051,867 $2,026,791 $1,828,037 ROAA (1) 0.86% 1.09% 1.23% of which PPP Income (2) $10 $145 $978 Unrealized PPP Fees EOP $13 $19 $1,506 PPP Balance EOP $1,304 $1,362 $42,424 PPP AVG. Balance $1,320 $6,620 $51,098 PPP Loans (1) Annualized. (2) PPP Income includes loan fees and interest income. 14
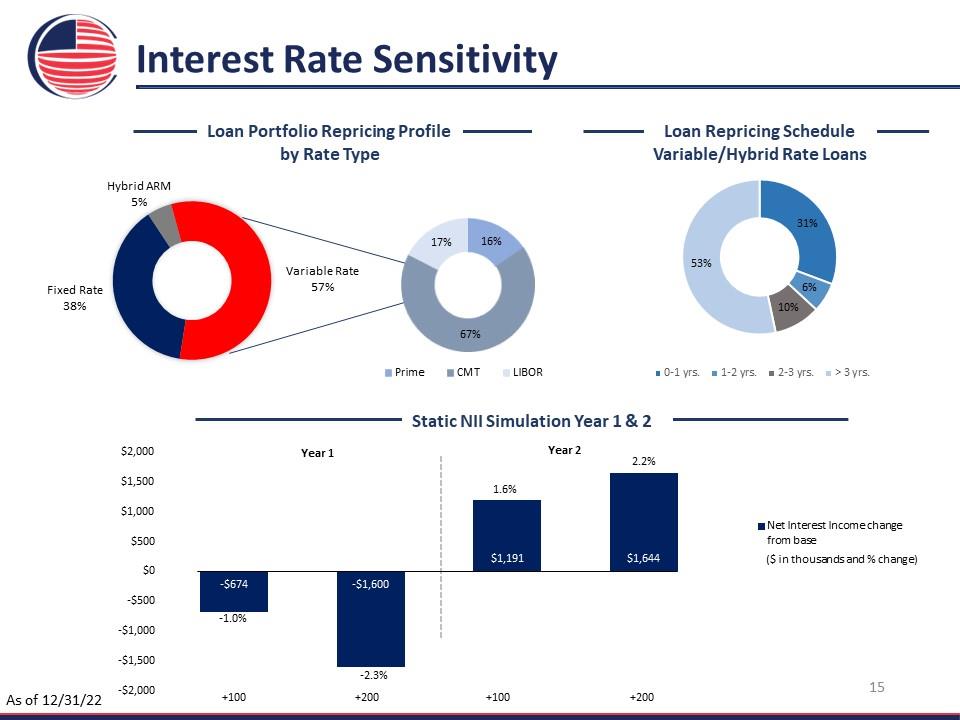
Interest Rate Sensitivity Loan Portfolio Repricing Profile by Rate Type Hybrid ARM 5% Variable Rate 57% Fixed Rate 38% 17% 16% 67% Prime CMT LIBOR 31% 6% 10%53% yrs 1-2 yrs. 2-3 yrs >3 yrs Static NII Simulation Year 1 & 2 Year 1 Years 2 -$6.74 -$16.00 $11.91 $16.44 -1.0% -2.3% 1.6% 2.2% Net Interest Income change from base ($ in thousands and % change) As of 12/31/22 15
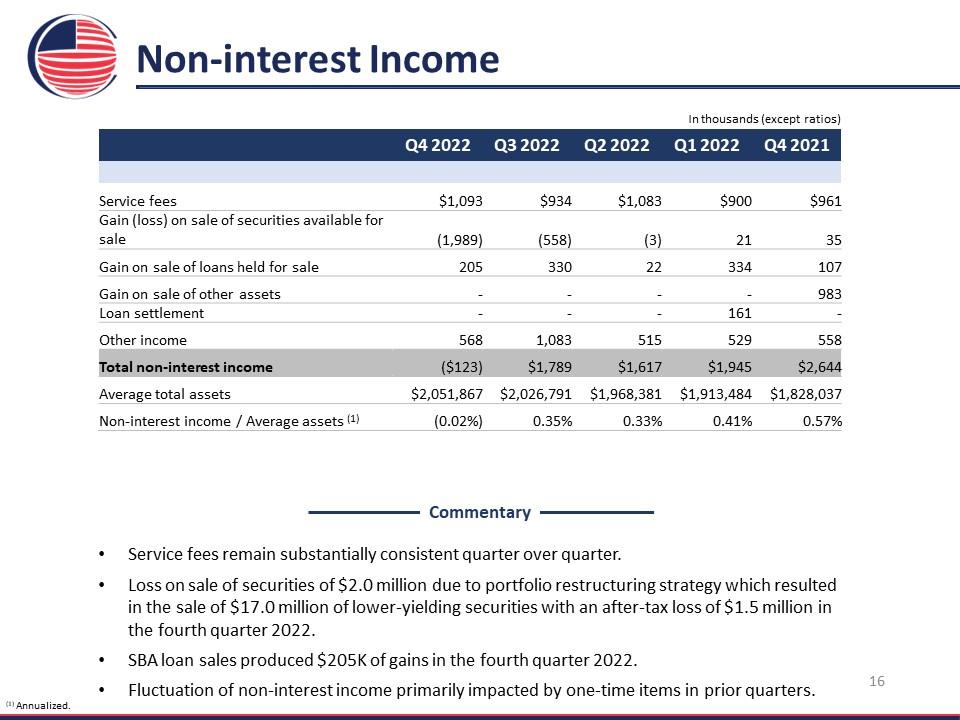
Non-interest Income In thousands (except ratios) Q4 2022 Q3 2022 Q2 2022 Q1 2022 Q4 2021 Service fees $1,093 $934 $1,083 $900 $961 Gain (loss) on sale of securities available for sale (1,989) (558) (3) 21 35 Gain on sale of loans held for sale 205 330 22 334 107 Gain on sale of other assets - - - - 983 Loan settlement - - - 161 - Other income 568 1,083 515 529 558 Total non-interest income ($123) $1,789 $1,617 $1,945 $2,644 Average total assets $2,051,867 $2,026,791 $1,968,381 $1,913,484 $1,828,037 Non-interest income / Average assets (1) (0.02%) 0.35% 0.33% 0.41% 0.57% Commentary Service fees remain substantially consistent quarter over quarter. Loss on sale of securities of $2.0 million due to portfolio restructuring strateg y which resulted in the sale of $17.0 million of lower-yielding securities with an after-tax loss of $1.5 million in the fourth quarter 2022. SBA loan sales produced $205K of gains in the fourth quarter 2022. Fluctuation of non-interest income primarily impacted by one-time items in prior quarters. (1) Annualized. 16
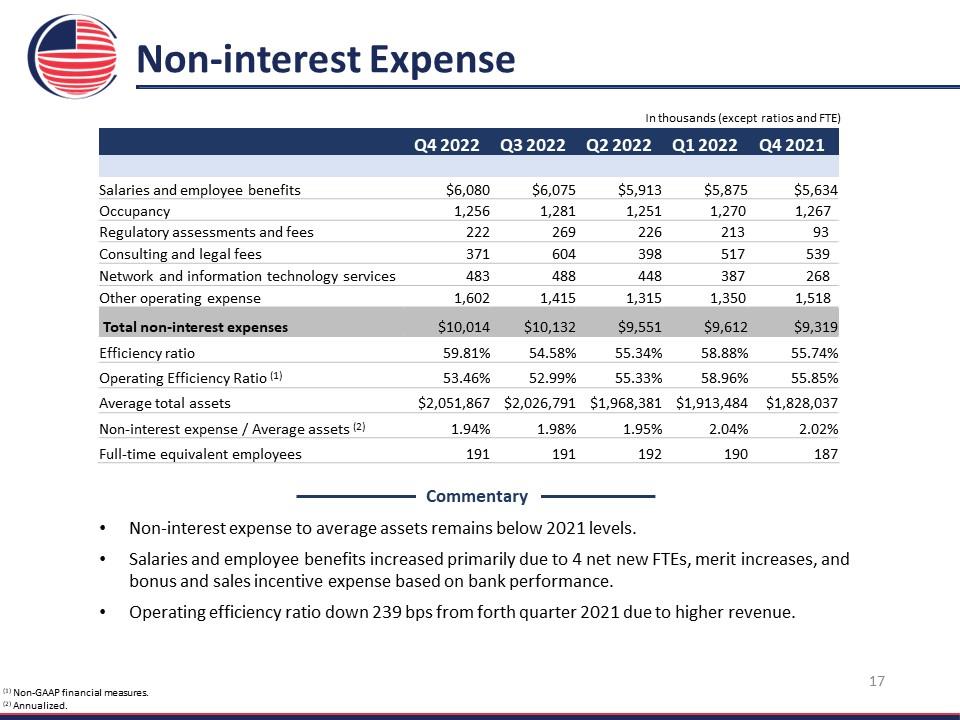
Non-interest Expense In thousands (except ratios and FTE) Q4 2022 Q3 2022 Q2 2022 Q1 2022 Q4 2021 Salaries and employee benefits $6,080 $6,075 $5,913 $5,875 $5,634 Occupancy 1,256 1,281 1,251 1,270 1,267 Regulatory assessments and fees 222 269 226 213 93 Consulting and legal fees 371 604 398 517 539 Network and information technology services 483 488 448 387 268 Other operating expense 1,602 1,415 1,315 1,350 1,518 Total non-interest expenses $10,014 $10,132 $9,551 $9,612 $9,319 Efficiency ratio 59.81% 54.58% 55.34% 58.88% 55.74% Operating Efficiency Ratio (1) 53.46% 52.99% 55.33% 58.96% 55.85% Average total assets $2,051,867 $2,026,791 $1,968,381 $1,913,484 $1,828,037 Non-interest expense / Average assets (2) 1.94% 1.98% 1.95% 2.04% 2.02% Full-time equivalent employees 191 191 192 190 187 Commentary Non-interest expense to average assets remains below 2021 levels. Salaries and employee benefits increased primarily due to 4 net new FTEs, merit increases, and bonus and sales incentive expense based on bank performance. Operating efficiency ratio down 239 bps from forth quarter 2021 due to higher revenue. (1) Non-GAAP financial measures. (2) Annualized. 17
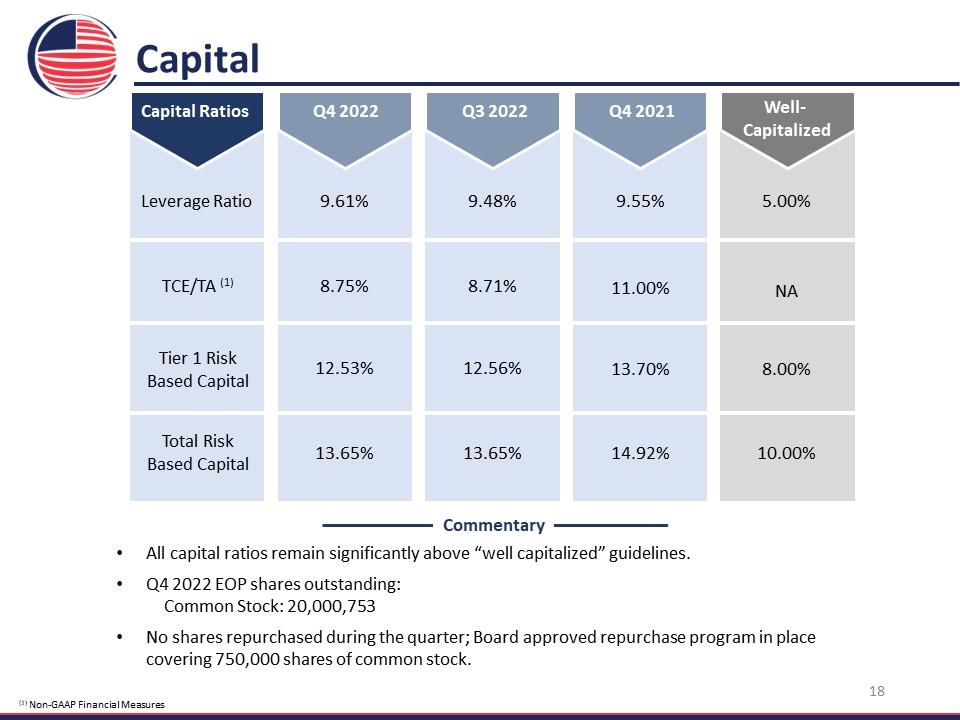
Capital Capital Ratios Q4 2022 Q3 2022 Q4 2021 Well-Capitalized Leverage Ratio 9.61% 9.48% 9.55% 5.00% TCE/TA (1) 8.75% 8.71% 11.00% NA Tier 1 Risk Based Capital 12.53% 12.56% 13.70% 8.00% Total Risk Based Capital 13.65% 13.65% 14.92% 10.00% Commentary All capital ratios remain significantly above “well capitalized” guidelines. Q4 2022 EOP shares outstanding: Common Stock: 20,000,753 No shares repurchased during the quarter; Board approved repurchase program in place covering 750,000 shares of common stock. (1) Non-GAAP Financial Measures 18
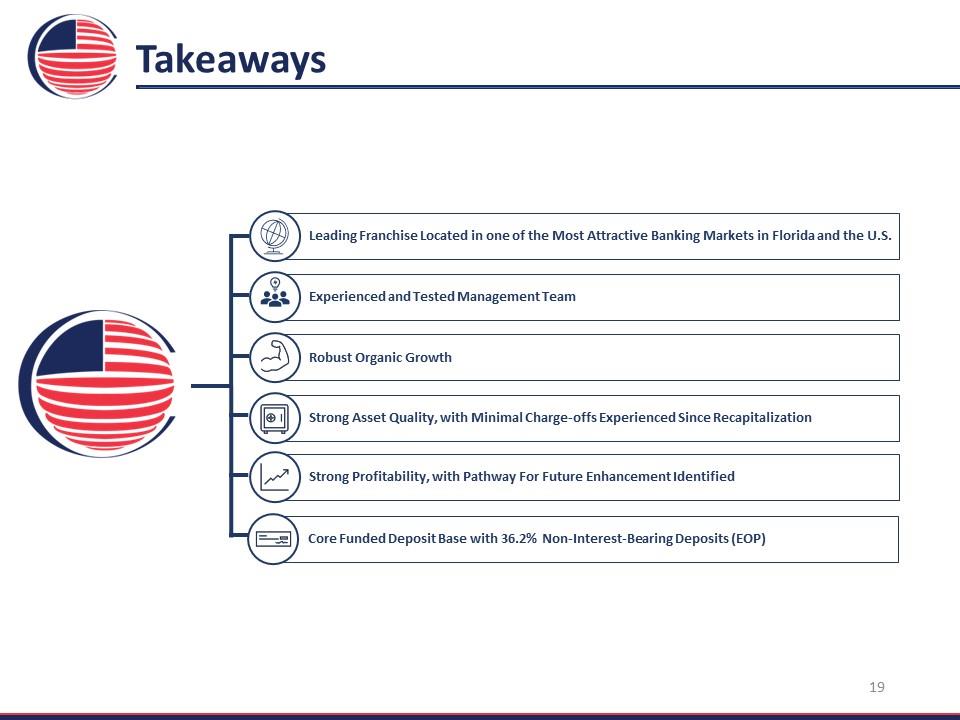
Takeaways Leading Franchise Located in one of the Most Attractive Banking Markets in Florida and the U.S. Experienced and Tested Management Team Robust Organic Growth Strong Asset Quality, with Minimal Charge-offs Experienced Since Recapitalization Strong Profitability, with Pathway For Future Enhancement Identified Core Funded Deposit Base with 36.2% Non-Interest-Bearing Deposits (EOP) 19
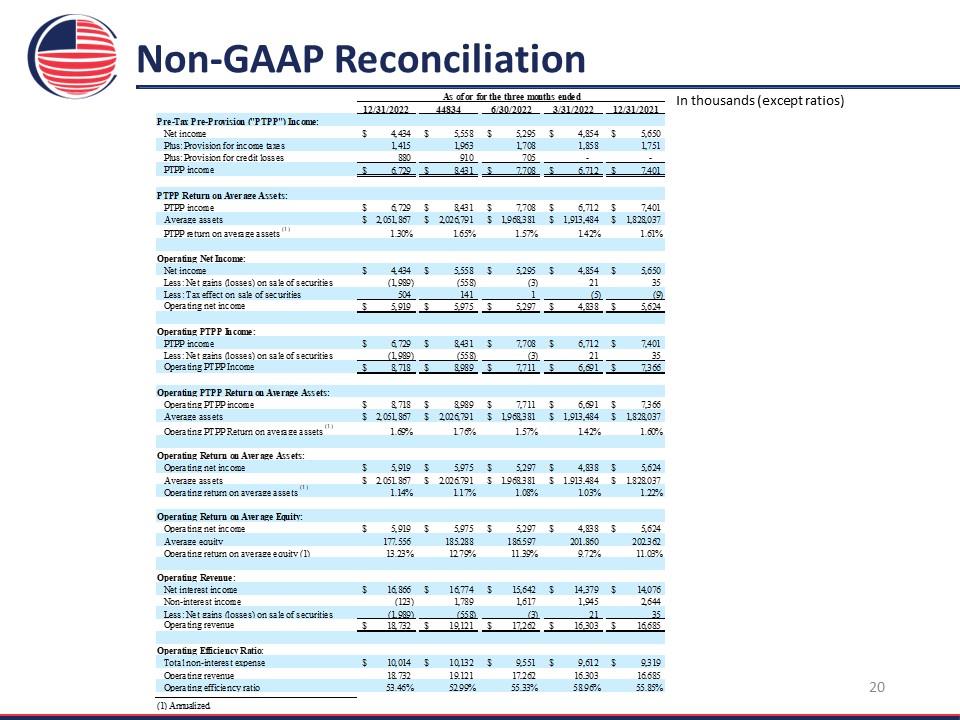
Non-GAAP Reconciliation In thousands (except ratios) 7 As of or for the three mouths ended 12/31/2022 44834 6/30/2022 3/31/2022 12/31/2021 Pre-Tax Pre-Provision ("PTPP") Income: Net income $ 4.434 $ 5.558 $ 5.295 $ 4.854 $ 5.650 Plus: Provision for income taxes 1,415 1.963 1.708 1.858 1.751 Plus: Provision for credit losses 880 910 705 - - PTPP income $ 6.729 $ 8.431 $ 7.708 $ 6.712 $ 7.401 PTPP Return on Average Assets: PTPP income $ 6.729 $ 8.431 $ 7.708 $ 6.712 $ 7.401 Average assets $ 2.051.867 $ 2.026.791 $ 1.968.381 $ 1.913.484 $ 1.828.037 PTPP return on average assets '1' 1.30% 1.65% 1.57% 1.42% 1.61% Operating Net Income: Net income $ 4.434 $ 5.558 $ 5.295 $ 4.854 $ 5.650 Less: Net gains (losses) on sale of securities (1.989) (558) (3) 21 35 Less: Tax effect on sale of securities 504 141 1 (5) (9) Operating net income $ 5.919 $ 5.975 $ 5.297 $ 4.838 $ 5.624 Operating PTPP Income: PTPP income $ 6.729 $ 8.431 $ 7.708 $ 6.712 $ 7.401 Less: Net gains (losses) on sale of securities (1.989) (558) (3) 21 35 Operating PTPP Income $ 8.718 $ 8.989 $ 7.711 $ 6.691 $ 7.366 Operating PTPP Return ou Average Assets: Operating PTPP income Average assets Operating PTPP Return on average assets 'lj $ 8.718 $ 2.051.867 1.69% Operating Return ou Average Assets: Operating net income Average assets Operating return on average assets (1) $ 5.919 $ 2.051.867 1.14% Operating Return ou Average Equity’ Operating net income Average equity Operating return on average equity (1) $ 5.919 177.556 13.23% Operating Revenue Net interest income Non-interest income Less: Net gains (losses) on sale of securities Operating revenue $ 16.866 (123) (1.989) $ 18.732 Operating Efficiency Ratio: Total non-interest expense Operating revenue Operating efficiency ratio $ 10.014 18.732 53.46% $ 8.989 $ 7.711 $ 6.691 $ 7.366 9 $ 2.026.791 $ 1.968.381 $ 1.913.484 $ 1.828.037 1.76%
1.57% 1.42% 1.60% $ 5.975 $ 5.297 $ 4.838 $ 5.624 $ 2.026.791 $ 1.968.381 $ 1.913.484 $ 1.828.037 1.17% 1.08% 1.03% 1.22% $ 5.975 $ 5.297 $ 4.838 $ 5.624 185.288 186.597 201.860 202.362 12.79% 11.39% 9.72% 11.03% $ 16.774 $ 15.642 $ 14.379 $ 14.076 1.789 1.617 1.945 2.644 (558) (3) 21 35 $ 19.121 $ 17.262 $ 16.303 $ 16.685
■
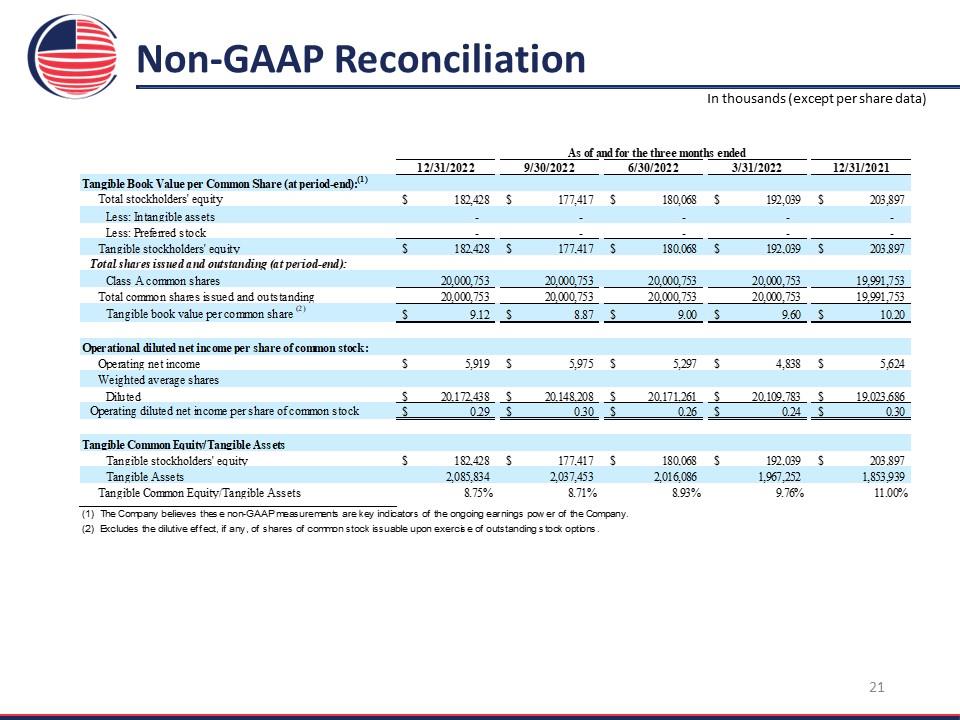
Non-GAAP Reconciliation In thousands (except per share data) As of and for the three months ended 12/31/2022 9/30/2022 6/30/2022 3/31/2022 12/31/2021 tangible Book Value per Common Share (at period-end):11 ' Total stockholders' equity S 182.428 s 177.417 s 180.06S S 192.039 S 203.897 Less: Intangible assets ..... Less: Preferred stock - - - - - Tangible stockholders' equity Total shares issued and outstanding (at period-end): s 181428 s 177.417 s 180.06S s 192.039 S 203.897 Class A common shares 20.000.753 Vi AM 1C 20.000.753 Vt /V\A If 20.000.753 yA AAA 20.(0X3.753 AA iVW If? 19.991.753 t A fWt If? total common shares issued and outstanding Tangible book value per common share ' s 2U.OOU. /5 b 9.12 s 2U.UUO. /5o 8.S7 s 2U.UW. /5b 9. CO s 2U.UUU. /5b 9.60 S i9.yyi./5b 10.20 Operational diluted net income per share of common stock: Operating net income s 5.919 s 5.975 s 5297 S 4.838 S 5.624 Weighted average shares Diluted s 20.17243S s 20.14S.20S s 20.171.261 s 20.109.7S3 s 19.023.686 Operating diluted net income per share of common stock s 029 s 030 s 0.26 s 0.24 s 0.30 fnnoihli1 fVminifin Fmiin/TmoiKlo Tangible stockholders’ equity s 181428 s 177.417 s 180.06S s 192.039 s 203.897 Tangible Assets 2.0S5.S34 1037,453 2,016,086 1,967252 LS53539 Tangible Common Equity. Tangible Assets 8.75% 8.71% 8.93% 9.76% 11.00% 1. The Carpark believes these non-GAAP treasurer 3rekey in caters of the ongoing earnings paver of the Company. 2. Precludes the dilutive effect, if any. of shares of common stock issuable upon exercise of outstanding stock options. 21
Contact Information Lou de la Aguilera President, CEO & Director (305) 715-5186 laguilera@uscentury.com Rob Anderson Chief Financial Officer (305) 715-5393 rob.anderson@uscentury.com Investor Relations InvestorRelations@uscentury.com 22