Exhibit 99.2
Exhibit 99.2 EARNINGS PRESENTATION FIRST QUARTER 2023 NASDAQ: USCB USBC FINANCIAL HOLDINGS
FORWARD-LOOKING STATEMENTS This presentation may contain statements that are not historical in nature and are intended to be, and are hereby identified as, forward-looking statements for purposes of the safe harbor provided by Section 21E of the Securities Exchange Act of 1934, as amended. Forward-looking statements are those that are not historical facts. The words “may,” “will,” “anticipate,” “should,” “would,” “believe,” “contemplate,” “expect,” “aim,” “plan,” “estimate,” “continue,” and “intend,” as well as other similar words and expressions of the future, are intended to identify forward-looking statements. These forward-looking statements include, but are not limited to, statements related to our projected growth, anticipated future financial performance, and management’s long-term performance goals, as well as statements relating to the anticipated effects on results of operations and financial condition from expected developments or events, or business and growth strategies, including anticipated internal growth and balance sheet restructuring. These forward-looking statements involve significant risks and uncertainties that could cause our actual results to differ materially from those anticipated in such statements. Potential risks and uncertainties include, but are not limited to: • the strength of the United States economy in general and the strength of the local economies in which we conduct operations; • our ability to successfully manage interest rate risk, credit risk, liquidity risk, and other risks inherent to our industry; • the accuracy of our financial statement estimates and assumptions, including the estimates used for our credit loss reserve and deferred tax asset valuation allowance; • the efficiency and effectiveness of our internal control environment; • our ability to comply with the extensive laws and regulations to which we are subject, including the laws for each jurisdiction where
we operate; • adverse changes or conditions in capital and financial markets, including actual or potential stresses in the banking industry; deposit attrition and the level of our uninsured deposits; legislative or regulatory changes and changes in accounting principles, policies, practices or guidelines, including the on-going effects of the implementation of the Current Expected Credit Losses (“CECL”) standard; • the effects of our lack of a diversified loan portfolio and concentration in the South Florida market, including the risks of geographic, depositor, and industry concentrations, including our concentration in loans secured by real estate; effects of climate change; • the concentration of ownership of our common stock; • fluctuations in the price of our common stock; • our ability to fund or access the capital markets at attractive rates and terms and manage our growth, both organic growth as well as growth through other means, such as future acquisitions; • inflation, interest rate, unemployment rate, market, and monetary fluctuations; impacts of international hostilities and geopolitical events; • increased competition and its effect on the pricing of our products and services as well as our margin; • the effectiveness of our risk management strategies, including operational risks, including, but not limited to, client, employee, or third-party fraud and security breaches; and • other risks described in this presentation and other filings we make with the Securities and Exchange Commission (“SEC”). All forward -looking statements are necessarily only estimates of future results, and there can be no assurance that actual results will not differ materially from expectations. Therefore, you are cautioned not to place undue reliance on any forward-looking statements. Further, forward -looking statements included in this presentation are made only as of the date hereof, and we undertake no obligation to update or revise any
forward-looking statements to reflect events or circumstances after the date on which the statements are made or to reflect the occur rence of unanticipated events, unless required to do so under the federal securities laws. You should also review the risk factors described in the reports USCB Financial Holdings, Inc. filed or will file with the SEC and, for periods prior to the completion of the bank holding company reorganization in December 2021, U.S. Century Bank filed with the FDIC. Non-GAAP Financial Measures This presentation includes financial information determined by methods other than in accordance with generally accepted accounting principles (“GAAP”). This financial information includes certain operating performance measures. Management has included these non-GAAP measures because it believes these measures may provide useful supplemental information for evaluating the Company’s underlying performance trends. Further, management uses these measures in managing and evaluating the Company’s business and intends to refer to them in discussions about our operations and performance. Operating performance measures should be viewed in addition to, and not as an alternative to or substitute for, measures determined in accordance with GAAP, and are not necessarily comparable to non-GAAP measures that may be presented by other companies. Reconciliations of these non -GAAP measures to the most directly comparable GAAP measures can be found in the ‘Non-GAAP Reconciliation Tables’ included in the presentation. All numbers included in this presentation are unaudited unless otherwise noted. 2
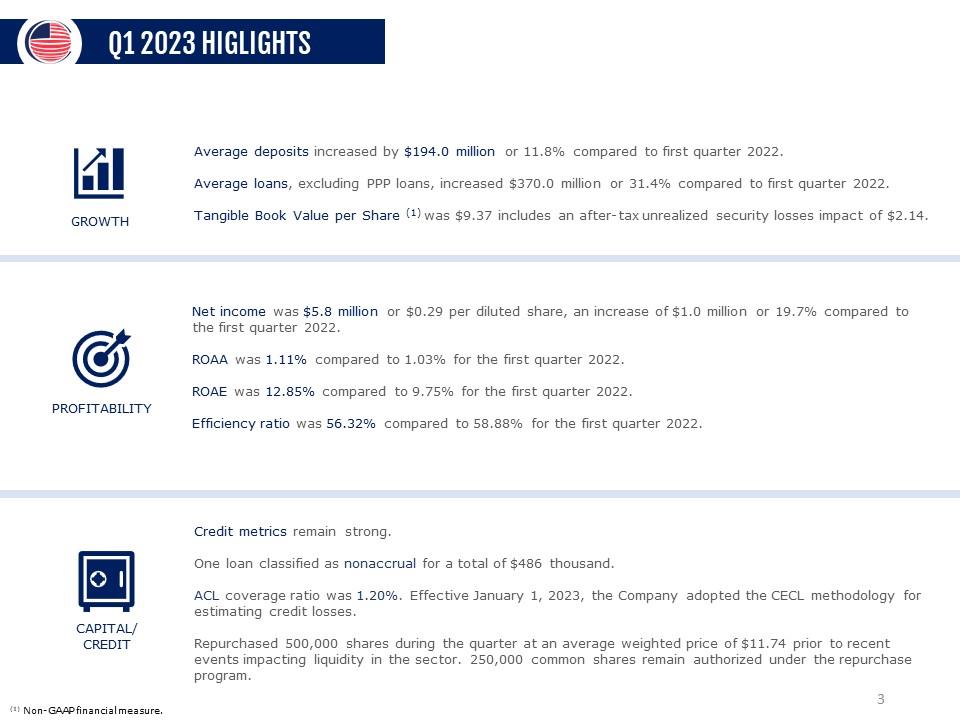
Q1 2023 HIGLIGHTS GROWTH Average deposits increased by $194.0 million or 11.8% compared to first quarter 2022. Average loans, excluding PPP loans, increased $370.0 million or 31.4% compared to first quarter 2022. Tangible Book Value per Share (1) was $9.37 includes an after-tax unrealized security losses impact of $2.14. PROFITABILITY Net income was $5.8 million or $0.29 per diluted share, an increase of $1.0 million or 19.7% compared to the first quarter 2022. ROAA was 1.11% compared to 1.03% for the first quarter 2022. ROAE was 12.85% compared to 9.75% for the first quarter 2022. Efficiency ratio was 56.32% compared to 58.88% for the first quarter 2022. CAPITAL/ CREDIT Credit metrics remain strong. One loan classified as nonaccrual for a total of $486 thousand. ACL coverage ratio was 1.20%. Effective January 1, 2023, the Company adopted the CECL methodology for estimating credit losses. Repurchased 500,000 shares during the quarter at an average weighted price of $11.74 prior to recent events impacting liquidity in the sector. 250,000 common shares remain authorized under the repurchase program. (1) Non-GAAP financial measure. 3
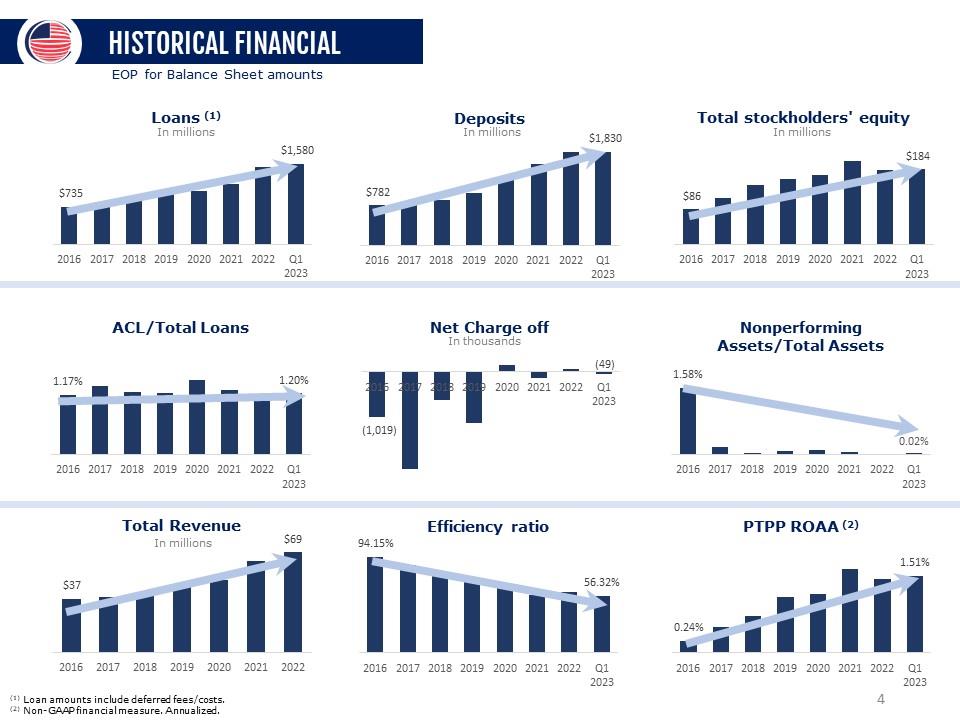
HISTORICAL FINANCIAL EOP for Balance Sheet amounts Loans (1) In millions $735 $1,580 Deposits In millions $782 $1,830 Total stockholders’ equity In millions $86 $184 ACL/Total Loans 1.17% 1.20% Net Charge off In thousands (1,019) (49) Nonperforming Assets/Total Assets 1.58% 0.02% Total Revenue In millions $37 $69 Efficiency ratio 94.15% 56.32% PTPP ROAA (2) 0.24% 1.51% (1) Loan amounts include deferred fees/costs. (2) Non-GAAP financial measure. Annualized. 4
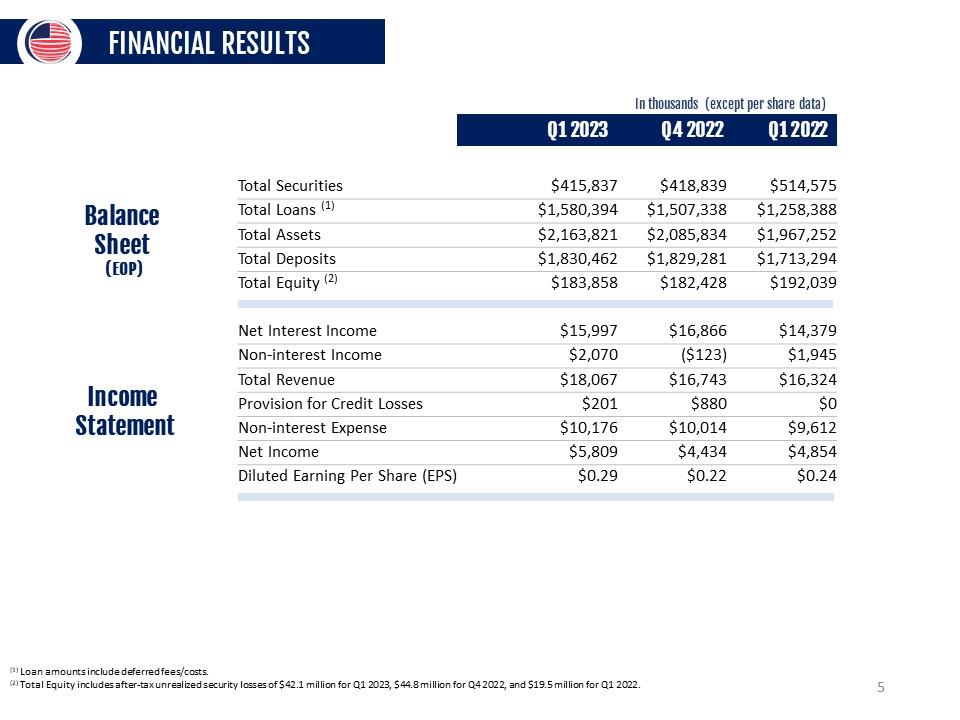
FINANCIAL RESULTS Balance Sheet (EOP) In thousands (except per share data) Q1 2023 Q4 2022 Q1 2022 Total Securities $415,837 $418,839 $514,575 Total Loans (1) $1,580,394 $1,507,338 $1,258,388 Total Assets $2,163,821 $2,085,834 $1,967,252 Total Deposits $1,830,462 $1,829,281 $1,713,294 Total Equity (2) $183,858 $182,428 $192,039 Income Statement Net Interest Income $15,997 $16,866 $14,379 Non-interest Income $2,070 ($123) $1,945 Total Revenue $18,067 $16,743 $16,324 Provision for Credit Losses $201 $880 $0 Non-interest Expense $10,176 $10,014 $9,612 Net Income $5,809 $4,434 $4,854 Diluted Earning Per Share (EPS) $0.29 $0.22 $0.24 (1) Loan amounts include deferred fees/costs. (2) Total Equity includes after-tax unrealized security losses of $42.1 million for Q1 2023, $44.8 million for Q4 2022, and $19.5 million for Q1 2022. 5
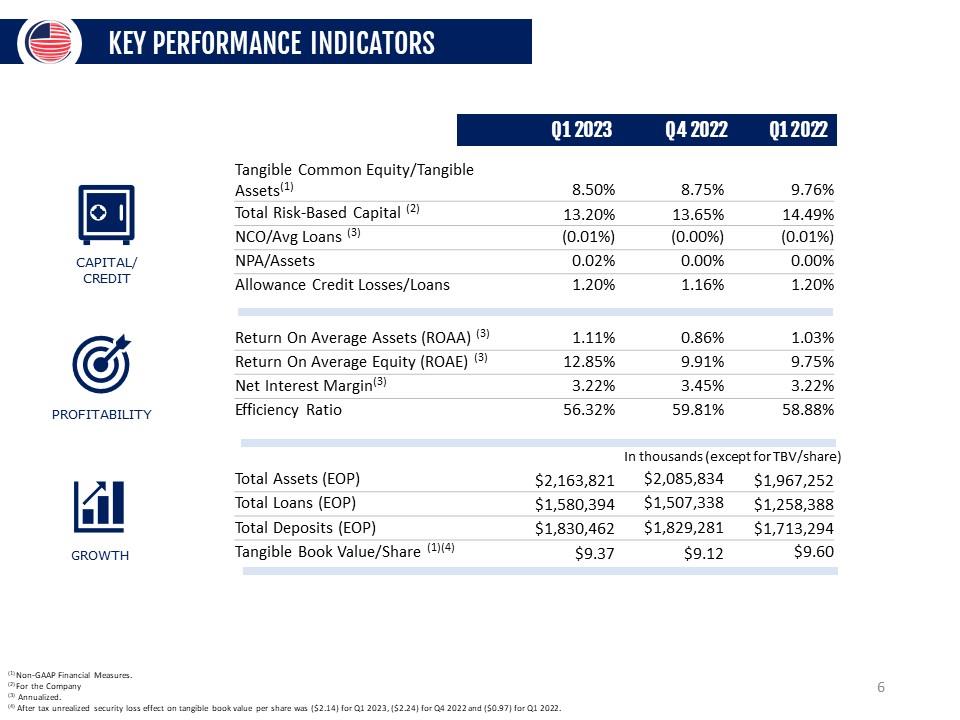
KEY PERFORMANCE INDICATORS CAPITAL/ CREDIT PROFITABILITY GROWTH Q1 2023 Q4 2022 Q1 2022 Tangible Common Equity/Tangible Assets(1) 8.50% 8.75% 9.76% Total Risk-Based Capital (2) 13.20% 13.65% 14.49% NCO/Avg Loans (3) (0.01%) (0.00%) (0.01%) NPA/Assets 0.02% 0.00% 0.00% Allowance Credit Losses/Loans 1.20% 1.16% 1.20% Return On Average Assets (ROAA) (3) 1.11% 0.86% 1.03% Return On Average Equity (ROAE) (3) 12.85% 9.91% 9.75% Net Interest Margin(3) 3.22% 3.45% 3.22% Efficiency Ratio 56.32% 59.81% 58.88% Total Assets (EOP) $2,163,821 $2,085,834 $1,967,252 Total Loans (EOP) $1,580,394 $1,507,338 $1,258,388 Total Deposits (EOP) $1,830,462 $1,829,281 $1,713,294 Tangible Book Value/Share (1)(4) $9.37 $9.12 $9.60 (1) Non-GAAP Financial Measures. (2) For the Company (3) Annualized. (4) After tax unrealized security loss effect on tangible book value per share was ($2.14) for Q1 2023, ($2.24) for Q4 2022 and ($0.97) for Q1 2022. 6
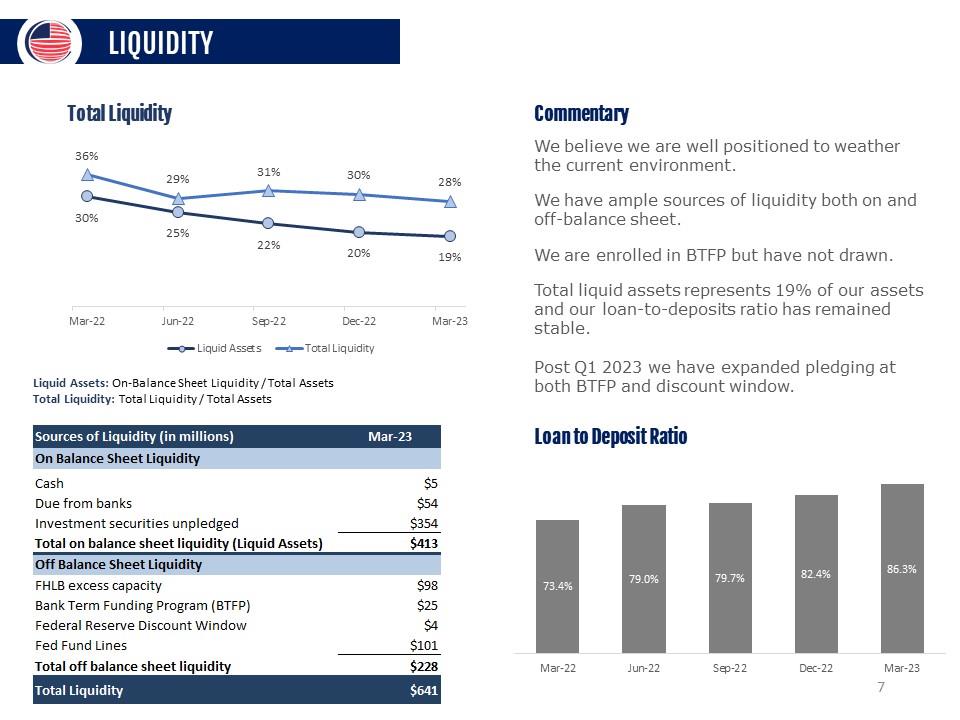
LIQUIDITY Total Liquidity 36% 29% 31% 30% 28% 30% 25% 22% 20% 19% Liquid Assets Total Liquidity Commentary We believe we are well positioned to weather the current environment. We have ample sources of liquidity both on and off-balance sheet. We are enrolled in BTFP but have not drawn. Total liquid assets represents 19% of our assets and our loan-to-deposits ratio has remained stable. Post Q1 2023 we have expanded pledging at both BTFP and discount window. Liquid Assets: On-Balance Sheet Liquidity / Total Assets Total Liquidity: Total Liquidity / Total Assets Sources of Liquidity (in millions) Mar-23 On Balance Sheet Liquidity Cash Due from banks Investment securities unpledged Total on balance sheet liquidity (Liquid Assets) Off Balance Sheet Liquidity FHLB excess capacity Bank Term Funding Program (BTFP) Federal Reserve Discount Window Fed Fund Lines Total off balance sheet liquidity $641 Total Liquidity Loan to Deposit Ratio 73.4% 79.0% 79.7% 82.4% 86.3% 7
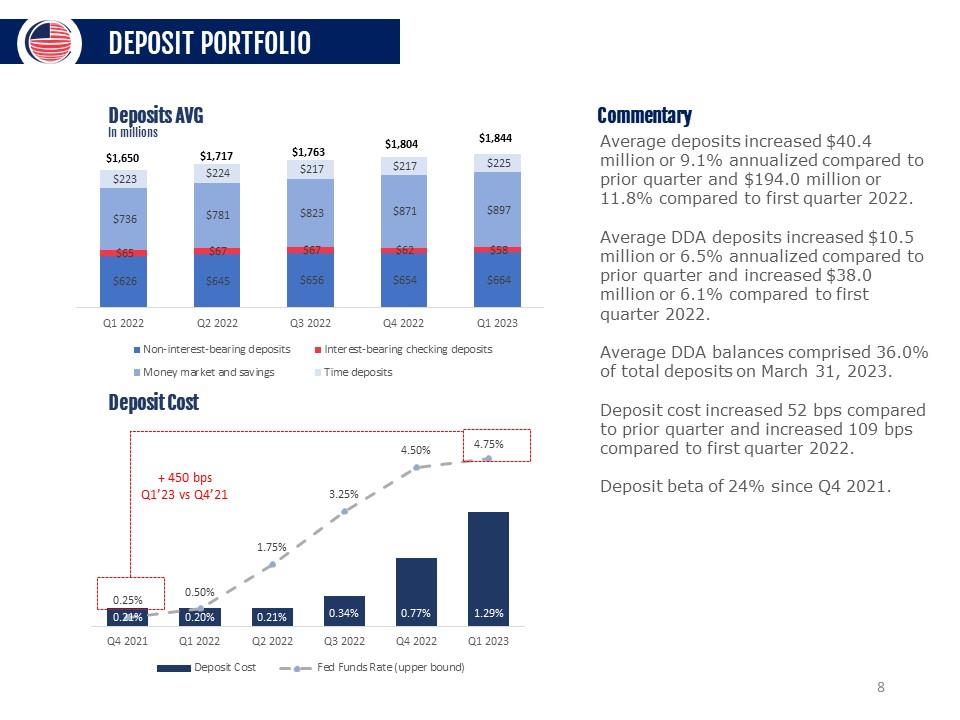
DEPOSIT PORTFOLIO Deposits AVG In millions $1,650 $1,717 $1,763 $1,804 $1,844 $223 $224 $217 $217 $225 $736 $781 $823 $871 $897 $65 $67 $67 $62 $58 $625 $645 $656 $654 $664 Q1 2022 Q2 2022 Q3 2022 Q4 2022 Q1 2023 Non-interest-bearing deposits Interest-bearing checking deposits Money market and savings Time deposits Deposit Cost 0.25% 0.50% 1.75% 3.25% 4.50% 4.75% 0.21% 0.20% 0.21% 0.34% 0.77% 1.29% Q4 2021 Q1 2022 Q2 2022 Q3 2022 Q4 2022 Q1 2023 Deposit Cost Fed Fund Rate (upper bound) Commentary Average deposits increased $40.4 million or 9.1% annualized compared to prior quarter and $194.0 million or 11.8% compared to first quarter 2022. Average DDA deposits increased $10.5 million or 6.5% annualized compared to prior quarter and increased $38.0 million or 6.1% compared to first quarter 2022. Average DDA balances comprised 36.0% of total deposits on March 31, 2023. Deposit cost increased 52 bps compared to prior quarter and increased 109 bps compared to first quarter 2022. Deposit beta of 24% since Q4 2021. 8
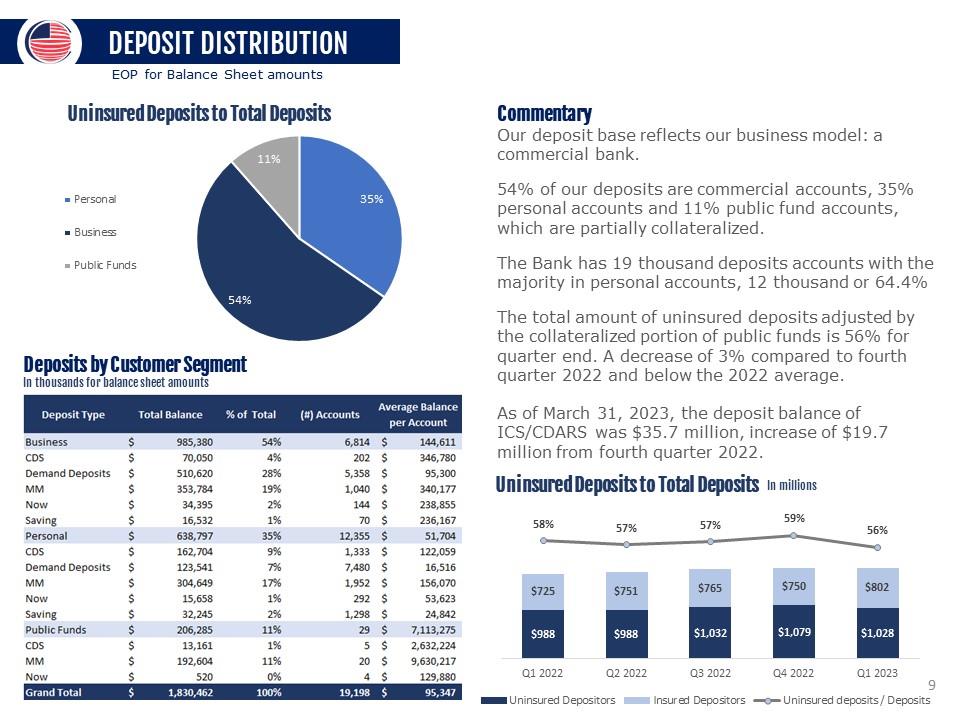
DEPOSIT DISTRIBUTION EOP for Balance Sheet amounts Uninsured Deposits to Total Deposits Personal Business Public Funds 11% 35% 54% Deposits by Customer Segment In thousands for balance sheet amounts Deposit Type Total Balance % of Total (#) Accounts Average Balance per Account Business $ 985,380 54% 6,814 $ 144,611 CDS $ 70,050 4% 202 $ 346,780 Demand Deposits $ 510,620 28% 5,358 $ 95,300 MM $ 353,784 19% 1,040 $ 340,177 Now $ 34,395 2% 144 $ 238,855 Saving $ 16,532 1% 70 $ 236,167 Personal $ 638,797 35% 12,355 $ 51,704 CDS $ 162,704 9% 1,333 $ 122,059 Demand Deposits $ 123,5 41 7% 7,480 $ 16,516 MM $ 304,649 17% 1,952 $ 156,070 Now $ 15,658 1% 292 $ 53,623 Saving $ 32,245 2% 1,298 $ 24,842 Public Funds $ 206,285 11% 29 $ 7,113,275 CDS $ 13,161 1% 5 $ 2,632,224 MM $ 192,604 11% 20 $ 9,630,217 Now $ 520 0% 4 $ 129,880 Grand Total $ 1,830,462 100% 19,198 $ 95,347 Commentary Our deposit base reflects our business model: a commercial bank. 54% of our deposits are commercial accounts, 35% personal accounts and 11% public fund accounts, which are partially collateralized. The Bank has 19 thousand deposits accounts with the majority in personal accounts, 12 thousand or 64.4% The total amount of uninsured deposits adjusted by the collateralized portion of public funds is 56% for quarter end. A decrease of 3% compared to fourth quarter 2022 and below the 2022 average. As of March 31, 2023, the deposit balance of ICS/CDARS was $35.7 million, increase of $19.7 million from fourth quarter 2022. Uninsured Deposits to Total Deposits In millions 58% 57% 57% $725 $751 $765 $988 $988 $1,032 Q1 2022 Q2 2022 Q3 2022 Uninsured Depositors Insured Depositors 59% 56% $1,079 $1,028 Q4 2022 Q1 2023 Uninsured deposits / Deposits 9
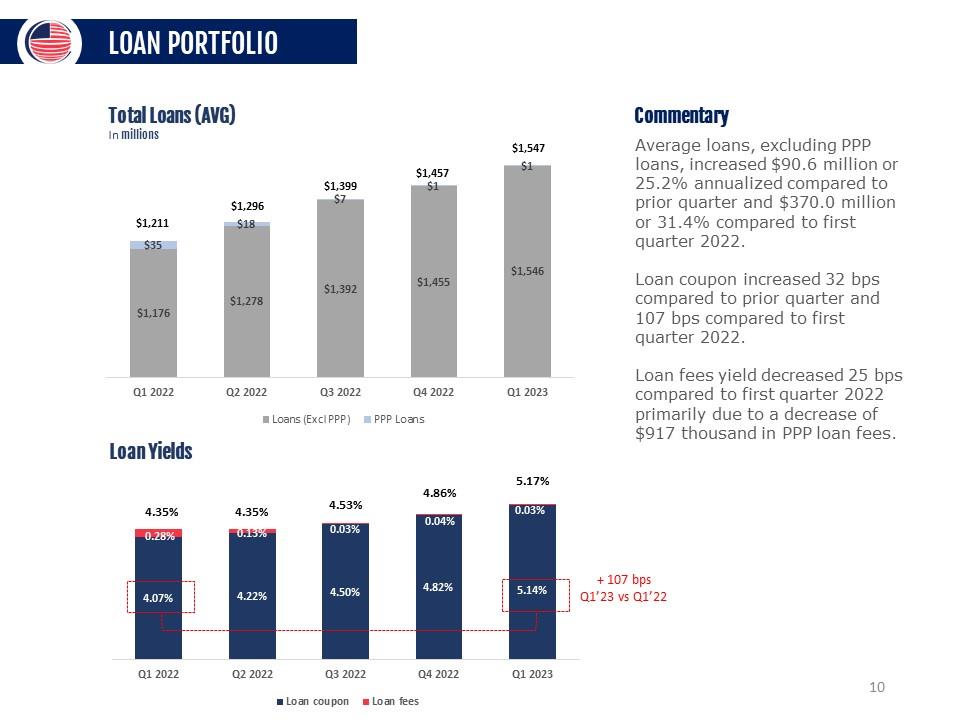
LOAN PORTFOLIO Total Loans (AVG) In millions $1,211 $1,296 $1,399 $1,457 $1,547 $35 $18 $7 $1 $1 $1,176 $1,278 $1,392 $1,455 $1,546 Q1 2022 Q2 2022 Q3 2022 Q4 2022 Q1 2023 Loans (Exd PPP) PPP Loans Loan Yields 4.35% 4.35% 4.53% 4.86% 5.17% 0.28% 0.13% 0.03% 0.04% 0.03% 4.07% 4.22% 4.50% 4.82% 4.14% Q1 2022 Q2 2022 Q3 2022 Q4 2022 Q1 2023 Loan coupon Loan fees Commentary Average loans, excluding PPP loans, increased $90.6 million or 25.2% annualized compared to prior quarter and $370.0 million or 31.4% compared to first quarter 2022. Loan coupon increased 32 bps compared to prior quarter and 107 bps compared to first quarter 2022. Loan fees yield decreased 25 bps compared to first quarter 2022 primarily due to a decrease of $917 thousand in PPP loan fees. 10
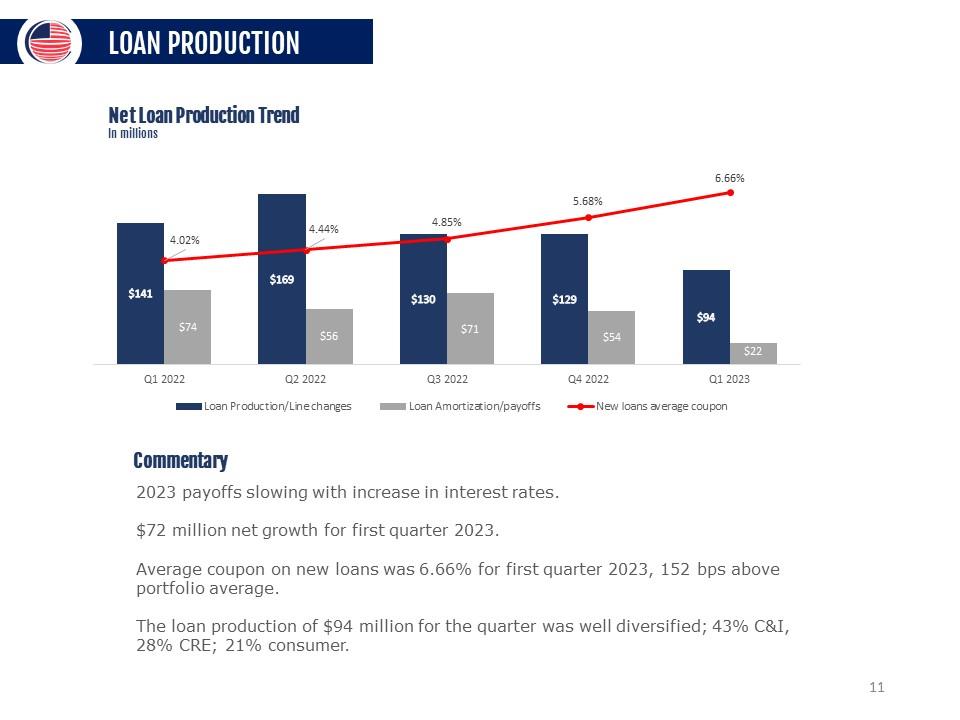
LOAN PRODUCTION Net Loan Production Trend In millions 4.02% 4.44% 4.85% 5.68% 6.66 $141 $74 $169 $56 $130 $71 $129 $54 $94 $22 Q1 2022 Q2 2022 Q3 2022 Q4 2022 Q1 2023 Loan Production/Lien changes Loan Amortization/payoffs New loans average coupon Commentary 2023 payoffs slowing with increase in interest rates. $72 million net growth for first quarter 2023. Average coupon on new loans was 6.66% for first quarter 2023, 152 bps above portfolio average. The loan production of $94 million for the quarter was well diversified; 43% C&I, 28% CRE; 21% consumer. 11
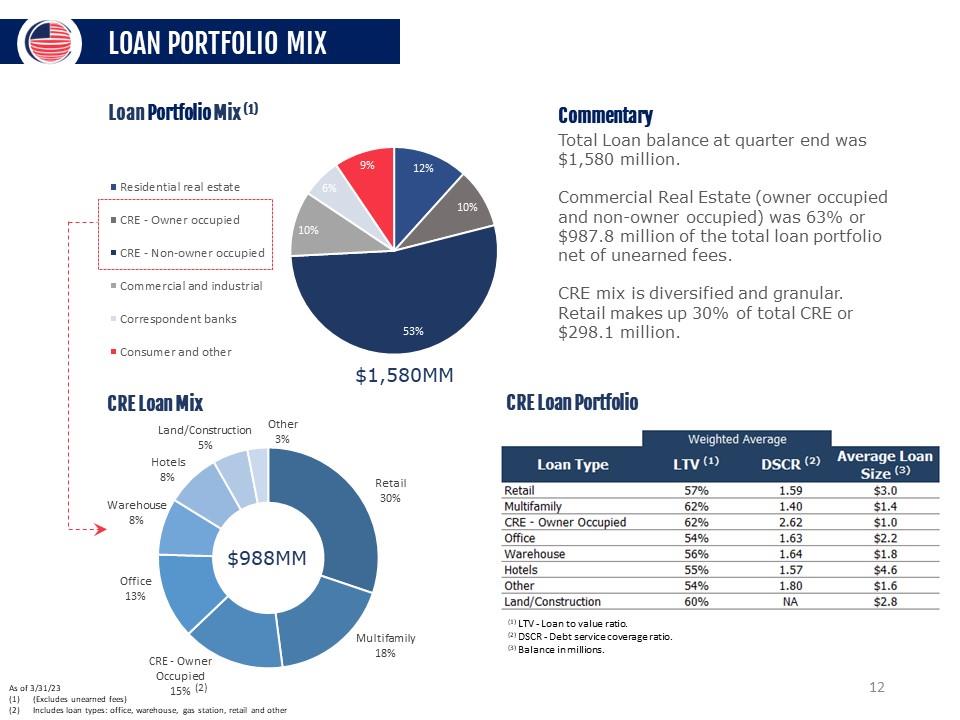
LOAN PORTFOLIO MIX Loan Portfolio Mix (1) Residential real estate -1- CRE - Owner occupied ! I ! CRE - Non-owner occupied Commercial and Industrial Correspondent banks Consumer and other 10% 6% 9% 12% 10% 53% $1,580MM Commentary Total Loan balance at quarter end was $1,580 million. Commercial Real Estate (owner occupied and non-owner occupied) was 63% or $987.8 million of the total loan portfolio net of unearned fees. CRE mix is diversified and granular. Retail makes up 30% of total CRE or $298.1 million. CRE Loan Mix Land/Construction 5% Other 3% Retail 30% Multifamily 18% CRE - Owner Occupied 15% Office 13% Warehouse 8% Hotels 8% CRE Loan Portfolio ) ► Weighted Average Loan Type LTV DSCR C2) Average Loan Size ™ Retail 57% 1.59 $3.0 Multifamily 62% 1.40 $1.4 CRE - Owner Occupied 62% 2.62 $1.0 Office 54% 1.63 $2.2 Warehouse 56% 1.64 $1.8 Hotels 55% 1.57 $4.6 Other 54% 1.80 $1.6 Land/Construction 60% NA $2.8 . : : O LTV - Loan to value ratio. '2! DSCR - Debt service coverage ratio. Balance in millions. (1) LTV - Loan to value ratio. (2) DSCR - Debt service coverage ratio. (3) Balance in millions. As of 3/31/23 (1) (Excludes unearned fees) (2) Includes loan types: office, warehouse, gas station, retail and other 12
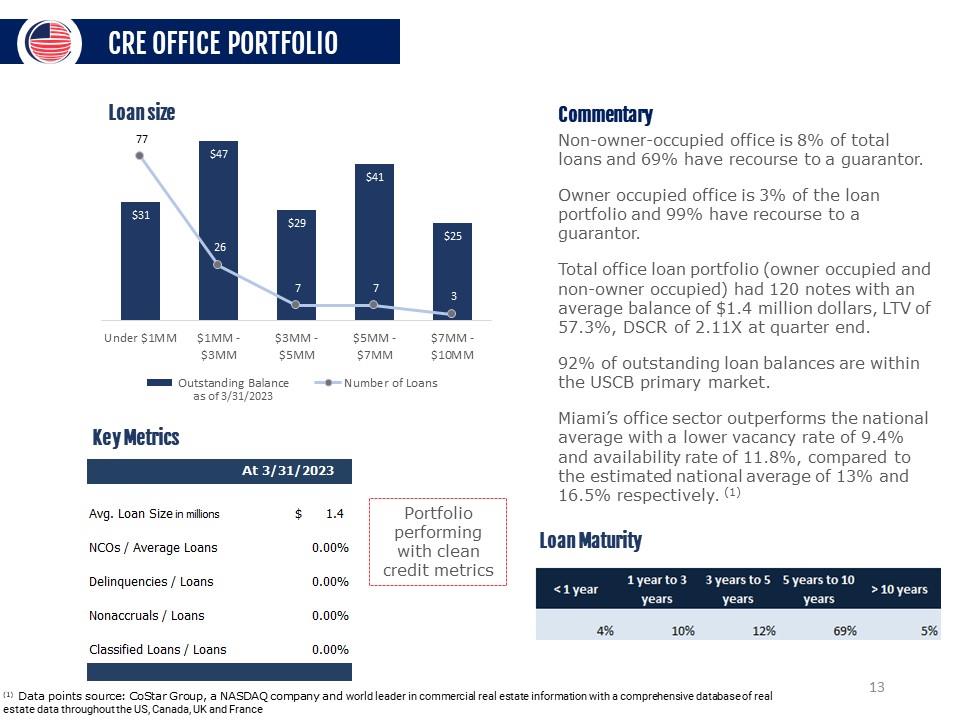
CRE OFFICE PORTFOLIO Loan size 77 $47 $31 Under SIMM SIMM - $3MM - $5MM _ $7MM - $3MM $5MM $7MM $10MM Outstanding Balance as of 3/31/2023 Number of Loans Key Metrics At 3/31/2023 Avg. Loan Size in millions $ 1.4 NCOs / Average Loans 0.00% Delinquencies / Loans 0.00% Nonaccruals / Loans 0.00% Classified Loans / Loans 0.00% Portfolio performing with clean credit metrics Commentary Non-owner-occupied office is 8% of total loans and 69% have recourse to a guarantor. Owner occupied office is 3% of the loan portfolio and 99% have recourse to a guarantor. Total office loan portfolio (owner occupied and non-owner occupied) had 120 notes with an average balance of $1.4 million dollars, LTV of 57.3%, DSCR of 2.11X at quarter end. 92% of outstanding loan balances are within the USCB primary market. Miami’s office sector outperforms the national average with a lower vacancy rate of 9.4% and availability rate of 11.8%, compared to the estimated national average of 13% and 16.5% respectively. (1) Loan Maturity < 1 year 1 year to 3 3 years to 5 5 years to 10 >10 years years years years 4% 10% 12% 69% 5% (1) Data points source: CoStar Group, a NASDAQ company and world leader in commercial real estate information with a comprehensive database of real estate data throughout the US, Canada, UK and France 13
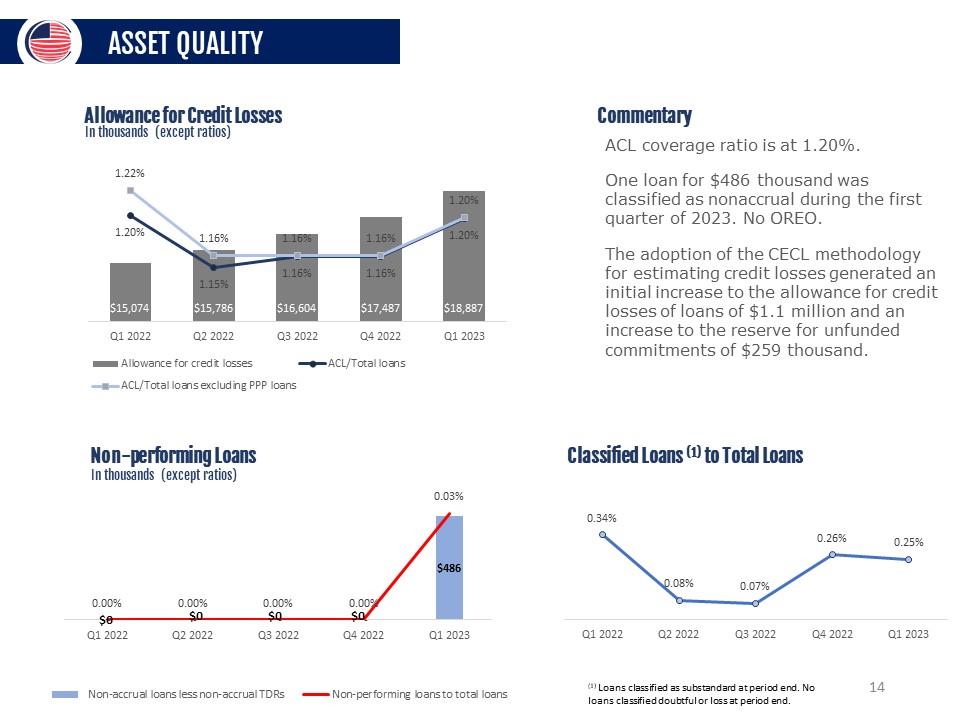
ASSET QUALITY Allowance for Credit Losses In thousands (except ratios) 1.22% 1.16% 1.16% 1.16% 1.20% 1.20% 1.15% 1.16% 1.16% 1.20% $15,074 $15,786 $16,604 $17,487 $18,887 Q1 2022 Q2 2022 Q3 2022 Q4 2022 Q1 2023 Allowance for credit losses ACL/Total loans ACL/Total loans excluding PPP loans Commentary ACL coverage ratio is at 1.20%. One loan for $486 thousand was classified as nonaccrual during the first quarter of 2023. No OREO. The adoption of the CECL methodology for estimating credit losses generated an initial increase to the allowance for credit losses of loans of $1.1 million and an increase to the reserve for unfunded commitments of $259 thousand. Non-performing Loans In th 0.00% 0.00% 0.00% 0.00% 0.03% $0 $0 $0 $0 $486 Q1 2022 Q2 2022 Q3 2022 Q4 2022 Q1 2023ousands (except ratios) Nin0accrual loans less non-accrual TDRs Non-performing loans to total loans Classified Loans M to Total Loans 0.34% 0.08% 0.07% 0.26% 0.25% Q1 2022 Q2 2022 Q3 2022 Q4 2022 Q1 2023 (1) Loans classified as substandard at period end. No loans classified doubtful or loss at period end. 14
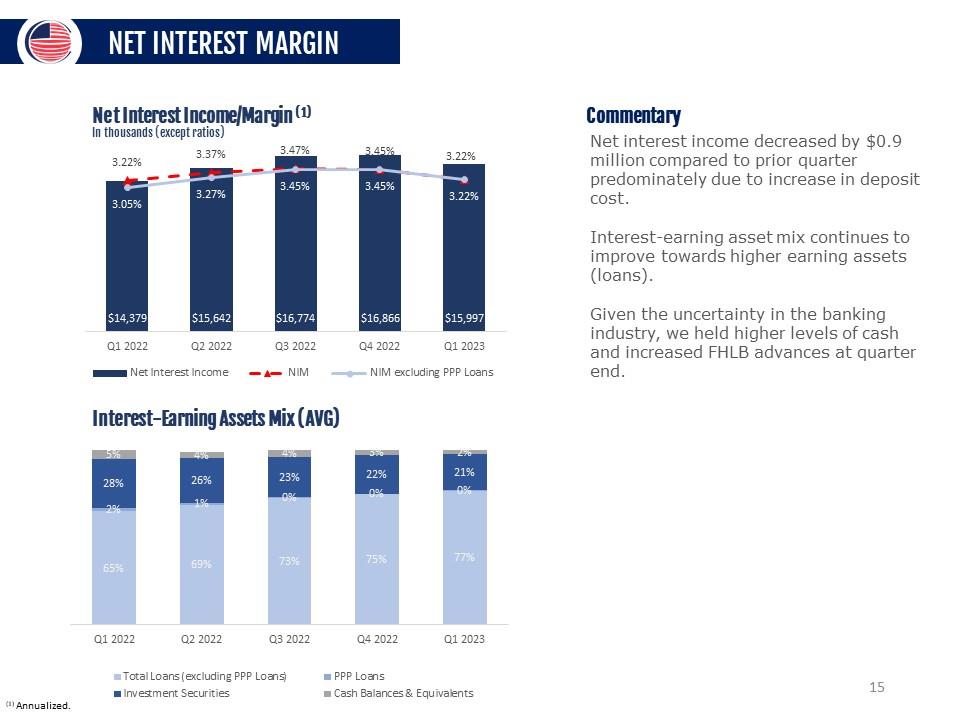
NET INTEREST MARGIN Net Interest Income/Margin (1) In thousands (except ratios) Ql 2022 Q2 2022 Q3 2022 3.22% ^,1 3.45% 3.22% $16,866 $15,997 Q4 2022 Ql 2023 Net Interest Income A— NIM NIM excluding PPP Loans Interest-Earning Assets Mix (AVG) 5% 4% 4% 3% 2% 28% 26% 23% 22% 21% 2% 1% 0% 0% 0% 65% 69% 73% 75% 77% Q1 2022 Q2 2022 Q3 2022 Q4 2022 Q1 2023 Total Loans (excluding PPP Loans) Investment Securities ■PPP Loans Cash Balances & Equivalent s Commentary Net interest income decreased by $0.9 million compared to prior quarter predominately due to increase in deposit cost. Interest -earning asset mix continues to improve towards higher earning assets (loans). Given the uncertainty in the banking industry, we held higher levels of cash and increased FHLB advances at quarter end. (1) Annualized. 15
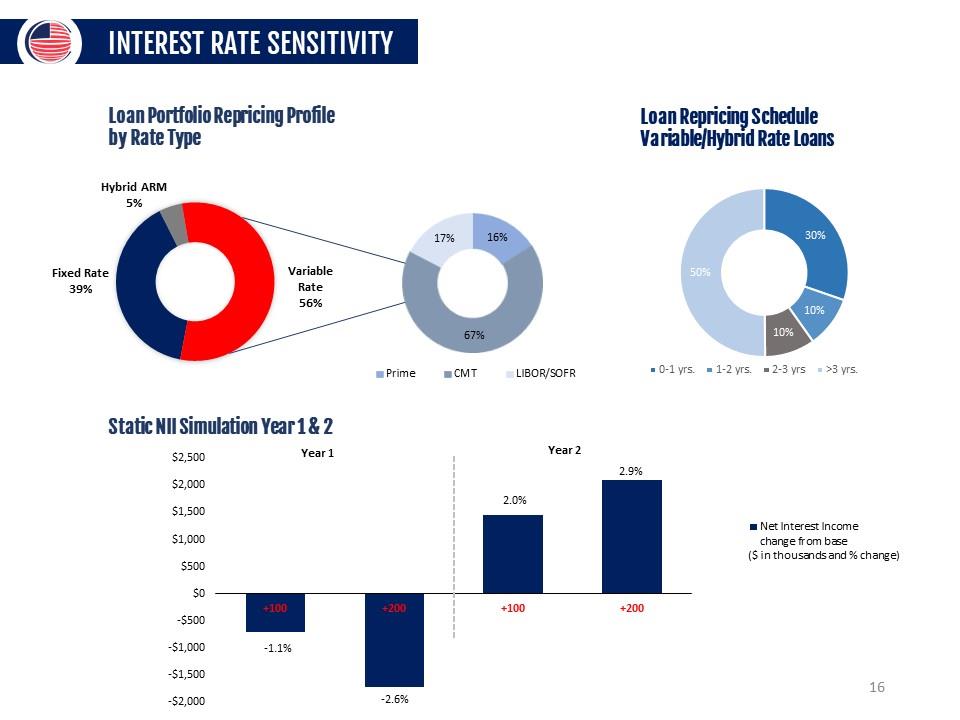
INTEREST RATE SENSITIVITY Loan Portfolio Repricing Profile by Rate Type Hybrid ARM 5% Fixed Rate 39% Variable Rate 56% 17% 16% 67% Prime CMT LIBOR/SOFRA Loan Repricing Schedule Variable/Hybrid Rate Loans 30% 10% 10% 50% yrs. 1-2 yrs. 2-3 yrs >3 yrs Static NII Simulation Year 1 & 2 100 200 100 200 -1.1% -2.6% 2.0% 2.9% Net Interest Income change from base ($ in thousands and % change) 16
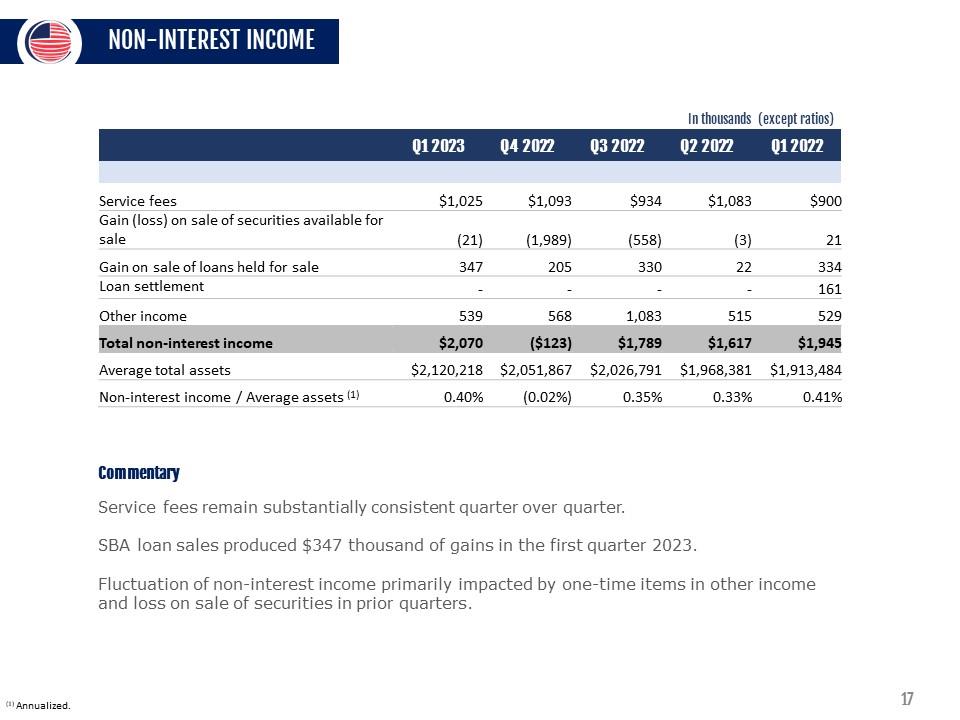
NON-INTEREST INCOME In thousands (except ratios) Q1 2023 Q4 2022 Q3 2022 Q2 2022 Q1 2022 Service fees $1,025 $1,093 $934 $1,083 $900 Gain (loss) on sale of securities available for sale (21) (1,989) (558) (3) 21 Gain on sale of loans held for sale 347 205 330 22 334 Loan settlement - - - - 161 Other income 539 568 1,083 515 529 Total non-interest income $2,070 ($123) $1,789 $1,617 $1,945 Average total assets $2,120,218 $2,051,867 $2,026,791 $1,968,381 $1,913,484 Non-interest income / Average assets (1) 0.40% (0.02%) 0.35% 0.33% 0.41% Commentary Service fees remain substantially consistent quarter over quarter. SBA loan sales produced $347 thousand of gains in the first quarter 2023. Fluctuation of non-interest income primarily impacted by one-time items in other income and loss on sale of securities in prior quarters. (1) Annualized. 17
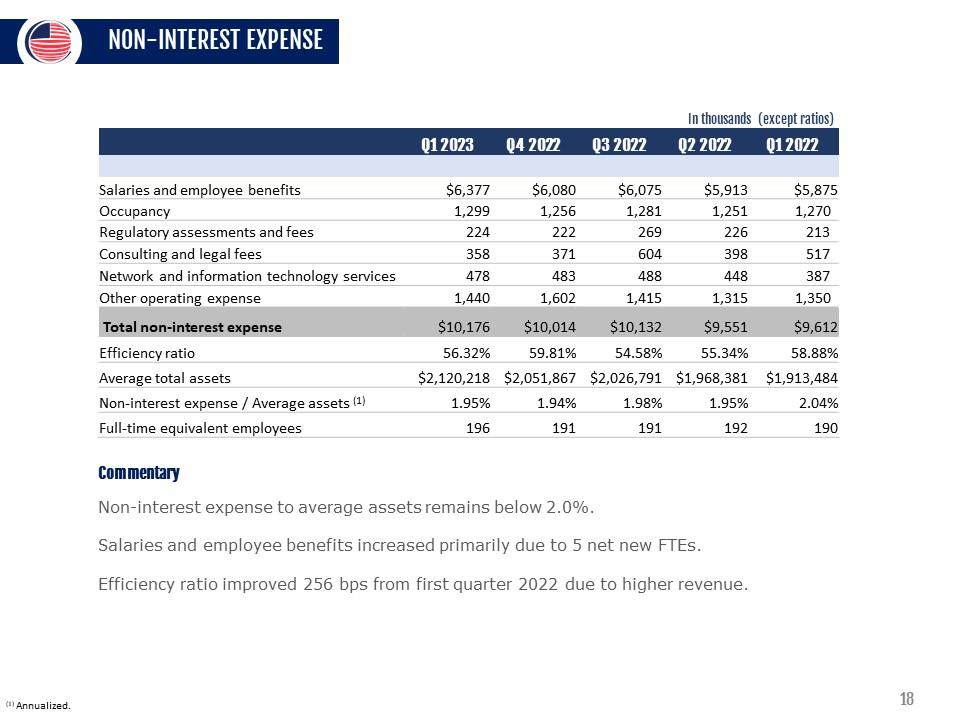
NON-INTEREST EXPENSE In thousands (except ratios) Q1 2023 Q4 2022 Q3 2022 Q2 2022 Q1 2022 Salaries and employee benefits $6,377 $6,080 $6,075 $5,913 $5,875 Occupancy 1,299 1,256 1,28 1 1,251 1,270 Regulatory assessments and fees 224 222 269 226 213 Consulting and legal fees 358 371 604 398 517 Network and information technology services 478 483 488 448 387 Other operating expense 1,440 1,602 1,415 1,315 1,350 Total non-interest expense $10,176 $10,014 $10,132 $9,551 $9,612 Efficiency ratio 56.32% 59.81% 54.58% 55.34% 58.88% Average total assets $2,120,218 $2,051,867 $2,026,791 $1,968,381 $1,913,484 Non-interest expense / Average assets (1) 1.95% 1.94% 1.98% 1.95% 2.04% Full-time equivalent employees 196 191 191 192 190 Commentary Non-interest expense to average assets remains below 2.0%. Salaries and employee benefits increased primarily due to 5 net new FTEs. Efficiency ratio improved 256 bps from first quarter 2022 due to higher revenue. (1) Annualized. 18

CAPITAL capital Ratios w 1 Q12023 1 Leverage Ratio 9.36% TCE/TA <2> 8.50% Tier 1 Risk Based Capital 12.04% Total Risk Based Capital 13.20% AOCI In Millions ($42.1) 042022 9.61% 8.75% 12.53% 13.65% ($44.8) WpII- IIUH Capitalized 9.47% 5.00% 9.76% NA 13.35% 8.00% 14.49% 10.00% ($19.5) Commentary 500,000 shares repurchased during the quarter at an average weighted price of $11.74. 250,000 common shares remain authorized under the repurchase program. AOCI improved by $2.7 million compared to fourth quarter 2022. Q1 2023 EOP shares outstanding: Common Stock: 19,622,380 (1) For the Company (2) Non-GAAP Financial Measures 19
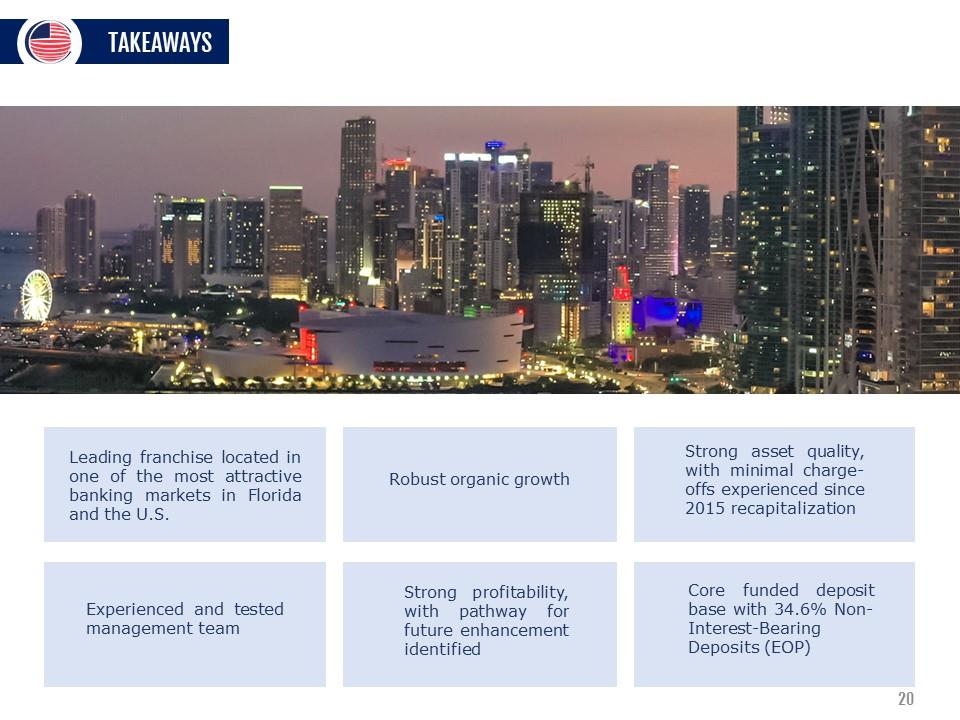
TAKEAWAYS Leading franchise located in one of the most attractive Robust organic growth banking markets in Florida and the U.S. Strong asset quality, with minimal charge - offs experienced since 2015 recapitalization Experienced and tested management team Strong profitability, with pathway for future enhancement identified Core funded deposit base with 34.6% Non - Interest-Bearing Deposits (EOP) 20
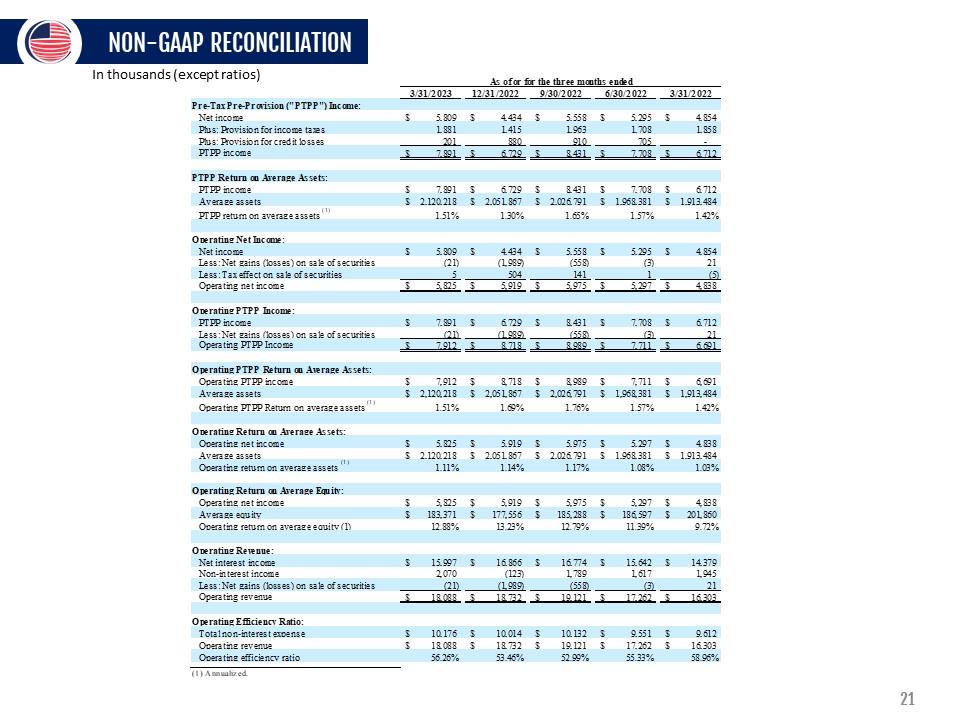
NON-GAAP RECONCILIATION In thousands (except ratios) 3/31/2023 Pre-Tax Pre-Provision (PTPP") Bicorne: Net income $ 5,809 Plus: Provision for income taxes 1,881 Plus: Provision for credit losses 201 PTPP income $ 7,891 PTPP Return ou Average Assets: PTPP income $ 7,891 Average assets $ 2,120,218 PTPP return on average assets(1) 1.51% Operating Net Income: Net income $ 5,809 Less: Net gains (losses) on sale of securities (21) Less: Tax effect on sale of securities 5_ Operating net income $ 5,825 Operating PTPP Bicorne: PTPP income $ 7,891 Less: Net gains (losses) on sale of securities (21) Operating PTPP Income $ 7,912 Operating PTPP Return on Average Assets: Operating PTPP income $ 7,912 Average assets $ 2,120,218 Operating PTPP Return on average assets(1; 1.51% As of or for the three months ended 12/31/2022 9/30/2022 6/30/2022 3/31/2022 $ 4,434 $ 5,558 $ 5295 $ 4,854 1,415 1,963 1,708 1,858 880 910 705 - $ 6,729 $ S,431 $ 7,708 $ 6,712 $ 6,729 $ 8,431 $ 7,708 $ 6,712 $ 2,051,867 $ 2,026,791 $ 1,968381 $ 1,913,484 130% 1.65% 1.57% 1.42% $ 4,434 $ 5,558 $ 5295 $ 4,854 (1,989) (558) (3) 21 504 141 1 (5)_ $ 5,919 $ 5,975 S 5297 S 4,838 $ 6,729 $ 8,431 $ 7,708 $ 6,712 (1,989) (558) ßl 21 $ 8.7 IS $ S.9S9 $ 7,711 $ 6,691 $ 8,718 $ 8,989 $ 7,711 $ 6,691 $ 2,051,867 $ 2,026,791 $ 1,968381 $ 1,913,484 1.69% 1.76% 1.57% 1.42% Oper a till 2 Return ou .Average Assets : Operating net income Average assets Operating return on average assets £ 5,825 £ 2,120,218 1.11% Operating Return on Au?rage Equity: Operating net income Average equity Operating return on average equity (1) £ 5,825 £ 183371 12.88% Operating Revenue: net interest income non-interest income Less: Net gains (losses) on sale of securities Operating revenue £ 15,997 2,070 1211 £ 18,088 Operating Efficiency Ratio: Total non-interest expense Operating revenue Operating
efficiency ratio £ 10,176 £ 18,088 56.26% $ 5,919 $ 5,975 $ 5,297 $ 4,838 $ 2,051,867 $ 2,026,791 $ 1,968381 $ 1,913,484 1.14% 1.17% 1.08% 1.03% $ 5,919 $ 5,975 $ 5,297 $ 4,838 $ 177,556 $ 185288 $ 1S6,597 $ 201,860 1323% 12.79% 1139% 9.72% $ 16,866 $ 16,774 $ 15,642 $ 14379 (123) 1,789 1,617 1,945 (1,989) (558) (31 21_ £ 1S,732 £ 19,121 S 17262 S 16303 £ 10,014 £ 10,132 £ 9,551 £ 9,612 £ 18,732 £ 19,121 £ 17262 £ 16303 53.46% 52.99% 5533% 58.96% (1) Annualized 21
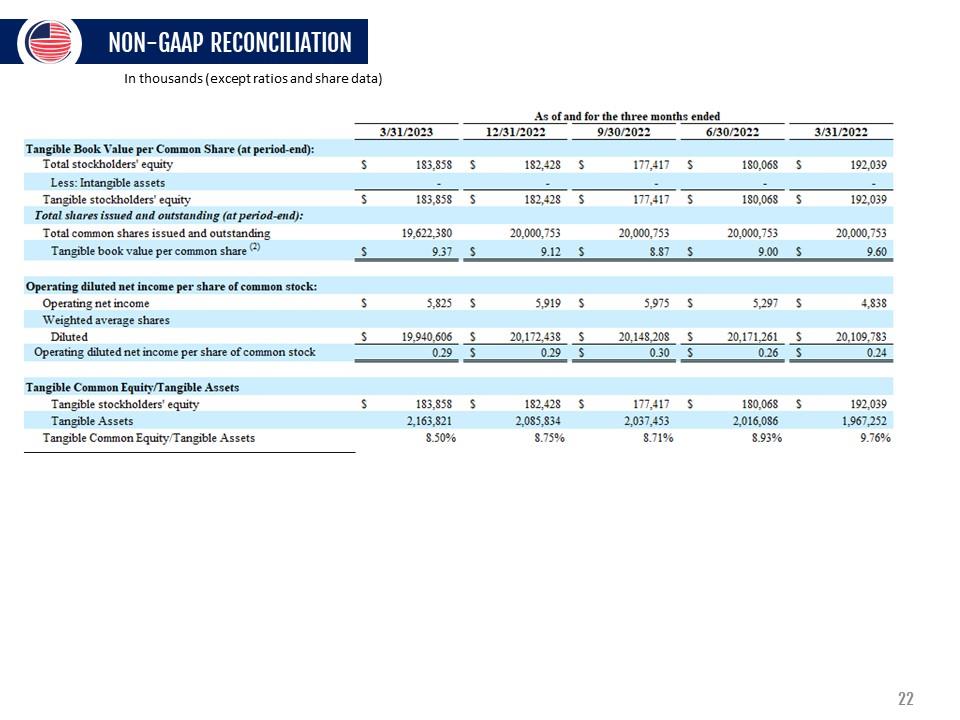
NON-GAAP RECONCILIATION In thousands (except ratios and share data) As of and for the three months ended Tangible Book Value per Common Share (at period-end): 3/31/2023 12/31/2022 9/30/2022 6/30/2022 3/31/2022 Total stockholders' equity S 1S3,S5S S 1S2,42S S 177,417 S ISO,06$ S 192,039 Less: Intangible assets _ _ _ _ _ Tangible stockholders' equity S 1S3,S5S S 1S2.428 S 177,417 S 180,06S S 192.039 Total shares issued and outstanding (at period-end): Total common shares issued and outstanding 19,622,3S0 20,000,753 20,000,753 20,000,753 20,000,753 Tangible book value per common share w s 9.37 s 9.12 s S.87 s 9.00 s 9.60 Operating diluted net income per share of common stock: Operating net income s 5.S25 s 5,919 s 5,975 s 5,297 s 4.S3S Weighted average shares Diluted S 19.940,606 S 20,172,438 S 20,148,208 S 20,171,261 S 20:109.7S3 Operating diluted net income per share of common stock 0.29 S 0.29 S 0.30 S 0.26 S 0.24 Tangible Common Equity/Tangible Assets Tangible stockholders’ equity S 1S3,S5S S 181428 S 177,417 S 180,06S S 192,039 Tangible Assets 2,163,821 2,085,834 2,037,453 2,016,0S6 1,967,252 Tangible Common Equity Tangible Assets S.50% S.75% 8.71% 8.93% 9.76% 22
CONTACT INFORMATION LOU DE LA AGUILERA President, CEO & Director (305) 715-5186 laguilera@uscentury.com ROB ANDERSON EVP, CHIEF FINANCIAL OFFICER (305) 715-5393 rob.anderson@uscentury.com INVESTOR RELATIONS InvestorRelations@uscentury.com 23