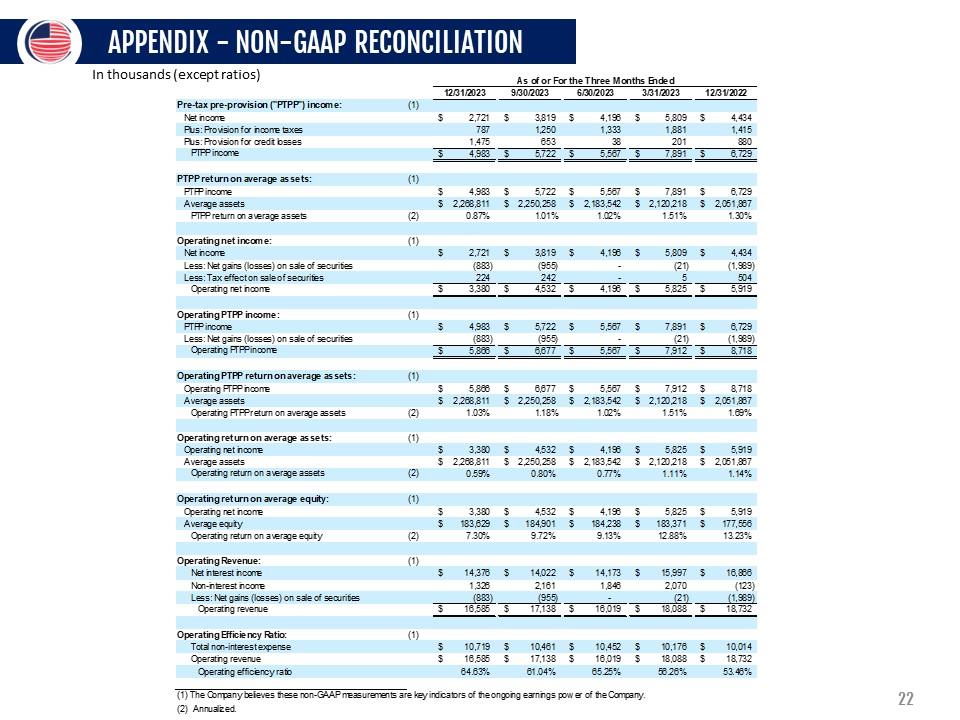
APPENDIX - NON-GAAP RECONCILIATIONIn thousands (except ratios)
Pre-tax-provison (“PTPP”) income: As of or for the three months ended
12/31/2023 9/30/2023 6/30/2023 3/31/2023 12/31/2022Net income
(1) $2,721 $3,819 $ 4,196 $5,809 $4,434 Plus :Provision for
income taxes 787 1,250 1,333 1,881 1,415 Plus:Provision for credit
losses 1,475 653 38 201 880 PITPP income4,983 $5,722 $5,567
$7,891 $6,729 PTPP return on average assets (1) $4,983 $5,722 $5,567
$7,891 $6,729 Average assets $2,268,811 $2,250,258 $2,183,542 $2,120,2018
$2,051,867 PTPP return on average assets (2) 0.87% 1.01%
1.02% 1.51% 1.30%Operating net income: (1) $2,721 $ 3,819
$ 4,196 $ 5,809 $ 4,434 (883) (955) – (21) (1,989) Less : net gains
(losses) on sale of securities Less :tax effect on sale of securities 224
242 – 5 504Operating net income $3,380 $ 4,532 $ 4,196 $ 5,825
$ 5,919 Operating PTPP income (1) $ 4,983 $5,722 $5,567 $7,891
$6,729 Less:net gains (losses) on sale of securities (883) (955) – (21)
(1,989)Operating PTPP income $ 5,866 $ 6,677 $5,567 $7,912
$8,718Operating PTPP return on average assests: (1) $5,866 $6,677
$5,567 $ 7,912 $8,718Average asets $ 2,268,811 $ 2,250,258 $2,183,542
$2,120,218 $2,051,867 Operating PTPP return on average assets (2)1.03%
1.18% 1.02% 1.51%1.69%Opearting return on average
assets : (1) $3,380 $ 4,532 $ 4,196 $ 5,825 $ 5,919 Average assets $ 2,268,811
$2,250,258 $ 2,183,542 $ 2,051,867 Opearting return on average
assets (2) 0.59% 0.80% 0.77% 1.11% 1.14% Operating return on average
equity : (1)$3,380
$4,532 $4,196 $5,825 $ 5,919 Average equity $183,629 $184,901
$184,238 $183,371 $177.556 Operating return on average
equity 7.30% 9.72% 9.13% 12.88% 13.23%Operating revenue : (1) $
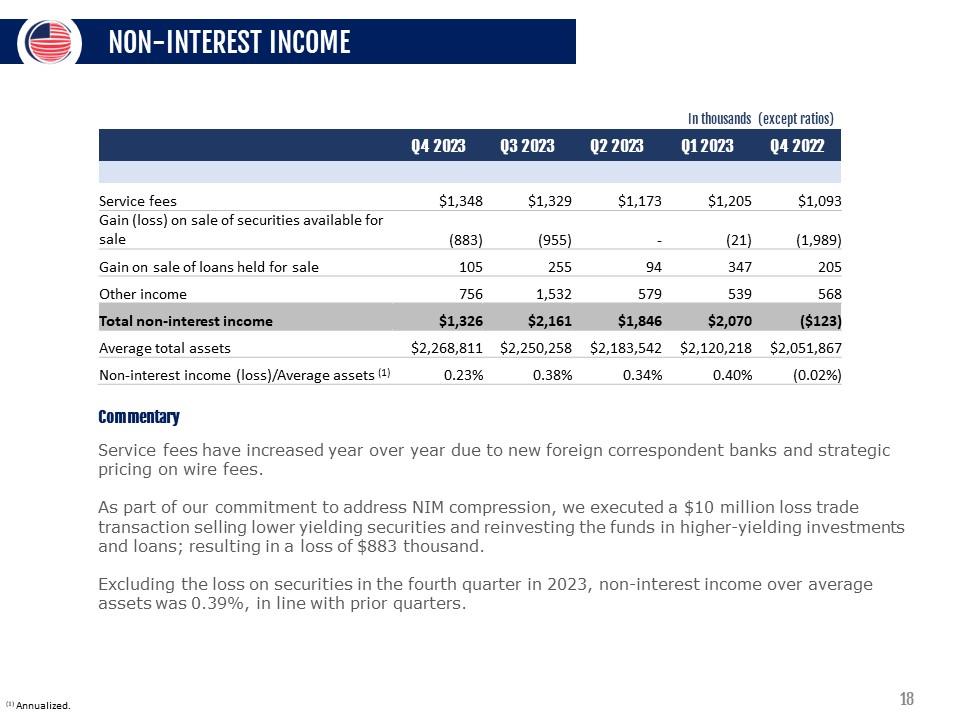
14,376 $14,022 $14,173 $15,997 $16,866 Non-interest income
1,326 2,161 1,846 2,070 (123) Less :net gains (losses)on sale of
securities
(833) (955)- (21)(1,989) Oerating revenue $ 16,585 $ 17,138 $16,019
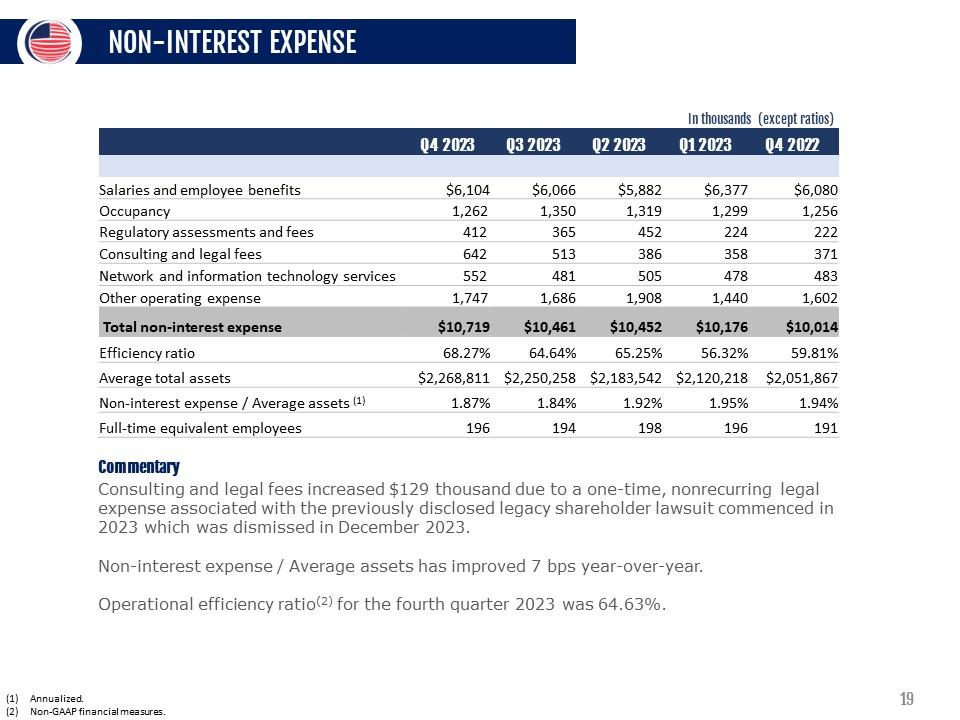
$ 18,088 $ 18,732Operating Efficiency Ration: (1) $10,719 $10,461
$10,452 $10,176 $10,014 Operating revenue $16,585 $ 17,138
$16,019 $18,088 $18,732 Operating efficiency ration 64.63% 61.04%
65.25% 56.26% 53.46% (1)The company believes these non-GAAP
measurements are key indicators of the ongoing earnings power
of the company (2)Annualized.