Exhibit 99.2
EARNINGS PRESENTATION FIRST QUARTER 2024 NASDAG: USCB USCB FINANCIAL HOLDINGS | U.S. CENTURY BANK
FORWARD-LOOKING STATEMENTS This presentation may contain statements that are not historical in nature and are intended to be, and are hereby identified as, forward-looking statements for purposes of the safe harbor provided by Section 21E of the Securities Exchange Act of 1934, as amended. Forward-looking statements are those that are not historical facts. The words “may,” “will,” “anticipate,” “could,” “ should,” “would,” “believe,” “contemplate,” “expect,” “aim,” “plan,” “estimate,” “continue,” and “intend,”, the negative of these terms, as well as other similar words and expressions of the future, are intended to identify forward-looking statements. These forward -looking statements include, but are not limited to, statements related to our projected growth, anticipated future financial performance, and management’s long-term performance goals, as well as statements relating to the anticipated effects on results of operations and financial condition from expected or potential developments or events, or business and growth strategies, including anticipated internal growth and balance sheet restructuring. These forward-looking statements involve significant risks and uncertainties that could cause our actual results to differ materially from those anticipated in such statements. Potential risks and uncertainties include, but are not limited to: the strength of the United States economy in general and the strength of the local economies in which we conduct operations; our ability to successfully manage interest rate risk, credit risk, liquidity risk, and other risks inherent to our industry; the accuracy of our financial statement estimates and assumptions, including the estimates used for our credit loss reserve and deferred tax asset valuation allowance; the efficiency and effectiveness of our internal control procedures and processes; our ability to comply with the extensive laws and regulations to which we
are subject, including the laws for each jurisdiction where we operate; adverse changes or conditions in the capital and financial markets, including actual or potential stresses in the banking industry; deposit attrition and the level of our uninsured deposits; legislative or regulatory changes and changes in accounting principles, policies, practices or guidelines, including the on-going effects of the implementation of the Current Expected Credit Losses (“CECL”) standard; the lack of a significantly diversified loan portfolio and the concentration in the South Florida market, including the risks of geographic, depositor, and industry concentrations, including our concentration in loans secured by real estate, in particular, commercial real estate; the effects of climate change; the concentration of ownership of our common stock; fluctuations in the price of our common stock; our ability to fund or access the capital markets at attractive rates and terms and manage our growth, both organic growth as well as growth through other means, such as future acquisitions; inflation, interest rate, unemployment rate, market, and monetary fluctuations; impacts of international hostilities and geopolitical events; increased competition and its effect on the pricing of our products and services as well as our net interest rate spread and net interest margin; the loss of key employees; the effectiveness of our risk management strategies, including operational risks, including, but not limited to, client, employee, or third-party fraud and cybersecurity-breaches; and other risks described in this presentation and other filings we make with the Securities and Exchange Commission (“SEC”). All forward-looking statements are necessarily only estimates of future results, and there can be no assurance that actual results will not differ materially from expectations. Therefore, you are cautioned not to place undue reliance on any forward-looking
statements. Further, forward-looking statements included in this presentation are made only as of the date hereof, and we undertake no obligation to update or revise any forward-looking statements to reflect events or circumstances occurring after the date on which the statements are made or to reflect the occurrence of unanticipated events, unless required to do so under the federal securities laws. You should also review the risk factors described in the reports USCB Financial Holdings, Inc. filed or will file with the SEC. Non-GAAP Financial Measures This presentation includes financial information determined by methods other than in accordance with generally accepted accounting principles (“GAAP”). This financial information includes certain operating performance measures. Management has included these non-GAAP financial measures because it believes these measures may provide useful supplemental information for evaluating the Company’s expectations and underlying performance trends. Further, management uses these measures in managing and evaluating the Company’s business and intends to refer to them in discussions about our operations and performance. Operating performance measures should be viewed in addition to, and not as an alternative to or substitute for, measures determined in accordance with GAAP, and are not necessarily comparable to non-GAAP measures that may be presented by other companies. Reconciliations of these non-GAAP measures to the most directly compara ble GAAP measures can be found in the ‘Non-GAAP Reconciliation Tables’ included in the presentation. All numbers included in this presentation are unaudited unless otherwise noted. 2
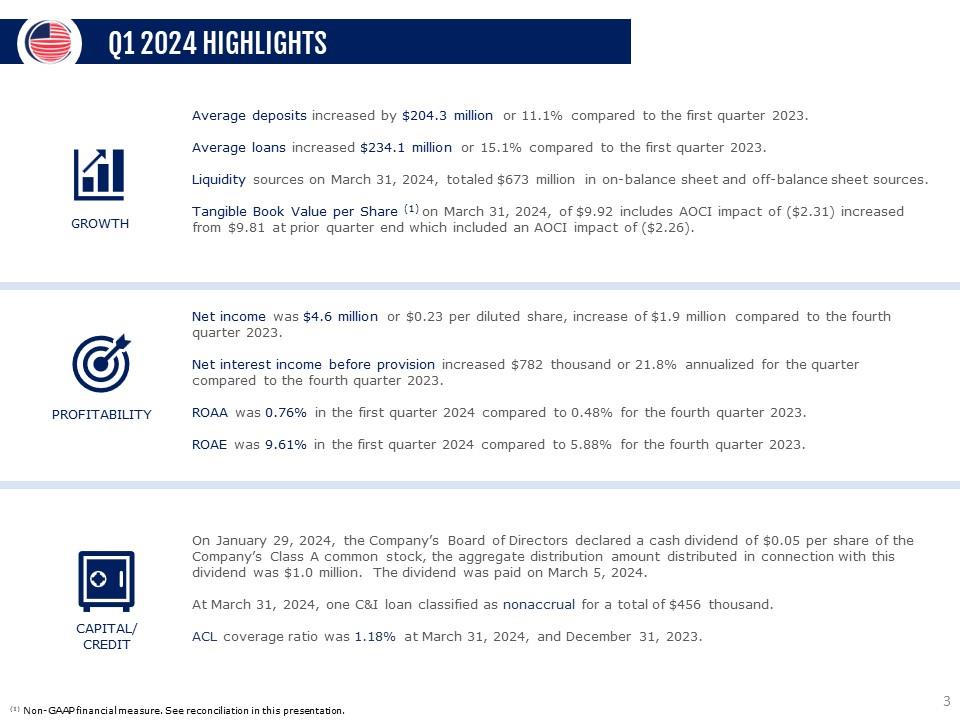
Q1 2024 HIGHLIGHTS Growth Average deposits increased by $204.3 million or 11.1% compared to the first quarter 2023. Average loans increased $234.1 million or 15.1% compared to the first quarter 2023. Liquidity sources on March 31, 2024, totaled $673 millio n in on-balance sheet and off-balance sheet sources. Tangible Book Value per Share (1) on March 31, 2024, of $9.92 includes AOCI impact of ($2.31) increased from $9.81 at prior quarter end which included an AOCI impact of ($2.26). Profitability Net income was $4.6 million or $0.23 per diluted share, increase of $1.9 million compared to the fourth quarter 2023. Net interest income before provision increased $782 thousand or 21.8% annualized for the quarter compared to the fourth quarter 2023. ROAA was 0.76% in the first quarter 2024 compared to 0.48% for the fourth quarter 2023. ROAE was 9.61% in the first quarter 2024 compared to 5.88% for the fourth quarter 2023. Capital/Credit On January 29, 2024, the Company’s Board of Directors declared a cash dividend of $0.05 per share of the Company’s Class A common stock, the aggregate distribution amount distributed in connection with this dividend was $1.0 million. The dividend was paid on March 5, 2024. At March 31, 2024, one C&I loan classified as nonaccrual for a total of $456 thousand. ACL coverage ratio was 1.18% at March 31, 2024, and December 31, 2023. 3
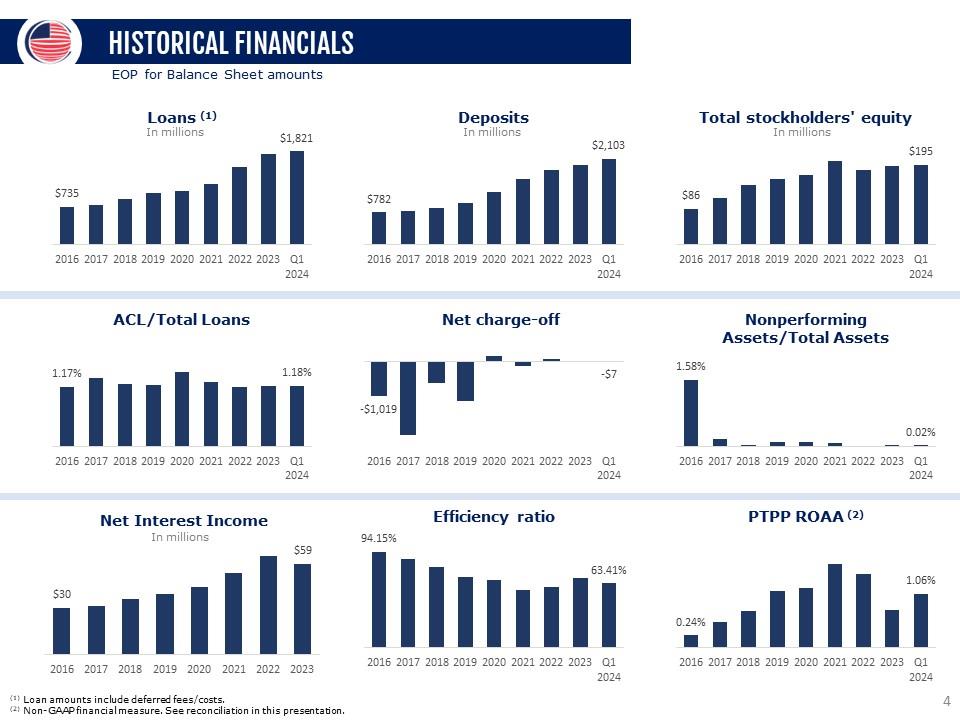
HISTORICAL FINANCIALS EOP for Balance Sheet amounts Loans (1) In millions $735 $1,821 2016 2017 2018 2019 2020 2021 2022 2023 Q1 2024 Deposits In millions $782 $2,103 2016 2017 2018 2019 2020 2021 2022 2023 Q1 2024 Total stockholders’ equity In millions $86 $195 2016 2017 2018 2019 2020 2021 2022 2023 Q1 2024 ACL/Total Loans 1.17% 1.18% 2016 2017 2018 2019 2020 2021 2022 2023 Q1 2024 Net charge-off -$1,019 -$7 2016 2017 2018 2019 2020 2021 2022 2023 Q1 2024 Net charge off Nonperforming Assets/Total Assets 158.00% 0.02% 2016 2017 2018 2019 2020 2021 2022 2023 Q1 2024 Net interest income In millions $30 $59 2016 2017 2018 2019 2020 2021 2022 2023 Q1 2024 Efficiency ratio 94.15% 63.41% 2016 2017 2018 2019 2020 2021 2022 2023 Q1 2024 PTPP ROAA (2) 0.24% 1.06% 2016 2017 2018 2019 2020 2021 2022 2023 Q1 2024 (1) Loan amounts include deferred fees/costs. (2) Non-GAAP financial measure. See reconciliation in this presentation. 4
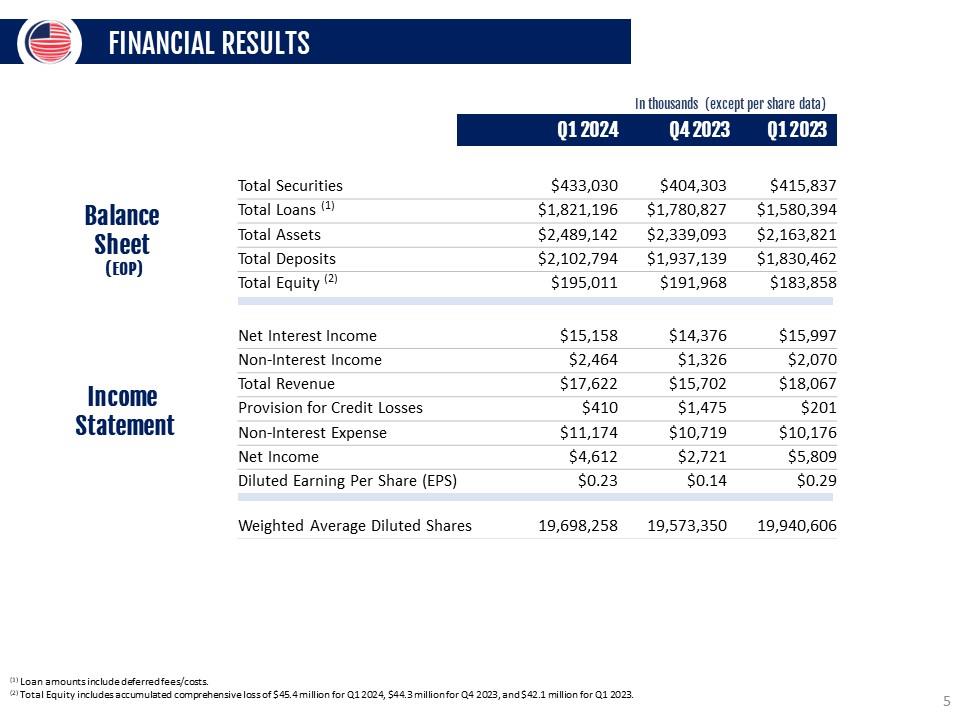
FINANCIAL RESULTS Balance Sheet (EOP) In thousands (except per share data) Q1 2024 Q4 2023 Q1 2023 Total Securities $433,030 $404,303 $415,837 Total Loans (1) $1,821,196 $1,780,827 $1,580,394 Total Assets $2,489,142 $2,339,093 $2,163,821 Total Deposits $2,102,794 $1,937,139 $1,830,462 Total Equity (2) $195,011 $191,968 $183,858 Income Statement Net Interest Income $15,158 $14,376 $15,997 Non-Interest Income $2,464 $1,326 $2,070 Total Revenue $17,622 $15,702 $18,067 Provision for Credit Losses $410 $1,475 $201 Non-Interest Expense $11,174 $10,719 $10,176 Net Income $4,612 $2,721 $5,809 Diluted Earning Per Share (EPS) $0.23 $0.14 $0.29 Weighted Average Diluted Shares 19,698,258 19,573,350 19,940,606 (1) Loan amounts include deferred fees/costs. (2) Total Equity includes accumulated comprehensive loss of $45.4 million for Q1 2024, $44.3 million for Q4 2023, and $42.1 million for Q1 2023. 5
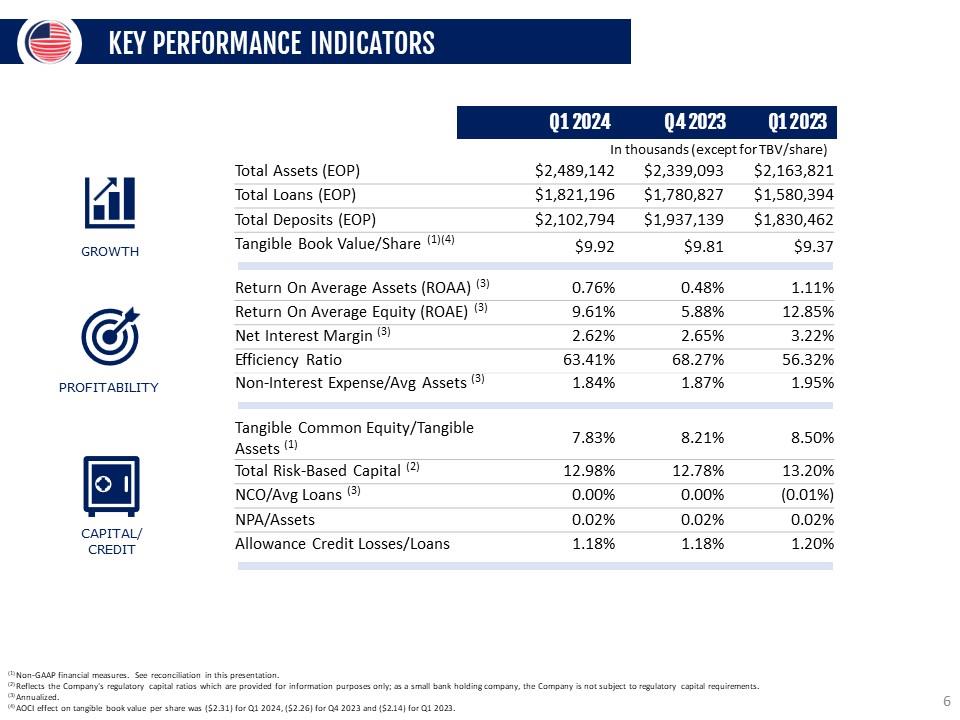
KEY PERFORMANCE INDICATORS Q1 2024 Q4 2023 Q1 2023 In thousands (except for TBV/share) GROWTH Total Assets (EOP) $2,489,142 $2,339,093 $2,163,821 Total Loans (EOP) $1,821,196 $1,780,827 $1,580,394 Total Deposits (EOP) $2,102,794 $1,937,139 $1,830,462 Tangible Book Value/Share (1)(4) $9.92 $9.81 $9.37 PROFITABILITY Return On Average Assets (ROAA) (3) 0.76% 0.48% 1.11% Return On Average Equity (ROAE) (3) 9.61% 5.88% 12.85% Net Interest Margin (3) 2.62% 2.65% 3.22% Efficiency Ratio 63.41% 68.27% 56.32% Non-Interest Expense/Avg Assets (3) 1.84% 1.87% 1.95% CAPITAL/CREDIT Tangible Common Equity/Tangible Assets (1) 7.83% 8.21% 8.50% Total Risk-Based Capital (2) 12.98% 12.78% 13.20% NCO/Avg Loans (3) 0.00% 0.00% (0.01%) NPA/Assets 0.02% 0.02% 0.02% Allowance Credit Losses/Loans 1.18% 1.18% 1.20% (1) Non-GAAP financial measures. See reconciliation in this presentation. (2) Reflects the Company's regulatory capital ratios which are provided for information purposes only; as a small bank holding company, the Company is not subject to regulatory capital requirements. (3) Annualized. (4) AOCI effect on tangible book value per share was ($2.31) for Q1 2024, ($2.26) for Q4 2023 and ($2.14) for Q1 2023. 6
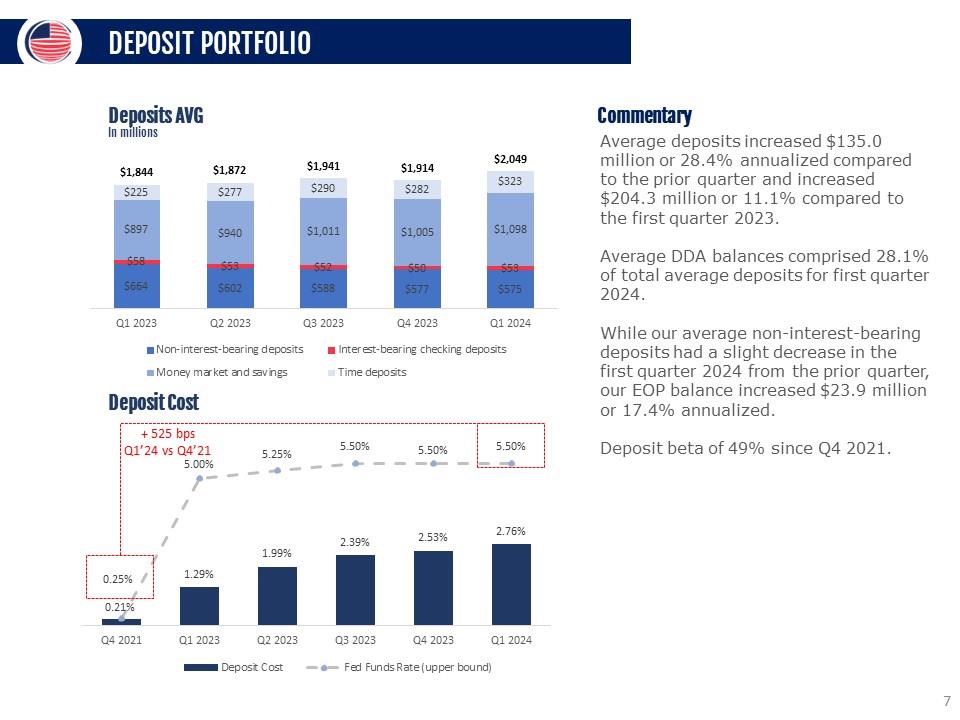
DEPOSIT PORTFOLIO Deposits AVG In millions $1,844 $1,872 $194 $1,914 $2,049 $225 $277 $290 $282 $323 $897 $940 $1,011 $1,005 $1,098 $58 $53 $52 $50 $53 $664 $602 $588 $577 $575 Q1 2023 Q2 2023 Q3 2023 Q4 2023 Q1 2024 Non-interest -bearing deposits Interest-bearing checking deposits Money market and savings Time deposits Deposit Cost 0.25% 5.00% 5.25% 5.50% 5.50% 5.50% 0.21% 1.29% 1.99% 2.39% 2.53% 2.76% Q4 2021 Q1 2023 Q2 2023 Q3 2023 Q4 2023 Q1 2024 Deposit Cost Fed Fund Rate (upper bound) Commentary Average deposits increased $135.0 million or 28.4% annualized compared to the prior quarter and increased $204.3 million or 11.1% compared to the first quarter 2023. Average DDA balances comprised 28.1% of total average deposits for the first quarter 2024. While our average non-interest-bearing deposits had a slight decrease in the first quarter 2024 from the prior quarter, our EOP balance increased $23.9 million or 17.4% annualized. Deposit beta of 49% since Q4 2021. 7
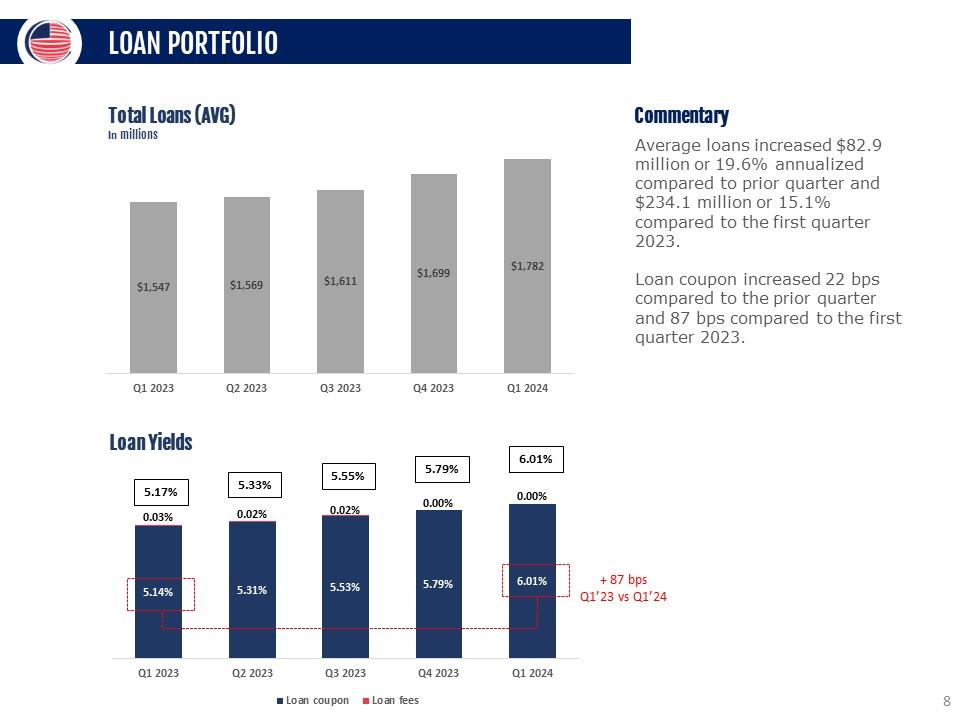
LOAN PORTFOLIO Total Loans (AVG) In millions $1,547 $1,569 $1,611 $1,699 $1,782 Q1 2023 Q2 2023 Q3 2023 Q4 2023 Q1 2024 Loan Yields 5.17% 5.33% 5.55% 5.79% 6.01% 0.03% 0.02% 0.02% 0.00% 0.00% 5.14% 5.31% 5.53% 5.79% 6.01% +87 bps Q1'23 vs Q1'24 Q1 2023 Q2 2023 Q3 2023 Q4 2023 Q1 2024 Loan co upon Loan fees Commentary Average loans increased $82.9 million or 19.6% annualized compared to prior quarter and $234.1 million or 15.1% compared to the first quarter 2023. Loan coupon increased 22 bps compared to the prior quarter and 87 bps compared to the first quarter 2023. 8
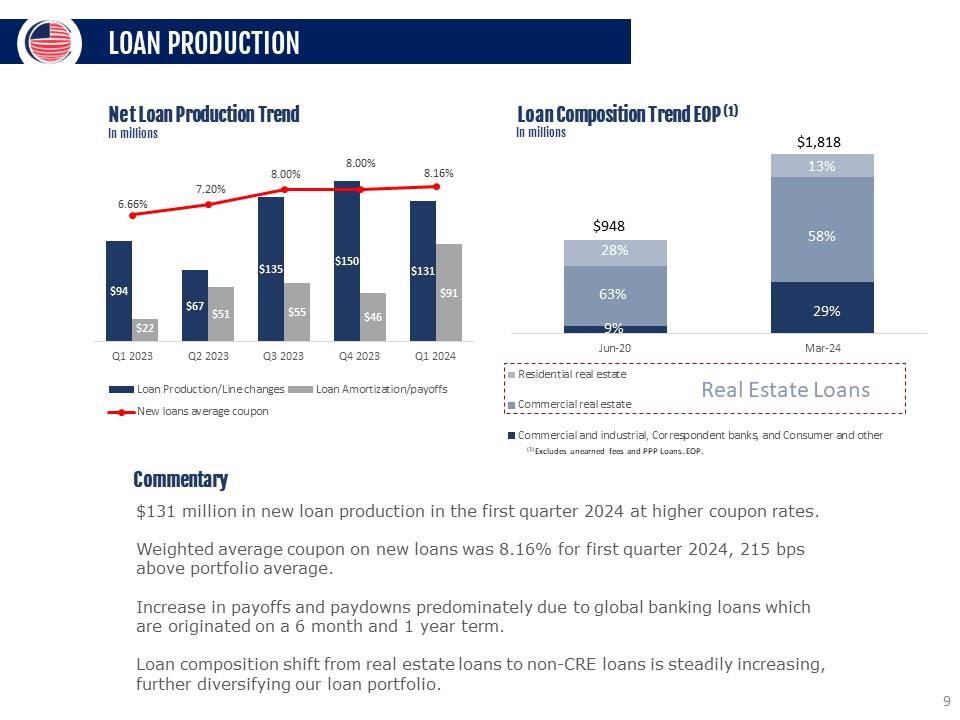
LOAN PRODUCTION Net Loan Production Trend In millions 6.66% 7.20% 8.00% 8 8.16 $96 $22 $67 $51 $135 $55 $150 $46 $131 $91 Q1 2023 Q2 2023 Q3 2023 Q4 2023 Q1 2024 Loan Production/Line change Loan Amortization/payoffs New loans average coupon Loan Composition Trend EOP (1) In millions $948 $1,818 28% 12% 63% 58% 9% 29% 10-Jun 24-Mar Residential real estate Commercial real estate Real Estate Loans Commercial and industrial, Foreign banks, and Consume rand other (1) Excludes unearned fees and PPP Loans, EOP Commentary $131 million in new loan production in the first quarter 2024 at higher coupon rates. Weighted average coupon on new loans was 8.16% for first quarter 2024, 215 bps above portfolio average. Increase in payoffs and paydowns predominately due to global banking loans which are originated on a 6 month and 1 year term. Loan composition shift from real estate loans to non-CRE loans is steadily increasing, further diversifying our loan portfolio. 9
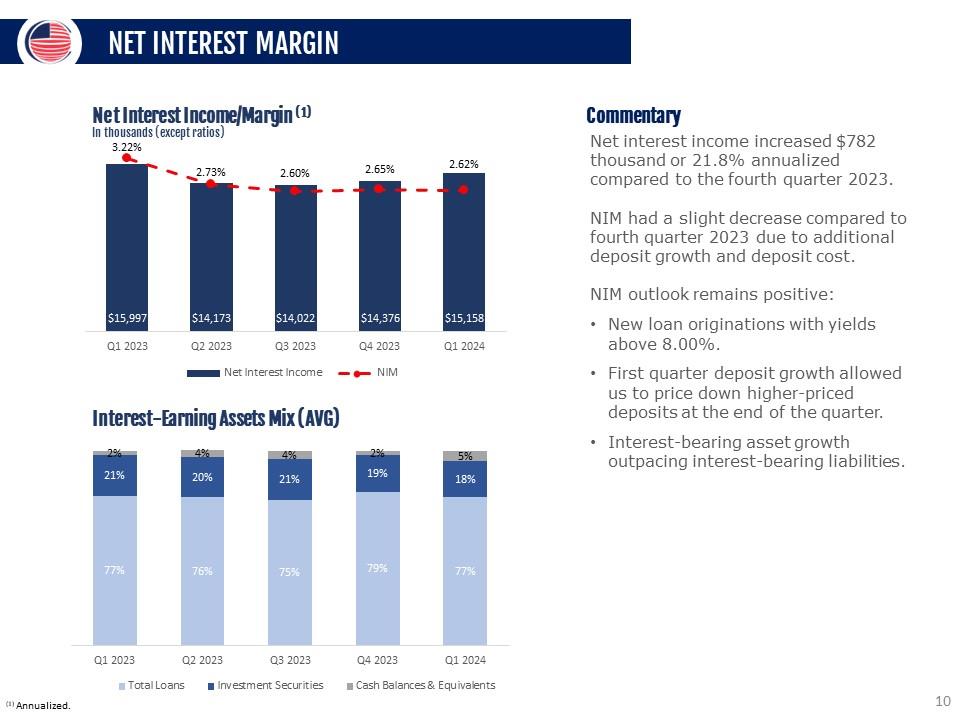
NET INTEREST MARGIN Net Interest Income/Margin (1) In thousands (except ratios) 3.22% 2.73% 2.60% 2.65% 2.62% $15,997 $14,173 $14,022 $14,376 $15,158 Q1 2023 Q2 2023 Q3 2023 Q4 2023 Q1 2024 Net Interest Income NIM Interest-Earning Assets Mix (AVG) 2% 4% 4% 2% 5% 21% 20% 21% 19% 18% 77% 76% 75% 79% 77% Q1 2023 Q2 2023 Q3 2023 Q4 2023 Q1 2024 Total Loans Investment Securities Cash Balances & Equivalents Commentary Net interest income increased $782 thousand or 21.8% annualized compared to the fourth quarter 2023. NIM had a slight decrease compared to fourth quarter 2023 due to additional deposit growth and deposit cost. NIM outlook remains positive: New loan originations with yields above 8.00%. First quarter deposit growth allowed us to price down higher-priced deposits at the end of the quarter. Interest-bearing asset growth outpacing interest-bearing liabilities. (1) Annualized. 10
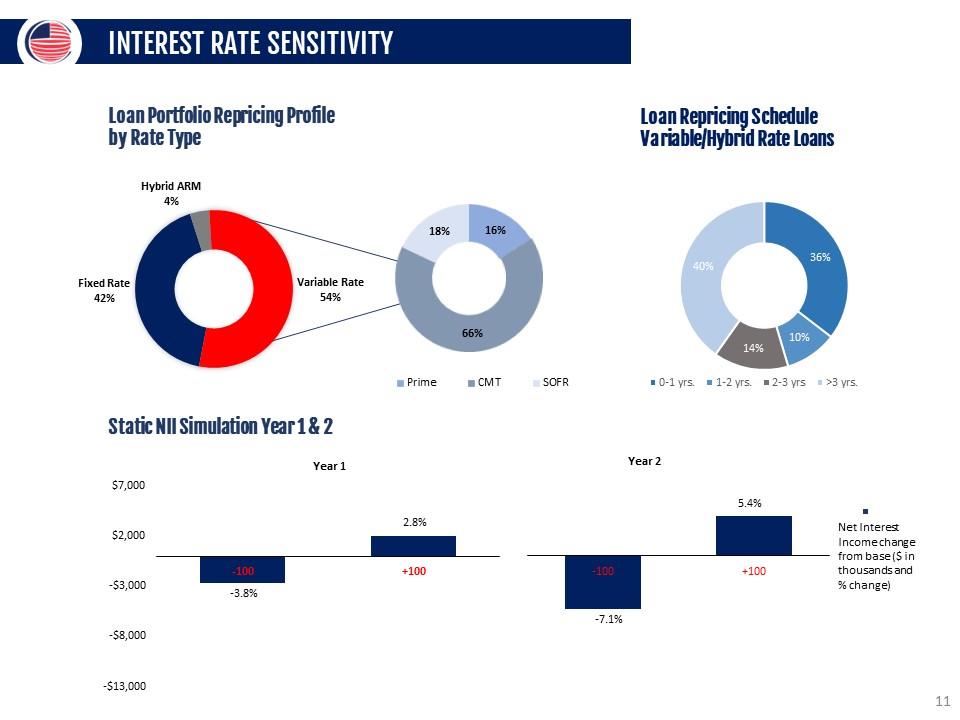
INTEREST RATE SENSITIVITY Loan Portfolio Repricing Profile by Rate Type Hybrid ARM 4% Fixed Rate 42% Variable Rate 54% 18% 16% 66% Prime CMT SOFR 40% 36% 10% 14% 0-1 yrs. 0-2 1-2 yrs. 0-3 2-3 yrs. 0-4 >3 yrs. Static NII Simulation Year 1 & 2 Year 1 Yer 2 $7,000 $2,000 2.8% 5.4% -$3,000 -100 `+100 `-100 +100 -$8,000 3.8% -7.1% Net Interest Income change from base ($ in thousands and % change) 11
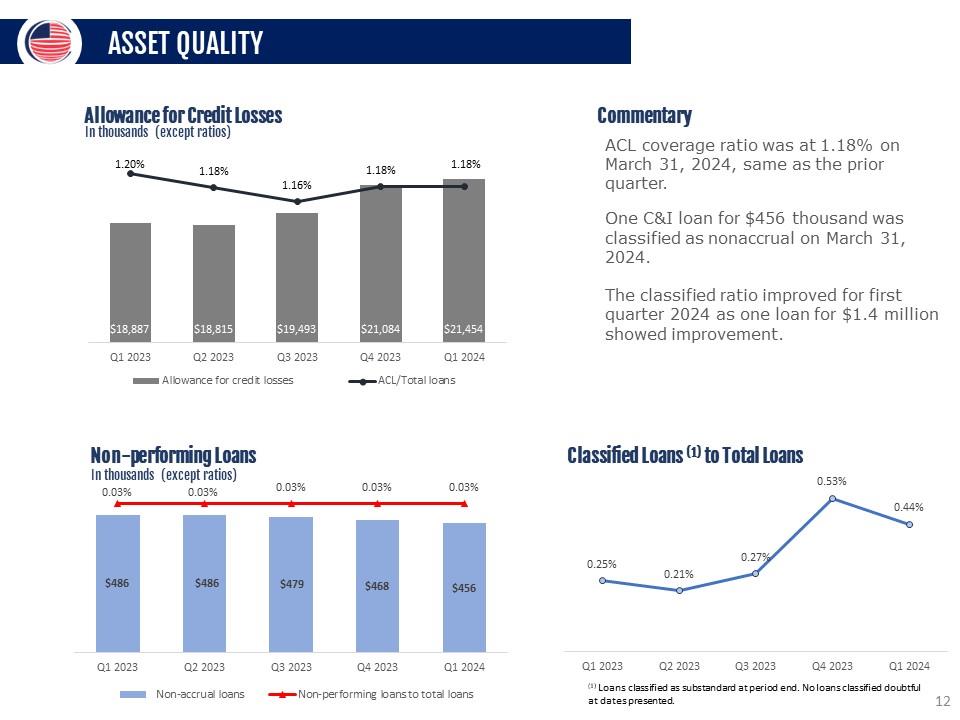
ASSET QUALITY Allowance for Credit Losses In thousands (except ratios) 1.20% 1.18% 1.16% 1.18% 1.18% $18,887 $18,815 $19,493 $21,084 $21,454 Q1 2023 Q2 2023 Q3 2023 Q4 2023 Q1 2024 Allowance for credit losses ACL/Total Loans Non-performing Loans In thousan ds (except ratios) 0.03% 0.03% 0.03% 0.03% 0.03% $486 $486 $479 $468 $456 Q1 2023 Q2 2023 Q3 2023 Q4 2023 Q1 2024 Non -accrual loans Non-performing loans to total loans Classified Loans (1) to Total Loans 0.25% 0.21% 0.27% 0.53% 0.44% Q1 2023 Q2 2023 Q3 2023 Q4 2023 Q1 2024 (1) Loans classified as substandard at period end. No loans classified doubtful at dates presented. Commentary ACL coverage ratio was at 1.18% on March 31, 2024, same as the prior quarter. One C&I loan for $456 thousand was classified as nonaccrual on March 31, 2024. The classified ratio improved for first quarter 2024 as one loan for $1.4 million showed improvement. 12
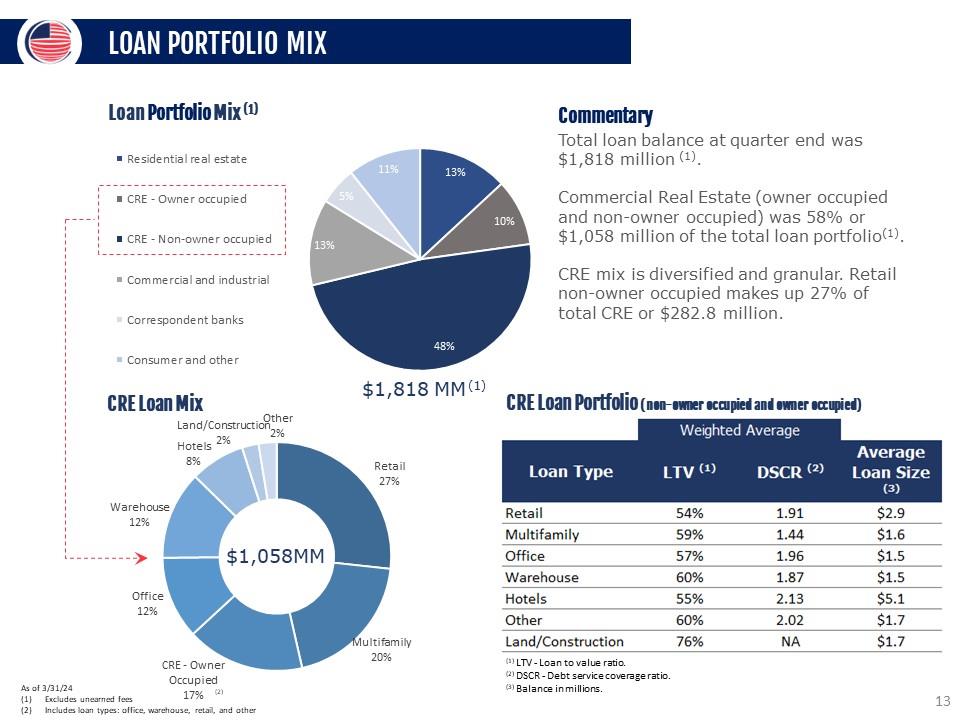
LOAN PORTFOLIO MIX Loan Portfolio Mix (1) Residential real estate CRE -Owner occupied CRE - Non-owner occupied Commercial and industrial Correspondent banks Consumer and other 11% 11% 13% 10% 48% 13% 5% $1,818MM(1) Commentary Total loan balance at quarter end was $1,818 million (1). Commercial Real Estate (owner occupied and non-owner occupied) was 58% or $1,058 million of the total loan portfolio(1). CRE mix is diversified and granular. Retail non-owner occupied makes up 27% of total CRE or $282.8 million. CRE Loan Mix Land/Construction 2% Other 2% Retail 27% Multifamily 20% CRE - Owner Occupied 17% Office 12% Warehouse 12% Hotels 8% $1,058MM CRE Loan Portfolio (non-owner occupied and owner occupied) Weighted Average Average Loan Type LTV (1> DSCR (2) Loan Size (3) Retail Multifamily 54% 59% 1.91 1.44 $2.9 $1.6 Office 57% 1.96 $1.5 Warehouse 60% 1.87 $1.5 Hotels 55% 2.13 $5.1 Other 60% 2.02 $1.7 Land/Construction 76% NA $1.7 l0lTV Loan to value rallo. 10 DSCR Debt service coverage ratio. Balance in millions As of 3/31/24 Excludes unearned fees Includes loan types: office, warehouse, retail, and other 13
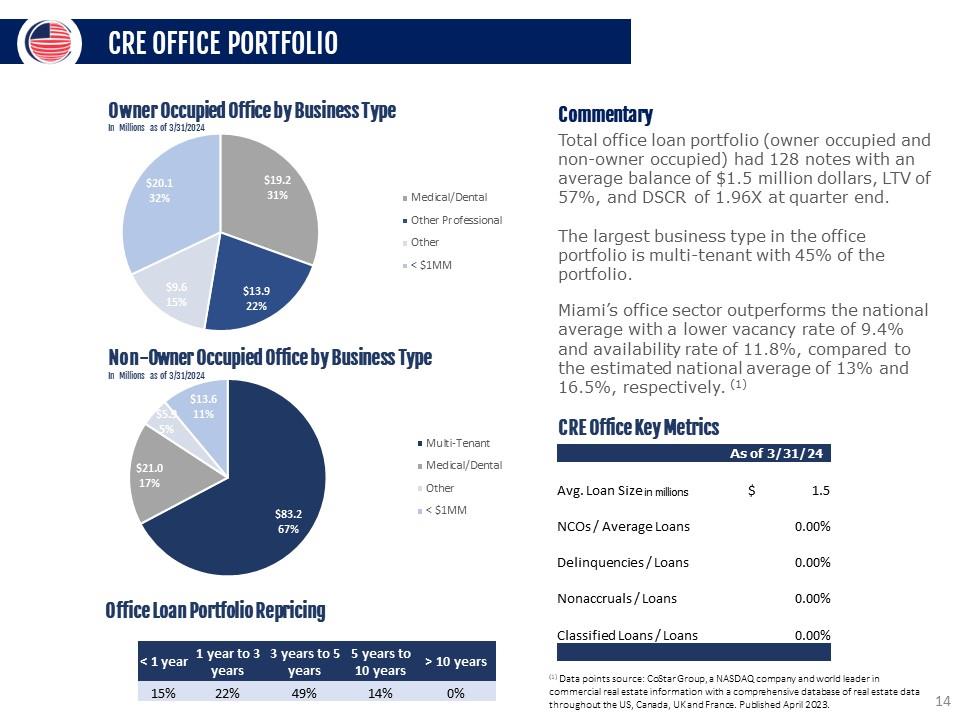
CRE OFFICE PORTFOLIO Owner Occupied Office by Business Type In Millions as of 3/31/2024 $20.1 32% $19.2 31% $13.9 22% $9.6 15% Medical/Dental Other Professional Other < $1MM Non-Owner Occupied Office by Business Type $13.6 11% $83.2 67% $21.0 17% $5.9 5% Multi-Tenant Medical/Dental Other < $1MM Commentary Total office loan portfolio (owner occupied and non-owner occupied) had 128 notes with an average balance of $1.5 million dollars, LTV of 57%, and DSCR of 1.96X at quarter end. The largest business type in the office portfolio is multi-tenant with 45% of the portfolio. Miami’s office sector outperforms the national average with a lower vacancy rate of 9.4% and availability rate of 11.8%, compared to the estimated national average of 13% and 16.5%, respectively. (1) CRE Office Key Metrics As of 3/31/240 Avg. Loan Size in millions $ 1.5 NCOs / Average Loans 0.00% Delinquencies / Loans 0.00% Nonaccruals / Loans 0.00% Classified Loans / Loans 0.00% (1) Data points source: CoStar Group, a NASDAQ company and world leader in commercial real estate information with a comprehensive database of real estate data throughout the US, Canada, UK and France. Published April 2023. 14
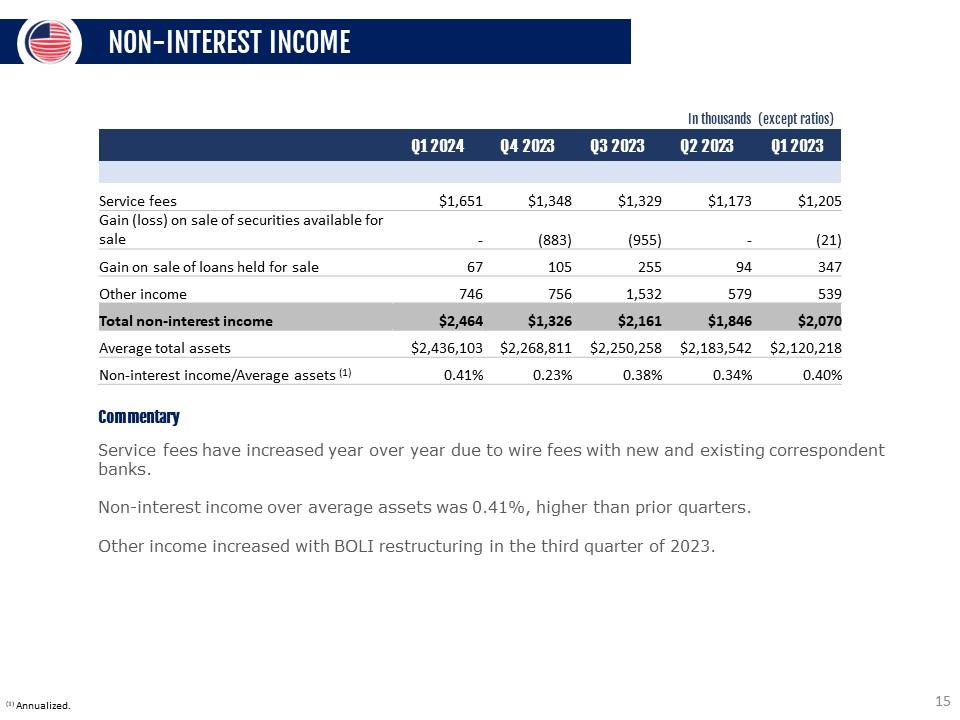
NON-INTEREST INCOME In thousands (except ratios) Q1 2024 Q4 2023 Q3 2023 Q2 2023 Q1 2023 Service fees $1,651 $1,348 $1,329 $1,173 $1,205 Gain (loss) on sale of securities available for sale - (883) (955) - (21) Gain on sale of loans held for sale 67 105 255 94 347 Other income 746 756 1,532 579 539 Total non-interest income $2,464 $1,326 $2,161 $1,846 $2,070 Average total assets $2,436,103 $2,268,811 $2,250,258 $2,183,542 $2,120,21 8 Non-interest income/Average assets (1) 0.41% 0.23% 0.38% 0.34% 0.40% Commentary Service fees have increased year over year due to wire fees with new and existing correspondent banks. Non-interest income over average assets was 0.41%, higher than prior quarters. Other income increased with BOLI restructuring in the third quarter of 2023. (1) Annualized. 15
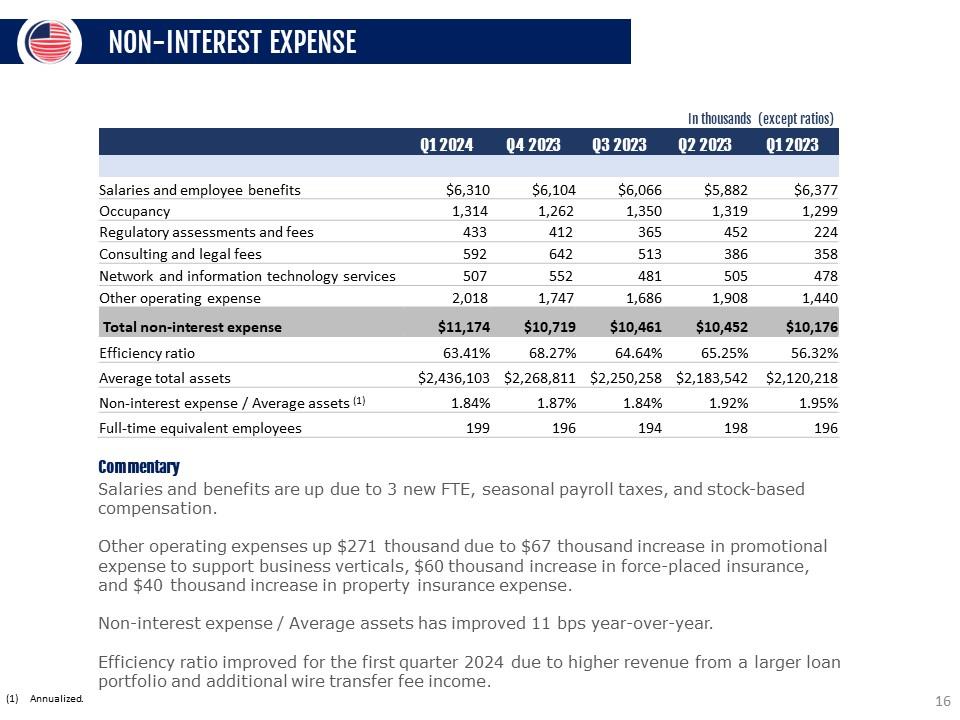
NON-INTEREST EXPENSE In thousands (except ratios) Q1 2024 Q4 2023 Q3 2023 Q2 2023 Q1 2023 Salaries and employee benefits $6,310 $6,104 $6,066 $5,882 $6,377 Occupancy 1,314 1,262 1,350 1,319 1,299 Regulatory assessments and fees 433 412 365 452 224 Consulting and legal fees 592 642 513 386 358 Network and information technology services 507 552 481 505 478 Other operating expense 2,018 1,747 1,686 1,908 1,440 Total non-interest expense $11,174 $10,719 $10,461 $10,452 $10,176 Efficiency ratio 63.41% 68.27% 64.64% 65.25% 56.32% Average total assets $2,436,103 $2,268,811 $2,250,258 $2,183,542 $2,120,218 Non-interest expense / Average assets (1) 1.84% 1.87% 1.84% 1.92% 1.95% Full-time equivalent employees 199 196 194 198 196 Commentary Salaries and benefits are up due to 3 new FTE, seasonal payroll taxes, and stock-based compensation. Other operating expenses up $271 thousand due to $67 thousand increase in promotional expense to support business verticals, $60 thousand increase in force-placed insurance, and $40 thousand increase in property insurance expense. Non-interest expense / Average assets has improved 11 bps year-over-year. Efficiency ratio improved for the first quarter 2024 due to higher revenue from a larger loan portfolio and additional wire transfer fee income. Annualized. 16
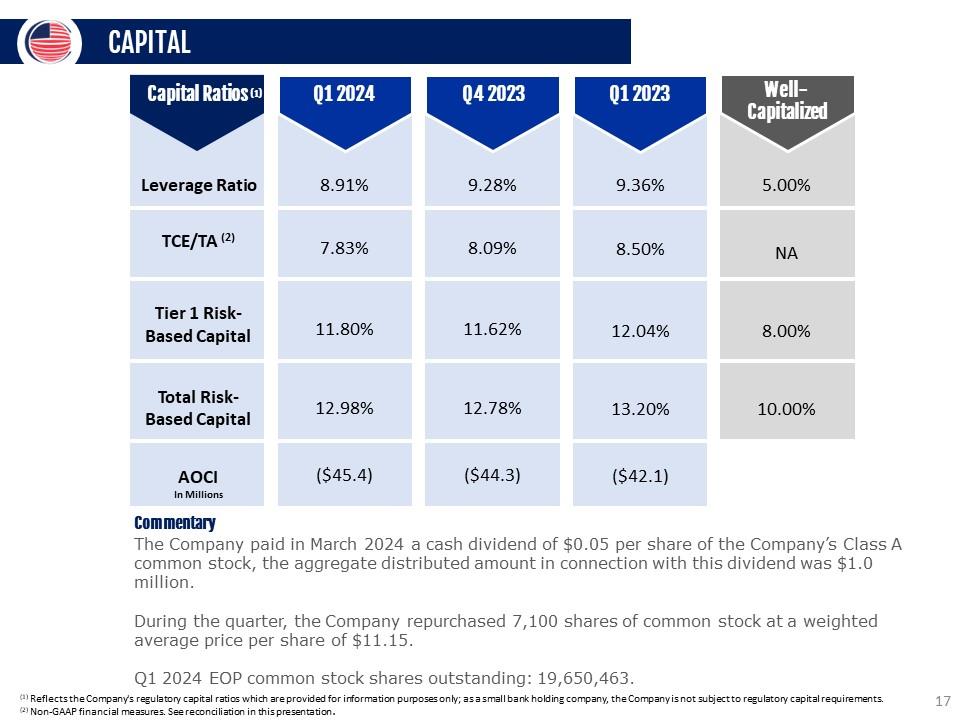
CAPITAL 'S Capital Ratios Ql 2024 8.91% Leverage Ratio TCE/TA (2) 7.83% Tier 1 Risk- Based Capital 11.80% Total Risk- 12.98% Based Capital AOCI ($45.4) ln Millions Well -Capitalized 9.28% 8.09% 11.62% 12.78% ($44.3) 9.36% 8.50% 12.04% 13.20% ($42.1) 5.00% NA 8.00% 10.00% Commentary The Company paid in March 2024 a cash dividend of $0.05 per share of the Company’s Class A common stock, the aggregate distributed amount in connection with this dividend was $1.0 million. During the quarter, the Company repurchased 7,100 share s of common stock at a weighted average price per share of $11.15. Q1 2024 EOP common stock shares outstanding: 19,650,463. (1) Reflects the Company's regulatory capital ratios which are provided for information purposes only; as a small bank holding comp any, the Company is not subject to regulatory capital requirements. (2) Non-GAAP financial measures. See reconciliation in this presentation. 17
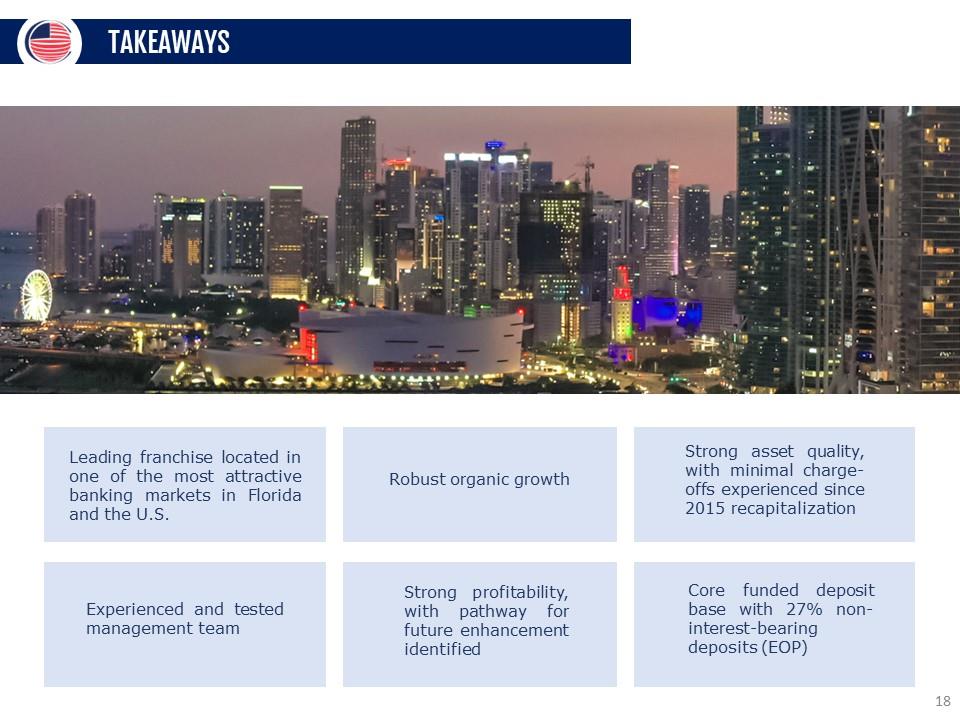
TAKEAWAYS Leading franchise located in one of the most attractive banking markets in Florida and the U.S. Robust organic growth Strong asset quality, with minimal charge-offs experienced since 2015 recapitalization Experienced and tested management team Strong profitability, with pathway for future enhancement identified Core funded deposit base with 27% non-interest-bearing deposits (EOP) 18
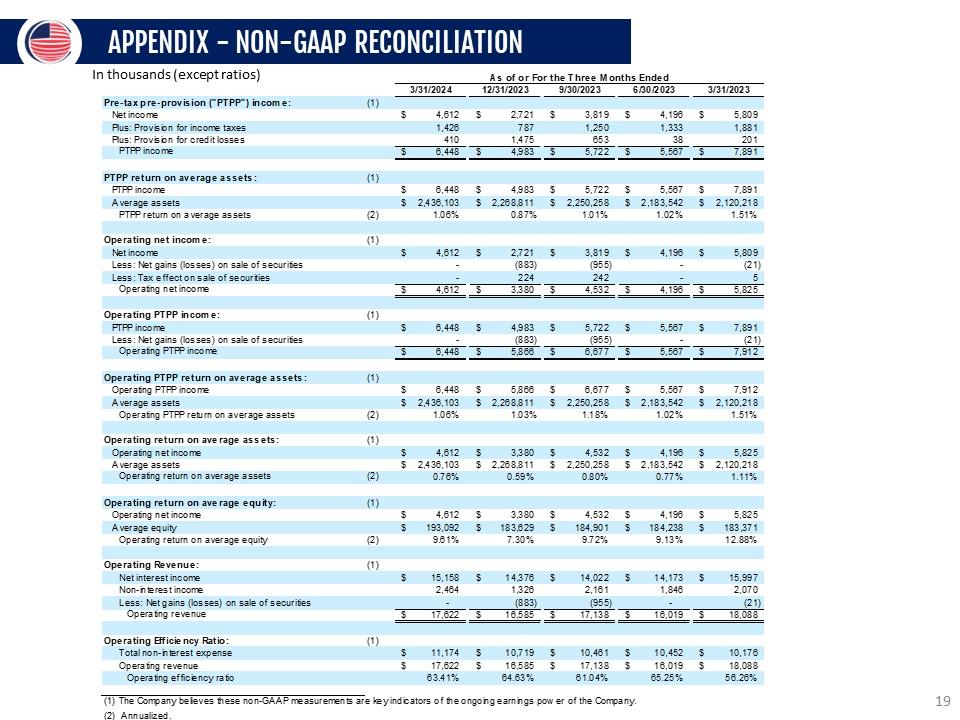
APPENDIX - NON-GAAP RECONCILIATION In thousands (except ratios) As of or For the Three Months Ended 3/31/2024 12/31/2023 9/30/2023 6/30/2023 3/31/2023 Pre-tax pre-provision ("PTPP") income: (1) Net income $4,612$2,721$3,819$4,196$5,809 Plus: Provision for income taxes 1,426 A A fl 787 1 17C 1,250 cc? 1,333 OQ 1,881 on a Plus: Provision for credit losses PTPP income $41U 6,448 s 1,4/ 4,983$bW 5,722 s 0Ö 5,567 s Z) 1 7,891 PTPP return on average assets: (1) PTPP income $6,448$4,983$5,722$5,567$7,891 Average assets $2,436,103$2,268,811$2,250,258$2,183,542$2,120,218 PTPP return on average assets (2) 1.06% 0.87% 1.01% 1.02% 1.51% Operating net income: (1) Net income $4,612$2,721$3,819$4,196$5,809 Less: Net gains (losses) on sale of securities - (883) (955) - (21) Less: Tax effect on sale of securities - 224 242 - 5 Operating net income $4,612$3,380$4,532$4,196$5,825 Operating PTPP income: (1) PTPP income Less: Net gains (losses) on sale of securities $6,448$4,983 (883) s 5,722 (955) s 5,567$7,891 (21) Operating PTPP income S 6,448 S 5,866 S 6,677 S 5,567 S 7,912 Operating PTPP return on average assets: (1) Operating PTPP income Average assets s s 6,448 2,436,103 s s 5,866 2,268,811 s s 6,677 2,250,258 s s 5,567 2,183,542 s s 7,912 2,120,218 Operating PTPP return on average assets (2) 1.06% 1.03% 1.18% 1.02% 1.51% Operating return on average assets: (1) Operating net income AvPrflHP acepte $4,612 ? 436 1 03 s 3,380 ? 266 611 s 4,532 ? 250 2S6 s 4,196 2 163 542 s 5,825 2 120 216 ni vi utjv floOvlo Operating return on average assets (2) 4. ,*T JW , 1 V sJ 0.76% 4. . Í-.SJ V, \J 1 1 0.59% 4. V ,4 w’U 0.80% 4 , 1 \JyJ (Jt4 0.77% 4. I 4 U, 4 1 \J 1.11% Operating PTPP income: (1) PTPP income S 6,448 S 4,983 S 5,722 S 5,567 S 7,891 Less: Net gains (losses) on sale of securities Operating PTPP income $6,448$(883) 5,866 s (955)
6,677 s 5,567$(21) 7,912 Operating PTPP return on average assets: (1) Operating PTPP income Average assets s s 6,448 2,436,10 3 s s 5,866 2,268,811 s s 6,677 2,250,258 s s 5,567 2,183,542 s s 7,912 2,120,218 Operating PTPP return on average assets (2) 1.06% 1.03% 1.18% 1.02% 1.51% Operating return on average assets: (1) Operating net income $4,612$3,380$4,532$4,196$5,825 Average assets $2,436,103$2,268,811$2,250,258$2,183,542$2,120,218 Operating return on average assets (2) 0.76% 0.59% 0.80% 0.77% 1.11% Operating return on average equity: (1) Operating net income Average equity s s 4,612 193,092 s s 3,380 183,629 s s 4,532 184,901 s s 4,196 184,238 s s 5,825 183,371 Operating return on average equity (2) 9.61% 7.30% 9.72% 9.13% 12.88% Operating Revenue: (1) Net interest income $15,158$14,376$14,022$14,173$15,997 Non-interest income 2,464 1,326 2,161 1,846 2,070 Less: Net gains (losses) on sale of securities - (883) (955) - (21) Operating revenue $17,622$16,5 85$17,138$16,019$18,088 Operating Efficiency Ratio: (1) Total non-interest expense s c 11,174 47 C77 s c 10,719 a c C9C s c 10,461 47 4 OO s c 10,452 A C s c 10,176 4 O fíO O Operating revenu e Operating efficiency ratio 5 1 ( ,b ¿Z 63.41% 5 1 b, bob 64.63% 1 f ,1 bo 61.04% 5 iotuiy 65.25% 5 1 O'Uoo 56.26% 1. The Company believes these non-GAAP measurements are key indicators of the ongoing earnings power of the Company. 2. Annualized. 19
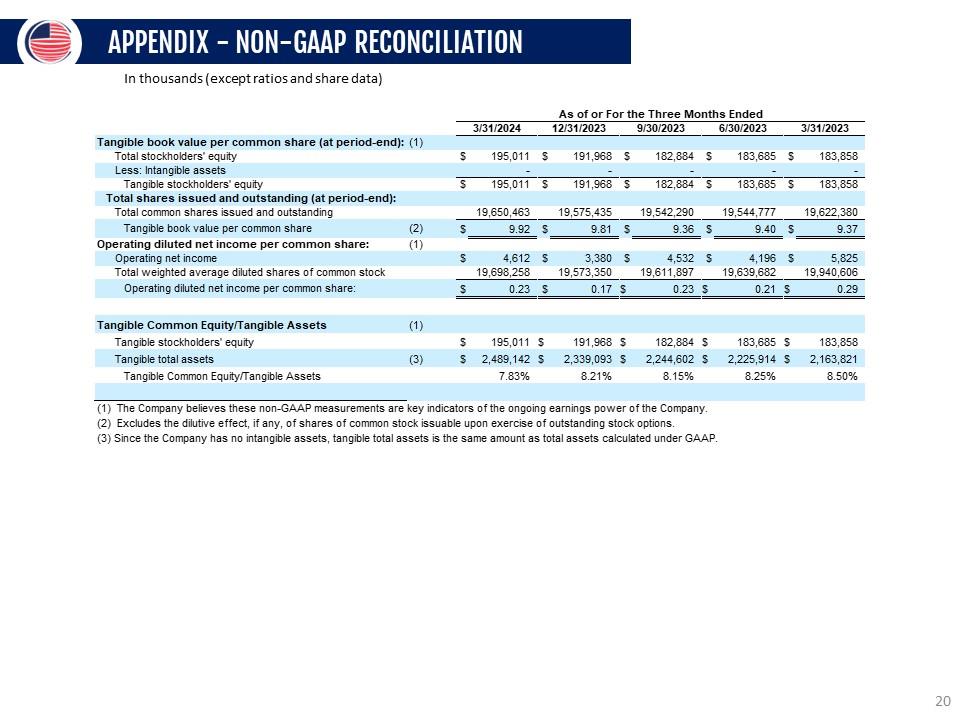
APPENDIX - NON-GAAP RECONCILIATION In thousands (except ratios and share data) As of or For the Three Months Bided 3/31/2024 12/31/2023 9/30/2023 6/30/2023 3/31/2023 Tangible book value per common share (at period-end): (1) Total stockholders' equity $195.011$191,968$182.884$183,685$183.858 Less: Intangible assets - - - - - Tangible stockholders' equity $195.011$191,968$182.884$183,685$183,858 Total shares issued and outstanding (at period-end): Total common shares issued and outstanding 19.650.463 19.575,435 19.542.290 19.544.777 19.622.380 Tangible book value per common share (2)$9.92$9.81$9.36$9.40$9.37 Operating diluted net income per common share: (1) Operating net income $4,612$3,380$4,532$4,196$5,825 Total weighted average diluted shares of common stock 19.698.258 19.573,350 19.611,897 19.639.682 19.940.606 Operating diluted net income per common share: $0.23$0.17$0.23$0.21$0.29 Tangible Com m on Equity/Tangible Assets (1) Tangible stockholders' equity $195.011$191,968$182.884$183.685$183.858 Tan gible total assets (3)$2.489,142$2.339.093$2.244.602$2.225,914$2,163.821 Tangible Common Equity/Tangible Assets 7.83% 8.21% 8.15% 8.25% 8.50% 1. The Company believes these non-GAAP measurements are key indicators of the ongoing earnings pew er of the Company. 2. Excludes the dilutive effect if any. of shares of common stock issuable upon exercise of outstanding stock options. 3. Since the Company has no intangible assets, tangible total assets is the same amount as total assets calculated under GAAP 20
CONTACT INFORMATION LOU DE LA AGUILERA Chairman, President & CEO (305) 715-5186 laguilera@uscentury.com ROB ANDERSON EVP, Chief Financial Officer (305) 715-5393 rob.anderson@uscentury.com INVESTOR RELATIONS InvestorRelations@uscentury.com 21