| | | FREE WRITING PROSPECTUS |
| | | FILED PURSUANT TO RULE 433 |
| | | REGISTRATION FILE NO.: 333-261279-01 |
| | | |
BANK 2022-BNK39
Free Writing Prospectus
Structural and Collateral Term Sheet
$1,200,927,306
(Approximate Total Mortgage Pool Balance)
$1,006,827,000
(Approximate Offered Certificates)
Banc of America Merrill Lynch Commercial Mortgage Inc.
as Depositor
Morgan Stanley Mortgage Capital Holdings LLC
Wells Fargo Bank, National Association
Bank of America, National Association
National Cooperative Bank, N.A.
as Sponsors and Mortgage Loan Sellers
Commercial Mortgage Pass-Through Certificates
Series 2022-BNK39
January 18, 2022
BofA SECURITIES
Co-Lead Bookrunner Manager
Academy Securities, Inc.
Co-Manager | WELLS FARGO SECURITIES
Co-Lead Bookrunner Manager | MORGAN STANLEY
Co-Lead Bookrunner Manager
Drexel Hamilton
Co-Manager |
| | | |
| | | |
STATEMENT REGARDING THIS FREE WRITING PROSPECTUS
The depositor has filed a registration statement (including a prospectus) with the SEC (File No. 333-261279) for the offering to which this communication relates. Before you invest, you should read the prospectus in that registration statement and other documents the depositor has filed with the SEC for more complete information about the depositor, the issuing entity and this offering. You may get these documents for free by visiting EDGAR on the SEC web site at www.sec.gov. Alternatively, the depositor or any underwriter or any dealer participating in the offering will arrange to send you the prospectus if you request it by calling toll free 1-866-294-1322 or by email to dg.Prospectus_Requests@baml.com.
This is not a research report and was not prepared by any Underwriter’s research department. Please see additional important information and qualifications at the end of this Term Sheet. |
| | | |
Neither this Term Sheet nor anything contained herein shall form the basis for any contract or commitment whatsoever. The information contained herein is preliminary as of the date hereof. This Term Sheet is subject to change, completion or amendment from time to time. The information contained herein supersedes information in any other communication relating to the securities described herein; provided, that the information contained herein will be superseded by similar information delivered to you as part of the Preliminary Prospectus. The information contained herein should be reviewed only in conjunction with the entire Preliminary Prospectus. All of the information contained herein is subject to the same limitations and qualifications contained in the Preliminary Prospectus. The information contained herein does not contain all relevant information relating to the underlying mortgage loans or mortgaged properties. Such information is described in the Preliminary Prospectus. The information contained herein will be more fully described in the Preliminary Prospectus. The information contained herein should not be viewed as projections, forecasts, predictions or opinions with respect to value. Prior to making any investment decision, prospective investors are strongly urged to read the Preliminary Prospectus in its entirety. Neither the Securities and Exchange Commission nor any state securities commission has approved or disapproved of these securities or determined if this Term Sheet is truthful or complete. Any representation to the contrary is a criminal offense.
BofA Securities is the marketing name for the global banking and global markets businesses of Bank of America Corporation. Lending, derivatives, and other commercial banking activities are performed globally by banking affiliates of Bank of America Corporation, including Bank of America, N.A., member FDIC. Securities, strategic advisory, and other investment banking activities are performed globally by investment banking affiliates of Bank of America Corporation, including, in the United States, BofA Securities, Inc., which is a registered broker-dealer and member of the Financial Industry Regulatory Authority (“FINRA”) and the Securities Investor Protection Corporation (“SIPC”), and, in other jurisdictions, locally registered entities.
Wells Fargo Securities is the trade name for the capital markets and investment banking services of Wells Fargo & Company and its subsidiaries, including but not limited to Wells Fargo Securities, LLC, a member of the New York Stock Exchange, FINRA, the National Futures Association (“NFA”) and SIPC, Wells Fargo Prime Services, LLC, a member of FINRA, NFA and SIPC, and Wells Fargo Bank, National Association. Wells Fargo Securities, LLC and Wells Fargo Prime Services, LLC are distinct entities from affiliated banks and thrifts.
IMPORTANT NOTICE RELATING TO AUTOMATICALLY GENERATED EMAIL DISCLAIMERS
Any legends, disclaimers or other notices that may appear at the bottom of, or attached to, the email communication to which this Term Sheet may have been attached are not applicable to this Term Sheet and should be disregarded. Such legends, disclaimers or other notices have been automatically generated as a result of this Term Sheet having been sent via Bloomberg or another email system.
IMPORTANT NOTICE REGARDING THE CONDITIONS FOR THIS OFFERING OF ASSET-BACKED SECURITIES
THE ASSET-BACKED SECURITIES REFERRED TO IN THIS TERM SHEET ARE BEING OFFERED WHEN, AS AND IF ISSUED. IN PARTICULAR, YOU ARE ADVISED THAT THE ASSET-BACKED SECURITIES, AND THE ASSET POOL BACKING THEM, ARE SUBJECT TO MODIFICATION OR REVISION (INCLUDING, AMONG OTHER THINGS, THE POSSIBILITY THAT ONE OR MORE CLASSES OF SECURITIES MAY BE SPLIT, COMBINED OR ELIMINATED), AT ANY TIME PRIOR TO ISSUANCE OR AVAILABILITY OF A FINAL PROSPECTUS. AS A RESULT, YOU MAY COMMIT TO PURCHASE SECURITIES THAT HAVE CHARACTERISTICS THAT MAY CHANGE, AND YOU ARE ADVISED THAT ALL OR A PORTION OF THE SECURITIES MAY NOT BE ISSUED THAT HAVE THE CHARACTERISTICS DESCRIBED IN THIS TERM SHEET. OUR OBLIGATION TO SELL SECURITIES TO YOU IS CONDITIONED ON THE SECURITIES AND THE UNDERLYING TRANSACTION HAVING THE CHARACTERISTICS DESCRIBED IN THIS TERM SHEET. IF WE DETERMINE THAT THE FOREGOING CONDITION IS NOT SATISFIED IN ANY MATERIAL RESPECT, WE WILL NOTIFY YOU, AND NEITHER THE ISSUING ENTITY NOR ANY UNDERWRITER WILL HAVE ANY OBLIGATION TO YOU TO DELIVER ALL OR ANY PORTION OF THE SECURITIES WHICH YOU HAVE COMMITTED TO PURCHASE, AND THERE WILL BE NO LIABILITY BETWEEN US AS A CONSEQUENCE OF THE NON-DELIVERY.
This is not a research report and was not prepared by any Underwriter’s research department. Please see additional important information and qualifications at the end of this Term Sheet. |
| | T-2 | |
| BANK 2022-BNK39 | Structural Overview |
Offered Certificates
| | | | | | | | | |
| | | | | | | | | |
| Class | Expected Ratings
(Fitch/Moody’s/DBRS
Morningstar)(1) | Approximate Initial
Certificate Balance
or Notional
Amount(2) | Approximate
Initial Credit
Support(3) | | Pass-Through
Rate
Description | Expected
Weighted
Average Life
(Years)(4) | Expected Principal
Window
(Months)(4) | Certificate
Principal UW NOI
Debt
Yield(5) | Certificate
Principal
to Value
Ratio(6) |
| Class A-1 | AAAsf/Aaa(sf)/AAA(sf) | $12,669,000 | 30.000% | | (7) | 2.85 | 1 – 58 | 19.1% | 36.6% |
| Class A-2 | AAAsf/Aaa(sf)/AAA(sf) | $2,824,000 | 30.000% | | (7) | 4.85 | 58 – 58 | 19.1% | 36.6% |
| Class A-SB | AAAsf/Aaa(sf)/AAA(sf) | $24,138,000 | 30.000% | | (7) | 7.41 | 58 – 116 | 19.1% | 36.6% |
| Class A-3(8) | AAAsf/Aaa(sf)/AAA(sf) | (8)(9) | 30.000% | | (7)(8) | (9) | (9) | 19.1% | 36.6% |
| Class A-4(8) | AAAsf/Aaa(sf)/AAA(sf) | (8)(9) | 30.000% | | (7)(8) | (9) | (9) | 19.1% | 36.6% |
| Class X-A | AAAsf/Aaa(sf)/AAA(sf) | $798,616,000(10) | N/A | | Variable IO(11) | N/A | N/A | N/A | N/A |
| Class X-B | AA-sf/Aa2(sf)/AAA(sf) | $159,723,000(10) | N/A | | Variable IO(11) | N/A | N/A | N/A | N/A |
| Class A-S(8) | AAAsf/Aa1(sf)/AAA(sf) | $114,088,000(8) | 20.000% | | (7)(8) | 9.93 | 119 – 119 | 16.7% | 41.8% |
| Class B(8) | AA-sf/Aa3(sf)/AA(high)(sf) | $45,635,000(8) | 16.000% | | (7)(8) | 9.93 | 119 – 119 | 15.9% | 43.9% |
| Class C(8) | A-sf/A3(sf)/A(high)(sf) | $48,488,000(8) | 11.750% | | (7)(8) | 9.93 | 119 – 119 | 15.2% | 46.1% |
Privately Offered Certificates(12)
| | | | | | | | | |
| | | | | | | | | |
| Class | Expected Ratings
(Fitch/Moody’s/DBRS
Morningstar)(1) | Approximate Initial
Certificate Balance
or Notional
Amount(2) | Approximate
Initial Credit
Support(3) | | Pass-Through
Rate
Description | Expected
Weighted Average Life
(Years)(4) | Expected
Principal
Window
(Months)(4) | Certificate
Principal
UW NOI
Debt
Yield(5) | Certificate
Principal
to Value
Ratio(6) |
| Class X-D | BBB-sf/NR/BBB(high)(sf) | $54,192,000(10) | N/A | | Variable IO(11) | N/A | N/A | N/A | N/A |
| Class X-F | BB-sf/NR/BBB(low)(sf) | $27,096,000(10) | N/A | | Variable IO(11) | N/A | N/A | N/A | N/A |
| Class X-G | B-sf/NR/BB(sf) | $11,409,000(10) | N/A | | Variable IO(11) | N/A | N/A | N/A | N/A |
| Class X-H | NR/NR/NR | $41,356,941(10) | N/A | | Variable IO(11) | N/A | N/A | N/A | N/A |
| Class D | BBBsf/NR/A(low)(sf) | $28,522,000 | 9.250% | | (7) | 9.93 | 119 – 119 | 14.7% | 47.4% |
| Class E | BBB-sf/NR/BBB(sf) | $25,670,000 | 7.000% | | (7) | 9.93 | 119 – 119 | 14.4% | 48.6% |
| Class F | BB-sf/NR/BB(high)(sf) | $27,096,000 | 4.625% | | (7) | 9.93 | 119 – 119 | 14.0% | 49.8% |
| Class G | B-sf/NR/BB(low)(sf) | $11,409,000 | 3.625% | | (7) | 9.93 | 119 – 119 | 13.9% | 50.3% |
| Class H | NR/NR/NR | $41,356,941 | 0.000% | | (7) | 9.98 | 119 – 120 | 13.4% | 52.2% |
Non-Offered Eligible Vertical Interest(12)
| Class | Expected Ratings
(Fitch/Moody’s/DBRS
Morningstar)(1) | Approximate
Initial Certificate
Balance or
Notional
Amount(2) | Approximate
Initial Credit
Support(3) | | Pass-
Through
Rate
Description | Expected
Weighted
Average Life
(Years)(4) | Expected
Principal
Window
(Months)(4) | Certificate
Principal
UW NOI
Debt
Yield(5) | Certificate
Principal
to Value
Ratio(6) |
| RR Interest | NR/NR/NR | $60,046,365.32 | N/A | | (13) | 9.74 | 1 – 120 | N/A | N/A |
| (1) | Ratings shown are those of Fitch Ratings, Inc. (“Fitch”), Moody’s Investors Service, Inc. (“Moody’s”) and DBRS, Inc. (“DBRS Morningstar”). Certain nationally recognized statistical rating organizations that were not hired by the depositor may use information they receive pursuant to Rule 17g-5 under the Securities Exchange Act of 1934, as amended, or otherwise to rate the certificates. There can be no assurance as to what ratings a non-hired nationally recognized statistical rating organization would assign. See “Risk Factors—Other Risks Relating to the Certificates—Nationally Recognized Statistical Rating Organizations May Assign Different Ratings to the Certificates; Ratings of the Certificates Reflect Only the Views of the Applicable Rating Agencies as of the Dates Such Ratings Were Issued; Ratings May Affect ERISA Eligibility; Ratings May Be Downgraded” and “Ratings” in the Preliminary Prospectus to be dated on or about the date hereof (the “Preliminary Prospectus”). Capitalized terms used but not defined herein have the meanings assigned to such terms in the Preliminary Prospectus. |
| (2) | Approximate, subject to a permitted variance of plus or minus 5% and further subject to the discussion in footnote (9) below. In addition, the notional amounts of the Class X-A, Class X-B, Class X-D, Class X-F, Class X-G and Class X-H certificates may vary depending upon the final pricing of the classes of principal balance certificates or trust components whose certificate or principal balances comprise such notional amounts, and, if as a result of such pricing the pass-through rate of any class of the Class X-A, Class X-B, Class X-D, Class X-F, Class X-G or Class X-H certificates, as applicable, would be equal to zero at all times, such class of certificates will not be issued on the closing date of this securitization. |
| (3) | The approximate initial credit support percentages set forth for the certificates are approximate and, for the Class A-1, Class A-2, Class A-SB, Class A-3 and Class A-4 certificates, are presented in the aggregate, taking into account the principal balances of the Class A-3 and Class A-4 trust components. The approximate initial credit support percentage set forth for each class of the Class A-S, Class B and Class C certificates represents the approximate credit support for the underlying trust component with the same alphanumeric designation. The RR Interest provides credit support only to the limited extent that it is allocated a portion of any losses incurred on the underlying mortgage loans, which such losses are allocated between it, on the one hand, and to the Non-Retained Certificates, on the other hand, pro rata in accordance with their respective Percentage Allocation Entitlements (as defined below). See “Credit Risk Retention” in the Preliminary Prospectus. |
This is not a research report and was not prepared by any Underwriter’s research department. Please see additional important information and qualifications at the end of this Term Sheet. |
| | T-3 | |
| BANK 2022-BNK39 | Structural Overview |
| (4) | The Expected Weighted Average Life and Expected Principal Window during which distributions of principal would be received as set forth in the foregoing table with respect to each class of certificates having a certificate balance are based on the assumptions set forth under “Yield and Maturity Considerations—Weighted Average Life” in the Preliminary Prospectus and on the assumptions that there are no prepayments, modifications or losses in respect of the mortgage loans and that there are no extensions or forbearances of maturity dates or anticipated repayment dates of the mortgage loans. |
| (5) | Certificate Principal UW NOI Debt Yield for any class of principal balance certificates shown in the table above (other than the RR Interest) is calculated as the product of (a) the weighted average UW NOI Debt Yield for the mortgage pool, multiplied by (b) a fraction, the numerator of which is the aggregate initial certificate or principal balance of all the principal balance certificates, and the denominator of which is the sum of (x) the aggregate initial certificate or principal balance of the subject class of principal balance certificates (or, with respect to the Class A-3, Class A-4, Class A-S, Class B or Class C certificates, the trust component with the same alphanumeric designation) and all other classes of principal balance certificates (other than the RR Interest), if any, that are senior to such class and (y) the outstanding certificate balance of the RR Interest, multiplied by the applicable RR Interest Computation Percentage. The Certificate Principal UW NOI Debt Yields of the Class A-1, Class A-2, Class A-SB, Class A-3 and Class A-4 certificates are calculated in the aggregate for those classes as if they were a single class. With respect to any class of principal balance certificates, the “RR Interest Computation Percentage” is equal to a fraction, expressed as a percentage, the numerator of which is the total initial certificate or principal balance of the subject class of principal balance certificates (or, with respect to the Class A-3, Class A-4, Class A-S, Class B or Class C certificates, the trust component with the same alphanumeric designation) and all other classes of principal balance certificates (other than the RR Interest), if any, that are senior to such class, and the denominator of which is the sum of the aggregate initial certificate or principal balance of all the principal balance certificates (other than the RR Interest). |
| (6) | Certificate Principal to Value Ratio for any class of principal balance certificates shown in the table above (other than the RR Interest) is calculated as the product of (a) the weighted average Cut-off Date LTV Ratio of the mortgage pool, multiplied by (b) a fraction, the numerator of which is the sum of (x) the aggregate initial certificate or principal balance of the subject class of principal balance certificates (or, with respect to the Class A-3, Class A-4, Class A-S, Class B or Class C certificates, the trust component with the same alphanumeric designation) and all other classes of principal balance certificates (other than the RR Interest), if any, that are senior to such class and (y) the outstanding certificate balance of the RR Interest, multiplied by the applicable RR Interest Computation Percentage, and the denominator of which is the aggregate initial certificate or principal balance of all the principal balance certificates. The Certificate Principal to Value Ratios of the Class A-1, Class A-2, Class A-SB, Class A-3 and Class A-4 certificates are calculated in the aggregate for those classes as if they were a single class. |
| (7) | The pass-through rate for each class of the Class A-1, Class A-2, Class A-SB, Class A-3, Class A-4, Class A-S, Class B, Class C, Class D, Class E, Class F, Class G and Class H certificates will be one of the following: (i) a fixed rate per annum, (ii) a variable rate per annum equal to the weighted average of the net mortgage interest rates on the mortgage loans for the related distribution date, (iii) a variable rate per annum equal to the lesser of (a) a fixed rate and (b) the weighted average of the net mortgage interest rates on the mortgage loans for the related distribution date or (iv) a variable rate per annum equal to the weighted average of the net mortgage interest rates on the mortgage loans for the related distribution date minus a specified percentage. For purposes of the calculation of the weighted average of the net mortgage interest rates on the mortgage loans for each distribution date, the net mortgage interest rates will be adjusted as necessary to a 30/360 basis. |
| (8) | The Class A-3-1, Class A-3-2, Class A-3-X1, Class A-3-X2, Class A-4-1, Class A-4-2, Class A-4-X1, Class A-4-X2, Class A-S-1, Class A-S-2, Class A-S-X1, Class A-S-X2, Class B-1, Class B-2, Class B-X1, Class B-X2, Class C-1, Class C-2, Class C-X1 and Class C-X2 certificates are also offered certificates. Such classes of certificates, together with the Class A-3, Class A-4, Class A-S, Class B and Class C certificates, constitute the “Exchangeable Certificates”. The Class A-1, Class A-2, Class A-SB, Class D, Class E, Class F, Class G and Class H certificates, together with the RR Interest and the Exchangeable Certificates with a certificate balance, are referred to as the “principal balance certificates.” Each class of Exchangeable Certificates will have the certificate balance or notional amount and pass-through rate described below under “Exchangeable Certificates.” Each class of Class A-3, Class A-4, Class A-S, Class B and Class C Exchangeable Certificates will have the same ratings as the Class A-3, Class A-4, Class A-S, Class B and Class C certificates, respectively, shown in the table above. |
| (9) | The exact initial principal balances or notional amounts of the Class A-3, Class A-3-X1, Class A-3-X2, Class A-4, Class A-4-X1 and Class A-4-X2 trust components (and consequently, the exact aggregate initial certificate balances or notional amounts of the Exchangeable Certificates with an “A-3” or “A-4” designation) are unknown and will be determined based on the final pricing of the certificates. However, the initial principal balances, weighted average lives and principal windows of the Class A-3 and Class A-4 trust components are expected to be within the applicable ranges reflected in the following chart. The aggregate initial principal balance of the Class A-3 and Class A-4 trust components is expected to be approximately $758,985,000, subject to a variance of plus or minus 5%. The Class A-3-X1 and Class A-3-X2 trust components will have initial notional amounts equal to the initial principal balance of the Class A-3 trust component. The Class A-4-X1 and Class A-4-X2 trust components will have initial notional amounts equal to the initial principal balance of the Class A-4 trust component. In the event that the Class A-4 trust component is issued with an initial certificate balance of $758,985,000, the Class A-3 trust component (and, correspondingly, the Class A-3 Exchangeable Certificates) will not be issued. |
| | Trust Components | Expected Range of Initial Principal
Balance | Expected Range of Weighted Average
Life (Years) | Expected Range of Principal Window
(Months) |
| | Class A-3 | $0 - $350,000,000 | NAP – 9.80 | NAP / 116 – 118 |
| | Class A-4 | $408,985,000 - $758,985,000 | 9.86 – 9.91 | 116 – 119 / 118 – 119 |
| (10) | The Class X-A, Class X-B, Class X-D, Class X-F, Class X-G and Class X-H certificates (collectively referred to as the “Class X certificates”) are notional amount certificates and will not be entitled to distributions of principal. The notional amount of the Class X-A certificates will be equal to the aggregate certificate or principal balance of the Class A-1, Class A-2 and Class A-SB certificates and the Class A-3 and Class A-4 trust components. The notional amount of the Class X-B certificates will be equal to the aggregate principal balance of the Class A-S and Class B trust components. The notional amount of the Class X-D certificates will be equal to the aggregate certificate balance of the Class D and Class E certificates. The notional amount of each class of the Class X-F, Class X-G and Class X-H certificates will be equal to the certificate balance of the class of principal balance certificates that, with the addition of “X-,” has the same alphabetical designation as the subject class of Class X certificates. |
| (11) | The pass-through rate for the Class X-A certificates for any distribution date will be a per annum rate equal to the excess, if any, of (a) the weighted average of the net mortgage interest rates on the mortgage loans for the related distribution date, over (b) the weighted average of the pass-through rates on the Class A-1, Class A-2 and Class A-SB certificates and the Class A-3, Class A-3-X1, Class A-3-X2, Class A-4, Class A-4-X1 and Class A-4-X2 trust components for the related distribution date, weighted on the basis of their respective certificate or principal balances or notional amounts outstanding immediately prior to that distribution date (but excluding trust components with a notional amount in the denominator of such weighted average calculation). The pass-through rate for the Class X-B certificates for any distribution date will be a per annum rate equal to the excess, if any, of (a) the weighted average of the net mortgage interest rates on the mortgage loans for the related distribution date, over (b) the weighted average of the pass-through rates on the Class A-S, Class A-S-X1, Class A-S-X2, Class B, Class B-X1 and Class B-X2 trust components for the related distribution date, weighted on the basis of their respective principal balances or notional amounts outstanding immediately prior to that distribution date (but excluding trust components with a notional amount in the denominator of such weighted average calculation). The pass-through rate for the Class X-D certificates for any distribution date will be a per annum rate equal to the excess, if any, of (a) the weighted average of the net mortgage interest rates on the mortgage loans for the related distribution date, over (b) the weighted average of the pass-through rates on the Class D and Class E certificates for the related distribution date, weighted on the basis of their respective certificate balances |
This is not a research report and was not prepared by any Underwriter’s research department. Please see additional important information and qualifications at the end of this Term Sheet. |
| | T-4 | |
| BANK 2022-BNK39 | Structural Overview |
| | outstanding immediately prior to that distribution date. The pass-through rate for each class of the Class X-F, Class X-G and Class X-H certificates for any distribution date will be a per annum rate equal to the excess, if any, of (a) the weighted average of the net mortgage interest rates on the mortgage loans for the related distribution date, over (b) the pass-through rate for the related distribution date on the class of principal balance certificates that, with the addition of “X-,” has the same alphabetical designation as the subject class of Class X certificates. For purposes of the calculation of the weighted average of the net mortgage interest rates on the mortgage loans for each distribution date, the net mortgage interest rates will be adjusted as necessary to a 30/360 basis. |
| (12) | Not offered pursuant to the Preliminary Prospectus or this Term Sheet. Information provided in this Term Sheet regarding the characteristics of these certificates is provided only to enhance your understanding of the offered certificates. The privately offered certificates also include the Class V and Class R certificates, which do not have a certificate balance, notional amount, credit support, pass-through rate, rating, assumed final distribution date or rated final distribution date, and which are not shown in the chart. The Class V certificates represent a beneficial ownership interest held through the grantor trust in a specified percentage of certain excess interest in respect of mortgage loans having anticipated repayment dates, if any. The Class R certificates represent the beneficial ownership of the residual interest in each of the real estate mortgage investment conduits, as further described in the Preliminary Prospectus. |
| (13) | Although it does not have a specified pass-through rate (other than for tax reporting purposes), the effective pass-through rate for the RR Interest will be a variable rate per annum equal to the weighted average of the net mortgage interest rates on the mortgage loans for the related distribution date (in each case adjusted, if necessary, to accrue on the basis of a 360-day year consisting of twelve 30-day months). |
This is not a research report and was not prepared by any Underwriter’s research department. Please see additional important information and qualifications at the end of this Term Sheet. |
| | T-5 | |
| BANK 2022-BNK39 | Structural Overview |
Issue Characteristics
| Offered Certificates: | $1,006,827,000 (approximate) monthly pay, multi-class, commercial mortgage pass-through certificates, consisting of 18 principal balance classes (Class A-1, Class A-2, Class A-SB, Class A-3, Class A-3-1, Class A-3-2, Class A-4, Class A-4-1, Class A-4-2, Class A-S, Class A-S-1, Class A-S-2, Class B, Class B-1, Class B-2, Class C, Class C-1 and Class C-2) and 12 interest-only classes (Class A-3-X1, Class A-3-X2, Class A-4-X1, Class A-4-X2, Class X-A, Class X-B, Class A-S-X1, Class A-S-X2, Class B-X1, Class B-X2, Class C-X1 and Class C-X2) |
Co-Lead Managers and Joint
Bookrunners: |
BofA Securities, Inc., Morgan Stanley & Co. LLC and Wells Fargo Securities, LLC |
| Co-Managers: | Academy Securities, Inc. and Drexel Hamilton, LLC |
| Mortgage Loan Sellers: | Morgan Stanley Mortgage Capital Holdings LLC, Wells Fargo Bank, National Association, Bank of America, National Association and National Cooperative Bank, N.A. |
| Rating Agencies: | Fitch, Moody’s and DBRS Morningstar |
| Master Servicers: | Wells Fargo Bank, National Association and National Cooperative Bank, N.A. |
| Special Servicers: | LNR Partners, LLC, National Cooperative Bank, N.A. and Situs Holdings, LLC |
| Certificate Administrator/ Certificate Registrar/Custodian: | Computershare Trust Company, N.A. |
| Trustee: | Wilmington Trust, National Association |
| Operating Advisor: | Park Bridge Lender Services LLC |
| Asset Representations Reviewer: | Park Bridge Lender Services LLC |
| Initial Directing Certificateholder: | Eightfold Real Estate Capital Fund V, L.P. or its affiliate |
| Risk Retention Consultation Party: | Bank of America, National Association |
| U.S. Credit Risk Retention: | For a discussion on the manner in which the U.S. credit risk retention requirements will be addressed by Bank of America, National Association, as the retaining sponsor, see “Credit Risk Retention” in the Preliminary Prospectus. |
| EU Risk Retention: | None of the sponsors, the depositor or the underwriters or their respective affiliates, or any other person, intends to retain a material net economic interest in the securitization constituted by the issue of the certificates, or to take any other action in respect of such securitization, in a manner prescribed or contemplated by the EU Securitization Regulation or the UK Securitization Regulation. In particular, no such person undertakes to take any action which may be required by any potential investor or certificateholder for the purposes of its compliance with any requirement of the EU Securitization Regulation or the UK Securitization Regulation. In addition, the arrangements described under “Credit Risk Retention” in the Preliminary Prospectus have not been structured with the objective of ensuring compliance by any person with any requirement of the EU Securitization Regulation or the UK Securitization Regulation. Consequently, the Offered Certificates may not be a suitable investment for investors that are subject to any requirement of the EU Securitization Regulation or the UK Securitization Regulation. See “Risk Factors—Other Risks Relating to the Certificates—EU Securitization Regulation and UK Securitization Regulation” in the Preliminary Prospectus. |
| Cut-off Date: | The mortgage loans will be considered part of the trust fund as of their respective cut-off dates. The cut-off date with respect to each mortgage loan is the respective due date for the monthly debt service payment that is due in February 2022 (or, in the case of any mortgage loan that has its first due date after February 2022, the date that would have been its due date in February 2022 under the terms of that mortgage loan if a monthly debt service payment were scheduled to be due in that month). |
| Expected Pricing Date: | Week of January 17, 2022 |
| Expected Closing Date: | February 10, 2022 |
| Determination Dates: | The 11th day of each month or, if the 11th day is not a business day, then the business day immediately following such 11th day. |
| Distribution Dates: | The 4th business day following each determination date. The first distribution date will be in March 2022. |
| Rated Final Distribution Date: | The distribution date in February 2055 |
| Interest Accrual Period: | Preceding calendar month |
| Payment Structure: | Sequential pay |
| Tax Treatment: | REMIC, except that the Exchangeable Certificates will evidence interests in a grantor trust |
| Optional Termination: | 1.00% clean-up call |
| Minimum Denominations: | $10,000 for each class of Offered Certificates (other than Class X-A and Class X-B certificates); $1,000,000 for the Class X-A and Class X-B certificates |
| Settlement Terms: | DTC, Euroclear and Clearstream |
This is not a research report and was not prepared by any Underwriter’s research department. Please see additional important information and qualifications at the end of this Term Sheet. |
| | T-6 | |
| BANK 2022-BNK39 | Structural Overview |
| Legal/Regulatory Status: | Each class of Offered Certificates is expected to be eligible for exemptive relief under ERISA. No class of Offered Certificates is SMMEA eligible. |
| Analytics: | The certificate administrator is expected to make available all distribution date statements, CREFC® reports and supplemental notices received by it to certain modeling financial services as described in the Preliminary Prospectus. |
| Bloomberg Ticker: | BANK 2022-BN39<MTGE><GO> |
| Risk Factors: | THE CERTIFICATES INVOLVE CERTAIN RISKS AND MAY NOT BE SUITABLE FOR ALL INVESTORS. SEE THE “RISK FACTORS” SECTION OF THE PRELIMINARY PROSPECTUS. |
This is not a research report and was not prepared by any Underwriter’s research department. Please see additional important information and qualifications at the end of this Term Sheet. |
| | T-7 | |
| BANK 2022-BNK39 | Structural Overview |
Structural Overview
Allocation Between the RR Interest
and the Non-Retained Certificates: | The aggregate amount available for distributions to the holders of the Certificates (including the RR Interest) on each distribution date (net of specified expenses of the issuing entity, including fees payable to, and costs and expenses reimbursable to, each applicable master servicer, primary servicer and special servicer, the certificate administrator, the trustee, the operating advisor, the asset representations reviewer and CREFC®) will be allocated between amounts available for distribution to the holders of the RR Interest, on the one hand, and to all other Certificates (other than the Class V and Class R Certificates), referred to herein as the “Non-Retained Certificates”, on the other hand. The portion of such amount allocable to (a) the RR Interest will at all times be the product of such amount multiplied by 5% and (b) the Non-Retained Certificates will at all times be the product of such amount multiplied by the difference between 100% and the percentage set forth in clause (a) (each, the respective “Percentage Allocation Entitlement”). |
| Accrual: | Each class of Offered Certificates will accrue interest on a 30/360 basis. |
| Amount and Order of Distributions: | On each distribution date, the Non-Retained Certificates’ Percentage Allocation Entitlement of funds available for distribution from the mortgage loans, net of (i) any yield maintenance charges and prepayment premiums and (ii) any excess interest, will be distributed in the following amounts and order of priority: First, to the Class A-1, Class A-2, Class A-SB, Class X-A, Class X-B, Class X-D, Class X-F, Class X-G and Class X-H certificates and the Class A-3, Class A-3-X1, Class A-3-X2, Class A-4, Class A-4-X1 and Class A-4-X2 trust components, in respect of interest, up to an amount equal to, and pro rata in accordance with, the interest entitlements for those classes of certificates and trust components; Second, to the Class A-1, Class A-2 and Class A-SB certificates and the Class A-3 and Class A-4 trust components as follows, to the extent of applicable available funds allocated to principal: either (i)(a) first, to principal on the Class A-SB certificates, until the certificate balance of the Class A-SB certificates is reduced to the planned principal balance for the related distribution date set forth in Annex E to the Preliminary Prospectus, and (b) second, to principal on the Class A-1 certificates, the Class A-2 certificates, the Class A-3 trust component, the Class A-4 trust component and the Class A-SB certificates, in that order, in each case until the certificate or principal balance of such class of certificates or trust component has been reduced to zero, or (ii) if the certificate or principal balance of each class of principal balance certificates and trust components other than the Class A-1, Class A-2 and Class A-SB certificates, the Class A-3 and Class A-4 trust components and the RR Interest has been reduced to zero as a result of the allocation of losses on the mortgage loans to those certificates, to principal on the Class A-1, Class A-2 and Class A-SB certificates and the Class A-3 and Class A-4 trust components, pro rata, without regard to the distribution priorities described above or the planned principal balance of the Class A-SB certificates; Third, to the Class A-1, Class A-2 and Class A-SB certificates and the Class A-3 and Class A-4 trust components, first, up to an amount equal to, and pro rata based on, any previously unreimbursed losses on the mortgage loans allocable to principal that were previously borne by each such class or trust component and then in the amount of interest thereon; Fourth, to the Class A-S, Class A-S-X1 and Class A-S-X2 trust components, as follows: (a) to each such trust component in respect of interest, up to an amount equal to, and pro rata in accordance with, the interest entitlements for those trust components; (b) to the extent of applicable available funds allocable to principal remaining after distributions in respect of principal to each class of certificates or trust component with a higher priority (as set forth in prior enumerated clauses set forth above), to principal on the Class A-S trust component until its principal balance has been reduced to zero; and (c) to reimburse the Class A-S trust component, first, in the amount of any previously unreimbursed losses on the mortgage loans that were previously allocated thereto, then in the amount of interest thereon; Fifth, to the Class B, Class B-X1 and Class B-X2 trust components, as follows: (a) to each such trust component in respect of interest, up to an amount equal to, and pro rata in accordance with, the interest entitlements for those trust components; (b) to the extent of applicable available funds allocable to principal remaining after distributions in respect of principal to each class of certificates or trust component with a higher priority (as set forth in prior enumerated clauses set forth above), to principal on the Class B trust component until its principal balance has been reduced to zero; and (c) to reimburse the Class B trust component, first, in the amount of any previously unreimbursed losses on the mortgage loans that were previously allocated thereto, then in the amount of interest thereon; Sixth, to the Class C, Class C-X1 and Class C-X2 trust components, as follows: (a) to each such trust component in respect of interest, up to an amount equal to, and pro rata in accordance with, the interest entitlements for those trust components; (b) to the extent of applicable available funds allocable to principal remaining after distributions in respect of principal to each class of certificates or trust component with a higher priority (as set forth in prior enumerated clauses set forth above), to principal on the Class C trust component until its principal balance has been reduced to zero; and (c) to reimburse the Class C trust component, first, in the amount of any previously unreimbursed losses on the mortgage loans that were previously allocated thereto, then in the amount of interest thereon; Seventh, to the Class D, Class E, Class F, Class G and Class H certificates in the amounts and order of priority described in “Description of the Certificates—Distributions” in the Preliminary Prospectus; and Eighth, to the Class R certificates, any remaining amounts. Principal and interest payable on each trust component will be distributed pro rata to the corresponding classes of Exchangeable Certificates representing interests therein in accordance with their Class Percentage Interests therein as described below under “Exchangeable Certificates.” |
This is not a research report and was not prepared by any Underwriter’s research department. Please see additional important information and qualifications at the end of this Term Sheet. |
| | T-8 | |
| BANK 2022-BNK39 | Structural Overview |
| Interest and Principal Entitlements: | The interest entitlement of each class of Offered Certificates on each distribution date generally will be the interest accrued during the related interest accrual period on the related certificate balance or notional amount at the related pass-through rate, net of any prepayment interest shortfalls allocated to that class for such distribution date as described below. If prepayment interest shortfalls arise from voluntary prepayments on serviced mortgage loans during any collection period, the applicable master servicer is required to make a limited compensating interest payment to offset those shortfalls. See “Description of the Certificates—Prepayment Interest Shortfalls” in the Preliminary Prospectus. The remaining amount of prepayment interest shortfalls will be allocated between the RR Interest, on one hand, and the Non-Retained Certificates, on the other hand, in accordance with their respective Percentage Allocation Entitlements. The prepayment interest shortfalls allocated to the Non-Retained Certificates will be allocated among such classes of certificates (other than the Exchangeable Certificates) and trust components that are entitled to interest, on a pro rata basis, based on their respective amounts of accrued interest for the related distribution date, to reduce the interest entitlement on each such class of certificates and trust components. For any distribution date, prepayment interest shortfalls allocated to a trust component will be allocated among the related classes of Exchangeable Certificates, pro rata, in accordance with their respective class percentage interests for that distribution date. If a class of certificates or trust component receives less than the entirety of its interest entitlement on any distribution date, then the shortfall (excluding any shortfall due to prepayment interest shortfalls), together with interest thereon, will be added to its interest entitlement for the next succeeding distribution date. The aggregate principal distribution amount for each distribution date generally will be the aggregate amount of principal received or advanced in respect of the mortgage loans, net of any non-recoverable advances and interest thereon and any workout-delayed reimbursement amounts that are reimbursed to the applicable master servicer or the trustee during the related collection period. Non-recoverable advances and interest thereon are reimbursable from principal collections before reimbursement from other amounts. Workout-delayed reimbursement amounts will be reimbursable from principal collections. The Non-Retained Certificates and the RR Interest will be entitled to their respective Percentage Allocation Entitlements of the aggregate principal distribution amount. |
Exchangeable Certificates: | Certificates of each class of Exchangeable Certificates may be exchanged for certificates of the corresponding classes of Exchangeable Certificates set forth next to such class in the table below, and vice versa. Following any exchange of certificates of one or more classes of Exchangeable Certificates (the applicable “Surrendered Classes”) for certificates of one or more classes of other Exchangeable Certificates (the applicable “Received Classes”), the Class Percentage Interests (as defined below) of the outstanding principal balances or notional amounts of the Corresponding Trust Components that are represented by the Surrendered Classes (and consequently their related certificate balances or notional amounts) will be decreased, and those of the Received Classes (and consequently their related certificate balances or notional amounts) will be increased. The dollar denomination of the certificates of each of the Received Classes must be equal to the dollar denomination of the certificates of each of the Surrendered Classes. No fee will be required with respect to any exchange of Exchangeable Certificates. |
| | Surrendered Classes (or Received Classes) of Certificates | Received Classes (or Surrendered Classes) of Certificates |
| | Class A-3 | Class A-3-1, Class A-3-X1 |
| | Class A-3 | Class A-3-2, Class A-3-X2 |
| | Class A-4 | Class A-4-1, Class A-4-X1 |
| | Class A-4 | Class A-4-2, Class A-4-X2 |
| | Class A-S | Class A-S-1, Class A-S-X1 |
| | Class A-S | Class A-S-2, Class A-S-X2 |
| | Class B | Class B-1, Class B-X1 |
| | Class B | Class B-2, Class B-X2 |
| | Class C | Class C-1, Class C-X1 |
| | Class C | Class C-2, Class C-X2 |
| | On the closing date, the issuing entity will issue the following “trust components,” each with the initial principal balance (or, if such trust component has an “X” suffix, notional amount) and pass-through rate set forth next to it in the table below. Each trust component with an “X” suffix will not be entitled to distributions of principal. |
| | Trust Component | Initial Principal Balance
or Notional Amount | Pass-Through Rate |
| | Class A-3 | See footnote (9) to the first table above under “Structural Overview” | Class A-3 certificate pass-through rate
minus 1.00% |
| | Class A-3-X1 | Equal to Class A-3 trust component principal balance | 0.50% |
| | Class A-3-X2 | Equal to Class A-3 trust component principal balance | 0.50% |
| | Class A-4 | See footnote (9) to the first table above under “Structural Overview” | Class A-4 certificate pass-through rate
minus 1.00% |
| | Class A-4-X1 | Equal to Class A-4 trust component principal balance | 0.50% |
| | Class A-4-X2 | Equal to Class A-4 trust component principal balance | 0.50% |
This is not a research report and was not prepared by any Underwriter’s research department. Please see additional important information and qualifications at the end of this Term Sheet. |
| | T-9 | |
| BANK 2022-BNK39 | Structural Overview |
| | Class A-S | $114,088,000 | Class A-S certificate pass-through rate
minus 1.00% |
| | Class A-S-X1 | Equal to Class A-S trust component
principal balance | 0.50% |
| | Class A-S-X2 | Equal to Class A-S trust component
principal balance | 0.50% |
| | Class B | $45,635,000 | Class B certificate pass-through rate
minus 1.00% |
| | Class B-X1 | Equal to Class B trust component
principal balance | 0.50% |
| | Class B-X2 | Equal to Class B trust component
principal balance | 0.50% |
| | Class C | $48,488,000 | Class C certificate pass-through rate
minus 1.00% |
| | Class C-X1 | Equal to Class C trust component
principal balance | 0.50% |
| | Class C-X2 | Equal to Class C trust component
principal balance | 0.50% |
| | Each class of Exchangeable Certificates represents an undivided beneficial ownership interest in the trust components set forth next to it in the table below (the “Corresponding Trust Components”). Each class of Exchangeable Certificates has a pass-through rate equal to the sum of the pass-through rates of the Corresponding Trust Components and represents a percentage interest (the related “Class Percentage Interest”) in each Corresponding Trust Component, including principal and interest payable thereon (and reimbursement of losses allocable thereto), equal to (x) the certificate balance (or, if such class has an “X” suffix, notional amount) of such class of certificates, divided by (y) the principal balance of the Class A-3 trust component (if such class of Exchangeable Certificates has an “A-3” designation), the Class A-4 trust component (if such class of Exchangeable Certificates has an “A-4” designation), the Class A-S trust component (if such class of Exchangeable Certificates has an “A-S” designation), the Class B trust component (if such class of Exchangeable Certificates has a “B” designation), or the Class C trust component (if such class of Exchangeable Certificates has a “C” designation). |
| | Group of Exchangeable Certificates | Class of Exchangeable Certificates | Corresponding Trust Components |
| | “Class A-3 Exchangeable Certificates” | Class A-3 | Class A-3, Class A-3-X1, Class A-3-X2 |
| | Class A-3-1 | Class A-3, Class A-3-X2 |
| | Class A-3-2 | Class A-3 |
| | Class A-3-X1 | Class A-3-X1 |
| | Class A-3-X2 | Class A-3-X1, Class A-3-X2 |
| | “Class A-4 Exchangeable Certificates” | Class A-4 | Class A-4, Class A-4-X1, Class A-4-X2 |
| | Class A-4-1 | Class A-4, Class A-4-X2 |
| | Class A-4-2 | Class A-4 |
| | Class A-4-X1 | Class A-4-X1 |
| | Class A-4-X2 | Class A-4-X1, Class A-4-X2 |
| | “Class A-S Exchangeable Certificates” | Class A-S | Class A-S, Class A-S-X1, Class A-S-X2 |
| | Class A-S-1 | Class A-S, Class A-S-X2 |
| | Class A-S-2 | Class A-S |
| | Class A-S-X1 | Class A-S-X1 |
| | Class A-S-X2 | Class A-S-X1, Class A-S-X2 |
| | “Class B Exchangeable Certificates” | Class B | Class B, Class B-X1, Class B-X2 |
| | Class B-1 | Class B, Class B-X2 |
| | Class B-2 | Class B |
| | Class B-X1 | Class B-X1 |
| | Class B-X2 | Class B-X1, Class B-X2 |
| | “Class C Exchangeable Certificates” | Class C | Class C, Class C-X1, Class C-X2 |
| | Class C-1 | Class C, Class C-X2 |
| | Class C-2 | Class C |
| | Class C-X1 | Class C-X1 |
| | Class C-X2 | Class C-X1, Class C-X2 |
| | The maximum certificate balance or notional amount of each class of Class A-3 Exchangeable Certificates, Class A-4 Exchangeable Certificates, Class A-S Exchangeable Certificates, Class B Exchangeable Certificates or Class C Exchangeable Certificates that could be issued in an exchange is equal to the principal balance of the Class A-3, Class A-4, Class A-S, Class B or Class C trust component, respectively. The maximum certificate balances of Class A-3, Class A-4, Class A-S, Class B and Class C certificates (subject to the constraint on the aggregate initial principal balance of the Class A-3 and Class A-4 trust components discussed in footnote (9) to the first table above under “Structural Overview”) will be issued on the closing date, and the certificate balance or notional amount of each other class of Exchangeable Certificates will be equal to zero on the closing date. |
This is not a research report and was not prepared by any Underwriter’s research department. Please see additional important information and qualifications at the end of this Term Sheet. |
| | T-10 | |
| BANK 2022-BNK39 | Structural Overview |
| | Each class of Class A-3 Exchangeable Certificates, Class A-4 Exchangeable Certificates, Class A-S Exchangeable Certificates, Class B Exchangeable Certificates and Class C Exchangeable Certificates will have a certificate balance or notional amount equal to its Class Percentage Interest multiplied by the principal balance of the Class A-3, Class A-4, Class A-S, Class B or Class C trust component, respectively. Each class of Class A-3 Exchangeable Certificates, Class A-4 Exchangeable Certificates, Class A-S Exchangeable Certificates, Class B Exchangeable Certificates and Class C Exchangeable Certificates with a certificate balance will have the same approximate initial credit support percentage, Expected Weighted Average Life, Expected Principal Window, Certificate Principal UW NOI Debt Yield and Certificate Principal to Value Ratio as the Class A-3, Class A-4, Class A-S, Class B or Class C certificates, respectively, shown above. |
| Special Servicer Compensation: | The principal compensation to be paid to a special servicer in respect of its special servicing activities will be the special servicing fee, the workout fee and the liquidation fee. The special servicing fee for each distribution date is calculated based on the outstanding principal balance of each serviced mortgage loan that is a specially serviced mortgage loan (and any related serviced companion loan) or as to which the related mortgaged property has become an REO property at the special servicing fee rate, which will be a rate equal to (a) other than with respect to National Cooperative Bank, N.A., the greater of 0.25000% and the per annum rate that would result in a special servicing fee for the related month of $5,000 and (b) with respect to National Cooperative Bank, N.A., the greater of 0.25000% per annum and the per annum rate that would result in a special servicing fee of $1,000 for the related month. The special servicing fee will be payable monthly, first, from liquidation proceeds, insurance and condemnation proceeds, and other collections in respect of the related specially serviced mortgage loan or REO property and, then, from general collections on all the mortgage loans and any REO properties. Each applicable special servicer will also be entitled to (i) liquidation fees generally equal to 1.0% (or, if such rate would result in an aggregate liquidation fee less than $25,000, then the liquidation fee rate will be equal to such rate as would result in an aggregate liquidation fee equal to $25,000) of liquidation proceeds and certain other collections in respect of a specially serviced mortgage loan (and any related serviced companion loan) or related REO property and of amounts received in respect of mortgage loan repurchases by the related mortgage loan sellers and (ii) workout fees generally equal to 1.0% of interest (other than post-ARD excess interest on mortgage loans with anticipated repayment dates and other than default interest) and principal payments made in respect of a rehabilitated mortgage loan (and any related serviced companion loan), subject to a floor of $25,000 with respect to any mortgage loan, whole loan or related REO property, and in the case of each of clause (i) and (ii), subject to certain adjustments and exceptions as described in the Preliminary Prospectus under “Pooling and Servicing Agreement—Servicing and Other Compensation and Payment of Expenses—Special Servicing Compensation”. With respect to any non-serviced mortgage loan, the related special servicer under the related other pooling and servicing agreement pursuant to which such mortgage loan is being serviced will be entitled to similar compensation as that described above with respect to such non-serviced mortgage loan under such other pooling and servicing agreement as further described in the Preliminary Prospectus, although any related fees may accrue at a different rate and there may be a higher (or no) cap on liquidation and workout fees. |
| Prepayment Premiums/Yield Maintenance Charges: | If any yield maintenance charge or prepayment premium is collected during any collection period with respect to any mortgage loan, then on the immediately succeeding distribution date, the certificate administrator will pay: |
| | (1) to the Non-Retained Certificates, in the following amounts: |
| | (a) to the holders of each class of the Class A-1, Class A-2, Class A-SB, Class A-3, Class A-3-1, Class A-3-2, Class A-4, Class A-4-1, Class A-4-2, Class A-S, Class A-S-1, Class A-S-2, Class B, Class B-1, Class B-2, Class C, Class C-1, Class C-2, Class D and Class E certificates, the product of (x) the Non-Retained Certificates’ Percentage Allocation Entitlement of such yield maintenance charge or prepayment premium, (y) the related Base Interest Fraction for such class and the applicable principal prepayment, and (z) a fraction, the numerator of which is equal to the amount of principal distributed to such class for that distribution date, and the denominator of which is the total amount of principal distributed to the Class A-1, Class A-2, Class A-SB, Class D and Class E certificates and the Class A-3 Exchangeable Certificates, the Class A-4 Exchangeable Certificates, the Class A-S Exchangeable Certificates, the Class B Exchangeable Certificates and the Class C Exchangeable Certificates for that distribution date, |
| | (b) to the holders of the Class A-3-X1 certificates, the product of (x) the Non-Retained Certificates’ Percentage Allocation Entitlement of such yield maintenance charge or prepayment premium, (y) a fraction, the numerator of which is equal to the amount of principal distributed to the Class A-3-1 certificates for that distribution date, and the denominator of which is the total amount of principal distributed to the Class A-1, Class A-2, Class A-SB, Class D and Class E certificates and the Class A-3 Exchangeable Certificates, the Class A-4 Exchangeable Certificates, the Class A-S Exchangeable Certificates, the Class B Exchangeable Certificates and the Class C Exchangeable Certificates for that distribution date, and (z) the difference between (1) the Base Interest Fraction for the Class A-3 certificates and the applicable principal prepayment and (2) the Base Interest Fraction for the Class A-3-1 certificates and the applicable principal prepayment, |
| | (c) to the holders of the Class A-3-X2 certificates, the product of (x) the Non-Retained Certificates’ Percentage Allocation Entitlement of such yield maintenance charge or prepayment premium, (y) a fraction, the numerator of which is equal to the amount of principal distributed to the Class A-3-2 certificates for that distribution date, and the denominator of which is the total amount of principal |
This is not a research report and was not prepared by any Underwriter’s research department. Please see additional important information and qualifications at the end of this Term Sheet. |
| | T-11 | |
| BANK 2022-BNK39 | Structural Overview |
| | distributed to the Class A-1, Class A-2, Class A-SB, Class D and Class E certificates and the Class A-3 Exchangeable Certificates, the Class A-4 Exchangeable Certificates, the Class A-S Exchangeable Certificates, the Class B Exchangeable Certificates and the Class C Exchangeable Certificates for that distribution date, and (z) the difference between (1) the Base Interest Fraction for the Class A-3 certificates and the applicable principal prepayment and (2) the Base Interest Fraction for the Class A-3-2 certificates and the applicable principal prepayment, |
| | (d) to the holders of the Class A-4-X1 certificates, the product of (x) the Non-Retained Certificates’ Percentage Allocation Entitlement of such yield maintenance charge or prepayment premium, (y) a fraction, the numerator of which is equal to the amount of principal distributed to the Class A-4-1 certificates for that distribution date, and the denominator of which is the total amount of principal distributed to the Class A-1, Class A-2, Class A-SB, Class D and Class E certificates and the Class A-3 Exchangeable Certificates, the Class A-4 Exchangeable Certificates, the Class A-S Exchangeable Certificates, the Class B Exchangeable Certificates and the Class C Exchangeable Certificates for that distribution date, and (z) the difference between (1) the Base Interest Fraction for the Class A-4 certificates and the applicable principal prepayment and (2) the Base Interest Fraction for the Class A-4-1 certificates and the applicable principal prepayment, |
| | (e) to the holders of the Class A-4-X2 certificates, the product of (x) the Non-Retained Certificates’ Percentage Allocation Entitlement of such yield maintenance charge or prepayment premium, (y) a fraction, the numerator of which is equal to the amount of principal distributed to the Class A-4-2 certificates for that distribution date, and the denominator of which is the total amount of principal distributed to the Class A-1, Class A-2, Class A-SB, Class D and Class E certificates and the Class A-3 Exchangeable Certificates, the Class A-4 Exchangeable Certificates, the Class A-S Exchangeable Certificates, the Class B Exchangeable Certificates and the Class C Exchangeable Certificates for that distribution date, and (z) the difference between (1) the Base Interest Fraction for the Class A-4 certificates and the applicable principal prepayment and (2) the Base Interest Fraction for the Class A-4-2 certificates and the applicable principal prepayment, |
| | (f) to the holders of the Class A-S-X1 certificates, the product of (x) the Non-Retained Certificates’ Percentage Allocation Entitlement of such yield maintenance charge or prepayment premium, (y) a fraction, the numerator of which is equal to the amount of principal distributed to the Class A-S-1 certificates for that distribution date, and the denominator of which is the total amount of principal distributed to the Class A-1, Class A-2, Class A-SB, Class D and Class E certificates and the Class A-3 Exchangeable Certificates, the Class A-4 Exchangeable Certificates, the Class A-S Exchangeable Certificates, the Class B Exchangeable Certificates and the Class C Exchangeable Certificates for that distribution date, and (z) the difference between (1) the Base Interest Fraction for the Class A-S certificates and the applicable principal prepayment and (2) the Base Interest Fraction for the Class A-S-1 certificates and the applicable principal prepayment, |
| | (g) to the holders of the Class A-S-X2 certificates, the product of (x) the Non-Retained Certificates’ Percentage Allocation Entitlement of such yield maintenance charge or prepayment premium, (y) a fraction, the numerator of which is equal to the amount of principal distributed to the Class A-S-2 certificates for that distribution date, and the denominator of which is the total amount of principal distributed to the Class A-1, Class A-2, Class A-SB, Class D and Class E certificates and the Class A-3 Exchangeable Certificates, the Class A-4 Exchangeable Certificates, the Class A-S Exchangeable Certificates, the Class B Exchangeable Certificates and the Class C Exchangeable Certificates for that distribution date, and (z) the difference between (1) the Base Interest Fraction for the Class A-S certificates and the applicable principal prepayment and (2) the Base Interest Fraction for the Class A-S-2 certificates and the applicable principal prepayment, |
| | (h) to the holders of the Class B-X1 certificates, the product of (x) the Non-Retained Certificates’ Percentage Allocation Entitlement of such yield maintenance charge or prepayment premium, (y) a fraction, the numerator of which is equal to the amount of principal distributed to the Class B-1 certificates for that distribution date, and the denominator of which is the total amount of principal distributed to the Class A-1, Class A-2, Class A-SB, Class D and Class E certificates and the Class A-3 Exchangeable Certificates, the Class A-4 Exchangeable Certificates, the Class A-S Exchangeable Certificates, the Class B Exchangeable Certificates and the Class C Exchangeable Certificates for that distribution date, and (z) the difference between (1) the Base Interest Fraction for the Class B certificates and the applicable principal prepayment and (2) the Base Interest Fraction for the Class B-1 certificates and the applicable principal prepayment, |
| | (i) to the holders of the Class B-X2 certificates, the product of (x) the Non-Retained Certificates’ Percentage Allocation Entitlement of such yield maintenance charge or prepayment premium, (y) a fraction, the numerator of which is equal to the amount of principal distributed to the Class B-2 certificates for that distribution date, and the denominator of which is the total amount of principal distributed to the Class A-1, Class A-2, Class A-SB, Class D and Class E certificates and the Class A-3 Exchangeable Certificates, the Class A-4 Exchangeable Certificates, the Class A-S Exchangeable Certificates, the Class B Exchangeable Certificates and the Class C Exchangeable Certificates for that distribution date, and (z) the difference between (1) the Base Interest Fraction for the Class B certificates and the applicable principal prepayment and (2) the Base Interest Fraction for the Class B-2 certificates and the applicable principal prepayment, |
| | (j) to the holders of the Class C-X1 certificates, the product of (x) the Non-Retained Certificates’ Percentage Allocation Entitlement of such yield maintenance charge or prepayment premium, (y) a fraction, the numerator of which is equal to the amount of principal distributed to the Class C-1 |
This is not a research report and was not prepared by any Underwriter’s research department. Please see additional important information and qualifications at the end of this Term Sheet. |
| | T-12 | |
| BANK 2022-BNK39 | Structural Overview |
| | certificates for that distribution date, and the denominator of which is the total amount of principal distributed to the Class A-1, Class A-2, Class A-SB, Class D and Class E certificates and the Class A-3 Exchangeable Certificates, the Class A-4 Exchangeable Certificates, the Class A-S Exchangeable Certificates, the Class B Exchangeable Certificates and the Class C Exchangeable Certificates for that distribution date, and (z) the difference between (1) the Base Interest Fraction for the Class C certificates and the applicable principal prepayment and (2) the Base Interest Fraction for the Class C-1 certificates and the applicable principal prepayment, |
| | (k) to the holders of the Class C-X2 certificates, the product of (x) the Non-Retained Certificates’ Percentage Allocation Entitlement of such yield maintenance charge or prepayment premium, (y) a fraction, the numerator of which is equal to the amount of principal distributed to the Class C-2 certificates for that distribution date, and the denominator of which is the total amount of principal distributed to the Class A-1, Class A-2, Class A-SB, Class D and Class E certificates and the Class A-3 Exchangeable Certificates, the Class A-4 Exchangeable Certificates, the Class A-S Exchangeable Certificates, the Class B Exchangeable Certificates and the Class C Exchangeable Certificates for that distribution date, and (z) the difference between (1) the Base Interest Fraction for the Class C certificates and the applicable principal prepayment and (2) the Base Interest Fraction for the Class C-2 certificates and the applicable principal prepayment, |
| | (l) to the holders of the Class X-A certificates, the excess, if any, of (x) the product of (1) the Non-Retained Certificates’ Percentage Allocation Entitlement of such yield maintenance charge or prepayment premium and (2) a fraction, the numerator of which is equal to the total amount of principal distributed to the Class A-1, Class A-2 and Class A-SB certificates and the Class A-3 Exchangeable Certificates and the Class A-4 Exchangeable Certificates for that distribution date, and the denominator of which is the total amount of principal distributed to the Class A-1, Class A-2, Class A-SB, Class D and Class E certificates and the Class A-3 Exchangeable Certificates, the Class A-4 Exchangeable Certificates, the Class A-S Exchangeable Certificates, the Class B Exchangeable Certificates and the Class C Exchangeable Certificates for that distribution date, over (y) the total amount of such yield maintenance charge or prepayment premium distributed to the Class A-1, Class A-2 and Class A-SB certificates and the Class A-3 Exchangeable Certificates and the Class A-4 Exchangeable Certificates as described above, |
| | (m) to the holders of the Class X-B certificates, the excess, if any, of (x) the product of (1) the Non-Retained Certificates’ Percentage Allocation Entitlement of such yield maintenance charge or prepayment premium and (2) a fraction, the numerator of which is equal to the total amount of principal distributed to the Class A-S Exchangeable Certificates and the Class B Exchangeable Certificates for that distribution date, and the denominator of which is the total amount of principal distributed to the Class A-1, Class A-2, Class A-SB, Class D and Class E certificates and the Class A-3 Exchangeable Certificates, the Class A-4 Exchangeable Certificates, the Class A-S Exchangeable Certificates, the Class B Exchangeable Certificates and the Class C Exchangeable Certificates for that distribution date, over (y) the total amount of such yield maintenance charge or prepayment premium distributed to the Class A-S Exchangeable Certificates and the Class B Exchangeable Certificates as described above, |
| | and (n) to the holders of the Class X-D certificates, any remaining portion of the Non-Retained Certificates’ Percentage Allocation Entitlement of such yield maintenance charge or prepayment premium not distributed as described above in this clause (1), |
| | and (2) to the RR Interest, its Percentage Allocation Entitlement of such yield maintenance charge or prepayment premium. All yield maintenance charges and prepayment premiums referred to above will be net of any liquidation fees payable therefrom. |
| | No yield maintenance charges or prepayment premiums will be distributed to the holders of the Class X-F, Class X-G, Class X-H, Class F, Class G, Class H, Class V or Class R Certificates. |
| | “Base Interest Fraction” means, with respect to any principal prepayment of any mortgage loan that provides for the payment of a yield maintenance charge or prepayment premium, and with respect to any class of principal balance certificates (other than the RR Interest), a fraction (A) the numerator of which is the greater of (x) zero and (y) the difference between (i) the pass-through rate on that class, and (ii) the applicable discount rate and (B) the denominator of which is the difference between (i) the mortgage interest rate on the related mortgage loan and (ii) the applicable discount rate; provided, that: under no circumstances will the Base Interest Fraction be greater than one; if the discount rate referred to above is greater than or equal to both the mortgage interest rate on the related mortgage loan and the pass-through rate on that class, then the Base Interest Fraction will equal zero; and if the discount rate referred to above is greater than or equal to the mortgage interest rate on the related mortgage loan and is less than the pass-through rate on that class, then the Base Interest Fraction will be equal to 1.0. |
| | Consistent with the foregoing, the Base Interest Fraction is equal to: |
| | | (Pass-Through Rate – Discount Rate) | |
| | | (Mortgage Rate – Discount Rate) | |
| Realized Losses: | On each distribution date, immediately following the distributions to be made to the certificateholders on that date, the certificate administrator is required to calculate the amount, if any, by which (i) the aggregate stated principal balance of the mortgage loans, including any successor REO loans, expected to be outstanding immediately following that distribution date is less than (ii) the then aggregate certificate balance of the principal |
This is not a research report and was not prepared by any Underwriter’s research department. Please see additional important information and qualifications at the end of this Term Sheet. |
| | T-13 | |
| BANK 2022-BNK39 | Structural Overview |
| | balance certificates after giving effect to distributions of principal on that distribution date. The Non-Retained Certificates’ Percentage Allocation Entitlement of such amount will be applied to the Class H, Class G, Class F, Class E and Class D certificates and the Class C, Class B and Class A-S trust components, in that order, in each case until the related certificate or principal balance has been reduced to zero, and then to the Class A-1, Class A-2 and Class A-SB certificates and the Class A-3 and Class A-4 trust components, pro rata based upon their respective certificate or principal balances, until their respective certificate or principal balances have been reduced to zero. The RR Interest’s Percentage Allocation Entitlement of such amount will be applied to the RR Interest until the related RR Interest balance has been reduced to zero. Any portion of such amount applied to the Class A-3, Class A-4, Class A-S, Class B or Class C trust component will reduce the certificate balance or notional amount of each class of certificates in the related group of Exchangeable Certificates by an amount equal to the product of (x) its certificate balance or notional amount, divided by the principal balance of such trust component prior to the applicable reduction, and (y) the amount applied to such trust component. |
| Serviced Whole Loans: | The following mortgaged property secures a mortgage loan and one or more pari passu promissory notes (a “serviced companion loan”) that will be serviced pursuant to the related intercreditor agreement and the pooling and servicing agreement for this transaction: 333 River Street. With respect to such mortgaged property, the related mortgage loan, together with the related serviced companion loan(s), is referred to herein (for so long as it is serviced under the pooling and servicing agreement for this transaction) as a “serviced whole loan.” Each serviced companion loan is not part of the mortgage pool and may be contributed to one or more future securitization transactions (if not already securitized) or may be otherwise transferred at any time, subject to compliance with the related intercreditor agreement. See the table below entitled “Mortgage Loans with Pari Passu Companion Loans” as well as “Description of the Mortgage Pool—The Whole Loans” in the Preliminary Prospectus, for additional information regarding each such whole loan. |
| Non-Serviced Whole Loans: | Each of the following mortgaged properties or portfolio of mortgaged properties secures a mortgage loan (each, a “non-serviced mortgage loan”), one or more pari passu promissory notes and, in some cases, one or more generally subordinate promissory notes (each such promissory note, a “non-serviced companion loan”) that will be serviced pursuant to the related intercreditor agreement and the pooling and servicing agreement or trust and servicing agreement (referred to herein as a related “pooling and servicing agreement”) for another securitization transaction: 601 Lexington Avenue, CX - 350 & 450 Water Street, One North Wacker, Park Avenue Plaza and 1201 Lake Robbins. With respect to each such mortgaged property or portfolio of mortgaged properties, the related mortgage loan, together with the related non-serviced companion loan(s), is referred to herein (for so long as it is serviced under the pooling and servicing agreement for another securitization transaction) as a “non-serviced whole loan.” Each non-serviced companion loan is not part of the mortgage pool and may be contributed to one or more future securitization transactions (if not already securitized) or may be otherwise transferred at any time, subject to compliance with the related intercreditor agreement. Servicing of each non-serviced whole loan will generally be directed by the holder of the related control note (or, if such control note is included in a securitization, the directing certificateholder thereunder (or other party designated thereunder to exercise the rights of such control note)), and such holder will have the right to replace the special servicer with respect to the related whole loan with or without cause. See the tables below entitled “Mortgage Loans with Pari Passu Companion Loans” and “Mortgage Loans with Subordinate Debt,” as well as “Description of the Mortgage Pool—The Whole Loans” in the Preliminary Prospectus, for additional information regarding each such whole loan. |
Directing Certificateholder/
Controlling Class: | The “Directing Certificateholder” will be the Controlling Class Certificateholder (or its representative) selected by more than 50% (by certificate balance) of the Controlling Class Certificateholders; provided, that (1) absent that selection, (2) until a Directing Certificateholder is so selected or (3) upon receipt of a notice from a majority of the Controlling Class Certificateholders (by certificate balance) that a Directing Certificateholder is no longer designated, the Controlling Class Certificateholder that owns the largest aggregate certificate balance of the Controlling Class (or its representative) will be the Directing Certificateholder; provided, that (a) in the case of clause (3), if no one holder owns the largest aggregate certificate balance of the Controlling Class, then there will be no Directing Certificateholder until appointed in accordance with the terms of the pooling and servicing agreement, and (b) the certificate administrator and the other parties to the pooling and servicing agreement will be entitled to assume that the identity of the Directing Certificateholder has not changed until such parties receive written notice of a replacement of the Directing Certificateholder from a party holding the requisite interest in the Controlling Class (as confirmed by the certificate registrar), or the resignation of the then current Directing Certificateholder. The “Controlling Class” will be, as of any time of determination, the most subordinate class of Control Eligible Certificates then outstanding that has an aggregate certificate balance (as notionally reduced by any Cumulative Appraisal Reduction Amounts (as defined below) allocable to such class) at least equal to 25% of the initial certificate balance of that class; provided, that if at any time the certificate balances of the certificates other than the Control Eligible Certificates and the RR Interest have been reduced to zero as a result of principal payments on the mortgage loans, then the Controlling Class will be the most subordinate class of Control Eligible Certificates that has a certificate balance greater than zero without regard to any Cumulative Appraisal Reduction Amounts. The Controlling Class as of the closing date will be the Class H certificates. The “Control Eligible Certificates” will be any of the Class G and Class H certificates. |
| Control Rights: | Prior to a Control Termination Event, the Directing Certificateholder will have certain consent and consultation rights under the pooling and servicing agreement with respect to certain major decisions and other matters. A “Control Termination Event” will occur when (i) the Class G certificates have a certificate balance (taking into account the application of the allocable portion of any Cumulative Appraisal Reduction Amounts to notionally reduce the certificate balance thereof) of less than 25% of the initial certificate balance of that class or (ii) a |
This is not a research report and was not prepared by any Underwriter’s research department. Please see additional important information and qualifications at the end of this Term Sheet. |
| | T-14 | |
| BANK 2022-BNK39 | Structural Overview |
| holder of the Class G certificates is the majority Controlling Class Certificateholder and has irrevocably waived its right, in writing, to exercise any of the rights of the Controlling Class Certificateholder and such rights have not been reinstated to a successor controlling class certificateholder; provided that a Control Termination Event will be deemed not continuing in the event that the certificate balances of the principal balance certificates other than the Control Eligible Certificates and the RR Interest have been reduced to zero as a result of principal payments on the mortgage loans. After the occurrence of a Control Termination Event but prior to the occurrence of a Consultation Termination Event, the Directing Certificateholder will not have any consent rights, but the Directing Certificateholder will have certain non-binding consultation rights under the pooling and servicing agreement with respect to certain major decisions and other matters. A “Consultation Termination Event” will occur when (i) no class of Control Eligible Certificates has a certificate balance (without regard to the application of the allocable portion of any Cumulative Appraisal Reduction Amounts) at least equal to 25% of the initial certificate balance of that class; or (ii) a holder of the Class G certificates is the majority Controlling Class Certificateholder and has irrevocably waived its right, in writing, to exercise any of the rights of the Controlling Class Certificateholder and such rights have not been reinstated to a successor controlling class certificateholder; provided that no Consultation Termination Event resulting solely from the operation of clause (ii) will be deemed to have existed or be in continuance with respect to a successor holder of the Class G certificates that has not irrevocably waived its right to exercise any of the rights of the Controlling Class Certificateholder; provided, further, that a Consultation Termination Event will be deemed not continuing in the event that the certificate balances of the principal balance certificates other than the Control Eligible Certificates and the RR Interest have been reduced to zero as a result of principal payments on the mortgage loans. In the event of any transfer of the Class G certificates by a Controlling Class Certificateholder that had irrevocably waived its rights, the successor Controlling Class Certificateholder that purchased such Class G certificates, even if it does not waive its rights, will not have any consent rights with respect to any Mortgage Loan that became a Specially Serviced Loan prior to such successor Controlling Class Certificateholder’s purchase of such Class G certificates and had not become a Corrected Loan prior to such purchase until such Mortgage Loan becomes a Corrected Loan. After the occurrence of a Consultation Termination Event, the Directing Certificateholder will not have any consent or consultation rights, except with respect to any rights expressly set forth in the pooling and servicing agreement, and the operating advisor will retain certain non-binding consultation rights under the pooling and servicing agreement with respect to certain major decisions and other matters. Notwithstanding the proviso to the definitions of “Control Termination Event” and “Consultation Termination Event”, a Control Termination Event and a Consultation Termination Event will each be deemed to have occurred with respect to any Excluded Loan with respect to the Directing Certificateholder or the holder of the majority of the Controlling Class, and neither the Directing Certificateholder nor any Controlling Class Certificateholder will have any consent or consultation rights with respect to the servicing of such Excluded Loan. An “Excluded Loan” means (a) with respect to the Directing Certificateholder or the holder of the majority of the Controlling Class, a mortgage loan or whole loan with respect to which, as of any date of determination, the Directing Certificateholder or the holder of the majority of the Controlling Class is a Borrower Party or (b) with respect to the Risk Retention Consultation Party or the holder of the majority of the RR Interest, a mortgage loan or whole loan with respect to which, as of any date of determination, the Risk Retention Consultation Party or the holder of the majority of the RR Interest is a Borrower Party. It is expected that there will be no Excluded Loans with respect to this securitization on the closing date. “Borrower Party” means a borrower, a mortgagor, a manager of a mortgaged property, the holder of a mezzanine loan that has been accelerated or as to which foreclosure or enforcement proceedings have been commenced against the equity collateral pledged to secure the related mezzanine loan, or any Borrower Party Affiliate. With respect to a mortgage loan secured by a residential cooperative property, a person will not be considered a “Borrower Party” solely by reason of such person holding one or more cooperative unit loans that are secured by direct equity interests in the related borrower or owning one or more residential cooperative units comprising the related mortgaged property as a result of any foreclosure, transfer in lieu of foreclosure or other exercise of remedies with respect to any such unit loan(s). “Borrower Party Affiliate” means, with respect to a borrower, a mortgagor, a manager of a mortgaged property or the holder of a mezzanine loan that has been accelerated or as to which foreclosure or enforcement proceedings have been commenced against the equity collateral pledged to secure the related mezzanine loan, (a) any other person controlling or controlled by or under common control with such borrower, mortgagor, manager or mezzanine lender, as applicable, or (b) any other person owning, directly or indirectly, 25% or more of the beneficial interests in such borrower, mortgagor, manager or mezzanine lender, as applicable. For the purposes of this definition, “control” when used with respect to any specified person means the power to direct the management and policies of such person, directly or indirectly, whether through the ownership of voting securities, by contract or otherwise and the terms “controlling” and “controlled” have meanings correlative to the foregoing. Notwithstanding any of the foregoing to the contrary, if any mortgage loan is part of a whole loan, the Directing Certificateholder’s consent and/or consultation rights with respect thereto may be limited as described in the Preliminary Prospectus. In particular, with respect to each non-serviced whole loan, the Directing Certificateholder will only have certain consultation rights with respect to certain major decisions and other matters related to such whole loan, in each case only prior to a Control Termination Event or Consultation Termination Event, as applicable. In addition, with respect to any serviced A/B whole loan, for so long as the holder of the related subordinate companion loan is the controlling note holder, the holder of such subordinate companion loan (rather than the Directing Certificateholder) will be entitled to exercise such consent and consultation rights with respect to such whole loan. |
This is not a research report and was not prepared by any Underwriter’s research department. Please see additional important information and qualifications at the end of this Term Sheet. |
| | T-15 | |
| BANK 2022-BNK39 | Structural Overview |
| Appraisal Reduction Amounts and Collateral Deficiency Amounts: | An “Appraisal Reduction Amount” generally will be created in the amount, if any, by which the principal balance of a required appraisal loan (which is a mortgage loan with respect to which certain defaults, modifications or insolvency events have occurred as further described in the Preliminary Prospectus) plus other amounts overdue or advanced in connection with such mortgage loan exceeds 90% of the appraised value of the related mortgaged property plus certain escrows and reserves (including letters of credit) held with respect to the mortgage loan. A mortgage loan will cease to be subject to an Appraisal Reduction Amount when it has been brought current for at least three consecutive months, no additional event of default is foreseeable in the reasonable judgment of the applicable special servicer and no other circumstances exist that would cause such mortgage loan or any related companion loan to be a specially serviced loan; however, a “Collateral Deficiency Amount” may exist with respect to any mortgage loan that is modified into an AB loan structure (an “AB Modified Loan”) and remains a corrected mortgage loan and, if so, will generally equal the excess of (i) the stated principal balance of such AB Modified Loan (taking into account the related junior note(s) and any pari passu notes included therein), over (ii) the sum of (in the case of a whole loan, solely to the extent allocable to the subject mortgage loan) (x) the most recent appraised value for the related mortgaged property or mortgaged properties, plus (y) solely to the extent not reflected or taken into account in such appraised value (or in the calculation of any related Appraisal Reduction Amount) and to the extent on deposit with, or otherwise under the control of, the lender as of the date of such determination, any capital or additional collateral contributed by the related borrower at the time the mortgage loan became (and as part of the modification related thereto) such AB Modified Loan for the benefit of the related mortgaged property or mortgaged properties (provided that in the case of an non-serviced mortgage loan, the amounts set forth in this clause (y) will be taken into account solely to the extent relevant information is received by the applicable special servicer), plus (z) any other escrows or reserves (in addition to any amounts set forth in the immediately preceding clause (y) and solely to the extent not reflected or taken into account in the calculation of any related Appraisal Reduction Amount) held by the lender in respect of such AB Modified Loan as of the date of such determination, which such excess, for the avoidance of doubt, will be determined separately from and exclude any related Appraisal Reduction Amounts. As used herein, a “Cumulative Appraisal Reduction Amount” will be the sum of any Appraisal Reduction Amounts and any Collateral Deficiency Amounts. Any Appraisal Reduction Amount in respect of any non-serviced mortgage loan generally will be calculated in accordance with the other servicing agreement pursuant to which such mortgage loan is being serviced, which calculations are expected to be generally similar to those provided for in the pooling and servicing agreement for this transaction. If any mortgage loan is part of a whole loan, any Appraisal Reduction Amount or Collateral Deficiency Amount will (or effectively will) be calculated in respect of such whole loan taken as a whole and allocated, to the extent provided in the related intercreditor agreement and the related pooling and servicing agreement, first, to any related subordinate companion loan, and second, to the related mortgage loan and any pari passu companion loan on a pro rata basis by unpaid principal balance. Appraisal Reduction Amounts will proportionately reduce the interest portion of debt service advances required to be made in respect of the related mortgage loan. Appraisal Reduction Amounts and Collateral Deficiency Amounts (in each case, to the extent of the Non-Retained Certificates’ Percentage Allocation Entitlement thereof) will be (i) taken into account in determining the identity of the controlling class entitled to appoint the Directing Certificateholder, the existence of a Control Termination Event and the allocation and/or exercise of voting rights for certain purposes (see “Directing Certificateholder/Controlling Class” above) and (ii) allocated to the following classes of certificates and trust components, in each case to notionally reduce their certificate balances or principal balances until the certificate balance or principal balance of each such class or trust component is notionally reduced to zero: the Class H, Class G, Class F, Class E and Class D certificates and the Class C, Class B and Class A-S trust components, in that order, and then pro rata to the Class A-1, Class A-2 and Class A-SB certificates and the Class A-3 and Class A-4 trust components. Appraisal Reduction Amounts and Collateral Deficiency Amounts allocated to the Class A-3, Class A-4, Class A-S, Class B or Class C trust component will be allocated to the corresponding classes of Exchangeable Certificates with certificate balances pro rata to notionally reduce their certificate balances in accordance with their Class Percentage Interests therein. Neither (i) a Payment Accommodation with respect to any mortgage loan or serviced whole loan nor (ii) any default or delinquency that would have existed but for such Payment Accommodation will constitute an appraisal reduction event, for so long as the related borrower is complying with the terms of such Payment Accommodation. A “Payment Accommodation” for any mortgage loan or serviced whole loan means the entering into of any temporary forbearance agreement as a result of the COVID-19 emergency (and qualification as a COVID-19 emergency forbearance will be determined by the special servicer in its sole and absolute discretion in accordance with the Servicing Standard) relating to payment obligations or operating covenants under the related mortgage loan documents or the use of funds on deposit in any reserve account or escrow account for any purpose other than the explicit purpose described in the related mortgage loan documents, that in each case (i) defers no greater than 3 monthly debt service payments (but no greater than 9 monthly debt service payments in the aggregate with any other Payment Accommodations) and (ii) requires full repayment of deferred payments, reserves and escrows by the date that is 24 months following the date of the first Payment Accommodation for such mortgage loan or serviced whole loan. For the avoidance of doubt, a Payment Accommodation may only be entered into by the applicable special servicer on behalf of the issuing entity in its sole and absolute discretion in accordance with the Servicing Standard subject to Directing Certificateholder consent as a major decision and the master servicer will have no processing, consent or other rights with respect thereto. No Payment Accommodation may be granted if the Mortgage Loan or Serviced Whole Loan is in default with respect to any loan provision other than the provision(s) subject to the forbearance request. |
This is not a research report and was not prepared by any Underwriter’s research department. Please see additional important information and qualifications at the end of this Term Sheet. |
| | T-16 | |
| BANK 2022-BNK39 | Structural Overview |
| Appraised-Out Class: | An “Appraised-Out Class” is any class of Control Eligible Certificates, the certificate balance of which (taking into account the application of the Non-Retained Certificates’ Percentage Allocation Entitlement of any Appraisal Reduction Amounts or Collateral Deficiency Amounts to notionally reduce the certificate balance of such class) has been reduced to less than 25% of its initial certificate balance. Any Appraised-Out Class may not exercise any direction, control, consent and/or similar rights of the Controlling Class until such time, if any, as such class is reinstated as the Controlling Class, and the rights of the Controlling Class will be exercised by the next most senior class of Control Eligible Certificates that is not an Appraised-Out Class, if any, during such period. |
| Appraisal Remedy: | The holders of the majority (by certificate balance) of an Appraised-Out Class (such holders, the “Requesting Holders”) will have the right, at their sole expense, to require the applicable special servicer to order (or, with respect to a non-serviced mortgage loan, require the applicable special servicer to request from the applicable non-serviced special servicer) a second appraisal of any mortgage loan (or serviced whole loan) for which an appraisal reduction event has occurred or as to which there exists a Collateral Deficiency Amount. With respect to any serviced mortgage loan, the applicable special servicer will be required to use its reasonable efforts to ensure that such appraisal is delivered within 30 days from receipt of the Requesting Holders’ written request and will be required to cause such appraisal to be prepared on an “as-is” basis by an MAI appraiser. With respect to any non-serviced mortgage loan, the applicable special servicer will be required to use commercially reasonable efforts to obtain such second appraisal from the applicable non-serviced special servicer. In addition, the Requesting Holders of any Appraised-Out Class will have the right to challenge the Appraisal Reduction Amount and to require the applicable special servicer to order an additional appraisal of any serviced mortgage loan as to which there exists a Collateral Deficiency Amount if an event has occurred at, or with respect to, the related mortgaged property or mortgaged properties that would have a material effect on its or their appraised value, and such special servicer is required to use reasonable efforts to obtain an appraisal from an MAI appraiser reasonably acceptable to such special servicer within 30 days from receipt of the Requesting Holders’ written request. Upon receipt of such supplemental appraisal, the applicable special servicer will be required to determine, in accordance with the Servicing Standard, whether, based on its assessment of such supplemental appraisal, any recalculation of the applicable Appraisal Reduction Amount or Collateral Deficiency Amount is warranted and, if so warranted, such person will be required to recalculate such Appraisal Reduction Amount or Collateral Deficiency Amount, as applicable, based upon such supplemental appraisal as described above. If required by any such recalculation, the applicable Appraised-Out Class will be reinstated as the Controlling Class and each Appraised-Out Class will, if applicable, have its related certificate balance notionally restored to the extent required by such recalculation of the Appraisal Reduction Amount or Collateral Deficiency Amount, if applicable. |
| Sale of Defaulted Loans: | Under certain circumstances the applicable special servicer may be required to use reasonable efforts to solicit offers for a defaulted serviced mortgage loan (and any related companion loan (to the extent provided under the related intercreditor agreement) and/or related REO properties). The Directing Certificateholder will not have a right of first refusal to purchase a defaulted loan. If the applicable special servicer does not receive an offer at least equal to the outstanding principal balance plus all accrued and unpaid interest and outstanding costs and expenses and certain other amounts specified in the pooling and servicing agreement (the “Par Purchase Price”), the applicable special servicer may purchase the defaulted loan or REO property at the Par Purchase Price or may accept the first cash offer received from any person that is determined to be a fair price for such defaulted loan or REO property. If multiple offers are received during the period designated by the applicable special servicer for receipt of offers, such special servicer is generally required to select the highest offer. The applicable special servicer will be required to determine whether any cash offer constitutes a fair price for any defaulted loan or REO property if the highest offeror is a person other than a party to the pooling and servicing agreement for this transaction (the “PSA”), the Directing Certificateholder, the Risk Retention Consultation Party, any sponsor, any Borrower Party, any independent contractor engaged by a special servicer, the trustee for the securitization of a related companion loan (with respect to a whole loan if it is a defaulted loan), any related companion loan holder or its representative, any holder of a related mezzanine loan or any known affiliate of any of the preceding entities (each, an “Interested Person”). If an offer is made by an Interested Person, the trustee will be required to determine (based upon the most recent appraisal conducted in accordance with the terms of the PSA) whether the offer constitutes a fair price for the defaulted loan or REO property unless (i) the offer is equal to or greater than the applicable Par Purchase Price and (ii) the offer is the highest offer received. Absent an offer at least equal to the Par Purchase Price, no offer from an Interested Person will constitute a fair price unless (x) it is the highest offer received and (y) at least two other offers are received from independent third parties. Neither the trustee nor any of its affiliates may make an offer for or purchase any specially serviced loan or REO property. Notwithstanding any of the foregoing to the contrary, the applicable special servicer is not required to accept the highest offer and may accept a lower offer for a defaulted loan or REO property if such special servicer determines, in accordance with the Servicing Standard (and subject to the requirements of any related intercreditor agreement), that a rejection of such offer would be in the best interests of the certificateholders and any related companion loan holders as a collective whole as if they constituted a single lender (and with respect to a serviced A/B whole loan, taking into account the subordinate nature of any related subordinate companion loan), so long as such lower offer was not made by such special servicer or any of its affiliates. If title to any mortgaged property is acquired by the trust fund, the applicable special servicer will generally be required to sell such mortgaged property prior to the close of the third calendar year beginning after the year of acquisition. The foregoing applies to mortgage loans serviced under the PSA. With respect to any non-serviced whole loan, if the special servicer under the applicable pooling and servicing agreement determines to sell the related |
This is not a research report and was not prepared by any Underwriter’s research department. Please see additional important information and qualifications at the end of this Term Sheet. |
| | T-17 | |
| BANK 2022-BNK39 | Structural Overview |
| | controlling companion loan if it becomes a defaulted loan, then the applicable special servicer will be required to sell the related whole loan, including the related mortgage loan included in the BANK 2022-BNK39 securitization trust and the related pari passu companion loan(s) and, under certain circumstances, any subordinate companion loan(s), as a single loan. In connection with any such sale, the special servicer under the applicable pooling and servicing agreement will be required to follow procedures substantially similar to those set forth above. |
| Risk Retention Consultation Party: | A risk retention consultation party may be appointed by the holder or holders of more than 50% of the RR Interest, by certificate balance. The majority RR Interest holder will have a continuing right to appoint, remove or replace the risk retention consultation party in its sole discretion. This right may be exercised at any time and from time to time. Except with respect to an Excluded Loan as to such party or the holder of the majority of the RR Interest, the risk retention consultation party will be entitled to consult with the applicable special servicer, upon request of the risk retention consultation party, with respect to certain material servicing actions proposed by such special servicer; provided, that prior to the occurrence and continuance of a Consultation Termination Event, such mortgage loan must also be a specially serviced mortgage loan. |
| Appointment and Replacement of each Special Servicer: | The Directing Certificateholder will appoint each initial special servicer as of the closing date. Prior to the occurrence and continuance of a Control Termination Event, any special servicer may generally be replaced by the Directing Certificateholder with or without cause at any time. After the occurrence and during the continuance of a Control Termination Event and upon (a) the written direction of holders of principal balance certificates evidencing not less than 25% of the voting rights of all classes of certificates (other than the RR Interest) entitled to principal (taking into account the application of Cumulative Appraisal Reduction Amounts to notionally reduce the certificate balances of classes to which such Cumulative Appraisal Reduction Amounts are allocable) requesting a vote to replace the applicable special servicer with a replacement special servicer, (b) payment by such requesting holders to the certificate administrator of all reasonable fees and expenses to be incurred by the certificate administrator in connection with administering such vote and (c) delivery by such holders of a rating agency confirmation from each applicable rating agency, the certificate administrator will be required to promptly post such notice on its internet website and by mail and conduct the solicitation of votes of all certificates in such regard, which requisite affirmative votes must be received within 180 days of the posting of such notice. Upon the written direction of holders of at least 66 2/3% of a Certificateholder Quorum, the trustee will be required to immediately replace the applicable special servicer with a qualified replacement special servicer designated by such holders of certificates. After the occurrence and during the continuance of a Consultation Termination Event, if the operating advisor determines that the applicable special servicer is not performing its duties as required under the pooling and servicing agreement or is otherwise not acting in accordance with the Servicing Standard, the operating advisor may also recommend the replacement of such special servicer. The operating advisor’s recommendation to replace such special servicer must be confirmed by an affirmative vote of holders of principal balance certificates evidencing at least a majority of the aggregate voting rights (taking into account the application of any Cumulative Appraisal Reduction Amounts to notionally reduce the respective certificate balances) of all principal balance certificates on an aggregate basis (which requisite affirmative vote must be received within 180 days of posting of the notice of the operating advisor’s recommendation to the certificate administrator’s website). A “Certificateholder Quorum” means, in connection with any solicitation of votes in connection with the replacement of a special servicer or the asset representations reviewer, the holders of certificates evidencing at least 50% of the aggregate voting rights (taking into account the application of realized losses and, other than with respect to the termination of the asset representations reviewer, any Cumulative Appraisal Reduction Amounts to notionally reduce the certificate balance of the certificates) of all classes of certificates entitled to principal (other than the RR Interest) on an aggregate basis. With respect to each serviced whole loan, any holder of a related pari passu companion loan, following a servicer termination event with respect to the applicable special servicer that affects such holder, will be entitled to direct the trustee (and the trustee will be required) to terminate such special servicer solely with respect to such serviced whole loan. A replacement special servicer will be selected by the trustee or, prior to a Control Termination Event, by the Directing Certificateholder; provided, that any successor special servicer appointed to replace the special servicer with respect to such whole loan cannot be the entity (or its affiliate) that was terminated at the direction of the holder of the related pari passu companion loan. Notwithstanding any of the foregoing to the contrary, with respect to any serviced A/B whole loans as to which a subordinate companion loan holder is the related controlling note holder, the holder of the related control note will be entitled to replace the applicable special servicer with respect to such whole loan at any time, with or without cause, and while it is a serviced whole loan, no other party may replace the applicable special servicer for such whole loan unless there is a servicer termination event with respect thereto. With respect to any non-serviced whole loan, subject to conditions or restrictions in the applicable intercreditor agreement, the BANK 2022-BNK39 trust, as holder of the related mortgage loan, has the right to terminate the applicable special servicer under the related pooling and servicing agreement if a servicer termination event occurs, with respect to such special servicer that affects the trust in its capacity as such holder. Such rights may be exercised by the Directing Certificateholder prior to a Consultation Termination Event (or the applicable special servicer, following the occurrence and during the continuance of a Consultation Termination Event). The successor special servicer will be selected pursuant to the applicable pooling and servicing agreement by the related directing holder prior to a control termination event under such pooling and servicing agreement. |
| Servicing Standard: | Each applicable master servicer and each applicable special servicer is obligated to service and administer the mortgage loans (and, if applicable, the serviced companion loans) in accordance with the definition of the “Servicing Standard” described in the Preliminary Prospectus and the terms of the pooling and servicing |
This is not a research report and was not prepared by any Underwriter’s research department. Please see additional important information and qualifications at the end of this Term Sheet. |
| | T-18 | |
| BANK 2022-BNK39 | Structural Overview |
| agreement, provided that each non-serviced mortgage loan, if any, will be serviced by another master servicer or special servicer under the pooling and servicing agreement with respect to the securitization of a related companion loan, which entities will be obligated to service and administer such non-serviced mortgage loan pursuant to a similar standard set forth in the related pooling and servicing agreement. |
| Excluded Special Servicer: | If a special servicer obtains knowledge that it has become a Borrower Party with respect to any mortgage loan (an “Excluded Special Servicer Loan”), such special servicer will be required to resign as special servicer of that Excluded Special Servicer Loan. Prior to the occurrence and continuance of a Control Termination Event, the Directing Certificateholder will be required to appoint (and may remove and replace with or without cause) a separate special servicer that is not a Borrower Party (an “Excluded Special Servicer”) with respect to any Excluded Special Servicer Loan, unless such Excluded Special Servicer Loan is also an Excluded Loan with respect to the Directing Certificateholder or the holder of the majority of the Controlling Class. For avoidance of doubt, with respect to a mortgage loan secured by a residential cooperative property, a person will not be considered a Borrower Party solely by reason of such person holding one or more cooperative unit loans that are secured by direct equity interests in the related borrower or owning one or more residential cooperative units comprising the related mortgaged property as a result of any foreclosure, transfer in lieu of foreclosure or other exercise of remedies with respect to any such unit loan(s). After the occurrence and during the continuance of a Control Termination Event, if at any time the applicable Excluded Special Servicer Loan is also an Excluded Loan with respect to the Directing Certificateholder or the holder of the majority of the Controlling Class or if the Directing Certificateholder is entitled to appoint the Excluded Special Servicer but does not so appoint within 30 days of notice of such resignation, the resigning special servicer will be required to use reasonable efforts to select the related Excluded Special Servicer. Any Excluded Special Servicer will be required to perform all of the obligations of the applicable special servicer and will be entitled to all special servicing compensation with respect to such Excluded Special Servicer Loan earned while the related mortgage loan is an Excluded Special Servicer Loan. As of the closing date, LNR Partners, LLC is expected to be a Borrower Party with respect to the Marketplace at the Outlets mortgage loan. For so long as LNR Partners, LLC is a Borrower Party with respect to the Marketplace at the Outlets mortgage loan, such mortgage loan will be considered an Excluded Special Servicer Loan. Situs Holdings, LLC will act as the special servicer for such Excluded Special Servicer Loan (and, if appointed, may act as the excluded special servicer for other mortgage loans that are excluded special servicer loans in the future) and will be entitled to all special servicing compensation related thereto with respect to such mortgage loan earned during such time as it is an excluded special servicer loan. |
Liquidated
Loan Waterfall: | On liquidation of any mortgage loan, all net liquidation proceeds related to the mortgage loan (but not any related companion loan) will be applied so that amounts allocated as a recovery of accrued and unpaid interest will not, in the first instance, include any delinquent interest that was not advanced as a result of Appraisal Reduction Amounts (or would not have been advanced in the absence of a non-recoverability determination) or accrued on the portion of the stated principal balance thereof equal to any related Collateral Deficiency Amount in effect from time to time and as to which no advance was made (collectively, the “Subordinated Interest Amount”). After the adjusted interest amount is so allocated, any remaining liquidation proceeds will be allocated to pay principal on the mortgage loan until the unpaid principal amount of the mortgage loan has been reduced to zero. Any remaining liquidation proceeds will then be allocated to pay the Subordinated Interest Amount. |
| Operating Advisor: | The operating advisor will be required to perform certain review duties if a Control Termination Event has occurred and is continuing, which will generally include a limited annual review of, and the preparation of a report regarding, certain actions of the applicable special servicer with respect to the resolution and/or liquidation of specially serviced loans. The review and report generally will be based on any asset status reports and additional information delivered to the operating advisor by such special servicer. In addition, if a Control Termination Event has occurred and is continuing, the applicable special servicer must consult with the operating advisor (in addition to the Directing Certificateholder if no Consultation Termination Event has occurred and is continuing) in connection with major decisions with respect to mortgage loans. Furthermore, under certain circumstances, but only if a Consultation Termination Event has occurred and is continuing, the operating advisor may recommend the replacement of the applicable special servicer as described above under “—Appointment and Replacement of each Special Servicer”; however, the operating advisor will not have any rights or obligations with respect to a non-serviced whole loan. If a Consultation Termination Event has occurred and is continuing, the operating advisor may be removed and replaced without cause upon the affirmative direction of certificates owners holding not less than 75% of the voting rights of all certificates (taking into account the application of Cumulative Appraisal Reduction Amounts), following a proposal from certificate owners holding not less than 25% of the voting rights of all certificates (taking into account the application of Cumulative Appraisal Reduction Amounts). The certificateholders who initiate a vote on a termination and replacement of the operating advisor without cause must cause the payment of the fees and expenses incurred in the replacement. In addition, in the event there are no classes of certificates outstanding other than the Control Eligible Certificates, the RR Interest and the Class X-F, Class F, Class X-G, Class X-H, Class V and Class R certificates, then all of the rights and obligations of the operating advisor under the PSA will terminate without payment of any penalty or termination fee (other than any rights or obligations that accrued prior to the date of such termination (including accrued and unpaid compensation) and other than indemnification rights arising out of events occurring prior to such termination). See “Pooling and Servicing Agreement—The Operating Advisor—Termination of the Operating Advisor Without Cause” in the Preliminary Prospectus. |
| Asset Representations Reviewer: | The asset representations reviewer will be required to review certain delinquent mortgage loans (excluding a mortgage loan for which a Payment Accommodation has been made and the related borrower is complying with the terms of such Payment Accommodation) after a specified delinquency threshold has been met and the |
This is not a research report and was not prepared by any Underwriter’s research department. Please see additional important information and qualifications at the end of this Term Sheet. |
| | T-19 | |
| BANK 2022-BNK39 | Structural Overview |
| required percentage of certificateholders vote to direct a review as described below. The asset representations reviewer will be entitled to the Asset Representations Reviewer Fee with respect to such review. See “Pooling and Servicing Agreement—The Asset Representations Reviewer” in the Preliminary Prospectus. The certificate administrator will be required to notify certificateholders if the specified delinquency threshold has been met as described in the Preliminary Prospectus under “—The Asset Representations Reviewer”. If certificateholders evidencing not less than 5.0% of the voting rights request a vote to commence an asset review, and if subsequently (i) a majority of those certificateholders who cast votes and (ii) a majority of an Asset Review Quorum authorizes an asset review within 150 days of the request for a vote, the asset representations reviewer will be required to conduct an asset review of delinquent loans. The asset representations reviewer may be terminated and replaced without cause. Upon (i) the written direction of certificateholders evidencing not less than 25% of the voting rights (without regard to the application of any Cumulative Appraisal Reduction Amounts) requesting a vote to terminate and replace the asset representations reviewer with a proposed successor asset representations reviewer that is an eligible asset representations reviewer, and (ii) payment by such holders to the certificate administrator of the reasonable fees and expenses to be incurred by the certificate administrator in connection with administering such vote, the certificate administrator will be required to promptly provide notice to all certificateholders and the asset representations reviewer of such request by posting such notice on its internet website, and by mailing such notice to all certificateholders and the asset representations reviewer. Upon the written direction of certificateholders evidencing at least 75% of a Certificateholder Quorum (without regard to the application of any Cumulative Appraisal Reduction Amounts), the trustee will be required to terminate all of the rights and obligations of the asset representations reviewer under the pooling and servicing agreement (other than any rights or obligations that accrued prior to the date of such termination and other than indemnification rights arising out of events occurring prior to such termination) by written notice to the asset representations reviewer, and the proposed successor asset representations reviewer will be appointed. See “Pooling and Servicing Agreement—The Asset Representations Reviewer” in the Preliminary Prospectus. An “Asset Review Quorum” means, in connection with any solicitation of votes to authorize an Asset Review as described above, the holders of certificates evidencing at least 5.0% of the aggregate voting rights represented by all certificates that have voting rights. |
| Dispute Resolution Provisions: | The mortgage loan sellers will be subject to the dispute resolution provisions set forth in the PSA to the extent those provisions are triggered with respect to any mortgage loan sold to the depositor by a mortgage loan seller, and such mortgage loan seller will be obligated under the related mortgage loan purchase agreement to comply with all applicable provisions and to take part in any mediation or arbitration proceedings that may result. Generally, in the event that a Repurchase Request is not “Resolved” within 180 days after the related mortgage loan seller receives such Repurchase Request, then the enforcing servicer will be required to send a notice to the first certificateholder (or beneficial owner) to deliver a certificateholder repurchase request with respect to the mortgage loan (the “Initial Requesting Certificateholder”) (if any) and to the certificate administrator (which will be required to make such notice available to certificateholders via the certificate administrator’s website) indicating the enforcing servicer’s intended course of action with respect to the Repurchase Request. If (a) the enforcing servicer’s intended course of action with respect to the Repurchase Request does not involve pursuing further action to exercise rights against the related mortgage loan seller with respect to the Repurchase Request and the Initial Requesting Certificateholder, if any, or any other certificateholder or certificate owner wishes to exercise its right to refer the matter to mediation (including nonbinding arbitration) or arbitration, or (b) the enforcing servicer’s intended course of action is to pursue further action to exercise rights against the related mortgage loan seller with respect to the Repurchase Request but the Initial Requesting Certificateholder, if any, or any other certificateholder or certificate owner does not agree with the dispute resolution method selected by the enforcing servicer, then the Initial Requesting Certificateholder, if any, or such other certificateholder or certificate owner may deliver a written notice to the enforcing servicer indicating its intent to exercise its right to refer the matter to either mediation or arbitration. “Resolved” means, with respect to a Repurchase Request, (i) that the related material defect or breach has been cured, (ii) the related mortgage loan has been repurchased in accordance with the related mortgage loan purchase agreement, (iii) a mortgage loan has been substituted for the related mortgage loan in accordance with the related mortgage loan purchase agreement, (iv) the applicable mortgage loan seller has made a loss of value payment, (v) a contractually binding agreement has been entered into between the enforcing servicer, on behalf of the issuing entity, and the related mortgage loan seller that settles the related mortgage loan seller’s obligations under the related mortgage loan purchase agreement, or (vi) the related mortgage loan is no longer property of the issuing entity as a result of a sale or other disposition in accordance with the pooling and servicing agreement. See “Pooling and Servicing Agreement—Dispute Resolution Provisions” in the Preliminary Prospectus. |
| Investor Communications: | The certificate administrator is required to include on any Form 10-D any request received from a certificateholder to communicate with other certificateholders related to certificateholders exercising their rights under the terms of the PSA. Any certificateholder wishing to communicate with other certificateholders regarding the exercise of its rights under the terms of the PSA will be able to deliver a written request signed by an authorized representative of the requesting investor to the certificate administrator. |
| Deal Website: | The certificate administrator will be required to maintain a deal website which will include, among other items: (a) summaries of asset status reports prepared by a special servicer, (b) inspection reports, (c) appraisals, (d) various “special notices” described in the Preliminary Prospectus, (e) the “Investor Q&A Forum” and (f) a voluntary “Investor Registry”. Investors may access the deal website following execution of a certification and confidentiality agreement. |
This is not a research report and was not prepared by any Underwriter’s research department. Please see additional important information and qualifications at the end of this Term Sheet. |
| | T-20 | |
| BANK 2022-BNK39 | Collateral Overview |
| Mortgage Loan Sellers | No. of
Mortgage
Loans | No. of
Mortgaged
Properties | Aggregate
Cut-off Date
Balance | % of
Pool(1) |
| Morgan Stanley Mortgage Capital Holdings LLC | 27 | 56 | $469,378,558 | 39.1% |
| Wells Fargo Bank, National Association | 17 | 18 | $339,199,518 | 28.2% |
| Bank of America, National Association | 6 | 6 | $199,938,556 | 16.6% |
| Wells Fargo Bank, National Association/Morgan Stanley Mortgage Capital Holdings LLC(3) | 1 | 1 | $110,000,000 | 9.2% |
| National Cooperative Bank, N. A. | 15 | 15 | $82,410,675 | 6.9% |
| Total: | 66 | 96 | $1,200,927,306 | 100.0% |
Pool Statistics
| Aggregate Cut-off Date Balance: | $1,200,927,306 |
| Number of Mortgage Loans: | 66 |
| Average Cut-off Date Balance per Mortgage Loan: | $18,195,868 |
| Number of Mortgaged Properties: | 96 |
| Average Cut-off Date Balance per Mortgaged Property: | $12,509,659 |
| Weighted Average Mortgage Rate: | 3.2916% |
| % of Pool Secured by 5 Largest Mortgage Loans: | 34.0% |
| % of Pool Secured by 10 Largest Mortgage Loans: | 54.5% |
| % of Pool Secured by ARD Loans(4): | 4.4% |
| Weighted Average Original Term to Maturity (months)(4): | 120 |
| Weighted Average Remaining Term to Maturity (months)(4): | 118 |
| Weighted Average Seasoning (months): | 2 |
| % of Pool Secured by Single Tenant Mortgaged Properties: | 14.4% |
| % of Pool Secured by Refinance Loans: | 71.7% |
| % of Pool Secured by Acquisition Loans: | 20.3% |
| % of Pool Secured by Recapitalization Loans: | 8.0% |
Additional Debt
| % of Pool with Pari Passu Mortgage Debt: | 28.0% |
| % of Pool with Subordinate Mortgage Debt(5): | 16.5% |
| % of Pool with Mezzanine Debt: | 2.9% |
Credit Statistics(6)(7)
| Weighted Average UW NOI DSCR: | 3.84x |
| Weighted Average UW NOI Debt Yield(8): | 13.4% |
| Weighted Average UW NCF DSCR: | 3.73x |
| Weighted Average UW NCF Debt Yield(8): | 13.0% |
| Weighted Average Cut-off Date LTV Ratio(8)(9): | 52.2% |
| Weighted Average Maturity Date LTV Ratio(8)(9): | 50.6% |
Footnotes are set forth on the following page.
This is not a research report and was not prepared by any Underwriter’s research department. Please see additional important information and qualifications at the end of this Term Sheet. |
| | T-21 | |
| BANK 2022-BNK39 | Collateral Overview |
Amortization
| Weighted Average Original Amortization Term (months)(10): | 361 |
| Weighted Average Remaining Amortization Term (months)(10): | 360 |
| % of Pool Interest Only through Maturity: | 75.1% |
| % of Pool Interest Only, Amortizing Balloon: | 13.2% |
| % of Pool Amortizing Balloon: | 7.2% |
| % of Pool Interest Only - ARD : | 4.4% |
Lockboxes
| % of Pool with Hard Lockboxes: | 52.5% |
| % of Pool with Springing Lockboxes: | 30.4% |
| % of Pool with No Lockboxes: | 13.8% |
| % of Pool with Soft Lockboxes: | 3.3% |
Reserves
| % of Pool Requiring Tax Reserves: | 63.5% |
| % of Pool Requiring Insurance Reserves: | 26.1% |
| % of Pool Requiring Replacement Reserves: | 65.1% |
| % of Pool Requiring TI/LC Reserves(11): | 74.4% |
Call Protection
| % of Pool with lockout period, followed by defeasance until open period: | 69.7% |
| % of Pool with lockout period. Yield maintenance followed by defeasance or a yield maintenance until open period: | 6.6% |
| % of Pool with no lockout period. Greater of a prepayment premium and yield maintenance followed by prepayment premium until open period: | 5.6% |
| % of Pool with lockout period, followed by the greater of a prepayment premium and yield maintenance until open period: | 5.1% |
| % of Pool with lockout period. The greater of a prepayment premium and yield maintenance, followed by defeasance or the greater of a prepayment premium and yield maintenance until open period: | 4.4% |
| % of Pool with lockout period, followed by defeasance or the greater of a prepayment premium and yield maintenance until open period: | 4.4% |
| % of Pool with no lockout period. Greater of yield maintenance and prepayment premium followed by defeasance or the greater of a prepayment premium and yield maintenance until open period: | 2.9% |
| % of Pool with no lockout period. Greater of a prepayment premium and yield maintenance until open period: | 1.2% |
| (1) | Unless otherwise indicated, all references to “% of Pool” in this Term Sheet reflect a percentage of the aggregate principal balance of the mortgage pool as of the Cut-off Date, after application of all payments of principal due during or prior to February 2022. |
| (2) | Thirteen (13) of the fifteen (15) mortgage loans for which National Cooperative Bank, N.A. is the mortgage loan seller were originated by its parent company, National Consumer Cooperative Bank, and transferred to National Cooperative Bank, N.A. Each such mortgage loan originated by National Consumer Cooperative Bank was underwritten pursuant to National Cooperative Bank, N.A.’s underwriting guidelines. |
| (3) | The 601 Lexington Avenue mortgage loan was co-originated by Wells Fargo Bank, National Association and Morgan Stanley Bank, N.A. Such mortgage loan is evidenced by two promissory notes: (i) note A-1-C2, with an outstanding principal balance of $67,543,860 as of the Cut-off Date, as to which Wells Fargo Bank, National Association is acting as mortgage loan seller; and (ii) note A-3-C2, with an outstanding principal balance of $42,456,140 as of the Cut-off Date, as to which Morgan Stanley Mortgage Capital Holdings LLC is acting as mortgage loan seller. |
| (4) | With respect to any ARD Loan, unless otherwise indicated, references in this Term Sheet to the applicable “maturity date” or “maturity” refer to the applicable anticipated repayment date with respect to such ARD Loan, and such applicable anticipated repayment date is treated as its maturity date for all purposes hereof. |
| (5) | Twelve (12) of the mortgage loans, each of which is secured by a residential cooperative property, currently have in place subordinate secured lines of credit to the related mortgage borrowers that permit future advances (such loans, collectively, the “Subordinate Coop LOCs”). The percentage figure expressed as “% of Pool with Subordinate Mortgage Debt” is determined as a percentage of the initial pool balance and does not take into account any Subordinate Coop LOCs and future subordinate debt (whether or not secured by the mortgaged property), if any, that may be permitted under the terms of any mortgage loan or the pooling and servicing agreement. See “Description of the Mortgage Pool—Additional Indebtedness—Other Secured Indebtedness” and “Description of the Mortgage Pool—Additional Debt Financing for Mortgage Loans Secured by Residential Cooperatives” in the Preliminary Prospectus. |
| (6) | With respect to any mortgage loan that is part of a whole loan, unless otherwise indicated, all LTV, DSCR and Debt Yield calculations in this Term Sheet include any related pari passu companion loans and exclude any subordinate companion loans, as applicable. Additionally, LTV, DSCR and Debt Yield figures in this Term Sheet are calculated for mortgage loans without regard to any additional indebtedness that may be incurred at a future date. For mortgaged properties securing residential cooperative mortgage loans all LTV, DSCR and Debt Yield calculations do not take into account any subordinate debt (whether or not secured by the related mortgaged property), that currently exists or is allowed under the terms of any mortgage loan. The information for each mortgaged property that relates to a mortgage loan that is cross-collateralized or cross-defaulted with one or more other mortgage loans is based upon the principal balance of that mortgage loan, except that the applicable loan-to-value ratio, debt service coverage ratio, and debt yield for each such mortgage loan is based upon the ratio or yield (as applicable) for the aggregate indebtedness evidenced by all loans in the group (without regard to any limitation on the amount of indebtedness secured by any mortgaged property in such cross-collateralized group). With respect to any leased fee loans, the SF/Units and Balance per SF/Unit figures in this Term Sheet are based on the size of the non-collateral improvements. |
| (7) | For mortgaged properties securing residential cooperative mortgage loans, all DSCR and Debt Yield calculations for each such mortgaged property is calculated using underwritten net operating Income or underwritten net cash flow, as applicable, for the related residential cooperative property which is the projected net operating income or net cash flow, as applicable, reflected in the most recent appraisal obtained by or otherwise in the possession of the related mortgage loan seller as of the Cut-off Date. All LTV ratio calculations are based upon the appraised value of the residential cooperative property determined as if such residential cooperative property is operated as a residential cooperative, inclusive of the amount of the underlying debt encumbering such residential cooperative property. |
| (8) | With respect to certain mortgage loans, debt yields and LTVs (such as, for example, UW NOI Debt Yield, UW NCF Debt Yield or Cut-off Date LTV Ratio) have been calculated based on a principal balance that is net of a holdback or earnout reserve. Such mortgage loans are identified under the definitions of “Underwritten NOI Debt Yield”, “Underwritten NCF Debt Yield” and “Cut-off Date LTV Ratio” set forth under “Description of the Mortgage Pool—Certain Calculations and Definitions” in the Preliminary Prospectus. |
This is not a research report and was not prepared by any Underwriter’s research department. Please see additional important information and qualifications at the end of this Term Sheet. |
| | T-22 | |
| BANK 2022-BNK39 | Collateral Overview |
| (9) | The LTV ratios set forth in this Term Sheet are generally based on the “as-is” values of the related mortgaged properties; provided that the “as-is” value for a portfolio of mortgaged properties may include a premium relating to the valuation of the mortgaged properties as a whole rather than as the sum of individually valued mortgaged properties; provided, further, that such LTV ratios may be based on “as-stabilized”, “as complete” or other contingent values in certain cases in which reserves have been established at origination for the applicable condition or circumstance that is expected to result in stabilization provided, further, that such LTV ratios may have been calculated based on a principal balance that is net of a holdback or earnout reserve. See the definition of “Appraised Value” under “Description of the Mortgage Pool—Certain Calculations and Definitions” in the Preliminary Prospectus. |
| (10) | Excludes mortgage loans that provide for payments of interest only through the related maturity date or anticipated repayment date, as applicable. |
| (11) | Excludes hospitality, multifamily, manufactured housing, leased fee and self storage properties. |
This is not a research report and was not prepared by any Underwriter’s research department. Please see additional important information and qualifications at the end of this Term Sheet. |
| | T-23 | |
| BANK 2022-BNK39 | Characteristic of the Mortgage Loans |
| Top 10 Mortgage Loans or Groups of Cross-Collateralized Mortgage Loans(1) |
| | | | | | | | | | | | | | |
Loan
No. | Mortgage
Loan
Seller | Property Name | City | State | Property Type | Cut-off Date
Balance | % of
Pool | SF/Units | Cut-off Date
Balance per
SF/Unit | UW
NCF
DSCR | UW NOI
Debt
Yield | Cut-off
Date LTV | Maturity Date LTV |
| 1 | WFB/MSMCH | 601 Lexington Avenue | New York | NY | Office | $110,000,000 | 9.2% | 1,675,659 | $431.65 | 4.50x | 13.2% | 42.5% | 42.5% |
| 2 | WFB | Marketplace at the Outlets | West Palm Beach | FL | Retail | $79,000,000 | 6.6% | 300,830 | $262.61 | 2.47x | 8.9% | 60.8% | 60.8% |
| 3 | MSMCH | 333 River Street | Hoboken | NJ | Multifamily | $75,000,000 | 6.2% | 526 | $237,642.59 | 5.22x | 12.4% | 34.5% | 34.5% |
| 4 | MSMCH | ExchangeRight Net Leased Portfolio #52 | Various | Various | Various | $73,460,000 | 6.1% | 445,241 | $164.99 | 2.31x | 8.6% | 61.9% | 61.9% |
| 5 | BANA | The Grove at Portofino Vineyards | Fort Myers | FL | Multifamily | $71,000,000 | 5.9% | 312 | $227,564.10 | 1.89x | 7.5% | 66.7% | 66.7% |
| 6 | WFB | ParkWorks Industry Center | Wilsonville | OR | Industrial | $64,800,000 | 5.4% | 383,071 | $169.16 | 2.40x | 8.9% | 67.2% | 67.2% |
| 7 | BANA | CX - 350 & 450 Water Street | Cambridge | MA | Mixed Use | $52,959,184 | 4.4% | 915,233 | $889.39 | 3.50x | 9.9% | 41.7% | 41.7% |
| 8 | MSMCH | Madonna Plaza | San Luis Obispo | CA | Retail | $46,500,000 | 3.9% | 287,129 | $161.95 | 1.55x | 10.1% | 70.9% | 60.4% |
| 9 | MSMCH | 5 Crosby Street | New York | NY | Mixed Use | $43,500,000 | 3.6% | 70,074 | $620.77 | 1.82x | 7.9% | 63.0% | 63.0% |
| 10 | BANA | One North Wacker | Chicago | IL | Office | $38,500,000 | 3.2% | 1,412,035 | $249.99 | 2.96x | 8.9% | 53.2% | 53.2% |
| | | Total/Wtd. Avg. | | | | $654,719,184 | 54.5% | | | 3.04x | 9.9% | 55.0% | 54.2% |
| (1) | With respect to any mortgage loan that is part of a whole loan, unless otherwise indicated, all LTV, DSCR, Debt Yield and Balance per SF/Units calculations in this Term Sheet include any related pari passu companion loans and exclude any subordinate companion loans, as applicable. Additionally, LTV, DSCR, Debt Yield and Balance per SF/Units figures in this Term Sheet are calculated for mortgage loans without regard to any additional indebtedness that may be incurred at a future date. With respect to any leased fee loans, the SF/Units and Balance per SF/Units figures in this Term Sheet are based on the size of the non-collateral improvements. |
This is not a research report and was not prepared by any Underwriter’s research department. Please see additional important information and qualifications at the end of this Term Sheet. |
| | T-24 | |
| BANK 2022-BNK39 | Characteristic of the Mortgage Loans |
| Mortgage Loans with Pari Passu Companion Loans |
Loan
No. | Mortgage
Loan Seller | Property Name |
Mortgage Loan
Cut-off Date
Balance | Aggregate Pari
Passu
Companion
Loan Cut-off
Date Balance |
Combined
Cut-off Date Balance | Lead Servicing Agreement | Master Servicer | Special Servicer | Control Rights | Combined
UW NCF
DSCR(1) | Combined
UW NOI
Debt Yield(1) | Combined
Cut-off
Date LTV(1) |
| 1 | WFB/MSMCH | 601 Lexington Avenue | $110,000,000 | $613,300,000 | $723,300,000 | BXP 2021-601L | Wells Fargo | Situs | BXP 2021-601L | 4.50x | 13.2% | 42.5% |
| 3 | MSMCH | 333 River Street | $75,000,000 | $50,000,000 | $125,000,000 | BANK 2022-BNK39 | Wells Fargo | LNR | BANK 2022-BNK39 | 5.22x | 12.4% | 34.5% |
| 7 | BANA | CX - 350 & 450 Water Street | $52,959,184 | $761,040,816 | $814,000,000 | CAMB 2021-CX2 | KeyBank | Situs | (2) | 3.50x | 9.9% | 41.7% |
| 10 | BANA | One North Wacker | $38,500,000 | $314,500,000 | $353,000,000 | BANK 2021-BNK36 | Wells Fargo | Rialto | BANK 2021-BNK36 | 2.96x | 8.9% | 53.2% |
| 11 | MSMCH | Park Avenue Plaza | $35,000,000 | $304,170,000 | $339,170,000 | MSC 2021-PLZA | Wells Fargo | Wells Fargo | MSC 2021-PLZA | 5.84x | 17.4% | 31.9% |
| 14 | WFB | 1201 Lake Robbins | $25,000,000 | $225,000,000 | $250,000,000 | BANK 2021-BNK37 | Wells Fargo | CWCapital | BANK 2021-BNK37 | 2.26x | 9.2% | 55.3% |
| (1) | DSCR, Debt Yield and LTV calculations include any related pari passu companion loans and exclude any subordinate companion loans, as applicable. |
| (2) | The controlling class under the CAMB 2021-CX2 securitization has the right to appoint the directing holder for the CX – 350 & 450 Water Street Whole Loan under the CAMB 2021-CX2 trust and servicing agreement. However, the current holder of the controlling class, 3650 Cal Bridge Cambridge Crossing LLC, is a borrower related party under the CAMB 2021-CX2 trust and servicing agreement, therefore until such time as there is a holder of the controlling class that is not a borrower related party under the CAMB 2021-CX2 trust and servicing agreement, neither a subordinate control period or a subordinate consultation period will be deemed to exist and furthermore no directing holder will have consent or consultation rights under the CAMB 2021-CX2 trust and servicing agreement. See “Description of the Mortgage Pool—The Whole Loans—The Non-Serviced A/B Whole Loans—The CX – 350 & 450 Water Street Pari Passu-A/B Whole Loan” in the Preliminary Prospectus. |
| Mortgage Loans with Subordinate Debt(1) |
Loan
No. | Mortgage
Loan Seller | Property Name |
Mortgage Loan Cut-off Date
Balance | Cut-off Date Balance per SF |
Subordinate Debt Cut-off Date Balance | UW NCF DSCR | UW NOI Debt Yield | Cut-off Date LTV | Whole Loan UW NCF DSCR(2) | Whole Loan UW NOI Debt Yield(2) | Whole Loan Cut-off Date LTV(2) |
| 1 | WFB/MSMCH | 601 Lexington Avenue | $110,000,000 | $431.65 | $276,700,000 | 4.50x | 13.2% | 42.5% | 3.25x | 9.5% | 58.8% |
| 7 | BANA | CX - 350 & 450 Water Street | $52,959,184 | $889.39 | $411,000,000 | 3.50x | 9.9% | 41.7% | 2.32x | 6.6% | 62.7% |
| 11 | MSMCH | Park Avenue Plaza | $35,000,000 | $292.49 | $120,830,000 | 5.84x | 17.4% | 31.9% | 4.31x | 12.8% | 43.3% |
| (1) | In addition, twelve (12) of the mortgage loans, each of which is secured by a residential cooperative property, currently have in place Subordinate Coop LOCs that permit future advances. See “Description of the Mortgage Pool—Additional Indebtedness—Other Secured Indebtedness” and “Description of the Mortgage Pool—Additional Debt Financing for Mortgage Loans Secured by Residential Cooperatives” in the Preliminary Prospectus. |
| (2) | Whole Loan UW NCF DSCR, Whole Loan UW NOI Debt Yield and Whole Loan Cut-off Date LTV figures shown above are calculated based on any related pari passu notes and any related subordinate note(s). |
| Mortgage Loans with Mezzanine Debt |
Loan
No. | Mortgage
Loan Seller | Property Name |
Mortgage Loan Cut-off Date
Balance | Cut-off Date Balance per SF |
Cut-off Date Mezzanine Debt Balance | UW NCF DSCR | UW NOI Debt Yield | Cut-off Date LTV | Total Debt UW NCF DSCR(1) | Total Debt UW NOI Debt Yield(1) | Total Debt Cut-off Date LTV(1) |
| 11 | MSMCH | Park Avenue Plaza | $35,000,000 | $292.49 | $115,000,000 | 5.84x | 17.4% | 31.9% | 3.27x | 10.3% | 54.1% |
| (1) | Total Debt UW NCF DSCR, Total Debt UW NOI Debt Yield and Total Debt Cut-off Date LTV figures shown above are calculated based on any related pari passu notes and any related subordinate note(s) and mezzanine note(s). |
This is not a research report and was not prepared by any Underwriter’s research department. Please see additional important information and qualifications at the end of this Term Sheet. |
| | T-25 | |
| BANK 2022-BNK39 | Characteristic of the Mortgage Loans |
Mortgage Loans with Scheduled Balloon Payments and Related Classes(1)
| Class A-2 ($2,824,000) |
Loan
No. | Mortgage
Loan
Seller | Property Name | State | Property Type | Cut-off
Date
Balance | % of
Pool | Maturity Date Balance | % of
Class A-2
Certificate
Principal
Balance | SF | Cut-off
Date
Balance per
SF | UW
NCF
DSCR | UW NOI
Debt
Yield | Cut-off
Date
LTV | Maturity
Date LTV | Rem. IO Period
(mos.) | Rem.
Term to
Maturity
(mos.) |
| 54 | MSMCH | Safelock Storage | OK | Self Storage | $3,100,000 | 0.3% | $2,976,421 | 105.4% | 69,250 | $44.77 | 1.48x | 10.3% | 59.0% | 56.7% | 22 | 58 |
| | | Total/Wtd. Avg. | | | $3,100,000 | 0.3% | $2,976,421 | 105.4% | | | 1.48x | 10.3% | 59.0% | 56.7% | 22 | 58 |
| (1) | The table above reflects the mortgage loans whose balloon payments will be applied to pay down the Class A-2 certificates, assuming (i) that none of the mortgage loans experience prepayments, defaults or losses; (ii) there are no extensions of maturity dates; and (iii) each mortgage loan is paid in full on its stated maturity date or, in the case of any mortgage loan with an anticipated repayment date, on such anticipated repayment date. The table above is otherwise based on the Structuring Assumptions set forth under “Yield and Maturity Considerations—Weighted Average Life” in the Preliminary Prospectus. |
This is not a research report and was not prepared by any Underwriter’s research department. Please see additional important information and qualifications at the end of this Term Sheet. |
| | T-26 | |
| BANK 2022-BNK39 | Characteristic of the Mortgage Loans |
| Prior Securitization History(1) |
Loan
No. | Mortgage
Loan
Seller | Property Name | City | State | Property
Type | Cut-off
Date
Balance | % of
Pool | SF/Units | Cut-off
Date
Balance per
SF/Unit(2) | UW NCF
DSCR(2)(3) | UW NOI
Debt
Yield(2)(3) | Cut-off
Date
LTV(2)(3) | Maturity
Date
LTV(2)(3) | Prior Securitization |
| 3 | MSMCH | 333 River Street | Hoboken | NJ | Multifamily | $75,000,000 | 6.2% | 526 | $237,642.59 | | 5.22x | 12.4% | | 34.5% | 34.5% | FN 470772 |
| 8 | MSMCH | Madonna Plaza | San Luis Obispo | CA | Retail | $46,500,000 | 3.9% | 287,129 | $161.95 | | 1.55x | 10.1% | | 70.9% | 60.4% | WFRBS 2011-C5 |
| 17 | WFB | Hanes Commons Shopping Center | Winston-Salem | NC | Retail | $21,700,000 | 1.8% | 152,758 | $142.05 | | 1.66x | 9.8% | | 70.5% | 65.1% | GSMS 2012-GCJ9 |
| 22 | WFB | Selma Square - CA | Selma | CA | Retail | $14,725,800 | 1.2% | 104,371 | $141.09 | | 1.68x | 9.6% | | 67.9% | 61.2% | WFRBS 2012-C8 |
| 30 | WFB | Extra Space Self Storage-NM | Albuquerque | NM | Self Storage | $11,000,000 | 0.9% | 100,175 | $109.81 | | 4.19x | 12.5% | | 55.7% | 55.7% | UBSBB 2012-C4 |
| 34 | WFB | Extra Space Storage - Baltimore | Middle River | MD | Self Storage | $9,600,000 | 0.8% | 86,740 | $110.68 | | 3.40x | 11.3% | | 41.6% | 41.6% | JPMBB 2015-C29 |
| 35 | WFB | Extra Space Storage - Gaithersburg | Gaithersburg | MD | Self Storage | $9,500,000 | 0.8% | 60,827 | $156.18 | | 3.53x | 11.7% | | 52.4% | 52.4% | GSMS 2015-GS1 |
| 50 | MSMCH | The DeLUXE Apartments | Reno | NV | Multifamily | $3,650,000 | 0.3% | 25 | $146,000.00 | | 2.10x | 8.5% | | 62.0% | 62.0% | FN AN7108 |
| | | Total | | | | 191,675,800 | 16.0% | | | | | | | |
| (1) | Includes mortgage loans for which all or a portion of the previously existing debt was most recently securitized in conduit securitizations, based on information provided by the related borrower or obtained through searches of a third-party database. The information has not otherwise been confirmed by the mortgage loan sellers. With respect to any mortgage loan that is part of a whole loan, unless otherwise indicated, all LTV, DSCR, Debt Yield and Cut-off Date Balance per SF/Unit calculations include any related pari passu companion loans and exclude any related subordinate companion loans, as applicable. |
| (2) | For properties that are part of a portfolio, the Cut-off Date Balance Per SF/Unit, UW NCF DSCR, UW NOI Debt Yield, Cut-off Date LTV and Maturity Date LTV calculations reflect the values of the portfolio as a whole. |
| (3) | For mortgaged properties securing residential cooperative mortgage loans, the UW NCF DSCR and UW NOI Debt Yield for each such mortgaged property is calculated using underwritten net operating income or underwritten net cash flow, as applicable, for the related residential cooperative property which is the projected net operating income or net cash flow, as applicable, reflected in the most recent appraisal obtained by or otherwise in the possession of the related mortgage loan seller as of the Cut-off Date. LTV calculations are based upon the appraised value of the residential cooperative property determined as if such residential cooperative property is operated as a residential cooperative, inclusive of the amount of the underlying debt encumbering such residential cooperative property. The UW NCF DSCR, UW NOI Debt Yield and LTV calculations do not take into account any subordinate debt (whether or not secured by the related mortgaged property), that currently exists or is allowed under the terms of any mortgage loan. |
This is not a research report and was not prepared by any Underwriter’s research department. Please see additional important information and qualifications at the end of this Term Sheet. |
| | T-27 | |
| BANK 2022-BNK39 | Characteristic of the Mortgage Loans |

| Property Type Distribution(1)(2) |
| | | | | | | | | |
| Property Type | Number of Mortgaged Properties | Aggregate Cut-off Date Balance | % of Pool | Wtd. Avg.
Mortgage
Rate | Wtd. Avg.
UW NCF
DSCR | Wtd. Avg.
UW NOI
Debt Yield | Wtd. Avg.
Cut-off
Date LTV | Wtd. Avg.
Maturity
Date LTV |
| Multifamily | 29 | $321,760,675 | 26.8% | 2.9752% | 6.35x | 21.9% | 38.4% | 38.1% |
| Garden | 6 | $138,600,000 | 11.5% | 3.2713% | 2.97x | 9.4% | 55.7% | 55.7% |
| Cooperative | 15 | $82,410,675 | 6.9% | 2.9542% | 14.36x | 55.8% | 7.5% | 6.3% |
| High Rise | 1 | $75,000,000 | 6.2% | 2.3150% | 5.22x | 12.4% | 34.5% | 34.5% |
| Mid Rise | 2 | $17,830,000 | 1.5% | 3.2131% | 2.23x | 7.4% | 52.8% | 52.8% |
| Low Rise | 5 | $7,920,000 | 0.7% | 3.7283% | 2.23x | 8.8% | 62.6% | 62.6% |
| Retail | 36 | $314,371,138 | 26.2% | 3.6850% | 2.05x | 9.3% | 64.5% | 60.8% |
| Anchored | 8 | $230,750,800 | 19.2% | 3.7376% | 1.96x | 9.4% | 65.6% | 60.7% |
| Single Tenant | 26 | $75,170,338 | 6.3% | 3.5084% | 2.31x | 8.8% | 61.4% | 61.2% |
| Unanchored | 1 | $5,200,000 | 0.4% | 3.5900% | 1.96x | 10.8% | 63.4% | 57.3% |
| Shadow Anchored | 1 | $3,250,000 | 0.3% | 4.1900% | 2.54x | 11.7% | 63.7% | 63.7% |
| Office | 10 | $256,963,229 | 21.4% | 2.9953% | 3.77x | 12.0% | 48.0% | 46.5% |
| CBD | 3 | $183,500,000 | 15.3% | 2.7852% | 4.43x | 13.1% | 42.7% | 42.7% |
| Suburban | 3 | $51,918,567 | 4.3% | 3.6077% | 1.95x | 9.4% | 62.0% | 54.3% |
| Medical | 4 | $21,544,662 | 1.8% | 3.3089% | 2.57x | 8.9% | 59.4% | 59.4% |
| Mixed Use | 4 | $115,259,184 | 9.6% | 3.4180% | 2.65x | 8.8% | 54.0% | 54.0% |
| Office/Lab | 1 | $52,959,184 | 4.4% | 2.7920% | 3.50x | 9.9% | 41.7% | 41.7% |
| Office/Retail | 1 | $43,500,000 | 3.6% | 4.1900% | 1.82x | 7.9% | 63.0% | 63.0% |
| Multifamily/Retail | 2 | $18,800,000 | 1.6% | 3.3951% | 2.15x | 7.5% | 67.9% | 67.9% |
| Self Storage | 11 | $97,850,000 | 8.1% | 3.3799% | 3.02x | 10.5% | 56.5% | 56.0% |
| Self Storage | 11 | $97,850,000 | 8.1% | 3.3799% | 3.02x | 10.5% | 56.5% | 56.0% |
| Industrial | 4 | $79,162,930 | 6.6% | 3.4902% | 2.41x | 9.9% | 63.8% | 62.1% |
| Flex | 2 | $71,779,372 | 6.0% | 3.4575% | 2.43x | 9.8% | 63.8% | 62.5% |
| Warehouse | 1 | $4,387,500 | 0.4% | 3.6400% | 2.69x | 10.7% | 63.6% | 63.6% |
| Warehouse/Distribution | 1 | $2,996,058 | 0.2% | 4.0550% | 1.73x | 10.6% | 64.4% | 51.5% |
| Hospitality | 1 | $11,985,150 | 1.0% | 4.3310% | 1.93x | 12.7% | 59.6% | 48.1% |
| Limited Service | 1 | $11,985,150 | 1.0% | 4.3310% | 1.93x | 12.7% | 59.6% | 48.1% |
| Manufactured Housing | 1 | $3,575,000 | 0.3% | 4.0800% | 2.98x | 12.7% | 60.6% | 60.6% |
| RV Park | 1 | $3,575,000 | 0.3% | 4.0800% | 2.98x | 12.7% | 60.6% | 60.6% |
| Total/Wtd. Avg. | 96 | $1,200,927,306 | 100.0% | 3.2916% | 3.73x | 13.4% | 52.2% | 50.6% |
| (1) | All numerical information concerning the mortgage loans is approximate and, in the case of mortgage loans secured by multiple properties, is based on allocated loan amounts with respect to such properties. All weighted average information regarding the mortgage loans reflects the weighting of the mortgage loans based on their outstanding principal balances as of the Cut-off Date or, in the case of mortgage loans secured by multiple properties, allocated loan amounts. The sum of numbers and percentages in columns may not match the “Total” due to rounding. With respect to any mortgage loan that is part of a whole loan, unless otherwise indicated, all LTV, DSCR and Debt Yield calculations include any related pari passu companion loans and exclude any related subordinate companion loans, as applicable. For mortgaged properties securing residential cooperative mortgage loans, the UW NCF DSCR and UW NOI Debt Yield for each such mortgaged property is calculated using underwritten net operating income or underwritten net cash flow, as applicable, for the related residential cooperative property which is the projected net operating income or net cash flow, as applicable, reflected in the most recent appraisal obtained by or otherwise in the possession of the related mortgage loan seller as of the Cut-off Date. All LTV ratio calculations are based upon the appraised value of the residential cooperative property determined as if such residential cooperative property is operated as a residential cooperative, inclusive of the amount of the underlying debt encumbering such residential cooperative property. The UW NCF DSCR, UW NOI Debt Yield and LTV calculations do not take into account any subordinate debt (whether or not secured by the related mortgaged property), that currently exists or is allowed under the terms of any mortgage loan. |
| (2) | With respect to any mortgage loan that is cross-collateralized or cross-defaulted with other mortgage loans, the loan-to-value ratio, debt service coverage ratio and debt yield for such mortgage loan is based upon the ratio or yield (as applicable) for the aggregate indebtedness evidence by all loans in the group (without regard to any limitation on the amount of indebtedness secured by any mortgaged property in such cross-collateralized group). On an individual basis, without regard to the cross-collateralization feature, any mortgage loan that is part of a cross-collateralized group of mortgage loans may have a higher loan to value ratio, lower debt service coverage ratio, and/or lower debt yield than is presented herein. |
This is not a research report and was not prepared by any Underwriter’s research department. Please see additional important information and qualifications at the end of this Term Sheet. |
| | T-28 | |
| BANK 2022-BNK39 | Characteristic of the Mortgage Loans |

| Geographic Distribution(1)(2) |
| State or Other Jurisdiction | Number of
Mortgaged
Properties | Aggregate
Cut-off Date
Balance | % of
Pool | Wtd. Avg.
Mortgage
Rate | Wtd. Avg.
UW NCF
DSCR | Wtd. Avg.
UW NOI
Debt Yield | Wtd. Avg. Cut-
off
Date LTV | Wtd. Avg.
Maturity
Date LTV |
| New York | 24 | $317,777,083 | 26.5% | 3.1154% | 6.50x | 23.2% | 37.5% | 37.2% |
| Florida | 4 | $167,185,150 | 13.9% | 3.6893% | 2.17x | 8.6% | 63.3% | 62.3% |
| New Jersey | 2 | $77,996,058 | 6.5% | 2.3818% | 5.09x | 12.3% | 35.6% | 35.2% |
| California | 3 | $73,445,800 | 6.1% | 4.0095% | 1.75x | 9.8% | 69.3% | 61.3% |
| Southern California(3) | 2 | $58,720,000 | 4.9% | 4.1303% | 1.76x | 9.8% | 69.7% | 61.4% |
| Northern California(3) | 1 | $14,725,800 | 1.2% | 3.5280% | 1.68x | 9.6% | 67.9% | 61.2% |
| Illinois | 7 | $71,137,696 | 5.9% | 3.0774% | 2.49x | 9.3% | 57.8% | 55.9% |
| Oregon | 1 | $64,800,000 | 5.4% | 3.5020% | 2.40x | 8.9% | 67.2% | 67.2% |
| Massachusetts | 2 | $58,457,245 | 4.9% | 2.8553% | 3.39x | 9.8% | 43.6% | 43.6% |
| Texas | 5 | $47,875,000 | 4.0% | 3.7908% | 2.51x | 10.0% | 56.0% | 56.0% |
| Kentucky | 4 | $44,100,000 | 3.7% | 2.6467% | 4.24x | 11.8% | 46.5% | 46.5% |
| Nevada | 4 | $37,547,940 | 3.1% | 3.3843% | 1.89x | 11.1% | 61.0% | 47.8% |
| Louisiana | 2 | $31,550,000 | 2.6% | 3.7618% | 2.56x | 9.6% | 63.5% | 63.5% |
| Arizona | 1 | $28,375,000 | 2.4% | 3.5500% | 1.57x | 9.2% | 67.9% | 56.6% |
| Tennessee | 1 | $23,500,000 | 2.0% | 2.6950% | 3.82x | 10.7% | 40.0% | 40.0% |
| North Carolina | 1 | $21,700,000 | 1.8% | 3.6360% | 1.66x | 9.8% | 70.5% | 65.1% |
| New Mexico | 3 | $20,525,729 | 1.7% | 3.0831% | 3.52x | 11.1% | 57.6% | 57.6% |
| Ohio | 5 | $19,184,977 | 1.6% | 3.4650% | 2.31x | 8.6% | 61.9% | 61.9% |
| Maryland | 2 | $19,100,000 | 1.6% | 3.2435% | 3.46x | 11.5% | 47.0% | 47.0% |
| Connecticut | 6 | $10,226,864 | 0.9% | 3.5396% | 2.33x | 8.9% | 62.7% | 62.7% |
| Virginia | 1 | $10,000,000 | 0.8% | 3.6180% | 2.49x | 9.2% | 64.5% | 64.5% |
| Washington | 1 | $9,900,000 | 0.8% | 3.6300% | 2.36x | 8.8% | 62.9% | 62.9% |
| Wyoming | 1 | $7,200,000 | 0.6% | 3.1900% | 3.25x | 10.6% | 51.8% | 51.8% |
| Iowa | 1 | $6,588,423 | 0.5% | 3.4650% | 2.31x | 8.6% | 61.9% | 61.9% |
| Georgia | 4 | $6,067,496 | 0.5% | 3.4650% | 2.31x | 8.6% | 61.9% | 61.9% |
| Alabama | 3 | $4,711,608 | 0.4% | 3.6668% | 2.78x | 10.7% | 48.8% | 48.8% |
| Michigan | 1 | $4,422,365 | 0.4% | 3.4650% | 2.31x | 8.6% | 61.9% | 61.9% |
| New Hampshire | 1 | $4,306,992 | 0.4% | 3.4650% | 2.31x | 8.6% | 61.9% | 61.9% |
| Missouri | 1 | $4,292,894 | 0.4% | 3.4650% | 2.31x | 8.6% | 61.9% | 61.9% |
| Oklahoma | 1 | $3,100,000 | 0.3% | 5.3700% | 1.48x | 10.3% | 59.0% | 56.7% |
| Wisconsin | 1 | $2,575,576 | 0.2% | 3.4650% | 2.31x | 8.6% | 61.9% | 61.9% |
| Pennsylvania | 2 | $1,842,450 | 0.2% | 3.4650% | 2.31x | 8.6% | 61.9% | 61.9% |
| Indiana | 1 | $1,434,961 | 0.1% | 3.4650% | 2.31x | 8.6% | 61.9% | 61.9% |
| Total/Wtd. Avg. | 96 | $1,200,927,306 | 100.0% | 3.2916% | 3.73x | 13.4% | 52.2% | 50.6% |
| (1) | All numerical information concerning the mortgage loans is approximate and, in the case of mortgage loans secured by multiple properties, is based on allocated loan amounts with respect to such properties. All weighted average information regarding the mortgage loans reflects the weighting of the mortgage loans based on their outstanding principal balances as of the Cut-off Date or, in the case of mortgage loans secured by multiple properties, allocated loan amounts. The sum of numbers and percentages in columns may not match the “Total” due to rounding. With respect to any mortgage loan that is part of a whole loan, unless otherwise indicated, all LTV, DSCR and Debt Yield calculations include any related pari passu companion loans and exclude any related subordinate companion loans, as applicable. For mortgaged properties securing residential cooperative mortgage loans, the UW NCF DSCR and UW NOI Debt Yield for each such mortgaged property is calculated using underwritten net operating income or underwritten net cash flow, as applicable, for the related residential cooperative property which is the projected net operating income or net cash flow, as applicable, reflected in the most recent appraisal obtained by or otherwise in the possession of the related mortgage loan seller as of the Cut-off Date. All LTV ratio calculations are based upon the appraised value of the residential cooperative property determined as if such residential cooperative property is operated as a residential cooperative, inclusive of the amount of the underlying debt encumbering such residential cooperative property. The UW NCF DSCR, UW NOI Debt Yield and LTV calculations do not take into account any subordinate debt (whether or not secured by the related mortgaged property), that currently exists or is allowed under the terms of any mortgage loan. |
| (2) | With respect to any mortgage loan that is cross-collateralized or cross-defaulted with other mortgage loans, the loan-to-value ratio, debt service coverage ratio and debt yield for such mortgage loan is based upon the ratio or yield (as applicable) for the aggregate indebtedness evidence by all loans in the group (without regard to any limitation on the amount of indebtedness secured by any mortgaged property in such cross-collateralized group). On an individual basis, without regard to the cross-collateralization feature, any mortgage loan that is part of a cross-collateralized group of mortgage loans may have a higher loan to value ratio, lower debt service coverage ratio, and/or lower debt yield than is presented herein. |
| (3) | “Northern California” includes zip codes above 93600, and “Southern California” includes zip codes at or below 93600. |
This is not a research report and was not prepared by any Underwriter’s research department. Please see additional important information and qualifications at the end of this Term Sheet. |
| | T-29 | |
| BANK 2022-BNK39 | Collateral Statistics |
Collateral Statistics(1)(2)
Cut-off Date Balance ($)
| | | | |
| | No. of
Mortgage
Loans | Aggregate
Cut-off Date
Balance ($) | % of
Pool |
| 1,497,623 - 5,000,000 | 20 | 58,248,358 | 4.9 |
| 5,000,001 - 15,000,000 | 26 | 251,466,198 | 20.9 |
| 15,000,001 - 25,000,000 | 7 | 146,200,000 | 12.2 |
| 25,000,001 - 35,000,000 | 3 | 90,293,567 | 7.5 |
| 35,000,001 - 55,000,000 | 4 | 181,459,184 | 15.1 |
| 55,000,001 - 75,000,000 | 4 | 284,260,000 | 23.7 |
| 75,000,001 – 110,000,000 | 2 | 189,000,000 | 15.7 |
| Total: | 66 | $1,200,927,306 | 100.0% |
| Min: $1,497,623 | Max: $110,000,000 | Avg: $18,195,868 | |
State or Other Jurisdiction(2)
| | | | |
| | No. of
Mortgaged
Properties | Aggregate
Cut-off Date
Balance ($) | % of Pool |
| New York | 24 | 317,777,083 | 26.5 |
| Florida | 4 | 167,185,150 | 13.9 |
| New Jersey | 2 | 77,996,058 | 6.5 |
| California | 3 | 73,445,800 | 6.1 |
| Southern California(3) | 2 | 58,720,000 | 4.9 |
| Northern California(3) | 1 | 14,725,800 | 1.2 |
| Illinois | 7 | 71,137,696 | 5.9 |
| Oregon | 1 | 64,800,000 | 5.4 |
| Massachusetts | 2 | 58,457,245 | 4.9 |
| Texas | 5 | 47,875,000 | 4.0 |
| Kentucky | 4 | 44,100,000 | 3.7 |
| Nevada | 4 | 37,547,940 | 3.1 |
| Louisiana | 2 | 31,550,000 | 2.6 |
| Arizona | 1 | 28,375,000 | 2.4 |
| Tennessee | 1 | 23,500,000 | 2.0 |
| North Carolina | 1 | 21,700,000 | 1.8 |
| New Mexico | 3 | 20,525,729 | 1.7 |
| Ohio | 5 | 19,184,977 | 1.6 |
| Maryland | 2 | 19,100,000 | 1.6 |
| Connecticut | 6 | 10,226,864 | 0.9 |
| Virginia | 1 | 10,000,000 | 0.8 |
| Washington | 1 | 9,900,000 | 0.8 |
| Wyoming | 1 | 7,200,000 | 0.6 |
| Iowa | 1 | 6,588,423 | 0.5 |
| Georgia | 4 | 6,067,496 | 0.5 |
| Alabama | 3 | 4,711,608 | 0.4 |
| Michigan | 1 | 4,422,365 | 0.4 |
| New Hampshire | 1 | 4,306,992 | 0.4 |
| Missouri | 1 | 4,292,894 | 0.4 |
| Oklahoma | 1 | 3,100,000 | 0.3 |
| Wisconsin | 1 | 2,575,576 | 0.2 |
| Pennsylvania | 2 | 1,842,450 | 0.2 |
| Indiana | 1 | 1,434,961 | 0.1 |
| Total: | 96 | $1,200,927,306 | 100.0% |
Property Type(2)
| �� | | | |
| | No. of
Mortgaged
Properties | Aggregate
Cut-off Date Balance ($) | % of
Pool |
| Multifamily | 29 | 321,760,675 | 26.8 |
| Garden | 6 | 138,600,000 | 11.5 |
| Cooperative | 15 | 82,410,675 | 6.9 |
| High Rise | 1 | 75,000,000 | 6.2 |
| Mid Rise | 2 | 17,830,000 | 1.5 |
| Low Rise | 5 | 7,920,000 | 0.7 |
| Retail | 36 | 314,371,138 | 26.2 |
| Anchored | 8 | 230,750,800 | 19.2 |
| Single Tenant | 26 | 75,170,338 | 6.3 |
| Unanchored | 1 | 5,200,000 | 0.4 |
| Shadow Anchored | 1 | 3,250,000 | 0.3 |
| Office | 10 | 256,963,229 | 21.4 |
| CBD | 3 | 183,500,000 | 15.3 |
| Suburban | 3 | 51,918,567 | 4.3 |
| Medical | 4 | 21,544,662 | 1.8 |
| Mixed Use | 4 | 115,259,184 | 9.6 |
| Office/Lab | 1 | 52,959,184 | 4.4 |
| Office/Retail | 1 | $43,500,000 | 3.6 |
| Multifamily/Retail | 2 | $18,800,000 | 1.6 |
| Self Storage | 11 | 97,850,000 | 8.1 |
| Self Storage | 11 | 97,850,000 | 8.1 |
| Industrial | 4 | 79,162,930 | 6.6 |
| Flex | 2 | 71,779,372 | 6.0 |
| Warehouse | 1 | 4,387,500 | 0.4 |
| Warehouse/Distribution | 1 | 2,996,058 | 0.2 |
| Hospitality | 1 | 11,985,150 | 1.0 |
| Limited Service | 1 | 11,985,150 | 1.0 |
| Manufactured Housing | 1 | 3,575,000 | 0.3 |
| RV Park | 1 | 3,575,000 | 0.3 |
| Total: | 96 | $1,200,927,306 | 100.0% |
Mortgage Rate (%)
| | No. of
Mortgage
Loans | Aggregate
Cut-off Date
Balance ($) | % of
Pool |
| 2.3150 - 2.9999 | 20 | 461,195,797 | 38.4 |
| 3.0000 - 3.4999 | 21 | 317,102,001 | 26.4 |
| 3.5000 – 5.3700 | 25 | 422,629,508 | 35.2 |
| Total: | 66 | $1,200,927,306 | 100.0% |
| Min: 2.3150% | Max: 5.3700% | Wtd Avg: 3.2916% | |
Original Term to Maturity or ARD (mos.)
| | No. of
Mortgage
Loans | Aggregate
Cut-off Date
Balance ($) | % of
Pool |
| 60 | 1 | 3,100,000 | 0.3 |
| 120 | 65 | 1,197,827,306 | 99.7 |
| Total: | 66 | $1,200,927,306 | 100.0% |
| Min: 60 mos. | Max: 120 mos. | Wtd Avg: 120 mos. | |
Remaining Term to Maturity or ARD (mos.)
| | No. of
Mortgage
Loans | Aggregate
Cut-off Date
Balance ($) | % of
Pool |
| 58 - 60 | 1 | 3,100,000 | 0.3 |
| 61 - 120 | 65 | 1,197,827,306 | 99.7 |
| Total: | 66 | $1,200,927,306 | 100.0% |
| Min: 58 mos. | Max: 120 mos. | Wtd Avg: 118 mos. | |
Original Amortization Term (mos.)
| | No. of
Mortgage
Loans | Aggregate
Cut-off Date
Balance ($) | % of
Pool |
| Interest Only | 44 | 955,086,684 | 79.5 |
| 240 | 1 | 6,979,372 | 0.6 |
| 360 | 19 | 230,624,912 | 19.2 |
| 480 | 2 | 8,236,339 | 0.7 |
| Total: | 66 | $1,200,927,306 | 100.0% |
| Min: 240 mos. | Max: 480 mos. | Wtd Avg: 361 mos. | |
Remaining Amortization Term (mos.)
| | No. of
Mortgage
Loans | Aggregate
Cut-off Date
Balance ($) | % of
Pool |
| Interest Only | 44 | 955,086,684 | 79.5 |
| 239 – 270 | 1 | 6,979,372 | 0.6 |
| 271 – 360 | 19 | 230,624,912 | 19.2 |
| 361 – 479 | 2 | 8,236,339 | 0.7 |
| Total: | 66 | $1,200,927,306 | 100.0% |
| Min: 239 mos. | Max: 479 mos. | Wtd Avg: 360 mos. | |
Mortgage Loan Sellers
| | No. of
Mortgage
Loans | Aggregate
Cut-off Date
Balance ($) | % of
Pool |
| MSMCH | 27 | 469,378,558 | 39.1 |
| WFB | 17 | 339,199,518 | 28.2 |
| BANA | 6 | 199,938,556 | 16.6 |
| WFB/MSMCH | 1 | 110,000,000 | 9.2 |
| NCB | 15 | 82,410,675 | 6.9 |
| Total: | 66 | $1,200,927,306 | 100.0% |
Amortization Type
| | No. of
Mortgage
Loans | Aggregate
Cut-off Date
Balance ($) | % of
Pool |
| Interest Only | 43 | 902,127,500 | 75.1 |
Interest Only, Amortizing
Balloon | 10 | 159,100,800 | 13.2 |
| Amortizing Balloon | 12 | 86,739,823 | 7.2 |
| Interest Only - ARD | 1 | 52,959,184 | 4.4 |
| Total: | 66 | $1,200,927,306 | 100.0% |
Cut-off Date LTV Ratio (%)
| | No. of
Mortgage
Loans | Aggregate
Cut-off Date
Balance ($) | % of
Pool |
| 1.5 - 30.0 | 16 | 84,410,675 | 7.0 |
| 30.1 - 40.0 | 6 | 145,014,372 | 12.1 |
| 40.1 - 50.0 | 6 | 203,659,184 | 17.0 |
| 50.1 - 60.0 | 10 | 155,685,150 | 13.0 |
| 60.1 - 65.0 | 19 | 321,238,558 | 26.7 |
| 65.1 - 70.9 | 9 | 290,919,367 | 24.2 |
| Total: | 66 | $1,200,927,306 | 100.0% |
| Min: 1.5% | Max: 70.9% | Wtd Avg: 52.2% | |
Maturity Date or ARD LTV Ratio (%)
| | No. of
Mortgage
Loans | Aggregate
Cut-off Date
Balance ($) | % of
Pool |
| 1.5 - 30.0 | 17 | 91,390,047 | 7.6 |
| 30.1 - 45.0 | 9 | 325,694,184 | 27.1 |
| 45.1 - 55.0 | 10 | 154,099,775 | 12.8 |
| 55.1 - 60.0 | 8 | 103,075,000 | 8.6 |
| 60.1 - 69.4 | 22 | 526,668,300 | 43.9 |
| Total: | 66 | $1,200,927,306 | 100.0% |
| Min: 1.5% | Max: 69.4% | Wtd Avg: 50.6% | |
UW NCF DSCR (x)
| | No. of
Mortgage
Loans | Aggregate
Cut-off Date
Balance ($) | % of
Pool |
| 1.43 - 1.70 | 9 | 165,819,367 | 13.8 |
| 1.71 - 2.10 | 8 | 162,631,208 | 13.5 |
| 2.11 - 2.50 | 10 | 304,710,000 | 25.4 |
| 2.51 - 3.50 | 13 | 165,606,056 | 13.8 |
| 3.51 - 4.50 | 7 | 193,540,740 | 16.1 |
| 4.51 - 35.04 | 19 | 208,619,935 | 17.4 |
| Total: | 66 | $1,200,927,306 | 100.0% |
| Min: 1.43x | Max: 35.04x | Wtd Avg: 3.73x | |
UW NOI Debt Yield (%)
| | No. of
Mortgage
Loans | Aggregate
Cut-off Date
Balance ($) | % of
Pool |
| 7.2 - 9.0 | 13 | 450,730,000 | 37.5 |
| 9.1 - 10.0 | 12 | 210,178,551 | 17.5 |
| 10.1 - 11.0 | 12 | 160,083,558 | 13.3 |
| 11.1 - 14.0 | 10 | 251,545,150 | 20.9 |
| 14.1 - 24.0 | 7 | 65,594,053 | 5.5 |
| 24.1 - 113.9 | 12 | 62,795,994 | 5.2 |
| Total: | 66 | $1,200,927,306 | 100.0% |
Min: 7.2% | Max: 113.9% | Wtd Avg: 13.4 | % |
| (1) | All numerical information concerning the mortgage loans is approximate. All weighted average information regarding the mortgage loans reflects the weighting of the mortgage loans based on their outstanding principal balances as of the Cut-off Date. The sum of numbers and percentages in columns may not match the “Total” due to rounding. With respect to any mortgage loan that is part of a whole loan, unless otherwise indicated, all LTV, DSCR and Debt Yield calculations include any related pari passu companion loans and exclude any related subordinate companion loans, as applicable. For mortgaged properties securing residential cooperative mortgage loans, the UW NCF DSCR and UW NOI Debt Yield for each such mortgaged property is calculated using underwritten net operating income or underwritten net cash flow, as applicable, for the related residential cooperative property which is the projected net operating income or net cash flow, as applicable, reflected in the most recent appraisal obtained by or otherwise in the possession of the related mortgage loan seller as of the Cut-off Date. All LTV ratio calculations are based upon the appraised value of the residential cooperative property determined as if such residential cooperative property is operated as a residential cooperative, inclusive of the amount of the underlying debt encumbering such residential cooperative property. The UW NCF DSCR, UW NOI Debt Yield and LTV calculations do not take into account any subordinate debt (whether or not secured by the related mortgaged property), that currently exists or is allowed under the terms of any mortgage loan. The information for each mortgaged property that relates to a mortgage loan that is cross-collateralized or cross-defaulted with one or more other mortgage loans is based upon the principal balance of that mortgage loan, except that the applicable loan-to-value ratio, debt service coverage ratio, and debt yield for each such mortgage loan is based upon the ratio or yield (as applicable) for the aggregate indebtedness evidenced by all loans in the group (without regard to any limitation on the amount of indebtedness secured by any mortgaged property in such cross-collateralized group). |
| (2) | In the case of mortgage loans secured by multiple properties, cut-off date balance information is based on allocated loan amounts with respect to such properties. |
| (3) | “Northern California” includes zip codes above 93600, and “Southern California” includes zip codes at or below 93600. |
This is not a research report and was not prepared by any Underwriter’s research department. Please see additional important information and qualifications at the end of this Term Sheet. |
| | T-30 | |
(THIS PAGE INTENTIONALLY LEFT BLANK)
This is not a research report and was not prepared by any Underwriter’s research department. Please see additional important information and qualifications at the end of this Term Sheet. |
| | T-31 | |
| Office – CBD | Loan #1 | Cut-off Date Balance: | | $110,000,000 |
| 601 Lexington Avenue | 601 Lexington Avenue | Cut-off Date LTV: | | 42.5% |
| New York, NY 10022 | | UW NCF DSCR: | | 4.50x |
| | | UW NOI Debt Yield: | | 13.2% |

This is not a research report and was not prepared by any Underwriter’s research department. Please see additional important information and qualifications at the end of this Term Sheet. |
| | T-32 | |
| Office – CBD | Loan #1 | Cut-off Date Balance: | | $110,000,000 |
| 601 Lexington Avenue | 601 Lexington Avenue | Cut-off Date LTV: | | 42.5% |
| New York, NY 10022 | | UW NCF DSCR: | | 4.50x |
| | | UW NOI Debt Yield: | | 13.2% |
![[GRAPHIC]](https://capedge.com/proxy/FWP/0001539497-22-000071/n2893tsimg007a.jpg)
This is not a research report and was not prepared by any Underwriter’s research department. Please see additional important information and qualifications at the end of this Term Sheet. |
| | T-33 | |
| Office – CBD | Loan #1 | Cut-off Date Balance: | | $110,000,000 |
| 601 Lexington Avenue | 601 Lexington Avenue | Cut-off Date LTV: | | 42.5% |
| New York, NY 10022 | | UW NCF DSCR: | | 4.50x |
| | | UW NOI Debt Yield: | | 13.2% |

This is not a research report and was not prepared by any Underwriter’s research department. Please see additional important information and qualifications at the end of this Term Sheet. |
| | T-34 | |
| Mortgage Loan No. 1 – 601 Lexington Avenue |
| Mortgage Loan Information | | Property Information |
| Mortgage Loan Sellers: | WFB/MSMCH | | Single Asset/Portfolio: | Single Asset |
| Credit Assessment (DBRSM/Fitch/Moody’s): | A(high)/BBBsf/Aa3 | | Location: | New York, NY 10022 |
| Original Balance(1): | $110,000,000 | | General Property Type: | Office |
| Cut-off Date Balance(1): | $110,000,000 | | Detailed Property Type: | CBD |
| % of Initial Pool Balance: | 9.2% | | Title Vesting: | Fee/Leasehold |
| Loan Purpose: | Refinance | | Year Built/Renovated: | 1977/2021 |
| Borrower Sponsor: | BP/CGCenter MM LLC | | Size: | 1,675,659 SF |
| Guarantor(2): | BP/CGCenter I LLC and BP/CGCenter II LLC | | Cut-off Date Balance per SF(1): | $432 |
| Mortgage Rate: | 2.79196% | | Maturity Balance per SF(1): | $432 |
| Note Date: | 12/10/2021 | | Property Manager: | Boston Properties Limited |
| First Payment Date: | 2/9/2022 | | | Partnership (borrower-related) |
| Maturity Date: | 1/9/2032 | | | |
| Original Term to Maturity: | 120 months | | | |
| Original Amortization Term: | 0 months | | | |
| IO Period: | 120 months | | Underwriting and Financial Information(8) |
| Seasoning: | 1 month | | UW NOI: | $95,273,106 |
| Prepayment Provisions(3): | L(25),D(88),O(7) | | UW NOI Debt Yield(1): | 13.2% |
| Lockbox/Cash Mgmt Status: | Hard/Springing | | UW NOI Debt Yield at Maturity(1): | 13.2% |
| Additional Debt Type(1)(4): | Pari Passu/Subordinate | | UW NCF DSCR(1): | 4.50x |
| Additional Debt Balance(1)(4): | $613,300,000/$276,700,000 | | Most Recent NOI: | $89,547,809 (9/30/2021 TTM) |
| Future Debt Permitted (Type): | No (NAP) | | 2nd Most Recent NOI: | $88,939,219 (12/31/2020) |
| Reserves(5) | | 3rd Most Recent NOI: | $82,516,612 (12/31/2019) |
| Type | Initial | Monthly | Cap | | Most Recent Occupancy: | 96.3% (11/1/2021) |
| RE Taxes: | $0 | Springing | NAP | | 2nd Most Recent Occupancy: | 97.6% (12/31/2020) |
| Insurance: | $0 | Springing | NAP | | 3rd Most Recent Occupancy: | 100.0% (12/31/2019) |
| Replacement Reserve: | $0 | Springing | $837,829 | | Appraised Value (as of): | $1,700,000,000 (10/1/2021) |
| TI/LC Reserve: | $0 | Springing | $10,053,948 | | Appraised Value per SF: | $1,015 |
| Tenant Specific TI/LC Reserve: | (6) | $0 | NAP | | Cut-off Date LTV Ratio(1): | 42.5% |
| Free Rent Reserve: | (7) | $0 | NAP | | Maturity Date LTV Ratio(1): | 42.5% |
| | | | | | | |
Sources and Uses |
| Sources | Proceeds | % of Total | | Uses | Proceeds | % of Total |
| Senior Loan Amount(1): | $723,300,000 | 72.3% | | Loan Payoff: | $618,492,902 | 61.8% |
| Subordinate Loan Amount(1): | $276,700,000 | 27.7% | | Return of Equity: | $368,350,972 | 36.8% |
| | | | | Closing Costs: | $13,156,127 | 1.3% |
| Total Sources: | $1,000,000,000 | 100.0% | | Total Uses: | $1,000,000,000 | 100.0% |
| (1) | The 601 Lexington Avenue Mortgage Loan (as defined below) is part of the 601 Lexington Avenue Whole Loan (as defined below) with an original aggregate principal balance of $1,000,000,000. The Cut-off Date Balance per SF, Maturity Date Balance per SF, UW NOI Debt Yield, UW NOI Debt Yield at Maturity, UW NCF DSCR, Cut-off Date LTV Ratio and Maturity Date LTV Ratio numbers presented above are based on the 601 Lexington Avenue Senior Loan (as defined below). The Cut-off Date Balance per SF, Maturity Date Balance per SF, UW NOI Debt Yield, UW NOI Debt Yield at Maturity, UW NCF DSCR, Cut-off Date LTV Ratio and Maturity Date LTV Ratio based upon the 601 Lexington Avenue Whole Loan are $597, $597, 9.5%, 9.5%, 3.25x, 58.8% and 58.8%, respectively. |
| (2) | BP/CGCenter I LLC and BP/CGCenter II LLC are the single purpose entity borrowers. The 601 Lexington Avenue Whole Loan is recourse to the single purpose entity borrowers for certain items. There is no separate non-recourse carveout guarantor or environmental indemnitor for the 601 Lexington Avenue Whole Loan. Boston Properties Limited Partnership, a Delaware Limited partnership (“BPLP”) has executed a Guaranty of Reserve Funds in place of posting certain reserves. |
| (3) | Defeasance of the 601 Lexington Avenue Whole Loan is permitted at any time after the earlier to occur of (a) the end of the two-year period commencing on the closing date of the securitization of the last promissory note representing a portion of the 601 Lexington Avenue Whole Loan to be securitized and (b) December 10, 2024. The assumed defeasance lockout period of 25 payments is based on the closing date of this transaction in February 2022. |
| (4) | See “The Mortgage Loan” and “Additional Secured Indebtedness (not including trade debts)” below for further discussion of additional debt. |
| (5) | See “Escrows and Reserves” below for further discussion of reserve requirements. |
| (6) | BPLP provided a payment guaranty in lieu of depositing $52,315,328 at closing for approved leasing expenses outstanding at the time of origination of the 601 Lexington Avenue Whole Loan. |
| (7) | BPLP provided a payment guaranty in lieu of depositing $8,974,469 at closing for the free rent and gap rent outstanding for six tenants at the time of origination of the 601 Lexington Avenue Whole Loan. |
| (8) | The novel coronavirus pandemic is an evolving situation and could impact the 601 Lexington Avenue Whole Loan more severely than assumed in the underwriting of the 601 Lexington Avenue Whole Loan and could adversely affect the NOI, NCF and occupancy information, as well as the appraised value and the DSCR, LTV and Debt Yield metrics presented above and herein. See "Risk Factors—Risks Related to Market Conditions and Other External Factors—The Coronavirus Pandemic Has Adversely Affected the Global Economy and Will Likely Adversely Affect the Performance of the Mortgage Loans" in the prospectus. |
This is not a research report and was not prepared by any Underwriter’s research department. Please see additional important information and qualifications at the end of this Term Sheet. |
| | T-35 | |
| Office – CBD | Loan #1 | Cut-off Date Balance: | | $110,000,000 |
| 601 Lexington Avenue | 601 Lexington Avenue | Cut-off Date LTV: | | 42.5% |
| New York, NY 10022 | | UW NCF DSCR: | | 4.50x |
| | | UW NOI Debt Yield: | | 13.2% |
The Mortgage Loan. The largest mortgage loan (the “601 Lexington Avenue Mortgage Loan”) is part of a whole loan (the “601 Lexington Avenue Whole Loan”) that is evidenced by 20 pari passu senior promissory notes in the aggregate original principal amount of $723,300,000 (collectively, the “601 Lexington Avenue Senior Loan”) and four pari passu subordinate promissory notes in the aggregate original principal amount of $276,700,000 (collectively, the “601 Lexington Avenue Subordinate Companion Loan”). The 601 Lexington Avenue Whole Loan was co-originated on December 10, 2021, by Wells Fargo Bank, National Association (“WFB”), DBR Investments Co. Limited (“DBRI”), Morgan Stanley Bank, N.A. (“MSBNA”) and Citi Real Estate Funding Inc. (“Citi”). The 601 Lexington Avenue Whole Loan is secured by a first priority mortgage on the borrowers’ fee simple interest in three condominium units and a leasehold interest in a portion of a fourth condominium unit relating to an office building located in New York, New York (the “601 Lexington Avenue Property”). The 601 Lexington Avenue Mortgage Loan is evidenced by the $67,543,860 non-controlling promissory Note A-1-C2, being contributed by WFB, and the $42,456,140 non-controlling promissory Note A-3-C2, being contributed by MSMCH, in the aggregate original principal amount of $110,000,000. As shown in the “601 Lexington Avenue Whole Loan Summary” table below, 8 promissory notes in the original aggregate principal amount of $426,700,000 were contributed to the BXP 2021-601L securitization trust. The 601 Lexington Avenue Whole Loan is being serviced pursuant to the trust and servicing agreement for the BXP 2021-601L securitization trust. The 601 Lexington Avenue Senior Loan pari passu notes other than those evidencing the 601 Lexington Avenue Mortgage Loan are referred to herein as the “601 Lexington Avenue Non-Serviced Pari Passu Companion Loans”. See “Description of the Mortgage Pool—The Whole Loans— The Non-Serviced A/B Whole Loans—The 601 Lexington Avenue Pari Passu-A/B Whole Loan” and “Pooling and Servicing Agreement—Servicing of the Non-Serviced Mortgage Loans” in the prospectus.
| 601 Lexington Avenue Whole Loan Summary |
| Note | Original Balance | Cut-off Date Balance | Note Holder | Controlling Piece |
| 601 Lexington Avenue Senior Loan |
| A-1-S1 | $52,500,000 | $52,500,000 | BXP 2021-601L | Yes |
| A-2-S1, A-3-S1, A-4-S1 | $92,500,000 | $92,500,000 | BXP 2021-601L | No |
| A-1-C2, A-3-C2 | $110,000,000 | $110,000,000 | BANK 2022-BNK39 | No |
| A-1-C1, A-1-C3, A-1-C4 | $133,111,140 | $133,111,140 | WFB | No |
| A-2-C1, A-2-C2, A-2-C3, A-2-C4 | $126,126,000 | $126,126,000 | DBRI | No |
| A-3-C1, A-3-C3, A-3-C4 | $83,669,860 | $83,669,860 | MSBNA | No |
| A-4-C1, A-4-C2, A-4-C3, A-4-C4 | $120,393,000 | $120,393,000 | Citi | No |
| Total (Senior Loan) | $723,300,000 | $723,300,000 | | |
| 601 Lexington Avenue Subordinate Companion Loan |
| B-1, B-2, B-3, B-4 | $276,700,000 | $276,700,000 | BXP 2021-601L | No |
| Total (Whole Loan) | $1,000,000,000 | $1,000,000,000 | | |
The Borrowers and the Borrower Sponsor. The borrowers are BP/CGCenter I LLC and BP/CGCenter II LLC, each a Delaware limited liability company and single purpose entity with two independent directors. The borrower sponsor is BP/CGCenter MM LLC, an indirectly owned subsidiary of Boston Properties Limited Partnership and of Norges Bank Investment Management (“Norges”). There is no separate environmental indemnitor or non-recourse carveout guarantor with respect to the 601 Lexington Avenue Whole Loan. Boston Properties Limited Partnership, a Delaware Limited partnership (“Boston Properties” or “BPLP”) has executed a Guaranty of Reserve Funds in place of posting certain reserves.
Boston Properties (NYSE: BXP) is the largest publicly traded developer, owner, and manager of Class A office properties in the United States, concentrated in five markets: Boston, Los Angeles, New York, San Francisco and Washington, DC. The company was founded in 1970 and became a public company in 1997. The company is a fully integrated real estate company, organized as a real estate investment trust (REIT), that develops, manages, operates, acquires and owns a diverse portfolio of primarily Class A office space. The company’s portfolio totals 52.5 million SF and 202 properties, including nine properties under construction or redevelopment. Boston Properties has held an ownership in interest in the 601 Lexington Avenue Property since 2001 and also controls property and leasing management.
Norges manages the Norwegian Government Pension Fund Global, often referred to as the Norwegian oil fund. Norges manages assets worth more than 11,000 billion kroner, or about $1.3 trillion dollars. The fund is invested in international equity and fixed-income markets and in real estate.
The Property. The 601 Lexington Avenue Property is comprised of the borrowers’ fee and leasehold interests in certain condominium units within a 59-story, Class A, office tower located in Midtown Manhattan at East 53rd Street and Lexington Avenue. Situated on a 1.6-acre site, the property comprises approximately 1.7 million SF of office and retail space, which includes a high-rise office tower as well as a six-story office and retail building totaling 227,276 SF situated at the base (the “Low Rise Building”). The building, with a 45° angled top and a stilt-style base, was designated as a landmark by the New York City Landmarks Preservation Commission in September 2016. As of November 1, 2021, the property was 96.3% leased. Investment grade tenants and tenants included in a legal industry magazine listing of the largest global 200 law firms by gross revenue represent 83.6% of the NRA and 85.7% of underwritten gross rent. Further, the top four tenants represent 71.6% of underwritten gross rent and have a weighted average remaining lease term of 15.2 years.
Originally built in 1977, the 601 Lexington Avenue Property underwent renovations totaling approximately $283 million in 2021, which included repositioning the Low Rise Building as well as the redevelopment of the ground and lower level space into a food hall. Following the repositioning, the Low Rise Building includes 195,326 SF of office space, 31,950 SF of retail space and a public marketplace and a new dedicated street-level entrance and lobby for low-rise office floors. The food hall (known as The Hugh) contains a collection of 15 restaurants, bars and food retailers and is directly connected to a public plaza that provides access to the East 53rd Street subway stop. Additional amenities of the Low Rise Building include a succession of rooftop terraces on each floor as well as a fitness center. The Low Rise Building office space is fully leased to NYU, which utilizes the space to house NYU Langone Health. In addition, NYU is occupying a portion of the land owned by the adjoining St. Peter's Church (see “Ground Lease” section below).
Condominium Regime. The 601 Lexington Avenue Property is comprised of (a) the borrowers’ fee simple interest in three condominium units within the four unit Condominium known as 601 Lexington Avenue Condominium (the “Condominium”) and (b) the borrowers’ leasehold interest in a portion of a fourth condominium unit, commonly known as the “Church Unit”, within the Condominium. The borrower-owned units include 94.4% of the common elements, which entitles the borrowers to 94 of the 100 votes in the condominium regime (together with the right to appoint 6 of 7 board members). The
This is not a research report and was not prepared by any Underwriter’s research department. Please see additional important information and qualifications at the end of this Term Sheet. |
| | T-36 | |
| Office – CBD | Loan #1 | Cut-off Date Balance: | | $110,000,000 |
| 601 Lexington Avenue | 601 Lexington Avenue | Cut-off Date LTV: | | 42.5% |
| New York, NY 10022 | | UW NCF DSCR: | | 4.50x |
| | | UW NOI Debt Yield: | | 13.2% |
loan documents provide that it is an event of default if, without the prior written consent of the lender, the borrowers vote for or otherwise consent to, any modification or amendment to any of the terms or provisions of the condominium documents in violation of the terms of the loan agreement. See “Description of the Mortgage Pool – Mortgage Pool Characteristics – Condominium and Other Shared Interests” in the prospectus.
Major Tenants.
Kirkland & Ellis (616,139 SF, 36.8% NRA, 39.4% underwritten gross rent, 2/28/2039 expiration). Kirkland & Ellis (“K&E”) was founded in 1909 in Chicago, Illinois and is the largest law firm in the world by revenue and the fifth-largest by number of attorneys. K&E is a long-term tenant at the property having been in occupancy since 1993. K&E signed an early renewal in 2014 to extend its lease through 2039 and expanded its space again in 2017. As the property’s largest tenant, K&E occupies the majority of the upper floors of the building (32-47, 49-52). For floor 32 only, K&E has a termination option on June 30, 2027 with 18 months’ notice and the payment of unamortized leasing costs. Additionally, as of February 28, 2034, K&E can terminate either its highest or lowest floor (one floor only). K&E has $4,062,504 of outstanding free rent.
Citibank (216,256 SF, 12.9% of NRA; 12.3% of underwritten gross rent, various expirations). Citibank, an affiliate of Citi, one of the originators of the 601 Lexington Avenue Whole Loan,is a multinational consumer and investment bank, with core activities that include safeguarding assets, lending money, making payments and accessing the capital markets on behalf of its clients. The property was originally developed as Citicorp’s headquarters and the bank was previously an owner of the property. Citibank is on various leases expiring in December 2022 (3.6% of NRA, 3.4% of underwritten gross rent), August 2023 (3.6% of NRA, 3.4% of underwritten gross rent), April 2027 (1.8% NRA, 1.8% of underwritten gross rent), and April 2032 (4.0% NRA, 3.7% of underwritten gross rent). Citibank has four, 5-year renewal options and does not have any termination options.
NYU (195,326 SF; 11.7% of NRA; 10.1% of underwritten gross rent, 10/31/2049 expiration). New York University (“NYU”) is a new tenant to the property with a lease commencing in 2020 of the newly redeveloped atrium building. NYU will use the space to house NYU Langone Health and is expected to take occupancy in January 2022. NYU structured a leasehold condominium for a period of approximately 30 years through October 2049. The leasehold condominium is structured as a standard lease, and is operated as a leasehold condominium to allow the tenant to benefit from its tax exempt entity status. NYU has one, 10-year renewal option, one, 7-year renewal option and does not have any termination options.
Freshfields Bruckhaus Deringer (139,243 SF; 8.3% of NRA; 9.8% of underwritten gross rent; 6/30/2026 expiration). Freshfields Bruckhaus Deringer (“Freshfields”) is one of the largest multinational law firms in the world, headquartered in London. Tracing its roots back to the 18th century, it is also among the world's oldest law firms. Freshfields has been a tenant at the property since 2010, expanded in 2017, and is on a lease expiring in 2026 with two, 5-year renewal options and no termination options.
Blackstone (89,967 SF; 5.4% of NRA; 5.2% of underwritten gross rent, 12/31/2027 expiration). Blackstone is an investment firm with total assets under management of $730.7 billion as of October 21, 2021. Blackstone’s asset management businesses include investment vehicles focused on real estate, private equity, public debt and equity, growth equity, opportunistic, non-investment grade credit, real assets and secondary funds, all on a global basis. Blackstone has been a tenant at the property since 2015, expanded in 2017 and is on a lease expiring in 2027 with two, 5-year renewal options or one, 10-year renewal option and no termination options.
This is not a research report and was not prepared by any Underwriter’s research department. Please see additional important information and qualifications at the end of this Term Sheet. |
| | T-37 | |
| Office – CBD | Loan #1 | Cut-off Date Balance: | | $110,000,000 |
| 601 Lexington Avenue | 601 Lexington Avenue | Cut-off Date LTV: | | 42.5% |
| New York, NY 10022 | | UW NCF DSCR: | | 4.50x |
| | | UW NOI Debt Yield: | | 13.2% |
The following table presents certain information relating to the major tenants at the 601 Lexington Avenue Property:
Tenant Summary(1) |
| Tenant Name | Credit Rating (Moody's/ Fitch/ S&P) | Tenant SF | Approx. % of Total SF | Annual UW
Gross
Rent(2)(3) | % of Total Annual UW Gross Rent(2) | Annual UW Gross Rent PSF(2)(3) | Lease Expiration | Renewal Options | Termination Option (Y/N) |
| K&E | NR/NR/NR | 616,139(4) | 36.8% | $61,225,450 | 39.4% | $99.37 | 2/28/2039 | None | Y(5) |
| Citibank | Aa3/A+/A+ | 216,256(6)(7) | 12.9% | $19,030,810 | 12.3% | $88.00 | Various(8) | 4x5 yr | N |
| NYU | Aa2/NR/AA- | 195,326 | 11.7% | $15,697,290 | 10.1% | $80.36 | 10/31/2049 | 1x10 yr and 1x7 yr | N |
| Freshfields | NR/NR/NR | 139,243(9) | 8.3% | $15,272,330 | 9.8% | $109.68 | 6/30/2026 | 2x5 yr | N |
| Citadel | Ba1/NR/BBB- | 144,193 | 8.6% | $13,771,418 | 8.9% | $95.51 | 8/31/2022(10) | None | N |
| Blackstone | NR/A+/A+ | 89,967 | 5.4% | $8,067,806 | 5.2% | $89.68 | 12/31/2027 | 2x5 yr or 1x10 yr | N |
| BTG | NR/NR/NR | 31,401 | 1.9% | $4,747,674 | 3.1% | $151.19 | 3/31/2028 | 1x5 yr | N |
| Apax | NR/NR/NR | 31,401 | 1.9% | $4,093,254 | 2.6% | $130.35 | 7/31/2026 | 1x5 yr | N |
| OrbiMed | NR/NR/NR | 31,401 | 1.9% | $3,543,036 | 2.3% | $112.83 | 3/31/2033 | 2x5 yr | N |
| Siris Capital Group | NR/NR/NR | 18,928 | 1.1% | $2,331,624 | 1.5% | $123.18 | 9/30/2030 | None | Y(11) |
| Subtotal/Wtd. Avg. | | 1,514,255 | 90.4% | $147,780,691 | 95.2% | $97.59 | | | |
| | | | | | | | | | |
| Other Tenants | | 99,343 | 5.9% | $7,530,269 | 4.8% | $75.80 | | | |
| Vacant Space | | 62,061 | 3.7% | $0 | 0.0% | $0.00 | | | |
| Total/Wtd. Avg. | | 1,675,659 | 100.0% | $155,310,960 | 100.0% | $96.25(12) | | | |
| (1) | Information based on the underwritten rent roll. |
| (2) | The Annual UW Gross Rent, % of Total Annual UW Gross Rent and Annual UW Gross Rent PSF are based on the underwritten gross rent based on the underwritten rent roll. |
| (3) | The Annual UW Gross Rent and Annual Gross UW Rent PSF shown above include contractual rent steps through September 2022 totaling $128,513. The lender’s underwriting gives separate credit for straight-line rent averaging for an investment grade tenant (NYU) and tenants included in a legal industry magazine listing of the largest global 200 law firms by gross revenue (K&E and Freshfields) through loan maturity. The total implied underwritten rental rate for K&E, NYU, and Freshfields, inclusive of the straight line credit, is approximately $108.46, $85.17 and $111.22 PSF, respectively. See “Underwritten Net Cash Flow” below. |
| (4) | Includes 600 SF of storage space. |
| (5) | For floor 32 only, K&E has a June 30, 2027 termination option with 18 months’ notice and the payment of unamortized leasing costs. Additionally, as of February 28, 2034, K&E can terminate either its highest or lowest floor (one floor only). |
| (6) | Includes 6,333 SF of storage space. |
| (7) | Citibank is currently subleasing Suites 1900 and 2100 totaling 59,978 SF (3.6% of NRA). |
| (8) | Floors 18 and 20 (59,978 SF) expire in December 2022, Floors 19 and 21 (59,978 SF) expire in August 2023, Floor 23 (29,989 SF) expires in April 2027, Floors 24 and 25 (66,311 SF) expire in April 2032. Citibank is expected to vacate the space expiring in December 2022 and August 2023. |
| (9) | Freshfields is currently subleasing Suite 5510 totaling 15,932 SF (1.0% of NRA). As of the origination date, Freshfields was also publicly marketing the remainder of their leased space for sublet. |
(10) Citadel has provided notice it intends to vacate at its lease expiration in August 2022.
| (11) | Siris Capital Group has the option to terminate all its space on September 30, 2027 with notice by September 30, 2026 (12 months) and the payment of unamortized leasing costs. |
| (12) | Total/Wtd. Avg. Annual UW Gross Rent PSF excludes vacant space. |
The following table presents certain information relating to the lease rollover schedule at the 601 Lexington Avenue Property:
| Lease Rollover Schedule(1)(2) |
| Year | # of Leases Rolling | SF Rolling | Approx. % of Total SF Rolling | Approx. Cumulative % of SF Rolling | UW Gross Rent PSF Rolling(3) | Total UW Gross Rent Rolling(3) | Approx. % of Total Gross Rent Rolling(3) | Approx. Cumulative % of Total Gross Rent Rolling(3) |
| 2022 | 10 | 204,171 | 12.2% | 12.2% | $93.23 | $19,035,831 | 12.3% | 12.3% |
| 2023 | 2 | 59,978 | 3.6% | 15.8% | $87.77 | $5,264,413 | 3.4% | 15.6% |
| 2024 | 1 | 5,724 | 0.3% | 16.1% | $115.00 | $658,260 | 0.4% | 16.1% |
| 2025 | 0 | 0 | 0.0% | 16.1% | $0.00 | $0 | 0.0% | 16.1% |
| 2026 | 7 | 170,645 | 10.2% | 26.3% | $113.48 | $19,365,584 | 12.5% | 28.5% |
| 2027 | 4 | 119,956 | 7.2% | 33.4% | $90.20 | $10,820,276 | 7.0% | 35.5% |
| 2028 | 1 | 31,401 | 1.9% | 35.3% | $151.19 | $4,747,674 | 3.1% | 38.6% |
| 2029 | 0 | 0 | 0.0% | 35.3% | $0.00 | $0 | 0.0% | 38.6% |
| 2030 | 4 | 18,928 | 1.1% | 36.5% | $123.18 | $2,331,624 | 1.5% | 40.1% |
| 2031 | 2 | 37,789 | 2.3% | 38.7% | $80.72 | $3,050,214 | 2.0% | 42.0% |
| 2032 & Beyond | 41 | 965,006 | 57.6% | 96.3% | $93.3 | $90,037,083 | 58.0% | 100.0% |
| Vacant | 0 | 62,061 | 3.7% | 100.0% | $0.00 | $0 | 0.0% | 100.0% |
| Total/Wtd. Avg. | 72 | 1,675,659 | 100.0% | | $96.25(4) | $155,310,960 | 100.0% | |
| (1) | Information is based on the underwritten rent roll. |
| (2) | Certain tenants may have lease termination options that are exercisable prior to the originally stated expiration date of the subject lease and that are not considered in the Lease Rollover Schedule. |
| (3) | The UW Gross Rent PSF Rolling, Total UW Gross Rent Rolling, Approx. % of Total UW Gross Rent Rolling and Approx. Cumulative % of Total UW Gross Rent Rolling are based on the underwritten gross rent based on the underwritten rent roll. |
| (4) | Total/Wtd. Avg. Gross UW Rent PSF Rolling excludes vacant space. |
This is not a research report and was not prepared by any Underwriter’s research department. Please see additional important information and qualifications at the end of this Term Sheet. |
| | T-38 | |
| Office – CBD | Loan #1 | Cut-off Date Balance: | | $110,000,000 |
| 601 Lexington Avenue | 601 Lexington Avenue | Cut-off Date LTV: | | 42.5% |
| New York, NY 10022 | | UW NCF DSCR: | | 4.50x |
| | | UW NOI Debt Yield: | | 13.2% |
COVID-19 Update. As of January 5, 2022, the 601 Lexington Avenue Property was open and operating. The borrower sponsor reported that the only tenant with outstanding rent relief is Hillstone (7,800 SF, 0.5% of NRA, 0.9% of underwritten gross rent), which received an abatement of 50% of six months rent (approximately $168,000 from September 1, 2020 to February 28, 2021), which it is expected to repay over the course of 2022 and 2023.
The Market. The 601 Lexington Avenue Property is located in Midtown Manhattan at East 53rd Street and Lexington Avenue in New York, New York. The 601 Lexington Avenue Property, which takes up the majority of a city block bounded clockwise from the west by Lexington Avenue, 54th Street, benefits from its proximity to Central Park, access to the luxury shopping corridor along Fifth and Madison Avenues, and available mass transit including the 4, 5, 6, E, M, N, R, and W subway lines. The property sits on top of a public plaza (directly connected to The Hugh food hall) that provides access to the East 53rd Street subway stop.
According to a third party market research report, the 601 Lexington Avenue Property is situated within the Plaza District Office submarket of the New York City Office Market. The Plaza District is not only the largest office submarket in New York City, with 90 million SF of inventory, but in the United States as well. As of October 2021, the Plaza District submarket reported a 14.4% vacancy rate (and a 17.4% availability rate) and average asking rents of $86.73 PSF, gross. The appraisal identified 9 directly competitive buildings totaling 10.5 million SF with a 7.0% vacancy rate and average asking rents of $102.14 PSF. The appraisal concluded to market rents ranging from $80.00 to $115.00 PSF, modified gross, for the various floors of office space at the 601 Lexington Avenue Property (see table below).
The following table presents certain information relating to the appraisal’s market rent conclusion for the 601 Lexington Avenue Property:
| Market Rent Summary |
| | Office Floors 2-22 | Office Floors 23-31 | Office Floors 32-42 | Office Floors 43-54 | East Building 55-59 |
| Market Rent (PSF) | $80.00 | $85.00 | $95.00 | $105.00 | $115.00 |
| Lease Term (Years) | 10 | 10 | 10 | 15 | 15 |
| Lease Type (Reimbursements) | MG | MG | MG | MG | MG |
| Rent Increase Projection | $10.00 PSF in year 6 | $10.00 PSF in year 6 | $10.00 PSF in year 6 | $10.00 PSF in year 6 | $10.00 PSF in year 6 |
The following table presents information relating to comparable office property sales for the 601 Lexington Avenue Property:
| Comparable Property Sale Summary |
| Property Name/Location | Sale Date | Year Built/Renovated | Total NRA (SF) | Occupancy | Sale Price | Sale Price PSF |
Confidential Park Ave New York, NY | Nov-2021 | 1994/2021 | 765,000 | 91.0% | $750,000,000 | $980.39 |
51 West 52nd Street New York, NY | Nov-2021 | 1963/NAP | 872,593 | 100.0% | $960,000,000 | $1,100.17 |
1177 Avenue of the Americas New York, NY | Nov-2021 | 1987/2013 | 1,024,733 | 81.0% | $858,500,000 | $837.78 |
550 Washington Street New York, NY | Sep-2021 | 1934/2022 | 1,257,529 | 100.0% | $2,020,800,000 | $1,606.96 |
220 East 42nd Street New York, NY | Jul-2021 | 1930/2015 | 1,224,755 | 93.0% | $790,100,000 | $645.11 |
One Park Avenue New York, NY | Jul-2021 | 1926/2000 | 947,894 | 99.0% | $875,000,000 | $923.10 |
410 Tenth Avenue New York, NY | Dec-2020 | 1927/2021 | 634,359 | 98.0% | $952,840,000 | $1,502.05 |
1633 Broadway New York, NY | May-2020 | 1972/2013 | 2,561,512 | 98.0% | $2,400,000,000 | $936.95 |
Source: Appraisal.
This is not a research report and was not prepared by any Underwriter’s research department. Please see additional important information and qualifications at the end of this Term Sheet. |
| | T-39 | |
| Office – CBD | Loan #1 | Cut-off Date Balance: | | $110,000,000 |
| 601 Lexington Avenue | 601 Lexington Avenue | Cut-off Date LTV: | | 42.5% |
| New York, NY 10022 | | UW NCF DSCR: | | 4.50x |
| | | UW NOI Debt Yield: | | 13.2% |
The following table presents information with respect to comparable office properties to the 601 Lexington Avenue Property:
| Comparable Office Supply Summary |
| Property Name/Location | Office Area (SF) | Year Built/Renovated | Stories | Sublease SF Available | % Occupied (Direct) | Average Asking Rent PSF |
601 Lexington Avenue Property New York, NY | 1,675,659(1) | 1977/2021 | 59 | - | 96.3%(1) | $96.25(1)(2) |
599 Lexington Avenue New York, NY | 1,058,805 | 1986 | 50 | 0 | 100.0% | NAP |
600 Lexington Avenue New York, NY | 305,472 | 1983 | 36 | 34,922 | 87.8% | $90.00 |
55 East 52nd Street New York, NY | 1,518,210 | 1981 | 49 | 0 | 97.6% | $95.00 |
65 East 55th Street New York, NY | 619,631 | 1986 | 38 | 23,708 | 92.9% | $155.00 |
237 Park Avenue New York, NY | 1,243,384 | 1915 | 21 | 220,823 | 98.6% | $75.00 |
245 Park Avenue New York, NY | 1,787,000 | 1966 | 45 | 93,108 | 89.5% | $110.00 |
875 Third Avenue New York, NY | 750,000 | 1982 | 29 | 0 | 87.3% | $80.00 |
277 Park Avenue New York, NY | 1,850,000 | 1964 | 51 | 23,163 | 83.2% | $110.00 |
280 Park Avenue New York, NY | 1,320,211 | 1968 | 43 | 27,407 | 100.0% | NAP |
Source: Appraisal, unless otherwise indicated.
| (1) Information | obtained from the underwritten rent roll. |
| (2) Represents | Annual UW Gross Rent PSF. |
This is not a research report and was not prepared by any Underwriter’s research department. Please see additional important information and qualifications at the end of this Term Sheet. |
| | T-40 | |
| Office – CBD | Loan #1 | Cut-off Date Balance: | | $110,000,000 |
| 601 Lexington Avenue | 601 Lexington Avenue | Cut-off Date LTV: | | 42.5% |
| New York, NY 10022 | | UW NCF DSCR: | | 4.50x |
| | | UW NOI Debt Yield: | | 13.2% |
Operating History and Underwritten Net Cash Flow. The following table presents certain information relating to the historical operating performance and Underwritten Net Cash Flow at the 601 Lexington Avenue Property:
| Cash Flow Analysis |
| | 2018 | 2019 | 2020 | 9/30/2021 TTM | UW | UW PSF |
| Base Rent | $133,149,752 | $135,562,062 | $143,558,635 | $144,061,141 | $145,905,931 | $87.07 |
| Contractual Rent Steps(1) | $0 | $0 | $0 | $0 | $128,513 | $0.08 |
| Rent Average Benefit(2) | $0 | $0 | $0 | $0 | $6,752,020 | $4.03 |
| Grossed Up Vacant Space | $0 | $0 | $0 | $0 | $5,489,750 | $3.28 |
| Total Recoveries | $13,799,300 | $10,210,032 | $9,414,939 | $9,538,732 | $10,422,946 | $6.22 |
| Other Income | $1,616,466 | $1,730,575 | $2,517,181 | $1,475,308 | $1,452,145 | $0.87 |
| Less Vacancy & Credit Loss(3) | $0 | $0 | $0 | $0 | ($10,444,971) | ($6.23) |
| Effective Gross Income | $148,565,518 | $147,502,669 | $155,490,755 | $155,075,181 | $159,706,334 | $95.31 |
| | | | | | | |
| Real Estate Taxes | $39,670,091 | $42,193,437 | $43,060,793 | $41,588,994 | $40,950,953 | $24.44 |
| Insurance | $569,495 | $612,718 | $732,213 | $892,330 | $1,375,389 | $0.82 |
| Management Fee | $3,006,130 | $3,265,479 | $3,235,326 | $3,218,199 | $1,000,000 | $0.60 |
| Other Operating Expenses | $18,195,642 | $18,914,423 | $19,523,204 | $19,827,849 | $21,106,886 | $12.60 |
| Total Expenses | $61,441,358 | $64,986,057 | $66,551,536 | $65,527,372 | $64,433,228 | $38.45 |
| | | | | | | |
| Net Operating Income | $87,124,160 | $82,516,612 | $88,939,219 | $89,547,809 | $95,273,106 | $56.86 |
| Capital Expenditures | $0 | $0 | $0 | $0 | $418,915 | $0.25 |
| TI/LC | $0 | $0 | $0 | $0 | $2,743,708 | $1.64 |
| Net Cash Flow | $87,124,160 | $82,516,612 | $88,939,219 | $89,547,809 | $92,110,483 | $54.97 |
| | | | | | | |
| Occupancy% | 99.3% | 100.0% | 97.6% | 96.3% | 96.3% | |
| NOI DSCR(4) | 4.26x | 4.03x | 4.34x | 4.37x | 4.65x | |
| NCF DSCR(4) | 4.26x | 4.03x | 4.34x | 4.37x | 4.50x | |
| NOI Debt Yield(4) | 12.0% | 11.4% | 12.3% | 12.4% | 13.2% | |
| NCF Debt Yield(4) | 12.0% | 11.4% | 12.3% | 12.4% | 12.7% | |
| (1) | Represents contractual rent steps through September 2022. |
| (2) | Represents straight-line rent averaging for an investment grade tenant (NYU) and tenants included in a legal industry magazine listing of the largest global 200 law firms by gross revenue (K&E and Freshfields). |
| (3) | The underwritten economic vacancy is 6.7%. The 601 Lexington Avenue Property was 96.3% leased as of November 1, 2021. |
| (4) | The debt service coverage ratios and debt yields are based on the 601 Lexington Avenue Senior Loan, and exclude the 601 Lexington Avenue Subordinate Companion Loan. |
Escrows and Reserves.
Real Estate Taxes - Upon the occurrence and continuance of a Cash Trap Event Period (as defined below under “Lockbox and Cash Management”), the 601 Lexington Avenue Whole Loan documents require ongoing monthly real estate tax reserves in an amount equal to 1/12 of the real estate taxes that the lender reasonably estimates will be payable during the next 12 months. In lieu of making the monthly payments, the borrowers have the right to deliver to the lender a guaranty from BPLP (as described below under “BPLP Guaranty”) so long as BPLP’s senior unsecured credit rating is at least “BBB” by S&P and “Baa3” by Moody’s (the “BPLP Guarantor Required Rating”).
Insurance - Upon the occurrence and continuance of a Cash Trap Event Period, the 601 Lexington Avenue Whole Loan documents require ongoing monthly insurance reserves in an amount equal to 1/12 of the insurance premiums that the lender estimates will be payable for the renewal of the coverage during the next 12 months; provided, however, notwithstanding any Cash Trap Event Period, the reserve will not be required if the borrowers maintain a blanket insurance policy reasonably acceptable to the lender. In lieu of making the monthly payments, the borrowers have the right to deliver to the lender a guaranty from BPLP (as described below under “BPLP Guaranty”) so long as BPLP’s senior unsecured credit rating satisfies the BPLP Guarantor Required Rating.
Replacement Reserve – Upon the occurrence and continuance of a Cash Trap Event Period, the 601 Lexington Avenue Whole Loan documents require ongoing monthly replacement reserves of $34,910, subject to a cap of $837,829. In lieu of making the monthly payments, the borrowers have the right to deliver to the lender a guaranty from BPLP (as described below under “BPLP Guaranty”) so long as BPLP’s senior unsecured credit rating satisfies the BPLP Guarantor Required Rating.
TI/LC Reserve – Upon the occurrence and continuance of a Cash Trap Event Period, the 601 Lexington Avenue Whole Loan documents require ongoing monthly TI/LC reserves of $418,915, subject to a cap of $10,053,948. In lieu of making the monthly payments, the borrowers have the right to deliver to the lender a guaranty from BPLP (as described below under “BPLP Guaranty”) so long as BPLP’s senior unsecured credit rating satisfies the BPLP Guarantor Required Rating.
Tenant Specific TI/LC Reserve – BPLP provided a payment guaranty in lieu of depositing $52,315,328 at closing for approved leasing expenses outstanding at the time of origination of the 601 Lexington Avenue Whole Loan.
This is not a research report and was not prepared by any Underwriter’s research department. Please see additional important information and qualifications at the end of this Term Sheet. |
| | T-41 | |
| Office – CBD | Loan #1 | Cut-off Date Balance: | | $110,000,000 |
| 601 Lexington Avenue | 601 Lexington Avenue | Cut-off Date LTV: | | 42.5% |
| New York, NY 10022 | | UW NCF DSCR: | �� | 4.50x |
| | | UW NOI Debt Yield: | | 13.2% |
Free Rent Reserve – BPLP provided a payment guaranty in lieu of depositing $8,974,469 at closing for the free rent and gap rent outstanding for six tenants at the time of origination of the 601 Lexington Avenue Whole Loan.
Lockbox and Cash Management. The 601 Lexington Avenue Whole Loan documents require that the borrowers establish and maintain a lender-controlled lockbox account, which is already in-place, and direct all tenants to pay rent directly into such lockbox account. The 601 Lexington Avenue Whole Loan documents also require that all rents received by the borrowers be deposited into the lockbox account within five business days of receipt. Prior to the occurrence of a Cash Trap Event Period, all funds on deposit in the lockbox account will be disbursed to the borrowers’ operating account. During a Cash Trap Event Period, all funds in the lockbox account are required to be swept each business day into the cash management account controlled by the lender and, on each payment date, all funds in the cash management account are required to be applied in accordance with the 601 Lexington Avenue Whole Loan documents to make required deposits (if any) into the real estate tax and insurance reserves, to pay debt service on the 601 Lexington Avenue Whole Loan, to make required deposits (if any) into the replacement and TI/LC reserves, and to pay operating expenses set forth in the annual budget (which is required to be approved by the lender during a Cash Trap Event Period). During a Cash Trap Event Period, any excess cash flow remaining after satisfaction of the foregoing items is required to be swept to an excess cash flow subaccount to be held by the lender as additional security for the 601 Lexington Avenue Whole Loan; provided, however, so long as no event of default exists under the 601 Lexington Avenue Whole Loan, if amounts on deposit in the TI/LC Reserve are not sufficient to pay approved leasing expenses, then upon request of the borrowers, funds in the excess cash flow subaccount are required to be disbursed for approved leasing expenses.
A “Cash Trap Event Period” will commence upon the earlier of the following:
| (i) | the occurrence and continuance of an event of default; or |
| (ii) | the net operating income debt service coverage ratio (“NOI DSCR”) for the 601 Lexington Avenue Whole Loan falling below 1.20x at the end of any calendar quarter. |
A Cash Trap Event Period will end upon the occurrence of the following:
| ● | with regard to clause (i) above, the cure of such event of default; or |
| ● | with regard to clause (ii) above: |
| (a) | the NOI DSCR for the 601 Lexington Avenue Whole Loan being greater than or equal to 1.20x for one calendar quarter; or |
| (b) | the borrowers delivering to the lender as additional collateral and security for the payment of the debt, (x) cash to be held as an additional reserve fund that, if applied as a prepayment of the outstanding principal balance of the 601 Lexington Avenue Whole Loan, would cause the NOI DSCR to be at least 1.20x (the “Cash Management Sweep Cure Amount”), (y) a letter of credit having an aggregate notional amount in the amount of the Cash Management Sweep Cure Amount, or (z) so long as BPLP’s senior unsecured credit rating satisfies the BPLP Guarantor Required Rating, a guaranty by BPLP in the amount of the Cash Management Sweep Cure Amount. |
BPLP Guaranty. The borrowers have the right to deliver to the lender a guaranty (a “BPLP Guaranty”) from BPLP (in the context of the BPLP Guaranty, the “BPLP Guarantor”), in lieu of making the payments to any of the reserve accounts and in lieu of making any cash deposits as alteration security, net proceeds deficiency with respect to the restoration after a casualty or condemnation or Cash Sweep Management Sweep Cure Amount, so long as BPLP’s senior unsecured credit rating meets the BPLP Guarantor Required Rating. Additionally, the borrowers have the right to deliver to the lender a BPLP Guaranty in lieu of deposits previously made for any such purpose (whereupon, the amount so replaced would then be returned to the borrowers). The aggregate amount guaranteed under any such BPLP Guaranty (together with any cash delivered by the borrowers to the lender and/or any letter of credit delivered by the borrowers to the lender) related to any such purpose, must at all times be at least equal to the aggregate amount which the borrowers are required to have on deposit for such purpose. The aggregate amount guaranteed under any BPLP Guaranty (when aggregated with the full amount of any letter of credit and/or cash on deposit) will be reduced as the borrowers expend funds for the purposes which such funds would have otherwise been deposited in the applicable reserve account. The aggregate amount of any BPLP Guaranty (and the full amount of any letter of credit obtained by BPLP) will not at any time exceed 10.0% of the outstanding principal balance of the Whole Loan, unless the borrowers deliver a new non-consolidation opinion which takes into account such BPLP guarantees and letters of credit.
In the event of any downgrade, withdrawal or qualification of the rating of the BPLP Guarantor by any rating agency such that the BPLP Guarantor no longer satisfies the BPLP Guarantor Required Rating, within 10 business days of such downgrade, withdrawal or qualification, the borrowers are required to either (i) deposit with the lender cash in the amount of the guaranteed obligations under each BPLP Guaranty then outstanding, and/or (ii) provide the lender with a letter of credit with a face amount equal to the guaranteed obligations under each BPLP Guaranty then outstanding.
Additional Secured Indebtedness (not including trade debts). The 601 Lexington Avenue Property also secures the 601 Lexington Avenue Non-Serviced Pari Passu Companion Loans, which have an aggregate Cut-off Date principal balance of $613,300,000 and the 601 Lexington Avenue Subordinate Companion Loan, which has an aggregate Cut-off Date principal balance of $276,700,000. The 601 Lexington Avenue Non-Serviced Pari Passu Companion Loans and the 601 Lexington Avenue Subordinate Companion Loan are coterminous with the 601 Lexington Avenue Mortgage Loan. The 601 Lexington Avenue Non-Serviced Pari Passu Companion Loans and 601 Lexington Avenue Subordinate Companion Loan accrue interest at the same rate as the 601 Lexington Avenue Mortgage Loan. The 601 Lexington Avenue Mortgage Loan and the 601 Lexington Avenue Non-Serviced Pari Passu Companion Loans are each pari passu in right of payment and together are senior in right of payment to the 601 Lexington Avenue Subordinate Companion Loan. The holders of the 601 Lexington Avenue Mortgage Loan, the 601 Lexington Avenue Non-Serviced Pari Passu Companion Loans and the 601 Lexington Avenue Subordinate Companion Loan have entered into a co-lender agreement which sets forth the allocation of collections on the 601 Lexington Avenue Whole Loan. See “Description of the Mortgage Pool—The Whole Loans— The Non-Serviced A/B Whole Loans—The 601 Lexington Avenue Pari Passu-A/B Whole Loan”.
| Subordinate Note Summary |
| | B-Note Original Principal Balance | B-Note Interest Rate | Original Term (mos.) | Original Amort. Term (mos.) | Original IO Term (mos.) | Whole Loan UW NCF DSCR | Whole Loan UW NOI DY | Whole Loan Cutoff Date LTV |
| 601 Lexington Avenue Subordinate Companion Loan | $276,700,000 | 2.79196% | 120 | 0 | 120 | 3.25x | 9.5% | 58.8% |
This is not a research report and was not prepared by any Underwriter’s research department. Please see additional important information and qualifications at the end of this Term Sheet. |
| | T-42 | |
| Office – CBD | Loan #1 | Cut-off Date Balance: | | $110,000,000 |
| 601 Lexington Avenue | 601 Lexington Avenue | Cut-off Date LTV: | | 42.5% |
| New York, NY 10022 | | UW NCF DSCR: | | 4.50x |
| | | UW NOI Debt Yield: | | 13.2% |
Mezzanine Loan and Preferred Equity. Not permitted.
Release of Property.Not permitted.
Right of First Offer/Right of First Refusal. None.
Ground Lease. The borrowers have an approximately 18,000 SF ground lease from the abutting St. Peter’s Lutheran Church of Manhattan (“St. Peter’s Church”), that is in turn sub-leased to NYU. The office space (floors 2-6) is 100% leased by NYU and is being used to house NYU Langone Health. NYU is occupying a portion of the “Church Unit” condominium unit owned by St. Peter's Church. Such portion of the condominium unit is incorporated into the office building. The borrowers are required to pay ground rent ($49.96 PSF with annual escalations of 1.5%) to St. Peter’s Church. The borrowers are required to purchase the ground leased space in 2036 for a fixed price of approximately $23.3 million.
Letter of Credit. None; however, a letter of credit may be provided to avoid or terminate a Cash Trap Event Period due to clause (ii) as described above under “Lockbox and Cash Management” or in place of any amount reserved under the loan documents provided the aggregate amount of any letters of credit (together with any BPLP Guaranties) do not at any time exceed 10.0% of the outstanding principal balance of the 601 Lexington Avenue Whole Loan, unless the borrowers deliver a new non-consolidation opinion which takes into account such BPLP Guaranties and letters of credit.
Terrorism Insurance.The 601 Lexington Avenue Whole Loan documents require that the “all risk” insurance policy required to be maintained by the borrowers, in an amount equal to the full replacement cost of the 601 Lexington Avenue Property, contain no exclusion for damage or destruction caused by acts of terrorism, as well as business interruption insurance covering a period of restoration of 24 months and a 12-month extended period of indemnity (provided that if TRIPRA or a similar statute is not in effect, the borrowers will not be obligated to pay terrorism insurance premiums in excess of two times the annual premium for the casualty and business interruption coverage (without giving effect to the cost of terrorism, flood and earthquake and business interruption components of such coverage)).
The 601 Lexington Avenue Whole Loan documents provide that required terrorism insurance may be written by a non-rated captive insurer owned by BPLP subject to certain conditions, including, among other things: (i) TRIPRA is in full force and effect; (ii) the terrorism policy issued by such captive insurer, together with any other qualified terrorism policies in-place, provide per occurrence limit in an amount not less than replacement cost and rent loss coverage as otherwise required; (iii) covered losses that are not reinsured by the federal government under TRIPRA and paid to the captive insurer are reinsured with a cut-through endorsement by an insurance company rated S&P “A”/ Moody’s “A2” or better; (iv) all reinsurance agreements between the captive insurer and other reinsurance providers are reasonably acceptable to the lender; (v) such captive insurer shall not be subject to a bankruptcy or similar insolvency proceeding; (vi) such captive insurer is licensed in the State of Vermont or other jurisdiction to the extent reasonably approved by the lender and qualified to issue the terrorism policy in accordance with applicable legal requirements; and (vii) the related policy will not contain a provision that terrorism coverage will expire or be excluded or limited in the event TRIPRA expires or is no longer in effect, so long as an insurance policy that does not contain such a provision is commercially available. See “Risk Factors—Risks Relating to the Mortgage Loans—Terrorism Insurance May Not Be Available for All Mortgaged Properties” in the prospectus.
This is not a research report and was not prepared by any Underwriter’s research department. Please see additional important information and qualifications at the end of this Term Sheet. |
| | T-43 | |
| Retail – Anchored | Loan #2 | Cut-off Date Balance: | | $79,000,000 |
| 1751 Palm Beach Lakes Boulevard | Marketplace at the Outlets | Cut-off Date LTV: | | 60.8% |
| West Palm Beach, FL 33401 | | UW NCF DSCR: | | 2.47x |
| | | UW NOI Debt Yield: | | 8.9% |
This is not a research report and was not prepared by any Underwriter’s research department. Please see additional important information and qualifications at the end of this Term Sheet. |
| | T-44 | |
| Retail – Anchored | Loan #2 | Cut-off Date Balance: | | $79,000,000 |
| 1751 Palm Beach Lakes Boulevard | Marketplace at the Outlets | Cut-off Date LTV: | | 60.8% |
| West Palm Beach, FL 33401 | | UW NCF DSCR: | | 2.47x |
| | | UW NOI Debt Yield: | | 8.9% |
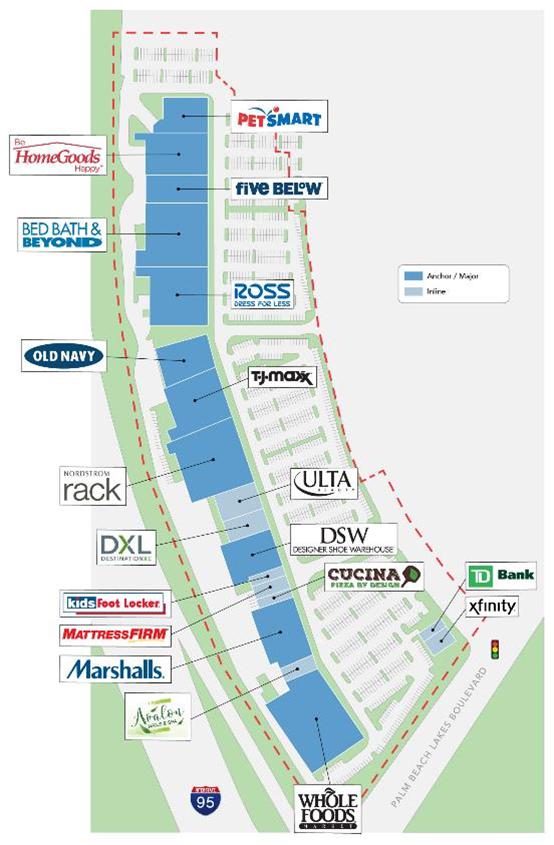
This is not a research report and was not prepared by any Underwriter’s research department. Please see additional important information and qualifications at the end of this Term Sheet. |
| | T-45 | |
| Retail – Anchored | Loan #2 | Cut-off Date Balance: | | $79,000,000 |
| 1751 Palm Beach Lakes Boulevard | Marketplace at the Outlets | Cut-off Date LTV: | | 60.8% |
| West Palm Beach, FL 33401 | | UW NCF DSCR: | | 2.47x |
| | | UW NOI Debt Yield: | | 8.9% |

This is not a research report and was not prepared by any Underwriter’s research department. Please see additional important information and qualifications at the end of this Term Sheet. |
| | T-46 | |
| Mortgage Loan No. 2 – Marketplace at the Outlets |
| Mortgage Loan Information | | Property Information |
| Mortgage Loan Seller: | WFB | | Single Asset/Portfolio: | Single Asset |
| Credit Assessment (DBRSM/Fitch/Moody’s): | NR/NR/NR | | Location: | West Palm Beach, FL 33401 |
| Original Balance: | $79,000,000 | | General Property Type: | Retail |
| Cut-off Date Balance: | $79,000,000 | | Detailed Property Type: | Anchored |
| % of Initial Pool Balance: | 6.6% | | Title Vesting: | Fee |
| Loan Purpose: | Acquisition | | Year Built/Renovated: | 2014/NAP |
| Borrower Sponsor: | Starwood Real Estate Income Trust, Inc. | | Size: | 300,830 SF |
| Guarantor: | Starwood REIT Operating Partnership, L.P. | | Cut-off Date Balance PSF: | $263 |
| Mortgage Rate: | 3.4540% | | Maturity Date Balance PSF: | $263 |
| Note Date: | 12/30/2021 | | Property Manager: | Self-managed |
| First Payment Date: | 2/11/2022 | | | |
| Maturity Date: | 1/11/2032 | | | |
| Original Term to Maturity: | 120 months | | Underwriting and Financial Information(3) |
| Original Amortization Term: | None | | |
| IO Period: | 120 months | | Underwriting and Financial Information(2) |
| Seasoning: | 1 month | | UW NOI(3): | $7,056,730 |
| Prepayment Provisions: | L(11),YM(14),DorYM(90),O(5) | | UW NOI Debt Yield: | 8.9% |
| Lockbox/Cash Mgmt Status: | Hard/Springing | | UW NOI Debt Yield at Maturity: | 8.9% |
| Additional Debt Type: | No | | UW NCF DSCR: | 2.47x |
| Additional Debt Balance: | NAP | | Most Recent NOI(3): | $6,046,373 (11/30/2021 TTM) |
| Future Debt Permitted (Type): | No (NAP) | | 2nd Most Recent NOI: | $5,986,427 (12/31/2020) |
| Reserves(1) | | 3rd Most Recent NOI: | $6,355,218 (12/31/2019) |
| Type | Initial | Monthly | Cap | | Most Recent Occupancy: | 100.0% (1/1/2022) |
| RE Taxes: | $156,213 | $156,210 | NAP | | 2nd Most Recent Occupancy: | 94.2% (12/31/2020) |
| Insurance: | $143,305 | $14,331 | NAP | | 3rd Most Recent Occupancy: | 100.0% (12/31/2019) |
| Replacement Reserve: | $0 | $3,219 | $115,880 | | Appraised Value (as of): | $130,000,000 (11/23/2021) |
| Leasing Reserve: | $0 | $16,095 | $579,402 | | Appraised Value PSF: | $432 |
| Existing TI/LC Obligations: | $376,399 | $0 | NAP | | Cut-off Date LTV Ratio: | 60.8% |
| Rent Concession Reserve: | $40,300 | $0 | NAP | | Maturity Date LTV Ratio: | 60.8% |
| | | | | | | |
| Sources and Uses |
| Sources | Proceeds | % of Total | | Uses | Proceeds | % of Total |
| Loan Amount: | $79,000,000 | 59.2% | | Purchase Price: | $130,000,000 | 97.4% |
| Borrower Equity: | $54,418,755 | 40.8% | | Closing Costs: | $2,702,538 | 2.0% |
| | | | | Reserves: | $716,217 | 0.5% |
| Total Sources: | $133,418,755 | 100.0% | | Total Uses: | $133,418,755 | 100.0% |
| (1) | See “Escrows and Reserves” below. |
| (2) | The novel coronavirus pandemic is an evolving situation and could impact the Marketplace at the Outlets Mortgage Loan (as defined below) more severely than assumed in the underwriting of the Marketplace at the Outlets Mortgage Loan and could adversely affect the NOI, NCF and occupancy information, as well as the appraised value and the DSCR, LTV and Debt Yield metrics presented above and herein. See "Risk Factors-—Risks Related to Market Conditions and Other External Factors—The Coronavirus Pandemic Has Adversely Affected the Global Economy and Will Likely Adversely Affect the Performance of the Mortgage Loans" in the prospectus. |
| (3) | The increase Net Operating Income from TTM 11/30/2021 to UW was driven by new leases being signed for the Whole Foods expansion space and Marshalls (see “Operating History and Underwritten Net Cash Flow” below). |
The Mortgage Loan. The second largest mortgage loan (the “Marketplace at the Outlets Mortgage Loan”) is evidenced by a promissory note in the original principal amount of $79,000,000 and secured by the fee interest in an anchored retail property located in West Palm Beach, Florida (the “Marketplace at the Outlets Property”).
The Borrower and the Borrower Sponsor. The borrower is SREIT Palm Beach Lakes BLVD., L.L.C., a Delaware limited liability company and single purpose entity with two independent directors. The borrower sponsor is Starwood Real Estate Income Trust, Inc., and the non-recourse carveout guarantor is Starwood REIT Operating Partnership, L.P.
Starwood REIT Operating Partnership, L.P. is an affiliate of Starwood Real Estate Income Trust, Inc. (“Starwood”). Founded in 1991, Starwood employs over 4,000 employees across 16 offices worldwide. As of October 31, 2021, Starwood had approximately $100 billion of assets under management and $65 billion of equity capital raised since inception.
This is not a research report and was not prepared by any Underwriter’s research department. Please see additional important information and qualifications at the end of this Term Sheet. |
| | T-47 | |
| Retail – Anchored | Loan #2 | Cut-off Date Balance: | | $79,000,000 |
| 1751 Palm Beach Lakes Boulevard | Marketplace at the Outlets | Cut-off Date LTV: | | 60.8% |
| West Palm Beach, FL 33401 | | UW NCF DSCR: | | 2.47x |
| | | UW NOI Debt Yield: | | 8.9% |
The Property. The Marketplace at the Outlets Property is an anchored retail center located in West Palm Beach, Florida totaling 300,830 SF. Built in 2014, the property is situated on a 27.7-acre site and is anchored by Whole Foods Market, Nordstrom Rack, Bed Bath & Beyond, Ross Dress for Less, T.J. Maxx, Marshalls, HomeGoods, DSW, Old Navy, PetSmart and Five Below, which collectively account for approximately 89.1% of NRA and 81.1% of underwritten base rent. Additional tenants include ULTA, Mattress Firm, Kids Foot Locker and TD Bank. The Marketplace at the Outlets Property is adjacent to Palm Beach Outlets (not part of the collateral), which is an approximately 460,000 SF outlet center with major tenants including Saks Off Fifth, Polo Ralph Lauren, Nike Factory Store and Forever 21. The property contains 1,262 surface parking spaces, resulting in a parking ratio of 4.2 spaces per 1,000 SF of rentable area. As of January 1, 2022, the Marketplace at the Outlets Property was 100.0% leased, and the property has averaged 97.2% occupancy since 2015.
Major Tenants.
Whole Foods Market (43,318 SF; 14.4% of NRA; 13.6% of underwritten base rent). Whole Foods Market has been a tenant since 2015 and has two leases expiring in 2035 with six, five-year renewal options remaining. Whole Foods Market originally occupied a 41,434 SF space and recently executed a lease for a 1,884 SF expansion space (the “Whole Foods Expansion Space”). The tenant is not yet in occupancy or paying rent on the Whole Foods Expansion Space, which is expected to be delivered by February 2022 with a projected opening date four weeks post-delivery. The tenant does not have any termination options and is not required to report sales.
Nordstrom Rack (36,102 SF; 12.0% of NRA; 11.8% of underwritten base rent). Nordstrom Rack has been a tenant since 2014 and has a lease expiring in October 2024 with four, five-year renewal options remaining. The tenant does not have any termination options and is not required to report sales.
Bed Bath & Beyond (32,400 SF; 10.8% of NRA; 7.7% of underwritten base rent). Bed Bath & Beyond has been a tenant since 2014 and has a lease expiring in January 2025 with three, five-year renewal options remaining. The tenant does not have any termination options and is not required to report sales.
The following table presents certain information relating to the tenancy at the Marketplace at the Outlets Property:
| Tenant Summary |
| Tenant Name | Credit Rating (Fitch/Moody's/ S&P)(1) | Tenant SF | Approx. % of SF | Annual UW Rent(2) | % of Total Annual UW Rent | Annual UW Rent PSF(2) | | Renewal Options |
| Termination Option (Y/N) | Lease Expiration |
| Major Tenants | | | | | | | | | |
| Whole Foods Market(2) | NR/A1/AA- | 43,318 | 14.4% | $971,953 | 13.6% | $22.44 | N | Various(2) | 6 x 5 yr |
| Nordstrom Rack | BBB-/Ba1/BB+ | 36,102 | 12.0% | $844,065 | 11.8% | $23.38 | N | 10/31/2024 | 4 x 5 yr |
| Bed Bath & Beyond | NR/Ba3/B+ | 32,400 | 10.8% | $550,800 | 7.7% | $17.00 | N | 1/31/2025 | 3 x 5 yr |
| Ross Dress for Less | NR/A2/BBB+ | 27,065 | 9.0% | $554,833 | 7.8% | $20.50 | N | 1/31/2026 | 4 x 5 yr |
| T.J. Maxx | NR/A2/A | 25,100 | 8.3% | $527,100 | 7.4% | $21.00 | N | 10/31/2024 | 4 x 5 yr |
| Marshalls(3) | NR/A2/A | 22,368 | 7.4% | $492,096 | 6.9% | $22.00 | N | 2/28/2032 | 4 x 5 yr |
| HomeGoods | NR/A2/A | 21,621 | 7.2% | $464,852 | 6.5% | $21.50 | N | 11/30/2027 | 4 x 5 yr |
| DSW | NR/NR/NR | 17,347 | 5.8% | $438,879 | 6.2% | $25.30 | N | 1/31/2025 | 2 x 5 yr |
| Total/Wtd. Avg. | | 225,321 | 74.9% | $4,844,578 | 67.9% | $21.50 | | | |
| | | | | | | | | | |
| Non-Major Tenants | | 75,509 | 25.1% | $2,287,996 | 32.1% | $30.30 | | | |
| Occupied Collateral Total | | 300,830 | 100.0% | $7,132,574 | 100.0% | $23.71 | | | |
| Vacant Space | | 0 | 0.0% | | | | | | |
| Total | | 300,830 | 100.0% | $7,132,574 | 100.0% | $23.71 | | | |
| (1) | Certain ratings are those of the parent company whether or not the parent guarantees the lease. |
| (2) | Whole Foods Market occupies two spaces: 41,434 SF with an Annual UW Rent PSF of $21.73 and lease expiration date of February 28, 2035; and the Whole Foods Expansion Space (1,884 SF with an Annual UW Rent PSF of $38.00 and lease expiration date of April 30, 2035). Both leases have six, five-year renewal options remaining. The tenant has a signed lease for the Whole Foods Expansion Space but is not yet in occupancy or paying rent on such space. The Whole Foods Expansion Space is expected to be delivered by February 2022 with a projected opening date four weeks post-delivery, and the tenant is required to commence paying rent on such space the earlier of (i) 90 days after delivery or (ii) the first date the space is put to active use. The seller credited the borrower sponsor an amount equal to $700,000 (the “Whole Foods Escrow Funds”), which is currently held by the title company. The lender has a lien and security interest on the Whole Foods Escrow Funds, and the title company is required to transfer an amount equal to $7,647 to the Marketplace at the Outlets Mortgage Loan lockbox account on the first day of each calendar month until Whole Foods Market has commenced paying full unabated rent on the Whole Foods Expansion Space. The Whole Foods Escrow Funds may also be used for payment of punchlist items and leasing commissions in connection with the Whole Foods Market lease. For the avoidance of doubt, Whole Foods Market is currently in occupancy and paying rent on its original 41,434 SF space. |
| (3) | Marshalls has a signed lease but is not yet in occupancy or paying rent. The Marshalls space is expected to be delivered on March 18, 2022 with a projected grand opening date of April 14, 2022. The seller credited the borrower sponsor an amount equal to $3,200,000 (the “Marshalls General Escrow Funds”), as well as an amount equal to $2,603,939 (the “Marshalls Work Escrow Funds”) for work on the Marshalls space, which are currently held by the title company. The lender has a lien and security interest on the Marshalls General Escrow Funds and the Marshalls Work Escrow Funds, and the title company is required to transfer an amount equal to $57,971 to the Marketplace at the Outlets Mortgage Loan lockbox account on the first day of each calendar month until Marshalls has commenced paying full unabated rent. Marshalls General Escrow Funds are also available to pay leasing commissions in relation to the Marshalls lease and under certain conditions may be reallocated to the Marshalls Work Escrow Funds. |
This is not a research report and was not prepared by any Underwriter’s research department. Please see additional important information and qualifications at the end of this Term Sheet. |
| | T-48 | |
| Retail – Anchored | Loan #2 | Cut-off Date Balance: | | $79,000,000 |
| 1751 Palm Beach Lakes Boulevard | Marketplace at the Outlets | Cut-off Date LTV: | | 60.8% |
| West Palm Beach, FL 33401 | | UW NCF DSCR: | | 2.47x |
| | | UW NOI Debt Yield: | | 8.9% |
The following table presents a summary of sales and occupancy costs for certain tenants at the Marketplace at the Outlets Property.
| Tenant Sales(1)(2) |
| | 2019 Sales (PSF) | 2020 Sales (PSF) | TTM 9/30/2021 Sales (PSF) | Occupancy Cost(3) |
| T.J. Maxx | NAV | $389 | NAV | 8.3% |
| HomeGoods | NAV | $353 | NAV | 9.3% |
| DSW | $245 | $154 | $212 | 18.6% |
| (1) | Information obtained from the borrower. |
| (2) | Tenants shown on the Tenant Summary table above and not included on the Tenant Sales table are not required to report sales. |
| (3) | Occupancy cost based on underwritten base rent and reimbursements divided by most recent reported sales. |
The following table presents certain information relating to the lease rollover schedule at the Marketplace at the Outlets Property:
| Lease Rollover Schedule(1)(2) |
| Year | # of Leases Rolling | SF Rolling | UW Rent PSF Rolling | Approx. % of Total SF Rolling | Approx. Cumulative % of SF Rolling | Total UW Rent Rolling | Approx. % of Total Rent Rolling | Approx. Cumulative % of Total Rent Rolling |
| 2022 | 0 | 0 | $0.00 | 0.0% | 0.0% | $0 | 0.0% | 0.0% |
| 2023 | 0 | 0 | $0.00 | 0.0% | 0.0% | $0 | 0.0% | 0.0% |
| 2024 | 2 | 61,202 | $22.40 | 20.3% | 20.3% | $1,371,165 | 19.2% | 19.2% |
| 2025 | 6 | 80,009 | $23.65 | 26.6% | 46.9% | $1,891,816 | 26.5% | 45.7% |
| 2026 | 3 | 44,499 | $22.37 | 14.8% | 61.7% | $995,655 | 14.0% | 59.7% |
| 2027 | 1 | 21,621 | $21.50 | 7.2% | 68.9% | $464,852 | 6.5% | 66.2% |
| 2028 | 1 | 6,200 | $28.60 | 2.1% | 71.0% | $177,320 | 2.5% | 68.7% |
| 2029 | 2 | 17,588 | $29.87 | 5.8% | 76.8% | $525,348 | 7.4% | 76.1% |
| 2030 | 1 | 2,026 | $71.57 | 0.7% | 77.5% | $145,000 | 2.0% | 78.1% |
| 2031 | 1 | 1,999 | $48.71 | 0.7% | 78.2% | $97,369 | 1.4% | 79.5% |
| 2032 | 1 | 22,368 | $22.00 | 7.4% | 85.6% | $492,096 | 6.9% | 86.4% |
| 2033 & Beyond | 2 | 43,318 | $22.44 | 14.4% | 100.0% | $971,953 | 13.6% | 100.0% |
| Vacant | 0 | 0 | $0.00 | 0.0% | 100.0% | $0 | 0.0% | 100.0% |
| Total/Wtd. Avg. | 20 | 300,830 | $23.71(3) | 100.0% | | $7,132,574 | 100.0% | |
| (1) | Information is based on the underwritten rent roll. |
| (2) | Certain tenants may have lease termination options that are exercisable prior to the originally stated expiration date of the related lease and are not considered in the rollover schedule. |
| (3) | Wtd. Avg. UW Rent PSF Rolling excludes vacant space. |
COVID-19 Update. As of January 5, 2022, the Marketplace at the Outlets Property was open and operating with no outstanding tenant rent relief agreements.
The Market.The Marketplace at the Outlets Property is located at the northwestern corner of Palm Beach Lakes Boulevard and Executive Center Drive in the West Palm Beach community of Palm Beach County. The property also has approximately one mile of direct frontage along Interstate 95, which provides regional access to the surrounding neighborhood. The property is located within a heavily commercialized pocket of West Palm Beach. Okeechobee Boulevard (located south of the property) and Belvedere Road are considered to be main commuter roadway through central Palm Beach County and serve to connect the western parts of the county with the eastern portion. The surrounding neighborhood comprises a variety of uses with retail and commercial uses front the major roadways and single and multifamily dwellings predominantly on the secondary roadways. According to the appraisal, the estimated 2021 population within a three- and five-mile radius was approximately 112,429 and 230,722, respectively, and the average household income within the same radii was $71,193 and $74,883, respectively.
According to a third party market research report, the Marketplace at the Outlets Property is located within the West Palm Beach submarket of the Palm Beach retail market. As of January 2022, the submarket reported total inventory of approximately 16.1 million SF with a 3.7% vacancy rate and average asking rent of $23.08 PSF. The appraiser concluded to market rents for the Marketplace at the Outlets Property ranging from $21.00 PSF for anchor space to $65.00 PSF for outparcel space (see table below).
This is not a research report and was not prepared by any Underwriter’s research department. Please see additional important information and qualifications at the end of this Term Sheet. |
| | T-49 | |
| Retail – Anchored | Loan #2 | Cut-off Date Balance: | | $79,000,000 |
| 1751 Palm Beach Lakes Boulevard | Marketplace at the Outlets | Cut-off Date LTV: | | 60.8% |
| West Palm Beach, FL 33401 | | UW NCF DSCR: | | 2.47x |
| | | UW NOI Debt Yield: | | 8.9% |
The following table presents certain information relating to the appraisal’s market rent conclusion for the Marketplace at the Outlets Property:
| Market Rent Summary |
| | Anchor | Junior Anchor | Major | Inline | Outparcel |
| Market Rent (PSF) | $21.00 | $22.50 | $28.50 | $47.50 | $65.00 |
| Lease Term (Years) | 10 | 10 | 10 | 10 | 10 |
Lease Type (Reimbursements) | Net | Net | Net | Net | Net |
| Rent Increase Projection | 10.0% in Year 6 | 10.0% in Year 6 | 10.0% in Year 6 | 10.0% in Year 6 | 10.0% in Year 6 |
The table below presents certain information relating to comparable retail property sales pertaining to the Marketplace at the Outlets Property:
| Comparable Sales |
Property Name | Location | Rentable Area (SF) | Anchors | Sale Date | Sale Price (PSF) | Appraiser’s Adjusted Sale Price (PSF) |
| Village Plaza at Bunker Hill | 9710 Kay Freeway Houston, TX | 491,667 | HEB, Academy, Burlington, Nordstrom Rack, Sam Moon, PetSmart | 12/2020 | $447.44 | $514.56 |
| Village on the Parkway | 5100 Belt Line Road Dallas, TX | 343,989 | AMC Theater 9, Whole Foods, 24 Hour Fitness (Vacant), Sidecar Social | 5/2021 | $334.31 | $434.60 |
| The Markets at Town Center | 4871 Town Center Parkway Jacksonville, FL | 254,228 | Rooms to Go, Nordstrom Rack, West Marine, Sprouts, REI | 11/2021 | $365.81 | $402.39 |
| Blakeney Shopping Center / Blakeney Crossing | 9870 Rea Road Charlotte, NC | 384,180 | Marshalls/HomeGoods, Harris Teeter, Best Buy, PetSmart, Off Broadway Shoes, Old Navy | 11/2021 | $471.13 | $424.02 |
Source: Appraisal
This is not a research report and was not prepared by any Underwriter’s research department. Please see additional important information and qualifications at the end of this Term Sheet. |
| | T-50 | |
| Retail – Anchored | Loan #2 | Cut-off Date Balance: | | $79,000,000 |
| 1751 Palm Beach Lakes Boulevard | Marketplace at the Outlets | Cut-off Date LTV: | | 60.8% |
| West Palm Beach, FL 33401 | | UW NCF DSCR: | | 2.47x |
| | | UW NOI Debt Yield: | | 8.9% |
Operating History and Underwritten Net Cash Flow. The following table presents certain information relating to the historical operating performance and Underwritten Net Cash Flow at the Marketplace at the Outlets Property:
| Cash Flow Analysis |
| | 2018 | 2019 | 2020 | 11/30/2021 TTM | UW | UW PSF |
| Base Rent | $6,278,266 | $6,571,966 | $6,744,796 | $6,517,740 | $7,132,574 | $23.71 |
| IG Rent Averaging Credit | $0 | $0 | $0 | $0 | $113,335(1) | $0.38 |
| Gross Potential Rent | $6,278,266 | $6,571,966 | $6,744,796 | $6,517,740 | $7,245,909 | $24.09 |
| | | | | | | |
| Other Income | $54 | $5,100 | $165,000 | $0 | $0 | $0.00 |
| Percentage Rent | $13,868 | $26,621 | $141,441 | $0 | $41,335 | $0.14 |
| Total Recoveries | $2,649,739 | $2,816,638 | $2,708,751 | $2,629,997 | $3,659,405 | $12.16 |
| Net Rental Income | $8,941,927 | $9,420,325 | $9,759,988 | $9,147,737 | $10,946,649 | $36.39 |
| (Vacancy & Credit Loss) | $0 | $0 | ($737,563) | $0 | ($269,273)(2) | ($0.90) |
| Effective Gross Income | $8,941,927 | $9,420,325 | $9,022,425 | $9,147,737 | $10,677,376 | $35.49 |
| | | | | | | |
| Real Estate Taxes | $1,725,731 | $1,782,927 | $1,818,923 | $1,789,856 | $2,500,644 | $8.31 |
| Insurance | $129,502 | $210,039 | $310,445 | $348,116 | $167,938 | $0.56 |
| Management Fee | $272,126 | $292,029 | $309,606 | $328,805 | $320,321 | $1.06 |
| Other Operating Expenses | $772,206 | $780,112 | $597,024 | $634,587 | $631,743 | $2.10 |
| Total Operating Expenses | $2,899,565 | $3,065,107 | $3,035,998 | $3,101,364 | $3,620,646 | $12.04 |
| | | | | | | |
| Net Operating Income | $6,042,362 | $6,355,218 | $5,986,427 | $6,046,373(3) | $7,056,730(3) | $23.46 |
| Replacement Reserves | $0 | $0 | $0 | $0 | $38,627 | $0.13 |
| TI/LC | $0 | $0 | $0 | $0 | $193,134 | $0.64 |
| Net Cash Flow | $6,042,362 | $6,355,218 | $5,986,427 | $6,046,373 | $6,824,969 | $22.69 |
| | | | | | | |
| Occupancy % | 100.0% | 100.0% | 94.2% | 92.3%(4) | 97.5%(2) | |
| NOI DSCR | 2.18x | 2.30x | 2.16x | 2.19x | 2.55x | |
| NCF DSCR | 2.18x | 2.30x | 2.16x | 2.19x | 2.47x | |
| NOI Debt Yield | 7.6% | 8.0% | 7.6% | 7.7% | 8.9% | |
| NCF Debt Yield | 7.6% | 8.0% | 7.6% | 7.7% | 8.6% | |
| (1) | Represents straight-line rent averaging for investment grade tenants Whole Foods Market, Marshalls, TD Bank and Comcast. |
| (2) | The underwritten economic vacancy is 2.5%. The Marketplace at the Outlets Property was 100.0% occupied as of January 1, 2022. |
| (3) | The increase in Net Operating Income from TTM 11/30/2021 to UW was driven by new leases being signed for the Whole Foods expansion space (1,884 SF; Annual UW Base Rent of $71,592; Recoveries of $21,907) and Marshalls (Annual UW Base Rent of $492,096; Recoveries of $244,654). |
| (4) | Represents occupancy as of September 2021. |
Escrows and Reserves.
Real Estate Taxes – The loan documents require an upfront deposit of $156,213 for real estate taxes and ongoing monthly deposits of $156,210. Notwithstanding the foregoing, the borrower is not required to deposit funds with respect to any taxes that are paid directly by tenants pursuant to the terms of their leases provided that (i) such tenant is not in default under the terms of its lease and (ii) the borrower delivers evidence reasonably acceptable to the lender that such taxes have been paid prior to delinquency.
Insurance – The loan documents require an upfront deposit of $143,305 for insurance and ongoing monthly deposits of $14,331.
Replacement Reserve – The loan documents require ongoing monthly replacement reserve deposits of $3,219 subject to a cap of $115,880.
Leasing Reserve – The loan documents require ongoing monthly reserves of $16,095 for tenant improvements and leasing commissions, subject to a cap of $579,402.
Existing TI/LC Obligations Reserve – The loan documents require an upfront deposit of $376,399 for outstanding tenant improvements and leasing commissions related to Nail Lease Work ($153,131) and Casual Male Work ($223,268).
Rent Concession Reserve – The loan documents require an upfront deposit of $40,300 for certain future rent credits or abatements related to tenant Casual Male.
Holdback Escrow Agreement – In addition to the reserves held by the lender, the borrower has collaterally assigned its rights in a holdback escrow agreement between the seller of the Marketplace at the Outlets Property, the borrower and Chicago Title Company (“Chicago Title”), pursuant to which Chicago Title is holding an amount equal to $6,503,939 as security for completion of work by the seller, leasing commissions and rent concessions under
This is not a research report and was not prepared by any Underwriter’s research department. Please see additional important information and qualifications at the end of this Term Sheet. |
| | T-51 | |
| Retail – Anchored | Loan #2 | Cut-off Date Balance: | | $79,000,000 |
| 1751 Palm Beach Lakes Boulevard | Marketplace at the Outlets | Cut-off Date LTV: | | 60.8% |
| West Palm Beach, FL 33401 | | UW NCF DSCR: | | 2.47x |
| | | UW NOI Debt Yield: | | 8.9% |
the Marshalls and Whole Foods Market (for the Whole Foods Expansion Space) leases. The aforementioned funds include the Whole Foods Escrow Funds, the Marshalls General Escrow Funds and the Marshalls Work Escrow Funds (see footnotes to the Cash Flow Analysis table above).
Lockbox and Cash Management. The Marketplace at the Outlets Mortgage Loan is structured with a hard lockbox with springing cash management. The borrower is required to deposit all rents within two business days of receipt, and to direct all tenants to make direct rent deposits into the lockbox account. As long as a Cash Trap Event Period is not in effect, all funds in the lockbox account are required to be distributed to the borrower. During a Cash Trap Event Period, all excess funds in the lockbox account are required to be swept to a lender-controlled cash management account.
A “Cash Trap Event Period” will commence upon the earliest of the following:
| (i) | the occurrence of an event of default; |
| (ii) | the net operating income debt service coverage ratio (“NOI DSCR”) falling below 1.30x for two consecutive calendar quarters; |
| (iii) | the borrower filing for bankruptcy (or a similar insolvency proceeding); |
| (iv) | Whole Foods (a) vacating or failing to occupy its space, (b) ceasing to operate its business at the Marketplace at the Outlets Property, or giving written notice of such; (c) becoming subject of a bankruptcy action or defaulting under its lease beyond applicable notice and cure periods; or (d) terminating its lease or giving written notice of its intent to terminate its lease. |
A Cash Trap Event Period will end upon the occurrence of the following:
| ● | with regard to clause (i), the cure of such event of default; |
| ● | with regard to clause (ii), (a) the NOI DSCR being greater than or equal to 1.30x for two consecutive calendar quarters; (b) the borrower prepaying the mortgage loan in an amount such that that the NOI DSCR is no less than 1.30x; or (c) the borrower delivering to the lender cash or letter of credit in an amount equal to the amount by which net operating income would need to increase in order to achieve an NOI DSCR equal to 1.30x (the “DSCR Cure Collateral”), provided that the DSCR Cure Collateral will be held by the lender as additional collateral for the mortgage loan and will be returned to the borrower upon the earlier of (x) the occurrence of a Cash Trap Event Period cure pursuant to clause (a) or (b) of this paragraph, and (y) the repayment of the mortgage loan in full; |
| ● | with regard to clause (iii), such bankruptcy action being discharged, stayed or dismissed within 90 days of filing; or |
| ● | with regard to clause (iv), (I) the borrower having entered into one or more replacement leases demising all or substantially all of the Whole Foods Space; (II) there being no outstanding tenant improvements, tenant improvement allowances or leasing commissions due and payable under the replacement leases (unless such amounts were reserved with the lender); and (III) such replacement tenant having taken occupancy of its space, opened for business and commenced payment of full, unabated rent (unless any outstanding abated rent was reserved with the lender); or with respect to a Cash Trap Event Period triggered by clause (iv)(c) above, (A) the dismissal of such bankruptcy action; (B) Whole Foods no longer being insolvent or subject to any bankruptcy action; and (C) Whole Foods having assumed its lease and has provided adequate assurances for the repayment of rent thereunder. |
Additional Secured Indebtedness (not including trade debts). None.
Mezzanine Loan and Preferred Equity.None.
Release of Property. From and after the prepayment lockout date, the borrower may obtain the release of the certain outparcel building totaling 6,026 SF of rentable area and currently occupied by Comcast and TD Bank from the lien of the Marketplace at the Outlets Mortgage Loan, provided the following conditions, among others, are satisfied: (i) no event of default is continuing; (ii) the borrower prepays the Marketplace at the Outlets Mortgage Loan in an amount equal to $5,733,440, in addition to any required yield maintenance premium; and (iii) the debt yield following the release is no less than the greater of the debt yield at origination (8.55%) and the debt yield immediately prior to the release (provided that the borrower will be permitted to prepay the mortgage loan or post cash or a letter of credit with the lender in an amount to satisfy such debt yield).
In addition, at any time, the borrower may obtain the release of a certain parking parcel containing 53 parking spaces from the lien of the Marketplace at the Outlets Mortgage Loan and the substitution of an adjacent parking parcel, also containing 53 parking spaces, upon the satisfaction of certain conditions outlined in the loan documents.
Right of First Offer/Right of First Refusal. None.
Ground Lease. None.
Letter of Credit. None.
Terrorism Insurance. The loan documents require that the “all risk” insurance policy required to be maintained by the borrower provides coverage for terrorism in an amount equal to the full replacement cost of the Marketplace at the Outlets Property, as well as business interruption insurance covering no less than the 18-month period following the occurrence of a casualty event, together with a 12-month extended period of indemnity.
This is not a research report and was not prepared by any Underwriter’s research department. Please see additional important information and qualifications at the end of this Term Sheet. |
| | T-52 | |
(THIS PAGE INTENTIONALLY LEFT BLANK)
This is not a research report and was not prepared by any Underwriter’s research department. Please see additional important information and qualifications at the end of this Term Sheet. |
| | T-53 | |
| Multifamily – High Rise | Loan #3 | Cut-off Date Balance: | | $75,000,000 |
| 333 River Street | 333 River Street | Cut-off Date LTV: | | 34.5% |
| Hoboken, NJ 07030 | | U/W NCF DSCR: | | 5.22x |
| | | U/W NOI Debt Yield: | | 12.4% |
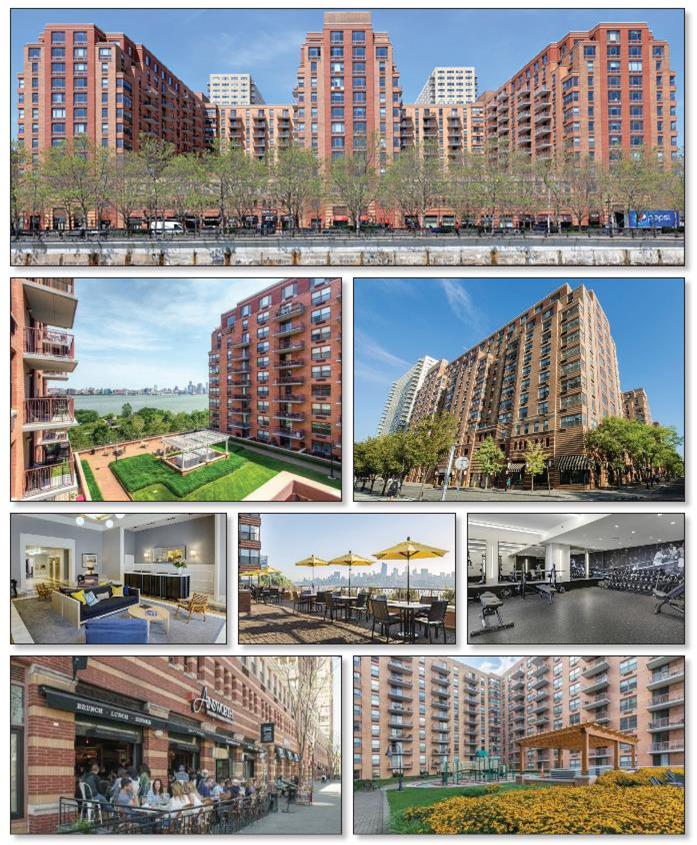
This is not a research report and was not prepared by any Underwriter’s research department. Please see additional important information and qualifications at the end of this Term Sheet. |
| | T-54 | |
| Multifamily – High Rise | Loan #3 | Cut-off Date Balance: | | $75,000,000 |
| 333 River Street | 333 River Street | Cut-off Date LTV: | | 34.5% |
| Hoboken, NJ 07030 | | U/W NCF DSCR: | | 5.22x |
| | | U/W NOI Debt Yield: | | 12.4% |

This is not a research report and was not prepared by any Underwriter’s research department. Please see additional important information and qualifications at the end of this Term Sheet. |
| | T-55 | |
| Mortgage Loan No. 3 – 333 River Street |
| Mortgage Loan Information | | Property Information |
| Mortgage Loan Seller: | MSMCH | | Single Asset/Portfolio: | Single Asset |
| Credit Assessment (DBRSM/Fitch/Moody’s): | A(high)/BBB-sf/A1 | | Location: | Hoboken, NJ 07030 |
| Original Balance(1): | $75,000,000 | | General Property Type: | Multifamily |
| Cut-off Date Balance(1): | $75,000,000 | | Detailed Property Type: | High Rise |
| % of Initial Pool Balance: | 6.2% | | Title Vesting: | Leasehold |
| Loan Purpose: | Refinance | | Year Built/Renovated: | 2002 / NAP |
| Borrower Sponsor: | Ironstate Holdings LLC | | Size: | 526 Units |
| Guarantor(2): | NAP | | Cut-off Date Balance per Unit(1): | $237,643 |
| Mortgage Rate: | 2.3150% | | Maturity Date Balance per Unit(1): | $237,643 |
| Note Date: | 12/30/2021 | | Property Manager: | Ironstate Properties LLC |
| First Payment Date: | 2/1/2022 | | | (borrower-related) |
| Maturity Date: | 1/1/2032 | | Underwriting and Financial Information(6) |
| Original Term to Maturity: | 120 months | | UW NOI(7): | $15,447,134 |
| Original Amortization Term: | 0 months | | UW NOI Debt Yield(1): | 12.4% |
| IO Period: | 120 months | | UW NOI Debt Yield at Maturity(1): | 12.4% |
| Seasoning: | 1 month | | UW NCF DSCR(1): | 5.22x |
| Prepayment Provisions(3): | L(25),D(88),O(7) | | Most Recent NOI(7): | $12,690,258 (10/31/2021 TTM) |
| Lockbox/Cash Mgmt Status: | Springing/Springing | | 2nd Most Recent NOI(7): | $15,578,296 (12/31/2020) |
| Additional Debt Type(1)(4): | Pari Passu | | 3rd Most Recent NOI(7): | $17,611,758 (12/31/2019) |
| Additional Debt Balance(1)(4): | $50,000,000 | | Most Recent Occupancy: | 99.6% (12/1/2021) |
| Future Debt Permitted (Type): | No (NAP) | | 2nd Most Recent Occupancy: | 76.3% (12/31/2020) |
| Reserves(5) | | 3rd Most Recent Occupancy: | 97.4% (12/31/2019) |
| Type | Initial | Monthly | Cap | | Appraised Value (as of): | $362,000,000 (10/28/2021) |
| RE Taxes: | $0 | Springing | NAP | | Appraised Value per Unit: | $688,213 |
| Insurance: | $0 | Springing | NAP | | Cut-off Date LTV Ratio(1): | 34.5% |
| Replacement Reserve: | $0 | Springing | NAP | | Maturity Date LTV Ratio(1): | 34.5% |
| | | | | | |
| Sources and Uses |
| Sources | Proceeds | % of Total | | Uses | Proceeds | % of Total |
| Whole Loan Amount: | $125,000,000 | 98.8% | | Loan Payoff: | $125,372,601 | 99.0% |
| Borrower Equity: | $1,575,640 | 1.2% | | Closing Costs: | $1,203,039 | 1.0% |
| Total Sources: | $126,575,640 | 100.0% | | Total Uses: | $126,575,640 | 100.0% |
| (1) | The 333 River Street Mortgage Loan (as defined below) is a part of the 333 River Street Whole Loan (as defined below) with an original aggregate principal balance of $125,000,000. The Cut-off Date Balance Per Unit, Maturity Date Balance Per Unit, UW NOI Debt Yield, UW NOI Debt Yield at Maturity, UW NCF DSCR, Cut-off Date LTV Ratio and Maturity Date LTV Ratio numbers presented above are based on the aggregate principal balance of the promissory notes comprising the 333 River Street Whole Loan. |
| (2) | There is no non-recourse carveout guarantor or separate environmental indemnitor for the 333 River Street Whole Loan. |
| (3) | Defeasance of the 333 River Street Whole Loan is permitted at any time after the earlier of (i) February 1, 2025, or (ii) two years from the closing date of the securitization that includes the last pari |
passu note of the 333 River Street Whole Loan to be securitized. The assumed defeasance lockout period of 25 payments is based on the closing date of this transaction in February 2022.
| (4) | See “The Mortgage Loan” and “Additional Secured Indebtedness (not including trade debts).” |
| (5) | See “Escrows and Reserves” below for further discussion of reserve requirements. |
| (6) | The novel coronavirus pandemic is an evolving situation and could impact the 333 River Street Whole Loan more severely than assumed in the underwriting of the 333 River Street Whole Loan and could adversely affect the NOI, NCF and occupancy information, as well as the appraised value and the DSCR, LTV and Debt Yield metrics presented above and herein. See "Risk Factors—Risks Related to Market Conditions and Other External Factors—The Coronavirus Pandemic Has Adversely Affected the Global Economy and Will Likely Adversely Affect the Performance of the Mortgage Loans" in the prospectus. |
| (7) | The decrease between 3rd Most Recent NOI to 2nd Most Recent NOI and 2nd Most Recent NOI to Most Recent NOI is a result of elevated economic vacancy rates due to the coronavirus pandemic. Additionally, during the earlier months of the pandemic, the borrower was offering a 1-month concession on 13-month leases, a 2-month concession on 14-month leases and a 3-month concession on 15-month leases. The increase between Most Recent NOI and UW NOI is primarily due to the burn off of discounts and concessions. Remaining concessions are expected to burn off in 2022. The underwriting assumes that no concessions remain outstanding. |
The Mortgage Loan. The third largest mortgage loan (the “333 River Street Mortgage Loan”) is part of a whole loan (the “333 River Street Whole Loan”) evidenced by two pari passu promissory notes in the aggregate original principal amount of $125,000,000 and secured by a first priority leasehold mortgage encumbering a multifamily property located in Hoboken, New Jersey (the “333 River Street Property”). The controlling Note A-1, in the original principal amount of $75,000,000, represents the 333 River Street Mortgage Loan and will be included in the BANK 2022-BNK39 securitization trust. The non-controlling Note A-2, in the original principal amount of $50,000,000, is expected to be contributed to one or more future securitizations (the “333 River Street Serviced Pari Passu Companion Loan”). The 333 River Street Whole Loan will be serviced pursuant to the pooling and servicing agreement for the BANK 2022-BNK39 securitization trust. See “Description of the Mortgage Pool—The Whole Loans—The Serviced Pari Passu Whole Loans” and “Pooling and Servicing Agreement” in the prospectus.
This is not a research report and was not prepared by any Underwriter’s research department. Please see additional important information and qualifications at the end of this Term Sheet. |
| | T-56 | |
| Multifamily – High Rise | Loan #3 | Cut-off Date Balance: | | $75,000,000 |
| 333 River Street | 333 River Street | Cut-off Date LTV: | | 34.5% |
| Hoboken, NJ 07030 | | U/W NCF DSCR: | | 5.22x |
| | | U/W NOI Debt Yield: | | 12.4% |
| 333 River Street Whole Loan Summary |
| Note | Original Balance | Cut-off Date Balance | Note Holder | Controlling Piece |
| A-1 | $75,000,000 | $75,000,000 | BANK 2022-BNK39 | Yes |
| A-2 | $50,000,000 | $50,000,000 | Morgan Stanley Bank, N.A. | No |
| Total | $125,000,000 | $125,000,000 | | |
| | | | | |
The Borrower and the Borrower Sponsor. The borrower is Hoboken South Waterfront Associates, L.P., a single-purpose New Jersey limited partnership with one independent director in its organizational structure. The borrower sponsor is Ironstate Holdings LLC, which is owned by Michael Barry and David Barry. There is no non-recourse carveout guarantor or separate environmental indemnitor with respect to the 333 River Street Whole Loan. Ironstate Development (“Ironstate”), is a Hoboken-based real estate development company that has a history of developing properties in established urban centers. Ironstate owns residential properties along the Hudson waterfront in New Jersey in developments that include The Shipyard and Jersey City Urby among others.
The Property. The 333 River Street Property is comprised of the borrower’s leasehold interest in a multifamily property comprised of 526 market rate apartments within a 13-story luxury residential tower, which also includes 56,462 SF of retail space on the ground floor, and a below grade parking garage with 584 spaces (of which 250 are reserved for residents). The 333 River Street Property offers its residents a comprehensive amenity package including a 24-hour doorman, full-service concierge, health club, private landscaped courtyards, on-site parking, and expansive views of Manhattan. Unit amenities include stainless steel gas range/ovens, microwaves, washer/dryer, dishwashers, and balconies. The 333 River Street Property was originally developed in 2002. During the 7-year period between 2015 and 2021, the borrower spent an additional approximately $13.47 million in upgrades, including roof and HVAC replacement, the upgrading of individual units with plank flooring, installation of cabinets for Verizon FIOS adaption, the removal of popcorn ceilings and the remodeling of the children’s playroom and the aerobics room. The apartment unit mix is comprised of studio, one-, two- and three-bedroom units ranging in average size from 714 – 1,428 SF with an average of 923 SF. As of December 1, 2021, the 333 River Street Property is 99.6% occupied at an average contract rent of $3,695 per unit per month. Of the 526 units, 33 units representing 6.3% of the units are exclusively marketed as corporate furnished units and three units are model units with no income associated.
The 333 River Street Property includes 56,462 SF of retail space located along Sinatra Drive and River Street. The retail space serves as an amenity for the residents and ferry commuters as its tenants include two educational institutions (Steven's Institute and Bright Horizon Child), two restaurants (The Ainsworth and Union Hall), and a wine store. The retail space is 47.3% leased to 6 tenants. Historically, the retail space has been occupied with an average occupancy of 94.9% during the four-year period between 2017 and 2020. However, the occupancy of the retail space decreased in December 2020 due to the loss of King’s Super Market, a former tenant who leased 14,863 SF at the 333 River Street Property since January 2002. The residential units generate approximately 95.5% of the base rent at the 333 River Street Property while the retail tenants generate approximately 4.5% of the base rent at the 333 River Street Property.
The borrower sponsor was selected by the City of Hoboken (the “City”) and the Port Authority of New York & New Jersey (the “Port Authority”) to lead the development of the 333 River Street Property as part of their program to develop and economically revitalize the Hoboken waterfront. The Port Authority leased the land to the City pursuant to a prime ground lease (the “Prime Ground Lease”) and owns the air space above the land. Pursuant to the Ground Lease and Development Agreement dated December 17, 1999 (the “Ground Lease”), the City subleased the land to the borrower and the Port Authority leased the air space above the land to the borrower for a term of 99 years whereby the borrower would ground lease the site and construct the 333 River Street Property. Pursuant to the terms of the Ground Lease and Development Agreement, the borrower is obligated to pay (i) fixed ground rent, (ii) payments in lieu of taxes, (iii) percentage rent, and (iv) development association dues for operating and maintenance expenses associated with the sidewalks adjacent to the site and the subsurface structures of Piers A and C. See “Ground Lease” below.
The table below shows the residential apartment unit mix at the 333 River Street Property:
| Apartment Unit Mix |
| Unit Mix / Type | Total Units | Leased Units | % Leased | Average SF per Unit | Monthly Average Rent per Unit | Monthly Average Rent PSF |
| Studio | 38 | | 37 | 97.4% | 714 | | $2,745 | $3.87 |
| One Bedroom | 265 | | 265 | 100.0% | 733 | | $3,157 | $4.31 |
| Two Bedroom | 177 | | 176 | 99.4% | 1,120 | | $4,192 | $3.74 |
| Three Bedroom | 46 | | 46 | 100.0% | 1,428 | | $5,658 | $3.96 |
| Total/Average | 526 | | 524 | 99.6% | 923 | | $3,695 | $4.05 |
Source: Borrower rent roll dated December 1, 2021.
The Market. The 333 River Street Property is located in Hoboken, New Jersey in the Hoboken multifamily submarket in the New York multifamily market. Hoboken is part of the New York metropolitan area and is the site of Hoboken Terminal, a major transportation center for the region. NJ Transit's Main Line, Bergen County Line, Pascack Valley Line, Montclair-Boonton Line, Morris and Essex Lines and Meadowlands Rail Line terminate at the Hoboken Terminal. The Hudson-Bergen Light Rail has three stations in Hoboken: Hoboken Terminal, 2nd Street and 9th Street-Congress Street. PATH is a 24-hour subway system that operates from Hoboken Terminal to 33rd Street Manhattan, World Trade Center, Journal Square and Newark Penn Station. Hoboken also offers its residents two piers that provide various ferry services to Manhattan. According to the appraisal, as of the second quarter of 2021, the vacancy rate in the Hoboken multifamily submarket was approximately 7.4%, with average asking rents of $3,499 per unit and inventory of approximately 9,761 units. According to the appraisal, as of the second quarter of 2021, the vacancy rate in the New York multifamily market was approximately 3.3%, with average asking rents of $2,787 per unit and inventory of approximately 1.43 million units.
This is not a research report and was not prepared by any Underwriter’s research department. Please see additional important information and qualifications at the end of this Term Sheet. |
| | T-57 | |
| Multifamily – High Rise | Loan #3 | Cut-off Date Balance: | | $75,000,000 |
| 333 River Street | 333 River Street | Cut-off Date LTV: | | 34.5% |
| Hoboken, NJ 07030 | | U/W NCF DSCR: | | 5.22x |
| | | U/W NOI Debt Yield: | | 12.4% |
The following table presents certain information relating to comparable multifamily rental properties to the 333 River Street Property:
| Comparable Rental Properties |
| Property | Year Built | # Units | Unit Mix | Average SF per Unit | Average Monthly Rent per Unit | Average Monthly Rent PSF |
333 River Street Property(1) Hoboken, NJ | 2002 | 526 | Studio 1BR 2BR 3BR | 714 733 1,120 1,428 | $2,745 $3,157 $4,192 $5,658 | $3.87 $4.31 $3.74 $3.96 |
2 Twelfth Street Hoboken, NJ | 2003 | 150 | Studio 1BR 2BR 3BR | 579 822 1,219 1,495 | $2,430 $3,010 $4,390 $6,133 | $4.20 $3.66 $3.60 $4.10 |
1 14th Street Hoboken, NJ | 1999 | 138 | Studio 1BR 2BR 3BR | 508 739 1,541 1,068 | $2,375 $2,889 $4,152 $5,592 | $4.68 $3.91 $2.69 $5.24 |
770 Jackson Street Hoboken, NJ | 2019 | 424 | Studio 1BR 2BR 3BR | 478 754 1,071 1,408 | $2,388 $3,524 $4,680 $6,074 | $5.00 $4.67 $4.37 $4.31 |
300 Adams Street Hoboken, NJ | 1976 | 196 | Studio 1BR 2BR 3BR 4BR | 450 650 800 900 1,050 | $1,884 $2,031 $2,653 $2,842 $3,148 | $4.19 $3.12 $3.32 $3.16 $3.00 |
77 Park Avenue Hoboken, NJ | 2000 | 301 | Studio 1BR 2BR 3BR | 659 789 1,233 1,486 | $2,777 $3,079 $4,175 $5,521 | $4.21 $3.90 $3.38 $3.72 |
1330-1350 Willow Avenue Hoboken, NJ | 2016 | 140 | Studio 1BR 2BR 3BR | 555 768 1,134 1,450 | $2,622 $3,312 $4,253 $5,549 | $4.72 $4.31 $3.75 $3.83 |
51 Garden Street Hoboken, NJ | 1989 | 115 | 1BR 2BR 3BR | 608 812 1,078 | $3,022 $3,267 $4,517 | $4.97 $4.02 $4.19 |
300-320 Grand Street Hoboken, NJ | 1896 | 99 | Studio 1BR 2BR 3BR 4BR | 500 780 770 1,658 1,800 | $1,985 $2,394 $2,995 $4,308 $4,569 | $3.97 $3.07 $3.89 $2.60 $2.54 |
1 Walter Barry Independence Court Hoboken, NJ | 2007 | 185 | Studio 1BR 2BR 3BR | 508 808 1,193 1,762 | $2,538 $3,241 $4,236 $6,066 | $5.00 $4.01 $3.55 $3.44 |
Source: Appraisal, unless otherwise indicated.
| (1) | Based on the borrower rent roll dated December 1, 2021. |
The following table presents certain information relating to the appraisal’s market rent conclusion for the 333 River Street Property:
| Market Rent Summary |
| Unit Mix / Type | Units(1) | Average Unit
Size (SF)(1) | Avg. Monthly
Rent per Unit(1) | Avg. Monthly Rent PSF(1) | Avg. Monthly
Market Rent
per Unit(2) | Avg. Monthly
Market Rent PSF(2) |
| Studio | 38 | 714 | | $2,745 | $3.87 | $3,045 | $4.27 |
| One Bedroom | 265 | 733 | | $3,157 | $4.31 | $3,545 | $4.84 |
| Two Bedroom | 177 | 1,120 | | $4,192 | $3.74 | $4,713 | $4.21 |
| Three Bedroom | 46 | 1,428 | | $5,658 | $3.96 | $6,050 | $4.24 |
| (1) | Based on the borrower rent roll dated December 1, 2021. |
| (2) | Based on the appraisal. |
This is not a research report and was not prepared by any Underwriter’s research department. Please see additional important information and qualifications at the end of this Term Sheet. |
| | T-58 | |
| Multifamily – High Rise | Loan #3 | Cut-off Date Balance: | | $75,000,000 |
| 333 River Street | 333 River Street | Cut-off Date LTV: | | 34.5% |
| Hoboken, NJ 07030 | | U/W NCF DSCR: | | 5.22x |
| | | U/W NOI Debt Yield: | | 12.4% |
Operating History and Underwritten Net Cash Flow. The following table presents certain information relating to the historical operating performance and Underwritten Net Cash Flow for the 333 River Street Property:
| Cash Flow Analysis |
| | 2018 | 2019 | 2020 | 10/31/2021 TTM | UW | UW per Unit |
| Gross Potential Rent(1) | $22,860,013 | $23,339,718 | $23,888,996 | $23,650,193 | $23,452,020 | $44,585.59 |
| Other Income(2) | $3,999,942 | $4,094,147 | $3,906,568 | $4,003,066 | $3,303,458 | $6,280.34 |
| Reimbursements | $514,355 | $533,047 | $543,524 | $399,643 | $291,576 | $554.33 |
| Discounts Concessions | $0 | $0 | ($558,913) | ($2,038,694) | $0 | $0.00 |
| Vacancy & Credit Loss | ($917,822) | ($667,694) | ($2,188,574) | ($3,000,092) | ($1,285,393) | ($2,443.71) |
| Effective Gross Income | $26,456,488 | $27,299,219 | $25,591,601 | $23,014,116 | $25,761,661 | $48,976.54 |
| | | | | | | |
| Real Estate Taxes(3) | $2,085,557 | $2,168,979 | $2,327,544 | $2,403,185 | $2,251,251 | $4,279.94 |
| Insurance | $264,024 | $262,999 | $275,166 | $297,245 | $322,355 | $612.84 |
| Ground Lease(4) | $2,069,173 | $2,077,229 | $2,060,476 | $2,034,605 | $2,324,981 | $4,420.12 |
| Other Expenses | $5,146,775 | $5,178,253 | $5,350,119 | $5,588,823 | $5,415,941 | $10,296.47 |
| Total Expenses | $9,565,529 | $9,687,460 | $10,013,305 | $10,323,858 | $10,314,528 | $19,609.37 |
| | | | | | | |
| Net Operating Income(5) | $16,890,959 | $17,611,758 | $15,578,296 | $12,690,258 | $15,447,134 | $29,367.17 |
| Capital Expenditures | $0 | $0 | $0 | $0 | $131,500 | $250.00 |
| Net Cash Flow | $16,890,959 | $17,611,758 | $15,578,296 | $12,690,258 | $15,315,634 | $29,117.17 |
| | | | | | | |
| Occupancy % | 94.0% | 97.4% | 76.3% | 99.6%(1) | 95.0% | |
| NOI DSCR(6) | 5.76x | 6.00x | 5.31x | 4.33x | 5.26x | |
| NCF DSCR(6) | 5.76x | 6.00x | 5.31x | 4.33x | 5.22x | |
| NOI Debt Yield(6) | 13.5% | 14.1% | 12.5% | 10.2% | 12.4% | |
| NCF Debt Yield(6) | 13.5% | 14.1% | 12.5% | 10.2% | 12.3% | |
| (1) | UW Gross Potential Rent and 10/31/2021 TTM Occupancy % are based on the borrower rent roll dated December 1, 2021. |
| (2) | Other Income is comprised of (i) base rent paid by the retail tenants, (ii) parking income, (iii) storage income, and (iv) other income. |
| (3) | The borrower is required to make payments in lieu of real estate taxes as described below under Ground Lease. Real Estate Taxes has been underwritten based on the appraiser’s estimate of the payment in lieu of real estate taxes for the 2021/2022 tax year. |
| (4) | Ground Lease is comprised of (i) fixed ground rent and (ii) percentage rent. The fixed ground rent has been underwritten in the amount of $2,071,031 based on the average fixed ground rent due over the loan term. The percentage rent has been underwritten to 1.0% of the underwritten Effective Gross Income. |
| (5) | The decrease in Net Operating Income from 2019 to 2020 and 2020 to 10/31/2021 TTM is a result of elevated economic vacancy rates due to the coronavirus pandemic. Additionally, during the earlier months of the pandemic, the borrower was offering a 1-month concession on 13-month leases, a 2-month concession on 14-month leases and a 3-month concession on 15-month leases. The increase in Net Operating Income between 10/31/2021 TTM and UW is primarily due to the burn off of discounts and concessions. Remaining concessions are expected to burn off in 2022. The underwriting assumes that no concessions remain outstanding. |
| (6) | Debt service coverage ratios and debt yields are based on the 333 River Street Whole Loan. |
Escrows and Reserves.
Real Estate Taxes – The 333 River Street Whole Loan documents provide that the borrower is not required to reserve for real estate taxes, provided that (i) no event of default is continuing under the 333 River Street Whole Loan and (ii) the borrower provides the lender reasonably acceptable evidence that all real estate taxes then due and payable with respect to the 333 River Street Property have been paid in full prior to the date such taxes would (if not paid) be delinquent and subject to the imposition of penalties (the “Delinquency Date”), which evidence must be provided to the lender prior to the Delinquency Date. If at any time such conditions are not satisfied, the borrower is required during such time to make ongoing monthly deposits into a reserve for real estate taxes in an amount equal to 1/12 of the real estate taxes that the lender estimates will be payable during the next twelve months for the 333 River Street Property.
Insurance –The 333 River Street Whole Loan documents provide that the borrower is not required to reserve for insurance premiums, provided that (i) no event of default is continuing under the 333 River Street Whole Loan, (ii) the liability and casualty insurance coverage for the 333 River Street Property is included in a blanket policy approved by the lender in its reasonable discretion, and (iii) the borrower provides the lender with paid receipts for payment of the insurance premiums and provide evidence of renewals of the insurance policies, no later than ten days prior to the expiration of the current policy. If at any time such conditions are not satisfied, the borrower is required during such time to make ongoing monthly deposits into a reserve for insurance premiums in an amount equal to 1/12 of the insurance premiums that the lender estimates will be payable for the renewal of coverage upon the expiration of the insurance policies.
Replacement Reserve –The 333 River Street Whole Loan documents provide that the borrower is not required to reserve for capital expenditures, provided that no event of default is continuing under the 333 River Street Whole Loan. If at any time such condition is not satisfied, the borrower is required during such time to make ongoing monthly deposits of approximately $10,958 into a capital expenditure reserve.
This is not a research report and was not prepared by any Underwriter’s research department. Please see additional important information and qualifications at the end of this Term Sheet. |
| | T-59 | |
| Multifamily – High Rise | Loan #3 | Cut-off Date Balance: | | $75,000,000 |
| 333 River Street | 333 River Street | Cut-off Date LTV: | | 34.5% |
| Hoboken, NJ 07030 | | U/W NCF DSCR: | | 5.22x |
| | | U/W NOI Debt Yield: | | 12.4% |
Lockbox and Cash Management. The 333 River Street Whole Loan is structured with a springing lockbox and springing cash management. Upon the first occurrence of a Cash Sweep Event Period (as defined below), the borrower is required to establish and maintain a lockbox account for the benefit of the lender, and the borrower and property manager are required, during the continuance of the Cash Sweep Event Period, to direct all tenants to deposit all rents directly into the lockbox account, and to deposit all rents received by the borrower or property manager, despite such direction, into the lockbox account within one business day of receipt. Upon the first occurrence of a Cash Sweep Event Period, the lender is required to establish, and the borrower is required to cooperate with the cash management bank to establish, a lender-controlled cash management account, into which all funds in the lockbox account will be required to be deposited, so long as the Cash Sweep Event Period is continuing. During the continuance of a Cash Sweep Event Period, provided no event of default under the 333 River Street Whole Loan documents is continuing, all funds in the cash management account are required to be applied on each monthly payment date: (i) to make the monthly deposits into the real estate tax and insurance reserves, if any, as described above under “Escrows and Reserves,” (ii) to pay debt service on the 333 River Street Whole Loan, (iii) to make the monthly deposits into the replacement reserve, if any, as described above under “Escrows and Reserves,” (iv) to pay operating expenses set forth in the annual budget (which is required to be approved by the lender during a Cash Sweep Event Period) and lender-approved extraordinary expenses, and (v) to deposit any remainder into an excess cash flow reserve to be held as additional security for the 333 River Street Whole Loan during the continuance of such Cash Sweep Event Period. If no Cash Sweep Event Period is continuing, all funds in the excess cash flow subaccount are required to be disbursed to the borrower.
“Cash Sweep Event Period” means a period commencing upon an event of default under the 333 River Street Whole Loan documents and ending upon the cure, if applicable, of such event of default.
Additional Secured Indebtedness (not including trade debts). The 333 River Street Property also secures the remaining 333 River Street Serviced Pari Passu Companion Loan, which has a Cut-off Date principal balance of $50,000,000. The 333 River Street Serviced Pari Passu Companion Loan accrues interest at the same rate as the 333 River Street Mortgage Loan. The 333 River Street Mortgage Loan and the 333 River Street Serviced Pari Passu Companion Loan are pari passu in right of payment. The holders of the 333 River Street Mortgage Loan and the 333 River Street Serviced Pari Passu Companion Loan have entered into a co-lender agreement which sets forth the allocation of collections on the 333 River Street Whole Loan. See “Description of the Mortgage Pool—The Whole Loans—The Serviced Pari Passu Whole Loans” in the prospectus.
Mezzanine Loan and Preferred Equity. Not permitted.
Release of Property. Not permitted.
Right of First Offer / Right of First Refusal. None.
Ground Lease. Pursuant to the Prime Ground Lease, thePort Authority ground leased the land underlying the 333 River Street Property to the City and pursuant to the Ground Lease, the City subleased the land underlying the 333 River Street Property to the borrower and thePort Authority leased the air space above the land to the borrower, each for a term of 99 years expiring December 16, 2098. Pursuant to the terms of the Ground Lease, the borrower is obligated to pay (i) fixed ground rent, (ii) percentage rent, (iii) payments in lieu of taxes and (iv) development association dues for operating and maintenance expenses associated with the sidewalks adjacent to the site and the subsurface structures of Piers A and C (the “O&M Area”), as described in more detail below.
| ● | Fixed Ground Rent.The Ground Lease provides for fixed annual ground rent, payable to the Port Authority, in monthly installments. Annual ground rent through December 16, 2022 is $1,800,896, from December 17, 2022 through December 16, 2027 is $1,980,986, from December 17, 2027 through December 16, 2032 is $2,179,084, from December 17, 2032 through December 16, 2037 is $2,396,993, and from December 17, 2037 through December 16, 2042 is $2,684,632, and continues to increase every five-year interval thereafter, such that it is $8,893,506 at the termination of the ground lease. |
| ● | Percentage Ground Rent.The ground lessee is required to pay the Port Authority a percentage rent in an amount equal to 1.0% of all gross revenues, payable semi-annually. The percentage rent has been underwritten to 1.0% of the underwritten effective gross income. |
| ● | PILOT Rental.The 333 River Street Property is not subject to the imposition of the payment of real estate taxes, and instead the property owner is responsible to make a payment in lieu of taxes ("PILOT Rental") to the City for the remainder of the term of the Ground Lease. The annual PILOT Rental is due and payable in four quarterly installments, each equal to one-quarter of the annual obligation. The quarterly payments are due on February 1, May 1, August 1 and November 1. The PILOT Rental commenced on the 25th month of the Ground Lease with an initial payment of $2.00 per development square footage. The PILOT Rental increases each year by a rate equal to the greater of 2.0% or the percentage increase in the tax rate in effect on January 1 of such calendar year compared to the tax rate in effect on January 1 of the immediately preceding calendar year, but in no event will the percentage increase exceed 4.0%. |
| ● | Development Association Dues. The groundlessee is required to pay to the O&M Board (a board that administers the operation and maintenance of the O&M Area) an amount equal to the product of (i) the applicable O&M rate (currently estimated at $0.50, and increased annually by consumer price index increases) and (ii) the greater of (x) 599,000 SF and (y) the actual number of development SF contained in the 333 River Street Property. |
Letter of Credit. None.
Terrorism Insurance. The borrowers are required to obtain and maintain an “all risk” or “special form” property insurance policy that covers acts of terrorism in an amount equal to the “full replacement cost” of the 333 River Street Property, together with business income insurance covering the 18-month period commencing at the time of loss. Notwithstanding the foregoing, for so long as the Terrorism Risk Insurance Act of 2002, as extended and modified by the Terrorism Risk Insurance Program Reauthorization Act of 2015 (“TRIPRA”), is in effect (including any extensions thereof or if another federal governmental program is in effect relating to “acts of terrorism” which provides substantially similar protections as TRIPRA), the lender is required to accept terrorism insurance which covers against “covered acts” as defined by TRIPRA (or such other program) but only in the event that TRIPRA (or such other program) continues to cover both domestic and foreign acts of terrorism. See “Risk Factors—Risks Relating to the Mortgage Loans—Terrorism Insurance May Not Be Available for All Mortgaged Properties” in the prospectus.
This is not a research report and was not prepared by any Underwriter’s research department. Please see additional important information and qualifications at the end of this Term Sheet. |
| | T-60 | |
(THIS PAGE INTENTIONALLY LEFT BLANK)
This is not a research report and was not prepared by any Underwriter’s research department. Please see additional important information and qualifications at the end of this Term Sheet. |
| | T-61 | |
| Property Types – Various | Loan #4 | Cut-off Date Balance: | | $73,460,000 |
| Property Addresses – Various | ExchangeRight Net Leased Portfolio #52 | Cut-off Date LTV: | | 61.9% |
| | | U/W NCF DSCR: | | 2.31x |
| | | U/W NOI Debt Yield: | | 8.6% |
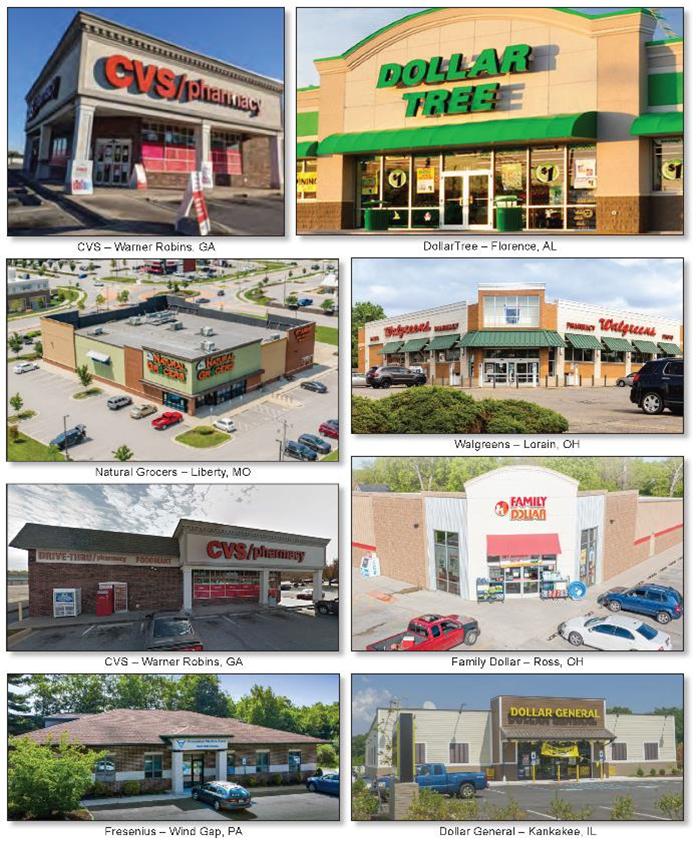
This is not a research report and was not prepared by any Underwriter’s research department. Please see additional important information and qualifications at the end of this Term Sheet. |
| | T-62 | |
| Property Types – Various | Loan #4 | Cut-off Date Balance: | | $73,460,000 |
| Property Addresses – Various | ExchangeRight Net Leased Portfolio #52 | Cut-off Date LTV: | | 61.9% |
| | | U/W NCF DSCR: | | 2.31x |
| | | U/W NOI Debt Yield: | | 8.6% |
![[GRAPHIC]](https://capedge.com/proxy/FWP/0001539497-22-000071/n2893tsimg015a.jpg)
This is not a research report and was not prepared by any Underwriter’s research department. Please see additional important information and qualifications at the end of this Term Sheet. |
| | T-63 | |
| Mortgage Loan No. 4 – ExchangeRight Net Leased Portfolio #52 |
| Mortgage Loan Information | | Property Information |
| Mortgage Loan Seller: | MSMCH | | Single Asset/Portfolio: | Portfolio |
| Credit Assessment (DBRSM/Fitch/Moody’s): | NR/NR/NR | | Location(2): | Various |
| Original Balance: | $73,460,000 | | General Property Type(2): | Various |
| Cut-off Date Balance: | $73,460,000 | | Detailed Property Type(2): | Various |
| % of Initial Pool Balance: | 6.1% | | Title Vesting: | Fee |
| Loan Purpose: | Acquisition | | Year Built/Renovated(2): | Various / Various |
| Borrower Sponsors: | David Fisher, Warren Thomas, Joshua | | Size: | 445,241 SF |
| | Ungerecht and ExchangeRight Real | | Cut-off Date Balance Per SF: | $165 |
| | Estate, LLC | | Maturity Date Balance Per SF: | $165 |
| Guarantors: | David Fisher, Warren Thomas, | | Property Manager: | NLP Management, LLC |
| | Joshua Ungerecht and ExchangeRight | | | (borrower-related) |
| | Real Estate, LLC | | | |
| Mortgage Rate: | 3.4650% | | | |
| Note Date: | 11/30/2021 | | | |
| First Payment Date: | 1/1/2022 | | | |
| Maturity Date: | 12/1/2031 | | | |
| Original Term to Maturity: | 120 months | | | |
| Original Amortization Term: | 0 months | | | |
| IO Period: | 120 months | | Underwriting and Financial Information(3) |
| Seasoning: | 2 months | | UW NOI: | $6,289,013 |
| Prepayment Provisions: | L(26),D(89),O(5) | | UW NOI Debt Yield: | 8.6% |
| Lockbox/Cash Mgmt Status: | Hard/Springing | | UW NOI Debt Yield at Maturity: | 8.6% |
| Additional Debt Type: | No | | UW NCF DSCR: | 2.31x |
| Additional Debt Balance: | NAP | | Most Recent NOI(4): | NAV |
| Future Debt Permitted (Type): | No (NAP) | | 2nd Most Recent NOI(4): | NAV |
| Reserves(1) | | 3rd Most Recent NOI(4): | NAV |
| Type | Initial | Monthly | Cap | | Most Recent Occupancy: | 100.0% (2/1/2022) |
| RE Taxes: | $17,647 | $14,751 | NAP | | 2nd Most Recent Occupancy(4): | NAV |
| Insurance: | $0 | Springing | NAP | | 3rd Most Recent Occupancy(4): | NAV |
| Capital Expenditures: | $0 | $3,982 | NAP | | Appraised Value (as of)(5): | $118,635,000 (Various) |
| Deferred Maintenance: | $47,086 | $0 | NAP | | Appraised Value per SF: | $266 |
| TI/LC Reserve: | $500,000 | Springing | NAP | | Cut-off Date LTV Ratio: | 61.9% |
| Environmental Reserve: | $351,560 | $0 | NAP | | Maturity Date LTV Ratio: | 61.9% |
| | | | | | | |
| Sources and Uses |
| Sources | Proceeds | % of Total | | Uses | Proceeds | % of Total |
| Mortgage Loan Amount: | $73,460,000 | 61.3% | | Purchase Price: | $117,577,441 | 98.1% |
| Borrower Equity: | $46,448,151 | 38.7% | | Closing Costs: | $1,414,417 | 1.2% |
| | | | | Reserves: | $916,293 | 0.8% |
| Total Sources: | $119,908,151 | 100.0% | | Total Uses: | $119,908,151 | 100.0% |
| (1) | See “Escrows and Reserves” section below for further discussion of reserve requirements. |
| (2) | See “The Properties” section below. |
| (3) | The novel coronavirus pandemic is an evolving situation and could impact the ExchangeRight Net Leased Portfolio #52 Mortgage Loan (as defined below) more severely than assumed in the underwriting of the ExchangeRight Net Leased Portfolio #52 Mortgage Loan and could adversely affect the NOI, NCF and occupancy information, as well as the appraised value and the DSCR, LTV and Debt Yield metrics presented above and herein. See "Risk Factors—Risks Related to Market Conditions and Other External Factors—The Coronavirus Pandemic Has Adversely Affected the Global Economy and Will Likely Adversely Affect the Performance of the Mortgage Loans" in the prospectus. |
| (4) | Historical occupancy and NOI are unavailable because the ExchangeRight Properties (as defined below) were acquired by the borrower between July 1, 2021 and October 26, 2021. |
| (5) | The individual appraised value as-of dates are between October 4, 2021 and November 9, 2021. |
The Mortgage Loan. The fourth largest mortgage loan (the “ExchangeRight Net Leased Portfolio #52 Mortgage Loan”) is evidenced by a promissory note in the original principal amount of $73,460,000 and secured by the fee interests in 26 net leased, single-tenant retail and medical office properties located in fifteen states (the “ExchangeRight Properties”).
The Borrower and the Borrower Sponsors. The borrower for the ExchangeRight Net Leased Portfolio #52 Mortgage Loan is ExchangeRight Net-Leased Portfolio 52 DST, a Delaware statutory trust with at least one independent trustee. The borrower sponsors are David Fisher, Warren Thomas, Joshua Ungerecht and ExchangeRight Real Estate, LLC. ExchangeRight Real Estate, LLC has more than 17 million SF of commercial properties under management and owns more than 950 investment-grade retail and multifamily properties located in 40 states. ExchangeRight Real Estate, LLC and its three owners, David Fisher, Warren Thomas and Joshua Ungerecht (collectively, the “Individual Guarantors”), are the guarantors of certain non-recourse carveout liabilities under the ExchangeRight Net Leased Portfolio #52 Mortgage Loan.
This is not a research report and was not prepared by any Underwriter’s research department. Please see additional important information and qualifications at the end of this Term Sheet. |
| | T-64 | |
| Property Types – Various | Loan #4 | Cut-off Date Balance: | | $73,460,000 |
| Property Addresses – Various | ExchangeRight Net Leased Portfolio #52 | Cut-off Date LTV: | | 61.9% |
| | | U/W NCF DSCR: | | 2.31x |
| | | U/W NOI Debt Yield: | | 8.6% |
The borrower has master leased the ExchangeRight Properties to a master tenant (the “ExchangeRight Net Leased Portfolio #52 Master Tenant”) owned by ExchangeRight Real Estate, LLC. The ExchangeRight Net Leased Portfolio #52 Master Tenant is a Delaware limited liability company structured to be bankruptcy-remote, with one independent director. The master lease generally imposes responsibility on the ExchangeRight Net Leased Portfolio #52 Master Tenant for the operation, maintenance and management of the ExchangeRight Properties and payment of all expenses incurred in the maintenance and repair of the ExchangeRight Properties, other than capital expenses. The ExchangeRight Net Leased Portfolio #52 Master Tenant’s interest in all tenant rents was assigned to the borrower, which in turn collaterally assigned its interest to the lender. The master lease is subordinate to the ExchangeRight Net Leased Portfolio #52 Mortgage Loan and, upon an event of default under the ExchangeRight Net Leased Portfolio #52 Mortgage Loan, the lender has the right to cause the borrower to terminate the master lease. A default under the master lease is an event of default under the ExchangeRight Net Leased Portfolio #52 Mortgage Loan and gives rise to recourse liability to the non-recourse carveout guarantors for losses, unless such default arises solely in connection with the failure of the ExchangeRight Net Leased Portfolio #52 Master Tenant to pay rent as a result of the ExchangeRight Properties not generating sufficient cash flow for the payment of such rent.
The lender has the right to require the borrower to convert from a Delaware statutory trust to a limited liability company upon (i) an event of default or the lender’s good faith determination of imminent default under the ExchangeRight Net Leased Portfolio #52 Mortgage Loan, (ii) the lender’s good faith determination that the borrower will be unable to make a material decision or take a material action required in connection with the operation and maintenance of the ExchangeRight Properties, and (iii) 90 days prior to the maturity date of the ExchangeRight Net Leased Portfolio #52 Mortgage Loan, if an executed commitment from an institutional lender to refinance the ExchangeRight Net Leased Portfolio #52 Mortgage Loan is not delivered to the lender.
At any time after November 30, 2022, the borrower sponsors have the right to effect a one-time transfer of all (but not less than all) of the outstanding ownership interests in the borrower to an Approved Transferee (as defined below) and to replace the non-recourse carveout guarantors as the person who controls the borrower with such Approved Transferee; provided that certain conditions are satisfied, including among others: (i) no event of default has occurred and is continuing, (ii) the Approved Transferee owns 100% of the beneficial ownership interests in, and controls, the borrower and ExchangeRight Net Leased Portfolio #52 Master Tenant, (iii) the Approved Transferee executes a full payment guarantee and indemnity pursuant to which it agrees to be liable (from and after the transfer) for all indemnity obligations (including environmental liabilities and obligations) for which the existing non-recourse carveout guarantors are liable under the non-recourse carveout guaranty, (iv) the delivery of an enforceability opinion and a non-consolidation opinion and (v) if required by the lender, the receipt of confirmation from each rating agency that such transfer and guarantor replacement will not result in a downgrade of the respective ratings assigned to the BANK 2022-BNK39 certificates (such a transfer and replacement, a “Qualified Transfer”). A Cash Management Period (as defined below) will be triggered if a Qualified Transfer does not occur by the payment date in December 2028 (36 months prior to the maturity date of the ExchangeRight Net Leased Portfolio #52 Mortgage Loan). See “Lockbox and Cash Management” below. In addition, at any time after November 30, 2022, the borrower sponsors have the right to effect a one-time transfer of all (but not less than all) of the outstanding ownership interests in the borrower to an Approved REIT (as defined below) or a wholly owned subsidiary thereof that meets the requirements of a Qualified Transferee (as defined below) and to replace the non-recourse carveout guarantors as the person who controls the borrower with such Approved REIT.
"Approved Transferee" means (A) an eligible institution that is or is wholly-owned and controlled by a bank, savings and loan association, investment bank, insurance company, trust company, real estate investment trust, commercial credit corporation, pension plan, pension fund or pension advisory firm, mutual fund, government entity or plan or institution similar to any of the foregoing or (B) any person that (1) is a Qualified Transferee, (2) is regularly engaged in the business of owning or operating commercial properties, or interests therein, which are similar to the ExchangeRight Properties, (3) owns interests in, or operates, at least five retail properties with a minimum of 750,000 SF in the aggregate, (4) maintains either (i) a net worth of at least $200,000,000 and total assets of at least $400,000,000, or (ii) an investment grade rating by S&P or Moody’s, (5) at all times owns no less than 100% of the legal and beneficial ownership of the borrower, (6) is not a Delaware statutory trust, and (7) subject to certain exceptions, causes a conversion of the borrower into a Delaware limited liability company.
“Qualified Transferee” means a transferee that (i) has never been indicted or convicted of, or pled guilty or no contest to, a felony, (ii) has never been indicted or convicted of, or pled guilty or no contest to, a Patriot Act offense and is not on any government watch list, (iii) has never been the subject of a voluntary or involuntary (to the extent the same has not been discharged) bankruptcy proceeding, (iv) has no material outstanding judgments, litigations or regulatory actions against it or its interests and (v) is not crowdfunded.
“Approved REIT” means a real estate investment trust that (i) meets the requirements of a Qualified Transferee and for whom the lender receives a reasonably acceptable credit check; (ii) is at all times (a) owned, directly or indirectly, by the Individual Guarantors in an amount that is equal to or greater than the lesser of 1% of all equity interests and equity interests valued at not less than $15,000,000, and (b) under the control of one or more persons that (1) meet the requirements of a Qualified Transferee and for whom the lender receives a reasonably acceptable credit check, and (2) is at all times owned, directly or indirectly, by the Individual Guarantors in an amount not less than 51% of all equity interests, and controlled by the Individual Guarantors; and (iii) is otherwise reasonably acceptable to the lender in all respects.
This is not a research report and was not prepared by any Underwriter’s research department. Please see additional important information and qualifications at the end of this Term Sheet. |
| | T-65 | |
| Property Types – Various | Loan #4 | Cut-off Date Balance: | | $73,460,000 |
| Property Addresses – Various | ExchangeRight Net Leased Portfolio #52 | Cut-off Date LTV: | | 61.9% |
| | | U/W NCF DSCR: | | 2.31x |
| | | U/W NOI Debt Yield: | | 8.6% |
The Properties.The ExchangeRight Properties are comprised of 26 single-tenant retail and medical office properties totaling 445,241 SF and located across fifteen states. The ExchangeRight Properties are located in Ohio (five properties, 39.8% of NRA and 25.3% of underwritten rent), Iowa (one property, 11.6% of NRA and 8.7% of underwritten rent), Georgia (four properties, 11.3% of NRA and 8.2% of underwritten rent), Illinois (three properties, 5.2% of NRA and 9.0% of underwritten rent), and New York (one property, 4.3% of NRA and 4.5% of underwritten rent) with the twelve remaining ExchangeRight Properties located in Alabama, Missouri, Connecticut, Massachusetts, Pennsylvania, New Hampshire, Minnesota, Wisconsin, New Mexico, and Indiana. Built between 1965 and 2021, with four of the 26 properties built in 2021, the ExchangeRight Properties range in size from 3,336 SF to 136,914 SF.
The ExchangeRight Properties are leased to the following twelve nationally recognized tenants operating in diverse retail and medical office segments: Sam’s Club, Walgreens, Hobby Lobby, Dollar General, Tractor Supply, CVS, Family Dollar, First Midwest Bank, Natural Grocers, Octapharma, Dollar Tree and Fresenius. The ExchangeRight Properties have a weighted average remaining lease term of approximately 10.6 years. Leases representing 47.6% of NRA and 60.3% of the underwritten base rent expire after the maturity date of the ExchangeRight Net Leased Portfolio #52 Mortgage Loan. For the purposes of the preceding two sentences, the Walgreens leases, which grant early termination rights to Walgreens, and the Octapharma lease, which grants a one-time termination option to Octapharma, were assumed to expire on the date when the earliest termination right under the lease, if exercised, would be effective.
The following table presents certain information relating to the state locations of the ExchangeRight Properties:
| Geographic Summary |
| State | Number of Properties | Tenant SF | % of Collateral SF | Annual UW
Rent | Annual UW Rent PSF | % of Annual UW Rent |
| OH | 5 | 177,160 | 39.8% | $1,721,412 | $9.72 | 25.3% |
| IA | 1 | 51,809 | 11.6% | $595,804 | $11.50 | 8.7% |
| GA | 4 | 50,292 | 11.3% | $561,195 | $11.16 | 8.2% |
| IL | 3 | 23,187 | 5.2% | $611,561 | $26.38 | 9.0% |
| NY | 1 | 19,097 | 4.3% | $306,600 | $16.05 | 4.5% |
| AL | 2 | 18,950 | 4.3% | $210,852 | $11.13 | 3.1% |
| MO | 1 | 15,000 | 3.4% | $391,650 | $26.11 | 5.8% |
| CT | 1 | 14,490 | 3.3% | $373,200 | $25.76 | 5.5% |
| MA | 1 | 14,320 | 3.2% | $517,000 | $36.10 | 7.6% |
| PA | 2 | 14,200 | 3.2% | $186,600 | $13.14 | 2.7% |
| NH | 1 | 13,612 | 3.1% | $405,000 | $29.75 | 5.9% |
| MI | 1 | 13,428 | 3.0% | $449,500 | $33.47 | 6.6% |
| WI | 1 | 12,509 | 2.8% | $239,098 | $19.11 | 3.5% |
| NM | 1 | 3,851 | 0.9% | $100,000 | $25.97 | 1.5% |
| IN | 1 | 3,336 | 0.7% | $140,505 | $42.12 | 2.1% |
| Subtotal/Wtd. Avg. | 26 | 445,241 | 100.0% | $6,809,976 | $15.30 | 100.0% |
| | | | | | | | |
| | Source: Appraisals & Underwritten Rent Roll |
This is not a research report and was not prepared by any Underwriter’s research department. Please see additional important information and qualifications at the end of this Term Sheet. |
| | T-66 | |
| Property Types – Various | Loan #4 | Cut-off Date Balance: | | $73,460,000 |
| Property Addresses – Various | ExchangeRight Net Leased Portfolio #52 | Cut-off Date LTV: | | 61.9% |
| | | U/W NCF DSCR: | | 2.31x |
| | | U/W NOI Debt Yield: | | 8.6% |
The following table presents certain information relating to the ExchangeRight Properties, which are presented in descending order of their Appraised Values.
| ExchangeRight Properties Summary |
| Property Name | Year Built/
Renovated | Tenant NRSF | %of Portfolio NRSF | Lease Expiration Date(1) | Appraised Value | % of Portfolio Appraised Value | Annual UW Base Rent | Annual UW Base Rent PSF | % of Annual UW Base Rent | Renewal Options |
| Sam's Club - Bedford, OH | 1991 / NAP | 136,914 | 30.8% | 10/31/2031 | $17,800,000 | 15.0% | $978,173 | $7.14 | 14.4% | 7 x 5 yr |
| Hobby Lobby - West Des Moines, IA | 2017 / NAP | 51,809 | 11.6% | 3/31/2033 | $10,500,000 | 8.9% | $595,804 | $11.50 | 8.7% | 3 x 5 yr |
| Walgreens - Worcester, MA | 2007 / NAP | 14,320 | 3.2% | 4/30/2032 | $9,000,000 | 7.6% | $517,000 | $36.10 | 7.6% | None |
| Walgreens - St Clair Shores, MI | 2002 / NAP | 13,428 | 3.0% | 12/31/2032 | $7,100,000 | 6.0% | $449,500 | $33.47 | 6.6% | None |
| Walgreens - Merrimack, NH | 2008 / NAP | 13,612 | 3.1% | 1/31/2033 | $7,000,000 | 5.9% | $405,000 | $29.75 | 5.9% | None |
| Natural Grocers - Liberty, MO | 2016 / NAP | 15,000 | 3.4% | 1/31/2032 | $6,870,000 | 5.8% | $391,650 | $26.11 | 5.8% | 4 x 5 yr |
| Walgreens - Windsor Locks, CT | 2008 / NAP | 14,490 | 3.3% | 3/31/2034 | $6,600,000 | 5.6% | $373,200 | $25.76 | 5.5% | None |
| Tractor Supply - Troy, NY | 2011 / NAP | 19,097 | 4.3% | 11/30/2036 | $5,800,000 | 4.9% | $306,600 | $16.05 | 4.5% | 4 x 5 yr |
| Walgreens - Lorain, OH | 2006 / NAP | 14,550 | 3.3% | 9/30/2031 | $5,700,000 | 4.8% | $328,498 | $22.58 | 4.8% | None |
| First Midwest Bank - Galesburg, IL | 1993 / NAP | 8,190 | 1.8% | 9/30/2030 | $5,060,000 | 4.3% | $309,771 | $37.82 | 4.5% | 5 x 5 yr |
| Octapharma - Kenosha, WI | 1965 / 2020 | 12,509 | 2.8% | 6/30/2032 | $4,160,000 | 3.5% | $239,098 | $19.11 | 3.5% | 3 x 5 yr |
| Tractor Supply - Perry, GA | 2017 / 2021 | 19,097 | 4.3% | 7/31/2032 | $4,100,000 | 3.5% | $219,405 | $11.49 | 3.2% | 4 x 5 yr |
| First Midwest Bank - Lansing, IL | 1996 / NAP | 5,971 | 1.3% | 9/30/2030 | $3,360,000 | 2.8% | $205,324 | $34.39 | 3.0% | 5 x 5 yr |
| CVS - Medina, OH | 1984 / NAP | 9,100 | 2.0% | 4/30/2036 | $3,300,000 | 2.8% | $195,000 | $21.43 | 2.9% | None |
| CVS - Warner Robins, GA | 1999 / NAP | 10,112 | 2.3% | 6/30/2031 | $2,860,000 | 2.4% | $150,000 | $14.83 | 2.2% | 6 x 5 yr |
| First Midwest Bank - Dyer, IN | 1985 / 2005 | 3,336 | 0.7% | 9/30/2030 | $2,300,000 | 1.9% | $140,505 | $42.12 | 2.1% | 5 x 5 yr |
| Family Dollar - Ross, OH | 2017 / NAP | 9,107 | 2.0% | 3/31/2032 | $1,925,000 | 1.6% | $115,749 | $12.71 | 1.7% | 6 x 5 yr |
| Dollar General - Akron, OH | 2021 / NAP | 7,489 | 1.7% | 5/31/2036 | $1,900,000 | 1.6% | $103,992 | $13.89 | 1.5% | 5 x 5 yr |
| CVS - Roswell, NM | 2010 / NAP | 3,851 | 0.9% | 10/31/2033 | $1,820,000 | 1.5% | $100,000 | $25.97 | 1.5% | 5 x 5 yr |
| Dollar Tree - Florence, AL | 2021 / NAP | 9,924 | 2.2% | 6/30/2031 | $1,800,000 | 1.5% | $109,164 | $11.00 | 1.6% | 5 x 5 yr |
| Dollar General - Kankakee, IL | 2021 / NAP | 9,026 | 2.0% | 7/31/2036 | $1,790,000 | 1.5% | $96,465 | $10.69 | 1.4% | 4 x 5 yr |
| Dollar General - Jefferson Hills, PA | 2016 / NAP | 9,100 | 2.0% | 8/31/2031 | $1,750,000 | 1.5% | $105,000 | $11.54 | 1.5% | 3 x 5 yr |
| Dollar General - Hueytown, AL | 2016 / NAP | 9,026 | 2.0% | 8/31/2031 | $1,700,000 | 1.4% | $101,688 | $11.27 | 1.5% | 4 x 5 yr |
| Family Dollar - Columbus, GA | 2021 / NAP | 9,180 | 2.1% | 9/30/2031 | $1,610,000 | 1.4% | $96,390 | $10.50 | 1.4% | 5 x 5 yr |
| Dollar General - Chatsworth, GA | 2004 / 2020 | 11,903 | 2.7% | 8/31/2030 | $1,530,000 | 1.3% | $95,400 | $8.01 | 1.4% | 4 x 5 yr |
| Fresenius - Wind Gap, PA | 1998 / NAP | 5,100 | 1.1% | 9/30/2031 | $1,300,000 | 1.1% | $81,600 | $16.00 | 1.2% | 2 x 5 yr |
| Total/Weighted Average | | 445,241 | 100.0% | | $118,635,000 | 100.0% | $6,809,976 | $15.30 | 100.0% | |
| (1) | For the purposes of the table and loan underwriting, the Walgreens leases, which each grant early termination rights to Walgreens, and the Octapharma lease, which grants early termination rights to Octapharma, were assumed to expire on the date as of when the earliest termination right under each lease, if exercised, would be effective. |
This is not a research report and was not prepared by any Underwriter’s research department. Please see additional important information and qualifications at the end of this Term Sheet. |
| | T-67 | |
| Property Types – Various | Loan #4 | Cut-off Date Balance: | | $73,460,000 |
| Property Addresses – Various | ExchangeRight Net Leased Portfolio #52 | Cut-off Date LTV: | | 61.9% |
| | | U/W NCF DSCR: | | 2.31x |
| | | U/W NOI Debt Yield: | | 8.6% |
The following table presents a summary regarding the tenants at the ExchangeRight Properties:
| Tenant Summary |
| Tenant Name | Credit Rating
(S&P/
Moody’s/Fitch)(1) | No. of Properties | Tenant SF | Approx.% of SF | Annual UW Base Rent | Annual UW Base Rent PSF | App. % of Total Annual UW
Base Rent |
| Sam's Club | NR / NR / NR | 1 | 136,914 | 30.8% | $978,173 | $7.14 | 14.4% |
| Walgreens | BBB / Baa2 / NR | 5 | 70,400 | 15.8% | $2,073,198 | $29.45 | 30.4% |
| Hobby Lobby | NR / NR / NR | 1 | 51,809 | 11.6% | $595,804 | $11.50 | 8.7% |
| Dollar General | BBB / Baa2 / NR | 5 | 46,544 | 10.5% | $502,545 | $10.80 | 7.4% |
| Tractor Supply | BBB / Baa1 / NR | 2 | 38,194 | 8.6% | $526,005 | $13.77 | 7.7% |
| CVS | BBB / Baa2 / NR | 3 | 23,063 | 5.2% | $445,000 | $19.29 | 6.5% |
| Family Dollar | NR / Baa2 / NR | 2 | 18,287 | 4.1% | $212,139 | $11.60 | 3.1% |
| First Midwest Bank | NR / Baa2 / NR | 3 | 17,497 | 3.9% | $655,600 | $37.47 | 9.6% |
| Natural Grocers | NR / NR / NR | 1 | 15,000 | 3.4% | $391,650 | $26.11 | 5.8% |
| Octapharma | NR / NR / NR | 1 | 12,509 | 2.8% | $239,098 | $19.11 | 3.5% |
| Dollar Tree | BBB / Baa2 / NR | 1 | 9,924 | 2.2% | $109,164 | $11.00 | 1.6% |
| Fresenius | NR / NR/ NR | 1 | 5,100 | 1.1% | $81,600 | $16.00 | 1.2% |
| Subtotal/Wtd. Avg. | | 26 | 445,241 | 100.0% | $6,809,976 | $15.30 | 100.0% |
| | | | | | | | |
| Vacant | | 0 | 0 | 0.0% | | | |
| Total/Wtd. Avg. | | 26 | 445,241 | 100.0% | | | |
| (1) | Certain ratings are those of the parent company whether or not the parent guarantees the lease. |
The following table presents certain information relating to the lease rollover at the ExchangeRight Properties:
| Lease Rollover Schedule(1)(2)(3) |
| Year | # of Leases Rolling | SF Rolling | Annual UW Base Rent PSF Rolling | Approx. % of Total SF Rolling | Approx. Cumulative % of SF Rolling | Total UW Base Rent Rolling | Approx. % of Total UW Base Rent Rolling | Approx. Cumulative % of Total UW Base Rent Rolling |
| 2022 | 0 | 0 | $0.00 | 0.0% | 0.0% | $0 | 0.0% | 0.0% |
| 2023 | 0 | 0 | $0.00 | 0.0% | 0.0% | $0 | 0.0% | 0.0% |
| 2024 | 0 | 0 | $0.00 | 0.0% | 0.0% | $0 | 0.0% | 0.0% |
| 2025 | 0 | 0 | $0.00 | 0.0% | 0.0% | $0 | 0.0% | 0.0% |
| 2026 | 0 | 0 | $0.00 | 0.0% | 0.0% | $0 | 0.0% | 0.0% |
| 2027 | 0 | 0 | $0.00 | 0.0% | 0.0% | $0 | 0.0% | 0.0% |
| 2028 | 0 | 0 | $0.00 | 0.0% | 0.0% | $0 | 0.0% | 0.0% |
| 2029 | 0 | 0 | $0.00 | 0.0% | 0.0% | $0 | 0.0% | 0.0% |
| 2030 | 4 | 29,400 | $25.54 | 6.6% | 6.6% | $751,000 | 11.0% | 11.0% |
| 2031 | 8 | 203,906 | $9.57 | 45.8% | 52.4% | $1,950,513 | 28.6% | 39.7% |
| 2032 & Beyond | 14 | 211,935 | $19.39 | 47.6% | 100.0% | $4,108,463 | 60.3% | 100.0% |
| Vacant | 0 | 0 | $0.00 | 0.0% | 100.0% | $0 | 0.0% | 100.0% |
| Total/Wtd. Avg. | 26 | 445,241 | $15.30 | 100.0% | | $6,809,976 | 100.0% | |
| (1) | Information is based on the underwritten rent roll. |
| (2) | Certain tenants may have lease termination options that are exercisable prior to the stated expiration date of the subject lease or leases which are not considered in the lease rollover schedule, except as described in footnote (3) below. |
| (3) | For the purposes of the table and loan underwriting, the Walgreens leases, which each grant early termination rights to Walgreens, and the Octapharma lease, which grants early termination rights to Octapharma, were assumed to expire on the date as of when the earliest termination right under each lease, if exercised, would be effective. |
COVID-19 Update. As of December 1, 2021, the ExchangeRight Properties were open and operating with no outstanding tenant rent relief agreements. All tenants have been reported to have been paying full rent.
This is not a research report and was not prepared by any Underwriter’s research department. Please see additional important information and qualifications at the end of this Term Sheet. |
| | T-68 | |
| Property Types – Various | Loan #4 | Cut-off Date Balance: | | $73,460,000 |
| Property Addresses – Various | ExchangeRight Net Leased Portfolio #52 | Cut-off Date LTV: | | 61.9% |
| | | U/W NCF DSCR: | | 2.31x |
| | | U/W NOI Debt Yield: | | 8.6% |
Underwritten Net Cash Flow. The following table presents certain information relating to the Underwritten Net Cash Flow at the ExchangeRight Properties:
| Cash Flow Analysis(1) |
| | UW | UW Per SF |
| Gross Potential Rent(2) | $6,809,976 | $15.30 |
| Total Recoveries | $0 | $0.00 |
| Other Income | $0 | $0.00 |
| Less Vacancy & Credit Loss | ($326,458) | ($0.73) |
| Effective Gross Income | $6,483,518 | $14.56 |
| | | |
| Real Estate Taxes | $0 | $0.00 |
| Insurance | $0 | $0.00 |
| Other Expenses | $194,506 | $0.44 |
| Total Expenses(3) | $194,506 | $0.44 |
| | | |
| Net Operating Income | $6,289,013 | $14.12 |
| Capital Expenditures | $66,786 | $0.15 |
| TI/LC | $305,580 | $0.69 |
| Plus TI/LC Credit(4) | ($50,000) | ($0.11) |
| Net Cash Flow | $5,966,647 | $13.40 |
| | | |
| Occupancy %(5) | 95.2% | |
| NOI DSCR | 2.44x | |
| NCF DSCR | 2.31x | |
| NOI Debt Yield | 8.6% | |
| NCF Debt Yield | 8.1% | |
| | | | |
| (1) | Historical financial information is not available because the ExchangeRight Properties were acquired by the borrower sponsors between July 1, 2021 and October 26, 2021. |
| (2) | Includes $59,048 of straight line rent for the First Midwest Bank –Galesburg, IL, Tractor Supply – Perry, GA, First Midwest Bank – Lansing, IL, First Midwest Bank – Dyer, IN and Family Dollar – Ross, OH tenants. |
| (3) | Total Expenses consist of a 3.0% management fee. |
| (4) | Plus TI/LC Credit means credit for one tenth of the $500,000 initial deposit into the TI/LC reserve was underwritten. |
| (5) | Occupancy % represents economic occupancy at the ExchangeRight Properties. As of February 1, 2022, the ExchangeRight Properties were 100.0% occupied. |
Escrows and Reserves.
Real Estate Taxes – The borrower deposited at loan origination approximately $17,647 for real estate taxes. The borrower will be required to make monthly deposits in an amount equal to 1/12th of the real estate taxes that the lender estimates will be payable during the next 12 months, initially approximately $14,751 per month, except that no deposits will be required on account of taxes with respect to the Direct Tax Pay Tenants (as defined below) for so long as (i) no event of default under the ExchangeRight Net Leased Portfolio #52 Mortgage Loan has occurred and is continuing, (ii) the borrower provides proof of payment by the tenant (or the borrower) directly to the taxing authority on or before 15 days prior to the last date on which the taxes can be paid without the accrual of interest or penalties, (iii) the tenant’s lease is not subject to any default beyond any applicable grace or notice and cure period by either the borrower or such tenant, and (iv) no material adverse change has (in the lender’s reasonable determination) occurred with respect to the applicable tenant such that its ability to timely pay the taxes has been materially jeopardized. “Direct Tax Pay Tenant” means any tenant that has the right or the obligation pursuant to its lease to pay taxes for the applicable ExchangeRight Property directly to the applicable taxing authority and is actually exercising such right or complying with such obligation, as applicable. The ExchangeRight Net Leased Portfolio #52 Mortgage Loan documents provide that the initial such Direct Tax Pay Tenants are the tenants at the (i) Family Dollar – Ross, OH, (ii) First Midwest Bank – Dyer, IN, (iii) First Midwest Bank – Galesburg, IL, (iv) First Midwest Bank – Lansing, IL, (v) Hobby Lobby – West Des Moines, IA, (vi) Natural Grocers – Liberty, MO, (vii) Sam’s Club – Bedford, OH, (viii) Tractor Supply – Perry, GA, (ix) Walgreens – Lorain, OH, (x) Walgreens – Merrimack, NH, (xi) Walgreens – St Clair Shores, MI, (xii) Walgreens – Windsor Locks, CT, and (xiii) Walgreens – Worcester, MA ExchangeRight Properties.
Insurance – The borrower will not be required to make monthly deposits into an insurance reserve as long as the casualty and liability insurance with respect to the ExchangeRight Properties is maintained under a lender-approved blanket policy and no event of default is continuing under the ExchangeRight Net Leased Portfolio #52 Mortgage Loan. If such conditions are not satisfied, the borrower will be required to make deposits into an insurance reserve in an amount equal to 1/12th of the insurance premiums that the lender estimates will be payable for the renewal of the coverage afforded by the insurance policies upon the expiration thereof, except that no deposits will be required on account of insurance premiums with respect to the Direct Insurance Pay Tenants (as defined below) for so long as (i) no event of default under the ExchangeRight Net Leased Portfolio #52 Mortgage Loan has occurred and is continuing, (ii) the borrower provides proof of payment by the tenant (or the borrower) directly to the insurance company on or before 15 days prior to the due date for insurance premiums, (iii) the tenant’s lease is not subject to any default beyond any applicable grace or notice and cure period by either the borrower or such tenant, and (iv) no material adverse change has (in the lender’s reasonable determination) occurred with respect to the applicable tenant such that its ability to timely pay the insurance premiums has been materially jeopardized. “Direct Insurance Pay Tenant” means any tenant that has the right or the obligation pursuant to its lease to maintain all or a portion of the insurance for the applicable ExchangeRight Property and to pay insurance premiums directly to the applicable insurance company and is actually exercising such right or complying with such obligation, as
This is not a research report and was not prepared by any Underwriter’s research department. Please see additional important information and qualifications at the end of this Term Sheet. |
| | T-69 | |
| Property Types – Various | Loan #4 | Cut-off Date Balance: | | $73,460,000 |
| Property Addresses – Various | ExchangeRight Net Leased Portfolio #52 | Cut-off Date LTV: | | 61.9% |
| | | U/W NCF DSCR: | | 2.31x |
| | | U/W NOI Debt Yield: | | 8.6% |
applicable. The ExchangeRight Net Leased Portfolio #52 Mortgage Loan documents provide that the initial such Direct Insurance Pay Tenants (which maintain property and terrorism insurance for the applicable property) are the tenants at the (i) CVS – Medina, OH, (ii) CVS – Warner Robins, GA, (iii) CVS – Roswell, NM, (iv) Dollar General – Jefferson Hills, PA, (v) Dollar General – Akron, OH, (vi) Dollar General – Kankakee, IL, (vii) Dollar General – Hueytown, AL, (viii) Dollar General – Chatsworth, GA, (ix) Family Dollar – Ross, OH, (x) First Midwest Bank – Lansing, IL, (xi) First Midwest Bank – Dyer, IN, (xii) First Midwest Bank – Galesburg, IL, (xiii) Natural Grocers – Liberty, MO, (xiv) Sam’s Club – Bedford, OH, (xv) Tractor Supply – Perry, GA, (xvi) Tractor Supply – Troy, NY, (xvii) Walgreens – Windsor Locks, CT, (xviii) Walgreens – St Clair Shores, MI, (xix) Walgreens – Worcester, MA, (xx) Walgreens – Lorain, OH, and (xxi) Walgreens – Merrimack, NH ExchangeRight Properties.
Required Repairs – The ExchangeRight Net Leased Portfolio #52 Mortgage Loan documents provide for an upfront deposit of $47,086 for required repairs at certain ExchangeRight Properties, including repairs of roofing, pavement and asphalt, installation of ADA compliant parking spaces, exterior cleaning, painting and sealing, and fire extinguisher inspection.
Replacement Reserve – The borrower is required to deposit ongoing monthly reserves for approved capital expenses an amount equal to one-twelfth of the product obtained by multiplying $0.26 by the aggregate rentable square feet of space at the ExchangeRight Properties, excluding the following tenants: (i) CVS – Median, OH, (ii) Dollar General – Akron, OH, (iii) Dollar General – Hueytown, AL, (iv) Dollar General – Jefferson Hills, PA, (v) Dollar General – Kankakee, IL, (vi) Family Dollar – Ross, OH, (vii) Sam’s Club – Bedford, OH, (viii) Walgreens – Lorain, OH, (ix) Walgreens – Merrimack, NH, (x) Walgreens – Windsor Locks, CT and (xi) Walgreens – Worcester, MA, in each case, to the extent the following conditions are satisfied: (i) no event of default under the ExchangeRight Net Leased Portfolio #52 Mortgage Loan has occurred and is continuing, (ii) the borrower provides proof of payment by the tenant of all capital expenses promptly following request by the lender, (iii) the tenant’s lease is not subject to any default beyond any applicable grace or notice and cure period by either the borrower or such tenant, and (iv) no material adverse change has (in the lender’s reasonable determination) occurred with respect to the applicable tenant such that its ability to timely pay the capital expenses has been materially jeopardized. Initially, such monthly deposit equals approximately $3,982.
TI/LC Reserve – The borrower deposited at loan origination $500,000 for tenant improvements and leasing commissions. During a Cash Management Period (as defined below), the borrower will be required to deposit monthly an amount equal to one-twelfth of the product obtained by multiplying $0.70 by the aggregate rentable square feet of space at the ExchangeRight Properties (initially approximately $25,972) for tenant improvements and leasing commissions.
Environmental Reserve – At origination, approximately $351,560 was deposited into a reserve for potential environmental work relating to recognized environmental conditions at certain of the ExchangeRight Properties.
Lockbox and Cash Management. The ExchangeRight Net Leased Portfolio #52 Mortgage Loan is structured with a hard lockbox and springing cash management. The borrower is required to (or to cause the ExchangeRight Net Leased Portfolio #52 Master Tenant or property manager to) cause all rents relating to the ExchangeRight Properties to be transmitted directly by the tenants of each property into the lockbox account and, to the extent that such rents are received by the borrower (or ExchangeRight Net Leased Portfolio #52 Master Tenant or property manager), cause such amounts to be deposited into the lockbox account within two business days following receipt. The lockbox bank is required to sweep such funds into the ExchangeRight Net Leased Portfolio #52 Master Tenant’s operating account on each business day other than during a Cash Management Period. Upon the occurrence of a Cash Management Period, the borrower and a cash management bank are required to establish a cash management account into which all funds in the lockbox account will be required to be transferred on each business day during a Cash Management Period. During a Cash Management Period, and provided no event of default is continuing, funds in the cash management account are required to be applied (i) to make the next monthly deposits (to the extent required) into the real estate taxes and insurance reserves as described above under “Escrows and Reserves”, (ii) to reserve the next monthly debt service payment due on the ExchangeRight Net Leased Portfolio #52 Mortgage Loan, (iii) to make the next monthly deposits into the replacement reserve and the TI/LC reserve (to the extent required) as described above under “Escrows and Reserves”, (iv) to pay operating expenses set forth in the annual budget (which is required to be reasonably approved by the lender during a Cash Management Period) and, to the extent the Cash Management Period exists solely as the result of a decline in the debt service coverage ratio, additional operating expenses reasonably approved by the lender and (v) to deposit any remainder into a cash collateral subaccount to be held as additional security for the ExchangeRight Net Leased Portfolio #52 Mortgage Loan during such Cash Management Period. Upon cessation of a Cash Management Period, all available amounts on deposit in the cash collateral account must be released to or as directed by the borrower.
A “Cash Management Period" means a period:
(i) commencing upon an event of default under the ExchangeRight Net Leased Portfolio #52 Mortgage Loan and ending when such event of default has been cured or waived, or
(ii) commencing when the debt service coverage ratio (based on net operating income for the trailing 12 months) as of the end of any calendar quarter is less than 1.50x and ending when the debt service coverage ratio (based on net operating income for the trailing 12 months) is at least 1.50x as of the end of each of two consecutive calendar quarters, or
(iii) commencing on the payment date that occurs in December 2028 (36 months before the maturity date of the ExchangeRight Net Leased Portfolio #52 Mortgage Loan), unless a Qualified Transfer has occurred as of such date, and ending when a Qualified Transfer occurs.
Additional Secured Indebtedness (not including Trade Debts). Not permitted.
Mezzanine Loan and Preferred Equity. Not permitted.
Release of Property. Not permitted.
This is not a research report and was not prepared by any Underwriter’s research department. Please see additional important information and qualifications at the end of this Term Sheet. |
| | T-70 | |
| Property Types – Various | Loan #4 | Cut-off Date Balance: | | $73,460,000 |
| Property Addresses – Various | ExchangeRight Net Leased Portfolio #52 | Cut-off Date LTV: | | 61.9% |
| | | U/W NCF DSCR: | | 2.31x |
| | | U/W NOI Debt Yield: | | 8.6% |
Right of First Offer / Right of First Refusal. The related single tenant at each of the following eleven ExchangeRight Properties has a right of first refusal (“ROFR”) or right of first offer (“ROFO”) to purchase the related ExchangeRight Property: (i) Tractor Supply—Troy, NY, (ii) Walgreens—Lorain, OH, (iii) Walgreens—St Clair Shores, MI, (iv) Walgreens—Worcester, MA, (v) First Midwest Bank—Dyer, IN, (vi) First Midwest Bank—Galesburg, IL, (vii) First Midwest Bank—Lansing, IL, (viii) Walgreens—Windsor Locks, CT, (ix) Family Dollar—Ross, OH, (x) Walgreens—Merrimack, NH, (xi) Tractor Supply—Perry, GA. With respect to the Tractor Supply—Troy, NY and Tractor Supply - Perry, GA Mortgaged Properties, the tenant has agreed that its rights under the lease, including its ROFR, will be subordinate to the mortgage. With respect to each other such Mortgaged Property, such ROFR or ROFO (i) will not be applicable in the instance of a foreclosure or a deed in lieu of foreclosure and (ii) will apply to subsequent transfers of the applicable ExchangeRight Property. See “Description of the Mortgage Pool—Tenant Issues—Purchase Options and Rights of First Refusal” in the prospectus.
Ground Lease. None.
Letter of Credit. None.
Terrorism Insurance. The borrower is required to obtain and maintain an “all risk” property insurance policy that covers perils of terrorism and acts of terrorism in an amount equal to the “full replacement cost” of the ExchangeRight Properties together with 18 months of business income insurance, plus a 365-day extended period of indemnity, provided that such coverage is available. See “Risk Factors—Risks Relating to the Mortgage Loans—Terrorism Insurance May Not Be Available for All Mortgaged Properties” in the prospectus.
This is not a research report and was not prepared by any Underwriter’s research department. Please see additional important information and qualifications at the end of this Term Sheet. |
| | T-71 | |
| Multifamily – Garden | Loan #5 | Cut-off Date Balance: | | $71,000,000 |
| 19093 Cresenzo Court | The Grove at Portofino Vineyards | Cut-off Date LTV: | | 66.7% |
| Fort Myers, FL 33967 | | U/W NCF DSCR: | | 1.89x |
| | | U/W NOI Debt Yield: | | 7.5% |

This is not a research report and was not prepared by any Underwriter’s research department. Please see additional important information and qualifications at the end of this Term Sheet. |
| | T-72 | |
| Multifamily – Garden | Loan #5 | Cut-off Date Balance: | | $71,000,000 |
| 19093 Cresenzo Court | The Grove at Portofino Vineyards | Cut-off Date LTV: | | 66.7% |
| Fort Myers, FL 33967 | | U/W NCF DSCR: | | 1.89x |
| | | U/W NOI Debt Yield: | | 7.5% |
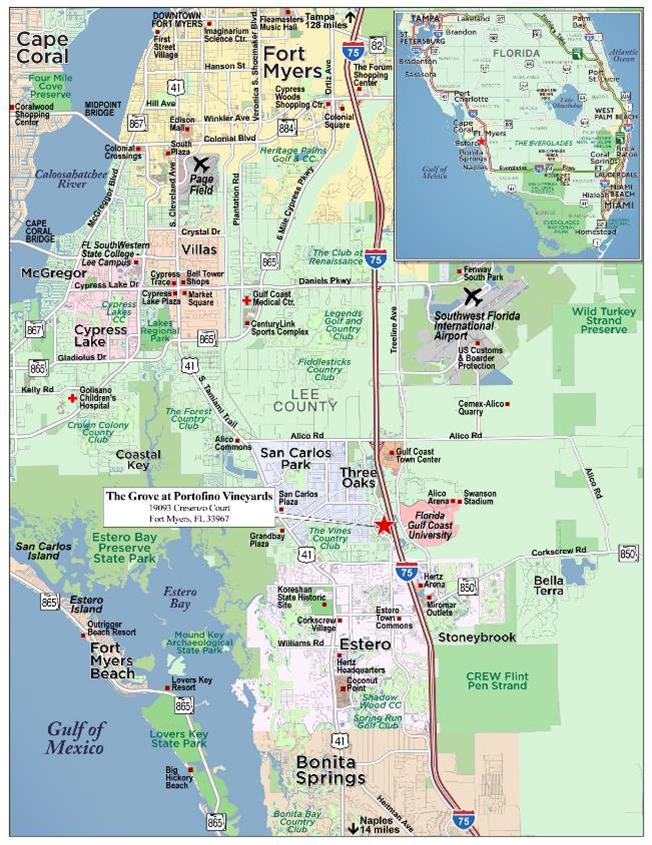
This is not a research report and was not prepared by any Underwriter’s research department. Please see additional important information and qualifications at the end of this Term Sheet. |
| | T-73 | |
| Mortgage Loan No. 5 – The Grove at Portofino Vineyards |
| Mortgage Loan Information | | Property Information |
| Mortgage Loan Seller: | BANA | | Single Asset/Portfolio: | Single Asset |
| Credit Assessment (DBRSM/Fitch/Moody’s): | NR/NR/NR | | Location: | Fort Myers, FL 33967 |
| Original Balance: | $71,000,000 | | General Property Type: | Multifamily |
| Cut-off Date Balance: | $71,000,000 | | Detailed Property Type: | Garden |
| % of Initial Pool Balance: | 5.9% | | Title Vesting: | Fee |
| Loan Purpose: | Refinance | | Year Built/Renovated: | 2020 / NAP |
| Borrower Sponsor: | Prime Group | | Size: | 312 Units |
| Guarantor: | Prime Hospitality Group, LLC | | Cut-off Date Balance per Unit: | $227,564 |
| Mortgage Rate: | 3.8500% | | Maturity Date Balance per Unit: | $227,564 |
| Note Date: | 12/17/2021 | | Property Manager: | PMG Asset Services, LLC |
| First Payment Date: | 2/1/2022 | | | (borrower-related) |
| Maturity Date: | 1/1/2032 | | | |
| Original Term to Maturity: | 120 months | | Underwriting and Financial Information(2) |
| Original Amortization Term: | 0 months | | UW NOI: | $5,309,871 |
| IO Period: | 120 months | | UW NOI Debt Yield: | 7.5% |
| Seasoning: | 1 month | | UW NOI Debt Yield at Maturity: | 7.5% |
| Prepayment Provisions: | L(25),D(91),O(4) | | UW NCF DSCR: | 1.89x |
| Lockbox/Cash Mgmt Status: | None/Springing | | Most Recent NOI(3): | $940,595 (10/31/2021 TTM) |
| Additional Debt Type: | No | | 2nd Most Recent NOI(3): | NAV |
| Additional Debt Balance: | NAP | | 3rd Most Recent NOI(3): | NAV |
| Future Debt Permitted (Type): | No (NAP) | | Most Recent Occupancy(3): | 95.8% (11/18/2021) |
| Reserves(1) | | 2nd Most Recent Occupancy(3): | NAV |
| Type | Initial | Monthly | Cap | | 3rd Most Recent Occupancy(3): | NAV |
| RE Taxes: | $71,197 | $23,732 | NAP | | Appraised Value (as of): | $106,500,000 (11/5/2021) |
| Insurance: | $48,890 | $24,445 | NAP | | Appraised Value per Unit: | $341,346 |
| Replacement Reserve: | $0 | $4,992 | NAP | | Cut-off Date LTV Ratio: | 66.7% |
| Holdback Reserve: | $2,000,000 | $0 | NAP | | Maturity Date LTV Ratio: | 66.7% |
| | | | | | | |
| Sources and Uses |
| Sources | Proceeds | % of Total | | Uses | Proceeds | % of Total |
| Loan Amount: | $71,000,000 | 100.0% | | Loan Payoff(4): | $31,483,198 | 44.3% |
| | | | | Return of Equity(4): | $35,648,297 | 50.2% |
| | | | | Reserves: | $2,120,087 | 3.0% |
| | | | | Closing Costs: | $1,748,418 | 2.5% |
| Total Sources: | $71,000,000 | 100.0% | | Total Uses: | $71,000,000 | 100.0% |
| (1) | See “Escrows and Reserves” below for further discussion of reserve information. |
| (2) | The novel coronavirus pandemic is an evolving situation and could impact The Grove at Portofino Vineyards Mortgage Loan (as defined below) more severely than assumed in the underwriting of The Grove at Portofino Vineyards Mortgage Loan. The pandemic and resulting economic disruption could also adversely affect the NOI, NCF and occupancy information, as well as the appraised value and DSCR, LTV and Debt Yield metrics presented above. See "Risk Factors—Risks Related to Market Conditions and Other External Factors—The Coronavirus Pandemic Has Adversely Affected the Global Economy and Will Likely Adversely Affect the Performance of the Mortgage Loans" in the prospectus. |
| (3) | The borrower sponsor completed construction of The Grove at Portofino Vineyards Property (as defined below) in December 2020, therefore, the Most Recent NOI is not a full twelve months and no historical information is available. |
| (4) | The borrower sponsor has owned the site since 2005, when it was vacant, and completed construction of The Grove at Portofino Vineyards Property in December 2020, and as of loan origination has a total cost basis of $51,177,458. |
The Mortgage Loan. The fifth largest mortgage loan (“The Grove at Portofino Vineyards Mortgage Loan”) is evidenced by a promissory note in the original principal amount of $71,000,000 and secured by a first priority fee mortgage encumbering a 312-unit garden-style multifamily property located in Fort Myers, Florida (“The Grove at Portofino Vineyards Property”).
The Borrower and the Borrower Sponsor. The borrower is The Grove at Portofino Vineyards LLC, a Delaware limited liability company with one independent director. The borrower sponsor is Prime Group and the non-recourse carveout guarantor is Prime Hospitality Group, LLC.
Prime Hospitality Group, LLC is a subsidiary of Prime Group, a vertically integrated real estate development company based in Hollywood, Florida. Founded in 1987 by Fred Abbo, Prime Group began as a residential construction company and has grown to include retail, office and hospitality specialties, as well as consulting and property management services. As President and Chairman, Mr. Abbo guides and directs policy for Prime Group as well as national and international finance, marketing and sales programs. Prime Group’s residential projects include 29 apartment, townhome, condominium and single-family developments, with a total of 7,150 units throughout the state of Florida.
The Property. The Grove at Portofino Vineyards Property is a 312-unit multifamily property located in Fort Myers, Florida. The garden-style community was developed on a 16.39-acre site in 2020 by the borrower sponsor and includes 13 three-story apartment buildings, a clubhouse and a maintenance building. The Grove at Portofino Vineyards Property offers community amenities including a pool, lounge area, dog wash station, car wash area, car charging station, 360 covered and surface parking spaces and fitness center. The borrower sponsor also has plans to develop future phases of the related development, including a 264-unit garden style community expected to begin construction in the next 18 months, and a community with 96 townhouses
This is not a research report and was not prepared by any Underwriter’s research department. Please see additional important information and qualifications at the end of this Term Sheet. |
| | T-74 | |
| Multifamily – Garden | Loan #5 | Cut-off Date Balance: | | $71,000,000 |
| 19093 Cresenzo Court | The Grove at Portofino Vineyards | Cut-off Date LTV: | | 66.7% |
| Fort Myers, FL 33967 | | U/W NCF DSCR: | | 1.89x |
| | | U/W NOI Debt Yield: | | 7.5% |
and 106 single family homes. The future garden style community is expected to feature garages, higher end finishes and separate amenities and is therefore not expected to be directly competitive with The Grove at Portofino Vineyards Property.
The Grove at Portofino Vineyards Property’s 312 units consist of one-bedroom, two-bedroom, and three-bedroom layouts. Of the 312 units, 102 are one-bedroom/one-bathroom units that average 733 SF of NRA, 156 are two-bedroom/two-bathroom units that average 1,031 SF of NRA, 36 are three-bedroom/two-bathroom units that average 1,256 SF of NRA, and 18 are three-bedroom/three-bathroom units that average 1,347 SF of NRA. Unit amenities include stainless steel appliances, solid surface counters, trash pickup, walk-in closets, balcony/patio and Wi-Fi. Due to its proximity to Florida Gulf Coast University, an estimated approximately 20% of the current tenants at The Grove at Portofino Vineyards Property are students, according to the borrower sponsor. All leases require a guaranty unless the tenant provides proof of monthly income of at least 3-times the monthly rent. As of November 18, 2021, The Grove at Portofino Vineyards Property was 95.8% occupied.
The table below shows the apartment unit mix at The Grove at Portofino Vineyards Property:
| Unit Mix |
| Unit Mix / Type | Units | Occupied Units | % Occupied | Average SF per Unit | Total SF | Monthly Average
Rent per Unit | Monthly Average|
Market Rent per
Unit(1) |
| 1 BR 1 BA | 102 | 102 | 100.0% | 733 | 74,766 | $1,496 | $1,484 |
| 2 BR 2 BA | 156(2) | 149 | 95.5% | 1,031 | 160,818 | $1,883 | $1,830 |
| 3 BR 2 BA | 36 | 35 | 97.2% | 1,256 | 45,216 | $2,324 | $2,315 |
| 3 BR 3 BA | 18 | 13 | 72.2% | 1,347 | 24,246 | $2,887 | $2,887 |
| Total/Wtd. Avg. | 312 | 299 | 95.8% | 978 | 305,046 | $1,846 | $1,834 |
Source: Borrower rent roll as of November 18, 2021, unless otherwise noted
| (1) | Information obtained from the appraisal. |
| (2) | Includes one model unit which has been underwritten as vacant. |
The Market. The Grove at Portofino Vineyards Property is located in Fort Myers, Florida, in close proximity to local economic drivers including Florida Gulf Coast University (2.3 miles), Hertz’s global headquarters (4.0 miles), Coconut Point (4.7 miles), and Miromar Outlets (4.8 miles). Primary access to The Grove at Portofino Vineyards Property is provided by Three Oaks Parkway, which is a major four-lane north-south arterial. Additional access to the neighborhood is provided by Interstate 75, which is a north-south highway situated adjacent to The Grove at Portofino Vineyards Property that links southwest Florida to Tampa to the north and greater Miami to the east.
The Grove at Portofino Vineyards Property is located in the Southern Lee County multifamily submarket of the Cape Coral-Fort Myers market. As of the third quarter of 2021, the appraisal indicated the submarket had an inventory of 8,656 units, a vacancy rate of 2.15%, and an average asking rental rate per unit of $1,456. According to a November 2021 third-party market report, Southern Lee County's multifamily demand and diminishing supply pipeline have cut the average vacancy rate by nearly half over the past three quarters. The submarket’s geography includes high population growth areas such as Estero, San Carlos Park, and Bonita Springs, which fuel multifamily demand. Southern Lee County draws demand from the Naples market. The commute from The Grove at Portofino Vineyards Property to the Fort Myers central business district is approximately 20 to 25 minutes and the drive to Southwest Florida International Airport is approximately 15 minutes.
According to the appraisal, within a one-, three- and five-mile radius of The Grove at Portofino Vineyards Property, the 2021 average household income was approximately $98,844, $100,825 and $112,411, respectively; and within the same radii, the 2021 estimated population was 5,854, 49,955 and 75,361, respectively. The 2021 estimated population of Fort Myers was 89,238 and the population has a projected annual growth rate of 2.7%.
This is not a research report and was not prepared by any Underwriter’s research department. Please see additional important information and qualifications at the end of this Term Sheet. |
| | T-75 | |
| Multifamily – Garden | Loan #5 | Cut-off Date Balance: | | $71,000,000 |
| 19093 Cresenzo Court | The Grove at Portofino Vineyards | Cut-off Date LTV: | | 66.7% |
| Fort Myers, FL 33967 | | U/W NCF DSCR: | | 1.89x |
| | | U/W NOI Debt Yield: | | 7.5% |
The table below shows comparable rental properties to The Grove at Portofino Vineyards Property:
| Comparable Rental Properties |
| | The Grove at Portofino Vineyards Property(1) | Murano at Three Oaks | Spectra | Estero Oaks | The Reserve at Coconut Point | Springs at Gulf Coast | Millennium Apartments | Longitude 81 | Estero Parc |
| Year Built | 2020 | 2020 | 2016 | 2016 | 2021 | 2017 | 2018 | 2015 | 2020 |
| Number of units | 312 | 318 | 324 | 280 | 180 | 203 | 298 | 260 | 198 |
| Distance from Subj. (miles) | - | 2.4 | 5.9 | 1.1 | 4.0 | 2.3 | 2.2 | 2.6 | 3.8 |
| Occupancy | 95.8% | 89% | 97% | 95% | 0% | 98% | 95% | 100% | 97% |
| Average Unit size (SF): | | | | | | | | | |
| - 1-BR | 733 | 774 | 727 | 870 | 734 | 820 | 735 | 820 | 718 |
| - 2-BR | 1,031 | 1,064 | 1,072 | 1,188 | 1,047 | 1,117 | 1,070 | 1,117 | 1,057 |
| - 3-BR | 1,286 | 1,324 | 1,307 | 1,401 | 1,253 | 1,366 | 1,197 | 1,366 | 1,387 |
| Average Monthly Rent per Unit: | | | | | | | | | |
| - 1-BR | $1,496 | $1,768 | $1,595 | $1,508 | $1,863 | $1,509 | $1,434 | $1,321 | $1,639 |
| - 2-BR | $1,883 | $1,920 | $1,774 | $1,815 | $2,468 | $1,670 | $1,697 | $1,574 | $1,963 |
| - 3-BR | $2,476 | $2,250 | $1,841 | $1,938 | $2,758 | $2,051 | $2,120 | $1,818 | $2,326 |
| Average Annual Rent per SF: | | | | | | | | | |
| - 1-BR | $24.48 | $27.44 | $26.34 | $20.84 | $30.48 | $22.13 | $23.92 | $19.32 | $27.36 |
| - 2-BR | $21.94 | $21.66 | $19.86 | $18.36 | $28.32 | $17.95 | $19.08 | $16.95 | $22.28 |
| - 3-BR | $23.20 | $20.40 | $16.92 | $16.62 | $26.40 | $18.04 | $21.24 | $16.04 | $20.16 |
Source: Appraisal
| (1) | Occupancy, Average Monthly Rent per Unit and Average Annual Rent per SF for The Grove at Portofino Vineyards Property is based on the borrower rent roll dated November 18, 2021. |
Operating History and Underwritten Net Cash Flow. The following table presents certain information relating to the historical operating performance and Underwritten Net Cash Flow at The Grove at Portofino Vineyards Property:
| Cash Flow Analysis(1) |
| | 10/31/2021 TTM(1) | UW | UW Per Unit |
| Gross Potential Rent | $6,179,316 | $7,046,580 | $22,585.19 |
| Concessions(2) | ($593,478) | ($70,466) | ($225.85) |
| Vacancy(3) | ($4,007,778) | ($352,329) | ($1,129.26) |
| Other Income | $432,094 | $606,620 | $1,944.29 |
| Effective Gross Income | $2,010,154 | $7,230,405 | $23,174.38 |
| | | | |
| Real Estate Taxes(4) | $214,799 | $580,026 | $1,859.06 |
| Insurance | $123,909 | $315,000 | $1,009.62 |
| Other Operating Expenses | $730,851 | $1,025,508 | $3,286.88 |
| Total Operating Expenses | $1,069,559 | $1,920,534 | $6,155.56 |
| | | | |
| Net Operating Income | $940,595 | $5,309,871 | $17,018.82 |
| Replacement Reserves | $0 | $78,000 | $250.00 |
| Net Cash Flow | $940,595 | $5,231,871 | $16,768.82 |
| | | | |
| Occupancy | 95.8%(5) | 94.9% | |
| NOI DSCR | 0.34x | 1.92x | |
| NCF DSCR | 0.34x | 1.89x | |
| NOI Debt Yield | 1.3% | 7.5% | |
| NCF Debt Yield | 1.3% | 7.4% | |
| | | | | |
| (1) | The borrower sponsor completed construction of The Grove at Portofino Vineyards Property in December 2020, therefore, the 10/31/2021 TTM period is not a full twelve months and no historical information is available. |
| (2) | According to the borrower sponsor, concessions were exclusively offered on leases with terms of 13 to 14 months during lease-up and concessions were discontinued as of early October 2021. |
| (3) | UW Vacancy represents the economic vacancy. |
| (4) | UW Real Estate Taxes represent a 15-year average of taxes increasing at a maximum 10% assessment cap increase per year. Current annual real estate taxes are $273,000. |
| (5) | Based on the borrower rent roll dated November 18, 2021. |
This is not a research report and was not prepared by any Underwriter’s research department. Please see additional important information and qualifications at the end of this Term Sheet. |
| | T-76 | |
| Multifamily – Garden | Loan #5 | Cut-off Date Balance: | | $71,000,000 |
| 19093 Cresenzo Court | The Grove at Portofino Vineyards | Cut-off Date LTV: | | 66.7% |
| Fort Myers, FL 33967 | | U/W NCF DSCR: | | 1.89x |
| | | U/W NOI Debt Yield: | | 7.5% |
Escrows and Reserves.
Real Estate Taxes – The Grove at Portofino Vineyards Mortgage Loan documents provide for an upfront reserve of approximately $71,197 for real estate taxes and ongoing monthly deposits into a reserve for real estate taxes in an amount equal to 1/12th of the real estate taxes that the lender estimates will be payable during the next twelve months for The Grove at Portofino Vineyards Property (initially, approximately $23,732 per month).
Insurance – The Grove at Portofino Vineyards Mortgage Loan documents provide for an upfront reserve of approximately $48,890 for insurance and ongoing monthly deposits into a reserve for insurance in an amount equal to 1/12th of the insurance premiums that the lender estimates will be payable during the next twelve months for The Grove at Portofino Vineyards Property (initially, approximately $24,445 per month). In the event the lender waives in writing the insurance escrow requirements because the required insurance is maintained under a blanket insurance policy, monthly deposits will be suspended.
Replacement Reserve – The borrower is required to deposit approximately $4,992 for replacements monthly.
Holdback Reserve – At loan origination, the lender reserved a capitalized holdback of $2,000,000, which will be disbursed to the borrower in one or two disbursements on or before January 1, 2024 if and to the extent The Grove at Portofino Vineyards Property has achieved a net cash flow debt yield (for purposes of such calculation, excluding the amount remaining in the holdback reserve following the applicable disbursement) of not less than 8.0%. After January 1, 2024, the lender will hold any remaining holdback reserve funds as additional collateral for The Grove at Portofino Vineyards Mortgage Loan for the remaining loan term.
Lockbox and Cash Management. The Grove at Portofino Vineyards Mortgage Loan is structured with springing cash management. Upon the first occurrence of a Cash Sweep Period (as defined below) or an event of default, the borrower is required to establish a cash management account for the benefit of the lender, into which all rents and other revenue from The Grove at Portofino Vineyards Property is required to be deposited by the borrower or property manager and, during a Cash Sweep Period, all funds in the cash management account are required to be disbursed in accordance with The Grove at Portofino Vineyards Mortgage Loan documents. Also, during a Cash Sweep Period, all excess cash is required to be collected by the lender and held as additional security for The Grove at Portofino Vineyards Mortgage Loan. If a Cash Sweep Period comes to an end, any funds in the cash management account will be transferred to the borrower and the account will be closed until the occurrence of another Cash Sweep Period or event of default.
A “Cash Sweep Period” will commence on the first day of the calendar month following the month during which the lender notifies the borrower of its determination that the underwritten net cash flow is less than $3,500,000 on a trailing 12 month basis for any calendar quarter, and ending on the last day of the calendar month during which the lender notifies the borrower of its determination that the underwritten net cash flow equals or exceeds $3,500,000 on a trailing 12 month basis for two consecutive calendar quarters.
Additional Secured Indebtedness (not including trade debts). None.
Mezzanine Loan and Preferred Equity. Not permitted.
Release of Property. Not permitted.
Right of First Offer / Right of First Refusal. None.
Ground Lease. None.
Letter of Credit. None.
Terrorism Insurance. The borrower is required to obtain and maintain property insurance that covers perils and acts of terrorism and is required to obtain and maintain business interruption insurance for 18 months plus a 6-month extended period of indemnity. See “Risk Factors—Risks Relating to the Mortgage Loans—Terrorism Insurance May Not Be Available for All Mortgaged Properties” in the prospectus.
This is not a research report and was not prepared by any Underwriter’s research department. Please see additional important information and qualifications at the end of this Term Sheet. |
| | T-77 | |
| Industrial - Flex | Loan #6 | Cut-off Date Balance: | | $64,800,000 |
| 26600 Southwest Parkway Avenue | ParkWorks Industry Center | Cut-off Date LTV: | | 67.2% |
| Wilsonville, OR 97070 | | UW NCF DSCR: | | 2.40x |
| | | UW NOI Debt Yield: | | 8.9% |
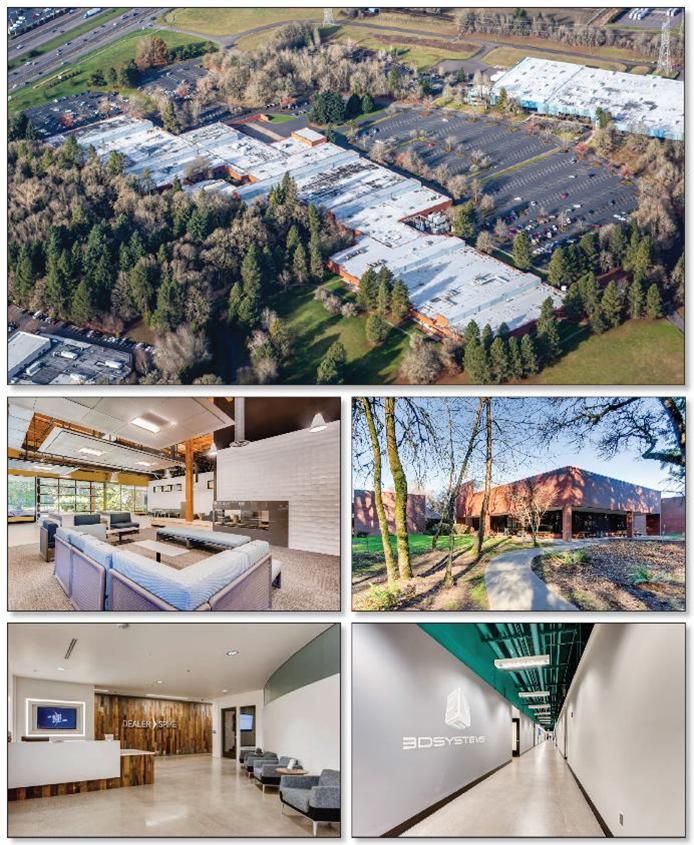
This is not a research report and was not prepared by any Underwriter’s research department. Please see additional important information and qualifications at the end of this Term Sheet. |
| | T-78 | |
| Industrial - Flex | Loan #6 | Cut-off Date Balance: | | $64,800,000 |
| 26600 Southwest Parkway Avenue | ParkWorks Industry Center | Cut-off Date LTV: | | 67.2% |
| Wilsonville, OR 97070 | | UW NCF DSCR: | | 2.40x |
| | | UW NOI Debt Yield: | | 8.9% |
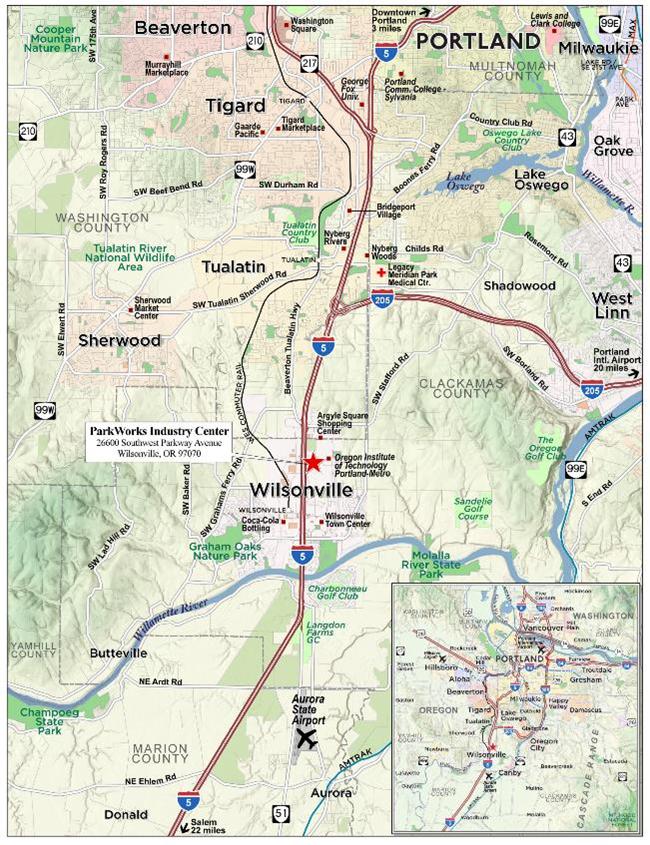
This is not a research report and was not prepared by any Underwriter’s research department. Please see additional important information and qualifications at the end of this Term Sheet. |
| | T-79 | |
| Mortgage Loan No. 6 – ParkWorks Industry Center |
| Mortgage Loan Information | | Property Information |
| Mortgage Loan Seller: | WFB | | Single Asset/Portfolio: | Single Asset |
| Credit Assessment (DBRSM/Fitch/Moody’s): | NR/NR/NR | | Location: | Wilsonville, OR 97070 |
| Original Balance: | $64,800,000 | | General Property Type: | Industrial |
| Cut-off Date Balance: | $64,800,000 | | Detailed Property Type: | Flex |
| % of Initial Pool Balance: | 5.4% | | Title Vesting: | Fee |
| Loan Purpose: | Recapitalization | | Year Built/Renovated: | 1975 / 2021 |
| Borrower Sponsor: | ScanlanKemberBard Companies, LLC | | Size: | 383,071 SF |
| Guarantors(1): | Various | | Cut-off Date Balance per SF: | $169 |
| Mortgage Rate: | 3.5020% | | Maturity Balance per SF: | $169 |
| Note Date: | 12/7/2021 | | Property Manager: | SKB PM I, LLC |
| First Payment Date: | 1/11/2022 | | | Borrower-related |
| Maturity Date: | 12/11/2031 | | | |
| Original Term to Maturity: | 120 months | | | |
| Original Amortization Term: | 0 months | | | |
| IO Period: | 120 months | | | |
| Seasoning: | 2 months | | | |
| Prepayment Provisions: | L(26),D(87),O(7) | | Underwriting and Financial Information(3) |
| Lockbox/Cash Mgmt Status: | Hard/In Place | | UW NOI: | $5,771,616 |
| Additional Debt Type: | NAP | | UW NOI Debt Yield: | 8.9% |
| Additional Debt Balance: | NAP | | UW NOI Debt Yield at Maturity: | 8.9% |
| Future Debt Permitted (Type): | No (NAP) | | UW NCF DSCR: | 2.40x |
| Reserves(2) | | Most Recent NOI(4): | NAV |
| Type | Initial | Monthly | Cap | | 2nd Most Recent NOI(4): | NAV |
| RE Taxes: | $89,370 | $44,685 | NAP | | 3rd Most Recent NOI(4): | NAV |
| Insurance: | $0 | Springing | NAP | | Most Recent Occupancy: | 100.0% (10/20/2021) |
| Replacement Reserve: | $0 | $4,788 | $172,368 | | 2nd Most Recent Occupancy(4): | NAV |
| CapEx Work Reserve: | $8,124,564 | $0 | NAP | | 3rd Most Recent Occupancy(4): | NAV |
| Rent Concession Reserve: | $1,732,447 | $0 | NAP | | Appraised Value (as of) (5): | $96,415,000 (4/1/2022) |
| Existing TI/LC Reserve: | $18,659,554 | $0 | NAP | | Appraised Value per SF: | $252 |
| TI/LC Reserve: | $574,596 | $15,961 | $574,596 | | Cut-off Date LTV Ratio: | 67.2% |
| Roof Work Reserve: | $1,850,000 | $0 | NAP | | Maturity Date LTV Ratio: | 67.2% |
| Sources and Uses |
| Sources | Proceeds | % of Total | | Uses | Proceeds | % of Total |
| Loan Amount: | $64,800,000 | 51.3% | | Purchase Price(6): | $92,775,000 | 73.4% |
| Borrower Equity: | $30,911,391 | 24.5% | | Reserves: | $31,030,530 | 24.6% |
| Seller Credits(7): | $30,646,446 | 24.3% | | Closing Costs: | $2,552,307 | 2.0% |
| Total Sources: | $126,357,837 | 100.0% | | Total Uses: | $126,357,837 | 100.0% |
| (1) | The general non-recourse guarantors are ScanlanKemperBard Companies, LLC, Todd M. Gooding, James V. Paul, and Patrick Terrell. The limited non-recourse guarantors are Kent C. McCarthy Dynasty Trust Non-GST Portion UA 3-1-2006, Michael E. Menashe, Michael E. Menashe Revocable Trust u/t/a dated October 14, 2020, Nicholas S. Kucha, Kucha Family Trust u/t/a dated August 23, 2019, Russell L. Reitz, and Russell L. Reitz, M.D. Trust u/t/a dated August 3, 2007. The limited non-recourse guarantors are only liable for specific acts related to the specific tenancy-in-common borrower controlled by the applicable limited non-recourse guarantor. |
| (2) | See “Escrows and Reserves” below for further discussion of reserve requirements. |
| (3) | The novel coronavirus pandemic is an evolving situation and could impact the ParkWorks Industry Center Mortgage Loan more severely than assumed in the underwriting of the ParkWorks Industry Center Mortgage Loan and could adversely affect the NOI, NCF and occupancy information, as well as the appraised value and the DSCR, LTV and Debt Yield metrics presented above and herein. See "Risk Factors—Risks Related to Market Conditions and Other External Factors—The Coronavirus Pandemic Has Adversely Affected the Global Economy and Will Likely Adversely Affect the Performance of the Mortgage Loans" in the prospectus. |
| (4) | The ParkWorks Industry Center Property (as defined below) had substantial vacancy in 2019 and 2020, and therefore historical financials and occupancy are not applicable to stabilized operations. See “The Property” section below for further details. |
| (5) | The appraisal represents the Prospective Market Value – As If Complete and Stabilized, less the value of three land parcels that may be released from the collateral. The value assumes that Twist Bioscience, which represents 55.4% of NRA and 55.3% of underwritten rent, has completed its build out and begun paying rent. All leasing costs for the tenant were reserved at loan closing. |
| (6) | The total purchase price for the ParkWorks Industry Center Property was $99,000,000. The $92,775,000 is net of $3,000,000 allocated to three vacant land parcels that are eligible for free release, and $3,225,000 of equity that is being rolled over from SkanlanKemperBard Companies, LLC previous ownership position. |
| (7) | The seller of the ParkWorks Industry Center Property provided credits for the roof repair ($1,850,000), Twist tenant improvements and auditorium ($18,184,088), Twist leasing commission ($47,466), Twist rent and CAM ($2,012,328), and redevelopment work and contingency ($8,124,564). |
The Mortgage Loan. The sixth largest mortgage loan (the “ParkWorks Industry Center Mortgage Loan”) is secured by a first priority fee mortgage encumbering a 383,071 SF industrial flex building, located in Wilsonville, OR (the “ParkWorks Industry Center Property”).
This is not a research report and was not prepared by any Underwriter’s research department. Please see additional important information and qualifications at the end of this Term Sheet. |
| | T-80 | |
| Industrial - Flex | Loan #6 | Cut-off Date Balance: | | $64,800,000 |
| 26600 Southwest Parkway Avenue | ParkWorks Industry Center | Cut-off Date LTV: | | 67.2% |
| Wilsonville, OR 97070 | | UW NCF DSCR: | | 2.40x |
| | | UW NOI Debt Yield: | | 8.9% |
The Borrowers and the Borrower Sponsor. The borrowing entity consists of seven tenants in common, SKB-Parkworks, LLC, Terrell and Associates Parkworks, LLC, Patrick Valencia Parkworks, LLC, Oak Tree KCMDT TIC Parkworks, LLC, Peachland Parkworks, LLC, NSK Properties II Parkworks, LLC and RLR MD Parkworks, LLC, all Delaware limited liability companies and single purpose entities with one independent director each. The general non-recourse guarantors are ScanlanKemperBard Companies, LLC, Todd M. Gooding, James V. Paul, and Patrick Terrell. The limited non-recourse guarantors are Kent C. McCarthy Dynasty Trust Non-GST Portion UA 3-1-2006, Michael E. Menashe, Michael E. Menashe Revocable Trust u/t/a dated October 14, 2020, Nicholas S. Kucha, Kucha Family Trust u/t/a dated August 23, 2019, Russell L. Reitz, and Russell L. Reitz, M.D. Trust u/t/a dated August 3, 2007. The limited non-recourse guarantors are only liable for specific acts related to the specific tenancy-in-common borrower controlled by the applicable limited non-recourse guarantor.
NSK Properties II Parkworks, LLC is subject to a reverse 1031 exchange, which has to occur within 180 days of closing, but is expected to happen sooner. Failure of the specific sponsor to come into ownership of the applicable borrower within 120 days will be an event of default (provided the borrower has 30 days to cure after they become aware of the failure or the lender provides notice), and a springing recourse event after 180 days. Recourse will be limited to the specific guarantors and sponsor’s entity guarantor and the remaining borrowers will have a 30 day period to cure the event of default by buying out the applicable interest.
The borrower sponsor is ScanlanKemperBard Companies, LLC (“SKB”). Based in Portland, Oregon, SKB is a real estate developer and operator. Since its founding over 20 years ago, the company has originated more than $4.68 billion in total portfolio activity and acquired 30.6 million SF through 108 total deals. SKB currently has 20 institutional partners and provides services including acquisition, reposition, development, advisory and management services. Guarantors Todd M. Gooding, James V. Paul and Patrick Terrell serve as the President, Executive Vice President of Asset Management, and Director, Principal, respectively, for SKB.
For additional information on the borrower sponsor and guarantors please see “Description of the Mortgage Pool - Loan Purpose; Default History, Bankruptcy Issues and Other Proceedings” in the prospectus.
The Property. The ParkWorks Industry Center Property is multi-tenant industrial property consisting of 383,071 rentable SF situated on three contiguous tax parcels totaling 88.3 acres. The one-story property was built in 1975, renovated in 2021 and is predominantly finished with R&D and manufacturing buildouts. The ParkWorks Industry Center Property includes eighth dock-high and four grade-level loading doors and 19.5’ to 24’ clear heights. The property features various amenities including a lounge with canteen market, fitness room, newly renovated entrance lobby, on-site public transportation and food truck, and abundant outdoor space. There are 1,150 parking space representing a 3.0 spaces / 1,000 SF parking ratio.
SKB, with its joint venture partner Oaktree Capital, purchased the ParkWorks Industry Center Property in 2015 as part of a sale lease back from the Xerox Corporation, with a business plan of repositioning the property from an owner/user campus to a multi-tenant office/industrial use. Xerox downsized as part of the transaction to approximately 184,358 SF and the ownership group implemented a $3.7 million capital improvement plan including campus signage, tenant amenities and building systems. In April 2020, SKB recapitalized the ParkWorks Industry Center Property upon notice from Xerox that it would be downsizing to 10,778 SF in November 2020. Due to Xerox downsizing and the repositioning plan, the ParkWorks Industry Center Property had substantial vacancy in 2019 and 2020. The new ownership group developed a $13 million capital plan and within a year had signed a lease with Twist Bioscience for 212,052 SF. In conjunction with the current sale and recapitalization, the borrower is spending $1.85 million on roof repairs and $8.1 million on building improvements including skylights, new docks, site modifications, signage upgrades, and other various improvements. As of October 20, 2021, the ParkWorks Industry Center Property is 100% leased to five tenants.
Major Tenant.
Twist Bioscience (212,052 SF; 55.4% of NRA; 55.3% of underwritten base rent; March 31, 2034 lease expiration): Twist Bioscience (“Twist”) was founded in 2013 and specializes in synthetic biology and genomics. The company has developed a DNA Synthesis platform that provides a new method of manufacturing synthetic DNA by writing DNA on a silicon chip. Twist has approximately 652 employees and, as of December 22, 2021 a market capitalization of approximately $4.3 billion.
Twist originally signed a lease for 110,995 SF (the “Original Space”) in December 2020 and amended the lease to include an additional 101,057 SF (“Expansion Space”) in April 2021. The lease commencement dates are September 2021 and April 2022 for the Original Space and Expansion Space, respectively. The tenant has six months of free rent on the Original Space followed by paying rent on only 64,590 SF in months 7-12. There is no free rent on the Expansion Space. All free rent and gap rent were reserved at loan closing. Twist is spending approximately $30.3 million of its own money to build out its space, with the borrower contributing an additional $17.6 million, once Twist has paid for its portion. The tenant has one, 10-year extension option with 9 to 12 months’ notice at fair market rent. The lease includes 3% annual rent increases and no termination or contraction options.
3D Systems (114,158 SF; 29.8% of NRA; 29.9% of underwritten base rent; February 28, 2031 lease expiration): Founded in 1986, 3 Systems provides comprehensive products and services including 3D printers, hardware, software, and material solutions from plastics to metals. The company is headquartered in South Carolina and has offices and manufacturing facilities around the world. 3D Systems has approximately 1,995 employees and, as of December 22, 2021, a market capitalization of $2.8 billion.
3D Systems has been a tenant since 2013 and has expanded several times, with the most recent expansion in June 2020 when it concurrently extended its lease though 2/28/2031. The tenant has one, 5-year extension option for at least 80% of its space, with 9 months’ notice at fair market rent. The lease includes 3% annual rent increases and no termination or contraction options.
Dealer Spike (45,123 SF; 11.8% of NRA; 11.8% of underwritten base rent; April 30, 2026 lease expiration): Dealer Spike is a worldwide digital advertising company focusing on helping dealers increase sales and service profitability through online digital advertising and training. The company has approximately 438 employees and is headquartered at the ParkWorks Industry Center Property.
Deal Spike has been a tenant since May 2018 and has two, 5-year extension options, with notice between 15 and 12 months prior to lease expiration at fair market rent. The lease includes 3% annual rent increases and no termination or contraction options.
This is not a research report and was not prepared by any Underwriter’s research department. Please see additional important information and qualifications at the end of this Term Sheet. |
| | T-81 | |
| Industrial - Flex | Loan #6 | Cut-off Date Balance: | | $64,800,000 |
| 26600 Southwest Parkway Avenue | ParkWorks Industry Center | Cut-off Date LTV: | | 67.2% |
| Wilsonville, OR 97070 | | UW NCF DSCR: | | 2.40x |
| | | UW NOI Debt Yield: | | 8.9% |
The following table presents certain information relating to the tenancy at the ParkWorks Industry Center Property:
| Tenant Summary |
| Tenant Name | Credit Rating (Fitch/ Moody's/S&P) | Tenant SF | Approx. % of SF | Annual UW Rent(1) | % of Total Annual UW Rent | Annual UW Rent PSF(1) | Termination
Option
(Y/N) | Lease Expiration | Renewal Options |
| Twist Bioscience(2) | NR/NR/NR | 212,052 | 55.4% | $3,360,960 | 55.3% | $15.85 | N | 3/31/2034 | 1x10 yr |
| 3D Systems | NR/NR/NR | 114,158 | 29.8% | $1,816,653 | 29.9% | $15.91 | N | 2/28/2031 | 1x5 yr |
| Dealer Spike | NR/NR/NR | 45,123 | 11.8% | $714,953 | 11.8% | $15.84 | N | 4/30/2026 | 2x5 yr |
| Subtotal/Wtd. Avg. | | 371,333 | 96.9% | $5,892,566 | 96.9% | $15.87 | | | |
| | | | | | | | | | |
| Other Tenants | | 11,738 | 3.1% | $186,471 | 3.1% | $15.89 | | | |
| Vacant Space | | 0 | 0.0% | $0 | 0.0% | $0.00 | | | |
| Total/Wtd. Avg. | | 383,071 | 100.0% | $6,079,037 | 100.0% | $15.87 | | | |
| (1) | The Annual U/W Rent PSF and Annual U/W Rent shown above represent rent steps through September 2022. |
| (2) | Twist Bioscience has two spaces: Unit-1 (110,995 SF) had a start date of 9/17/2021, and Unit-3 (101,057 SF), with a rent start date of 4/1/2022. |
The following table presents certain information relating to the lease rollover schedule at the ParkWorks Industry Center Property:
| Lease Rollover Schedule(1) |
| Year | # of Leases Rolling | SF Rolling | Annual UW Rent PSF Rolling | Approx. % of Total SF Rolling | Approx. Cumulative % of SF Rolling | Total UW Rent Rolling | Approx. % of Total Rent Rolling | Approx. Cumulative % of Total Rent Rolling |
| 2022 | 2 | 11,738 | $15.89 | 3.1% | 3.1% | $186,471 | 3.1% | 3.1% |
| 2023 | 0 | 0 | $0.00 | 0.0% | 3.1% | $0 | 0.0% | 3.1% |
| 2024 | 0 | 0 | $0.00 | 0.0% | 3.1% | $0 | 0.0% | 3.1% |
| 2025 | 0 | 0 | $0.00 | 0.0% | 3.1% | $0 | 0.0% | 3.1% |
| 2026 | 1 | 45,123 | $15.84 | 11.8% | 14.8% | $714,953 | 11.8% | 14.8% |
| 2027 | 0 | 0 | $0.00 | 0.0% | 14.8% | $0 | 0.0% | 14.8% |
| 2028 | 0 | 0 | $0.00 | 0.0% | 14.8% | $0 | 0.0% | 14.8% |
| 2029 | 0 | 0 | $0.00 | 0.0% | 14.8% | $0 | 0.0% | 14.8% |
| 2030 | 0 | 0 | $0.00 | 0.0% | 14.8% | $0 | 0.0% | 14.8% |
| 2031 | 1 | 114,158 | $15.91 | 29.8% | 44.6% | $1,816,653 | 29.9% | 44.7% |
| 2032 & Beyond | 2 | 212,052 | $15.56 | 55.4% | 100.0% | $3,360,960 | 55.3% | 100.0% |
| Vacant | 0 | 0 | $0.00 | 0.0% | 100.0% | $0.00 | 0.0% | 100.0% |
| Total/Wtd. Avg. | 6 | 383,071 | $15.87 | 100.0% | | $6,079,037 | 100.0% | |
| (1) | Information is based on the underwritten rent roll. |
COVID-19 Update. As of December 13, 2021, the ParkWorks Industry Center Property is open and operating with no outstanding tenant rent relief agreements.
The Market. The ParkWorks Industry Center Property is located in Wilsonville, Oregon, approximately 16.4 miles south of Portland. Wilsonville is adjacent to Interstate 5 which connects to Seattle and Canada to the north and California to the south. The city has become a major employment center in the Portland Metropolitan area with many large employers located there including Xerox Corporation, Tyco Electronics, Sysco Food Services, FLIR and Rockwood Collins, which reflect concentrations in the tech manufacturing and food distribution industries. The ParkWorks Industry Center Property is located adjacent to Interstate 5 with the closest interchange approximately 1.5 miles away. Additionally, it is located approximately 27.8 miles to the Portland International Airport and 32.6 miles from Salem, Oregon. The primary land use in the immediate area is industrial, with commercial development clustered near the two Interstate 5 interchanges. The nearest amenities to the ParkWorks Industry Center Property are at the Argyle Square Shopping Center, within five minutes, which includes a Costco, Target, Petco and several outparcels with national quick service users. According to the appraisal, the estimated 2022 population within a one, three and five-mile radius was approximately 3,300, 40,621, and 93,012, respectively and the estimated 2022 average household income within the same radii was approximately $110,953, $133,864 and $130,743, respectively.
According to the appraisal, the property is situated within in the Wilsonville industrial submarket within the greater Portland industrial market. As of the second quarter of 2021, the submarket reported a total inventory of approximately 8.5 million SF with a 6.1% vacancy rate and an average asking rent of $9.91 per SF (net). The appraiser identified six comparable buildings, only two located in Oregon, with rents ranging from $16.68 to $20.00 per SF (net). The appraiser concluded a market rent for the ParkWorks Industry Center Property of $17.75 per SF (net).
This is not a research report and was not prepared by any Underwriter’s research department. Please see additional important information and qualifications at the end of this Term Sheet. |
| | T-82 | |
| Industrial - Flex | Loan #6 | Cut-off Date Balance: | | $64,800,000 |
| 26600 Southwest Parkway Avenue | ParkWorks Industry Center | Cut-off Date LTV: | | 67.2% |
| Wilsonville, OR 97070 | | UW NCF DSCR: | | 2.40x |
| | | UW NOI Debt Yield: | | 8.9% |
The following table presents certain information relating to the appraisal’s market rent conclusions for the ParkWorks Industry Center Property:
| Market Rent Summary(1) |
| | R&D | Twist Space |
| Market Rent (PSF) | $17.75 | $17.75 |
| Lease Term (Years) | 10 | 10 |
| Lease Type | NNN | NNN |
| Rent Increase Projection | 3% per annum | 3% per annum |
| Tenant Improvements (New/Renewal) | $40-$50 / $0-$10 | $40-$50 / $0-$10 |
| Leasing Commissions (New/Renewal) | 8.5% / 3.0% | 8.5% / 3.3% |
| Free Rent | None | None |
The table below presents certain information relating to comparable sales pertaining to ParkWorks Industry Center Property identified by the appraiser:
| Comparable Sales |
Property Name/Location | Location | Year Built/Renovated | Rentable Area (SF) | Occupancy | Sale Date | Sale Price (PSF) |
Willows Commerce Park II 9825-9931 Willows Road | Redmond, WA | 1999/NAP | 417,414 | 97% | Mar-2021 | $335 |
Millikan 73 13955 Southwest Millikan Way | Beaverton, OR | 1976/NAP | 103,316 | 100% | Mar-2021 | $232 |
NE Jacobson Road & NE Croeni Industrial Building 6231 NE Croeni Avenue | Hillsboro, OR | 2020/NAP | 60,000 | 0% | Jun-2020 | $195 |
Leveton Business Park 18625 Southwest 108th Avenue | Tualatin, OR | 2018/NAP | 87,476 | 100% | Feb-2020 | $274 |
Zetron Building 12034 134th Court Northeast | Redmond, WA | 1995/NAP | 189,000 | 95% | Dec-2019 | $286 |
Marymoor Technology Building 17275 Northeast 67th Court | Redmond, WA | 1984/2018 | 78,676 | 100% | May-2019 | $299 |
Source: Appraisal
The following table presents certain information relating to comparable office leases for the ParkWorks Industry Center Property:
| Comparable Building Leases |
| Property Name/Location | Year Built/
Renovated | Total GLA (SF) | Occupancy | Term | Annual Base Rent PSF | Lease Type |
Willow Ridge Tech Center-Spectralux 12335 134th Court Northeast Redmond, WA | 1987/1995 | 31,105 | 100% | 36 mths. | $20.00 | NNN |
Millikan Business Center 14400-14523 Southwest Millikan Way Beaverton, OR | 1970/NAP | 292,599 | 100% | 125 mths. | $17.25 | NNN |
Gateway 84 – Building 1 7400 Gateway Boulevard Newark, CA | 2019/NAP | 117,898 | 100% | 180 mths. | $16.68 | NNN |
Valley Oak Technology Center – Building 1 6373 San Ignacio Avenue San Jose, CA | 2002/2019 | 82,144 | 100% | 132 mths. | $18.60 | NNN |
Fremont Research Center 47513-33, 47600, 47621-33, 47650 Westinghouse Drive & 255 Fourier Avenue Fremont, CA | 1983/NAP | 217,653 | 100% | 86 mths. | $16.92 | NNN |
Oracle Building 3380 Northeast 79th Avenue Hillsboro, OR | 2000/NAP | 90,972 | 100% | 60 mths. | $16.80 | NNN |
Source: Appraisal.
This is not a research report and was not prepared by any Underwriter’s research department. Please see additional important information and qualifications at the end of this Term Sheet. |
| | T-83 | |
| Industrial - Flex | Loan #6 | Cut-off Date Balance: | | $64,800,000 |
| 26600 Southwest Parkway Avenue | ParkWorks Industry Center | Cut-off Date LTV: | | 67.2% |
| Wilsonville, OR 97070 | | UW NCF DSCR: | | 2.40x |
| | | UW NOI Debt Yield: | | 8.9% |
Underwritten Net Cash Flow. The following table presents certain information relating to the Underwritten Net Cash Flow at the ParkWorks Industry Center Property:
| Cash Flow Analysis |
| | UW | UW PSF |
| Gross Potential Base Rent | $6,079,037(1) | $15.87 |
| Total Recoveries | $2,561,244 | $6.69 |
| Other Income(2) | $131,333 | $0.34 |
| Less Vacancy & Credit Loss | ($303,952) | ($0.79) |
| Effective Gross Income | $8,467,662 | $22.10 |
| | | |
| Real Estate Taxes | $565,078 | $1.48 |
| Insurance | $76,500 | $0.20 |
| Other Operating Expenses | $2,054,468 | $5.36 |
| Total Expenses | $2,696,046 | $7.04 |
| | | |
| Net Operating Income | $5,771,616 | $15.07 |
| CapEx | $57,461 | $0.15 |
| TI/LC(3) | $191,537 | $0.50 |
| Net Cash Flow | $5,522,619 | $14.42 |
| | | |
| Occupancy %(4) | 95.0% | |
| NOI DSCR | 2.51x | |
| NCF DSCR | 2.40x | |
| NOI Debt Yield | 8.9% | |
| NCF Debt Yield | 8.5% | |
| | | | |
| (1) | The UW Base Rent represents rent steps through September 2022. |
| (2) | Other Income includes Twist’s pro rata share of the amortized cost of the roof replacement and other capital expenditure items completed by landlord. Additionally, it includes HVAC overage charges for 3D Systems. |
| (3) | TI/LC includes a $57,460 deduction for the upfront TI/LC reserve. |
| (4) | Although the ParkWorks Industry Center Property is currently 100% leased, a 5% vacancy is underwritten. |
Escrows and Reserves.
Real Estate Taxes – The loan documents require an upfront deposit of $89,370 and ongoing monthly real estate tax reserves in an amount equal to 1/12th of the real estate taxes that the lender estimates will be payable during the next 12 months, initially estimated at $44,685.
Insurance – The loan documents require ongoing monthly insurance reserves in an amount equal to 1/12th of the insurance premiums that the lender estimates will be payable for the renewal of the coverage afforded by the policies upon the expiration thereof.
Notwithstanding the above, the borrower’s obligation to make insurance reserve payments will be waived so long as (i) no event of default is continuing, (ii) the insurance policies maintained by the borrower are part of a blanket or umbrella policy approved by the lender in its reasonable discretion, and (iii) the lender is provided with paid receipts for the payment of the insurance premiums no later than ten business days prior to the expiration dates of said policies.
Replacement Reserve – The loan documents require an ongoing monthly replacement reserve deposit of $4,788, capped at $172,368.
TI/LC Reserve – The loan documents require an upfront deposit of $574,596 and an ongoing monthly TI/LC reserve deposit of $15,961, provided that if there is no Cash Trap Event Period continuing, the reserve will be capped at $574,596.
CapEx Work Reserve – The loan documents require an upfront deposit of $8,124,564 related to certain ongoing capital projects including but not limited to skylights, new docks, site modifications, and signage upgrades, as outlined in the loan agreement.
Roof Work Reserve – The loan documents require an upfront deposit of $1,850,000 related to the installation of a TPO membrane and the reapplication of aluminized coating on certain areas of the roof.
Rent Concession Reserve – The loan documents require an upfront deposit of $1,732,447, which represents the amount of future rent credits or abatements under the Twist Bioscience lease.
Existing TI/LC Reserve – The loan documents require an upfront deposit of $18,659,554, which represents the leasing commissions and tenant improvements payable by the borrower under the Twist Bioscience lease.
This is not a research report and was not prepared by any Underwriter’s research department. Please see additional important information and qualifications at the end of this Term Sheet. |
| | T-84 | |
| Industrial - Flex | Loan #6 | Cut-off Date Balance: | | $64,800,000 |
| 26600 Southwest Parkway Avenue | ParkWorks Industry Center | Cut-off Date LTV: | | 67.2% |
| Wilsonville, OR 97070 | | UW NCF DSCR: | | 2.40x |
| | | UW NOI Debt Yield: | | 8.9% |
Lockbox and Cash Management. The ParkWorks Mortgage Loan is structured with a hard lockbox and in-place cash management. The borrower and property manager are required to direct the tenant to pay rent directly into the lockbox account, and to deposit any rents otherwise received in such account within two business days after receipt. On each business day, the lockbox bank is required to transfer amounts on deposit in the lockbox account into the cash management account, to be applied in accordance with the loan documents. If no Cash Trap Event Period exists, all excess cash flow will be disbursed to the borrower. During the continuance of a Cash Trap Event Period, excess cash flow will be held by the lender as additional collateral.
A “Cash Trap Event Period” will commence upon the earlier of the following:
| (i) | the occurrence of an event of default under the loan documents; |
| (ii) | the net cash flow debt service coverage ratio is below 1.20x (assuming 30-year amortization), tested quarterly; |
| (iii) | the occurrence of a Major Tenant Sweep Event Period (as defined below). |
A Cash Trap Event Period will end upon the occurrence of the following:
| ● | with regard to clause (i), the cure of such event of default; |
| ● | with regard to clause (ii), the net cash flow debt service coverage ratio being greater than 1.25x for two consecutive quarters, tested quarterly, or within 10 days of notification by the lender, the borrower delivers cash or a letter of credit in an amount which, if applied to the then principal balance of the ParkWorks Industry Center Mortgage Loan (without payment of any prepayment penalty or yield maintenance premium), would result in the debt service coverage ratio threshold of 1.25x being satisfied; |
| ● | with regard to clause (iii), a Material Tenant Sweep Event Cure (as defined below) occurs. |
A “Major Tenant Sweep Event” will commence upon the occurrence of any of the following:
| (i) | nine months prior to the lease expiration for 3D Systems; |
| (ii) | either 3D Systems or Twist Bioscience (each a “Major Tenant”) go dark, vacate, or otherwise fail to occupy the entirety of its space; |
| (iii) | the occurrence of a monetary or material non-monetary default by a Major Tenant under its lease beyond any applicable notice and cure periods; or |
| (iv) | any filing by or against a Major Tenant under any creditor’s rights laws that could reasonably be expected to result in a rejection of the lease |
provided, however, that if the borrower makes the applicable Major Tenant Sweep Event Avoidance Deposit (defined below) within 30 days of the occurrence, no Major Tenant Sweep Event will be deemed to have occurred.
A “Major Tenant Sweep Event Cure” will commence upon the occurrence of any of the following:
| ● | with respect to clauses (ii), (iii), and (iv), the date on which the Major Tenant space is leased to one or more qualified leases sufficient to generate a debt service coverage ratio equal to or greater than 1.25x for two consecutive quarters and the tenant has taken occupancy of its entire space, all contingencies under the lease have been satisfied, all leasing commissions and tenant improvements have been paid or reserved for, the tenant is paying full rent, or the remaining free rent has been reserved, and the rent commencement date under such lease has been set; |
| ● | with regard solely to clause (i), the date on which 3D Systems exercises its renewal option for all its space, or otherwise enters into an extension pursuant to an amendment to its lease or pursuant to a new lease in form and substance reasonably approved by the lender; |
| ● | if caused solely by clause (ii), the date when the Major Tenant has resumed its normal business operations in the entirety of its space for a period of two consecutive quarters; |
| ● | if caused solely by clause (iii), the date three months following the date when the default has been cured, provided there is no other default under the Major Tenant lease; or |
| ● | if caused solely by clause (iv), the applicable proceeding under any creditor’s rights laws having been terminated and/or the Major Tenant lease has been affirmed and assumed in a manner reasonably acceptable the lender. |
A “Major Tenant Sweep Event Avoidance Deposit” means $30 per rentable SF multiplied by the total amount of the Major Tenant space.
Additional Secured Indebtedness (not including trade debts). None.
Mezzanine Loan and Preferred Equity. Not permitted.
Release of Property.There are three parcels eligible for free release from the ParkWorks Industry Center Property, the value of each which was excluded from the appraised value. On up to two occasions, the lender may release a portion of the collateral within Parcel 5, a 7.24-acre un-developed parcel and Parcel 7, a 2.8-acre undeveloped parcel, not to exceed 10.04-acres in total. Additionally, on up to two occasions, the lender may release a portion of the collateral in Tract A, a 31.8-acre un-developed parcel, not to exceed 31.8 acres in total. In each case, all of the following conditions must be satisfied:
| (i) | no event of default exists; |
| (ii) | the release parcel is released in connection with a sale to a third-party other than the borrower (may be an affiliate of the borrower or guarantor); |
| (iii) | the release parcel contains no net rentable area; |
| (iv) | the release parcel, and remaining parcel, are separate legal lots and tax parcels and each is in compliance with all applicable zoning and land use laws, and the remaining parcel has access to the Minimum Number of Parking Spaces (defined below); |
| (v) | any development, subdivision, construction, or use on the release parcel will not have an adverse effect or violate any lease requirements on the remaining parcel; and |
| (vi) | the borrower has entered into, and recorded, a permanent parking easement with the release parcel for the number of parking spaces necessary so that the remaining parcel has at least the Minimum Number of Parking Spaces. |
This is not a research report and was not prepared by any Underwriter’s research department. Please see additional important information and qualifications at the end of this Term Sheet. |
| | T-85 | |
| Industrial - Flex | Loan #6 | Cut-off Date Balance: | | $64,800,000 |
| 26600 Southwest Parkway Avenue | ParkWorks Industry Center | Cut-off Date LTV: | | 67.2% |
| Wilsonville, OR 97070 | | UW NCF DSCR: | | 2.40x |
| | | UW NOI Debt Yield: | | 8.9% |
“Minimum Number of Parking Spaces” means the greater of (a) 1,024, and (b) an amount equal to the minimum parking ratio or minimum parking spaces required under the leases, each REA and all applicable zoning laws and ordinances.
Right of First Offer/Right of First Refusal. None.
Ground Lease. None.
Letter of Credit. None.
Terrorism Insurance.The loan documents require that the “all risk” insurance policy required to be maintained by the borrower provides coverage for terrorism in an amount equal to the full replacement cost of the property, as well as business interruption insurance covering no less than the 18-month period following the occurrence of a casualty event, together with a 6-month extended period of indemnity.
This is not a research report and was not prepared by any Underwriter’s research department. Please see additional important information and qualifications at the end of this Term Sheet. |
| | T-86 | |
(THIS PAGE INTENTIONALLY LEFT BLANK)
This is not a research report and was not prepared by any Underwriter’s research department. Please see additional important information and qualifications at the end of this Term Sheet. |
| | T-87 | |
| Mixed Use – Office/Lab | Loan #7 | Cut-off Date Balance: | | $52,959,184 |
| 350 and 450 Water Street | CX - 350 & 450 Water Street | Cut-off Date LTV: | | 41.7% |
| Cambridge, MA 02141 | | UW NCF DSCR: | | 3.50x |
| | | UW NOI Debt Yield: | | 9.9% |
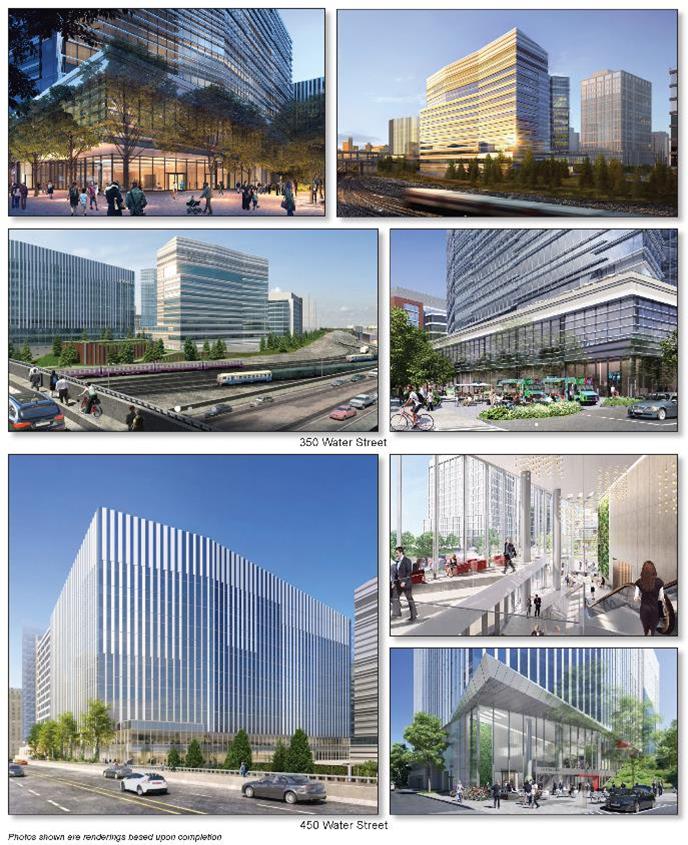
This is not a research report and was not prepared by any Underwriter’s research department. Please see additional important information and qualifications at the end of this Term Sheet. |
| | T-88 | |
| Mixed Use – Office/Lab | Loan #7 | Cut-off Date Balance: | | $52,959,184 |
| 350 and 450 Water Street | CX - 350 & 450 Water Street | Cut-off Date LTV: | | 41.7% |
| Cambridge, MA 02141 | | UW NCF DSCR: | | 3.50x |
| | | UW NOI Debt Yield: | | 9.9% |
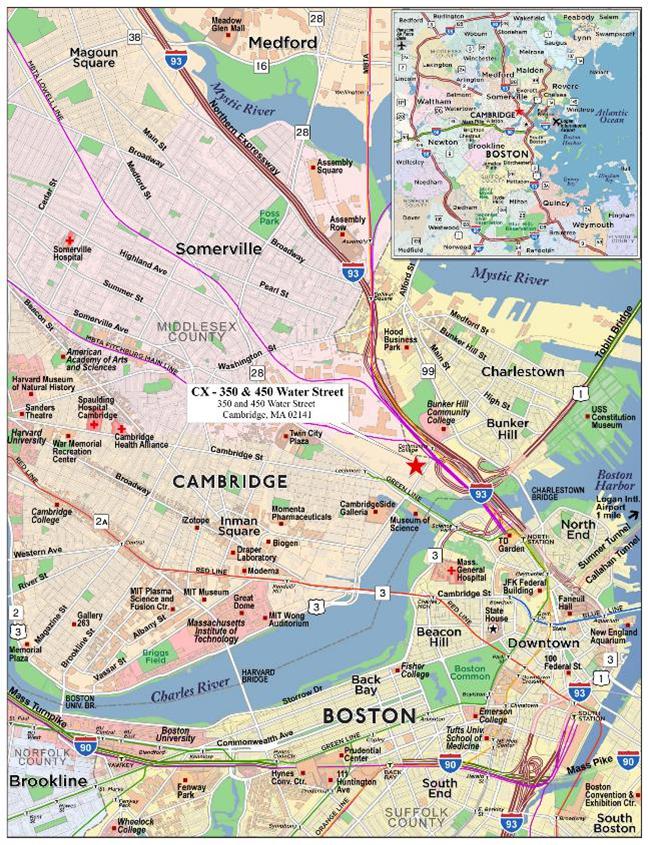
This is not a research report and was not prepared by any Underwriter’s research department. Please see additional important information and qualifications at the end of this Term Sheet. |
| | T-89 | |
| Mortgage Loan No. 7 – CX - 350 & 450 Water Street |
| Mortgage Loan Information | | Property Information |
| Mortgage Loan Seller: | BANA | | Single Asset/Portfolio: | Single Asset |
| Credit Assessment (DBRSM/Fitch/Moody’s): | A(high)/BBB-sf/A3 | | Location: | Cambridge, MA 02141 |
| Original Balance(1): | $52,959,184 | | General Property Type: | Mixed Use |
| Cut-off Date Balance(1): | $52,959,184 | | Detailed Property Type: | Office/Lab |
| % of Initial Pool Balance: | 4.4% | | Title Vesting: | Fee |
| Loan Purpose: | Refinance | | Year Built/Renovated: | 2021 / NAP |
| Borrower Sponsors: | DivcoWest, California State Teachers’ Retirement System and Teacher | | Size: | 915,233 SF |
| | Retirement System of Texas | | Cut-off Date Balance Per SF(1): | $889 |
| Guarantors(2): | DW PropCo G, LLC and DW PropCo H, LLC | | Maturity Date Balance Per SF(1)(3): | $889 |
| Mortgage Rate: | 2.7920% | | Property Manager: | Divco West Real Estate |
| Note Date: | 10/14/2021 | | | Services, Inc. |
| First Payment Date: | 12/6/2021 | | | (borrower-related) |
| Maturity Date(3): | 11/6/2031 | | | |
| Original Term to Maturity(3): | 120 months | | Underwriting and Financial Information(7) |
| Original Amortization Term: | 0 months | | UW NOI: | $80,703,532 |
| IO Period(3): | 120 months | | UW NOI Debt Yield(1): | 9.9% |
| Seasoning: | 3 months | | UW NOI Debt Yield at Maturity(1)(3): | 9.9% |
| Prepayment Provisions(3)(4): | L(24),YM1(3),DorYM1(86),O(7) | | UW NCF DSCR(1): | 3.50x |
| Lockbox/Cash Mgmt Status: | Hard/Springing | | Most Recent NOI(8): | NAV |
| Additional Debt Type(1): | Pari Passu / B Notes | | 2nd Most Recent NOI(8): | NAV |
| Additional Debt Balance(1): | $761,040,816 / $411,000,000 | | 3rd Most Recent NOI(8): | NAV |
| Future Debt Permitted (Type): | No (NAP) | | Most Recent Occupancy: | 100.0% (11/1/2021) |
| Reserves(5) | | 2nd Most Recent Occupancy(8): | NAV |
| Type | Initial | Monthly | Cap | | 3rd Most Recent Occupancy(8): | NAV |
| RE Taxes: | $0 | Springing | NAP | | Appraised Value (as of)(9): | $1,954,000,000 (4/1/2023) |
| Insurance: | $0 | Springing | NAP | | Appraised Value PSF: | $2,135 |
| TI/LC Reserve: | $52,062,079 | Springing | NAP | | Cut-off Date LTV Ratio(1)(9): | 41.7% |
| Other Reserve(6): | $97,383,122 | $0 | NAP | | Maturity Date LTV Ratio(1)(3)(9): | 41.7% |
| | | | | | | |
| Sources and Uses |
| Sources | Proceeds | % of Total | | Uses | Proceeds | % of Total |
| Senior Loan Amount(1): | $814,000,000 | 66.4% | | Loan Payoff: | $617,846,136 | 50.4% |
| Subordinate Loan Amount(1): | $411,000,000 | 33.6% | | Return of Equity: | $451,939,764 | 36.9% |
| | | | | Reserves: | $149,445,201 | 12.2% |
| | | | | Closing Costs: | $5,768,900 | 0.5% |
| Total Sources: | $1,225,000,000 | 100.0% | | Total Uses: | $1,225,000,000 | 100.0% |
| (1) | The CX - 350 & 450 Water Street Mortgage Loan (as defined below) is part of the CX - 350 & 450 Water Street Whole Loan (as defined below), which is comprised of twenty pari passu senior promissory notes and four subordinate notes. The Cut-off Date Balance Per SF, Maturity Date Balance Per SF, UW NOI Debt Yield, UW NOI Debt Yield at Maturity, UW NCF DSCR, Cut-off Date LTV Ratio and Maturity Date LTV Ratio numbers presented above are based on the principal balance of the CX - 350 & 450 Water Street Senior Loan (as defined below). The Cut-off Date Balance Per SF, Maturity Date Balance Per SF, UW NOI Debt Yield, UW NOI Debt Yield at Maturity, UW NCF DSCR, Cut-off Date LTV Ratio and Maturity Date LTV Ratio based on the principal balance of the CX - 350 & 450 Water Street Whole Loan are $1,338, $1,338, 6.6%, 6.6%, 2.32x, 62.7% and 62.7%, respectively. |
| (2) | There is no non-recourse carveout guarantor or environmental indemnitor for the CX - 350 & 450 Water Street Whole Loan separate from the borrower. The entities identified above under “Guarantor” are the borrowers. |
| (3) | The CX - 350 & 450 Water Street Whole Loan is structured with an Anticipated Repayment Date (“ARD”) of November 6, 2031 and a final maturity date of November 6, 2036. The initial interest rate for the CX – 350 & 450 Water Street Whole Loan is 2.79200% per annum. After the ARD, the interest rate will increase by 2.0000% over the greater of (x) 2.792000%, and (y) (1) the swap rate in effect on the ARD plus (2) 1.26000%. The metrics presented above are calculated based on the ARD. |
| (4) | The CX - 350 & 450 Water Street Whole Loan may be voluntarily prepaid in whole beginning on or after the payment date in December 2023 with the payment of the yield maintenance premium if such prepayment occurs prior to the payment date in May 2031. In addition, the CX – 350 & 450 Water Street Whole Loan may be defeased in whole at any time after the earlier to occur of (i) October 14, 2024 or (ii) the date that is two years from the closing date of the securitization that includes the last pari passu note to be securitized. |
| (5) | See “Escrows and Reserves” section below for further discussion of reserve requirements. |
| (6) | Other Reserve represents a Base Building Work Reserve of approximately $86,650,891 and an Aventis Rent Reserve of approximately $10,732,231. |
| (7) | The novel coronavirus pandemic is an evolving situation and could impact the CX - 350 & 450 Water Street Whole Loan more severely than assumed in the underwriting of the CX - 350 & 450 Water Street Whole Loan and could adversely affect the NOI, NCF and occupancy information, as well as the appraised value and the DSCR, LTV and Debt Yield metrics presented above and herein. See "Risk Factors-—Risks Related to Market Conditions and Other External Factors—The Coronavirus Pandemic Has Adversely Affected the Global Economy and Will Likely Adversely Affect the Performance of the Mortgage Loans" in the prospectus. |
| (8) | Historical financial information and occupancy is not available because the CX - 350 & 450 Water Street Property (as defined below) is currently being built. The 350 Water Street building is expected to be substantially completed in the second quarter of 2022 and the 450 Water Street building was substantially completed on December 16, 2021. |
| (9) | The Appraised Value shown is the “Prospective Market Value Upon Completion & Stabilization”, which assumes that the outstanding capital expenditures of approximately $56 million for the 350 Water Street building and $80 million for the 450 Water Street building are fully funded and reserved by the lender, and that these reserved funds would pass with title to any purchaser of the CX – 350 & 450 Water Street Property. The appraisal concluded to an “as-is” appraised value of $1.778 billion as of September 8, 2021. The “as-is” appraised value results in a Cut-off Date LTV Ratio and Maturity Date LTV Ratio of 45.8% for the CX - 350 & 450 Water Street Senior Loan, and a Cut-off Date LTV Ratio and Maturity Date LTV Ratio of 68.9% for the CX - 350 & 450 Water Street Whole Loan. The appraisal concluded to an “as dark” appraised value of $1.901 billion. The “as dark” appraised value results in a Cut-off Date LTV Ratio and Maturity Date LTV Ratio of 42.8% for the CX - 350 & 450 Water Street Senior Loan, and a Cutoff Date LTV Ratio and Maturity Date LTV Ratio of 64.4% for the CX - 350 & 450 Water Street Whole Loan. |
This is not a research report and was not prepared by any Underwriter’s research department. Please see additional important information and qualifications at the end of this Term Sheet. |
| | T-90 | |
| Mixed Use – Office/Lab | Loan #7 | Cut-off Date Balance: | | $52,959,184 |
| 350 and 450 Water Street | CX - 350 & 450 Water Street | Cut-off Date LTV: | | 41.7% |
| Cambridge, MA 02141 | | UW NCF DSCR: | | 3.50x |
| | | UW NOI Debt Yield: | | 9.9% |
The Mortgage Loan. The seventh largest mortgage loan (the “CX - 350 & 450 Water Street Mortgage Loan”) is part of a whole loan (the “CX - 350 & 450 Water Street Whole Loan”) evidenced by twenty pari passu senior promissory notes in the aggregate original principal amount of $814,000,000 (collectively, the “CX - 350 & 450 Water Street Senior Loan” and “CX - 350 & 450 Water Street Senior Notes”) and four junior pari passu notes in the aggregate original principal amount of $411,000,000 (collectively, the “CX - 350 & 450 Water Street Subordinate Companion Loan” and the “350 & 450 Water Street Junior Notes”) that are subordinate to the CX - 350 & 450 Water Street Senior Loan. The CX - 350 & 450 Water Street Whole Loan was originated by Bank of America, N.A., DBR Investments Co. Limited, JPMorgan Chase Bank, National Association and 3650 Cal Bridge Lending, LLC. The CX - 350 & 450 Water Street Whole Loan is secured by a first priority fee mortgage encumbering two sciences laboratory and office buildings aggregating 915,233 SF located in Cambridge, Massachusetts (the “CX - 350 & 450 Water Street Property”).
The CX - 350 & 450 Water Street Mortgage Loan is evidenced by the non-controlling senior Notes A-2-2 and A-2-5 with an aggregate original principal amount of $52,959,184. The remaining promissory notes comprising the CX - 350 & 450 Water Street Whole Loan are summarized in the below table. The CX - 350 & 450 Water Street Whole Loan will be serviced pursuant to the trust and servicing agreement for the CAMB 2021-CX2 securitization trust. See “Description of the Mortgage Pool—The Whole Loans—The CX - 350 & 450 Water Street Pari Passu-A/B Whole Loan” and “Pooling and Servicing Agreement—Servicing of the Non-Serviced Mortgage Loans” in the prospectus.
The CX - 350 & 450 Water Street Whole Loan has a 10-year interest-only term through the ARD of November 6, 2031 and a final maturity date of November 6, 2036. After the ARD, through and including November 6, 2036, the following structure will apply: the interest rate will increase (such new rate, the “Adjusted Interest Rate”) by 2.0000% over the greater of (x) 2.79200%, and (y)(1) the swap rate in effect on the ARD plus (2) 1.26000%; however, interest accrued at the excess of the Adjusted Interest Rate over the initial interest rate will be deferred as described below under “Lockbox and Cash Management.” For the period from the origination date through the ARD, the CX - 350 & 450 Water Street Whole Loan accrues interest at the rate of 2.79200% per annum.
| CX - 350 & 450 Water Street Whole Loan Summary |
Note | Original Balance | Cut-off Date Balance | Note Holder | Controlling
Piece |
| A-1-1, A-2-1, A-3-1, A-4-1 | $285,000,000 | $285,000,000 | CAMB 2021-CX2 | Yes |
| A-1-3, A-3-2 | $94,000,000 | $94,000,000 | Benchmark 2021-B30 | No |
| A-1-5, A-1-6, A-1-8 | $101,000,000 | $101,000,000 | DBR Investments Co. Limited | No |
| A-2-3, A-2-4 | $55,000,000 | $55,000,000 | BANK 2021-BNK38 | No |
| A-2-2, A-2-5 | $52,959,184 | $52,959,184 | BANK 2022-BNK39 | No |
| A-1-7, A-4-2, A-4-3 | $77,900,000 | $77,900,000 | 3650R 2021-PF1 | No |
| A-1-2, A-1-4, A-1-9, A-3-3 | $148,140,816 | $148,140,816 | Benchmark 2021-B31 | No |
| Total Senior Notes | $814,000,000 | $814,000,000 | | |
| B-1, B-2, B-3, B-4 | $411,000,000 | $411,000,000 | CAMB 2021-CX2 | No |
| Whole Loan | $1,225,000,000 | $1,225,000,000 | | |
The Borrowers and the Borrower Sponsors. The borrowers are DW PropCo G, LLC and DW PropCo H, LLC, each a Delaware limited liability company and single purpose entity with two independent directors. There is no non-recourse carveout guarantor or environmental indemnitor for the CX – 350 & 540 Water Street Whole Loan separate from the borrowers. The borrower sponsors are a joint venture between DivcoWest (“Divco”), California State Teachers’ Retirement System (“CalSTRS”) and Teacher Retirement System of Texas (“TRS”).
Founded in 1993, Divco is a multidisciplinary investment firm headquartered in San Francisco, California with over 160 employees across six investment offices. Divco is a developer, owner and operator of real estate throughout the United States, with expertise in Boston, having invested in and managed over 22 commercial properties in the area, including offices in the Seaport, Financial District, and East Cambridge submarkets. Most notably, Divco owned and operated One Kendall Square, a life sciences office campus in the Kendall Square submarket. As of June 30, 2021, Divco had over $13.7 billion in assets under management. Since inception, Divco has acquired approximately 55.0 million SF.
CalSTRS is reported to be the nation’s second largest public pension fund, with assets totaling approximately $321.9 billion as of October 31, 2021. Their investment portfolio is diversified into nine asset categories, approximately including 11.7% (approximately $37.8 billion as of June 30, 2021) of which is allocated towards real estate investments in institutional Class A commercial assets across the United States. Divco and CalSTRS have an 18-year history of investing together with Divco and CalSTRS, investing over $1.5 billion into various Divco sponsored investment vehicles.
Established in 1937, TRS provides retirement and related benefits for those employed by the public schools, colleges, and universities supported by the State of Texas. As of August 31, 2020, the agency is serving nearly 1.7 million participants and had assets under management of nearly $187 billion. TRS is the largest public retirement system in Texas in both membership and assets.
The Property. The CX – 350 & 450 Water Street Property consists of two Class A, LEED Gold (targeted), life sciences laboratory and office buildings totaling 915,233 SF located in Cambridge, Massachusetts. The 350 Water Street building (Parcel G) is a laboratory building consisting of 511,157 SF. The 450 Water Street building (Parcel H) is a contemporary office building consisting of 404,076 SF. Designed by Perkins + Will (350 Water Street) and NBBJ (450 Water Street), the CX – 350 & 450 Water Street Property has views of both the Cambridge and Boston skylines. The CX – 350 & 450 Water Street Property has an adjacent open space with playing field, a plaza to host food trucks and nearby access to two MBTA stops (Green and Orange line). The Community College MBTA orange line is a 5-minute walk away. The CX – 350 & 450 Water Street Property is 100% leased to Aventis Inc. (wholly owned by Sanofi).
The 350 Water Street building is a 12-story building featuring laboratory space, ground floor retail, a third-floor terrace, three below-grade parking levels with 377 parking spaces (0.74 per 1,000 SF), bike storage with showers, an adjacent open space with playing field and fitness center. The 350 Water Street building has 15’ - 19’ ceiling heights and eight passenger elevators. The 350 Water Street building is anticipated to be Wired Score Platinum and LEED Gold certified upon completion.
This is not a research report and was not prepared by any Underwriter’s research department. Please see additional important information and qualifications at the end of this Term Sheet. |
| | T-91 | |
| Mixed Use – Office/Lab | Loan #7 | Cut-off Date Balance: | | $52,959,184 |
| 350 and 450 Water Street | CX - 350 & 450 Water Street | Cut-off Date LTV: | | 41.7% |
| Cambridge, MA 02141 | | UW NCF DSCR: | | 3.50x |
| | | UW NOI Debt Yield: | | 9.9% |
The 450 Water Street building is a 9-story building featuring office space, ground floor retail, a two-story mezzanine, three above-grade and two below-grade parking levels with 440 parking spaces (1.09 per 1,000 SF) and bike storage. The 450 Water Street building has 14’ - 16’ ceiling heights and six passenger elevators. The 450 Water Street building is anticipated to be Wired Score Platinum, WELL Gold and LEED Gold certified upon completion.
The CX – 350 & 450 Water Street Property is currently in the process of finishing construction. The 350 Water Street building is expected to be substantially completed in the second quarter of 2022 and the 450 Water Street building was substantially completed on December 16 2021. At loan origination, the borrowers reserved the following with the lender: (i) $86,650,891 for base building work related to hard costs, hard cost contingency, soft costs and soft cost contingency for the CX – 350 & 450 Water Street Property, (ii) approximately $15,483,880 of tenant improvement allowance related to the 350 Water Street building and $28,254,233 of tenant improvement allowance related to the 450 Water Street building and (iii) approximately $8,323,966 of leasing commissions related to the 450 Water Street building. The below chart details the borrower sponsors’ development budgets, which do not include land allocations or financing costs. We cannot assure you that the 350 Water Street building will be completed as expected or at all.
| Development Budget Summary |
| 350 Water Street (Parcel G) | 450 Water Street (Parcel H) |
| | Budget | Remaining Cost | Budget | Remaining Cost |
| Hard Costs | $221,627,140 | $35,507,711 | $181,926,397 | $28,882,890 |
| HC Contingency | $915,139 | $1,065,231 | $866,487 | $866,487 |
| Soft Costs | $43,854,255 | $8,357,324 | $42,547,726 | $11,379,153 |
| SC Contingency | $210,241 | $250,720 | $410,417 | $341,375 |
| TI Allowance | $139,789,250 | $15,483,880 | $64,916,764 | $28,254,233 |
| Leasing Commissions | $26,886,858 | $0 | $21,254,398 | $8,323,966 |
| Total | $433,282,883 | $60,664,866 | $311,922,189 | $78,048,104 |
| | | | | | |
Sole Tenant.
Aventis Inc. (915,233 SF, 100.0% of NRA, 100.0% of underwritten base rent). Aventis Inc. is a wholly owned subsidiary of Sanofi S.A. (“Sanofi”) (rated A+/A1/AA by Fitch/Moody’s/S&P), which is the guarantor under the Aventis Inc. leases. Founded in 1973, Sanofi is a multinational pharmaceutical company headquartered in Paris, France. Sanofi engages in the research and development, manufacturing, and marketing of pharmaceutical drugs, principally in the prescription market. Sanofi (NASDAQ:SNY) is publicly traded on the NASDAQ stock exchange and had a market cap of approximately $123.1 billion as of October 20, 2021.
The CX – 350 & 450 Water Street Property is expected to serve as Sanofi’s North American Research headquarters, where it is expected to consolidate approximately 3,000 employees from a number of local offices in the Boston area. Additionally, Sanofi is expected to consolidate approximately 400 employees from various sites at the Cambridge Crossing development and in Lyon, France to form a Center of Excellence at the CX – 350 & 450 Water Street Property dedicated to mRNA vaccine research. Sanofi plans to invest more than $476.0 million per year to develop vaccines against infectious diseases.
The CX – 350 & 450 Water Street Property is currently undergoing a tenant buildout. The Aventis Inc. tenant buildout contract and base building changes total approximately $304.3 million ($595 PSF) for the 350 Water Street building and approximately $92.2 million ($228 PSF) for the 450 Water Street building. Aventis Inc. is entitled to receive an approximate $139.8 million ($273 PSF) tenant improvement allowance for the 350 Water Street building and an approximate $73.7 million ($181 PSF) tenant improvement allowance for the 450 Water Street building. In total, the approximate $396.5 million ($433 PSF) tenant buildout contract and base building changes do not include any tenant investment for soft costs. Additionally, the approximate $396.5 million ($433 PSF) can be paid from the tenant improvement allowance to the extent available. In addition to the tenant buildout contract and base building changes, Sanofi is expected to invest approximately $194.8 million ($213 PSF) into the CX – 350 & 450 Water Street Property, not including FF&E.
Aventis Inc. executed two, 15-year leases at the CX – 350 & 450 Water Street Property in late 2018. The rent commencement date of the lease at 350 Water Street was July 1, 2021. The rent commencement date of the lease at 450 Water Street was November 10, 2021. The sole tenant, Aventis Inc., is not yet in occupancy of either the 350 Water Street building or the 450 Water Street building, pending the buildout of its space. We cannot assure you that the buildout of the CX – 350 & 450 Water Street Property will be completed as expected or at all, or that Aventis Inc. will take occupancy as expected or at all. At loan origination, prior to the substantial completion of, and rent commencement at the 450 Water Street building, the borrowers reserved approximately $10,732,231 into a gap rent reserve for the Aventis Inc. lease related to the 450 Water Street building. Aventis Inc. has the right to terminate each of its respective leases effective as of the end of its 14th lease year, subject to a termination fee equal to 12 months base rent.
The blended starting base rent for the Aventis Inc. leases are $71.53 PSF (NNN) for 350 Water Street and 450 Water Street. Base rent for the laboratory building, 350 Water Street, is $75.90 PSF and base rent for the office building, 450 Water Street, is $66.00 PSF, with both leases including approximately 2.5% annual rent steps. Aventis Inc. did not receive any free rent as part of its lease. The in-place rent at the 350 Water Street building is approximately 31.0% below the appraisal’s concluded market rent of $110.00 PSF (NNN) for the laboratory space and the in-place rent at the 450 Water Street building is approximately 22.4% below the appraisal’s concluded market rent of $85.00 PSF (NNN) for the office space. Sanofi’s guarantees of the leases at the 350 Water Street and 450 Water Street buildings have guaranty caps of $207.5 million and $142.5 million, respectively.
This is not a research report and was not prepared by any Underwriter’s research department. Please see additional important information and qualifications at the end of this Term Sheet. |
| | T-92 | |
| Mixed Use – Office/Lab | Loan #7 | Cut-off Date Balance: | | $52,959,184 |
| 350 and 450 Water Street | CX - 350 & 450 Water Street | Cut-off Date LTV: | | 41.7% |
| Cambridge, MA 02141 | | UW NCF DSCR: | | 3.50x |
| | | UW NOI Debt Yield: | | 9.9% |
The following table presents certain information relating to the tenancy at the CX - 350 & 450 Water Street Property:
| Tenant Summary(1) |
| Tenant Name | Credit Rating (Moody’s/Fitch/S&P)(2) | Tenant SF | Approx. % of SF | Annual UW Rent | % of Total Annual UW Rent | Annual UW Rent PSF | Lease Exp. | Renewal Options | Term. Option (Y/N) |
| Aventis Inc. (350 Water Street)(3) | A1 / A+ / AA | 511,157(4) | 55.8% | $38,796,816 | 59.3% | $75.90 | 6/30/2036 | 2 x 10 yr | Y(5) |
Aventis Inc. (450 Water Street)(3) | A1 / A+ / AA | 404,076(4) | 44.2% | $26,669,016 | 40.7% | $66.00 | 11/30/2036 | 2 x 10 yr | Y(5) |
| Total/Wtd. Avg. | | 915,233 | 100.0% | $65,465,832 | 100.0% | $71.53 | | | |
| (1) | Information is based on the underwritten rent roll dated November 1, 2021. |
| (2) | The credit ratings are those of the direct parent company, Sanofi, which is the guarantor under the leases. |
| (3) | Aventis Inc. is currently not in occupancy, pending the substantial completion of the buildout out of its spaces at the CX - 350 & 450 Water Street Property. |
| (4) | Tenant SF includes up to 10,000 SF of terrace space for 350 Water Street and up to 4,000 SF of terrace space for 450 Water Street. |
| (5) | Aventis Inc. has the right to terminate each of the leases, with a termination fee, effective as of the end of its 14th lease year. If Aventis Inc. is to exercise the early termination right, it must deliver to the landlord between 24 and 36 months prior to the early termination date (a) notice that the early termination right has been exercised and (b) the early termination payment. The early termination payment equals the sum of (i) the 12 monthly installments of base rent that would have been due for the 12-month period immediately following the early termination date in the absence of such termination and (ii) the stipulated operating expenses/tax component per the lease. |
The following table presents certain information relating to the lease rollover schedule at the CX - 350 & 450 Water Street Property:
| Lease Rollover Schedule(1) |
| Year | # of Leases Rolling | SF Rolling | UW Rent PSF Rolling | Approx. % of Total SF Rolling | Approx. Cumulative % of SF Rolling | Total UW Rent Rolling | Approx. % of Total Rent Rolling | Approx. Cumulative % of Total Rent Rolling |
| 2022 | 0 | 0 | $0.00 | 0.0% | 0.0% | $0 | 0.0% | 0.0% |
| 2023 | 0 | 0 | $0.00 | 0.0% | 0.0% | $0 | 0.0% | 0.0% |
| 2024 | 0 | 0 | $0.00 | 0.0% | 0.0% | $0 | 0.0% | 0.0% |
| 2025 | 0 | 0 | $0.00 | 0.0% | 0.0% | $0 | 0.0% | 0.0% |
| 2026 | 0 | 0 | $0.00 | 0.0% | 0.0% | $0 | 0.0% | 0.0% |
| 2027 | 0 | 0 | $0.00 | 0.0% | 0.0% | $0 | 0.0% | 0.0% |
| 2028 | 0 | 0 | $0.00 | 0.0% | 0.0% | $0 | 0.0% | 0.0% |
| 2029 | 0 | 0 | $0.00 | 0.0% | 0.0% | $0 | 0.0% | 0.0% |
| 2030 | 0 | 0 | $0.00 | 0.0% | 0.0% | $0 | 0.0% | 0.0% |
| 2031 | 0 | 0 | $0.00 | 0.0% | 0.0% | $0 | 0.0% | 0.0% |
| 2032 & Thereafter | 2 | 915,233 | $71.53 | 100.0% | 100.0% | $65,465,832 | 100.0% | 100.0% |
| Vacant | 0 | 0 | $0.00 | 0.0% | 100.0% | $0 | 0.0% | 100.0% |
| Total/Wtd. Avg. | 2 | 915,233 | $71.53 | 100.0% | | $65,465,832 | 100.0% | |
| (1) | Information is based on the underwritten rent roll dated November 1, 2021. |
COVID-19 Update. As of October 14, 2021, the borrower sponsors had reported no collection issues.
The Market. The CX – 350 & 450 Water Street Property is located in the Cambridge market within the Greater Boston area. The city of Cambridge is located in the Boston core-based statistical area directly north of the city of Boston and separated from Boston’s central business district (“CBD”) by the Charles River. Cambridge is bordered by Somerville to the north and Watertown to the west. The city is acclaimed for its mix of venture capital, National Institutes of Health (NIH) funding and state investments. In recent years, Cambridge has become a life sciences and biotechnology hub not only for the northeast, but for the entire United States. Cambridge is home to over 5,000 private business establishments, with major companies including Watson Health, Amgen, Facebook and Apple, among others.
The Cambridge market is best known for its innovation and high concentration of research and development operations. Cambridge has one of the highest densities of educated people in the world, with 42 colleges, universities and community colleges in the Boston/Cambridge area, including being home to Harvard University and Massachusetts Institute of Technology (MIT). There are over 11,000 undergraduate students and over 11,000 graduate students living in Cambridge.
The CX – 350 & 450 Water Street Property is part of a larger 4.5 million SF master-planned mixed-use-transit-oriented development known as Cambridge Crossing, which is an innovation community in East Cambridge, proximate to Kendall Square. Cambridge Crossing is spread across 43 acres and is expected to total over 16 buildings consisting of over 2.1 million SF of science and technology space, 2.4 million SF of residential space, 100,000 SF of retail space and 11 acres of open space. The development of Cambridge Crossing has approximately 2.5 million SF completed or under construction and recent leases to Philips, Sanofi, and Bristol Myers Squibb.
Cambridge Crossing benefits from its various forms of transit, including one MBTA (Green Line) station soon to be on site, and one MBTA (Orange Line) station a short walk away, four Hubway stations, designated bike lanes, an EZ ride and private Cambridge Crossing shuttle, walking paths and acres of green spaces. In addition, Cambridge Crossing is approximately 3.5 miles from the Boston Logan International Airport.
This is not a research report and was not prepared by any Underwriter’s research department. Please see additional important information and qualifications at the end of this Term Sheet. |
| | T-93 | |
| Mixed Use – Office/Lab | Loan #7 | Cut-off Date Balance: | | $52,959,184 |
| 350 and 450 Water Street | CX - 350 & 450 Water Street | Cut-off Date LTV: | | 41.7% |
| Cambridge, MA 02141 | | UW NCF DSCR: | | 3.50x |
| | | UW NOI Debt Yield: | | 9.9% |
The below table presents the submarket statistics for the laboratory and office space in the Cambridge market.
| Laboratory Submarket Statistics |
| Submarket | Inventory (SF) | Overall Vacancy Rate | Direct Vacancy Rate | YTD Construction Completions (SF) | YTD Overall Absorptions (SF) | Under Construction (SF) | Direct Avg. Rent | Direct Avg. Rent (Class A) |
| Alewife | 1,192,000 | 1.0% | 0.0% | 0 | 100,681 | 3,100,000 | $71.00 | NAP |
| East Cambridge | 7,397,000 | 1.3% | 0.0% | 0 | (56,745) | 2,304,000 | $105.81 | $105.81 |
| Mid Cambridge | 3,934,000 | 1.3% | 0.0% | 0 | (41,966) | 0 | $82.88 | $81.07 |
| Total/Wtd. Avg. | 12,523,000 | 1.0% | 0.0% | 0 | 1,970 | 5,404,000 | $100.40 | $104.14 |
Source: Appraisal
| Office Submarket Statistics |
| Submarket | Inventory (SF) | Overall Vacancy Rate | Direct Vacancy Rate | YTD Construction Completions (SF) | YTD Overall Absorptions (SF) | Under Construction (SF) | Direct Avg. Rent | Direct Avg. Rent (Class A) |
| Alewife | 1,652,770 | 5.6% | 3.6% | 0 | 37,442 | 0 | $59.92 | $60.22 |
| East Cambridge | 8,207,363 | 7.2% | 2.8% | 0 | 196,420 | 1,235,423 | $82.60 | $82.29 |
| Mid Cambridge | 2,175,363 | 6.8% | 3.7% | 0 | (40,073) | 0 | $65.07 | $80.56 |
| Total/Wtd. Avg. | 12,035,496 | 6.9% | 3.0% | 0 | 193,789 | 1,235,423 | $75.07 | $79.92 |
Source: Appraisal
The following table summarizes the comparable laboratory leases in the surrounding market.
| Summary of Comparable Laboratory Leases |
| Property | Location | Year Built | Tenant Name | Lease Start Date | Term (yrs.) | Lease Type | Tenant Size (SF) | Base Rent PSF | Rent Steps /yr | TI PSF |
| 350 Water Street(1) | Cambridge, MA | 2021(2) | Aventis Inc. | Jul-21 | 15.0 | Net | 511,157 | $75.90 | 2.50% | $250.00 |
| Seaport Labs | Boston, MA | 2023 | Eli Lilly LOI | Jan-23 | 15.0 | Net | 165,000 | $103.00 | 3.00% | $210.00 |
| 201 Brookline Avenue | Boston, MA | 2022 | Verve Therapeutics | Jun-22 | 15.0 | Net | 105,000 | $91.00 | 3.00% | $225.00 |
| Cambridge Crossing EF | Cambridge, MA | 2023 | Bristol Myers Squibb | May-22 | 15.0 | Net | 40,000 | $105.00 | 2.75% | $225.00 |
| 238 Main Street | Cambridge, MA | 2021 | Beam Therapeutics | Aug-21 | 12.0 | Net | 122,620 | $96.50 | 3.00% | $190.00 |
| 65 Landsdowne Street | Cambridge, MA | 2001 | Brigham and Women's | Feb-21 | 5.0 | Net | 112,410 | $100.00 | 3.00% | $0.00 |
| Cambridge Crossing EF | Cambridge, MA | 2023 | Bristol Myers Squibb | Aug-20 | 15.0 | Net | 260,000 | $88.50 | 2.50% | $225.00 |
| Cambridge Crossing | Cambridge, MA | 2019 | Cereval | Feb-20 | 10.0 | Net | 59,865 | $92.00 | 3.00% | $200.00 |
| Total/Wtd. Avg.(3) | | | | | 12.4 | | 123,556 | $95.20 | | $186.20 |
Source: Appraisal
| (1) | Information is based on the underwritten rent roll dated November 1, 2021. |
| (2) | The 350 Water Street building is in the process of finishing construction with the base building substantial completion date expected in the second quarter of 2022. We cannot assure you the base building construction will be completed as expected or at all. |
| (3) | The Total/Wtd. Avg. excludes the 350 Water Street building. |
The laboratory lease comparables range in size from 40,000 SF to 260,000 SF, with lease terms ranging from 5 to 15 years. The comparables exhibit a range in rents from $88.50 to $105.00 PSF, with an average of $95.20 PSF on a net basis. Free rent concessions ranged from 0 to 12 months, averaging 1.71 months, with tenant improvement allowances ranging from $0.00 to $225.00 PSF, an average of $182.14 PSF. The appraiser concluded to a market rent of $110.00 PSF at 350 Water Street, which is a 44.9% premium to the in-place rent of $75.90 PSF.
This is not a research report and was not prepared by any Underwriter’s research department. Please see additional important information and qualifications at the end of this Term Sheet. |
| | T-94 | |
| Mixed Use – Office/Lab | Loan #7 | Cut-off Date Balance: | | $52,959,184 |
| 350 and 450 Water Street | CX - 350 & 450 Water Street | Cut-off Date LTV: | | 41.7% |
| Cambridge, MA 02141 | | UW NCF DSCR: | | 3.50x |
| | | UW NOI Debt Yield: | | 9.9% |
The following table summarizes the comparable office leases in the surrounding market.
| Summary of Comparable Office Leases |
| Property | Location | Year Built | Tenant Name | Lease Start Date | Term (yrs.) | Lease Type | Tenant Size (SF) | Base Rent PSF | Rent Steps | TI PSF |
| 450 Water Street(1) | Cambridge, MA | 2021 | Aventis Inc. | Nov-21 | 15.0 | Net | 404,076 | $66.00 | 2.50%/yr | $181.00 |
| Seaport Labs I | Boston, MA | 2023 | Foundation Medicine (Shell) | Sep-23 | 15.0 | Net | 581,538 | $69.50 | 2.50%/yr | $0.00 |
| 1001 Boylston Street | Boston, MA | 2022 | CarGurus | Jun-23 | 15.0 | Net | 225,428 | $64.95 | $1.30/SF | $161.00 |
| Google HQ | Cambridge, MA | 2022 | Google | Apr-22 | 15.0 | Net | 385,423 | $88.50 | $1.00/SF | $84.00 |
| 222 Berkeley Street | Boston, MA | 1991 | GW&K Investments | Feb-21 | 10.0 | Net | 47,304 | $72.00 | 2.00%/yr | $85.00 |
| Alexandria Center | Cambridge, MA | 2017 | Bluebird Bio | Jan-21 | 10.0 | Net | 267,000 | $100.00 | 3.00%/yr | $0.00 |
| Total/Wtd. Avg.(2) | | | | | 13.0 | | 301,339 | $79.16 | | $48.24 |
Source: Appraisal
| (1) | Information is based on the underwritten rent roll dated November 1, 2021. |
| (2) | The Total/Wtd. Avg. excludes the 450 Water Street building. |
The office lease comparables range in size from 47,304 SF to 581,538 SF and have lease terms ranging from 10 to 15 years. The lease comparables exhibit a range in rents from $64.95 to $100.00 PSF, with an average of $79.16 PSF on a net basis. Free rent concessions ranged from 0 to 8 months, averaging two months, with tenant improvement allowances ranging from $0.00 to $161 PSF, an average of $66.00 PSF. The appraiser concluded to a market rent of $85.00 PSF at 450 Water Street, which is a 28.8% premium to the in-place rent of $66.00 PSF.
The following table presents certain information relating to the appraisal’s market rent conclusion for the CX – 350 & 450 Water Street Property:
| Market Rent Summary |
| | Laboratory | Office |
| Market Rent PSF (NNN) | $110.00 | $85.00 |
| Lease Term (Years) | 15 | 15 |
| Rent Increase Projection | 3% per annum | 3% per annum |
This is not a research report and was not prepared by any Underwriter’s research department. Please see additional important information and qualifications at the end of this Term Sheet. |
| | T-95 | |
| Mixed Use – Office/Lab | Loan #7 | Cut-off Date Balance: | | $52,959,184 |
| 350 and 450 Water Street | CX - 350 & 450 Water Street | Cut-off Date LTV: | | 41.7% |
| Cambridge, MA 02141 | | UW NCF DSCR: | | 3.50x |
| | | UW NOI Debt Yield: | | 9.9% |
Underwritten Net Cash Flow. The following table presents certain information relating to the Underwritten Net Cash Flow at the CX - 350 & 450 Water Street Property:
| Cash Flow Analysis(1) |
| | UW | UW PSF |
| Base Rent(2) | $65,465,832 | $71.53 |
| Straight Line Rent(3) | $13,436,165 | $14.68 |
| Tenant Recoveries | $11,768,903 | $12.86 |
| Other Income | $3,673,555 | $4.01 |
| (Vacancy) | ($1,415,167) | ($1.55) |
| Effective Gross Income | $92,929,288 | $101.54 |
| | | |
| Real Estate Taxes | $6,540,712 | $7.15 |
| Insurance | $457,617 | $0.50 |
| Other Operating Expenses | $5,227,428 | $5.71 |
| Total Operating Expenses | $12,225,756 | $13.36 |
| | | |
| Net Operating Income | $80,703,532 | $88.18 |
| Replacement Reserves | $137,285 | $0.15 |
| TI/LC | $0 | $0.00 |
| Net Cash Flow | $80,566,247 | $88.03 |
| | | |
| Occupancy %(4) | 98.5% | |
| NOI DSCR(5) | 3.50x | |
| NCF DSCR(5) | 3.50x | |
| NOI Debt Yield(5) | 9.9% | |
| NCF Debt Yield(5) | 9.9% | |
| | | | |
| (1) | Historical financial information and occupancy is not available because the CX - 350 & 450 Water Street Property is currently being built. The 350 Water Street building is expected to be substantially completed in the second quarter of 2022. The 450 Water Street building was substantially completed December 16, 2021. |
| (2) | Based on the in-place rent roll dated November 1, 2021 for contractual leases. The rent commencement date for the 350 Water Street property was in July 2021. The rent commencement date of the lease at 450 Water Street was November 10, 2021. At loan origination, the borrowers reserved approximately $10,732,231 into a gap rent reserve for the Aventis Inc. lease related to the 450 Water Street property. |
| (3) | Straight-line average rent credit for Aventis Inc. (Sanofi, investment grade rated parent company) through its lease term, including parking income rent adjusted for increases of 2.0% adjusted for CPI. The straight-line rent averages result in an average NNN base rent of $90.99 PSF for the 350 Water Street lease and $78.98 PSF for the 450 Water Street lease over the life of the lease. |
| (4) | Represents economic occupancy. |
| (5) | Based on the CX - 350 & 450 Water Street Senior Loan. |
Escrows and Reserves.
Real Estate Taxes – During a Trigger Period (as defined below), the borrowers are required to deposit into a real estate tax reserve, on a monthly basis, 1/12 of the estimated annual real estate taxes.
Insurance – During a Trigger Period, the borrowers are required to deposit into an insurance reserve, on a monthly basis, 1/12 of estimated insurance premiums, unless an acceptable blanket policy is in effect.
TI/LC Reserve – At loan origination, the borrowers deposited approximately $52,062,079 into an existing TI/LC reserve. During a Lease Sweep Period (as defined below), all available cash will be swept into the deposit account held by the lender, which will be transferred to the rollover reserve.
Base Building Work Reserve – At loan origination, the borrowers deposited $86,650,891 into a reserve for the completion of construction of the CX – 350 & 450 Water Street Property.
Aventis Rent Reserve – At loan origination, the borrowers deposited $10,732,231 into a gap rent reserve for the Aventis Inc. lease related to the 450 Water Street building.
This is not a research report and was not prepared by any Underwriter’s research department. Please see additional important information and qualifications at the end of this Term Sheet. |
| | T-96 | |
| Mixed Use – Office/Lab | Loan #7 | Cut-off Date Balance: | | $52,959,184 |
| 350 and 450 Water Street | CX - 350 & 450 Water Street | Cut-off Date LTV: | | 41.7% |
| Cambridge, MA 02141 | | UW NCF DSCR: | | 3.50x |
| | | UW NOI Debt Yield: | | 9.9% |
A “Trigger Period” will occur:
| (i) | commencing upon the ARD (with no cure or end date); |
| (ii) | commencing upon the occurrence of an event of default under the CX - 350 & 450 Water Street Whole Loan until cured; |
| (iii) | on any date from and after December 31, 2022, commencing when the debt service coverage ratio is less than 1.75x based on the CX - 350 & 450 Water Street Whole Loan as of two consecutive calendar quarters, and ending upon the earlier to occur of (a) the debt service coverage ratio based on the CX - 350 & 450 Water Street Whole Loan is equal to or greater than 1.75x for two consecutive calendar quarters or (b) the funds on deposit in the cash collateral account are equal to the sum of (x) $25,557,850, to the extent the 350 Water Street property has not been released and (y) $20,203,800, to the extent the 450 Water Street property has not been released; or |
| (iv) | during a Lease Sweep Period. |
A “Lease Sweep Period” will commence (prior to the ARD) upon:
| (i) | the earliest to occur of: |
(a) the date that is 12 months prior to the earliest stated expiration of the Lease Sweep Lease (as defined below);
(b) the last date under such Lease Sweep Lease that the tenant has the right to give notice of its exercise of a renewal option; or
(c) with respect to any Lease Sweep Lease that is a Short Term Qualifying Lease (as defined below), the date that is 12 months prior to the ARD or the date that the lender reasonably determines that a Lease Sweep Period should commence in order for the aggregate amount of projected deposits into the rollover account for the period commencing on such date through the ARD is equal to the Lease Sweep Deposit Amount (as defined below);
| (ii) | the date of the early termination, early cancellation or early surrender of a Lease Sweep Lease (or any material portion thereof) prior to its then current expiration date or the receipt by the applicable borrower or manager of written notice from the tenant under a Lease Sweep Lease of its intent to effect an early termination, early cancellation or early surrender of such Lease Sweep Lease prior to its then current expiration date; |
| (iii) | solely with respect to any Lease Sweep Lease under which neither the tenant thereunder, nor any guarantor of all of the tenant’s obligations thereunder, is an investment grade entity, if such tenant has ceased operating its business (i.e., “goes dark”) in a majority of its leased space at the applicable property and the same has not been subleased in accordance with the terms of the loan documents, pursuant to a sublease on the same or substantially similar or better terms as the applicable Lease Sweep Lease; |
| (iv) | a monetary or material non-monetary default under a Lease Sweep Lease by the tenant; or |
| (v) | the occurrence of an insolvency proceeding. |
A Lease Sweep Period will end upon:
| (A) | if triggered in the case of clause (i) above, the entirety of the Lease Sweep Lease space is leased pursuant to one or more qualified leases and in the lender’s reasonable judgment, sufficient funds have been accumulated in the rollover account; |
| (B) | if triggered in the case of clause (i) above, the date on which the tenant under the Lease Sweep Lease irrevocably exercises its renewal or extension option or otherwise extends its Lease Sweep Lease in accordance with the terms of the loan documents with respect to all of its Lease Sweep Space, and, in the lender’s reasonable judgment, sufficient funds have been accumulated in the rollover account; |
| (C) | if triggered in the case of clause (ii) above, if the tenant under the applicable Lease Sweep Lease rescinds in writing the exercise of its notice exercising its early termination, cancellation or surrender right or option; |
| (D) | if triggered in the case of clause (iii) above, the circumstances giving rise to a Lease Sweep Period under clause (iii) no longer exist; |
| (E) | if triggered in the case of clause (iv) above, the date on which the subject default has been cured; |
| (F) | if triggered in the case of clause (v) above, either (1) the applicable insolvency proceeding has terminated or (2) the applicable Lease Sweep Lease has been assumed or assumed and assigned to a third party in a manner reasonably satisfactory to the lender; |
| (G) | if triggered in the case of clauses (i), (ii), (iii), (iv) and/or (v) above, the CX - 350 & 450 Water Street Property has achieved a debt yield of not less than 6.0% and, in the lender’s reasonable judgment, sufficient funds have been accumulated in the rollover account; or |
| (H) | if triggered in in the case of clauses (i), (ii), (iii), (iv) and/or (v) above, the date on which funds in the rollover account collected with respect to the Lease Sweep Space in question is equal to the Lease Sweep Deposit Amount applicable to such Lease Sweep space. |
A “Lease Sweep Lease” means (i) the Aventis Inc. lease at 350 Water Street property, (ii) the Aventis Inc. lease at the 450 Water Street property or (iii) any replacement lease that, either individually or when taken together with any other lease with the same tenant or its affiliates covers the majority of the Lease Sweep Lease space.
A “Lease Sweep Tenant” means any tenant under a Lease Sweep Lease.
A “Lease Sweep Deposit Amount” means an amount equal to the total rentable SF of the applicable Lease Sweep Lease space that is the subject of a Lease Sweep Period multiplied by $50.00.
A “Short Term Qualifying Lease” means any qualified lease that has an initial term which does not extend at least two years beyond the ARD.
Lockbox and Cash Management. The CX - 350 & 450 Water Street Whole Loan is structured with a hard lockbox and springing cash management. The borrowers are required to deliver tenant direction letters instructing all tenants to deposit rents into a lender-controlled lockbox account. The borrowers are required to cause all rents to be deposited directly into the lender-controlled lockbox account. All funds received by the borrowers or the manager are required to be deposited in the lockbox account within two business days following receipt. During the continuance of a Trigger Period, funds on deposit in the lockbox account are required to be swept on a daily basis into a lender-controlled cash management account. Prior to the ARD, all excess cash is required to be transferred to a lender-controlled account as additional collateral for the CX - 350 & 450 Water Street Whole Loan, subject to certain permitted uses by the borrowers described in the loan documents, and except as described below with respect to a Lease Sweep Period. If the CX - 350 & 450 Water Street Whole Loan is not paid by the ARD, from and after the ARD, the CX - 350 & 450 Water Street Whole Loan will accrue interest at the Adjusted Interest Rate; however, interest accrued at the excess of the Adjusted Interest Rate over the initial interest rate will be deferred.
This is not a research report and was not prepared by any Underwriter’s research department. Please see additional important information and qualifications at the end of this Term Sheet. |
| | T-97 | |
| Mixed Use – Office/Lab | Loan #7 | Cut-off Date Balance: | | $52,959,184 |
| 350 and 450 Water Street | CX - 350 & 450 Water Street | Cut-off Date LTV: | | 41.7% |
| Cambridge, MA 02141 | | UW NCF DSCR: | | 3.50x |
| | | UW NOI Debt Yield: | | 9.9% |
After the ARD, all amounts on deposit in the cash management account after payment of debt service, required reserves and budgeted operating expenses will be required to be applied to the prepayment of the outstanding principal balance of the CX – 350 & 450 Water Street Whole Loan, first to the CX - 350 & 450 Water Street Senior Loan and then to the CX - 350 & 450 Water Street Subordinate Companion Loan, until the outstanding principal balance has been reduced to zero, then to any excess interest until the excess interest has been reduced to zero and then to any other indebtedness due under the CX – 350 & 450 Water Street Whole Loan until the other indebtedness has been reduced to zero.
Additional Secured Indebtedness (not including trade debts). The CX - 350 & 450 Water Street Property also secures the remaining CX - 350 & 450 Water Street Senior Notes (the “CX - 350 & 450 Water Street Non-Serviced Pari Passu Companion Loans”), which have an aggregate Cut-off Date principal balance of $761,040,816, and the CX - 350 & 450 Water Street Subordinate Companion Loan, which has a Cut-off Date Principal Balance of $411,000,000. The CX - 350 & 450 Water Street Non-Serviced Pari Passu Companion Loans and the CX - 350 & 450 Water Street Subordinate Companion Loan accrue interest at the same rate as the CX - 350 & 450 Water Street Mortgage Loan. The CX - 350 & 450 Water Street Mortgage Loan and the CX - 350 & 450 Water Street Non-Serviced Pari Passu Companion Loans are pari passu in right of payment, and are generally senior in right of payment to the CX - 350 & 450 Water Street Subordinate Companion Loan. The holders of the CX - 350 & 450 Water Street Mortgage Loan, CX - 350 & 450 Water Street Non-Serviced Pari Passu Companion Loans and CX 350 & 450 Water Street Subordinate Companion Loan have entered into a co-lender agreement, which sets forth the allocation of collections on the CX - 350 & 450 Water Street Whole Loan. See “Description of the Mortgage Pool—The Whole Loans—The CX - 350 & 450 Water Street Pari Passu-A/B Whole Loan” in the prospectus.
Mezzanine Loan and Preferred Equity.None.
Release of Property. The CX - 350 & 450 Water Street Whole Loan documents allow, on any business day on or after (A) December 6, 2023 (with respect to a partial release through partial prepayment) or (B) after the expiration of the related defeasance lockout period (with respect to a partial release through partial defeasance), as applicable, any borrower to obtain the release of its respective property in connection with a bona fide third-party sale, provided the borrowers must partially prepay (with the prepayment fee) or partially defease the CX – 350 & 450 Water Street Whole Loan in an amount equal to, (i) with respect to the release of the 350 Water Street property, 110% of the allocated loan amount and (ii) with respect to the release of the 450 Water Street property, 105% of the allocated loan amount, and so long as after giving effect to such release, (a) the debt service coverage ratio is equal to or greater than the greater of the debt service coverage ratio on the CX – 350 & 450 Water Street Whole Loan preceding such release and 1.90x and (b) certain REMIC related conditions are satisfied. The allocated loan amount for the 350 Water Street property is $720,300,000 and the allocated loan amount for the 450 Water Street property is $504,700,000.
Right of First Offer/Right of First Refusal. None.
Ground Lease. None.
Letter of Credit. None.
Terrorism Insurance. The borrowers are required to obtain and maintain property insurance that covers perils and acts of terrorism and is required to obtain and maintain business interruption insurance for 24 months plus a 12-month extended period of indemnity (provided that if TRIPRA or a similar statute is not in effect, the borrower will not be obligated to pay terrorism insurance premiums in excess of two times the annual premium for the property and business interruption/rental loss insurance coverage). See “Risk Factors—Risks Relating to the Mortgage Loans—Terrorism Insurance May Not Be Available for All Mortgaged Properties” in the prospectus.
This is not a research report and was not prepared by any Underwriter’s research department. Please see additional important information and qualifications at the end of this Term Sheet. |
| | T-98 | |
(THIS PAGE INTENTIONALLY LEFT BLANK) This
This is not a research report and was not prepared by any Underwriter’s research department. Please see additional important information and qualifications at the end of this Term Sheet. |
| | T-99 | |
| Retail – Anchored | Loan #8 | Cut-off Date Balance: | | $46,500,000 |
| 201-299 Madonna Road | Madonna Plaza | Cut-off Date LTV: | | 70.9% |
| San Luis Obispo, CA 93405 | | UW NCF DSCR: | | 1.55x |
| | | UW NOI Debt Yield: | | 10.1% |

This is not a research report and was not prepared by any Underwriter’s research department. Please see additional important information and qualifications at the end of this Term Sheet. |
| | T-100 | |
| Retail – Anchored | Loan #8 | Cut-off Date Balance: | | $46,500,000 |
| 201-299 Madonna Road | Madonna Plaza | Cut-off Date LTV: | | 70.9% |
| San Luis Obispo, CA 93405 | | UW NCF DSCR: | | 1.55x |
| | | UW NOI Debt Yield: | | 10.1% |

This is not a research report and was not prepared by any Underwriter’s research department. Please see additional important information and qualifications at the end of this Term Sheet. |
| | T-101 | |
| Retail – Anchored | Loan #8 | Cut-off Date Balance: | | $46,500,000 |
| 201-299 Madonna Road | Madonna Plaza | Cut-off Date LTV: | | 70.9% |
| San Luis Obispo, CA 93405 | | UW NCF DSCR: | | 1.55x |
| | | UW NOI Debt Yield: | | 10.1% |
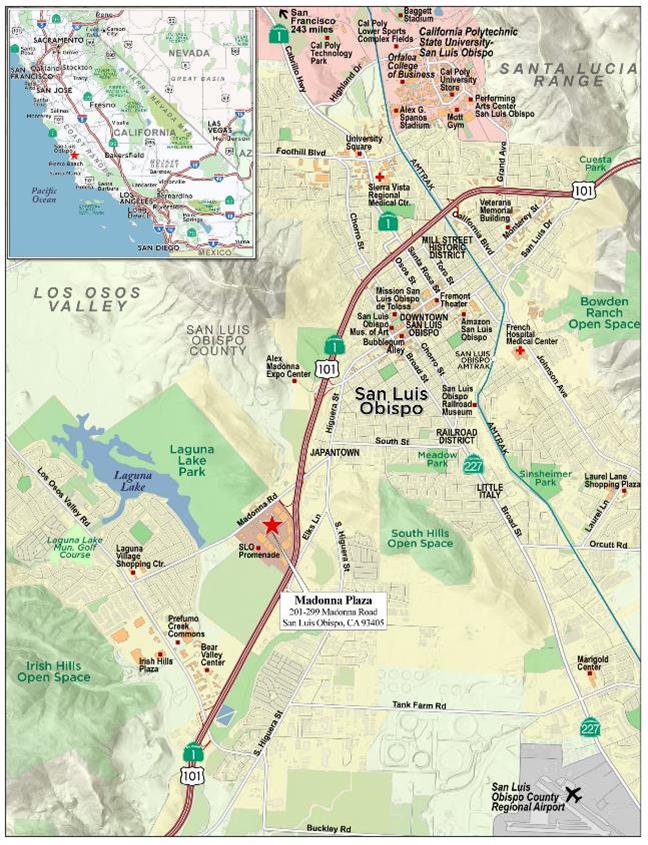
This is not a research report and was not prepared by any Underwriter’s research department. Please see additional important information and qualifications at the end of this Term Sheet. |
| | T-102 | |
| Mortgage Loan No. 8 – Madonna Plaza |
| Mortgage Loan Information | | Property Information |
| Mortgage Loan Seller: | MSMCH | | Single Asset/Portfolio: | Single Asset |
| Credit Assessment (DBRSM/Fitch/Moody’s): | NR/NR/NR | | Location: | San Luis Obispo, CA 93405 |
| Original Balance: | $46,500,000 | | General Property Type: | Retail |
| Cut-off Date Balance: | $46,500,000 | | Detailed Property Type: | Anchored |
| % of Initial Pool Balance: | 3.9% | | Title Vesting(2): | Leasehold |
| Loan Purpose: | Refinance | | Year Built/Renovated: | 1968-2019/1999-2011 |
| Borrower Sponsor: | Schottenstein Realty LLC | | Size: | 287,129 SF |
| Guarantor: | Schottenstein Realty LLC | | Cut-off Date Balance Per SF: | $162 |
| Mortgage Rate: | 4.3600% | | Maturity Date Balance Per SF: | $138 |
| Note Date: | 11/5/2021 | | Property Manager: | Schottenstein Property Group, LLC |
| First Payment Date: | 1/1/2022 | | | (borrower related) |
| Maturity Date: | 12/1/2031 | | | |
| Original Term to Maturity: | 120 months | | | |
| Original Amortization Term: | 360 months | | | |
| IO Period: | 24 months | | | |
| Seasoning: | 2 months | | Underwriting and Financial Information(3) |
| Prepayment Provisions: | L(24),YM1(91),O(5) | | UW NOI(4): | $4,673,708 |
| Lockbox/Cash Mgmt Status: | Hard/Springing | | UW NOI Debt Yield: | 10.1% |
| Additional Debt Type: | No | | UW NOI Debt Yield at Maturity: | 11.8% |
| Additional Debt Balance: | NAP | | UW NCF DSCR: | 1.55x |
| Future Debt Permitted (Type): | No (NAP) | | Most Recent NOI(4): | $4,212,538 (6/30/2021 TTM) |
| Reserves(1) | | 2nd Most Recent NOI: | $4,196,241 (12/31/2020) |
| Type | Initial | Monthly | Cap | | 3rd Most Recent NOI: | $4,104,715 (12/31/2019) |
| RE Taxes: | $0 | Springing | NAP | | Most Recent Occupancy: | 95.9% (10/19/2021) |
| Insurance: | $0 | Springing | NAP | | 2nd Most Recent Occupancy: | 95.9% (12/31/2020) |
| Replacement Reserve: | $0 | $3,589 | $43,069 | | 3rd Most Recent Occupancy: | 95.9% (12/31/2019) |
| TI/LC Reserve: | $3,304,798 | Springing | $557,030 | | Appraised Value (as of): | $65,600,000 (9/27/2021) |
| Rent Reserve: | $417,447 | Springing | NAP | | Appraised Value Per SF: | $228 |
| DSW Holdback Reserve: | $1,000,000 | $0 | NAP | | Cut-off Date LTV Ratio: | 70.9% |
| Ground Rent Reserve: | $0 | Springing | NAP | | Maturity Date LTV Ratio: | 60.4% |
| | | | | | | |
| Sources and Uses |
| Sources | Proceeds | % of Total | | Uses | Proceeds | % of Total |
| Mortgage Loan Amount: | $46,500,000 | 100.0% | | Loan Payoff: | $34,006,139 | 73.1% |
| | | | | Return of Equity: | $6,321,602 | 13.6% |
| | | | | Reserves: | $4,722,245 | 10.2% |
| | | | | Closing Costs: | $1,450,014 | 3.1% |
| Total Sources: | $46,500,000 | 100.0% | | Total Uses: | $46,500,000 | 100.0% |
| (1) | See “Escrows and Reserves” section below for further discussion of reserve requirements. |
| (2) | See “Ground Lease” section below. |
| (3) | The novel coronavirus pandemic is an evolving situation and could impact the Madonna Plaza Mortgage Loan more severely than assumed in the underwriting of the Madonna Plaza Mortgage Loan and could adversely affect the NOI, NCF and occupancy information, as well as the appraised value and the DSCR, LTV and Debt Yield metrics presented above and herein. See "Risk Factors-—Risks Related to Market Conditions and Other External Factors—The Coronavirus Pandemic Has Adversely Affected the Global Economy and Will Likely Adversely Affect the Performance of the Mortgage Loans" in the prospectus. |
| (4) | Increases in NOI from 6/30/2021 TTM to UW are primarily due to new leases to tenants Five Below, Dave’s Hot Chicken, The Good Feet Store, and Party City, as well as contractual rent steps through December 2022 for Ralphs, DSW, Med Stop Medical Clinic, Chipotle, the Good Feet Store, Sally Beauty, and Starbucks totaling $77,135. |
The Mortgage Loan. The eighth largest mortgage loan (the “Madonna Plaza Mortgage Loan”) is evidenced by a promissory note in the original principal amount of $46,500,000 and secured by a first priority leasehold mortgage encumbering a 287,129 SF anchored retail shopping center located in San Luis Obispo, California (the “Madonna Plaza Property”).
The Borrower and the Borrower Sponsor. The borrower for the Madonna Plaza Mortgage Loan is Madonna Plaza SRT LP, a single-purpose California limited partnership with one independent director in its organizational structure. The general partner of the borrower is Madonna SRT LLC, a single purpose Delaware limited liability company. The non-recourse carveout guarantor and borrower sponsor is Schottenstein Realty LLC, a fully-integrated, self-managed owner, operator, and redeveloper of power/big box, community and neighborhood shopping centers in major population centers throughout the United States. As of June 30, 2021, Schottenstein Realty LLC owns interests in 84 operating properties in 23 states with approximately 11.4 million SF of gross leasable area. Jay Schottenstein is the Chairman and Chief Executive Officer of Schottenstein Realty LLC, has led the Schottenstein Companies since 1993, and has more than 30 years’ experience in the retail and real estate industries. Jay Schottenstein is also the Chief Executive Officer of American Eagle Outfitters.
This is not a research report and was not prepared by any Underwriter’s research department. Please see additional important information and qualifications at the end of this Term Sheet. |
| | T-103 | |
| Retail – Anchored | Loan #8 | Cut-off Date Balance: | | $46,500,000 |
| 201-299 Madonna Road | Madonna Plaza | Cut-off Date LTV: | | 70.9% |
| San Luis Obispo, CA 93405 | | UW NCF DSCR: | | 1.55x |
| | | UW NOI Debt Yield: | | 10.1% |
The Property. The Madonna Plaza Property is comprised of a ground leasehold interest under a ground lease expiring December 31, 2086, in a 287,129 SF retail shopping center on an approximately 27.8 acre site in San Luis Obispo, California. See “Ground Lease” below. The Madonna Plaza Property is comprised of eight buildings with 1,420 parking spaces (5.0 spaces per 1,000 SF). Built in phases between 1968 and 2019, and renovated between 1999 and 2011, the Madonna Plaza Property is anchored by Kohl’s (21.8% of NRA) and Ralphs (18.1% of NRA). As of October 19, 2021, the Madonna Plaza Property was 95.9% leased to 25 tenants.
Major Tenants.
Kohl’s (62,481 SF, 21.8% of NRA, 27.1% of underwritten rent). Kohl’s is a retail chain of family-oriented department stores. Kohl’s stores feature apparel, footwear, accessories, and soft home products. Kohl’s operates more than 1,100 stores in 49 states, while also offering online shopping. Kohl’s has anchored the Madonna Plaza Property since 2009, has a lease expiration date of January 31, 2026 and has two 5-year renewal options, followed by one 3.5-year renewal option remaining.
Ralphs (51,933 SF, 18.1% of NRA, 10.2% of underwritten rent). Ralphs is a chain of grocery supermarket stores, and is one of the largest subsidiaries of The Kroger Co. (NYSE: KR), the nation’s largest supermarket company that operates combination food and drug stores, multi-department stores, marketplace stores, and price impact warehouses. Through 17 subsidiaries, The Kroger Co. operates over 2,700 retail food stores in 35 states and the District of Columbia, as well as an online retail store. Ralphs has anchored the Madonna Plaza Property since 1999, has a lease expiration date of September 30, 2026, and has six 5-year renewal options remaining.
Best Buy (30,000 SF, 10.4% of NRA, 8.6% of underwritten rent). Best Buy, founded in 1966, is a provider of technology products, services and solutions in the United States and Canada, offering products and services to customers visiting stores, engaging with Geek Squad agents, or using its websites or mobile applications. Best Buy has more than 1,000 stores in the United States and Canada and approximately 100,000 employees. Best Buy has been a tenant at the Madonna Plaza Property since 2002 and exercised a five-year renewal option in 2018, has a lease expiration of March 31, 2023, and has two, 5-year renewal options remaining.
Ross Dress for Less (22,000 SF, 7.7% of NRA, 7.1% of underwritten rent). Ross Dress for Less is a chain of off-price department stores that offers a selection of women’s and men’s apparel, accessories, footwear and furniture. Ross Dress for Less has more than 100,000 employees and 1,585 stores in 40 states, District of Columbia and Guam. Ross Dress for Less has been a tenant at the Madonna Plaza Property since 2018, has a lease expiration of January 31, 2030 and has four, 5-year renewal options remaining.
Michaels (21,370 SF, 7.4% of NRA, 6.9% of underwritten rent). Michaels is North America’s largest retail specialty provider of arts, crafts, framing, floral, wall décor, and seasonal merchandise. Michaels operates in 1,200 stores in 49 states, with over 10,000 employees. Michaels has been a tenant at the Madonna Plaza Property since 2019, has a lease expiration of July 31, 2034, and has four 5-year renewal options remaining.
The following table presents a summary regarding the major tenants at the Madonna Plaza Property:
| Tenant Summary(1) |
| Tenant Name | Credit Rating (Fitch/Moody’s/ S&P)(2) | Tenant SF | Approx.% of SF | Annual UW Rent | Annual UW Rent PSF | App. % of Total Annual UW Rent | Term. Option | Renewal Options | Lease Expiration |
| Kohl's | BBB-/Baa2/BBB- | 62,481 | 21.8% | $1,513,642 | $24.23 | 27.1% | N | 2 x 5 yr & 1 x 3.5 yr | 1/31/2026 |
| Ralphs | NR/Baa1/BBB | 51,933 | 18.1% | $571,263 | $11.00 | 10.2% | N | 6 x 5 yr | 9/30/2026 |
| Best Buy | NR/A3/BBB+ | 30,000 | 10.4% | $480,000 | $16.00 | 8.6% | N | 2 x 5 yr | 3/31/2023 |
| Ross Dress For Less | NR/A2/BBB+ | 22,000 | 7.7% | $396,000 | $18.00 | 7.1% | N | 4 x 5 yr | 1/31/2030 |
| Michaels | NR/NR/NR | 21,370 | 7.4% | $384,660 | $18.00 | 6.9% | N | 4 x 5 yr | 7/31/2034 |
| Subtotal/Wtd. Avg. | | 187,784 | 65.4% | $3,345,565 | $17.82 | 59.8% | | | |
| | | | | | | | | | |
| Other Tenants | | 87,480 | 30.5% | $2,247,502 | $25.69 | 40.2% | | | |
| Vacant Space | | 11,865 | 4.1% | $0 | $0.00 | 0.0% | | | |
| Total/Wtd. Avg. | | 287,129 | 100.0% | $5,593,067 | $20.32(3) | 100.0% | | | |
| (1) | Information is based on the underwritten rent roll as of October 19, 2021. |
| (2) | Certain ratings are those of the parent company whether or not the parent company guarantees the lease. |
| (3) | Total/Wtd. Avg. Annual UW Rent PSF excludes vacant space. |
This is not a research report and was not prepared by any Underwriter’s research department. Please see additional important information and qualifications at the end of this Term Sheet. |
| | T-104 | |
| Retail – Anchored | Loan #8 | Cut-off Date Balance: | | $46,500,000 |
| 201-299 Madonna Road | Madonna Plaza | Cut-off Date LTV: | | 70.9% |
| San Luis Obispo, CA 93405 | | UW NCF DSCR: | | 1.55x |
| | | UW NOI Debt Yield: | | 10.1% |
The following table presents certain information relating to the lease rollover at the Madonna Plaza Property:
| Lease Rollover Schedule(1)(2) |
| Year | # of Leases Rolling | SF Rolling | Annual UW Rent PSF Rolling(3) | Approx. % of Total SF Rolling | Approx. Cumulative % of SF Rolling | Total UW Rent Rolling | Approx. % of Total Rent Rolling | Approx. Cumulative % of Total Rent Rolling |
| MTM | 1 | 1,455 | $44.64 | 0.5% | 0.5% | $64,949 | 1.2% | 1.2% |
| 2022 | 0 | 0 | $0.00 | 0.0% | 0.5% | $0 | 0.0% | 1.2% |
| 2023 | 6 | 41,606 | $19.24 | 14.5% | 15.0% | $800,483 | 14.3% | 15.5% |
| 2024 | 2 | 4,421 | $36.01 | 1.5% | 16.5% | $159,184 | 2.8% | 18.3% |
| 2025 | 2 | 5,190 | $26.80 | 1.8% | 18.3% | $139,089 | 2.5% | 20.8% |
| 2026 | 5 | 131,599 | $20.24 | 45.8% | 64.2% | $2,663,557 | 47.6% | 68.4% |
| 2027 | 1 | 1,200 | $36.00 | 0.4% | 64.6% | $43,200 | 0.8% | 69.2% |
| 2028 | 1 | 17,660 | $15.50 | 6.2% | 70.7% | $273,730 | 4.9% | 74.1% |
| 2029 | 1 | 2,496 | $27.60 | 0.9% | 71.6% | $68,890 | 1.2% | 75.3% |
| 2030 | 1 | 22,000 | $18.00 | 7.7% | 79.3% | $396,000 | 7.1% | 82.4% |
| 2031 | 1 | 3,925 | $40.00 | 1.4% | 80.6% | $157,000 | 2.8% | 85.2% |
| 2032 & Beyond | 4 | 43,712 | $18.92 | 15.2% | 95.9% | $826,986 | 14.8% | 100.0% |
| Vacant | 0 | 11,865 | $0.00 | 4.1% | 100.0% | $0 | 0.0% | 100.0% |
| Total/Wtd. Avg. | 25 | 287,129 | $20.32(3) | 100.0% | | $5,593,067 | 100.0% | |
| (1) | Information is based on the underwritten rent roll as of October 19, 2021. |
| (2) | Certain tenants may have lease termination options that are exercisable prior to the stated expiration date of the subject lease or leases which are not considered in the lease rollover schedule. |
| (3) | Total/Wtd. Avg. Annual UW Rent PSF Rolling excludes vacant space. |
COVID-19 Update. As of December 3, 2021, the borrower sponsor has reported that the Madonna Plaza Property is open and operating and monthly rent collections at the Madonna Plaza Property were 100% for the months of November and December 2021. One tenant has outstanding rent relief of $300 per month which ends May 1, 2022.
The Market. The Madonna Plaza Property is located in San Luis Obispo, California, in the Northwest San Luis Obispo (“SLO”) submarket within the San Luis Obispo/Paso Robles market. The Madonna Plaza Property is located adjacent to Interstate 101, which has an interchange at Madonna Road, one block east of the Madonna Plaza Property. Interstate 101 runs north/south and merges into the Pacific Coast Highway (California SR 1) along the coast of Southern California. Downtown San Luis Obispo is located 1.6 miles northeast of the Madonna Plaza Property and can be accessed through I-101 or Madonna Road. San Luis Obispo is home to California Polytechnic State University, which has an undergraduate enrollment of approximately 26,000 students. The Madonna Plaza Property is half a mile from the San Luis Ranch Community Development, a project that is planned to include 580 new homes, a 200-room hotel, a 65,000 SF office campus and 120,000 SF of retail. According to the appraisal, as of the third quarter of 2021, the Northwest SLO submarket had approximately 1.5 million SF of retail space inventory, overall vacancy in the submarket was approximately 6.4% and asking rent was $25.14 PSF. According to the appraisal, the 2020 estimated population within a one-, three- and five-mile radius of the Madonna Plaza Property was 7,889, 51,248, and 64,387 respectively. The 2020 estimated average household income within a one-, three-, and five-mile radius of the Madonna Plaza Property was $89,656, $85,265, and $89,557, respectively.
The following table presents recent leasing data for anchor tenants at comparable retail properties with respect to the Madonna Plaza Property:
| Comparable Anchor Retail Lease Summary |
| Property/Location | Tenant Name | Size (SF) | Lease Size (SF) | Lease Date | Rent PSF | Lease Term (Mos.) |
Madonna Plaza Property(1) San Luis Obispo, CA | Kohl’s | 287,129 | 62,481 | Feb. 2009 | $24.23 | 204 |
SLO Promenade San Luis Obispo, CA | Listing | 316,413 | 24,063 | Oct. 2021 | $22.20 | 120 |
Five Cities Center Arroyo Grande, CA | Fitness 19 | 308,809 | 7,225 | July 2021 | $23.40 | 36 |
Renaissance Center Victorville, CA | LA Fitness | 112,143 | 22,000 | June 2021 | $15.00 | 120 |
Sunnymead Plaza Moreno Valley, CA | WSS | 53,040 | 29,126 | Aug. 2020 | $14.40 | NAP |
Retail Center Palm Springs, CA | Grocery Outlet | 18,000 | 18,000 | Aug. 2019 | $16.68 | 120 |
Mervyns Tustin, CA | Kohl’s | 74,439 | 74,439 | Jan. 2019 | $12.00 | 120 |
Source: Appraisal, unless otherwise noted.
| (1) | Information is based on the underwritten rent roll as of October 19, 2021. |
This is not a research report and was not prepared by any Underwriter’s research department. Please see additional important information and qualifications at the end of this Term Sheet. |
| | T-105 | |
| Retail – Anchored | Loan #8 | Cut-off Date Balance: | | $46,500,000 |
| 201-299 Madonna Road | Madonna Plaza | Cut-off Date LTV: | | 70.9% |
| San Luis Obispo, CA 93405 | | UW NCF DSCR: | | 1.55x |
| | | UW NOI Debt Yield: | | 10.1% |
The following table presents recent leasing data for in line retail tenants at comparable retail properties with respect to the Madonna Plaza Property:
| Comparable In Line Retail Lease Summary |
| Property/Location | Tenant Name | Size (SF) | Lease Size (SF) | Lease Date | Rent PSF | Lease Term (Mos.) |
Madonna Plaza Property(1) San Luis Obispo, CA | Dave’s Hot Chicken | 287,129 | 3,925 | Oct. 2021 | $40.00 | 120 |
SLO Promenade San Luis Obispo, CA | Listing | 316,413 | 2,800 | Oct. 2021 | $30.00 | 60 |
The Network Building San Luis Obispo, CA | Lavender Blu Boutique | 14,000 | 1,306 | May 2021 | $36.00 | 24 |
The Creamery San Luis Obispo, CA | Hella Hot Chicken | 26,000 | 712 | March 2021 | $42.00 | 60 |
The Gateway Center Paso Robles, CA | Paleteria y Neveria Colima | 3,576 | 1,157 | July 2020 | $30.00 | 36 |
Foothill Plaza San Luis Obispo, CA | Restaurant Tenant | 58,948 | 1,632 | June 2020 | $40.80 | 84 |
Source: Appraisal, unless otherwise noted.
| (1) | Information is based on the underwritten rent roll as of October 19, 2021. |
The following table presents information relating to sales of comparable properties to the Madonna Plaza Property identified by the appraisal:
| Comparable Sales |
| Property/Location | Rentable Area (SF) | Year Built/ Renovated | Occupancy | Sale Date | Sale Price | Sale Price (PSF) |
Madonna Plaza Property 201-299 Madonna Road San Luis Obispo, CA | 287,129(1) | 1968-2019 / 1999-2011 | 95.9%(1) | March-2011 | $58,500,000 | $203.74 |
Ontario Gateway Center 4400-4510 Ontario Mills Parkway Ontario, CA | 225,749 | 1999 / 2001 | 100.0% | Sep-2021 | $40,500,000 | $179.40 |
Camarillo Village Square 2306-2640 Las Posas Road Camarillo, CA | 247,080 | 1971 / 2002 | 94.0% | May-2021 | $61,500,000 | $248.91 |
South Bay Village 19300-19350 Hawthorne Boulevard Torrance, CA | 104,906 | 1971 / 2012 | 100.0% | Dec-2020 | $39,750,000 | $378.91 |
Arlington Plaza 6008-6390 Van Buren Boulevard Riverside, CA | 135,866 | 1960 / 1984 | NAV | Jan-2020 | $27,100,000 | $199.46 |
Santa Fe Springs Promenade 11442-11570 Telegraph Road Santa Fe Springs, CA | 111,925 | 1954 / 1993 | 81.0% | Jan-2020 | $31,900,000 | $285.01 |
Towne Center East 2510-2550 Cherry Avenue Signal Hill, CA | 163,200 | 1994 / NAP | 100.0% | Sep-2019 | $61,000,000 | $373.77 |
Source: Appraisal, unless otherwise noted.
| (1) | Information is based on the underwritten rent roll as of October 19, 2021. |
The following table presents information relating to the appraisal’s market rent conclusion for the Madonna Plaza Property:
| Market Rent Summary |
| | Anchor | Junior Anchor | OutParcel | Restaurant | Inline |
| Market Rent | $16.80 | $16.80 | $36.00 | $39.60 | $28.80 |
| Lease Term (Years) | 15 | 10 | 5 | 5 | 5 |
| Lease Type | NNN | NNN | NNN | NNN | NNN |
| Rent Increases Projection | 10% / 5 years | 10% / 5 years | 3.0% per annum | 3.0% per annum | 3.0% per annum |
| Tenant Improvements (New) | $20.00 | $20.00 | $20.00 | $20.00 | $20.00 |
| Leasing Commissions (New/Renewal) | 6.0% / 3.0% | 6.0% / 3.0% | 6.0% / 3.0% | 6.0% / 3.0% | 6.0% / 3.0% |
| Free Rent (New/Renewal) | 6 months / 1 month | 6 months / 1 month | 3 months / 1 month | 6 months / 1 month | 3 months / 1 month |
This is not a research report and was not prepared by any Underwriter’s research department. Please see additional important information and qualifications at the end of this Term Sheet. |
| | T-106 | |
| Retail – Anchored | Loan #8 | Cut-off Date Balance: | | $46,500,000 |
| 201-299 Madonna Road | Madonna Plaza | Cut-off Date LTV: | | 70.9% |
| San Luis Obispo, CA 93405 | | UW NCF DSCR: | | 1.55x |
| | | UW NOI Debt Yield: | | 10.1% |
Operating History and Underwritten Net Cash Flow. The following table presents certain information relating to the historical operating performance and the Underwritten Net Cash Flow at the Madonna Plaza Property:
| Cash Flow Analysis |
| | 2017 | 2018 | 2019 | 2020 | 6/30/2021 TTM(1) | UW(1) | UW PSF |
| Gross Potential Rent(2) | $4,808,798 | $4,801,603 | $5,264,942 | $5,403,115 | $5,353,163 | $5,996,569 | $20.88 |
| Reimbursements | $1,022,317 | $1,048,700 | $1,368,623 | $1,486,617 | $1,569,460 | $1,819,870 | $6.34 |
| Other Income | $0 | $0 | $0 | $0 | $0 | $0 | $0.00 |
| Discounts Concessions | $0 | $0 | $0 | $0 | $0 | $0 | $0.00 |
| Less Vacancy & Credit Loss | ($33,113) | ($18,000) | ($221,360) | ($232,692) | ($171,943) | ($489,338) | ($1.70) |
| Effective Gross Income | $5,798,002 | $5,832,303 | $6,412,205 | $6,657,040 | $6,750,680 | $7,327,102 | $25.52 |
| | | | | | | | |
| Real Estate Taxes | $665,713 | $679,028 | $636,679 | $772,172 | $789,644 | $763,898 | $2.66 |
| Insurance | $134,469 | $109,890 | $118,060 | $137,068 | $150,992 | $207,642 | $0.72 |
| Ground Rent | $529,930 | $493,436 | $514,502 | $533,854 | $518,950 | $580,430(3) | $2.02 |
| Other Expenses | $776,673 | $931,837 | $1,038,249 | $1,017,705 | $1,078,556 | $1,101,424 | $3.84 |
| Total Expenses | $2,106,785 | $2,214,191 | $2,307,490 | $2,460,799 | $2,538,142 | $2,653,394 | $9.24 |
| | | | | | | | |
| Net Operating Income | $3,691,217 | $3,618,113 | $4,104,715 | $4,196,241 | $4,212,538 | $4,673,708 | $16.28 |
| Capital Expenditures | $0 | $0 | $0 | $0 | $0 | $57,426 | $0.20 |
| TI/LC | $0 | $0 | $0 | $0 | $0 | $318,713 | $1.11 |
| Net Cash Flow | $3,691,217 | $3,618,113 | $4,104,715 | $4,196,241 | $4,212,538 | $4,297,569 | $14.97 |
| | | | | | | | |
| Occupancy % | 76.9% | 80.9% | 95.9% | 95.9% | 95.9%(4) | 93.3% | |
| NOI DSCR | 1.33x | 1.30x | 1.48x | 1.51x | 1.51x | 1.68x | |
| NCF DSCR | 1.33x | 1.30x | 1.48x | 1.51x | 1.51x | 1.55x | |
| NOI Debt Yield | 7.9% | 7.8% | 8.8% | 9.0% | 9.1% | 10.1% | |
| NCF Debt Yield | 7.9% | 7.8% | 8.8% | 9.0% | 9.1% | 9.2% | |
| (1) | Increases in Gross Potential Rent and Net Operating Income from 6/30/2021 TTM to UW are primarily due to new leases to tenants Five Below, Dave’s Hot Chicken, The Good Feet Store, and Party City, as well as contractual rent steps through December 2022 for Ralphs, DSW, Med Stop Medical Clinic, Chipotle, the Good Feet Store, Sally Beauty, and Starbucks totaling $77,135. |
| (2) | Petco previously leased a 20,100 SF unit at the Madonna Plaza Property under a lease that expired December 31, 2021. The borrower has informed the lender that the borrower plans to subdivide the former Petco box into two approximately 10,000 SF units for which the borrower has executed leases with Party City (10,036 SF / 3.5% of NRA / 2.7% of UW Base Rent through January 31, 2032) and Five Below (10,012 SF / 3.5% of NRA / 3.0% of UW Base Rent through January 31, 2032). Party City and Five Below both have anticipated possession dates in June 2022, and have rent commencement dates of August 29, 2022 and September 29, 2022, respectively. Party City has the right to terminate its lease if its space is not delivered to it with landlord’s work at substantial completion on or before November 16, 2022. Five Below has the right to terminate its lease if its space is not delivered to it with landlord’s work at substantial completion by August 1, 2022. In addition, the Party City lease requires the borrower to pay the tenant liquidated damages of two days of rent for each day after June 30, 2022 that the borrower fails to deliver the premises as required by the lease, which may at the tenant’s discretion be offset by the tenant against its rent obligations, and the Five Below lease provides that the tenant will be entitled to one day of free rent for each day after June 1, 2022 that the borrower fails to deliver the premises as required by the lease.. Party City and Five Below are underwritten as occupied and all gap rent, free rent and outstanding tenant improvements and leasing commissions were reserved at origination. Dave's Hot Chicken (3,925 SF / 1.4% of NRA / 2.8% of UW Base Rent through October 31, 2031) is in the process of opening. The lease requires that the tenant begin paying rent no later than January 19, 2022. Three months of gap rent for November through January were reserved at origination. |
| (3) | Underwritten Ground Rent Expense represents 11.5% of the prior year base rent achieved from Ralph’s and 10.25% of the remaining center base rent (see “Ground Lease” section). |
| (4) | 6/30/2021 TTM Occupancy is based off the October 19, 2021 underwritten rent roll. |
Escrows and Reserves.
Real Estate Taxes – During the continuance of a Tax Trigger Period (as defined below), the Madonna Plaza Mortgage Loan documents provide for ongoing monthly deposits into a reserve for real estate taxes in an amount equal to 1/12 of the real estate taxes that the lender estimates will be payable during the next twelve months.
Insurance – During the continuance of an Insurance Trigger Period (as defined below), the Madonna Plaza Mortgage Loan documents provide for ongoing monthly deposits into a reserve for insurance premiums in an amount equal to 1/12 of the insurance premiums that the lender estimates will be payable for the renewal of coverage upon the expiration of the insurance policies; provided that such monthly deposits are not required so long as (i) no event of default is continuing, (ii) the liability and casualty insurance coverage for the Madonna Plaza Property is included in a blanket policy approved by the lender in its reasonable discretion, and (iii) the borrower provides the lender with evidence of payment of the insurance premiums and renewals of the insurance policies, no later than the expiration of the current policy.
Ground Rent Reserve – During the continuance of a Ground Rent Trigger Period (as defined below), the Madonna Plaza Mortgage Loan documents provide for ongoing monthly deposits into a reserve for ground rent in an amount equal to 1/3 of the ground rent that the lender estimates will be payable under the ground lease on the immediately succeeding quarterly payment date.
Replacement Reserve – The Madonna Plaza Mortgage Loan documents provide for ongoing monthly deposits of $3,589 into a reserve for approved capital expenditures, provided that, so long as no event of default is continuing under the Madonna Plaza Mortgage Loan, the borrower is not required to deposit any portion of such monthly deposit that would cause the amount then on deposit in such reserve fund to exceed $43,069.
TI/LC Reserve – On the origination date, the Madonna Plaza Mortgage Loan documents required the borrower to deposit into reserve (i) $1,476,770 for outstanding tenant improvements and leasing commissions due under the lease for Five Below, (ii) $1,505,400 for outstanding tenant improvements and leasing commissions due under the lease for Party City, (iii) $210,380 for outstanding tenant improvements and leasing commissions due under the lease
This is not a research report and was not prepared by any Underwriter’s research department. Please see additional important information and qualifications at the end of this Term Sheet. |
| | T-107 | |
| Retail – Anchored | Loan #8 | Cut-off Date Balance: | | $46,500,000 |
| 201-299 Madonna Road | Madonna Plaza | Cut-off Date LTV: | | 70.9% |
| San Luis Obispo, CA 93405 | | UW NCF DSCR: | | 1.55x |
| | | UW NOI Debt Yield: | | 10.1% |
for Dave’s Hot Chicken, (iv) $25,000 for outstanding leasing commissions due under the lease for Chipotle and (v) $87,248 for outstanding tenant improvements and leasing commissions due under the lease for The Good Feet Store.
In addition, the Madonna Plaza Mortgage Loan documents provide for ongoing monthly deposits of approximately $23,210 into a reserve for future tenant improvement and leasing commission costs that may be incurred by the borrower, provided that, so long as no event of default is continuing under the Madonna Plaza Mortgage Loan, the borrower is not required to deposit any portion of such monthly deposit that would cause the amount then on deposit in such reserve fund to exceed $557,030. Notwithstanding the foregoing, the borrower will not be required to make such monthly deposits, as long as (i) the Schottenstein Condition (as defined below) remains satisfied (ii) the Guarantor TI Waiver Requirement (as defined below) remains satisfied and (iii) the Madonna Plaza Property remains at least 85% occupied.
Rent Reserve – On the origination date, the Madonna Plaza Mortgage Loan documents required the borrower to deposit into reserve (i) the sum of $206,080 for gap rent under the lease for Five Below, (ii) $125,450 for gap rent under the lease for Party City, (iii) $46,667 for rent concessions due under the lease for Ulta Beauty, and (iv) $39,250 for rent due under the lease for Dave’s Hot Chicken. In addition, (i) upon a Five Below Gap Rent Trigger (as defined below), the borrower is required to reserve an additional $170,204, which is equal to one year’s rent for Five Below, and (ii) upon a Party City Gap Rent Trigger (as defined below), the borrower is required to reserve an additional $150,540, which is equal to one year’s rent for Party City.
"Five Below Gap Rent Trigger" means (i) July 1, 2022, if the borrower has not delivered Five Below’s space to Five Below in accordance with its lease and/or (ii) Five Below has terminated its lease (which it is entitled to do if the borrower fails to deliver its space with landlord’s work at substantial completion by August 1, 2022).
"Party City Gap Rent Trigger" means (i) July 1, 2022, if the borrower has not delivered Party City’s space to Party City in accordance with its lease and/or (ii) Party City has terminated its lease (which it is entitled to do if the borrower fails to deliver its space with landlord’s work at substantial completion by November 16, 2022).
DSW Holdback Funds – On the origination date, the Madonna Plaza Mortgage Loan documents required the lender to deposit $1,000,000 (the “DSW Holdback Funds”) from the proceeds of the Madonna Plaza Mortgage Loan into a DSW Holdback Funds account. The lender is required to disburse the DSW Holdback Funds to the borrower, provided that the borrower reasonably satisfies the following conditions prior to the date that is two years from the origination date (the “DSW Holdback Disbursement Termination Date”): (i) no event of default exists and remains uncured under the Madonna Plaza Mortgage Loan and (ii) DSW has not exercised the termination option set forth in its lease (which permits termination with 30 days’ notice and payment of a termination fee equal to $176,600 if DSW’s gross sales are less than $3,250,000 in its fifth lease year (ending April 2022), such termination option has expired, and DSW’s lease is in full force and effect with no default thereunder, as confirmed by an estoppel certificate. If the borrower fails to satisfy the foregoing conditions prior to the DSW Holdback Disbursement Termination Date, the DSW Holdback Funds are required to be applied to the prepayment of the Madonna Plaza Mortgage Loan, and the borrower is required to pay any yield maintenance premium then due.
A “Tax Trigger Period” is a period (i) commencing upon (A) the failure of the Schottenstein Condition to remain satisfied, (B) the commencement of a Cash Sweep Event Period (as defined below), (C) the failure of any real estate taxes to be paid on or prior to the date the same are due (unless then being contested in accordance with the terms of the Madonna Plaza Mortgage Loan documents), (D) the borrower fails to provide evidence of payment of real estate taxes within ten days following a request by the lender, or (E) the occurrence of a monetary event of default under the Madonna Plaza Mortgage Loan; and (ii) ending (v) upon the full repayment of the Madonna Plaza Mortgage Loan, (w) if commenced under clause (B), the cure of all Cash Sweep Event Periods, (x) if commenced under clause (C), such taxes are paid in full within ten days following written notice from the lender, (y) if commenced under clause (D), such evidence is provided to the lender within ten days following written notice from the lender, and (z) if commenced under clause (E), the cure of such monetary event of default is accepted by the lender in its sole discretion.
An “Insurance Trigger Period” is a period (i) commencing upon (A) the failure of the Schottenstein Condition to remain satisfied, (B) the commencement of a Cash Sweep Event Period, (C) the failure of any insurance premiums to be paid on or prior to the date the same are due or the borrower fails to provide the lender with evidence of payment of such premiums and copies of certificates evidencing the insurance policies as required under the Madonna Plaza Mortgage Loan documents, (D) any insurance policy fails to satisfy in any material respect the terms and conditions of the Madonna Plaza Mortgage Loan documents, or (E) the occurrence of a monetary event of default under the Madonna Plaza Mortgage Loan; and (ii) ending (w) upon the full repayment of the Madonna Plaza Mortgage Loan, (x) if commenced under clause (B), the cure of all Cash Sweep Event Periods, (y) if commenced under clause (C) or (D), delivery to the lender of evidence of payment of the applicable insurance premiums, certificates evidencing the applicable insurance policies, or evidence that all insurance policies comply with the relevant terms and conditions of the Madonna Plaza Mortgage Loan documents (as applicable) within ten days following written notice from the lender, and (z) if commenced under clause (E), the cure of such monetary event of default is accepted by the lender in its sole discretion.
The Madonna Plaza Mortgage Loan documents provide that cures under clauses (ii) (x) or (y) of the definition of Tax Trigger Period and under clause (ii) (y) of the definition of Insurance Trigger Period may not occur (in the aggregate) more than four times during the term of the Madonna Plaza Mortgage Loan and a cure under clause (ii)(y) of the definition of Insurance Trigger Period may not extend beyond the expiration date of any applicable insurance policy.
A “Ground Rent Trigger Period” is a period (i) commencing upon (A) the failure of the Schottenstein Condition to remain satisfied, (B) the occurrence of an event of default under the ground lease (beyond all applicable notice and cure periods), or (C) the occurrence of an event of default under the Madonna Plaza Mortgage Loan; and (ii) ending (x) upon the full repayment of the Madonna Plaza Mortgage Loan, (y) if commenced under clause (B), the cure of the default under the ground lease, as evidenced by an estoppel certificate of the ground lessor, and (z) if commenced under clause (C), the cure of such event of default is accepted by the lender in its sole discretion.
The “Schottenstein Condition” means that the Schottenstein Family (as defined below) owns, directly or indirectly, at least 51% of the borrower and controls the borrower and the general partner of the borrower.
The “Schottenstein Family” means, individually or collectively, any of: (i) Jay L. Schottenstein, Joseph Schottenstein, Jonathan Schottenstein, Jeffrey Schottenstein, Lori Schottenstein or their respective spouses and lineal descendants, including their children or grandchildren; (ii) any trusts or entities of which any of such persons are the sole beneficiaries or which are entirely owned or controlled (directly or indirectly) by any such persons (or majority-
This is not a research report and was not prepared by any Underwriter’s research department. Please see additional important information and qualifications at the end of this Term Sheet. |
| | T-108 | |
| Retail – Anchored | Loan #8 | Cut-off Date Balance: | | $46,500,000 |
| 201-299 Madonna Road | Madonna Plaza | Cut-off Date LTV: | | 70.9% |
| San Luis Obispo, CA 93405 | | UW NCF DSCR: | | 1.55x |
| | | UW NOI Debt Yield: | | 10.1% |
owned and controlled, so long as the persons set forth in clauses (i) and (ii) above continue to own directly or indirectly 51% or more of, and control, the borrower) or (iii) a private or public real estate investment trust sponsored and controlled by one or more of the persons set forth in clauses (i) and (ii) above; or (iv) a public offering of the non-recourse carveout guarantor or its affiliates after which public offering, such guarantor or its affiliates as applicable, are controlled by one or more of the persons set forth in clauses (i) and (ii) above.
“Guarantor TI Waiver Requirement” means the non-recourse carveout guarantor maintains a minimum net worth (as defined in the related non-recourse carveout guaranty, and excluding the Madonna Plaza Property) of $100,000,000 and a minimum liquidity (as defined in the related non-recourse carveout guaranty, and excluding the Madonna Plaza Property) of $4,650,000.
A “Cash Sweep Event Period” means a period: (i) commencing upon a monetary event of default under the Madonna Plaza Mortgage Loan and ending upon the acceptance by the lender, in its sole discretion, of a cure of such monetary event of default, or (ii) commencing upon a voluntary bankruptcy of the borrower and/or the non-recourse carveout guarantor that has not been dismissed, settled or cured within 180 days, or if a voluntary bankruptcy of the guarantor, the guarantor is not replaced with a guarantor meeting the requirements of the Madonna Plaza Mortgage Loan documents and reasonably satisfactory to the lender within 30 days of written demand, and ending upon any voluntary bankruptcy of the borrower and/or guarantor, as applicable, being dismissed, settled and cured and the borrower and/or guarantor, as applicable, having emerged from bankruptcy, or (iii) commencing upon (except as described below) the debt service coverage ratio on the Madonna Plaza Mortgage Loan (calculated based on a 30-year amortization schedule) being less than 1.10x for four consecutive calendar quarters (a “DSCR Event”) and ending on the date that the debt service coverage ratio on the Madonna Plaza Mortgage Loan (calculated based on a 30-year amortization schedule) is at least 1.10x for the four immediately preceding calendar quarters, or (iv) commencing upon a Major Tenant Lease Expiration Event (as defined below) and ending upon the expiration of such Major Tenant Lease Expiration Event.
The borrower may avoid a Cash Sweep Event Period due to a DSCR Event by posting cash or a letter of credit in the amount that, if applied to the debt under the Madonna Plaza Mortgage Loan would result in a debt service coverage ratio of 1.10x; provided that on each one-year anniversary of the DSCR Event that it remains uncured, the borrower is required to post additional cash or letter of credit to cure such DSCR Event. For purposes of determining if a DSCR Event has occurred, if one or more Major Tenant Lease Expiration Events have occurred, the rent due under the Major Tenant lease(s) for the Major Tenant(s) that are the subject of the Major Tenant Lease Expiration Event(s), will be included in the calculation of the debt service coverage ratio as if such rent was paid in full as long as the Cash Flow Condition (as defined below) applicable to such Major Tenant Lease Expiration Event(s) has been satisfied.
A "Major Tenant Lease Expiration Event" will occur upon (i) the date a Major Tenant (as defined below) gives notice to vacate or exercises any valid termination option under such Major Tenant’s lease, (ii) a Major Tenant canceling or terminating its lease, (iii) the date upon which a Major Tenant or its lease guarantor has entered into or becomes subject to certain bankruptcy or insolvency actions, (iv) the date upon which a Major Tenant has "gone dark" in, or vacated, all or substantially all of its space, other than in connection with a temporary closure resulting from a casualty, condemnation or remodeling, which temporary closure may not exceed 90 days (or such longer period as may be expressly permitted under its lease) and (v) the failure of any Major Tenant to renew its lease on or before the applicable Major Tenant Renewal Date (as defined below) in accordance with its lease or upon terms acceptable to the lender; provided that a Major Tenant Lease Expiration Event will not be deemed to have occurred if the Cash Flow Condition for the applicable Major Tenant has been satisfied. A Major Tenant Lease Expiration Event will expire if (1) the applicable Major Tenant (A) has, if applicable, renewed or extended its lease in accordance with its lease or upon terms acceptable to the lender, (B) if it or its lease guarantor has entered into or becomes subject to a bankruptcy or insolvency event, such event has been dismissed, settled and cured and it or its lease guarantor has emerged from bankruptcy, and (C) is in occupancy of the space demised under its lease, open for business and paying its full contractual rent as confirmed by a tenant estoppel certificate or (2) 80% or more of the Major Tenant space has been re-leased at then market rents (as reasonably determined by the borrower) and the related tenants are in occupancy, open for business and paying full contractual rent, as confirmed by tenant estoppel certificates.
"Major Tenant" means (1) Kohl's, (2) Ralphs and (3) any replacement tenant that leases the space demised under the Kohl’s lease or Ralphs lease.
“Major Tenant Renewal Date” means (1) with respect to Kohl’s, the date that is 12 months prior to its lease expiration date, (2) with respect to Ralphs, the date which is nine months prior to its lease expiration date, and (3) with respect to a replacement tenant, the earlier of (x) six months prior to its lease expiration date and (y) the date by which it is required to provide the borrower with written notice that it intends to renew its lease.
"Cash Flow Condition" means the deposit with the lender by the borrower within ten days of the occurrence of a Major Tenant Lease Expiration Event of either cash or one or more letters of credit in the applicable Major Tenant Deposit Amount.
“Major Tenant Deposit Amount” means (i) with respect to Kohl’s, an amount equal to $2,499,240 plus $40 multiplied by each SF of space leased by Kohl's in excess of 62,481 SF and (ii) with respect to Ralphs an amount equal to $2,077,320 plus $40 multiplied by each SF of space leased by Ralphs in excess of 51,933 SF.
Lockbox and Cash Management. The Madonna Plaza Mortgage Loan is structured with a hard lockbox and springing cash management. The borrower is required to direct all tenants to deposit rents directly into a lender-controlled lockbox account, and to deposit any rents received by the borrower or the property manager into such account within two business days of receipt. If no Cash Sweep Event Period exists, all funds in the lockbox account will be swept to an account designated by the borrower. Upon the first occurrence of a Cash Sweep Event Period, the lender is required to establish, and the borrower is required to cooperate with the cash management bank to establish, a cash management account controlled by the lender. During the continuance of a Cash Sweep Event Period, funds in the lockbox account are required to be swept on each business day to the cash management account, and, provided no event of default is continuing, all funds in the cash management account are required to be applied on each monthly payment date: (i) to make the monthly deposits into the ground rent, real estate tax, and insurance reserves, if any, as described above under “Escrows and Reserves” (ii) to pay debt service on the Madonna Plaza Mortgage Loan, (iii) to make the monthly deposits into the replacement reserve and rollover reserve, if any, as described above under “Escrows and Reserves,” (iv) to pay operating expenses set forth in the annual budget (which is required to be approved by the lender during a Cash Sweep Event Period) and lender-approved extraordinary expenses, and (v) to deposit any remainder (x) if a Cash Sweep Event Period is in effect as a result of one or more Major Tenant Lease Expiration Events (and the Cash Flow Condition has not been satisfied), into a Major Tenant reserve (to be used for expenses of retenanting the applicable Major Tenant space) until the aggregate amount deposited into the Major Tenant reserve equals the Major Tenant Deposit Amount with respect to the applicable Major Tenant or Major Tenants (provided that the borrower may deposit cash or a letter of credit such that the amount in the Major Tenant reserve equals the Major Tenant Deposit Amount with respect to the applicable Major
This is not a research report and was not prepared by any Underwriter’s research department. Please see additional important information and qualifications at the end of this Term Sheet. |
| | T-109 | |
| Retail – Anchored | Loan #8 | Cut-off Date Balance: | | $46,500,000 |
| 201-299 Madonna Road | Madonna Plaza | Cut-off Date LTV: | | 70.9% |
| San Luis Obispo, CA 93405 | | UW NCF DSCR: | | 1.55x |
| | | UW NOI Debt Yield: | | 10.1% |
Tenant or Major Tenants, in which event no further amount is required to be deposited in such reserve) and (y) after any deposits required under clause (x) have been made, into an excess cash flow reserve to be held as additional security for the Madonna Plaza Mortgage Loan during the continuance of such Cash Sweep Event Period. If no Cash Sweep Event Period is continuing, all funds in the excess cash flow reserve are required to be disbursed to the borrower.
Additional Secured Indebtedness (not including Trade Debts). Not permitted.
Mezzanine Loan and Preferred Equity. Not permitted.
Release of Property. Not permitted.
Right of First Offer / Right of First Refusal. None.
Ground Lease. The Madonna Plaza Property is comprised of a ground leasehold interest under a ground lease agreement dated December 19, 1966, as amended, between Charles A. Pasquini, Jr. Separate Property Trust under Agreement dated May 26, 2005, as ground lessor, and the borrower, as ground lessee (the “Madonna Plaza Ground Lease”). The Madonna Plaza Ground Lease has an expiration date of December 31, 2086 with no renewal options. The current annual ground rent is 11.5% of the prior year minimum rent from the Ralphs suite and 10.25% of the remaining income from the Madonna Plaza Property (including base rent and percentage rent, but excluding reimbursements) plus percentage rent for the Ralphs suite, for the prior year. On January 1, 2042, 2062 and 2082, the ground rent is required to be adjusted in accordance with the following provisions. If the income from the Madonna Plaza Property (calculated on an accrual basis, and including base rent and percentage rent, but excluding reimbursements) (the “Adjusted Qualified Rental”) is greater than or equal to the fair rental value of the Madonna Plaza Property (as defined in the Madonna Plaza Ground Lease and determined by the agreement of the parties, or if the parties are unable to agree, by an appraisal procedure) (the “Fair Rental Value”) then the annual ground rent until the next adjustment date will be equal to 13.5% of the prior year minimum rent from the Ralphs suite and 12% of the remaining income from the Madonna Plaza Property (including base rent and percentage rent, but excluding reimbursements) plus percentage rent for the Ralphs suite, for the prior year. If the Adjusted Qualified Rental is less than the Fair Rental Value, then the annual rent until the next adjustment date will be equal to the Qualified Rental Percentage (as defined below) of the income from the Madonna Plaza Property (including base rent and percentage rent, but excluding reimbursements) for the prior year.
''Qualified Rental Percentage" will be that percentage which is determined by dividing the Fair Rental Value as of June 1 of the year immediately prior to the calendar year containing the applicable adjustment date by the Adjusted Qualified Rental for the calendar year immediately prior to the calendar year containing the applicable adjustment date, and then multiplying the quotient by 12% (but in no event will the Qualified Rental Percentage be less than 12%).
Letter of Credit. None. However, a letter of credit may be used to satisfy the Cash Flow Condition and/or to cure a DSCR Event, as described above.
Terrorism Insurance. The borrower is required to obtain and maintain an “all risk” property insurance policy that covers acts of terrorism in an amount equal to the “full replacement cost” of the Madonna Plaza Property together with business income insurance covering not less than the 18-month period commencing at the time of loss, together with an extended period of indemnity endorsement of up to six months. Notwithstanding the foregoing, for so long as the Terrorism Risk Insurance Act of 2002, as extended and modified by the Terrorism Risk Insurance Program Reauthorization Act of 2015 (“TRIPRA”) is in effect (including any extensions thereof or if another federal governmental program is in effect relating to “acts of terrorism” which provides substantially similar protections as TRIPRA), the lender is required to accept terrorism insurance which covers against “covered acts” as defined by TRIPRA (or such other program) as full compliance with the loan documents, but only in the event that TRIPRA (or such other program) continues to cover both domestic and foreign acts of terrorism; provided, that if TRIPRA (or a similar or subsequent statute) is not in effect, the borrower is not required to pay insurance premiums with respect to such terrorism insurance in excess of two times the amount of the insurance premiums that are payable at such time in respect of the property and rental loss and/or business income insurance required under the loan documents (without giving effect to the cost of terrorism components of such property and rental loss and/or business income insurance). See “Risk Factors—Risks Relating to the Mortgage Loans—Terrorism Insurance May Not Be Available for All Mortgaged Properties” in the prospectus.
This is not a research report and was not prepared by any Underwriter’s research department. Please see additional important information and qualifications at the end of this Term Sheet. |
| | T-110 | |
(THIS PAGE INTENTIONALLY LEFT BLANK)
This is not a research report and was not prepared by any Underwriter’s research department. Please see additional important information and qualifications at the end of this Term Sheet. |
| | T-111 | |
| Mixed Use – Office/Retail | Loan #9 | Cut-off Date Balance: | | $43,500,000 |
| 5 Crosby Street | 5 Crosby Street | Cut-off Date LTV: | | 63.0% |
| New York, NY 10013 | | UW NCF DSCR: | | 1.82x |
| | | UW NOI Debt Yield: | | 7.9% |
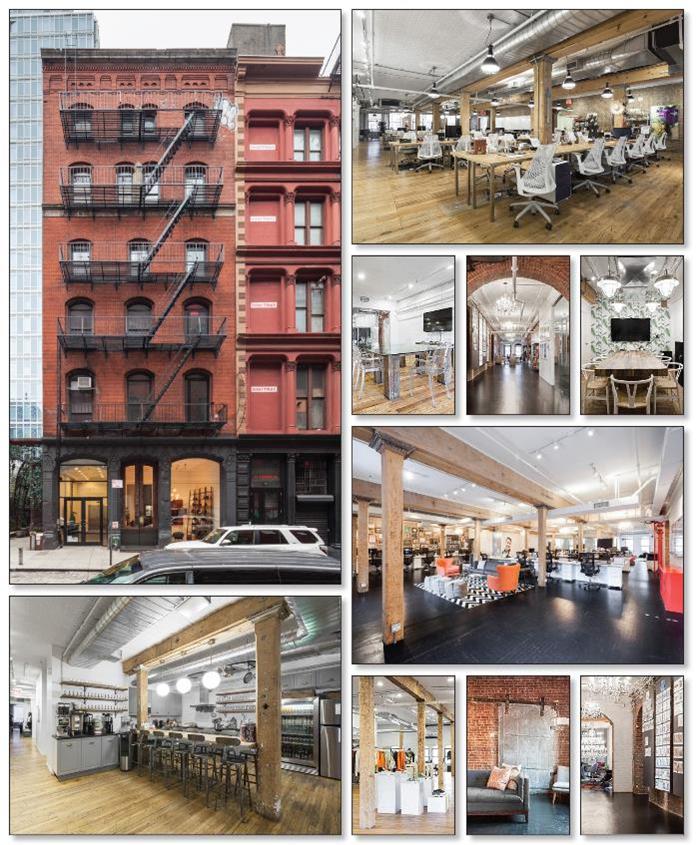
This is not a research report and was not prepared by any Underwriter’s research department. Please see additional important information and qualifications at the end of this Term Sheet. |
| | T-112 | |
| Mixed Use – Office/Retail | Loan #9 | Cut-off Date Balance: | | $43,500,000 |
| 5 Crosby Street | 5 Crosby Street | Cut-off Date LTV: | | 63.0% |
| New York, NY 10013 | | UW NCF DSCR: | | 1.82x |
| | | UW NOI Debt Yield: | | 7.9% |
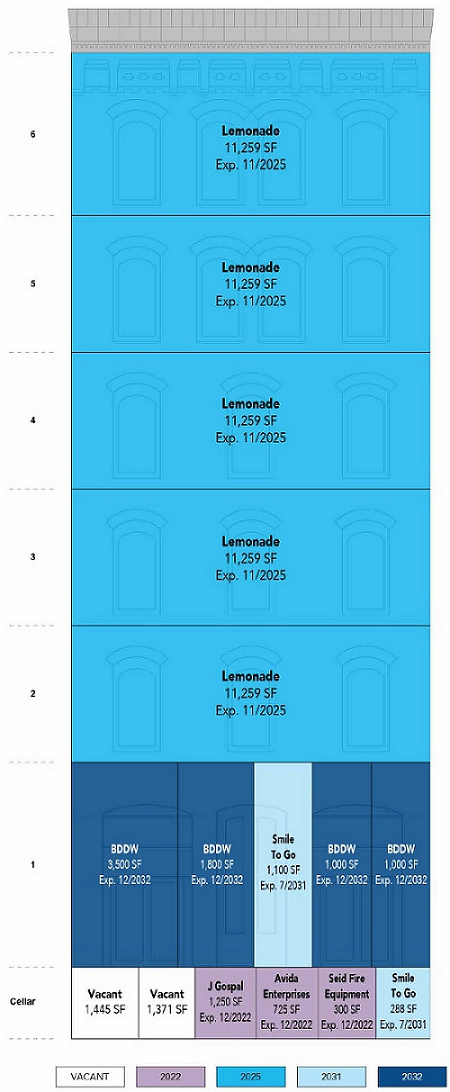
This is not a research report and was not prepared by any Underwriter’s research department. Please see additional important information and qualifications at the end of this Term Sheet. |
| | T-113 | |
| Mixed Use – Office/Retail | Loan #9 | Cut-off Date Balance: | | $43,500,000 |
| 5 Crosby Street | 5 Crosby Street | Cut-off Date LTV: | | 63.0% |
| New York, NY 10013 | | UW NCF DSCR: | | 1.82x |
| | | UW NOI Debt Yield: | | 7.9% |
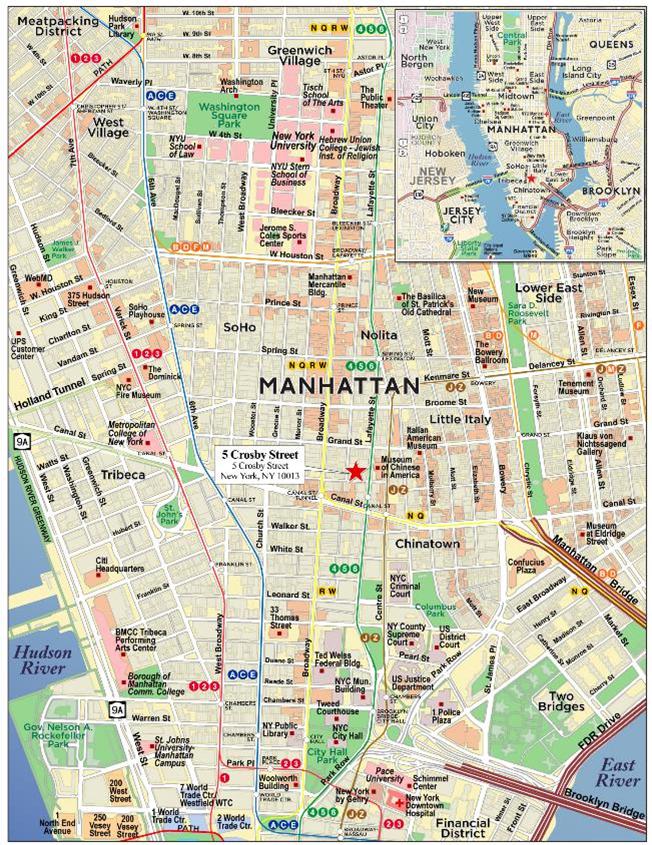
This is not a research report and was not prepared by any Underwriter’s research department. Please see additional important information and qualifications at the end of this Term Sheet. |
| | T-114 | |
| Mortgage Loan No. 9 – 5 Crosby Street |
| Mortgage Loan Information | | Property Information |
| Mortgage Loan Seller: | MSMCH | | Single Asset/Portfolio: | Single Asset |
| Credit Assessment (DBRSM/Fitch/Moody’s): | NR/NR/NR | | Location: | New York, NY 10013 |
| Original Balance: | $43,500,000 | | General Property Type: | Mixed Use |
| Cut-off Date Balance: | $43,500,000 | | Detailed Property Type: | Office/Retail |
| % of Initial Pool Balance: | 3.6% | | Title Vesting: | Fee |
| Loan Purpose: | Refinance | | Year Built/Renovated: | 1915/2017 |
| Borrower Sponsor: | Marion Eng | | Size: | 70,074 SF |
| Guarantor: | Marion Eng | | Cut-off Date Balance Per SF: | $621 |
| Mortgage Rate: | 4.1900% | | Maturity Date Balance Per SF: | $621 |
| Note Date: | 11/24/2021 | | Property Manager: | Cape Advisors, Inc. |
| First Payment Date: | 1/1/2022 | | | |
| Maturity Date: | 12/1/2031 | | | |
| Original Term to Maturity: | 120 months | | | |
| Original Amortization Term: | 0 months | | | |
| IO Period: | 120 months | | Underwriting and Financial Information(2) |
| Seasoning: | 2 months | | UW NOI: | $3,416,228 |
| Prepayment Provisions: | L(26),D(90),O(4) | | UW NOI Debt Yield: | 7.9% |
| Lockbox/Cash Mgmt Status: | Hard/Springing | | UW NOI Debt Yield at Maturity: | 7.9% |
| Additional Debt Type: | No | | UW NCF DSCR: | 1.82x |
| Additional Debt Balance: | NAP | | Most Recent NOI: | $3,436,332 (8/31/2021 TTM) |
| Future Debt Permitted (Type): | No (NAP) | | 2nd Most Recent NOI: | $2,813,795 (12/31/2020) |
| Reserves(1) | | 3rd Most Recent NOI: | $3,184,087 (12/31/2019) |
| Type | Initial | Monthly | Cap | | Most Recent Occupancy: | 96.0% (10/1/2021) |
| RE Taxes: | $254,975 | $36,425 | NAP | | 2nd Most Recent Occupancy: | 98.0% (12/31/2020) |
| Insurance: | $0 | Springing | NAP | | 3rd Most Recent Occupancy: | 98.0% (2/1/2020) |
| Replacement Reserve: | $0 | $1,168 | $28,030 | | Appraised Value (as of): | $69,000,000 (10/8/2021) |
| TI/LC Reserve: | $1,250,000 | $29,198 | $2,050,000 | | Appraised Value Per SF: | $985 |
| Rent Reserve: | $1,650,208 | $0 | NAP | | Cut-off Date LTV Ratio: | 63.0% |
| Other Reserve: | $3,669,779 | $0 | NAP | | Maturity Date LTV Ratio: | 63.0% |
| | | | | | | |
| Sources and Uses |
| Sources | Proceeds | % of Total | | Uses | Proceeds | % of Total |
| Loan Amount: | $43,500,000 | 100.0% | | Loan Payoff: | $31,230,179 | 71.8% |
| | | | | Reserves: | $6,824,962 | 15.7% |
| | | | | Return of Equity: | $3,874,926 | 8.9% |
| | | | | Closing Costs: | $1,569,933 | 3.6% |
| Total Sources: | $43,500,000 | 100.0% | | Total Uses: | $43,500,000 | 100.0% |
| (1) | See “Escrows and Reserves” section below for further discussion of reserve requirements. |
| (2) | The novel coronavirus pandemic is an evolving situation and could impact the 5 Crosby Street Mortgage Loan (as defined below) more severely than assumed in the underwriting of the 5 Crosby Street Mortgage Loan and could adversely affect the NOI, NCF and occupancy information, as well as the appraised value and the DSCR, LTV and Debt Yield metrics presented above and herein. See "Risk Factors-—Risks Related to Market Conditions and Other External Factors—The Coronavirus Pandemic Has Adversely Affected the Global Economy and Will Likely Adversely Affect the Performance of the Mortgage Loans" in the prospectus. |
The Mortgage Loan. The ninth largest mortgage loan (the “5 Crosby Street Mortgage Loan”) is evidenced by a promissory note in the original principal amount of $43,500,000 and secured by a first priority fee simple mortgage encumbering a 70,074 SF mixed use office and retail building located in New York, New York (the “5 Crosby Street Property”).
The Borrower and the Borrower Sponsor. The borrower for the 5 Crosby Street Mortgage Loan is 5 Crosby LLC, a single-purpose Delaware limited liability company with one independent director in its organizational structure. The non-recourse carveout guarantor and borrower sponsor is Marion Eng. Marion Eng operated a family clothing manufacturing business out of the 5 Crosby Street Property from 1985 to 1995, after which she began converting the 5 Crosby Street Property to its present use as a mixed-use office/retail building. In 2011, the borrower sponsor hired New York City based developer Cape Advisors, Inc. to manage, renovate and reposition the 5 Crosby Street Property. Cape Advisors, Inc. has completed over $1.5 billion in development projects, principally in New York and New Jersey and continues to manage the 5 Crosby Street Property today. In addition to the 5 Crosby Street Property, Marion Eng also owns an office property in Queens as well as a portfolio of fast food franchises throughout New York City.
The Property. The 5 Crosby Street Property is a 70,074 SF mixed use office and retail building on an approximately 0.22-acre site in New York, New York. The 5 Crosby Street Property was built in 1915 and has undergone several renovations since the borrower acquired it. Most recently, the borrower invested approximately $1.1 million ($16 PSF) to upgrade elevators, HVAC equipment and fire and sprinkler systems. Additionally, the borrower has informed the lender that it plans to make upgrades to the 5 Crosby Street Property and convert the multi-tenant second floor to a single-tenant layout due to the expansion of the largest tenant, Lemonade, as described below under “Major Tenants.” The second floor is currently configured as multi-tenant space with 6,827 SF out of 8,217 SF of NRA occupied by seven tenants. Following the conversion to a single-tenant floor plan, the second floor is expected
This is not a research report and was not prepared by any Underwriter’s research department. Please see additional important information and qualifications at the end of this Term Sheet. |
| | T-115 | |
| Mixed Use – Office/Retail | Loan #9 | Cut-off Date Balance: | | $43,500,000 |
| 5 Crosby Street | 5 Crosby Street | Cut-off Date LTV: | | 63.0% |
| New York, NY 10013 | | UW NCF DSCR: | | 1.82x |
| | | UW NOI Debt Yield: | | 7.9% |
to include 11,259 SF of NRA to match the layout of floors 3-6. The Lemonade expansion into the second floor is expected to occur May 1, 2023. All current second floor tenants have leases that expire by August 2022, with the exception of Kworq, which occupies 1,668 SF and has a lease expiring April 2024. The borrower has executed a termination agreement with Kworq pursuant to which the tenant has agreed to vacate its space by April 30, 2022 in exchange for a termination fee of $70,000.
Due to the 5 Crosby Street Property being built prior to 1938, a certificate of occupancy was never issued. Given the historical change in use over time, which would now require a certificate of occupancy, the borrower applied for and received an Alteration Type 1 Permit from the New York City Department of Buildings (the “DOB”), which the borrower has represented evidences that the DOB has approved plans and specifications for a certificate of occupancy which permits the uses of the building for retail and office use once all work is completed and inspected. Such permit expired on December 9, 2020; however, the borrower has represented that such permit is not required to be renewed as a condition of issuance of a certificate of occupancy. The borrower has represented and warranted that it has performed upgrade work to each of the sprinkler system and fire alarm system, and that its completion of such work, and its cure of certain DOB and Environmental Code Board violations at the 5 Crosby Street Property are conditions precedent to issuance of a certificate of occupancy. The borrower is awaiting inspection of the sprinkler system and fire alarm system work from the applicable governmental authorities. The borrower has covenanted that, subject to force majeure delays (which includes delays due to the COVID-19 pandemic or a similar pandemic or epidemic), it will use commercially reasonable efforts and comply with all legal requirements to obtain a temporary certificate of occupancy (“TCO”) for the 5 Crosby Street Property on or before December 31, 2022, subject to extension for 30-day periods, up to a total of 90 days, provided that the borrower delivers reasonably acceptable evidence to the lender that it is using commercially reasonable efforts to obtain the TCO by the applicable deadline. Lemonade has acknowledged the lack of a valid Certificate of Occupancy and that such a certificate is not a condition to payment of rent under the Lemonade lease. Lemonade is performing its own build-out work as described in the “Major Tenants” section. The 5 Crosby Street Property has been granted landmark status by the New York City Landmarks Preservation Commission, and therefore the borrower is subject to limitations on its ability to alter or restore the 5 Crosby Street Property.
As of the underwritten rent roll dated October 1, 2021, the 5 Crosby Street Property was 96.0% leased to seven tenants, including the Lemonade expansion space described below. Other than the top two tenants (Lemonade and BDDW) no other tenant accounts for more than 2.0% of NRA or 3.5% of underwritten rent. The 5 Crosby Street Property consists of 56,295 SF of office space (80.3% of NRA and 73.1% of underwritten rent) and 13,779 SF of retail space (19.7% of NRA and 25.3% of underwritten rent).
Major Tenants.
Lemonade (56,295 SF, 80.3% of NRA, 73.1% of underwritten rent). Founded in 2015 and publicly traded since July 2020, Lemonade (NYSE: LMND) is a technology-driven home and renters insurance company that is headquartered at the 5 Crosby Street Property. See “Risk Factors—Risks Relating to the Mortgage Loans—Mortgaged Properties Leased to Startup Companies Have Special Risks” in the prospectus. Since taking occupancy, Lemonade has expanded several times and now occupies the entire third, fourth and sixth floors. Lemonade has also executed a new lease amendment to expand onto the fifth floor and second floor. The lease with respect to the fifth floor will commence on the later of May 15, 2022 and the date the landlord delivers the space to the tenant in accordance with the lease, and the lease with respect to the second floor will commence on the later of May 1, 2023 and the date that is 15 days after the landlord delivers the space to the tenant in accordance with the lease. This will increase the tenant’s footprint from 33,777 SF to 56,295 SF and will represent the entire office component at the 5 Crosby Street Property. In conjunction with the expansion, Lemonade extended its lease on all space through November 2025. Lemonade is entitled to receive $100,000 monthly rent credits totaling $1.5 million from June 2022 through November 2023. The fifth floor is currently occupied by Pereira O'Dell on a lease through April 2022 and the second floor is currently leased as a multi-tenant floor which is expected to be renovated to a single tenant floor to accommodate Lemonade's expansion. As part of its agreement with Lemonade, the borrower is required to convert the second floor at a budgeted capital cost of approximately $1 million, which also includes building installation upgrades. However, Lemonade is responsible for the build out of its space on the second and fifth floors. Additionally, Kworq currently occupies a portion of the second floor, but has executed a termination agreement pursuant to which it agreed to vacate its space by April 30, 2022. If the lease commencement for the fifth floor occurs after June 15, 2022 or for the second floor occurs after July 1, 2023, the rent for the related space will abate on a day-by-day basis for the period of such delay.
BDDW (7,300 SF, 10.4% of NRA, 19.4% of underwritten rent). BDDW is a luxury furniture brand which offers furniture, ceramics and clothing. BDDW’s headquarters and showroom are located on the ground floor at the 5 Crosby Street Property, while products are designed and developed at the company’s studio in Philadelphia. BDDW has expanded several times since taking occupancy in 2001, has a lease expiration date of December 31, 2032, and has two 5-year renewal options remaining.
This is not a research report and was not prepared by any Underwriter’s research department. Please see additional important information and qualifications at the end of this Term Sheet. |
| | T-116 | |
| Mixed Use – Office/Retail | Loan #9 | Cut-off Date Balance: | | $43,500,000 |
| 5 Crosby Street | 5 Crosby Street | Cut-off Date LTV: | | 63.0% |
| New York, NY 10013 | | UW NCF DSCR: | | 1.82x |
| | | UW NOI Debt Yield: | | 7.9% |
The following table presents a summary regarding the major tenants at the 5 Crosby Street Property:
| Tenant Summary(1) |
| Tenant Name | Credit Rating (Fitch/Moody’s/ S&P)(2) | Tenant SF | Approx.% of SF | Annual UW Rent | Annual UW Rent PSF (3) | App. % of Total Annual UW Rent | Term. Option | Renewal Options | Lease Expiration |
| Lemonade(4) | NR/NR/NR | 56,295 | 80.3% | $3,659,500 | $65.01 | 73.1% | N | 1 x 3 yr | 11/30/2025 |
| BDDW | NR/NR/NR | 7,300 | 10.4% | $971,844 | $133.13 | 19.4% | N | 2 x 5 yr | 12/31/2032 |
| Smile To Go | NR/NR/NR | 1,388 | 2.0% | $177,312 | $127.75 | 3.5% | N | None | 7/31/2031 |
| Subtotal/Wtd. Avg. | | 64,983 | 92.7% | $4,808,656 | $74.00 | 96.0% | | | |
| | | | | | | | | | |
| Other Tenants(5) | | 2,275 | 3.2% | $199,800 | $87.82 | 4.0% | | | |
| Vacant Space | | 2,816 | 4.0% | $0 | $0.00 | 0.0% | | | |
| Total/Wtd. Avg. | | 70,074 | 100.0% | $5,008,456 | $74.47 | 100.0% | | | |
| (1) | Information is based on the underwritten rent roll as of October 1, 2021. |
| (2) | Certain ratings are those of the parent company whether or not the parent company guarantees the lease. |
| (3) | Total Wtd. Avg. Annual UW Rent PSF excludes vacant space. |
| (4) | Information regarding Lemonade includes its fifth floor and second floor expansion space. The lease with respect to the fifth floor will commence on the later of May 15, 2022 and the date the landlord delivers the space to the tenant in accordance with the lease, and the lease with respect to the second floor will commence on the later of May 1, 2023 and the date that is 15 days after the landlord delivers the space to the tenant in accordance with the lease. All of such expansion space and related rent is underwritten. If the lease commencement for the fifth floor occurs after June 15, 2022 or for the second floor occurs after July 1, 2023, the rent for the related space will abate on a day-by-day basis for the period of such delay. In addition, Lemonade is entitled to a rent credit of $100,000 a month (for an aggregate credit of $1,500,000) for each month from June 2022 through November 2023. |
| (5) | Other Tenants includes $82,800 of underwritten billboard rent associated with Vector Media Holding Company. There is no SF tied to this lease. Billboard rent is contingent on approval by the New York City Landmarks Preservation Commission of the use of the building for billboard space. See “Escrows and Reserves—Debt Yield Holdback Reserve.” |
The following table presents certain information relating to the lease rollover at the 5 Crosby Street Property:
| Lease Rollover Schedule(1)(2) |
| Year | # of Leases Rolling | SF Rolling | Annual UW Rent PSF Rolling | Approx. % of Total SF Rolling | Approx. Cumulative % of SF Rolling | Total UW Rent Rolling | Approx. % of Total Rent Rolling | Approx. Cumulative % of Total Rent Rolling |
| 2022(3) | 4 | 2,275 | $87.82 | 3.2% | 3.2% | $199,800 | 4.0% | 4.0% |
| 2023 | 0 | 0 | $0.00 | 0.0% | 3.2% | $0 | 0.0% | 4.0% |
| 2024 | 0 | 0 | $0.00 | 0.0% | 3.2% | $0 | 0.0% | 4.0% |
| 2025 | 1 | 56,295 | $65.01 | 80.3% | 83.6% | $3,659,500 | 73.1% | 77.1% |
| 2026 | 0 | 0 | $0.00 | 0.0% | 83.6% | $0 | 0.0% | 77.1% |
| 2027 | 0 | 0 | $0.00 | 0.0% | 83.6% | $0 | 0.0% | 77.1% |
| 2028 | 0 | 0 | $0.00 | 0.0% | 83.6% | $0 | 0.0% | 77.1% |
| 2029 | 0 | 0 | $0.00 | 0.0% | 83.6% | $0 | 0.0% | 77.1% |
| 2030 | 0 | 0 | $0.00 | 0.0% | 83.6% | $0 | 0.0% | 77.1% |
| 2031 | 1 | 1,388 | $127.75 | 2.0% | 85.6% | $177,312 | 3.5% | 80.6% |
| 2032 & Beyond | 1 | 7,300 | $133.13 | 10.4% | 96.0% | $971,844 | 19.4% | 100.0% |
| Vacant | 0 | 2,816 | $0.00 | 4.0% | 100.0% | $0 | 0.0% | 100.0% |
| Total/Wtd. Avg. | 7 | 70,074 | $74.47(4) | 100.0% | | $5,008,456 | 100.0% | |
| (1) | Information is based on the underwritten rent roll as of October 1, 2021. Information regarding Lemonade includes its fifth floor and second floor expansion space. The lease with respect to the fifth floor will commence on the later of May 15, 2022 and the date the landlord delivers the space to the tenant in accordance with the lease, and the lease with respect to the second floor will commence on the later of May 1, 2023 and the date that is 15 days after the landlord delivers the space to the tenant in accordance with the lease. All of such expansion space and related rent is underwritten. |
| (2) | Certain tenants may have lease termination options that are exercisable prior to the stated expiration date of the subject lease or leases which are not considered in the lease rollover schedule. |
| (3) | 2022 includes $82,800 of underwritten billboard rent associated with Vector Media Holding Company. There is no SF tied to this lease. Billboard rent is contingent on approval by the New York City Landmarks Preservation Commission of the use of the building for billboard space. See “Escrows and Reserves—Debt Yield Holdback Reserve.” |
| (4) | Total Wtd. Avg. Annual UW Rent PSF Rolling excludes vacant space. |
COVID-19 Update. As of November 24, 2021, the borrower sponsor has reported that the 5 Crosby Street Property is open and operating with steady rent collections in previous months. During the COVID-19 pandemic, Lemonade, BDDW and Smile to Go were each given some form of rent relief. Smile to Go received relief in the form of forgivable rent. BDDW is in the process of paying back deferred rent over a 10-month period through February 2022 (and also receives a 15% discount to fixed rent during such period) and received a 50.0% waiver of fixed rent that was due from April 2020 to June 2020. Lemonade received relief in the form of its security deposit being applied to pay down base rent ($62,803 to still be paid down in November 2022).
This is not a research report and was not prepared by any Underwriter’s research department. Please see additional important information and qualifications at the end of this Term Sheet. |
| | T-117 | |
| Mixed Use – Office/Retail | Loan #9 | Cut-off Date Balance: | | $43,500,000 |
| 5 Crosby Street | 5 Crosby Street | Cut-off Date LTV: | | 63.0% |
| New York, NY 10013 | | UW NCF DSCR: | | 1.82x |
| | | UW NOI Debt Yield: | | 7.9% |
The Market. The 5 Crosby Street Property is located in New York, New York, in the SoHo neighborhood of Midtown South, but also borders the neighborhoods of NoHo, Greenwich Village, and East Village. The 5 Crosby Street Property is located within the NoHo/SoHo submarket of the overall Midtown South market. The Canal Street Subway Station is located two blocks southwest of the 5 Crosby Street Property. This station provides access to the N, Q, R and W lines. The Canal-Lafayette Street Subway Station is located two blocks southeast of the 5 Crosby Street Property. This station provides access to the 6 line. MTA’s M1 and M55 buses travel north to south along Broadway making stops at the Broadway/Spring Street Station, which is located two blocks east of the 5 Crosby Street Property. Notable demand generators in the immediate area include the retail presence in the surrounding area, the proximity to a large residential concentration to the east, as well as the 5 Crosby Street Property’s proximity to Washington Square Park. The park also borders the flagship campus of New York University, which is home to several thousand students and faculty. According to the appraisal, as of the second quarter of 2021, the NoHo/SoHo submarket had approximately 10.6 million SF of office space inventory, overall vacancy in the submarket was approximately 10.3% and asking rent was $79.30 PSF. According to the appraisal, as of the second quarter of 2021, the Midtown South market had approximately 78.8 million SF of office space inventory and asking rent was $77.76 PSF. According to the appraisal, the 2021 estimated population within a 0.25-, 0.50- and 0.75-mile radius of the 5 Crosby Street Property was 13,101, 47,841, and 124,659 respectively. The 2021 estimated median household income within a 0.25-, 0.50- and 0.75-mile radius of the 5 Crosby Street Property was $104,309, $91,331, and $90,844, respectively. The appraisal identified an office market rent of $65.00 PSF for the 5 Crosby Street Property.
The following table presents recent leasing data for tenants at comparable office properties with respect to the 5 Crosby Street Property:
| Comparable Office Lease Summary |
| Subject/Location | Tenant Name | Size (SF) | Lease Size (SF) | Lease Date | Rent PSF | Lease Term (Mos.) |
5 Crosby Street Property(1) New York, NY | Lemonade | 70,074 | 56,295 | Various(2) | $65.01 | Various(2) |
65 Bleecker Street New York, NY | Virgin Records America | 120,500 | 9,310 | 7/1/2021 | $62.00 | 60 |
628 Broadway New York, NY | Pay With Privacy | 68,500 | 11,000 | 7/1/2021 | $65.00 | 48 |
508 Laguardia Place New York, NY | Titan Investment | 10,500 | 3,200 | 7/1/2021 | $80.00 | 36 |
138 Spring Street New York, NY | Foundrae | 25,000 | 3,100 | 7/1/2021 | $68.00 | 62 |
460 Broome Street New York, NY | Calibre One | 16,738 | 2,619 | 8/1/2021 | $66.20 | 60 |
13 Crosby Street New York, NY | Square /Cash App | 44,925 | 40,000 | 1/1/2021 | $69.00 | 94 |
632 Broadway New York, NY | Galileo Super Klossy | 159,598 | 11,511 4,817 | 4/1/2021 4/1/2020 | $70.00 $66.67 | 87 50 |
30 Cooper Square New York, NY | Juxtapose | 75,000 | 6,500 | 11/1/2020 | $62.00 | 60 |
Source: Appraisal, unless otherwise noted
| (1) | Information is based on the underwritten rent roll as of October 1, 2021. |
| (2) | Lemonade has been underwritten to occupy five floors at the 5 Crosby Street Property and each floor has a separate lease start date. All leases are through November 2025. |
This is not a research report and was not prepared by any Underwriter’s research department. Please see additional important information and qualifications at the end of this Term Sheet. |
| | T-118 | |
| Mixed Use – Office/Retail | Loan #9 | Cut-off Date Balance: | | $43,500,000 |
| 5 Crosby Street | 5 Crosby Street | Cut-off Date LTV: | | 63.0% |
| New York, NY 10013 | | UW NCF DSCR: | | 1.82x |
| | | UW NOI Debt Yield: | | 7.9% |
Operating History and Underwritten Net Cash Flow. The following table presents certain information relating to the historical operating performance and the Underwritten Net Cash Flow at the 5 Crosby Street Property:
| Cash Flow Analysis |
| | 2017 | 2018 | 2019 | 2020 | 8/31/2021 TTM | UW | UW PSF |
| Gross Potential Rent(1) | $4,399,151 | $4,587,767 | $4,754,584 | $4,366,827 | $4,884,522 | $5,066,456 | $72.30 |
| Other Income(2) | $0 | $0 | $0 | $0 | $0 | $82,800 | $1.18 |
| Reimbursements(3) | $0 | $0 | $0 | $0 | $0 | $15,180 | $0.22 |
| Less Vacancy & Credit Loss | $0 | $0 | $0 | $0 | $0 | ($258,222) | ($3.68) |
| Effective Gross Income | $4,399,151 | $4,587,767 | $4,754,584 | $4,366,827 | $4,884,522 | $4,906,214 | $70.01 |
| | | | | | | | |
| Real Estate Taxes | $450,956 | $933,747 | $1,083,361 | $1,120,636 | $1,002,229 | $887,800 | $12.67 |
| Insurance | $43,635 | $75,963 | $92,812 | $88,695 | $86,825 | $90,000 | $1.28 |
| Other Expenses | $616,889 | $615,550 | $394,324 | $343,701 | $359,135 | $512,186 | $7.31 |
| Total Expenses | $1,111,480 | $1,625,260 | $1,570,497 | $1,553,032 | $1,448,189 | $1,489,986 | $21.26 |
| | | | | | | | |
| Net Operating Income | $3,287,672 | $2,962,507 | $3,184,087 | $2,813,795 | $3,436,332 | $3,416,228 | $48.75 |
| Capital Expenditures | $0 | $0 | $0 | $0 | $0 | $14,015 | $0.20 |
| TI/LC(4) | $0 | $0 | $0 | $0 | $0 | $33,367 | $0.48 |
| Net Cash Flow | $3,287,672 | $2,962,507 | $3,184,087 | $2,813,795 | $3,436,332 | $3,368,846 | $48.08 |
| | | | | | | | |
| Occupancy %(1) | 100.0% | 98.0% | 98.0%(5) | 98.0% | 96.0% | 95.0% | |
| NOI DSCR | 1.78x | 1.60x | 1.72x | 1.52x | 1.86x | 1.85x | |
| NCF DSCR | 1.78x | 1.60x | 1.72x | 1.52x | 1.86x | 1.82x | |
| NOI Debt Yield | 7.6% | 6.8% | 7.3% | 6.5% | 7.9% | 7.9% | |
| NCF Debt Yield | 7.6% | 6.8% | 7.3% | 6.5% | 7.9% | 7.7% | |
| (1) | Gross Potential Rent and 8/31/2021 TTM Occupancy is based on the underwritten rent roll dated October 1, 2021. Information regarding Lemonade includes its fifth floor and second floor expansion space. The lease with respect to the fifth floor will commence on the later of May 15, 2022 and the date the landlord delivers the space to the tenant in accordance with the lease, and the lease with respect to the second floor will commence on the later of May 1, 2023 and the date that is 15 days after the landlord delivers the space to the tenant in accordance with the lease. All of such expansion space and related rent is underwritten. |
| (2) | Other Income is underwritten based on anticipated billboard rent from Vector Media Holding Company totaling $82,800 annually. Billboard rent is contingent on approval by the New York City Landmarks Preservation Commission of the use of the building for billboard space. The lender has structured the 5 Crosby Street Mortgage Loan with an upfront $1,000,000 holdback reserve related to the billboard rent. See “Escrows and Reserves—Debt Yield Holdback Reserve.” |
| (3) | Historically reimbursements were included in Gross Potential Rent. |
| (4) | TI/LC includes a 10% credit for the upfront TILC reserve of $1.25 million. |
| (5) | 2019 Occupancy is based on the rent roll dated February 1, 2020. |
Escrows and Reserves.
Real Estate Taxes – The 5 Crosby Street Mortgage Loan documents provide for an upfront deposit of $254,975 into a reserve for real estate taxes, and ongoing monthly deposits into a reserve for real estate taxes in an amount equal to 1/12 of the real estate taxes that the lender estimates will be payable during the next twelve months (initially, $36,425).
Insurance – The 5 Crosby Street Mortgage Loan documents provide for ongoing monthly deposits into a reserve for insurance premiums in an amount equal to 1/12 of the insurance premiums that the lender estimates will be payable for the renewal of coverage upon the expiration of the insurance policies; provided that such monthly deposits are not required so long as (i) no event of default is continuing, (ii) the liability and casualty insurance coverage for the 5 Crosby Street Property is included in a blanket policy approved by the lender in its reasonable discretion, and (iii) the borrower provides the lender with evidence of payment of the insurance premiums and renewals of the insurance policies, no later than ten days prior to the expiration of the current policy.
Replacement Reserve – The 5 Crosby Street Mortgage Loan documents provide for ongoing monthly deposits of approximately $1,168 into a reserve for approved capital expenditures, provided that the amount on deposit in such reserve (net of any outstanding disbursement requests) may not exceed approximately $28,030.
TI/LC Reserve – The 5 Crosby Street Mortgage Loan documents provide for an upfront reserve of $1,250,000 and ongoing monthly deposits of approximately $29,198 for future tenant improvement and leasing commission costs incurred by the borrower, provided that the amount on deposit in such reserve (net of any outstanding disbursement requests) may not exceed $2,050,000.
Rent Concession Reserve – The 5 Crosby Street Mortgage Loan documents provide for an upfront reserve of approximately $1,650,208 for rent credits, free rent periods, prepaid rent and/or rent abatements under existing leases for the tenants Lemonade and Smile to Go.
Lemonade Expansion Premises Reserve – The 5 Crosby Street Mortgage Loan documents provide for upfront reserves of (i) approximately $83,886 for gap rent for Lemonade’s fifth floor expansion premises, (ii) approximately $1,053,123 for gap rent for Lemonade’s second floor expansion premises, (iii) $250,000 for work to be performed for Lemonade’s fifth floor expansion premises and (iv) $1,000,000 for work to be performed for Lemonade’s second floor expansion premises.
Existing TI/LC Obligations Reserve – The 5 Crosby Street Mortgage Loan documents provide for an upfront reserve of $212,770 for a leasing commission payable by the borrower with respect to the Lemonade lease.
This is not a research report and was not prepared by any Underwriter’s research department. Please see additional important information and qualifications at the end of this Term Sheet. |
| | T-119 | |
| Mixed Use – Office/Retail | Loan #9 | Cut-off Date Balance: | | $43,500,000 |
| 5 Crosby Street | 5 Crosby Street | Cut-off Date LTV: | | 63.0% |
| New York, NY 10013 | | UW NCF DSCR: | | 1.82x |
| | | UW NOI Debt Yield: | | 7.9% |
Existing Tenant Buyout Reserve – The 5 Crosby Street Mortgage Loan documents provide for an upfront reserve of $70,000 to buy out the lease of Kworq on the second floor of the improvements at the 5 Crosby Street Property.
Debt Yield Holdback Reserve – The 5 Crosby Street Mortgage Loan documents provide for an upfront reserve of $1,000,000 (the “Holdback Funds”). The borrower will have the right to obtain the release of the Holdback Funds (or a portion thereof up to an amount which does not cause the debt yield, after giving effect to such release, to be less than 7.35% (the “Release Debt Yield”)), upon satisfaction of certain conditions on or prior to the date that is 15 months after the origination date (the “Paydown Date”), including but not limited to (i) no event of default exists under the 5 Crosby Street Mortgage Loan documents, (ii) the debt yield after the release, as determined by the lender, is equal to or greater than the Release Debt Yield, (iii) receipt by the lender of reasonably acceptable evidence that (a) the New York City Landmarks Preservation Commission (or applicable governing body) has approved the use of a portion of the exterior of the building at the 5 Crosby Street Property for the purpose of displaying one or more large-format advertisements (such approved area, the “Outdoor Billboard”), (b) the Outdoor Billboard (and the use thereof) is in conformance with all legal requirements, (c) the Outdoor Billboard has been leased to one or more tenants under a written lease or leases reasonably acceptable to the lender, each with a term of not less than five years and without termination options, (d) each tenant of the Outdoor Billboard is in possession of its portion of the Outdoor Billboard and has commenced paying full, unabated rent and there are no defaults beyond applicable notice, grace and cure periods under such tenant’s lease and (e) any work performed by the borrower in connection with government approval of the Outdoor Billboard and any leases of such Outdoor Billboard has been completed in accordance with applicable legal requirements and the loan documents, and (iv) the lender has received a certificate from the borrower stating (x) that the debt yield is greater than or equal to the Release Debt Yield (and providing calculations in support of such statement) and (y) to the effect set forth in clause (iii)(e) above. If any portion of the Holdback Funds are not released by the lender as described above on or prior to the Paydown Date, the Holdback Funds are required to be applied to the prepayment of the 5 Crosby Street Mortgage Loan, and the borrower is required to pay any yield maintenance premium then due in connection with such prepayment.
Lockbox and Cash Management. The 5 Crosby Street Mortgage Loan is structured with a hard lockbox and springing cash management. The borrower is required to direct all tenants to deposit rents directly into a lender-controlled lockbox account, and to deposit any rents received by the borrower or the property manager into such account within one business day of receipt. If no Cash Sweep Event Period (as defined below) exists, all funds in the lockbox account will be swept to an account designated by the borrower. Upon the first occurrence of a Cash Sweep Event Period, the lender is required to establish, and the borrower is required to cooperate with the cash management bank to establish, a cash management account controlled by the lender. During the continuance of a Cash Sweep Event Period, funds in the lockbox account are required to be swept on each business day to the cash management account, and, provided no event of default is continuing, all funds in the cash management account are required to be applied on each monthly payment date: (i) to make the monthly deposits into the real estate tax and insurance reserves, if any, as described above under “Escrows and Reserves,” (ii) to pay debt service on the 5 Crosby Street Mortgage Loan, (iii) to make the monthly deposits into the replacement reserve and TI/LC reserve, if any, as described above under “Escrows and Reserves,” (iv) to pay operating expenses set forth in the annual budget (which is required to be approved by the lender during a Cash Sweep Event Period) and lender-approved extraordinary expenses, and (v) to deposit any remainder into an excess cash flow reserve to be held as additional security for the 5 Crosby Street Mortgage Loan during the continuance of such Cash Sweep Event Period, provided that if the Cash Sweep Event Period is due solely to a Low DSCR Trigger Event or Lease Termination Event (as such terms are defined below) the lender is required to disburse funds from such account to pay operating expenses set forth in the approved annual budget and lender-approved extraordinary expenses. If no Cash Sweep Event Period is continuing, all funds in the excess cash flow reserve are required to be disbursed to the borrower.
“Cash Sweep Event Period” means a period:
| (i) | Commencing upon an event of default under the 5 Crosby Street Mortgage Loan documents and ending upon the cure (if applicable) of such event of default; |
| (ii) | Commencing upon the debt service coverage ratio on the 5 Crosby Street Mortgage Loan (assuming a 30 year amortization schedule) being less than 1.10x at the end of any calendar quarter (a “Low DSCR Trigger Event”), and ending upon the date the debt service coverage ratio on the 5 Crosby Street Mortgage Loan (assuming a 30 year amortization schedule) is at least 1.10x for the immediately preceding two calendar quarters; or |
| (iii) | Commencing upon the occurrence of a Specified Tenant Trigger Period (as defined below), and ending upon the expiration of such Specified Tenant Trigger Period. |
“Specified Tenant Trigger Period” means a period:
| (i) | Commencing upon the first to occur of (1) Lemonade (or a replacement tenant(s) for the space leased to Lemonade at origination) (“Specified Tenant”) failing to be in actual, physical possession of its space, failing to be open to the public for business during customary hours and/or “going dark” in its space, (2) Specified Tenant giving notice that it is terminating its lease for all or any portion of its space, (3) any termination or cancellation of any Specified Tenant’s lease (including, without limitation, rejection in any bankruptcy or similar insolvency proceeding) and/or such lease failing to otherwise be in full force and effect, (4) any bankruptcy or similar insolvency of Specified Tenant, (5) Specified Tenant failing to extend or renew its lease on or prior to the date that is 12 months prior to expiration in accordance with such lease and the loan documents for at least three years (such event, a “Lease Termination Event”) and (6) December 1, 2030, unless the earlier of (X) the stated expiration date of the Specified Tenant’s lease and (Y) the date on which any early termination option under such lease is freely exercisable, is not earlier than December 1, 2034; and |
| (ii) | Expiring upon the first to occur of the lender’s receipt of reasonably acceptable evidence (including, without limitation, an acceptable tenant estoppel certificate) of (1) the satisfaction of each of the following, as applicable (a) the applicable Specified Tenant is in actual, physical possession of its space, open to the public for business during customary hours and not “dark” in its space, (b) the applicable Specified Tenant has revoked or rescinded all lease termination or cancellation notices and has re-affirmed its lease as being in full force and effect, (c) in the event of a Lease Termination Event, the applicable Specified Tenant has renewed or extended its lease in accordance with such lease and the loan documents for at least three years, (d) with respect to any applicable bankruptcy or insolvency proceedings involving the applicable Specified Tenant or its lease, the applicable Specified Tenant is no longer insolvent or subject to any bankruptcy or insolvency proceedings and has affirmed its lease pursuant to final, non-appealable order of a court of competent jurisdiction and (e) the applicable Specified Tenant is paying full, unabated rent under its lease or (2) the borrower leasing the entire Specified Tenant’s space in accordance with the loan documents, and the applicable tenant being in actual, physical occupancy of, and open to the public for business in, its space and paying full unabated rent. Notwithstanding the foregoing, no Specified Tenant Trigger Period will be deemed to exist pursuant to clause (i)(1) of this definition to the extent |
This is not a research report and was not prepared by any Underwriter’s research department. Please see additional important information and qualifications at the end of this Term Sheet. |
| | T-120 | |
| Mixed Use – Office/Retail | Loan #9 | Cut-off Date Balance: | | $43,500,000 |
| 5 Crosby Street | 5 Crosby Street | Cut-off Date LTV: | | 63.0% |
| New York, NY 10013 | | UW NCF DSCR: | | 1.82x |
| | | UW NOI Debt Yield: | | 7.9% |
| | that clause (i)(1) of this definition is satisfied as a result of the Excused Vacancy Condition. “Excused Vacancy Condition”, as more fully defined in the 5 Crosby Street Mortgage Loan documents, means a tenant has “gone dark” or substantially reduced its operations at the 5 Crosby Street Property due to (i) governmental requirements or advisories or applicable law, or (ii) an official, formal written policy of the tenant and its parent entities providing that all stores and/or offices similar in nature to those at the 5 Crosby Street Property located in the same metropolitan area will be closed and shuttered for the health and safety of such tenant’s employees, in each case as a result of the COVID-19 pandemic or other similar pandemic or epidemic, provided that the Excused Vacancy Condition will not be satisfied if there is an event of default under the 5 Crosby Street Mortgage Loan or the applicable tenant has provided notice of its intention to terminate its lease. |
Additional Secured Indebtedness (not including Trade Debts). Not permitted.
Mezzanine Loan and Preferred Equity. Not permitted.
Release of Property. Not permitted.
Right of First Offer / Right of First Refusal. None.
Ground Lease. None.
Letter of Credit. None.
Terrorism Insurance. The borrower is required to obtain and maintain an “all risk” property insurance policy that covers acts of terrorism in an amount equal to the “full replacement cost” of the 5 Crosby Street Property together with business income insurance covering not less than the 12-month period commencing at the time of loss, together with an extended period of indemnity endorsement of up to six months. Notwithstanding the foregoing, for so long as the Terrorism Risk Insurance Act of 2002, as extended and modified by the Terrorism Risk Insurance Program Reauthorization Act of 2015 (“TRIPRA”) is in effect (including any extensions thereof or if another federal governmental program is in effect relating to “acts of terrorism” which provides substantially similar protections as TRIPRA), the lender is required to accept terrorism insurance which covers against “covered acts” as defined by TRIPRA (or such other program) as full compliance with the loan documents, but only in the event that TRIPRA (or such other program) continues to cover both domestic and foreign acts of terrorism. See “Risk Factors—Risks Relating to the Mortgage Loans—Terrorism Insurance May Not Be Available for All Mortgaged Properties” in the prospectus.
This is not a research report and was not prepared by any Underwriter’s research department. Please see additional important information and qualifications at the end of this Term Sheet. |
| | T-121 | |
| Office – CBD | Loan #10 | Cut-off Date Balance: | | $38,500,000 |
| 1 North Wacker Drive | One North Wacker | Cut-off Date LTV: | | 53.2% |
| Chicago, IL 60606 | | UW NCF DSCR: | | 2.96x |
| | | UW NOI Debt Yield: | | 8.9% |
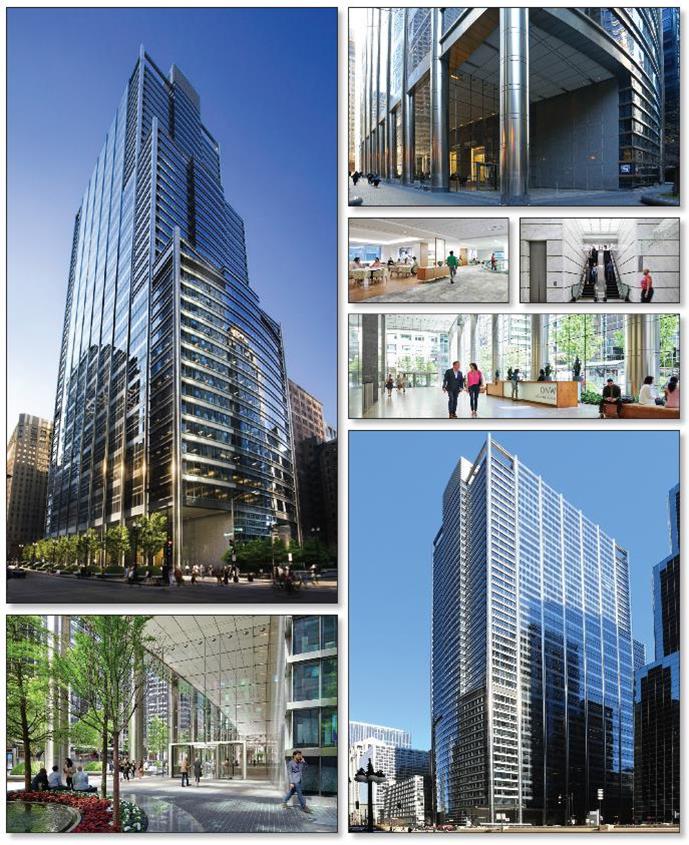
This is not a research report and was not prepared by any Underwriter’s research department. Please see additional important information and qualifications at the end of this Term Sheet. |
| | T-122 | |
| Office – CBD | Loan #10 | Cut-off Date Balance: | | $38,500,000 |
| 1 North Wacker Drive | One North Wacker | Cut-off Date LTV: | | 53.2% |
| Chicago, IL 60606 | | UW NCF DSCR: | | 2.96x |
| | | UW NOI Debt Yield: | | 8.9% |
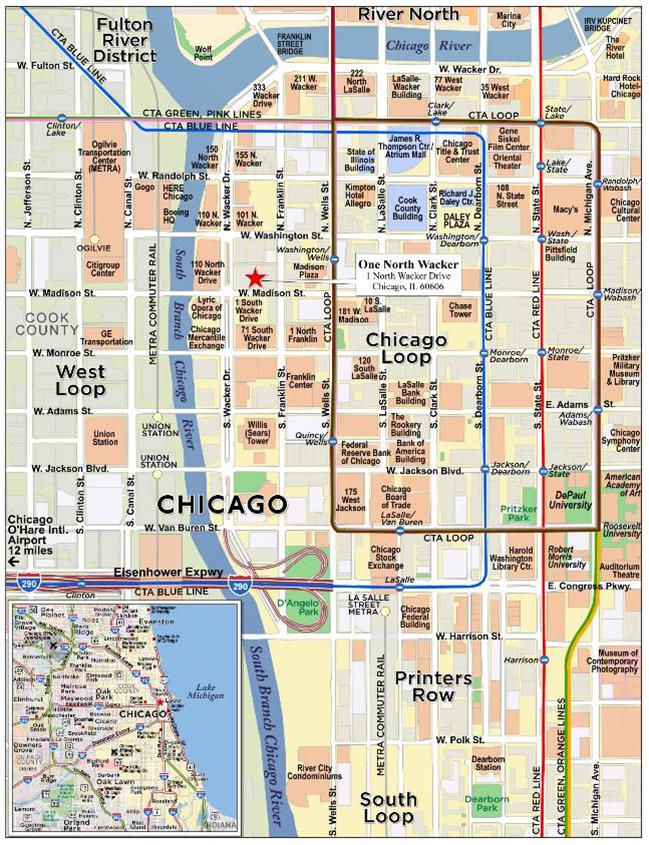
This is not a research report and was not prepared by any Underwriter’s research department. Please see additional important information and qualifications at the end of this Term Sheet. |
| | T-123 | |
| Mortgage Loan No. 10 – One North Wacker |
| Mortgage Loan Information | | Property Information |
| Mortgage Loan Seller: | BANA | | Single Asset/Portfolio: | Single Asset |
| Credit Assessment (DBRSM/Fitch/ Moody’s): | NR/NR/NR | | Location: | Chicago, IL 60606 |
| Original Balance(1): | $38,500,000 | | General Property Type: | Office |
| Cut-off Date Balance(1): | $38,500,000 | | Detailed Property Type: | CBD |
| % of Initial Pool Balance: | 3.2% | | Title Vesting: | Fee |
| Loan Purpose: | Refinance | | Year Built/Renovated: | 2001 / NAP |
| Borrower Sponsor: | The Irvine Company | | Size: | 1,412,035 SF |
| Guarantor: | 71 South Wacker Drive Holdings LLC | | Cut-off Date Balance Per SF(1): | $250 |
| Mortgage Rate: | 2.7185% | | Maturity Date Balance Per SF(1): | $250 |
| Note Date: | 9/10/2021 | | Property Manager: | Hines Interests Limited |
| First Payment Date: | 11/1/2021 | | | Partnership |
| Maturity Date: | 10/1/2031 | | | |
| Original Term to Maturity: | 120 months | | | |
| Original Amortization Term: | 0 months | | Underwriting and Financial Information(4) |
| IO Period: | 120 months | | UW NOI: | $31,276,370 |
| Seasoning: | 4 months | | UW NOI Debt Yield(1): | 8.9% |
| Prepayment Provisions: | L(28),DorYM1(87),O(5) | | UW NOI Debt Yield at Maturity(1): | 8.9% |
| Lockbox/Cash Mgmt Status: | Hard/Springing | | UW NCF DSCR(1): | 2.96x |
| Additional Debt Type(1): | Pari Passu | | Most Recent NOI: | $30,737,245 (7/31/2021 TTM) |
| Additional Debt Balance(1): | $314,500,000 | | 2nd Most Recent NOI: | $36,156,466 (6/30/2020) |
| Future Debt Permitted (Type): | No (NAP) | | 3rd Most Recent NOI: | $32,913,965 (6/30/2019) |
| Reserves(2) | | Most Recent Occupancy: | 81.3% (9/1/2021) |
| Type | Initial | Monthly | Cap | | 2nd Most Recent Occupancy: | 91.0% (6/30/2020) |
| RE Taxes: | $0 | Springing | NAP | | 3rd Most Recent Occupancy: | 87.0% (6/30/2019) |
| Insurance: | $0 | Springing | NAP | | Appraised Value (as of): | $664,000,000 (8/10/2021) |
| Replacement Reserve: | $0 | Springing | $299,964 | | Appraised Value Per SF: | $470 |
| TI/LC Reserve: | $0 | Springing | $5,600,000 | | Cut-off Date LTV Ratio(1): | 53.2% |
| Other Reserve(3): | $6,501,426 | $0 | NAP | | Maturity Date LTV Ratio(1): | 53.2% |
| Sources and Uses |
| Sources | Proceeds | % of Total | | Uses | Proceeds | % of Total |
| Whole Loan Amount(1): | $353,000,000 | 98.1% | | Loan Payoff: | $352,858,833 | 98.0% |
| Borrower Equity: | $6,961,961 | 1.9% | | Reserves: | $6,501,426 | 1.8% |
| | | | | Closing Costs: | $601,702 | 0.2% |
| Total Sources: | $359,961,961 | 100.0% | | Total Uses: | $359,961,961 | 100.0% |
| (1) | The One North Wacker Mortgage Loan (as defined below) is part of the One North Wacker Whole Loan (as defined below), which is evidenced by eight pari passu promissory notes with an aggregate principal balance of $353,000,000. The Cut-off Date Balance Per SF, Maturity Date Balance Per SF, UW NOI Debt Yield, UW NOI Debt Yield at Maturity, UW NCF DSCR, Cut-off Date LTV Ratio and Maturity Date LTV Ratio numbers presented above are based on the aggregate principal balance of the promissory notes comprising the One North Wacker Whole Loan. |
| (2) | See “Escrows and Reserves” below for further discussion of reserve information. The borrower is permitted to provide a letter of credit or guaranty in lieu of certain monthly reserves. |
| (3) | Other Reserve consists of a free rent reserve ($1,915,596) and a landlord obligations reserve ($4,585,830). |
| (4) | The novel coronavirus pandemic is an evolving situation and could impact the One North Wacker Whole Loan more severely than assumed in the underwriting of the One North Wacker Whole Loan and could adversely affect the NOI, NCF and occupancy information, as well as the appraised value and the DSCR, LTV and Debt Yield metrics presented above and herein. See "Risk Factors-—Risks Related to Market Conditions and Other External Factors—The Coronavirus Pandemic Has Adversely Affected the Global Economy and Will Likely Adversely Affect the Performance of the Mortgage Loans" in the prospectus. |
The Mortgage Loan. The tenth largest mortgage loan (the “One North Wacker Mortgage Loan”) is part of a whole loan (the “One North Wacker Whole Loan”) that is evidenced by eight pari passu promissory notes in the aggregate original principal amount of $353,000,000 and secured by a first priority fee mortgage encumbering a 1,412,035 SF Class A office tower located in Chicago, Illinois (the “One North Wacker Property”). The One North Wacker Mortgage Loan is evidenced by the non-controlling Notes A-2-2 and A-5 with an original principal amount of $38,500,000. The remaining promissory notes comprising the One North Wacker Whole Loan are summarized in the below table. The One North Wacker Whole Loan is being serviced pursuant to the pooling and servicing agreement for the BANK 2021-BNK36 securitization. See “Description of the Mortgage Pool—The Whole Loans—The Non-Serviced Pari Passu Whole Loans” and “Pooling and Servicing Agreement—Servicing of the Non-Serviced Mortgage Loans” in the prospectus.
This is not a research report and was not prepared by any Underwriter’s research department. Please see additional important information and qualifications at the end of this Term Sheet. |
| | T-124 | |
| Office – CBD | Loan #10 | Cut-off Date Balance: | | $38,500,000 |
| 1 North Wacker Drive | One North Wacker | Cut-off Date LTV: | | 53.2% |
| Chicago, IL 60606 | | UW NCF DSCR: | | 2.96x |
| | | UW NOI Debt Yield: | | 8.9% |
| One North Wacker Whole Loan Summary |
| Note | Original Balance | Cut-off Date Balance | Note Holder | Controlling Piece |
| A-1 | $122,000,000 | $122,000,000 | BANK 2021-BNK36 | Yes |
| A-2-1 | $72,000,000 | $72,000,000 | BANK 2021-BNK38 | No |
| A-2-2 | $23,000,000 | $23,000,000 | BANK 2022-BNK39 | No |
| A-3 | $80,000,000 | $80,000,000 | BANK 2021-BNK37 | No |
| A-4 | $20,500,000 | $20,500,000 | BANK 2021-BNK37 | No |
| A-5 | $15,500,000 | $15,500,000 | BANK 2022-BNK39 | No |
| A-6 | $15,000,000 | $15,000,000 | BANK 2021-BNK37 | No |
| A-7 | $5,000,000 | $5,000,000 | BANK 2021-BNK36 | No |
| Total | $353,000,000 | $353,000,000 | | |
The Borrower and the Borrower Sponsor. The borrower is One North Wacker LLC, a Delaware limited liability company and single purpose entity with two independent directors.
The borrower sponsor is The Irvine Company, a private real estate developer, operator and investor headquartered in Newport Beach, California. The Irvine Company acquired the One North Wacker Property in two transactions in 2011 and 2015 for a purchase price of approximately $539 million and, after capital expenditures and leasing costs, maintains a current cost basis of $805 million. The non-recourse carveout guarantor is 71 South Wacker Drive Holdings LLC, an affiliate of the borrower sponsor.
The Property. The One North Wacker Property is a 51-story, 1,412,035 SF, Class A, LEED Platinum certified office tower located in Chicago, Illinois. Originally constructed in 2001, the One North Wacker Property features a three-story glass atrium lobby, column-free floor plates with floor-to-ceiling glass windows, a landscaped plaza, an on-site sundry shop, a 9,597 SF conference center, a private fitness center and the One North Kitchen restaurant and bar. The One North Wacker Property also includes a two-story, 210-space below grade parking garage.
As of September 1, 2021, the One North Wacker Property was 81.3% leased to a granular rent roll of 48 tenants from a wide range of industries. The One North Wacker Property’s two largest tenants by NRA, Pricewaterhouse Coopers, LLP and UBS Americas Inc, are established, multinational corporations that have occupied the One North Wacker Property since its original construction in 2001. None of the remaining tenants contribute more than 9.5% to the underwritten base rent at the One North Wacker Property. Between 2013 and 2021, the property has maintained an average occupancy of 90%.
Major Tenants.
Pricewaterhouse Coopers, LLP (316,840 SF, 22.4% of NRA, 27.9% of underwritten base rent). Pricewaterhouse Coopers, LLP (“PWC”) is one of the world’s largest accounting firms and one of the largest privately held firms in the United States. PWC employs over 284,000 employees in 155 countries. PWC’s professional services include audit, tax and consulting in various industries. PWC occupies 316,840 SF at the One North Wacker Property on a lease that expires in October 2028, with three, five-year renewal options. PWC has the option to terminate its lease effective October 31, 2025, if notice is given by April 30, 2024 together with payment of a termination fee comprised of the unamortized amount of allowances, rent abatement, commissions and capital expenses, plus interest. PWC is reportedly currently seeking to sublease 70,082 SF (22.1% of its space). The One North Wacker Whole Loan is structured with a cash sweep period that will commence upon the earlier of (i) PWC’s failure to exercise its extension option for all of its leased space prior to the earlier of (x) the date that PWC is required to exercise such option under its lease and (y) the date that is 15 months prior to the then applicable expiration date of its lease; and (ii) PWC providing formal written notice that it relinquishes its lease renewal option with respect to all or a portion of its leased space. See “Lockbox and Cash Management” below.
UBS Americas Inc (138,445 SF, 9.8% of NRA, 14.9% of underwritten base rent). Founded in 1862 and headquartered in Zurich, Switzerland, UBS Group AG is an international financial services company offering a full range of wealth management and investment services. UBS Americas Inc, a subsidiary of UBS Group AG, has been a tenant at the One North Wacker Property since 2001 and currently occupies 138,445 SF. UBS Americas Inc recently renewed its lease through September 2032, which renewal will be effective October 1, 2022, and has two, five-year renewal options remaining. In connection with the ten-year renewal, UBS Americas Inc committed to a 2.5% annual rent increase and received $40.00 PSF in tenant improvement allowances from the landlord and five months of abated rent from October 1, 2022 through February 28, 2023.
Barnes & Thornburg LLP (95,475 SF, 6.8% of NRA, 9.5% of underwritten base rent). Barnes & Thornburg LLP is a national, full-service law firm that employs approximately 600 attorneys and operates 19 offices in the continental United States. Barnes & Thornburg LLP occupies 95,475 SF at the One North Wacker Property on a lease that expires in February 2030, with two, five-year renewal options. Barnes & Thornburg currently subleases 27,747 SF to Baker & Hostetler through April 30, 2024.
This is not a research report and was not prepared by any Underwriter’s research department. Please see additional important information and qualifications at the end of this Term Sheet. |
| | T-125 | |
| Office – CBD | Loan #10 | Cut-off Date Balance: | | $38,500,000 |
| 1 North Wacker Drive | One North Wacker | Cut-off Date LTV: | | 53.2% |
| Chicago, IL 60606 | | UW NCF DSCR: | | 2.96x |
| | | UW NOI Debt Yield: | | 8.9% |
The following table presents certain information relating to the tenancy at the One North Wacker Property:
| Tenant Summary(1) |
| Tenant Name | Credit Rating (Fitch/Moody's/S&P)(2) | Tenant SF | Approx. % of SF | Annual UW Rent | % of Total Annual UW Rent | Annual UW Rent PSF | Lease Exp. | Renewal Options | Term. Option (Y/N) |
| Pricewaterhouse Coopers, LLP | NR/NR/NR | 316,840 | 22.4% | $10,354,159 | 27.9% | $32.68 | 10/31/2028 | 3 x 5 yr | Y(3) |
| UBS Americas Inc(4) | NR/Aa3/A+ | 138,445 | 9.8% | $5,543,627 | 14.9% | $40.04 | 9/30/2032 | 2 x 5 yr | N |
| Barnes & Thornburg LLP(5) | NR/NR/NR | 95,475 | 6.8% | $3,528,008 | 9.5% | $36.95 | 2/28/2030 | 2 x 5 yr | N |
| Fitch Group, Inc. | NR/NR/NR | 65,392 | 4.6% | $1,923,828 | 5.2% | $29.42 | 12/31/2031 | 2 x 5 yr | Y(6) |
| The McQuade Financial Group(7) | NR/NR/NR | 50,342 | 3.6% | $2,043,885 | 5.5% | $40.60 | 8/31/2027 | 2 x 5 yr | N |
| Adams Street Partners, LLC | NR/NR/NR | 40,444 | 2.9% | $1,250,124 | 3.4% | $30.91 | 9/30/2030 | 2 x 5 yr | Y(8) |
| B.C. Ziegler and Company | NR/NR/NR | 32,445 | 2.3% | $966,960 | 2.6% | $29.80 | 7/31/2030 | 2 x 5 yr | Y(9) |
| Stifel, Nicolaus & Company | BBB/NR/BBB- | 29,477 | 2.1% | $840,095 | 2.3% | $28.50 | 6/30/2034 | NAP | Y(10) |
| The Irvine Company(11) | NR/NR/NR | 25,116 | 1.8% | $0 | 0.0% | $0.00 | Various(11) | NAP | N |
| Wipfli | NR/NR/NR | 24,359 | 1.7% | $682,052 | 1.8% | $28.00 | 11/30/2029 | 2 x 5 yr +1 x 10 yr | Y(12) |
| Subtotal/Wtd. Avg. | | 818,335 | 58.0% | $27,132,738 | 73.0% | $33.16 | | | |
| | | | | | | | | | |
| Other Tenants | | 330,251 | 23.4% | $10,032,085 | 27.0% | $30.38 | | | |
| Vacant Space | | 263,449 | 18.7% | $0 | 0.0% | $0.00 | | | |
| Total/Wtd. Avg. | | 1,412,035 | 100.0% | $37,164,823 | 100.0% | $32.36(13) | | | |
| (1) | Information is based on the underwritten rent roll dated September 1, 2021. |
| (2) | Certain ratings are those of the parent company whether or not the parent guarantees the lease. |
| (3) | Pricewaterhouse Coopers, LLP has the option to terminate its lease effective October 31, 2025, if notice is given by April 30, 2024 together with payment of a termination fee comprised of the unamortized amount of allowances, rent abatement, commissions and capital expenses, plus interest. |
| (4) | In connection with its lease renewal, UBS Americas Inc received five months of abated rent from October 1, 2022 through February 28, 2023. |
| (5) | Barnes & Thornburg currently subleases 27,747 SF to Baker & Hostetler through April 30, 2024. |
| (6) | Fitch Group, Inc. has the option to terminate its lease effective December 31, 2029, with 12 months’ notice and payment of a termination fee equal to $3,734,090. |
| (7) | The McQuade Financial Group currently subleases 3,456 SF to Waitzman Voigt, D’Aquila through August 31, 2027. |
| (8) | Adams Street Partners, LLC has the option to terminate its lease effective September 30, 2027, with 12 months’ notice and payment of a termination fee equal to $1,929,294. |
| (9) | B.C. Ziegler and Company has the option to terminate its lease effective July 31, 2025, with 12 months’ notice and payment of a termination fee equal to $3,618,303. |
| (10) | Stifel, Nicolaus & Company has the option to terminate its lease effective December 31, 2030, with 12 months’ notice and payment of a termination fee equal to $2,240,918. |
| (11) | The Irvine Company is sponsor affiliated. The Irvine Company occupies 17,379 SF expiring on July 31, 2024 and 7,737 SF expiring on October 31, 2026. |
| (12) | Wipfli has the option to terminate its lease effective May 31, 2026, with 12 months’ notice and payment of a termination fee equal to $2,032,058. |
| (13) | Wtd. Avg. Annual UW Rent PSF excludes vacant space. |
The following table presents certain information relating to the lease rollover schedule at the One North Wacker Property:
| Lease Rollover Schedule(1)(2) |
| Year | # of Leases Rolling | SF Rolling | UW Rent PSF Rolling | Approx. % of Total SF Rolling | Approx. Cumulative % of SF Rolling | Total UW Rent Rolling | Approx. % of Total Rent Rolling | Approx. Cumulative % of Total Rent Rolling |
| MTM / 2021 | 2 | 2,528 | $34.80 | 0.2% | 0.2% | $87,974 | 0.2% | 0.2% |
| 2022 | 6 | 33,154 | $29.63 | 2.3% | 2.5% | $982,472 | 2.6% | 2.9% |
| 2023 | 2 | 8,964 | $29.54 | 0.6% | 3.2% | $264,779 | 0.7% | 3.6% |
| 2024 | 9 | 66,083 | $24.53 | 4.7% | 7.8% | $1,621,042 | 4.4% | 8.0% |
| 2025 | 7 | 47,400 | $30.42 | 3.4% | 11.2% | $1,441,822 | 3.9% | 11.8% |
| 2026 | 5 | 56,331 | $27.31 | 4.0% | 15.2% | $1,538,595 | 4.1% | 16.0% |
| 2027 | 6 | 80,313 | $38.72 | 5.7% | 20.9% | $3,109,650 | 8.4% | 24.3% |
| 2028 | 7 | 363,072 | $32.55 | 25.7% | 46.6% | $11,817,770 | 31.8% | 56.1% |
| 2029 | 2 | 32,112 | $29.74 | 2.3% | 48.9% | $954,926 | 2.6% | 58.7% |
| 2030 | 8 | 203,448 | $34.59 | 14.4% | 63.3% | $7,038,243 | 18.9% | 77.6% |
| 2031 | 1 | 65,392 | $29.42 | 4.6% | 67.9% | $1,923,828 | 5.2% | 82.8% |
| 2032 & Beyond | 4 | 189,789 | $33.64 | 13.4% | 81.3% | $6,383,722 | 17.2% | 100.0% |
| Vacant | 0 | 263,449 | $0.00 | 18.7% | 100.0% | $0 | 0.0% | 100.0% |
| Total/Wtd. Avg. | 59 | 1,412,035 | $32.36(3) | 100.0% | | $37,164,823 | 100.0% | |
| (1) | Information is based on the underwritten rent roll dated September 1, 2021. |
| (2) | Certain tenants may have lease termination options that are exercisable prior to the originally stated expiration date of the related lease and are not considered in the rollover schedule. |
| (3) | Wtd. Avg. UW Rent PSF Rolling excludes vacant space. |
COVID-19 Update. As of September 9, 2021, the borrower sponsor had reported that the property was open and operating. The borrower sponsor granted COVID-19 related rent relief to two food-service tenants, which rent relief is no longer outstanding other than approximately $10,260 of deferred rent due to Munchies as of the closing date of the One North Wacker Whole Loan.
This is not a research report and was not prepared by any Underwriter’s research department. Please see additional important information and qualifications at the end of this Term Sheet. |
| | T-126 | |
| Office – CBD | Loan #10 | Cut-off Date Balance: | | $38,500,000 |
| 1 North Wacker Drive | One North Wacker | Cut-off Date LTV: | | 53.2% |
| Chicago, IL 60606 | | UW NCF DSCR: | | 2.96x |
| | | UW NOI Debt Yield: | | 8.9% |
The Market. The One North Wacker Property is situated at the northeast corner of Wacker Drive and Madison Street along the west side of North Franklin Street in the West Loop submarket of Chicago. The site is within walking distance of several public transportation options, including Chicago Transit Authority bus and “L” systems, Union Station and Ogilvie Transportation Center. Additionally, two interstates, I-90 and I-290, are accessible in close proximity to the One North Wacker Property.
The One North Wacker Property is located in the West Loop office submarket, within the Downtown Chicago office market. At the end of the second quarter of 2021, the West Loop office submarket was 84.9% Class A space, with inventory of 52,058 SF, a vacancy rate of 15.2% and average asking rent of $44.69 PSF. From 2016 to 2020, the Class A submarket added 6,332 SF, vacancy ranged from 11.75% to 13.63% and asking rent increased by 17.0%.
The One North Wacker Property benefits from the area’s population density. The estimated 2021 population within a 1-, 3- and 5-mile radius of the One North Wacker Property was 80,323, 375,627 and 850,278, respectively. The estimated 2021 average household income within the same radii was $165,806, $145,096 and $124,630, respectively.
The following table presents the comparable office properties to the One North Wacker Property:
| | Comparable Property Summary |
Property Name/Location | Year Built | Rentable Area (SF) | Occupancy | Asking Rent | Major Tenants |
One North Wacker 1 North Wacker Drive | 2001 | 1,412,035(1) | 81.3%(1) | $32.36(1) | Pricewaterhouse Coopers, LLP, UBS Americas Inc, Barnes & Thornburg LLP, Fitch Group, Inc., The McQuade Financial Group |
Bank of America Tower 110 North Wacker Drive | 2020 | 1,546,909 | 76.4% | - | Bank of America, Lincoln International, Regus 18, Perkins Coie |
River Point 444 West Lake Street | 2016 | 1,081,702 | 99.4% | $46.05 | McDermott Will and Emery, DLA Piper, LLP, Mead Johnson, Harrison Street Capital |
| 300 North LaSalle Street(2) | 2009 | 1,302,901 | 97.7% | $40.04 | Aviva USA Corporation, Hub International, PSP Capital Partners |
Mesirow Financial Building 353 North Clark Street | 2009 | 1,184,255 | 91.6% | - | Intercontinental Exchange, Inc., Insight Global LLC, American Board of Medical Specialties |
| 155 North Wacker Drive | 2009 | 1,152,953 | 92.3% | $38.34 | The Savo Group Ltd, Broker’s Risk Placement Service, Ogletree, Deakins, Nash |
Hyatt Center 71 South Wacker Drive(2) | 2005 | 1,687,710 | 95.9% | $30.16 | Mayer Brown, LLP, IBM Corporation, iManage, Towers Watson, Milliman |
One Eleven South Wacker 111 South Wacker Drive | 2004 | 1,213,322 | 95% | $28.79 | Houlihan Lokey, Harris Associates, RBC Wealth Management |
| | | | | | | |
Source: Appraisal
| (1) | Information is based on the underwritten rent roll dated September 1, 2021. |
| (2) | 300 North LaSalle Street and Hyatt Center are also owned by the borrower sponsor. |
The following table presents certain information relating to the appraisal’s market rent conclusion for the One North Wacker Property:
Market Rent Summary |
| Market Rent PSF | Lease Term (Mos.) | Rent Increase Projection | Lease Type |
| Low-Rise Office <10k SF | $26.00 | 60 | 2.5% per annum | NNN |
| Low-Rise Office >10k SF | $26.00 | 120 | 2.5% per annum | NNN |
| Mid-Rise Office <10k SF | $27.00 | 84 | 2.5% per annum | NNN |
| Mid-Rise Office >10k SF | $27.00 | 120 | 2.5% per annum | NNN |
| High-Rise Office <10k SF | $33.00 | 84 | 2.5% per annum | NNN |
| High-Rise Office >10k SF | $33.00 | 120 | 2.5% per annum | NNN |
| Retail | $50.00 | 120 | None | NNN |
This is not a research report and was not prepared by any Underwriter’s research department. Please see additional important information and qualifications at the end of this Term Sheet. |
| | T-127 | |
| Office – CBD | Loan #10 | Cut-off Date Balance: | | $38,500,000 |
| 1 North Wacker Drive | One North Wacker | Cut-off Date LTV: | | 53.2% |
| Chicago, IL 60606 | | UW NCF DSCR: | | 2.96x |
| | | UW NOI Debt Yield: | | 8.9% |
Operating History and Underwritten Net Cash Flow. The following table presents certain information relating to the historical operating performance and Underwritten Net Cash Flow at the One North Wacker Property:
| Cash Flow Analysis |
| | 2018(1) | 2019(1) | 2020(1) | 7/31/2021 TTM | UW | UW PSF |
| Gross Potential Rent(2) | $36,368,825 | $37,210,886 | $39,255,102 | $37,501,013 | $44,602,883 | $31.59 |
| Reimbursements | $27,554,940 | $26,297,908 | $28,082,091 | $28,380,399 | $39,387,779 | $27.89 |
| Parking Income | $885,253 | $854,306 | $687,047 | $262,917 | $450,597 | $0.32 |
| Other Income | $1,415,339 | $1,189,211 | $1,029,114 | $598,902 | $1,110,080 | $0.79 |
| (Vacancy & Concessions) | $0 | $0 | $0 | $0 | ($14,779,360) | ($10.47) |
| Effective Gross Income | $66,224,357 | $65,552,311 | $69,053,354 | $66,743,231 | $70,771,979 | $50.12 |
| | | | | | | |
| Real Estate Taxes | $20,814,040 | $20,212,039 | $20,586,725 | $24,744,256 | $25,436,918 | $18.01 |
| Insurance | $473,195 | $494,509 | $502,621 | $555,747 | $698,712 | $0.49 |
| Other Operating Expenses | $12,059,082 | $11,931,798 | $11,807,543 | $10,705,982 | $13,359,979 | $9.46 |
| Total Operating Expenses | $33,346,317 | $32,638,346 | $32,896,888 | $36,005,986 | $39,495,609 | $27.97 |
| | | | | | | |
| Net Operating Income | $32,878,040 | $32,913,965 | $36,156,466 | $30,737,245 | $31,276,370 | $22.15 |
| Replacement Reserves | $0 | $0 | $0 | $0 | $299,964 | $0.21 |
| TI/LC | $0 | $0 | $0 | $0 | $2,142,602 | $1.52 |
| Net Cash Flow | $32,878,040 | $32,913,965 | $36,156,466 | $30,737,245 | $28,833,804 | $20.42 |
| | | | | | | |
| Occupancy % | 86.0% | 87.0% | 91.0% | 81.3%(3) | 82.4%(4) | |
| NOI DSCR(5) | 3.38x | 3.38x | 3.72x | 3.16x | 3.21x | |
| NCF DSCR(5) | 3.38x | 3.38x | 3.72x | 3.16x | 2.96x | |
| NOI Debt Yield(5) | 9.3% | 9.3% | 10.2% | 8.7% | 8.9% | |
| NCF Debt Yield(5) | 9.3% | 9.3% | 10.2% | 8.7% | 8.2% | |
| (1) | Represents trailing 12 months as of June 30 for each respective year. |
| (2) | UW Gross Potential Rent includes contractual rent steps through October 1, 2022 ($751,146) and straight line averaged rent for investment grade rated tenants ($542,907). |
| (3) | Represents occupancy as of September 1, 2021. |
| (4) | Represents economic occupancy. |
| (5) | Debt service coverage ratios and debt yields are based on the One North Wacker Whole Loan. |
Escrows and Reserves.
Real Estate Taxes – The borrower is required to deposit monthly to a real estate tax reserve 1/12 of the annual estimated real estate taxes (i) during a Cash Trap Event Period (as defined below), (ii) during a DSCR Trigger Event Period (as defined below), or (iii) upon the borrower’s failure to provide the lender evidence of timely payment of taxes. Provided no event of default is continuing, in lieu of monthly deposits to the real estate tax reserve, the borrower is permitted to provide a letter of credit or a guaranty for such amounts from a borrower affiliate approved by the lender.
Insurance – The borrower is required to deposit monthly 1/12 of the annual estimated insurance premiums to the insurance reserve (i) during a Cash Trap Event Period, (ii) during a DSCR Trigger Event Period, or (iii) upon the borrower’s failure to provide the lender evidence of the renewal of a blanket policy to the extent the borrower maintains insurance pursuant to a blanket policy. Provided no event of default is continuing, in lieu of monthly deposits to the insurance reserve, the borrower is permitted to provide a letter of credit or a guaranty for such amounts from a borrower affiliate approved by the lender.
Replacement Reserve – During either a Cash Trap Event Period or a DSCR Trigger Event Period, the borrower is required to deposit monthly $24,997 to a reserve for replacements to the One North Wacker Property, subject to a cap of $299,964. Provided no event of default is continuing, in lieu of monthly deposits to the replacement reserve, the borrower is permitted to provide a letter of credit or a guaranty for such amounts from a borrower affiliate approved by the lender.
TI/LC Reserve – During a DSCR Trigger Event Period, the borrower is required to deposit monthly $178,550 for future tenant improvements and leasing commissions, subject to a cap of $5,600,000. Provided no event of default is continuing, in lieu of monthly deposits to the TI/LC reserve, the borrower is permitted to provide a letter of credit or a guaranty for such amounts from a borrower affiliate approved by the lender.
Free Rent Reserve – At loan origination, the borrower deposited $1,915,596 into a free rent reserve for outstanding obligations relating to The Alexander Group, Inc through April 1, 2022 and to Stifel, Nicolaus & Company through October 1, 2022. Funds in the free rent reserve account are required to be disbursed monthly as rent becomes due under each applicable lease.
Landlord Obligations Reserve – At loan origination, the borrower deposited $4,585,830 into a landlord obligation reserve for outstanding obligations to The Alexander Group, Inc, Stifel, Nicolaus & Company, Boyd Watterson Asset Management LLC and The Jordan Company, L.P. Upon request from the borrower, the lender will be required to disburse funds to reimburse the borrower for costs and expenses incurred in the performance of certain unfunded landlord obligations set forth in the One North Wacker Whole Loan documents.
This is not a research report and was not prepared by any Underwriter’s research department. Please see additional important information and qualifications at the end of this Term Sheet. |
| | T-128 | |
| Office – CBD | Loan #10 | Cut-off Date Balance: | | $38,500,000 |
| 1 North Wacker Drive | One North Wacker | Cut-off Date LTV: | | 53.2% |
| Chicago, IL 60606 | | UW NCF DSCR: | | 2.96x |
| | | UW NOI Debt Yield: | | 8.9% |
A “DSCR Trigger Event Period” will commence upon the date, tested quarterly, that the amortizing debt service coverage ratio is less than 1.15x and will expire on the date, tested quarterly, that the amortizing debt service coverage ratio is equal to or greater than 1.15x for two consecutive calendar quarters.
Lockbox and Cash Management. The One North Wacker Whole Loan is structured with a hard lockbox and springing cash management. All rents from the One North Wacker Property are required to be deposited directly to the lockbox account and, so long as a Cash Trap Event Period is not continuing, funds in the lockbox account will be transferred to the borrower’s operating account. During a Cash Trap Event Period, the borrower will not have access to the funds in the lockbox account and such funds will be transferred to the lender-controlled cash management account and disbursed according to the One North Wacker Whole Loan documents. During a Cash Trap Event Period, all excess cash is required to be held by the lender as additional security for the One North Wacker Whole Loan; provided that excess cash will be disbursed at the direction of the borrower if a PWC Excess Cash Flow Sweep Stop (as defined below) is in effect.
A “Cash Trap Event Period” will (a) commence upon (i) the occurrence of an event of default, (ii) PWC failing to exercise its extension option with respect to all of the PWC space prior to the earlier of (x) the date by which PWC is required to exercise such option pursuant to the lease and (y) 15 months prior to the then applicable lease expiration date, (iii) PWC providing notice that it is relinquishing its option to renew its lease with respect to all or a portion of the PWC space, (iv) PWC defaulting in the payment of rent for more than 45 days, or (v) PWC becoming the subject of any proceedings as a debtor and (b) terminate when (i) with respect to clause (a)(i), the lender accepts a cure of such event of default, (ii) with respect to clause (a)(ii), PWC exercises its renewal option or one or more replacement tenants lease its space, (iii) with respect to clause (a)(iii), one or more replacement tenants lease PWC’s space, (iv) with respect to clause (a)(iv), PWC has cured such default or one or more tenants lease its space, (v) with respect to clause (a)(v), PWC is no longer subject to any proceedings as a debtor or one or more tenants lease its space.
A “PWC Excess Cash Flow Sweep Stop” will be in effect if, as of any monthly payment date during a Cash Trap Event Period, (a) no event of default exists and (b) total undisbursed funds then on deposit in the excess cash flow account on such monthly payment date are not less than an amount equal to the product of (x) the applicable square footage impacted by PWC’s non-renewal, default or bankruptcy multiplied by (y) $30.
Additional Secured Indebtedness (not including trade debts). The One North Wacker Property also secures notes A-1, A-2-1, A-3, A-4, A-6 and A-7 (the “One North Wacker Non-Serviced Pari Passu Companion Loans”), which have a Cut-off Date principal balance of $314,500,000. The One North Wacker Non-Serviced Pari Passu Companion Loans accrue interest at the same rate as the One North Wacker Mortgage Loan. The One North Wacker Mortgage Loan is entitled to payments of principal and interest on a pro rata and pari passu basis with the One North Wacker Non-Serviced Pari Passu Companion Loans. The holders of the One North Wacker Mortgage Loan and the One North Wacker Non-Serviced Pari Passu Companion Loans have entered into a co-lender agreement which sets forth the allocation of collections on the One North Wacker Whole Loan. See “Description of the Mortgage Pool—The Whole Loans—The Non-Serviced Pari Passu Whole Loans” in the prospectus.
Mezzanine Loan and Preferred Equity. None.
Release of Property. None.
Right of First Offer/Right of First Refusal. None.
Ground Lease. None.
Letter of Credit. None.
Terrorism Insurance. The borrower is required to obtain and maintain property insurance and business interruption insurance for 24 months plus a 365-day extended period of indemnity. Such insurance is required to cover perils of terrorism and acts of terrorism; provided that the borrower is permitted to maintain terrorism coverage with a licensed captive insurance company that is affiliated with the borrower sponsor if certain conditions set forth in the related Whole Loan documents are satisfied, and if the Terrorism Risk Insurance Program Reauthorization Act of 2019 is not in effect, the borrowers will only be required to pay for terrorism insurance through such captive insurance company a maximum of two times the annual insurance premiums payable for the One North Wacker Property at the time with respect to the property and business interruption policies (excluding the terrorism, named storm and earthquake components of such premiums). See “Risk Factors—Risks Relating to the Mortgage Loans—Terrorism Insurance May Not Be Available for All Mortgaged Properties” in the prospectus.
This is not a research report and was not prepared by any Underwriter’s research department. Please see additional important information and qualifications at the end of this Term Sheet. |
| | T-129 | |
| Mortgage Loan No. 11 – Park Avenue Plaza |
| Mortgage Loan Information | | Mortgaged Property Information |
| Mortgage Loan Seller: | MSMCH | | Single Asset/Portfolio: | Single Asset |
| Credit Assessment (DBRSM/Fitch/Moody’s): | AAA/BBB-sf/Aaa | | Location: | New York, NY 10055 |
| Original Balance(1): | $35,000,000 | | General Property Type: | Office |
| Cut-off Date Balance(1): | $35,000,000 | | Detailed Property Type: | CBD |
| % of Initial Pool Balance: | 2.9% | | Title Vesting: | Fee |
| Loan Purpose: | Refinance | | Year Built/Renovated: | 1980/2015 |
| Borrower Sponsors: | Park Avenue Plaza Company L.P. | | Size: | 1,159,593 SF |
| | and The Sungate Park Avenue | | Cut-off Date Balance Per SF(1): | $292 |
| | Delaware Trust | | Maturity Date Balance Per SF(1): | $292 |
| Guarantor(2): | NAP | | Property Manager: | 55 East 52nd Street Management |
| Mortgage Rate: | 2.8375% | | | L.P. (borrower-related) |
| Note Date: | 10/8/2021 | | | |
| First Payment Date: | 12/5/2021 | | | |
| Maturity Date: | 11/5/2031 | | | |
| Original Term to Maturity: | 120 months | | | |
| Original Amortization Term: | 0 months | | Underwriting and Financial Information(4) |
| IO Period: | 120 months | | UW NOI(5): | $59,005,151 |
| Seasoning: | 3 months | | UW NOI Debt Yield(1): | 17.4% |
| Prepayment Provisions: | YM1(27),DorYM1(86),O(7) | | UW NOI Debt Yield at Maturity(1): | 17.4% |
| Lockbox/Cash Mgmt Status(3): | Hard/In Place | | UW NCF DSCR(1): | 5.84x |
| Additional Debt Type(1): | Pari Passu/ Subordinate/ Mezzanine | | Most Recent NOI(5): | $48,269,811 (6/30/2021 TTM) |
| Additional Debt Balance(1): | $304,170,000 / $120,830,000 / | | 2nd Most Recent NOI: | $37,355,736 (12/31/2020) |
| | $115,000,000 | | 3rd Most Recent NOI: | $43,307,357 (12/31/2019) |
| Future Debt Permitted (Type): | Yes (Mezzanine) | | Most Recent Occupancy: | 99.0% (10/1/2021) |
| Reserves | | 2nd Most Recent Occupancy: | 98.7% (12/31/2020) |
| Type | Initial | Monthly | Cap | | 3rd Most Recent Occupancy: | 98.5% (12/31/2019) |
| RE Taxes: | $8,606,069 | $2,238,800 | NAP | | Appraised Value (as of): | $1,063,000,000 (8/18/2021) |
| Insurance: | $0 | Springing | NAP | | Appraised Value per SF: | $917 |
| Capital Expenditures: | $0 | Springing | $463,837 | | Cut-off Date LTV Ratio(1): | 31.9% |
| TI/LC Reserve: | $43,543,892 | Springing | $6,000,000 | | Maturity Date LTV Ratio(1): | 31.9% |
| Sources and Uses |
| Sources | Proceeds | % of Total | | Uses | Proceeds | % of Total |
| Senior Loan Amount(1): | $339,170,000 | 58.8% | | Refinance Existing Debt: | $512,914,175 | 89.0% |
| Subordinate Loan Amount(1): | $120,830,000 | 21.0% | | Reserves: | $52,149,961 | 9.0% |
| Mezzanine Loan(1): | $115,000,000 | 20.0% | | Closing Costs: | $11,324,028 | 2.0% |
| Borrower Equity: | $1,388,164 | 0.20% | | | | |
| Total Sources: | $576,388,164 | 100.0% | | Total Uses: | $576,388,164 | 100.0% |
| (1) | The Park Avenue Plaza Mortgage Loan (as defined below) is part of the Park Avenue Plaza Whole Loan (as defined below), which is comprised of eight pari passu senior promissory notes with an aggregate original principal balance of $339,170,000 (collectively, the “Park Avenue Plaza Senior Loans”) and one promissory note that is subordinate to the Park Avenue Plaza Senior Loans with an original principal balance of $120,830,000 (the “Park Avenue Plaza Subordinate Companion Loan”, and together with the Park Avenue Plaza Senior Loans, the “Park Avenue Plaza Whole Loan”). The Cut-off Date Balance Per SF, Maturity Date Balance Per SF, UW NCF DSCR, UW NOI Debt Yield, UW NOI Debt Yield at Maturity, Cut-off Date LTV Ratio and Maturity Date LTV Ratio numbers presented above are based on the aggregate Cut-off Date principal balance of the Park Avenue Plaza Senior Loans, without regard to the Park Avenue Plaza Subordinate Companion Loan or the $115,000,000 mezzanine loan (the “Park Avenue Plaza Mezzanine Loan”). The Cut-off Date Balance Per SF, Maturity Date Balance Per SF, UW NCF DSCR, UW NOI Debt Yield, UW NOI Debt Yield at Maturity, Cut-off Date LTV Ratio and Maturity Date LTV Ratio numbers based on the entire Park Avenue Plaza Whole Loan are $396.69, $396.69, 4.31x, 12.8%, 12.8%, 43.3% and 43.3%, respectively. The Cut-off Date Balance Per SF, Maturity Date Balance Per SF, UW NCF DSCR, UW NOI Debt Yield, UW NOI Debt Yield at Maturity, Cut-off Date LTV Ratio and Maturity Date LTV Ratio numbers based on the combined balance of the Park Avenue Plaza Whole Loan and the Park Avenue Plaza Mezzanine Loan are $495.86, $495.86, 3.27x, 10.3%, 10.3%, 54.1% and 54.1%, respectively. |
| (2) | There is no non-recourse carveout guarantor or separate environmental indemnitor with respect to the Park Avenue Plaza Whole Loan. |
| (3) | A cash management period is in place from origination through December 31, 2024. After December 31, 2024, the Park Avenue Plaza Whole Loan will revert to a hard lockbox with springing cash management. |
| (4) | The novel coronavirus pandemic is an evolving situation and could impact the Park Avenue Plaza Whole Loan more severely than assumed in the underwriting of the Park Avenue Plaza Whole Loan and could adversely affect the NOI, NCF and occupancy information, as well as the appraised value and the DSCR, LTV and Debt Yield metrics presented above and herein. See “Risk Factors—Risks Related to Market Conditions and Other External Factors—The Coronavirus Pandemic Has Adversely Affected the Global Economy and Will Likely Adversely Affect the Performance of the Mortgage Loans” in the prospectus. |
| (5) | The increase in Net Operating Income from TTM NOI (6/30/2021) to UW NOI was due to the expiration of free rent periods. |
The Mortgage Loan. The eleventh largest mortgage loan (the “Park Avenue Plaza Mortgage Loan”) is part of the Park Avenue Plaza Whole Loan in the original principal balance of $460,000,000. The Park Avenue Plaza Whole Loan is secured by a first priority fee mortgage encumbering a 1,159,593 SF Class A office property in New York, New York (the “Park Avenue Plaza Property”). The Park Avenue Plaza Whole Loan is comprised of the Park Avenue Plaza Senior Loans, consisting of eight pari passu senior promissory notes in the aggregate original principal balance of $339,170,000, and the Park Avenue Plaza Subordinate Companion Loan, consisting of one subordinate promissory note in the original principal balance of $120,830,000. The non-controlling senior Note A-6 with an original principal balance of $35,000,000, represents the Park Avenue Plaza Mortgage Loan that will be included in the BANK 2022-BNK39 securitization trust. The controlling Note A-1 and non-controlling Note A-3, in the aggregate original principal balance of $159,170,000, and the Park Avenue Plaza Subordinate Companion Loan have been contributed to the MSC 2021-PLZA securitization trust. The non-controlling Note A-
This is not a research report and was not prepared by any Underwriter’s research department. Please see additional important information and qualifications at the end of this Term Sheet. |
| | T-130 | |
| Office – CBD | Loan #11 | Cut-off Date Balance: | | $35,000,000 |
| 55 East 52nd Street | Park Avenue Plaza | Cut-off Date LTV: | | 31.9% |
| New York, NY 10055 | | UW NCF DSCR: | | 5.84x |
| | | UW NOI Debt Yield: | | 17.4% |
2 and Note A-5, in the aggregate original principal balance of $75,000,000, have been contributed to the BANK 2021-BNK37 securitization trust. The non-controlling Note A-4, Note A-7, and Note A-8, with an aggregate original principal balance of $70,000,000, have been contributed to the BANK 2021-BNK38 securitization trust. The Park Avenue Plaza Whole Loan is being serviced pursuant to the trust and servicing agreement for the MSC 2021-PLZA securitization trust. See “Description of the Mortgage Pool—The Whole Loans—The Non-Serviced A/B Whole Loans —The Park Avenue Plaza Pari Passu A/B Whole Loan” and “Pooling and Servicing Agreement—Servicing of the Non-Serviced Mortgage Loans” in the prospectus.
| Park Avenue Plaza Whole Loan Summary |
| Notes | Original Balance | Cut-off Date Balance | Note Holder | Controlling Piece |
| A-1 | $139,170,000 | $139,170,000 | MSC 2021-PLZA | Yes |
| A-2 | $50,000,000 | $50,000,000 | BANK 2021-BNK37 | No |
| A-3 | $20,000,000 | $20,000,000 | MSC 2021-PLZA | No |
| A-4 | $10,000,000 | $10,000,000 | BANK 2021-BNK38 | No |
| A-5 | $25,000,000 | $25,000,000 | BANK 2021-BNK37 | No |
| A-6 | $35,000,000 | $35,000,000 | BANK 2022-BNK39 | No |
| A-7 | $10,000,000 | $10,000,000 | BANK 2021-BNK38 | No |
| A-8 | $50,000,000 | $50,000,000 | BANK 2021-BNK38 | No |
| B-1 | $120,830,000 | $120,830,000 | MSC 2021-PLZA | No |
| Total | $460,000,000 | $460,000,000 | | |
The Borrower and the Borrower Sponsors. The borrower is Park Avenue Plaza Owner LLC, a single-purpose Delaware limited liability company with two independent directors in its organizational structure. There is no non-recourse carveout guarantor or separate environmental indemnitor with respect to the Park Avenue Plaza Whole Loan. The borrower is indirectly owned and controlled by Park Avenue Plaza Company L.P. (the “Fisher Brothers Sponsor”) and The Sungate Park Avenue Delaware Trust (collectively with the Fisher Brothers Sponsor, the “Borrower Sponsor”). The Fisher Brothers Sponsor is owned by affiliates of Fisher Brothers, a family-owned, multi-generational real estate investment company with experience in owning and managing Class A office space, as well as developing both residential and commercial space, with a focus on urban markets on the East Coast. Founded in 1915, the firm has developed over 10 million SF of Class A office space. Fisher Brothers’ portfolio includes assets such as 1345 Avenue of the Americas, 605 Third Avenue, and 299 Park Avenue in Manhattan and Station Place in Washington, DC.
The Property. The Park Avenue Plaza Property is a Class A, 44-story office property totaling 1,159,593 SF located in New York, New York. The Park Avenue Plaza Property was built in 1980 on a 0.88 acre site by Fisher Brothers and has been continuously owned by the family since its construction. The Park Avenue Plaza Property is located on Park Avenue between 52nd and 53rd Street in the Park Avenue office submarket of Midtown Manhattan, just behind a four-floor landmarked building, the Racquet and Tennis Club. Park Avenue Plaza is a LEED Platinum, Energy Star-certified glass and steel office tower with a green façade and approximately 31,000 SF floor plates. Due to its position behind the Racquet and Tennis Club and south of Lever House, the Park Avenue Plaza Property benefits from unobstructed views up Park Avenue. Since January 2020, the Borrower Sponsor has invested approximately $38.8 million in capital expenditures at the Park Avenue Plaza Property, including tenant improvement work and lobby renovations. The Park Avenue Plaza Property is 99.0% leased as of October 1, 2021, by a number of financial services, fund management and consulting firms. Notable tenants at the Park Avenue Plaza Property include BlackRock, which is currently headquartered at the Park Avenue Plaza Property (32.3% of NRA, 29.6% of underwritten base rent), Evercore, which is headquartered at the Park Avenue Plaza Property (29.3% of NRA, 30.4% of underwritten base rent), Intercontinental Exchange (8.1% of NRA, 9.9% of underwritten base rent), Morgan Stanley (8.1% of NRA, 8.8% of underwritten base rent) and Duff & Phelps (7.8% of NRA, 8.5% of underwritten base rent). The Park Avenue Plaza Property benefits from many long-term leases, with an average lease term of 16.3 years. The Park Avenue Plaza Property has averaged over 99% occupancy dating back to 2011.
Major Tenants.
BlackRock (375,022 SF, 32.3% of NRA, 29.6% of underwritten rent). BlackRock is a public investment management firm that specializes in equity and fixed income products, as well as alternative and money market instruments, which it invests in on behalf of institutional and retail investors worldwide. The firm has offices in more than 30 countries and is currently headquartered at the Park Avenue Plaza Property. BlackRock has given notice that it will vacate all 375,022 SF of its space upon its lease expiration in April 2023 to relocate to its new global headquarters at 50 Hudson Yards. The borrower has executed a lease with Jennison Associates commencing upon BlackRock’s lease expiration to take 118,998 SF (floors 24 through 27) of BlackRock’s existing space with a lease expiration date of February 28, 2040. In addition, Morgan Stanley has executed a lease to take over 194,466 SF of the BlackRock space following BlackRock’s lease expiration as described under “Morgan Stanley” below.
Evercore (339,447 SF, 29.3% of NRA, 30.4% of underwritten rent). Evercore is an independent investment banking advisory firm founded in 1995. The company provides advisory services on merges and mergers and acquisitions, strategic shareholder advisory, restructurings and capital structure to corporate clients. Evercore has offices in 28 cities around the globe and generates approximately 75% of its revenue in the United States. Evercore is headquartered at the Park Avenue Plaza Property. Evercore has been a tenant at the Park Avenue Plaza Property since 2006 and has extended and expanded its space at the Park Avenue Plaza Property multiple times. As of October 1, 2021, Evercore occupies 339,447 SF (of which 119,484 SF of space is subleased from Aon through April 30, 2023) through December 31, 2035 and has one, five-year extension option remaining.
Intercontinental Exchange (94,119 SF, 8.1% of NRA, 9.9% of underwritten rent). Intercontinental Exchange (“ICE”) is a leading provider of regulated marketplaces and clearing services for global commodity trading, primarily of electricity, and agricultural commodities, metals, interest rates, equities, exchange traded funds, or ETFs, credit derivatives, digital assets, bonds and currencies, and also offers mortgage and technology services. It manages a handful of global over-the-counter (OTC) markets and regulated futures exchanges. The firm also owns ICE Futures Europe, a European energy futures and options platform, as well as NYSE Holdings (including the New York Stock Exchange). The company serves clients in over 150 countries. ICE's largest geographical market is the United States with nearly 65% of the company's revenue. ICE has been a tenant at the Park Avenue Plaza Property since 2012 and as of October 1, 2021, occupies 94,119 SF at the Park Avenue Plaza Property, through November 30, 2028. ICE has two, five-year extension options remaining.
This is not a research report and was not prepared by any Underwriter’s research department. Please see additional important information and qualifications at the end of this Term Sheet. |
| | T-131 | |
| Office – CBD | Loan #11 | Cut-off Date Balance: | | $35,000,000 |
| 55 East 52nd Street | Park Avenue Plaza | Cut-off Date LTV: | | 31.9% |
| New York, NY 10055 | | UW NCF DSCR: | | 5.84x |
| | | UW NOI Debt Yield: | | 17.4% |
Morgan Stanley (93,590 SF, 8.1% of NRA, 8.8% of underwritten rent). Morgan Stanley is a bank holding company, that provides diversified financial services on a worldwide basis. Morgan Stanley operates a global securities business which serves individual and institutional investors and investment banking clients. Morgan Stanley also operates a global asset management business and was a top five loan contributor to United States commercial mortgage-backed securities deals in 2020. Morgan Stanley has been a tenant at the Park Avenue Plaza Property since 2008 and has extended and expanded its space at the Park Avenue Plaza Property multiple times. As of October 1, 2021, Morgan Stanley occupies 93,590 SF through April 30, 2036. Morgan Stanley has the option to terminate its lease on July 31, 2033 with eighteen months prior notice (no later than January 31, 2032).
In addition, following the origination date, Morgan Stanley, an affiliate of the loan seller, executed a lease for an additional 288,056 SF at the Park Avenue Plaza Property, including 194,466 SF of the space being vacated by BlackRock in April 2023. Morgan Stanley is expected to take possession of the space in 2023, and is entitled to free rent through June 14, 2024. The new lease expires June 30, 2038. The additional Morgan Stanley lease has not been included in occupancy or underwritten rent. We cannot assure you that Morgan Stanley will take occupancy or start paying rent with respect to the new lease as expected or at all.
General Atlantic (91,666 SF, 7.9% of NRA, 7.6% of underwritten rent). General Atlantic is a private growth equity firm which offers portfolio management, financial planning and investment advisory services to customers worldwide. General Atlantic has been a tenant at the Park Avenue Plaza Property since 2007, as of October 1, 2021 occupies 91,666 SF (of which 60,464 SF is subleased from Aon through April 30, 2023) and has a lease expiration of July 31, 2039. General Atlantic has one, five-year extension option remaining.
The following table presents a summary regarding the tenants at the Park Avenue Plaza Property:
| Tenant Summary(1) |
| Tenant Name | Credit Ratings (Moody’s/S&P/ Fitch)(2) | Tenant SF | Approx. % of SF | Annual UW Rent | % of Total Annual UW Rent | Annual UW Rent PSF | Lease Expiration | Termination Option (Y/N) | Renewal Options |
| BlackRock(3) | NR/Aa3/AA- | 375,022 | 32.3% | $28,562,646 | 29.6% | $76.16 | 4/30/2023 | N | (3) |
| Evercore(4) | NR/NR/NR | 339,447 | 29.3% | $29,302,485 | 30.4% | $86.32 | 12/31/2035(4) | N | 1 x 5 yr |
| ICE | NR/A3/BBB+ | 94,119 | 8.1% | $9,561,684 | 9.9% | $101.59 | 11/30/2028 | N | 2 x 5 yr |
| Morgan Stanley(5) | A/A1/BBB+ | 93,590 | 8.1% | $8,516,690 | 8.8% | $91.00 | 4/30/2036 | Y(5) | (5) |
| General Atlantic(6) | NR/NR/NR | 91,666 | 7.9% | $7,286,396 | 7.6% | $79.49 | 7/31/2039(6) | N | 1 x 5 yr |
| Duff & Phelps | NR/NR/NR | 91,019 | 7.8% | $8,191,710 | 8.5% | $90.00 | 12/31/2035 | N | 1 x 5 yr |
| BBR Partners | NR/NR/NR | 30,345 | 2.6% | $2,579,325 | 2.7% | $85.00 | 6/30/2037 | N | 1 x 5 yr |
| Court Square(7) | NR/NR/NR | 29,545 | 2.5% | $2,127,240 | 2.2% | $72.00 | 4/30/2023(7) | N | None |
| Subtotal/Wtd. Avg. | | 1,144,753 | 98.7% | $96,128,176 | 99.6% | $83.97 | | | |
| | | | | | | | | | |
| Other Tenants | | 3,640 | 0.3% | $351,005 | 0.4% | $96.43 | | | |
| Vacant Space | | 11,200 | 1.0% | $0 | 0.0% | $0.00 | | | |
| Total/Wtd. Avg. | | 1,159,593 | 100.0% | $96,479,181 | 100.0% | $84.01(8) | | | |
| (1) | Information is based on the underwritten rent roll. |
| (2) | Certain ratings are those of the parent company whether or not the parent company guarantees the lease. |
| (3) | BlackRock has given notice that it will vacate its space upon its natural lease expiration of April 30, 2023. The borrower has already executed a lease with Jennison Associates commencing upon BlackRock’s lease expiration to take 118,998 SF (floors 24 through 27) of BlackRock’s existing 375,022 SF of space with a lease expiration date of February 28, 2040. Morgan Stanley has also executed a lease for a portion of the BlackRock space following BlackRock’s lease expiration as described under “Major Tenants” above. |
| (4) | Evercore commenced occupancy as a subtenant of Aon on floors 35 through 38 (119,484 SF) on July 25, 2006 with a lease expiration coterminous with Aon’s natural lease expiration of April 30, 2023. Evercore executed a lease as of July 1, 2018 with a commencement of May 1, 2023 (after Aon’s tenancy expires) and a lease expiration of December 31, 2035 (coterminous with the rest of its space). |
| (5) | Morgan Stanley has the right to extend the term of its lease for either one, five-year option or one, ten-year option. Morgan Stanley has the option to terminate its lease on July 31, 2033 with eighteen months prior notice (no later than January 31, 2032). Morgan Stanley has executed a lease for an additional 288,056 SF at the Mortgaged Property as described under “Major Tenants” above. The new lease is not included in occupancy or underwritten rent. We cannot assure you that Morgan Stanley will take occupancy or start paying rent with respect to the new lease as expected or at all. |
| (6) | General Atlantic commenced occupancy as a subtenant of Aon on floor 32 (30,293 SF) on August 1, 2007 and floor 33 (30,171 SF) on January 15, 2010 with a lease expiration date coterminous with Aon’s natural lease expiration of April 30, 2023. On July 8, 2016 General Atlantic executed a lease with a lease commencement on May 1, 2023 (after Aon’s tenancy expires) with a lease expiration on July 31, 2039 (coterminous with the rest of its space). |
| (7) | Court Square commenced occupancy as a subtenant of Aon on floor 34 (29,545 SF) on February 22, 2012 with a lease expiration coterminous with Aon’s natural lease expiration of April 30, 2023. Evercore executed a lease on July 1, 2018 with a commencement of May 1, 2023 (after Aon’s/Court Square’s tenancy expires) and a lease expiration of December 31, 2035 (coterminous with the rest of its space). |
| (8) | Wtd. Avg. Underwritten Base Rent Per SF and Underwritten Base Rent excludes vacant space. |
This is not a research report and was not prepared by any Underwriter’s research department. Please see additional important information and qualifications at the end of this Term Sheet. |
| | T-132 | |
| Office – CBD | Loan #11 | Cut-off Date Balance: | | $35,000,000 |
| 55 East 52nd Street | Park Avenue Plaza | Cut-off Date LTV: | | 31.9% |
| New York, NY 10055 | | UW NCF DSCR: | | 5.84x |
| | | UW NOI Debt Yield: | | 17.4% |
The following table presents certain information with respect to the lease rollover at the Park Avenue Plaza Property:
| Lease Rollover Schedule(1) |
| Year | # of Leases Rolling | SF Rolling | Annual UW Rent PSF Rolling | % of Total SF Rolling | Cumulative % of SF Rolling | Annual UW Rent Rolling | % of Annual UW Rent Rolling | Cumulative % of Annual UW Rent Rolling |
| 2022 | 0 | 0 | $0.00 | 0.0% | 0.0% | $0 | 0.0% | 0.0% |
| 2023(2) | 1 | 256,024 | $70.03 | 22.1% | 22.1% | $17,928,534 | 18.6% | 18.6% |
| 2024 | 1 | 1,369 | $146.10 | 0.1% | 22.2% | $200,004 | 0.2% | 18.8% |
| 2025 | 1 | 283 | $345.41 | 0.0% | 22.2% | $97,751 | 0.1% | 18.9% |
| 2026 | 0 | 0 | $0.00 | 0.0% | 22.2% | $0 | 0.0% | 18.9% |
| 2027 | 0 | 0 | $0.00 | 0.0% | 22.2% | $0 | 0.0% | 18.9% |
| 2028 | 1 | 94,119 | $101.59 | 8.1% | 30.3% | $9,561,684 | 9.9% | 28.8% |
| 2029 | 0 | 0 | $0.00 | 0.0% | 30.3% | $0 | 0.0% | 28.8% |
| 2030 | 0 | 0 | $0.00 | 0.0% | 30.3% | $0 | 0.0% | 28.8% |
| 2031 | 0 | 0 | $0.00 | 0.0% | 30.3% | $0 | 0.0% | 28.8% |
| 2032 & Beyond | 9 | 796,598 | $86.23 | 68.7% | 99.0% | $68,691,208 | 71.2% | 100.0% |
| Vacant | 0 | 11,200 | $0.00 | 1.0% | 100.0% | $0 | 0.0% | 100.0% |
| Total/Wtd. Avg. | 13 | 1,159,593 | $84.01(3) | 100.0% | | $96,479,181 | 100.0% | |
| (1) | Information is based on the underwritten rent roll. Certain tenants may have lease termination options that are exercisable prior to the stated expiration date of the subject lease or leases that are not considered in the lease expiration schedule. |
| (2) | 2023 rollover has been adjusted to reflect signed leases that will take effect upon BlackRock’s and Aon’s planned vacancy. Jennison Associates has signed a lease to take 118,998 SF of BlackRock’s space through February 2040. All of the remaining Aon subleased space currently occupied by General Atlantic (60,464 SF), Court Square (29,545 SF) and Evercore (119,484 SF) will convert to prime leases upon the existing tenants’ lease expiration dates as described above. 2023 rollover has not been adjusted for the new Morgan Stanley lease. |
| (3) | Wtd. Avg. Underwritten Base Rent Per SF and Underwritten Base Rent excludes vacant space. |
COVID-19 Update. As of January 1, 2021, the Borrower Sponsor has reported that the Park Avenue Plaza Property is open and operating and no lease modification or rent relief requests have been received and tenants have generally remained current on all rent and lease obligations.
The Market. The Park Avenue Plaza Property is located in New York, New York, within the Park Avenue submarket of the Manhattan office market. Access to the Park Avenue Plaza Property is provided by the Lexington Avenue - 53rd Street Subway Station, the Fifth Avenue – 53rd Street Subway station and Grand Central Terminal. According to the appraisal, as of the fourth quarter of 2021, the vacancy rate in the Park Avenue submarket was approximately 10.3%, with average asking rents of $103.52 per SF and inventory of approximately 26.0 million SF. According to the appraisal, as of the second quarter of 2021, the vacancy rate in the Manhattan office market was approximately 9.7%, with average asking rents of $73.89 per SF and inventory of approximately 468.0 million SF. According to the appraisal, the 2020 population within a quarter-, half- and one-mile radius of the Park Avenue Plaza Property was 3,418, 36,164 and 174,471, respectively. The 2020 median household income within the same quarter-, half- and one-mile radius was $188,743, $210,372 and $194,585, respectively.
The appraisal noted that the Manhattan office market continues to suffer from the effects of the COVID-19 pandemic. As of the second quarter of 2021, the availability rate increased for the fifth consecutive quarter, to 18.7%, a record high. The increases were consistent across the three major markets (Midtown, Midtown South and Downtown), with changes between 30 and 160 basis points. Seventeen contiguous large blocks of 100,000 SF and above drove the 140-basis-point increase from last quarter. Following the minimal leasing totals and increased availability, quarterly absorption closed at negative 9.5 million SF, a slight increase from the first quarter. Available sublease space increased by 1.1 million SF quarter-over-quarter and was up to 22.0 million SF by quarter’s end. Despite this increase, approximately 2.2 million SF of sublease space has been removed from the market since October 2020.
Overall asking rents in Manhattan fell in the second quarter of 2021 by 0.2% to $73.89 Per SF, representing the smallest quarter-over-quarter decrease since the onset of the pandemic. Rents remain 9.6% below pre-pandemic levels, reaching their lowest point in more than five years.
The following table presents certain information relating to the appraisal’s market rent conclusion for the Park Avenue Plaza Property:
| Market Rent Summary |
| Category | Market Rent (PSF) | Reimbursements | Annual Escalation | Tenant Improvements PSF (New/Renewal) | Free Rent (months)
(New/Renewal) | Lease Term | Leasing Commissions (New) | Leasing Commissions (Renewal) |
| Office (Floors Mezz-14) | $85.00 | Mod. Gross | 10.0% every 5 years | $125.00 / $93.75 | 15 / 7.5 | 15 Years | 3.50% | 1.75% |
| Office (Floors 15-21) | $87.00 | Mod. Gross | 10.0% every 5 years | $125.00 / $93.75 | 15 / 7.5 | 15 Years | 3.50% | 1.75% |
| Office (Floors 22-29) | $90.00 | Mod. Gross | 10.0% every 5 years | $125.00 / $93.75 | 15 / 7.5 | 15 Years | 3.50% | 1.75% |
| Office (Floors 30-38) | $95.00 | Mod. Gross | 10.0% every 5 years | $125.00 / $93.75 | 15 / 7.5 | 15 Years | 3.50% | 1.75% |
| Office (Floors 39-41) | $100.00 | Mod. Gross | 10.0% every 5 years | $125.00 / $93.75 | 15 / 7.5 | 15 Years | 3.50% | 1.75% |
| Office (Floors 42-44) | $110.00 | Mod. Gross | 10.0% every 5 years | $125.00 / $93.75 | 15 / 7.5 | 15 Years | 3.50% | 1.75% |
This is not a research report and was not prepared by any Underwriter’s research department. Please see additional important information and qualifications at the end of this Term Sheet. |
| | T-133 | |
| Office – CBD | Loan #11 | Cut-off Date Balance: | | $35,000,000 |
| 55 East 52nd Street | Park Avenue Plaza | Cut-off Date LTV: | | 31.9% |
| New York, NY 10055 | | UW NCF DSCR: | | 5.84x |
| | | UW NOI Debt Yield: | | 17.4% |
The following table presents recent leasing data at comparable office properties with respect to the Park Avenue Plaza Property:
| Comparable Leases Summary |
| Property/Location | Year Built | SF | Tenant Name | Tenant Size (SF) | Lease Date | Rent PSF | Lease Type |
Park Avenue Plaza Property(1) New York, NY | 1980 | 1,159,593 | BlackRock | 375,022 | Various | $76.16 | Mod. Gross |
399 Park Avenue New York, NY | 1961 | 1,576,437 | Blue Owl Capital | 25,096 | Aug. 2021 | $107.00 | Mod. Gross |
280 Park Avenue New York, NY | 1968 | 1,307,746 | GQG Partners | 8,996 | Jul. 2021 | $92.00 | Mod. Gross |
499 Park Avenue New York, NY | 1981 | 303,000 | Deutsche Bundesbank | 5,684 | Jun. 2021 | $110.00 | Mod. Gross |
888 Seventh Avenue New York, NY | 1969 | 908,299 | QVT Financial LP | 12,503 | Jun. 2021 | $110.00 | Mod. Gross |
280 Park Avenue New York, NY | 1968 | 1307,746 | Kyndryl | 49,751 | Jun. 2021 | $85.00 | Mod. Gross |
345 Park Avenue New York, NY | 1969 | 1,983,246 | Blackstone | 718,845 | Mar. 2021 | $85.00 | Mod. Gross |
40 West 57th Street New York, NY | 1972 | 779,017 | Lightyear Capital | 13,500 | Mar. 2021 | $92.50 | Mod. Gross |
399 Park Avenue New York, NY | 1961 | 1,576,437 | Capital Group Companies | 25,107 | Feb. 2021 | $107.00 | Mod. Gross |
Source: Appraisal, unless otherwise indicated.
| (1) | Information based on the underwritten rent roll other than year built. |
Operating History and Underwritten Net Cash Flow. The following table presents certain information relating to the historical operating performance and Underwritten Net Cash Flow at the Park Avenue Plaza Property:
| Cash Flow Analysis |
| | 2018 | 2019 | 2020 | 6/31/2021 TTM | UW | UW PSF |
| Gross Potential Rent | $81,458,357 | $86,426,028 | $96,255,809 | $97,592,006 | $96,479,181(1) | $83.20 |
| Reimbursements | $17,839,630 | $20,477,198 | $15,436,088 | $15,727,742 | $13,616,686 | $11.74 |
| Other Income | $3,958,645 | $5,432,930 | $5,353,738 | $4,985,339 | $3,453,995 | $2.98 |
| Free Rent | ($6,991,487) | ($11,418,703) | ($24,918,133) | ($15,862,263) | $0 | $0.00 |
| SL Rent | $0 | $0 | $0 | $0 | $817,867 | $0.71 |
| Net Rental Income | $96,265,145 | $100,917,453 | $92,127,502 | $102,442,824 | $114,367,729 | $98.63 |
| Less Vacancy & Credit Loss | $0 | $0 | $0 | $0 | ($1,147,008) | ($0.99) |
| Effective Gross Income | $96,265,145 | $100,917,453 | $92,127,502 | $102,442,824 | $113,220,721 | $97.64 |
| | | | | | | |
| Real Estate Taxes | $25,158,799 | $26,773,563 | $26,865,584 | $26,865,584 | $26,865,584 | $23.17 |
| Insurance | $972,416 | $963,034 | $1,064,621 | $1,118,388 | $1,118,388 | $0.96 |
| Management Fee | $914,148 | $929,585 | $950,006 | $957,443 | $1,000,000 | $0.86 |
| Other Operating Expenses | $28,159,565 | $28,943,914 | $25,891,555 | $25,231,598 | $25,231,598 | $21.76 |
| Total Operating Expenses | $55,204,928 | $57,610,096 | $54,771,766 | $54,173,013 | $54,215,570 | $46.75 |
| | | | | | | |
| Net Operating Income(2) | $41,060,217 | $43,307,357 | $37,355,736 | $48,269,811 | $59,005,151 | $50.88 |
| Replacement Reserves | $0 | $0 | $0 | $0 | $289,898 | $0.25 |
| TI/LC | $0 | $0 | $0 | $0 | $1,739,390 | $1.50 |
| Net Cash Flow | $41,060,217 | $43,307,357 | $37,355,736 | $48,269,811 | $56,975,864 | $49.13 |
| | | | | | | |
| Occupancy % | 96.1% | 98.5% | 98.7% | 99.0% | 98.0% | |
| NOI DSCR(3) | 4.21x | 4.44x | 3.83x | 4.95x | 6.05x | |
| NCF DSCR(3) | 4.21x | 4.44x | 3.83x | 4.95x | 5.84x | |
| NOI Debt Yield(3) | 12.1% | 12.8% | 11.0% | 14.2% | 17.4% | |
| NCF Debt Yield(3) | 12.1% | 12.8% | 11.0% | 14.2% | 16.8% | |
| (1) | Underwritten Gross Potential Rent Revenue is based on the rent roll as of October 1, 2021 and includes rent steps of $1,576 through September 30, 2022. |
| (2) | The increase in Net Operating Income from 6/31/2021 TTM to UW was due to the expiration of free rent periods. |
| | (3) | Based on the Park Avenue Plaza Senior Loans, without regard to the Park Avenue Plaza Subordinate Companion Loan or the Park Avenue Plaza Mezzanine Loan. |
This is not a research report and was not prepared by any Underwriter’s research department. Please see additional important information and qualifications at the end of this Term Sheet. |
| | T-134 | |
(THIS PAGE INTENTIONALLY LEFT BLANK)
This is not a research report and was not prepared by any Underwriter’s research department. Please see additional important information and qualifications at the end of this Term Sheet. |
| | T-135 | |
| Mortgage Loan No. 12 – Arcadia Fiesta |
| Mortgage Loan Information | | Property Information |
| Mortgage Loan Seller: | MSMCH | | Single Asset/Portfolio: | Single Asset |
| Credit Assessment (DBRSM/Fitch/Moody’s): | NR/NR/NR | | Location: | Phoenix, AZ 85016 |
| Original Balance: | $28,375,000 | | General Property Type: | Retail |
| Cut-off Date Balance: | $28,375,000 | | Detailed Property Type: | Anchored |
| % of Initial Pool Balance: | 2.4% | | Title Vesting: | Fee |
| Loan Purpose: | Acquisition | | Year Built/Renovated: | 1959/2016 |
| Borrower Sponsor: | John Cameron Allard | | Size: | 154,436 SF |
| Guarantor: | Hinton Financial Services, Inc. | | Cut-off Date Balance Per SF: | $184 |
| Mortgage Rate: | 3.5500% | | Maturity Date Balance Per SF: | $153 |
| Note Date: | 11/24/2021 | | Property Manager: | De Rito Property Management, |
| First Payment Date: | 1/1/2022 | | | L.L.C. |
| Maturity Date: | 12/1/2031 | | | |
| Original Term to Maturity: | 120 months | | Underwriting and Financial Information(1) |
| Original Amortization Term: | 360 months | | UW NOI: | $2,606,685 |
| IO Period: | 24 months | | UW NOI Debt Yield: | 9.2% |
| Seasoning: | 2 months | | UW NOI Debt Yield at Maturity: | 11.0% |
| Prepayment Provisions: | L(26),D(87),O(7) | | UW NCF DSCR: | 1.57x |
| Lockbox/Cash Mgmt Status: | Hard/Springing | | Most Recent NOI: | $2,513,466 (9/30/2021 TTM) |
| Additional Debt Type: | No | | 2nd Most Recent NOI: | $2,415,975 (12/31/2020) |
| Additional Debt Balance: | NAP | | 3rd Most Recent NOI: | $2,532,467 (12/31/2019) |
| Future Debt Permitted (Type): | No (NAP) | | Most Recent Occupancy: | 100.0% (10/31/2021) |
| Reserves | | 2nd Most Recent Occupancy: | 100.0% (12/31/2020) |
| Type | Initial | Monthly | Cap | | 3rd Most Recent Occupancy: | 100.0% (12/31/2019) |
| RE Taxes: | $37,946 | $37,946 | NAP | | Appraised Value (as of): | $41,800,000 (10/18/2021) |
| Insurance: | $9,174 | $4,587 | NAP | | Appraised Value Per SF: | $271 |
| Replacement Reserve: | $0 | $1,930 | NAP | | Cut-off Date LTV Ratio: | 67.9% |
| TI/LC Reserve: | $0 | $12,870 | $772,180 | | Maturity Date LTV Ratio: | 56.6% |
| Sources and Uses |
| Sources | Proceeds | % of Total | | Uses | Proceeds | % of Total |
| Loan Amount: | $28,375,000 | 67.1% | | Purchase Price: | $41,650,000 | 98.5% |
| Borrower Equity: | 13,896,374 | 32.9% | | Closing Costs: | $574,254 | 1.4% |
| | | | | Reserves: | $47,120 | 0.1% |
| Total Sources: | $42,271,374 | 100.0% | | Total Uses: | $42,271,374 | 100.0% |
| (1) | The novel coronavirus pandemic is an evolving situation and could impact the Arcadia Fiesta Mortgage Loan (as defined below) more severely than assumed in the underwriting of the Arcadia Fiesta Mortgage Loan and could adversely affect the NOI, NCF and occupancy information, as well as the appraised value and the DSCR, LTV and Debt Yield metrics presented above and herein. See "Risk Factors-—Risks Related to Market Conditions and Other External Factors—The Coronavirus Pandemic Has Adversely Affected the Global Economy and Will Likely Adversely Affect the Performance of the Mortgage Loans" in the prospectus. |
The Mortgage Loan. The twelfth largest mortgage loan (the “Arcadia Fiesta Mortgage Loan”) is evidenced by a promissory note in the original principal amount of $28,375,000 and secured by a first priority fee mortgage encumbering a 154,436 SF anchored retail shopping center located in Phoenix, Arizona (the “Arcadia Fiesta Property”).
The Borrower and the Borrower Sponsor. The borrower for the Arcadia Fiesta Mortgage Loan is Arcadia Fiesta LP, a single-purpose Arizona limited partnership with two independent directors in its organizational structure. The general partner of the borrower is Arcadia Fiesta GP, LLC, a single-purpose Delaware limited liability company. The borrower sponsor is John Cameron Allard, a Canadian citizen and former surgeon. John Cameron Allard currently owns and manages approximately 25 shopping centers with approximately 200 tenants in Canada and the United States. The non-recourse carveout guarantor is Hinton Financial Services, Inc., a Colorado corporation solely owned by John Cameron Allard. Hinton Financial Services, Inc. holds Mr. Allard’s United States assets, which, in addition to the Arcadia Fiesta Property, consist of a retail center in the Phoenix area and over 3,500 acres of undeveloped land.
The Property. The Arcadia Fiesta Property is a 154,436 SF retail shopping center on an approximately 12.9 acre site in Phoenix, Arizona. The Arcadia Fiesta Property is comprised of 20 units across five parcels, with one building per parcel. Originally built in 1959, the Arcadia Fiesta Property underwent a significant redevelopment and renovation in 2016. Although some of the shell structures were retained, the Arcadia Fiesta Property was effectively rebuilt with new storefronts, roof, HVAC, and interior build-out. One wing of shops was added, a new two-tenant pad building was constructed, and three ground lease parcels were developed for new fast food restaurant buildings. The Arcadia Fiesta Property is anchored by Ross Dress for Less (19.5% of NRA). As of October 31, 2021, the Arcadia Fiesta Property was 100.0% occupied by 20 tenants. The Arcadia Fiesta Property contains 781 parking spaces (5.1 spaces per 1,000 SF).
This is not a research report and was not prepared by any Underwriter’s research department. Please see additional important information and qualifications at the end of this Term Sheet. |
| | T-136 | |
| Retail – Anchored | Loan #12 | Cut-off Date Balance: | | $28,375,000 |
| 3131 East Indian School Road | Arcadia Fiesta | Cut-off Date LTV: | | 67.9% |
| Phoenix, AZ 85016 | | UW NCF DSCR: | | 1.57x |
| | | UW NOI Debt Yield: | | 9.2% |
Major Tenants.
Ross Dress for Less (30,190 SF, 19.5% of NRA, 14.0% of underwritten rent). Ross Dress for Less is a chain of off-price department stores that offers a selection of women’s and men’s apparel, accessories, footwear and furniture. Ross Dress for Less has more than 100,000 employees and 1,585 stores in 40 states, District of Columbia and Guam. Ross Dress for Less has been a tenant at the Arcadia Fiesta Property since 2016, has a lease expiration of January 31, 2027 and has four, 5-year renewal options remaining.
Salon Boutique (16,258 SF, 10.5% of NRA, 10.1% of underwritten rent). Salon Boutique offers luxury suite rentals for salon professionals, massage therapists, aestheticians, chiropractors, and wellness professionals. Established in 1999, Salon Boutique has 10 locations in Arizona, 10 locations in Texas, two locations in Nevada, and one location in Tennessee. Salon Boutique has been a tenant at the Arcadia Fiesta Property since 2017, has a lease expiration date of May 29, 2032, and has one 10-year renewal option remaining.
Jo-Ann Fabrics (16,000 SF, 10.4% of NRA, 7.4% of underwritten rent). Jo-Ann Fabrics operates as a specialty retailer of sewing, and arts and crafts products in the United States through retail stores, as well as online. Founded in 1943, as of April 1, 2021, Jo-Ann Fabrics operates 855 retail stores in 49 states. Jo-Ann Fabrics has been a tenant at the Arcadia Fiesta Property since 2018, has a lease expiration date of February 25, 2029 and has three 5-year renewal options remaining.
The Tile Shop (15,794 SF, 10.2% of NRA, 8.4% of underwritten rent). The Tile Shop is a specialty retailer of man-made and natural stone tiles, setting and maintenance materials, and related accessories in the United States. It offers marble, travertine, granite, quartz, sandstone, metal, glass, ceramic, and other tiles for sale under the Rush River and Fired Earth brands. The Tile Shop was founded in 1985, and as of March 11, 2021, operates in 143 stores in 31 states and the District of Columbia. The Tile Shop has been a tenant at the Arcadia Fiesta Property since 2017, has a lease expiration date of March 31, 2027, and has one 10-year renewal option remaining.
Ace Hardware (13,822 SF, 8.9% of NRA, 6.4% of underwritten rent). Ace Hardware is a large hardware retail cooperative, and the largest non-grocery American retail cooperative, offering a wide variety of paint, lawn and garden, tools and hardware products, as well as local niche services. Founded in 1924, Ace Hardware operates over 5,000 stores around the world, with a majority of the stores independently owned. Ace Hardware has been a tenant at the Arcadia Fiesta Property since 2001, has a lease expiration date of August 31, 2026, and has two 5-year renewal options remaining.
The following table presents a summary regarding the major tenants at the Arcadia Fiesta Property:
| Tenant Summary(1) |
| Tenant Name | Credit Rating (Fitch/Moody’s/ S&P)(2) | Tenant SF | Approx.% of SF | Annual UW Rent | Annual UW Rent PSF | App. % of Total Annual UW Rent | | | |
| Term. Option | Renewal Options | Lease Expiration |
| Ross Dress For Less | NR/A2/BBB+ | 30,190 | 19.5% | $407,565 | $13.50 | 14.0% | N | 4 x 5 yr | 1/31/2027 |
| Salon Boutique | NR/NR/NR | 16,258 | 10.5% | $292,644 | $18.00 | 10.1% | N | 1 x 10 yr | 5/29/2032 |
| Jo-Ann Fabrics | NR/NR/NR | 16,000 | 10.4% | $216,000 | $13.50 | 7.4% | N | 3 x 5 yr | 2/25/2029 |
| The Tile Shop | NR/NR/NR | 15,794 | 10.2% | $243,228 | $15.40 | 8.4% | N | 1 x 10 yr | 3/31/2027 |
| Ace Hardware | NR/NR/NR | 13,822 | 8.9% | $186,597 | $13.50 | 6.4% | N | 2 x 5 yr | 8/31/2026 |
| Subtotal/Wtd. Avg. | | 92,064 | 59.6% | $1,346,034 | $14.62 | 46.4% | | | |
| | | | | | | | | | |
| Other Tenants | | 62,372 | 40.4% | $1,556,607 | $24.96 | 53.6% | | | |
| Vacant Space | | 0 | 0.0% | $0 | $0.00 | 0.0% | | | |
| Total/Wtd. Avg. | | 154,436 | 100.0% | $2,902,640 | $18.80 | 100.0% | | | |
| (1) | Information is based on the underwritten rent roll as of October 31, 2021. |
| (2) | Certain ratings are those of the parent company whether or not the parent company guarantees the lease. |
This is not a research report and was not prepared by any Underwriter’s research department. Please see additional important information and qualifications at the end of this Term Sheet. |
| | T-137 | |
| Retail – Anchored | Loan #12 | Cut-off Date Balance: | | $28,375,000 |
| 3131 East Indian School Road | Arcadia Fiesta | Cut-off Date LTV: | | 67.9% |
| Phoenix, AZ 85016 | | UW NCF DSCR: | | 1.57x |
| | | UW NOI Debt Yield: | | 9.2% |
The following table presents certain information relating to the lease rollover at the Arcadia Fiesta Property:
| Lease Rollover Schedule(1) |
| Year | # of Leases Rolling | SF Rolling | Annual UW Rent PSF Rolling | Approx. % of Total SF Rolling | Approx. Cumulative % of SF Rolling | Total UW Rent Rolling | Approx. % of Total Rent Rolling | Approx. Cumulative % of Total Rent Rolling |
| 2022 | 0 | 0 | $0.00 | 0.0% | 0.0% | $0 | 0.0% | 0.0% |
| 2023 | 3 | 5,900 | $35.01 | 3.8% | 3.8% | $206,548 | 7.1% | 7.1% |
| 2024 | 0 | 0 | $0.00 | 0.0% | 3.8% | $0 | 0.0% | 7.1% |
| 2025 | 0 | 0 | $0.00 | 0.0% | 3.8% | $0 | 0.0% | 7.1% |
| 2026 | 2 | 17,742 | $19.48 | 11.5% | 15.3% | $345,649 | 11.9% | 19.0% |
| 2027 | 10 | 77,273 | $18.42 | 50.0% | 65.3% | $1,423,093 | 49.0% | 68.1% |
| 2028 | 0 | 0 | $0.00 | 0.0% | 65.3% | $0 | 0.0% | 68.1% |
| 2029 | 1 | 16,000 | $13.50 | 10.4% | 75.7% | $216,000 | 7.4% | 75.5% |
| 2030 | 1 | 13,822 | $13.50 | 8.9% | 84.7% | $186,597 | 6.4% | 81.9% |
| 2031 | 0 | 0 | $0.00 | 0.0% | 84.7% | $0 | 0.0% | 81.9% |
| 2032 & Beyond | 3 | 23,699 | $22.14 | 15.4% | 100.0% | $524,753 | 18.1% | 100.0% |
| Vacant | 0 | 0 | $0.00 | 0.0% | 100.0% | $0 | 0.0% | 100.0% |
| Total/Wtd. Avg. | 20 | 154,436 | $18.80 | 100.0% | | $2,902,640 | 100.0% | |
| (1) | Information is based on the underwritten rent roll as of October 31, 2021. |
COVID-19 Update. Three tenants received abated or deferred rent relief in 2020 due to the COVID 19 pandemic. Anytime Fitness received deferred rent in April and May 2020 to be repaid in monthly installments with 1.5% interest from June 1, 2020 through December 31, 2021. Tuesday Morning and The Tile Shop each received 3 months deferred rent in 2020. As of December 28, 2021, deferred rent has been paid in full by all three tenants.
The Market. The Arcadia Fiesta Property is located in Phoenix, Arizona, in the Central Scottsdale submarket, within the Phoenix-Mesa-Scottsdale MSA retail market. The Arcadia Fiesta Property is located at the intersection of two major thoroughfares, and is within two miles of the Camelback office corridor and upscale “Arcadia” and “Camelback Corridor” residential neighborhoods. According to a third party report, as of November 12, 2021, the Central Scottsdale submarket had approximately 16.6 million SF of retail space inventory, overall vacancy in the submarket was approximately 4.8%, and asking rent was $29.44 PSF. According to the appraisal, the 2021 estimated population within a one-, three-, and five-mile radius of the Arcadia Fiesta Property was 22,586, 161,132 and 307,564, respectively. The 2021 estimated average household income with a one-, three- and five-mile radius of the Arcadia Fiesta Property was $82,621, $88,180 and $93,585, respectively.
The following table presents recent leasing data for junior anchor retail tenants at comparable retail properties with respect to the Arcadia Fiesta Property:
| Comparable Junior Anchor Retail Lease Summary |
| Property/Location | Tenant Name | Occupancy | Lease Size (SF) | Lease Date | Rent PSF | Lease Term (Mos.) |
Arcadia Fiesta Property(1) Phoenix, AZ | Ross Dress For Less | 100.0% | 30,190 | Dec. 2016 | $13.50 | 120 |
New River Goodwill New River, AZ | Goodwill | 100.0% | 24,932 | Apr. 2018 | $15.54 | 180 |
Former Fry’s Phoenix, AZ | Michael’s | 100.0% | 25,324 | July 2018 | $13.50 | 120 |
Val Vista Towne Center Gilbert, AZ | Goodwill | 90.0% | 23,848 | Sep. 2020 | $15.00 | 120 |
Superstition Gateway Mesa, AZ | Marshalls | 95.0% | 23,000 | Oct. 2020 | $13.00 | 120 |
BevMo Glendale, AZ | BevMo | 100.0% | 14,552 | Dec. 2020 | $17.00 | 36 |
Goodwill Center Gilbert, AZ | Hole 9 Yards | 70.0% | 20,625 | July 2021 | $12.50 | 84 |
Source: Appraisal, unless otherwise noted.
| (1) | Information is based on the underwritten rent roll as of October 31, 2021. |
This is not a research report and was not prepared by any Underwriter’s research department. Please see additional important information and qualifications at the end of this Term Sheet. |
| | T-138 | |
| Retail – Anchored | Loan #12 | Cut-off Date Balance: | | $28,375,000 |
| 3131 East Indian School Road | Arcadia Fiesta | Cut-off Date LTV: | | 67.9% |
| Phoenix, AZ 85016 | | UW NCF DSCR: | | 1.57x |
| | | UW NOI Debt Yield: | | 9.2% |
The following table presents information relating to comparable sales pertaining to the Arcadia Fiesta Property identified by the appraisal:
| Comparable Sales |
| Property/Location | Rentable Area (SF) | Year Built/ Renovated | Occupancy | Sale Date | Sale Price | Sale Price (PSF) |
Arcadia Fiesta Property 3131 East Indian School Road Phoenix, AZ | 154,436(1) | 1959 / 2016 | 100.0%(1) | Oct-2021 | $41,650,000 | $269.69 |
Camelback & Miller Plaza 4370-4408 North Miller Road Scottsdale, AZ | 137,577 | 1978 / 1993 | 92.0% | Jul-2019 | $33,350,000 | $242.41 |
Crossroads Towne Center – Chandler 2840 East Germann Road Chandler, AZ | 254,109 | 2005 / NAP | 99.0% | Jan-2020 | $61,800,000 | $243.20 |
Oracle Wetmore 4380 North Oracle Road Tucson, AZ | 150,170 | 2005 / NAP | 97.0% | Feb-2021 | $38,025,000 | $253.21 |
Camelback Colonnade 1949 East Camelback Road Phoenix, AZ | 642,118 | 1961 / 1995 | 89.0% | June-2021 | $162,500,000 | $253.07 |
Wilmot Plaza 6301-6351 East Broadway Boulevard Tucson, AZ | 124,521 | 1958 / 2015 | 95.0% | Sep-2021 | $42,500,000 | $341.31 |
Source: Appraisal, unless otherwise noted.
| (1) | Information is based on the underwritten rent roll as of October 31, 2021. |
The following table presents certain information relating to the appraisal’s market rent conclusion for the Arcadia Fiesta Property:
| Market Rent Summary |
| | Market Rent PSF | Lease Term Mos. | Rent Escalations | Lease Type |
| Shops Space: | $36.25 | 60 | 3.0% per annum | NNN |
| Pad Shops Space: | $53.96 | 120 | 10.0% every 5 years | NNN |
| Junior Anchor Space: | $13.63 | 120 | 10.0% every 5 years | NNN |
| Salon Suites Tenant Space: | $13.63 | 120 | 10.0% every 5 years | NNN |
| Anytime Fitness Space: | $13.29 | 120 | 10.0% every 5 years | NNN |
| QSR Ground Lease Space: | $35.16 | 120 | 10.0% every 5 years | NNN |
| Kiosk Ground Lease Space: | $128.31 | 120 | 10.0% every 5 years | NNN |
This is not a research report and was not prepared by any Underwriter’s research department. Please see additional important information and qualifications at the end of this Term Sheet. |
| | T-139 | |
| Retail – Anchored | Loan #12 | Cut-off Date Balance: | | $28,375,000 |
| 3131 East Indian School Road | Arcadia Fiesta | Cut-off Date LTV: | | 67.9% |
| Phoenix, AZ 85016 | | UW NCF DSCR: | | 1.57x |
| | | UW NOI Debt Yield: | | 9.2% |
Operating History and Underwritten Net Cash Flow. The following table presents certain information relating to the historical operating performance and the Underwritten Net Cash Flow at the Arcadia Fiesta Property:
| Cash Flow Analysis |
| | 2017 | 2018 | 2019 | 2020 | 9/30/2021 TTM | UW | UW PSF |
| Gross Potential Rent(1) | $1,564,575 | $2,437,250 | $2,668,406 | $2,670,579 | $2,684,994 | $2,902,640 | $18.80 |
| Reimbursements | $351,290 | $698,065 | $774,506 | $839,649 | $843,457 | $956,941 | $6.20 |
| Other Income | $11,131 | $5,612 | $1,607 | $3,674 | $9,249 | $9,167 | $0.06 |
| Discounts Concessions | $0 | $0 | $0 | ($113,455) | $0 | $0 | $0.00 |
| Less Vacancy & Credit Loss | $0 | $0 | $0 | $0 | $0 | ($192,979) | ($1.25) |
| Effective Gross Income | $1,926,996 | $3,140,927 | $3,444,519 | $3,400,447 | $3,537,700 | $3,675,769 | $23.80 |
| | | | | | | | |
| Real Estate Taxes | $426,677 | $414,807 | $430,607 | $433,659 | $442,172 | $463,308 | $3.00 |
| Insurance | $21,587 | $21,666 | $23,886 | $28,195 | $32,650 | $54,000 | $0.35 |
| Other Expenses | $374,894 | $466,056 | $457,560 | $522,617 | $549,413 | $551,776 | $3.57 |
| Total Expenses | $823,159 | $902,530 | $912,052 | $984,472 | $1,024,234 | $1,069,084 | $6.92 |
| | | | | | | | |
| Net Operating Income | $1,103,838 | $2,238,398 | $2,532,467 | $2,415,975 | $2,513,466 | $2,606,685 | $16.88 |
| Capital Expenditures | $0 | $0 | $0 | $0 | $0 | $22,574 | $0.15 |
| TI/LC | $0 | $0 | $0 | $0 | $0 | $168,335 | $1.09 |
| Net Cash Flow | $1,103,838 | $2,238,398 | $2,532,467 | $2,415,975 | $2,513,466 | $2,415,776 | $15.64 |
| | | | | | | | |
| Occupancy % | 86.6% | 100.0% | 100.0% | 100.0% | 100.0%(2) | 95.0%(3) | |
| NOI DSCR | 0.72x | 1.45x | 1.65x | 1.57x | 1.63x | 1.69x | |
| NCF DSCR | 0.72x | 1.45x | 1.65x | 1.57x | 1.63x | 1.57x | |
| NOI Debt Yield | 3.9% | 7.9% | 8.9% | 8.5% | 8.9% | 9.2% | |
| NCF Debt Yield | 3.9% | 7.9% | 8.9% | 8.5% | 8.9% | 8.5% | |
| (1) | Increases in Gross Potential Rent from 2017 to 2018, and 2018 to 2019 were primarily due to the Arcadia Fiesta Property undergoing significant renovations in 2016. After the renovations, the Arcadia Fiesta Property achieved an 85.0% occupancy in July 2017, a 90.0% occupancy in March 2018, and 100.0% occupancy by October 2018. As such, 2017 does not represent a stabilized year of cash flows. Rent Income increased 59.0% between 2017 and 2018. |
| (2) | 9/30/2021 TTM Occupancy is based off the October 31, 2021 rent roll. |
| (3) | Represents economic occupancy. |
This is not a research report and was not prepared by any Underwriter’s research department. Please see additional important information and qualifications at the end of this Term Sheet. |
| | T-140 | |
(THIS PAGE INTENTIONALLY LEFT BLANK)
This is not a research report and was not prepared by any Underwriter’s research department. Please see additional important information and qualifications at the end of this Term Sheet. |
| | T-141 | |
| Mortgage Loan No. 13 – Spanish Ridge Portfolio |
| Mortgage Loan Information | | Property Information |
| Mortgage Loan Seller: | WFB | | Single Asset/Portfolio: | Portfolio |
| Credit Assessment (DBRSM/Fitch/Moody’s): | NR/NR/NR | | Location: | Las Vegas, NV 89148 |
| Original Balance: | $27,000,000 | | General Property Type: | Office |
| Cut-off Date Balance: | $26,918,567 | | Detailed Property Type: | Suburban |
| % of Initial Pool Balance: | 2.2% | | Title Vesting: | Fee |
| Loan Purpose: | Refinance | | Year Built/Renovated: | Various/2017 |
| Borrower Sponsors: | Ryan Tedder and Keith Kantrowitz | | Size: | 112,549 SF |
| Guarantors: | Ryan Tedder and Keith Kantrowitz | | Cut-off Date Balance PSF: | $239 |
| Mortgage Rate: | 3.4040% | | Maturity Date Balance PSF: | $187 |
| Note Date: | 12/10/2021 | | Property Manager: | SKR Real Estate Services |
| First Payment Date: | 1/11/2022 | | | |
| Maturity Date: | 12/11/2031 | | | |
| Original Term to Maturity: | 120 months | | |
| Original Amortization Term: | 360 months | | |
| IO Period: | 0 months | | Underwriting and Financial Information(2) |
| Seasoning: | 2 months | | UW NOI: | $2,548,264 |
| Prepayment Provisions: | L(26),D(90),O(4) | | UW NOI Debt Yield: | 9.5% |
| Lockbox/Cash Mgmt Status: | Soft/Springing | | UW NOI Debt Yield at Maturity: | 12.1% |
| Additional Debt Type: | No | | UW NCF DSCR: | 1.66x |
| Additional Debt Balance: | NAP | | Most Recent NOI: | $2,544,577 (9/30/2021 TTM) |
| Future Debt Permitted (Type): | No (NAP) | | 2nd Most Recent NOI(3): | $2,566,477 (12/31/2020) |
| Reserves | | 3rd Most Recent NOI(3): | $1,836,634 (12/31/2019) |
| Type | Initial | Monthly | Cap | | Most Recent Occupancy: | 100.0% (10/1/2021) |
| RE Taxes: | $9,123 | $10,644 | NAP | | 2nd Most Recent Occupancy(4): | 100.0% (12/31/2020) |
| Insurance: | $5,634 | $4,209 | NAP | | 3rd Most Recent Occupancy(4): | 77.8% (12/31/2019) |
| Replacement Reserve: | $374,902 | $1,876 | NAP | | Appraised Value (as of): | $39,400,000 (10/27/2021) |
| Leasing Reserve: | $1,000,000 | $11,724 | NAP | | Appraised Value PSF: | $350 |
| Rent Concession Reserve(1): | $435,653 | $0 | NAP | | Cut-off Date LTV Ratio: | 68.3% |
| Existing TI/LC Reserve: | $153,100 | $0 | NAP | | Maturity Date LTV Ratio: | 53.4% |
| | | | | | | |
| Sources and Uses |
| Sources | Proceeds | % of Total | | Uses | Proceeds | % of Total |
| Loan Amount: | $27,000,000 | 100.0% | | Loan Payoff: | $18,332,081 | 67.9% |
| | | | | Return of Equity: | $6,271,371 | 23.2% |
| | | | | Reserves: | $1,978,412 | 7.3% |
| | | | | Closing Costs: | $418,136 | 1.5% |
| Total Sources: | $27,000,000 | 100.0% | | Total Uses: | $27,000,000 | 100.0% |
| (1) | The Spanish Ridge Portfolio Mortgage Loan documents require an upfront deposit for outstanding free rent of $435,653 for Harmony Homes ($24,152), Paul Powell Law Firm ($88,674), Signature Real Estate Group ($36,744), Celsius Network Limited ($161,158), and Self Insured Solutions ($124,926). |
| (2) | The novel coronavirus pandemic is an evolving situation and could impact the Spanish Ridge Portfolio Mortgage Loan more severely than assumed in the underwriting of the Spanish Ridge Portfolio Mortgage Loan and could adversely affect the NOI, NCF and occupancy information, as well as the appraised value and the DSCR, LTV and Debt Yield metrics presented above and herein. See "Risk Factors-—Risks Related to Market Conditions and Other External Factors—The Coronavirus Pandemic Has Adversely Affected the Global Economy and Will Likely Adversely Affect the Performance of the Mortgage Loans" in the prospectus. |
| (3) | The increase in Net Operating Income between 3rd Most Recent and 2nd Most Recent is primarily attributable to rent abatements for Paul Powell Law Firm in 2019, and increased base rent for Meadows Bank occurring with its October 2019 renewal. |
| (4) | Information obtained from the borrower. |
The Mortgage Loan. The thirteenth largest mortgage loan (the “Spanish Ridge Mortgage Loan”) is evidenced by a promissory note in the original principal amount of $27,000,000 and secured by the fee interest in a two property suburban office portfolio located in Las Vegas, Nevada (the “Spanish Ridge Portfolio Property”).
The Borrowers and the Borrower Sponsors. The borrowing entity consists of three tenants in common, MRK Spanish Ridge LLC, PREH Spanish Ridge, LLC, and New Spanish Ridge, LLC, each a Delaware limited liability company and single purpose entity with one independent director each. The borrower sponsors and non-recourse guarantors are Ryan Tedder and Keith Kantrowitz.
The Properties. The Spanish Ridge Portfolio Property consists of two office buildings totaling 112,549 SF located in Las Vegas, Nevada. Built in 2006 and 2007, the properties were renovated in 2017 to include new landscaping, exterior lighting, lobby areas, and approximately $3.5 million in tenant improvement allowances. The Spanish Ridge Portfolio Property is situated on two adjacent parcels totaling 6.48-acres and contains 563 parking spaces, equating to 5.0 spaces per 1,000 SF. As of October 1, 2021, the buildings are 100% occupied by six tenants, with the largest tenant representing 27.2% of the underwritten base rent.
This is not a research report and was not prepared by any Underwriter’s research department. Please see additional important information and qualifications at the end of this Term Sheet. |
| | T-142 | |
| Office - Suburban | Loan #13 | Cut-off Date Balance: | | $26,918,567 |
| Various | Spanish Ridge Portfolio | Cut-off Date LTV: | | 68.3% |
| Las Vegas, NV 89148 | | UW NCF DSCR: | | 1.66x |
| | | UW NOI Debt Yield: | | 9.5% |
The borrowers purchased the Spanish Ridge Portfolio Property for $32.5 million in June 2021 in an off-market transaction. While the property was 100% occupied at the time of the sale, two tenants representing 29.0% of the net rentable area were known to be vacating (the related space has since been re-tenanted). One of the sellers, through the New Spanish Ridge, LLC entity, retained a 20% ownership interest in the property.
8912 Spanish Ridge
The 8912 Spanish Ridge Property is a three-story, 70,911 SF office building, constructed in 2006 and renovated in 2017. The building is situated on a 4.23-acre site and as of October 1, 2021 was 100% occupied by four tenants.
8918 Spanish Ridge
The 8918 Spanish Ridge Park Property is a two-story, 41,638 SF office building, constructed in 2007 and renovated in 2017. The building is situated on a 2.25-acre site and as of October 1, 2021 was 100% occupied by two tenants.
The following table presents certain information relating to the Spanish Ridge Portfolio Property:
| Spanish Ridge Property Summary |
| Property Name – Location | Year Built/Renovated | Total NRA (SF) | Occupancy | U/W NCF | % Total U/W NCF |
8912 Spanish Ridge Avenue Las Vegas, NV | 2006/2017 | 70,911 | 100.0% | $1,593,439 | 66.6% |
8918 Spanish Ridge Avenue Las Vegas, NV | 2007/2017 | 41,638 | 100.0% | $798,382 | 33.4% |
| Total | | 112,549 | | $2,391,820 | 100.0% |
| Source: Appraisal | | | | | |
COVID-19 Update. As of January 7, 2022, the Spanish Ridge Portfolio Property was fully open and operational and no lease modification or rent relief requests have been received.
Major Tenants.
Celsius Network Limited (24,948 SF; 22.2% of NRA; 27.2% of underwritten base rent; June 30, 2027 lease expiration). Celsius Network Limited (“Celsius”) is a centralized platform for crypto assets offering deposits and collateralized loans. Founded in 2017, the company has approximately 486 employees. The platform supports over 40 assets and has a community that has grown to over 1 million users in three years. In October 2021, Celsius completed a $400 million fundraising round let by WestCap, and a Canada–based global investment group, which pushed Celsius’ valuation to approximately $3 billion. The tenant is located at the 8912 Spanish Ridge Property and has two, 5-year extension option with 12 months’ notice at 3% above the base rent at the time of the renewal.
Celsius posted a letter of credit issued by Signature Bank in the amount of $1,541,786, totaling approximately 23 months of underwritten rent. So long as there is no event of default under the lease, the letter of credit will be reduced to $770,893 on June 1, 2024 and to $0 on June 2, 2025. The letter of credit is freely transferable to any lender with a first lien security interest in the Spanish Ridge Portfolio Property.
Maikeru Corp dba Meadows Bank (25,633 SF; 22.8% of NRA; 22.2% of underwritten base rent; July 1, 2025 lease expiration). Maikeru Corp dba Meadows Bank (“Meadows Bank”) was founded in 2008 and is a full service community bank. The tenant has branches in Las Vegas, Henderson, Reno and Pahrump, NV and Phoenix, AZ. In addition, Meadows Bank has production offices in Salt Lake City, UT, Denver, CO, Sacramento, CA Dallas, TX, Ridgefield, WA and Portland, OR. Meadows Bank has been a tenant at the property since 2014 and most recently renewed in 2019. The tenant is located at the 8912 Spanish Ridge Property and has one, 5-year extension option with 9 months’ notice at fair market rent.
Paul Powell Law Firm (20,500 SF; 18.2% of NRA; 17.7% of underwritten base rent; July 31, 2025 lease expiration). Founded in 2013, Paul Powell Law Firm specializes in personal injury law with a focus on vehicle related accidents and slip and fall accidents. The company has 11 attorneys and two offices, one at the subject property and one in Chicago. Paul Powell Law Firm has been a tenant at the property since 2019. The tenant is located at the 8918 Spanish Ridge Property and has one, 5-year extension option with 12 months’ notice at fair market rent, but in no event less than the base rent during the immediately preceding period.
This is not a research report and was not prepared by any Underwriter’s research department. Please see additional important information and qualifications at the end of this Term Sheet. |
| | T-143 | |
| Office - Suburban | Loan #13 | Cut-off Date Balance: | | $26,918,567 |
| Various | Spanish Ridge Portfolio | Cut-off Date LTV: | | 68.3% |
| Las Vegas, NV 89148 | | UW NCF DSCR: | | 1.66x |
| | | UW NOI Debt Yield: | | 9.5% |
The following table presents certain information relating to the tenancy at the Spanish Ridge Portfolio Property:
| Tenant Summary |
| Tenant Name | Credit Rating (Fitch/Moody's/ S&P) | Tenant SF | Approx. % of SF | Annual UW Rent(1) | % of Total Annual UW Rent | Annual UW Rent PSF(1) | | Renewal Options |
| Termination Option (Y/N) | Lease Expiration |
| Major Tenants | | | | | | | | | |
| Celsius Network Limited | NR/NR/NR | 24,948 | 22.2% | $808,315 | 27.2% | $32.40 | N | 6/30/2027 | 2 x 5 yr |
| Maikeru Corp dba Meadows Bank | NR/NR/NR | 25,633 | 22.8% | $659,184 | 22.2% | $25.72 | N | 7/1/2025 | 1 x 5 yr |
| Paul Powell Law Firm | NR/NR/NR | 20,500 | 18.2% | $524,181 | 17.7% | $25.57 | N | 7/31/2025 | 1 x 5 yr |
| Total/Wtd. Avg. | | 71,081 | 63.2% | $1,991,680 | 67.1% | $28.02 | | | |
| | | | | | | | | | |
| Non-Major Tenants | | 41,468 | 36.8% | $977,695 | 32.9% | $23.58 | | | |
| Occupied Collateral Total | | 112,549 | 100.0% | $2,969,376 | 100.0% | $26.38 | | | |
| Vacant Space | | 0 | 0.0% | | | | | | |
| Total/Wtd. Avg. | | 112,549 | 100.0% | | | | | | |
| (1) | Annual UW Rent and Annual UW Rent PSF include contractual rent steps through August 2022 totaling $39,358. |
The following table presents certain information relating to the lease rollover schedule at the Spanish Ridge Portfolio Property:
| Lease Rollover Schedule(1)(2) |
| Year | # of Leases Rolling | SF Rolling | UW Rent PSF Rolling | Approx. % of Total SF Rolling | Approx. Cumulative % of SF Rolling | Total UW Rent Rolling | Approx. % of Total Rent Rolling | Approx. Cumulative % of Total Rent Rolling |
| 2022 | 0 | 0 | $0.00 | 0.0% | 0.0% | $0 | 0.0% | 0.0% |
| 2023 | 0 | 0 | $0.00 | 0.0% | 0.0% | $0 | 0.0% | 0.0% |
| 2024 | 1 | 12,675 | $22.87 | 11.3% | 11.3% | $289,827 | 9.8% | 9.8% |
| 2025 | 2 | 46,133 | $25.65 | 41.0% | 52.3% | $1,183,365 | 39.9% | 49.6% |
| 2026 | 0 | 0 | $0.00 | 0.0% | 52.3% | $0 | 0.0% | 49.6% |
| 2027 | 1 | 24,948 | $32.40 | 22.2% | 74.4% | $808,315 | 27.2% | 76.8% |
| 2028 | 1 | 21,138 | $21.80 | 18.8% | 93.2% | $460,791 | 15.5% | 92.4% |
| 2029 | 0 | 0 | $0.00 | 0.0% | 93.2% | $0 | 0.0% | 92.4% |
| 2030 | 0 | 0 | $0.00 | 0.0% | 93.2% | $0 | 0.0% | 92.4% |
| 2031 | 1 | 7,655 | $29.66 | 6.8% | 100.0% | $227,078 | 7.6% | 100.0% |
| 2032 & Beyond | 0 | 0 | $0.00 | 0.0% | 100.0% | $0 | 0.0% | 100.0% |
| Vacant | 0 | 0 | $0.00 | 0.0% | 100.0% | $0 | 0.0% | 100.0% |
| Total/Wtd. Avg. | 6 | 112,549 | $26.38 | 100.0% | | $2,969,376 | 100.0% | |
| (1) | Information is based on the underwritten rent roll. |
| (2) | Certain tenants may have lease termination options that are exercisable prior to the originally stated expiration date of the related lease and are not considered in the rollover schedule. |
The Market. The Spanish Ridge Portfolio Property is located within an area known as Summerlin South, approximately 15 miles from downtown Las Vegas, Nevada. The property is located approximately 7.3 miles from Downtown Summerlin, which is an 106-acre development totaling 1.6 million SF of fashion, entertainment, dining and office uses that was completed in 2014. The area also includes various golf courses, parks, schools, an extensive trail system, and Summerlin Hospital. According to the appraisal, Summerlin is consistently ranked as one of the ten best-selling master planned communities within the nation. The Spanish Ridge Portfolio Property is adjacent to the 215 Beltway with the closest exit being approximately 0.7 miles from the property. In addition, the Harry Reid International Airport is located 11.8 miles to the east. According the appraisal, within a one, three- and five-mile radius of the Spanish Ridge Portfolio Property, the 2021 average household income was approximately $90,151, $87,818, and $92,806, respectively; and within the same radii, the 2021 estimated population was 23,498, 161,882, and 347,414, respectively.
According to the appraisal, the property is situated within the Southwest Las Vegas office submarket. As of second quarter 2021, the submarket reported total inventory of approximately 12.6 million SF, with a 10.0% vacancy rate and average asking rent of $26.24 PSF, gross. The appraisal included 11 lease comparables from five buildings ranging from $18.00 to $38.00 PSF and concluded to a market rent of $30.00 PSF, net.
This is not a research report and was not prepared by any Underwriter’s research department. Please see additional important information and qualifications at the end of this Term Sheet. |
| | T-144 | |
| Office - Suburban | Loan #13 | Cut-off Date Balance: | | $26,918,567 |
| Various | Spanish Ridge Portfolio | Cut-off Date LTV: | | 68.3% |
| Las Vegas, NV 89148 | | UW NCF DSCR: | | 1.66x |
| | | UW NOI Debt Yield: | | 9.5% |
The following table presents certain information relating to the appraisal’s market rent conclusion for the Spanish Ridge Portfolio Property:
| Market Rent Summary |
| | Office |
| Market Rent (PSF) | $30.00 |
| Lease Term (Years) | 7 |
| Lease Type (Reimbursements) | Net |
| Rent Increase Projection | 3.0%/year |
| Concessions (New/Renewal) (months) | 4 months / 1 month |
| Tenant Improvement (New/Renewal) | $20.00 / $10.00 |
| Leasing Commissions (New/Renewal) | 6.0% / 3.0% |
The table below presents certain information relating to comparable sales pertaining to the Spanish Ridge Portfolio Property identified by the appraiser:
| Comparable Sales |
Property Name | Location | Rentable Area (SF) | Occupancy | Sale Date | Sale Price (PSF) |
| Corporate Center 1 & 3 | 8880 and 8930 West Sunset Road Las Vegas, NV 89148 | 95,001 | 92.0% | Oct-21 | $336.84 |
| The Parkway | 7455 West Washington Avenue Las Vegas, NV 89128 | 128,762 | 100.0% | Oct-21 | $354.41 |
| Golden Entertainment Corporate Office | 6595 South Jones Boulevard Las Vegas, NV 89118 | 46,041 | 100.0% | May-21 | $401.82 |
| Breakthrough Way Office | 3755 Breakthrough Way Las Vegas, NV 89135 | 97,815 | 94.0% | May-21 | $296.48 |
| Centennial Hills MOB | 6170 North Durango Drive Las Vegas, NV 89149 | 57,156 | 100.0% | Jan-21 | $323.68 |
Source: Appraisal.
The following table presents certain information relating to comparable office leases for the Spanish Ridge Portfolio Property:
| Comparable Building Lease |
| Property Name/Location | Year Built/ Renovated | Total GLA (SF) | Occupancy | Tenant | SF | Date | Term | Annual Base Rent PSF | Lease Type |
Corporate Center 1 & 3 8880 and 8930 West Sunset Road Las Vegas, NV | 2009/NAP | 95,001 | 92% | Allegiant Hospice Group Avana Plastic Surgery Coaching Charities John Park Law | 2,256 8,129 2,500 2,577 | Aug-21 Aug-21 Jul-21 Mar-21 | 3.0 Yrs 7.0 Yrs 6.0 Yrs 3.0 Yrs | $18.00 $20.40 $22.14 $18.00 | NNN NNN NNN NNN |
Breakthrough Way Office 3755 Breakthrough Way Las Vegas, NV | 2008/NAP | 97,815 | 94% | JA Kennedy Real Estate Cornerstone Wealth Management | 4,274 2,320 | Jun-20 Jul-19 | 2.2 Yrs 5.2 Yrs | $30.60 $30.60 | FS FS |
Fort Apache Office Park 4670-4730 South Fort Apache Road Las Vegas, NV | 2002/2014 | 110,738 | 95% | Nevada Corporate Headquarters North American Title | 12,629 4,689 | Jan-20 Dec-19 | 5.3 Yrs 3.3 Yrs | $30.00 $30.60 | FS FS |
Howard Hughes Plaza 10100 West Charleston Boulevard Las Vegas, NV | 2000/NAP | 71,546 | 95% | Financial Group Collective Care for Women LLC | 10,605 2,098 | Feb-21 Dec-20 | 5.0 Yrs 3.0 Yrs | $34.20 $34.08 | FS FS |
Pavilion Office Building 10801 West Charleston Boulevard Las Vegas, NV | 2007/NAP | 141,156 | 96% | Confidential | 5,380 | Mar-20 | 5.0 Yrs | $38.00 | MG |
Source: Appraisal.
This is not a research report and was not prepared by any Underwriter’s research department. Please see additional important information and qualifications at the end of this Term Sheet. |
| | T-145 | |
| Office - Suburban | Loan #13 | Cut-off Date Balance: | | $26,918,567 |
| Various | Spanish Ridge Portfolio | Cut-off Date LTV: | | 68.3% |
| Las Vegas, NV 89148 | | UW NCF DSCR: | | 1.66x |
| | | UW NOI Debt Yield: | | 9.5% |
Operating History and Underwritten Net Cash Flow. The following table presents certain information relating to the historical operating performance and Underwritten Net Cash Flow at the Spanish Ridge Portfolio Property:
| Cash Flow Analysis |
| | 2018 | 2019 | 2020 | 9/30/2021 TTM | UW | UW PSF |
| Base Rent | $1,982,117 | $2,016,070 | $2,603,779 | $2,846,531 | $2,969,376(1) | $26.38 |
| Free Rent Adjustment | ($279,850) | ($332,100) | $112,739 | ($137,562) | $0 | $0.00 |
| Grossed Up Vacant Space | $0 | $0 | $0 | $0 | $0 | $0.00 |
| Gross Potential Rent | $1,702,267 | $1,683,970 | $2,716,519 | $2,708,969 | $2,969,376 | $26.38 |
| Other Income(2) | $16,520 | $15,590 | $15,750 | $15,990 | $15,792 | $0.14 |
| Total Recoveries | $556,199 | $764,920 | $503,266 | $498,709 | $572,189 | $5.08 |
| Net Rental Income | $2,274,986 | $2,464,480 | $3,235,535 | $3,223,668 | $3,557,357 | $31.61 |
| (Vacancy & Credit Loss) | $0 | $0 | $0 | $0 | ($296,938)(3) | ($2.64) |
| Effective Gross Income | $2,274,986 | $2,464,480 | $3,235,535 | $3,223,668 | $3,260,419 | $28.97 |
| | | | | | | |
| Real Estate Taxes | $99,946 | $104,491 | $96,748 | $121,365 | $124,562 | $1.11 |
| Insurance | $28,444 | $37,309 | $36,085 | $36,045 | $48,015 | $0.43 |
| Management Fee | $77,936 | $78,957 | $89,704 | $94,609 | $97,813 | $0.87 |
| Other Operating Expenses | $418,480 | $407,088 | $446,521 | $427,072 | $441,767 | $3.93 |
| Total Operating Expenses | $624,807 | $627,846 | $669,058 | $679,091 | $712,156 | $6.33 |
| | | | | | | |
| Net Operating Income | $1,650,179 | $1,836,634(3) | $2,566,477(3) | $2,544,577 | $2,548,264 | $22.64 |
| Replacement Reserves | $0 | $0 | $0 | $0 | $22,510 | $0.20 |
| TI/LC | $0 | $0 | $0 | $0 | $133,933 | $1.19 |
| Net Cash Flow | $1,650,179 | $1,836,634 | $2,566,477 | $2,544,577 | $2,391,820 | $21.25 |
| | | | | | | |
| Occupancy % | 81.8% | 77.8% | 100.0% | 100.0% | 90.0%(4) | |
| NOI DSCR | 1.15x | 1.28x | 1.79x | 1.77x | 1.77x | |
| NCF DSCR | 1.15x | 1.28x | 1.79x | 1.77x | 1.66x | |
| NOI Debt Yield | 6.1% | 6.8% | 9.5% | 9.5% | 9.5% | |
| NCF Debt Yield | 6.1% | 6.8% | 9.5% | 9.5% | 8.9% | |
| (1) | UW Base Rent includes contractual rent steps through August 2022 totaling $39,358. |
| (2) | Other Income includes tenants that pay for covered parking and some tenant employees also pay directly for covered parking. |
| (3) | The increase in Net Operating Income between 3rd Most Recent and 2nd Most Recent is primarily attributable to rent abatements for Paul Powell Law Firm in 2019, and increased base rent for Meadows Bank occurring with its October 2019 renewal. |
| (4) | The Spanish Ridge Portfolio Property was 100.0% physically occupied as of October 1, 2021. The underwritten vacancy is 10.0%. |
This is not a research report and was not prepared by any Underwriter’s research department. Please see additional important information and qualifications at the end of this Term Sheet. |
| | T-146 | |
(THIS PAGE INTENTIONALLY LEFT BLANK)
This is not a research report and was not prepared by any Underwriter’s research department. Please see additional important information and qualifications at the end of this Term Sheet. |
| | T-147 | |
| Mortgage Loan No. 14 – 1201 Lake Robbins |
| Mortgage Loan Information | | Property Information |
| Mortgage Loan Seller: | WFB | | Single Asset/Portfolio: | Single Asset |
| Credit Assessment (DBRSM/Fitch/Moody’s): | NR/NR/NR | | Location: | The Woodlands, TX 77380 |
| Original Balance(1): | $25,000,000 | | General Property Type: | Office |
| Cut-off Date Balance(1): | $25,000,000 | | Detailed Property Type: | Suburban |
| % of Initial Pool Balance: | 2.1% | | Title Vesting: | Fee |
| Loan Purpose: | Recapitalization | | Year Built/Renovated: | 2002/NAP |
| Borrower Sponsor: | The Howard Hughes Corporation | | Size: | 807,586 SF |
| Guarantor: | The Woodlands Land Development Company, L.P. | | Cut-off Date Balance per SF(1): | $310 |
| Mortgage Rate: | 3.8270% | | Maturity Balance per SF(1): | $310 |
| Note Date: | 10/8/2021 | | Property Manager: | Howard Hughes Management |
| First Payment Date: | 11/11/2021 | | | Services Company, LLC |
| Maturity Date: | 10/11/2031 | | | (borrower-related) |
| Original Term to Maturity: | 120 months | | Underwriting and Financial Information(6) |
| Original Amortization Term: | 0 months | | UW NOI(7): | $22,923,465 |
| IO Period: | 120 months | | UW NOI Debt Yield(1): | 9.2% |
| Seasoning: | 4 months | | UW NOI Debt Yield at Maturity(1): | 9.2% |
| Prepayment Provisions: | L(28),D(85),O(7) | | UW NCF DSCR(1): | 2.26x |
| Lockbox/Cash Mgmt Status: | Hard/In Place | | Most Recent NOI: | $24,086,187 (8/31/2021 TTM) |
| Additional Debt Type(1): | Pari Passu | | 2nd Most Recent NOI: | $24,374,004 (12/31/2020) |
| Additional Debt Balance(1): | $225,000,000 | | 3rd Most Recent NOI(7): | NAV |
| Future Debt Permitted (Type): | No (NAP) | | Most Recent Occupancy: | 100.0% (1/1/2022) |
| Reserves | | 2nd Most Recent Occupancy: | 100.0% (12/31/2020) |
| Type | Initial | Monthly | Cap | | 3rd Most Recent Occupancy: | 100.0% (12/31/2019) |
| RE Taxes(2): | $0 | Springing | NAP | | Appraised Value (as of): | $452,000,000 (8/25/2021) |
| Insurance(3): | $0 | Springing | NAP | | Appraised Value per SF: | $560 |
| Replacement Reserve(4): | $0 | Springing | NAP | | Cut-off Date LTV Ratio(1): | 55.3% |
| TI/LC Reserve(5): | $0 | Springing | NAP | | Maturity Date LTV Ratio(1): | 55.3% |
| Sources and Uses |
| Sources | Proceeds | % of Total | | Uses | Proceeds | % of Total |
| Whole Loan Amount(1): | $250,000,000 | 100.0% | | Return of Equity(8): | $248,133,803 | 99.3% |
| | | | | Closing Costs: | $1,866,197 | 0.7% |
| Total Sources: | $250,000,000 | 100.0% | | Total Uses: | $250,000,000 | 100.0% |
| (1) | The 1201 Lake Robbins Mortgage Loan (as defined below) is part of the 1201 Lake Robbins Whole Loan (as defined below) with an original aggregate principal balance of $250,000,000. The Cut-off Date Balance per SF, Maturity Date Balance per SF, UW NOI Debt Yield, UW NOI Debt Yield at Maturity, UW NCF DSCR, Cut-off Date LTV Ratio and Maturity Date LTV Ratio numbers presented above are based on the 1201 Lake Robbins Whole Loan. |
| (2) | The loan documents do not require ongoing monthly tax reserves so long as no Cash Trap Event Period has occurred or is continuing. A “Cash Trap Event Period” will commence upon the earlier of the following: (i) the occurrence of an event of default under the loan documents; (ii) the net cash flow debt yield being less than 6.0% for any calendar quarter; and (iii) the occurrence of a Material Tenant Event. A “Material Tenant Event” will commence upon the earlier of the following: (i) Occidental defaults under the lease beyond any notice and cure periods; (ii) Occidental becomes a debtor in a bankruptcy, insolvency or similar proceeding; (iii) Occidental goes dark in 50% or more of the 1201 Lake Robbins property, unless it is caused by COVID-19 or any other pandemic event; (iv) the credit rating of Occidental is downgraded below “B” or the equivalent by any rating agency; (v) Occidental has not renewed its lease for a minimum of a five-year term on then-current market terms reasonably approved by lender, at least 12 months prior to loan maturity; or (vi) Occidental terminates, surrenders, or cancels its lease. |
| (3) | The loan documents do not require ongoing monthly insurance reserves so long as no Cash Trap Event Period has occurred or is continuing. |
| (4) | The loan documents do not require ongoing monthly replacement reserves so long as no Cash Trap Event Period has occurred or is continuing. Notwithstanding the foregoing, the borrower’s obligation to make insurance reserve payments will be waived so long as (i) no event of default is continuing, (ii) the insurance policies maintained by borrower are part of a blanket or umbrella policy approved by the lender in its reasonable discretion, and (iii) the lender is provided with paid receipts for the payment of the insurance premiums no later than ten business days prior to the expiration dates of said policies. |
| (5) | The loan documents do not require ongoing monthly TI/LC reserves so long as no Cash Trap Event Period has occurred or is continuing. |
| (6) | The novel coronavirus pandemic is an evolving situation and could impact the 1201 Lake Robbins Whole Loan more severely than assumed in the underwriting of the 1201 Lake Robbins Whole Loan and could adversely affect the NOI, NCF and occupancy information, as well as the appraised value and the DSCR, LTV and Debt Yield metrics presented above and herein. See "Risk Factors—Risks Related to Market Conditions and Other External Factors—The Coronavirus Pandemic Has Adversely Affected the Global Economy and Will Likely Adversely Affect the Performance of the Mortgage Loans" in the prospectus. |
| (7) | The 1201 Lake Robbins Borrower purchased the property in December 2019. No prior historical financials are available. |
| (8) | The 1201 Lake Robbins Borrower purchased the property in December 2019 as part of a portfolio acquired by The Howard Hughes Corporation, and was unencumbered. |
The Mortgage Loan. The fourteenth largest mortgage loan (the “1201 Lake Robbins Mortgage Loan”) is part of a whole loan (the “1201 Lake Robbins Whole Loan”) that is evidenced by four pari passu promissory notes in the aggregate original principal amount of $250,000,000. The 1201 Lake Robbins Whole Loan is secured by a first priority fee mortgage encumbering an 807,586 SF office building, located in The Woodlands, Texas (the “1201 Lake Robbins Property”). The 1201 Lake Robbins Whole Loan is being serviced under the pooling and servicing agreement for the BANK 2021-BNK37 securitization trust. See “Description of the Mortgage Pool—The Whole Loans—The Non-Serviced Pari Passu Whole Loans” and “Pooling and Servicing Agreement—Servicing of the Non-Serviced Mortgage Loans” in the prospectus.
This is not a research report and was not prepared by any Underwriter’s research department. Please see additional important information and qualifications at the end of this Term Sheet. |
| | T-148 | |
| Office – Suburban | Loan #14 | Cut-off Date Balance: | | $25,000,000 |
| 1201 Lake Robbins Drive | 1201 Lake Robbins | Cut-off Date LTV: | | 55.3% |
| The Woodlands, TX 77380 | | UW NCF DSCR: | | 2.26x |
| | | UW NOI Debt Yield: | | 9.2% |
| 1201 Lake Robbins Whole Loan Summary |
| Notes | Original Balance | Cut-off Date Balance | Note Holder | Controlling Piece |
| A-1 | $100,000,000 | $100,000,000 | BANK 2021-BNK37 | Yes |
| A-2 | $70,000,000 | $70,000,000 | WFCM 2021-C61 | No |
| A-3 | $55,000,000 | $55,000,000 | BANK 2021-BNK38 | No |
| A-4 | $25,000,000 | $25,000,000 | BANK 2022-BNK39 | No |
| Total | $250,000,000 | $250,000,000 | | |
The Borrower and the Borrower Sponsor. The borrower is HH Woodlands Tower Holdings, LLC (the “1201 Lake Robbins Borrower”), a Delaware limited liability company with two independent directors. The non-recourse carveout guarantor is The Woodlands Land Development Company, L.P. (the “1201 Lake Robbins Guarantor”). The borrower sponsor is The Howard Hughes Corporation. Founded in 2010, the company owns, manages, and develops commercial, residential and mixed-use real estate throughout the United States. Through its Operating Assets segment, the company owns 15 retail, 32 office, 12 multi-family, and 13 other operating assets.
The Property. The 1201 Lake Robbins Property is a 30-story, Class A office building consisting of 807,586 rentable SF situated on 5.1 acres of land. The property was originally built as the corporate headquarters for Anadarko and includes a fitness center, deli, and a 45,000 SF annex which includes a large cafeteria and conference space. In 2019, Occidental Petroleum Corporation (“Occidental”) acquired Anadarko, and The Howard Hughes Corporation purchased both the 1201 Lake Robbins Property and an adjacent office building. Subsequently Occidental signed a new 13-year lease and consolidated its space from the adjacent building into the 1201 Lake Robbins Property. As of January 1, 2022, the 1201 Lake Robbins Property is 100% leased to Occidental.
The 1201 Lake Robbins Property is subject to a shared parking agreement with the adjacent building, whereby the 1201 Lake Robbins Borrower and the owner of the adjacent building reallocated parking spaces in each building’s garage such that the 1201 Lake Robbins Property is entitled to the use of 2,019 parking spaces as required under the Occidental lease. Expenses are shared between the two property owners based on each owner’s share of the total available parking spaces.
Sole Tenant.
Occidental (BB/Ba2/BB: F/M/S&P; 807,586 SF; 100.0% of NRA; 100.0% of underwritten base rent; December 31, 2032 lease expiration): Occidental is an international energy company with assets in the United States, Middle East, Africa and Latin America. Founded in 1920, Occidental is one of the largest oil producers in the Unites States, including being a leading producer in the Permian and DJ Basins and offshore Gulf of Mexico. As of October 14, 2021, the company has a market capitalization of $30.0 billion and employs 11,800 people.
Occidental signed a new 13-year lease in December 2019 and has either two, 5-year or one, 10-year extension options for at least 250,000 SF, with 12 months’ notice at 95% of fair market rent. The lease includes 2% annual rent increases and no termination or contraction options.
The following table presents certain information relating to the tenancy at the 1201 Lake Robbins Property:
| Tenant Summary |
| Tenant Name | Credit Rating (Fitch/Moody's/S&P) | Tenant SF | Approx. % of SF | Annual UW Rent(1) | % of Total Annual UW Rent | Annual UW Rent PSF(1) | Termination Option (Y/N) | Lease Expiration | Renewal Options(2) |
| Occidental | BB/Ba2/BB | 807,586 | 100.0% | $24,784,815 | 100.0% | $30.69 | N | 12/31/2032 | Various |
| Vacant Space | | 0 | 0.0% | $0 | 0.0% | $0.00 | | | |
| Total/Wtd. Avg. | | 807,586 | 100.0% | $24,784,815 | 100.0% | $30.69 | | | |
| (1) | The Annual U/W Base Rent PSF and Annual U/W Base Rent shown above represent the January 1, 2022 rent step. |
| (2) | Tenant has the option of two, 5-year or one, 10-year renewal option for at least 250,000 SF at 95% of fair market rent. |
This is not a research report and was not prepared by any Underwriter’s research department. Please see additional important information and qualifications at the end of this Term Sheet. |
| | T-149 | |
| Office – Suburban | Loan #14 | Cut-off Date Balance: | | $25,000,000 |
| 1201 Lake Robbins Drive | 1201 Lake Robbins | Cut-off Date LTV: | | 55.3% |
| The Woodlands, TX 77380 | | UW NCF DSCR: | | 2.26x |
| | | UW NOI Debt Yield: | | 9.2% |
The following table presents certain information relating to the lease rollover schedule at the 1201 Lake Robbins Property:
| Lease Rollover Schedule(1) |
| Year | # of Leases Rolling | SF Rolling | Annual UW Rent PSF Rolling | Approx. % of Total SF Rolling | Approx. Cumulative % of SF Rolling | Total UW Rent Rolling | Approx. % of Total Rent Rolling | Approx. Cumulative % of Total Rent Rolling |
| 2022 | 0 | 0 | $0.00 | 0.0% | 0.0% | $0 | 0.0% | 0.0% |
| 2023 | 0 | 0 | $0.00 | 0.0% | 0.0% | $0 | 0.0% | 0.0% |
| 2024 | 0 | 0 | $0.00 | 0.0% | 0.0% | $0 | 0.0% | 0.0% |
| 2025 | 0 | 0 | $0.00 | 0.0% | 0.0% | $0 | 0.0% | 0.0% |
| 2026 | 0 | 0 | $0.00 | 0.0% | 0.0% | $0 | 0.0% | 0.0% |
| 2027 | 0 | 0 | $0.00 | 0.0% | 0.0% | $0 | 0.0% | 0.0% |
| 2028 | 0 | 0 | $0.00 | 0.0% | 0.0% | $0 | 0.0% | 0.0% |
| 2029 | 0 | 0 | $0.00 | 0.0% | 0.0% | $0 | 0.0% | 0.0% |
| 2030 | 0 | 0 | $0.00 | 0.0% | 0.0% | $0 | 0.0% | 0.0% |
| 2031 | 0 | 0 | $0.00 | 0.0% | 0.0% | $0 | 0.0% | 0.0% |
| 2032 & Beyond | 1 | 807,586 | $30.69 | 100.0% | 100.0% | $24,784,815 | 100.0% | 100.0% |
| Vacant | 0 | 0 | $0.00 | 0.0% | 100.0% | $0 | 0.0% | 100.0% |
| Total/Wtd. Avg. | 1 | 807,586 | $30.69 | 100.0% | | $24,784,815 | 100.0% | |
| (1) | Information is based on the underwritten rent roll. |
COVID-19 Update. As of October 7, 2021, the 1201 Lake Robbins Property is open and operating with no outstanding tenant rent relief agreements.
The Market. The 1201 Lake Robbins Property is located in The Woodlands, Texas, approximately 29.5 miles north of Houston. The Woodlands is a mixed-use master-planned development that contains approximately 27,000 acres, of which approximately 20-25% will remain forest preserves, parks, golf courses, lakes and open space. The Woodlands includes over 1,650 companies including major corporations such as Chevron Phillips, Occidental, and Baker Hughes, and employs an estimated 22,629 people. Currently, the Woodlands is home to more than 60,000 residents, contains 3.9 million SF of retail and commercial space and approximately 6.3 million SF of office and industrial space. At full build out, the community is expected to have 132,500 residents and approximately 82,000 employees. The 1201 Lake Robbins Property is located directly adjacent to the Woodlands Waterway, which winds through the township and connects attractions along the way such as dining, hotels, nightlife and outdoor green space. According to the appraisal, the estimated 2020 population within a one, three and five-mile radius was approximately 5,552, 62,548 and 160,703, respectively and the estimated 2020 average household income within the same radii was approximately $133,550, $132,792 and $141,072, respectively.
The 1201 Lake Robbins Property is located approximately 4.9 miles from the Grand Parkway, the outermost loop around Houston and provides accessibility throughout the area, and 1.1 miles from Interstate 45, a major north south thoroughfare. Additionally, the 1201 Lake Robbins Property is located 0.9 miles from The Woodlands Mall, featuring various dining and entertainment options and tenants such as Apple, Coach, Peloton and Nordstrom. The 1201 Lake Robbins Property is also located approximately 22.5 miles from the George Bush Intercontinental Airport.
According to the appraisal, the property is situated within in the Woodlands/Conroe submarket within the greater Houston office market. As of the second quarter of 2021, the submarket reported a total inventory of approximately 11.0 million SF with a 19.1% vacancy rate and an average asking rent of $40.24 per SF, net. The appraiser identified nine comparable buildings located within The Woodlands with rents ranging from $21.00 to $30.75 per SF, net. The appraiser concluded a market rent for the 1201 Lake Robbins Property of $29.00 per SF, net.
The following table presents certain information relating to the appraisal’s market rent conclusions for the 1201 Lake Robbins Property:
| Market Rent Summary |
| | Office |
| Market Rent (PSF) | $29.00 |
| Lease Term (Years) | 10 |
| Lease Type | Net |
| Rent Increase Projection | $0.50 per annum |
| Tenant Improvements (New/Renewal) | $75.00 / $25.00 |
| Leasing Commissions (New/Renewal) | 6.0% / 6.0% |
| Free Rent | 12 months |
This is not a research report and was not prepared by any Underwriter’s research department. Please see additional important information and qualifications at the end of this Term Sheet. |
| | T-150 | |
| Office – Suburban | Loan #14 | Cut-off Date Balance: | | $25,000,000 |
| 1201 Lake Robbins Drive | 1201 Lake Robbins | Cut-off Date LTV: | | 55.3% |
| The Woodlands, TX 77380 | | UW NCF DSCR: | | 2.26x |
| | | UW NOI Debt Yield: | | 9.2% |
The table below presents certain information relating to comparable sales pertaining to 1201 Lake Robbins Property identified by the appraiser:
| Comparable Sales |
Property Name/Location | City, State | Year Built/Renovated | Rentable Area (SF) | Sale Date | Sale Price (PSF) |
Apple at Capital Ridge 320 South Capital of Texas Highway | Austin, TX | 2015/NAP | 216,511 | Aug-2021 | $647 |
Waterway Plaza 1 10003 Woodloch Forest Drive | The Woodlands, TX | 2000/NAP | 223,516 | Jan-2021 | $488 |
Helios Plaza 201 Helios Way | Houston, TX | 2009/NAP | 377,185 | Aug-2021 | $472 |
HP Inc. Plaza in City Place 10300 Energy Drive | Spring, TX | 2018/NAP | 378,402 | Aug-2021 | $575 |
Ten West One 17420 Katy Freeway | Houston, TX | 1998/NAP | 199,000 | Aug-2021 | $337 |
Source: Appraisal.
The following table presents certain information relating to comparable office leases for the 1201 Lake Robbins Property:
| Comparable Building Leases(1) |
| Property Name/Location | Year Built/ Renovated | Total GLA (SF) | Occupancy(2) | Term | Annual Base Rent PSF(3) | Lease Type |
1201 Lake Robbins Property 1201 Lake Robbins Drive The Woodlands, TX | 2002/NAP | 807,586(4) | 100%(4) | 13 Yrs. | $30.69(5) | NNN |
One, Two & Three Hughes Landing 1780, 1790 & 1800 Hughes Landing Boulevard The Woodlands, TX | 2015/NAP | 716,230 | 86% | 5-10 Yrs. | $30.00 | NNN |
Woodlands Town Center 1 & 2 1330 & 1450 Lake Robbins Drive The Woodlands, TX | 1999/NAP | 280,415 | 82% | 5-10 Yrs. | $24.50 | NNN |
3 Waterway Square Place 3 Waterway Avenue The Woodlands, TX | 2013/NAP | 232,045 | 87% | 3-10 Yrs. | $29.00 | NNN |
4 Waterway Square Place 4 Waterway Avenue The Woodlands, TX | 2008/NAP | 218,551 | 100% | 5 Yrs. | $29.00 | NNN |
21 Waterway 21 Waterway Avenue The Woodlands, TX | 2005/NAP | 102,816 | 99% | 3-10 Yrs. | $30.50 | NNN |
24 Waterway 24 Waterway Avenue The Woodlands, TX | 2008/NAP | 308,000 | 91% | 3-10 Yrs. | $29.00 | NNN |
Waterway Plaza Two 10001 Woodloch Forest Drive The Woodlands, TX | 2000/NAP | 142,270 | 60% | 3-10 Yrs. | $26.50 | NNN |
Wildwood Corporate Centre II 480 WildWood Forest Drive The Woodlands, TX | 2016/NAP | 201,933 | 89% | 5-10 Yrs. | $21.00 | NNN |
The Woodlands Tower 9950 Woodloch Forest Drive The Woodlands, TX | 2014/NAP | 595,854 | 34% | 5-10 Yrs. | $30.75 | NNN |
| (1) | Information obtained from the appraisal. Includes comparable buildings located in The Woodlands, TX. |
| (2) | Represents building occupancy as of September 2021, with the exception of the 1201 Lake Robbins Property. |
| (3) | Represents quoted rental rates as of September 2021, with the exception of the 1201 Lake Robbins Property. |
| (4) | Information obtained from the underwritten rent roll. |
| (5) | Represents the underwritten base rent. |
This is not a research report and was not prepared by any Underwriter’s research department. Please see additional important information and qualifications at the end of this Term Sheet. |
| | T-151 | |
| Office – Suburban | Loan #14 | Cut-off Date Balance: | | $25,000,000 |
| 1201 Lake Robbins Drive | 1201 Lake Robbins | Cut-off Date LTV: | | 55.3% |
| The Woodlands, TX 77380 | | UW NCF DSCR: | | 2.26x |
| | | UW NOI Debt Yield: | | 9.2% |
Operating History and Underwritten Net Cash Flow. The following table presents certain information relating to the historical operating performance and Underwritten Net Cash Flow at the 1201 Lake Robbins Property:
| Cash Flow Analysis |
| | 2020 | 8/31/2021 TTM | UW | UW PSF |
| Gross Potential Base Rent | $23,823,787 | $24,141,438 | $24,784,815(1) | $30.69 |
| Total Recoveries | $12,027,957 | $11,856,395 | $11,820,073 | $14.64 |
| Other Income | $0 | $0 | $0 | $0.00 |
| Less Vacancy & Credit Loss | $0 | $0 | ($1,239,241) | ($1.53) |
| Effective Gross Income | $35,851,744 | $35,997,833 | $35,365,647 | $43.79 |
| | | | | |
| Real Estate Taxes | $4,906,836 | $4,571,446 | $5,138,179 | $6.36 |
| Insurance | $635,236 | $647,661 | $697,633 | $0.86 |
| Other Operating Expenses | $5,935,668 | $6,692,539 | $6,606,370 | $8.18 |
| Total Expenses | $11,477,740 | $11,911,646 | $12,442,182 | $15.41 |
| | | | | |
| Net Operating Income | $24,374,004 | $24,086,187 | $22,923,465 | $28.39 |
| CapEx | $0 | $0 | $161,517 | $0.20 |
| TI/LC | $0 | $0 | $807,586 | $1.00 |
| Net Cash Flow | $24,374,004 | $24,086,187 | $21,954,362 | $27.19 |
| | | | | |
| Occupancy %(2) | 100.0% | 100.0% | 95.0% | |
| NOI DSCR(3) | 2.51x | 2.48x | 2.36x | |
| NCF DSCR(3) | 2.51x | 2.48x | 2.26x | |
| NOI Debt Yield(3) | 9.7% | 9.6% | 9.2% | |
| NCF Debt Yield(3) | 9.7% | 9.6% | 8.8% | |
| (1) | The UW Base Rent represents the January 1, 2022 rent step. |
| (2) | The 1201 Lake Robbins Property is 100% leased. The 1201 Lake Robbins Property is underwritten with 5% vacancy. |
| (3) | Based on the 1201 Lake Robbins Whole Loan. |
This is not a research report and was not prepared by any Underwriter’s research department. Please see additional important information and qualifications at the end of this Term Sheet. |
| | T-152 | |
(THIS PAGE INTENTIONALLY LEFT BLANK)
This is not a research report and was not prepared by any Underwriter’s research department. Please see additional important information and qualifications at the end of this Term Sheet. |
| | T-153 | |
| Mortgage Loan No. 15 – RML The MarQ |
| Mortgage Loan Information | | Property Information |
| Mortgage Loan Seller: | MSMCH | | Single Asset/Portfolio: | Single Asset |
| Credit Assessment (DBRSM/Fitch/Moody’s): | NR/NR/NR | | Location: | Georgetown, KY 40324 |
| Original Balance: | $25,000,000 | | General Property Type: | Multifamily |
| Cut-off Date Balance: | $25,000,000 | | Detailed Property Type: | Garden |
| % of Initial Pool Balance: | 2.1% | | Title Vesting: | Fee |
| Loan Purpose: | Refinance | | Year Built/Renovated: | 2018-2019; NAP |
| Borrower Sponsor: | RML Construction, LLP | | Size: | 295 Units |
| Guarantor: | RML Construction, LLP | | Cut-off Date Balance per Unit: | $84,746 |
| Mortgage Rate: | 2.6150% | | Maturity Date Balance per Unit: | $84,746 |
| Note Date: | 12/21/2021 | | Property Manager: | Self-managed |
| First Payment Date: | 2/1/2022 | | | |
| Maturity Date: | 1/1/2032 | | | |
| Original Term to Maturity: | 120 months | | Underwriting and Financial Information(3) |
| Original Amortization Term: | 0 months | | UW NOI: | $2,537,621 |
| IO Period: | 120 months | | UW NOI Debt Yield: | 10.2% |
| Seasoning: | 1 month | | UW NOI Debt Yield at Maturity: | 10.2% |
| Prepayment Provisions: | L(25),D(91),O(4) | | UW NCF DSCR: | 3.72x |
| Lockbox/Cash Mgmt Status: | Springing/Springing | | Most Recent NOI: | $2,827,603 (9/30/2021 TTM) |
| Additional Debt Type: | No | | 2nd Most Recent NOI: | $2,744,121 (12/31/2020) |
| Additional Debt Balance: | NAP | | 3rd Most Recent NOI: | $2,528,525 (12/31/2019) |
| Future Debt Permitted (Type): | No (NAP) | | Most Recent Occupancy: | 98.6% (10/31/2021) |
| Reserves | | 2nd Most Recent Occupancy: | 97.0% (12/31/2020) |
| Type | Initial | Monthly | Cap | | 3rd Most Recent Occupancy: | 97.0% (12/31/2019) |
| RE Taxes: | $92,196 | $30,732 | NAP | | Appraised Value (as of)(4): | $48,900,000 (10/14/2021) |
| Insurance(1): | $0 | Springing | NAP | | Appraised Value per Unit: | $165,763 |
| Replacement Reserve: | $0 | $6,146 | NAP | | Cut-off Date LTV Ratio: | 51.1% |
| Environmental Reserve(2): | $64,500 | $0 | NAP | | Maturity Date LTV Ratio: | 51.1% |
| | | | | | | | |
| Sources and Uses |
| Sources | Proceeds | % of Total | | Uses | Proceeds | % of Total |
| Loan Amount: | $25,000,000 | 100.0% | | Loan Payoff: | $23,096,179 | 92.4% |
| | | | | Closing Costs: | $1,252,100 | 5.0% |
| | | | | Return of Equity: | $495,025 | 2.0% |
| | | | | Reserves: | $156,696 | 0.6% |
| Total Sources: | $25,000,000 | 100.0% | | Total Uses: | $25,000,000 | 100.0% |
| (1) | The RML The MarQ Mortgage Loan (as defined below) documents do not require ongoing monthly escrows for insurance premiums as long as (i) no event of default has occurred and is continuing, (ii) the borrower provides the lender with written evidence that all required insurance coverages are being maintained in full force and effect, and (iii) the borrower provides the lender with paid receipts for the payment of the insurance premiums at least 20 days prior to the expiration of the policy. |
| (2) | For radon testing and/or mitigation. See “Description of the Mortgage Pool—Environmental Considerations” in the prospectus. |
| (3) | The novel coronavirus pandemic is an evolving situation and could impact the RML The MarQ Mortgage Loan more severely than assumed in the underwriting of the RML The MarQ Mortgage Loan and could adversely affect the NOI, NCF and occupancy information, as well as the appraised value and the DSCR, LTV and Debt Yield metrics presented above and herein. See "Risk Factors—Risks Related to Market Conditions and Other External Factors—The Coronavirus Pandemic Has Adversely Affected the Global Economy and Will Likely Adversely Affect the Performance of the Mortgage Loans" in the prospectus. |
| (4) | The Appraised Value includes $1,050,000 associated with furniture, fixtures or equipment. |
The Mortgage Loan. The fifteenth largest mortgage loan (the “RML The MarQ Mortgage Loan”) is evidenced by a promissory note in the original principal amount of $25,000,000. The RML The MarQ Mortgage Loan is secured by a first priority fee mortgage encumbering a multifamily property located in Georgetown, Kentucky (the “RML The MarQ Property”).
The Borrower and the Borrower Sponsor. The borrower is McClelland Circle Partners LLC, a single-purpose Kentucky limited liability company with one independent director in its organizational structure. The borrower sponsor and non-recourse carveout guarantor is RML Construction, LLP. The borrower is 100.0% owned by RML Construction, LLP. Founded in 1991, RML Construction, LLP is a limited liability partnership that is involved in the construction and rental of duplexes, triplexes, townhomes, and apartments in the Lexington, Kentucky and Knoxville, Tennessee areas. The company currently owns and operates a portfolio of commercial real estate consisting of 13 multifamily properties.
The borrower is affiliated with the borrowers under the mortgage loans identified in Annex A-1 to the prospectus as RML Waterstone, RML Tracery, RML Greendale Townhomes and RML Sandersville Townhomes.
This is not a research report and was not prepared by any Underwriter’s research department. Please see additional important information and qualifications at the end of this Term Sheet. |
| | T-154 | |
| Multifamily – Garden | Loan #15 | Cut-off Date Balance: | | $25,000,000 |
| 105 Waterstone Path | RML The MarQ | Cut-off Date LTV: | | 51.1% |
| Georgetown, KY 40324 | | U/W NCF DSCR: | | 3.72x |
| | | U/W NOI Debt Yield: | | 10.2% |
The Property. The RML The MarQ Property is a 295-unit garden multifamily apartment complex totaling 302,038 SF situated on a 24.51-acre site and includes 15 two-story apartment buildings and 623 parking spaces (2.1 per 1,000 SF of NRA). The RML The MarQ Property was built in phases between 2018 and 2019. The borrower sponsor has invested $263,178 on capital expenditures, including clubhouse renovations and pool upgrades. The apartment unit mix is comprised of studio, one-, two- and three-bedroom units ranging in size from 594 – 1,389 SF with an average of 1,024 SF. As of October 31, 2021, the RML The MarQ Property is currently 98.6% occupied at an average contract rent of $1,033 per unit per month. Each unit generally features full kitchens with stainless steel appliances, granite countertops, ceramic tile backsplashes, walk-in closets, patio/balcony, central air-conditioning, 9' ceilings, crown molding, ceiling fan, and washer/dryer hookups. Select units have an in-unit washer/dryer and privately accessible attached garages. Building amenities include a clubhouse, leasing office, coffee bar, fitness center, business center, two swimming pools, and grilling area. The borrower sponsor has plans to develop a MarQ Phase II property directly west of the RML The MarQ Property totaling 140 units. These units will be nearly identical to the RML The MarQ Phase I units. The table below shows the residential apartment unit mix at the RML The MarQ Property:
| Apartment Unit Mix |
| Unit Mix / Type | Total Units | Leased Units | % Leased | Average SF per Unit | Monthly Average Rent per Unit | Monthly Average Rent PSF |
| Studio | 31 | 29 | 93.5% | 594 | $799 | $1.35 |
| One Bedroom | 108 | 107 | 99.1% | 819 | $893 | $1.09 |
| Two Bedroom | 118 | 118 | 100.0% | 1,208 | $1,134 | $0.94 |
| Three Bedroom | 38 | 37 | 97.4% | 1,385 | $1,302 | $0.94 |
| Total/Weighted Average | 295 | 291 | 98.6% | 1,024 | $1,033 | $1.04 |
Source: Borrower rent roll dated October 31, 2021.
The Market. The RML The MarQ Property is located in Georgetown, Kentucky in the Scott County multifamily submarket in the Lexington region multifamily market. The local area is anchored by the US Highway 60/Bypass 460 corridor, which is a divided, four-lane thoroughfare. Many Georgetown area residents commute to nearby metropolitan Lexington for employment opportunities. Within Georgetown, more than 7,000 people work at the Toyota Georgetown Assembly Plant, situated on the east side of the city. Georgetown also includes the private, four-year university of Georgetown College, situated near the city center. This school has a typical enrollment of around 1,700 total students. Other regional demand generators within a 10 to 15- minute drivetime of the RML The MarQ Property include the University of Kentucky campus as well as the medical campuses of UK Healthcare – Albert B. Chandler Hospital and Baptist Health Lexington. According to the appraisal, as of the third quarter of 2021, the vacancy rate in the Scott County multifamily submarket was approximately 1.2%, with average asking rents of $984 per unit and inventory of approximately 3,273 units. According to the appraisal, as of the third quarter of 2021, the vacancy rate in the Lexington region multifamily market was approximately 3.4%, with average asking rents of $934 per unit and inventory of approximately 44,860 units. According to the appraisal, the estimated 2021 population within a one-, three- and five-mile radius of the RML The MarQ Property was 5,930, 27,924 and 43,518, respectively. The estimated 2021 average household income within the same radii was $73,331, $75,771 and $84,729, respectively.
The following table presents certain information relating to comparable multifamily rental properties to the RML The MarQ Property:
| Comparable Rental Properties |
| Property | Year Built | # Units | Unit Mix | Average SF per Unit | Average Monthly Rent per Unit | Average Monthly Rent PSF |
RML The MarQ Property(1) Georgetown, KY | 2018-2019 | 295 | Studio 1BR 2BR 3BR | 594 819 1,208 1,385 | $799 $893 $1,134 $1,302 | $1.35 $1.09 $0.94 $0.94 |
The Mill at Georgetown Georgetown, KY | 2012 | 228 | 1BR 2BR 3BR | 698 1,043 1,665 | $1,000 $1,081 $1,547 | $1.43 $1.04 $0.93 |
Amerson Orchard Georgetown, KY | 2017 | 325 | 1BR 2BR 3BR 4BR | 538 932 1,502 1,770 | $854 $1,072 $1,351 $1,611 | $1.59 $1.15 $0.90 $0.91 |
Haverford Place Georgetown, KY | 2001 | 160 | 1BR 2BR 3BR | 900 1,288 1,369 | $932 $1,101 $1,452 | $1.04 $0.85 $1.06 |
Wyndamere Georgetown, KY | 2007 | 294 | 2BR | 975 | $978 | $1.00 |
Georgetown Oaks Georgetown, KY | 2002 | 216 | 1BR 2BR 3BR | 800 1,125 1,400 | $845 $930 $1,175 | $1.06 $0.83 $0.84 |
Source: Appraisal, unless otherwise indicated.
| (1) | Based on the borrower rent roll dated October 31, 2021. |
This is not a research report and was not prepared by any Underwriter’s research department. Please see additional important information and qualifications at the end of this Term Sheet. |
| | T-155 | |
| Multifamily – Garden | Loan #15 | Cut-off Date Balance: | | $25,000,000 |
| 105 Waterstone Path | RML The MarQ | Cut-off Date LTV: | | 51.1% |
| Georgetown, KY 40324 | | U/W NCF DSCR: | | 3.72x |
| | | U/W NOI Debt Yield: | | 10.2% |
The following table presents certain information relating to the appraisal’s market rent conclusion for the RML The MarQ Property:
| Market Rent Summary |
| Unit Type | Units(1) | Average Size (SF) (1) | Avg. Monthly Rent per Unit(1) | Avg. Monthly Rent PSF(1) | Avg. Monthly Market Rent per Unit(2) | Avg. Monthly Market Rent PSF(2) |
| Studio | 31 | 594 | $799 | $1.35 | $862 | $1.45 |
| One Bedroom | 108 | 819 | $893 | $1.09 | $931 | $1.14 |
| Two Bedroom | 118 | 1,208 | $1,134 | $0.94 | $1,181 | $0.98 |
| Three Bedroom | 38 | 1,385 | $1,302 | $0.94 | $1,372 | 0.99 |
| (1) | Based on the borrower rent roll dated October 31, 2021. |
| (2) | Based on the appraisal. |
Operating History and Underwritten Net Cash Flow. The following table presents certain information relating to the historical operating performance and Underwritten Net Cash Flow for the RML The MarQ Property:
| Cash Flow Analysis |
| | 2019 | 2020 | 9/30/2021 TTM | UW | UW per Unit |
| Gross Potential Rent(1) | $3,079,466 | $3,370,754 | $3,476,863 | $3,623,981 | $12,284.68 |
| Other Income(2) | $468,133 | $337,617 | $329,595 | $329,595 | $1,117.27 |
| Discounts Concessions | $0 | $0 | $0 | $0 | $0.00 |
| Vacancy & Credit Loss | $0 | $0 | $0 | ($181,199) | ($614.23) |
| Effective Gross Income | $3,547,599 | $3,708,371 | $3,806,458 | $3,772,378 | $12,787.72 |
| | | | | | |
| Real Estate Taxes | $188,477 | $217,375 | $239,212 | $368,426 | $1,248.90 |
| Insurance | $135,020 | $127,005 | $128,751 | $129,328 | $438.40 |
| Other Expenses | $695,577 | $619,870 | $610,892 | $737,002 | $2,498.31 |
| Total Expenses | $1,019,074 | $964,250 | $978,856 | $1,234,756 | $4,185.61 |
| | | | | | |
| Net Operating Income | $2,528,525 | $2,744,121 | $2,827,603 | $2,537,621 | $8,602.11 |
| Capital Expenditures | $0 | $0 | $0 | $73,750 | $250.00 |
| Net Cash Flow | $2,528,525 | $2,744,121 | $2,827,603 | $2,463,871 | $8,352.11 |
| | | | | | |
| Occupancy %(1) | 97.0% | 97.0% | 98.6% | 95.0% | |
| NOI DSCR | 3.81x | 4.14x | 4.27x | 3.83x | |
| NCF DSCR | 3.81x | 4.14x | 4.27x | 3.72x | |
| NOI Debt Yield | 10.1% | 11.0% | 11.3% | 10.2% | |
| NCF Debt Yield | 10.1% | 11.0% | 11.3% | 9.9% | |
| (1) | UW Gross Potential Rent and 9/30/2021 TTM Occupancy % are based on the borrower rent roll dated October 31, 2021. |
| (2) | Other Income is comprised of pet rent, security deposits, late fees and washer/dryer rentals. |
This is not a research report and was not prepared by any Underwriter’s research department. Please see additional important information and qualifications at the end of this Term Sheet. |
| | T-156 | |
This material was prepared by sales, trading, banking or other non-research personnel of one of the following (or an affiliate thereof): BofA Securities, Inc. (together with its affiliates, “BofA Securities”), Morgan Stanley & Co. LLC, Morgan Stanley & Co. International Limited, Morgan Stanley Japan Limited and/or Morgan Stanley Dean Witter Asia Limited (together with their affiliates, hereinafter “Morgan Stanley”), Wells Fargo Securities, LLC (together with its affiliates, “Wells Fargo”), Academy Securities, Inc. (together with its affiliates, “Academy”) or Drexel Hamilton, LLC (together with its affiliates, “Drexel”, and collectively with BofA Securities, Morgan Stanley, Wells Fargo and Academy, the “Underwriters”). This material was not produced by an Underwriter’s research analyst, although it may refer to an Underwriter’s research analyst or research report. Unless otherwise indicated, these views (if any) are the author’s and may differ from those of the fixed income or equity research departments of the Underwriters or others in those firms.
This material may have been prepared by or in conjunction with the respective trading desks of the Underwriters that may deal as principal in or own or act as market maker or liquidity provider for the securities/instruments (or related derivatives) mentioned herein. The trading desk of any Underwriter may have accumulated a position in the subject securities/instruments based on the information contained herein. Trading desk materials are not independent of the proprietary interests of the Underwriters, which may conflict with your interests. Each of the Underwriters may also perform or seek to perform investment banking services for the issuers of the securities and instruments mentioned herein.
The information contained in this material is subject to change, completion or amendment from time to time, and the information in this material supersedes information in any other communication relating to the securities referred to in this material. This material is not a solicitation to participate in any trading strategy, and is not an offer to sell any security or instrument or a solicitation of an offer to buy or sell any security or instrument in any jurisdiction where an offer, solicitation or sale is not permitted. Unless otherwise set forth in this material, any securities referred to in this material may not have been registered under the U.S. Securities Act of 1933, as amended, and, if not, may not be offered or sold absent an exemption therefrom. Recipients are required to comply with any legal or contractual restrictions on their purchase, holding, sale, exercise of rights or performance of obligations under any securities/instruments transaction.
The securities/instruments discussed in this material may not be suitable for all investors. This material has been prepared and issued by the Underwriters for intended distribution to market professionals and institutional investor clients. Other recipients should seek independent investment advice prior to making any investment decision based on this material. This material does not provide individually tailored investment advice or offer tax, regulatory, accounting or legal advice. Prior to entering into any proposed transaction, recipients should determine, in consultation with their own investment, legal, tax, regulatory and accounting advisors, the economic risks and merits, as well as the legal, tax, regulatory and accounting characteristics and consequences, of the transaction. You should consider this material as only a single factor in making an investment decision. The value of and income from investments may vary because of changes in interest rates, foreign exchange rates, default rates, prepayment rates, securities/instruments prices, market indexes, operational or financial conditions of companies or other factors. There may be time limitations on the exercise of options or other rights in securities/instruments transactions. Past performance is not necessarily a guide to future performance. Estimates of future performance are based on assumptions that may not be realized. Actual events may differ from those assumed and changes to any assumptions may have a material impact on any projections or estimates. Other events not taken into account may occur and may significantly affect the projections or estimates. Certain assumptions may have been made for modeling purposes only to simplify the presentation and/or calculation of any projections or estimates, and the Underwriters do not represent that any such assumptions will reflect actual future events. Accordingly, there can be no assurance that estimated returns or projections will be realized or that actual returns or performance results will not materially differ from those estimated herein. Some of the information contained in this document may be aggregated data of transactions in securities or other financial instruments executed by an Underwriter that has been compiled so as not to identify the underlying transactions of any particular customer.
Notwithstanding anything herein to the contrary, the Underwriters and each recipient hereof agree that they (and their employees, representatives, and other agents) may disclose to any and all persons, without limitation of any kind from the commencement of discussions, the U.S. federal and state income tax treatment and tax structure of the transaction and all materials of any kind (including opinions or other tax analyses) that are provided to it relating to the tax treatment and tax structure (as such terms are defined in Treasury Regulation 1.6011-4). For this purpose, "tax structure" is limited to facts relevant to the U.S. federal and state income tax treatment of the transaction and does not include information relating to the identity of the parties, their affiliates, agents or advisors. This authorization of tax disclosure is retroactively effective to the commencement of discussions with prospective investors regarding the transactions contemplated herein.
THE DISTRIBUTION OF THIS MATERIAL (A) IF MADE BY A PERSON WHO IS NOT AN AUTHORIZED PERSON UNDER THE FINANCIAL SERVICES AND MARKETS ACT 2000 (“FSMA”), IS BEING MADE ONLY TO, OR DIRECTED ONLY AT, PERSONS WHO (I) ARE OUTSIDE THE UNITED KINGDOM, OR (II) HAVE PROFESSIONAL EXPERIENCE IN MATTERS RELATING TO INVESTMENTS AND QUALIFY AS INVESTMENT PROFESSIONALS IN ACCORDANCE WITH ARTICLE 19(5) OF THE FINANCIAL SERVICES AND MARKETS ACT 2000 (FINANCIAL PROMOTION) ORDER 2005 (AS AMENDED, THE “FINANCIAL PROMOTION ORDER”), OR (III) ARE PERSONS FALLING WITHIN ARTICLE 49(2)(A) THROUGH (D) (“HIGH NET WORTH COMPANIES, UNINCORPORATED ASSOCIATIONS, ETC.”) OF THE FINANCIAL PROMOTION ORDER OR, (IV) ARE PERSONS TO WHOM THIS MATERIAL MAY OTHERWISE LAWFULLY BE COMMUNICATED OR DIRECTED; AND (B) IF MADE BY A PERSON WHO IS AN AUTHORIZED PERSON UNDER THE FSMA, IS BEING MADE ONLY TO, OR DIRECTED ONLY AT, PERSONS WHO (I) ARE OUTSIDE THE UNITED KINGDOM, OR (II) HAVE PROFESSIONAL EXPERIENCE OF PARTICIPATING IN UNREGULATED SCHEMES (AS DEFINED FOR PURPOSES OF THE FINANCIAL SERVICES AND MARKETS ACT 2000 (PROMOTION OF COLLECTIVE INVESTMENT SCHEMES) (EXEMPTIONS) ORDER 2001 (AS AMENDED, THE “PROMOTION OF COLLECTIVE INVESTMENT SCHEMES EXEMPTIONS ORDER”)) AND QUALIFY AS INVESTMENT PROFESSIONALS IN ACCORDANCE WITH ARTICLE 14(5) OF THE PROMOTION OF COLLECTIVE INVESTMENT SCHEMES EXEMPTIONS ORDER, OR (III) ARE PERSONS FALLING WITHIN ARTICLE 22(2)(A) THROUGH (D) (HIGH NET WORTH COMPANIES, UNINCORPORATED ASSOCIATIONS, ETC.) OF THE PROMOTION OF COLLECTIVE INVESTMENT SCHEMES EXEMPTIONS ORDER, OR (IV) ARE PERSONS TO WHOM THE ISSUING ENTITY MAY LAWFULLY BE PROMOTED IN ACCORDANCE WITH SECTION 4.12 OF THE FCA HANDBOOK CONDUCT OF BUSINESS SOURCEBOOK.
THE OFFERED CERTIFICATES HAVE NOT BEEN AND WILL NOT BE REGISTERED UNDER THE FINANCIAL INSTRUMENTS AND EXCHANGE LAW OF JAPAN, AS AMENDED (THE “FIEL”), AND DISCLOSURE UNDER THE FIEL HAS NOT BEEN AND WILL NOT BE MADE WITH RESPECT TO THE OFFERED CERTIFICATES. ACCORDINGLY, EACH OF BOFA SECURITIES, INC., MORGAN STANLEY & CO. LLC, WELLS FARGO SECURITIES, LLC, ACADEMY SECURITIES, INC. AND DREXEL HAMILTON, LLC HAS REPRESENTED AND AGREED THAT IT HAS NOT, DIRECTLY OR INDIRECTLY, OFFERED OR SOLD AND WILL NOT, DIRECTLY OR INDIRECTLY, OFFER OR SELL ANY OFFERED CERTIFICATES, IN JAPAN OR TO, OR FOR THE BENEFIT OF, ANY RESIDENT OF JAPAN (WHICH TERM AS USED IN THIS MATERIAL MEANS ANY PERSON RESIDENT IN JAPAN, INCLUDING ANY CORPORATION OR OTHER ENTITY ORGANIZED UNDER THE LAWS OF JAPAN) OR TO OTHERS FOR REOFFERING OR RE SALE, DIRECTLY OR INDIRECTLY, IN JAPAN OR TO, OR FOR THE BENEFIT OF, ANY RESIDENT OF JAPAN EXCEPT PURSUANT TO AN EXEMPTION FROM THE REGISTRATION REQUIREMENTS OF, AND OTHERWISE IN COMPLIANCE WITH, THE FIEL AND OTHER RELEVANT LAWS, REGULATIONS AND MINISTERIAL GUIDELINES OF JAPAN. AS PART OF THIS OFFERING OF THE OFFERED CERTIFICATES, THE UNDERWRITERS MAY OFFER THE OFFERED CERTIFICATES IN JAPAN TO UP TO 49 OFFEREES IN ACCORDANCE WITH THE ABOVE PROVISIONS.