united states
securities and exchange commission
washington, d.c. 20549
form n-csr
certified shareholder report of registered management
investment companies
Investment Company Act file number 333-264440
Cantor Select Portfolios Trust
(Exact name of registrant as specified in charter)
110 E. 59th Street, New York, NY 10022
(Address of principal executive offices) (Zip code)
Corporation Services Company
251 Little Falls Drive
Wilmington, DE 19808
New Castle County
(Name and address of agent for service)
Registrant's telephone number, including area code: 212-915-1722
Date of fiscal year end: 9/30
Date of reporting period: 3/31/2023
Form N-CSR is to be used by management investment companies to file reports with the Commission not later than 10 days after the transmission to stockholders of any report that is required to be transmitted to stockholders under Rule 30e-1 under the Investment Company Act of 1940 (17 CFR 270.30e-1). The Commission may use the information provided on Form N-CSR in its regulatory, disclosure review, inspection and policymaking roles.
A registrant is required to disclose the information specified by Form N-CSR, and the Commission will make this information public. A registrant is not required to respond to the collection of information contained in Form N-CSR unless the Form displays a currently valid Office of Management and Budget ("OMB") control number. Please direct comments concerning the accuracy of the information collection burden estimate and any suggestions for reducing the burden to Secretary, Securities and Exchange Commission, 450 Fifth Street, NW, Washington, DC 20549-0609. The OMB has reviewed this collection of information under the clearance requirements of 44 U.S.C. § 3507.
Item 1. Reports to Stockholders.
| (a) |
 |
| Cantor Growth Equity Fund |
| Semi-Annual Report |
| March 31, 2023 |
Management’s Discussion and Analysis (Unaudited)
Market Review
Global equity markets started this fiscal year with a reversal of the downtrend of the first nine months of calendar 2022 and finished solidly in the black for the quarter. This was followed by an even stronger upward move in the second quarter as investors shrugged off inflation fears and bank failures. Common sense would seem to suggest that financial markets would not respond favorably to the shotgun wedding of Credit Suisse to UBS and the second and third largest bank failures in U.S. history. However, market participants have learned over the last 40-years that financial crises are a good time to buy risk assets because central banks will ride to the rescue with a flood of liquidity and lower interest rates. During the fiscal second quarter, market participants once again shrugged off common sense and ran with those lessons. The result was upward moves of 15.6% in domestic equities (S&P 500 Index) and 22.1% in non-U.S. markets (MSCI All-Country World Index ex-US), although dramatic outperformance of many mega-cap technology stocks, almost to the exclusion of other stocks was a dominant theme.
Within the Fund
For the six-month period ended March 31, 2023, Cantor Growth Equity Fund (the “Fund”) Institutional Class shares net of fee performance outperformed the Fund’s benchmark, the Russell 1000 Growth Index.
The Fund’s holdings within the Consumer Discretionary and Industrials sectors contributed the most to positive relative return, while the Fund’s positioning in the Technology and Consumer Staples sectors had the most negative effect on relative performance. The small Cash balance of the Fund was also a significant negative contributor given the relatively large upward move in the benchmark during the six-month period. Stock selection provided all of the positive relative performance, slightly offset by a slight negative effect from sector allocation. The Fund’s overweight exposure to the Financials sector caused 0.6% of relative underperformance. Also, as discussed below, the underweight exposure to the Technology sector had a negative effect while the overweight position in the Industrials sector was a positive.
The Consumer Discretionary sector delivered significantly better relative performance with a 15.6% return while in the benchmark the sector returned 1.0%.
| ● | Amazon.com, Inc., the global online retailer and web services operator, reported revenues for the September quarter that were just short of expectations. Also, management indicated some unexpected slowdown in the web services segment. Thus, shares posted a return of –24.3% during the period. As the Fund had a negative exposure in the stock with a weight of 0.8% relative to the benchmark’s weight of 2.23% during the period, the result was a 1.2% positive performance effect relative to the benchmark. |
The Fund holdings in the Industrials sector delivered the best absolute performance with the Fund’s holdings returning 34.1% compared to a 21.7% return in the benchmark sector. In addition, as Industrials was the second best performing sector in the benchmark, the Fund’s 13.4% weight versus a 7.7% weight in the index delivered a positive allocation effect of almost 0.4%.
| ● | Parker-Hannifin Corp., a diversified industrial conglomerate that operates across a wide variety of end markets reported two solid quarterly results during the period. In addition, management provided a positive outlook that allowed analysts to increase the forecast for the coming year. As a result, shares gained 39.9% during the six months. |
On the negative side, the Fund’s positioning in the Technology and Consumer Staples sectors caused most of the lagging performance.
1
In the Technology sector, the Fund’s holdings posted a return of 22.4%, worse than the 26.4% sector return in the index. However, as Technology was the best performing sector in the benchmark, the Fund’s 31.2% weight versus a 44.1% weight in the index caused sector allocation to add more than 1.2% of negative relative performance. In total, the sector delivered 2.5% of relative underperformance for the six-month period.
| ● | Qualys, Inc., a provider of cloud-based IT security and compliance solutions, has an impressive record of delivering earnings that are better than analysts’ expectations. However, during the period the market became concerned that business spending on IT security will slow relative to the pandemic years. As a result, shares declined 6.8% during the six-month period. |
The Fund’s holdings in the Consumer Staples sector returned 9.9% during the period, compared to a benchmark sector return of 12.7%.
| ● | Costco Wholesale Corp., the membership warehouse shopping club, reported revenues just shy of expectations and earnings that came in 2% short for the September quarter. The company experienced margin pressure from rapidly rising costs at the same time as same store sales growth failed to surprise to the upside for the period. While the report for the following quarter was better, even with a rebound in the shares the return for the stock was 5.5% for the full six-month period. |
Outlook
In September 2022, Federal Reserve Chair Jerome Powell stated, “We have got to get inflation behind us. I wish there were a painless way to do that. There isn’t.” At the time market participants speculated Powell was acknowledging the Fed was willing to push the economy into recession or accept a financial crisis. The Fed certainly got the latter. As for the former, the Atlanta Fed GDPNow Forecast for the first quarter currently stands at 2.5%. Certainly not a level that indicates an economy in turmoil. We believe the actions the Fed has taken to date will prove sufficient to anchor inflation expectations and that further rate increases will not prove necessary; however, we do not believe rate decreases are likely in 2023, unless further financial contagion arises. The U.S. labor market remains quite resilient with close to 5 million more job openings than unemployed (approx. 11 million openings for approximately 6 million unemployed). Key inflation metrics are all headed down and it is likely the events of the past month with SVB, SBNY and Credit Suisse will all catalyze a further decline in inflation as credit markets tighten further. Since 1996 the Fed has targeted a 2% inflation rate and over that time Core PCE and CPI have averaged 1.9% and 2.5%, respectively. The current trend indicates inflation will be in the range of 2-3% by year-end 2023. We believe the Fed is done with rate increases and will take a wait and see approach on further declines in inflation and financial market fallout. We also expect earnings to continue a modest downturn but believe much of that is already priced into equity markets. There are still some very challenging days, weeks and months ahead but avoiding a deep recession does appear possible and a significant upturn in earnings should be expected as the inflationary peak gets further in the rear-view mirror.
Investors should consider the investment objectives, risks, and charges and expenses of the Fund before investing. The prospectus contains this and other information about the Fund and should be read carefully before investing. The prospectus may be obtained at 833-764-2266 or visiting www.cantorgrowthequityfund.com.
The Fund is distributed by Ultimus Fund Distributors, LLC, Member FINRA/SPIC.
2
Important Risk Information:
Investing involves risk, including loss of principal. There is no guarantee that any investment strategy will achieve its objectives, generate profits or avoid losses. The Fund will be subject to the following principal risks: market risk, growth stock risk, limited number of securities risk, sector risk, company size risk, liquidity risk, active management and selection risk, COVID-19 risk, and cybersecurity risk.
Definitions
The S&P 500 Index is an unmanaged index of the shares of large U.S. corporations. All index performance includes capital appreciation and reinvested dividends and is presented gross of fees.
The Russell 1000 Growth Index is an unmanaged index of the shares of large U.S. corporations. All index performance includes capital appreciation and reinvested dividends and is presented gross of fees.
The Consumer Price Index (CPI) measures the monthly change in prices paid by U.S. consumers. The Bureau of Labor Statistics (BLS) calculates the CPI as a weighted average of prices for a basket of goods and services representative of aggregate U.S. consumer spending.
The Core PCE price index is defined as personal consumption expenditures (PCE) prices excluding food and energy prices. The U.S. Bureau of Economic Analysis (BEA) calculates Core PCE. The core PCE price index measures the prices paid by consumers for goods and services without the volatility caused by movements in food and energy prices to reveal underlying inflation trends.
The Atlanta Federal Reserve GDPNow is not an official forecast of the Atlanta Fed. Rather, it is best viewed as a running estimate of real GDP growth based on available economic data for the current measured quarter. There are no subjective adjustments made to GDPNow—the estimate is based solely on the mathematical results of the model.
3
| CANTOR GROWTH EQUITY FUND |
| COMPARATIVE PERFORMANCE CHARTS |
| (Unaudited) |
| Average Annual Total Returns(a) (for the periods ended March 31, 2023) | ||||||||||||||
| Since | Inception | |||||||||||||
| Cantor Growth Equity Fund | 6 Months | 1 Year | 5 Years | 10 Years | inception | Date | ||||||||
| Class A(b) excluding sales charges | 21.20% | (6.14%) | 12.08% | 13.21% | N/A | 10/25/2000 | ||||||||
| Class A(b) including sales charges | 14.24% | (11.52%) | 10.76% | 12.54% | N/A | 10/25/2000 | ||||||||
| Institutional Class(c) | 21.49% | (5.84%) | 12.42% | N/A | 13.65% | 4/1/2013 | ||||||||
| Class R6(d) | 21.39% | (5.86%) | 12.48% | N/A | 13.74% | 4/1/2013 | ||||||||
| Russell 1000 Growth Index | 16.88% | (10.90%) | 13.66% | 14.59% | 14.67% | * | ||||||||
| * | The since inception return for the Russell 1000 Growth Index is as of 4/1/2013. |
| (a) | Total returns are a measure of the change in value of an investment in the Fund over the periods covered, which assumes any dividends or capital gains distributions are reinvested in shares of the Fund. Returns do not reflect the deduction of taxes a shareholder would pay on the Fund’s distributions or the redemption of Fund shares. Expense limitations were in effect for certain classes during some or all of the periods shown. Performance would have been lower had expense limitations not been in effect. Total returns for less than one year are not annualized. |
| (b) | Class A shares are sold with a maximum front-end sales charge of 5.75% and have an annual 12b-1 fee of 0.25% of average daily net assets. Performance of Class A shares, excluding sales charges, assumes that no front-end sales charges applied. |
| (c) | Institutional Class shares are not subject to a sales charge and are offered for sale exclusively to certain eligible investors. Institutional Class shares pay no distribution and service (12b-1) fees. |
| (d) | Class R6 shares are available only to certain investors. In addition, Class R6 shares do not pay any service fees, sub-accounting fees, and or/ sub-transfer agency fees to any brokers, dealers, or other financial intermediaries. Class R6 shares pay no 12b-1 fees. |
The Fund’s net expense ratios, as described in the most recent prospectus dated February 1, 2023, were 1.17%, 0.86%, and 0.79% for Class A, Institutional Class and Class R6, respectively. Without the waiver, the expenses would be 1.35%, 1.02%, and 0.94% for Class A, Institutional Class, and Class R6, respectively, per the Fund’s most recent prospectus dated February 1, 2023. Cantor Fitzgerald Investment Advisors, L.P. (“the Advisor”) has agreed to waive or reduce its management fees and to assume other expenses of the Fund in an amount that limits the Total Annual Operating Expenses of the Fund (exclusive of (i) brokerage fees and commissions; (ii) acquired fund fees and expenses; (iii) fees and expenses associated with investments in other collective investment vehicles or derivative instruments (including, for example, option and swap fees and expenses); (iv) borrowing costs (such as interest and dividend expense on securities sold short); (v) taxes and (vi) extraordinary expenses, such as litigation expenses (which may include indemnification of Fund officers and Trustees and contractual indemnification of Fund service providers (other than the Advisor or Sub-Advisor) but inclusive of organizational costs and offering costs) to not more than 1.17%, 0.86%, and 0.79% of the average daily net assets of the Class A, Institutional Class and Class R6 shares
4
| CANTOR GROWTH EQUITY FUND |
| COMPARATIVE PERFORMANCE CHARTS |
| (Unaudited)(Continued) |
of the Fund, respectively. This contractual arrangement is in effect through September 16, 2024, unless terminated by the Board of Trustees of the Trust at any time. Please see the “Financial Highlights” section in this report for the most recent expense ratios.
The performance quoted represents past performance, which does not guarantee future results. The investment return and principal value of an investment will fluctuate so that an investor’s shares, when redeemed, may be worth more or less than their original cost. The returns shown do not reflect deduction of taxes that a shareholder would pay on Fund distributions or the redemption of Fund shares. Current performance of the Fund may be lower or higher than the performance quoted. The Fund’s investment objectives, risks, charges and expenses should be considered carefully before investing. Performance data current to the most recent month-end may be obtained by calling 1-833-764-2266.
The Fund’s investment objectives, strategies, risks, charges and expenses should be considered carefully before investing. The prospectus contains this and other important information about the Fund and may be obtained by calling the same number as above. Please read it carefully before investing.
The Fund is distributed by Ultimus Fund Distributors, LLC, member FINRA.
5
| CANTOR GROWTH EQUITY FUND |
| PORTFOLIO INFORMATION |
| March 31, 2023 (Unaudited) |
Sector Diversification
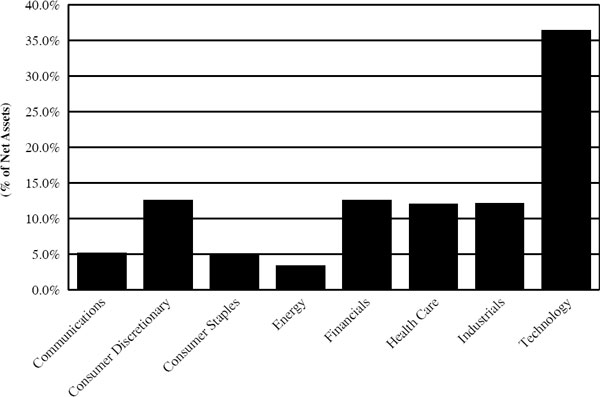
| Ten Largest Equity Holdings | % of Net Assets | |
| Apple, Inc. | 4.7% | |
| Microsoft Corp. | 4.5% | |
| Cadence Design Systems, Inc. | 3.9% | |
| AutoZone, Inc. | 3.5% | |
| Parker-Hannifin Corp. | 3.4% | |
| Arch Capital Group Ltd. | 3.2% | |
| KLA Corporation | 3.1% | |
| EMCOR Group, Inc. | 3.0% | |
| Costco Wholesale Corp. | 3.0% | |
| Fortinet, Inc. | 3.0% |
6
| CANTOR GROWTH EQUITY FUND |
| SCHEDULE OF INVESTMENTS |
| March 31, 2023 (Unaudited) |
| COMMON STOCKS — 98.79% | Shares | Fair Value | ||||||
| Communications — 5.09% | ||||||||
| Alphabet, Inc., Class A(a) | 73,110 | $ | 7,583,701 | |||||
| Omnicom Group, Inc. | 76,310 | 7,199,085 | ||||||
| 14,782,786 | ||||||||
| Consumer Discretionary — 12.54% | ||||||||
| AutoZone, Inc.(a) | 4,100 | 10,078,415 | ||||||
| Booking Holdings, Inc.(a) | 2,850 | 7,559,369 | ||||||
| Boyd Gaming Corp. | 109,000 | 6,989,080 | ||||||
| SeaWorld Entertainment, Inc.(a) | 92,040 | 5,642,972 | ||||||
| Ulta Beauty, Inc.(a) | 11,290 | 6,160,614 | ||||||
| 36,430,450 | ||||||||
| Consumer Staples — 4.86% | ||||||||
| Costco Wholesale Corp. | 17,280 | 8,585,914 | ||||||
| Performance Food Group Co.(a) | 91,750 | 5,536,195 | ||||||
| 14,122,109 | ||||||||
| Energy — 3.32% | ||||||||
| Exxon Mobil Corp. | 54,580 | 5,985,243 | ||||||
| Marathon Petroleum Corp. | 27,100 | 3,653,893 | ||||||
| 9,639,136 | ||||||||
| Financials — 12.52% | ||||||||
| American Express Co. | 43,890 | 7,239,656 | ||||||
| Ameriprise Financial, Inc. | 24,900 | 7,631,850 | ||||||
| Arch Capital Group Ltd.(a) | 137,690 | 9,345,020 | ||||||
| JPMorgan Chase & Co. | 40,640 | 5,295,798 | ||||||
| W.R. Berkley Corp. | 109,950 | 6,845,487 | ||||||
| 36,357,811 | ||||||||
| Health Care — 12.01% | ||||||||
| Agilent Technologies, Inc. | 36,150 | 5,000,991 | ||||||
| IQVIA Holdings, Inc.(a) | 27,670 | 5,503,286 | ||||||
| McKesson Corp. | 17,570 | 6,255,799 | ||||||
| Merck & Co., Inc. | 53,980 | 5,742,932 | ||||||
| Vertex Pharmaceuticals, Inc.(a) | 16,260 | 5,123,038 | ||||||
| Zimmer Biomet Holdings, Inc. | 56,080 | 7,245,536 | ||||||
| 34,871,582 | ||||||||
| Industrials — 12.09% | ||||||||
| Clean Harbors, Inc.(a) | 56,340 | 8,031,830 | ||||||
| EMCOR Group, Inc. | 53,810 | 8,748,968 | ||||||
| Parker-Hannifin Corp. | 29,180 | 9,807,690 | ||||||
| United Rentals, Inc. | 21,520 | 8,516,755 | ||||||
| 35,105,243 | ||||||||
7
| CANTOR GROWTH EQUITY FUND |
| SCHEDULE OF INVESTMENTS (Unaudited) (Continued) |
| COMMON STOCKS — 98.79% (Continued) | Shares | Fair Value | ||||||
| Technology — 36.36% | ||||||||
| Adobe, Inc.(a) | 18,320 | $ | 7,059,978 | |||||
| Apple, Inc. | 83,598 | 13,785,310 | ||||||
| Cadence Design Systems, Inc.(a) | 53,520 | 11,244,017 | ||||||
| ExlService Holdings, Inc.(a) | 29,730 | 4,811,206 | ||||||
| Fortinet, Inc.(a) | 129,070 | 8,577,992 | ||||||
| Gartner, Inc.(a) | 21,360 | 6,958,447 | ||||||
| Jabil, Inc. | 69,730 | 6,147,397 | ||||||
| Juniper Networks, Inc. | 190,500 | 6,557,010 | ||||||
| KLA Corporation | 22,510 | 8,985,317 | ||||||
| Manhattan Associates, Inc.(a) | 34,140 | 5,286,579 | ||||||
| Microsoft Corp. | 45,100 | 13,002,330 | ||||||
| Qualys, Inc.(a) | 42,940 | 5,583,059 | ||||||
| Workday, Inc., Class A(a) | 37,000 | 7,641,980 | ||||||
| 105,640,622 | ||||||||
| Total Common Stocks (Cost $207,654,718) | $ | 286,949,739 | ||||||
| MONEY MARKET FUNDS — 1.37% | Shares | Fair Value | ||||||
| Fidelity Investments Money Market Fund, Institutional Class, 4.72%(b) | 3,975,451 | $ | 3,975,451 | |||||
| Total Money Market Funds | ||||||||
| (Cost $3,975,451) | 3,975,451 | |||||||
| Total Investments — 100.16% | ||||||||
| (Cost $211,630,169) | $ | 290,925,190 | ||||||
| Liabilities in Excess of Other Assets — (0.16)% | (457,667 | ) | ||||||
| NET ASSETS — 100.00% | $ | 290,467,523 | ||||||
| (a) | Non-income producing security. |
| (b) | Rate disclosed is the seven-day effective yield as of March 31, 2023. |
See accompanying notes to financial statements.
8
| CANTOR GROWTH EQUITY FUND |
| STATEMENT OF ASSETS AND LIABILITIES (Unaudited) |
| March 31, 2023 |
| ASSETS | ||||
| Investments in securities: | ||||
| At cost | $ | 211,630,169 | ||
| At value | $ | 290,925,190 | ||
| Receivable for capital shares sold | 92,632 | |||
| Dividends receivable | 152,410 | |||
| Other assets | 15,669 | |||
| TOTAL ASSETS | 291,185,901 | |||
| LIABILITIES | ||||
| Payable for capital shares redeemed | 58,845 | |||
| Accrued investment advisory fees, net of waiver | 113,828 | |||
| Accrued shareholders services fees - Class A | 73,176 | |||
| Accrued 12b-1 fees - Class A | 71,257 | |||
| Payable to administrator | 63,434 | |||
| Other accrued expenses and liabilities | 337,838 | |||
| TOTAL LIABILITIES | 718,378 | |||
| NET ASSETS | $ | 290,467,523 | ||
| NET ASSETS CONSISTS OF | ||||
| Paid-in capital | $ | 208,929,371 | ||
| Accumulated earnings | 81,538,152 | |||
| Net Assets | $ | 290,467,523 |
See accompanying notes to financial statements.
9
| CANTOR GROWTH EQUITY FUND |
| STATEMENT OF ASSETS AND LIABILITIES (Unaudited) (Continued) |
| March 31, 2023 |
| Class A: | ||||
| Net assets | $ | 282,048,195 | ||
| Shares of beneficial interest outstanding, unlimited authorization, no par value | 31,402,040 | |||
| Net asset value per share | $ | 8.98 | ||
| Sales charge | 5.75 | % | ||
| Offering price per share, equal to net assets value per share/(1-sales charge) | $ | 9.53 | ||
| Institutional Class: | ||||
| Net assets | $ | 8,332,149 | ||
| Shares of beneficial interest outstanding, unlimited authorization, no par value | 872,749 | |||
| Net asset value per share | $ | 9.55 | ||
| Class R6: | ||||
| Net assets | $ | 87,179 | ||
| Shares of beneficial interest outstanding, unlimited authorization, no par value | 8,985 | |||
| Net asset value per share | $ | 9.70 |
See accompanying notes to financial statements.
10
| CANTOR GROWTH EQUITY FUND |
| STATEMENT OF OPERATIONS (Unaudited) |
| For the Six Months Ended March 31, 2023 |
| INVESTMENT INCOME | ||||
| Dividends | $ | 2,748,183 | ||
| Expenses: | ||||
| Advisor fees | 903,029 | |||
| 12b-1 fees - Class A | 339,659 | |||
| Shareholder services fees - Class A | 211,321 | |||
| Shareholder services fees - Institutional Class | 2,437 | |||
| Transfer agent fees | 101,696 | |||
| Administration and accounting fees | 89,236 | |||
| Insurance expense | 45,609 | |||
| Trustee fees | 34,405 | |||
| Registration fees | 29,138 | |||
| Compliance services fees | 26,461 | |||
| Legal fees | 24,932 | |||
| Printing and mailing expense | 12,753 | |||
| Custodian fees | 12,665 | |||
| Audit and tax services fees | 9,972 | |||
| Other fees | 11,381 | |||
| TOTAL EXPENSES | 1,854,694 | |||
| Fees reduced by the Advisor | (237,895 | ) | ||
| NET EXPENSES | 1,616,799 | |||
| NET INVESTMENT INCOME | 1,131,384 | |||
| REALIZED AND CHANGE IN UNREALIZED GAIN ON INVESTMENTS | ||||
| Net realized gain from investments transactions | 1,569,472 | |||
| Net change in unrealized appreciation on investments | 50,491,327 | |||
| NET REALIZED AND CHANGE IN UNREALIZED GAIN ON INVESTMENTS | 52,060,799 | |||
| NET INCREASE IN NET ASSETS RESULTING FROM OPERATIONS | $ | 53,192,183 |
See accompanying notes to financial statements.
11
| CANTOR GROWTH EQUITY FUND |
| STATEMENTS OF CHANGES IN NET ASSETS |
| For the | ||||||||
| Six Months | For the | |||||||
| Ended | Year Ended | |||||||
| March 31, 2023 | September 30, | |||||||
| (Unaudited) | 2022 | |||||||
| OPERATIONS | ||||||||
| Net investment income (loss) | $ | 1,131,384 | $ | (997,086 | ) | |||
| Net realized gains from investments | 1,569,472 | 118,557,115 | ||||||
| Net change in unrealized appreciation (depreciation) on investments | 50,491,327 | (220,652,925 | ) | |||||
| Net increase (decrease) in net assets resulting from operations | 53,192,183 | (103,092,896 | ) | |||||
| DISTRIBUTIONS TO SHAREHOLDERS | ||||||||
| Distributed earnings: | ||||||||
| Class A | (66,657,163 | ) | (156,566,728 | ) | ||||
| Institutional Class | (1,294,549 | ) | (14,457,651 | ) | ||||
| Class R6 | (10,982 | ) | (486,387 | ) | ||||
| (67,962,694 | ) | (171,510,766 | ) | |||||
| CAPITAL SHARE TRANSACTIONS | ||||||||
| Proceeds from shares sold: | ||||||||
| Class A | 3,931,391 | 22,095,175 | ||||||
| Institutional Class | 4,100,719 | 7,078,526 | ||||||
| Class R6 | 39,400 | 168,804 | ||||||
| 8,071,510 | 29,342,505 | |||||||
| Net asset value of shares issued upon reinvestment of distributions to shareholders | ||||||||
| Class A | 66,447,132 | 156,152,307 | ||||||
| Institutional Class | 1,285,038 | 14,449,952 | ||||||
| Class R6 | 10,982 | 486,387 | ||||||
| 67,743,152 | 171,088,646 | |||||||
| Payment for shares redeemed | ||||||||
| Class A | (26,856,324 | ) | (189,268,161 | ) | ||||
| Institutional Class | (2,252,186 | ) | (76,667,761 | ) | ||||
| Class R6 | (1,767 | ) | (1,919,614 | ) | ||||
| (29,110,277 | ) | (267,855,536 | ) | |||||
| Net increase (decrease) in net assets from capital share transactions | 46,704,385 | (67,424,385 | ) | |||||
| TOTAL INCREASE (DECREASE) IN NET ASSETS | 31,933,874 | (342,028,047 | ) | |||||
| NET ASSETS | ||||||||
| Beginning of period | 258,533,649 | 600,561,696 | ||||||
| End of period | $ | 290,467,523 | $ | 258,533,649 | ||||
See accompanying notes to financial statements.
12
| CANTOR GROWTH EQUITY FUND |
| STATEMENTS OF CHANGES IN NET ASSETS (Continued) |
| For the | ||||||||
| Six Months | For the | |||||||
| Ended | Year Ended | |||||||
| March 31, 2023 | September 30, | |||||||
| (Unaudited) | 2022 | |||||||
| CAPITAL SHARE ACTIVITY | ||||||||
| Shares sold: | ||||||||
| Class A | 437,043 | 1,610,359 | ||||||
| Institutional Class | 447,057 | 492,324 | ||||||
| Class R6 | 4,228 | 10,639 | ||||||
| 888,328 | 2,113,322 | |||||||
| Shares reinvested: | ||||||||
| Class A | 7,744,421 | 11,185,695 | ||||||
| Institutional Class | 141,058 | 991,081 | ||||||
| Class R6 | 1,186 | 32,975 | ||||||
| 7,886,665 | 12,209,751 | |||||||
| Shares redeemed: | ||||||||
| Class A | (2,941,263 | ) | (16,018,619 | ) | ||||
| Institutional Class | (239,052 | ) | (5,395,037 | ) | ||||
| Class R6 | (168 | ) | (138,999 | ) | ||||
| (3,180,483 | ) | (21,552,655 | ) | |||||
| Net increase (decrease) in shares outstanding | 5,594,510 | (7,229,582 | ) | |||||
| Shares outstanding, beginning of period | 26,689,264 | 33,918,846 | ||||||
| Shares outstanding, end of period | 32,283,774 | 26,689,264 | ||||||
See accompanying notes to financial statements.
13
| CANTOR GROWTH EQUITY FUND |
| FINANCIAL HIGHLIGHTS |
| Class A |
Selected Per Share Data for a Share Outstanding Throughout Each Period
| Six Months | ||||||||||||||||||||||||
| Ended | ||||||||||||||||||||||||
| March 31, | Years Ended September 30, | |||||||||||||||||||||||
| 2023 | 2022(a) | 2021 | 2020(b) | 2019 | 2018 | |||||||||||||||||||
| Net asset value, beginning of period | $ | 9.68 | $ | 17.63 | $ | 13.67 | $ | 12.09 | $ | 13.61 | $ | 12.04 | ||||||||||||
| Income (loss) from investment operations: | ||||||||||||||||||||||||
| Net investment income (loss)(c) | 0.16 | (0.03 | ) | (0.04 | ) | (0.03 | ) | 0.02 | (0.01 | ) | ||||||||||||||
| Net realized and unrealized gains (losses) on investments | 1.89 | (2.42 | ) | 5.37 | 2.93 | (0.92 | ) | 2.66 | ||||||||||||||||
| Total from investment operations | 2.05 | (2.45 | ) | 5.33 | 2.90 | (0.90 | ) | 2.65 | ||||||||||||||||
| Less distributions from: | ||||||||||||||||||||||||
| Net investment income | (0.12 | ) | — | — | (0.02 | ) | — | (0.01 | ) | |||||||||||||||
| Net realized gains | (2.63 | ) | (5.50 | ) | (1.37 | ) | (1.30 | ) | (0.62 | ) | (1.07 | ) | ||||||||||||
| Total distributions | (2.75 | ) | (5.50 | ) | (1.37 | ) | (1.32 | ) | (0.62 | ) | (1.08 | ) | ||||||||||||
| Net asset value, end of period | $ | 8.98 | $ | 9.68 | $ | 17.63 | $ | 13.67 | $ | 12.09 | $ | 13.61 | ||||||||||||
| Total return(d) | 21.20 | % (e) | (23.47 | %) | 41.67 | % | 25.53 | % | (6.01 | %) | 23.22 | % | ||||||||||||
| Net assets at end of period (000’s) | $ | 282,048 | $ | 253,190 | $ | 518,096 | $ | 472,795 | $ | 507,351 | $ | 570,309 | ||||||||||||
| Ratio of total expenses to average net assets(f) | 1.17 | % (g) | 1.12 | % | 1.09 | % | 1.14 | % | 1.20 | % | 1.22 | % | ||||||||||||
| Ratio of net expenses to average net assets(f) | 1.00 | % (g) | 1.11 | % | 1.09 | % | 1.14 | % | 1.19 | % | 1.22 | % | ||||||||||||
| Ratio of net investment income (loss) to average net assets | 0.81 | % (g) | (0.22 | %) | (0.28 | %) | (0.22 | %) | 0.16 | % | (0.06 | %) | ||||||||||||
| Portfolio turnover rate(h) | 15 | % (e) | 40 | % | 31 | % | 37 | % | 51 | % | 37 | % | ||||||||||||
| (a) | Effective close of business on September 16, 2022, Class A shares of Delaware Growth Equity Fund were reorganized into Class A shares of Cantor Growth Equity Fund. See notes to the financial statements. The Class A shares’ financial highlights for the periods prior to September 16, 2022 reflect the performance of Delaware Growth Equity Fund. |
| (b) | On October 4, 2019, Class A shares of First Investors Select Growth Fund were reorganized into Class shares of Delaware Growth Equity Fund. The Class A shares’ financial highlights for the periods prior to October 4, 2019 reflect the performance of First Investors Select Growth Fund Class A shares. |
| (c) | Calculated using average shares outstanding. |
| (d) | Total return is based on the change in net asset value of a share during the period and assumes reinvestment of dividends and distributions at net asset value and does not reflect the impact of a sales charge. |
| (e) | Not annualized. |
| (f) | Expense ratios do not include expenses of the Underlying Funds in which the Fund invests. |
| (g) | Annualized. |
| (h) | Portfolio turnover is calculated on the basis on the Fund as a whole without distinguishing among the classes of shares. |
See accompanying notes to financial statements.
14
| CANTOR GROWTH EQUITY FUND |
| FINANCIAL HIGHLIGHTS |
| Institutional Class |
Selected Per Share Data for a Share Outstanding Throughout Each Period
| Six Months | ||||||||||||||||||||||||
| Ended | ||||||||||||||||||||||||
| March 31, | Years Ended September 30, | |||||||||||||||||||||||
| 2023 | 2022(a) | 2021 | 2020(b) | 2019 | 2018 | |||||||||||||||||||
| Net asset value, beginning of period | $ | 10.13 | $ | 18.18 | $ | 14.03 | $ | 12.38 | $ | 13.89 | $ | 12.23 | ||||||||||||
| Income (loss) from investment operations: | ||||||||||||||||||||||||
| Net investment income (loss)(c) | 0.17 | (0.01 | ) | (0.01 | ) | 0.01 | 0.06 | 0.04 | ||||||||||||||||
| Net realized and unrealized gains (losses) on investments | 2.01 | (2.54 | ) | 5.53 | 3.00 | (0.94 | ) | 2.71 | ||||||||||||||||
| Total from investment operations | 2.18 | (2.55 | ) | 5.52 | 3.01 | (0.88 | ) | 2.75 | ||||||||||||||||
| Less distributions from: | ||||||||||||||||||||||||
| Net investment income | (0.13 | ) | — | — | (0.06 | ) | (0.01 | ) | (0.02 | ) | ||||||||||||||
| Net realized gains | (2.63 | ) | (5.50 | ) | (1.37 | ) | (1.30 | ) | (0.62 | ) | (1.07 | ) | ||||||||||||
| Total distributions | (2.76 | ) | (5.50 | ) | (1.37 | ) | (1.36 | ) | (0.63 | ) | (1.09 | ) | ||||||||||||
| Net asset value at end of period | $ | 9.55 | $ | 10.13 | $ | 18.18 | $ | 14.03 | $ | 12.38 | $ | 13.89 | ||||||||||||
| Total return(d) | 21.49 | % (e) | (23.26 | %) | 41.98 | % | 25.88 | % | (5.74 | %) | 23.74 | % | ||||||||||||
| Net assets, end of period (000’s) | $ | 8,332 | $ | 5,305 | $ | 80,648 | $ | 121,478 | $ | 143,304 | $ | 194,554 | ||||||||||||
| Ratio of total expenses to average net assets(f) | 0.86 | % (g) | 0.85 | % | 0.84 | % | 0.89 | % | 0.89 | % | 0.83 | % | ||||||||||||
| Ratio of net expenses to average net assets(f) | 0.70 | % (g) | 0.84 | % | 0.84 | % | 0.86 | % | 0.88 | % | 0.83 | % | ||||||||||||
| Ratio of net investment income (loss) to average net assets | 1.06 | % (g) | (0.04 | %) | (0.05 | %) | 0.06 | % | 0.50 | % | 0.34 | % | ||||||||||||
| Portfolio turnover rate(h) | 15 | % (e) | 40 | % | 31 | % | 37 | % | 51 | % | 37 | % | ||||||||||||
| (a) | Effective close of business on September 16, 2022, Institutional Class shares of Delaware Growth Equity Fund were reorganized into Institutional Class shares of Cantor Growth Equity Fund. See notes to the financial statements. The Institutional Class shares’ financial highlights for the periods prior to September 16, 2022 reflect the performance of Delaware Growth Equity Fund. |
| (b) | On October 4, 2019, Advisor Class shares of First Investors Select Growth Fund were reorganized into Institutional Class shares of Delaware Growth Equity Fund. The Institutional Class shares’ financial highlights for the periods prior to October 4, 2019 reflect the performance of First Investors Select Growth Fund Advisor Class shares. |
| (c) | Calculated using average shares outstanding. |
| (d) | Total return is based on the change in net asset value of a share during the period and assumes reinvestment of dividends and distributions at net asset value. |
| (e) | Not annualized. |
| (f) | Expense ratios do not include expenses of the Underlying Funds in which the Fund invests. |
| (g) | Annualized. |
| (h) | Portfolio turnover is calculated on the basis on the Fund as a whole without distinguishing among the classes of shares. |
See accompanying notes to financial statements.
15
| CANTOR GROWTH EQUITY FUND |
| FINANCIAL HIGHLIGHTS |
| Class R6 |
Selected Per Share Data for a Share Outstanding Throughout Each Period
| Six Months | ||||||||||||||||||||||||
| Ended | ||||||||||||||||||||||||
| March 31, | Years Ended September 30, | |||||||||||||||||||||||
| 2023 | 2022(a) | 2021 | 2020(b) | 2019 | 2018 | |||||||||||||||||||
| Net asset value, beginning of period | $ | 10.26 | $ | 18.34 | $ | 14.13 | $ | 12.46 | $ | 13.97 | $ | 12.29 | ||||||||||||
| Income (loss) from investment operations: | ||||||||||||||||||||||||
| Net investment income (loss)(c) | 0.17 | (0.01 | ) | 0.01 | 0.02 | 0.07 | 0.05 | |||||||||||||||||
| Net realized and unrealized gains (losses) on investments | 2.03 | (2.57 | ) | 5.57 | 3.02 | (0.95 | ) | 2.72 | ||||||||||||||||
| Total from investment operations | 2.20 | (2.58 | ) | 5.58 | 3.04 | (0.88 | ) | 2.77 | ||||||||||||||||
| Less distributions from: | ||||||||||||||||||||||||
| Net investment income | (0.13 | ) | — | — | (0.07 | ) | (0.01 | ) | (0.02 | ) | ||||||||||||||
| Net realized gains | (2.63 | ) | (5.50 | ) | (1.37 | ) | (1.30 | ) | (0.62 | ) | (1.07 | ) | ||||||||||||
| Total distributions | (2.76 | ) | (5.50 | ) | (1.37 | ) | (1.37 | ) | (0.63 | ) | (1.09 | ) | ||||||||||||
| Net asset value, end of period | $ | 9.70 | $ | 10.26 | $ | 18.34 | $ | 14.13 | $ | 12.46 | $ | 13.97 | ||||||||||||
| Total return(d) | 21.39 | % (e) | (23.20 | %) | 42.12 | % | 25.97 | % | (5.66 | %) | 23.81 | % | ||||||||||||
| Net assets at end of period (000’s) | $ | 87 | $ | 38 | $ | 1,818 | $ | 3,561 | $ | 4,044 | $ | 7,836 | ||||||||||||
| Ratio of total expenses to average net assets(f) | 0.79 | % (g) | 0.77 | % | 0.76 | % | 0.83 | % | 0.80 | % | 0.80 | % | ||||||||||||
| Ratio of net expenses to average net assets(f) | 0.64 | % (g) | 0.76 | % | 0.76 | % | 0.79 | % | 0.79 | % | 0.80 | % | ||||||||||||
| Ratio of net investment income (loss) to average net assets | 1.08 | % (g) | (0.07 | %) | 0.08 | % | 0.12 | % | 0.57 | % | 0.35 | % | ||||||||||||
| Portfolio turnover rate(h) | 15 | % (e) | 40 | % | 31 | % | 37 | % | 51 | % | 37 | % | ||||||||||||
| (a) | Effective close of business on September 16, 2022, Class R6 shares of Delaware Growth Equity Fund were reorganized into Class R6 shares of Cantor Growth Equity Fund. See notes to the financial statements. The Class R6 shares’ financial highlights for the periods prior to September 16, 2022 reflect the performance of Delaware Growth Equity Fund. |
| (b) | On October 4, 2019, Institutional Class shares of First Investors Select Growth Fund were reorganized into Class R6 shares of Delaware Growth Equity Fund. The Class R6 shares’ financial highlights for the periods prior to October 4, 2019 reflect the performance of First Investors Select Growth Fund Institutional Class shares. |
| (c) | Calculated using average shares outstanding. |
| (d) | Total return is based on the change in net asset value of a share during the period and assumes reinvestment of dividends and distributions at net asset value. |
| (e) | Not annualized. |
| (f) | Expense ratios do not include expenses of the Underlying Funds in which the Fund invests. |
| (g) | Annualized. |
| (h) | Portfolio turnover is calculated on the basis on the Fund as a whole without distinguishing among the classes of shares. |
See accompanying notes to financial statements.
16
| CANTOR GROWTH EQUITY FUND |
| NOTES TO FINANCIAL STATEMENTS |
| March 31, 2023 (Unaudited) |
1. Organization
Cantor Select Portfolios Trust (the “Trust”) was organized on December 16, 2021, as a Delaware statutory trust and is authorized to have multiple series or portfolios. The Trust is registered with the U.S. Securities and Exchange Commission (the “SEC”) as an open-end management investment company under the Investment Company Act of 1940, as amended (the “1940 Act”). The Trust currently consists of one series, Cantor Growth Equity Fund (the “Fund”), which is a separate, diversified series of the Trust.
On September 16, 2022, pursuant to an agreement and plan of reorganization (the “Reorganization”), the Delaware Growth Equity Fund (the “Predecessor Fund”), a series of Delaware Group Equity Funds IV, an unaffiliated registered investment company, transferred all of its assets and liabilities into the Fund. The Reorganization was accomplished by a tax-free exchange of 26,447,279 Class A shares, 562,134 Institutional Class shares and 3,736 Class R6 shares of the Predecessor Fund, valued at $272,905,087, $6,071,698 and $40,858, respectively, for the exact same number of shares of the Fund having the same value. For financial reporting purposes, assets received and shares issued by the Fund were recorded at fair value; however, the cost basis of the investments received from the Predecessor Fund was carried forward to align ongoing reporting of the Fund’s realized and unrealized gains and losses with amounts distributable to shareholders for tax purposes. Immediately prior to the Reorganization, the net assets of the Predecessor Fund were $279,017,643, including $50,417,794 of unrealized appreciation, $968,568 accumulated net investment loss, and $59,933,552 of accumulated realized losses. The Fund has succeeded to the accounting and performance history of the Predecessor Fund. The Predecessor Fund and the Fund had identical investment objectives and substantially similar principal investment strategies and principal risks. For financial reporting purposes, the Predecessor Fund’s financial and performance history prior to the Reorganization is carried forward and reflected in the Fund’s financial statements and financial highlights.
The Predecessor Fund commenced operations on October 25, 2000. The Predecessor Fund acquired all of the assets and liabilities of the First Investors Select Growth Fund, a series of First Investors Equity Funds in a tax-free reorganization on October 4, 2019. As a result, the Predecessor Fund succeeded to the performance and accounting history of the First Investors Select Growth Fund.
The investment objective of the Fund is to seek long-term growth of capital.
The Fund offers three types of classes of shares: Class A Shares, Institutional Class Shares and Class R6 Shares. Each class represents interests in the same portfolio of investments and has the same rights, but each class differs with respect to sales loads, minimum investments, and ongoing expenses. Class A Shares charge a 5.75% front-end sales charge, distribution and service plan fees of 0.25%, and no contingent deferred sales charge on shares redeemed. Initial investment is $1,000. Institutional Class Shares and Class R6 have no front-end sales charge, no distribution or service plan fee, and no contingent deferred sales charge on shares redeemed. There are no minimum investments (except for shares purchased through an automatic investment plan) for Institutional Class Shares and Class R6 Shares. Class R6 shares do not pay for any service fees, sub-accounting fees, and /or subtransfer agency fees to any brokers, dealers, or other financial intermediaries.
17
| CANTOR GROWTH EQUITY FUND |
| NOTES TO FINANCIAL STATEMENTS (Unaudited) (Continued) |
2. Significant Accounting Policies
The Fund follows accounting and reporting guidance under Financial Accounting Standards Board (“FASB”) Accounting Standards Codification Topic 946, “Financial Services – Investment Companies.” The following is a summary of the Fund’s significant accounting policies. These policies are in conformity with accounting principles generally accepted in the United States of America (“GAAP”).
Securities valuation — The Fund’s portfolio securities are valued as of the close of business of the regular session of the New York Stock Exchange (normally 4:00 p.m. Eastern Time). Securities traded on a national stock exchange, including common stocks and closed-end investment companies, if any, are valued based upon the closing price on the principal exchange where the security is traded, if available, otherwise, at the last quoted bid price. Securities that are quoted by Nasdaq are valued at the Nasdaq Official Closing Price. Investments representing shares of money market funds and other open-end investment companies are valued at their net asset value (“NAV”) as reported by such companies. When using a quoted price and when the market is considered active, securities will be classified as Level 1 within the fair value hierarchy (see below).
When market quotations are not readily available, if a pricing service cannot provide a price, or if the investment advisor believes the price received from the pricing service is not indicative of market value, securities will be valued in good faith at fair value using methods consistent with procedures adopted by the Board of Trustees (the “Board” or “Trustees”) and will be classified as Level 2 or 3 within the fair value hierarchy, depending on the inputs used. Such methods of fair valuation may include, but are not limited to: multiple of earnings, multiple of book value, discount from market of a similar freely traded security, purchase price of the security, subsequent private transactions in the security or related securities, or a combination of these and other factors.
GAAP establishes a single authoritative definition of fair value, sets out a framework for measuring fair value and requires additional disclosures about fair value measurements. Various inputs are used in determining the value of the Fund’s investments. These inputs are summarized in the three broad levels listed below:
| ● | Level 1 – quoted prices in active markets for identical securities |
| ● | Level 2 – other significant observable inputs |
| ● | Level 3 – significant unobservable inputs |
The inputs or methodology used for valuing securities are not necessarily an indication of the risks associated with investing in those securities. The inputs used to measure fair value may fall into different levels of the fair value hierarchy. In such cases, for disclosure purposes, the level in the fair value hierarchy within which the fair value measurement falls in its entirety is determined based on the lowest level input that is significant to the fair value measurement.
18
| CANTOR GROWTH EQUITY FUND |
| NOTES TO FINANCIAL STATEMENTS (Unaudited) (Continued) |
The following is a summary of the Fund’s investments and other financial instruments based on the inputs used to value the investments and other financial instruments as of March 31, 2023, by security type:
| Cantor Growth Equity Fund | Level 1 | Level 2 | Level 3 | Total | ||||||||||||
| Investments in Securities: | ||||||||||||||||
| Common Stocks | $ | 286,949,739 | $ | — | $ | — | $ | 286,949,739 | ||||||||
| Money Market Funds | 3,975,451 | — | — | 3,975,451 | ||||||||||||
| Total | $ | 290,925,190 | $ | — | $ | — | $ | 290,925,190 | ||||||||
Refer to the Fund’s Schedule of Investments for a listing of the common stocks by sector type. There were no Level 3 investments held by the Fund as of or during the six months ended March 31, 2023.
Share valuation — The NAV per share of the Fund is calculated daily by dividing the total value of its assets, less liabilities, by the number of shares outstanding.
Allocation between classes — Class accounting investment income, common expense, and realized and unrealized gain (loss) on investments are to the various classes of the Fund on the basis of daily net assets of each class. Realized and unrealized gain (loss) on investments are allocated to the various classes of the Fund on the basis of daily net assets of each class. Distribution expense relating to a specific class are charged directly to that class. Class R6 shares will not be allocated any expenses related to services fees, sub-accounting fees, and /or sub-transfer agency fees paid to brokers, dealers, or other financial intermediaries.
Investment income — Dividend income is recorded on the ex-dividend date. Non-cash dividends included in dividend income, if any, are recorded at the fair market value of the security received. Interest income is accrued as earned. Discounts and premiums on fixed income securities purchased are amortized using the interest method. Withholding taxes, if any, on foreign dividends have been recorded in accordance with the Fund’s understanding of the applicable country’s rules and tax rates.
Distributions to shareholders — The Fund intends to distribute its net investment income and net realized long-term and short-term capital gains, if any, at least annually. The amount of distributions from net investment income and net realized capital gains are determined in accordance with federal income tax regulations, which may differ from GAAP. These “book/tax” differences are either temporary or permanent in nature. Dividends and distributions are recorded on the ex-dividend date. The tax character of distributions paid during the fiscal year ended September 30, 2022, the Fund’s most recent fiscal year end, was as follows:
| Ordinary | Long-Term | Total | ||||||||||
| Income | Capital Gains | Distributions | ||||||||||
| Cantor Growth Equity Fund | $ | 14,379,591 | $ | 157,131,175 | $ | 171,510,766 | ||||||
Investment transactions — Investment transactions are accounted for on trade date for financial reporting purposes. Realized gains and losses on investments sold are determined on a specific identification basis.
19
| CANTOR GROWTH EQUITY FUND |
| NOTES TO FINANCIAL STATEMENTS (Unaudited) (Continued) |
Estimates — The preparation of financial statements in conformity with GAAP requires management to make estimates and assumptions that affect the reported amounts of assets and liabilities and the disclosure of contingent assets and liabilities, each as of the date of the financial statements, and the reported amounts of increase (decrease) in net assets resulting from operations during the reporting period. Actual results could differ from those estimates.
Federal income tax — The Fund has qualified and intends to continue to qualify as a regulated investment company under the Internal Revenue Code of 1986, as amended (the “Code”). Qualification generally will relieve the Fund of liability for federal income taxes to the extent 100% of its net investment income and any net realized capital gains are distributed in accordance with the Code.
In order to avoid imposition of the excise tax applicable to regulated investment companies, it is also the Fund’s intention to declare as dividends in each calendar year at least 98% of its net investment income (earned during the calendar year) and 98.2% of its net realized capital gains (earned during the twelve months ended October 31) plus undistributed amounts from prior years.
The following information is computed on a tax basis for each item as of March 31, 2023:
| Tax cost of portfolio investments | $ | 211,815,271 | ||
| Gross unrealized appreciation | $ | 83,701,327 | ||
| Gross unrealized depreciation | (4,591,409 | ) | ||
| Net unrealized appreciation | $ | 79,109,918 | ||
The difference between the federal income tax cost of portfolio investments and the financial statement cost of portfolio investments for the Fund is due to certain differences in the recognition of capital gains and losses under income tax regulations and GAAP. These “book/tax” differences are temporary in nature and are primarily due to differing treatments of losses deferred due to wash sales.
The Fund recognizes the tax benefits or expenses of uncertain tax positions only when the position is “more likely than not” to be sustained assuming examination by tax authorities. Management has reviewed the tax positions taken by the Fund on federal income tax returns for all open tax years (generally, three years) and has concluded that no provision for unrecognized tax benefits or expenses is required in these financial statements.
Certain capital losses incurred after October 31, and within the current taxable year, are deemed to arise on the first business day of the Fund’s following taxable year. Late year Ordinary Losses incurred after December 31 are deemed to arise on the first business day of the Fund’s following taxable year. For the tax year ended September 30, 2022, the Fund deferred $284,702 in Qualified Late Year Ordinary Losses.
GAAP requires that certain components of net assets relating to permanent differences be reclassified between financial and tax reporting. These reclassifications have no effect on net assets or net asset value per share. For the tax year ended September 30, 2022, the Fund decreased accumulated earnings by $34,649,775 and increased paid-in capital by $34,649,775. These reclassifications are due primarily to the tax treatment of operating losses and equalizations.
20
| CANTOR GROWTH EQUITY FUND |
| NOTES TO FINANCIAL STATEMENTS (Unaudited) (Continued) |
3. Investment Transactions
Investment transactions, other than short-term investments and U.S. government securities, were purchases of $42,192,934 and sales of $62,100,980 for the six months ended March 31, 2023.
4. Transactions with Related Parties
INVESTMENT ADVISORY AGREEMENTS
The Fund’s investments are managed by Cantor Fitzgerald Investment Advisors, L.P. (the “Advisor”) under the terms of an Investment Advisory Agreement. Under the Investment Advisory Agreement, the Fund pays the Advisor a fee, which is computed and accrued daily and paid monthly, at an annual rate of 0.65% of its average daily net assets up to $500 million; 0.60% of the next $500 million of such assets; 0.55% of such assets $1.5 billion, and 0.50% on assets in excess of $2.5 billion. Prior to September 16, 2022, the investment advisor for the Predecessor Fund was Delaware Management Company (“Prior Advisor”), and the fee schedule was the same as described above.
The Advisor has entered into an Expense Limitation Agreement (“ELA”) with the Trust, pursuant to which the Advisor has agreed to waive management fees and /or reimburse the Fund for expenses the Fund incurs, but only to the extent necessary to maintain the Fund’s total annual operating expenses after fee waivers and/or reimbursement (exclusive of (i) brokerage fees and commissions; (ii) acquired fund fees and expenses; (iii) fees and expenses associated with investments in other collective investment vehicles or derivative instruments (including, for example, option and swap fees and expenses); (iv) borrowing costs (such as interest and dividend expense on securities sold short); (v) taxes and (vi) extraordinary expenses, such as litigation expenses (which may include indemnification of Fund officers and Trustees and contractual indemnification of Fund service providers (other than the Advisor or Sub-Advisor) but inclusive of organizational costs and offering costs) to not more than 1.17%, 0.86%, and 0.79% of the average daily net assets of the Class A, Institutional Class, and Class R6 shares of the Fund, respectively. This contractual arrangement is in effect through September 16, 2024, unless terminated by the Board at any time. The ELA shall continue in effect for successive twelve-month periods provided that such continuance is specifically approved at least annually by the Advisor. Accordingly, during the six months ended March 31, 2023, the Advisor reduced its advisory fees and/or paid expenses indirectly in the amount of $237,895.
Any waiver or reimbursement by the Advisor is subject to repayment by the Fund provided the Advisor continues to serve as investment advisor to the Fund and subject to the limitations that: (1) the reimbursement for fees and expenses will be made only if payable not more than three years from the date in which they were incurred; and (2) the reimbursement may not be made if it would cause the lesser of the Expense Limitation in place at the time of waiver or at the time of reimbursement to be exceeded.
As of March 31, 2023, the Advisor may seek recoupment of investment advisory fee reductions and expense reimbursements no later than March 31, 2026 in the amount of $237,895.
The Fund’s sub-advisor is Smith Group Asset Management, LLC (the “Sub-Advisor”). Pursuant to the sub-advisory agreement with the Advisor, the sub-advisor provides the Fund with a program of continuous supervision of the Fund’s assets, including developing the composition of its portfolio, and furnishes advice
21
| CANTOR GROWTH EQUITY FUND |
| NOTES TO FINANCIAL STATEMENTS (Unaudited) (Continued) |
and recommendations with respect to investments, investment policies, and the purchase and sale of securities. The Advisor pays a sub-advisory fee based on the Fund’s daily net assets, at an annual rate of 0.20%.
OTHER SERVICE PROVIDERS
Ultimus Fund Solutions, LLC (“Ultimus” or the “Administrator”) provides administration, fund accounting, and transfer agent services to the Fund. The Fund pays Ultimus fees in accordance with the agreements for such services. In addition, the Fund pays out-of-pocket expenses including, but not limited to, postage, supplies, and certain costs related to the pricing of the Fund’s portfolio securities. During the six months ended March 31, 2023, the Administrator earned fees of $89,236 for such services.
Ultimus Fund Distributors, LLC (“UFD”) serves as the Fund’s principal underwriter and acts as the distributor of the Fund’s shares. UFD is an affiliate of Ultimus. UFD is compensated by the Advisor (not the Fund) for acting as principal underwriter.
Pursuant to a distribution agreement and distribution plan, the Fund pays the distributor an annual 12b-1 fee of 0.25% of the average daily net assets of the Class A shares. The fees are calculated daily and paid monthly. Institutional Class and Class R6 shares do not pay 12b-1 fees.
Northern Lights Compliance Services, LLC (“NLCS”), an affiliate of Ultimus, provides a Chief Compliance Officer to the Trust, as well as related compliance services, pursuant to a consulting agreement between NLCS and the Trust. Under the terms of such agreement, NLCS receives fees from the Fund, which are approved annually by the Board.
Certain officers of the Trust are also employees of Ultimus and the Advisor and such persons are not paid by the Fund for serving in such capacities.
COMPENSATION OF TRUSTEES
Trustees and officers affiliated with the Advisor or Ultimus are not compensated by the Trust for their services. Each Trustee who is not an affiliated person of the Advisor or Ultimus receives from the Trust an annual retainer of $20,000, payable quarterly; annual payment of $5,000 for audit committee chair fee, payable quarterly, and reimbursement of travel and other expenses incurred in attending meetings.
22
| CANTOR GROWTH EQUITY FUND |
| NOTES TO FINANCIAL STATEMENTS (Unaudited) (Continued) |
5. Beneficial Ownership
The beneficial ownership, either directly or indirectly, of more than 25% of the voting securities of a fund creates a presumption of control of the fund, under Section 2(a)(9) of the 1940 Act. As of March 31, 2023, the following shareholders owned of record 25% or more of the outstanding shares of the Fund.
| NAME OF RECORD OWNER | % Ownership |
| Class A | |
| Matrix Trust Company (for the benefit of its customers) | 32% |
| Institutional Class | |
| Charles Schwab & Co Inc. (for the benefit of its customers) | 27% |
| Class R6 | |
| Charles Schwab & Co Inc. (for the benefit of its customers) | 32% |
| National Financial Services, LLC (for the benefit of its customers) | 68% |
6. Sector Risk
If the Fund has significant investments in the securities of issuers in industries within a particular business sector, any development affecting that sector will have a greater impact on the value of the net assets of the Fund than would be the case if the Fund did not have significant investments in that sector. In addition, this may increase the risk of loss of an investment in the Fund and increase the volatility of the Fund’s NAV per share. From time to time, circumstances may affect a particular sector and the companies within such sector. For instance, economic or market factors, regulation or deregulation, or other developments may negatively impact all companies in a particular sector and therefore the value of the Fund’s portfolio would be adversely affected. As of March 31, 2023, the Fund had 36.36% of its net assets invested in the Technology sector.
7. Contingencies and Commitments
The Fund indemnifies the Trust’s officers and Trustees for certain liabilities that might arise from the performance of their duties to the Fund. Additionally, in the normal course of business the Fund enters into contracts that contain a variety of representations and warranties and which provide general indemnifications. The Fund’s maximum exposure under these arrangements is unknown, as this would involve future claims that may be made against the Fund that have not yet occurred. However, based on experience, the Trust expects the risk of loss to be remote.
8. Subsequent Events
The Fund is required to recognize in the financial statements the effects of all subsequent events that provide additional evidence about conditions that existed as of the date of the Statement of Assets and Liabilities. For non-recognized subsequent events that must be disclosed to keep the financial statements from being misleading, the Fund is required to disclose the nature of the event as well as an estimate of its financial effect, or a statement that such an estimate cannot be made. Management has evaluated subsequent events through the issuance of these financial statements and has noted no such events.
23
| CANTOR GROWTH EQUITY FUND |
| ABOUT YOUR FUND EXPENSES (Unaudited) |
We believe it is important for you to understand the impact of costs on your investment. All mutual funds have operating expenses. As a shareholder of the Fund, you incur ongoing costs, including management fees and other operating expenses. These ongoing costs, which are deducted from the Fund’s gross income, directly reduce the investment return of the Fund.
A mutual fund’s ongoing costs are expressed as a percentage of its average net assets. This figure is known as the expense ratio. The following examples are intended to help you understand the ongoing costs (in dollars) of investing in the Fund and to compare these costs with the ongoing costs of investing in other mutual funds. The examples below are based on an investment of $1,000 made at the beginning of the period and held for the entire period from October 1, 2022 through March 31, 2023.
The table below illustrates the Fund’s ongoing costs in two ways:
Actual fund return – This section helps you to estimate the actual expenses that you paid over the period. The “Ending Account Value” shown is derived from the Fund’s actual return, and the fourth column shows the dollar amount of operating expenses that would have been paid by an investor who started with $1,000 in the Fund. You may use the information here, together with the amount you invested, to estimate the expenses that you paid over the period.
To do so, simply divide your account value by $1,000 (for example, an $8,600 account value divided by $1,000 = 8.6), then multiply the result by the number given for the Fund under the heading “Expenses Paid During Period.”
Hypothetical 5% return – This section is intended to help you compare the Fund’s ongoing costs with those of other mutual funds. It assumes the Fund had an annual return of 5% before expenses during the period shown, but that the expense ratio is unchanged. In this case, because the returns used are not the Fund’s actual returns, the results do not apply to your investment. The example is useful in making comparisons because the U.S. Securities and Exchange Commission requires all mutual funds to calculate expenses based on a 5% return. You can assess the Fund’s ongoing costs by comparing this hypothetical example with the hypothetical examples that appear in shareholder reports of other funds.
Note that expenses shown in the table are meant to highlight and help you compare ongoing costs only. The Fund does not charge sales loads or redemption fees.
The calculations assume no shares were bought or sold during the period. Your actual costs may have been higher or lower, depending on the amount of your investment and the timing of any purchases or redemptions.
More information about the Fund’s expenses, including annual expense ratios for the past five fiscal years, can be found in the Financial Highlights tables of this report. For additional information on operating expenses and other shareholder costs, please refer to the Fund’s prospectus.
24
| CANTOR GROWTH EQUITY FUND |
| ABOUT YOUR FUND EXPENSES (Unaudited) (Continued) |
| Beginning | Ending | |||||||||
| Account Value | Account Value | Expenses Paid | ||||||||
| October 1, | March 31, | Net | During | |||||||
| 2022 | 2023 | Expense Ratio(a) | Period(b) | |||||||
| Cantor Growth Equity Fund | ||||||||||
| Class A Shares | Actual | $1,000 | $1,212.00 | $6.45 | 1.17% | |||||
| Hypothetical(b) | $1,000 | $1,019.10 | $5.89 | 1.17% | ||||||
| Institutional Class | Actual | $1,000 | $1,214.90 | $4.75 | 0.86% | |||||
| Hypothetical(b) | $1,000 | $1,020.64 | $4.33 | 0.86% | ||||||
| R6 Class | Actual | $1,000 | $1,213.90 | $4.36 | 0.79% | |||||
| Hypothetical(b) | $1,000 | $1,020.99 | $3.98 | 0.79% | ||||||
| (a) | Expenses are equal to the Fund’s annualized expense ratios, multiplied by the average account value over the period, multiplied by 182/365 (to reflect the one-half year period). The annualized expense ratios reflect reimbursement of expenses by the Fund’s Advisor for the period beginning October 1, 2022 through March 31, 2023. The Financial Highlights tables in the Fund’s financial statements, included in this report, also show the gross expense ratios, without such reimbursements. |
| (b) | Hypothetical assumes 5% annual return before expenses. |
25
| CANTOR GROWTH EQUITY FUND |
| OTHER INFORMATION (Unaudited) |
The Trust files a complete listing of portfolio holdings for the Fund with the SEC as of the end of the first and third quarters of each fiscal year as an exhibit to its reports on Form N-PORT. The filings are available upon request, by calling 1-833-764-2266. Furthermore, you may obtain a copy of these filings on the SEC’s website at www.sec.gov and the Fund’s website www.growthequityfund.cantorassetmanagment.com.
A description of the policies and procedures that the Fund uses to determine how to vote proxies relating to portfolio securities is available without charge upon request by calling toll-free 1-833-764-2266, or on the SEC’s website at www.sec.gov. Information regarding how the Fund voted proxies relating to portfolio securities during the most recent 12-month period ended June 30 is also available without charge upon request by calling toll-free 1-833-764-2266, or on the SEC’s website at www.sec.gov.
26
| PRIVACY NOTICE |
| CANTOR SELECT PORTFOLIOS TRUST |
| FACTS | WHAT DOES CANTOR SELECT PORTFOLIOS TRUST DO WITH YOUR PERSONAL INFORMATION? |
| Why? | Financial companies choose how they share your personal information. Federal law gives consumers the right to limit some, but not all sharing. Federal law also requires us to tell you how we collect, share, and protect your personal information. Please read this notice carefully to understand what we do. |
| What? | The types of personal information we collect and share depends on the product or service that you have with us. This information can include:
■ Social Security number and wire transfer instructions
■ account transactions and transaction history
■ investment experience and purchase history
When you are no longer our customer, we continue to share your information as described in this notice. |
| How? | All financial companies need to share customers’ personal information to run their everyday business. In the section below, we list the reasons financial companies can share their customers’ personal information; the reasons Cantor Select Portfolios Trust chooses to share; and whether you can limit this sharing. |
| Reasons we can share your personal information | Does Cantor Select Portfolios Trust share information? | Can you limit this sharing? |
For our everyday business purposes – Such as to process your transactions, maintain your account(s), respond to court orders and legal investigations, or report to credit bureaus. | YES | NO |
For our marketing purposes – to offer our products and services to you. | NO | We don’t share |
| For joint marketing with other financial companies. | NO | We don’t share |
For our affiliates’ everyday business purposes – information about your transactions and records. | NO | We don’t share |
For our affiliates’ everyday business purposes – information about your creditworthiness. | NO | We don’t share |
| For nonaffiliates to market to you | NO | We don’t share |
| QUESTIONS? | Call 1-402-493-4603 |
27
| PRIVACY NOTICE |
| CANTOR SELECT PORTFOLIOS TRUST |
| Page 2 |
| What we do | |
How does Cantor Select Portfolios Trust protect my personal information? | To protect your personal information from unauthorized access and use, we use security measures that comply with federal law. These measures include computer safeguards and secured files and buildings.
Our service providers are held accountable for adhering to strict policies and procedures to prevent any misuse of your nonpublic personal information. |
| How does Cantor Select Portfolios Trust collect my personal information? | We collect your personal information, for example, when you
■ open an account or deposit money
■ direct us to buy securities or direct us to sell your securities
■ seek advice about your investments
We also collect your personal information from others, such as credit bureaus, affiliates, or other companies. |
Why can’t I limit all sharing? | Federal law gives you the right to limit only
■ Sharing for affiliates’ everyday business purposes – information about your creditworthiness.
■ Affiliates from using your information to market to you.
■ Sharing for nonaffiliates to market to you.
State laws and individual companies may give you additional rights to limit sharing. |
| Definitions | |
| Affiliates | Companies related by common ownership or control. They can be financial and nonfinancial companies.
The following companies may be considered affiliates of CSPT:
■ Northern Lights Compliance Services, LLC
■ The Ultimus Group, LLC
■ The Ultimus Group Intermediate, LLC
■ The Ultimus Group Midco, LLC
■ The Ultimus Group Management, Inc.
■ The Ultimus Group Employee, LLC
■ Ultimus Holdings, LLC
■ Ultimus Intermediary, LLC
■ Ultimus Fund Solutions, LLC
■ Ultimus Asset Services, LLC
■ Ultimus Fund Distributors, LLC
■ Unified Financial Securities, LLC
■ Ultimus Private Fund Solutions, LLC |
28
This page intentionally left blank.
 | |
Investment Advisor
Sub-Advisor
Administrator
Custodian
Independent Registered | Legal Counsel
Officers
Trustees
|
| CGE-SAR-23 | |
| (b) | Not applicable. |
Item 2. Code of Ethics. NOT APPLICABLE – disclosed with annual report
Item 3. Audit Committee Financial Expert. NOT APPLICABLE- disclosed with annual report
Item 4. Principal Accountant Fees and Services. NOT APPLICABLE – disclosed with annual report
Item 5. Audit Committee of Listed Companies. The registrant’s board of trustees has determined that the registrant has at least one audit committee financial expert serving on its audit committee. The name of the audit committee financial expert is Janine L. Cohen. Ms. Cohen is “independent” for purposes of this Item.
Item 6. Schedule of Investments. Schedule filed with Item 1.
Item 7. Disclosure of Proxy Voting Policies and Procedures for Closed-End Management Investment Companies. NOT APPLICABLE – applies to closed-end funds only
Item 8. Portfolio Managers of Closed-End Investment Companies. NOT APPLICABLE – applies to closed-end funds only
Item 9. Purchases of Equity Securities by Closed-End Management Investment Company and Affiliated Purchasers. NOT APPLICABLE – applies to closed-end funds only
Item 10. Submission of Matters to a Vote of Security Holders.
The registrant has not adopted procedures by which shareholders may recommend nominees to the registrant’s board of trustees.
Item 11. Controls and Procedures.
(a) Based on their evaluation of the registrant’s disclosure controls and procedures (as defined in Rule 30a-3(c) under the Investment Company Act of 1940, as amended (the “Act”)) as of a date within 90 days of the filing date of this report, the registrant’s principal executive officer and principal financial officer have concluded that such disclosure controls and procedures are reasonably designed and are operating effectively to ensure that material information relating to the registrant is made known to them by others within those entities, particularly during the period in which this report is being prepared, and that the information required in filings on Form N-CSR is recorded, processed, summarized, and reported on a timely basis.
(b) There were no significant changes in the registrant’s internal control over financial reporting that occurred during the period covered by this report that have materially affected, or are reasonably likely to materially affect, the registrant’s internal control over financial reporting.
Item 12. Disclosure of Securities Lending Activities for Closed-End Investment Companies.
Not Applicable.
Item 13. Exhibits.
(a) (1) Not Applicable – filed with annual report
(a)(2) Certifications pursuant to Rule 30a-2(a) are attached hereto.
| (1) | Not applicable. |
| (2) | Change in the registrant’s independent public accountants: Not applicable |
(b) Certifications pursuant to Rule 30a-2(b) are furnished herewith.
SIGNATURES
Pursuant to the requirements of the Securities Exchange Act of 1934 and the Investment Company Act of 1940, the registrant has duly caused this report to be signed on its behalf by the undersigned, thereunto duly authorized.
| (Registrant) | Cantor Select Portfolios Trust | ||
| By (Signature and Title)* | /s/ William Ferri | ||
William Ferri Principal Executive Officer | |||
| Date | 6/6/2023 | ||
| Pursuant to the requirements of the Securities Exchange Act of 1934 and the Investment Company Act of 1940, this report has been signed below by the following persons on behalf of the registrant and in the capacities and on the dates indicated. | |||
| By (Signature and Title)* | /s/ William Ferri | ||
William Ferri Principal Executive Officer | |||
| Date | 6/6/2023 | ||
| By (Signature and Title)* | /s/ Zachary P. Richmond | ||
| Zachary Richmond, Treasurer and Principal Financial Officer | |||
| Date | 6/6/2023 | ||
* Print the name and title of each signing officer under his or her signature.