UNITED STATES
SECURITIES AND EXCHANGE COMMISSION
WASHINGTON, D.C. 20549
FORM N-CSR
CERTIFIED SHAREHOLDER REPORT OF REGISTERED MANAGEMENT
INVESTMENT COMPANIES
| Investment Company Act file number | 811-23773 |
| Cantor Select Portfolios Trust |
| (Exact name of registrant as specified in charter) |
| 110 E. 59th Street, New York, NY | 10022 |
| (Address of principal executive offices) | (Zip code) |
| Corporation Services Company |
| 251 Little Falls Drive, Wilmington, Delaware 19808 |
| (Name and address of agent for service) |
| Registrant’s telephone number, including area code: | (212) 915-1722 | |
| Date of fiscal year end: | 12/31 | |
| Date of reporting period: | 12/31/24 | |
Item 1. Reports to Stockholders.
Cantor Fitzgerald Equity Opportunity Fund
Annual Shareholder Report - December 31, 2024
This annual shareholder report contains important information about Cantor Fitzgerald Equity Opportunity Fund for the period of January 1, 2024 to December 31, 2024. You can find additional information about the Fund at https://equityopportunityfund.cantorassetmanagement.com/. You can also request this information by contacting us at (833) 764-2266. This report describes changes to the Fund that occurred during the reporting period.
What were the Fund’s costs for the last year?
(based on a hypothetical $10,000 investment)
| Class Name | Costs of a $10,000 investment | Costs paid as a percentage of a $10,000 investment |
|---|
| Class A | $212 | 2.03% |
|---|
How did the Fund perform during the reporting period?
For the year ended December 31, 2024, the Cantor Fitzgerald Equity Opportunity Fund (the “Fund”) Institutional shares Class (ATGAX) generated a 9.0% return, underperforming the 15.3% return of the CRSP (Center for Research in Security Prices) US Mid Cap Index. The underperformance of the Fund can be largely attributed to an economy showing robust growth with a resilient labor market, inflation that retreated from recent highs and the Federal Reserve reducing rates by 100 basis points during the year, public companies reporting relatively solid profitability, and investors’ appetite for developments related to Artificial Intelligence (AI). This resulted in sectors such as Financials, Utilities, and Information Technology (IT) posting the best returns in the benchmark. While the Fund had significant exposure to IT, it failed to offset the underexposure to Financials and Utilities during the year. Within the Fund, the Consumer Staples sector provided the best relative performance as underweight exposure at 1.2% compared to a 4.9% weight in the benchmark was beneficial. It was the second worst performing sector in the benchmark with a –7.5% return, thus the Fund’s underweight exposure resulted in a 0.8% positive relative performance. The discount retailer Dollar Tree, which was not held in the Fund, was a big contributor to the negative performance for the sector in the benchmark with the shares declining 47.0% during the year. The Fund’s holdings in the Communication Services sector were the largest contributor to negative relative performance. The Fund’s carried a large position in ZoomInfo that averaged a 4.1% weight in the portfolio for the year. The company, a provider of technology to facilitate remote meeting activities that were in great demand during the pandemic, declined 43.2% during the period, causing 2.6% of negative relative performance. Finally of note, the Fund was managed by Aquila Investment Management into the fourth quarter of the year. Cantor Fitzgerald Investment Advisors assumed management of the Fund starting October 18, 2024.
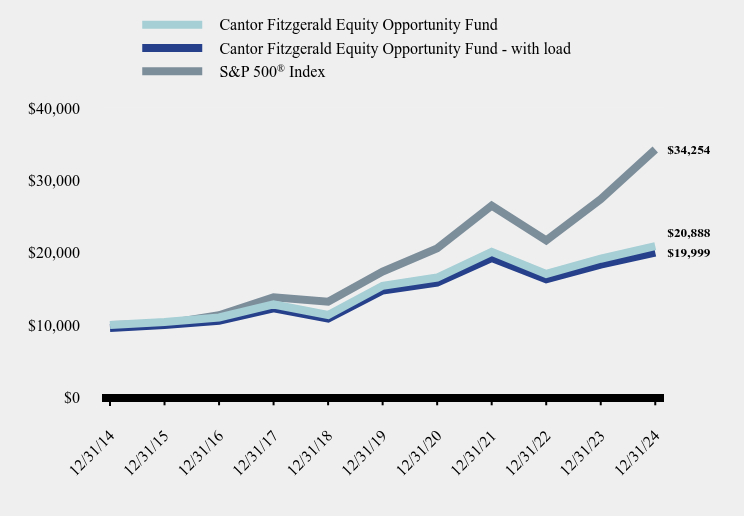
How has the Fund performed over the last ten years?
Total Return Based on $10,000 Investment
| Cantor Fitzgerald Equity Opportunity Fund | Cantor Fitzgerald Equity Opportunity Fund - with load | S&P 500® Index |
|---|
| 12/31/14 | $10,000 | $9,575 | $10,000 |
|---|
| 12/31/15 | $10,421 | $9,978 | $10,138 |
|---|
| 12/31/16 | $11,030 | $10,561 | $11,351 |
|---|
| 12/31/17 | $12,834 | $12,288 | $13,829 |
|---|
| 12/31/18 | $11,378 | $10,894 | $13,223 |
|---|
| 12/31/19 | $15,413 | $14,758 | $17,386 |
|---|
| 12/31/20 | $16,552 | $15,848 | $20,585 |
|---|
| 12/31/21 | $20,114 | $19,259 | $26,494 |
|---|
| 12/31/22 | $17,048 | $16,323 | $21,696 |
|---|
| 12/31/23 | $19,156 | $18,342 | $27,399 |
|---|
| 12/31/24 | $20,888 | $19,999 | $34,254 |
|---|
Average Annual Total Returns
|
|---|
| |
|---|
| |
|---|
| 1 Year | 5 Years | 10 Years |
|---|
| Cantor Fitzgerald Equity Opportunity Fund | | | |
|---|
| Without Load | 9.04% | 6.27% | 7.64% |
|---|
| With Load | 4.40% | 5.35% | 7.18% |
|---|
| S&P 500 Index | 25.02% | 14.53% | 13.10% |
|---|
| CRSP MidCap Core Index | 15.25% | 9.86% | 9.57% |
|---|
| | | |
|---|
The Fund's past performance is not a good predictor of how the Fund will perform in the future. The graph and table do not reflect the deduction of taxes that a shareholder would pay on fund distributions or redemption of fund shares.
| Net Assets | $78,593,470 |
|---|
| Number of Portfolio Holdings | 57 |
|---|
| Advisory Fee | $922,917 |
|---|
| Portfolio Turnover | 44% |
|---|
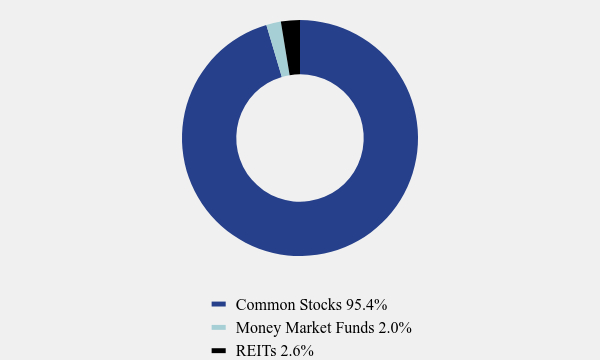
Asset Weighting (% of total investments)
| Value | Value |
|---|
| Common Stocks | 95.4% |
| Money Market Funds | 2.0% |
| REITs | 2.6% |
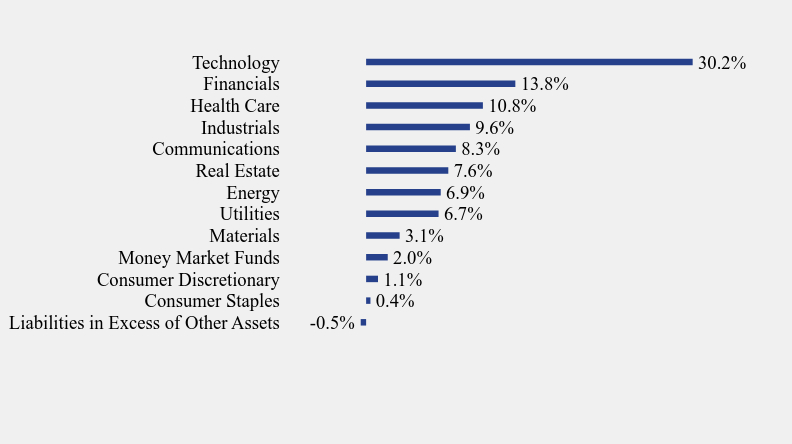
What did the Fund invest in?
Sector Weighting (% of net assets)
| Value | Value |
|---|
| Liabilities in Excess of Other Assets | -0.5% |
| Consumer Staples | 0.4% |
| Consumer Discretionary | 1.1% |
| Money Market Funds | 2.0% |
| Materials | 3.1% |
| Utilities | 6.7% |
| Energy | 6.9% |
| Real Estate | 7.6% |
| Communications | 8.3% |
| Industrials | 9.6% |
| Health Care | 10.8% |
| Financials | 13.8% |
| Technology | 30.2% |
Top 10 Holdings (% of net assets)
| Holding Name | % of Net Assets |
|---|
| Arista Networks Inc | 4.9% |
|---|
| ROBLOX Corporation - Class A | 4.6% |
|---|
| Elastic N.V. | 4.3% |
|---|
| Illumina, Inc. | 4.3% |
|---|
| DexCom, Inc. | 4.2% |
|---|
| Coherent Corporation | 3.9% |
|---|
| ARM Holdings plc - ADR | 3.8% |
|---|
| Take-Two Interactive Software, Inc. | 3.7% |
|---|
| Cadence Design Systems, Inc. | 3.4% |
|---|
| WEC Energy Group, Inc. | 3.4% |
|---|
This is a summary of certain changes to the Fund since January 1, 2024. For more complete information, you may review the Fund’s next prospectus, which we expect to be available by May 1, 2025 at https://equityopportunityfund.cantorassetmanagement.com/ or upon request at (833) 764-2266. As described more fully in Note 1 of the Annual Financial Statements for the Fund, effective as of the close of business on November 22, 2024, each Fund received all of the assets and liabilities of the corresponding fund of the Aquila Funds Trust (each, a “Predecessor Fund”) (the “Reorganization”). Each Predecessor Fund’s investment objective, policies, and limitations were substantially similar to those of the corresponding Fund, each with no operations before the Reorganization. For financial reporting purposes, the Predecessor Fund’s operating history before the Reorganization is reflected in the corresponding Fund’s financial statements and financial highlights. On November 21, 2024, Tair Weller & Baker LLP (“Tait”) resigned as the independent registered public accounting firm of the Funds, and the AuditCommittee of the Board of Trustees approved Cohen & Company, Ltd. to serve as the independent registered public accounting firm of the Funds. There were no disagreements with EY during the Funds' two most recent fiscal years or any subsequent interim period.
Cantor Fitzgerald Equity Opportunity Fund - Class A (ATGAX)
Annual Shareholder Report - December 31, 2024
Where can I find additional information about the Fund?
Additional information is available on the Fund's website ( https://equityopportunityfund.cantorassetmanagement.com/ ), including its:
Prospectus
Financial information
Holdings
Proxy voting information
Cantor Fitzgerald Equity Opportunity Fund
Annual Shareholder Report - December 31, 2024
This annual shareholder report contains important information about Cantor Fitzgerald Equity Opportunity Fund for the period of January 1, 2024 to December 31, 2024. You can find additional information about the Fund at https://equityopportunityfund.cantorassetmanagement.com/. You can also request this information by contacting us at (833) 764-2266. This report describes changes to the Fund that occurred during the reporting period.
What were the Fund’s costs for the last year?
(based on a hypothetical $10,000 investment)
| Class Name | Costs of a $10,000 investment | Costs paid as a percentage of a $10,000 investment |
|---|
| Institutional | $180 | 1.72% |
|---|
How did the Fund perform during the reporting period?
For the year ended December 31, 2024, the Cantor Fitzgerald Equity Opportunity Fund (the “Fund”) Institutional shares Class (ATGYX) generated a 9.5% return, underperforming the 15.3% return of the CRSP (Center for Research in Security Prices) US Mid Cap Index. The underperformance of the Fund can be largely attributed to an economy showing robust growth with a resilient labor market, inflation that retreated from recent highs and the Federal Reserve reducing rates by 100 basis points during the year, public companies reporting relatively solid profitability, and investors’ appetite for developments related to Artificial Intelligence (AI). This resulted in sectors such as Financials, Utilities, and Information Technology (IT) posting the best returns in the benchmark. While the Fund had significant exposure to IT, it failed to offset the underexposure to Financials and Utilities during the year. Within the Fund, the Consumer Staples sector provided the best relative performance as underweight exposure at 1.2% compared to a 4.9% weight in the benchmark was beneficial. It was the second worst performing sector in the benchmark with a –7.5% return, thus the Fund’s underweight exposure resulted in a 0.8% positive relative performance. The discount retailer Dollar Tree, which was not held in the Fund, was a big contributor to the negative performance for the sector in the benchmark with the shares declining 47.0% during the year. The Fund’s holdings in the Communication Services sector were the largest contributor to negative relative performance. The Fund’s carried a large position in ZoomInfo that averaged a 4.1% weight in the portfolio for the year. The company, a provider of technology to facilitate remote meeting activities that were in great demand during the pandemic, declined 43.2% during the period, causing 2.6% of negative relative performance. Finally of note, the Fund was managed by Aquila Investment Management into the fourth quarter of the year. Cantor Fitzgerald Investment Advisors assumed management of the Fund starting October 18, 2024.
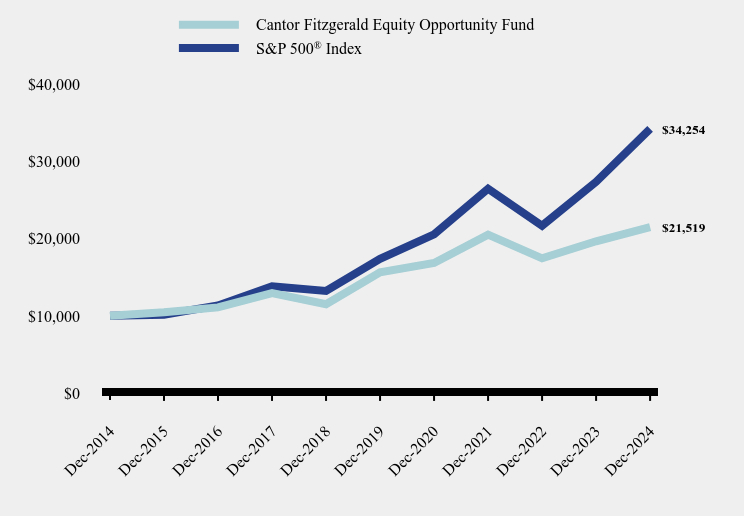
How has the Fund performed over the last ten years?
Total Return Based on $10,000 Investment
| Cantor Fitzgerald Equity Opportunity Fund | S&P 500® Index |
|---|
| Dec-2014 | $10,000 | $10,000 |
|---|
| Dec-2015 | $10,452 | $10,138 |
|---|
| Dec-2016 | $11,096 | $11,351 |
|---|
| Dec-2017 | $12,949 | $13,829 |
|---|
| Dec-2018 | $11,513 | $13,223 |
|---|
| Dec-2019 | $15,646 | $17,386 |
|---|
| Dec-2020 | $16,853 | $20,585 |
|---|
| Dec-2021 | $20,541 | $26,494 |
|---|
| Dec-2022 | $17,464 | $21,696 |
|---|
| Dec-2023 | $19,677 | $27,399 |
|---|
| Dec-2024 | $21,519 | $34,254 |
|---|
Average Annual Total Returns
|
|---|
| |
|---|
| |
|---|
| 1 Year | 5 Years | 10 Years |
|---|
| | | |
|---|
| Cantor Fitzgerald Equity Opportunity Fund | 9.36% | 6.58% | 7.96% |
|---|
| S&P 500 Index | 25.02% | 14.53% | 13.10% |
|---|
| CRSP MidCap Core Index | 15.25% | 9.86% | 9.57% |
|---|
| | | |
|---|
The Fund's past performance is not a good predictor of how the Fund will perform in the future. The graph and table do not reflect the deduction of taxes that a shareholder would pay on fund distributions or redemption of fund shares.
| Net Assets | $78,593,470 |
|---|
| Number of Portfolio Holdings | 57 |
|---|
| Advisory Fee | $922,917 |
|---|
| Portfolio Turnover | 44% |
|---|
Asset Weighting (% of total investments)
| Value | Value |
|---|
| Common Stocks | 95.4% |
| Money Market Funds | 2.0% |
| REITs | 2.6% |
What did the Fund invest in?
Sector Weighting (% of net assets)
| Value | Value |
|---|
| Liabilities in Excess of Other Assets | -0.5% |
| Consumer Staples | 0.4% |
| Consumer Discretionary | 1.1% |
| Money Market Funds | 2.0% |
| Materials | 3.1% |
| Utilities | 6.7% |
| Energy | 6.9% |
| Real Estate | 7.6% |
| Communications | 8.3% |
| Industrials | 9.6% |
| Health Care | 10.8% |
| Financials | 13.8% |
| Technology | 30.2% |
Top 10 Holdings (% of net assets)
| Holding Name | % of Net Assets |
|---|
| Arista Networks Inc | 4.9% |
|---|
| ROBLOX Corporation - Class A | 4.6% |
|---|
| Elastic N.V. | 4.3% |
|---|
| Illumina, Inc. | 4.3% |
|---|
| DexCom, Inc. | 4.2% |
|---|
| Coherent Corporation | 3.9% |
|---|
| ARM Holdings plc - ADR | 3.8% |
|---|
| Take-Two Interactive Software, Inc. | 3.7% |
|---|
| Cadence Design Systems, Inc. | 3.4% |
|---|
| WEC Energy Group, Inc. | 3.4% |
|---|
This is a summary of certain changes to the Fund since January 1, 2024. For more complete information, you may review the Fund’s next prospectus, which we expect to be available by May 1, 2025 at https://equityopportunityfund.cantorassetmanagement.com/ or upon request at (833) 764-2266. As described more fully in Note 1 of the Annual Financial Statements for the Fund, effective as of the close of business on November 22, 2024, each Fund received all of the assets and liabilities of the corresponding fund of the Aquila Funds Trust (each, a “Predecessor Fund”) (the “Reorganization”). Each Predecessor Fund’s investment objective, policies, and limitations were substantially similar to those of the corresponding Fund, each with no operations before the Reorganization. For financial reporting purposes, the Predecessor Fund’s operating history before the Reorganization is reflected in the corresponding Fund’s financial statements and financial highlights. On November 21, 2024, Tair Weller & Baker LLP (“Tait”) resigned as the independent registered public accounting firm of the Funds, and the AuditCommittee of the Board of Trustees approved Cohen & Company, Ltd. to serve as the independent registered public accounting firm of the Funds. There were no disagreements with EY during the Funds' two most recent fiscal years or any subsequent interim period.
Cantor Fitzgerald Equity Opportunity Fund - Institutional (ATGYX)
Annual Shareholder Report - December 31, 2024
Where can I find additional information about the Fund?
Additional information is available on the Fund's website ( https://equityopportunityfund.cantorassetmanagement.com/ ), including its:
Prospectus
Financial information
Holdings
Proxy voting information
Cantor Fitzgerald High Income Fund
Annual Shareholder Report - December 31, 2024
This annual shareholder report contains important information about Cantor Fitzgerald High Income Fund for the period of January 1, 2024 to December 31, 2024. You can find additional information about the Fund at https://highincomefund.cantorassetmanagement.com/. You can also request this information by contacting us at (833) 764-2266. This report describes changes to the Fund that occurred during the reporting period.
What were the Fund’s costs for the last year?
(based on a hypothetical $10,000 investment)
| Class Name | Costs of a $10,000 investment | Costs paid as a percentage of a $10,000 investment |
|---|
| Class A | $123 | 1.20% |
|---|
How did the Fund perform during the reporting period?
For the year ended December 31, 2024, the Cantor Fitzgerald High Income Fund (the “Fund”) Class A (ATPAX) generated a 5.76% total return, underperforming the 8.19% return of the Bloomberg U.S. Corporate High Yield Index (the “High Yield Index or Index”). The underperformance of ATPAX in 2024 may be attributed to the strategy’s focus on higher quality credits and shorter duration, among other factors. After impressive performance in 2023, where the Index rose over 13% during the year, investors continued to be in a risk-taking mood, although most of the positive total return experienced in the High Yield sector was seen in the second half of the year. Investors had an insatiable demand for yield and underlying credit fundamentals remained stable to improving, making lower-rated credits the clear winner in 2024. Bonds rated CCC returned 15.1%, well out-pacing those rated BB (6.3%) and B-rated issues (7.4%). As the Fund maintained a very conservative risk profile related to credit quality throughout 2024, the average underweight position in CCC-rated issues during the period (3.6% vs. 10.9%) was a clear detraction to Fund performance. However, security selection in bonds rated single-B and BB provided some positive attribution, as Fund holdings rated B were up 7.8% vs. 7.6% for B-rated issuers in the Index. In addition, BB-rated Fund holdings increased 6.4% compared to the 6.2% for the Index. Finally, as the Fund’s weighted average duration remained at least a half-year shorter than the Index, the tightening in High Yield credit spreads provided a further detraction in performance in 2024. Throughout the year, the Option Adjusted Spread on the Index moved from 323 basis points (“bps”) to 287 bps, although the Yield-to-Worst only declined about 10 bps. Although the US Treasury market saw a rise in rates of about 60-90 bps across the yield curve since the Federal Reserve cut the Federal Funds rate in September, the risk-on tone, combined with favorable supply/demand dynamics in the High Yield market, provided some of the catalyst for credit spread tightening and another year of positive total return.
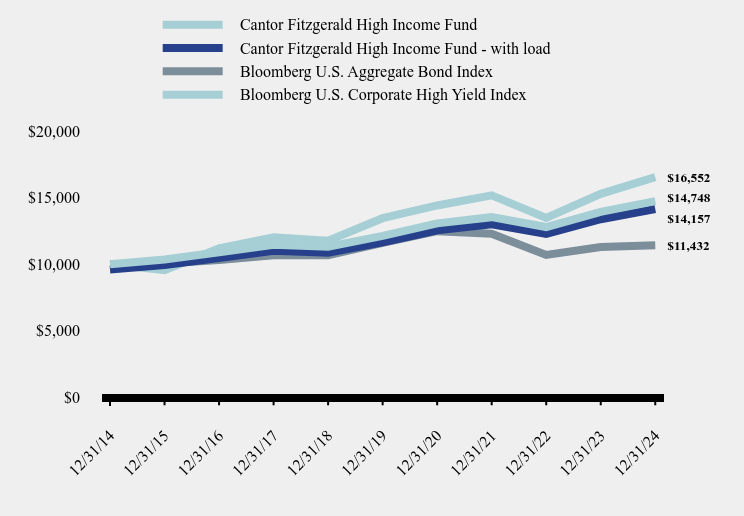
How has the Fund performed over the last ten years?
Total Return Based on $10,000 Investment
| Cantor Fitzgerald High Income Fund | Cantor Fitzgerald High Income Fund - with load | Bloomberg U.S. Aggregate Bond Index | Bloomberg U.S. Corporate High Yield Index |
|---|
| 12/31/14 | $10,000 | $9,599 | $10,000 | $10,000 |
|---|
| 12/31/15 | $10,358 | $9,943 | $10,055 | $9,553 |
|---|
| 12/31/16 | $10,898 | $10,461 | $10,321 | $11,190 |
|---|
| 12/31/17 | $11,475 | $11,015 | $10,687 | $12,029 |
|---|
| 12/31/18 | $11,327 | $10,873 | $10,688 | $11,779 |
|---|
| 12/31/19 | $12,138 | $11,652 | $11,620 | $13,466 |
|---|
| 12/31/20 | $13,077 | $12,553 | $12,492 | $14,424 |
|---|
| 12/31/21 | $13,543 | $13,000 | $12,299 | $15,185 |
|---|
| 12/31/22 | $12,800 | $12,287 | $10,699 | $13,486 |
|---|
| 12/31/23 | $13,945 | $13,386 | $11,291 | $15,299 |
|---|
| 12/31/24 | $14,748 | $14,157 | $11,432 | $16,552 |
|---|
Average Annual Total Returns
| 1 Year | 5 Years | 10 Years |
|---|
| Cantor Fitzgerald High Income Fund | | | |
|---|
| Without Load | 5.76% | 3.97% | 3.96% |
|---|
| With Load | 1.52% | 3.13% | 3.54% |
|---|
| Bloomberg U.S. Aggregate Bond Index | 1.25% | -0.33% | 1.35% |
|---|
| Bloomberg U.S. Corporate High Yield Index | 8.19% | 4.21% | 5.17% |
|---|
The Fund's past performance is not a good predictor of how the Fund will perform in the future. The graph and table do not reflect the deduction of taxes that a shareholder would pay on fund distributions or redemption of fund shares.
| Net Assets | $59,517,214 |
|---|
| Number of Portfolio Holdings | 51 |
|---|
| Advisory Fee (net of waivers) | $75,016 |
|---|
| Portfolio Turnover | 33% |
|---|
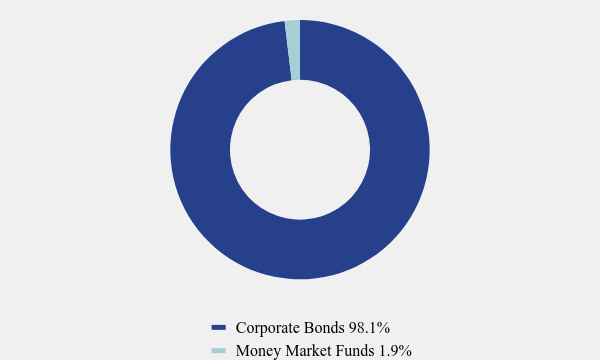
Asset Weighting (% of total investments)
| Value | Value |
|---|
| Corporate Bonds | 98.1% |
| Money Market Funds | 1.9% |
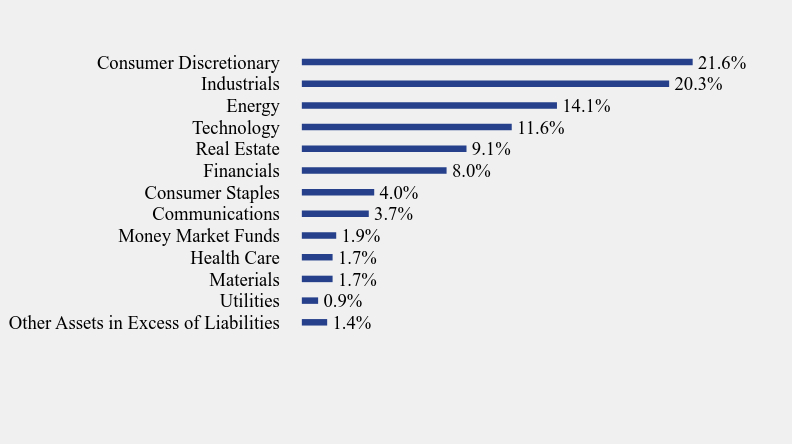
What did the Fund invest in?
Sector Weighting (% of net assets)
| Value | Value |
|---|
| Other Assets in Excess of Liabilities | 1.4% |
| Utilities | 0.9% |
| Materials | 1.7% |
| Health Care | 1.7% |
| Money Market Funds | 1.9% |
| Communications | 3.7% |
| Consumer Staples | 4.0% |
| Financials | 8.0% |
| Real Estate | 9.1% |
| Technology | 11.6% |
| Energy | 14.1% |
| Industrials | 20.3% |
| Consumer Discretionary | 21.6% |
Top 10 Holdings (% of net assets)
| Holding Name | % of Net Assets |
|---|
| Rithm Capital Corporation 144A | 3.6% |
|---|
| Transocean Titan Financing Ltd. 144A | 3.0% |
|---|
| ViaSat, Inc. 144A | 3.0% |
|---|
| QVC, Inc. | 2.9% |
|---|
| Tutor Perini Corporation 144A | 2.8% |
|---|
| Venture Global LNG, Inc. 144A | 2.8% |
|---|
| OneMain Finance Corporation | 2.7% |
|---|
| JB Poindexter & Co Inc 144A | 2.7% |
|---|
| USA Compression Partners, L.P. / USA Compression 144A | 2.6% |
|---|
| TransDigm, Inc. 144A | 2.6% |
|---|
This is a summary of certain changes to the Fund since January 1, 2024. For more complete information, you may review the Fund’s next prospectus, which we expect to be available by May 1, 2025 at Fund at https://highincomefund.cantorassetmanagement.com/ or upon request at (833) 764-2266. As described more fully in Note 1 of the Annual Financial Statements for the Fund, effective as of the close of business on November 22, 2024, each Fund received all of the assets and liabilities of the corresponding fund of the Aquila Funds Trust (each, a “Predecessor Fund”) (the “Reorganization”). Each Predecessor Fund’s investment objective, policies, and limitations were substantially similar to those of the corresponding Fund, each with no operations before the Reorganization. For financial reporting purposes, the Predecessor Fund’s operating history before the Reorganization is reflected in the corresponding Fund’s financial statements and financial highlights. On November 21, 2024, Tair Weller & Baker LLP (“Tait”) resigned as the independent registered public accounting firm of the Funds, and the AuditCommittee of the Board of Trustees approved Cohen & Company, Ltd. to serve as the independent registered public accounting firm of the Funds. There were no disagreements with EY during the Funds' two most recent fiscal years or any subsequent interim period.
Cantor Fitzgerald High Income Fund - Class A (ATPAX)
Annual Shareholder Report - December 31, 2024
Where can I find additional information about the Fund?
Additional information is available on the Fund's website ( https://highincomefund.cantorassetmanagement.com/ ), including its:
Prospectus
Financial information
Holdings
Proxy voting information
Cantor Fitzgerald High Income Fund
Annual Shareholder Report - December 31, 2024
This annual shareholder report contains important information about Cantor Fitzgerald High Income Fund for the period of January 1, 2024 to December 31, 2024. You can find additional information about the Fund at https://highincomefund.cantorassetmanagement.com/. You can also request this information by contacting us at (833) 764-2266. This report describes changes to the Fund that occurred during the reporting period.
What were the Fund’s costs for the last year?
(based on a hypothetical $10,000 investment)
| Class Name | Costs of a $10,000 investment | Costs paid as a percentage of a $10,000 investment |
|---|
| Institutional | $103 | 1.00% |
|---|
How did the Fund perform during the reporting period?
For the year ended December 31, 2024, the Cantor Fitzgerald High Income Fund (the “Fund”) Institutional Class (ATPYX) generated a 5.97% total return, underperforming the 8.19% return of the Bloomberg U.S. Corporate High Yield Index (the “High Yield Index or Index”). The underperformance of ATPYX in 2024 may be attributed to the strategy’s focus on higher quality credits and shorter duration, among other factors. After impressive performance in 2023, where the Index rose over 13% during the year, investors continued to be in a risk-taking mood, although most of the positive total return experienced in the High Yield sector was seen in the second half of the year. Investors had an insatiable demand for yield and underlying credit fundamentals remained stable to improving, making lower-rated credits the clear winner in 2024. Bonds rated CCC returned 15.1%, well out-pacing those rated BB (6.3%) and B-rated issues (7.4%). As the Fund maintained a very conservative risk profile related to credit quality throughout 2024, the average underweight position in CCC-rated issues during the period (3.6% vs. 10.9%) was a clear detraction to Fund performance. However, security selection in bonds rated single-B and BB provided some positive attribution, as Fund holdings rated B were up 7.8% vs. 7.6% for B-rated issuers in the Index. In addition, BB-rated Fund holdings increased 6.4% compared to the 6.2% for the Index. Finally, as the Fund’s weighted average duration remained at least a half-year shorter than the Index, the tightening in High Yield credit spreads provided a further detraction in performance in 2024. Throughout the year, the Option Adjusted Spread on the Index moved from 323 basis points (“bps”) to 287 bps, although the Yield-to-Worst only declined about 10 bps. Although the US Treasury market saw a rise in rates of about 60-90 bps across the yield curve since the Federal Reserve cut the Federal Funds rate in September, the risk-on tone, combined with favorable supply/demand dynamics in the High Yield market, provided some of the catalyst for credit spread tightening and another year of positive total return.
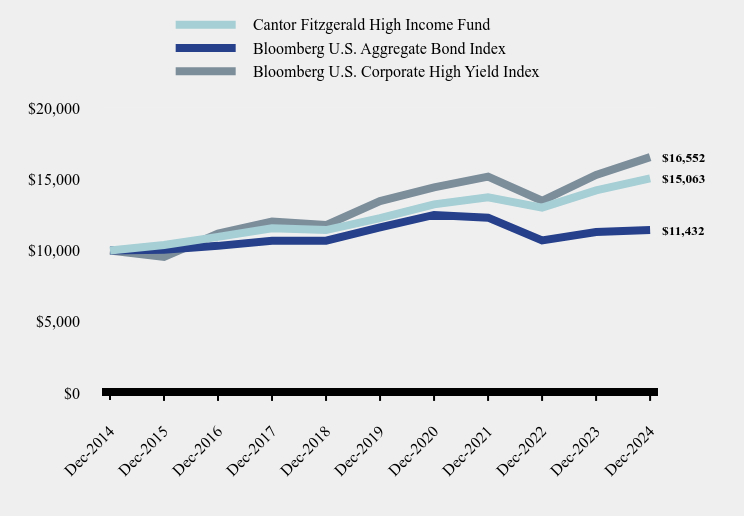
How has the Fund performed over the last ten years?
Total Return Based on $10,000 Investment
| Cantor Fitzgerald High Income Fund | Bloomberg U.S. Aggregate Bond Index | Bloomberg U.S. Corporate High Yield Index |
|---|
| Dec-2014 | $10,000 | $10,000 | $10,000 |
|---|
| Dec-2015 | $10,377 | $10,055 | $9,553 |
|---|
| Dec-2016 | $10,953 | $10,321 | $11,190 |
|---|
| Dec-2017 | $11,556 | $10,687 | $12,029 |
|---|
| Dec-2018 | $11,431 | $10,688 | $11,779 |
|---|
| Dec-2019 | $12,273 | $11,620 | $13,466 |
|---|
| Dec-2020 | $13,233 | $12,492 | $14,424 |
|---|
| Dec-2021 | $13,732 | $12,299 | $15,185 |
|---|
| Dec-2022 | $13,005 | $10,699 | $13,486 |
|---|
| Dec-2023 | $14,213 | $11,291 | $15,299 |
|---|
| Dec-2024 | $15,063 | $11,432 | $16,552 |
|---|
Average Annual Total Returns
| 1 Year | 5 Years | 10 Years |
|---|
| Cantor Fitzgerald High Income Fund | 5.97% | 4.18% | 4.18% |
|---|
| Bloomberg U.S. Aggregate Bond Index | 1.25% | -0.33% | 1.35% |
|---|
| Bloomberg U.S. Corporate High Yield Index | 8.19% | 4.21% | 5.17% |
|---|
The Fund's past performance is not a good predictor of how the Fund will perform in the future. The graph and table do not reflect the deduction of taxes that a shareholder would pay on fund distributions or redemption of fund shares.
| Net Assets | $59,517,214 |
|---|
| Number of Portfolio Holdings | 51 |
|---|
| Advisory Fee (net of waivers) | $75,016 |
|---|
| Portfolio Turnover | 33% |
|---|
Asset Weighting (% of total investments)
| Value | Value |
|---|
| Corporate Bonds | 98.1% |
| Money Market Funds | 1.9% |
What did the Fund invest in?
Sector Weighting (% of net assets)
| Value | Value |
|---|
| Other Assets in Excess of Liabilities | 1.4% |
| Utilities | 0.9% |
| Materials | 1.7% |
| Health Care | 1.7% |
| Money Market Funds | 1.9% |
| Communications | 3.7% |
| Consumer Staples | 4.0% |
| Financials | 8.0% |
| Real Estate | 9.1% |
| Technology | 11.6% |
| Energy | 14.1% |
| Industrials | 20.3% |
| Consumer Discretionary | 21.6% |
Top 10 Holdings (% of net assets)
| Holding Name | % of Net Assets |
|---|
| Rithm Capital Corporation 144A | 3.6% |
|---|
| Transocean Titan Financing Ltd. 144A | 3.0% |
|---|
| ViaSat, Inc. 144A | 3.0% |
|---|
| QVC, Inc. | 2.9% |
|---|
| Tutor Perini Corporation 144A | 2.8% |
|---|
| Venture Global LNG, Inc. 144A | 2.8% |
|---|
| OneMain Finance Corporation | 2.7% |
|---|
| JB Poindexter & Co Inc 144A | 2.7% |
|---|
| USA Compression Partners, L.P. / USA Compression 144A | 2.6% |
|---|
| TransDigm, Inc. 144A | 2.6% |
|---|
This is a summary of certain changes to the Fund since January 1, 2024. For more complete information, you may review the Fund’s next prospectus, which we expect to be available by May 1, 2025 at Fund at https://highincomefund.cantorassetmanagement.com/ or upon request at (833) 764-2266. As described more fully in Note 1 of the Annual Financial Statements for the Fund, effective as of the close of business on November 22, 2024, each Fund received all of the assets and liabilities of the corresponding fund of the Aquila Funds Trust (each, a “Predecessor Fund”) (the “Reorganization”). Each Predecessor Fund’s investment objective, policies, and limitations were substantially similar to those of the corresponding Fund, each with no operations before the Reorganization. For financial reporting purposes, the Predecessor Fund’s operating history before the Reorganization is reflected in the corresponding Fund’s financial statements and financial highlights. On November 21, 2024, Tair Weller & Baker LLP (“Tait”) resigned as the independent registered public accounting firm of the Funds, and the AuditCommittee of the Board of Trustees approved Cohen & Company, Ltd. to serve as the independent registered public accounting firm of the Funds. There were no disagreements with EY during the Funds' two most recent fiscal years or any subsequent interim period.
Cantor Fitzgerald High Income Fund - Institutional (ATPYX)
Annual Shareholder Report - December 31, 2024
Where can I find additional information about the Fund?
Additional information is available on the Fund's website ( https://highincomefund.cantorassetmanagement.com/ ), including its:
Prospectus
Financial information
Holdings
Proxy voting information
Item 2. Code of Ethics.
| (a) | The registrant has, as of the end of the period covered by this report, adopted a code of ethics that applies to the registrant’s principal executive officer, principal financial officer, and principal accounting officer or controller, or persons performing similar functions, regardless of whether these individuals are employed by the registrant or a third party. |
| | |
| (b) | Not applicable. |
| | |
| (c) | During the period covered by this report, there were no amendments to any provision of the code of ethics. |
| | |
| (d) | During the period covered by this report, there were no waivers or implicit waivers of a provision of the code of ethics. |
| | |
| (e) | Not applicable. |
| | |
| (f) | See Item 19(a)(1) |
Item 3. Audit Committee Financial Expert.
(a)(1) The registrant’s board of trustees has determined that the registrant has at least one audit committee financial expert serving on the audit committee. (a)(2) Douglas Barnard is an audit committee financial expert, as defined in Item 3 of Form N-CSR. Mr. Barnard is independent for purposes of this Item. (a)(3) Not applicable. |
Item 4. Principal Accountant Fees and Services.
| (a) | Audit Fees. The aggregate fees billed for each of the last two fiscal years for professional services rendered by the registrant’s principal accountant for the audit of the registrant’s annual financial statements or services that are normally provided by the accountant in connection with statutory and regulatory filings or engagements for those fiscal years are as follows: |
| Trust Series | | 2024 | |
| Cantor Select Portfolios Trust | | $ | 42,000 | |
| (b) | Audit-Related Fees. There were no fees billed in each of the last two fiscal years for assurances and related services by the principal accountant that are reasonably related to the performance of the audit of the registrant’s financial statements and are not reported under paragraph (a) of this Item. |
| (c) | Tax Fees - The aggregate fees billed in each of the last two fiscal years for professional services rendered by the principal accountant for tax compliance are as follows: |
| Trust Series | | 2024 | |
| Cantor Select Portfolios Trust | | $ | 8,000 | |
Preparation of Federal & State income tax returns, assistance with calculation of required income, capital gain and excise distributions and preparation of Federal excise tax returns.
| (d) | All Other Fees. The aggregate fees billed in each of the last two fiscal years for products and services provided by the registrant’s principal accountant, other than the services reported in paragraphs (a) through (c) of this item were $0 and $0 for the fiscal years ended December 31, 2024 and 2023 respectively. |
| | |
| (e)(1) | The audit committee does not have pre-approval policies and procedures. Instead, the audit committee or audit committee chairman approves on a case-by-case basis each audit or non-audit service before the principal accountant is engaged by the registrant. |
| | |
| (e)(2) | There were no services described in each of paragraphs (b) through (d) of this Item that were approved by the audit committee pursuant to paragraph (c)(7)(i)(C) of Rule 2-01 of Regulation S-X. |
| | |
| (f) | Not applicable. |
| | |
| (g) | All non-audit fees billed by the registrant’s principal accountant for services rendered to the registrant for the fiscal years ended December 31, 2024 and 2023 respectively are disclosed in (b)-(d) above. There were no audit or non-audit services performed by the registrant’s principal accountant for the registrant’s adviser. |
| | |
| (h) | Not applicable. |
| | |
| (i) | Not applicable. |
| | |
| (j) | Not applicable. |
Item 5. Audit Committee of Listed Registrants.
Not applicable.
Item 6. Investments.
(a) The Registrant’s schedule of investments in unaffiliated issuers is included in the Financial Statements under Item 7 of this form.
(b) Not applicable.
Item 7. Financial Statements and Financial Highlights for Open-End Management Investment Companies.
(a)
Table of Contents
| Cantor Fitzgerald Equity Opportunity Fund | |
| Schedule of Investments | 1 |
| Statement of Assets and Liabilities | 9 |
| Statement of Operations | 10 |
| Statement of Changes in Net Assets | 11 |
| Financial Highlights | 15 |
| | |
| Cantor Fitzgerald High Income Fund | |
| Schedule of Investments | 5 |
| Statement of Assets and Liabilities | 9 |
| Statement of Operations | 10 |
| Statement of Changes in Net Assets | 13 |
| Financial Highlights | 17 |
| | |
| Cantor Portfolio Select Trust | |
| Notes to Financial Statements | 19 |
| Opinion Letter | 33 |
| Additional Information | 34 |
| | |
| | |
| | |
| CANTOR FITZGERALD EQUITY OPPORTUNITY FUND |
| SCHEDULE OF INVESTMENTS |
| December 31, 2024 |
| Shares | | | | | Fair Value | |
| | | | | COMMON STOCKS — 90.8% | | | | |
| | | | | AEROSPACE & DEFENSE - 1.0% | | | | |
| | 5,000 | | | Aerovironment, Inc.(a) | | $ | 769,450 | |
| | | | | | | | | |
| | | | | AUTOMOTIVE - 0.6% | | | | |
| | 50,000 | | | Ford Motor Company | | | 495,000 | |
| | | | | | | | | |
| | | | | BANKING - 4.2% | | | | |
| | 10,000 | | | Fifth Third Bancorp | | | 422,800 | |
| | 90,000 | | | First Horizon Corporation | | | 1,812,600 | |
| | 53,000 | | | Huntington Bancshares, Inc. | | | 862,310 | |
| | 1,000 | | | M&T Bank Corporation | | | 188,010 | |
| | | | | | | | 3,285,720 | |
| | | | | BIOTECH & PHARMA - 0.4% | | | | |
| | 2,000 | | | Biogen, Inc.(a) | | | 305,840 | |
| | | | | | | | | |
| | | | | CONSTRUCTION MATERIALS - 0.7% | | | | |
| | 2,000 | | | Vulcan Materials Company | | | 514,460 | |
| | | | | | | | | |
| | | | | ELECTRIC UTILITIES - 6.7% | | | | |
| | 5,000 | | | CMS Energy Corporation | | | 333,250 | |
| | 5,000 | | | Consolidated Edison, Inc. | | | 446,150 | |
| | 6,000 | | | Dominion Energy, Inc. | | | 323,160 | |
| | 3,000 | | | DTE Energy Company | | | 362,250 | |
| | 6,000 | | | Entergy Corporation | | | 454,920 | |
| | 11,000 | | | Exelon Corporation | | | 414,040 | |
| | 8,000 | | | FirstEnergy Corporation | | | 318,240 | |
| | 28,000 | | | WEC Energy Group, Inc. | | | 2,633,120 | |
| | | | | | | | 5,285,130 | |
| | | | | ELECTRICAL EQUIPMENT - 1.8% | | | | |
| | 5,000 | | | Rockwell Automation, Inc. | | | 1,428,950 | |
| | | | | | | | | |
| | | | | ENGINEERING & CONSTRUCTION - 2.4% | | | | |
| | 6,000 | | | Quanta Services, Inc. | | | 1,896,300 | |
See accompanying notes which are an integral part of these financial statements.
| CANTOR FITZGERALD EQUITY OPPORTUNITY FUND |
| SCHEDULE OF INVESTMENTS (Continued) |
| December 31, 2024 |
| Shares | | | | | Fair Value | |
| | | | | COMMON STOCKS — 90.8% (Continued) | | | | |
| | | | | ENTERTAINMENT CONTENT - 8.3% | | | | |
| | 62,390 | | | ROBLOX Corporation, Class A(a) | | $ | 3,609,885 | |
| | 16,000 | | | Take-Two Interactive Software, Inc.(a) | | | 2,945,280 | |
| | | | | | | | 6,555,165 | |
| | | | | FOOD - 0.4% | | | | |
| | 7,000 | | | The Campbell’s Company | | | 293,160 | |
| | | | | | | | | |
| | | | | HEALTH CARE FACILITIES & SERVICES - 2.0% | | | | |
| | 8,000 | | | IQVIA Holdings, Inc.(a) | | | 1,572,080 | |
| | | | | | | | | |
| | | | | INSTITUTIONAL FINANCIAL SERVICES - 6.5% | | | | |
| | 9,000 | | | Bank of New York Mellon Corporation (The) | | | 691,470 | |
| | 10,000 | | | Cboe Global Markets, Inc. | | | 1,954,000 | |
| | 6,000 | | | CME Group, Inc. | | | 1,393,380 | |
| | 4,000 | | | Northern Trust Corporation | | | 410,000 | |
| | 5,000 | | | State Street Corporation | | | 490,750 | |
| | 1,000 | | | Tradeweb Markets, Inc., Class A | | | 130,920 | |
| | | | | | | | 5,070,520 | |
| | | | | INSURANCE - 3.1% | | | | |
| | 30,000 | | | MetLife, Inc. | | | 2,456,400 | |
| | | | | | | | | |
| | | | | MACHINERY - 0.9% | | | | |
| | 6,000 | | | Xylem, Inc. | | | 696,120 | |
| | | | | | | | | |
| | | | | MEDICAL EQUIPMENT & DEVICES - 8.4% | | | | |
| | 42,000 | | | DexCom, Inc.(a) | | | 3,266,340 | |
| | 25,000 | | | Illumina, Inc.(a) | | | 3,340,750 | |
| | | | | | | | 6,607,090 | |
| | | | | METALS & MINING - 1.6% | | | | |
| | 80,000 | | | Barrick Gold Corporation | | | 1,240,000 | |
See accompanying notes which are an integral part of these financial statements.
| CANTOR FITZGERALD EQUITY OPPORTUNITY FUND |
| SCHEDULE OF INVESTMENTS (Continued) |
| December 31, 2024 |
| Shares | | | | | Fair Value | |
| | | | | COMMON STOCKS — 90.8% (Continued) | | | | |
| | | | | OIL & GAS PRODUCERS - 6.9% | | | | |
| | 2,550 | | | ConocoPhillips | | $ | 252,884 | |
| | 9,000 | | | Diamondback Energy, Inc. | | | 1,474,470 | |
| | 10,000 | | | Phillips 66 | | | 1,139,300 | |
| | 14,000 | | | Valero Energy Corporation | | | 1,716,260 | |
| | 15,000 | | | Williams Companies, Inc. (The) | | | 811,800 | |
| | | | | | | | 5,394,714 | |
| | | | | RETAIL - DISCRETIONARY - 0.4% | | | | |
| | 4,000 | | | Best Buy Company, Inc. | | | 343,200 | |
| | | | | | | | | |
| | | | | SEMICONDUCTORS - 10.8% | | | | |
| | 24,000 | | | ARM Holdings plc - ADR(a) | | | 2,960,640 | |
| | 32,000 | | | Coherent Corporation(a) | | | 3,031,360 | |
| | 30,000 | | | Micron Technology, Inc. | | | 2,524,800 | |
| | | | | | | | 8,516,800 | |
| | | | | SOFTWARE - 13.0% | | | | |
| | 9,000 | | | Cadence Design Systems, Inc.(a) | | | 2,704,140 | |
| | 34,400 | | | Elastic N.V.(a) | | | 3,408,351 | |
| | 15,000 | | | IonQ, Inc.(a) | | | 626,550 | |
| | 3,000 | | | Synopsys, Inc.(a) | | | 1,456,080 | |
| | 8,000 | | | Workday, Inc., Class A(a) | | | 2,064,240 | |
| | | | | | | | 10,259,361 | |
| | | | | STEEL - 0.9% | | | | |
| | 6,000 | | | Steel Dynamics, Inc. | | | 684,420 | |
| | | | | | | | | |
| | | | | TECHNOLOGY HARDWARE - 6.3% | | | | |
| | 35,050 | | | Arista Networks Inc(a) | | | 3,874,077 | |
| | 64,000 | | | Extreme Networks, Inc.(a) | | | 1,071,360 | |
| | | | | | | | 4,945,437 | |
See accompanying notes which are an integral part of these financial statements.
| CANTOR FITZGERALD EQUITY OPPORTUNITY FUND |
| SCHEDULE OF INVESTMENTS (Continued) |
| December 31, 2024 |
| Shares | | | | | Fair Value | |
| | | | | COMMON STOCKS — 90.8% (Continued) | | | | |
| | | | | TRANSPORTATION EQUIPMENT - 3.5% | | | | |
| | 20,000 | | | Allison Transmission Holdings, Inc. | | $ | 2,161,200 | |
| | 6,000 | | | PACCAR, Inc. | | | 624,120 | |
| | | | | | | | 2,785,320 | |
| | | | | | | | | |
| | | | | TOTAL COMMON STOCKS (Cost $51,476,842) | | | 71,400,637 | |
| | | | | | | | | |
| Shares | | | | | Fair Value | |
| | | | | REITS — 7.7% | | | | |
| | | | | REITS – 7.7% | | | | |
| | 6,000 | | | American Tower Corporation, Class A | | | 1,100,460 | |
| | 20,000 | | | Crown Castle, Inc. | | | 1,815,200 | |
| | 10,000 | | | Iron Mountain, Inc. | | | 1,051,100 | |
| | 70,000 | | | VICI Properties, Inc. | | | 2,044,700 | |
| | | | | | | | | |
| | | | | TOTAL REITS (Cost $5,639,638) | | | 6,011,460 | |
| | | | | | | | | |
| Shares | | | | | Fair Value | |
| | | | | SHORT-TERM INVESTMENTS — 2.0% | | | | |
| | | | | MONEY MARKET FUNDS - 2.0% | | | | |
| | 1,554,565 | | | Fidelity Investments Money Market Government Portfolio, Class I, 4.35% (Cost $1,554,565)(b) | | | 1,554,565 | |
| | | | | | | | | |
| | | | | TOTAL INVESTMENTS - 100.5% (Cost $58,671,045) | | $ | 78,966,662 | |
| | | | | LIABILITIES IN EXCESS OF OTHER ASSETS - (0.5)% | | | (373,192 | ) |
| | | | | NET ASSETS - 100.0% | | $ | 78,593,470 | |
| ADR | - American Depositary Receipt |
| | |
| LLC | - Limited Liability Company |
| | |
| LP | - Limited Partnership |
| | |
| NV | - Naamioze Vennootschap |
| | |
| PLC | - Public Limited Company |
| | |
| REIT | - Real Estate Investment Trust |
| (a) | Non-income producing security. |
| (b) | Rate disclosed is the seven day effective yield as of December 31, 2024. |
See accompanying notes which are an integral part of these financial statements.
| CANTOR FITZGERALD HIGH INCOME FUND |
| SCHEDULE OF INVESTMENTS |
| December 31, 2024 |
| Principal | | | | | Coupon Rate | | | | | |
| Amount ($) | | | | | (%) | | Maturity | | Fair Value | |
| | | | | | | | | | | |
| | | | | CORPORATE BONDS — 96.7% | | | | | | | | |
| | | | | AEROSPACE & DEFENSE — 2.6% | | | | | | | | |
| | 1,500,000 | | | TransDigm, Inc.(a) | | 6.8750 | | 12/15/30 | | $ | 1,522,312 | |
| | | | | | | | | | | | | |
| | | | | AUTOMOTIVE — 2.1% | | | | | | | | |
| | 1,250,000 | | | Ford Motor Company | | 6.1000 | | 08/19/32 | | | 1,243,950 | |
| | | | | | | | | | | | | |
| | | | | ELECTRIC UTILITIES — 0.9% | | | | | | | | |
| | 545,813 | | | Midland Cogeneration Venture LP(a) | | 6.0000 | | 03/15/25 | | | 540,354 | |
| | | | | | | | | | | | | |
| | | | | ENGINEERING & CONSTRUCTION — 2.8% | | | | | | | | |
| | 1,500,000 | | | Tutor Perini Corporation(a) | | 11.8750 | | 04/30/29 | | | 1,658,393 | |
| | | | | | | | | | | | | |
| | | | | ENTERTAINMENT CONTENT — 2.3% | | | | | | | | |
| | 1,500,000 | | | ROBLOX Corporation(a) | | 3.8750 | | 05/01/30 | | | 1,351,720 | |
| | | | | | | | | | | | | |
| | | | | HEALTH CARE FACILITIES & SERVICES — 1.7% | | | | | | | | |
| | 1,000,000 | | | IQVIA Inc(a) | | 6.5000 | | 05/15/30 | | | 1,017,571 | |
| | | | | | | | | | | | | |
| | | | | HOME CONSTRUCTION — 2.5% | | | | | | | | |
| | 1,500,000 | | | Century Communities, Inc. | | 6.7500 | | 06/01/27 | | | 1,500,862 | |
| | | | | | | | | | | | | |
| | | | | INTERNET MEDIA & SERVICES — 1.4% | | | | | | | | |
| | 850,000 | | | Cars.com, Inc.(a) | | 6.3750 | | 11/01/28 | | | 844,773 | |
| | | | | | | | | | | | | |
| | | | | LEISURE FACILITIES & SERVICES — 8.5% | | | | | | | | |
| | 1,500,000 | | | Caesars Entertainment, Inc.(a) | | 6.5000 | | 02/15/32 | | | 1,506,770 | |
| | 500,000 | | | Mohegan Gaming & Entertainment(a) | | 8.0000 | | 02/01/26 | | | 497,490 | |
| | 1,026,000 | | | Penn National Gaming, Inc.(a) | | 5.6250 | | 01/15/27 | | | 1,010,202 | |
| | 1,000,000 | | | Royal Caribbean Cruises Ltd.(a) | | 6.0000 | | 02/01/33 | | | 997,625 | |
| | 1,000,000 | | | Vail Resorts Inc(a) | | 6.5000 | | 05/15/32 | | | 1,011,218 | |
| | | | | | | | | | | | 5,023,305 | |
| | | | | LEISURE PRODUCTS — 1.7% | | | | | | | | |
| | 1,000,000 | | | Acushnet Co.(a) | | 7.3750 | | 10/15/28 | | | 1,033,477 | |
See accompanying notes which are an integral part of these financial statements.
| CANTOR FITZGERALD HIGH INCOME FUND |
| SCHEDULE OF INVESTMENTS (Continued) |
| December 31, 2024 |
| Principal | | | | | Coupon Rate | | | | | |
| Amount ($) | | | | | (%) | | Maturity | | Fair Value | |
| | | | | CORPORATE BONDS — 96.7% (Continued) | | | | | | | | |
| | | | | OIL & GAS PRODUCERS — 7.4% | | | | | | | | |
| | 500,000 | | | Cheniere Energy, Inc. | | 4.6250 | | 10/15/28 | | $ | 489,155 | |
| | 1,175,000 | | | Global Partners, L.P. / GLP Finance Corporation | | 7.0000 | | 08/01/27 | | | 1,179,036 | |
| | 1,000,000 | | | Occidental Petroleum Corporation | | 7.5000 | | 05/01/31 | | | 1,093,259 | |
| | 1,500,000 | | | Venture Global LNG, Inc.(a) | | 9.8750 | | 02/01/32 | | | 1,645,919 | |
| | | | | | | | | | | | 4,407,369 | |
| | | | | OIL & GAS SERVICES & EQUIPMENT — 6.7% | | | | | | | | |
| | 750,000 | | | Nabors Industries, Inc.(a) | | 8.8750 | | 08/15/31 | | | 696,440 | |
| | 1,750,000 | | | Transocean Titan Financing Ltd.(a) | | 8.3750 | | 02/01/28 | | | 1,785,659 | |
| | 1,500,000 | | | USA Compression Partners, L.P. / USA Compression(a) | | 7.1250 | | 03/15/29 | | | 1,526,471 | |
| | | | | | | | | | | | 4,008,570 | |
| | | | | REAL ESTATE INVESTMENT TRUSTS — 5.3% | | | | | | | | |
| | 1,000,000 | | | Iron Mountain, Inc.(a) | | 5.2500 | | 03/15/28 | | | 978,209 | |
| | 1,265,000 | | | RHP Hotel Properties LP / RHP Finance Corp(a) | | 4.5000 | | 02/15/29 | | | 1,194,321 | |
| | 1,000,000 | | | VICI Properties, L.P. / VICI Note Company, Inc.(a) | | 4.6250 | | 12/01/29 | | | 957,835 | |
| | | | | | | | | | | | 3,130,365 | |
| | | | | REAL ESTATE OWNERS & DEVELOPERS — 2.0% | | | | | | | | |
| | 1,230,000 | | | Howard Hughes Corporation (The)(a) | | 5.3750 | | 08/01/28 | | | 1,194,742 | |
| | | | | | | | | | | | | |
| | | | | REAL ESTATE SERVICES — 1.8% | | | | | | | | |
| | 1,100,000 | | | Cushman & Wakefield US Borrower, LLC(a) | | 6.7500 | | 05/15/28 | | | 1,100,999 | |
| | | | | | | | | | | | | |
| | | | | RETAIL - DISCRETIONARY — 6.9% | | | | | | | | |
| | 870,000 | | | Bath & Body Works, Inc. | | 6.6940 | | 01/15/27 | | | 888,512 | |
| | 1,503,000 | | | Builders FirstSource, Inc.(a) | | 5.0000 | | 03/01/30 | | | 1,428,777 | |
| | 1,750,000 | | | QVC, Inc. | | 4.4500 | | 02/15/25 | | | 1,738,667 | |
| | | | | | | | | | | | 4,055,956 | |
| | | | | SEMICONDUCTORS — 2.0% | | | | | | | | |
| | 1,250,000 | | | Coherent Corp(a) | | 5.0000 | | 12/15/29 | | | 1,192,866 | |
| | | | | | | | | | | | | |
| | | | | SOFTWARE — 5.1% | | | | | | | | |
| | 250,000 | | | Cloud Software Group, Inc.(a) | | 9.0000 | | 09/30/29 | | | 253,823 | |
| | 1,500,000 | | | Elastic N.V.(a) | | 4.1250 | | 07/15/29 | | | 1,390,599 | |
| | 1,500,000 | | | ZoomInfo Technologies, LLC/ZoomInfo Finance(a) | | 3.8750 | | 02/01/29 | | | 1,363,163 | |
| | | | | | | | | | | | 3,007,585 | |
See accompanying notes which are an integral part of these financial statements.
| CANTOR FITZGERALD HIGH INCOME FUND |
| SCHEDULE OF INVESTMENTS (Continued) |
| December 31, 2024 |
| Principal | | | | | Coupon Rate | | | | | |
| Amount ($) | | | | | (%) | | Maturity | | Fair Value | |
| | | | | CORPORATE BONDS — 96.7% (Continued) | | | | | | | | |
| | | | | SPECIALTY FINANCE — 8.0% | | | | | | | | |
| | 1,000,000 | | | Fortress Transportation and Infrastructure(a) | | 7.0000 | | 06/15/32 | | $ | 1,019,710 | |
| | 1,500,000 | | | OneMain Finance Corporation | | 9.0000 | | 01/15/29 | | | 1,590,555 | |
| | 2,163,000 | | | Rithm Capital Corporation(a) | | 6.2500 | | 10/15/25 | | | 2,161,336 | |
| | | | | | | | | | | | 4,771,601 | |
| | | | | STEEL — 1.6% | | | | | | | | |
| | 1,000,000 | | | Cleveland-Cliffs, Inc.(a) | | 6.7500 | | 04/15/30 | | | 977,844 | |
| | | | | | | | | | | | | |
| | | | | TECHNOLOGY HARDWARE — 3.0% | | | | | | | | |
| | 1,800,000 | | | ViaSat, Inc.(a) | | 5.6250 | | 09/15/25 | | | 1,783,738 | |
| | | | | | | | | | | | | |
| | | | | TECHNOLOGY SERVICES — 1.5% | | | | | | | | |
| | 1,000,000 | | | Iron Mountain Information Management Services,(a) | | 5.0000 | | 07/15/32 | | | 920,371 | |
| | | | | | | | | | | | | |
| | | | | TRANSPORTATION & LOGISTICS — 8.4% | | | | | | | | |
| | 1,000,000 | | | American Airlines, Inc./AAdvantage Loyalty IP Ltd.(a) | | 5.5000 | | 04/20/26 | | | 996,767 | |
| | 500,000 | | | Bristow Group, Inc.(a) | | 6.8750 | | 03/01/28 | | | 497,391 | |
| | 750,000 | | | Genesee & Wyoming, Inc.(a) | | 6.2500 | | 04/15/32 | | | 754,522 | |
| | 750,000 | | | JetBlue Airways Corp / JetBlue Loyalty, L.P.(a) | | 9.8750 | | 09/20/31 | | | 796,790 | |
| | 1,000,000 | | | United Airlines, Inc.(a) | | 4.3750 | | 04/15/26 | | | 983,259 | |
| | 1,000,000 | | | Watco Cos LLC / Watco Finance Corp(a) | | 7.1250 | | 08/01/32 | | | 1,030,749 | |
| | | | | | | | | | | | 5,059,478 | |
| | | | | TRANSPORTATION EQUIPMENT — 6.5% | | | | | | | | |
| | 1,250,000 | | | Allison Transmission, Inc.(a) | | 5.8750 | | 06/01/29 | | | 1,241,783 | |
| | 1,500,000 | | | JB Poindexter & Co Inc(a) | | 8.7500 | | 12/15/31 | | | 1,578,940 | |
| | 1,000,000 | | | Trinity Industries, Inc.(a) | | 7.7500 | | 07/15/28 | | | 1,037,732 | |
| | | | | | | | | | | | 3,858,455 | |
| | | | | WHOLESALE - CONSUMER STAPLES — 4.0% | | | | | | | | |
| | 1,000,000 | | | Performance Food Group, Inc.(a) | | 4.2500 | | 08/01/29 | | | 927,833 | |
| | 1,500,000 | | | US Foods, Inc.(a) | | 4.7500 | | 02/15/29 | | | 1,436,512 | |
| | | | | | | | | | | | 2,364,345 | |
| | | | | | | | | | | | | |
| | | | | TOTAL CORPORATE BONDS (Cost $57,130,390) | | | | | | | 57,571,001 | |
See accompanying notes which are an integral part of these financial statements.
| CANTOR FITZGERALD HIGH INCOME FUND |
| SCHEDULE OF INVESTMENTS (Continued) |
| December 31, 2024 |
| Shares | | | | | Fair Value | |
| | | | | SHORT-TERM INVESTMENTS — 1.9% | | | | |
| | | | | MONEY MARKET FUNDS - 1.9% | | | | |
| | 1,129,388 | | | Fidelity Investments Money Market Government Portfolio, Class I, 4.35% (Cost $1,129,388)(b) | | $ | 1,129,388 | |
| | | | | | | | | |
| | | | | TOTAL INVESTMENTS - 98.6% (Cost $58,259,778) | | $ | 58,700,389 | |
| | | | | OTHER ASSETS IN EXCESS OF LIABILITIES- 1.4% | | | 816,825 | |
| | | | | NET ASSETS - 100.0% | | $ | 59,517,214 | |
| LLC | - Limited Liability Company |
| | |
| LP | - Limited Partnership |
| | |
| NV | - Naamioze Vennootschap |
| (a) | Security exempt from registration under Rule 144A or Section 4(2) of the Securities Act of 1933. The security may be resold in transactions exempt from registration, normally to qualified institutional buyers. As of December 31, 2024 the total market value of 144A securities is $47,847,005 or 80.4% of net assets. |
| (b) | Rate disclosed is the seven day effective yield as of December 31, 2024. |
See accompanying notes which are an integral part of these financial statements.
| CANTOR FITZGERALD FUNDS |
| STATEMENTS OF ASSETS AND LIABILITIES |
| December 31, 2024 |
| | | Cantor Fitzgerald | | | Cantor Fitzgerald | |
| | | Equity Opportunity | | | High Income | |
| | | Fund | | | Fund | |
| ASSETS | | | | | | | | |
| At cost | | $ | 58,671,045 | | | $ | 58,259,778 | |
| At value | | $ | 78,966,662 | | | $ | 58,700,389 | |
| Dividends & interest receivable | | | 147,348 | | | | 1,012,442 | |
| Receivable for capital shares sold | | | 529 | | | | 87,482 | |
| Prepaid expenses and other assets | | | 6,866 | | | | 19,902 | |
| TOTAL ASSETS | | | 79,121,405 | | | | 59,820,215 | |
| | | | | | | | | |
| LIABILITIES | | | | | | | | |
| Payable to Advisor | | | 148,424 | | | | 38,675 | |
| Payable for capital shares redeemed | | | 246,106 | | | | 102,864 | |
| Dividends payable | | | — | | | | 47,177 | |
| Accrued 12b-1 fees - Class A | | | 17,479 | | | | 7,086 | |
| Payable to administrator | | | 9,503 | | | | 18,416 | |
| Other accrued expenses and liabilities | | | 106,423 | | | | 88,783 | |
| TOTAL LIABILITIES | | | 527,935 | | | | 303,001 | |
| | | | | | | | | |
| NET ASSETS | | $ | 78,593,470 | | | $ | 59,517,214 | |
| | | | | | | | | |
| NET ASSETS CONSISTS OF | | | | | | | | |
| Paid-in capital | | $ | 60,649,198 | | | $ | 68,617,574 | |
| Accumulated earnings (losses) | | | 17,944,272 | | | | (9,100,360 | ) |
| Net Assets | | $ | 78,593,470 | | | $ | 59,517,214 | |
| | | | | | | | | |
| Class A: | | | | | | | | |
| Net Assets | | $ | 43,316,955 | | | $ | 25,510,672 | |
| Shares of beneficial interest outstanding, unlimited authorization, no par value | | | 1,242,718 | | | | 3,127,692 | |
| Net asset value per share | | $ | 34.86 | | | $ | 8.16 | |
| Sales Charge | | | 5.75 | % | | | 4.00 | % |
| Offering price per share, equal to net asset value per share/(1-sales charge) | | $ | 36.99 | | | $ | 8.50 | |
| | | | | | | | | |
| Institutional Class: | | | | | | | | |
| Net Assets | | $ | 35,276,515 | | | $ | 34,006,542 | |
| Shares of beneficial interest outstanding, unlimited authorization, no par value | | | 840,888 | | | | 4,164,757 | |
| Net asset value per share | | $ | 41.95 | | | $ | 8.17 | |
See Accompanying Notes to Financial Statements.
| CANTOR FITZGERALD FUNDS |
| STATEMENTS OF OPERATIONS |
| | | Cantor Fitzgerald | | | Cantor Fitzgerald | |
| | | Equity Opportunity | | | High Income | |
| | | Fund | | | Fund | |
| | | For the | | | For the | |
| | | Year Ended | | | Year Ended | |
| | | December 31, 2024 | | | December 31, 2024 | |
| INVESTMENT INCOME | | | | | | | | |
| Dividends | | $ | 1,437,155 | | | $ | — | |
| Interest | | | — | | | | 4,956,625 | |
| Less: Foreign withholding taxes | | | (7,200 | ) | | | — | |
| TOTAL INVESTMENT INCOME | | | 1,429,955 | | | | 4,956,625 | |
| | | | | | | | | |
| EXPENSES | | | | | | | | |
| Advisor fees | | | 922,917 | | | | 510,491 | |
| Distribution fees - Class A | | | 173,566 | | | | 67,303 | |
| Administration and accounting fees | | | 61,778 | | | | 66,819 | |
| Transfer agent fees | | | 163,073 | | | | 142,809 | |
| Audit and tax services fees | | | 28,400 | | | | 20,900 | |
| Printing and mailing expense | | | 29,317 | | | | 20,793 | |
| Trustee fees | | | 127,411 | | | | 99,482 | |
| Registration fees | | | 64,794 | | | | 66,570 | |
| Compliance services fees | | | 8,265 | | | | 8,261 | |
| Legal fees | | | 330,927 | | | | 255,847 | |
| Custodian and bank service fees | | | 7,638 | | | | 5,074 | |
| Insurance expense | | | 14,645 | | | | 10,795 | |
| Shareholder servicing fees - Class A | | | 523 | | | | 458 | |
| Others fees | | | 24,453 | | | | 5,107 | |
| Total Operating Expenses | | | 1,957,707 | | | | 1,280,709 | |
| TOTAL EXPENSES | | | 1,957,707 | | | | 1,280,709 | |
| Fees reduced by the Manager | | | — | | | | (435,475 | ) |
| NET EXPENSES | | | 1,957,707 | | | | 845,234 | |
| | | | | | | | | |
| NET INVESTMENT INCOME (LOSS) | | | (527,752 | ) | | | 4,111,391 | |
| | | | | | | | | |
| REALIZED AND UNREALIZED GAINS (LOSSES) ON INVESTMENTS | | | | | | | | |
| Net realized gain (loss) from: | | | | | | | | |
| Investment transactions | | | 18,919,322 | | | | (491,921 | ) |
| | | | | | | | | |
| Net change in unrealized appreciation (depreciation) from: | | | | | | | | |
| Investment transactions | | | (8,573,574 | ) | | | 976,206 | |
| NET REALIZED AND UNREALIZED GAINS ON INVESTMENTS | | | 10,345,748 | | | | 484,285 | |
| | | | | | | | | |
| NET INCREASE IN NET ASSETS RESULTING FROM OPERATIONS | | $ | 9,817,996 | | | $ | 4,595,676 | |
See Accompanying Notes to Financial Statements.
| CANTOR FITZGERALD FUNDS |
| STATEMENTS OF CHANGES IN NET ASSETS |
| | | Cantor Fitzgerald Equity Opportunity Fund | |
| | | Year Ended | | | Year Ended | |
| | | December 31, | | | December 31, | |
| | | 2024 (a) | | | 2023 | |
| OPERATIONS | | | | | | | | |
| Net investment income (loss) | | $ | (527,752 | ) | | $ | 173,690 | |
| Net realized gain (loss) from: | | | | | | | | |
| Investment transactions | | | 18,919,322 | | | | (898,526 | ) |
| Net change in unrealized appreciation (depreciation) on: | | | | | | | | |
| Investment transactions | | | (8,573,574 | ) | | | 14,413,404 | |
| Net increase in net assets resulting from operations | | | 9,817,996 | | | | 13,688,568 | |
| | | | | | | | | |
| DISTRIBUTIONS TO SHAREHOLDERS | | | | | | | | |
| Distributed earnings: | | | | | | | | |
| Class A | | | (10,266,418 | ) | | | — | |
| Class Y | | | (110,279 | ) | | | — | |
| Institutional Class | | | (7,193,448 | ) | | | — | |
| | | | (17,570,145 | ) | | | — | |
| CAPITAL SHARE TRANSACTIONS | | | | | | | | |
| Proceeds from shares sold | | | | | | | | |
| Class A | | | 950,069 | (b) | | | 2,711,892 | |
| Class C | | | 110,414 | | | | 58,114 | |
| Class I | | | 70,805 | | | | 129,777 | |
| Class Y | | | 2,013,998 | | | | 5,443,207 | |
| Institutional Class | | | 511,465 | (c) | | | — | |
| | | | 3,656,751 | | | | 8,342,990 | |
| Net asset value of shares issued in reinvestment of distributions to shareholders | | | | | | | | |
| Class A | | | 9,383,125 | | | | — | |
| Class Y | | | 103,918 | | | | — | |
| Institutional Class | | | 6,572,517 | | | | — | |
| | | | 16,059,560 | | | | — | |
| Payments for shares redeemed | | | | | | | | |
| Class A | | | (23,597,814 | ) | | | (14,817,808 | ) |
| Class C | | | (1,858,440 | ) (b) | | | (2,413,028 | ) |
| Class I | | | (229,667 | ) (b) | | | (853,168 | ) |
| Class Y | | | (22,647,068 | ) (c) | | | (16,658,620 | ) |
| Institutional Class | | | (2,950,830 | ) | | | — | |
| | | | (51,283,819 | ) | | | (34,742,624 | ) |
| | | | | | | | | |
| Net decrease in net assets from capital share transactions | | | (31,567,508 | ) | | | (26,399,634 | ) |
| | | | | | | | | |
| TOTAL DECREASE IN NET ASSETS | | | (39,319,657 | ) | | | (12,711,066 | ) |
| | | | | | | | | |
| NET ASSETS | | | | | | | | |
| Beginning of year | | | 117,913,127 | | | | 130,624,193 | |
| End of year | | $ | 78,593,470 | | | $ | 117,913,127 | |
| (a) | Effective close of business on November 22, 2024, shares of Aquila Opportunity Growth Fund were reorganized into shares of Cantor Fitzgerald Equity Opportunity Fund. See notes to the financial statements. |
| (b) | Includes exchanges from Aquila Opportunity Growth Fund Class C and Class I to Cantor Fitzgerald Equity Opportunity Fund Class A upon conversion of shares on November 22, 2024. |
| (c) | Includes exchanges from Aquila Opportunity Growth Fund Class Y to Cantor Fitzgerald Equity Opportunity Fund Institutional Class upon conversion of shares on November 22, 2024. |
See Accompanying Notes to Financial Statements.
| CANTOR FITZGERALD FUNDS |
| STATEMENTS OF CHANGES IN NET ASSETS (Continued) |
| | | Cantor Fitzgerald Equity Opportunity Fund | |
| | | Year Ended | | | Year Ended | |
| | | December 31, | | | December 31, | |
| | | 2024(a) | | | 2023 | |
| CAPITAL SHARE ACTIVITY | | | | | | | | |
| Shares sold: | | | | | | | | |
| Class A | | | 56,274 | (b) | | | 72,561 | |
| Class C | | | 4,339 | | | | 2,495 | |
| Class I | | | 1,628 | | | | 3,288 | |
| Class Y | | | 41,037 | | | | 126,665 | |
| Institutional Class | | | 753,060 | (c) | | | — | |
| | | | 856,338 | | | | 205,009 | |
| Shares reinvested: | | | | | | | | |
| Class A | | | 259,145 | | | | — | |
| Class I | | | 17 | | | | — | |
| Class Y | | | 2,061 | | | | — | |
| Institutional Class | | | 150,970 | | | | — | |
| | | | 412,193 | | | | — | |
| Shares redeemed: | | | | | | | | |
| Class A | | | (557,557 | ) | | | (399,273 | ) |
| Class C | | | (103,847 | ) (b) | | | (103,616 | ) |
| Class I | | | (5,218 | ) (b) | | | (21,214 | ) |
| Class Y | | | (1,195,422 | ) (c) | | | (389,405 | ) |
| Institutional Class | | | (74,931 | ) | | | — | |
| | | | (1,936,975 | ) | | | (913,508 | ) |
| | | | | | | | | |
| Net decrease in shares outstanding | | | (668,444 | ) | | | (708,499 | ) |
| Shares outstanding, beginning of year | | | 2,752,050 | | | | 3,460,549 | |
| Shares outstanding, end of year | | | 2,083,606 | | | | 2,752,050 | |
| (a) | Effective close of business on November 22, 2024, shares of Aquila Opportunity Growth Fund were reorganized into shares of Cantor Fitzgerald Equity Opportunity Fund. See notes to the financial statements. |
| (b) | Includes exchanges of 33,646 shares from Aquila Opportunity Growth Fund Class C and 11,789 shares from Aquila Opportunity Growth Fund Class I to 33,418 shares of Cantor Fitzgerald Equity Opportunity Fund Class A upon conversion on November 22, 2024. |
| (c) | Includes exchanges of 743,262 shares from Aquila Opportunity Growth Fund Class Y to Cantor Fitzgerald Equity Opportunity Fund Institutional Class upon conversion on November 22, 2024. |
See Accompanying Notes to Financial Statements.
| CANTOR FITZGERALD FUNDS |
| STATEMENTS OF CHANGES IN NET ASSETS |
| | | Cantor Fitzgerald High Income Fund | |
| | | Year Ended | | | Year Ended | |
| | | December 31, | | | December 31, | |
| | | 2024 (a) | | | 2023 | |
| OPERATIONS | | | | | | | | |
| Net investment income | | $ | 4,111,391 | | | $ | 4,382,117 | |
| Net realized loss from: | | | | | | | | |
| Investment transactions | | | (491,921 | ) | | | (3,670,772 | ) |
| Net change in unrealized appreciation on: | | | | | | | | |
| Investment transactions | | | 976,206 | | | | 7,662,642 | |
| Net increase in net assets resulting from operations | | | 4,595,676 | | | | 8,373,987 | |
| | | | | | | | | |
| DISTRIBUTIONS TO SHAREHOLDERS | | | | | | | | |
| Distributed earnings: | | | | | | | | |
| Class A | | | (1,521,986 | ) | | | (1,501,842 | ) |
| Class C | | | (37,307 | ) | | | (43,925 | ) |
| Class I | | | (23,304 | ) | | | (30,069 | ) |
| Class Y | | | (2,377,096 | ) | | | (3,006,909 | ) |
| Institutional Class | | | (228,661 | ) | | | — | |
| | | | (4,188,354 | ) | | | (4,582,745 | ) |
| CAPITAL SHARE TRANSACTIONS | | | | | | | | |
| Proceeds from shares sold | | | | | | | | |
| Class A | | | 1,034,020 | (b) | | | 3,094,440 | |
| Class C | | | 94,776 | | | | 218,949 | |
| Class I | | | 3,418 | | | | 7,843 | |
| Class Y | | | 5,785,030 | | | | 14,789,939 | |
| Institutional Class | | | 70,737 | (c) | | | — | |
| | | | 6,987,981 | | | | 18,111,171 | |
| Net asset value of shares issued in reinvestment of distributions to shareholders | | | | | | | | |
| Class A | | | 1,291,927 | | | | 1,351,964 | |
| Class C | | | 34,279 | | | | 42,446 | |
| Class I | | | 19,517 | | | | 25,216 | |
| Class Y | | | 2,064,432 | | | | 2,583,564 | |
| Institutional Class | | | 196,352 | | | | — | |
| | | | 3,606,507 | | | | 4,003,190 | |
| Payments for shares redeemed | | | | | | | | |
| Class A | | | (10,035,574 | ) | | | (9,355,639 | ) |
| Class C | | | (324,667 | ) (b) | | | (569,210 | ) |
| Class I | | | (247,363 | ) (b) | | | (216,025 | ) |
| Class Y | | | (33,864,641 | ) (c) | | | (22,385,976 | ) |
| Institutional Class | | | (1,771,675 | ) | | | — | |
| | | | (46,243,920 | ) | | | (32,526,850 | ) |
| | | | | | | | | |
| Net decrease in net assets from capital share transactions | | | (35,649,432 | ) | | | (10,412,489 | ) |
| | | | | | | | | |
| TOTAL DECREASE IN NET ASSETS | | | (35,242,110 | ) | | | (6,621,247 | ) |
| | | | | | | | | |
| NET ASSETS | | | | | | | | |
| Beginning of year | | | 94,759,324 | | | | 101,380,571 | |
| End of year | | $ | 59,517,214 | | | $ | 94,759,324 | |
| (a) | Effective close of business on November 22, 2024, shares of Aquila High Income Fund were reorganized into shares of Cantor Fitzgerald High Income Fund. See notes to the financial statements. |
| (b) | Includes exchanges from Aquila High Income Fund Class C and Aquila High Income Fund Class I to Cantor Fitzgerald High Income Fund Class A upon conversion of shares on November 22, 2024. |
| (c) | Includes exchanges from Aquila High Income Fund Class Y to Cantor Fitzgerald High Income Fund Institutional Class upon conversion of shares on November 22, 2024. |
See Accompanying Notes to Financial Statements.
| CANTOR FITZGERALD FUNDS |
| STATEMENTS OF CHANGES IN NET ASSETS (Continued) |
| | | Cantor Fitzgerald High Income Fund | |
| | | Year Ended | | | Year Ended | |
| | | December 31, | | | December 31, | |
| | | 2024 (a) | | | 2023 | |
| CAPITAL SHARE ACTIVITY | | | | | | | | |
| Shares sold: | | | | | | | | |
| Class A | | | 284,940 | (b) | | | 390,650 | |
| Class C | | | 11,688 | | | | 27,580 | |
| Class I | | | 422 | | | | 995 | |
| Class Y | | | 711,220 | | | | 1,869,993 | |
| Institutional Class | | | 4,342,522 | (c) | | | — | |
| | | | 5,350,792 | | | | 2,289,218 | |
| Shares reinvested: | | | | | | | | |
| Class A | | | 157,011 | | | | 170,936 | |
| Class C | | | 4,200 | | | | 5,368 | |
| Class I | | | 2,397 | | | | 3,192 | |
| Class Y | | | 252,960 | | | | 326,344 | |
| Institutional Class | | | 24,000 | | | | — | |
| | | | 440,568 | | | | 505,840 | |
| Shares redeemed: | | | | | | | | |
| Class A | | | (1,227,289 | ) | | | (1,184,456 | ) |
| Class C | | | (146,480 | ) (b) | | | (72,165 | ) |
| Class I | | | (30,364 | ) (b) | | | (27,375 | ) |
| Class Y | | | (8,479,449 | ) (c) | | | (2,838,986 | ) |
| Institutional Class | | | (265,560 | ) | | | — | |
| | | | (10,149,142 | ) | | | (4,122,982 | ) |
| | | | | | | | | |
| Net decrease in shares outstanding | | | (4,357,782 | ) | | | (1,327,924 | ) |
| Shares outstanding, beginning of year | | | 11,650,231 | | | | 12,978,155 | |
| Shares outstanding, end of year | | | 7,292,449 | | | | 11,650,231 | |
| (a) | Effective close of business on November 22, 2024, shares of Aquila High Income Fund were reorganized into shares of Cantor Fitzgerald High Income Fund. See notes to the financial statements. |
| (b) | Includes exchanges of 106,571 shares from Aquila High Income Fund Class C and 50,100 shares from Aquila High Income Fund Class I to 156,636 shares of Cantor Fitzgerald High Income Fund Class A upon conversion on November 22, 2024. |
| (c) | Includes exchanges of 4,333,935 shares from Aquila High Income Fund Class Y to Cantor Fitzgerald High Income Fund Institutional Class upon conversion on November 22, 2024. |
See Accompanying Notes to Financial Statements.
| CANTOR FITZGERALD EQUITY OPPORTUNITY FUND |
| FINANCIAL HIGHLIGHTS |
| |
| Selected Per Share Data for a Share Outstanding Throughout each Year Presented: |
| | | Class A | |
| | | Year | | | Year | | | Year | | | Year | | | Year | |
| | | Ended | | | Ended | | | Ended | | | Ended | | | Ended | |
| | | December 31, | | | December 31, | | | December 31, | | | December 31, | | | December 31, | |
| | | 2024 (a) | | | 2023 | | | 2022 | | | 2021 | | | 2020 | |
| Net asset value, beginning of year | | $ | 40.70 | | | $ | 36.22 | | | $ | 46.98 | | | $ | 51.86 | | | $ | 50.62 | |
| Income (loss) from investment operations: | | | | | | | | | | | | | | | | | | | | |
| Net investment income (loss) (b) | | | (0.27 | ) | | | 0.01 | | | | (0.08 | ) | | | (0.48 | ) | | | (0.29 | ) |
| Net realized and unrealized gains (losses) on investments | | | 4.30 | | | | 4.47 | | | | (6.97 | ) | | | 10.56 | | | | 3.94 | |
| Total from investment operations | | | 4.03 | | | | 4.48 | | | | (7.05 | ) | | | 10.08 | | | | 3.65 | |
| Less distributions from: | | | | | | | | | | | | | | | | | | | | |
| Net investment income | | | (0.05 | ) | | | — | | | | — | | | | — | | | | — | |
| Net realized gains | | | (9.82 | ) | | | — | | | | (3.71 | ) | | | (14.96 | ) | | | (2.41 | ) |
| Total distributions | | | (9.87 | ) | | | — | | | | (3.71 | ) | | | (14.96 | ) | | | (2.41 | ) |
| Net asset value at end of year | | $ | 34.86 | | | $ | 40.70 | | | $ | 36.22 | | | $ | 46.98 | | | $ | 51.86 | |
| Total return (c) | | | 9.04 | % | | | 12.37 | % | | | (15.25 | )% | | | 21.53 | % | | | 7.39 | % |
| Net assets at end of year (000’s) | | $ | 43,317 | | | $ | 60,429 | | | $ | 65,619 | | | $ | 86,364 | | | $ | 76,508 | |
| Ratio of net expenses to average net assets (d)(f) | | | 2.03 | % | | | 1.75 | % | | | 1.67 | % | | | 1.49 | % | | | 1.54 | % |
| Ratio of net investment income (loss) to average net assets (d)(f) | | | -0.65 | % | | | 0.02 | % | | | -0.19 | % | | | -0.88 | % | | | -0.63 | % |
| Portfolio turnover rate (e) | | | 44 | % | | | 107 | % | | | 102 | % | | | 99 | % | | | 69 | % |
| (a) | Effective close of business on November 22, 2024, Class A, Class C and Class I shares of Aquila Opportunity Growth Fund were reorganized into Class A shares of Cantor Fitzgerald Equity Opportunity Fund. See notes to the financial statements. The Class A shares’ financial highlights for the periods prior to November 22, 2024 reflect the performance of Aquila Opportunity Growth Fund Class A. |
| (b) | Calculated using average shares outstanding. |
| (c) | Total return is based on the change in net asset value of a share during the period and assumes reinvestment of dividends and distributions at net asset value and does not reflect the impact of a sales charge. |
| (d) | Ratios were determined after advisory fee waivers/reductions by the Advisor. |
| (e) | Portfolio turnover is calculated on the basis on the Fund as a whole without distinguishing among the classes of shares. |
| (f) | Does not include the Fund’s share of the expenses of the underlying investment companies in which the Fund invests. |
See Accompanying Notes to Financial Statements.
| CANTOR FITZGERALD EQUITY OPPORTUNITY FUND |
| FINANCIAL HIGHLIGHTS |
| |
| Selected Per Share Data for a Share Outstanding Throughout each Year Presented: |
| | | Institutional Class | |
| | | Year | | | Year | | | Year | | | Year | | | Year | |
| | | Ended | | | Ended | | | Ended | | | Ended | | | Ended | |
| | | December 31, | | | December 31, | | | December 31, | | | December 31, | | | December 31, | |
| | | 2024 (a) | | | 2023 | | | 2022 | | | 2021 | | | 2020 | |
| Net asset value, beginning of year | | $ | 47.12 | | | $ | 41.82 | | | $ | 53.42 | | | $ | 57.00 | | | $ | 55.24 | |
| Income (loss) from investment operations: | | | | | | | | | | | | | | | | | | | | |
| Net investment income (loss) (b) | | | (0.17 | ) | | | 0.14 | | | | 0.04 | | | | (0.37 | ) | | | (0.17 | ) |
| Net realized and unrealized gains (losses) on investments | | | 4.93 | | | | 5.16 | | | | (7.93 | ) | | | 11.75 | | | | 4.34 | |
| Total from investment operations | | | 4.76 | | | | 5.30 | | | | (7.89 | ) | | | 11.38 | | | | 4.17 | |
| Less distributions from: | | | | | | | | | | | | | | | | | | | | |
| Net investment income | | | (0.11 | ) | | | — | | | | — | | | | — | | | | — | |
| Net realized gains | | | (9.82 | ) | | | — | | | | (3.71 | ) | | | (14.96 | ) | | | (2.41 | ) |
| Total distributions | | | (9.93 | ) | | | — | | | | (3.71 | ) | | | (14.96 | ) | | | (2.41 | ) |
| Net asset value at end of year | | $ | 41.95 | | | $ | 47.12 | | | $ | 41.82 | | | $ | 53.42 | | | $ | 57.00 | |
| Total return (c) | | | 9.36 | % | | | 12.67 | % | | | (14.98 | )% | | | 21.88 | % | | | 7.71 | % |
| Net assets at end of year (000’s) | | $ | 35,277 | | | $ | 54,301 | | | $ | 59,173 | | | $ | 105,557 | | | $ | 126,001 | |
| Ratio of net expenses to average net assets (d)(f) | | | 1.72 | % | | | 1.45 | % | | | 1.36 | % | | | 1.19 | % | | | 1.23 | % |
| Ratio of net investment income (loss) to average net assets (d)(f) | | | -0.35 | % | | | 0.32 | % | | | 0.09 | % | | | -0.60 | % | | | -0.33 | % |
| Portfolio turnover rate (e) | | | 44 | % | | | 107 | % | | | 102 | % | | | 99 | % | | | 69 | % |
| (a) | Effective close of business on November 22, 2024, Class Y shares of Aquila Opportunity Growth Fund were reorganized into Institutional Class shares of Cantor Fitzgerald Equity Opportunity Fund. See notes to the financial statements. The Institutional Class shares’ financial highlights for the periods prior to November 22, 2024 reflect the performance of Aquila Opportunity Growth Fund Class Y. |
| (b) | Calculated using average shares outstanding. |
| (c) | Total return is based on the change in net asset value of a share during the period and assumes reinvestment of dividends and distributions at net asset value and does not reflect the impact of a sales charge. |
| (d) | Ratios were determined after advisory fee waivers/reductions by the Advisor. |
| (e) | Portfolio turnover is calculated on the basis on the Fund as a whole without distinguishing among the classes of shares. |
| (f) | Does not include the Fund’s share of the expenses of the underlying investment companies in which the Fund invests. |
See Accompanying Notes to Financial Statements.
| CANTOR FITZGERALD HIGH INCOME FUND |
| FINANCIAL HIGHLIGHTS |
| |
| Selected Per Share Data for a Share Outstanding Throughout each Year Presented: |
| | | Class A | |
| | | Year | | | Year | | | Year | | | Year | | | Year | |
| | | Ended | | | Ended | | | Ended | | | Ended | | | Ended | |
| | | December 31, | | | December 31, | | | December 31, | | | December 31, | | | December 31, | |
| | | 2024 (a) | | | 2023 | | | 2022 | | | 2021 | | | 2020 | |
| Net asset value, beginning of year | | $ | 8.13 | | | $ | 7.81 | | | $ | 8.61 | | | $ | 8.69 | | | $ | 8.39 | |
| Income (loss) from investment operations: | | | | | | | | | | | | | | | | | | | | |
| Net investment income (b) | | | 0.41 | | | | 0.34 | | | | 0.30 | | | | 0.30 | | | | 0.30 | |
| Net realized and unrealized gains (losses) on investments | | | 0.05 | | | | 0.34 | | | | (0.77 | ) | | | 0.00 | | | | 0.33 | |
| Total from investment operations | | | 0.46 | | | | 0.68 | | | | (0.47 | ) | | | 0.30 | | | | 0.63 | |
| Less distributions from: | | | | | | | | | | | | | | | | | | | | |
| Net investment income | | | (0.43 | ) | | | (0.36 | ) | | | (0.33 | ) | | | (0.34 | ) | | | (0.33 | ) |
| Net realized gains | | | — | | | | — | | | | — | | | | (0.04 | ) | | | — | |
| Total distributions | | | (0.43 | ) | | | (0.36 | ) | | | (0.33 | ) | | | (0.38 | ) | | | (0.33 | ) |
| Net asset value at end of year | | $ | 8.16 | | | $ | 8.13 | | | $ | 7.81 | | | $ | 8.61 | | | $ | 8.69 | |
| Total return (c) | | | 5.76 | % | | | 8.94 | % | | | (5.49 | )% | | | 3.57 | % | | | 7.74 | % |
| Net assets at end of year (000’s) | | $ | 25,511 | | | $ | 31,807 | | | $ | 35,419 | | | $ | 39,082 | | | $ | 39,982 | |
| Ratio of total expenses to average net assets | | | 1.75 | % | | | 1.42 | % | | | 1.40 | % | | | 1.18 | % | | | 1.21 | % |
| Ratio of net expenses to average net assets (d)(f) | | | 1.20 | % | | | 1.20 | % | | | 1.19 | % | | | 1.18 | % | | | 1.21 | % |
| Ratio of net investment income to average net assets (d)(f) | | | 5.04 | % | | | 4.35 | % | | | 3.69 | % | | | 3.51 | % | | | 3.60 | % |
| Portfolio turnover rate (e) | | | 33 | % | | | 34 | % | | | 9 | % | | | 118 | % | | | 347 | % |
| (a) | Effective close of business on November 22, 2024, Class A, Class C and Class I shares of Aquila High Income Fund were reorganized into Class A shares of Cantor Fitzgerald High Income Fund. See notes to the financial statements. The Class A shares’ financial highlights for the periods prior to November 22, 2024 reflect the performance of Aquila High Income Fund Class A. |
| (b) | Calculated using average shares outstanding. |
| (c) | Total return is based on the change in net asset value of a share during the period and assumes reinvestment of dividends and distributions at net asset value and does not reflect the impact of a sales charge. |
| (d) | Ratios were determined after advisory fee waivers/reductions by the Advisor. |
| (e) | Portfolio turnover is calculated on the basis on the Fund as a whole without distinguishing among the classes of shares. |
| (f) | Does not include the Fund’s share of the expenses of the underlying investment companies in which the Fund invests. |
See Accompanying Notes to Financial Statements.
| CANTOR FITZGERALD HIGH INCOME FUND |
| FINANCIAL HIGHLIGHTS |
| |
| Selected Per Share Data for a Share Outstanding Throughout each Year Presented: |
| | | Institutional Class | |
| | | Year | | | Year | | | Year | | | Year | | | Year | |
| | | Ended | | | Ended | | | Ended | | | Ended | | | Ended | |
| | | December 31, | | | December 31, | | | December 31, | | | December 31, | | | December 31, | |
| | | 2024 (a) | | | 2023 | | | 2022 | | | 2021 | | | 2020 | |
| Net asset value, beginning of year | | $ | 8.14 | | | $ | 7.81 | | | $ | 8.61 | | | $ | 8.69 | | | $ | 8.40 | |
| Income (loss) from investment operations: | | | | | | | | | | | | | | | | | | | | |
| Net investment income (b) | | | 0.44 | | | | 0.36 | | | | 0.31 | | | | 0.32 | | | | 0.32 | |
| Net realized and unrealized gains (losses) on investments | | | 0.04 | | | | 0.35 | | | | (0.77 | ) | | | — | | | | 0.32 | |
| Total from investment operations | | | 0.48 | | | | 0.71 | | | | (0.46 | ) | | | 0.32 | | | | 0.64 | |
| Less distributions from: | | | | | | | | | | | | | | | | | | | | |
| Net investment income | | | (0.45 | ) | | | (0.38 | ) | | | (0.34 | ) | | | (0.36 | ) | | | (0.35 | ) |
| Net realized gains | | | — | | | | — | | | | — | | | | (0.04 | ) | | | — | |
| Total distributions | | | (0.45 | ) | | | (0.38 | ) | | | (0.34 | ) | | | (0.40 | ) | | | (0.35 | ) |
| Net asset value at end of year | | $ | 8.17 | | | $ | 8.14 | | | $ | 7.81 | | | $ | 8.61 | | | $ | 8.69 | |
| Total return (c) | | | 5.97 | % | | | 9.29 | % | | | (5.30 | )% | | | 3.77 | % | | | 7.82 | % |
| Net assets at end of year (000’s) | | $ | 34,007 | | | $ | 61,257 | | | $ | 63,845 | | | $ | 120,120 | | | $ | 136,978 | |
| Ratio of total expenses to average net assets | | | 1.55 | % | | | 1.22 | % | | | 1.18 | % | | | 0.98 | % | | | 1.01 | % |
| Ratio of net expenses to average net assets (d)(f) | | | 1.00 | % | | | 1.00 | % | | | 1.00 | % | | | 0.98 | % | | | 1.01 | % |
| Ratio of net investment income to average net assets (d)(f) | | | 5.37 | % | | | 4.56 | % | | | 3.86 | % | | | 3.71 | % | | | 3.81 | % |
| Portfolio turnover rate (e) | | | 33 | % | | | 34 | % | | | 9 | % | | | 118 | % | | | 347 | % |
| (a) | Effective close of business on November 22, 2024, Class Y shares of Aquila High Income Fund were reorganized into Institutional Class shares of Cantor Fitzgerald High Income Fund. See notes to the financial statements. The Institutional Class shares’ financial highlights for the periods prior to November 22, 2024 reflect the performance of Aquila High Income Fund Class Y. |
| (b) | Calculated using average shares outstanding. |
| (c) | Total return is based on the change in net asset value of a share during the period and assumes reinvestment of dividends and distributions at net asset value and does not reflect the impact of a sales charge. |
| (d) | Ratios were determined after advisory fee waivers/reductions by the Advisor. |
| (e) | Portfolio turnover is calculated on the basis on the Fund as a whole without distinguishing among the classes of shares. |
| (f) | Does not include the Fund’s share of the expenses of the underlying investment companies in which the Fund invests. |
See Accompanying Notes to Financial Statements.
| CANTOR FITZGERALD FUNDS |
| NOTES TO FINANCIAL STATEMENTS |
| December 31, 2024 |
1. Organization
Cantor Select Portfolios Trust (“Trust”) was organized on December 16, 2021, as a Delaware statutory trust and is authorized to have multiple series or portfolios. The Trust is registered with the U.S. Securities and Exchange Commission (“SEC”) as an open-end management investment company under the Investment Company Act of 1940, as amended (the “1940 Act”). The Trust currently consists of five series. Cantor Fitzgerald Equity Opportunity Fund and Cantor Fitzgerald High Income Fund (the “Funds”), are each separate, diversified series of the Trust.
REORGANIZATION
Effective as of the close of business on November 22, 2024, pursuant to an Agreement and Plan of Reorganization (the “Reorganization”), each Fund received all of the assets and liabilities of the corresponding fund (each, a “Predecessor Fund” and, together, the “Predecessor Funds”) of the Aquila Funds Trust (the “Predecessor Trust”) as outlined in the below table. Each Predecessor Fund’s investment objective, policies, and limitations were substantially similar to those of the corresponding Fund, each with no operations before the Reorganization. For financial reporting purposes, the Predecessor Fund’s operating history before the Reorganization is reflected in the corresponding Fund’s financial statements and financial highlights. The Reorganization was treated as a tax -free reorganization for federal income tax purposes, and accordingly, the basis of the assets of each Fund reflected the historical basis of the assets of the corresponding Predecessor Fund as of the date of the Reorganization. The Reorganization is also considered tax-free based on accounting principles generally accepted in the United States of America (“GAAP”).
| Predecessor Fund and Class | Fund and Class |
| Aquila Opportunity Growth Fund Class A | Cantor Fitzgerald Equity Opportunity Fund Class A |
| Aquila Opportunity Growth Fund Class C | Cantor Fitzgerald Equity Opportunity Fund Class A |
| Aquila Opportunity Growth Fund Class I | Cantor Fitzgerald Equity Opportunity Fund Class A |
| Aquila Opportunity Growth Fund Class Y | Cantor Fitzgerald Equity Opportunity Fund Institutional Class |
| Aquila High Income Fund Class A | Cantor Fitzgerald High Income Fund Class A |
| Aquila High Income Fund Class C | Cantor Fitzgerald High Income Fund Class A |
| Aquila High Income Fund Class I | Cantor Fitzgerald High Income Fund Class A |
| Aquila High Income Fund Class Y | Cantor Fitzgerald High Income Fund Institutional Class |
The costs of proxy solicitation; proxy printing, postage and processing; and legal fees in the amount of $100,000, were borne by Cantor Fitzgerald Investment Advisors, L.P. (the “Advisor”). The Predecessor Funds will pay any additional legal costs related to the Reorganization in excess of the $100,000 paid by the Advisor.
| CANTOR FITZGERALD FUNDS |
| NOTES TO FINANCIAL STATEMENTS (Continued) |
| December 31, 2024 |
The details of the Reorganization is shown below:
At the Close of Business on November 22, 2024
| | | Aquila Opportunity Growth Fund | | | | | | | | | | |
| | | | | | | | | | | | Cantor Fitzgerald | | | | | | | |
| | | | | | | | | | | | Equity Opportunity | | | Aquila Opportunity | | | Cantor Fitzgerald Equity | |
| | | Class A | | | Class C | | | Class I | | | Fund Class A | | | Growth Fund Class Y | | | Opportunity Fund Inst. Class | |
| | | | | | | | | | | | | | | | | | | |
| Net Assets | | $ | 48,755,645 | | | $ | 970,719 | | | $ | 591,901 | | | $ | 50,318,264 | | | $ | 40,308,902 | | | $ | 40,308,902 | |
| Shares Outstanding | | | 1,042,665.495 | | | | 33,645.631 | | | | 11,789.223 | | | | 1,076,082.956 | | | | 743,262.535 | | | | 743,262.535 | |
| Net Asset Value Per Share | | | 46.76 | | | | 28.85 | | | | 50.21 | | | | 46.76 | | | | 54.23 | | | | 54.23 | |
| | | | | | | | | | | | | | | | | | | | | | | | | |
| | | Aquila High Income Fund | | | | | | | | | | |
| | | | | | | | | | | | Cantor Fitzgerald | | | | | | | |
| | | | | | | | | | | | High Income Fund | | | Aquila High Income | | | Cantor Fitzgerald High | |
| | | Class A | | | Class C | | | Class I | | | Class A | | | Fund Class Y | | | Income Fund Inst. Class | |
| | | | | | | | | | | | | | | | | | | |
| Net Assets | | $ | 26,413,023 | | | $ | 876,473 | | | $ | 411,393 | | | $ | 27,700,889 | | | $ | 35,673,917 | | | $ | 35,673,917 | |
| Shares Outstanding | | | 3,212,475.134 | | | | 106,571.676 | | | | 50,100.405 | | | | 3,369,110.531 | | | | 4,333,934.538 | | | | 4,333,934.538 | |
| Net Asset Value Per Share | | | 8.22 | | | | 8.22 | | | | 8.21 | | | | 8.22 | | | | 8.23 | | | | 8.23 | |
For financial reporting purposes, assets received, and shares issued by the Cantor Fitzgerald Funds were recorded at fair value; however, the cost basis of the investments received from the Predecessor Funds was carried forward to align with the ongoing reporting of the Cantor Fitzgerald Fund’s realized and unrealized gains and losses with amounts distributable to shareholders for tax purposes. The cost and market value of the Aquila Opportunity Growth Fund was $66,111,675 and $90,788,379, respectively. The cost and market value of the Aquila High Income Fund was $61,961,925 and $62,717,334, respectively. The unrealized appreciation (depreciation) from the Aquila Opportunity Growth Fund and Aquila High Income Fund were $24,676,704 and $755,408, respectively. The Cantor Fitzgerald Funds have succeeded to the accounting and performance history of the Predecessor Funds, and as a result, the Predecessor Funds’ financial and performance history prior to the Reorganization is carried forward and reflected in the Cantor Fitzgerald Funds’ financial statements and financial highlights.
The investment objective of the Cantor Fitzgerald Equity Opportunity Fund is to seek capital appreciation.
The investment objective of the Cantor Fitzgerald High Income Fund is to seek high current income. Capital appreciation is a secondary objective when consistent with its primary objective.
The Cantor Fitzgerald Equity Opportunity Fund and the Cantor Fitzgerald High Income Fund each have three total classes of shares: Class A Shares, Institutional Class Shares, and Class R6 Shares. Each class represents interests in the same portfolio of investments and has the same rights, but each class differs with respect to sales loads, minimum investments, and ongoing expenses. The Cantor Fitzgerald Equity Opportunity Fund Class A Shares charge a 5.75% front-end sales charge, distribution and service plan fees of 0.25%, and no contingent deferred sales charge on shares redeemed. The Cantor Fitzgerald High Income Fund Class A Shares charge a 4.00% front-end sales charge, distribution and service plan fees of 0.25%, and no contingent deferred sales charge on shares redeemed. Initial investment is $1,000 minimum. Institutional Class Shares and Class R6 have no front-end sales charge, no distribution or service plan fee minimum, and no contingent deferred sales charge on shares redeemed. There are no minimum investments (except for shares purchased through an automatic investment plan) for Institutional Class Shares and
| CANTOR FITZGERALD FUNDS |
| NOTES TO FINANCIAL STATEMENTS (Continued) |
| December 31, 2024 |
Class R6 Shares. Class R6 shares do not pay for any service fees, sub-accounting fees, and /or subtransfer agency fees to any brokers, dealers, or other financial intermediaries. Class R6 is not currently offered in the Funds.
Operating Segments – The Funds have adopted Financial Accounting Standards Board (“FASB”) Accounting Standards Update 2023-07, Segment Reporting (Topic 280) - Improvements to Reportable Segment Disclosures (“ASU 2023-07”). Adoption of the standard impacted financial statement disclosures only and did not affect each Fund’s financial position or the results of its operations. An operating segment is defined in Topic 280 as a component of a public entity that engages in business activities from which it may recognize revenues and incur expenses, has operating results that are regularly reviewed by the public entity’s chief operating decision maker (“CODM”) to make decisions about resources to be allocated to the segment and assess its performance, and has discrete financial information available. The CODM is comprised of the portfolio manager and Chief Financial Officer of the Funds. Each Fund operates as a single operating segment. Each Fund’s income, expenses, assets, changes in net assets resulting from operations and performance are regularly monitored and assessed as a whole by the CODM responsible for oversight functions of each Fund, using the information presented in the financial statements and financial highlights.
2. Significant Accounting Policies
Each Fund follows accounting and reporting guidance under FASB Accounting Standards Codification Topic 946, “Financial Services – Investment Companies.” The following is a summary of the Funds’ significant accounting policies. These policies are in conformity with GAAP.
Securities valuation – The Funds’ portfolio securities are valued as of the close of business of the regular session of the New York Stock Exchange (normally 4:00 p.m. Eastern time). Securities traded on a national stock exchange, including common stocks, if any, are valued based upon the closing price on the principal exchange where the security is traded, if available, otherwise, at the last quoted bid price. Securities that are quoted by NASDAQ are valued at the NASDAQ Official Closing Price. Investments representing shares of money market funds and other open-end investment companies are valued at their net asset value (“NAV”) as reported by such companies.
Securities will be valued at fair value when market quotations (or other market valuations such as those obtained from a pricing service) are not readily available or are deemed unreliable. The Board of Trustees (the “Board” or “Trustees”) has designated the advisor as its valuation designee (the “Valuation Designee”) to execute these procedures. The Board may also enlist third party consultants such a valuation specialist at a public accounting firm, valuation consultant or financial officer of a security issuer on an as-needed basis to assist the Valuation Designee in determining a security-specific fair value. The Board is responsible for reviewing and approving fair value methodologies utilized by the Valuation Designee, approval of which shall be based upon whether the Valuation Designee followed the valuation procedures established by the Board.
Fair Valuation Process – The applicable investments are valued by the Valuation Designee pursuant to valuation procedures established by the Board. For example, fair value determinations are required for the following securities: (i) securities for which market quotations are insufficient or not readily available on a particular business day (including securities for which there is a short and temporary lapse in the provision of a price by the regular pricing source); (ii) securities for which, in the judgment of the Valuation Designee, the prices or values available do not represent the fair value of the instrument; factors which may cause the Valuation Designee to make such a judgment include, but are not limited to, the following: only a bid price or an asked price is available; the spread between bid and asked prices is substantial; the frequency of sales; the thinness of the market; the size of reported trades; and actions of the securities markets, such as the
| CANTOR FITZGERALD FUNDS |
| NOTES TO FINANCIAL STATEMENTS (Continued) |
| December 31, 2024 |
suspension or limitation of trading; (iii) securities determined to be illiquid; and (iv) securities with respect to which an event that will affects the value thereof has occurred (a “significant event”) since the closing prices were established on the principal exchange on which they are traded, but prior to a Fund’s calculation of its net asset value. Specifically, interests in commodity pools or managed futures pools are valued on a daily basis by reference to the closing market prices of each futures contract or other asset held by a pool, as adjusted for pool expenses. Restricted or illiquid securities, such as private investments or non-traded securities are valued based upon the current bid for the security from two or more independent dealers or other parties reasonably familiar with the facts and circumstances of the security (who should take into consideration all relevant factors as may be appropriate under the circumstances). If a current bid from such independent dealers or other independent parties is unavailable, the Valuation Designee shall determine, the fair value of such security using the following factors: (i) the type of security; (ii) the cost at date of purchase; (iii) the size and nature of the Fund’s holdings; (iv) the discount from market value of unrestricted securities of the same class at the time of purchase and subsequent thereto; (v) information as to any transactions or offers with respect to the security; (vi) the nature and duration of restrictions on disposition of the security and the existence of any registration rights; (vii) how the yield of the security compares to similar securities of companies of similar or equal creditworthiness; (viii) the level of recent trades of similar or comparable securities; (ix) the liquidity characteristics of the security; (x) current market conditions; and (xi) the market value of any securities into which the security is convertible or exchangeable.
GAAP establishes a single authoritative definition of fair value, sets out a framework for measuring fair value and requires additional disclosures about fair value measurements. Various inputs are used in determining the value of the Funds’ investments. These inputs are summarized in the three broad levels listed below:
| ● | Level 1 – quoted prices in active markets for identical securities |
| ● | Level 2 – other significant observable inputs |
| ● | Level 3 – significant unobservable inputs |
The inputs or methodology used for valuing securities are not necessarily an indication of the risks associated with investing in those securities. The inputs used to measure fair value may fall into different levels of the fair value hierarchy. In such cases, for disclosure purposes, the level in the fair value hierarchy within which the fair value measurement falls in its entirety is determined based on the lowest level input that is significant to the fair value measurement.
The following is a summary of each Fund’s investments and other financial instruments based on the inputs used to value the investments and other financial instruments as of December 31, 2024, by security type:
| Cantor Fitzgerald Equity Opportunity Fund | | Level 1 | | | Level 2 | | | Level 3 | | | Total | |
| Investments in Securities: | | | | | | | | | | | | | | | | |
| Common Stocks | | $ | 71,400,637 | | | $ | — | | | $ | — | | | $ | 71,400,637 | |
| REITS | | | 6,011,460 | | | | — | | | | — | | | | 6,011,460 | |
| Money Market Funds | | | 1,554,565 | | | | — | | | | — | | | | 1,554,565 | |
| Total | | $ | 78,966,662 | | | $ | — | | | $ | — | | | $ | 78,966,662 | |
| | | | | | | | | | | | | | | | | |
| Cantor Fitzgerald High Income Fund | | Level 1 | | | Level 2 | | | Level 3 | | | Total | |
| Investments in Securities: | | | | | | | | | | | | | | | | |
| Corporate Bonds | | $ | — | | | $ | 57,571,001 | | | $ | — | | | $ | 57,571,001 | |
| Money Market Funds | | | 1,129,388 | | | | — | | | | — | | | | 1,129,388 | |
| Total | | $ | 1,129,388 | | | $ | 57,571,001 | | | $ | — | | | $ | 58,700,389 | |
| | | | | | | | | | | | | | | | | |
| CANTOR FITZGERALD FUNDS |
| NOTES TO FINANCIAL STATEMENTS (Continued) |
| December 31, 2024 |
Refer to the Funds’ Schedule of Investments for a listing of the holdings by sector type. There were no Level 3 investments held by the Funds as of or during the year ended December 31, 2024.
Share valuation — The NAV per share of each Fund is calculated daily by dividing the total value of its assets, less liabilities, by the number of shares outstanding.
Allocation between classes — Class accounting investment income, common expenses, and realized and unrealized gain (loss) on investments are allocated to the various classes of each Fund on the basis of daily net assets of each class. Realized and unrealized gain (loss) on investments are allocated to the various classes of each Fund on the basis of daily net assets of each class. Distribution expense relating to a specific class are charged directly to that class.
Investment income — Dividend income is recorded on the ex-dividend date. Non-cash dividends included in dividend income, if any, are recorded at the fair market value of the security received. Interest income is accrued as earned. Discounts and premiums on fixed income securities purchased are amortized using the interest method. Withholding taxes, if any, on foreign dividends have been recorded in accordance with the Funds’ understanding of the applicable country’s rules and tax rates.
Distributions to shareholders — Dividends arising from net investment income are declared and paid annually to shareholders of the Cantor Fitzgerald Equity Opportunity Fund and declared daily and paid monthly to the shareholders of the Cantor Fitzgerald High Income Fund. Net realized short-term capital gains, if any, may be distributed throughout the year, and net realized long-term capital gains, if any, are distributed at least annually. The amount of distributions from net investment income and net realized capital gains are determined in accordance with federal income tax regulations, which may differ from GAAP. These “book/tax” differences are either temporary or permanent in nature. Dividends and distributions are recorded on the ex-dividend date.
Investment transactions — Investment transactions are accounted for on trade date for financial reporting purposes. Realized gains and losses on investments sold are determined on a specific identification basis.
Estimates — The preparation of financial statements in conformity with GAAP requires management to make estimates and assumptions that affect the reported amounts of assets and liabilities and the disclosure of contingent assets and liabilities, each as of the date of the financial statements, and the reported amounts of increase (decrease) in net assets resulting from operations during the reporting period. Actual results could differ from those estimates.
Federal Income Tax — The Funds have qualified and intend to continue to qualify as a regulated investment company under the Internal Revenue Code of 1986, as amended (the “Code”). Qualification generally will relieve the Funds of liability for federal income taxes to the extent 100% of their net investment income and any net realized capital gains are distributed in accordance with the Code. Management has analyzed the Funds’ tax positions and has concluded that no liability for unrecognized tax benefits should be recorded related to uncertain tax positions taken on returns filed for open tax years ended December 31, 2021 through December 31, 2023 for the Aquila Opportunity Growth Fund and Aquila High Income Fund, or expected to be taken in the Cantor Fitzgerald Funds’ December 31, 2024 tax returns.
The Funds recognize interest and penalties, if any, related to unrecognized tax benefits as income tax expense in the Statements of Operations. During the year, the Funds did not incur any interest or penalties.
| CANTOR FITZGERALD FUNDS |
| NOTES TO FINANCIAL STATEMENTS (Continued) |
| December 31, 2024 |
In order to avoid imposition of the excise tax applicable to regulated investment companies, it is also the Funds’ intention to declare as dividends in each calendar year at least 98% of its net investment income (earned during the calendar year) and 98.2% of its net realized capital gains (earned during the twelve months ended October 31) plus undistributed amounts from prior years.
3. Investment Transactions
Investment transactions, other than short-term investments and U.S. government securities, were as follows for the year ended December 31, 2024:
| | | Cantor Fitzgerald Equity | | | Cantor Fitzgerald High | |
| | | Opportunity Fund | | | Income Fund | |
| Purchases of investment securities | | $ | 44,141,471 | | | $ | 23,435,851 | |
| | | | | | | | | |
| Proceeds from sales and maturities of investment securities | | $ | 92,409,533 | | | $ | 51,379,130 | |
4. Transactions with Related Parties
INVESTMENT ADVISORY AGREEMENTS
Aquila Investment Management LLC (the “Manager”), a wholly-owned subsidiary of Aquila Management Corporation, the Predecessor Funds’ founder and sponsor, served as the Manager for each Fund under an Advisory and Administration Agreement with the Fund until October 18, 2024. Effective October 18, 2024, each Predecessor Fund’s investments were managed by Cantor Fitzgerald Investment Advisors, L.P. (the “Advisor”) under the terms of an Interim Investment Advisory Agreement with the Aquila Funds Trust.
Under the current Investment Advisory Agreement with the Trust, effective as of November 22, 2024, Cantor Fitzgerald Equity Opportunity Fund pays the Advisor a fee, which is computed and accrued daily and paid monthly, at an annual rate of 0.80% of its average daily net assets. Prior to conversion, the Aquila Opportunity Growth Fund paid its Manager monthly compensation based on the Predecessor Fund’s average daily net assets at the annual rate of 0.90% of such net asset value on net assets of the Fund up to $100,000,000, 0.85% on net assets of the Fund above $100,000,000 to $250,000,000, and 0.80% of the Fund’s net assets above $250,000,000.
Under the current Investment Advisory Agreement with the Trust, effective as of November 22, 2024, Cantor Fitzgerald High Income Fund, pays the Advisor a fee, which is computed and accrued daily and paid monthly, at an annual rate of 0.65% of its average daily net assets. Prior to conversion, the Aquila High Income Fund paid its Manager monthly compensation based on the Predecessor Fund’s average daily net assets at the annual rate of 0.65%.
Accordingly, during the period January 1, 2024 through October 18, 2024, the Manager earned fees in the amount of $766,506 and $424,986 for the Aquila Equity Opportunity Fund and the Aquila High Income Fund, respectively. For the remainder of the year ended December 31, 2024, the Advisor earned fees in the amount of $154,006 and $84,579 for the Cantor Fitzgerald Equity Opportunity Fund and the Cantor Fitzgerald High Income Fund, respectively.
As of October 18, 2024, each Predecessor Fund’s sub-advisor was Smith Group Asset Management, LLC (the “Sub-Advisor”) pursuant to an Interim Sub-Advisory Agreement with the Aquila Funds Trust. Pursuant to the sub-advisory
| CANTOR FITZGERALD FUNDS |
| NOTES TO FINANCIAL STATEMENTS (Continued) |
| December 31, 2024 |
agreement with the Advisor effective as of November 22, 2024, the Sub-Advisor provides the Funds with a program of continuous supervision of each Fund’s assets, including developing the composition of its portfolio, and furnishes advice and recommendations with respect to investments, investment policies, and the purchase and sale of securities. The Advisor pays a sub-advisory fee based on the Funds’ daily net assets, at an annual rate of 0.35% for the Cantor Fitzgerald Equity Opportunity Fund and 0.25% for the Cantor Fitzgerald High Income Fund.
The Advisor has entered into an Expense Limitation Agreement (“ELA”) with the Trust, pursuant to which the Advisor has agreed to waive management fees and /or reimburse each Fund for expenses each Fund incurs, but only to the extent necessary to maintain each Fund’s total annual operating expenses after fee waivers and/or reimbursement (exclusive of (i) brokerage fees and commissions; (ii) acquired fund fees and expenses; (iii) fees and expenses associated with investments in other collective investment vehicles or derivative instruments (including, for example, option and swap fees and expenses); (iv) borrowing costs (such as interest and dividend expense on securities sold short); (v) taxes and (vi) extraordinary expenses, such as litigation expenses (which may include indemnification of Fund officers and Trustees and contractual indemnification of Fund service providers (other than the Advisor or Sub-Advisor) but inclusive of organizational costs and offering costs). The ELA shall continue in effect for successive twelve-month periods provided that such continuance is specifically approved at least annually by the Advisor. For the period from October 18, 2024 through November 22, 2024, the Advisor entered into an Interim Expense Limitation Agreement with the Aquila Funds Trust with the same limitations as the ELA.
| Fund | Expense Cap | Expiration |
| Cantor Fitzgerald Equity Opportunity Fund | 1.50% Class A | January 31, 2026 |
| | 1.25% Institutional Class | |
| Cantor Fitzgerald High Income Fund | 1.20% Class A | January 31, 2026 |
| | 1.00% Institutional Class | |
The Advisor may recoup investment advisory fees that it waived or Fund expenses that it paid under this agreement for a period of three years from the date the fees were waived or expenses paid, if the recoupment can be achieved without causing the expense ratio of the share class (after the recoupment is taken into account) to exceed (i) the expense limit in effect at the time the fees were waived or expenses paid, or (ii) the expense limit in place at the time of the recoupment.
As of December 31, 2024, the current Advisor has waived/reimbursed no expenses for the Funds.
Prior to October 18, 2024, the Manager has contractually undertaken to waive fees and/or reimburse expenses of Aquila High Income Fund (other than portfolio transaction and other investment related costs, prime broker fees and expenses, interest expense, dividend expenses related to short sales if any, and acquired fund fees and expenses) so that total Fund expenses will not exceed 1.20% for Class A shares, 2.00% for Class C shares, 1.30% for Class I shares and 1.00% for Class Y shares, for the period through January 1, 2024 through April 30, 2024 and 1.20% for Class A shares, 1.99% for Class C shares, 1.27% for Class I shares and 1.00% for Class Y shares for the period May 1, 2024 through October 18, 2024. These waived or reimbursed expenses of $435,475, found on the Statements of Operations, are no longer able to be recouped by the prior Manager of the Funds.
OTHER SERVICE PROVIDERS
Effective November 25, 2024, Ultimus Fund Solutions, LLC (“Ultimus” or “Administrator”) provides administration, fund accounting, and transfer agent services to the Funds. The Funds pay Ultimus fees in accordance with the
| CANTOR FITZGERALD FUNDS |
| NOTES TO FINANCIAL STATEMENTS (Continued) |
| December 31, 2024 |
agreements for such services. In addition, the Funds pay out-of-pocket expenses including, but not limited to, postage, supplies, and certain costs related to the pricing of the Funds’ portfolio securities. During the year ended December 31, 2024, the Administrator earned total fees of $13,108 and $13,441, respectively, for such services for the Cantor Fitzgerald Equity Opportunity Fund and the Cantor Fitzgerald High Income Fund. Prior to November 25, 2024, Bank of New York Mellon (“BNYM”) provided administration, fund accounting, and transfer agent services to the Predecessor Funds. The Predecessor Funds paid BNYM fees in accordance with the agreements for such services. In addition, the Predecessor Funds paid out-of-pocket expenses including, but not limited to, postage, supplies, and certain costs related to the pricing of the Predecessor Funds’ portfolio securities. During the period ended November 22, 2024, BNYM earned fees of $211,743 and $196,187 for such services for the Aquila Opportunity Growth Fund and the Aquila High Income Fund, respectively. These fees combined can be referenced in the Statements of Operations.
Effective November 25, 2024, Ultimus Fund Distributors, LLC (“UFD”) serves as the Funds’ principal underwriter and acts as the distributor of the Funds’ shares. UFD is an affiliate of Ultimus. UFD is compensated by the Advisor (not the Funds) for acting as principal underwriter.
Pursuant to a distribution agreement and distribution plan, the Funds pay the distributor an annual 12b-1 fee of 0.25% of the average daily net assets of the Class A shares of the Cantor Fitzgerald Equity Opportunity Fund and 0.20% of the average daily net assets of the Class A shares of the Cantor Fitzgerald High Income Fund. The fees are calculated daily and paid monthly. Institutional Class shares do not pay 12b-1 fees.
Prior to November 1, 2024, Aquila Distributors LLC served as the Funds’ distributor and the Funds paid an annual 12b- 1 fee of 0.30% of the average daily net assets of Class A shares of the Aquila Opportunity Growth Fund and 0.20% of the average daily net assets of the Class A shares of the Aquila High Income Fund. Prior to the conversion, the Funds paid $160,877 from Aquila Opportunity Growth Fund and $61,666 Aquila High Income Fund, respectively, to Aquila Distributors LLC. For the period ended October 31, 2024, the Distributor received $3,620 and $1,530 in underwriter commissions from the sale of Class A shares of the Aquila Opportunity Growth Fund and Aquila High Income Fund, respectively. Effective November 1, 2024 until November 22, 2024, each Fund discontinued accepting requests from existing accounts or new investors to purchase shares or process exchanges into the Fund, and no longer processed shares purchases through any dividend or capital gain reinvestment or automatic investment plan.
Effective November 25, 2024, Northern Lights Compliance Services, LLC (“NLCS”), an affiliate of Ultimus, provides a Chief Compliance Officer to the Trust, as well as related compliance services, pursuant to a consulting agreement between NLCS and the Trust. Under the terms of such agreement, NLCS receives fees from the Fund, which are approved annually by the Board. Certain officers of the Trust are also employees of Ultimus and the Advisor and such persons are not paid by the Funds for serving in such capacities. Prior to November 25, 2024, under a Compliance Agreement with the Manager, the Manager was compensated by the Predecessor Funds for compliance related services provided to enable the Predecessor Funds to comply with Rule 38a-1 of the Investment Company Act of 1940.
COMPENSATION OF TRUSTEES
Trustees and officers affiliated with the Advisor or Ultimus are not compensated by the Trust for their services. Each Trustee who is not an affiliated person of the Advisor or Ultimus receives from the Trust an annual retainer of $20,000, payable quarterly, annual payment of $5,000 for audit committee chair fee, payable quarterly, and reimbursement of travel and other expenses incurred in attending meetings. The Independent Trustees received no monetary compensation during the period ended December 31, 2024, after the Reorganization, for the Cantor Fitzgerald Equity Opportunity Fund and Cantor Fitzgerald High Income Fund, for their services to
| CANTOR FITZGERALD FUNDS |
| NOTES TO FINANCIAL STATEMENTS (Continued) |
| December 31, 2024 |
the Trust. Prior to the Reorganization on November 22, 2024, the Aquila Opportunity Growth Fund and Aquila High Income Fund were allocated a portion of Trustee fees and expenses as part of the Aquila Funds Trust and the Independent Trustees were paid $127,411 and $99,482, respectively.
5. Principal Investment Risks
| Risk | Equity Opportunity
Fund | High Income
Fund |
| Credit Risk | | ✓ |
| Cybersecurity Risk. | ✓ | ✓ |
| Emerging Market Securities Risk. | ✓ | ✓ |
| Equity Securities Risk. | ✓ | |
| Extension Risk. | | ✓ |
| Foreign Securities Risk. | ✓ | ✓ |
| Interest Rate Risk. | | ✓ |
| Investment Risk. | | ✓ |
| Junk Bond Risk. | | ✓ |
| Market Risk. | | ✓ |
| Portfolio Turnover Risk. | ✓ | |
| Portfolio Selection Risk. | ✓ | ✓ |
| Prepayment of Call Risk. | | ✓ |
| Redemption Risk. | ✓ | ✓ |
| Small and Mid-Sized Companies Risk. | ✓ | |
| Subordinated Securities Risk. | | ✓ |
Investments in the Funds are subject to investment risks, including the possible loss of some or the entire principal amount invested. The Funds are subject to certain risks, including the principal risks noted below, any of which may adversely affect the Funds’ net asset value per shares, trading price, yield, total return, and ability to meet their investment objectives. An investment in the Fund is not a deposit or obligation of any bank, is not endorsed or guaranteed by any bank, and is not insured by the Federal Deposit Insurance Corporation or any other government agency. The prospectus states the individual risks for each individual fund, generally, the Funds will be subject to the following principal risks:
Credit risk – If an issuer or obligor of a security held by the Fund or a counterparty to a financial contract with the Fund defaults or is downgraded, or is perceived to be less creditworthy, or if the value of the assets underlying a security declines, the value of your investment will typically decline. Changes in actual or perceived creditworthiness may occur quickly. The Fund could be delayed or hindered in its enforcement of rights against an issuer, guarantor or counterparty. Securities in the lowest category of investment grade (i.e., BBB/Baa) may be considered to have speculative characteristics.
| CANTOR FITZGERALD FUNDS |
| NOTES TO FINANCIAL STATEMENTS (Continued) |
| December 31, 2024 |
Cybersecurity risk – Cybersecurity failures by and breaches of the Fund’s Manager, Transfer Agent, Custodian, Distributor or other service providers may disrupt Fund operations, interfere with the Fund’s ability to calculate its NAV, prevent Fund shareholders from purchasing, redeeming or exchanging shares or receiving distributions or receiving timely information regarding the Fund or their investment in the Fund, cause loss of or unauthorized access to private shareholder information, or result in financial losses to the Fund and its shareholders, regulatory fines, penalties, reputational damage, or additional compliance costs. Substantial costs may be incurred in order to prevent any cyber incidents in the future. The Fund and its shareholders could be negatively impacted as a result.
Emerging Market Securities risk – Emerging market countries tend to have economic, political and legal systems that are less fully developed and are less stable than those of more advanced countries. Low trading volumes may result in a lack of liquidity and in extreme price volatility.
Equity Securities risk – Securities fluctuate in price based on changes in a company’s financial condition and overall market and economic conditions. The market price of an individual security or particular type of security can be more volatile than the market as a whole and can perform differently from the value of the market as a whole.
Extension risk – During periods of rising interest rates, repayments of fixed income securities may occur more slowly than anticipated by the market. This may drive the prices of these securities down even more because their interest rates are lower than the current interest rate and they remain outstanding longer.
Foreign Securities risk – Foreign securities are subject to a number of additional risks, including nationalization or expropriation of assets, imposition of currency controls or restrictions, confiscatory taxation, political or financial instability, military conflicts and sanctions, terrorism, arbitrary application of laws and regulations or lack of rule of law, and other adverse economic or political developments. Lack of information and less market regulation may also affect the value of these securities. Risks are greater for investments in emerging markets. The value of investments in securities denominated in foreign currencies increases or decreases as the rates of exchange between those currencies and the U.S. dollar change. Currency exchange rates can be volatile, and are affected by factors such as general economic conditions, the actions of the U.S. and foreign governments or central banks, the imposition of currency controls and speculation. Sanctions or other government actions against certain countries could negatively impact the Fund’s investments in securities that have exposure to those countries. Circumstances that impact
Interest Rate risk – The market prices of the Fund’s fixed income securities may fluctuate significantly when interest rates change. The value of your investment will generally go down when interest rates rise. A rise in rates tends to have a greater impact on the prices of longer term or longer duration securities. In recent years, interest rates and credit spreads in the U.S. have been at historic lows. The U.S. Federal Reserve has raised certain interest rates, and interest rates may continue to go up. A general rise in interest rates could adversely affect the price and liquidity of fixed income securities and could also result in increased redemptions from the Fund. The maturity of a security may be significantly longer than its effective duration. A security’s maturity and other features may be more relevant than its effective duration in determining the security’s sensitivity to other factors such as changes in credit quality or in the yield premium that the market may establish for certain types of securities (sometimes called “credit spread”). In general, the longer its maturity the more a security may be susceptible to these factors. When the credit spread for a fixed income security goes up, or “widens,” the value of the security will generally go down.
| CANTOR FITZGERALD FUNDS |
| NOTES TO FINANCIAL STATEMENTS (Continued) |
| December 31, 2024 |
Investment risk – Various sectors of the global financial markets have been experiencing an extended period of adverse conditions. Market uncertainty has increased dramatically, particularly in the United States and Europe, and adverse market conditions have expanded to other markets. These conditions have resulted in disruption of markets, periods of reduced liquidity, greater volatility, general volatility of spreads, an acute contraction in the availability of credit and a lack of price transparency. The long-term impact of these events is uncertain but could continue to have a material effect on general economic conditions, consumer and business confidence and market liquidity.
Major public health issues, such as COVID-19, have at times, and may in the future impact the Fund. The COVID-19 pandemic caused substantial market volatility and global business disruption and impacted the global economy in significant and unforeseen ways. Any public health emergency, including the COVID-19 pandemic or any outbreak of other existing or new epidemic diseases or the threat thereof, and the resulting financial and economic market uncertainty, could have a material adverse impact on the Fund or its investments. Moreover, changes in interest rates, travel advisories, quarantines and restrictions, disrupted supply chains and industries, impact on labor markets, reduced liquidity or a slowdown in U.S. or global economic conditions resulting from a future public health crisis may also adversely affect the Fund or its investments. COVID-19, or any other health crisis and the current or any resulting financial, economic and capital markets environment, and future developments in these and other areas present uncertainty and risk with respect to the Fund’s NAV, performance, financial condition, results of operations, ability to pay distributions, make share repurchases and portfolio liquidity, among other factors.
Junk Bonds risk – Junk bonds are considered speculative, have a higher risk of default, tend to be less liquid and are more difficult to value than higher grade securities. Junk bonds tend to be volatile and more susceptible to adverse events and negative sentiments.
Market risk – The risk that all or a majority of the securities in a certain market — such as the stock or bond market — will decline in value because of factors such as adverse political or economic conditions, future expectations, investor confidence, or heavy institutional selling.
Portfolio Selection risk – The value of your investment may decrease if the Sub-Advisor’s judgment about the quality, relative yield, value or market trends affecting a particular market segment, security, industry, sector or region, or about interest rates or other market factors, is incorrect, or there may be imperfections, errors or limitations in the models, tools and information used by the Sub-Advisor.
Portfolio Turnover risk – If the Fund does a lot of trading, it may incur additional operating expenses and other costs, which would reduce performance. Trading activity could also cause shareholders to incur a higher level of taxable income or capital gains.
Prepayment or Call risk – Many issuers have a right to prepay their securities. If interest rates fall, an issuer may exercise this right. If this happens, the Fund will not benefit from the rise in market price that normally accompanies a decline in interest rates, and will be forced to reinvest prepayment proceeds at a time when yields on securities available in the market are lower than the yield on prepaid securities. The Fund may also lose any premium it paid on prepaid securities.
Redemption risk – The Fund may experience heavy redemptions that could cause the Fund to liquidate its assets at inopportune times or at a loss or depressed value or accelerate taxable gains or transaction costs, which could cause the value of your investment to decline.
| CANTOR FITZGERALD FUNDS |
| NOTES TO FINANCIAL STATEMENTS (Continued) |
| December 31, 2024 |
Small and Mid-Sized Companies risk – Companies having market capitalization of middle to smaller size are comparatively less well known and may have less trading in their shares than larger companies. Compared to large companies, small-and mid-size companies, and the market for their equity securities, may be more sensitive to changes in earnings results and investor expectations or poor economic or market conditions, including those experienced during a recession, have more limited product lines, operating histories and capital resources, may be dependent upon a limited management group, experience sharper swings in market values, have limited liquidity, be harder to value or to sell at the times and prices the Adviser thinks appropriate, and offer greater potential for gain and loss. The Fund invests in companies that are highly leveraged. Leverage can magnify the impact of adverse economic, political, regulatory and other developments on a company’s operations and market value.
Subordinated Securities risk – Subordinated securities are more likely to suffer a credit loss than non-subordinated securities of the same issuer and will be disproportionately affected by a default, downgrade or perceived decline in creditworthiness.
6. Contingencies and Commitments
The Trust indemnifies the Trust’s officers and Trustees for certain liabilities that might arise from the performance of their duties to the Trust. Additionally, in the normal course of business the Trust enters into contracts that contain a variety of representations and warranties and which provide general indemnifications. The Trust’s maximum exposure under these arrangements is unknown, as this would involve future claims that may be made against the Trust that have not yet occurred. However, based on experience, the Trust expects the risk of loss to be remote.
7. Distributions to Shareholders and Tax Components of Capital
The following table represents aggregate cost for federal tax purposes, for the Funds as of December 31, 2024 and differs from fair value by net unrealized appreciation/depreciation which consisted of:
| | | | | | Unrealized | | | Unrealized | | | Total Unrealized | |
| Fund | | Aggregate Cost | | | Appreciation | | | Depreciation | | | Appreciation | |
| Cantor Fitzgerald Equity Opportunity Fund | | $ | 59,119,009 | | | $ | 20,966,084 | | | $ | (1,118,431 | ) | | $ | 19,847,653 | |
| Cantor Fitzgerald High Income Fund | | | 58,370,732 | | | | 1,193,303 | | | | (863,646 | ) | | | 329,657 | |
The tax character of fund distributions for each Fund and year ended below was as follows:
For the year ended December 31, 2024:
| | | Ordinary | | | Long-Term | | | Return of | | | | |
| | | Income | | | Capital Gains | | | Capital | | | Total | |
| Cantor Fitzgerald Equity Opportunity Fund | | $ | 6,673,266 | | | $ | 10,896,879 | | | $ | — | | | $ | 17,570,145 | |
| Cantor Fitzgerald High Income Fund | | | 4,188,354 | | | | — | | | | — | | | | 4,188,354 | |
For the year ended December 31, 2023:
| | | Ordinary | | | Long-Term | | | Return of | | | | |
| | | Income | | | Capital Gains | | | Capital | | | Total | |
| Cantor Fitzgerald Equity Opportunity Fund | | $ | — | | | $ | — | | | $ | — | | | $ | — | |
| Cantor Fitzgerald High Income Fund | | | 4,582,745 | | | | — | | | | — | | | | 4,582,745 | |
| CANTOR FITZGERALD FUNDS |
| NOTES TO FINANCIAL STATEMENTS (Continued) |
| December 31, 2024 |
As of December 31, 2024, the components of accumulated earnings/(deficit) on a tax basis were as follows:
| | | Undistributed | | | Undistributed | | | Undistributed | | | Post October Loss | | | Capital Loss | | | Other | | | Unrealized | | | Total | |
| | | Ordinary | | | Ordinary | | | Long-Term | | | and | | | Carry | | | Book/Tax | | | Appreciation | | | Accumulated | |
| | | Tax-Exempt Income | | | Income | | | Capital Gains | | | Late Year Loss | | | Forwards | | | Differences | | | (Depreciation) | | | Earnings/(Deficits) | |
Cantor Fitzgerald Equity
Opportunity Fund | | $ | — | | | $ | — | | | $ | — | | | $ | (1,903,381 | ) | | $ | — | | | $ | — | | | $ | 19,847,653 | | | $ | 17,944,272 | |
Cantor Fitzgerald High
Income Fund | | | — | | | | — | | | | — | | | | — | | | | (9,430,017 | ) | | | — | | | | 329,657 | | | | (9,100,360 | ) |
The difference between book basis and tax basis undistributed net investment income (loss), accumulated net realized gain/(loss), and unrealized appreciation/(depreciation) from investments is primarily attributable to the tax deferral of losses on wash sales, c-corporation return of capital distributions and amortization adjustment.
Capital losses incurred after October 31 within the fiscal year are deemed to arise on the first business day of the following fiscal year for tax purposes. The Funds incurred and elected to defer such capital losses as follows:
| | | Post October | |
| | | Losses | |
| Cantor Fitzgerald Equity Opportunity Fund | | $ | 1,903,381 | |
| Cantor Fitzgerald High Income Fund | | | — | |
At December 31, 2024 the Funds had capital loss carry forwards for federal income tax purposes available to offset future capital gains, along with capital loss carryforwards utilized as follows:
| | | | | | | | | | | | Capital Loss Carry | |
| | | Short-Term | | | Long-Term | | | Total | | | Forward Utilized | |
| Cantor Fitzgerald Equity Opportunity Fund | | $ | — | | | $ | — | | | $ | — | | | $ | 361,672 | |
| Cantor Fitzgerald High Income Fund | | | 2,683,106 | | | | 6,746,911 | | | | 9,430,017 | | | | — | |
During the year ended December 31, 2024, certain funds utilized tax equalization which is the use of earnings and profits distributions to shareholders on redemption of shares as part of the dividends paid deduction for income tax purposes. Permanent book and tax differences, primarily attributable to the use of tax equalization credits and distributions in excess resulted in reclassifications for the year ended December 31, 2024 for the Funds as follows:
| | | | | | Accumulated Earnings | |
| | | Paid In Capital | | | (Losses) | |
| Cantor Fitzgerald Equity Opportunity Fund | | $ | 2,133,912 | | | $ | (2,133,912 | ) |
| Cantor Fitzgerald High Income Fund | | | (44,700 | ) | | | 44,700 | |
8. Credit Facility
Since August 30, 2017, Bank of New York Mellon and the Aquila Group of Funds (comprised of nine funds including Aquila Opportunity Growth Fund and Aquila High Income Fund) have been parties to a $40 million credit agreement. This credit agreement was terminated on June 28, 2024. It was noted that the Funds had never borrowed under the agreement since its inception in 2017. In accordance with the Aquila Group of Funds Guidelines for Allocation of Committed Line of Credit, each fund was responsible for payment of its proportionate share of a) a 0.17% per annum commitment fee; and, b) interest on amounts borrowed for temporary or emergency purposes by the fund (at the applicable per annum rate selected by the Aquila Group of Funds at the time of the borrowing of either (i) the adjusted daily simple Secured Overnight
| CANTOR FITZGERALD FUNDS |
| NOTES TO FINANCIAL STATEMENTS (Continued) |
| December 31, 2024 |
Financing Rate (“SOFR”) plus 1% or (ii) the sum of the higher of (a) the Prime Rate, (b) the Federal Funds Effective Rate, or (c) the adjusted daily simple Secured Overnight Financing Rate (“SOFR”) plus 1%). There were no borrowings under the credit agreement through termination on June 28, 2024.
9. Subsequent Events
The Funds are required to recognize in the financial statements the effects of all subsequent events that provide additional evidence about conditions that existed as of the date of the Statements of Assets and Liabilities. For non-recognized subsequent events that must be disclosed to keep the financial statements from being misleading, the Funds are required to disclose the nature of the event as well as an estimate of its financial effect, or a statement that such an estimate cannot be made. Management has evaluated subsequent events through the issuance of these financial statements and has noted no such events.

REPORT OF INDEPENDENT REGISTERED PUBLIC ACCOUNTING FIRM
To the Shareholders of Cantor Fitzgerald Equity Opportunity Fund and Cantor Fitzgerald High Income Fund and
Board of Trustees of Cantor Select Portfolios Trust
Opinion on the Financial Statements
We have audited the accompanying statements of assets and liabilities, including the schedules of investments, of Cantor Fitzgerald Equity Opportunity Fund and Cantor Fitzgerald High Income Fund (the “Funds”), each a series of Cantor Select Portfolios Trust, as of December 31, 2024, the related statements of operations, changes in net assets, and the financial highlights for the year then ended, and the related notes (collectively referred to as the “financial statements”). In our opinion, the financial statements present fairly, in all material respects, the financial position of each of the Funds as of December 31, 2024, the results of their operations, the changes in net assets, and the financial highlights for the period then ended, in conformity with accounting principles generally accepted in the United States of America.
The Funds’ financial statements and financial highlights for the years ended December 31, 2023, and prior, were audited by other auditors whose report dated February 29, 2024, expressed an unqualified opinion on those financial statements and financial highlights.
Basis for Opinion
These financial statements are the responsibility of the Funds’ management. Our responsibility is to express an opinion on the Funds’ financial statements based on our audit. We are a public accounting firm registered with the Public Company Accounting Oversight Board (United States) (“PCAOB”) and are required to be independent with respect to the Funds in accordance with the U.S. federal securities laws and the applicable rules and regulations of the Securities and Exchange Commission and the PCAOB.
We conducted our audit in accordance with the standards of the PCAOB. Those standards require that we plan and perform the audit to obtain reasonable assurance about whether the financial statements are free of material misstatement whether due to error or fraud.
Our audit included performing procedures to assess the risks of material misstatement of the financial statements, whether due to error or fraud, and performing procedures that respond to those risks. Such procedures included examining, on a test basis, evidence regarding the amounts and disclosures in the financial statements. Our procedures included confirmation of securities owned as of December 31, 2024, by correspondence with the custodian. Our audit also included evaluating the accounting principles used and significant estimates made by management, as well as evaluating the overall presentation of the financial statements. We believe that our audit provides a reasonable basis for our opinion.
We have served as the auditor of one or more investment companies advised by Cantor Fitzgerald Investment Advisors, L.P. since 2016.

COHEN & COMPANY, LTD.
Milwaukee, Wisconsin
February 28, 2025
| COHEN & COMPANY, LTD. |
| Registered with the Public Company Accounting Oversight Board |
| 800.229.1099 I 866.818.4538 fax I cohenco.com |
| CANTOR FITZGERALD EQUITY OPPORTUNITY FUND |
| CANTOR FITZGERALD HIGH INCOME FUND |
| ADDITIONAL INFORMATION (Unaudited) |
| December 31, 2024 |
Item 8 - Changes in and Disagreements with Accountants
On November 21, 2024, the Audit Committee of Cantor Select Portfolios Trust (“Committee”) appointed and formally engaged Cohen & Company, Ltd. as the Funds’ independent registered public accounting firm for the fiscal year ended December 31, 2024.
Tait, Weller & Baker LLP (“Tait”)’s reports on the Funds’ financial statements for the years prior to December 31, 2024, did not contain an adverse opinion or a disclaimer of opinion, nor were such reports qualified or modified as to uncertainty, audit scope or accounting principles.
During the years ended prior to December 31, 2024, there were no disagreements between the Funds and Tait on any matter of accounting principles or practices, financial statement disclosure, or auditing scope or procedure, which disagreements, if not resolved to the satisfaction of Tait, would have caused it to make reference to the subject matter of the disagreement in its report on the financial statements for such period. During the years ended prior to December 31, 2024, there were no reportable events (as defined in Item 304(a)(1)(v) of Regulation S-K).
Item 9 - Proxy Disclosures
At a Special Shareholder Meeting at which a quorum was present, held on November 13, 2024, shareholders of record of each of the Predecessor Funds as of the close of business on September 3, 2024 voted to approve the following proposals:
| Proposal 1: | To approve the Reorganization. |
| | Shares Voted in Favor | Shares Voted Against | Shares Voted Abstain |
| Aquila High Income Fund | 4,444,991.10 | 175,762.35 | 221,127.21 |
| Aquila Opportunity Growth Fund | 1,055,824.23 | 25,032.62 | 59,721.57 |
| Proposal 2: | To approve the liquidation and termination of the Aquila Funds Trust. |
| | Shares Voted in Favor | Shares Voted Against | Shares Voted Abstain |
| Aquila High Income Fund | 4,429,813.34 | 193,795.02 | 218,272.30 |
| Aquila Opportunity Growth Fund | 1,042,765.18 | 27,703.94 | 70,109.29 |
Item 10 - Remuneration Paid to Directors, Officers and Others
The Trustees of the Cantor Select Portfolios Trust received no monetary compensation during the period ended December 31, 2024 for the Cantor Fitzgerald Equity Opportunity Fund and Cantor Fitzgerald High Income Fund for their services to the Funds. Prior to the Reorganization on November 22, 2024, the Aquila Opportunity Growth Fund and Aquila High Income Fund were allocated a portion of Trustee fees and expenses as part of the Aquila Funds Trust and the Independent Trustees were paid $127,411 and $99,482, respectively.
Item 11 - Statement Regarding Basis for Approval of Investment Advisory Agreement
Cantor Fitzgerald High Income Fund and Cantor Fitzgerald Equity Opportunity Fund - Investment Advisory Agreement with the Advisor
In connection with the Special Board meeting held on April 3, 2024, the Board, including a majority of the Independent Trustees, discussed the approval of a management agreement (the “Investment Advisory Agreement”) between the Trust and the Advisor, with respect to the Cantor Fitzgerald High Income Fund (the “High Income Fund”) and the Cantor Fitzgerald Equity Opportunity Fund (the “Equity Opportunity Fund” and together with the High Income Fund, the “Funds”).
The Trustees were assisted by legal counsel throughout the review process. The Trustees relied upon the advice of legal counsel and their own business judgment in determining the material factors to be considered in evaluating the Investment Advisory Agreement and the weight to be given to each factor considered. The conclusions reached by the Trustees were based on a comprehensive evaluation of all of the information provided and were not the result of any one factor. Moreover, each Trustee may have afforded different weight to the various factors in reaching his conclusions with respect to the approval of the Investment Advisory Agreement. In connection with their deliberations regarding approval of the Investment Advisory Agreement, the Trustees reviewed materials prepared by the Advisor.
| CANTOR FITZGERALD EQUITY OPPORTUNITY FUND |
| CANTOR FITZGERALD HIGH INCOME FUND |
| ADDITIONAL INFORMATION (Unaudited) (Continued) |
| December 31, 2024 |
In deciding on whether to approve the Investment Advisory Agreement, the Trustees considered numerous factors, including:
Nature, Extent and Quality of Services. The Trustees considered the responsibilities of the Advisor under the Investment Advisory Agreement. The Trustees evaluated the Advisor’s staffing, personnel, and methods of operating; the education and experience of the Advisor’s personnel; the Advisor’s compliance program; and the Advisor’s financial condition. After reviewing the foregoing information and further information in the memorandum from the Advisor (e.g., descriptions of the Advisor’s business, compliance program, and ADV), the Board concluded that the nature, extent, and quality of the services provided by the Advisor were satisfactory and adequate.
Performance. The Trustees considered that the Aquila High Income Fund and the Aquila Opportunity Growth Fund (the “Predecessor Funds”) were managed by a different investment adviser, so the Advisor had no performance history of the Funds for the Trustees to evaluate. The Trustees noted that the Advisor has historically acted as a “manager of managers” and reviewed the performance of the Cantor Fitzgerald Large Cap Focused Fund presented by the Advisor, where the Advisor serves as an adviser supervising a sub-adviser. The Trustees compared the performance of the Cantor Fitzgerald Large Cap Focused Fund with the performance of a benchmark index. The Trustees noted that the Cantor Fitzgerald Large Cap Focused Fund outperformed the benchmark for all periods shown. The Trustees also considered the Advisor’s role in supervising the investment activity of the Sub- Advisor. The Trustees concluded that based on each Fund’s investment strategy and the Advisor’s presentation, the Advisor had the expertise to fulfill each Fund’s investment mandate.
Fees and Expenses. The Trustees next considered information regarding each Fund’s management fee. They compared each Fund’s management fee to that Fund’s peer group and category, as presented by the Advisor, noting that the management fee for the High Income Fund was the same as peer group average, but above the category average. They further noted that the management fee for the Opportunity Growth Fund was above both the peer group average and the category average. The Trustees noted that the funds in the peer group and category were much larger than the Opportunity Growth Fund, so they had more opportunities to realize economies of scale and charge lower management fees. Following this comparison, and upon further consideration and discussion of the foregoing, the Trustees concluded that the fees to be paid to the Advisor were not unreasonable in relation to the nature and quality of the services provided by the Advisor and that they reflected charges that were within a range of what could have been negotiated at arm’s length.
Profitability. The Trustees considered the Advisor’s anticipated profitability. The Trustees noted that the Advisor expected to realize a profit with respect to each Fund for both of the first two years of operations as series of the Trust. The Trustees also took into account the Advisor’s estimated costs of managing the Funds and information provided by the Advisor regarding its financial condition. The Trustees discussed the profitability level of the Advisor, noting, among other factors and circumstances, that the level of profitability was not excessive.
Economies of Scale. The Trustees considered whether the Advisor would realize economies of scale with respect to its management of the Funds. The Trustees considered the extent to which economies of scale would be realized as each Fund grows and whether fee levels reflect a reasonable sharing of economies of scale for the benefit of each Fund’s investors. The Trustees noted that breakpoints may be an appropriate way for the Advisor to share its economies of scale if each Fund experiences substantial asset growth; however, the Trustees recognized that each Fund may take some time to reach an asset level where the Advisor could realize significant economies of scale. The Trustees observed that economies of scale will be considered in the future as the asset level of each Fund grows.
Conclusion. The Trustees, having requested and received such information from the Advisor as it believed reasonably necessary to evaluate the terms of the proposed Investment Advisory Agreement, with the Independent Trustees having met in executive session with counsel, determined that approval of the Investment Advisory Agreement for an initial two-year term is in the best interests of each Fund and its shareholders.
Cantor Fitzgerald High Income Fund and Cantor Fitzgerald Equity Opportunity Fund - Investment Sub-Advisory Agreement with the Sub-Advisor
In connection with the Board meeting held on April 3, 2024, the Board, including a majority of the Independent Trustees, discussed the approval of a sub-advisory agreement between the Advisor and the Sub-Advisor, with respect to each Fund (the “Investment Sub-Advisory Agreement”).
The Trustees were assisted by legal counsel throughout the review process. The Trustees relied upon the advice of legal counsel and their own business judgment in determining the material factors to be considered in evaluating the Investment Sub-Advisory Agreement and the weight to be given to each factor considered. The conclusions reached by the Trustees were based on a comprehensive evaluation of all of the information provided and were not the result of any one factor. Moreover, each Trustee may have afforded different weight to the various factors in reaching his conclusions with respect to the approval of the Investment Sub-Advisory Agreement. In connection with their deliberations regarding approval of the Investment Sub-Advisory Agreement, the Trustees reviewed materials prepared by the Sub-Advisor.
| CANTOR FITZGERALD EQUITY OPPORTUNITY FUND |
| CANTOR FITZGERALD HIGH INCOME FUND |
| ADDITIONAL INFORMATION (Unaudited) (Continued) |
| December 31, 2024 |
In deciding on whether to approve the Investment Sub-Advisory Agreement, the Trustees considered numerous factors, including:
Nature, Extent and Quality of Services. The Trustees considered the responsibilities of the Sub-Advisor under the Sub-Advisory Agreement. The Trustees evaluated the Sub-Advisor’s staffing, personnel, and methods of operating; the education and experience of the Sub-Advisor’s personnel; compliance program; and financial condition. The Trustees noted that the portfolio manager for each Predecessor Fund continues to manage the Fund as an employee of the Sub-Advisor. After reviewing the foregoing information and further information in the memorandum from the Sub-Advisor (e.g., descriptions of the Sub- Advisor’s business, compliance program, and Form ADV), the Trustees concluded that the nature, extent, and quality of the services provided by the Sub-Advisor were satisfactory and adequate for each Fund.
Performance. The Trustees considered that each Predecessor Fund was managed by a different investment adviser, so the Sub-Advisor had no performance history of each Fund for the Trustees to evaluate. The Trustees compared the performance of the Cantor Fitzgerald Large Cap Focused Fund and a composite of small cap accounts managed by the Sub-Advisor with the performance of a large cap and small cap, respectively, benchmark index. The Trustees noted that the Cantor Fitzgerald Large Cap Focused Fund outperformed the large cap benchmark for all periods shown and that the small cap composite outperformed the small cap benchmark for the 1 year, 5 year, and since inception periods, but slightly underperformed the small cap benchmark for the 10 year period. The Trustees noted the Sub-Advisor’s explanation that the underperformance was primary attributable to an underweight to biotechnology stocks relative to the small cap benchmark. The Trustees concluded that based on each Fund’s investment strategy and the Sub-Advisor’s presentation, the Sub-Advisor had the expertise to fulfill each Fund’s investment mandate.
Fees and Expenses. The Trustees first noted the sub- advisory fee for each Fund under the Sub- Advisory Agreement. The Trustees noted that there were no other comparable accounts managed by the Sub-Advisor against which to compare the sub- advisory proposed for each Fund, but the Trustees noted the advisory fee comparison presented by the Advisor. Following this discussion, and upon further consideration and discussion of the foregoing, the Trustees concluded that the fee to be paid to the Sub-Advisor was not unreasonable in relation to the nature and quality of the services provided by the Sub-Advisor and that they reflected charges that were within a range of what could have been negotiated at arm’s length.
Profitability. The Trustees considered the Sub-Advisor’s anticipated profitability. The Trustees noted that the Sub-Advisor expected to realize a profit with respect to each Fund for both of the first two years of operations as series of the Trust. The Trustees also took into account the Sub-Advisor’s estimated costs of managing each Fund and information provided by the Sub-Advisor regarding its financial condition. The Trustees discussed the profitability level of the Sub-Advisor, noting, among other factors and circumstances, that the level of profitability was not excessive.
Economies of Scale. The Trustees considered whether the Sub-Advisor would realize economies of scale with respect to its management of each Fund. The Trustees considered the extent to which economies of scale would be realized as each Fund grows and whether fee levels reflect a reasonable sharing of economies of scale for the benefit of each Fund’s investors. The Trustees noted that breakpoints may be an appropriate way for the Sub-Advisor to share its economies of scale if each Fund experiences substantial asset growth; however, the Trustees recognized that each Fund may take some time to reach an asset level where the Sub-Advisor could realize significant economies of scale. The Trustees observed that economies of scale will be considered in the future as each Fund’s asset level grows.
Conclusion. The Trustees, having requested and received such information from the Sub-Advisor as it believed reasonably necessary to evaluate the terms of the proposed Sub-Advisory Agreement, with the Independent Trustees having met in executive session with counsel, determined that approval of the Sub-Advisory Agreement for an initial two-year term is in the best interests of each Fund and its shareholders.
Information regarding how the Funds vote proxies relating to portfolio securities for the twelve month period ended June 30 as well as a description of the policies and procedures that the Funds used to determine how to vote proxies are available without charge, upon request, by calling 1-833-764-2266 or by referring to the Securities and Exchange Commission’s (“SEC”) website at http://www.sec.gov.
Item 8. Changes in and Disagreements with Accountants for Open-End Management Investment Companies.
Included under Item 7
Item 9. Proxy Disclosures for Open-End Management Investment Companies.
Included under Item 7
Item 10. Remuneration Paid to Directors, Officers, and Others of Open-End Management Investment Companies.
Included under Item 7
Item 11. Statement Regarding Basis for Approval of Investment Advisory Contract.
Included under Item 7
Item 12. Disclosure of Proxy Voting Policies and Procedures for Closed-End Management Investment Companies.
Not applicable.
Item 13. Portfolio Managers of Closed-End Management Investment Companies.
Not applicable.
Item 14. Purchases of Equity Securities by Closed-End Management Investment Company and Affiliated Purchasers.
Not applicable.
Item 15. Submission of Matters to a Vote of Security Holders.
None
Item 16. Controls and Procedures
(a) The registrant’s Principal Executive Officer and Principal Financial Officer have concluded that the registrant’s disclosure controls and procedures (as defined in Rule 30a-3(c) under the Act) are effective in design and operation and are sufficient to form the basis of the certifications required by Rule 30a-(2) under the Act, based on their evaluation of these disclosure controls and procedures as of a date within 90 days of this report on Form N-CSR.
(b) There were no changes in the registrant’s internal control over financial reporting (as defined in Rule 30a-3(d) under the Act) during the period covered by this report that have materially affected, or are reasonably likely to materially affect, the registrant’s internal control over financial reporting.
Item 17. Disclosure of Securities Lending Activities for Closed-End Management Investment Companies.
Not applicable.
Item 18. Recovery of Erroneously Awarded Compensation.
Item 19. Exhibits.
(a)(1) Code of Ethics for Principal Executive and Senior Financial Officers.
(a)(2) Not applicable.
(a)(3) A separate certification for each principal executive officer and principal financial officer of the registrant as required by Rule 30a-2(a) under the Act (17 CFR 270.30a-2(a)): Attached hereto.
(a)(4) Change in the registrant’s independent public accountant
(b) Certifications required by Rule 30a-2(b) under the Act (17 CFR 270.30a-2(b)): Attached hereto.
SIGNATURES
Pursuant to the requirements of the Securities Exchange Act of 1934 and the Investment Company Act of 1940, the registrant has duly caused this report to be signed on its behalf by the undersigned, thereunto duly authorized.
Cantor Select Portfolios Trust
| By | /s/ William Ferri | |
| William Ferri |
| Principal Executive Officer/President |
| Date: 3/5/2025 |
Pursuant to the requirements of the Securities Exchange Act of 1934 and the Investment Company Act of 1940, this report has been signed below by the following persons on behalf of the registrant and in the capacities and on the dates indicated.
| By | /s/ William Ferri | |
| William Ferri |
| Principal Executive Officer/President |
| Date: 3/5/2025 |
| | | |
| By | /s/ Brian Curley | |
| Brian Curley |
| Principal Financial Officer/Treasurer |
| Date: 3/5/2025 |