UNITED STATES
SECURITIES AND EXCHANGE COMMISSION
WASHINGTON, D.C. 20549
FORM N-CSR
CERTIFIED SHAREHOLDER REPORT OF REGISTERED
MANAGEMENT INVESTMENT COMPANIES
811-23783
(Investment Company Act file number)
Opportunistic Credit Interval Fund
(Exact name of Registrant as specified in charter)
650 Madison Avenue, 3rd Floor
New York, NY 10022
(Address of principal executive offices) (Zip code)
The Corporation Trust Company
Corporation Trust Center, 1209 Orange Street
Wilmington, DE 19801
(Name and address of agent for service)
Registrant’s telephone number, including area code: (212) 891-2880
Date of fiscal year end: September 30
Date of reporting period: October 1, 2023- September 30, 2024
Item 1. Reports to Stockholders.
| (a) |
Table of Contents
| Shareholder Letter | 1 |
| Portfolio Update | 14 |
| Consolidated Schedule of Investments | 16 |
| Consolidated Statement of Assets and Liabilities | 23 |
| Consolidated Statement of Operations | 24 |
| Consolidated Statements of Changes in Net Assets | 25 |
| Consolidated Statement of Cash Flows | 26 |
| Financial Highlights | |
| Class I | 27 |
| Notes to Consolidated Financial Statements | 28 |
| Report of Independent Registered Public Accounting Firm | 41 |
| Additional Information | 42 |
| Trustees & Officers | 43 |
| Privacy Notice | 45 |

| Opportunistic Credit Interval Fund | Shareholder Letter |
September 30, 2024 (Unaudited)
Dear Shareholders:
It is our pleasure to provide our shareholders with the annual shareholder letter from the Opportunistic Credit Interval Fund (ticker: SOFIX) for the year ended September 30, 2024. The Fund posted a total return of 7.3% for the fiscal year, driven by gains across the portfolio.i
Given divergent signals in the market, we view this as an opportune time to share our views about the macroeconomic backdrop.
Public investors have unambiguously embraced a bullish outlook. The S&P 500ii has delivered the strongest rolling year to date performance of the 21st Century in 2024.1
Similarly, corporate credit spreads continue to push lower, with spreads for Investment Grade the narrowest since March 2005 and the non-financial sub-index the tightest since 2000. Hight Yield spreads have dropped to post-GFC lows.2
While there are some merits to the optimistic viewpoint (which we highlight below), we nevertheless believe markets risk overlooking certain fissures in the U.S. economy.
Macro Backdrop: The Concerning
With U.S. manufacturing in prolonged contraction (as reflected by ISM data), U.S. GDP will live and die with the consumer. Fraying by certain segments—particularly economically sensitive households—represents an underpriced risk, in our view.
For perspective, the fiscal response to COVID was roughly four times greater than the stimulus provided by the American Recovery and Reinvestment Act of 2009.3 The resulting wage and balance sheet growth have helped drive our post-pandemic recovery.
The fading impact of stimulus and inflation have combined to erode real wages. Nevertheless, consumers have maintained their elevated pace of spending—now far outpacing real income:
Real after-tax income vs. Real consumption
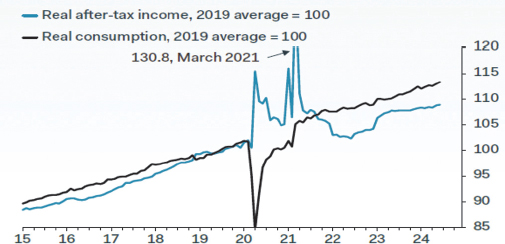
Source: Pantheon Macro (8/7/2024)
In short, this dynamic is not sustainable. Consumers can fund this income/spending gap through lower savings rates and/or borrowing, but there are limits to both. After those thresholds have been reached, households will be forced to cut spending, which, in time, will drag on GDP.
| 1 | Bloomberg and Deutsche Bank (10/8/2024) |
| 2 | Spread Strategy Spotlight: “’Just Enough’ or ‘Just Can’t Get Enough’” JP Morgan (10/22/2024) |
| 3 | Carola Binder, Shock Values: Prices and Inflation in American Democracy, page 263 (New York City, U Chicago Press, 2024). |
| Annual Report | September 30, 2024 | 1 |
| Opportunistic Credit Interval Fund | Shareholder Letter |
September 30, 2024 (Unaudited)
Consumer credit stress presents a further risk. With credit card rates roughly 23% higher than historical levels, St. Louis Federal Reserve data reflects that delinquencies have risen dramatically across income cohorts:4
Share of People in Delinquency (log scale)

Source: St. Louis Federal Reserve (6/6/2024)
Further Fed analysis shows that serious delinquencies for auto loans and credit cards (+90 days) have reached the highest levels of the post-GFC era:
New York Fed / Equifax U.S. Transitions into Serious Delinquincy (+90 days)
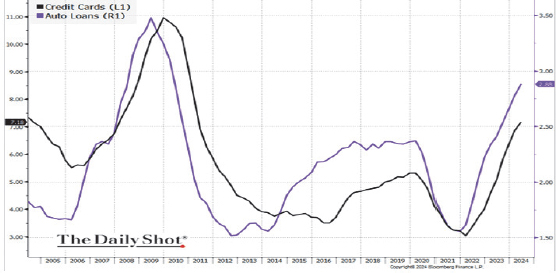
Source: New York Federal Reserve and Equifax (8/2/2024)
Relatedly, the New York Fed’s Debt Delinquency Expectation Survey measures consumers’ perceived risk of missing a debt payment within the next three months. The September reading of 14.2% (vs. 13.6% in August) is the highest since April 2020 (the peak of COVID panic) and above the ten-year average (2013-2023) of 12.1%5
| 4 | The Daily Dash (7/9/2024) |
| 5 | Federal Reserve Bank of New York (10/15/2024) |
| 2 | www.opportunisticcreditintervalfund.com |
| Opportunistic Credit Interval Fund | Shareholder Letter |
September 30, 2024 (Unaudited)
A telling picture of the U.S. consumer following: below compares the stock performance of Tapestry (the maker of high-end apparel under the Coach and Kate Spade brands) vs. discount chain Dollar General:
Trading Prices of Tapestry vs. Dollar General
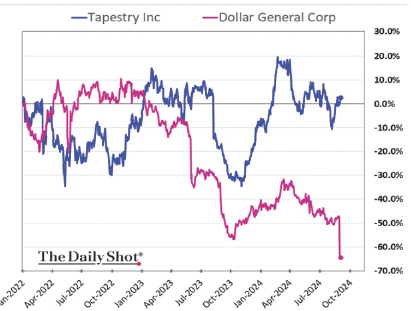
Source: The Daily Shot (9/5/2024)
In short, we have a deeply bifurcated consumer economy right now. Liquid assets (which represent proximal potential spending) have become constraints for the vast majority of households:
Households’ liquidity assets (as % of after-tax income), by percentile
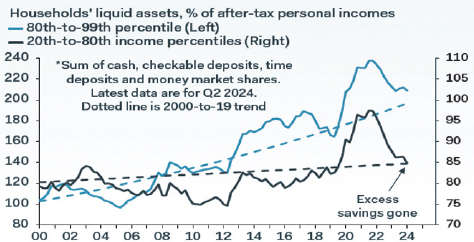
Source: Pantheon Macro (10/21/2024)
Although (intuitively) wealthy Americans drive most consumption, the bottom 40% of earnings still account for 22% of spending.6 The vulnerability of this segment presents a threat to our economy writ large.
Bank lending—or rather, the continued lack thereof—represents another overhang for our economy.
| 6 | Pantheon Macro (9/11/2024) |
| Annual Report | September 30, 2024 | 3 |
| Opportunistic Credit Interval Fund | Shareholder Letter |
September 30, 2024 (Unaudited)
As previously highlighted, traditional banks are facing a crush of obstacles: market-to-market losses, CRE uncertainty, depositor flight and Basel III End Game, being the most salient. Amid the shadows of uncertainty, banks, rather than performing their core lending function, have retrenched by hoarding cash. As the following graphs detail, banks are holding securities on balance sheets well above historical norms and providing loans well below trend:
Securities Held by Commercial Banks vs. C&I Loans by Commercial Banks
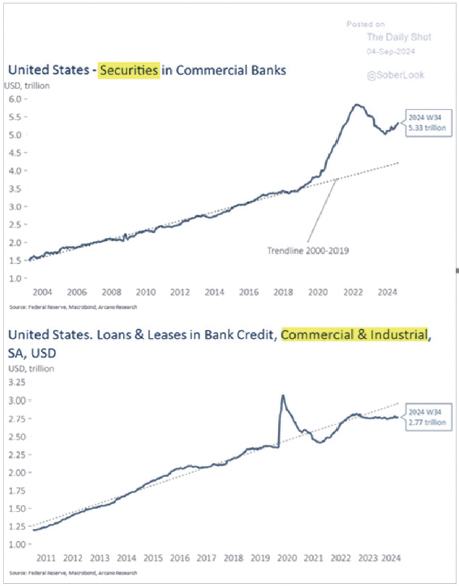
Source: Arcano Economics (9/4/2024)
| 4 | www.opportunisticcreditintervalfund.com |
| Opportunistic Credit Interval Fund | Shareholder Letter |
September 30, 2024 (Unaudited)
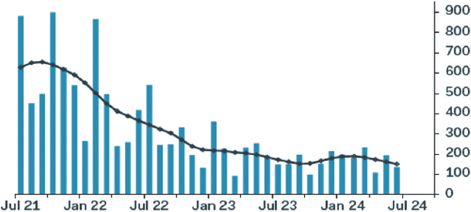
Further emphasizing the point, the following chart further underscores the literal and figurative flatlining of bank lending:

Source: The Daily Shot and Truist Advisory (10/07/2024)
Banks pulling back has provided more opportunities for non-traditional capital providers (like the Opportunistic Credit Interval Fund), but private markets represent a metaphorical ripple compared to the waves of capital historically provided by banks.
Change in Bank C&I and CRE vs. Change in Non-Bank Lending to Non-Financial
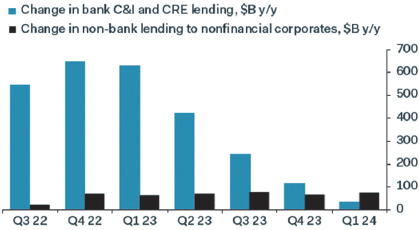
Source: Pantheon Macro Research (7/11/2024)
Simply put, the U.S. economy cannot continue to grow without credit availability and private markets cannot fully replace traditional banks. Recent rate cuts have loosened credit conditions (more below), but that benefit has accrued to larger corporations, not the small and medium-sized businesses reliant on bank funding.
Jobs represent another concern worth noting.
First, layoffs have remained muted, consistent with our expectations. Businesses will be slow, in our view, to fire the workforce they struggled to build post-pandemic. Peak profit margins may further enable companies to delay the reflective layoffs evident in downturns.
| Annual Report | September 30, 2024 | 5 |
| Opportunistic Credit Interval Fund | Shareholder Letter |
September 30, 2024 (Unaudited)
Nevertheless, our concern centers on the unambiguous downshift in job creation, as shown in the following graphs:
Private Non-Farm payrolls and trends
Source: Pantheon Macro Research (7/11/2024)
3-Month Average Payrolls

Source: BLS, Haver, Deutsche Bank (9/17/2024)
Forgive the cliché, but the “trend is not our friend” when it comes to jobs.
It is historically rare for the job market to regain momentum. Plus, jobs are often strong up until the point of a recession; then, the collapse is both sudden and severe. For example, on the eve of the GFC, U.S. unemployment was just 4.4% in May 2007 before a steady climb to a 10% peak.7
Headline job numbers have remained firm—particularly the blockbuster September report—but underlying data portends trouble ahead. Labor Differentials (the difference between “jobs are plentiful” and “jobs are hard to get” as measured by Consumer Confidence surveys) fell to 12.6 in September (from 15.9)—levels not seen since 2017.8
Our last concern to highlight relates to AI, which has been a key driver of the market’s furious ascent. Guessing the future of artificial intelligence is (thankfully) far beyond our purview, but we note some potentially troubling data related to AI.
Technology newsletter The Information reported last month that just 0.1% - 1.0% of Microsoft’s roughly 440mn users have subscribed to its AI add-on, Copilot.9 Further, estimates of total revenue from all LLM (large language model) remains just $10bn.10 For perspective, that is roughly the annual sales of Sketchers. Apple’s new “AI enabled phone” has been met with a collective shrug by consumer, with the company cutting order by nearly 10mn units.11
| 7 | U.S. Bureau of Labor Statistics |
| 8 | Pantheon Macro Research (9/11/2024) |
| 9 | “Hail Mary,” MacroStrategy Partnership (10/11/2024) |
| 10 | “Hail Mary,” MacroStrategy Partnership (10/11/2024) |
| 11 | “Apple Cuts Back iPhone Orders. Why Demand Fears Are Mounting,” Barron’s (10/24/2024) |
| 6 | www.opportunisticcreditintervalfund.com |
| Opportunistic Credit Interval Fund | Shareholder Letter |
September 30, 2024 (Unaudited)
The New York Times recently disclosed that market-leader Open-AI is expected to burn $5bn of cash in 2024 on an estimated $3.7bn sales.12 Relatedly, in a report this summer, tech investor Sequoia Capital calculated that AI companies would need to generate revenue of $600bn simply to payback capex spent thus far (including spending on GPU’s, energy, building, back-up generators).13
As for AI valuations, a recent report heighted that NVIDIA’s market cap exceeded the equity capitalization of five G7 countries: Canada, UK, France, Germany and Italy.14 For perspective, these countries generated GDP in 2023 of $2.1T, $3.3T, $3.0T, $4.5T and $2.2T, respective, compared to NVIDIA’s trailing twelve-month revenue of ~$96bn.15 This clearly seems out of whack.
It is far too early to characterize AI as the next Oculus or Google Glasses, but roughly two years into its investment cycle, AI has yet to demonstrate a mass market application despite massive investment by titans Amazon, Apple, Google and Microsoft.
We are not doubting the long-term path of AI per se, but the hype cycle is in jeopardy. Again, math always wins in the end. AI’s “rounding error” revenue despite massive capital investment and having captured cultural zeitgeist echoes of the Dot.com era.
Much as the gravitational pull of artificial intelligence has lifted asset prices, doubts about the technology, should they emerge, would weigh like an anvil on markets.
Macro Backdrop: The Good
Reversing gears, there are many positive economic signals underpinning the public markets cheery outlook.
As noted, economically sensitive consumers are struggling, but aggregate household balance sheets are remarkably healthy:
Household debt to disposal income
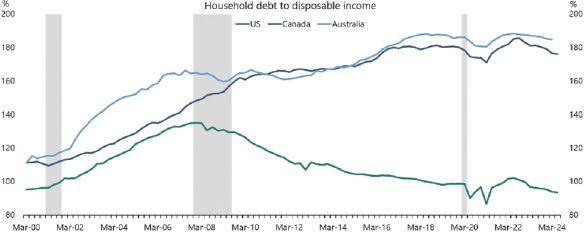
Source: Apollo Group (10/15/2024)
Lifted by post-pandemic wealth effects, U.S. net worth and the growth of net worth as measured by Oxford Economics’ consumer health monitor are nearing all-time highs.16
Much of these gains are concentrated, however. Affluent households disproportionately benefit from wealth effects; those without assets, see none. Aggregate data may therefore overstate their potential economic benefit, but the figures remain noteworthy.
| 12 | “OpenAI Is Growing Fast and Burning Through Piles of Money” New York Times (9/27/2024) |
| 13 | Sequia, “AI’s $600B Question.” (06/20/2024) |
| 14 | Apollo Chief Economist (10/24/2024) |
| 15 | https://data.worldbank.org/indicator/NY.GDP.MKTP.CD and Bloomberg |
| 16 | Oxford Economics (10/17/2024) |
| Annual Report | September 30, 2024 | 7 |
| Opportunistic Credit Interval Fund | Shareholder Letter |
September 30, 2024 (Unaudited)
Corporate balances sheets are also strikingly strong, with interest payments plumbing modern era lows:
Non-Financial Corporate Interest Payments

Source: Oxford Economics (10/17/2024)
The low interest burden has, in turn, contributed to declines in default rates as well:
Trialing three-month default rate, U.S. High Yield and Levered Loans

Source: Moody’s S&P, LDC, Bloomberg, Morgan Stanley (8/14/2024)
No conversation about markets would be complete without a discussion of interest rates.
First, the Fed’s 50 basis point17 cut in September may, in time, provide an economic boost. However, much like the lagging impact of hikes, cuts will take time to flow through to the economy. Importantly, the long end of the curve (which mortgage rates closely track) is higher since the September cuts (reflecting bullish expectations), which may mute the near-term benefit of lower Fed Funds.
| 17 | One basis point is equal to 0.01%, or 1/100th of 1%. |
| 8 | www.opportunisticcreditintervalfund.com |
| Opportunistic Credit Interval Fund | Shareholder Letter |
September 30, 2024 (Unaudited)
More notably, as seen below, the Fed’s cuts may accelerate a global easing cycle:
Number of global hikes vs. cuts since January 2015
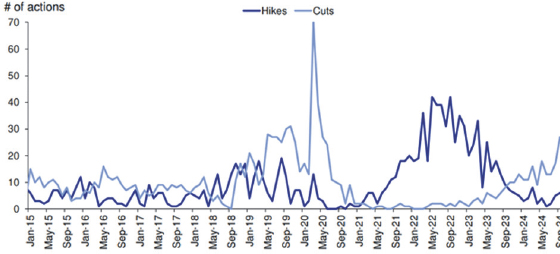
Source: Havner Analytics and Deutsche Bank (10/02/2024)
The recent surge in the dollar, in part, reflects market expectations that global easing may outpace the U.S.
Adding fuel, China recently announced a range of measures to jumpstart its economy—specifically trying to raise asset prices to lift consumer confidence. The size of these programs is larger than any Chinese government stimulus of the previous two years.18 The country also cut its one-year rate to 3.1% from 3.35%, the largest reduction ever.19
Highlighting the global connectedness of easing, China timed these moves in the wake of the Fed’s cuts to minimize the risk of capital flight. Herein lies the potential flywheel of stimulus as U.S. cuts beget easing around globe.
While lower global rates may prolong the current cycle, we note that U.S. 5-year inflation swaps have jumped in recent weeks:
Change (basis point) in the U.S. 5yr inflation swap
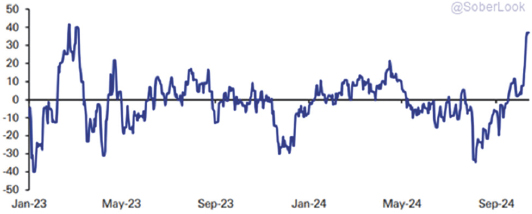
Source: Deutsche Bank (10/15/2024)
Ironically, if lower rates reignite inflationary pressures, it may force the Fed to recalibrate the path and magnitude on its easing cycle.
| 18 | “How This Time is Different,” Deutsche Bank (9/30/2024) |
| 19 | The Financial Times, (10/21/2024) |
| Annual Report | September 30, 2024 | 9 |
| Opportunistic Credit Interval Fund | Shareholder Letter |
September 30, 2024 (Unaudited)
Macro Backdrop: The Opportunity
Lofty public values suggest investors have put their faith in a soft landing. However, as reflected below, a benign outcome from mid-cycle cuts by global Central Bank have been historically rare:
Central bank track-record of mid-cycle cuts
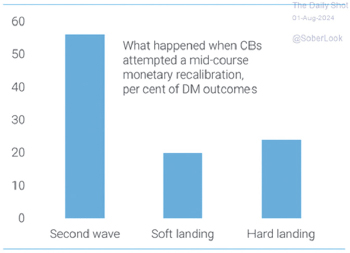
Source: Fed study and TS Lombard (8/1/2024)
To be clear, we are unambiguously cheering for a soft landing. If the Fed arrests inflation without recession, Chair Powell would join Paul Volker in the conversation of the greatest Chair ever. (The GFC has de-throned the once lauded Greenspan, in our view).
Nevertheless, with banks sidelined, certain consumers slowing, job creation likely having peaked, we remain skeptical. Geopolitical uncertainty represents yet another overhang.
With public markets having priced the bull-case across many variables, we have a simple response: God Bless the Private Market.
As reflected in the following graphs, middle market private credit continues to command a meaningful yield premium:
Private Credit Spreads vs. Leverage Loan (Term Loan B)
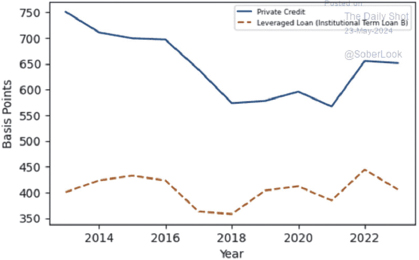
Source: Debtwire (7/11/2024)
| 10 | www.opportunisticcreditintervalfund.com |
| Opportunistic Credit Interval Fund | Shareholder Letter |
September 30, 2024 (Unaudited)
As for why private credit enjoys this advantage, I highlight the following passage from the Fed’s study, “Private Credit: Characteristics and Risks:”
“Given the absence of a liquid secondary market for many private credit instruments, lenders typically hold these loans until maturity or a refinancing event. As a result, these loan contracts can include features uncommon to traditional bank loans, such as a structured equity component, high prepayment penalties, or a role in oversight or management of the company.”20
Don’t fight the Fed when it comes to private market premium…
Again, not all private credit solutions deliver the same benefit. The dawn of monster funds by monster firms, has seen a degradation in segments of this market. Platforms forced to chase large deals must compete against public markets to win deals, resulting in lower yields and fewer investor protections.
As depicted below, loans to smaller companies enjoy a meaningful yield premium over larger deals:
Private Credit spreads by EBITDA size

Source: KBRA DLD Private Data; 3-month rolling average for first-lien term loans
Again, BC Partners views companies with EBITDA between $10mn to $50mn as our “wheelhouse”—an advantage conveyed by our “Goldilocks” size.
BC Partners and the Opportunistic Credit Interval Fund also focuses on lending to companies without private equity ownership, which often provides greater opportunity to dictate terms.
Sponsor-based transactions often entail aggressive structures (e.g. higher leverage, less amortization and no covenants) that have led, as reflected below, to higher instances of bankruptcy, default and debt exchanges:
Last Twelve-Month Loan Index Defaults

Source: Moody’s S&P, LDC, Bloomberg, Morgan Stanley (8/14/2024)
| 20 | Board of Governors of the Federal Reserve System, “Private Credit: Characteristics and Risks,” 2/23/2024 |
| Annual Report | September 30, 2024 | 11 |
| Opportunistic Credit Interval Fund | Shareholder Letter |
September 30, 2024 (Unaudited)
Firms that measure their AUM in the $10’s of billions cannot participate in the most attractive segments of the private market—smaller and non-sponsored deals—which we consider our playground.
The outlook for large cap private credit appears even more ominous going forward. Lower interest rates have enabled public markets to claw-back market share, as Bloomberg underscored in their recent article “Banks Reclaim $30bn of Debt Deal from Private Credit.”21 For clarity, none of those deals came at the expense of BC Partners.
Fund Performance
The Fund generated a total return of 7.3% for the fiscal year ended September 30, 2024, trailing that of our benchmark (Morningstar LSTA US Leveraged Loan TR USD Indexiii), largely due to cash drag during the period. During fiscal 2024, the Fund grew assets from $37M to $145M and successfully negotiated a multi-currency leverage facility, providing ample dry powder to further diversify the portfolio, support existing portfolio investments in their pursuit of growth initiatives and, to the extent relevant, aggressively deploy capital amidst a volatile market backdrop.
Despite modest underperformance during the year, inception-to-date returns continue to handily outpace the Index (16.7% vs.10.7%).
Among the Fund’s positive contributors were its investment in Smart Start (price appreciation of +26.7%), which was acquired at attractive levels by way of liquidity bid, as well as Camino (+4.0%) and MHS (+3.2%). Software, broadly, traded off during the period and our portfolio was no different – loans to Digicert and Ivanti traded down 7.4% and 1.8%, respectively. Further detracting from performance during fiscal 2024 was our private investment in IFRG Investor III, LP (-22.0%), an SPV designed to participate in the economics of the lead lender supporting the take-private transaction for Franchise Group. Since closing, performance has been affected by management turmoil, subsidiary underperformance and reactive asset sales. We remain in communication with the lender group to determine next steps for the business.
Positioning
This time last year, the Fund found itself ramping capital raising efforts and kicking off a significant phase of growth from roughly $37M of net assets to $145M today. At the time, the primary markets were quiet and remained relatively muted through early 2024, resulting in evenly split allocation across liquid and illiquid credit. As primary markets turned back on, the Fund began leaning into privately originated opportunities – today, over 70% of the portfolio is comprised by private deals.
Despite tightening spreads, we continue to see attractive private opportunities – one being a mid-sized, growing industrial manufacturer & distributor with whom we are aiming to close on a senior term loan priced at S+700 in the coming weeks. Private deals added to the portfolio since our last letter include Coterie Baby, a DTC, subscription-based platform focused on delivering premium diapers, and one of the largest deals in the history of BC Credit – Riddell, the premier designer and manufacturer of American football protective equipment.
Conclusion
The S&P 500 has gained 20% year to date through the third quarter. From this starting point—and with myriad risks in the subtext of our economy—equity markets feel like treacherous waters for investors.
This provides an opportune time to revisit a theme we have been hammering for several quarters: investors must reexamine portfolio construction.
The turbo-charged equity returns that propelled accounts post-GFC will not repeat in the years ahead. Reshoring, energy transition, shifting geopolitical order, aging demographics, spiraling debt-to-GDP, non-zero inflation, “just in case” rather than ‘just in time” inventories, persistent deficits and higher interest rates represent just some of the obstacles that will weigh on markets.
Goldman Sachs recently released a 10-Year forecast for annualized S&P 500 returns of just 3.0% (nominal).22 This represents but one of many market projections, but this outlook could undershoot by 4x and still trail the 16% per annum S&P return from 2009 to 2021.23 Starting valuation and market concentration feature among the largest contributors of the bank’s projections.
With higher returns likely available on a nominal basis, we think fixed income must become a larger share of investors’ assets. From a risk adjusted perspective, the case for fixed income becomes overwhelming.
| 21 | Bloomberg, “Banks Reclaim $30bn of Debt from Private Credit.” (10/03/2024) |
| 22 | Goldman Sachs, Global Strategy Paper #71: (10/18/2024) |
| 23 | Cost of Capital and Capital Allocation, Investment in the Era of ‘Easy Money” Morgan Stanely (2/28/2024) |
| 12 | www.opportunisticcreditintervalfund.com |
| Opportunistic Credit Interval Fund | Shareholder Letter |
September 30, 2024 (Unaudited)
Investors can similarly ill-afford to allocate to the countless mutual funds and ETFs that have historically comprised their credit allocation. The demise of small and medium banks has overwhelming tilted the opportunity towards private markets. Within private credit, investors should seek the most attractive lower middle market and non-sponsored segments—again, the playground of BC Partners.
Regards,
Matthias Ederer
Portfolio Manager
Opportunistic Credit Interval Fund
| i | Fund performance refers to that of Class I. Reflects twelve-month returns through September 30, 2024. Past performance is not indicative of future results. The investment return and principal value of an investment will fluctuate. An investor’s shares when redeemed, may be worth more or less than the original cost. Total return is calculated assuming reinvestment of all dividends and distributions. Performance figures for periods less than one year are not annualized. For performance information current to the most recent month-end, please call toll-free 1-833-404-4103. |
The Adviser and the Fund have entered into an Expense Limitation Agreement under which the Adviser has agreed, until at least February 1, 2025 to waive its management fees (excluding any incentive fee) and to pay or absorb the ordinary annual operating expenses of the Fund (excluding incentive fees, all borrowing costs, dividends, amortization/accretion on securities sold short, brokerage commissions, acquired fund fees and expenses and extraordinary expenses), to the extent that its management fees plus the Fund’s ordinary annual operating expenses exceed 2.50% per annum of the Fund’s average daily net assets attributable to Class I shares. Such Expense Limitation Agreement may not be terminated by the Adviser, but it may be terminated by the Board of Trustees, upon 60 days written notice to the Adviser. Any waiver or reimbursement by the Adviser is subject to repayment by the Fund within the three (3) years from the date the Adviser (or the previous investment adviser) waived any payment or reimbursed any expense, if the Fund is able to make the repayment without exceeding the lesser of the expense limitation in place at the time of the waiver or the current expense limitation and the repayment is approved by the Board of Trustees. See “Management of the Fund.”
| ii | S&P 500 – The S&P 500 is a market-capitalization-weighted index of the 500 largest publicly-traded companies in the U.S. Investors cannot invest directly in an index. |
| iii | Morningstar LSTA US Leveraged Loan TR USD Index - The Morningstar LSTA US Leveraged Loan TR USD Index is a market value-weighted index designed to measure the performance of the U.S. leveraged loan market based upon market weightings, spreads and interest payments. Investors cannot invest directly in an index. |
| Annual Report | September 30, 2024 | 13 |
| Opportunistic Credit Interval Fund | Portfolio Update |
September 30, 2024 (Unaudited)
The Fund’s performance figures for the period ended September 30, 2024, compared to its benchmark:
| Opportunistic Credit Interval Fund | 1 Month | Quarter | 6 Month | YTD | 1 Year | Since Inception | Inception |
Opportunistic Credit Interval Fund - NAV | 0.95% | 2.09% | 3.31% | 5.26% | 7.32% | 16.70% | 7/1/2022 |
Morningstar LSTA US Leveraged Loan TR USD Index | 0.71% | 2.04% | 3.98% | 6.54% | 9.59% | 10.68% | 7/1/2022 |
The Morningstar LSTA US Leveraged Loan TR USD Index is a market value-weighted index designed to measure the performance of the U.S. leveraged loan market based upon market weightings, spreads and interest payments. Investors cannot invest directly in an index.
Past performance is not indicative of future results. The investment return and principal value of an investment will fluctuate. An investor’s shares when redeemed, may be worth more or less than the original cost. Total return is calculated assuming reinvestment of all dividends and distributions. Performance figures for periods less than one year are not annualized. As of the Fund’s most recent prospectus dated January 26, 2024, the Fund’s total annual operating expenses, including acquired fund fees and expenses, before fee waivers is 11.17% for Class I. After fee waivers, the Fund’s total annual operating expense is 2.97% for Class I. For performance information current to the most recent month-end, please call toll-free 1-833-404-4103.
| 14 | www.opportunisticcreditintervalfund.com |
| Opportunistic Credit Interval Fund | Portfolio Update |
September 30, 2024 (Unaudited)
Comparison of the Change in Value of a $10,000 Investment

Consolidated Portfolio Composition as of September 30, 2024
| Asset Type | Percent of Net Assets |
| Bank Loan | 77.55% |
| Preferred Stock | 10.02% |
| Bonds & Notes | 4.90% |
| Joint Venture | 4.36% |
| Short-Term Investments | 3.27% |
| Equipment Financing | 2.00% |
| Common Equity | 0.67% |
| Warrants | 0.16% |
| Derivatives | 0.00% |
| Total Investments | 102.93% |
| Liabilities in Excess of Other Assets | (2.93%) |
| Net Assets | 100.00% |
Please see the Consolidated Schedule of Investments for a detailed listing of the Fund’s holdings.
| Annual Report | September 30, 2024 | 15 |
| Opportunistic Credit Interval Fund | Consolidated Schedule of Investments |
September 30, 2024
| Coupon | Reference Rate & Spread | Maturity | Principal | Value | ||||||||||||||
| BANK LOANS (77.55%) | ||||||||||||||||||
| Communication Services (6.63%) | ||||||||||||||||||
| Neptune Bidco US Inc., Second Lien Term Loan(a)(b) | 15.15 | % | 3M SOFR + 9.75%, 0.75% Floor | 10/11/2029 | $ | 2,000,000 | $ | 2,000,000 | ||||||||||
| Neptune Bidco US Inc., First Lien Term Loan A(a)(b) | 10.15 | % | 3M SOFR + 4.75%, 0.50% Floor | 10/11/2028 | 2,488,674 | 2,333,754 | ||||||||||||
| Neptune Bidco US Inc., First Lien Term Loan(a)(b) | 10.40 | % | 3M SOFR + 5.00%, 0.50% Floor | 04/11/2029 | 2,633,459 | 2,479,217 | ||||||||||||
| Next Flight Ventures Delayed Draw Term Loan(a)(b)(c)(d) | 15.01 | % | 3M SOFR + 10.00% | 12/26/2025 | 110,333 | 107,485 | ||||||||||||
| Next Flight Ventures, First Lien Term Loan, First Lien Term Loan(a)(b)(c) | 14.90 | % | 3M SOFR + 10.00% | 12/26/2025 | 1,144,974 | 1,115,319 | ||||||||||||
| Synamedia Americas Holdings, Inc., First Lien Term Loan(a)(b) | 12.35 | % | 3M SOFR + 7.75%, 1.00% Floor | 12/05/2028 | 1,653,017 | 1,617,973 | ||||||||||||
| 9,653,748 | ||||||||||||||||||
| Consumer Discretionary (1.92%) | ||||||||||||||||||
| PMP OPCO, LLC, First Lien Term Loan(a)(b)(e) | 13.35 | % | 1M SOFR + 8.50%, 2.00% Floor | 05/31/2029 | 1,968,750 | 1,931,934 | ||||||||||||
| PMP OPCO, LLC, Delayed Draw Term Loan(a)(b)(d)(e) | – | % | 1M SOFR + 8.50%, 2.00% Floor | 05/31/2029 | – | (11,419 | ) | |||||||||||
| PMP OPCO, LLC, Revolver(a)(b)(d)(e) | – | % | 1M SOFR + 8.50%, 2.00% Floor | 05/31/2029 | – | (4,091 | ) | |||||||||||
| Riddell Inc., First Lien Term Loan(a)(b)(e) | 11.17 | % | 1M SOFR + 6.00%, 1.00% Floor | 03/29/2029 | 897,727 | 887,673 | ||||||||||||
| Riddell Inc., Delayed Draw Term Loan(a)(b)(d)(e) | – | % | 1M SOFR + 6.00%, 1.00% Floor | 03/29/2029 | – | (1,018 | ) | |||||||||||
| 2,803,079 | ||||||||||||||||||
| Consumer Staples (8.93%) | ||||||||||||||||||
| Alphia, Inc., First Lien Term Loan(a)(b) | 9.85 | % | 1M SOFR + 5.00% | 10/03/2030 | 2,985,000 | 2,836,616 | ||||||||||||
| Florida Food Products LLC, First Lien Term Loan(a)(b) | 9.96 | % | 1M SOFR + 5.00%, 0.75% Floor | 10/18/2028 | 4,071,588 | 3,595,090 | ||||||||||||
| Global Integrated Flooring Systems Inc., First Lien Term Loan(a)(b)(c) | 14.70 | % | 3M SOFR + 8.36%, 1.00% PIK | 06/30/2025 | 1,247,278 | 677,022 | ||||||||||||
| Global Integrated Flooring Systems Inc., Revolver(a)(b)(c) | 13.31 | % | 1M SOFR + 8.36% | 06/30/2025 | 12,163 | 6,602 | ||||||||||||
| Jackson Ranch LLC, First Lien Term Loan(a)(b)(c) | 13.00 | % | 13.00% PIK | 09/20/2027 | 1,329,785 | 1,329,785 | ||||||||||||
| SPB C-2024, LLC, First Lien Term Loan(a)(b)(c) | 13.00 | % | 13.00% PIK | 08/19/2027 | 4,568,250 | 4,568,250 | ||||||||||||
| 13,013,365 | ||||||||||||||||||
| Financials (23.65%) | ||||||||||||||||||
| AIS Holdco LLC, First Lien Term Loan(a)(b) | 10.60 | % | 1M SOFR + 6.00%, 1.25% Floor | 05/21/2029 | 2,104,000 | 2,072,440 | ||||||||||||
| AIS Holdco LLC, Revolver(a)(b)(d) | – | % | 1M SOFR + 6.00%, 1.25% Floor | 05/21/2029 | – | (1,500 | ) | |||||||||||
| BetaNXT, Inc., First Lien Term Loan(a)(b) | 10.35 | % | 3M SOFR + 5.75% | 07/01/2029 | 5,369,697 | 5,155,446 | ||||||||||||
| Cor Leonis Limited, Revolver(a)(b)(d) | 12.10 | % | 1M SOFR+ 7.50%, 1.50% Floor | 05/15/2028 | 214,890 | 214,523 | ||||||||||||
| Expert Experience Credit Motors, LLC, Revolver(a)(b)(d) | 15.67 | % | 1M SOFR + 10.50% | 03/29/2026 | 4,958,139 | 4,958,139 | ||||||||||||
| Fortis Payment Systems, LLC, First Lien Term Loan(a)(b) | 9.95 | % | 3M SOFR + 5.25%, 1.00% Floor | 02/13/2026 | 1,865,625 | 1,854,057 | ||||||||||||
| Fortis Payment Systems, LLC, Delayed Draw Term Loan(a)(b)(d) | 9.95 | % | 3M SOFR + 5.25%, 1.00% Floor | 02/13/2026 | 272,910 | 272,554 | ||||||||||||
| Lion FIV Debtco Limited, Revolver(a)(b)(d) | 16.33 | % | 3M SOFR + 11.00% | 10/18/2024 | 988,180 | 974,355 | ||||||||||||
| Meridian Venture Partners II LP, First Lien Term Loan(a)(b)(c) | 15.50 | % | 15.50% PIK | 04/15/2027 | 4,613,135 | 4,498,730 | ||||||||||||
| Resolute Investment Managers, Inc., First Lien Term Loan(a)(b) | 11.37 | % | 3M SOFR + 6.50% | 04/30/2027 | 4,994,987 | 4,907,575 | ||||||||||||
See Notes to Consolidated Financial Statements.
| 16 | www.opportunisticcreditintervalfund.com |
| Opportunistic Credit Interval Fund | Consolidated Schedule of Investments |
September 30, 2024
| Coupon | Reference Rate & Spread | Maturity | Principal | Value | ||||||||||||||
| RHF VIII Holdings LLC, Revolver(a)(b)(d) | –% | 3M SOFR+ 7.13%, 2.50% Floor | 07/02/2026 | $ | 2,950,000 | $ | 2,950,000 | |||||||||||
| Royal Palm Equity Partners I L.P., First Lien Term Loan(a)(b)(c)(d) | 12.28 | % | 3M SOFR + 7.00%, 12.28% PIK, 2.50% Floor | 10/24/2033 | 2,119 | 1,673 | ||||||||||||
| Royal Palm Equity Partners I L.P., Delayed Draw Term Loan(a)(b)(c)(d) | 12.28 | % | 3M SOFR + 7.00%, 12.28% PIK, 2.50% Floor | 10/24/2033 | 10,595 | 8,366 | ||||||||||||
| Royal Palm Equity Partners I L.P., Initial First Lien Term Loan, First Lien Term Loan(a)(b)(c) | 12.28 | % | 3M SOFR + 7.00%, 12.28% PIK, 2.50% Floor | 10/24/2033 | 594,471 | 590,844 | ||||||||||||
| Royal Palm Equity Partners II L.P., First Lien Term Loan(a)(b)(c) | 13.28 | % | 3M SOFR + 8.00%, 13.28% PIK, 2.50% Floor | 10/24/2028 | 40,778 | 40,423 | ||||||||||||
| Russell Investments US Institutional Holdco, Inc., First Lien Term Loan(a)(b)(c) | 11.75 | % | 3M SOFR + 5.00%, 1.50% PIK, 1.00% Floor | 05/31/2027 | 4,597,128 | 3,992,606 | ||||||||||||
| TA/WEG HOLDINGS, LLC, 2020 Delayed Draw Term Loan(a)(b) | 10.52 | % | 3M SOFR + 5.50%, 1.00% Floor | 10/04/2027 | 309,935 | 309,935 | ||||||||||||
| TA/WEG HOLDINGS, LLC, 2021 Delayed Draw Term Loan(a)(b) | 10.70 | % | 3M SOFR + 5.50%, 1.00% Floor | 10/04/2027 | 463,361 | 463,361 | ||||||||||||
| TA/WEG HOLDINGS, LLC, 2024 Delayed Draw Term Loan(a)(b)(d) | 10.36 | % | 3M SOFR + 5.50%, 1.00% Floor | 10/04/2027 | 720,255 | 720,255 | ||||||||||||
| TA/WEG HOLDINGS, LLC, May 2022 Delayed Draw Term Loan(a)(b) | 10.69 | % | 3M SOFR + 5.50%, 1.00% Floor | 10/04/2027 | 464,966 | 464,966 | ||||||||||||
| TA/WEG HOLDINGS, LLC, Revolver(a)(b)(d) | – | % | 3M SOFR + 5.50%, 1.00% Floor | 02/02/2032 | – | – | ||||||||||||
| 34,448,748 | ||||||||||||||||||
| Health Care (8.54%) | ||||||||||||||||||
| CCMG Buyer, LLC, First Lien Term Loan(a)(b) | 10.61 | % | 1M SOFR + 5.50%, 1.00% Floor | 05/08/2030 | 1,579,375 | 1,575,427 | ||||||||||||
| CCMG Buyer, LLC, Revolver(a)(b)(d) | – | % | 1M SOFR + 5.50%, 1.00% Floor | 05/08/2030 | – | (625 | ) | |||||||||||
| Dentive LLC, First Lien Term Loan(a)(b) | 11.63 | % | 3M SOFR + 6.75%, 1.00% Floor | 12/26/2028 | 237,619 | 233,460 | ||||||||||||
| Dentive LLC, Delayed Draw Term Loan(a)(b)(d) | 11.63 | % | 3M SOFR + 6.75%, 1.00% Floor | 12/26/2028 | 1,471,704 | 1,433,608 | ||||||||||||
| IDC Infusion Services, Inc., First Lien Term Loan(a)(b) | 11.55 | % | 3M SOFR + 6.50%, 1.00% Floor | 07/07/2028 | 363,214 | 359,109 | ||||||||||||
| IDC Infusion Services, Inc., Delayed Draw Term Loan(a)(b)(d) | – | % | 3M SOFR + 6.50%, 1.00% Floor | 07/07/2028 | – | 1,158 | ||||||||||||
| IDC Infusion Services, Second Amendment First Lien Term Loan(a)(b) | 11.33 | % | 3M SOFR+ 6.00% | 07/07/2028 | 3,491,250 | 3,451,799 | ||||||||||||
| PhyNet Dermatology LLC, First Lien Term Loan(a)(b) | 11.78 | % | 6M SOFR + 6.50%, 1.00% Floor | 10/20/2029 | 484,104 | 480,473 | ||||||||||||
| PhyNet Dermatology LLC, Delayed Draw Term Loan(a)(b)(d) | – | % | 6M SOFR + 6.50%, 1.00% Floor | 10/20/2029 | – | 2,534 | ||||||||||||
| Radiology Partners, Inc, First Lien Term Loan(a)(b)(c) | 10.38 | % | 3M SOFR + 3.50%, 1.50% PIK | 01/31/2029 | 2,002,668 | 1,967,631 | ||||||||||||
| South Florida ENT Associates, First Lien Term Loan(a)(b) | 11.95 | % | 3M SOFR + 7.00%, 1.00% Floor | 12/31/2025 | 390,498 | 388,506 | ||||||||||||
| South Florida ENT Associates, Delayed Draw Term Loan(a)(b)(d) | 11.20 | % | 1M SOFR + 6.25% | 12/31/2025 | 62,058 | 59,730 | ||||||||||||
| USN Opco, LLC, First Lien Term Loan(a)(b) | 10.50 | % | 3M SOFR + 5.75%, 1.00% Floor | 12/21/2026 | 2,493,750 | 2,493,750 | ||||||||||||
| 12,446,560 | ||||||||||||||||||
| Industrials (8.49%) | ||||||||||||||||||
| Accordion Partners, LLC, First Lien Term Loan(a)(b) | 10.85 | % | 3M SOFR + 6.25%, 0.75% Floor | 08/29/2029 | 82,323 | 82,010 | ||||||||||||
| Accordion Partners, LLC, Delayed Draw Term Loan A(a)(b) | 11.10 | % | 3M SOFR + 6.50%, 0.75% Floor | 08/29/2029 | 7,208 | 7,208 | ||||||||||||
See Notes to Consolidated Financial Statements.
| Annual Report | September 30, 2024 | 17 |
| Opportunistic Credit Interval Fund | Consolidated Schedule of Investments |
September 30, 2024
| Coupon | Reference Rate & Spread | Maturity | Principal | Value | ||||||||||||||
| Accordion Partners, LLC, Delayed Draw Term Loan B(a)(b) | 11.50 | % | 3M SOFR + 6.25%, 0.75% Floor | 08/29/2029 | $ | 9,056 | $ | 9,021 | ||||||||||
| Accordion Partners, LLC, Third Amendment Delayed Draw Term Loan(a)(b) | 11.45 | % | 3M SOFR + 6.50%, 0.75% Floor | 08/29/2029 | 149,855 | 149,855 | ||||||||||||
| Accordion Partners, LLC, Third Amendment First Lien Term Loan, First Lien Term Loan(a)(b) | 11.52 | % | 3M SOFR + 6.50%, 0.75% Floor | 08/29/2029 | 98,791 | 98,791 | ||||||||||||
| Astro Acquisition, LLC, First Lien Term Loan(a)(b) | 10.10 | % | 3M SOFR + 5.50%, 1.00% Floor | 12/13/2027 | 3,980,000 | 3,953,732 | ||||||||||||
| Inmar, Inc., First Lien Term Loan(a)(b) | 10.23 | % | 3M SOFR + 5.50%, 1.00% Floor | 05/01/2026 | 992,462 | 995,524 | ||||||||||||
| Marvel APS, Delayed Draw Term Loan(a)(b)(c)(l) | 10.00 | % | 10.00% PIK | 12/21/2027 | 3,281,759 | 3,653,097 | ||||||||||||
| Material Handling Systems, Inc., First Lien Term Loan(a)(b) | 10.91 | % | 3M SOFR + 5.50%, 0.50% Floor | 06/08/2029 | 1,567,942 | 1,438,595 | ||||||||||||
| Tactical Air Support, Inc., First Lien Term Loan(a)(b) | 13.93 | % | 3M SOFR + 8.50%, 1.00% Floor | 12/22/2028 | 1,714,286 | 1,697,143 | ||||||||||||
| Tactical Air Support, Inc., Delayed Draw Term Loan(a)(b) | 13.76 | % | 1M SOFR + 8.50%, 1.00% Floor | 12/22/2028 | 285,714 | 282,857 | ||||||||||||
| 12,367,833 | ||||||||||||||||||
| Information Technology (16.13%) | ||||||||||||||||||
| Alegeus Technologies Holdings Corp., First Lien Term Loan(a)(b) | 13.46 | % | 3M SOFR + 8.25%, 1.00% Floor | 09/04/2026 | 351,313 | 351,313 | ||||||||||||
| Athos Merger Sub LLC, First Lien Term Loan(a)(b) | 10.32 | % | 3M SOFR + 5.00% | 07/31/2026 | 234,913 | 218,469 | ||||||||||||
| Athos Merger Sub LLC, Second Lien Term Loan(a)(b) | 13.57 | % | 3M SOFR + 8.25% | 07/30/2027 | 160,771 | 145,225 | ||||||||||||
| DCert Buyer, Inc., First Amendment Term Loan Refinancing, Second Lien Term Loan (a)(b) | 11.85 | % | 1M SOFR + 7.00% | 02/16/2029 | 3,532,961 | 3,068,642 | ||||||||||||
| DRI Holdings Inc., First Lien Term Loan(a)(b) | 10.20 | % | 1M SOFR + 5.25%, 0.50% Floor | 12/15/2028 | 500,743 | 484,887 | ||||||||||||
| Enverus Holdings, Inc., Initial First Lien Term Loan(a)(b) | 10.35 | % | 1M SOFR + 5.50%, 0.75% Floor | 12/12/2029 | 809,958 | 802,588 | ||||||||||||
| Enverus Holdings, Inc., Revolver(a)(b)(d) | 10.35 | % | 1M SOFR + 5.50%, 0.75% Floor | 12/12/2029 | 4,744 | 4,068 | ||||||||||||
| Global IID Parent LLC, Second Lien Term Loan(a)(b) | 12.62 | % | 3M SOFR + 7.75%, 0.50% Floor | 12/16/2029 | 165,000 | 158,879 | ||||||||||||
| Global IID Parent LLC, First Lien Term Loan(a)(b) | 9.37 | % | 3M SOFR + 4.50%, 0.50% Floor | 12/08/2028 | 1,730,333 | 1,714,414 | ||||||||||||
| HDC / HW Intermediate Holdings, LLC, First Lien Term Loan A(a)(b)(c) | 8.75 | % | 3M SOFR + 1.00%, 2.50% PIK, 5.25% Floor | 06/21/2026 | 932,717 | 794,489 | ||||||||||||
| HDC / HW Intermediate Holdings, LLC, First Lien Term Loan B(a)(b)(c)(j) | – | % | 3M SOFR + 1.00%, 2.50% PIK, 5.25% Floor | 06/21/2026 | 646,028 | – | ||||||||||||
| Help Systems Holdings, Inc., First Lien Term Loan(a)(b) | 8.95 | % | 1M SOFR + 4.00%, 0.75% Floor | 11/19/2026 | 2,483,103 | 2,374,468 | ||||||||||||
| Ivanti Software, Inc., First Lien Term Loan(a)(b) | 9.83 | % | 3M SOFR + 4.25%, 0.75% Floor | 12/01/2027 | 2,450,236 | 2,088,655 | ||||||||||||
| Kofax, Inc., First Lien Term Loan(a)(b) | 10.60 | % | 3M SOFR + 5.25%, 0.50% Floor | 07/20/2029 | 2,568,848 | 2,315,444 | ||||||||||||
| Morae Global Holdings Inc., First Lien Term Loan(a)(b) | 13.43 | % | 3M SOFR + 8.00%, 2.00% Floor | 10/26/2026 | 1,323,438 | 1,298,688 | ||||||||||||
| Morae Global Holdings Inc., Revolver(a)(b)(d) | – | % | 3M SOFR + 8.00%, 2.00% Floor | 10/26/2026 | – | (2,338 | ) | |||||||||||
| PEAK Technology Partners, Inc., First Lien Term Loan(a)(b) | 10.51 | % | 3M SOFR + 5.25%, 1.00% Floor | 07/22/2027 | 615,271 | 606,719 | ||||||||||||
| Riskonnect Parent LLC, First Lien Term Loan(a)(b) | 10.25 | % | 3M SOFR + 5.50%, 0.75% Floor | 12/07/2028 | 1,219,110 | 1,206,431 | ||||||||||||
| Riskonnect Parent LLC, Delayed Draw Term Loan(a)(b)(d) | – | % | 3M SOFR + 5.50%, 0.75% Floor | 12/07/2028 | – | (2,000 | ) | |||||||||||
See Notes to Consolidated Financial Statements.
| 18 | www.opportunisticcreditintervalfund.com |
| Opportunistic Credit Interval Fund | Consolidated Schedule of Investments |
September 30, 2024
| Coupon | Reference Rate & Spread | Maturity | Principal | Value | ||||||||||||||
| Tank Holding Corp., First Lien Term Loan(a)(b) | 10.25 | % | 1M SOFR + 5.75%, 0.75% Floor | 03/31/2028 | $ | 1,834,179 | $ | 1,808,271 | ||||||||||
| Tank Holding Corp., Revolver(a)(b)(d) | 10.75 | % | 1M SOFR + 5.75%, 0.75% Floor | 03/31/2028 | 4,851 | 4,754 | ||||||||||||
| Taoglas Group Holdings Limited, First Lien Term Loan(a)(b) | 11.85 | % | 3M SOFR + 7.25%, 1.00% Floor | 02/28/2029 | 309,293 | 295,901 | ||||||||||||
| Taoglas Group Holdings Limited, Revolver(a)(b)(d) | 12.35 | % | 3M SOFR + 7.25%, 1.00% Floor | 02/28/2029 | 76,700 | 72,976 | ||||||||||||
| VeriFone Systems, Inc., First Lien Term Loan(a)(b) | 9.33 | % | 3M SOFR + 4.00% | 08/20/2025 | 992,105 | 913,109 | ||||||||||||
| Zywave, Inc., First Lien Term Loan(a)(b) | 9.25 | % | 3M SOFR + 4.50%, 0.75% Floor | 11/12/2027 | 2,966,699 | 2,777,572 | ||||||||||||
| 23,501,624 | ||||||||||||||||||
| Real Estate (3.26%) | ||||||||||||||||||
| RHF VI FUNDING LLC, Revolver(a)(b)(d) | 12.37 | % | 3M SOFR+ 7.50% | 11/19/2024 | 4,750,000 | 4,750,000 | ||||||||||||
| 4,750,000 | ||||||||||||||||||
| TOTAL BANK LOANS | ||||||||||||||||||
| (Cost $112,871,201) | 112,984,957 | |||||||||||||||||
| BONDS & NOTES (4.90%) | ||||||||||||||||||
| Asset Backed Securities (0.23%) | ||||||||||||||||||
| Mount Logan Funding 2018-1 LP(a)(b)(e) | 22.14 | % | N/A | 01/22/2033 | 479,858 | 340,651 | ||||||||||||
| 340,651 | ||||||||||||||||||
| Notes (4.67%) | ||||||||||||||||||
| Financials (4.67%) | ||||||||||||||||||
| EJF CRT 2024-R1 LLC(a)(b) | 12.93 | % | N/A | 12/17/2055 | 6,806,755 | 6,806,755 | ||||||||||||
| 6,806,755 | ||||||||||||||||||
| TOTAL BONDS & NOTES | ||||||||||||||||||
| (Cost $7,207,753) | 7,147,406 | |||||||||||||||||
| EQUIPMENT FINANCING (2.00%) | ||||||||||||||||||
| Financials (2.00%) | ||||||||||||||||||
| White Oak Equipment Finance 1, LLC(a)(b)(i) | 10.75 | % | N/A | 01/01/2027 | 2,912,560 | 2,912,560 | ||||||||||||
| TOTAL EQUIPMENT FINANCING | ||||||||||||||||||
| (Cost $2,912,560) | 2,912,560 | |||||||||||||||||
| Shares | Value | |||||||||||||||||
| COMMON EQUITY (0.67%) | ||||||||||||||||||
| Communication Services (-%) | ||||||||||||||||||
| Next Flight Ventures(a)(f) | 23 | 3,136 | ||||||||||||||||
| NFV Co-Pilot, Inc.(a)(f) | 114 | 2,457 | ||||||||||||||||
| 5,593 | ||||||||||||||||||
| Consumer Discretionary (0.67%) | ||||||||||||||||||
| IFRG Investor III, L.P.(a) | 1,250,000 | 975,000 | ||||||||||||||||
| 975,000 | ||||||||||||||||||
| Information Technology (–%) | ||||||||||||||||||
| HDC / HW Intermediate Holdings, LLC(a)(f) | 24,803 | – | ||||||||||||||||
| – | ||||||||||||||||||
| TOTAL COMMON EQUITY | ||||||||||||||||||
| (Cost $1,259,807) | 980,593 | |||||||||||||||||
See Notes to Consolidated Financial Statements.
| Annual Report | September 30, 2024 | 19 |
| Opportunistic Credit Interval Fund | Consolidated Schedule of Investments |
September 30, 2024
| Shares | Value | |||||||||||||||||
| JOINT VENTURE (4.36%) | ||||||||||||||||||
| Joint Venture (4.36%) | ||||||||||||||||||
| Great Lakes Funding II LLC, Series A(d)(e)(g)(h) | 6,195,218 | 6,350,098 | ||||||||||||||||
| 6,350,098 | ||||||||||||||||||
| TOTAL JOINT VENTURE | ||||||||||||||||||
| (Cost $6,195,218) | 6,350,098 | |||||||||||||||||
| PREFERRED STOCK (10.02%) | ||||||||||||||||||
| Communication Services (1.59%) | ||||||||||||||||||
| Highmount DP SPV, LLC, Class A, Preferred(a)(d)(f)(i) | 2,321,429 | 2,321,429 | ||||||||||||||||
| 2,321,429 | ||||||||||||||||||
| Consumer Discretionary (5.97%) | ||||||||||||||||||
| EBSC Holdings LLC (Riddell, Inc.), Preferred(a)(b)(c)(e) | 10.00% PIK | 5,252,423 | 5,239,292 | |||||||||||||||
| Princeton Medspa Partners, LLC, Preferred(a)(b)(c)(e)(i) | 12.50% PIK | 3,610,274 | 3,455,844 | |||||||||||||||
| 8,695,136 | ||||||||||||||||||
| Health Care (2.46%) | ||||||||||||||||||
| Epilog Partners SPV III, LLC, Preferred(a)(d)(f)(i) | 3,519,353 | 3,580,632 | ||||||||||||||||
| 3,580,632 | ||||||||||||||||||
| TOTAL PREFERRED STOCK | ||||||||||||||||||
| (Cost $14,639,281) | 14,597,197 | |||||||||||||||||
| WARRANTS (0.16%) | ||||||||||||||||||
| Information Technology (0.16%) | ||||||||||||||||||
| Morae Global Holdings Inc., Warrants(a) | 1 | 78,792 | ||||||||||||||||
| Princeton Medspa Partners, LLC, Warrants(a)(e)(i) | 0.09 | 167,042 | ||||||||||||||||
| 245,834 | ||||||||||||||||||
| TOTAL WARRANTS | ||||||||||||||||||
| (COST $52,195) | 245,834 | |||||||||||||||||
| Number of Contracts | Value | |||||||||||||||||
| DERIVATIVES (–%) | ||||||||||||||||||
| Epilog Partners SPV III, LLC, Put Option(a)(i) | 3,500,000 | – | ||||||||||||||||
| Princeton Medspa Partners, LLC, Put Option(a)(e)(i) | 3,500,000 | – | ||||||||||||||||
| TOTAL DERIVATIVES | ||||||||||||||||||
| (Cost $–) | – | |||||||||||||||||
| SHORT-TERM INVESTMENT (3.27%) | ||||||||||||||||||
| US BANK MMDA - USBGFS 9, 4.70%(k) | 4,758,942 | 4,758,942 | ||||||||||||||||
| TOTAL SHORT-TERM INVESTMENT | ||||||||||||||||||
| (Cost $4,758,942) | 4,758,942 | |||||||||||||||||
| INVESTMENTS, AT VALUE (102.93%) | ||||||||||||||||||
| (Cost $149,896,957) | $ | 149,977,587 | ||||||||||||||||
| Other Liabilities In Excess Of Other Assets (-2.93%) | (4,263,573 | ) | ||||||||||||||||
| NET ASSETS (100.00%) | $ | 145,714,014 | ||||||||||||||||
See Notes to Consolidated Financial Statements.
| 20 | www.opportunisticcreditintervalfund.com |
| Opportunistic Credit Interval Fund | Consolidated Schedule of Investments |
September 30, 2024
Investment Abbreviations:
SOFR - Secured Overnight Financing Rate
PIK - Payment in-kind
Libor Rates:
1M US SOFR - 1 Month US SOFR as of September 30, 2024 was 4.85%
3M US SOFR - 3 Month US SOFR as of September 30, 2024 was 4.59%
6M US SOFR - 6 Month US SOFR as of September 30, 2024 was 4.25%
| (a) | As a result of the use of significant unobservable inputs to determine fair value, these investments have been classified as Level 3 assets. |
| (b) | Variable rate investment. Interest rates reset periodically. Interest rate shown reflects the rate in effect at September 30, 2024. For securities based on a published reference rate and spread, the reference rate and spread are indicated in the description above. Certain variable rate securities are not based on a published reference rate and spread but are determined by the issuer or agent and are based on current market conditions. These securities do not indicate a reference rate and spread in their description above. |
| (c) | Payment in kind security which may pay interest in additional par. |
| (d) | All or a portion of this commitment was unfunded as of September 30, 2024. |
| (e) | Affiliated company. |
| (f) | Non-income producing security. |
| (g) | Restricted security. |
| (h) | During the period ended September 30, 2024, the Fund invested $6,935,694 in Great Lakes Funding II, LLC - Series A units, received a return of capital distribution of $836,672, and reported change in unrealized appreciation of $156,973 on Great Lakes Funding II, LLC - Series A units. Additionally, Great Lakes Funding II LLC - Series A declared distributions of $787,378 during the period ended September 30, 2024. |
| (i) | Investment is held through SOFIX Master Blocker, LLC, wholly owned subsidiary. |
| (j) | Non-accrual |
| (k) | Money market fund; interest rate reflects seven-day effective yield on September 30, 2024. |
| (l) | Principal balance denominated in euros. |
See Notes to Consolidated Financial Statements.
| Annual Report | September 30, 2024 | 21 |
| Opportunistic Credit Interval Fund | Consolidated Schedule of Investments |
September 30, 2024
Additional information on investments in private investment funds:
| Security | Value | Redemption Frequency | Redemption Notice(Days) | Unfunded Commitments as of September 30, 2024 | ||||||||
| Great Lakes Funding II LLC, Series A | $ | 6,350,098 | N/A | N/A | $ | 1,803,730 | ||||||
| Total | $ | 6,350,098 | $ | 1,803,730 | ||||||||
Unfunded Commitments:
| Security | Value | Maturity Date | Unfunded Balance | |||||||
| AIS Holdco, LLC, Revolver | $ | (1,500 | ) | 05/21/2029 | $ | 100,000 | ||||
| CCMG Buyer, LLC, Revolver | (625 | ) | 05/08/2030 | 250,000 | ||||||
| Cor Leonis Limited, Revolver | 214,523 | 05/15/2028 | 368 | |||||||
| Dentive LLC, Delayed Draw Term Loan | 1,433,608 | 12/26/2028 | 1,645,500 | |||||||
| Enverus Holdings, Inc., Revolver | 4,068 | 12/12/2029 | 69,580 | |||||||
| Epilog Partners SPV III, LLC, Preferred | 3,580,632 | N/A | 260,647 | |||||||
| Expert Experience Credit Motors, LLC, Revolver | 4,958,139 | 03/29/2026 | 291,861 | |||||||
| Fortis Payment Systems, LLC, Delayed Draw Term Loan | 272,554 | 02/13/2026 | 351,563 | |||||||
| Highmount DP SPV, LLC | 2,321,429 | N/A | 2,678,571 | |||||||
| IDC Infusion Services, Inc., Delayed Draw Term Loan | 1,158 | 07/07/2028 | 133,117 | |||||||
| Lion FIV Debtco Limited, Revolver | 974,355 | 10/18/2024 | 761,820 | |||||||
| Morae Global Corporation, Revolver | (2,338 | ) | 10/26/2026 | 125,000 | ||||||
| Next Flight Ventures, Delayed Draw Term Loan | 107,485 | 12/26/2025 | 203,363 | |||||||
| PhyNet Dermatology LLC, Delayed Draw Term Loan | 2,534 | 10/20/2029 | 1,013,464 | |||||||
| PMP OPCO, LLC, Delayed Draw Term Loan | (11,419 | ) | 05/31/2029 | 1,312,500 | ||||||
| PMP OPCO, LLC, Revolver | (4,091 | ) | 05/31/2029 | 218,750 | ||||||
| RHF VI FUNDING LLC, Revolver | 4,750,000 | 11/19/2024 | 250,000 | |||||||
| RHF VIII Holdings LLC, Revolver | 2,950,000 | 07/02/2026 | 2,050,000 | |||||||
| Riddell Inc., Delayed Draw Term Loan | (1,018 | ) | 03/29/2029 | 90,909 | ||||||
| Riskonnect Parent LLC, Delayed Draw Term Loan | (2,000 | ) | 12/07/2028 | 5,000,000 | ||||||
| Royal Palm Equity Partners I L.P., Delayed Draw Term Loan | 8,366 | 10/24/2033 | 354,814 | |||||||
| Royal Palm Equity Partners I L.P., First Lien Term Loan | 1,673 | 10/24/2033 | 70,963 | |||||||
| South Florida ENT Associates, Delayed Draw Term Loan | 59,730 | 12/31/2025 | 107,744 | |||||||
| TA/WEG HOLDINGS, LLC, 2024 Delayed Draw Term Loan | 720,255 | 10/04/2027 | 1,743,593 | |||||||
| TA/WEG HOLDINGS, LLC, Revolver | - | 10/04/2027 | 207,900 | |||||||
| Tank Holding Corp., Revolver | 4,754 | 03/31/2028 | 1,997 | |||||||
| Taoglas Group Holdings Limited, Revolver | 72,976 | 02/28/2029 | 9,297 | |||||||
| Total | $ | 22,415,248 | $ | 19,303,321 | ||||||
| Total Unfunded Commitments | $ | 21,107,051 | ||||||||
See Notes to Consolidated Financial Statements.
| 22 | www.opportunisticcreditintervalfund.com |
| Opportunistic Credit Interval Fund | Consolidated Statement of Assets and Liabilities |
September 30, 2024
| ASSETS | ||||
| Investments, at value (Cost $131,688,097) | $ | 131,621,581 | ||
| Affiliated investments, at value (Cost $18,208,860) | 18,356,006 | |||
| Foreign cash, at value (Cost $15,249) | 16,974 | |||
| Interest and distributions receivable | 1,634,187 | |||
| Receivable for fund shares sold | 554,020 | |||
| Prepaid expenses and other assets | 390,846 | |||
| Total assets | $ | 152,573,614 | ||
| LIABILITIES | ||||
| Payable for investments purchased | 2,256,000 | |||
| USB Credit Facility | 3,562,086 | |||
| Interest and borrowing costs payable | 54,157 | |||
| Due to Custodian | 1,085 | |||
| Due to Adviser | 47,520 | |||
| Administration fees payable | 199,491 | |||
| Incentive fees payable | 491,584 | |||
| Transfer agency fees payable | 79,269 | |||
| Accrued expenses and other liabilities | 168,408 | |||
| Total liabilities | 6,859,600 | |||
| NET ASSETS | $ | 145,714,014 | ||
| NET ASSETS CONSISTS OF | ||||
| Paid-in capital | $ | 146,441,432 | ||
| Total distributable earnings | (727,418 | ) | ||
| NET ASSETS | $ | 145,714,014 | ||
| Common Shares: | ||||
| Institutional | ||||
| Net assets | $ | 145,714,014 | ||
| Shares of beneficial interest outstanding (no par value; unlimited shares) | 12,613,050 | |||
| Net asset value | $ | 11.55 | ||
See Notes to Consolidated Financial Statements.
| Annual Report | September 30, 2024 | 23 |
| Opportunistic Credit Interval Fund | Consolidated Statement of Operations |
For the Year Ended September 30, 2024
| INVESTMENT INCOME | ||||
| Interest – Affiliates | $ | 238,559 | ||
| Interest – Non-Affiliates | 9,137,498 | |||
| Dividends – Affiliates | 787,378 | |||
| Dividends – Non-Affiliates | 296,067 | |||
| Payment-in-kind interest – Affiliates | 362,697 | |||
| Payment-in-kind interest – Non-Affiliates | 1,212,298 | |||
| Other income | 438,108 | |||
| Total investment income | 12,472,605 | |||
| EXPENSES | ||||
| Investment advisory fees (Note 4) | 1,288,741 | |||
| Incentive fees (Note 4) | 1,162,184 | |||
| Administrative fees | 487,375 | |||
| Sub-administrative fees (Note 4) | 371,933 | |||
| Transfer agent fees | 304,310 | |||
| Interest expense and borrowing costs (Note 8) | 121,411 | |||
| Professional fees | 362,942 | |||
| Printing fees | 32,280 | |||
| Registration fees | 37,239 | |||
| Custody fees | 13,380 | |||
| Insurance expense | 163,408 | |||
| Trustee fees and expenses | 40,592 | |||
| Other expenses | 165,323 | |||
| Total expenses | 4,551,118 | |||
| Fees waived/expenses reimbursed by Adviser (Note 4) | (838,851 | ) | ||
| Total net expenses | 3,712,267 | |||
| NET INVESTMENT INCOME | 8,760,338 | |||
| REALIZED AND UNREALIZED GAIN/(LOSS) ON INVESTMENTS | ||||
| Net realized loss on investments – Non-Affiliates | (837,251 | ) | ||
| Net realized loss on investments – Affiliates | - | |||
| Net realized gain on foreign currency transactions | 18,869 | |||
| Total net realized loss | (818,382 | ) | ||
| Net change in unrealized depreciation on investments – Non-Affiliates | (743,982 | ) | ||
| Net change in unrealized appreciation on debt | (107,519 | ) | ||
| Net change in unrealized appreciation on investments – Affiliates | 118,422 | |||
| Net change in unrealized depreciation on translation of assets and liabilities in foreign currencies | (31 | ) | ||
| Total net change in unrealized depreciation | (733,110 | ) | ||
| NET REALIZED AND UNREALIZED LOSS ON INVESTMENTS | (1,551,492 | ) | ||
| NET INCREASE IN NET ASSETS RESULTING FROM OPERATIONS | $ | 7,208,846 | ||
See Notes to Consolidated Financial Statements.
| 24 | www.opportunisticcreditintervalfund.com |
| Opportunistic Credit Interval Fund | Consolidated Statements of Changes in Net Assets |
For the Year Ended September 30, 2024 | For the Year Ended September 30, 2023* | |||||||
| OPERATIONS | ||||||||
| Net investment income | $ | 8,760,338 | $ | 1,658,486 | ||||
| Net realized loss on investments | (837,251 | ) | 408,898 | |||||
| Net realized gain on foreign currency transactions | 18,869 | – | ||||||
| Net change in unrealized depreciation on investments | (625,560 | ) | 725,907 | |||||
| Net change in unrealized appreciation on debt | (107,519 | ) | – | |||||
| Net change in unrealized depreciation on translation of assets and liabilities in foreign currencies | (31 | ) | – | |||||
| Net increase in net assets resulting from operations | 7,208,846 | 2,793,291 | ||||||
| DISTRIBUTIONS TO SHAREHOLDERS | ||||||||
| From Distributable Earnings | ||||||||
| Institutional | (8,708,286 | ) | (1,944,979 | ) | ||||
| From return of capital: | ||||||||
| Institutional | (1,379,220 | ) | – | |||||
| Total distributions to shareholders | (10,087,506 | ) | (1,944,979 | ) | ||||
| COMMON SHARE TRANSACTIONS | ||||||||
| Institutional | ||||||||
| Proceeds from sales of shares | 118,846,338 | 34,341,560 | ||||||
| Distributions reinvested | 984,406 | 427,622 | ||||||
| Cost of shares redeemed | (9,133,342 | ) | (46,039 | ) | ||||
| Net increase from share transactions | 110,697,402 | 34,723,143 | ||||||
| Total net increase from net assets | 107,818,742 | 35,571,455 | ||||||
| NET ASSETS | ||||||||
| Beginning of year | 37,895,272 | 2,323,817 | ||||||
| End of year | $ | 145,714,014 | $ | 37,895,272 | ||||
| OTHER INFORMATION | ||||||||
| Common Shares Transactions | ||||||||
| Institutional | ||||||||
| Issued | 10,108,535 | 2,942,117 | ||||||
| Distributions reinvested | 84,977 | 38,178 | ||||||
| Redeemed | (786,520 | ) | (3,945 | ) | ||||
| Net increase in shares | 9,406,992 | 2,976,350 | ||||||
| * | These balances do not represent consolidated numbers. |
See Notes to Consolidated Financial Statements.
| Annual Report | September 30, 2024 | 25 |
| Opportunistic Credit Interval Fund | Consolidated Statement of Cash Flows |
For the Year Ended September 30, 2024
| CASH FLOWS FROM OPERATING ACTIVITIES: | ||||
| Net increase in net assets from operations | $ | 7,208,846 | ||
| Adjustments to reconcile net increase in net assets resulting from operations to net cash used in operating activities: | ||||
| Purchase of investment securities | (143,004,874 | ) | ||
| Proceeds from sale of investment securities | 17,203,234 | |||
| Purchase of short-term investment securities - net | 16,295,533 | |||
| Amortization of premium and accretion of discount on investments | (979,376 | ) | ||
| Payment-in-kind income | (1,574,995 | ) | ||
| Net realized (gain)/loss on: | ||||
| Investments | 818,382 | |||
| Net change in unrealized (appreciation)/depreciation on: | ||||
| Investments | 733,110 | |||
| (Increase)/Decrease in assets: | ||||
| Due from advisor | 196,349 | |||
| Interest and distributions receivable | (1,307,816 | ) | ||
| Prepaid expenses and other assets | (208,738 | ) | ||
| Increase/(Decrease) in liabilities: | ||||
| Due to Adviser | 47,520 | |||
| Interest and borrowing costs payable | 54,157 | |||
| Administration fees payable | 75,080 | |||
| Transfer agency fees payable | 79,269 | |||
| Due to custodian | 1,085 | |||
| Incentive fees payable | 453,187 | |||
| Accrued expenses and other liabilities | (170,104 | ) | ||
| Net cash used in operating activities | (104,080,151 | ) | ||
| CASH FLOWS FROM FINANCING ACTIVITIES: | ||||
| Proceeds from sales of shares | 118,860,162 | |||
| Cost of shares redeemed | (9,133,342 | ) | ||
| Borrowings on US Bank Line of Credit | 3,662,027 | |||
| Repayment on US Bank Line of Credit | (208,210 | ) | ||
| Cash distributions paid | (9,103,100 | ) | ||
| Net cash provided by financing activities | 104,077,537 | |||
| Net change in cash & cash equivalents | (2,614 | ) | ||
| Effect of exchange rate changes on cash | $ | 19,588 | ||
| Restricted and unrestricted cash, beginning of period | $ | – | ||
| Restricted and unrestricted cash, end of period | $ | 16,974 | ||
| SUPPLEMENTAL DISCLOSURE OF CASH FLOW INFORMATION | ||||
| Cash paid for interest: | $ | 67,254 | ||
| SUPPLEMENTAL DISCLOSURE OF NON-CASH INVESTING AND FINANCING TRANSACTIONS | ||||
| Reinvestment of distributions: | $ | 984,406 | ||
See Notes to Consolidated Financial Statements.
| 26 | www.opportunisticcreditintervalfund.com |
| Opportunistic Credit Interval Fund | Financial Highlights |
For a Share Outstanding Throughout the Periods Presented
Year Ended September 30, 2024 | Year Ended September 30, 2023 | For the Period Ended September 30, 2022(a) | ||||||||||
| NET ASSET VALUE, BEGINNING OF PERIOD | $ | 11.82 | $ | 10.12 | $ | 10.00 | ||||||
| INCOME/(LOSS) FROM INVESTMENT OPERATIONS | ||||||||||||
| Net investment income(b) | 1.04 | 1.49 | 0.05 | |||||||||
| Net realized and unrealized gain/(loss) on investments | (0.21 | ) | 1.48 | (c) | 0.07 | |||||||
| Total income from investment operations | 0.83 | 2.97 | 0.12 | |||||||||
| DISTRIBUTIONS TO SHAREHOLDERS | ||||||||||||
| From net investment income | (0.94 | ) | (1.27 | ) | – | |||||||
| From net realized gain on investments | – | – | – | |||||||||
| From return of capital | (0.16 | ) | – | – | ||||||||
| Total distributions | (1.10 | ) | (1.27 | ) | – | |||||||
| INCREASE/(DECREASE) IN NET ASSET VALUE | (0.27 | ) | 1.70 | 0.12 | ||||||||
| NET ASSET VALUE, END OF PERIOD | $ | 11.55 | $ | 11.82 | $ | 10.12 | ||||||
| TOTAL RETURN(d) | 7.32 | %(e) | 30.31 | %(e) | 1.20 | % | ||||||
| RATIOS AND SUPPLEMENTAL DATA | ||||||||||||
| Net assets, end of period (in 000s) | $ | 145,714 | $ | 37,895 | $ | 2,324 | ||||||
| RATIOS TO AVERAGE NET ASSETS(f) | ||||||||||||
| Including incentive fees, interest expense and interest amortization/accretion on securities sold short: | ||||||||||||
| Expenses, gross | 4.58 | % | 11.00 | % | 58.09 | %(g) | ||||||
| Expenses, net of fees waived/expenses reimbursed by Adviser | 3.74 | % | 2.80 | % | 2.50 | %(g) | ||||||
| Excluding incentive fees, interest expense and interest amortization/accretion on securities sold short: | ||||||||||||
| Expenses, gross | 3.34 | % | 10.70 | % | 58.09 | %(g) | ||||||
| Expenses, net of fees waived/expenses reimbursed by Adviser | 2.50 | % | 2.50 | % | 2.50 | %(g) | ||||||
| Net investment income | 8.84 | % | 12.79 | % | 2.24 | %(g) | ||||||
| PORTFOLIO TURNOVER RATE | 18 | % | 63 | % | 106 | %(g) | ||||||
| BORROWINGS AT END OF YEAR | ||||||||||||
| Aggregate amount outstanding (000s) | $ | 3,562 | – | – | ||||||||
| Asset coverage per $1,000 (000s) | $ | 41,907 | – | – |
| (a) | The Fund's Class I commenced operations on July 5, 2022. |
| (b) | Per share numbers have been calculated using the average shares method. |
| (c) | The amount shown for a share outstanding throughout the period is not indicative of the aggregate net realized and unrealized gain on investments for that period because of the timing of sales and repurchases of the Fund shares in relation to fluctuating market value of the investments in the Fund. |
| (d) | Total returns shown are historical in nature and assume changes in share price, reinvestment of dividends and capital gains distribution, if any. Had the Adviser not absorbed a portion of Fund expenses, total returns would have been lower. Returns shown exclude applicable sales charges. |
| (e) | Includes adjustments in accordance with accounting principles generally accepted in the United States of America and, as such, the net asset values for financial reporting purposes and the returns based upon those net asset values may differ from net asset values and returns for shareholder transactions. |
| (f) | Ratios do not include expenses of underlying investment companies and private investment funds in which the Fund invests. |
| (g) | Annualized. |
See Notes to Consolidated Financial Statements.
| Annual Report | September 30, 2024 | 27 |
| Opportunistic Credit Interval Fund | Notes to Consolidated Financial Statements |
September 30, 2024
1. ORGANIZATION
Opportunistic Credit Interval Fund (the “Fund”) is a closed-end, diversified management Investment Company that is registered under the Investment Company Act of 1940, as amended (the “1940 Act”). The Fund is structured as an interval fund and continuously offers its shares. The Fund was organized as a Delaware statutory trust on January 21, 2022. The Fund inception date was July 1, 2022 and commenced operations on July 5, 2022.
The Fund may issue an unlimited number of shares of beneficial interest. All shares of the Fund have equal rights and privileges. Each share of the Fund is entitled to one vote on all matters as to which shares are entitled to vote. In addition, each share of the Fund is entitled to participate, equally with other shares (i) in dividends and distributions declared by the Fund and (ii) upon liquidation, in the distribution of its proportionate share of the assets remaining after satisfaction of outstanding liabilities. Shares of the Fund are fully paid, non-assessable and fully transferable when issued and have no pre-emptive, conversion or exchange rights. Fractional shares have proportionately the same rights, including voting rights, as are provided for a full share. The Fund offers one class of shares: Class I shares.
The Fund’s investment objectives are to produce current income and capital appreciation. The Fund will seek to meet its investment objectives by investing primarily in credit-related instruments of North American and European issuers. The Fund defines credit-related instruments as debt, loans, loan participations, credit facility commitments, asset and lease pool interests, mortgage servicing rights, preferred shares, and swaps linked to credit-related instruments. The Fund’s investments will focus on privately originated credit investments as well as secondary credit investments. The Fund does not invest in instruments of emerging market issuers. The Fund will invest without restriction as to an instrument’s maturity, structure, seniority, interest rate formula, currency, and without restriction as to issuer capitalization or credit quality. Lower credit quality debt instruments, such as leveraged loans and high yield bonds, are commonly referred to as “junk” bonds. The Fund defines junk bonds as those rated lower than Baa3 by Moody’s Investors Services, Inc. (“Moody’s”) or lower than BBB by Standard and Poor’s Rating Group (“S&P”), or, if unrated, determined by the Adviser to be of similar credit quality.
Under normal circumstances, the Fund will invest at least 80% of its net assets, plus borrowings for investment purposes, in credit-related instruments. The Fund defines credit-related instruments as debt, loans, loan participations, credit facility commitments, asset and lease pool interests, mortgage servicing rights, preferred shares, and swaps linked to credit-related instruments.
Mount Logan Management LLC (the “Adviser”) serves as the Fund’s investment adviser.
On January 16, 2024, the Fund formed a wholly-owned taxable subsidiary, SOFIX Master Blocker, LLC (the “Taxable Subsidiary”), a Delaware limited liability company, which is taxed as a corporation for U.S. federal income tax purposes. The Taxable Subsidiary allows the Fund to make equity investments in companies organized as pass-through entities while continuing to satisfy the requirements of a Regulated Investment Company under Subchapter M of the Internal Revenue Code of 1986, as amended (the “Code”).
2. SIGNIFICANT ACCOUNTING POLICIES
The following is a summary of significant accounting policies followed by the Fund in preparation of its consolidated financial statements. These policies are in conformity with U.S. generally accepted accounting principles (“U.S. GAAP”). The Fund is an investment company and follows the accounting and reporting guidance under Financial Accounting Standards Board (“FASB”) Accounting Standards Codification (“ASC”) Topic 946, Financial Services – Investment Companies. These consolidated financial statements reflect adjustments that in the opinion of the Fund are necessary for the fair presentation of the financial position and results of operations as of and for the periods presented herein.
The Fund is considered an investment company for financial reporting purposes under U.S. GAAP and therefore applies the accounting and reporting guidance applicable to investment companies. The preparation of the consolidated financial statements requires management to make estimates and assumptions that affect the reported amounts of assets and liabilities and disclosure of contingent assets and liabilities at the date of the financial statements and the reported amounts of income and expenses for the year. Actual results could differ from those estimates, and such difference could be material. In accordance with U.S. GAAP guidance on consolidation, the Fund will generally not consolidate its investment in a portfolio company other than an investment company subsidiary or a controlled operating company whose business consists of providing services to the Fund. Accordingly, the Fund consolidated the accounts of the Fund’s wholly-owned subsidiary, the Taxable Subsidiary, in its consolidated financial statements. All significant intercompany balances and transactions have been eliminated in consolidation. All references made to the “Fund” herein include Opportunistic Credit Interval Fund and its consolidated subsidiary, except as stated otherwise.
Securities Transactions and Investment Income – Investment transactions are recorded on the trade date. Realized gains or losses on investments are calculated using the specific identification method for both financial statement and federal income tax purposes. Dividend income is recorded on the ex-dividend date and interest income is recorded on an accrual basis. Premiums on securities are amortized to the earliest call date and purchase discounts are accreted over the life of the respective securities using the effective interest method.
| 28 | www.opportunisticcreditintervalfund.com |
| Opportunistic Credit Interval Fund | Notes to Consolidated Financial Statements |
September 30, 2024
Loans are generally placed on non-accrual status when there is reasonable doubt that principal or interest will be collected in full. The Fund considers many factors relevant to an investment when placing it on or removing it from non-accrual status including, but not limited to, the delinquency status of the investment, economic and business conditions, the overall financial condition of the underlying investment, the value of the underlying collateral, bankruptcy status, if any, and any other facts or circumstances relevant to the investment. Accrued interest is generally reversed when a loan is placed on non-accrual status. Payments received on non-accrual loans may be recognized as income or applied to principal depending upon management’s judgment regarding collectability of the outstanding principal and interest. Generally non-accrual loans may be restored to accrual status when past due principal and interest is paid current and are likely to remain current based on management’s judgment.
Securities Valuation – Securities listed on an exchange are valued at the last reported sale price at the close of the regular trading session of the exchange on the business day the value is being determined, or in the case of securities listed on NASDAQ, at the NASDAQ Official Closing Price. In the absence of a sale, such securities shall be valued at the mid-price. Short-term investments that mature in 60 days or less may be valued at amortized cost, provided such valuations represent fair value. Investments in money market funds are valued at their respective net asset value (“NAV”).
Structured credit and other similar debt securities including, but not limited to, collateralized loan obligations (“CLO”) debt and equity securities, asset-backed securities (“ABS”), commercial mortgage-backed securities (“CMBS”) and other securitized investments backed by certain debt or other receivables (collectively, “Structured Credit Securities”), are valued on the basis of valuations provided by dealers in those instruments and/or independent pricing services recommended by the Adviser and approved by the Fund’s board of trustees (the "Board", "Trustees", or "Board of Trustees"). In determining fair value, dealers and pricing services will generally use information with respect to transactions in the securities being valued, quotations from other dealers, market transactions in comparable securities, analyses and evaluations of various relationships between securities and yield to maturity information. The Adviser will, based on its reasonable judgment, select the dealer or pricing service quotation that most accurately reflects the fair market value of the Structured Credit Security while taking into account the information utilized by the dealer or pricing service to formulate the quotation in addition to any other relevant factors. In the event that there is a material discrepancy between quotations received from third-party dealers or the pricing services, the Adviser may (i) use an average of the quotations received or (ii) select an individual quotation that the Adviser, based upon its reasonable judgment, determines to be reasonable.
When price quotations for certain securities are not readily available, or if the available quotations are not believed to be reflective of market value by the Adviser, those securities will be valued at fair value as determined in good faith by the Adviser in its capacity as the Board of Trustees’ valuation designee pursuant to Rule 2a-5 under the 1940 Act. As fair valuation involves subjective judgments, the Fund cannot ensure that fair values determined by the Board or persons acting in their direction would accurately reflect the price that the Fund could obtain for a security if the security was sold. As the valuation designee, the Adviser acts under the Board of Trustees’ oversight. The Adviser’s fair valuation policies and procedures are approved by the Board of Trustees.
Fair valuation procedures may be used to value a substantial portion of the assets of the Fund. The Fund may use the fair value of a security to calculate its NAV when, for example, (1) a portfolio security is not traded in a public market or the principal market in which the security trades is closed, (2) trading in a portfolio security is suspended and not resumed prior to the normal market close, (3) a portfolio security is not traded in significant volume for a substantial period, or (4) the Adviser determines that the quotation or price for a portfolio security provided by a broker-dealer or independent pricing service is inaccurate.
The fair value of securities may be difficult to determine and thus judgment plays a greater role in the valuation process. The fair valuation methodology may include or consider the following guidelines, as appropriate: (1) evaluation of all relevant factors, including but not limited to, pricing history, current market level and supply and demand of the respective security; (2) comparison to the values and current pricing of securities that have comparable characteristics; (3) knowledge of historical market information with respect to the security; and (4) other factors relevant to the security which would include, but not be limited to, duration, yield, fundamental analytical data, the Treasury yield curve and credit quality.
Valuation of Private Investment Funds – The Fund invests a portion of its assets in private investment funds (“Private Investment Funds”). Private Investment Funds, including an investment in Great Lakes Funding II LLC (“Great Lakes II Joint Venture”), value their investment assets at fair value and generally report a NAV or its equivalent in accordance with U.S. GAAP on a calendar quarter basis. The Fund has elected to apply the practical expedient and to value its investments in Private Investment Funds at their respective NAVs at each quarter-end in accordance with U.S. GAAP. For non-calendar quarter-end days, the Valuation Committee estimates the fair value of each Private Investment Fund by adjusting the most recent NAV for such Private Investment Fund, as necessary, by the change in a relevant benchmark that the Valuation Committee has deemed to be representative of the underlying securities in the Private Investment Fund.
Loan Participation and Assignments – The Fund invests in debt instruments, which are interests in amounts owed to lenders (the “Lenders”) by corporate, governmental or other borrowers. The Fund’s investments in loans may be in the form of direct investments, loans originated by the Fund, participations in loans or assignments of all or a portion of the loans from third parties or exposure to investments in loans through investment in Private Investment Funds or other pooled investment vehicles. When the Fund purchases an interest in a loan in the form of an assignment, the Fund acquires all of the direct rights and obligations of a lender (as such term is defined in the related credit agreement), including the right to vote on amendments or waivers of such credit agreement. However, the Fund generally has no right to enforce compliance with the terms of the loan agreement with the borrower. Instead, the administration of the loan agreement is often performed by a bank or other financial institution (the “Agent”) that acts as agent for the Lenders. Circumstances may arise in connection with which the Agent takes action that contradicts the will of the Lenders. For example, under certain circumstances, an Agent may refuse to declare the borrower in default, despite having received a notice of default from the Lenders. When the Fund purchases an interest in a loan in the form of a participation, the Fund purchases such participation interest from another existing Lender, and consequently, the Fund does not obtain the rights and obligations of the Lenders under the credit agreement, such as the right to vote on amendments or waivers. The Fund has the right to receive payments of principal, interest and any fees to which it is entitled only from the Lender from which the Fund has received that participation interest. In this instance, the Fund is subject to both the credit risk of the borrower and the credit risk of the Lender that sold the Fund such participation interest.
| Annual Report | September 30, 2024 | 29 |
| Opportunistic Credit Interval Fund | Notes to Consolidated Financial Statements |
September 30, 2024
Unfunded Commitments – The Fund may enter into unfunded loan commitments, which are contractual obligations for future funding, such as delayed draw term loans or revolving credit arrangements. Unfunded loan commitments represent a future obligation in full, even though a percentage of the notional loan amounts may not be utilized by the borrower. The Fund may receive a commitment fee based on the undrawn portion of the underlying line of credit portion of a floating rate loan.
Additionally, when the Fund invests in a Private Investment Fund, the Fund makes a commitment to invest a specified amount of capital in the applicable Private Investment Fund. The capital commitment may be drawn by the general partner of the Private Investment Fund either all at once or through a series of capital calls at the discretion of the general partner. The unfunded commitment represents the portion of the Fund’s overall capital commitment to a particular Private Investment Fund that has not yet been called by the general partner of the Private Investment Fund.
As of September 30, 2024, the Fund had unfunded commitments of $21,107,051.
Short Sales – The Fund may sell securities short. To do this the Fund will borrow and then sell (take short positions in) securities. To complete such a transaction, the Fund must borrow the security to deliver to the buyer. The Fund is then obligated to replace, or cover, the security borrowed by purchasing it in the open market at some later date. The Fund will generally have to pay a fee or premium to borrow a security and be obligated to repay the lender any dividend or interest that accrues on those securities during the period of the loan. The Fund bears the risk of a loss, unlimited in size, if the market price of the security increases between the date of the short sale and the date on which the Fund replaces the borrowed security. The Fund will realize a gain, limited to the price that the Fund sold the security short, if the security declines in value between those dates. There can be no assurance that securities necessary to cover a short position will be available for purchase. To mitigate leverage risk, the Fund will segregate liquid assets (which may include its long positions) at least equal to its short position exposure, marked-to-market daily.
Foreign Currency – Investment securities and other assets and liabilities denominated in foreign currencies are translated into U.S. dollar amounts at the date of valuation. Purchases and sales of investment securities and income and expense items denominated in foreign currencies are translated into U.S. dollar amounts on the respective dates of such transactions. The Fund does not isolate that portion of the results of operations resulting from changes in foreign exchange rates on investments from the fluctuations arising from changes in market prices of securities held. Such fluctuations are included with the net realized and unrealized gain or loss from investments. Reported net realized foreign exchange gains or losses arise from sales of foreign currencies, currency gains or losses realized between the trade and settlement dates on securities transactions, and the difference between the amounts of dividends, interest, and foreign withholding taxes recorded on the Fund's books and the U.S. dollar equivalent of the amounts actually received or paid. Net unrealized foreign exchange gains and losses arise from changes in the fair values of assets and liabilities, other than investments in securities at fiscal period end, resulting from changes in exchange rates.
Fair Value Measurements – A three-tier hierarchy has been established to classify fair value measurements for disclosure purposes. Inputs refer broadly to the assumptions that market participants would use in pricing the asset or liability, including assumptions about risk. Inputs may be observable or unobservable. Observable inputs are inputs that reflect the assumptions market participants would use in pricing the asset or liability that are developed based on market data obtained from sources independent of the reporting entity. Unobservable inputs are inputs that reflect the reporting entity’s own assumptions about the assumptions market participants would use in pricing the asset or liability that are developed based on the best information available. In accordance with U.S. GAAP guidance on fair value measurements and disclosure, the Fund discloses the fair value of its investments in a hierarchy that categorizes the inputs to valuation techniques used to measure the fair value.
| 30 | www.opportunisticcreditintervalfund.com |
| Opportunistic Credit Interval Fund | Notes to Consolidated Financial Statements |
September 30, 2024
Various inputs are used in determining the fair value of the Fund’s investments. These inputs are categorized in the following hierarchy under applicable accounting guidance:
| Level 1 – | Unadjusted quoted prices in active markets for identical, unrestricted assets or liabilities that the Fund has the ability to access at the measurement date; |
| Level 2 – | Quoted prices in markets that are not active, or quoted prices for similar assets or liabilities in active markets, or inputs other than quoted prices that are observable (either directly or indirectly) for substantially the full term of the asset or liability at the measurement date; and |
| Level 3 – | Significant unobservable prices or inputs (including the Fund’s own assumptions in determining the fair value of investments) where there is little or no market activity for the asset or liability at the measurement date. |
The availability of observable inputs can vary from security to security and is affected by a wide variety of factors, including, for example, the type of security, whether the security is new and not yet established in the marketplace, the liquidity of markets and other characteristics particular to the security. To the extent that valuation is based on models or inputs that are less observable or unobservable in the market, the determination of fair value requires more judgment. Accordingly, the degree of judgment exercised in determining fair value is greatest for instruments categorized in Level 3.
An investment level within the fair value hierarchy is based on the lowest level input, individually or in the aggregate, that is significant to fair value measurement. The valuation techniques used by the Fund to measure fair value maximizes the use of observable inputs and minimizes the use of unobservable inputs.
The inputs or methodologies used for valuing securities are not necessarily an indication of the risk or liquidity associated with investing in those securities. The following is a summary of the fair values according to the inputs used in valuing the Fund’s investments as of September 30, 2024:
| Investments in Securities at Value | Level 1 | Level 2 | Level 3 | Total | ||||||||||||
| Bank Loans(a) | ||||||||||||||||
| Communication Services | $ | – | $ | – | $ | 9,653,748 | $ | 9,653,748 | ||||||||
| Consumer Discretionary | – | – | 2,803,079 | 2,803,079 | ||||||||||||
| Consumer Staples | – | – | 13,013,365 | 13,013,365 | ||||||||||||
| Financials | – | – | 34,448,748 | 34,448,748 | ||||||||||||
| Health Care | – | – | 12,446,560 | 12,446,560 | ||||||||||||
| Industrials | – | – | 12,367,833 | 12,367,833 | ||||||||||||
| Information Technology | – | – | 23,501,624 | 23,501,624 | ||||||||||||
| Real Estate | – | – | 4,750,000 | 4,750,000 | ||||||||||||
| Bonds & Notes(a) | ||||||||||||||||
| Asset Backed Securities | – | – | 340,651 | 340,651 | ||||||||||||
| Corporate Bonds | – | – | 6,806,755 | 6,806,755 | ||||||||||||
| Equipment Financing(a) | – | – | 2,912,560 | 2,912,560 | ||||||||||||
| Common Equity(a) | ||||||||||||||||
| Communication Services | – | – | 5,593 | 5,593 | ||||||||||||
| Consumer Discretionary | – | – | 975,000 | 975,000 | ||||||||||||
| Information Technology | – | – | – | – | ||||||||||||
| Preferred Stock(a) | ||||||||||||||||
| Communication Services | – | – | 2,321,429 | 2,321,429 | ||||||||||||
| Consumer Discretionary | – | – | 8,695,136 | 8,695,136 | ||||||||||||
| Health Care | – | – | 3,580,632 | 3,580,632 | ||||||||||||
| Warrants(a) | – | – | 245,834 | 245,834 | ||||||||||||
| Short-Term Investment(a) | 4,758,942 | – | – | 4,758,942 | ||||||||||||
| TOTAL | $ | 4,758,942 | $ | – | $ | 138,868,547 | $ | 143,627,489 | ||||||||
| Investments measured at net asset value(a) | $ | 6,350,098 | ||||||||||||||
| Total Investments, at fair value | $ | 149,977,587 | ||||||||||||||
| (a) | For detailed descriptions, see the accompanying Consolidated Schedule of Investments. |
| Annual Report | September 30, 2024 | 31 |
| Opportunistic Credit Interval Fund | Notes to Consolidated Financial Statements |
September 30, 2024
The following table provides a reconciliation of the beginning and ending balances of investments for which the Fund has used Level 3 inputs to determine the fair value:
Investments in Securities at Value | Balance as of September 30, 2023 | Accrued Discount/ premium | Realized Gain/(Loss) | Change in Unrealized Appreciation/ Depreciation | Purchases | Sales Proceeds | Transfer into Level 3 | Transfer Out of Level 3 | Balance as of September 30, 2024 | Net change in unrealized appreciation/ (depreciation) Included in the Statement of Operations | ||||||||||||||||||||||||||||||
| Bank Loans | ||||||||||||||||||||||||||||||||||||||||
| Communication Services | $ | 1,490,849 | $ | 66,931 | $ | – | $ | 22,786 | $ | 8,502,521 | $ | (429,339 | ) | $ | – | $ | – | $ | 9,653,748 | $ | 22,786 | |||||||||||||||||||
| Consumer Discretionary | – | 3,274 | – | (11,066 | ) | 2,822,235 | (11,364 | ) | – | – | 2,803,079 | (11,066 | ) | |||||||||||||||||||||||||||
| Consumer Staples | 1,568,658 | 139,371 | – | (120,791 | ) | 11,564,764 | (138,637 | ) | – | – | 13,013,365 | (120,791 | ) | |||||||||||||||||||||||||||
| Financials | 1,236,945 | 170,330 | 349 | (234,373 | ) | 37,624,895 | (4,349,398 | ) | – | – | 34,448,748 | (234,373 | ) | |||||||||||||||||||||||||||
| Health Care | 1,008,913 | 17,541 | – | 67,439 | 11,589,928 | (237,261 | ) | – | – | 12,446,560 | 67,439 | |||||||||||||||||||||||||||||
| Industrials | 2,121,634 | 30,297 | (502,030 | ) | 60,839 | 12,749,079 | (2,091,986 | ) | – | – | 12,367,833 | 60,839 | ||||||||||||||||||||||||||||
| Information Technology | 13,745,594 | 459,854 | (93,141 | ) | (413,858 | ) | 17,775,998 | (7,972,823 | ) | – | – | 23,501,624 | (440,113 | ) | ||||||||||||||||||||||||||
| Real Estate | – | – | – | – | 4,750,000 | – | – | – | 4,750,000 | – | ||||||||||||||||||||||||||||||
| Bonds & Notes | ||||||||||||||||||||||||||||||||||||||||
| Asset Backed Securities | 439,310 | 90,853 | – | (91,164 | ) | – | (98,348 | ) | – | – | 340,651 | (91,164 | ) | |||||||||||||||||||||||||||
| Corporate Bonds | – | – | – | – | 7,000,000 | (193,245 | ) | – | – | 6,806,755 | – | |||||||||||||||||||||||||||||
| Equipment Financing | – | – | – | – | 3,645,509 | (732,949 | ) | – | – | 2,912,560 | – | |||||||||||||||||||||||||||||
| Preferred Stock | ||||||||||||||||||||||||||||||||||||||||
| Communication Services | – | – | – | – | 2,321,429 | – | – | – | 2,321,429 | – | ||||||||||||||||||||||||||||||
| Consumer Discretionary | – | 925 | – | (103,363 | ) | 8,797,574 | – | – | – | 8,695,136 | (103,363 | ) | ||||||||||||||||||||||||||||
| Health Care | – | – | – | 61,279 | 3,519,353 | – | – | – | 3,580,632 | 61,279 | ||||||||||||||||||||||||||||||
| Common Equity | ||||||||||||||||||||||||||||||||||||||||
| Communication Services | – | – | – | (4,214 | ) | 9,807 | – | – | – | 5,593 | (4,214 | ) | ||||||||||||||||||||||||||||
| Consumer Discretionary | 1,250,000 | – | – | (275,000 | ) | – | – | – | – | 975,000 | (275,000 | ) | ||||||||||||||||||||||||||||
| Industrials | 177,115 | – | (242,429 | ) | 65,314 | – | – | – | – | – | 65,314 | |||||||||||||||||||||||||||||
| Warrants | – | – | – | 193,639 | 52,195 | – | – | – | 245,834 | 193,639 | ||||||||||||||||||||||||||||||
| Derivatives | – | – | – | – | – | – | – | – | – | – | ||||||||||||||||||||||||||||||
| Total | $ | 23,039,018 | $ | 979,376 | (837,251 | ) | $ | (782,533 | ) | $ | 132,725,287 | $ | (16,255,350 | ) | $ | – | $ | – | $ | 138,868,547 | $ | (808,788 | ) | |||||||||||||||||
| 32 | www.opportunisticcreditintervalfund.com |
| Opportunistic Credit Interval Fund | Notes to Consolidated Financial Statements |
September 30, 2024
There are significant unobservable valuation inputs for material Level 3 investments, and a change to the unobservable input may result in a significant change to the value of the investment. Level 3 investment valuation techniques and inputs as of September 30, 2024 are as follows:
| Quantitative Information about Level 3 Fair Value Measurements | ||||||||||||
| Asset Category | Fair Value at September 30, 2024 | Valuation Technique | Unobservable Input(a) | Range of Input (Weighted Average)(b) | ||||||||
| Bank Loan | ||||||||||||
| Communication Services | $ | 2,840,777 | Discounted Cash Flows | Market Yield | 11.7% - 12.8% (12.2%) | |||||||
| Communication Services | 6,812,971 | Market | Broker/Dealer Quotes | N/A | ||||||||
| Consumer Discretionary | 886,655 | Discounted Cash Flows | Market Yield | 9.6% - 9.6% (9.6%) | ||||||||
| Consumer Discretionary | 1,916,424 | Recent Transaction | Transaction Price | $1.0 - $1.0 ($1.0) | ||||||||
| Consumer Staples | 6,431,706 | Market | Broker/Dealer Quotes | N/A | ||||||||
| Consumer Staples | 5,898,035 | Recent Transaction | Transaction Price | $1.0 - $1.0 ($1.0) | ||||||||
| Consumer Staples | 683,624 | Waterfall Analysis | LTM / NCY Revenue Multiple | 0.4x - 0.4x (0.4x) | ||||||||
| Financials | 17,443,121 | Discounted Cash Flows | Market Yield | 8.6% - 27.3% (16.4%) | ||||||||
| Financials | 14,055,627 | Market | Broker/Dealer Quotes | N/A | ||||||||
| Financials | 2,950,000 | Recent Transaction | Transaction Price | $1.0 - $1.0 ($1.0) | ||||||||
| Health Care | 10,478,929 | Discounted Cash Flows | Market Yield | 6.8% - 11.8% (9.7%) | ||||||||
| Health Care | 1,967,631 | Market | Broker/Dealer Quotes | N/A | ||||||||
| Industrials | 9,933,714 | Discounted Cash Flows | Market Yield | 6.1% - 17.4% (11.8%) | ||||||||
| Industrials | 2,434,119 | Market | Broker/Dealer Quotes | N/A | ||||||||
| Information Technology | 4,131,794 | Discounted Cash Flows | Market Yield | 8.2% - 17.6% (11.2%) | ||||||||
| Information Technology | 794,489 | Enterprise Market Value | Expected Sales Proceeds | $90.3 - $90.3 ($90.3) | ||||||||
| EBITDA Multiple | 12.0x - 12.0x (12.0x) | |||||||||||
| Information Technology | 18,575,341 | Market | Broker/Dealer Quotes | N/A | ||||||||
| Real Estate | 4,750,000 | Discounted Cash Flows | Market Yield | 11.7% - 11.7% (11.7%) | ||||||||
| Bonds & Notes | ||||||||||||
| Asset Backed Securities | 340,651 | Discounted Cash Flows | Market Yield | 22.1% - 22.1% (22.1%) | ||||||||
| Corporate Bonds | 6,806,755 | Recent Transaction | Transaction Price | $1.0 - $1.0 ($1.0) | ||||||||
| Common Equity | ||||||||||||
| Communication Services | 5,593 | Enterprise Market Value | EBITDA Multiple | 2.0x - 2.0x (2.0x) | ||||||||
| Consumer Discretionary | 975,000 | Enterprise Market Value | EBITDA Multiple | 7.2x - 7.2x (7.2x) | ||||||||
| Information Technology | - | Enterprise Market Value | Expected Sales Proceeds | $90.3 - $90.3 ($90.3) | ||||||||
| EBITDA Multiple | 12.0x - 12.0x (12.0x) | |||||||||||
| Equipment Financing | 2,912,560 | Discounted Cash Flows | Market Yield | 10.8% - 10.8% (10.8%) | ||||||||
| Preferred Stock | ||||||||||||
| Communication Services | 2,321,429 | Discounted Cash Flows | Market Yield | 8.2% - 8.2% (8.2%) | ||||||||
| Consumer Discretionary | 8,695,136 | Enterprise Value | Stock Price | $98.8 - $2,140.0 ($1,328.7) | ||||||||
| Time | 4.5 - 5.2 (4.8) | |||||||||||
| Volatility | 50.0% - 58.6% (53.4%) | |||||||||||
| Health Care | 3,580,632 | Enterprise Market Value | EBITDA Multiple | 13.0x - 13.0x (13.0x) | ||||||||
| Warrants | 78,792 | Enterprise Market Value | EBITDA Multiple | 5.5x - 5.5x (5.5x) | ||||||||
| 167,042 | Enterprise Value | Stock Price | $88.64 - $88.64 ($88.64) | |||||||||
| Time | 5.2 - 5.2 (5.2) | |||||||||||
| Volatility | 58.6% - 58.6% (58.6%) | |||||||||||
| Total Level 3 investments | $ | 138,868,547 | ||||||||||
| (a) | An increase in market yield would result in a decrease in fair value. A decrease in market yield would result in an increase in fair value. An increase in the transaction price would result in an increase in fair value. A decrease in the transaction price would result in a decrease in fair value. An increase in the EBITDA multiple would result in an increase in fair value. A decrease in the EBITDA multiple would result in a decrease in fair value. |
| (b) | The weighted averages disclosed in the table above were weighted by their relative fair value |
Concentration of Credit Risk – The Fund places its cash with one banking institution, which is insured by the Federal Deposit Insurance Corporation (“FDIC”). The FDIC limit is $250,000. At various times throughout the year, the amount on deposit may exceed the FDIC limit and subject the Fund to a credit risk.
Federal and Other Taxes – No provision for income taxes, except for the Taxable Subsidiary, is included in the accompanying financial statements. The Fund intends to distribute to shareholders all taxable investment income and realized gains and otherwise comply with Subchapter M of the Internal Revenue Code of 1986, as amended (the “Code”), applicable to regulated investment companies.
| Annual Report | September 30, 2024 | 33 |
| Opportunistic Credit Interval Fund | Notes to Consolidated Financial Statements |
September 30, 2024
The Fund evaluates tax positions taken (or expected to be taken) in the course of preparing the Fund’s tax provisions to determine whether these positions meet a “more-likely-than-not” standard that, based on the technical merits, have a more than fifty percent likelihood of being sustained by a taxing authority upon examination. A tax position that meets the “more-likely-than-not” recognition threshold is measured to determine the amount of benefit to recognize in the consolidated financial statements.
As of and during the period ended September 30, 2024, the Fund did not have a liability for any unrecognized tax benefits. The Fund and the Taxable Subsidiary file U.S. federal, state and local tax returns as required. The Fund’s tax returns are subject to examination by the relevant tax authorities until expiration of the applicable statute of limitations, which is generally three years after the filing of the tax return for federal purposes and four years for most state returns. Tax returns for open years have incorporated no uncertain tax positions that require a provision for income taxes.
The Taxable Subsidiary records deferred tax assets or liabilities related to temporary book versus tax differences on the income or loss generated by the underlying equity investments held by the Taxable Subsidiary.
Distributions to Shareholders – Distributions from net investment income, if any, are declared and paid quarterly. Distributions from net realized capital gains, if any, are declared and paid annually and are recorded on the ex-dividend date. The character of income and gains to be distributed is determined in accordance with income tax regulations, which may differ from U.S. GAAP.
Indemnification – The Fund indemnifies its officers and Trustees for certain liabilities that may arise from the performance of their duties to the Fund. Additionally, in the normal course of business, the Fund enters into contracts that contain a variety of representations and warranties and which provide general indemnities. The Fund’s maximum exposure under these arrangements is unknown, as this would involve future claims that may be made against the Fund that have not yet occurred. However, based on industry experience, the Fund expects the risk of loss due to these warranties and indemnities to be remote.
3. GREAT LAKES FUNDING II LLC
In August 2022, the Fund invested in Series A of Great Lakes Funding II LLC (the “Great Lakes II Joint Venture”), a joint venture with an investment strategy to underwrite and hold senior, secured unitranche loans made to middle-market companies. The Fund treats its investment in the Great Lakes II Joint Venture as a joint venture since an affiliate of the Adviser controls a 50% voting interest in the Great Lakes II Joint Venture.
The Great Lakes II Joint Venture is a Delaware series limited liability company, and pursuant to the terms of the Great Lakes Funding II LLC Limited Liability Company Agreement (the “Great Lakes II LLC Agreement”), prior to the end of the investment period with respect to each series established under the Great Lakes II LLC Agreement, each member of the predecessor series would be offered the opportunity to roll its interests into any subsequent series of the Great Lakes II Joint Venture. The Fund does not pay any advisory fees in connection with its investment in the Great Lakes II Joint Venture. Certain other funds managed by the Adviser or its affiliates have also invested in the Great Lakes II Joint Venture.
The fair value of the Fund’s investment in the Great Lakes II Joint Venture as of September 30, 2024 was $6,350,098. Fair value has been determined utilizing the practical expedient in accordance with U.S. GAAP. Pursuant to the terms of the Great Lakes II LLC Agreement, the Fund generally may not affect any direct or indirect sale, transfer, assignment, hypothecation, pledge or other disposition of or encumbrance upon its interests in the Great Lakes II Joint Venture, except that the Fund may sell or otherwise transfer its interests with the consent of the managing members of the Great Lakes II Joint Venture or to an affiliate or a successor to substantially all of the assets of the Fund.
As of September 30, 2024, the Fund had a $1,803,730 unfunded commitment to the Great Lakes II Joint Venture.
4. ADVISORY FEES AND OTHER TRANSACTIONS WITH SERVICE PROVIDERS
Advisory Fees – On May 14, 2022, the Fund entered into a management agreement (the “Management Agreement”) with the Adviser. Under the terms of the Management Agreement, the Adviser provides certain investment advisory and administrative services to the Fund and in consideration of the advisory services provided, the Adviser is entitled to a fee consisting of two components — a base management fee and an incentive fee, or collectively "investment advisory fees".
The base management fee is payable monthly in arrears at an annual rate of 1.25% of the average daily gross assets of the Fund. For the year ended September 30, 2024, the Fund incurred $1,288,741 in base management fees.
The incentive fee is calculated and payable quarterly in arrears based upon the Fund’s “pre-incentive fee net investment income” for the immediately preceding quarter and is subject to a hurdle rate, expressed as a rate of return on the Fund’s “adjusted capital,” equal to 1.50% per quarter (or an annualized hurdle rate of 6.0%), subject to a “catch-up” feature. For this purpose, “pre-incentive fee net investment income” means interest income, dividend income and any other income accrued during the calendar quarter, less the Fund’s operating expenses for the quarter (including the management fee, expenses reimbursed to the Adviser and any interest expenses and distributions paid on any issued and outstanding preferred shares, but excluding the incentive fee). Pre-incentive fee net investment income includes, in the case of investments with a deferred interest feature (such as OID, debt instruments with paid-in-kind (“PIK”) interest and zero coupon securities), accrued income that the Fund has not yet received in cash. Pre-incentive fee net investment income does not include any realized capital gains, realized capital losses or unrealized capital appreciation or depreciation. “Adjusted capital” means the cumulative gross proceeds received by the Fund from the sale of shares (including pursuant to the Fund’s distribution reinvestment plan), reduced by amounts paid in connection with purchases of shares pursuant to the Fund’s share repurchase program.
| 34 | www.opportunisticcreditintervalfund.com |
| Opportunistic Credit Interval Fund | Notes to Consolidated Financial Statements |
September 30, 2024
No incentive fee is payable in any calendar quarter in which the Fund’s pre-incentive fee net investment income does not exceed the quarterly hurdle rate of 1.50%. For any calendar quarter in which the Fund’s pre-incentive fee net investment income is greater than the hurdle rate, but less than or equal to 1.7647%, the incentive fee will equal the amount of the Fund’s pre-incentive fee net investment income in excess of the hurdle rate. This portion of the Fund’s pre-incentive fee net investment income which exceeds the hurdle rate but is less than or equal to 1.7647% is referred to as the “catch-up.” The “catch-up” provision is intended to provide the Adviser with an incentive fee of 15.0% on all of the Fund’s pre-incentive fee net investment income when the Fund’s pre-incentive fee net investment income reaches 1.7647% in any calendar quarter. For any calendar quarter in which the Fund’s pre-incentive fee net investment income exceeds 1.7647% of adjusted capital, the incentive fee will equal 15.0% of pre-incentive fee net investment income. For the year ended September 30, 2024, the Advisor earned an incentive fee of $1,162,184.
Under the Expense Limitation Agreement, dated May 14, 2022, the Adviser has contractually agreed to waive all or part of its management fees (excluding any incentive fee) and/or make payments to limit Fund expenses (excluding incentive fees, all borrowing costs, dividends, amortization/accretion and interest on securities sold short, brokerage commissions, acquired fund fees and expenses and extraordinary expenses) at least until February 1, 2025, such that the total annual operating expenses of the Fund do not exceed 2.50% per annum of the Class I average daily net assets. Fee waivers and expense payments may be recovered by the Adviser from the Fund, for a period of up to three years following the date of waiver or expense payment, if the Fund is able to make the repayment without exceeding the expense limitation in place at the time of waiver and the current expense limitation and the repayment is approved by the Board. For the year ended September 30, 2024, the Adviser waived fees of $838,851.
As of September 30, 2024, the following amounts that may be subject to reimbursement to the Adviser based upon their potential expiration dates:
| 2025 | 2026 | 2027 | |
| $199,001 | $1,063,097 | $838,851 |
Fund Administration and Accounting Fees and Expenses - BC Partners Management LLC (the “Administrator”), an affiliate of the Adviser, serves as administrator to the Fund. Pursuant to the Administration Agreement between the Administrator and the Fund, the Administrator furnishes the Fund with office facilities, equipment and clerical, bookkeeping and record keeping services at such facilities. Under the Administration Agreement, the Administrator also performs, or oversees the performance of, the Fund’s required administrative services, which include, among other things, being responsible for the financial records that the Fund is required to maintain and preparing reports to our shareholders. In addition, the Administrator assists the Fund in determining and publishing its net asset value, oversees the preparation and filing of the Fund’s tax returns and the printing and dissemination of reports to the Fund’s shareholders, and generally oversees the payment of Fund expenses and the performance of administrative and professional services rendered to the Fund by others. Payments under the Administration Agreement are equal to an amount based upon the Fund’s allocable portion of the Administrator’s overhead in performing its obligations under the Administration Agreement, including rent, the fees and expenses associated with performing compliance functions and the Fund’s allocable portion of the compensation of the Fund’s chief financial officer, chief compliance officer and the Fund’s allocable portion of the compensation of their respective administrative support staff. The Administration Agreement may be terminated by either party without penalty upon 60 days’ written notice to the other party. To the extent that the Administrator outsources any of its functions, the Fund will pay the fees associated with such functions on a direct basis without any incremental profit to the Administrator. During the year ended September 30, 2024, the Fund accrued $487,375 for administration fees pursuant to the Administration Agreement.
ALPS Fund Services, Inc. (“ALPS”) serves as sub-administrator to the Fund. During the year ended September 30, 2024, the Fund accrued $371,933 for sub-administration fees payable to ALPS.
Transfer Agent – SS&C Global Investor & Distribution Solutions, Inc. (“SS&C GIDS”) (the “Transfer Agent”), an affiliate of ALPS, serves as transfer, dividend paying and shareholder servicing agent for the Fund.
| Annual Report | September 30, 2024 | 35 |
| Opportunistic Credit Interval Fund | Notes to Consolidated Financial Statements |
September 30, 2024
Distributor – The Fund has entered into a distribution agreement with ALPS Distributors, Inc. (the “Distributor”), an affiliate of ALPS, to provide distribution services to the Fund. There are no fees paid to the Distributor pursuant to the distribution agreement. The Board has adopted, on behalf of the Fund, a shareholder servicing plan under which the Fund may compensate financial industry professionals for providing ongoing services in respect of clients with whom they have distributed shares of the Fund.
Trustees – Each Trustee who is not affiliated with the Fund or the Adviser receives an annual fee of $10,000, an additional $2,000 for attending the annual in-person meeting of the Board, and $500 for attending each of the remaining telephonic meetings, as well as reimbursement for any reasonable expenses incurred attending the meetings. None of the executive officers or interested Trustees receives compensation from the Fund.
5. INVESTMENT TRANSACTIONS
The cost of purchases and proceeds from the sale of securities, other than short-term securities, for the year ended September 30, 2024 amounted to $138,085,986 and $17,092,022, respectively.
6. CAPITAL SHARES
The Fund commenced operations on July 5, 2022 and currently offers Class I shares at NAV.
Share Repurchase Program - As an interval fund, the Fund offers its shareholders the option of redeeming shares on a quarterly basis, at NAV, no less than 5% of the Fund’s issued and outstanding shares as of the close of regular business hours on the New York Stock Exchange on the Repurchase Pricing Date. If shareholders tender for repurchase more than 5% of the outstanding shares of the Fund, the Fund may, but is not required to, repurchase up to an additional 2% of the outstanding shares of the Fund. If the Fund determines not to repurchase up to an additional 2% of the outstanding shares of the Fund, or if more than 7% of the outstanding shares of the Fund are tendered, then the Fund will repurchase shares on a pro rata basis based upon the number of shares tendered by each shareholder. There can be no assurance that the Fund will be able to repurchase all shares that each shareholder has tendered. In the event of an oversubscribed offer, shareholders may not be able to tender all shares that they wish to tender and may have to wait until the next quarterly repurchase offer to tender the remaining shares, subject to any proration. Subsequent repurchase requests will not be given priority over other shareholder requests.
For the year ended September 30, 2024, the Fund completed four quarterly repurchase offers. In these repurchase offers, the Fund offered to repurchase up to 5% of the number of its outstanding shares (up to 7% at the discretion of the officers of the Fund) as of the Repurchase Pricing Dates. For the year ended September 30, 2024, none of the quarterly repurchase offers were oversubscribed such that pro-ration was required.
The result of those repurchase offers were as follows:
| Repurchase Offer #1 | Repurchase Offer #2 | Repurchase Offer #3 | Repurchase Offer #4 | |
| Commencement Date | September 11, 2023 | December 11, 2023 | March 14, 2024 | June 12, 2024 |
| Repurchase Request Deadline | October 11, 2023 | January 10, 2024 | April 10, 2024 | July 10, 2024 |
| Repurchase Pricing Date | October 11, 2023 | January 10, 2024 | April 10, 2024 | July 10, 2024 |
| Amount Repurchased | $499,000 | $798,596 | $1,410,940 | $6,424,806 |
| Shares Repurchased | 42,181 | 67,967 | 120,593 | 555,779 |
7. BANK LINE OF CREDIT
On April 12, 2024, the Fund entered into a multi-currency revolving bank line of credit (the “Credit Facility”) with U.S. Bank National Association (“USB”). The Credit Facility has a committed, original available facility size of $25 million with an uncommitted accordion feature with a maximum available facility size up to $100 million. On September 13, 2024, the Fund executed on the accordion feature and increased its available facility size to $50 million. The Credit Facility is an evergreen facility terminable by either party upon 364 days of receipt of written notice. The Credit Facility is secured by a first-priority perfected security interest in all the Fund's assets with a facility fee of 0.25% per annum, payable quarterly, pro-rated for the life of the Credit Facility if the Credit Facility is terminated, a commitment fee of 0.35% on the unused portion of the maximum facility size and the interest on the used portion is based on the Fund's option, either daily simple SOFR, 1 month SOFR plus the applicable margin of 1.80% or the USB Prime rate.
During the year ended September 30, 2024, the Fund incurred $121,411 of interest and financing expenses related to the Credit Facility. Average borrowings during the year ended September 30, 2024, and the average interest rate for the days the line of credit was outstanding during the year ended September 30, 2024, were $3,266,790 and 5.46%, respectively. The largest outstanding borrowing during the year ended September 30, 2024, was $3,584,000. As of September 30, 2024, the Fund had borrowings of $3,562,086. As collateral for the Credit Facility, the Fund grants USB a first position security interest in and lien on substantially all securities of any kind or description held by the Fund in the pledge account. The fair value of the USB Credit Facility was approximated at carrying value on the consolidated statement of assets and liabilities.
| 36 | www.opportunisticcreditintervalfund.com |
| Opportunistic Credit Interval Fund | Notes to Consolidated Financial Statements |
September 30, 2024
Under the 1940 Act, the Fund is not permitted to incur indebtedness, including through the issuance of debt securities, unless immediately thereafter the Fund will have an asset coverage of at least 300%. In general, the term “asset coverage” for this purpose means the ratio which the value of the total assets of the Fund, less all liabilities and indebtedness not represented by senior securities, bears to the aggregate amount of senior securities representing indebtedness of the Fund. In addition, the Fund may be limited in its ability to declare any cash distribution on its capital stock or purchase its capital stock unless, at the time of such declaration or purchase, the Fund has an asset coverage (on its indebtedness) of at least 300% after deducting the amount of such distribution or purchase price, as applicable. As of September 30, 2024, our asset coverage ratio was 4,191%.
8. TAX BASIS INFORMATION
For the year ended September 30, 2024, the following reclassifications, which had no impact on results of operations or net assets, were recorded to reflect tax character. These differences were primarily attributed to non-deductible expenses.
Distributable Earnings | Paid-in Capital | ||||||
| $ | (90,107 | ) | $ | 90,107 | |||
The following information is computed on a tax basis for each item as of September 30, 2024:
Gross Appreciation | Gross Depreciation (excess of tax cost over value) | Net Appreciation (Depreciation) of Foreign Currency and Derivatives | Net Appreciation | Cost of Investments for Income Tax Purposes | ||||||||||||
| $ | 2,616,861 | $ | (1,821,491 | ) | $ | (107,550 | ) | $ | 687,820 | $ | 149,182,217 |
For the year ended September 30, 2024, the following reclassifications, which had no impact on results of operations or net assets, were recorded to reflect tax character. These differences were primarily attributed to non-deductible expenses.
As of September 30, 2024, the components of accumulated earnings on a tax basis were as follows:
| Undistributed Ordinary Income | $ | – | ||
| Accumulated Capital Losses | (1,415,238 | ) | ||
| Net Unrealized Appreciation on Securities | 687,820 | |||
| Tax Return of Capital | – | |||
| Total Distributable Earnings | $ | (727,418 | ) |
The difference between book basis and tax basis distributable earnings and unrealized appreciation/(depreciation) is primarily attributable to the tax deferral of losses, investments in partnerships and certain other investments.
The tax characteristics of distributions paid for the year ended September 30, 2024, were as follows:
| Ordinary Income | Long-Term Capital Gain | Return of Capital | |||||||
| $ | 8,708,286 | $ | – | $ | 1,379,220 |
The tax characteristics of distributions paid for the year ended September 30, 2023, were as follows:
| Ordinary Income | Long-Term Capital Gain | Return of Capital | |||||||
| $ | 1,944,979 | $ | – | $ | – |
Under current law, capital losses maintain their character as short-term or long-term and are carried forward to the next tax year without expiration. As of the current fiscal year end, the following amounts are available as carry forwards to the next tax year:
Short-Term Capital Losses | Long-Term Capital Losses | ||||||
| $ | 1,039,907 | $ | 375,331 |
| Annual Report | September 30, 2024 | 37 |
| Opportunistic Credit Interval Fund | Notes to Consolidated Financial Statements |
September 30, 2024
The Fund has formed a Taxable Subsidiary, which is taxed as a corporation for income tax purposes. The Taxable Subsidiary allows the Fund to make equity investments in companies organized as pass-through entities while continuing to satisfy the requirements of a RIC under the Code. The Taxable Subsidiary is a wholly owned subsidiary and consolidated in these financial statement statements for financial reporting purposes.
Deferred U.S. federal income taxes reflect the net tax effect of temporary differences between the carrying amount of assets and liabilities for financial reporting and U.S. federal income tax purposes. Components of deferred tax assets (liabilities) as of September 30, 2024, are as follows:
| As of September 30, 2024 | ||||
| Deferred tax assets: | ||||
| Net operating loss carryforwards | $ | – | ||
| Capital loss carryforwards | – | |||
| Other deferred tax assets | – | |||
| Less valuation allowance | – | |||
| Total deferred tax assets | $ | – | ||
| Deferred tax liabilities: | ||||
| Net unrealized appreciation/(depreciation) on investments | $ | 19,212 | ||
| Total deferred tax liabilities | $ | 19,212 | ||
| Net deferred tax liability | $ | 19,212 |
The Fund's income tax provision consists of the following as of September 30, 2024:
| As of September 30, 2024 | ||||
| Current: | ||||
| Federal | $ | 49,925 | ||
| $ | 49,925 | |||
| Deferred and other: | ||||
| Federal and state | $ | 19,212 | ||
| $ | 19,212 |
9. RISK FACTORS
In the normal course of business, the Fund faces certain risks and uncertainties. Set forth below is a summary of certain principal risks associated with the Fund. The following is not intended to be a complete list of all the potential risks associated with the Fund. For a more comprehensive list of potential risks the Fund may be subject to, please refer to the Fund’s Prospectus and Statement of Additional Information.
Co-Investment Transactions Risk - As a registered closed-end fund, the Fund is subject to certain regulatory restrictions in making investments. For example, registered closed-end funds generally are not permitted to co-invest with certain affiliated entities in transactions originated by the registered closed-end fund or its affiliates in the absence of an exemptive order from the SEC. However, registered closed-end funds are permitted to, and may, simultaneously co-invest in transactions where price is the only negotiated term. On October 23, 2018, the SEC issued an exemptive order to an affiliate of the Adviser that permits the Fund to co-invest, subject to the satisfaction of certain conditions, in certain private placement transactions, alongside other funds managed by affiliates, and any future funds that are advised by affiliated investment advisers. Under the terms of the exemptive order, in order for the Fund to participate in a co-investment transaction a “required majority” (as defined in Section 57(o) of the 1940 Act) of the Fund’s Independent Trustees must conclude that (i) the terms of the proposed transaction, including the consideration to be paid, are reasonable and fair to the Fund and its shareholders and do not involve overreaching with respect of the Fund or its shareholders on the part of any person concerned, and (ii) the proposed transaction is consistent with the interests of the Fund’s shareholders and is consistent with the Fund’s investment objectives and strategies and certain criteria established by the Fund’s Board of Trustees.
The Fund relies, in part, on affiliates to assist with identifying and executing upon investment opportunities and on the Fund’s Board of Trustees to review and approve the terms of the Fund’s participation in co-investment transactions with affiliates. Affiliates are not restricted from forming additional investment funds, entering into other investment advisory relationships or engaging in other business activities. These activities could be viewed as creating a conflict of interest in that the time and effort of the members of affiliates and their officers and employees will not be devoted exclusively to the Fund’s business but will be allocated between the Fund and such other business activities of affiliates in a manner that deemed necessary and appropriate.
The Adviser and individuals employed by it are not generally prohibited from raising capital for and managing other investment entities that make the same types of investments that the Fund targets. As a result, the time and resources that these individuals may devote to the Fund may be diverted. In addition, the Fund may compete with any such investment entity for the same investors and investment opportunities. Affiliates of the Adviser, whose primary business includes the origination of investments, engage in investment advisory business with accounts that compete with the Fund.
| 38 | www.opportunisticcreditintervalfund.com |
| Opportunistic Credit Interval Fund | Notes to Consolidated Financial Statements |
September 30, 2024
Convertible Securities Risk - Convertible securities are bonds, debentures, notes, preferred stocks or other securities that may be converted into or exchanged for a specified amount of common stock of the same or a different issuer within a particular period of time at a specified price or formula. A convertible security entitles its holder to receive interest that is generally paid or accrued on debt or a dividend that is paid or accrued on preferred stock until the convertible security matures or is redeemed, converted or exchanged. Convertible securities have unique investment characteristics in that they generally: (i) have higher yields than common stocks, but lower yields than comparable non-convertible securities; (ii) are less subject to fluctuation in value than the underlying common stock due to their fixed-income characteristics; and (iii) provide the potential for capital appreciation if the market price of the underlying common stock increases.
The value of a convertible security is a function of its “investment value” (determined by its yield in comparison with the yields of other securities of comparable maturity and quality that do not have a conversion privilege) and its “conversion value” (the security’s worth, at market value, if converted into the underlying common stock). The investment value of a convertible security is influenced by changes in interest rates, with investment value declining as interest rates increase and increasing as interest rates decline. The credit standing of the issuer and other factors also may have an effect on the convertible security’s investment value.
Credit Risk - It is possible that the Fund’s debt investments may not make scheduled interest and/or principal payments on their loans and/or debt securities, which may result in losses or reduced cash flow to the Fund, either or both of which may cause the Net Asset Value of, or the distributions by, the Fund to decrease. In addition, the credit quality of securities held by the Fund may fall if the underlying borrowers’ financial condition deteriorates. This also may negatively impact the value of and the Fund’s returns on its investment in such securities.
Debt Securities and Interest Rate Risks - Because the Fund invests in debt securities, the value of your investment in the Fund may fluctuate with changes in interest rates. Typically, a rise in market interest rates will cause a decline in the value of fixed rate or other debt instruments. If market interest rates increase, there is a significant risk that the value of the Fund’s investment in fixed rate debt securities may fall, and that it may be more difficult for the Fund to raise capital. Related risks include credit risk (the debtor may default) and prepayment risk (the debtor may pay its obligation early, reducing the amount of interest payments).
Foreign Investment Risk - Investing in foreign securities typically involves more risks than investing in U.S. securities. Investment in foreign securities carries risks associated with political and economic developments, government supervision and regulation of foreign securities and currency markets, less liquidity and more volatility, and currency exchange rate fluctuations.
Leverage Risk - The Fund is permitted to obtain leverage using any form or combination of financial leverage instruments, including through funds borrowed from banks or other financial institutions (i.e., a credit facility), margin facilities, the issuance of preferred shares or notes and leverage attributable to reverse repurchase agreements, dollar rolls or similar transactions. The Fund may use leverage opportunistically and may choose to increase or decrease its leverage, or use different types or combinations of leveraging instruments, at any time based on the Fund’s assessment of market conditions and the investment environment. The use of leverage, such as borrowing money to purchase securities, will cause the Fund (or a Public Investment Fund or Private Investment Fund in which the Fund has invested) to incur additional expenses and significantly magnify the Fund’s losses in the event of underperformance of the Fund’s (or Public Investment Fund’s or Private Investment Fund’s) underlying investments.
Market Disruption Risk - Unexpected local, regional or global events, such as war; acts of terrorism; financial, political or social disruptions; natural, environmental or man-made disasters; climate-change and climate-related events; the spread of infectious illnesses or other public health issues; recessions and depressions; or other events may result in market volatility, may have long-term effects on the United States and worldwide financial markets and may cause further economic uncertainties in the United States and worldwide. The Fund cannot predict the effects of such events in the future on the U.S. economy and securities markets.
Structured Products Risk - The Fund may invest in CDOs and other structured products, consisting of CBOs, CLOs and credit-linked notes. Holders of structured products bear risks of the underlying investments, index or reference obligation and are subject to counterparty risk. While certain structured products enable the investor to acquire interests in a pool of securities without the brokerage and other expenses associated with directly holding the same securities, investors in structured products generally pay their share of the structured product’s administrative and other expenses. Although it is difficult to predict whether the prices of indices and securities underlying structured products will rise or fall, these prices (and, therefore, the prices of structured products) will be influenced by the same types of political and economic events that affect issuers of securities and capital markets generally. If the issuer of a structured product uses shorter term financing to purchase longer term securities, the issuer may be forced to sell its securities at below market prices if it experiences difficulty in obtaining short-term financing, which may adversely affect the value of the structured products owned by the Fund. Certain structured products may be thinly traded or have a limited trading market. CLOs and credit- linked notes are typically privately offered and sold.
| Annual Report | September 30, 2024 | 39 |
| Opportunistic Credit Interval Fund | Notes to Consolidated Financial Statements |
September 30, 2024
10. AFFILIATE TRANSACTIONS
The following investments represent affiliated investments transactions during the year ended September 30, 2024, and the related positions as of September 30, 2024:
| Security Name | Fair Value as of September 30, 2023 | Purchases(a) | Sales(b) | Fair Value as of September 30, 2024* | Share/ Balance as of September 30, 2024 | Interest income/ Dividends | Realized Gain (Loss) | Change in Unrealized Gain (Loss) | ||||||||||||||||||||||||
| Great Lakes Funding II LLC, Series A | $ | 94,103 | $ | 6,935,694 | $ | (836,672 | ) | $ | 6,350,098 | 6,195,218 | $ | 787,378 | $ | – | $ | 156,973 | ||||||||||||||||
| EBSC Holdings LLC (Riddell, Inc.), Preferred | – | 5,188,225 | – | 5,239,292 | 5,252,423 | 252,423 | – | 51,067 | ||||||||||||||||||||||||
| Mount Logan Funding 2018-1 LP | 439,310 | 90,853 | (98,348 | ) | 340,651 | 479,858 | 90,853 | – | (91,164 | ) | ||||||||||||||||||||||
| PMP OPCO, LLC, Delayed Draw Term Loan | – | – | – | (11,419 | ) | – | 1,021 | – | (11,419 | ) | ||||||||||||||||||||||
| PMP OPCO, LLC, First Lien Term Loan | – | – | – | (4,091 | ) | 1,968,750 | 93,285 | – | (4,091 | ) | ||||||||||||||||||||||
| PMP OPCO, LLC, Revolver | – | 1,931,234 | – | 1,931,934 | – | 85 | – | 700 | ||||||||||||||||||||||||
| Princeton Medspa Partners, LLC, Preferred | – | 3,610,274 | – | 3,455,844 | 3,610,274 | 110,274 | – | (154,430 | ) | |||||||||||||||||||||||
| Princeton Medspa Partners, LLC, Warrants | – | – | – | 167,042 | – | – | – | 167,042 | ||||||||||||||||||||||||
| Princeton Medspa Partners, LLC, Put Option | – | – | – | – | 3,500,000 | – | – | – | ||||||||||||||||||||||||
| Riddell Inc, Delayed Draw Term Loan | – | – | – | (1,018 | ) | – | – | – | (1,018 | ) | ||||||||||||||||||||||
| Riddell Inc, First Lien Term Loan | – | 894,083 | (11,172 | ) | 887,673 | 192 | 53,315 | – | 4,762 | |||||||||||||||||||||||
| Total | $ | 533,413 | $ | 18,650,363 | $ | (946,192 | ) | $ | 18,356,006 | $ | 1,388,634 | $ | – | $ | 118,422 | |||||||||||||||||
| (a) | Purchases include increases in the cost basis of investments resulting from new portfolio investments, follow-on investments, accrued PIK and accretion of original issue discount. Purchases also include transfers into Affiliate classification. |
| (b) | Sales include decreases in the cost basis of investments resulting from principal repayments and sales. Sales also include transfers out of Affiliate classification. |
11. SUBSEQUENT EVENTS
The Fund has evaluated subsequent events through the date of issuance of the financial statements and has determined that there have been no events that have occurred that would require adjustments to our disclosures in the financial statements except as stated below.
| 40 | www.opportunisticcreditintervalfund.com |
| Report of Independent Registered | |
| Opportunistic Credit Interval Fund | Public Accounting Firm |
To the Shareholders and the Board of Trustees of Opportunistic Credit Interval Fund
Opinion on the Consolidated Financial Statements and Financial Highlights
We have audited the accompanying consolidated statement of assets and liabilities of Opportunistic Credit Interval Fund (the "Fund"), including the consolidated schedule of investments, as of September 30, 2024, the related consolidated statements of operations and cash flows for the year then ended, the consolidated statement of changes in net assets for the year ended September 30, 2024, the statement of changes in net assets for the year ended September 30, 2023, the financial highlights for each of the years ended September 30, 2024 and 2023, and for the period from July 5, 2022 (commencement of operations) to September 30, 2022, and the related notes. In our opinion, the consolidated financial statements and financial highlights present fairly, in all material respects, the financial position of the Fund as of September 30, 2024, and the results of its operations and its cash flows for the year then ended, the changes in its net assets for each of the two years in the period then ended, and the financial highlights for the years ended September 30, 2024 and 2023 and for the period from July 5, 2022 (commencement of operations) to September 30, 2022 in conformity with accounting principles generally accepted in the United States of America.
Basis for Opinion
These consolidated financial statements and financial highlights are the responsibility of the Fund's management. Our responsibility is to express an opinion on the Fund's consolidated financial statements and financial highlights based on our audits. We are a public accounting firm registered with the Public Company Accounting Oversight Board (United States) (PCAOB) and are required to be independent with respect to the Fund in accordance with the U.S. federal securities laws and the applicable rules and regulations of the Securities and Exchange Commission and the PCAOB.
We conducted our audits in accordance with the standards of the PCAOB. Those standards require that we plan and perform the audit to obtain reasonable assurance about whether the consolidated financial statements and financial highlights are free of material misstatement, whether due to error or fraud. The Fund is not required to have, nor were we engaged to perform, an audit of its internal control over financial reporting. As part of our audits we are required to obtain an understanding of internal control over financial reporting but not for the purpose of expressing an opinion on the effectiveness of the Fund’s internal control over financial reporting. Accordingly, we express no such opinion.
Our audits included performing procedures to assess the risks of material misstatement of the consolidated financial statements and financial highlights, whether due to error or fraud, and performing procedures that respond to those risks. Such procedures included examining, on a test basis, evidence regarding the amounts and disclosures in the consolidated financial statements and financial highlights. Our audits also included evaluating the accounting principles used and significant estimates made by management, as well as evaluating the overall presentation of the consolidated financial statements and financial highlights. Our procedures included confirmation of investments owned as of September 30, 2024, by correspondence with the custodian and brokers; when replies were not received, we performed other auditing procedures. We believe that our audits provide a reasonable basis for our opinion.
/s/ Deloitte & Touche LLP
New York, New York
November 27, 2024
We have served as the Fund’s auditor since 2022.
| Annual Report | September 30, 2024 | 41 |
| Opportunistic Credit Interval Fund | Additional Information |
September 30, 2024 (Unaudited)
1. PROXY VOTING POLICIES AND VOTING RECORD
A description of the policies and procedures that the Fund uses to vote proxies relating to portfolio securities is available without charge upon request by calling toll-free 833-404-4103, or on the Securities and Exchange Commission’s (“SEC”) website at http://www.sec.gov. Information regarding how the Fund voted proxies relating to portfolio securities during the most recent 12-month period ended June 30th is available without charge upon request by calling toll-free 833-404-4103, or on the SEC’s website at http://www.sec.gov.
2. QUARTERLY PORTFOLIO HOLDINGS
The Fund files a complete listing of portfolio holdings for the Fund with the SEC as of the first and third quarters of each fiscal year on Form N-PORT. The filings are available upon request by calling 833-404-4103. Furthermore, you may obtain a copy of the filing on the SEC’s website at http://www.sec.gov.
| 42 | www.opportunisticcreditintervalfund.com |
| Opportunistic Credit Interval Fund | Trustees and Officers |
September 30, 2024 (Unaudited)
The business and affairs of the Fund are managed under the direction of the Trustees. Information concerning the Trustees and officers of the Fund as of its fiscal period end September 30, 2024 is set forth below. Generally, each Trustee and officer serves an indefinite term or until certain circumstances such as resignation, death or otherwise as specified in the Fund’s organizational documents. Any Trustee may be removed at a meeting of shareholders by a vote meeting the requirements of the Fund’s organization documents. The Statement of Additional Information of the Fund includes additional information about the Trustees and officers and is available, without charge, upon request by calling the Fund toll-free at 1-833-404-4103. Refer to Footnote 4 of the Fund’s financial statements for additional information on Independent Trustee Compensation. The Interested Trustees and officers do not receive compensation from the Fund for their services to the Fund.
INDEPENDENT TRUSTEES
Name, Address and Year of Birth* | Position/ Term of Office** | Principal Occupation During the Past Five Years | Number of Portfolios in Fund Complex Overseen by Trustee | Other Directorships held by Trustee During Last 5 Years |
Alexander Duka 1966 | Trustee since April 2022 | Senior Advisor, Acceleration Bay LLC (a patent investment and technology acceleration business), January 2020 to present; Executive Vice President of Corporate Development, Acceleration Bay, 2017 to 2019; Senior Advisor, Texas Fabco Solutions LLC (oilfield services), 2019 to present; Bank/Managing Director, Citigroup Inc. (1997 to 2017). | 1 | BC Partners Lending Corp, 2018 to present
Portman Ridge Finance Corp, 2019 to present
Logan Ridge Finance Corporation, 2021 to present
Bondhouse Investment Trust, 2019 to 2021
Alternative Credit Income Fund, 2020 to present |
Robert Warshauer 1958 | Trustee since April 2022 | Chief Executive Officer of BLST Holdings, LLC (a finance company) 2020 - present. Former Managing Director and Head of Investment Banking - NY, Imperial Capital (an investment banking company), 2007 to 2020; Board Member, Icon Parking Holdings, LLC, 2020 to present, Global Knowledge (education service), 2020 - 2021, MD America (energy company), 2020; Board Member, Estrella Broadcasting (Spanish language media), 2019 to 2020. | 1 | BC Partners Lending Corp, 2018 to present
Portman Ridge Finance Corp, 2019 to present
Logan Ridge Finance Corporation, 2021 to present
Alternative Credit Income Fund, 2020 to present |
George Grunebaum 1963 | Trustee since April 2022 | President, Ashmore Funds, 2010 to present; CEO, Ashmore Funds, 2008 to present; Director/President, Gordonstoun American Foundation (non-profit education), 2000 to present. | 1 | BC Partners Lending Corp, 2018 to present
Portman Ridge Finance Corp, 2019 to present
Logan Ridge Finance Corporation, 2021 to present
Alternative Credit Income Fund, 2020 to present |
| Annual Report | September 30, 2024 | 43 |
| Opportunistic Credit Interval Fund | Trustees and Officers |
September 30, 2024 (Unaudited)
INTERESTED TRUSTEES AND OFFICERS
Name, Address and Year of Birth | Position/ Term of Office* | Principal Occupation During the Past Five Years | Number of Portfolios in Fund Complex Overseen by Trustee | Other Directorships held by Trustee During Last 5 Years |
Edward Goldthorpe 1976 | Chief Executive Officer (Principal Executive Officer), President, Trustee and Chairman of the Board since 2022 | Partner and Head of Credit, BC Partners (an asset management firm), 2017 to present). | 1 | BC Partners Lending Corp, 2018 to present
Portman Ridge Finance Corp, 2019 to present
Logan Ridge Finance Corporation, 2021 to present
Mount Logan Capital Inc., 2019 to present
Alternative Credit Income Fund, 2020 to present |
Brandon Satoren 1988 | Chief Financial Officer (Principal Financial Officer), Treasurer and Secretary since 2022 | Mr. Satoren Serves as the Chief Financial Officer (Principal Financial Officer) since 2024, Secretary and Treasurer of the Company since 2021. Mr. Satoren previously was a Vice President and Controller at PennantPark, a Vice President at AQR Capital Management, LLC and a Manager at PricewaterhouseCoopers LLP. He earned a Bachelor of Science in Accounting from the University of Central Florida in 2010. Mr. Satoren is a Certified Public Accountant licensed to practice in Colorado and is a member of the American Institute of Certified Public Accountants. | N/A | N/A |
David Held 1970 | Chief Compliance Officer and AML Officer since 2022 | Mr. Held has served as Chief Compliance Officer of Credit, BC Partners (an asset management firm) since 2021.Between 2015 and 2021, he served as Chief Compliance Officer of Lyxor Asset Management Inc. | N/A | N/A |
| * | Unless otherwise noted, the address of each Trustee and Officer is c/o Opportunistic Credit Interval Fund, 650 Madison Avenue, 3rd Floor, New York, NY 10022. |
| ** | The term of office for each Trustee and officer listed above will continue indefinitely. |
| 44 | www.opportunisticcreditintervalfund.com |
| Opportunistic Credit Interval Fund | Privacy Notice |
September 30, 2024 (Unaudited)
| FACTS | WHAT DOES OPPORTUNISTIC CREDIT INTERVAL FUND DO WITH YOUR PERSONAL INFORMATION? | ||||
| Why? | Financial companies choose how they share your personal information. Federal law gives consumers the right to limit some but not all sharing. Federal law also requires us to tell you how we collect, share, and protect your personal information. Please read this notice carefully to understand what we do. | ||||
| What? | The types of personal information we collect and share depend on the product or service you have with us. This information can include:
| ||||
| ● | Social Security number | ● | Purchase History | ||
| ● | Assets | ● | Account Balances | ||
| ● | Retirement Assets | ● | Account Transactions | ||
| ● | Transaction History | ● | Wire Transfer Instructions | ||
| ● | Checking Account Information | ||||
When you are no longer our customer, we continue to share your information as described in this notice. | |||||
| How? | All financial companies need to share customers’ personal information to run their everyday business. In the section below, we list the reasons financial companies can share their customers’ personal information; the reasons Opportunistic Credit Interval Fund chooses to share; and whether you can limit this sharing. | ||||
| REASONS WE CAN SHARE YOUR PERSONAL INFORMATION | Does Alternative Credit Income Fund share? | Can you limit this sharing? | |
| For our everyday business purposes — such as to process your transactions, maintain your account(s), respond to court orders and legal investigations, or report to credit bureaus | Yes | No | |
| For our marketing purposes — to offer our products and services to you | No | We don’t share | |
| For joint marketing with other financial companies | No | We don’t share | |
| For our affiliates’ everyday business purposes — information about your transactions and experiences | No | We don’t share | |
| For our affiliates’ everyday business purposes — information about your creditworthiness | No | We don’t share | |
| For non-affiliates to market to you | No | We don’t share | |
| QUESTIONS? | Call 1-833-404-4103 | ||
| Annual Report | September 30, 2024 | 45 |
| Opportunistic Credit Interval Fund | Privacy Notice |
September 30, 2024 (Unaudited)
| WHO WE ARE | |
| Who is providing this notice? | Opportunistic Credit Interval Fund |
| WHAT WE DO | |
| How does Opportunistic Credit Interval Fund protect my personal information? | To protect your personal information from unauthorized access and use, we use security measures that comply with federal law. These measures include computer safeguards and secured files and buildings.
Our service providers are held accountable for adhering to strict policies and procedures to prevent any misuse of your nonpublic personal information. |
| How does Opportunistic Credit Interval Fund collect my personal information? | We collect your personal information, for example, when you
● Open an account ● Provide account information ● Give us your contact information ● Make deposits or withdrawals from your account ● Make a wire transfer ● Tell us where to send the money ● Tells us who receives the money ● Show your government-issued ID ● Show your driver’s license
We also collect your personal information from other companies. |
| Why can’t I limit all sharing? | Federal law gives you the right to limit only
● Sharing for affiliates’ everyday business purposes – information about your creditworthiness ● Affiliates from using your information to market to you ● Sharing for non-affiliates to market to you
State laws and individual companies may give you additional rights to limit sharing. |
DEFINITIONS | |
Affiliates | Companies related by common ownership or control. They can be financial and nonfinancial companies.
● Opportunistic Credit Interval Fund does not share with our affiliates. |
Non-affiliates | Companies not related by common ownership or control. They can be financial and nonfinancial companies.
● Opportunistic Credit Interval Fund does not share with non-affiliates so they can market to you. |
Joint marketing | A formal agreement between nonaffiliated financial companies that together market financial products or services to you.
● Opportunistic Credit Interval Fund doesn’t jointly market. |
| 46 | www.opportunisticcreditintervalfund.com |
This Page Intentionally Left Blank

| (b) | Not applicable. |
Item 2. Code of Ethics.
| (a) | As of the end of the period covered by this report, the Registrant has adopted a code of ethics that applies to the Registrant’s principal executive officer, principal financial officer, principal accounting officer or controller, or persons performing similar functions, regardless of whether these individuals are employed by the Registrant or a third party. |
| (b) | Not applicable. |
| (c) | During the period covered by this report, there have not been any amendments to the provisions of the code of ethics adopted in Item 2(a) of this report. |
| (d) | During the period covered by this report, the Registrant had not granted any express or implicit waivers from the provisions of the code of ethics adopted in Item 2(a) of this report. |
| (e) | Not applicable. |
| (f) | The Registrant’s Senior Code of Ethics is filed herewith as Exhibit 19(a)(1) to this Form N-CSR. |
Item 3. Audit Committee Financial Expert.
| (a)(1)(i) | The Board of Trustees of the Registrant has determined that the Registrant has at least one Audit Committee Financial Expert serving on its audit committee. |
| (a)(2) | The Board of Trustees of the Registrant has designated Mr. Robert Warshauer as the Registrant’s Audit Committee Financial Expert. Mr. Warshauer is “independent” as defined in paragraph (a)(2) of Item 3 to Form N-CSR. |
Item 4. Principal Accountant Fees and Services.
| (a) | Audit Fees: For the Registrant’s fiscal years ended September 30, 2024 and September 30, 2023, the aggregate fees billed for professional services rendered by the principal accountant for the audit of the Registrant’s annual financial statements or services that are normally provided by the accountant in connection with statutory and regulatory filings or engagements were $173,250 and $131,250, respectively. |
| (b) | Audit-Related Fees: For the Registrant’s fiscal years ended September 30, 2024 and September 30, 2023, no fees were billed for assurance and related services by the principal accountant that are reasonably related to the performance of the audit of the Registrant’s financial statements and are not otherwise reported under paragraph (a) of this Item 4. |
| (c) | Tax Fees: For the Registrant’s fiscal years ended September 30, 2024 and September 30, 2023, no fees were billed for professional services rendered by the principal accountant for tax compliance, tax advice and tax planning. |
| (d) | All Other Fees: For the Registrant’s fiscal years ended September 30, 2024 and September 30, 2023, no fees were billed for products and services provided by the principal accountant, other than the services reported in paragraphs (a) through (c) of this Item 4. |
| (e)(1) | The Registrant’s audit committee is required to pre-approve all audit services and, when appropriate, any non-audit services (including audit-related, tax and all other services) to the Registrant. The Registrant’s audit committee also is required to pre-approve, when appropriate, any non-audit services (including audit-related, tax and all other services) to its adviser, or any entity controlling, controlled by or under common control with the adviser that provides ongoing services to the Registrant, to the extent that the services may be determined to have an impact on the operations or financial reporting of the Registrant. Services are reviewed on an engagement by engagement basis by the Audit Committee. |
| (2) | No services described in paragraphs (b) through (d) of this Item 4 were approved by the Registrant’s audit committee pursuant to paragraph (c)(7)(i)(C) of Rule 2-01 of Regulation S-X. |
| (f) | During the audit of Registrant’s financial statements for the reporting period, less than 50 percent of the hours expended on the principal accountant’s engagement were attributed to work performed by persons other than the principal accountant’s full-time, permanent employees. |
| (g) | For the Registrant’s fiscal years ended September 30, 2024 and September 30, 2023, the aggregate non-audit fees for services billed by the Registrant’s accountant for services rendered to the Registrant and rendered to the Registrant’s investment adviser (not including any sub-adviser whose role is primarily portfolio management and is subcontracted with or overseen by another investment adviser) and any entity controlling, controlled by, or under common control with the adviser that provides ongoing services to the Registrant were $0 and $0, respectively. |
| (h) | The Registrant’s audit committee has considered whether the provision of non-audit services to the Registrant’s investment adviser (not including any sub-adviser whose role is primarily portfolio management and is subcontracted with or overseen by another investment adviser), and any entity controlling, controlled by, or under common control with the investment adviser that provides ongoing services to the Registrant, that were not pre-approved pursuant to paragraph (c)(7)(ii) of Rule 2-01 of Regulation S-X, is compatible with maintaining the principal accountant’s independence. |
| (i) | Not applicable to the Registrant. |
| (j) | Not applicable to the Registrant. |
Item 5. Audit Committee of Listed Registrants.
Not applicable to the Registrant.
Item 6. Investments.
| (a) | The schedule of investments is included as part of the Reports to Shareholders filed under Item 1 of this report. |
| (b) | Not applicable to the Registrant. |
Item 7. Financial Statements and Financial Highlights for Open-End Management Investment Companies.
Not applicable to the Registrant.
Item 8. Changes in and Disagreements with Accountants for Open-End Management Investment Companies.
Not applicable to the Registrant
Item 9. Proxy Disclosures for Open-End Management Investment Companies.
Not applicable to the Registrant.
Item 10. Remuneration Paid to Directors, Officers, and Others of Open-End Management Investment Companies.
Not applicable to the Registrant.
Item 11. Statement Regarding Basis for Approval of Investment Advisory Contract.
Not applicable during Registrant’s most recent fiscal half-year.
Item 12. Disclosure of Proxy Voting Policies and Procedures for Closed-End Management Investment Companies.
Mount Logan Management LLC (“MLM”) has established written policies and procedures setting forth the principles and procedures by which MLM votes or gives consent with respect to securities owned by the Fund (“Votes”). The guiding principle by which MLM votes all Votes is to vote in the best interests of the Fund by maximizing the economic value of the Fund’s holdings, taking into account the Fund’s investment horizon, the contractual obligations under the relevant Governing Documents, and all other relevant facts and circumstances at the time of the vote. MLM does not permit voting decisions to be influenced in any manner that is contrary to, or dilutive of, this guiding principle.
It is MLM’s general policy to vote or give consent on all matters presented to security holders in any Vote. However, MLM reserves the right to abstain on any particular Vote or otherwise withhold its vote or consent on any matter if, in the judgment of the Chief Compliance Officer (“CCO”) or the relevant investment professional, the costs associated with voting such Vote outweigh the benefits to the Fund or if the circumstances make such an abstention or withholding otherwise advisable and in the best interests of the Fund.
The Fund generally cannot direct MLM’s Vote.
All voting decisions initially are the responsibility of MLM’s investment professionals, unless there is a material conflict of interest, in which case they should raise it with the CCO. In most cases, MLM investment professionals will make the decision as to the appropriate vote for any particular Vote. In making such decision, they may rely on any of the information and/or research available to them. In the event of a material conflict of interest, if the investment professional and the CCO are unable to arrive at an agreement as to how to vote, then the CCO may consult with MLM’s Board as to the appropriate vote, who will then review the issues and arrive at a decision based on the overriding principle of seeking the maximization of the economic value of the Fund’s holdings.
All MLM investment professionals are expected to perform their tasks relating to the voting of Votes in accordance with the principles set forth above, according the first priority to the best interest of the Fund. The CCO will use his or her best judgment to address any such conflict of interest and ensure that it is resolved in accordance with his or her independent assessment of the best interests of the Fund.
Where the CCO deems appropriate in his or her sole discretion, unaffiliated third parties may be used to help resolve conflicts. In this regard, the CCO shall have the power to retain independent fiduciaries, consultants, or professionals to assist with voting decisions and/or to delegate voting or consent powers to such fiduciaries, consultants or professionals.
Item 13. Portfolio Managers of Closed-End Management Investment Companies.
(a) Edward Goldthorpe serves as Portfolio Manager for the Fund, charged with the day to day management of the Fund. He has served the Fund as Portfolio Manager since the Fund commenced operations. Mr. Goldthorpe is currently a Partner at BC Partners Advisors LP (“BC Partners”), having launched the BC Partners Credit platform in February 2017, Chief Executive Officer of the Adviser and also serves as the CEO and Chairman of Mount Logan Capital Inc. Mr. Goldthorpe holds a Bachelor of Commerce from Queen’s University.
As of September 30, 2024, Mr. Goldthorpe managed the following accounts in addition to the Fund:
Total Other Accounts Managed
| Registered Investment Company Accounts | Assets Managed | Pooled Investment Vehicle Accounts | Assets Managed | Other Accounts | Assets Managed |
| 5 | $1.1 billion | 8 | $4.9 billion | 3 | $0.8 billion |
Other Accounts Managed Subject to Performance-Based Fees
| Registered Investment Company Accounts | Assets Managed | Pooled Investment Vehicle Accounts | Assets Managed | Other Accounts | Assets Managed |
| 5 | $1.1 billion | 8 | $4.9 billion | 1 | <$0.1 billion |
Henry Wang serves as a Portfolio Manager for the Fund, charged with the day-to-day management of the Fund. He has served the Fund as Portfolio Manager since the Fund commenced operations. Mr. Wang is currently a Partner at BC Partners and Co-President of the Adviser. Prior to joining BC Partners in 2017, Mr. Wang was a Partner at Stonerise Capital Partners from 2011 to 2017. Mr. Wang holds a MBA from the Kellogg School of Management at Northwestern University and a BS BA from Boston University.
As of September 30, 2024, Mr. Wang managed the following accounts in addition to the Fund:
Total Other Accounts Managed
| Registered Investment Company Accounts | Assets Managed | Pooled Investment Vehicle Accounts | Assets Managed | Other Accounts | Assets Managed |
| 5 | $1.1 billion | 8 | $4.9 billion | 3 | $0.8 billion |
Other Accounts Managed Subject to Performance-Based Fees
| Registered Investment Company Accounts | Assets Managed | Pooled Investment Vehicle Accounts | Assets Managed | Other Accounts | Assets Managed |
| 5 | $1.1 billion | 8 | $4.9 billion | 1 | <$0.1 billion |
Matthias Ederer serves as a Portfolio Manager for the Fund, charged with the day-to-day management of the Fund. He has served the Fund as Portfolio Manager since the Fund commenced operations. Mr. Ederer is currently a partner at BC Partners and Co-President of the Adviser Matthias has an MPhil in Economics from Oxford University and a BSc Economics from the University of Warwick.
As of September 30, 2024, Mr. Ederer managed the following accounts in addition to the Fund:
Total Other Accounts Managed
| Registered Investment Company Accounts | Assets Managed | Pooled Investment Vehicle Accounts | Assets Managed | Other Accounts | Assets Managed |
| 5 | $1.1 billion | 8 | $4.9 billion | 3 | $0.8 billion |
Other Accounts Managed Subject to Performance-Based Fees
| Registered Investment Company Accounts | Assets Managed | Pooled Investment Vehicle Accounts | Assets Managed | Other Accounts | Assets Managed |
| 5 | $1.1 billion | 8 | $4.9 billion | 1 | <$0.1 billion |
As of September 30, 2024, Mr. Goldthorpe did not own any Fund shares.
As of September 30, 2024, Mr. Wang did not own any Fund shares.
As of September 30, 2024, Mr. Ederer did not own any Fund shares.
Portfolio Manager Compensation
Each Portfolio Manager is compensated based on the success of various fund and business platforms. As part of this compensation, the Portfolio Manager receives a carried interest from the BC Partners’ activities that is distributed based on factors such as seniority, longevity and performance, including successful deal sourcing and execution. Each Portfolio Manager’s compensation would increase if the Fund’s performance (and net asset value) increased due to each Portfolio Manager’s indirect interest in the Adviser, but such compensation is not tied to any specific metric.
| (b) | Not applicable to this report. |
Item 14. Purchases of Equity Securities by Closed-End Management Investment Company and Affiliates Purchasers.
None.
Item 15. Submission of Matters to a Vote of Security Holders.
None.
Item 16. Controls and Procedures.
| (a) | Based on an evaluation of the Registrant’s disclosure controls and procedures as of a date within 90 days of the filing date of this report, the Registrant’s principal executive officer and principal financial officer have concluded that the disclosure controls and procedures are reasonably designed to ensure that the information required in filings on Form N-CSR is recorded, processed, summarized and reported by the filing date, including that information required to be disclosed is accumulated and communicated to the Registrant’s management, including the Registrant’s principal executive officer and principal financial officer, as appropriate to allow timely decisions regarding required disclosure. |
| (b) | There were no significant changes in the Registrant’s internal control over financial reporting that occurred during the period covered by this report that has materially affected, or are reasonably likely to materially affect, the Registrant’s internal control over financial reporting. |
Item 17. Disclosure of Securities Lending Activities for Closed-End Management Investment Companies.
None.
Item 18. Recovery of Erroneously Awarded Compensation.
| (a) | Not applicable. |
| (b) | Not applicable. |
Item 19. Exhibits.
(a)(1) | The Registrant’s Senior Code of Ethics is attached hereto as Exhibit 19(a)(1) in response to Item 2(f). |
(a)(2) | Not applicable. |
(a)(3) | Certifications pursuant to Rule 30a-2(a) under the 1940 Act are attached hereto as Exhibit 99.CERT. |
(a)(4) | None. |
| (a)(5) | Not applicable. |
| (b) | Certifications pursuant to Rule 30a-2(b) under the 1940 Act are attached hereto as Exhibit 99.906CERT. |
SIGNATURES
Pursuant to the requirements of the Securities Exchange Act of 1934 and the Investment Company Act of 1940, the Registrant has duly caused this report to be signed on its behalf by the undersigned, thereunto duly authorized.
OPPORTUNISTIC CREDIT INTERVAL FUND
| By: | /s/ Edward Goldthorpe | |
| Edward Goldthorpe | ||
President and Chief Executive Officer (Principal Executive Officer) | ||
Date: December 6, 2024
Pursuant to the requirements of the Securities Exchange Act of 1934 and the Investment Company Act of 1940, this report has been signed below by the following persons on behalf of the Registrant and in the capacities and on the dates indicated.
| By: | /s/ Edward Goldthorpe | |
| Edward Goldthorpe | ||
President and Chief Executive Officer (Principal Executive Officer) | ||
Date: December 6, 2024
| By: | /s/ Brandon Satoren | |
| Brandon Satoren | ||
Chief Financial Officer (Principal Financial Officer) | ||
Date: December 6, 2024