QUANTUM Q4 2023 Investor Presentation
FORWARD-LOOKING STATEMENTS Certain statements in this presentation are forward-looking, as defined in the Private Securities Litigation Reform Act of 1995. These statements involve risks, uncertainties, and other factors that may cause actual results to differ materially from the information expressed or implied by these forward-looking statements and may not be indicative of future results. These forward-looking statements are subject to a number of risks and uncertainties, including, among others, various factors beyond management’s control, including the risks set forth under the heading “Risk Factors” discussed under the caption “Item 1A. Risk Factors” in Part I of our most recent Annual Report on Form 10- K or any updates discussed under the caption “Item 1A. Risk Factors” in Part II of our Quarterly Reports on Form 10-Q and in our other filings with the SEC. Undue reliance should not be placed on the forward-looking statements in this presentation in making an investment decision, which are based on information available to us on the date hereof. We undertake no duty to update this information unless required by law. 2 COPYRIGHT © D-WAVE
THIS IS A PIVOTAL MOMENT FROM EXPERIMENTATION TO OPERATIONAL USE FROM TOY PROBLEMS TO ENTERPRISE SCALE FROM POTENTIAL IMPACT TO QUANTIFIABLE ROI 3 COPYRIGHT © D-WAVE

ESTABLISHED PRODUCT PORTFOLIO: • World’s largest Quantum Computer • Accessible through production-grade cloud service • World’s 3rd largest quantum IP portfolio • Demonstrated quantum supremacy GROWING COMMERCIAL ADOPTION: • 1st commercial Quantum Computing company • 30+ proven business use cases • Initial applications moving into production HIGH-VALUE CONSULTATIVE SERVICES: • 20+ successful POC engagements in 18 months • Advisory services to aid in production deployment INDUSTRY PERSPECTIVE: “By working with D-Wave and adopting quantum technology as part of our tech stack, we believe we can uncover an even greater collection of data-driven insights to deliver more relevant and effective marketing for our clients, at scale.” – Philippe Krakowsky, CEO of Interpublic Group MARKET LEADER STRONG CUSTOMER BASE THOUGHT LEADERSHIP Top three quantum patent portfolio globally 40 PhDs 220+ U.S. granted patents 100+ Pending worldwide 60+% Annealing AND Gate Over 240 scientific papers published Quantum Annealing Fifth generation system 5000+ qubits Real-Time Quantum Cloud Quantum hybrid solvers 99% up-time Open-Source Python Tools Easily configurable Simplifies use of QC & HSS Customer PS On-Ramp From application eval to production deployment (Source: GlobalData) D-WAVE AT A GLANCE 4 COPYRIGHT © D-WAVE

KEY MANAGEMENT TEAM & BOARD UPDATES Bolstered the executive leadership team and the Board to drive rapid growth and deliver strategic execution with the addition of Lorenzo Martinelli, Chief Revenue Officer, and the promotion of Dr. Trevor Lanting to Chief Development Officer and also added Sec. Kirstjen Nielsen, former secretary of Homeland Security, to the Board of Directors TREVOR LANTING, PhD CHIEF DEVELOPMENT OFFICER Expert in superconducting quantum technology, led development of five generations of quantum annealing products LORENZO MARTINELLI CHIEF REVENUE OFFICER Seasoned revenue-focused B2B SaaS executive with 30+ years of go-to-market expertise spanning sales, marketing, professional services and customer success SEC. KIRSTJEN NIELSEN BOARD OF DIRECTORS Global speaker and thought leader on security issues, AI and emerging tech, with prior positions in the U.S. government 5 COPYRIGHT © D-WAVE
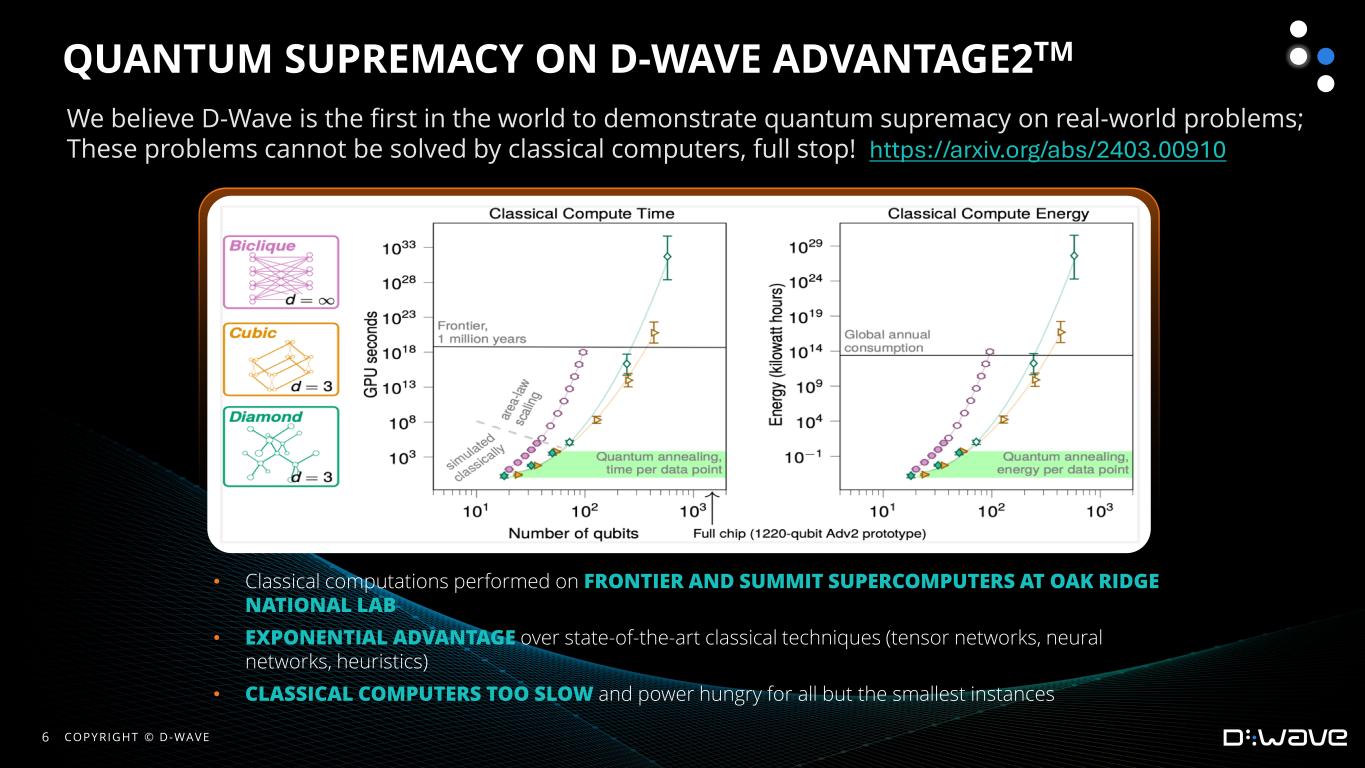
QUANTUM SUPREMACY ON D-WAVE ADVANTAGE2TM • Classical computations performed on FRONTIER AND SUMMIT SUPERCOMPUTERS AT OAK RIDGE NATIONAL LAB • EXPONENTIAL ADVANTAGE over state-of-the-art classical techniques (tensor networks, neural networks, heuristics) • CLASSICAL COMPUTERS TOO SLOW and power hungry for all but the smallest instances We believe D-Wave is the first in the world to demonstrate quantum supremacy on real-world problems; These problems cannot be solved by classical computers, full stop! https://arxiv.org/abs/2403.00910 6 COPYRIGHT © D-WAVE
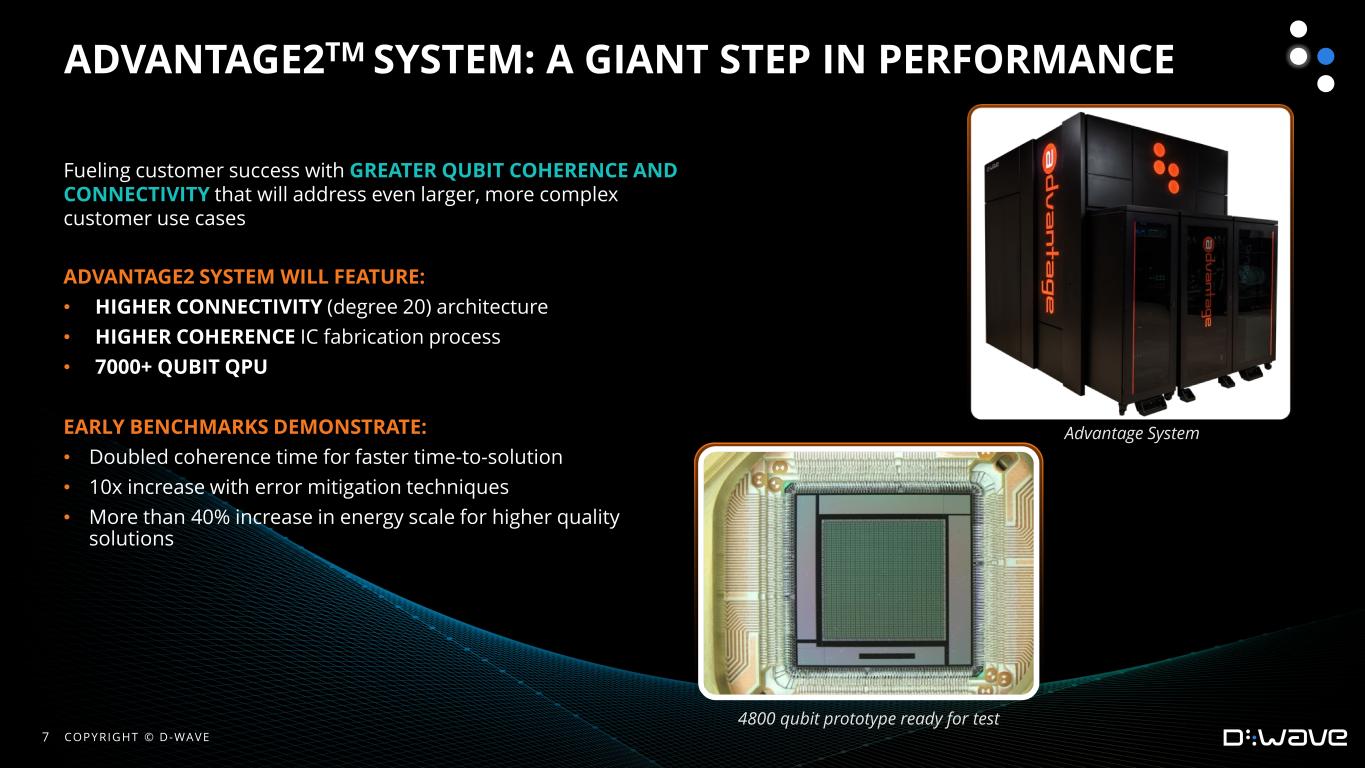
ADVANTAGE2 SYSTEM WILL FEATURE: • HIGHER CONNECTIVITY (degree 20) architecture • HIGHER COHERENCE IC fabrication process • 7000+ QUBIT QPU EARLY BENCHMARKS DEMONSTRATE: • Doubled coherence time for faster time-to-solution • 10x increase with error mitigation techniques • More than 40% increase in energy scale for higher quality solutions 4800 qubit prototype ready for test ADVANTAGE2TM SYSTEM: A GIANT STEP IN PERFORMANCE Fueling customer success with GREATER QUBIT COHERENCE AND CONNECTIVITY that will address even larger, more complex customer use cases Advantage System 7 COPYRIGHT © D-WAVE

TWO TECHNOLOGY LEADERS PARTNERING TO DELIVER QUANTUM GENERATIVE AI • MULTI-YEAR STRATEGIC PARTNERSHIP to develop and bring to market commercial applications combining the power of quantum + generative AI • ACCELERATED DEVELOPMENT TIMELINE supported by access to production Leap Services including hybrid and QPU solvers • JOINT GO-TO-MARKET EFFORTS with exclusive availability of applications via Leap service BUSINESS PARTNERSHIP TECHNICAL APPROACH • Developing QUANTUM GENERATIVE AI applications for multiple customer domains: drug discovery, logistics management, manufacturing optimization, and more • Harnessing COHERENT QUANTUM ANNEALING to deliver samples from quantum distributions for AI model training on customer data sets 8 COPYRIGHT © D-WAVE
INCREASING PRODUCTION APPLICATION DEPLOYMENTS CURRENTLY IN PRODUCTION • Employee Scheduling • Delivery Driver Scheduling MOVING INTO PRODUCTION • Promotional Tour Routing • Customer Rewards Program Optimization 9 COPYRIGHT © D-WAVE
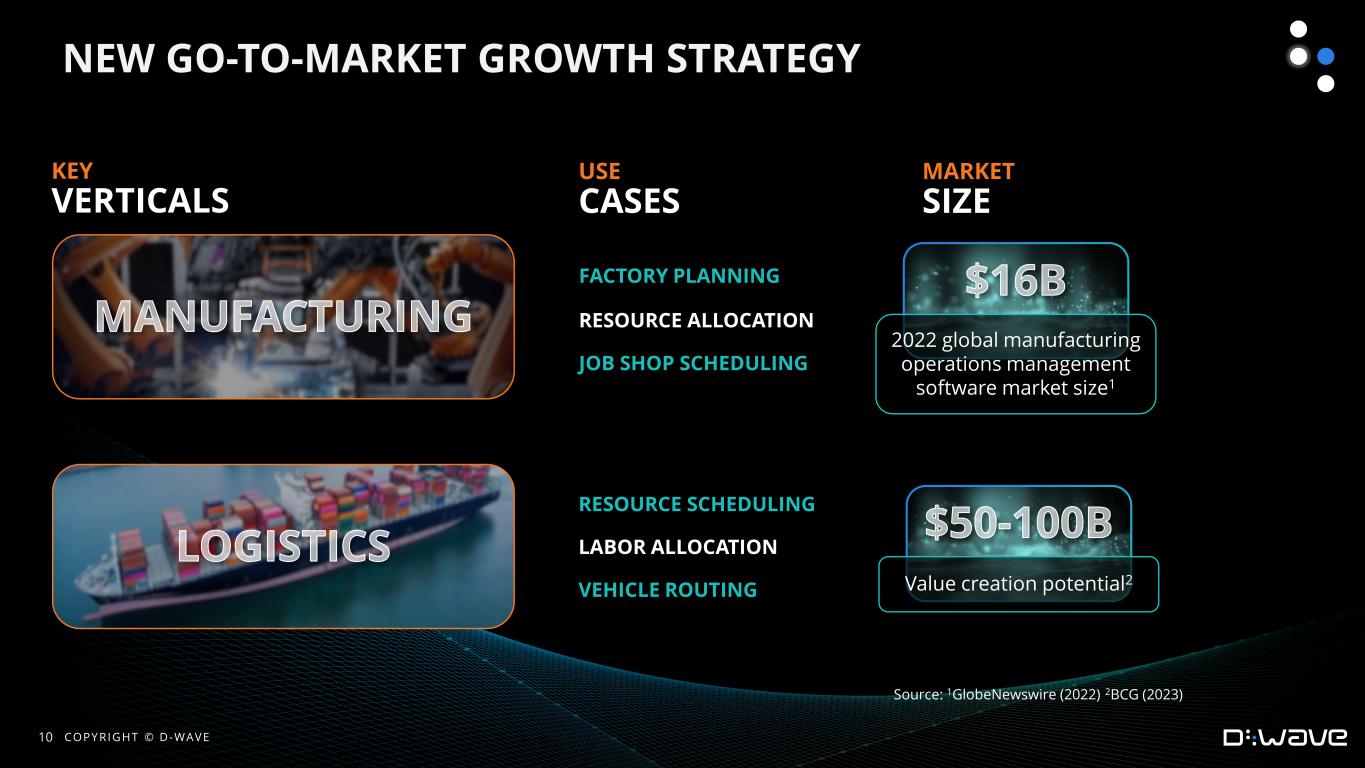
NEW GO-TO-MARKET GROWTH STRATEGY RESOURCE ALLOCATION JOB SHOP SCHEDULING FACTORY PLANNING RESOURCE SCHEDULING VEHICLE ROUTING LABOR ALLOCATION KEY VERTICALS USE CASES Source: 1GlobeNewswire (2022) 2BCG (2023) MARKET SIZE 2022 global manufacturing operations management software market size1 Value creation potential2 10 COPYRIGHT © D-WAVE
GROWING GOVERNMENT INTEREST AND MOMENTUM WITH NEAR-TERM QUANTUM TECHNOLOGIES • Positive reception of quantum supremacy pre-print, which has been submitted for peer review to a scientific publication • New engagements with Canadian and U.K. governments to build applications using our Advantage quantum computing system • Increased interest in training to prepare for a quantum ready workforce • Growing call by policy makers to incorporate annealing quantum computing and quantum-hybrid technology in global quantum programs 11 COPYRIGHT © D-WAVE
NEW PARTNERSHIPS TO FUEL GROWTH New partnerships with Deloitte Canada and NEC Australia aim to expedite the exploration and adoption of quantum computing solutions among governments and businesses in those respective regions 12 COPYRIGHT © D-WAVE
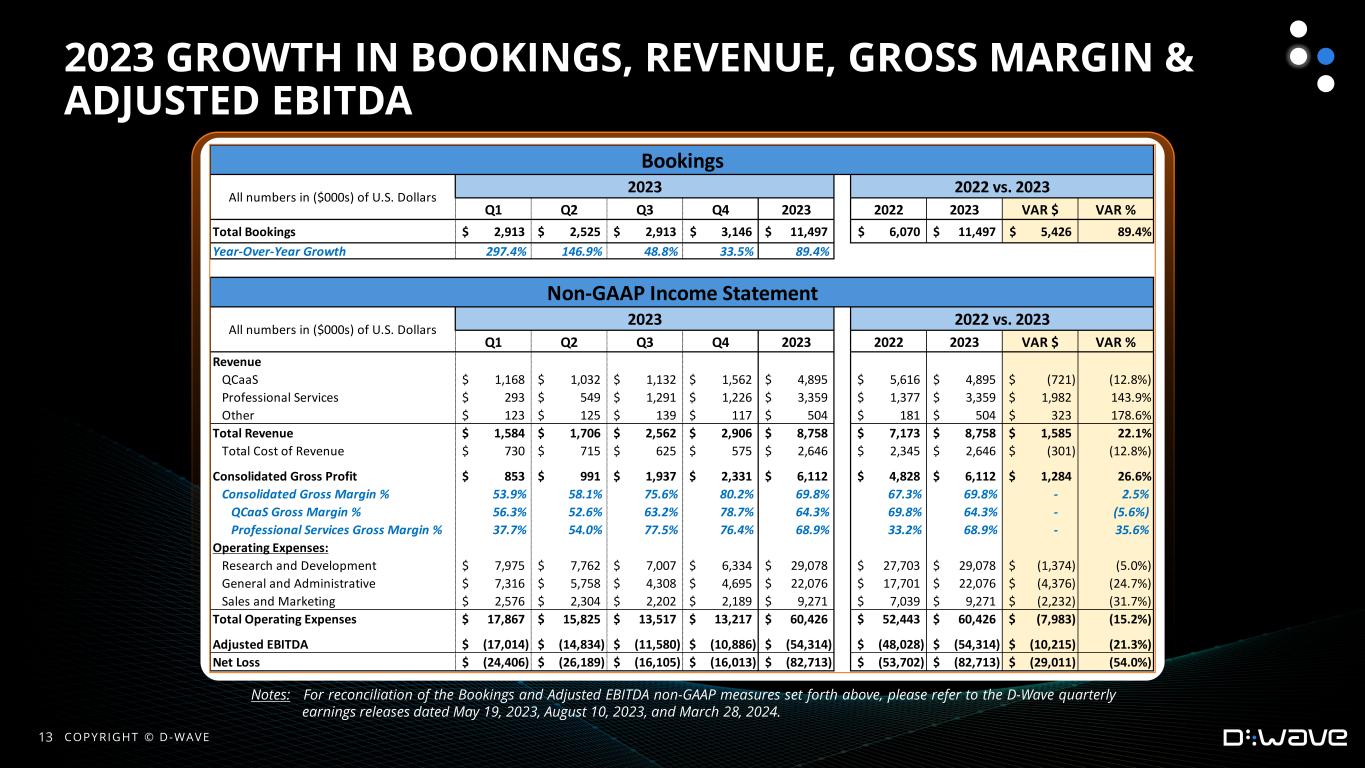
2023 GROWTH IN BOOKINGS, REVENUE, GROSS MARGIN & ADJUSTED EBITDA 13 COPYRIGHT © D-WAVE Q1 Q2 Q3 Q4 2023 2022 2023 VAR $ VAR % Total Bookings 2,913$ 2,525$ 2,913$ 3,146$ 11,497$ 6,070$ 11,497$ 5,426$ 89.4% Year-Over-Year Growth 297.4% 146.9% 48.8% 33.5% 89.4% Q1 Q2 Q3 Q4 2023 2022 2023 VAR $ VAR % Revenue QCaaS 1,168$ 1,032$ 1,132$ 1,562$ 4,895$ 5,616$ 4,895$ (721)$ (12.8%) Professional Services 293$ 549$ 1,291$ 1,226$ 3,359$ 1,377$ 3,359$ 1,982$ 143.9% Other 123$ 125$ 139$ 117$ 504$ 181$ 504$ 323$ 178.6% Total Revenue 1,584$ 1,706$ 2,562$ 2,906$ 8,758$ 7,173$ 8,758$ 1,585$ 22.1% Total Cost of Revenue 730$ 715$ 625$ 575$ 2,646$ 2,345$ 2,646$ (301)$ (12.8%) Consolidated Gross Profit 853$ 991$ 1,937$ 2,331$ 6,112$ 4,828$ 6,112$ 1,284$ 26.6% Consolidated Gross Margin % 53.9% 58.1% 75.6% 80.2% 69.8% 67.3% 69.8% - 2.5% QCaaS Gross Margin % 56.3% 52.6% 63.2% 78.7% 64.3% 69.8% 64.3% - (5.6%) Professional Services Gross Margin % 37.7% 54.0% 77.5% 76.4% 68.9% 33.2% 68.9% - 35.6% Operating Expenses: Research and Development 7,975$ 7,762$ 7,007$ 6,334$ 29,078$ 27,703$ 29,078$ (1,374)$ (5.0%) General and Administrative 7,316$ 5,758$ 4,308$ 4,695$ 22,076$ 17,701$ 22,076$ (4,376)$ (24.7%) Sales and Marketing 2,576$ 2,304$ 2,202$ 2,189$ 9,271$ 7,039$ 9,271$ (2,232)$ (31.7%) Total Operating Expenses 17,867$ 15,825$ 13,517$ 13,217$ 60,426$ 52,443$ 60,426$ (7,983)$ (15.2%) Adjusted EBITDA (17,014)$ (14,834)$ (11,580)$ (10,886)$ (54,314)$ (48,028)$ (54,314)$ (10,215)$ (21.3%) Net Loss (24,406)$ (26,189)$ (16,105)$ (16,013)$ (82,713)$ (53,702)$ (82,713)$ (29,011)$ (54.0%) 2022 vs. 20232023 All numbers in ($000s) of U.S. Dollars Bookings Non-GAAP Income Statement 2023 2022 vs. 2023 All numbers in ($000s) of U.S. Dollars Notes: For reconciliation of the Bookings and Adjusted EBITDA non-GAAP measures set forth above, please refer to the D-Wave quarterly earnings releases dated May 19, 2023, August 10, 2023, and March 28, 2024.
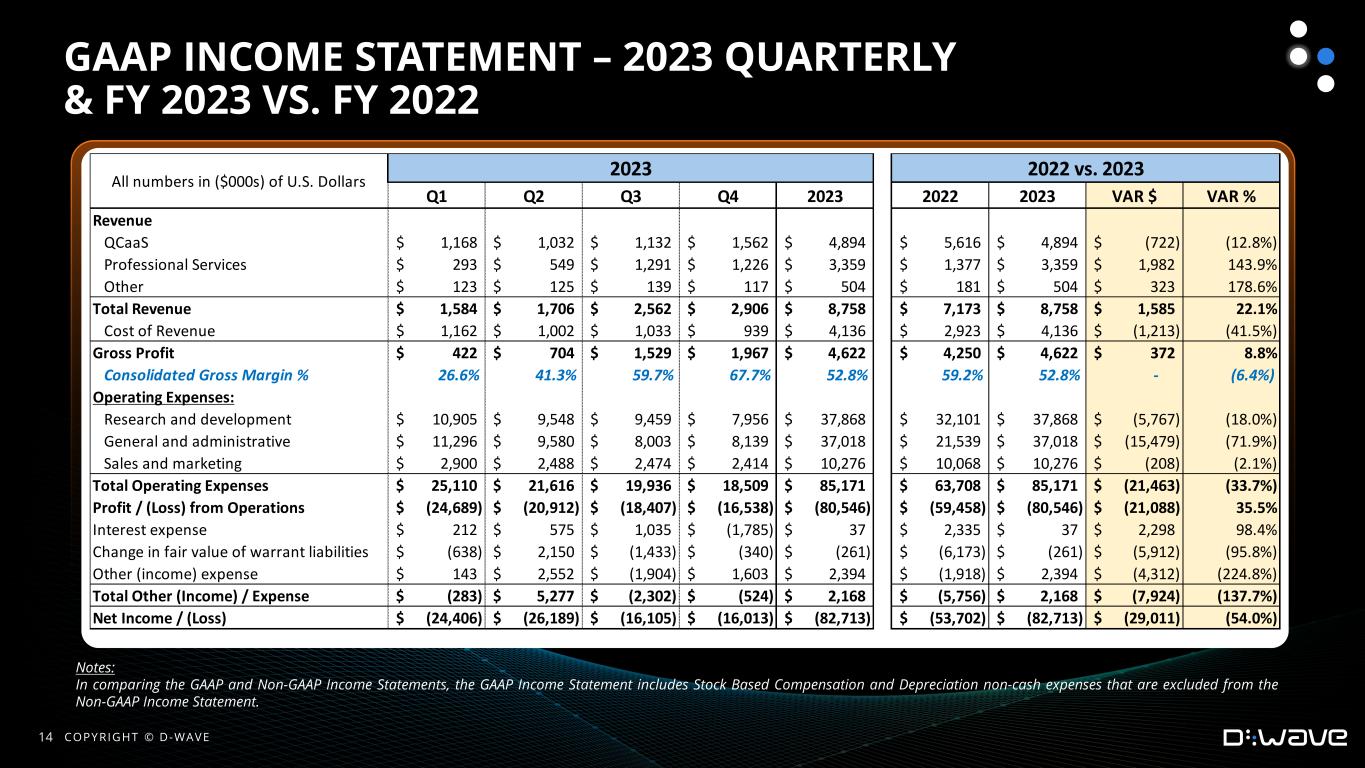
vv GAAP INCOME STATEMENT – 2023 QUARTERLY & FY 2023 VS. FY 2022 Q1 Q2 Q3 Q4 2023 2022 2023 VAR $ VAR % Revenue QCaaS 1,168$ 1,032$ 1,132$ 1,562$ 4,894$ 5,616$ 4,894$ (722)$ (12.8%) Professional Services 293$ 549$ 1,291$ 1,226$ 3,359$ 1,377$ 3,359$ 1,982$ 143.9% Other 123$ 125$ 139$ 117$ 504$ 181$ 504$ 323$ 178.6% Total Revenue 1,584$ 1,706$ 2,562$ 2,906$ 8,758$ 7,173$ 8,758$ 1,585$ 22.1% Cost of Revenue 1,162$ 1,002$ 1,033$ 939$ 4,136$ 2,923$ 4,136$ (1,213)$ (41.5%) Gross Profit 422$ 704$ 1,529$ 1,967$ 4,622$ 4,250$ 4,622$ 372$ 8.8% Consolidated Gross Margin % 26.6% 41.3% 59.7% 67.7% 52.8% 59.2% 52.8% - (6.4%) Operating Expenses: Research and development 10,905$ 9,548$ 9,459$ 7,956$ 37,868$ 32,101$ 37,868$ (5,767)$ (18.0%) General and administrative 11,296$ 9,580$ 8,003$ 8,139$ 37,018$ 21,539$ 37,018$ (15,479)$ (71.9%) Sales and marketing 2,900$ 2,488$ 2,474$ 2,414$ 10,276$ 10,068$ 10,276$ (208)$ (2.1%) Total Operating Expenses 25,110$ 21,616$ 19,936$ 18,509$ 85,171$ 63,708$ 85,171$ (21,463)$ (33.7%) Profit / (Loss) from Operations (24,689)$ (20,912)$ (18,407)$ (16,538)$ (80,546)$ (59,458)$ (80,546)$ (21,088)$ 35.5% Interest expense 212$ 575$ 1,035$ (1,785)$ 37$ 2,335$ 37$ 2,298$ 98.4% Change in fair value of warrant liabilities (638)$ 2,150$ (1,433)$ (340)$ (261)$ (6,173)$ (261)$ (5,912)$ (95.8%) Other (income) expense 143$ 2,552$ (1,904)$ 1,603$ 2,394$ (1,918)$ 2,394$ (4,312)$ (224.8%) Total Other (Income) / Expense (283)$ 5,277$ (2,302)$ (524)$ 2,168$ (5,756)$ 2,168$ (7,924)$ (137.7%) Net Income / (Loss) (24,406)$ (26,189)$ (16,105)$ (16,013)$ (82,713)$ (53,702)$ (82,713)$ (29,011)$ (54.0%) 2023 2022 vs. 2023 All numbers in ($000s) of U.S. Dollars Notes: In comparing the GAAP and Non-GAAP Income Statements, the GAAP Income Statement includes Stock Based Compensation and Depreciation non-cash expenses that are excluded from the Non-GAAP Income Statement. 14 COPYRIGHT © D-WAVE
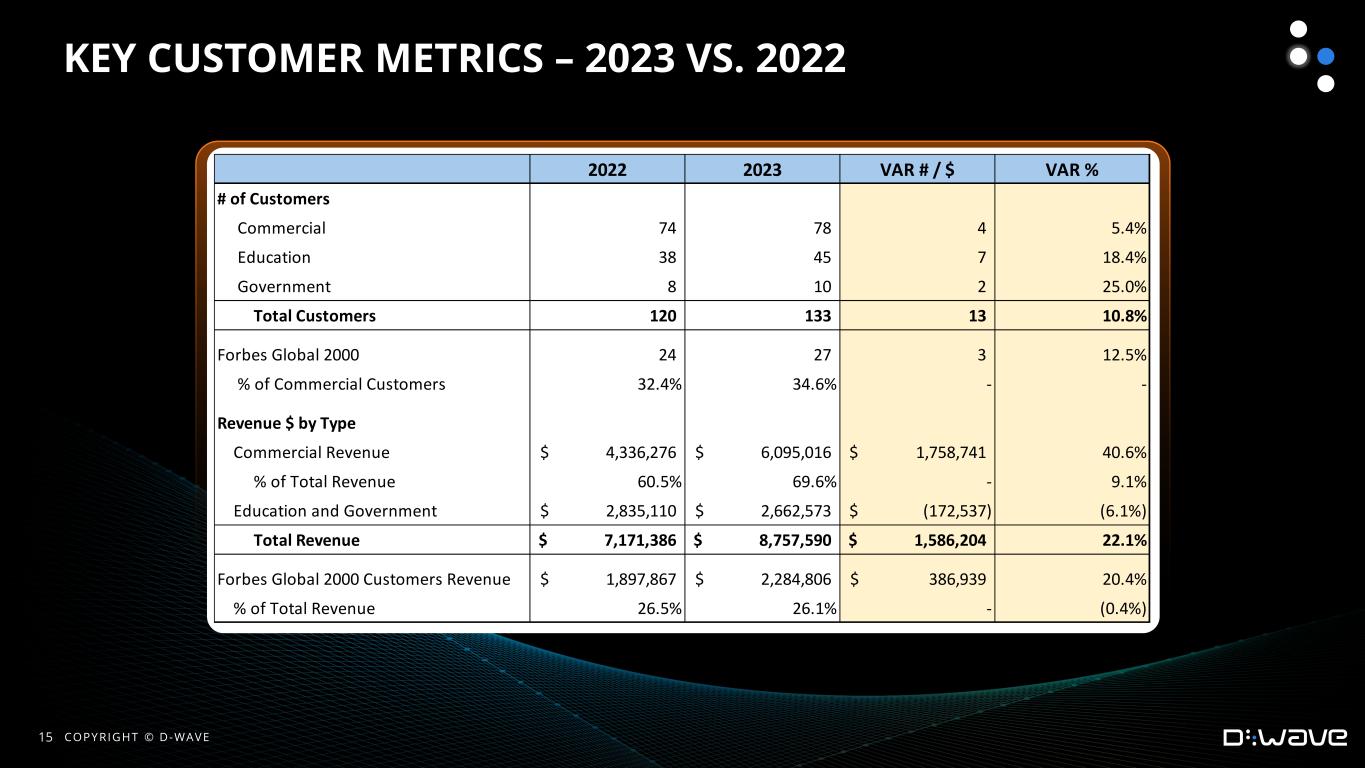
vv KEY CUSTOMER METRICS – 2023 VS. 2022 2022 2023 VAR # / $ VAR % # of Customers Commercial 74 78 4 5.4% Education 38 45 7 18.4% Government 8 10 2 25.0% Total Customers 120 133 13 10.8% Forbes Global 2000 24 27 3 12.5% % of Commercial Customers 32.4% 34.6% - - Revenue $ by Type Commercial Revenue 4,336,276$ 6,095,016$ 1,758,741$ 40.6% % of Total Revenue 60.5% 69.6% - 9.1% Education and Government 2,835,110$ 2,662,573$ (172,537)$ (6.1%) Total Revenue 7,171,386$ 8,757,590$ 1,586,204$ 22.1% Forbes Global 2000 Customers Revenue 1,897,867$ 2,284,806$ 386,939$ 20.4% % of Total Revenue 26.5% 26.1% - (0.4%) 15 COPYRIGHT © D-WAVE

vv CASH AND LIQUIDITY – LAST FIVE QUARTERS (1) On April 13, 2023, D-Wave entered into a $50 million four-year term loan agreement with PSP. The loan agreement is comprised of three individual tranches of $15 million, $15 million, and $20 million respectively and, to date, D-Wave has drawn the first two tranches totaling $30 million. However, the issuance of the third tranche is subject to certain conditions, and there can be no assurance that the Company will be able to meet the conditions necessary to draw on the third tranche. (2) D-Wave’s ability to raise funds under the ELOC is subject to a number of conditions including having a sufficient number of registered shares and having D-Wave’s stock price above $1.00 per share. 2022 Q4 Q1 Q2 Q3 Q4 Key Balance Sheet Measures Cash 7,065,207$ 8,988,243$ 7,514,163$ 53,316,733$ 41,306,821$ Key Liquidity Measures Remaining Capacity under PSPIB Term Loan (1) N/A 35,000,000$ 35,000,000$ 20,000,000$ 20,000,000$ Remaining Capacity under ELOC (2) 145,500,029$ 130,066,593$ 130,066,593$ 84,404,227$ 82,073,409$ Total Key Liquidity Measures 145,500,029$ 165,066,593$ 165,066,593$ 104,404,227$ 102,073,409$ Total Cash + Key Liquidity Measures 152,565,236$ 174,054,836$ 172,580,756$ 157,720,960$ 143,380,230$ 2023 16 COPYRIGHT © D-WAVE
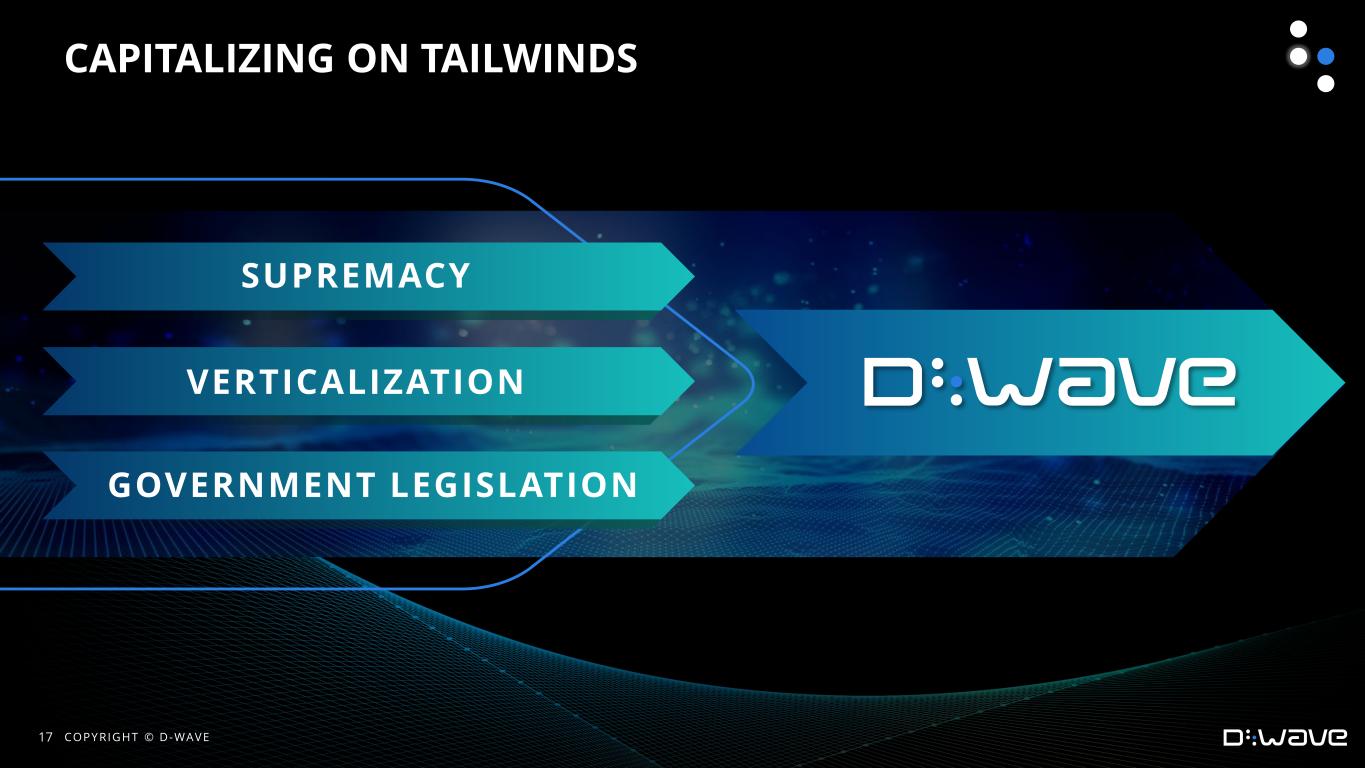
CAPITALIZING ON TAILWINDS VERTICALIZATION GOVERNMENT LEGISLATION SUPREMACY 17 COPYRIGHT © D-WAVE

QUANTUM 18 COPYRIGHT © D-WAVE


