
February 16, 2023 Fourth Quarter and Full Year 2022 Earnings Call
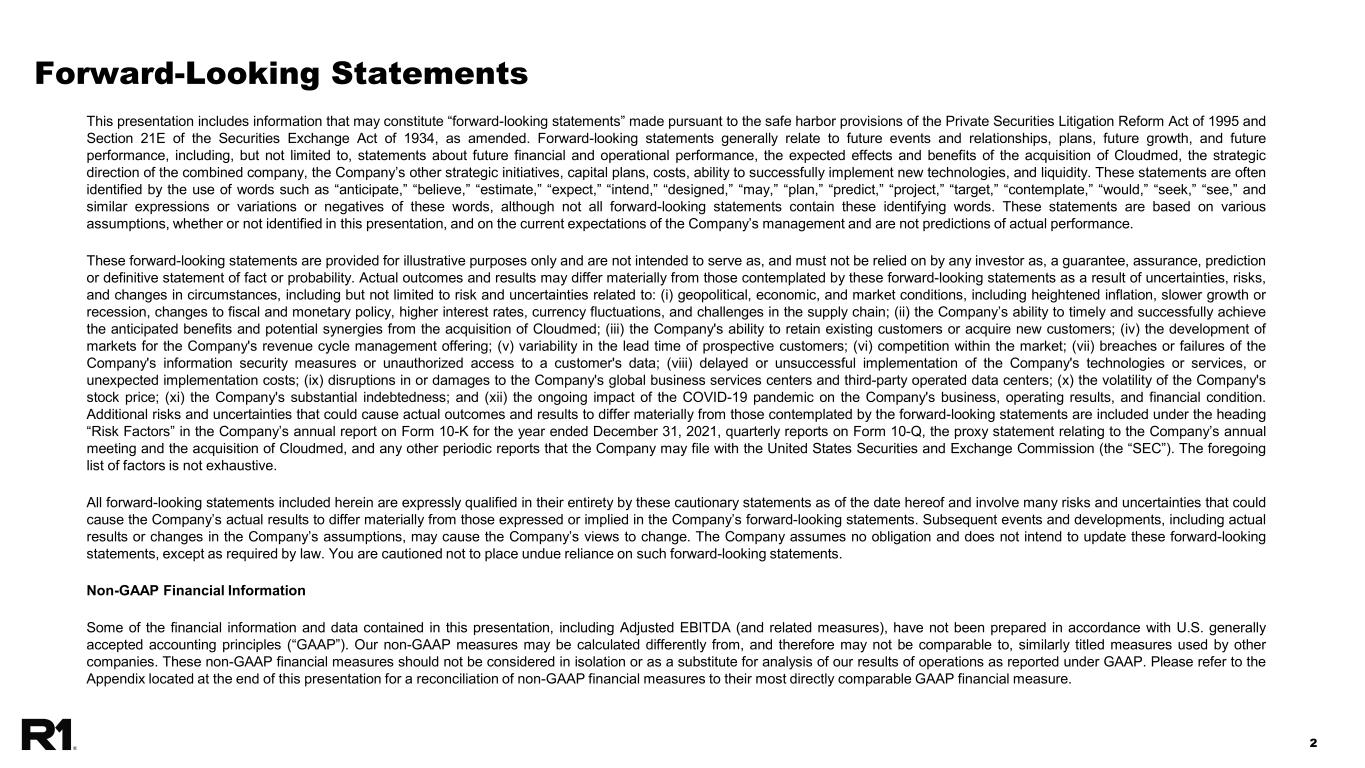
22 Forward-Looking Statements This presentation includes information that may constitute “forward-looking statements” made pursuant to the safe harbor provisions of the Private Securities Litigation Reform Act of 1995 and Section 21E of the Securities Exchange Act of 1934, as amended. Forward-looking statements generally relate to future events and relationships, plans, future growth, and future performance, including, but not limited to, statements about future financial and operational performance, the expected effects and benefits of the acquisition of Cloudmed, the strategic direction of the combined company, the Company’s other strategic initiatives, capital plans, costs, ability to successfully implement new technologies, and liquidity. These statements are often identified by the use of words such as “anticipate,” “believe,” “estimate,” “expect,” “intend,” “designed,” “may,” “plan,” “predict,” “project,” “target,” “contemplate,” “would,” “seek,” “see,” and similar expressions or variations or negatives of these words, although not all forward-looking statements contain these identifying words. These statements are based on various assumptions, whether or not identified in this presentation, and on the current expectations of the Company’s management and are not predictions of actual performance. These forward-looking statements are provided for illustrative purposes only and are not intended to serve as, and must not be relied on by any investor as, a guarantee, assurance, prediction or definitive statement of fact or probability. Actual outcomes and results may differ materially from those contemplated by these forward-looking statements as a result of uncertainties, risks, and changes in circumstances, including but not limited to risk and uncertainties related to: (i) geopolitical, economic, and market conditions, including heightened inflation, slower growth or recession, changes to fiscal and monetary policy, higher interest rates, currency fluctuations, and challenges in the supply chain; (ii) the Company’s ability to timely and successfully achieve the anticipated benefits and potential synergies from the acquisition of Cloudmed; (iii) the Company's ability to retain existing customers or acquire new customers; (iv) the development of markets for the Company's revenue cycle management offering; (v) variability in the lead time of prospective customers; (vi) competition within the market; (vii) breaches or failures of the Company's information security measures or unauthorized access to a customer's data; (viii) delayed or unsuccessful implementation of the Company's technologies or services, or unexpected implementation costs; (ix) disruptions in or damages to the Company's global business services centers and third-party operated data centers; (x) the volatility of the Company's stock price; (xi) the Company's substantial indebtedness; and (xii) the ongoing impact of the COVID-19 pandemic on the Company's business, operating results, and financial condition. Additional risks and uncertainties that could cause actual outcomes and results to differ materially from those contemplated by the forward-looking statements are included under the heading “Risk Factors” in the Company’s annual report on Form 10-K for the year ended December 31, 2021, quarterly reports on Form 10-Q, the proxy statement relating to the Company’s annual meeting and the acquisition of Cloudmed, and any other periodic reports that the Company may file with the United States Securities and Exchange Commission (the “SEC”). The foregoing list of factors is not exhaustive. All forward-looking statements included herein are expressly qualified in their entirety by these cautionary statements as of the date hereof and involve many risks and uncertainties that could cause the Company’s actual results to differ materially from those expressed or implied in the Company’s forward-looking statements. Subsequent events and developments, including actual results or changes in the Company’s assumptions, may cause the Company’s views to change. The Company assumes no obligation and does not intend to update these forward-looking statements, except as required by law. You are cautioned not to place undue reliance on such forward-looking statements. Non-GAAP Financial Information Some of the financial information and data contained in this presentation, including Adjusted EBITDA (and related measures), have not been prepared in accordance with U.S. generally accepted accounting principles (“GAAP”). Our non-GAAP measures may be calculated differently from, and therefore may not be comparable to, similarly titled measures used by other companies. These non-GAAP financial measures should not be considered in isolation or as a substitute for analysis of our results of operations as reported under GAAP. Please refer to the Appendix located at the end of this presentation for a reconciliation of non-GAAP financial measures to their most directly comparable GAAP financial measure.
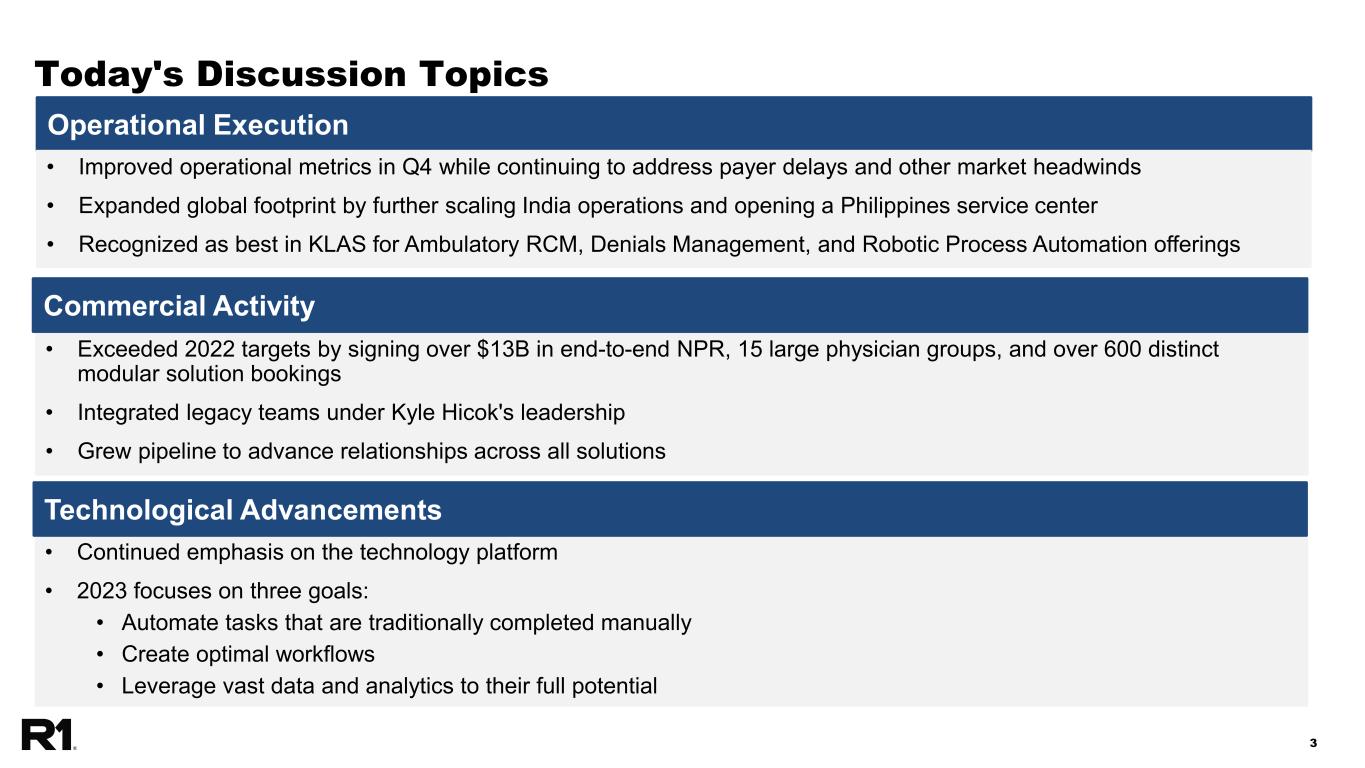
33 Today's Discussion Topics Operational Execution • Exceeded 2022 targets by signing over $13B in end-to-end NPR, 15 large physician groups, and over 600 distinct modular solution bookings • Integrated legacy teams under Kyle Hicok's leadership • Grew pipeline to advance relationships across all solutions Commercial Activity • Continued emphasis on the technology platform • 2023 focuses on three goals: • Automate tasks that are traditionally completed manually • Create optimal workflows • Leverage vast data and analytics to their full potential Technological Advancements • Improved operational metrics in Q4 while continuing to address payer delays and other market headwinds • Expanded global footprint by further scaling India operations and opening a Philippines service center • Recognized as best in KLAS for Ambulatory RCM, Denials Management, and Robotic Process Automation offerings
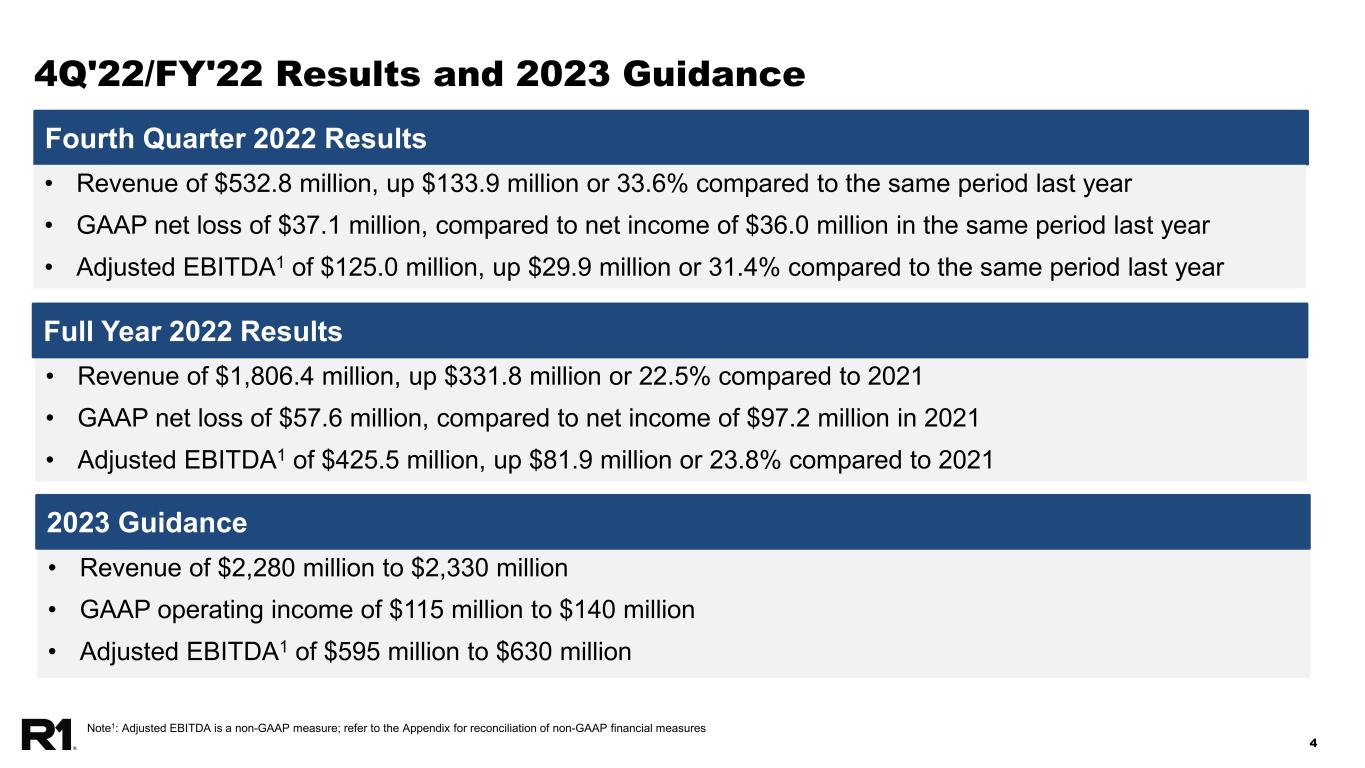
44 4Q'22/FY'22 Results and 2023 Guidance Fourth Quarter 2022 Results • Revenue of $1,806.4 million, up $331.8 million or 22.5% compared to 2021 • GAAP net loss of $57.6 million, compared to net income of $97.2 million in 2021 • Adjusted EBITDA1 of $425.5 million, up $81.9 million or 23.8% compared to 2021 Full Year 2022 Results • Revenue of $2,280 million to $2,330 million • GAAP operating income of $115 million to $140 million • Adjusted EBITDA1 of $595 million to $630 million 2023 Guidance Note1: Adjusted EBITDA is a non-GAAP measure; refer to the Appendix for reconciliation of non-GAAP financial measures • Revenue of $532.8 million, up $133.9 million or 33.6% compared to the same period last year • GAAP net loss of $37.1 million, compared to net income of $36.0 million in the same period last year • Adjusted EBITDA1 of $125.0 million, up $29.9 million or 31.4% compared to the same period last year
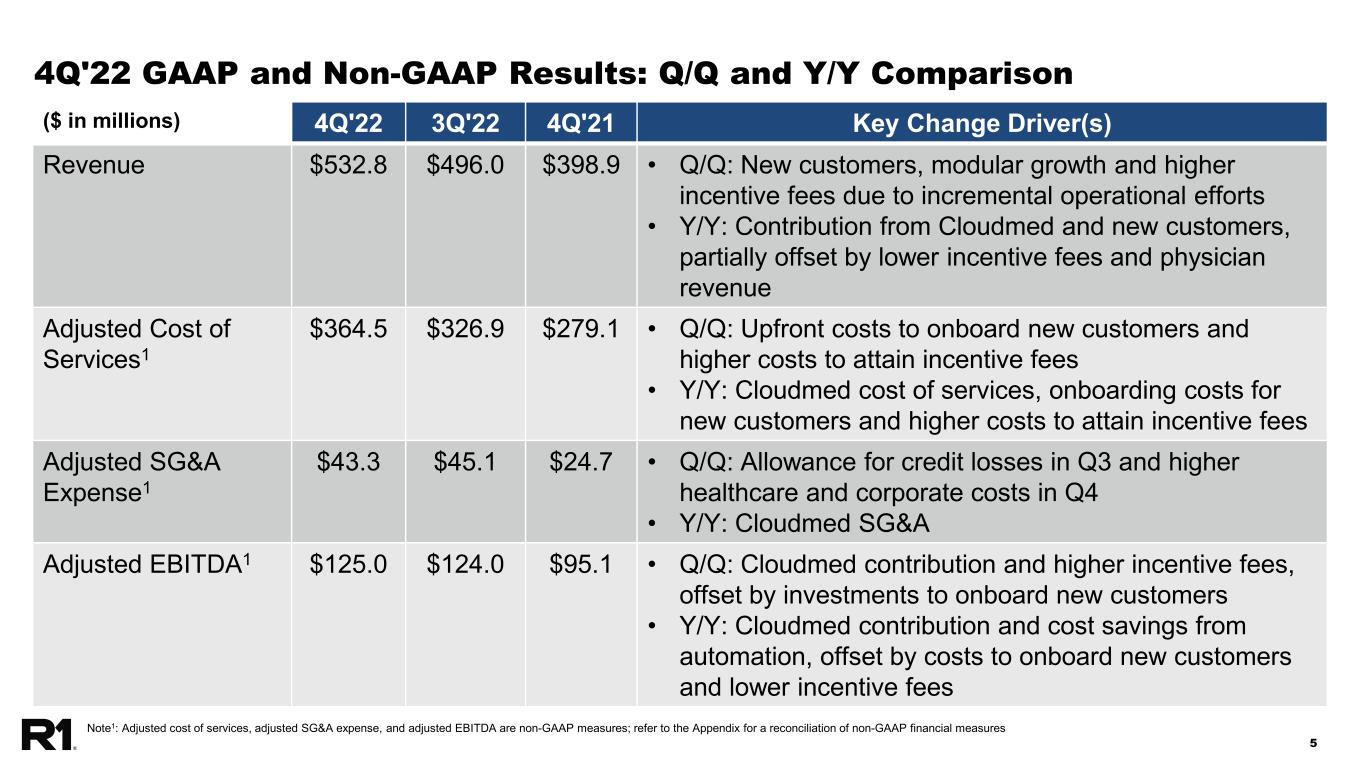
55 4Q'22 GAAP and Non-GAAP Results: Q/Q and Y/Y Comparison ($ in millions) 4Q'22 3Q'22 4Q'21 Key Change Driver(s) Revenue $532.8 $496.0 $398.9 • Q/Q: New customers, modular growth and higher incentive fees due to incremental operational efforts • Y/Y: Contribution from Cloudmed and new customers, partially offset by lower incentive fees and physician revenue Adjusted Cost of Services1 $364.5 $326.9 $279.1 • Q/Q: Upfront costs to onboard new customers and higher costs to attain incentive fees • Y/Y: Cloudmed cost of services, onboarding costs for new customers and higher costs to attain incentive fees Adjusted SG&A Expense1 $43.3 $45.1 $24.7 • Q/Q: Allowance for credit losses in Q3 and higher healthcare and corporate costs in Q4 • Y/Y: Cloudmed SG&A Adjusted EBITDA1 $125.0 $124.0 $95.1 • Q/Q: Cloudmed contribution and higher incentive fees, offset by investments to onboard new customers • Y/Y: Cloudmed contribution and cost savings from automation, offset by costs to onboard new customers and lower incentive fees Note1: Adjusted cost of services, adjusted SG&A expense, and adjusted EBITDA are non-GAAP measures; refer to the Appendix for a reconciliation of non-GAAP financial measures
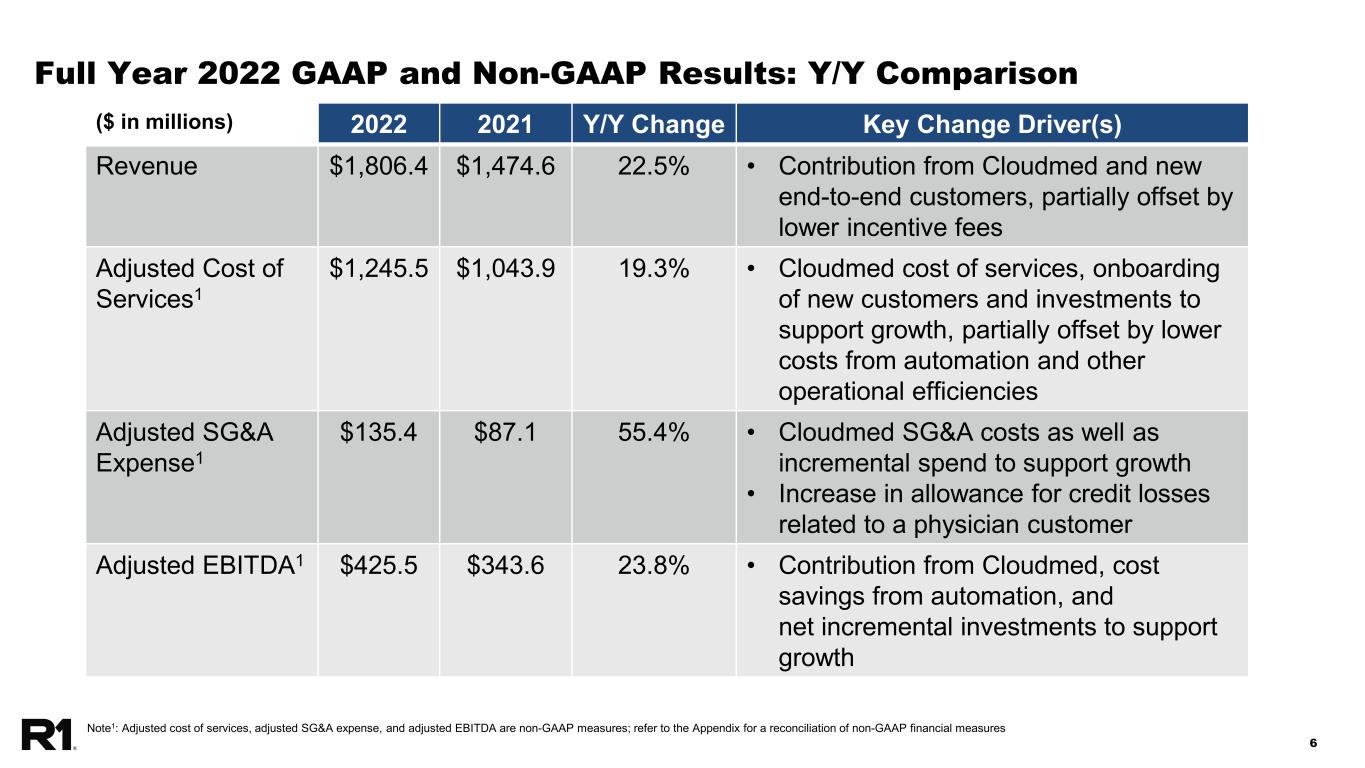
66 Full Year 2022 GAAP and Non-GAAP Results: Y/Y Comparison ($ in millions) 2022 2021 Y/Y Change Key Change Driver(s) Revenue $1,806.4 $1,474.6 22.5% • Contribution from Cloudmed and new end-to-end customers, partially offset by lower incentive fees Adjusted Cost of Services1 $1,245.5 $1,043.9 19.3% • Cloudmed cost of services, onboarding of new customers and investments to support growth, partially offset by lower costs from automation and other operational efficiencies Adjusted SG&A Expense1 $135.4 $87.1 55.4% • Cloudmed SG&A costs as well as incremental spend to support growth • Increase in allowance for credit losses related to a physician customer Adjusted EBITDA1 $425.5 $343.6 23.8% • Contribution from Cloudmed, cost savings from automation, and net incremental investments to support growth Note1: Adjusted cost of services, adjusted SG&A expense, and adjusted EBITDA are non-GAAP measures; refer to the Appendix for a reconciliation of non-GAAP financial measures
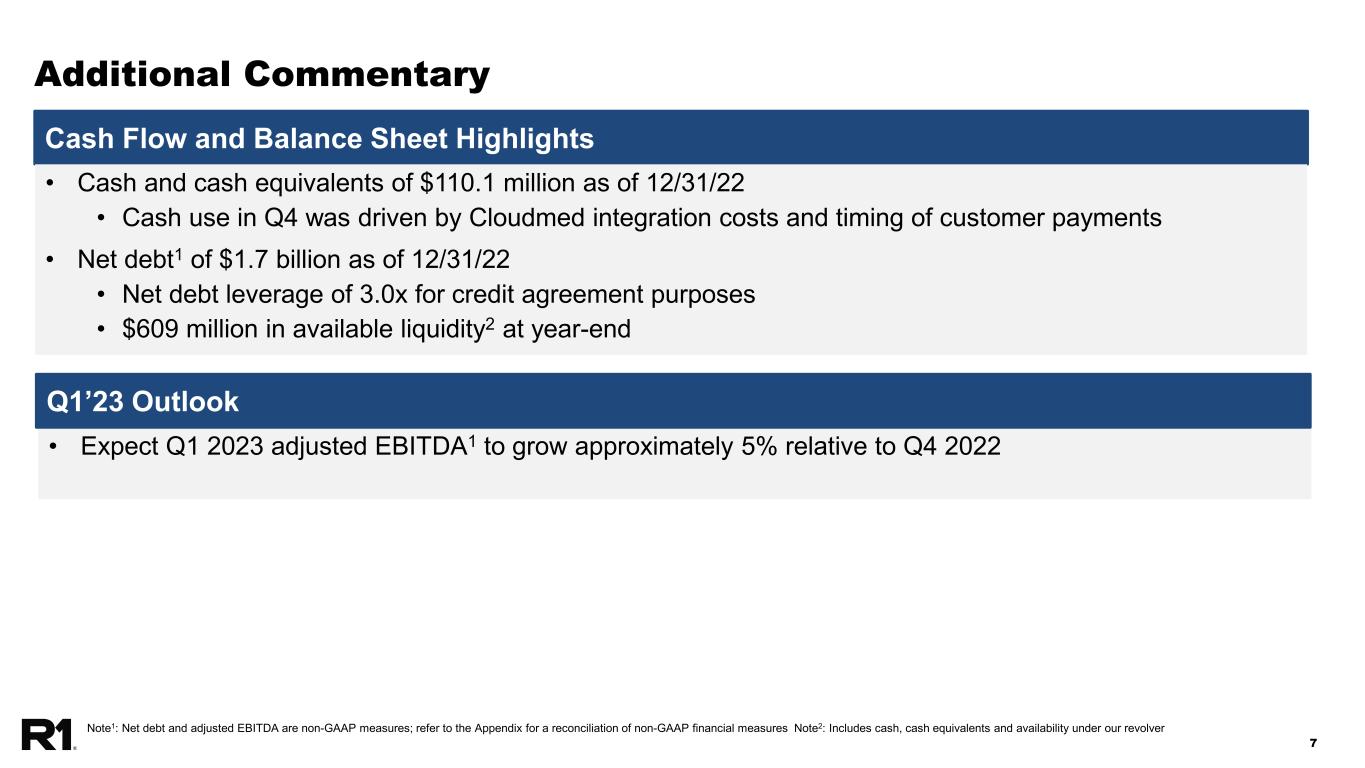
77 Additional Commentary Cash Flow and Balance Sheet Highlights • Expect Q1 2023 adjusted EBITDA1 to grow approximately 5% relative to Q4 2022 Q1’23 Outlook Note1: Net debt and adjusted EBITDA are non-GAAP measures; refer to the Appendix for a reconciliation of non-GAAP financial measures Note2: Includes cash, cash equivalents and availability under our revolver • Cash and cash equivalents of $110.1 million as of 12/31/22 • Cash use in Q4 was driven by Cloudmed integration costs and timing of customer payments • Net debt1 of $1.7 billion as of 12/31/22 • Net debt leverage of 3.0x for credit agreement purposes • $609 million in available liquidity2 at year-end

8 Appendix
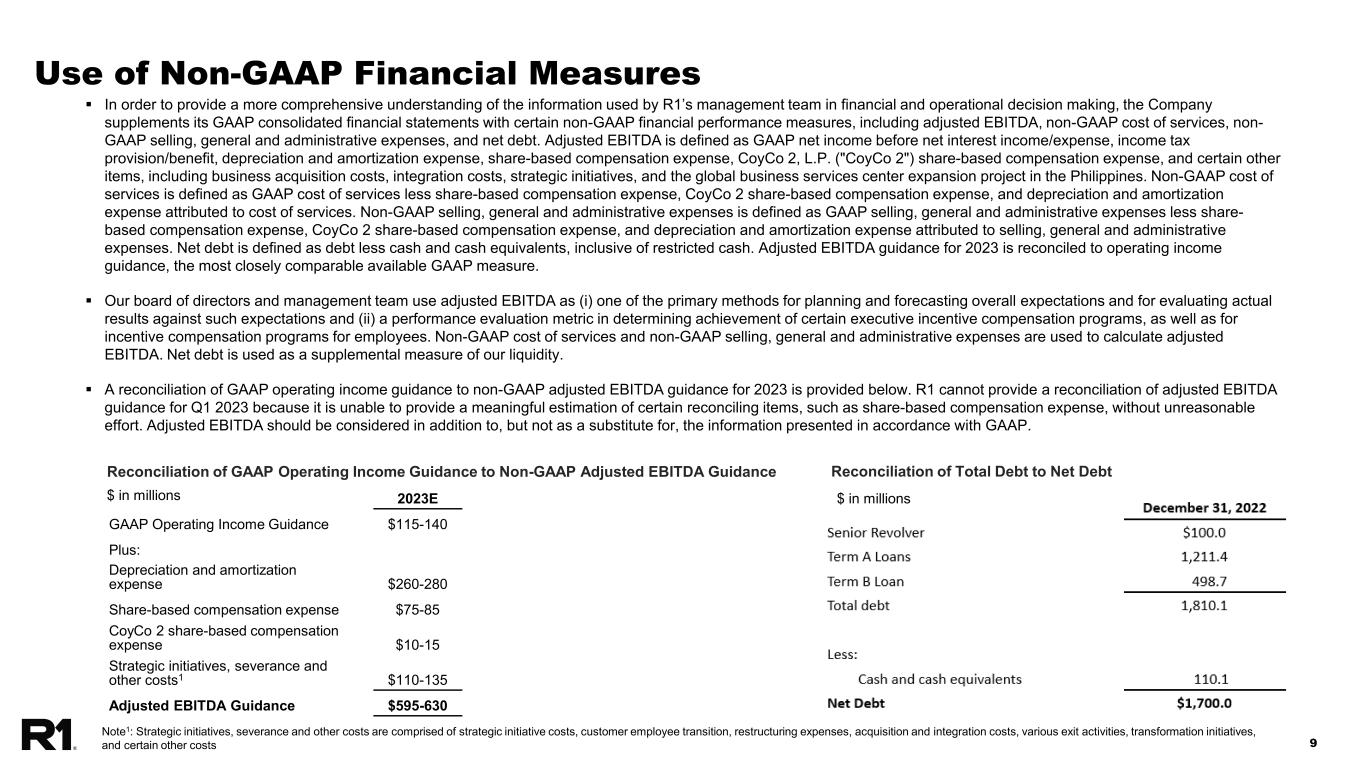
99 Use of Non-GAAP Financial Measures Reconciliation of GAAP Operating Income Guidance to Non-GAAP Adjusted EBITDA Guidance $ in millions In order to provide a more comprehensive understanding of the information used by R1’s management team in financial and operational decision making, the Company supplements its GAAP consolidated financial statements with certain non-GAAP financial performance measures, including adjusted EBITDA, non-GAAP cost of services, non- GAAP selling, general and administrative expenses, and net debt. Adjusted EBITDA is defined as GAAP net income before net interest income/expense, income tax provision/benefit, depreciation and amortization expense, share-based compensation expense, CoyCo 2, L.P. ("CoyCo 2") share-based compensation expense, and certain other items, including business acquisition costs, integration costs, strategic initiatives, and the global business services center expansion project in the Philippines. Non-GAAP cost of services is defined as GAAP cost of services less share-based compensation expense, CoyCo 2 share-based compensation expense, and depreciation and amortization expense attributed to cost of services. Non-GAAP selling, general and administrative expenses is defined as GAAP selling, general and administrative expenses less share- based compensation expense, CoyCo 2 share-based compensation expense, and depreciation and amortization expense attributed to selling, general and administrative expenses. Net debt is defined as debt less cash and cash equivalents, inclusive of restricted cash. Adjusted EBITDA guidance for 2023 is reconciled to operating income guidance, the most closely comparable available GAAP measure. Our board of directors and management team use adjusted EBITDA as (i) one of the primary methods for planning and forecasting overall expectations and for evaluating actual results against such expectations and (ii) a performance evaluation metric in determining achievement of certain executive incentive compensation programs, as well as for incentive compensation programs for employees. Non-GAAP cost of services and non-GAAP selling, general and administrative expenses are used to calculate adjusted EBITDA. Net debt is used as a supplemental measure of our liquidity. A reconciliation of GAAP operating income guidance to non-GAAP adjusted EBITDA guidance for 2023 is provided below. R1 cannot provide a reconciliation of adjusted EBITDA guidance for Q1 2023 because it is unable to provide a meaningful estimation of certain reconciling items, such as share-based compensation expense, without unreasonable effort. Adjusted EBITDA should be considered in addition to, but not as a substitute for, the information presented in accordance with GAAP. 2023E GAAP Operating Income Guidance $115-140 Plus: Depreciation and amortization expense $260-280 Share-based compensation expense $75-85 CoyCo 2 share-based compensation expense $10-15 Strategic initiatives, severance and other costs1 $110-135 Adjusted EBITDA Guidance $595-630 Note1: Strategic initiatives, severance and other costs are comprised of strategic initiative costs, customer employee transition, restructuring expenses, acquisition and integration costs, various exit activities, transformation initiatives, and certain other costs Reconciliation of Total Debt to Net Debt $ in millions

1010 Reconciliation of Non-GAAP Financial Measures $ in millions Reconciliation of GAAP Net Income (Loss) to Non-GAAP Adjusted EBITDA Three Months Ended December 31, Year Ended December 31, Three Months Ended September 30, 2022 2021 2022 2021 2022 Net income (loss) $ (37.1) $ 36.0 $ (57.6) $ 97.2 $ (29.5) Net interest expense 28.7 5.1 64.0 18.9 23.7 Income tax provision (benefit) 4.2 9.1 (3.4) 29.6 7.8 Depreciation and amortization expense 64.2 20.7 172.0 77.5 64.2 Share-based compensation expense 15.5 12.3 61.9 74.3 24.7 CoyCo 2 share-based compensation expense 2.1 — 5.1 — 3.0 Other expenses 47.4 11.9 183.5 46.1 30.1 Adjusted EBITDA (non-GAAP) $ 125.0 $ 95.1 $ 425.5 $ 343.6 $ 124.0 Reconciliation of GAAP Cost of Services to Non-GAAP Cost of Services Three Months Ended December 31, Year Ended December 31, Three Months Ended September 30, 2022 2021 2022 2021 2022 Cost of services $ 435.4 $ 304.6 $ 1,445.1 $ 1,162.8 $ 403.1 Less: Share-based compensation expense 7.4 5.4 28.1 44.2 11.3 CoyCo 2 share-based compensation expense (0.3) — 0.7 — 1.0 Depreciation and amortization expense 63.8 20.1 170.8 74.7 63.9 Non-GAAP cost of services $ 364.5 $ 279.1 $ 1,245.5 $ 1,043.9 $ 326.9 Reconciliation of GAAP SG&A to Non-GAAP SG&A Three Months Ended December 31, Year Ended December 31, Three Months Ended September 30, 2022 2021 2022 2021 2022 Selling, general and administrative $ 54.2 $ 32.2 $ 174.8 $ 120.0 $ 60.8 Less: Share-based compensation expense 8.1 6.9 33.8 30.1 13.4 CoyCo 2 share-based compensation expense 2.4 — 4.4 — 2.0 Depreciation and amortization expense 0.4 0.6 1.2 2.8 0.3 Non-GAAP selling, general and administrative $ 43.3 $ 24.7 $ 135.4 $ 87.1 $ 45.1


