Exhibit 99.3
PRO FORMA VALUATION REPORT
STANDARD CONVERSION
ECB Bancorp | Everett, Massachusetts
HOLDING COMPANY FOR:
Everett Co-Operative Bank | Everett, Massachusetts
Dated as of February 18, 2022

1311-A Dolley Madison Boulevard, Suite 2A
McLean, Virginia 22101
703.528.1700
rpfinancial.com

| February 18, 2022 |
Board of Directors
Everett Co-operative Bank
419 Broadway
Everett, Massachusetts 02149
Members of the Board Directors:
At your request, we have completed and hereby provide an independent appraisal (“Appraisal”) of the estimated pro forma market value of the common stock which is to be issued in connection with the mutual-to-stock conversion transaction described below.
This Appraisal is furnished pursuant to the requirements stipulated in the Code of Federal Regulations and has been prepared in accordance with the “Guidelines for Appraisal Reports for the Valuation of Savings and Loan Associations Converting from Mutual to Stock Form of Organization” (the “Valuation Guidelines”) of the Office of Thrift Supervision (“OTS”) and accepted by the Federal Reserve Board (“FRB”), the Office of the Comptroller of the Currency (“OCC”), the Federal Deposit Insurance Corporation (“FDIC”), the Massachusetts Commissioner of Banks (the “Commissioner”) and other state banking regulatory agencies, and applicable regulatory interpretations thereof.
Description of Plan of Conversion
On March 9, 2022, the Board of Directors of Everett Co-Operative Bank (“ECB” or the “Bank”) adopted the plan of conversion (the “Plan”); whereby the Bank will convert to stock form. As a result of the conversion, the Bank will convert to the stock form of ownership and issue all of its common stock to a to-be-formed holding called ECB Bancorp, Inc., a Maryland corporation (“the Company”). The Company will offer its common stock in a subscription offering to Eligible Account Holders, Supplemental Eligible Account Holders, Tax-Qualified Employee Plans. To the extent that shares remain available for purchase after satisfaction of all subscriptions received in the subscription offering, the shares may be offered for sale to members of the general public in a direct community offering and/or a syndicated community offering. A portion of the net proceeds received from the sale of the common stock will be used to purchase all of the then to be issued and outstanding capital stock of ECB and the balance of the net proceeds will be retained by the Company.
At this time, no other activities are contemplated for the Company other than the ownership of the Bank, a loan to the newly-formed ESOP and reinvestment of the proceeds that are retained by the Bank. In the future, the Company may acquire or organize other operating subsidiaries, diversify into other banking-related activities, pay dividends or repurchase its stock, although there are no specific plans to undertake such activities at the present time. The plan of conversion will provide for the establishment of a new charitable foundation (the “Foundation”). On a preliminary basis, the Foundation contribution is expected to consist of $600,000 of cash and 260,000 shares of Company common stock.
| Washington Headquarters | ||||||
| 1311-A Dolley Madison Boulevard | Main: (703) 528-1700 | |||||
| Suite 2A | Fax: (703) 528-1788 | |||||
| McLean, VA 22101 | Toll-Free: (866) 723-0594 | |||||
| www.rpfinancial.com | E-Mail: mail@rpfinancial.com |
Board of Directors
February 18, 2022
Page 2
RP® Financial, LC.
RP® Financial, LC. (“RP Financial”) is a financial consulting firm serving the financial services industry nationwide that, among other things, specializes in financial valuations and analyses of business enterprises and securities, including the pro forma valuation for savings institutions converting from mutual-to-stock form. The background and experience of RP Financial is detailed in Exhibit V-1. We believe that, except for the fee we will receive for the Appraisal, we are independent of the Bank, Everett Co-Operative Bank, the Bank and the other parties engaged by Everett Co-Operative Bank, the Bank or the Bank to assist in the stock conversion process.
Valuation Methodology
In preparing our Appraisal, we have reviewed the regulatory applications of the Company and the Bank, including the prospectus, as filed with the FRB, the FDIC, the Massachusetts Division of Banks and the Securities and Exchange Commission (“SEC”). We have conducted a financial analysis of the Company and the Bank that has included a review of audited financial information for the fiscal years ended December 31, 2017 through December 31, 2021, and a review of various unaudited information and internal financial reports through December 31, 2021, and due diligence related discussions with the Company’s management; Baker Newman Noyes, the Company’s independent auditor; Luse Gorman, PC, the Company’s conversion counsel and Keefe Bruyette & Woods, Inc., the Company’s marketing advisor in connection with the stock offering. All assumptions and conclusions set forth in the Appraisal were reached independently from such discussions. In addition, where appropriate, we have considered information based on other available published sources that we believe are reliable. While we believe the information and data gathered from all these sources are reliable, we cannot guarantee the accuracy and completeness of such information.
We have investigated the competitive environment within which ECB Bancorp operates and have assessed ECB Bancorp’s relative strengths and weaknesses. We have kept abreast of the changing regulatory and legislative environment for financial institutions and analyzed the potential impact on ECB Bancorp and the industry as a whole. We have analyzed the potential effects of the stock conversion on ECB Bancorp’s operating characteristics and financial performance as they relate to the pro forma market value of ECB Bancorp. We have reviewed the economic and demographic characteristics of the Company’s primary market area. We have compared ECB Bancorp’s financial performance and condition with selected publicly-traded thrifts in accordance with the Valuation Guidelines, as well as all publicly-traded thrifts and thrift holding companies. We have reviewed the current conditions in the securities markets in general and the market for thrift stocks in particular, including the market for existing thrift issues and initial public offerings by thrifts and thrift holding companies. We have excluded from such analyses thrifts subject to announced or rumored acquisition, and/or institutions that exhibit other unusual characteristics.
The Appraisal is based on ECB Bancorp’s representation that the information contained in the regulatory applications and additional information furnished to us by ECB Bancorp and its independent auditor, legal counsel and other authorized agents are truthful, accurate and complete. We did not independently verify the financial statements and other information provided by ECB Bancorp, or its independent auditor, legal counsel and other authorized agents
Board of Directors
February 18, 2022
Page 3
nor did we independently value the assets or liabilities of ECB Bancorp. The valuation considers ECB Bancorp only as a going concern and should not be considered as an indication of ECB Bancorp’s liquidation value.
Our appraised value is predicated on a continuation of the current operating environment for ECB Bancorp and for all thrifts and their holding companies. Changes in the local, state and national economy, the legislative and regulatory environment for financial institutions and mutual holding companies, the stock market, interest rates, and other external forces (such as natural disasters or significant world events) may occur from time to time, often with great unpredictability and may materially impact the value of thrift stocks as a whole or the value of ECB Bancorp’s stock alone. It is our understanding that there are no current plans for selling control of ECB Bancorp following completion of the conversion. To the extent that such factors can be foreseen, they have been factored into our analysis.
The estimated pro forma market value is defined as the price at which ECB Bancorp’s common stock, immediately upon completion of the stock offering, would change hands between a willing buyer and a willing seller, neither being under any compulsion to buy or sell and both having reasonable knowledge of relevant facts.
Valuation Conclusion
It is our opinion that, as of February 18. 2022, the estimated aggregate pro forma market value of the shares to be issued immediately following the conversion, including shares to be issued to the Foundation, equaled $95,100,000 at the midpoint, equal to $9,510,000 shares offered at a per share value of $10.00. Pursuant to conversion guidelines, the 15% valuation range applied to the midpoint of the offering including the 260,000 shares issued to the Foundation indicates a minimum market value of $81,225,000 and a maximum market value of $108,975,000. Based on the $10.00 per share offering price determined by the Board, this valuation range equates to total shares outstanding of 8,122,500 at the minimum and 10,897,500 at the maximum. In the event the appraised value is subject to an increase, the aggregate pro forma market value may be increased up to a super maximum value of $124,931,250 without a resolicitation. Based on the $10.00 per share offering price, the super maximum value would result in total shares outstanding of 12,493,125. Based on this valuation range, the offering range is as follows: $78,625,000 at the minimum, $92,500,000 at the midpoint, $106,375,000 at the maximum and $122,331,250 at the super maximum. Based on the $10.00 per share offering price, the number of offering shares is as follows: 7,862,500 at the minimum, 9,250,000 at the midpoint, 10,637,500 at the maximum and 12,233,125 at the super maximum.
Limiting Factors and Considerations
The valuation is not intended, and must not be construed, as a recommendation of any kind as to the advisability of purchasing shares of the common stock. Moreover, because such valuation is determined in accordance with applicable regulatory guidelines and is necessarily based upon estimates and projections of a number of matters, all of which are subject to change from time to time, no assurance can be given that persons who purchase shares of common stock in the conversion offering will thereafter be able to buy or sell such shares at prices
Board of Directors
February 18, 2022
Page 4
related to the foregoing valuation of the estimated pro forma market value thereof. The appraisal reflects only a valuation range as of this date for the pro forma market value of ECB Bancorp immediately upon issuance of the stock and does not take into account any trading activity with respect to the purchase and sale of common stock in the secondary market on the date of issuance of such securities or at anytime thereafter following the completion of the stock offering.
RP Financial’s valuation was based on the financial condition, operations and shares outstanding of ECB Bancorp as of December 31, 2021, the date of the financial data included in the prospectus.
RP Financial is not a seller of securities within the meaning of any federal and state securities laws and any report prepared by RP Financial shall not be used as an offer or solicitation with respect to the purchase or sale of any securities. RP Financial maintains a policy which prohibits RP Financial, its principals or employees from purchasing stock of its client institutions.
This valuation will be updated as provided for in the conversion regulations and guidelines. These updates will consider, among other things, any developments or changes in the financial performance and condition of ECB Bancorp, management policies, and current conditions in the equity markets for thrift shares, both existing issues and new issues. These updates may also consider changes in other external factors which impact value including, but not limited to: various changes in the legislative and regulatory environment for financial institutions, the stock market and the market for thrift stocks, and interest rates. Should any such new developments or changes be material, in our opinion, to the valuation of the shares, appropriate adjustments to the estimated pro forma market value will be made. The reasons for any such adjustments will be explained in the update at the date of the release of the update. The valuation will also be updated at the completion of ECB Bancorp’s stock offering.
| Respectfully submitted, | ||
| RP® FINANCIAL, LC. | ||
/s/ William E. Pommerening | ||
| William E. Pommerening | ||
| Chief Executive Officer and | ||
| Managing Director | ||
/s/ James P. Hennessey | ||
| James P. Hennessey | ||
| Director | ||
| RP® Financial, LC. | TABLE OF CONTENTS | |
| i |
TABLE OF CONTENTS
Everett Co-operative Bank
Boston, Massachusetts
| PAGE | ||||
DESCRIPTION | NUMBER | |||
CHAPTER ONE OVERVIEW AND FINANCIAL ANALYSIS |
| |||
Introduction | I.1 | |||
Plan of Conversion | I.1 | |||
Strategic Overview | I.2 | |||
Balance Sheet Trends | I.5 | |||
Income and Expense Trends | I.8 | |||
Interest Rate Risk Management | I.12 | |||
Lending Activities and Strategy | I.12 | |||
Loan Originations, Purchases and Sales | I.15 | |||
Asset Quality | I.16 | |||
Funding Composition and Strategy | I.16 | |||
Subsidiary Operations | I.17 | |||
Legal Proceedings | I.17 | |||
CHAPTER TWO MARKET AREA |
| |||
Introduction | II.1 | |||
Primary Market Area Overview | II.1 | |||
Market Area Demographics | II.2 | |||
Regional Economy | II.4 | |||
Unemployment Trends | II.6 | |||
Market Area Deposit Characteristics and Competition | II.6 | |||
CHAPTER THREE PEER GROUP ANALYSIS |
| |||
Peer Group Selection | III.1 | |||
Financial Condition | III.6 | |||
Income and Expense Components | III.9 | |||
Loan Composition | III.12 | |||
Credit Risk | III.12 | |||
Interest Rate Risk | III.15 | |||
Summary | III.17 | |||
| RP® Financial, LC. | TABLE OF CONTENTS | |
| ii |
TABLE OF CONTENTS
Everett Co-operative Bank
Boston, Massachusetts
(continued)
| PAGE | ||||
DESCRIPTION | NUMBER | |||
CHAPTER FOUR VALUATION ANALYSIS | ||||
Introduction | IV.1 | |||
Appraisal Guidelines | IV.1 | |||
RP Financial Approach to the Valuation | IV.1 | |||
Valuation Analysis | IV.2 | |||
1. Financial Condition | IV.2 | |||
2. Profitability, Growth and Viability of Earnings | IV.4 | |||
3. Asset Growth | IV.5 | |||
4. Primary Market Area | IV.6 | |||
5. Dividends | IV.7 | |||
6. Liquidity of the Shares | IV.8 | |||
7. Marketing of the Issue | IV.8 | |||
A. The Public Market | IV.9 | |||
B. The New Issue Market | IV.15 | |||
C. The Acquisition Market | IV.16 | |||
8. Management | IV.17 | |||
9. Effect of Government Regulation and Regulatory Reform | IV.17 | |||
Summary of Adjustments | IV.19 | |||
Valuation Approaches | IV.19 | |||
1. Price-to-Earnings (“P/E”) | IV.21 | |||
2. Price-to-Book (“P/B”) | IV.21 | |||
3. Price-to-Assets (“P/A”) | IV.23 | |||
Comparison to Recent Offerings | IV.23 | |||
Valuation Conclusion | IV.23 | |||
| RP® Financial, LC. | LIST OF TABLES | |
| iii |
LIST OF TABLES
Everett Co-operative Bank
Boston, Massachusetts
TABLE | DESCRIPTION | PAGE | ||||
1.1 | Historical Balance Sheet Data | I.6 | ||||
1.2 | Historical Income Statements | I.9 | ||||
2.1 | Summary Demographic Data | II.3 | ||||
2.2 | Primary Market Area Employment Sectors | II.4 | ||||
2.3 | Largest Private Employers in the Boston Metropolitan Area | II.5 | ||||
2.4 | Unemployment Trends | II.6 | ||||
2.5 | Deposit Summary | II.7 | ||||
2.6 | Market Area Deposit Competitors – As of June 30, 2021 | II.8 | ||||
3.1 | Peer Group of Publicly-Traded Banks and Thrifts | III.5 | ||||
3.2 | Balance Sheet Composition and Growth Rates | III.7 | ||||
3.3 | Income as a Percent of Average Assets and Yields, Costs, Spreads | III.10 | ||||
3.4 | Loan Portfolio Composition and Related Information | III.13 | ||||
3.5 | Credit Risk Measures and Related Information | III.14 | ||||
3.6 | Interest Rate Risk Measures and Net Interest Income Volatility | III.16 | ||||
4.1 | Peer Group Market Area Unemployment Rates | IV.7 | ||||
4.2 | Pricing Characteristics and After-Market Trends | IV.18 | ||||
4.3 | Public Market Pricing Versus Peer Group | IV.22 | ||||
| RP® Financial, LC. | OVERVIEW AND FINANCIAL ANALYSIS | |
| I.1 |
I. OVERVIEW AND FINANCIAL ANALYSIS
Introduction
Everett Co-operative Bank (“ECB”) or the Bank, established in 1890, is a Massachusetts-chartered mutual cooperative bank headquartered in Everett, Massachusetts. The Bank’s operations are conducted through the headquarters office location in Middlesex County and one full-service branch office located in Essex County. Both locations are located to the north of the City of Boston and the management considers the Bank’s markets to include Middlesex, Essex, Suffolk and Norfolk Counties. A map of ECB’s branch office locations is provided in Exhibit I-1.
The Bank is a member of the Federal Home Loan Bank (“FHLB”) system, and its deposits are insured up to the maximum allowable amount by the Federal Deposit Insurance Corporation (“FDIC”). As of December 31, 2021, Everett Co-operative Bank had total assets of $666.5 million, total deposits of $571.7 million and total equity of $77.3 million equal to 11.59% of total assets. The Bank’s audited and unaudited financial statements are included by reference as Exhibit I-2.
Plan of Conversion
The Board of Directors of Everett Co-operative adopted a plan of conversion (the “Plan”) on March 9, 2022. Pursuant to the Plan, the Bank will convert from a Massachusetts mutual cooperative bank to a Massachusetts stock cooperative bank and become the wholly owned subsidiary of ECB Bancorp, a newly formed Maryland corporation. ECB Bancorp will offer 100% of its common stock in a subscription offering to Eligible Account Holders, Supplemental Eligible Account Holders, Tax-Qualified Plans including Everett Co-operative Bank’s employee stock ownership plan (the “ESOP”). Shares of common stock not purchased in the subscription offering may be offered for sale to the general public in a community offering with a preference given to residents of Middlesex County and Essex County, Massachusetts. Any shares of common stock not purchased in the subscription offering or community offering may be offered for sale in a syndicated community offering to be managed by Keefe, Bruyette & Woods, Inc. At least 50% of the net proceeds from the stock offering will be invested in Everett Co-operative Bank and the balance of the net proceeds will be retained by the Company.
| RP® Financial, LC. | OVERVIEW AND FINANCIAL ANALYSIS | |
| I.2 |
At this time, no other activities are contemplated for the Company other than the ownership of the Bank, funding a loan to the newly-formed ESOP and reinvestment of the proceeds that are retained by the Company. In the future, Everett Co-operative Bank may acquire or organize other operating subsidiaries, diversify into other banking-related activities, pay dividends or repurchase its stock, although there are no specific plans to undertake such activities at the present time.
The Plan will provide for a contribution to the Everett Co-operative Bank Foundation, a newly established charitable foundation previously established to be established in connection with the Conversion (the “Foundation”). The Foundation contribution will be funded with a contribution consisting of 260,000 shares of ECB Bancorp common stock and $600,000 of cash The purpose of the Foundation is to provide financial support to charitable organizations in the communities in which Everett Co-operative Bank operates, and the contribution will enable those communities to share in the Company’s long-term growth. The Foundation is dedicated completely to community activities and the promotion of charitable causes.
Strategic Overview
ECB has been serving Middlesex and Essex Counties and other nearby areas in the Boston metropolitan area as a locally-owned and operated financial institution since its founding in 1890. For many years ECB operated as a traditional thrift institution, originating for portfolio long-term fixed rate residential loans funded with certificates of deposit. In recent years, the Bank has strived to diversify the loan portfolio into multifamily and commercial real estate mortgage loans, home equity loans and lines of credit, commercial business loans and construction loans. An additional benefit of this strategy has been an increase in lower cost core deposit accounts, related to the commercial lending activities. The Bank’s products and services are focused on the lending and investment needs of the local retail and commercial customer base as well as households in the market area. Based on the operating history and growth of the Bank since its founding, the Bank has established, to certain degree, its name recognition and overall reputation in the eastern Massachusetts marketplace. In addition, the Bank views itself as an integral part of the local communities served, and thus has historically strongly supported the retail customer base through providing residential loan products.
Loans constitute the major portion of the Bank’s composition of interest-earning assets, with residential and commercial real estate loans comprising the two largest concentrations of the Bank’s loan portfolio. Investments serve as a supplement to the Bank’s lending activities
| RP® Financial, LC. | OVERVIEW AND FINANCIAL ANALYSIS | |
| I.3 |
and the investment portfolio is considered to be indicative of a low risk investment philosophy, as government-sponsored residential mortgage-backed securities constitute a significant portion of the Bank’s investment portfolio.
Deposits have consistently served as the primary funding source for the Bank, with supplemental funding provided by utilization of borrowings as an alternative funding source for purposes of managing funding costs and interest rate risk. Core deposits, consisting of transaction and savings account deposits constitute the substantial portion of the Bank’s deposit base. Borrowings currently held by the Bank consist primarily of FHLB advances.
Everett Co-operative Bank’s earnings base is largely dependent upon net interest income and operating expense levels. The Bank’s net interest margin has trended higher in recent years, primarily reflecting the benefit of overall balance sheet growth including expansion of the loan portfolio. Importantly, the Bank’s yield on assets and cost of liabilities have diminished at a comparable pace such that the Bank’s spreads and margins have remained relatively stable over the last several years.
The Bank’s mortgage lending emphasis coupled with operations within an efficient two office branch network have been effective at limiting the Bank’s operating expense ratio to levels below 2% of assets. At the same time, the mortgage lending emphasis which has focused on lending for portfolio has limited non-interest fee income.
Importantly, the Bank has commenced a transition of its business operations and strategy to reflect a growth-oriented business plan wherein the Bank is seeking to grow the loan portfolio and asset base in a range of 6% to 10% annually with a gradual diversification of the loan portfolio to reflect a higher proportion of commercial mortgage loans. In order to accomplish this goal, the Bank has been and will continue to invest in a number of key areas including:
| • | Human capital including executive management and staff; |
| • | Technology; |
| • | Compliance; and |
| • | Risk management |
In order to accomplish these goals, ECB has recently employed a new executive to head up retail banking and expects to continue to employ additional lenders in both the commercial and residential lending areas. On a preliminary basis, management estimates ECB’s cost structure will increase in a range of $2 million next year on a pre-tax basis relative to the core run rate last year reflecting the addition of management, lenders, and back-office staff in a
| RP® Financial, LC. | OVERVIEW AND FINANCIAL ANALYSIS | |
| I.4 |
variety of areas to support the planned growth and diversification. Importantly, the impact of these investments will be to initially depress earnings over the next several years relative to the current core earnings rate while the earnings benefits of the foregoing investments are projected to be realized over the longer term.
The adoption of a growth-oriented business plan coupled with the plan diversification and development of commercial account relationships was a key factor in the decision to move forward with the standard conversion. The post-offering business plan will be focused on ECB historical roots in the Essex and Middlesex County markets with gradual reorientation of operations to reflect an increased emphasis on expanding commercial account relationships. In addition, the Bank will seek to continue to develop the infrastructure management believes ECB requires in order to be an effective competitor in the commercial and retail banking arena locally. Accordingly, ECB will continue to employ additional staff as needed to support growth of its commercial and consumer banking products and services. Furthermore, ECB may likely make additional capital investments in its retail branch network and technology to support its growth and expansion initiatives. The addition of the stock-based benefit plans is expected to improve the ability to attract and retain highly qualified individuals able to execute the plan. With the completion of the conversion, the Bank will also be in a better position to pursue growth through additional acquisitions of other financial service providers following the stock offering, given its strengthened capital position. The projected uses of proceeds are highlighted below.
| • | The Company. The Company is expected to retain not more than 50% of the net offering proceeds. At present, funds at the Company level, net of the loan to the ESOP, are expected to be primarily invested initially into liquid funds held as a deposit at the Bank. Over time, the funds may be utilized for various corporate purposes, possibly including acquisitions, infusing additional equity into the Bank, repurchases of common stock and the payment of cash dividends. |
| • | Everett Co-Operative Bank. At least 50% of the net conversion proceeds will be infused into the Bank. Cash proceeds (i.e., net proceeds less deposits withdrawn to fund stock purchases) infused into ECB are anticipated to become part of general operating funds and are expected to be primarily utilized to fund loan growth over time. |
Overall, it is the Company’s objective to pursue controlled growth that will serve to increase returns, while continuing to emphasize management of the overall risk associated with ECB Bancorp’s operations.
| RP® Financial, LC. | OVERVIEW AND FINANCIAL ANALYSIS | |
| I.5 |
Balance Sheet Trends
Table 1.1 shows the Bank’s historical balance sheet data for the past four fiscal years and as of December 31, 2021. From yearend 2017 through December 31, 2021, Everett Co-operative Bank’s assets increased at a 9.03% annual rate. The most significant contributor to assets growth was loan growth, which was primarily funded by deposit growth. A summary of Everett Co-operative Bank’s key operating ratios for the past three years is presented in Exhibit I-3.
Everett Co-operative Bank’s loans receivable portfolio increased at a 6.43% annual rate from yearend 2017 through December 31, 2021. The Bank has been seeking continued growth in the loan portfolio, both with respect to residential mortgage volume and growth in commercial relationships in order to stabilize the yield on assets at or above 4%. Notwithstanding the concerted effort to expand the loan portfolio, the loans-to-assets ratio diminished from 85.44% at yearend 2017 to 77.59% at December 31, 2021.
Everett Co-operative Bank’s emphasis on mortgage lending including both residential and commercial mortgage lending is evidenced by the historical composition of its loan portfolio. Over the past four years, mortgage loans have approximated 98% of gross loans which has included a broad mix of loans secured by residential, multi-family and commercial properties.
As of December 31, 2021, the balance of permanent first and second lien 1-4 family residential mortgage loans totaled $285.7 million, or 54.8% of total loans, and consisted of $259.7 million of 1st lien loans and $26.1 million of home equity loans. In addition, the Bank has been seeking to build commercial relationships to achieve an optimal balance between consume and commercial lending. Evidence of this effort is indicated in the loan portfolio composition which shows that commercial and multi-family mortgage loans together totaled $159.5 million, or 30.6% of total loans. The balance of the loan portfolio was comprised of construction loans ($70.7 million or 13.5% of loans) and small balances of non-mortgage loans which comprised a little more than 1% of the gross loan portfolio.
The intent of the Bank’s investment policy is to provide adequate liquidity and to generate a favorable return within the context of supporting Everett Co-operative Bank’s overall credit and interest rate risk objectives. The Bank is still evaluating options for the reinvestment of funds retained by the Company, one of which would be to place the funds on deposit with the Bank. Since yearend 2017, the Bank’s level of cash and investment securities (inclusive of FHLB stock) ranged from a low of 11.09% of assets at yearend 2018 to a high of 18.70% of
| RP® Financial, LC. | OVERVIEW AND FINANCIAL ANALYSIS | |
| I.6 |
Table 1.1
Everett Co-Operative Bank
Historical Balance Sheet Data
| Compounded | ||||||||||||||||||||||||||||||||||||||||||||
| As of the Fiscal Year Ended December 31, | Annual | |||||||||||||||||||||||||||||||||||||||||||
| 2017 | 2018 | 2019 | 2020 | 2021 | Growth Rate | |||||||||||||||||||||||||||||||||||||||
| Amount | Pct(1) | Amount | Pct(1) | Amount | Pct(1) | Amount | Pct(1) | Amount | Pct(1) | Pct | ||||||||||||||||||||||||||||||||||
| ($000) | (%) | ($000) | (%) | ($000) | (%) | ($000) | (%) | ($000) | (%) | (%) | ||||||||||||||||||||||||||||||||||
Total Amount of: | ||||||||||||||||||||||||||||||||||||||||||||
Assets | $ | 471,649 | 100.00 | % | $ | 497,897 | 100.00 | % | $ | 518,290 | 100.00 | % | $ | 587,625 | 100.00 | % | $ | 666,489 | 100.00 | % | 9.03 | % | ||||||||||||||||||||||
Cash and equivalents | 14,606 | 3.10 | % | 14,395 | 2.89 | % | 30,424 | 5.87 | % | 43,411 | 7.39 | % | 52,975 | 7.95 | % | 38.00 | % | |||||||||||||||||||||||||||
Securities available for sale | 0 | 0.00 | % | 0 | 0.00 | % | 0 | 0.00 | % | 5,037 | 0.86 | % | 5,010 | 0.75 | % | N/A | ||||||||||||||||||||||||||||
Securities held to maturity | 36,228 | 7.68 | % | 37,877 | 7.61 | % | 41,997 | 8.10 | % | 52,969 | 9.01 | % | 65,571 | 9.84 | % | 15.99 | % | |||||||||||||||||||||||||||
Federal Home Loan Bank stock | 2,266 | 0.48 | % | 2,942 | 0.59 | % | 1,668 | 0.32 | % | 1,418 | 0.24 | % | 1,087 | 0.16 | % | -16.78 | % | |||||||||||||||||||||||||||
Loans receivable (net) | 402,991 | 85.44 | % | 425,697 | 85.50 | % | 426,770 | 82.34 | % | 467,159 | 79.50 | % | 517,131 | 77.59 | % | 6.43 | % | |||||||||||||||||||||||||||
Fixed assets | 3,367 | 0.71 | % | 4,518 | 0.91 | % | 4,222 | 0.81 | % | 3,980 | 0.68 | % | 3,784 | 0.57 | % | 2.96 | % | |||||||||||||||||||||||||||
BOLI | 8,543 | 1.81 | % | 8,824 | 1.77 | % | 9,102 | 1.76 | % | 8,957 | 1.52 | % | 14,312 | 2.15 | % | 13.77 | % | |||||||||||||||||||||||||||
Other Assets | 3,648 | 0.77 | % | 3,644 | 0.73 | % | 4,107 | 0.79 | % | 4,694 | 0.80 | % | 6,619 | 0.99 | % | 16.06 | % | |||||||||||||||||||||||||||
Deposits | $ | 393,845 | 83.50 | % | $ | 406,924 | 81.73 | % | $ | 423,813 | 81.77 | % | $ | 491,398 | 83.62 | % | $ | 571,731 | 85.78 | % | 9.77 | % | ||||||||||||||||||||||
FHLB advances | 16,000 | 3.39 | % | 24,000 | 4.82 | % | 22,000 | 4.24 | % | 18,000 | 3.06 | % | 9,000 | 1.35 | % | -13.40 | % | |||||||||||||||||||||||||||
Other liabilities | 2,220 | 0.47 | % | 3,101 | 0.62 | % | 4,299 | 0.83 | % | 5,193 | 0.88 | % | 8,485 | 1.27 | % | 39.82 | % | |||||||||||||||||||||||||||
Stockholders’ equity | $ | 59,584 | 12.63 | % | $ | 63,872 | 12.83 | % | $ | 68,178 | 13.15 | % | $ | 73,034 | 12.43 | % | $ | 77,273 | 11.59 | % | 6.71 | % | ||||||||||||||||||||||
Tangible stockholders’ equity | $ | 59,584 | 12.63 | % | $ | 63,872 | 12.83 | % | $ | 68,178 | 13.15 | % | $ | 73,034 | 12.43 | % | $ | 77,273 | 11.59 | % | 6.71 | % | ||||||||||||||||||||||
Net Unrealized Gain/(Loss) on Investment/MBS Available for Sale | $ | 25 | 0.01 | % | $ | 19 | 0.00 | % | ($ | 275 | ) | -0.05 | % | ($ | 280 | ) | -0.05 | % | ($ | 83 | ) | -0.01 | % | — | ||||||||||||||||||||
Loans/Deposits | 102.32 | % | 104.61 | % | 100.70 | % | 95.07 | % | 90.45 | % | ||||||||||||||||||||||||||||||||||
Offices Open | 2 | 2 | 2 | 2 | 2 | |||||||||||||||||||||||||||||||||||||||
| (1) | Ratios are as a percent of ending assets. |
Source: Audited financial statements and offering prospectus. RP Financial calculations.
| RP® Financial, LC. | OVERVIEW AND FINANCIAL ANALYSIS | |
| I.7 |
assets at December 31, 2021, with the recent increase the result of significant deposit growth achieved in the COVID-19 pandemic operating environment in the face of comparatively more limited loan growth.
As of December 31, 2021, the balance of cash and investments equaled $124.6 million or 18.7% of assets. Cash and equivalent balances totaled $53.0 million or 8.0% of total assets and as referenced above, recent growth has been the result of an influx of deposit funds in the COVID-19 pandemic environment. Mortgage-backed securities comprised the largest segment of the investment portfolio $44.8 million (6.7% of assets) while U.S. agency and municipal securities totaled $10.1 million and $10.6 million respectively, together approximating 3.1% of assets. As of December 31, 2021, investments maintained as held to maturity totaled $65.6 and investments maintained as available for sale totaled $5.0 million. Investments maintained as available for sale at December 31, 2021 had a net unrealized gain of $20,000 while held-to-maturity investments had an unrealized loss equal to $15,000. Exhibit I-4 provides historical detail of the Bank’s investment portfolio. As of December 31, 2021, the Bank also held $1.1 million of FHLB stock.
The Bank also maintains an investment in bank-owned life insurance (“BOLI”) policies, which cover the lives of certain officers and Trustees of the Bank. The life insurance policies earn tax-exempt income through cash value accumulation and death proceeds. As of December 31, 2021, the cash surrender value of the Bank’s BOLI equaled $14.3 million.
Since yearend 2017, Everett Co-operative Bank’s funding needs have been addressed through a combination of deposits, borrowings and internal cash flows. From yearend 2017 through December 31, 2021, the Bank’s deposits increased at a 9.77% compounded annual rate. Deposits as a percent of assets increased from 83.5% at yearend 2017 to 85.8% at December 31, 2021. Deposits growth was sustained throughout the period covered in Table 1.1. Deposit growth trends in recent years reflect that deposit growth has primarily consisted of core deposits and, to a lesser extent, growth certificates of deposit (“CDs”). Core deposits comprised 60.3% of total deposits at December 31, 2021, versus 55.8% of total deposits at December 31, 2020, and thus reflects modest growth.
Borrowings serve as an alternative funding source for the Bank to address funding needs for growth and to support management of deposit costs and interest rate risk. From yearend 2017 through the period ended December 31, 2021, borrowings were at modest levels peaking at $24.0 million as of December 31, 2018 but had diminished to $9.0 million or 1.40% of
| RP® Financial, LC. | OVERVIEW AND FINANCIAL ANALYSIS | |
| I.8 |
assets as of December 31, 2021. Borrowings currently held by the Bank consist of FHLB advances.
The Bank’s equity increased at a 6.71% annual rate from yearend 2017 through December 31, 2021, which was largely related to retention of earnings. A stronger rate of asset growth relative to equity growth since yearend 2019 provided for a decrease in the Bank’s equity-to-assets ratio from 13.15% at yearend 2019 to 11.59% at December 31, 2021. All of the Bank’s equity consists of tangible equity as there is no goodwill on the balance sheet. Everett Co-operative Bank maintained capital surpluses relative to all of its regulatory capital requirements at December 31, 2021. The addition of stock proceeds will serve to strengthen the Bank’s capital position, as well as support growth opportunities. At the same time, the increase in Everett Co-operative Bank’s pro forma capital position will initially depress its ROE.
Income and Expense Trends
Table 1.2 shows the Bank’s historical income statements for the past four fiscal years and for the twelve months ended December 31, 2021. The Bank’s reported earnings have reflected a growth trend since fiscal 2017, supported by an expanding balance sheet and loan portfolio and effective control of operating costs. In this regard, net income has increased from $2.8 million or 0.60% of average assets during 2017 to a fiscal year high of $4.9 million, equal to 0.89% of average assets in fiscal 2020. Earnings diminished in fiscal 2021, as the Bank adopted a resolution freezing benefits and terminating its participation in the Pension Plan effective as of April 30, 2022. Freezing the Pension Plan eliminated all future benefit accruals; however, the accrued benefits as of April 30, 2022, remain. During the year ended December 31, 2021, ECB recognized $2.0 million as a Pension Plan expense. However, the actual cost could be higher since the actual cost is primarily dependent on the value of the Pension Plan’s assets and interest rates at the time of termination. Excluding the expense from freezing the pension plan on a tax effected basis, core earnings in fiscal 2021 were estimated to equal $5.5 million or 0.88% of average assets on a tax effected basis.
Net interest income and operating expenses represent the primary components of the Bank’s recurring earnings, while non-interest operating income is a relatively limited contributor to the Bank’s earnings. Loan loss provisions have had a modest impact on the Bank’s earnings over the past five years given ECB’s relatively conservative underwriting and the secured nature of the Bank’s mortgage loan portfolio coupled with a trend for rising real estate prices in the
| RP® Financial, LC. | OVERVIEW AND FINANCIAL ANALYSIS | |
| I.9 |
Table 1.2
Everett Co-operative Bank
Historical Income Statements
| For the Fiscal Year Ended December 31, 2021 | ||||||||||||||||||||||||||||||||||||||||
| 2017 | 2018 | 2019 | 2020 | 2021 | ||||||||||||||||||||||||||||||||||||
| Amount | Pct(1) | Amount | Pct(1) | Amount | Pct(1) | Amount | Pct(1) | Amount | Pct(1) | |||||||||||||||||||||||||||||||
| ($000) | (%) | ($000) | (%) | ($000) | (%) | ($000) | (%) | ($000) | (%) | |||||||||||||||||||||||||||||||
Interest Income | $ | 17,830 | 3.88 | % | $ | 20,513 | 4.23 | % | $ | 21,817 | 4.29 | % | $ | 21,487 | 3.93 | % | $ | 22,375 | 3.57 | % | ||||||||||||||||||||
Interest Expense | (4,231 | ) | -0.92 | % | (5,771 | ) | -1.19 | % | (7,183 | ) | -1.41 | % | (5,637 | ) | -1.03 | % | (3,681 | ) | -0.59 | % | ||||||||||||||||||||
|
|
|
|
|
|
|
|
|
|
|
|
|
|
|
|
|
|
|
| |||||||||||||||||||||
Net Interest Income | $ | 13,599 | 2.96 | % | $ | 14,742 | 3.04 | % | $ | 14,634 | 2.88 | % | $ | 15,850 | 2.90 | % | $ | 18,694 | 2.98 | % | ||||||||||||||||||||
Provision for Loan Losses | (270 | ) | -0.06 | % | (220 | ) | -0.05 | % | (200 | ) | -0.04 | % | (293 | ) | -0.05 | % | (360 | ) | -0.06 | % | ||||||||||||||||||||
|
|
|
|
|
|
|
|
|
|
|
|
|
|
|
|
|
|
|
| |||||||||||||||||||||
Net Interest Income after Provisions | $ | 13,329 | 2.90 | % | $ | 14,522 | 3.00 | % | $ | 14,434 | 2.84 | % | $ | 15,557 | 2.85 | % | $ | 18,334 | 2.92 | % | ||||||||||||||||||||
Other Income | 767 | 0.17 | % | 931 | 0.19 | % | 1,272 | 0.25 | % | 1,282 | 0.23 | % | 1,222 | 0.19 | % | |||||||||||||||||||||||||
Operating Expense | (8,767 | ) | -1.91 | % | (9,482 | ) | -1.96 | % | (9,840 | ) | -1.94 | % | (10,306 | ) | -1.89 | % | (12,084 | ) | -1.93 | % | ||||||||||||||||||||
Expense of Pension Plan Termination | 0 | 0.00 | % | 0 | 0.00 | % | 0 | 0.00 | % | 0 | 0.00 | % | (2,001 | ) | -0.32 | % | ||||||||||||||||||||||||
|
|
|
|
|
|
|
|
|
|
|
|
|
|
|
|
|
|
|
| |||||||||||||||||||||
Net Operating Income | $ | 5,329 | 1.16 | % | $ | 5,971 | 1.23 | % | $ | 5,866 | 1.15 | % | $ | 6,533 | 1.20 | % | $ | 5,471 | 0.87 | % | ||||||||||||||||||||
Non-Operating Income/Expense | ||||||||||||||||||||||||||||||||||||||||
Gain(Loss) on Sale/Impair of Investments | $ | 0 | 0.00 | % | $ | 0 | 0.00 | % | $ | 0 | 0.00 | % | $ | 0 | 0.00 | % | $ | 0 | 0.00 | % | ||||||||||||||||||||
Income/(Loss) Before Tax | $ | 5,329 | 1.16 | % | $ | 5,971 | 1.23 | % | $ | 5,866 | 1.15 | % | $ | 6,533 | 1.20 | % | $ | 5,471 | 0.87 | % | ||||||||||||||||||||
Income Tax Provision (Benefit) | (2,577 | ) | -0.56 | % | (1,609 | ) | -0.33 | % | (1,523 | ) | -0.30 | % | (1,673 | ) | -0.31 | % | (1,429 | ) | -0.23 | % | ||||||||||||||||||||
|
|
|
|
|
|
|
|
|
|
|
|
|
|
|
|
|
|
|
| |||||||||||||||||||||
Net Income (Loss) | $ | 2,752 | 0.60 | % | $ | 4,362 | 0.90 | % | $ | 4,343 | 0.85 | % | $ | 4,860 | 0.89 | % | $ | 4,042 | 0.64 | % | ||||||||||||||||||||
Adjusted Earnings | ||||||||||||||||||||||||||||||||||||||||
Net Income | $ | 2,752 | 0.60 | % | $ | 4,362 | 0.90 | % | $ | 4,343 | 0.85 | % | $ | 4,860 | 0.89 | % | $ | 4,042 | 0.64 | % | ||||||||||||||||||||
Deduct: Expense of Pension Termination | 0 | 0.00 | % | 0 | 0.00 | % | 0 | 0.00 | % | $ | 0 | 0.00 | % | $ | 2,001 | 0.32 | % | |||||||||||||||||||||||
Tax Effect (2) | 0 | 0.00 | % | 0 | 0.00 | % | 0 | 0.00 | % | 0 | 0.00 | % | (520 | ) | -0.08 | % | ||||||||||||||||||||||||
|
|
|
|
|
|
|
|
|
|
|
|
|
|
|
|
|
|
|
| |||||||||||||||||||||
Adjusted Earnings | $ | 2,752 | 0.60 | % | $ | 4,362 | 0.90 | % | $ | 4,343 | 0.85 | % | $ | 4,860 | 0.89 | % | $ | 5,523 | 0.88 | % | ||||||||||||||||||||
Expense Coverage Ratio (2) | 155.1 | % | 155.5 | % | 148.7 | % | 153.8 | % | 154.7 | % | ||||||||||||||||||||||||||||||
Efficiency Ratio (3) | 61.0 | % | 60.5 | % | 61.9 | % | 60.2 | % | 60.7 | % | ||||||||||||||||||||||||||||||
Effective Tax Rate Cost (Benefit) | -48.4 | % | -26.9 | % | -26.0 | % | -25.6 | % | -26.1 | % | ||||||||||||||||||||||||||||||
Return on Equity | 2.28 | % | 2.90 | % | 3.95 | % | 5.47 | % | 3.85 | % | ||||||||||||||||||||||||||||||
| (1) | Ratios are as a percent of average assets. |
| (2) | Expense coverage ratio calculated as net interest income before provisions for loan losses divided by operating expenses. |
| (3) | Efficiency ratio calculated as op. exp. divided by the sum of net int. inc. before prov. for loan losses plus other income (excluding net gains). |
Source: Audited financial statements and offering prospectus. RP Financial calculations.
| RP® Financial, LC. | OVERVIEW AND FINANCIAL ANALYSIS | |
| I.10 |
Bank’s markets. Non-operating income and losses generally have not been a significant factor in the Bank’s earnings over the past five years.
During the period covered in Table 1.2, the Bank’s net interest income to average assets ratio exhibited a narrow range of 2.88% to 3.04% and equaled 2.98% for the twelve months ended December 31, 2021. At the same time, the dollar value of net interest income has been increasing as a result of growth in the balances of loans and deposits. As previously noted, the Bank’s underlying spreads have been relatively consistent as well as the decline in overall asset and loan yields have diminished in the last several years in response to historically low levels of interest rates but such reductions have been largely matched by a decline in the cost of funds. Overall, during the three years, the Bank’s interest rate spread has increased from 2.65% in fiscal 2019, to 2.72% and 2.91% in fiscal 2020, and 2021, respectively. The Bank’s net interest rate spreads and yields and costs for the past two years are set forth Exhibit I-5 and presented in summary format in Exhibit I-3.
Non-interest operating income has historically been a modest contributor to the Bank’s income statement and averaged 0.23% of average assets for the most recent three fiscal years and equaled 0.19% of average assets for the twelve months ended December 31, 2021. Most of this income is gained from deposit account fees and the BOLI investment income. Importantly, the limited fee income is reflective of the traditional thrift business model employed by the Bank where the majority of income is generated through net interest income.
Operating expenses represent the other major component of the Bank’s income statement, and as shown in Table 1.2, and reflect the limited cost inherent in ECB’s traditional thrift operating strategy and limited retail banking presence through only two office locations. Operating expenses have increased in dollar terms since the end of fiscal 2017, increasing from $8.8 million, or 1.91% of average assets to a level of $12.1 million or 1.93% of average assets for the twelve months ended December 31, 2021. However, while operating expenses have trended higher over the past four years, the Bank has been effective in leveraging the increase in operating expenses through consistent growth of the balance sheet such that the ratio of operating expenses to average assets remained within a relatively narrow range.
Overall, during the past five fiscal years, the Bank’s expense coverage ratios (net interest income divided by operating expenses) averaged 153.6% and equaled 154.7% for the twelve months ended December 31, 2021. Similarly, the Bank’s efficiency ratio (operating expenses as a percent of the sum of net interest income and other operating income) exhibited
| RP® Financial, LC. | OVERVIEW AND FINANCIAL ANALYSIS | |
| I.11 |
a relatively narrow range from 60.2% to 61.9% and equaled 60.7% for the twelve months ended December 31, 2021.
Going forward, ECB’s operating expenses and operating expense ratio are expected to increase as ECB implements its diversification, growth and expansion strategy. In particular, in order to achieve its targeted loan growth objectives wherein the Bank is seeking to grow the loan portfolio and asset base in a range of 6% to 10% annually, the Bank will invest in required human, technology and other related infrastructure to support the growth objectives and manage the related risk factors. As noted previously, management estimates ECB’s cost structure will increase in a range of $2 million next year on a pre-tax basis relative to the core run rate last year reflecting the addition of management, lenders, and back office staff in a variety of areas to support the planned growth and diversification. Initially, the incremental expenses are expected to result in a reduction of after-tax income as the expenses will not be offset by additional revenue over the short to intermediate term.
During the period covered in Table 1.2, the amount of loan loss provisions and recoveries recorded by the Bank ranged from $200,000 or 0.04% of average assets in fiscal 2019, to $360,000 equal to 0.06% of average assets reported for the twelve months ended December 31, 2021. As of December 31, 2021 the Bank maintained loan loss allowances of $4.2 million, equal to 0.81% of total loans receivable and 431.46% of non-performing loans. Exhibit I-6 sets forth the Bank’s loan loss allowance activity for the past five years.
Over the past four years, the Bank’s effective tax rate hit a peak level of 48.4% in fiscal 2017, as a change in the federal corporate tax rate resulted in a reduction in the Bank’s deferred tax asset which was reflected as a tax expense for financial reporting purposes. Subsequent to fiscal 2017, the Bank’s average effective tax rate has been in a range of 26% to 27%. Based on discussions with management, RP Financial has assumed a marginal effective tax rate equal to 25.08% consistent with the assumptions in the prospectus.
| RP® Financial, LC. | OVERVIEW AND FINANCIAL ANALYSIS | |
| I.12 |
Interest Rate Risk Management
The Bank’s balance sheet is slightly asset sensitive in the short-term (less than one year). While community banks in general have been experiencing some interest spread compression during recent periods, primarily due to low investment yields and low loan demand in the COVID-19 pandemic environment, the Bank has realized loan growth and relatively stable spreads. As of December 31, 2021, an analysis of the Bank’s economic value of equity (“EVE”) and net interest income indicated that in the event of an instantaneous parallel 200 basis point increase in the U.S. Treasury yield curve EVE would decrease by 2.1% and net interest income would increase by 1.4% in year one, which were within policy limits (see Exhibit I-7).
The Bank pursues a number of strategies to manage interest rate risk, particularly with respect to seeking to limit the repricing mismatch between interest rate sensitive assets and liabilities. The Bank manages interest rate risk from the asset side of the balance sheet through lending diversification that emphasis origination of adjustable rate or shorter-term fixed rate loans, investing in investment securities with short-terms or adjustable interest rates, maintaining the investment portfolio as available for sale and selling originations of longer term 1-4 family fixed rate loans. As of December 31, 2021, the largest segment of the loan portfolio was secured by adjustable mortgage loans with various repricing periods, typically up to 10 years (see Exhibit I-8). On the liability side of the balance sheet, the Bank’s interest rate risk is primarily managed through maintaining a concentration of deposits in lower costing and less interest rate sensitive transaction and savings account deposits. Transaction and savings account deposits comprised 60.3% of the Bank’s total deposits at December 31, 2021.
The infusion of stock proceeds will serve to further limit the Bank’s interest rate risk exposure, as most of the net proceeds will be redeployed into interest-earning assets and the increase in the Bank’s capital position will lessen the proportion of interest rate sensitive liabilities funding assets.
Lending Activities and Strategy
Pursuant to the Bank’s strategic plan, the Bank has gradually evolved from a one-office operation focused on residential mortgage lending to one which is focused on serving the north shore area of the Boston metropolitan area through the addition of a second office and gradually diversifying the loan portfolio to include commercial loan relationships including primarily commercial mortgage and construction loans. In this regard, it is the Bank’s long term stated
| RP® Financial, LC. | OVERVIEW AND FINANCIAL ANALYSIS | |
| I.13 |
objective to be the premier business bank for small and middle market customers within the Bank’s retail banking footprint on the north shore. Moreover, ECB is seeking to grow commercial DDA as part of an effort to build broad-based commercial account relationships. Exhibit I-9 provides historical detail of ECB’s loan portfolio composition for the past four fiscal years which are summarized below.
1-4 Family Residential Mortgage Loans.
This is a line of business that was the Bank’s core business for over one hundred years and ECB seeks to capitalize on its residential mortgage lending expertise in both the primary and secondary markets. In this regard, the Bank is seeking both to leverage its expertise to continue to maximize origination volume to generate portfolio products and fee income.
Everett Co-operative Bank offers both fixed rate and adjustable rate 1-4 family residential mortgage loans with terms of up to 30 years. Loans are generally underwritten to secondary market guidelines, so as to allow for the sale of such loans if such a strategy is warranted for purposes of interest rate risk management. The Bank has been retaining most loans in recent periods but will consider selling loans based on market and interest rate conditions in the future. ARM loans offered by the Bank have initial repricing terms of up to 10 years and then reprice annually for the balance of the loan term. As of December 31, 2021, the Bank’s outstanding balance of 1-4 family residential mortgage loans totaled $259.7 million equal to 49.8% of total loans outstanding.
While the majority of the Bank’s residential lending are secured by primary residences of the homeowner, approximately 26.5% of ECB’s permanent residential mortgage portfolio is secured by investor-owned rental properties. These loans are typically adjustable rate or carry higher fixed rates than the owner-occupied portfolio. [CONFIRM]
Commercial Real Estate/Multi-Family Lending
As of December 31, 2021, commercial real estate/multi-family loans totaled $159.5 million, or 30.6% of the total loan portfolio, versus $120.5 million, or 29.7% of loans as of December 31, 2017. The balances of these loans have been trending upward in recent years due to the Bank’s focus to diversify its loan portfolio and increase yield. These types of loans are attractive credits given the higher yields, larger balances, shorter duration and prospective relationship potential.
| RP® Financial, LC. | OVERVIEW AND FINANCIAL ANALYSIS | |
| I.14 |
Commercial real estate loans are generally secured by five-or-more-unit apartment buildings, industrial properties and properties used for business purposes such as small office buildings and retail facilities. Commercial real estate loans are originated with a maximum term of 25 years with adjustable rate periods every five years. The maximum LTV for commercial real estate loans is 80%, based on the appraised value of the property, and the maximum debt service coverage ratio is 1.2 times.
These loans are generally priced at a higher rate of interest, have larger balances and involve a greater risk profile than 1-4 residential mortgage loans. Often the payments on commercial real estate loans are dependent on successful operations and management of the property. When originating commercial real estate loans, the Bank evaluates the qualifications and financial condition of the borrower, as well as the value and condition of the property securing the loan. The Bank will also generally require and obtain personal guarantees from the principals and generally requires a debt service coverage ratio of at least 120%.
Construction Loans
Construction loans represent an area of lending diversification for ECB, and such loans totaled $70.7 million, or 13.5% of loans as of December 31, 2021. Construction loans are generally offered to experienced local developers operating in the primary market area and to individuals for the construction of their personal residences. Construction loans for both residential and commercial properties usually have a term of 12 to 24 months but can be longer for more complex projects. Loans can be made with a maximum loan-to-value ratio of 75% of the appraised market value upon completion of the project or 80% for construction loans to owners. ECB also makes a limited amount of land loans to complement its construction lending activities, as such loans are generally secured by lots that will be used for residential or commercial development. Land loans also include loans secured by land purchased for investment purposes.
Construction loans generally involve greater credit risk than improved owner-occupied real estate lending. ECB reviews and inspects each property before disbursement of loan funds, and also requires detailed cost estimates to complete the construction project and an appraisal of the property.
| RP® Financial, LC. | OVERVIEW AND FINANCIAL ANALYSIS | |
| I.15 |
Home Equity Lines of Credit.
The Bank’s 1-4 family lending activities include home equity lines of credit. Home equity lines of credit are tied to the prime rate as published in The Wall Street Journal and are offered for terms of up to a ten year draw period followed by a repayment term of 15 years. The Bank will originate home equity lines of credit up to a maximum loan-to value (“LTV”) ratio of 70%, inclusive of other liens on the property. As of December 31, 2021, the Bank’s outstanding balance of home equity lines of credit totaled $26.1 million equal to 5.0% of total loans receivable.
Non-Mortgage Loans.
Consumer lending is currently not an active lending area for the Bank. Consumer loans offered by the Bank consisting primarily of loans secured by deposits and overdraft lines of credit. As of December 31, 2021, the consumer loan portfolio totaled $0.5 million equal to 0.1% of total loans outstanding.
Commercial loans secured by non-resident properties represent the other major segment of non-real estate lending and totaled $5.4 million equal to 1.0% of total loans as of December 31, 2021. While it is the Bank’s desire to be a market leader in business banking on the north shore of the Boston metropolitan area, the transition will necessarily be gradual. However, the Bank is seeking to continue to build out the commercial lending function by increasing staff in the area of loan officers and support staff including in credit and underwriting.
Loan Originations, Purchases and Sales
All lending activities are conducted by bank personnel located at the office locations, underwritten pursuant to bank policies and procedures. Loan sources typically include loan officers, marketing efforts, the existing customer base, walk-in customers and referrals from real estate brokers, builders and attorneys. The Bank generally originates loans for portfolio and has not sold loans over the last several fiscal years.
ECB has also periodically purchased participation loans from other financial institutions in the market area, primarily within the state of Massachusetts. Such loans are underwritten according to the Bank’s underwriting criteria and procedures. Participations generally consist of larger commercial real estate and multi-family mortgage loans.
| RP® Financial, LC. | OVERVIEW AND FINANCIAL ANALYSIS | |
| I.16 |
Asset Quality
A healthy regional economy and Bank’s emphasis on lending in local markets have supported maintenance of relatively favorable credit quality measures. While Everett Co-operative Bank’s balance of non-performing assets was relatively high as of the yearend 2017, equal to $8.7 million or 1.84% of assets, NPAs have subsequently been at low levels ranging from 0.15% to 0.28% of assets and equaled $982,000, or 0.15% of assets as of December 31, 2021. Non-accruing loans held by the Company at December 31, 2021, consisted solely of non-performing 1st lien residential loans and a small balance of home equity loans. Exhibit I-11 summarizes key asset quality data for ECB as of the end of the last two fiscal years.
To track the Bank’s asset quality and the adequacy of valuation allowances, ECB has established detailed asset classification policies and procedures which are consistent with regulatory guidelines. Classified assets are reviewed monthly by senior management and the Loan Committee, and quarterly by the full Board. The loan portfolio is also reviewed by an independent third party. Pursuant to these procedures, when needed, the Bank establishes additional valuation allowances to cover anticipated losses in classified or non-classified assets. As of December 31, 2021, the Bank maintained loan loss allowances of $4.2 million equal to 0.81% of total loans receivable and 431.5% of non-performing loans.
Funding Composition and Strategy
Deposits have consistently served as the Bank’s primary funding source and at December 31, 2021 deposits accounted for 98.45% of Everett Co-operative Bank’s combined balance of deposits and borrowings. Exhibit I-12 sets forth the Bank’s deposit composition for the past two fiscal years. Transaction and savings account deposits constituted 60.3% of total deposits at December 31, 2021, as compared to 55.7% of total deposits at December 31, 2017 based on data set forth in the annual audit. The slight increase in the concentration of core deposits comprising total deposits since yearend 2017 was realized both through a focused effort to build core deposit accounts and as a result of the COVID-19 pandemic which resulted in an influx of funds in core accounts by depositors desiring liquidity. As of December 31, 2021, interest-bearing and non-interest checking accounts comprised 19.6% of deposits while money market and savings accounts together comprised 40.9% of deposit accounts.
The balance of the Bank’s deposits consists of CDs, which equaled 39.7% of total deposits at December 31, 2021 compared to 44.4% of total deposits at December 31, 2017.
| RP® Financial, LC. | OVERVIEW AND FINANCIAL ANALYSIS | |
| I.17 |
Everett Co-operative Bank’s current CD composition reflects a higher concentration of short-term CDs (maturities of one year or less). As of December 31, 2021, jumbo CDs with balances of more than $250,000 amounted to $44.5 million, equal to 19.6% of CD balances and 7.8% of total deposits as of December 31, 2021.
Borrowings serve as an alternative funding source for the Bank to facilitate management of funding costs and interest rate risk Borrowings totaled $9.0 million at December 31, 2021 and consisted solely of FHLB advances.
Subsidiary Activities
Everett Co-operative Bank has one subsidiary, First Everett Securities Corporation, Inc. (“FESC”), a Massachusetts corporation, which is engaged in the buying, selling and holding of investment securities. The income earned on FESC, Inc.’s securities is subject to a significantly lower rate of state tax than that assessed on income earned on securities maintained at Everett Co-operative Bank. At December 31, 2021, FESC, Inc. had total assets of $36.6 million, substantially all of which were in securities and cash to be invested.
Legal Proceedings
The Bank is not currently party to any pending legal proceedings that the Bank’s management believes would have a material adverse effect on the Bank’s financial condition, results of operations or cash flows.
| RP® Financial, LC. | MARKET AREA | |
| II.1 |
II. MARKET AREA
Introduction
ECB serves the Boston metropolitan area through the main office in Everett, Massachusetts and a branch office in Lynnfield, Massachusetts. The Bank’s main office is located in Middlesex County and the branch is in Essex County, both of which are located north of Boston in the area commonly known as the North Shore area of Boston.
With operations in a major metropolitan area, the Bank’s competitive environment includes a significant number of thrifts, commercial banks and other financial services companies, some of which have a regional or national presence and are larger than the Bank in terms of deposits, loans, scope of operations, and number of branches. These institutions also have greater resources at their disposal than the Bank. The Boston metropolitan area has a highly developed economy, with a relatively high concentration of highly skilled workers who are employed in a number of different industry clusters including healthcare, financial services and technology.
Future growth opportunities for ECB depend on the future growth and stability of the national and regional economy, demographic growth trends and the nature and intensity of the competitive environment. These factors have been examined to help determine the growth potential that exists for the Bank, the relative economic health of the Bank’s market area, and the resultant impact on value.
Primary Market Area Overview
The primary market area for business operations is the eastern portion of the Commonwealth of Massachusetts, which includes the Boston metropolitan statistical area (the “Boston MSA”). To a much lesser extent, the Bank conducts business (primarily lending) in contiguous areas. Eastern Massachusetts is a relatively well-developed area settled in the early part of the country’s history that has a wide range of new and old housing and commercial building stock. Geographically, the market area covers a small area, and thus the Bank’s current branch office network provides access to a material portion of the statewide population base. Such operations are essentially limited to the southern portion of the Boston MSA (the region containing all of the Bank’s offices) and the southeastern region of Massachusetts.
| RP® Financial, LC. | MARKET AREA | |
| II.2 |
The market area served by the Bank, characterized primarily as the Boston MSA, has a highly developed and diverse economy, with the region’s many colleges and universities serving to attract industries in need of a highly skilled and educated workforce. Healthcare, high-tech and financial services companies constitute major sources of employment in the regional market area, as well as the colleges and universities that populate the Boston MSA. Tourism also is a prominent component of market area’s economy, as Boston annually ranks as one of the nation’s top tourist destinations.
ECB holds a small market share of deposits in the primary market area, given its asset size, number and size of competitors and the overall population base, and thus has potential for additional growth. Similar to other areas of the country, ECB operates in a competitive environment and competes with a number of national, regional and locally-based financial institutions. In addition, the Bank faces competition from mortgage banking companies, consumer finance companies, investment houses, mutual funds, insurance companies and other financial intermediaries. Competitive factors have intensified with the growth of electronic delivery systems.
Market Area Demographics
Demographic and economic growth trends, measured by changes in population, number of households, age distribution and median household income, provide key insight into the health of the market area served by ECB. Demographic data for Middlesex and Essex Counties in Massachusetts is provided in Table 2.1.
Population and household data indicate that the market area served by the Bank’s branches is largely suburban in nature. Middlesex and Essex Counties serve a large population base totaling 2.5 million people in aggregate. In addition, the population has been increasing in at an approximate rate of 0.6% annually and is projected to continue to increase at the same rate over the next five years. The Boston MSA’s population size reached 5.0 million as of the year end 2021, and also reflected a 0.6% annual rate over the past five years. These growth rates are in line with recent and expected statewide and national population growth rates. This represents a favorable statistic for financial institutions such as ECB, as the demand for personal financial services may likely improve in the near term future. Additional detail regarding the demographic trends of the local market has been included in Table 2.1.
| RP® Financial, LC. | MARKET AREA | |
| II.3 |
Table 2.1
Everett Co-operative Bank
Summary Demographic Data
| Year | Growth Rate | |||||||||||||||||||
| 2017 | 2022 | 2027 | 2017-2022 | 2022-2027 | ||||||||||||||||
| (%) | (%) | |||||||||||||||||||
Population (000) | ||||||||||||||||||||
USA | 325,139 | 334,280 | 344,999 | �� | 0.6 | % | 0.6 | % | ||||||||||||
Massachusetts | 6,861 | 7,079 | 7,380 | 0.6 | % | 0.8 | % | |||||||||||||
Boston-Cambridge-Newton, MA-NH | 4,833 | 5,012 | 5,239 | 0.7 | % | 0.9 | % | |||||||||||||
Essex, MA | 785 | 814 | 851 | 0.7 | % | 0.9 | % | |||||||||||||
Middlesex, MA | 1,607 | 1,653 | 1,728 | 0.6 | % | 0.9 | % | |||||||||||||
Households (000) | ||||||||||||||||||||
USA | 123,357 | 127,074 | 131,388 | 0.6 | % | 0.7 | % | |||||||||||||
Massachusetts | 2,682 | 2,783 | 2,913 | 0.7 | % | 0.9 | % | |||||||||||||
Boston-Cambridge-Newton, MA-NH | 1,882 | 1,962 | 2,059 | 0.8 | % | 1.0 | % | |||||||||||||
Essex, MA | 303 | 315 | 330 | 0.8 | % | 1.0 | % | |||||||||||||
Middlesex, MA | 624 | 646 | 677 | 0.7 | % | 0.9 | % | |||||||||||||
Median Household Income ($) | ||||||||||||||||||||
USA | 57,462 | 72,465 | 81,230 | 4.7 | % | 2.3 | % | |||||||||||||
Massachusetts | 72,859 | 94,232 | 105,455 | 5.3 | % | 2.3 | % | |||||||||||||
Boston-Cambridge-Newton, MA-NH | 80,000 | 103,847 | 116,543 | 5.4 | % | 2.3 | % | |||||||||||||
Essex, MA | 74,010 | 91,762 | 102,341 | 4.4 | % | 2.2 | % | |||||||||||||
Middlesex, MA | 90,117 | 118,062 | 132,394 | 5.6 | % | 2.3 | % | |||||||||||||
Per Capita Income ($) | ||||||||||||||||||||
USA | 31,459 | 40,370 | 45,347 | 5.1 | % | 2.4 | % | |||||||||||||
Massachusetts | 41,575 | 54,342 | 60,937 | 5.5 | % | 2.3 | % | |||||||||||||
Boston-Cambridge-Newton, MA-NH | 45,155 | 59,285 | 66,365 | 5.6 | % | 2.3 | % | |||||||||||||
Essex, MA | 40,865 | 52,528 | 58,635 | 5.1 | % | 2.2 | % | |||||||||||||
Middlesex, MA | 50,075 | 66,418 | 74,027 | 5.8 | % | 2.2 | % | |||||||||||||
2022 Age Distribution (%) | 0-14 Yrs. | 15-34 Yrs. | 35-54 Yrs. | 55-69 Yrs. | 70+ Yrs. | |||||||||||||||
USA | 18.2 | 26.6 | 25.0 | 18.5 | 11.7 | |||||||||||||||
Massachusetts | 15.9 | 26.8 | 25.4 | 19.7 | 12.2 | |||||||||||||||
Boston-Cambridge-Newton, MA-NH | 16.0 | 27.2 | 25.9 | 19.2 | 11.6 | |||||||||||||||
Essex, MA | 17.0 | 25.2 | 24.8 | 20.5 | 12.5 | |||||||||||||||
Middlesex, MA | 16.0 | 27.5 | 26.7 | 18.5 | 11.3 | |||||||||||||||
| Less Than | �� | $25,000 to | $50,000 to | |||||||||||||||||
2022 HH Income Dist. (%) | 25,000 | 50,000 | 100,000 | $100,000+ | ||||||||||||||||
USA | 16.4 | 19.1 | 28.8 | 35.8 | ||||||||||||||||
Massachusetts | 14.3 | 14.1 | 24.2 | 47.4 | ||||||||||||||||
Boston-Cambridge-Newton, MA-NH | 12.9 | 12.4 | 23.2 | 51.5 | ||||||||||||||||
Essex, MA | 14.1 | 14.8 | 25.1 | 46.0 | ||||||||||||||||
Middlesex, MA | 10.6 | 11.0 | 21.5 | 56.9 | ||||||||||||||||
Source: S&P Global Market Intelligence.
| RP® Financial, LC. | MARKET AREA | |
| II.4 |
Household growth rates paralleled population growth trends in the primary market area counties, with Essex County and Middlesex Counties displaying growth rates approximating the rate of growth for the Boston MSA and the state as a whole. The population base in Middlesex and Essex Counties is broadly comparable in terms of its age distribution relative to the state and nation.
Income measures show that both of the primary market area counties are relatively affluent markets, based on median household and per capita income measures that were well above the comparable U.S. measures. Specifically, the Middlesex County median household income and per capita income measures were higher than the comparable measures for Massachusetts and nation as a whole while the comparable income measures for Essex County fell between the levels for Massachusetts and the Nation as a whole
Regional Economy
Comparative employment data shown in Table 2.2 shows that employment in services and education/healthcare/social services constituted the largest and second largest source of jobs in both of the primary market area counties. Comparatively, education/healthcare/social services were the largest source of jobs in Massachusetts followed closely by jobs in services. Wholesale/retail trade and manufacturing jobs represented the third and fourth largest employment sectors in the primary market area counties, as well as in Massachusetts.
Table 2.2
Everett Co-operative Bank
Primary Market Area Employment Sectors
(Percent of Labor Force)
| Boston-Cambridge- | ||||||||||||||||
Employment Sector | Massachusetts | Newton, MA-NH | Essex, MA | Middlesex, MA | ||||||||||||
| (%) | ||||||||||||||||
Services | 27.3 | % | 29.2 | % | 27.8 | % | 30.7 | % | ||||||||
Education, Healthcare, Soc. Serv. | 28.0 | % | 27.0 | % | 25.0 | % | 27.9 | % | ||||||||
Government | 3.7 | % | 3.7 | % | 3.9 | % | 3.2 | % | ||||||||
Wholesale/Retail Trade | 12.4 | % | 11.6 | % | 13.0 | % | 10.1 | % | ||||||||
Finance/Insurance/Real Estate | 7.2 | % | 7.8 | % | 6.8 | % | 7.1 | % | ||||||||
Manufacturing | 8.8 | % | 8.6 | % | 10.5 | % | 9.8 | % | ||||||||
Construction | 5.8 | % | 5.4 | % | 5.7 | % | 4.9 | % | ||||||||
Information | 2.3 | % | 2.5 | % | 2.4 | % | 3.0 | % | ||||||||
Transportation/Utility | 4.1 | % | 4.0 | % | 4.5 | % | 3.3 | % | ||||||||
Agriculture | 0.4 | % | 0.3 | % | 0.3 | % | 0.2 | % | ||||||||
|
|
|
|
|
|
|
| |||||||||
| 100.0 | % | 100.0 | % | 100.0 | % | 100.0 | % | |||||||||
Source: S&P Global Market Intelligence.
| RP® Financial, LC. | MARKET AREA | |
| II.5 |
The market area served by the Bank, characterized primarily as the Boston MSA, has a highly developed and diverse economy, with the regions’ many colleges and universities serving to attract industries in need of a highly skilled and educated workforce. Healthcare, high-tech and financial services companies constitute major sources of employment in the Bank’s regional market area, as well as the colleges and universities that populate the Boston MSA. Tourism also is a prominent component of market area’s economy, as Boston annually ranks as one of the nation’s top tourist destinations. Table 2.3 lists the major employers in each of the primary market area counties.
Table 2.3
Everett Co-operative Bank
Largest Private Employers in the Boston Metropolitan Area
| Number of | ||||||||
Rank | Employer | City | Employees | |||||
1 | Partners Healthcare System Inc | Braintree | 25,000 | |||||
2 | Massachusetts General Hospital | Boston | 16,999 | |||||
3 | Brigham & Women’s Hospital | Boston | 13,303 | |||||
4 | Dan Farber Cancer Institute | Boston | 10,000 | |||||
5 | Raytheon Systems Intl Co | Andover | 10,000 | |||||
6 | U Mass System Admin Ofc | Worcester | 10,000 | |||||
7 | Boston Children’s Hospital | Boston | 8,000 | |||||
8 | Beth Israel Deaconess Med Ctr | Boston | 7,743 | |||||
9 | Staples Inc | Framingham | 6,600 | |||||
10 | Massachusetts Bay Trnsprtn | Boston | 6,001 | |||||
11 | Mass General For Child | Salem | 5,800 | |||||
12 | Lahey Hospital & Medical Ctr | Burlington | 5,787 | |||||
13 | Boston Medical Ctr Corp | Boston | 5,335 | |||||
14 | Boston University Sch-Medicine | Boston | 5,000 | |||||
15 | Dell EMC Corp | Hopkinton | 5,000 | |||||
16 | MSC Industrial Supply Co | Worcester | 5,000 | |||||
17 | TIAA | Boston | 5,000 | |||||
18 | Tufts Children’s Hospital | Boston | 5,000 | |||||
Source: www.careerinfonet.org
| RP® Financial, LC. | MARKET AREA | |
| II.6 |
Unemployment Trends
Comparative unemployment rates for Essex and Middlesex Counties equaled 3.8% and 2.6% as of October 2021 which represented a reduction in the range of 4% from the prior year level. Moreover, the Middlesex County unemployment rate was slightly below the state and national average while the Essex County rate was slightly higher.
Table 2.4
Everett Co-operative Bank
Unemployment Trends
| Unemployment Rate | Net | |||||||||||
Region | Oct 2020 | Oct 2021 | Change | |||||||||
USA | 6.5 | % | 3.7 | % | -2.8 | % | ||||||
Massachusetts | 7.3 | % | 3.5 | % | -3.8 | % | ||||||
Boston-Cambridge-Newton, MA-NH | 6.7 | % | 3.1 | % | -3.6 | % | ||||||
Essex, MA | 8.1 | % | 3.8 | % | -4.3 | % | ||||||
Middlesex, MA | 6.2 | % | 2.6 | % | -3.6 | % | ||||||
Source: S&P Global Market Intelligence.
Market Area Deposit Characteristics and Competition
The Bank’s deposit base is closely tied to the economic fortunes of Middlesex and Essex Counties and, in particular, the areas that are nearby to the Bank’s branches. Table 2.5 displays deposit market trends from June 30, 2016 through June 30, 2021 for ECB, as well as for all commercial bank and savings institution branches located in the primary market area counties and the state of Massachusetts.
| RP® Financial, LC. | MARKET AREA | |
| II.7 |
Table 2.5
Everett Co-operative Bank
Deposit Summary
| As of June 30, | ||||||||||||||||||||||||||||
| 2016 | 2021 | Deposit | ||||||||||||||||||||||||||
| Market | No. of | Market | No. of | Growth Rate | ||||||||||||||||||||||||
| Deposits | Share | Branches | Deposits | Share | Branches | 2016-2021 | ||||||||||||||||||||||
| (Dollars in Thousands) | (%) | |||||||||||||||||||||||||||
Massachusetts | $ | 356,367,522 | 100.0 | % | 2,192 | $ | 579,335,415 | 100.0 | % | 2,049 | 10.2 | % | ||||||||||||||||
Commercial Banks | $ | 297,109,635 | 83.4 | % | 1,499 | $ | 500,056,177 | 86.3 | % | 1,405 | 11.0 | % | ||||||||||||||||
Savings Institutions | $ | 59,257,887 | 16.6 | % | 693 | $ | 79,279,238 | 13.7 | % | 644 | 6.0 | % | ||||||||||||||||
Boston-Cambridge-Newton, MA-NH | $ | 311,234,504 | 100.0 | % | 1,527 | $ | 514,496,315 | 100.0 | % | 1,466 | 10.6 | % | ||||||||||||||||
Commercial Banks | $ | 273,096,464 | 87.7 | % | 1,128 | $ | 463,622,269 | 90.1 | % | 1,076 | 11.2 | % | ||||||||||||||||
Savings Institutions | $ | 38,138,040 | 12.3 | % | 399 | $ | 50,874,046 | 9.9 | % | 390 | 5.9 | % | ||||||||||||||||
Everett Co-operative Bank | $ | 375,467 | 0.1 | % | 2 | $ | 539,963 | 0.1 | % | 2 | 7.5 | % | ||||||||||||||||
Essex County | $ | 21,509,542 | 100.0 | % | 251 | $ | 32,401,294 | 100.0 | % | 238 | 8.5 | % | ||||||||||||||||
Commercial Banks | $ | 12,167,219 | 56.6 | % | 154 | $ | 18,707,811 | 57.7 | % | 141 | 9.0 | % | ||||||||||||||||
Savings Institutions | $ | 9,342,323 | 43.4 | % | 97 | $ | 13,693,483 | 42.3 | % | 97 | 7.9 | % | ||||||||||||||||
Everett Co-operative Bank | $ | 21,530 | 0.1 | % | 1 | $ | 98,486 | 0.3 | % | 1 | 35.5 | % | ||||||||||||||||
Middlesex County | $ | 55,660,514 | 100.0 | % | 513 | $ | 83,775,769 | 100.0 | % | 487 | 8.5 | % | ||||||||||||||||
Commercial Banks | $ | 40,867,161 | 73.4 | % | 377 | $ | 63,919,252 | 76.3 | % | 348 | 9.4 | % | ||||||||||||||||
Savings Institutions | $ | 14,793,353 | 26.6 | % | 136 | $ | 19,856,517 | 23.7 | % | 139 | 6.1 | % | ||||||||||||||||
Everett Co-operative Bank | $ | 353,937 | 0.6 | % | 1 | $ | 441,477 | 0.5 | % | 1 | 4.5 | % | ||||||||||||||||
Source: FDIC.
Commercial banks maintained a larger market share of deposits than savings institutions in the states of Massachusetts as well as in both of the primary market area counties. However, the difference in market share for savings institutions and commercial banks was relatively narrow in Essex County. For the five year period covered in Table 2.5, savings institutions experienced a decrease in deposit market share in the primary market area counties as well as in the states of Massachusetts. Overall, for the past five years, bank and thrift deposits for the primary market area counties increased at an 8.5% annual rate in both Essex and Middlesex counties. Comparatively, deposits increased at a 10.2% annual rate in the state of Massachusetts during the five year period.
As of June 30, 2021, ECB maintained relatively low deposit market shares in both Middlesex and Essex Counties of 0.3% and 0.5% respectively. The Bank’s deposits increased at annual rates of 4.5% in Middlesex County as growth was focused in the newly-established Lynnfield office which was opened in 2016.
As implied by the Bank’s relatively low market shares of deposits in the primary market area counties, competition among financial institutions in the Bank’s market area is significant. Among the Bank’s competitors are much larger and more diversified institutions, which have
| RP® Financial, LC. | MARKET AREA | |
| II.8 |
greater resources than maintained by ECB. Financial institution competitors in the Bank’s primary market area include other locally based thrifts and banks, as well as regional, super regional and money center banks. From a competitive standpoint, ECB has sought to emphasize its community orientation in the markets served by its branches. There are a total of 34 banking institutions operating in Essex County, with ECB holding the 29th largest market share of deposits. In Middlesex County there are a total of 49 banking institutions, with ECB holding the 29th largest market share of deposits.
Table 2.6 lists the Bank’s largest competitors in the market area counties, based on deposit market share as noted parenthetically.
Table 2.6
Everett Co-operative Bank
Market Area Deposit Competitors - As of June 30, 2021
Location Name | Market Share | Rank | ||||||||
| (%) | ||||||||||
Boston-Cambridge- | Bank of America Corporation (NC) | 29.68 | ||||||||
Newton, MA-NH | Citizens Financial Group, Inc. (RI) | 15.93 | ||||||||
Banco Santander S.A. | 7.15 | |||||||||
Eastern Bankshares Inc. (MA) | 5.80 | |||||||||
The Toronto-Dominion Bank | 5.54 | |||||||||
First Repub Bank (CA) | 4.43 | |||||||||
Independent Bank Corp. (MA) | 3.96 | |||||||||
Everett Co-operative Bank (MA) | 0.16 | 51 of 102 | ||||||||
Essex County, MA | The Toronto-Dominion Bank | 12.70 | ||||||||
Bank of America Corporation (NC) | 10.55 | |||||||||
Inst for Svgs in Newburyport (MA) | 10.20 | |||||||||
Salem Five Bancorp (MA) | 10.19 | |||||||||
Eastern Bankshares Inc. (MA) | 9.92 | |||||||||
People’s United Financial Inc. (CT) | 7.09 | |||||||||
Banco Santander S.A. | 6.47 | |||||||||
Everett Co-operative Bank (MA) | 0.30 | 29 of 34 | ||||||||
Middlesex County, MA | Bank of America Corporation (NC) | 24.25 | ||||||||
Citizens Financial Group Inc. (RI) | 11.37 | |||||||||
Eastern Bankshares Inc. (MA) | 9.34 | |||||||||
The Toronto-Dominion Bank | 6.38 | |||||||||
Cambridge Financial Group Inc. (MA) | 5.29 | |||||||||
Middlesex Bancorp MHC (MA) | 4.75 | |||||||||
Banco Santander S.A. | 4.06 | |||||||||
Everett Co-operative Bank (MA) | 0.53 | 29 of 49 | ||||||||
Source: S&P Global Market Intelligence.
| RP® Financial, LC. | PEER GROUP ANALYSIS | |
| III.1 |
III. PEER GROUP ANALYSIS
This chapter presents an analysis of ECB’s operations versus a group of comparable institutions (the “Peer Group”) selected from the universe of all publicly-traded savings institutions in a manner consistent with the regulatory valuation guidelines. The basis of the pro forma market valuation of ECB is derived from the pricing ratios of the Peer Group institutions, incorporating valuation adjustments for key differences in relation to the Peer Group. Since no Peer Group can be exactly comparable to ECB, key areas examined for differences are: financial condition; profitability, growth and viability of earnings; asset growth; primary market area; dividends; liquidity of the shares; marketing of the issue; management; and effect of government regulations and regulatory reform.
Peer Group Selection
The Peer Group selection process is governed by the general parameters set forth in the regulatory valuation guidelines. Accordingly, the Peer Group is comprised of only those publicly-traded savings institutions whose common stock is either listed on the NYSE or NASDAQ, since their stock trading activity is regularly reported and generally more frequent than non-publicly traded and closely-held institutions. Institutions that are not listed on the NYSE or NASDAQ are inappropriate, since the trading activity for thinly-traded or closely-held stocks are typically highly irregular in terms of frequency and price and thus may not be a reliable indicator of market value. We have also excluded from the Peer Group those companies under acquisition or subject to rumored acquisition and recent conversions (less than one year), since their pricing ratios are subject to unusual distortion and/or have limited trading history. A recent listing of the universe of all publicly-traded savings institutions is included as Exhibit III-1.
Ideally, the Peer Group, which must have at least 10 members to comply with the regulatory valuation guidelines, should be comprised of locally- or regionally-based institutions with comparable resources, strategies and financial characteristics. There are approximately 45 publicly-traded savings institutions nationally and, thus, it is typically the case that the Peer Group will be comprised of institutions with relatively comparable characteristics. To the extent that differences exist between the converting institution and the Peer Group, valuation adjustments will be applied to account for the differences. Since ECB will be a full public company upon completion of the offering, we considered only full public companies to be viable
| RP® Financial, LC. | PEER GROUP ANALYSIS | |
| III.2 |
candidates for inclusion in the Peer Group. From the universe of publicly-traded thrifts, we selected ten institutions with characteristics similar to those of ECB. In the selection process, we applied the following “screen” to the universe of all public companies that were eligible for consideration:
| • | Screen #1 New England institutions with assets between $300 million and $3.0 billion, and positive core earnings. Three companies met the criteria for Screen #1 and all included in the Peer Group: Provident Bancorp, Inc., Randolph Bancorp, Inc. and Western New England Bancorp, Inc. Exhibit III-2 provides financial and public market pricing characteristics of all publicly-traded New England thrifts. |
| • | Screen #2 Mid-Atlantic institutions with assets between $300 million and $2.0 billion and positive core earnings. Twelve companies met the criteria for Screen #2 and nine were included in the Peer Group: ESSA Bancorp, Inc., Generations Bancorp NY, Inc., HV Bancorp, Inc., Magyar Bancorp, Inc., Northeast Community Bancorp, Inc. PCSB Financial Corporation, Prudential Bancorp, Inc., William Penn Bancorporation and WVS Financial Corp. Exhibit III-3 provides financial and public market pricing characteristics of all publicly-traded Mid-Atlantic Thrifts. Two companies completing standard conversion offerings in July 2021 were excluded from the Peer Group including PB Bankshares and Blue Foundry Bancorp since they have had limited seasoning as fully converted public companies and limited opportunity to deploy their conversion proceeds. Likewise, a recent second step conversion completed by Ponce Financial Group in January 2022 was excluded as it has yet to report financial data publicly incorporating the results of the recent offering. |
Table 3.1 shows the general characteristics of each of the twelve Peer Group companies and Exhibit III-4 provides summary demographic and deposit market share data for the primary market areas served by each of the Peer Group companies. While there are expectedly some differences between the Peer Group companies and ECB, we believe that the Peer Group companies, on average, provide a good basis for valuation subject to valuation adjustments. The following sections present a comparison of ECB’s financial condition, income and expense trends, loan composition, interest rate risk and credit risk versus the Peer Group as of the most recent publicly available date.
In addition to the selection criteria used to identify the Peer Group companies, a summary description of the key comparable characteristics of each of the Peer Group companies relative to ECB’s characteristics is detailed below.
| RP® Financial, LC. | PEER GROUP ANALYSIS | |
| III.3 |
| • | ESSA Bancorp, Inc. of Pennsylvania. Comparable due to similar level of interest expense as a percent of average assets, comparable level of 1-4 family loans and MBS as a percent of assets, similar level of reserves as a percent of loans and as a percent of NPLs. |
| • | Generations Bancorp NY of New York. Generations Bancorp was included in the Peer Group based on its focus on residential mortgage lending in addition to its location in the Mid-Atlantic region of the US. |
| • | HV Bancorp, Inc. of Pennsylvania. Comparable due to similar asset size of branch office network, and similar ratio of residential mortgage loans as a percent of assets reflecting a similar business model. Additionally, while the level of interest income is comparable, HV Bancorp’s earnings have been supported by gains on the sale of loans which contrast to the Bank’s portfolio lending strategy. |
| • | Magyar Bancorp, Inc. of New Jersey, is relatively similar to ECB in terms of its earnings composition operating with an operating expense ratio below the Peer Group average and a comparatively modest level of non-interest income. The comparatively high ratio of mortgage lending including loans secured by commercial real estate enhances the comparability to the Company. |
| • | Northeast Community Bancorp, Inc. has a very high capital ratio equal to 20.52% reflecting the completion of a mutual-to-stock conversion in July 2021. Earnings for Northeast Community Bancorp are comparatively high in relation to the Bank reflecting the relatively high asset yields supported by its active construction lending program. |
| • | PCSB Financial Corporation reflects a similar mortgage lending strategy in comparison to ECB, albeit with a greater emphasis on commercial mortgages. Like ECB, PCSB Financial Corporation operates with a very low operating expense ratio and limited non-interest income enhancing the comparability to ECB from an operational perspective. |
| • | Provident Bancorp, Inc. was included in the Peer Group primarily as a result of its operations on the north shore area of suburban Boston and not withstanding its modestly stronger earnings and emphasis on commercial mortgage and non-mortgage lending and very limited residential mortgage lending. |
| • | Prudential Bancorp, Inc. of Pennsylvania. Comparable due to Prudential Bancorp’s mortgage lending emphasis and relatively comparable earnings levels. Like ECB, Prudential Bancorp’s operations reflect low expenses and a high ratio of assets per employee. |
| • | Randolph Bancorp, Inc. of Massachusetts. This comparable company operates in markets in and south of Boston in areas making it highly comparable to the Bank’s market. In addition, Randolph Bancorp’s loan portfolio is focused on residential mortgages although its focus on loans originated for resale reflects a difference relative to ECB’s lending strategy which more heavily focused on portfolio lending. |
| • | Western New England Bancorp, Inc. This comparable company operates in western Massachusetts and like ECB, is focused on residential and commercial mortgage lending. Western New England Bancorp is the largest company included in the Peer Group at $2.5 billion in assets but was included in the Peer Group given its Massachusetts-based operation. |
| RP® Financial, LC. | PEER GROUP ANALYSIS | |
| III.4 |
| • | William Penn Bancorp, Inc. has the highest capital ratio of any Peer Group company equal to 25.14% reflecting the completion of a mutual-to-stock conversion in recent periods. |
| • | WVS Financial Corp. of Pennsylvania. Was included in the Peer Group notwithstanding some notable differences to ECB including the high level of investments in the portfolio and very low operating expense ratio. However, the loan portfolio is predominated by mortgage loans enhancing the comparability to ECB. |
In aggregate, the Peer Group companies maintained a slightly higher level of tangible equity as the industry average (13.22% of assets versus 12.87% for all public companies), generated lower earnings as a percent of average assets (0.79% core ROAA versus 0.98% for all public companies), and earned a lower ROE. The Peer Group’s average P/TB ratio and average core P/E multiple were lower compared to the respective averages for all publicly-traded fully converted thrifts.
| All Fully Converted Publicly-Traded | Peer Group | |||||||
Financial Characteristics (Averages) | ||||||||
Assets ($Mil) | $ | 3,902 | $ | 1,168 | ||||
Market capitalization ($Mil) | 559 | 147 | ||||||
Tangible equity/assets (%) | 12.87 | % | 13.22 | % | ||||
Core return on average assets (%) | 0.98 | 0.79 | ||||||
Core return on average equity (%) | 7.59 | 6.83 | ||||||
Pricing Ratios (Averages)(1) | ||||||||
Core price/earnings (x) | 14.49x | 16.08x | ||||||
Price/tangible book (%) | 119.49 | % | 96.63 | % | ||||
Price/assets (%) | 13.28 | % | 12.17 | % | ||||
| (1) | Based on market prices as of February 18, 2022. |
The following sections present a comparison of ECB’s financial condition, income and expense trends, loan composition, interest rate risk and credit risk versus the figures reported by the Peer Group. Figures referenced for the Peer Group are on a median basis unless otherwise noted. The conclusions drawn from the comparative analysis are then factored into the valuation analysis discussed in the final chapter.
| RP® Financial, LC. | PEER GROUP ANALYSIS | |
| III.5 |
Table 3.1
Peer Group of Publicly-Traded Banks & Thrifts
As of December 31, 2021
| As of | ||||||||||||||||||||||||||||||||||||
| February 18, 2022 | ||||||||||||||||||||||||||||||||||||
Ticker | Financial Institution | Exchange | Region | City | State | Total Assets | Offices | Fiscal Mth End | Stock Price | Market Value | ||||||||||||||||||||||||||
| ($Mil) | ($) | ($Mil) | ||||||||||||||||||||||||||||||||||
ESSA | ESSA Bancorp, Inc. | NASDAQGS | MA | Stroudsburg | PA | 1,868 | 22 | Sep | 18.05 | 177 | ||||||||||||||||||||||||||
GBNY | Generations Bancorp NY, Inc. | NASDAQCM | MA | Seneca Falls | NY | 377 | (1) | 10 | Dec | 11.98 | 29 | |||||||||||||||||||||||||
HVBC | HV Bancorp, Inc. | NASDAQCM | MA | Doylestown | PA | 560 | 7 | Dec | 21.44 | 44 | ||||||||||||||||||||||||||
MGYR | Magyar Bancorp, Inc. | NASDAQGM | MA | New Brunswick | NJ | 781 | 7 | Sep | 12.05 | 86 | ||||||||||||||||||||||||||
NECB | Northeast Community Bancorp, Inc. | NASDAQCM | MA | White Plains | NY | 1,225 | 11 | Dec | 12.78 | 198 | ||||||||||||||||||||||||||
PCSB | PCSB Financial Corporation | NASDAQCM | MA | Yorktown Heights | NY | �� | 1,888 | 15 | Jun | 18.82 | 289 | |||||||||||||||||||||||||
PVBC | Provident Bancorp, Inc. | NASDAQCM | NE | Amesbury | MA | 1,729 | 7 | Dec | 17.00 | 297 | ||||||||||||||||||||||||||
PBIP | Prudential Bancorp, Inc. | NASDAQGM | MA | Philadelphia | PA | 1,084 | 10 | Sep | 14.87 | 116 | ||||||||||||||||||||||||||
RNDB | Randolph Bancorp, Inc. | NASDAQGM | NE | Quincy | MA | 803 | 5 | Dec | 22.44 | 107 | ||||||||||||||||||||||||||
WNEB | Western New England Bancorp, Inc. | NASDAQGS | NE | Westfield | MA | 2,538 | 27 | Dec | 9.35 | 212 | ||||||||||||||||||||||||||
WMPN | William Penn Bancorporation | NASDAQCM | MA | Bristol | PA | 834 | 14 | Jun | 12.51 | 179 | ||||||||||||||||||||||||||
WVFC | WVS Financial Corp. | NASDAQGM | MA | Pittsburgh | PA | 356 | 5 | Jun | 15.19 | 26 | ||||||||||||||||||||||||||
Source: S&P Capital IQ.
| RP® Financial, LC. | PEER GROUP ANALYSIS | |
| III.6 |
Financial Condition
Table 3.2 shows comparative balance sheet measures for ECB and the Peer Group, reflecting the expected similarities and some differences given the selection procedures outlined above. The Bank’s and the Peer Group’s ratios reflect balances as of December 31, 2021. ECB’s equity-to-assets ratio of 11.59% was below the Peer Group’s median net worth ratio of 12.44%. The Bank’s pro forma equity position will increase with the addition of stock proceeds, with such ratio extending the advantage above the Peer Group’s ratio. The increase in ECB’s pro forma equity ratio will be favorable from a risk perspective and in terms of future earnings potential that could be realized through leverage and lower funding costs. At the same time, the Bank’s higher pro forma equity ratio will depress return on equity. Both ECB’s and the Peer Group’s equity ratios reflected surpluses with respect to the regulatory capital requirements. On a pro forma basis, the Bank’s regulatory surpluses will continue to be higher than the Peer Group figures.
The interest-earning asset compositions for the Bank and the Peer Group were somewhat similar, with loans constituting the largest concentration of interest-earning assets for both ECB and the Peer Group. The Bank’s loans-to-assets ratio of 77.59% was higher than the comparable Peer Group median ratio of 72.19%. Comparatively, the Bank’s cash and investments-to-assets ratio of 18.54% was lower than the comparable Peer Group ratio of 29.24%. Overall, ECB’s interest-earning assets amounted to 96.13% of assets, which was slightly more than the comparable Peer Group ratio of 95.13%. The Peer Group’s non-interest earning assets included bank-owned life insurance (BOLI”) equal to 2.34% of assets and goodwill/intangibles equal to 0.28% of assets, while the Bank maintained BOLI equal to 2.15% of assets and no goodwill/intangibles.
| RP® Financial, LC. | PEER GROUP ANALYSIS | |
| III.7 |
Table 3.2
Balance Sheet Composition and Growth Rates
Comparable Institution Analysis
As of December 31, 2021, or Most Recent Available Data
| Balance Sheet as a Percent of Assets | Balance Sheet Annual Growth Rates (2)(3) | |||||||||||||||||||||||||||||||||||||||||||||||||||||||||||||||||||||||||||||
| Cash & | MBS & | Net | Borrowed | Sub. | Total | Goodwill | Tangible | MBS, Cash & | Borrows. | Total | Tangible | |||||||||||||||||||||||||||||||||||||||||||||||||||||||||||||||||||
| Equivalents | Invest | BOLI | Loans (1) | Deposits | Funds | Debt | Equity | & Intang | Equity | Assets | Investments | Loans | Deposits | &Sub debt | Equity | Equity | ||||||||||||||||||||||||||||||||||||||||||||||||||||||||||||||
Everett Co-Operative Bank | ||||||||||||||||||||||||||||||||||||||||||||||||||||||||||||||||||||||||||||||
December 31, 2021 | 7.95 | % | 10.59 | % | 2.15 | % | 77.59 | % | 85.78 | % | 1.35 | % | 0.00 | % | 11.59 | % | 0.00 | % | 11.59 | % | 13.42 | % | 21.83 | % | 10.70 | % | 16.35 | % | -50.00 | % | 5.80 | % | 5.80 | % | ||||||||||||||||||||||||||||||||||||||||||||
Comparable Group | ||||||||||||||||||||||||||||||||||||||||||||||||||||||||||||||||||||||||||||||
Averages | 9.25 | % | 19.99 | % | 2.34 | % | 66.07 | % | 77.09 | % | 7.92 | % | 0.21 | % | 13.44 | % | 0.29 | % | 13.15 | % | 4.42 | % | 35.43 | % | -1.33 | % | 4.42 | % | -30.93 | % | 26.36 | % | 27.39 | % | ||||||||||||||||||||||||||||||||||||||||||||
Medians | 9.70 | % | 12.47 | % | 2.08 | % | 72.19 | % | 81.61 | % | 4.25 | % | 0.00 | % | 12.44 | % | 0.19 | % | 12.15 | % | 6.39 | % | 9.23 | % | -2.92 | % | 7.35 | % | -34.18 | % | 4.49 | % | 4.88 | % | ||||||||||||||||||||||||||||||||||||||||||||
Comparable Group | ||||||||||||||||||||||||||||||||||||||||||||||||||||||||||||||||||||||||||||||
ESSA | ESSA Bancorp, Inc. | PA | 10.62 | % | 12.47 | % | 2.02 | % | 71.70 | % | 87.50 | % | 0.37 | % | 0.00 | % | 11.11 | % | 0.76 | % | 10.35 | % | -0.03 | % | 9.23 | % | -2.63 | % | 0.27 | % | -68.39 | % | 6.94 | % | 7.65 | % | ||||||||||||||||||||||||||||||||||||||||||
GBNY | Generations Bancorp NY, Inc. | (2 | ) | NY | 3.23 | % | 10.58 | % | 2.08 | % | 76.16 | % | 82.55 | % | 5.26 | % | 0.00 | % | 11.25 | % | 0.42 | % | 10.83 | % | 2.63 | % | 6.97 | % | -1.14 | % | 2.68 | % | -36.55 | % | 45.02 | % | 47.97 | % | ||||||||||||||||||||||||||||||||||||||||
HVBC | HV Bancorp, Inc. | PA | 21.56 | % | NA | NA | 65.29 | % | 82.84 | % | 5.28 | % | 1.78 | % | 7.61 | % | 0.00 | % | 7.61 | % | -34.99 | % | NA | -7.97 | % | -36.51 | % | -52.30 | % | 9.53 | % | 9.53 | % | |||||||||||||||||||||||||||||||||||||||||||||
MGYR | Magyar Bancorp, Inc. | NJ | 10.54 | % | 10.29 | % | 2.23 | % | 73.56 | % | 82.97 | % | 3.26 | % | 0.00 | % | 12.61 | % | 0.00 | % | 12.61 | % | 5.24 | % | 60.43 | % | -4.05 | % | 5.82 | % | -60.07 | % | 69.14 | % | 69.14 | % | ||||||||||||||||||||||||||||||||||||||||||
NECB | Northeast Community Bancorp, Inc. | NY | 12.44 | % | 3.22 | % | 2.06 | % | 79.02 | % | 75.68 | % | 2.54 | % | 0.00 | % | 20.52 | % | 0.05 | % | 20.47 | % | 26.53 | % | 116.43 | % | 18.10 | % | 20.14 | % | -1.50 | % | 63.42 | % | 63.69 | % | ||||||||||||||||||||||||||||||||||||||||||
PCSB | PCSB Financial Corporation | NY | 6.37 | % | 23.21 | % | 1.90 | % | 65.94 | % | 80.67 | % | 3.57 | % | 0.00 | % | 14.56 | % | 0.33 | % | 14.23 | % | 5.49 | % | 16.58 | % | 0.61 | % | 10.58 | % | -42.07 | % | 2.05 | % | 2.12 | % | ||||||||||||||||||||||||||||||||||||||||||
PVBC | Provident Bancorp, Inc. | MA | 8.85 | % | 2.18 | % | 2.46 | % | 84.23 | % | 84.42 | % | 1.03 | % | 0.00 | % | 13.52 | % | 0.00 | % | 13.52 | % | 14.84 | % | 63.12 | % | 10.79 | % | 17.98 | % | -0.56 | % | -0.88 | % | -0.88 | % | ||||||||||||||||||||||||||||||||||||||||||
PBIP | Prudential Bancorp, Inc. | PA | 10.60 | % | 29.93 | % | 3.07 | % | 53.97 | % | 66.47 | % | 19.28 | % | 0.00 | % | 12.32 | % | 0.58 | % | 11.74 | % | -9.14 | % | -16.91 | % | -3.42 | % | -3.71 | % | -25.67 | % | 1.79 | % | 1.95 | % | ||||||||||||||||||||||||||||||||||||||||||
RNDB | Randolph Bancorp, Inc. | MA | 14.37 | % | 6.80 | % | 1.09 | % | 73.37 | % | 79.44 | % | 6.22 | % | 0.00 | % | 12.56 | % | 0.00 | % | 12.56 | % | 11.40 | % | 133.86 | % | -2.22 | % | 20.79 | % | -31.81 | % | 1.09 | % | 1.10 | % | ||||||||||||||||||||||||||||||||||||||||||
WNEB | Western New England Bancorp, Inc. | MA | 4.08 | % | 16.98 | % | 2.87 | % | 72.68 | % | 88.69 | % | 0.10 | % | 0.77 | % | 8.81 | % | 0.59 | % | 8.22 | % | 7.29 | % | 0.00 | % | -3.22 | % | 10.46 | % | -67.25 | % | -1.30 | % | -1.22 | % | ||||||||||||||||||||||||||||||||||||||||||
WMPN | William Penn Bancorporation | PA | 7.40 | % | 29.27 | % | 4.53 | % | 54.77 | % | 68.44 | % | 4.92 | % | 0.00 | % | 25.65 | % | 0.68 | % | 24.96 | % | 11.71 | % | 0.00 | % | -7.69 | % | -4.40 | % | -4.34 | % | 120.07 | % | 128.12 | % | ||||||||||||||||||||||||||||||||||||||||||
WVFC | WVS Financial Corp. | PA | 0.93 | % | 75.03 | % | 1.43 | % | 22.08 | % | 45.39 | % | 43.20 | % | 0.00 | % | 10.75 | % | 0.00 | % | 10.75 | % | 12.01 | % | 0.00 | % | -13.06 | % | 8.88 | % | 19.36 | % | -0.53 | % | -0.53 | % | ||||||||||||||||||||||||||||||||||||||||||
| (1) | Includes loans held for sale. |
| (2) | As of September 30, 2021, or latest available data for peer group. |
Source: S&P Capital IQ and RP® Financial, LC. calculations. The information provided in this table has been obtained from sources we believe are reliable, but we cannot guarantee the accuracy or completeness of such information.
Copyright (c) 2022 by RP® Financial, LC.
| RP® Financial, LC. | PEER GROUP ANALYSIS | |
| III.8 |
ECB’s funding liabilities reflected a funding composition that was somewhat similar to that of the Peer Group’s funding composition. The Bank’s deposits equaled 85.78% of assets, which was above the Peer Group’s median ratio of 81.61%. Comparatively, the Bank maintained a lower level of borrowings than the Peer Group, as indicated by borrowings-to-assets ratios of 1.35% and 4.25% for ECB and the Peer Group, respectively. Total interest-bearing liabilities maintained by the Bank and the Peer Group, as a percent of assets, equaled 87.13% and 85.22%, respectively.
A key measure of balance sheet strength for a thrift institution is its interest-earning assets/interest-bearing liabilities (“IEA/IBL”) ratio. Presently, the Bank’s IEA/IBL ratio is below the Peer Group’s ratio, based on IEA/IBL ratios of 110.32% and 111.84%, respectively. The additional capital realized from stock proceeds should serve to provide ECB with an IEA/IBL ratio that exceeds the Peer Group’s average ratio, as the increase in capital provided by the infusion of stock proceeds will serve to lower the level of interest-bearing liabilities funding assets and will be primarily deployed into interest-earning assets.
The growth rate section of Table 3.2 shows annual growth rates for key balance sheet items. ECB’s and the Peer Group’s growth rates are based on annual growth for the 12 months ended December 31, 2021. ECB recorded a 13.42% increase in assets, versus asset growth of 6.39% recorded by the Peer Group based on the median. Asset growth for ECB included a 10.70% increase in loans, which was complemented by a 21.83% increase in cash and investments.
Asset growth for the Peer Group was the result of deposit growth which funded expanded balances of cash and investments as the loan portfolio for the Peer Group shrank modestly based on the average and median. Specifically, deposits increased at a 16.35% annual pace for ECB versus an average of 4.42% for the Peer Group while borrowed funds shrank markedly for both. The Bank’s tangible capital increased by 5.80%, which was more than the Peer Group’s tangible capital growth rate of 4.88% based on the median. The average equity growth for the Peer Group was supported by three companies which completed second step conversions within the growth rate measurement period. The Bank’s post-conversion capital growth rate will initially be constrained by maintenance of a higher pro forma capital position. Additional implementation of any stock repurchases and dividend payments, pursuant to regulatory limitations and guidelines, could also slow the Bank’s capital growth rate in the longer term following the stock offering.
| RP® Financial, LC. | PEER GROUP ANALYSIS | |
| III.9 |
Income and Expense Components
Table 3.3 displays statements of operations for the Bank and the Peer Group. The Bank’s and the Peer Group’s ratios are based on earnings for the 12 months ended December 31, 2021. ECB reported net income to average assets ratios of 0.64% while the Peer Group’s average and median ROA was equal to 0.79% and 0.82% based on the average and median, respectively. Importantly, the Bank’s core earnings adjusted to exclude the after-tax expense of the pension termination equaled $5.5 million or 0.88% and thus was modestly higher than the Peer Group’s ratio. A higher ratio of net interest income and lower operating expenses represented earnings advantages for the Bank, while a higher ratio of gains on sale of loans and non-interest operating income earnings advantages for the Peer Group.
The Bank’s higher net interest income to average assets ratio was realized through a higher interest income ratio, which was facilitated by a higher yield earned on interest-earning assets (3.68% versus 3.38% median for the Peer Group). The advantage of the Bank’s higher interest income was partially mitigated by its higher ratio of interest expense to average assets (0.59% and 0.35% for the Bank and Peer Group, respectively). The Bank’s higher interest expense ratio was the result of more expensive deposits including the CD portfolio. Overall, ECB and the Peer Group reported net interest income to average assets ratios of 2.98% and 2.90% (median), respectively.
The Bank’s business model focused on portfolio mortgage lending, while limiting net non-interest income, also minimizes ECB’s operating costs. ECB reported a lower ratio of operating expenses, equal to 1.93% of average assets versus the Peer Group median (2.36% of average assets). In connection with the operating expense ratios, ECB maintained a comparatively lower number of employees relative to its asset size. Assets per full time equivalent employee equaled $12.3 million for the Bank versus a comparable measure of $8.2 million for the Peer Group. On a post-offering basis, the Bank’s operating expenses can be expected to further increase with the addition of the ESOP and certain expenses that result from being a publicly-traded savings institution, with such expenses already impacting the Peer Group’s operating expenses. In addition to the foregoing, management estimates ECB’s cost structure will increase in a range of $2 million next year on a pre-tax basis relative to the core run rate last year reflecting the addition of management, lenders, and back office staff in a variety of areas to support the planned growth and diversification. In addition, the Bank will continue to make enhancements to facilitate the growth in such key areas as technology while
| RP® Financial, LC. | PEER GROUP ANALYSIS | |
| III.10 |
Table 3.3
Income as Percent of Average Assets and Yields, Costs, Spreads
Comparable Institution Analysis
For the 12 Months Ended December 31, 2021 or Most Recent Available Data
| Net Interest Income | Non-Interest Income | Non-Op. Items | Yields, Costs, and Spreads | |||||||||||||||||||||||||||||||||||||||||||||||||||||||||||||||||||||||
| Loss | NII | Gain | Other | Total | Provision | MEMO: | MEMO: | |||||||||||||||||||||||||||||||||||||||||||||||||||||||||||||||||||
| Net | Provis. | After | on Sale of | Non-Int | Non-Int | Net Gains/ | Extrao. | for | Yield | Cost | Yld-Cost | Assets/ | Effective | |||||||||||||||||||||||||||||||||||||||||||||||||||||||||||||
| Income | Income | Expense | NII | on IEA | Provis. | Loans | Income | Expense | Losses (1) | Items | Taxes | On IEA | Of IBL | Spread | FTE Emp. | Tax Rate | ||||||||||||||||||||||||||||||||||||||||||||||||||||||||||
| (%) | (%) | (%) | (%) | (%) | (%) | (%) | (%) | (%) | (%) | (%) | (%) | (%) | (%) | (%) | ($000) | (%) | ||||||||||||||||||||||||||||||||||||||||||||||||||||||||||
Everett Co-Operative Bank | ||||||||||||||||||||||||||||||||||||||||||||||||||||||||||||||||||||||||||
December 31, 2021 | 0.64 | % | 3.57 | % | 0.59 | % | 2.98 | % | 0.06 | % | 2.92 | % | 0.07 | % | 0.12 | % | 1.93 | % | -0.32 | % | 0.00 | % | 0.23 | % | 3.68 | % | 0.78 | % | 2.90 | % | $ | 12,342 | 26.12 | % | ||||||||||||||||||||||||||||||||||||||||
Comparable Group (2) | ||||||||||||||||||||||||||||||||||||||||||||||||||||||||||||||||||||||||||
Averages | 0.79 | % | 3.29 | % | 0.41 | % | 2.87 | % | 0.08 | % | 2.80 | % | 0.59 | % | 0.28 | % | 2.62 | % | 0.03 | % | 0.00 | % | 0.24 | % | 3.67 | % | 0.36 | % | 3.31 | % | $ | 8,188 | 21.97 | % | ||||||||||||||||||||||||||||||||||||||||
Medians | 0.82 | % | 3.23 | % | 0.35 | % | 2.90 | % | 0.06 | % | 2.87 | % | 0.01 | % | 0.26 | % | 2.36 | % | 0.03 | % | 0.00 | % | 0.23 | % | 3.38 | % | 0.19 | % | 3.19 | % | $ | 8,207 | 23.87 | % | ||||||||||||||||||||||||||||||||||||||||
Comparable Group | ||||||||||||||||||||||||||||||||||||||||||||||||||||||||||||||||||||||||||
ESSA | ESSA Bancorp, Inc. | 0.90 | % | 3.10 | % | 0.25 | % | 2.85 | % | 0.10 | % | 2.76 | % | 0.08 | % | 0.46 | % | 2.23 | % | 0.02 | % | 0.00 | % | 0.19 | % | 3.38 | % | 0.19 | % | 3.19 | % | $ | 7,973 | 17.61 | % | |||||||||||||||||||||||||||||||||||||||
GBNY | Generations Bancorp NY, Inc. | (2 | ) | 0.35 | % | 3.66 | % | 0.52 | % | 3.14 | % | 0.15 | % | 2.99 | % | 0.00 | % | 0.71 | % | 3.37 | % | 0.10 | % | 0.00 | % | 0.08 | % | 4.00 | % | 0.61 | % | 3.39 | % | $ | 4,450 | 18.18 | % | |||||||||||||||||||||||||||||||||||||
HVBC | HV Bancorp, Inc. | 0.69 | % | 2.86 | % | 0.38 | % | 2.48 | % | 0.09 | % | 2.39 | % | 2.54 | % | -0.24 | % | 3.74 | % | NA | 0.00 | % | 0.25 | % | 3.38 | % | 0.19 | % | 3.19 | % | $ | 3,901 | 26.54 | % | ||||||||||||||||||||||||||||||||||||||||
MGYR | Magyar Bancorp, Inc. | 0.83 | % | 3.65 | % | 0.33 | % | 3.33 | % | 0.14 | % | 3.19 | % | 0.10 | % | 0.22 | % | 2.37 | % | 0.04 | % | 0.00 | % | 0.35 | % | 3.86 | % | 0.50 | % | 3.36 | % | $ | 8,217 | 29.49 | % | |||||||||||||||||||||||||||||||||||||||
NECB | Northeast Community Bancorp, Inc. | 1.13 | % | 4.61 | % | 0.49 | % | 4.12 | % | 0.34 | % | 3.78 | % | 0.00 | % | 0.26 | % | 2.52 | % | -0.04 | % | 0.00 | % | 0.35 | % | 4.92 | % | 0.94 | % | 3.98 | % | $ | 9,343 | 23.56 | % | |||||||||||||||||||||||||||||||||||||||
PCSB | PCSB Financial Corporation | 0.80 | % | 3.11 | % | 0.41 | % | 2.70 | % | -0.03 | % | 2.73 | % | 0.00 | % | 0.12 | % | 1.88 | % | 0.04 | % | 0.00 | % | 0.21 | % | 3.38 | % | 0.19 | % | 3.19 | % | $ | 11,429 | 20.40 | % | |||||||||||||||||||||||||||||||||||||||
PVBC | Provident Bancorp, Inc. | 1.02 | % | 4.08 | % | 0.21 | % | 3.87 | % | 0.24 | % | 3.62 | % | 0.00 | % | 0.33 | % | 2.54 | % | -0.01 | % | 0.00 | % | 0.38 | % | 4.28 | % | 0.41 | % | 3.87 | % | $ | 9,865 | 26.95 | % | |||||||||||||||||||||||||||||||||||||||
PBIP | Prudential Bancorp, Inc. | 0.69 | % | 3.32 | % | 1.25 | % | 2.08 | % | 0.02 | % | 2.06 | % | 0.01 | % | 0.16 | % | 1.57 | % | 0.14 | % | 0.00 | % | 0.11 | % | 3.38 | % | 0.19 | % | 3.19 | % | $ | 11,914 | 13.72 | % | |||||||||||||||||||||||||||||||||||||||
RNDB | Randolph Bancorp, Inc. | 1.29 | % | 3.24 | % | 0.29 | % | 2.95 | % | -0.06 | % | 3.01 | % | 3.72 | % | 0.57 | % | 5.56 | % | -0.04 | % | 0.00 | % | 0.41 | % | 3.38 | % | 0.19 | % | 3.19 | % | $ | 4,387 | 24.18 | % | |||||||||||||||||||||||||||||||||||||||
WNEB | Western New England Bancorp, Inc. | 0.96 | % | 3.22 | % | 0.27 | % | 2.95 | % | -0.04 | % | 2.99 | % | 0.06 | % | 0.42 | % | 2.22 | % | 0.03 | % | 0.00 | % | 0.32 | % | 3.38 | % | 0.19 | % | 3.19 | % | $ | 8,196 | 25.30 | % | |||||||||||||||||||||||||||||||||||||||
WMPN | William Penn Bancorporation | 0.50 | % | 3.02 | % | 0.38 | % | 2.65 | % | 0.00 | % | 2.65 | % | NA | NA | 2.34 | % | 0.02 | % | 0.00 | % | 0.07 | % | 3.31 | % | 0.53 | % | 2.78 | % | $ | 7,229 | 12.50 | % | |||||||||||||||||||||||||||||||||||||||||
WVFC | WVS Financial Corp. | 0.33 | % | 1.57 | % | 0.20 | % | 1.37 | % | -0.02 | % | 1.40 | % | 0.00 | % | 0.12 | % | 1.11 | % | 0.04 | % | 0.00 | % | 0.11 | % | 3.38 | % | 0.19 | % | 3.19 | % | $ | 11,347 | 25.25 | % | |||||||||||||||||||||||||||||||||||||||
| (1) | Net gains/losses includes gain/loss on sale of securities and nonrecurring income and expense. |
| (2) | As of September 30, 2021, or latest available data for peer group. |
Source: S&P Capital IQ and RP® Financial, LC. calculations. The information provided in this table has been obtained from sources we believe are reliable, but we cannot guarantee the accuracy or completeness of such information.
Copyright (c) 2022 by RP® Financial, LC.
| RP® Financial, LC. | PEER GROUP ANALYSIS | |
| III.11 |
continuing to expand back office functions such as compliance. Over the long term, the Bank will be seeking to leverage both the capital and infrastructure investments through its expanded growth capacity.
When viewed together, net interest income and operating expenses provide considerable insight into a bank’s earnings strength, since those sources of income and expenses are typically the most prominent components of earnings and are generally more predictable than losses and gains realized from the sale of assets or other non-recurring activities. In this regard, the Bank’s interest coverage ratio equal to 1.54x was more favorable than the Peer Group’s expense coverage ratio of 1.10x. Importantly, the expense coverage ratio does not capture the impact of non-interest income which is comparatively modest for the Bank as noted below.
Contributions to earnings from non-interest operating income, excluding gains on sale of loans, was lower for the Bank in comparison to the Peer Group, equaling 0.12% and 0.28% of average assets, respectively. Moreover, the Peer Group’s earnings were supported by gains on the sale of loans equal to 0.59% of average assets based on the average and 0.01% based on the median with the average ratio for the Peer Group reflecting very high contributions of two companies. Taking non-interest operating income into account in comparing the Bank’s and the Peer Group’s earnings, ECB’s efficiency ratio (operating expenses, net of amortization of intangibles, as a percent of the sum of non-interest operating income and net interest income) of 60.67% was more favorable than the Peer Group’s average efficiency ratio of 71.39%.
Loan loss provisions were not a significant factor in the operations of either ECB or the Peer Group reflecting relatively strong asset quality ratios for both. Loan loss provisions established by the Bank and the Peer Group equaled 0.06% of average assets for both.
The Bank reported non-operating expenses equal to 0.32% of average assets which was comprised of the expense related to the freezing of the pension plan. Conversely, the Peer Group recorded minimal net non-operating gains and losses. The Bank’s non-recurring pension plan expense will be excluded from core earnings on a tax-effected basis for purposes of deriving a valuation core earnings base. Extraordinary items were not a factor in either the Bank’s or the Peer Group’s earnings.
The Bank recorded an effective tax rate of 26.12%, which was higher than the Peer Group’s effective tax rate of 21.97%. Based on discussions with ECB’s management, the
| RP® Financial, LC. | PEER GROUP ANALYSIS | |
| III.12 |
average tax rate for the Bank approximates the combined marginal tax rate for federal and state income taxes.
Loan Composition
Table 3.4 presents data related to the Bank’s and the Peer Group’s loan portfolio compositions (including the investment in mortgage-backed securities). In comparison to the Peer Group, the Bank’s loan portfolio composition reflected a higher combined concentration of 1-4 family permanent mortgage loans and mortgage-backed securities (49.59% of assets versus 33.88% for the Peer Group). Loan servicing intangibles constituted a more significant balance sheet item for the Peer Group, equal to an average of $1.7 million for the Peer Group compared to a minimal balance for the Bank.
Diversification into commercial lending was more significant for the Peer Group which reflected higher concentrations of commercial mortgage and non-mortgage loans which equaled 15.81% of assets in aggregate for ECB versus an average of 25.99% for the Peer Group. By comparison, ECB was more heavily invested in multi-family and construction which equaled 8.93% and 10.60% of assets, respectively, as compared to comparable ratios of 12.93% for the foregoing two loan categories in aggregate.
Overall, the Bank’s asset composition provided for a slightly lower risk weighted assets-to-assets ratio of 69.09% compared to 74.06% for the Peer Group.
Credit Risk
Overall, based on a comparison of credit risk measures, the Bank’s implied credit risk exposure was viewed to be modestly lower than the Peer Group’s implied credit risk exposure although both ECB and the Peer Group had favorable credit quality ratios overall. As shown in Table 3.5, the Bank’s ratios for non-performing/assets and non-performing loans/loans equaled 0.15% and 0.19%, respectively, versus comparable measures of 0.81% and 1.05% for the Peer Group. However, excluding accruing loans that are classified as troubled debt restructurings, the Peer Group’s average NPA/Assets ratio equaled 0.53%.
The Bank’s and Peer Group’s loss reserves as a percent of non-performing loans equaled 431.36% and 101.95%, respectively. Loss reserves maintained as percent of loans receivable equaled 0.81% for the Bank, versus 0.92% for the Peer Group- the lower ratio for the Bank is not unexpected given the lower ratio of NPAs. Net loan charge-offs were nominal for
| RP® Financial, LC. | PEER GROUP ANALYSIS | |
| III.13 |
Table 3.4
Loan Portfolio Composition and Related Information
Comparable Institution Analysis
As of December 31, 2021 or the Most Recent Date Available
| Portfolio Composition as a Percent of Assets | ||||||||||||||||||||||||||||||||||||||||||||
| 1-4 | Constr. | Multi- | Commerc. | RWA/ | Serviced | Servicing | ||||||||||||||||||||||||||||||||||||||
Company Name | MBS | Family | & Land | Family | Comm RE | Business | Consumer | Assets | For Others | Assets | ||||||||||||||||||||||||||||||||||
| (%) | (%) | (%) | (%) | (%) | (%) | (%) | (%) | ($000) | ($000) | |||||||||||||||||||||||||||||||||||
Everett Co-operative Bank | ||||||||||||||||||||||||||||||||||||||||||||
December 31, 2021 | 6.72 | % | 42.87 | % | 10.60 | % | 8.93 | % | 15.00 | % | 0.82 | % | 0.08 | % | 69.09 | % | $ | 0 | $ | 0 | ||||||||||||||||||||||||
Comparable Group | ||||||||||||||||||||||||||||||||||||||||||||
Averages | 9.52 | % | 24.36 | % | 8.23 | % | 4.69 | % | 16.62 | % | 9.36 | % | 2.98 | % | 74.06 | % | $ | 7,353 | $ | 1,721 | ||||||||||||||||||||||||
Medians | 6.45 | % | 27.53 | % | 3.36 | % | 3.86 | % | 15.66 | % | 5.49 | % | 0.23 | % | 72.13 | % | $ | 0 | $ | 10 | ||||||||||||||||||||||||
Comparable Group | ||||||||||||||||||||||||||||||||||||||||||||
ESSA Bank & Trust | PA | 5.50 | % | 35.46 | % | 6.49 | % | 6.79 | % | 18.41 | % | 2.99 | % | 0.63 | % | 75.28 | % | $ | 0 | $ | 833 | |||||||||||||||||||||||
Generations Bank | NY | 0.31 | % | 32.58 | % | 0.00 | % | 0.12 | % | 5.68 | % | 2.10 | % | 32.29 | % | 73.58 | % | $ | 0 | $ | 16 | |||||||||||||||||||||||
Huntingdon Valley Bank | PA | 2.73 | % | 33.30 | % | 9.46 | % | 2.68 | % | 9.02 | % | 10.97 | % | 0.81 | % | 65.36 | % | $ | 0 | $ | 3,382 | |||||||||||||||||||||||
Magyar Bank | NJ | 7.40 | % | 27.97 | % | 3.11 | % | 3.89 | % | 31.76 | % | 7.41 | % | 0.42 | % | 66.23 | % | $ | 0 | $ | 3 | |||||||||||||||||||||||
NorthEast Community Bank | NY | 0.65 | % | 0.59 | % | 56.03 | % | 9.58 | % | 3.87 | % | 9.68 | % | 0.02 | % | 105.70 | % | $ | 0 | $ | 0 | |||||||||||||||||||||||
PCSB Bank | NY | 11.99 | % | 12.73 | % | 0.85 | % | 10.74 | % | 36.73 | % | 5.09 | % | 0.02 | % | 72.80 | % | $ | 0 | $ | 0 | |||||||||||||||||||||||
The Provident Bank | MA | 0.93 | % | 2.53 | % | 2.66 | % | 2.68 | % | 20.56 | % | 56.88 | % | 0.09 | % | 90.64 | % | $ | 0 | $ | 0 | |||||||||||||||||||||||
Prudential Bank | PA | 11.36 | % | 17.67 | % | 9.27 | % | 6.73 | % | 15.15 | % | 5.89 | % | 0.05 | % | 67.17 | % | $ | 0 | $ | 0 | |||||||||||||||||||||||
Envision Bank | MA | 4.17 | % | 46.87 | % | 4.23 | % | 3.84 | % | 16.17 | % | 2.15 | % | 0.95 | % | 71.56 | % | $ | 0 | $ | 15,616 | |||||||||||||||||||||||
Westfield Bank | MA | 15.36 | % | 27.09 | % | 3.62 | % | 6.95 | % | 25.77 | % | 8.83 | % | 0.16 | % | 72.13 | % | $ | 88,238 | $ | 693 | |||||||||||||||||||||||
William Penn Bank | PA | 21.84 | % | 36.42 | % | 2.01 | % | 1.36 | % | 15.01 | % | 0.37 | % | 0.30 | % | NA | $ | 0 | $ | 109 | ||||||||||||||||||||||||
West View Savings Bank | PA | 32.07 | % | 19.07 | % | 1.09 | % | 0.95 | % | 1.36 | % | 0.00 | % | 0.01 | % | 54.21 | % | $ | 0 | $ | 0 | |||||||||||||||||||||||
Note: Bank level data
Source: S&P Capital IQ and RP® Financial, LC. calculations. The information provided in this table has been obtained from sources we believe are reliable, but we cannot guarantee the accuracy or completeness of such information.
Copyright (c) 2022 by RP® Financial, LC.
| RP® Financial, LC. | PEER GROUP ANALYSIS | |
| III.14 |
Table 3.5
Credit Risk Measures and Related Information
Comparable Institution Analysis
As of December 31, 2021 or the Most Recent Date Available.
| REO/ Assets | NPAs & 90+Del/ Assets (1) | Adj NPAs & 90+Del/ Assets (2) | NPLs/ Loans (3) | Rsrves/ Loans HFI | Rsrves/ NPLs (3) | Rsrves/ NPAs & 90+Del (1) | Net Loan Chargeoffs (4) | NLCs/ Loans | ||||||||||||||||||||||||||||||||
| (%) | (%) | (%) | (%) | (%) | (%) | (%) | ($000) | (%) | ||||||||||||||||||||||||||||||||
Everett Co-Operative Bank | ||||||||||||||||||||||||||||||||||||||||
December 31, 2021 | 0.00 | % | 0.15 | % | 0.15 | % | 0.19 | % | 0.81 | % | 431.36 | % | 431.36 | % | $ | 0 | 0.00 | % | ||||||||||||||||||||||
Comparable Group | ||||||||||||||||||||||||||||||||||||||||
Averages | 0.05 | % | 0.81 | % | 0.53 | % | 1.05 | % | 0.98 | % | 101.95 | % | 108.49 | % | $ | 585 | 0.07 | % | ||||||||||||||||||||||
Medians | 0.00 | % | 0.69 | % | 0.47 | % | 1.14 | % | 0.92 | % | 82.12 | % | 77.25 | % | $ | 93 | 0.02 | % | ||||||||||||||||||||||
Comparable Group | ||||||||||||||||||||||||||||||||||||||||
ESSA Bank & Trust | PA | 0.01 | % | 1.29 | % | 1.03 | % | 1.75 | % | 1.34 | % | 76.45 | % | 75.84 | % | -$ | 276 | -0.02 | % | |||||||||||||||||||||
Generations Bank | NY | 0.01 | % | 1.65 | % | 0.87 | % | 2.23 | % | 0.66 | % | 29.54 | % | 29.41 | % | $ | 516 | 0.18 | % | |||||||||||||||||||||
Huntingdon Valley Bank | PA | 0.00 | % | 0.67 | % | 0.67 | % | 1.02 | % | 0.72 | % | 63.10 | % | 63.10 | % | $ | 194 | 0.05 | % | |||||||||||||||||||||
Magyar Bank | NJ | 0.08 | % | 1.29 | % | 0.88 | % | 1.62 | % | 1.41 | % | 86.98 | % | 81.39 | % | $ | 0 | 0.00 | % | |||||||||||||||||||||
NorthEast Community Bank | NY | 0.16 | % | 0.16 | % | 0.16 | % | 0.00 | % | 0.54 | % | NA | 261.22 | % | $ | 3,444 | 0.40 | % | ||||||||||||||||||||||
PCSB Bank | NY | 0.00 | % | 0.50 | % | 0.27 | % | 0.50 | % | 0.68 | % | 134.65 | % | 89.50 | % | -$ | 369 | -0.03 | % | |||||||||||||||||||||
The Provident Bank | MA | 0.00 | % | 1.46 | % | 0.17 | % | 1.71 | % | 1.34 | % | 77.25 | % | 77.25 | % | $ | 2,904 | 0.22 | % | |||||||||||||||||||||
Prudential Bank | PA | 0.38 | % | 1.12 | % | 1.12 | % | 1.36 | % | 1.41 | % | 104.03 | % | 68.90 | % | $ | 124 | 0.02 | % | |||||||||||||||||||||
Envision Bank | MA | 0.00 | % | 0.48 | % | 0.33 | % | 0.64 | % | 1.14 | % | 164.42 | % | 164.42 | % | $ | 62 | 0.01 | % | |||||||||||||||||||||
Westfield Bank | MA | 0.00 | % | 0.35 | % | 0.20 | % | 0.48 | % | 1.06 | % | 221.60 | % | 221.60 | % | $ | 378 | 0.02 | % | |||||||||||||||||||||
William Penn Bank | PA | 0.01 | % | 0.71 | % | 0.61 | % | 1.26 | % | 0.77 | % | 61.50 | % | 60.72 | % | $ | 47 | 0.01 | % | |||||||||||||||||||||
West View Savings Bank | PA | 0.00 | % | 0.00 | % | 0.00 | % | 0.00 | % | 0.67 | % | NA | NA | $ | 0 | 0.00 | % | |||||||||||||||||||||||
| (1) | NPAs are defined as nonaccrual loans, performing TDRs, and OREO. |
| (2) | Adjusted NPAs are defined as nonaccrual loans and OREO (performing TDRs are excluded). |
| (3) | NPLs are defined as nonaccrual loans and performing TDRs. |
| (4) | Net loan chargeoffs are shown on a last twelve month basis. |
Source: S&P Capital IQ and RP® Financial, LC. calculations. The information provided in this table has been obrained from sources we believe are reliable, but we cannot guarantee the accuracy or completeness of such information.
Copyright (c) 2022 by RP® Financial, LC.
| RP® Financial, LC. | PEER GROUP ANALYSIS | |
| III.15 |
both the Bank and the Peer Group equaling 0 basis points and 7 basis points, respectfully, for the most recent twelve month period.
Interest Rate Risk
Table 3.6 reflects various key ratios highlighting the relative interest rate risk exposure of the Bank versus the Peer Group. In terms of balance sheet composition, ECB’s interest rate risk characteristics implied a comparable degree of interest rate risk exposure relative to the measures reported for the Peer Group. In this regard, while the Bank’s tangible equity-to-assets and IEA/IBL ratios were below the Peer Group ratios, non-interest earnings assets were also lower. On a pro forma basis, the infusion of stock proceeds should serve to strengthen the Bank’s balance sheet interest rate risk characteristics, given the increases that will be realized in Bank’s tangible equity-to-assets and IEA/IBL ratios.
To analyze interest rate risk associated with the net interest margin, we reviewed quarterly changes in net interest income as a percent of average assets for ECB and the Peer Group. In general, the comparative fluctuations in the Bank’s and the Peer Group’s net interest income ratios implied that a similar degree of interest rate risk was associated with the Bank’s net interest margin, based on the interest rate environment that prevailed during the period covered in Table 3.5. The stability of the Bank’s net interest margin should be enhanced by the infusion of stock proceeds, as interest rate sensitive liabilities will be funding a lower portion of ECB’s assets and the proceeds will be substantially deployed into interest-earning assets.
| RP® Financial, LC. | PEER GROUP ANALYSIS | |
| III.16 |
Table 3.6
Interest Rate Risk Measures and Net Interest Income Volatility
Comparable Institution Analysis
As of December 31, 2021 or the Most Recent Date Available.
| Balance Sheet Measures | ||||||||||||||||||||||||||||||||||||||||||||||
| Tangible | Avg | Non-Earn. | Quarterly Change in Net Interest Income | |||||||||||||||||||||||||||||||||||||||||||
| Equity/ | IEA/ | Assets/ | ||||||||||||||||||||||||||||||||||||||||||||
| Assets | Avg IBL | Assets | 12/31/2021 | 9/30/2021 | 6/30/2021 | 3/31/2021 | 12/31/2020 | 6/30/2020 | ||||||||||||||||||||||||||||||||||||||
| (%) | (%) | (%) | (change in net interest income is annualized in basis points) | |||||||||||||||||||||||||||||||||||||||||||
Everett Co-Operative Bank | ||||||||||||||||||||||||||||||||||||||||||||||
December 31, 2021 | 11.6 | % | 128.4 | % | 3.7 | % | 10 | -1 | -5 | 10 | -3 | 11 | ||||||||||||||||||||||||||||||||||
Comparable Group | ||||||||||||||||||||||||||||||||||||||||||||||
Average | 13.2 | % | 142.3 | % | 7.2 | % | -2 | 11 | 3 | -4 | 9 | 1 | ||||||||||||||||||||||||||||||||||
Median | 12.2 | % | 136.2 | % | 6.0 | % | 1 | 13 | 0 | -2 | 17 | 2 | ||||||||||||||||||||||||||||||||||
Comparable Group | ||||||||||||||||||||||||||||||||||||||||||||||
ESSA | ESSA Bancorp, Inc. | PA | 10.4 | % | 129.8 | % | 4.8 | % | -11 | 25 | 1 | 5 | 18 | 10 | ||||||||||||||||||||||||||||||||
GBNY | Generations Bancorp NY, Inc. | (1 | ) | NY | 10.9 | % | 101.4 | % | 10.7 | % | NA | 13 | 7 | 14 | 7 | -1 | ||||||||||||||||||||||||||||||
HVBC | HV Bancorp, Inc. | PA | 7.6 | % | NA | 6.4 | % | -23 | 49 | 49 | 9 | -65 | -11 | |||||||||||||||||||||||||||||||||
MGYR | Magyar Bancorp, Inc. | NJ | 12.6 | % | 155.0 | % | 4.3 | % | -3 | 0 | -6 | 17 | 20 | -3 | ||||||||||||||||||||||||||||||||
NECB | Northeast Community Bancorp, Inc. | NY | 20.5 | % | 185.1 | % | 12.0 | % | 6 | -19 | -11 | -4 | 20 | 9 | ||||||||||||||||||||||||||||||||
PCSB | PCSB Financial Corporation | NY | 14.3 | % | 131.4 | % | 4.8 | % | 14 | 1 | 10 | 0 | 1 | -3 | ||||||||||||||||||||||||||||||||
PVBC | Provident Bancorp, Inc. | MA | 13.5 | % | 187.4 | % | 7.6 | % | 1 | 12 | -13 | -27 | 19 | 5 | ||||||||||||||||||||||||||||||||
PBIP | Prudential Bancorp, Inc. | PA | 11.8 | % | 113.6 | % | 5.5 | % | 1 | 17 | 7 | 3 | 13 | 4 | ||||||||||||||||||||||||||||||||
RNDB | Randolph Bancorp, Inc. | MA | 12.6 | % | 138.4 | % | 10.3 | % | -20 | 34 | 5 | -3 | 18 | -7 | ||||||||||||||||||||||||||||||||
WNEB | Western New England Bancorp, Inc. | MA | 8.3 | % | 147.0 | % | 5.7 | % | -10 | 15 | -13 | -12 | 47 | 9 | ||||||||||||||||||||||||||||||||
WMPN | William Penn Bancorporation | PA | 25.1 | % | 134.1 | % | 11.7 | % | 13 | -10 | -2 | -34 | 17 | 8 | ||||||||||||||||||||||||||||||||
WVFC | WVS Financial Corp. | PA | 10.7 | % | NA | 2.4 | % | 5 | -8 | -4 | -10 | -2 | -10 | |||||||||||||||||||||||||||||||||
NA=Change is greater than 100 basis points during the quarter.
(1) As of September 30, 2021 or the latest date available.
Source: S&P Capital IQ and RP® Financial, LC. calculations. The information provided in this table has been obtained from sources we believe are reliable, but we cannot guarantee the accuracy or completeness of such information.
Copyright (c) 2022 by RP® Financial, LC.
| RP® Financial, LC. | PEER GROUP ANALYSIS | |
| III.17 |
Summary
Based on the above analysis, RP Financial concluded that the Peer Group forms a reasonable basis for determining the pro forma market value of the Bank. Such general characteristics as asset size, capital position, interest-earning asset composition, funding composition, core earnings measures, loan composition, credit quality and exposure to interest rate risk all tend to support the reasonability of the Peer Group from a financial standpoint. Those areas where differences exist will be addressed in the form of valuation adjustments to the extent necessary.
| RP® Financial, LC. | VALUATION ANALYSIS | |
| IV.1 |
IV. VALUATION ANALYSIS
Introduction
This chapter presents the valuation analysis and methodology prepared pursuant to the regulatory guidelines, and valuation adjustments and assumptions used to determine the estimated pro forma market value of the common stock to be issued in conjunction with the Bank’s standard conversion offering.
Appraisal Guidelines
The federal regulatory appraisal guidelines required by the OCC, FRB, the FDIC and state banking agencies specify the pro forma market value methodology for estimating the pro forma market value of an institution. Pursuant to this methodology: (1) a peer group of comparable publicly-traded institutions is selected; (2) a financial and operational comparison of the subject Bank to the peer group is conducted to discern key differences; and (3) a valuation analysis in which the pro forma market value of the subject Bank is determined based on the market pricing of the peer group as of the date of valuation, incorporating valuation adjustments for key differences. In addition, the pricing characteristics of recent conversions, both at conversion and in the aftermarket, must be considered.
RP Financial Approach to the Valuation
The valuation analysis herein complies with such regulatory approval guidelines. Accordingly, the valuation incorporates a detailed analysis based on the Peer Group, discussed in Chapter III, which constitutes “fundamental analysis” techniques. Additionally, the valuation incorporates a “technical analysis” of recently completed conversions, including closing pricing and aftermarket trading of such offerings. It should be noted that these valuation analyses cannot possibly fully account for all the market forces which impact trading activity and pricing characteristics of a stock on a given day.
The pro forma market value determined herein is a preliminary value for the Bank’s to-be-issued stock. Throughout the stock issuance process, RP Financial will: (1) review changes in the Bank’s operations and financial condition; (2) monitor the Bank’s operations and financial condition relative to the Peer Group to identify any fundamental changes; (3) monitor the external factors affecting value including, but not limited to, local and national economic
| RP® Financial, LC. | VALUATION ANALYSIS | |
| IV.2 |
conditions, interest rates and the stock market environment, including the market for thrift stocks; and, (4) monitor pending conversion offerings, both regionally and nationally. If material changes should occur prior to the close of the offering, RP Financial will evaluate if updated valuation reports should be prepared reflecting such changes and their related impact on value, if any. RP Financial will also prepare a final valuation update at the closing of the offering to determine if the prepared valuation analysis and resulting range of value continues to be appropriate.
The appraised value determined herein is based on the current market and operating environment for the Bank and for all thrifts. Subsequent changes in the local and national economy, the legislative and regulatory environment, the stock market, interest rates, and other external forces (such as natural disasters or major world events), which may occur from time to time (often with great unpredictability) may materially impact the market value of all thrift stocks, including ECB’s value, the market value of the stocks of publicly traded financial institutions or ECB’s value alone. To the extent a change in factors impacting the Bank’s value can be reasonably anticipated and/or quantified, RP Financial has incorporated the estimated impact into its analysis.
Valuation Analysis
A fundamental analysis discussing similarities and differences relative to the Peer Group was presented in Chapter III. The following sections summarize the key differences between the Bank and the Peer Group and how those differences affect the pro forma valuation. Emphasis is placed on the specific strengths and weaknesses of the Bank relative to the Peer Group in such key areas as financial condition, profitability, growth and viability of earnings, asset growth, primary market area, dividends, liquidity of the shares, marketing of the issue, management, and the effect of government regulations and/or regulatory reform. We have also considered the market for thrift stocks, in particular new issues, to assess the impact on value of ECB’s coming to market at this time.
| 1. | Financial Condition |
The financial condition of an institution is an important determinant in pro forma market value because investors typically look to such factors as liquidity, capital, asset composition and quality, and funding sources in assessing investment attractiveness. The similarities and differences in the Bank’s and the Peer Group’s financial strengths are noted as follows:
| RP® Financial, LC. | VALUATION ANALYSIS | |
| IV.3 |
| • | Overall A/L Composition. Loans funded by retail deposits were the primary components of both ECB’s and the Peer Group’s balance sheets. In comparison to the Peer Group, the Bank’s interest-earning asset composition exhibited a slightly higher concentration of loans but a slightly lower level of diversification into high risk-weight loans. ECB’s funding composition was similar to the Peer Group as both funded operations primarily with deposits and the level of borrowings was small for the Peer Group and minimal for the Bank. Overall, as a percent of assets, the Bank maintained a higher level of interest-earning assets and a higher level of interest-bearing liabilities relative to the comparable ratios for the Peer Group, which translated into a slightly higher IEA/IBL ratio for ECB. After factoring in the impact of the net stock proceeds, the Bank’s IEA/IBL ratio will realize further improvement relative to the Peer Group’s IEA/IBL ratio. On balance, RP Financial concluded that the overall A/L composition was broadly comparable to the Peer Group. |
| • | Credit Quality. Both the Bank and the Peer Group had relatively favorable asset quality measures with ECB’s ratios being slightly more favorable. Specifically, the ratio of NPAs/Assets was lower while reserve coverage in relation to NPAs was higher. Loss reserves maintained as percent of loans receivable equaled 0.81% for the Bank, versus 0.92% for the Peer Group and the lower ratio for the Bank is not unexpected given the lower ratio of NPAs. Overall, RP Financial concluded that credit quality was a slightly favorable factor in our adjustment for financial condition. |
| • | Balance Sheet Liquidity. The Bank maintained a lower level of cash and investment securities than the Peer Group. At the same time, the substantial majority of the investment securities portfolio which is also larger are classified as held-to-maturity limiting the ability to generate liquidity over the short term. Following the infusion of stock proceeds, the Bank’s cash and investments ratio is expected to increase as a portion of the net proceeds will initially be held in short-term liquid funds. The Bank’s future borrowing capacity was considered to be similar to the Peer Group’s borrowing capacity, as the level of borrowings was modest for both. Overall, RP Financial concluded that balance sheet liquidity was a slight positive factor in our adjustment for financial condition with the expected addition of the stock conversion proceeds at the completion of the conversion. |
| • | Funding Liabilities. The Bank’s interest-bearing funding composition reflected a slightly higher concentration of deposits and a lower concentration of borrowings relative to the comparable Peer Group median ratios but were broadly comparable overall. Overall, RP Financial concluded that funding liabilities were a neutral factor in our adjustment for financial condition. |
| • | Equity. The Bank currently operates with a tangible equity/assets ratio which fell below the Peer Group’s average and median ratios on a pre-conversion basis. However, following the stock offering, ECB’s holding company’s pro forma capital position will exceed the Peer Group’s figures by a material amount. On balance, RP Financial concluded that equity strength was a positive factor in our adjustment for financial condition. |
| RP® Financial, LC. | VALUATION ANALYSIS | |
| IV.4 |
On balance, ECB’s balance sheet strength was considered to be modestly greater than the Peer Group’s balance sheet strength and, thus, a slight upward adjustment was applied for the Bank’s financial condition.
| 2. | Profitability, Growth and Viability of Earnings |
Earnings are a key factor in determining pro forma market value, as the level and risk characteristics of an institution’s earnings stream and prospects to generate future earnings heavily influence the multiple that the investment community will pay for earnings. The major factors considered in the valuation are described below.
| • | Reported Earnings. The Bank’s reported earnings were lower than the Peer Group’s on a ROAA basis (0.64% of average assets versus a median 0.82% of average assets for the Peer Group). As noted in the Peer Group analysis in Section Three, the modestly lower core earnings was the result of a pension termination expense and core earnings was more similar as noted below. |
| • | Core Earnings. Importantly, the Bank’s core earnings adjusted to exclude the $1.5 million after-tax expense of the pension termination equaled $5.5 million or 0.88% and thus was modestly higher than the Peer Group’s reported earnings level. The Bank’s core earnings benefits from stronger levels of net interest income and the efficient two office branch structure which contributed to a lower level of operating expenses. The Bank reported higher earnings notwithstanding the Peer Group’s higher non-interest income and gains on the sale of loans. Overall, the Bank’s core earnings were considered to be comparable to the Peer Group’s reported earnings and, thus, RP Financial concluded that this was a neutral factor in our adjustment for profitability, growth and viability of earnings. |
| • | Interest Rate Risk. Quarterly changes in the Bank’s and the Peer Group’s net interest income to average assets ratios indicated that a similar degree of volatility was associated with ECB’s net interest margin. Other measures of interest rate risk, such as IEA/IBL ratios and levels of non-interest earning assets were more favorable for the Bank. On a pro forma basis, the infusion of stock proceeds can be expected to provide the Bank with equity-to-assets and IEA/ILB ratios that are more favorable than the Peer Group’s ratios, as well as enhance the stability of the Bank’s net interest margin. Accordingly, on balance, interest rate risk was a neutral factor in our adjustment for profitability, growth and viability of earnings. |
| • | Credit Risk. The impact of future credit losses is considered to be nominal for the Bank and only marginally higher for the Peer Group, primarily reflecting the greater inherent risk in their higher risk-weight loan portfolios which included a higher level of commercial mortgage and non-mortgage loans as well as multi-family and construction loans. Overall, RP Financial concluded that credit risk was a slight positive factor in our adjustment for profitability, growth and viability of earnings for the Bank, the upward assessment was mitigated by the fact that the Peer Group also maintained very strong asset quality and had a limited |
| RP® Financial, LC. | VALUATION ANALYSIS | |
| IV.5 |
history of credit-related losses. In addition, implementation of the Bank’s growth and diversification strategy will result in ECB’s credit risk exposure increasing as the Bank increases high risk-weight commercial lending and potentially through the growth of larger borrower relationships to achieve the targeted growth objectives. |
| • | Earnings Growth Potential. Several factors were considered in assessing earnings growth potential. First, the Bank’s net income approximates the Peer Group average and median on a pre-conversion basis. However, the Bank is projecting to incur additional operating costs related to its infrastructure and expansion investments without equal offsetting revenues initially. Additionally, while the stock conversion will provide additional capital to facilitate long term growth, the expense of the stock benefit plans and the high capital ratio which will prevail until the equity raised in conversion can be leveraged will depress the ROE initially. In view of the Bank’s expansion plans and pro forma capital level, ECB’s earnings growth potential was considered to be modestly better than the Peer Group. At the same time, the advantage was mitigated to an extent from an investor’s perspective given the execution risk inherent in the growth strategy. Accordingly, earnings growth potential was a slight favorable factor in our adjustment for profitability, growth and viability of earnings. |
| • | Return on Equity. Currently, the Bank‘s core ROE is comparable to the Peer Group’s core ROE. As the result of the increase in equity that will be realized from the infusion of net stock proceeds into the Bank’s equity, coupled with the impact of the incremental expenses for the infrastructure investments, the Bank’s pro forma return equity will be lower than the Peer Group’s ROE for at least the intermediate future. |
On balance, ECB’s pro forma earnings strength was considered to be less favorable than the Peer Group’s as meaningful future earnings growth will be dependent upon ECB’s ability to successfully execute its growth and diversification strategy which will take several years to fully realize and entails a degree of execution risk. Coupled with the much higher capital ratio that ECB will operate with, the ROE will be depressed relative to the Peer Group over at least the next five years based on the projected results in ECB’s strategic plan. Accordingly, we applied a slight downward adjustment for Profitability, Growth and Viability of Earnings.
| 3. | Asset Growth |
Comparative asset growth rates for the Bank and the Peer Group showed a 13.42% which exceeded the Peer Group average and median asset growth rates 4.42% and 6.39%, respectively, over the most recent 12 month period. Importantly, the fiscal stimulus in the COVID pandemic environment has resulted in an influx of funds for many financial institutions in excess of loan demand. In this regard, the Peer Group’s loan portfolio shrank by approximately
| RP® Financial, LC. | VALUATION ANALYSIS | |
| IV.6 |
1% on average while ECB’s loan portfolio increased by 10.70% over the corresponding timeframe. Overall, the Bank’s recent asset growth trends would tend to be viewed favorably relative to the Peer Group’s asset growth trends in terms of supporting future earnings growth. On a pro forma basis, the Bank’s tangible equity-to-assets ratio will be higher than the Peer Group’s tangible equity-to-assets ratio, providing the Bank with greater leverage capacity as maintained by the Peer Group. Coupled with the adoption and initial implementation of a growth-oriented business plan, a slight upward adjustment was applied for asset growth.
| 4. | Primary Market Area |
The general condition of an institution’s market area has an impact on value, as future success is in part dependent upon opportunities for profitable activities in the local market served. ECB serves the Boston Metropolitan Areas focusing on areas north of Boston in Middlesex and Essex Counties through the main office in Everett and a branch office in Lynnfield. Within this market, the Bank faces significant competition for loans and deposits from both community-based institutions and larger regional financial institutions, which provide a broader array of services and have significantly larger branch networks. However, the Peer Group companies by virtue of their relatively comparable size relative to ECB also face numerous and/or large competitors.
Demographic and economic trends and characteristics in the Bank’s primary market area are presented in Exhibit III-3 along with Peer Group comparable data. In this regard, the total population of Middlesex and Essex Counties is higher than the average and median primary market areas of the Peer Group. While these demographic trends are slightly more favorable for the Bank, the per capita income level in Middlesex County ($66,418 estimated as of 2022) is well above the average and median of the Peer Group’s markets while the income level for Essex County is more comparable to the Peer Group median. The deposit market share exhibited by the Bank in both Middlesex and Essex Counties is below the Peer Group average and median, indicative of the larger market within which the Bank operates, while several of the Peer Group members operate in smaller demographic areas. As shown in Table 4.1, the average unemployment rate for the primary market area counties served by the Peer Group companies was modestly higher than the unemployment rate reflected for Middlesex County but lower than the rate for Essex County. On balance, we concluded that a slight upward adjustment was appropriate for the Bank’s market area.
| RP® Financial, LC. | VALUATION ANALYSIS | |
| IV.7 |
Table 4.1
Everett Co-operative Bank
Peer Group Market Area Unemployment Rates
| Unemployment | ||||||
| Rate | ||||||
County | December 2021 | |||||
Everett Co-operative Bank | Middlesex, MA | 2.6 | % | |||
Peer Group Average | 3.8 | % | ||||
Peer Group | ||||||
ESSA Bancorp, Inc. | Monroe, PA | 5.2 | % | |||
Generations Bancorp NY, Inc. | Seneca, NY | 2.8 | % | |||
HV Bancorp, Inc. | Bucks, PA | 3.3 | % | |||
Magyar Bancorp, Inc. | Middlesex, NJ | 4.3 | % | |||
Northeast Community Bancorp, Inc. | Westchester, NY | 2.8 | % | |||
PCSB Financial Corporation | Westchester, NY | 2.8 | % | |||
Provident Bancorp, Inc. | Essex, MA | 3.8 | % | |||
Prudential Bancorp, Inc. | Philadelphia, PA | 5.8 | % | |||
Randolph Bancorp, Inc. | Norfolk, MA | 3.1 | % | |||
Western New England Bancorp, Inc. | Hampden, MA | 4.9 | % | |||
William Penn Bancorporation | Bucks, PA | 3.3 | % | |||
WVS Financial Corp. | Allegheny, PA | 3.7 | % | |||
Source: S&P Capital IQ.
| 5. | Dividends |
At this time the Bank has not established a dividend policy. Future declarations of dividends by the Board of Directors will depend upon a number of factors, including investment opportunities, growth objectives, financial condition, profitability, tax considerations, minimum capital requirements, regulatory limitations, stock market characteristics and general economic conditions.
Ten out of the twelve Peer Group companies pay regular cash dividends, with implied dividend yields ranging from 0.24% to 2.67%. The average dividend yield on the stocks of the Peer Group institutions equaled 2.11% as of February 18. 2022, reflecting the yield of the ten
| RP® Financial, LC. | VALUATION ANALYSIS | |
| IV.8 |
companies which have a regular dividend policy. Comparatively, as of February 18. 2022, the average dividend yield on the stocks of all fully-converted publicly-traded thrifts equaled 1.30%.
Overall, following the conversion, the Bank’s capacity to pay dividends is viewed to be comparable to the Peer Group’s capacity to pay dividends based on its pro forma capitalization and earnings levels. On balance, we concluded that no adjustment was warranted for this factor.
| 6. | Liquidity of the Shares |
The Peer Group is by definition composed of companies that are traded in the public markets. All of the Peer Group companies trade on NASDAQ. Typically, the number of shares outstanding and market capitalization provides an indication of how much liquidity there will be in a particular stock. The market capitalization of the Peer Group companies ranged from $26.3 million to $297.1 million as of February 18. 2022, with average and median market values of $146.5 million and $146.2 million, respectively. The shares issued and outstanding of the Peer Group companies ranged from 1.7 million to 22.7 million, with average and median shares outstanding equal to 10.1 million and 8.8 million, respectively. The Bank’s stock offering is expected to provide for a pro forma market value that will be modestly below the Peer Group median. Following the conversion, the Bank’s stock will be traded on the NASDAQ Capital Market. Overall, we anticipate that the Bank’s stock will have a comparable level of trading as the Peer Group companies on average and, therefore, we concluded that no adjustment was necessary for this factor.
| 7. | Marketing of the Issue |
Three separate markets exist for thrift stocks: (1) the after-market for public companies, both fully-converted stock companies and MHC’s, in which trading activity is regular and investment decisions are made based upon financial condition, earnings, capital, ROE, dividends and future prospects; (2) the new issue market in which converting thrifts are evaluated on the basis of the same factors but on a pro forma basis without the benefit of prior operations as a publicly-held Bank and stock trading history; and (3) the thrift acquisition market. All three of these markets were considered in the valuation of the Bank’s to-be-issued stock.
| RP® Financial, LC. | VALUATION ANALYSIS | |
| IV.9 |
| A. | The Public Market |
The value of publicly-traded thrift stocks is easily measurable, and is tracked by most investment houses and related organizations. Exhibit IV-1 provides pricing and financial data on all publicly-traded thrifts. In general, thrift stock values react to market stimuli such as interest rates, inflation, perceived industry health, projected rates of economic growth, regulatory issues and stock market conditions in general. Exhibit IV-2 displays historical stock market trends for various indices and includes historical stock price index values for thrifts and commercial banks. Exhibit IV-3 displays various stock price indices as of February 18, 2022.
In terms of assessing general stock market conditions, the performance of the overall stock market has generally shown an upward trend in recent quarters. A wave of new Covid-19 infections prompted a sell-off in the broader stock at the at the start of 2021, which was followed by stocks rallying higher on expectations that there would be a big boost in government spending under a Democrat-controlled Senate. Stocks fell in mid-January, as initial jobless claims posted their biggest weekly increase since the Covid-19 pandemic hit in March. After all three major U.S. stock indexes closed at record highs going into the second half of January, all three major U.S. stock indexes suffered their sharpest losses in late-January amid concerns about how effectively the Covid-19 vaccine was being distributed. Robust fourth quarter earnings posted by some large-cap stocks and a decline in initial jobless claims for a third straight week contributed to stocks rallying higher in the first week of February. All three major U.S. stock indexes closed at record highs going into mid-February, as expectations of a new round of stimulus aid, strong corporate earnings and progress with the rollout of the Covid-19 vaccine fueled stock market gains. The DJIA closed at a new record high at the conclusion of the Federal Reserve’s policy meeting on February 24th, as the Federal Reserve signaled that it was committed to keeping east-monetary policies unchanged. Led by a decline in technology shares, stocks retreated at the end of February on inflation concerns and rising Treasury yields. The DJIA surged to several record highs during the first half of March, as investors rotated into cyclical stocks following a stronger-than-expected employment report for February and progress on a new stimulus bill. Comparatively, with long-term Treasury yields continuing to rise, the NASDAQ fell into correction territory in the second week of March. After the Federal Reserve pledged to maintain its easy-money policies, the DJIA closed above 33000 for the first time heading into the second half of March. As long-term Treasury yields continued to rise, technology and other high growth stocks experienced further selling pressure heading into the
| RP® Financial, LC. | VALUATION ANALYSIS | |
| IV.10 |
second half of March. Stocks retreated going into late-March and then rallied on signs that the U.S. economy was positioned for a period of rapid growth. For the first quarter overall, the DJIA was up 7.8%, the S&P 500 gained 5.8% and the NASDAQ added 2.8%.
Led by rebound in technology stocks, the S&P 500 closed above 4000 for the first time at the start of the second quarter of 2021. March jobs data, which showed stronger-than-expected job growth, and a rebound in March service sector activity powered the DJIA and S&P 500 to record highs in the second week of April, as investors bet that economic growth would pick up with more people getting Covid-19 vaccines and increased government spending. Some strong first quarter earnings reports pushed the DJIA and S&P 500 to more record highs in mid-April, which was followed by stocks trading lower across all sectors heading into the second half of April. Stocks traded unevenly heading into the last week of April, as investors weighed fresh evidence that a strong economic recovery was underway against rising Covid-19 infection levels in some countries and consideration by the Biden administration to raise capital gain taxes. For the month of April, the DJIA, S&P 500 and NASDAQ posted monthly gains of 2.7%, 5.2% and 5.4% respectively.
Economically sensitive shares led the stock market higher at the start of May, as investors reacted to data showing economic growth was picking up and continuation of a strong earnings season. A lackluster April jobs report sparked a rebound in technology shares and other growth stocks, while the DJIA and S&P 500 closed at record highs on May 7th. Stock market turbulence prevailed heading into mid-May, with the broader stock market selling off after a sharp increase in April consumer prices heightened inflation concerns and then ended the week rallying higher. Economically sensitive shares led the market lower going in the second half of May, as the Federal Reserve signaled an eventual shift away from its easy-money pandemic policies amid evidence of mounting inflation and a robust economic recovery. Two consecutive weeks of initial weekly jobless claims hitting new pandemic lows contributed to stocks rallying in late-May, with the DJIA and S&P 500 recording gains for the month of May versus a slight decline in the NASDAQ and, thereby, snapping a six-month winning streak.
Stocks closed out the first week of June 2021 edging higher after the May employment report showed the labor market continued its slow recovery. Losses in the financial, industrial and consumer sectors weighed on the broader stock market heading into mid-June, as investors balanced their confidence in the economy reopening against the risks of rising inflation, supply-chain problems and the possibility of higher taxes. Rate-hike worries
| RP® Financial, LC. | VALUATION ANALYSIS | |
| IV.11 |
fueled a sell-off following the Federal Reserve’s mid-June policy meeting, in which the Federal Reserve signaled that they expected to raise interest rates by late-2023, sooner than they had previously anticipated. Stocks rebounded in the second half of June, with the major U.S. stock indexes closing out the second quarter at or near record highs driven by data signaling acceleration in the world economy and optimism over additional fiscal stimulus in the form of a $1 trillion infrastructure plan.
All three major U.S. stock indexes closed at new highs at the start of the third quarter of 2021, as the June jobs report confirmed that the U.S. economy continued to recover at a healthy clip. Concerns about inflation and the rapid spread of the Covid-19 Delta variant contributed to snapping a three-week winning streak for U.S. stocks in mid-July. A string of strong second quarter earnings reports helped stocks rebound to new highs heading into late-July, with all three major U.S. stock indexes finishing with gains for the month of July. A generally positive trend in the broader stock market was sustained through the first week of August, as the July employment report indicated that the economy was continuing to rebound. Passage of an infrastructure bill by the Senate and generally strong second quarter earnings helped to propel the Dow Jones Industrial Average (“DJIA”) and S&P 500 to more record highs in the second week of August.
The NASDAQ and S&P 500 traded to new record highs at the start of September, which was followed by a pullback in the broader stock market as weaker-than-expected job growth for August raised concerns that an increasing number of Covid-19 cases would slow economic growth. Mixed economic data and concerns about the inflation outlook and that stocks had rallied for too long without a correction translated into stocks trading unevenly through mid-September. Worries about spreading troubles from China’s property market due to the potential default of a major real estate developer in China prompted a broad-based sell-off on September 20th, with energy and financial shares leading the biggest stock market decline since May. Economically sensitive shares led stocks higher heading into the final week of the third quarter, which was attributed to the Federal Reserve signaling the economy had made enough progress for the central bank to begin reducing pandemic stimulus measures in November. Stocks retreated sharply lower to close out the third quarter, as investors contemplated that higher inflation would stick around longer than expected.
The broader stock market continued to trade unevenly through the first half of October 2021, with lawmakers reaching a deal on a short-term debt limit and strong earnings
| RP® Financial, LC. | VALUATION ANALYSIS | |
| IV.12 |
posted by bank and healthcare companies contributing to stock market gains that were somewhat negated by stocks trading lower on worries about slowing growth and mounting inflation. Propelled by strong third quarter earnings reports, all three major U.S. stocks closed at multiple record highs during the second half of October. For the month of October, the Dow Jones Industrial Average (“DJIA”) was up 5.8%, the S&P 500 was up 6.9% and the NASDAQ was up 7.3%. The broader stock market rally continued through the first week of November, with all three major U.S. stock indexes rising to fresh highs after the Federal Reserve approved plans to start scaling back its bond-buying stimulus program and the October employment report showed job growth rebounded. Data showing that inflation hit a three-decade high contributed to snapping the five-week winning streak in the broader stock market, as all three of the major U.S. stock indexes finished the second week of November with slim losses. Fresh Covid-19 restrictions in Europe contributed to stocks trading lower going into the second half of November, as a rise in Covid-19 cases dimmed prospects for a global economic recovery. Concerns that the fast-spreading Omicron Covid-19 variant would derail the global economy’s recovery triggered a sell-off in the broader stock market, with the DJIA suffering its worst day of 2021 on the Friday following Thanksgiving. Fueled by the uncertain impact of the Omicron variant and rising inflation, the retreat in the broader stock market continued through the end of November and the start of December. Notwithstanding weaker-than-expected job growth reported for November, stocks rallied to close out the first week of December and into the second week of December on hopes that the Omicron variant would be less damaging to the economy than initially feared. Stocks retreated ahead of the Federal Reserve mid-December meeting and then traded higher at conclusion of the Federal Reserve meeting, as the Federal Reserve mapped out plans to more quickly wind down pandemic stimulus efforts and to raise its target interest rate at least three times in 2022.
The broader market stock indices flirted with record highs to close out 2021 and in trading in the first week of the New Year. However, the market exhibited significant volatility in the latter half of January into February as by the market close on Wednesday, January 26th, the cumulative loss on the S&P 500 index had moved towards 10% barely four weeks into the New Year. The year-to-date decline in the NASDAQ Composite, a tech-heavy index, is well into the double digits. The message from the Federal Reserve, which concluded its scheduled policy meeting on the 26th, is that interest rates must rise soon to tackle high inflation. The stock market subsequently rallied into the last trading week of January into February on volatile trading as 1st quarter earnings reports buoyed the market. However, the broad market indices
| RP® Financial, LC. | VALUATION ANALYSIS | |
| IV.13 |
diminished to the levels of late January through February 18, 2022, as geopolitical concerns with the looming war in Ukraine and the impact of rising energy prices loomed large in investors concerns. On February 18, 2022, the DJIA closed at 34079.18 and the NASDAQ closed at 13548.07.
The market for thrift stocks has also generally been positive in recent quarters. Thrift shares traded flat at the start of 2021 and then rallied higher in the second week of January on expectations of additional stimulus after Democrats took control of the Senate. Thrift shares reversed course and trended lower in the second half of January on concerns over the lingering economic impact of the coronavirus and related impact on loan demand and credit quality. A decline in coronavirus cases across the U.S. helped thrift shares to rebound in the first week of February. Expectations of more stimulus, some positive economic reports and rising bond yields contributed to thrift shares trading higher going into late-February. After trading lower in late-February on inflation concerns, thrift shares rallied during the first half of March. The SNL Thrift Index for all publicly-traded thrifts was up 9.1% during the first half of March, as investors rotated into economically shares on signs that the U.S. economy was gaining traction in light of the favorable jobs report for March, the signing of a $1.9 trillion relief package and more people getting vaccinated. Thrift shares pulled back towards the close of the first quarter on concerns about the strength of the economic recovery, the Federal Reserve’s ending of a yearlong reprieve that eased capital requirements for big banks and a large investment fund unwound billions of dollars in holdings.
Strong job growth reflected in the March employment data and an improving economic outlook propelled thrift stocks higher at the start of the second quarter of 2021. Despite favorable first quarter earnings posted by Wall Street’s big banks, financial shares edged lower in mid-April as investors focused on the lack of loan growth and net interest margins coming under further pressure. A pick-up in bank merger activity contributed to financial shares trading higher going into the last week of April, which was followed by thrift shares pulling back in the last week of April on signs that inflation was accelerating. Signs that economic growth was accelerating helped to lift thrift shares in early-May. After spiking lower on signs that inflation was heating up, thrift shares powered higher to close out the second week of trading in May as investors saw value in bank stocks that underperformed the broader stock market during 2020 and were trading at relatively low P/E multiples compared to the S&P 500. After financial shares retreated in late-May, as the Federal Reserve’s top supervisory official
| RP® Financial, LC. | VALUATION ANALYSIS | |
| IV.14 |
came under criticism during his semi-annual congressional testimony, bank and thrift stocks traded higher to closeout May and the start of June on news that initial weekly jobless claims hit a new pandemic low for a second consecutive week.
Weaker-than-expected job growth reflected in the May employment report translated into financial shares edging lower to close out the first week of June 2021. With data showing another leap in May consumer prices, concerns of rising inflation pressured financial shares lower in the second week of June. Financial shares retreated further heading into the second half of June, as investors reacted to the Federal Reserve projecting higher interest rates sooner than expected and an unexpected rise in weekly jobless claims. Progress in negotiations towards reaching an agreement on infrastructure legislation boosted financial shares in late-June, which was followed by a sell-off in financial shares going into start of the third quarter on growing concerns about the economic recovery amid the spread of the Delta coronavirus variant.
Financial shares posted gains following Congressional testimony by the Federal Reserve Chairman in mid-July 2021, where he told members of Congress that inflation would moderate and that the central bank planned to maintain its current monetary policies. Following a pullback heading into the second half of July, financial shares traded higher in late-July as the Federal Reserve concluded its policy meeting maintaining its target rate near zero and hinted that it could start tapering bond purchases. Concerns that the pandemic recovery might be faltering pressured financial shares lower at the start of August, which was followed by bank and thrift stocks rebounding on the favorable employment numbers reported for July as investors weighed reassuring comments from the Federal Reserve Chairman and full approval of the Pfizer Covid-19 vaccine against a potential slowdown in the economic recovery due to an uptick in Covid-19 infections. Prior to stabilizing in mid-September, disappointing payrolls numbers reported for August weighed on economically sensitive shares through the first two weeks of September. After financial shares were among the worst performing sectors during the September 20th sell-off triggered by the potential default of a major Chinese real estate developer, economically sensitive shares traded higher to close out the third quarter as the Federal Reserve indicated that it was ready to tapering its $120 billion in monthly purchases of Treasury bonds and mortgage-backed securities.
Congress agreeing to avert a government default standoff for a couple of months and favorable third quarter earnings posted by the large banks helped to sustain the positive
| RP® Financial, LC. | VALUATION ANALYSIS | |
| IV.15 |
trend in financial stocks through the first half of October 2021. Financial shares edge up slightly during the second half of October, as investors reacted to weekly initial jobless claims hitting a new pandemic-era low and an increase in consumer confidence. News that Federal Reserve officials agreed to wind down their asset-purchase program by $15 billion each in November and December boosted financial shares at the start of November, which was followed by a slight pullback in the second week of November as inflation data added to investors’ concerns about price pressures in the economy. Financial shares retreated further heading into the second half of November and then rebounded after Federal Reserve Chairman Jerome Powell was renominated for a second term. News of a fresh coronavirus threat following identification of the Omicron variant, along with concerns about rising inflation, pressured financial shares lower through the end of November and the beginning of December. Indications that Omicron variant may cause milder illness than previously feared contributed to bank stocks edging higher in the second week of December. Bank shares edged lower in mid-December, as investors reacted to the Federal Reserve’s decision to accelerate ending its asset purchase program and to begin raising rates in 2022.
Bank shares traded up through the first several weeks of January supported by earnings releases that showed that strong earnings were continuing with many of the largest public banks meeting or exceeding analysts estimates. However, the prices of financial institutions continue to reflect inflationary concerns on the part of investors as well as concerns regarding the impact of the conflict in Ukraine might have on the energy prices and in damage to the broader economy. On February 18, 2022, the S&P U.S. BMI Banks Index closed at 188.9, an increase of 2% since the beginning of the year.
| B. The | New Issue Market |
In addition to thrift stock market conditions in general, the new issue market for converting thrifts is also an important consideration in determining the Bank’s pro forma market value. The new issue market is separate and distinct from the market for seasoned thrift stocks in that the pricing ratios for converting issues are computed on a pro forma basis, specifically: (1) the numerator and denominator are both impacted by the conversion offering amount, unlike existing stock issues in which price change affects only the numerator; and (2) the pro forma pricing ratio incorporates assumptions regarding source and use of proceeds, effective tax rates, stock plan purchases, etc. which impact pro forma financials, whereas pricing for existing issues are based on reported financials. The distinction between pricing of converting and
| RP® Financial, LC. | VALUATION ANALYSIS | |
| IV.16 |
existing issues is perhaps no clearer than in the case of the price/book (“P/B”) ratio in that the P/B ratio of a converting thrift will typically result in a discount to book value whereas in the current market for existing thrifts the P/B ratio often reflects a premium to book value. Therefore, it is appropriate to also consider the market for new issues, both at the time of the conversion and in the aftermarket. As shown in Table 4.2, there have been six standard conversions, six second step conversion and two mutual holding company offering completed over the last twelve months. The six recently completed standard conversion offerings which are most relevant to the Bank’s offering have all been completed since July 2021. On average, these offerings closed at 59.8% pro forma P/TB ratio and had the average gross proceeds was $87.9 million. The largest standard conversion in terms of the offering and asset size may be the most relevant for ECB’s pro forma pricing, was completed by Blue Foundry Bancorp of New Jersey on July 16, 2021. Blue Foundry Bancorp raised gross proceeds of $277.7 million, which was at the supermaximum of its offering range. Blue Foundry’s closing pro forma price/tangible book ratio equaled 66.2%. Blue Foundry’s stock price was up 27.0% after the first week of trading and as of February 18. 2022, Blue Foundry’s stock price was up 43.3% from its IPO price.
| C. The | Acquisition Market |
Also considered in the valuation was the potential impact on ECB’s holding company’s stock price of recently completed and pending acquisitions of other savings institutions operating in Massachusetts. As shown in Exhibit IV-4, there have been 24 bank and thrift acquisitions completed from the beginning of 2017 through year-to-date 2022, of which 12 involved savings institutions. To the extent that acquisition speculation may impact the Bank’s offering, we have largely taken this into account in selecting companies for the Peer Group which operate in markets that have experienced a comparable level of acquisition activity as the Bank’s market and, thus, are subject to the same type of acquisition speculation that may influence ECB’s stock. However, since converting thrifts are subject to a three-year regulatory moratorium from being acquired, acquisition speculation in ECB’s stock would tend to be less compared to the stocks of the Peer Group companies.\
* * * * * * * * * * *
In determining our valuation adjustment for marketing of the issue, we considered trends in both the overall thrift market, the new issue market including the new issue market for thrift
| RP® Financial, LC. | VALUATION ANALYSIS | |
| IV.17 |
conversions and the local acquisition market for thrift stocks. Overall, volatile market conditions which have led to an 8.8% selloff in the S&P 500 index and a 13.4% decline in the NASDAQ on a year-to-date coupled with the prospect of three projected rate increases by the Federal Reserve have led to unusual market volatility. Taking these factors and trends into account, RP Financial concluded that a slight downward adjustment was appropriate in the valuation analysis for purposes of marketing of the issue.
| 8. | Management |
The Bank’s management team appears to have experience and expertise in all of the key areas of the Bank’s operations. In the most recent year, the Bank has commenced making a significant investment in management through hiring senior level management to fill certain key positions and retraining certain other key officers to facilitate implementation of the Bank’s strategic plan. Exhibit IV-5 provides summary resumes of the Bank’s Board of Directors and senior management.
Similarly, the returns, equity positions and other operating measures of the Peer Group companies are indicative of well-managed financial institutions, which have Boards and management teams that have been effective in implementing competitive operating strategies. Therefore, on balance, we concluded no valuation adjustment relative to the Peer Group was appropriate for this factor.
| 9. | Effect of Government Regulation and Regulatory Reform |
In summary, as a fully-converted, FDIC insured institution, Everett Co-Operative Bank will operate in substantially the same regulatory environment as the Peer Group members — all of whom are adequately capitalized institutions and are operating with no apparent restrictions. Exhibit IV-6 reflects Everett Co-Operative Bank’s pro forma regulatory capital ratios. On balance, no adjustment has been applied for the effect of government regulation and regulatory reform.
| RP® Financial, LC. | VALUATION ANALYSIS | |
| IV.18 |
Table 4.2
Pricing Characteristics and After-Market Trends
Conversions Completed in Trailing 12 Months
Institutional Information | Pre-Conversion Data | Offering Information | Insider Purchases | Pro Forma Data | Post-IPO Pricing Trends | |||||||||||||||||||||||||||||||||||||||||||||||||||||||||||||||||||||||||||||||||||||||||||||||||||||||||||||||||||
| Financial Info. | Asset Quality | % Off Incl. Fdn.+Merger Shares | Pricing Ratios(2)(5) | Financial Charac. | Closing Price: | |||||||||||||||||||||||||||||||||||||||||||||||||||||||||||||||||||||||||||||||||||||||||||||||||||||||||||||||||||
| Excluding Foundation | Benefit Plans | Initial | First | After | After | |||||||||||||||||||||||||||||||||||||||||||||||||||||||||||||||||||||||||||||||||||||||||||||||||||||||||||||||||||
| Conversion | Equity/ | NPAs/ | Res. | Gross | % | % of | Exp./ | Recog. | Stk | Mgmt.& | Div. | Core | Core | Core | IPO | Trading | % | First | % | First | % | Thru | % | |||||||||||||||||||||||||||||||||||||||||||||||||||||||||||||||||||||||||||||||||||||||||||||||||
Institution | Date | Ticker | Assets | Assets | Assets | Cov. | Proc. | Offer | Mid. | Proc. | ESOP | Plans | Option | Dirs. | Yield | P/TB | P/E | P/A | ROA | TE/A | ROE | Price | Day | Chg | Week(3) | Chg | Month(4) | Chg | 2/18/22 | Chg | ||||||||||||||||||||||||||||||||||||||||||||||||||||||||||||||||||||||||||||||||||||||||||
| ($Mil) | (%) | (%) | (%) | ($Mil.) | (%) | (%) | (%) | (%) | (%) | (%) | (%)(1) | (%) | (%) | (x) | (%) | (%) | (%) | (%) | ($) | ($) | (%) | ($) | (%) | ($) | (%) | ($) | (%) | |||||||||||||||||||||||||||||||||||||||||||||||||||||||||||||||||||||||||||||||||||||||||||||
Standard Conversions | ||||||||||||||||||||||||||||||||||||||||||||||||||||||||||||||||||||||||||||||||||||||||||||||||||||||||||||||||||||||||
NSTS Bancorp, Inc., IL | 1/19/22 | NSTS-NASDAQ | $ | 260 | 17.68 | % | 0.70 | % | 529 | % | $ | 52.9 | 100 | % | 132 | % | 3.7 | % | 8.0 | % | 4.0 | % | 10.0 | % | 5.0 | % | 0.00 | % | 59.5 | % | NM | 17.7 | % | -0.2 | % | 29.8 | % | -0.6 | % | $ | 10.00 | $ | 12.59 | 25.9 | % | $ | 12.30 | 23.0 | % | $ | 12.50 | 25.0 | % | $ | 12.50 | 25.0 | % | |||||||||||||||||||||||||||||||||||||||||||||||||||||||||||||||
Catalyst Bancorp, Inc., LA* | 10/13/21 | CLST-NASDAQ | $ | 239 | 21.26 | % | 2.19 | % | 190 | % | $ | 52.9 | 100 | % | 132 | % | 3.0 | % | 8.0 | % | 4.0 | % | 10.0 | % | 2.9 | % | 0.00 | % | 55.3 | % | NM | 18.7 | % | -0.1 | % | 33.7 | % | -0.2 | % | $ | 10.00 | $ | 13.56 | 35.6 | % | $ | 13.85 | 38.5 | % | $ | 13.76 | 37.6 | % | $ | 13.84 | 38.4 | % | |||||||||||||||||||||||||||||||||||||||||||||||||||||||||||||||
TC Bancshares, Inc., GA | 7/21/21 | TCBC-NASDAQ | $ | 364 | 11.14 | % | 0.62 | % | 188 | % | $ | 49.0 | 100 | % | 104 | % | 2.7 | % | 8.0 | % | 4.0 | % | 10.0 | % | 2.2 | % | 0.00 | % | 59.5 | % | NM | 12.1 | % | 0.1 | % | 20.3 | % | 0.3 | % | $ | 10.00 | $ | 12.11 | 21.1 | % | $ | 12.07 | 20.7 | % | $ | 12.89 | 28.9 | % | $ | 13.75 | 37.5 | % | |||||||||||||||||||||||||||||||||||||||||||||||||||||||||||||||
Blue Foundry Bancorp, NJ* | 7/16/21 | BLFY-NASDAQ | $ | 1,948 | 9.76 | % | 0.66 | % | 130 | % | $ | 277.7 | 100 | % | 132 | % | 1.6 | % | 8.0 | % | 4.0 | % | 10.0 | % | 1.4 | % | 0.00 | % | 66.2 | % | NM | 13.0 | % | -0.6 | % | 19.7 | % | -3.2 | % | $ | 10.00 | $ | 12.90 | 29.0 | % | $ | 12.70 | 27.0 | % | $ | 13.39 | 33.9 | % | $ | 14.33 | 43.3 | % | |||||||||||||||||||||||||||||||||||||||||||||||||||||||||||||||
Texas Community Bncshres, Inc, TX | 7/16/21 | TCBS-NASDAQ | $ | 317 | 10.03 | % | 0.37 | % | 162 | % | $ | 32.1 | 100 | % | 89 | % | 4.3 | % | 8.0 | % | 4.0 | % | 10.0 | % | 11.0 | % | 0.00 | % | 56.2 | % | 99.0x | 9.5 | % | 0.1 | % | 16.9 | % | 0.6 | % | $ | 10.00 | $ | 15.08 | 50.8 | % | $ | 15.35 | 53.5 | % | $ | 15.29 | 52.9 | % | $ | 17.75 | 77.5 | % | |||||||||||||||||||||||||||||||||||||||||||||||||||||||||||||||
PB Bankshares, Inc., PA* | 7/15/21 | PBBK-NASDAQ | $ | 281 | 7.76 | % | 0.83 | % | 125 | % | $ | 27.8 | 100 | % | 132 | % | 4.9 | % | 8.0 | % | 4.0 | % | 10.0 | % | 4.2 | % | 0.00 | % | 61.9 | % | NM | 9.1 | % | 0.0 | % | 14.8 | % | -0.1 | % | $ | 10.00 | $ | 13.08 | 30.8 | % | $ | 13.24 | 32.4 | % | $ | 12.90 | 29.0 | % | $ | 14.00 | 40.0 | % | |||||||||||||||||||||||||||||||||||||||||||||||||||||||||||||||
|
|
|
|
|
|
|
|
|
|
|
|
|
|
|
|
|
|
|
|
|
|
|
|
|
|
|
|
|
|
|
|
|
|
|
|
|
|
|
|
|
|
|
|
|
|
|
|
|
|
|
|
|
|
|
| |||||||||||||||||||||||||||||||||||||||||||||||||||||||||||||||||
| | Averages - Standard Conversions: | | $ | 568 | 12.94 | % | 0.90 | % | 221 | % | $ | 82.1 | 100 | % | 120 | % | 3.4 | % | 8.0 | % | 4.0 | % | 10.0 | % | 4.4 | % | 0.00 | % | 59.8 | % | 99.0x | 13.4 | % | -0.1 | % | 22.5 | % | -0.5 | % | $ | 10.00 | $ | 13.22 | 32.2 | % | $ | 13.25 | 32.5 | % | $ | 13.45 | 34.5 | % | $ | 14.36 | 43.6 | % | |||||||||||||||||||||||||||||||||||||||||||||||||||||||||||||||
| | Medians - Standard Conversions: | | $ | 299 | 10.59 | % | 0.68 | % | 175 | % | $ | 50.9 | 100 | % | 132 | % | 3.3 | % | 8.0 | % | 4.0 | % | 10.0 | % | 3.5 | % | 0.00 | % | 59.5 | % | 99.0x | 12.6 | % | 0.0 | % | 20.0 | % | -0.2 | % | $ | 10.00 | $ | 12.99 | 29.9 | % | $ | 12.97 | 29.7 | % | $ | 13.14 | 31.4 | % | $ | 13.92 | 39.2 | % | |||||||||||||||||||||||||||||||||||||||||||||||||||||||||||||||
Second Step Conversions | ||||||||||||||||||||||||||||||||||||||||||||||||||||||||||||||||||||||||||||||||||||||||||||||||||||||||||||||||||||||||
Ponce Financial Group, Inc., NY* | 1/28/22 | PDLB-NASDAQ | $ | 1,561 | 11.14 | % | 1.05 | % | 157 | % | $ | 133.2 | 54 | % | 127 | % | 3.0 | % | 8.0 | % | 4.0 | % | 10.0 | % | 0.9 | % | 0.00 | % | 85.9 | % | 34.6x | 14.8 | % | 0.4 | % | 17.2 | % | 2.5 | % | $ | 10.00 | $ | 10.79 | 7.9 | % | $ | 10.65 | 6.5 | % | $ | 10.64 | 6.4 | % | $ | 10.64 | 6.4 | % | |||||||||||||||||||||||||||||||||||||||||||||||||||||||||||||||
Magyar Bancorp, Inc., NJ* | 7/15/21 | MGYR-NASDAQ | $ | 759 | 7.84 | % | 1.43 | % | 79 | % | $ | 39.1 | 55 | % | 115 | % | 3.9 | % | 8.0 | % | 4.0 | % | 10.0 | % | 2.3 | % | 0.00 | % | 76.9 | % | 19.0x | 9.0 | % | 0.5 | % | 11.7 | % | 4.0 | % | $ | 10.00 | $ | 10.94 | 9.4 | % | $ | 10.70 | 7.0 | % | $ | 10.23 | 2.3 | % | $ | 12.05 | 20.5 | % | |||||||||||||||||||||||||||||||||||||||||||||||||||||||||||||||
Cullman Bancorp, Inc., AL | 7/15/21 | CULL-NASDAQ | $ | 334 | 16.95 | % | 0.20 | % | 1012 | % | $ | 43.1 | 58 | % | 132 | % | 3.7 | % | 8.0 | % | 4.0 | % | 10.0 | % | 7.6 | % | 1.20 | % | 77.4 | % | 22.5x | 19.9 | % | 0.9 | % | 25.6 | % | 3.4 | % | $ | 10.00 | $ | 11.40 | 14.0 | % | $ | 11.85 | 18.5 | % | $ | 11.46 | 14.6 | % | $ | 11.96 | 19.6 | % | |||||||||||||||||||||||||||||||||||||||||||||||||||||||||||||||
1895 Bancorp of Wisconsin, Inc., WI | 7/15/21 | BCOW-NASDAQ | $ | 517 | 11.60 | % | 0.24 | % | 217 | % | $ | 35.4 | 55 | % | 115 | % | 5.0 | % | 8.0 | % | 4.0 | % | 10.0 | % | 0.8 | % | 0.00 | % | 71.6 | % | 56.4x | 11.7 | % | 0.2 | % | 16.4 | % | 1.3 | % | $ | 10.00 | $ | 11.15 | 11.5 | % | $ | 11.07 | 10.7 | % | $ | 10.74 | 7.3 | % | $ | 11.64 | 16.4 | % | |||||||||||||||||||||||||||||||||||||||||||||||||||||||||||||||
NorthEast Community Bncrp, Inc., NY* | 7/13/21 | NECB-NASDAQ | $ | 966 | 16.30 | % | 0.58 | % | 143 | % | $ | 97.9 | 60 | % | 96 | % | 2.5 | % | 8.0 | % | 4.0 | % | 10.0 | % | 0.6 | % | 2.40 | % | 68.2 | % | 14.9x | 15.6 | % | 1.1 | % | 22.9 | % | 4.6 | % | $ | 10.00 | $ | 10.61 | 6.1 | % | $ | 10.59 | 5.9 | % | $ | 10.06 | 0.6 | % | $ | 12.78 | 27.8 | % | |||||||||||||||||||||||||||||||||||||||||||||||||||||||||||||||
William Penn Bancorporation, PA* | 3/25/21 | WMPN-NASDAQ | $ | 737 | 13.70 | % | 0.67 | % | 75 | % | $ | 126.4 | 83 | % | 115 | % | 2.0 | % | 8.0 | % | 4.0 | % | 10.0 | % | 1.0 | % | 1.29 | % | 74.5 | % | 106.6x | 17.9 | % | 0.2 | % | 24.3 | % | 0.7 | % | $ | 10.00 | $ | 11.41 | 14.1 | % | $ | 11.36 | 13.6 | % | $ | 11.39 | 13.9 | % | $ | 12.51 | 25.1 | % | |||||||||||||||||||||||||||||||||||||||||||||||||||||||||||||||
|
|
|
|
|
|
|
|
|
|
|
|
|
|
|
|
|
|
|
|
|
|
|
|
|
|
|
|
|
|
|
|
|
|
|
|
|
|
|
|
|
|
|
|
|
|
|
|
|
|
|
|
|
|
|
| |||||||||||||||||||||||||||||||||||||||||||||||||||||||||||||||||
| | Averages - Second Step Conversions: | | $ | 812 | 12.92 | % | 0.70 | % | 281 | % | $ | 79.2 | 61 | % | 117 | % | 3.3 | % | 8.0 | % | 4.0 | % | 10.0 | % | 2.2 | % | 0.81 | % | 75.7 | % | 42.3x | 14.8 | % | 0.5 | % | 19.7 | % | 2.7 | % | $ | 10.00 | $ | 11.05 | 10.5 | % | $ | 11.04 | 10.4 | % | $ | 10.75 | 7.5 | % | $ | 11.93 | 19.3 | % | |||||||||||||||||||||||||||||||||||||||||||||||||||||||||||||||
| | Medians - Second Step Conversions: | | $ | 748 | 12.65 | % | 0.63 | % | 150 | % | $ | 70.5 | 57 | % | 115 | % | 3.4 | % | 8.0 | % | 4.0 | % | 10.0 | % | 1.0 | % | 0.60 | % | 75.7 | % | 28.6x | 15.2 | % | 0.5 | % | 20.1 | % | 3.0 | % | $ | 10.00 | $ | 11.04 | 10.4 | % | $ | 10.89 | 8.9 | % | $ | 10.69 | 6.9 | % | $ | 12.01 | 20.1 | % | |||||||||||||||||||||||||||||||||||||||||||||||||||||||||||||||
Mutual Holding Companies | ||||||||||||||||||||||||||||||||||||||||||||||||||||||||||||||||||||||||||||||||||||||||||||||||||||||||||||||||||||||||
CFSB Bancorp, Inc., MA* | 1/13/22 | CFSB-NASDAQ | $ | 337 | 14.56 | % | 0.00 | % | NM | $ | 28.0 | 43 | % | 130 | % | 5.4 | % | 8.7 | % | 4.4 | % | 10.9 | % | 5.2 | % | 0.00 | % | 63.2 | % | 75.4x | 16.7 | % | 0.3 | % | 20.0 | % | 1.6 | % | $ | 10.00 | $ | 10.18 | 1.80 | % | $ | 10.65 | 6.5 | % | $ | 10.63 | 6.3 | % | $ | 10.64 | 6.4 | % | ||||||||||||||||||||||||||||||||||||||||||||||||||||||||||||||||
Marathon Bancorp, Inc., WI* | 4/20/21 | MBBC-OTCPink | $ | 174 | 12.39 | % | 0.22 | % | 562 | % | $ | 10.0 | 45 | % | 124 | % | 12.2 | % | 8.7 | % | 4.4 | % | 10.9 | % | 7.0 | % | 0.00 | % | 55.8 | % | 35.4x | 11.6 | % | 0.4 | % | 16.0 | % | 2.6 | % | $ | 10.00 | $ | 10.10 | 1.00 | % | $ | 10.27 | 2.7 | % | $ | 10.27 | 2.7 | % | $ | 10.92 | 9.2 | % | |||||||||||||||||||||||||||||||||||||||||||||||||||||||||||||||
|
|
|
|
|
|
|
|
|
|
|
|
|
|
|
|
|
|
|
|
|
|
|
|
|
|
|
|
|
|
|
|
|
|
|
|
|
|
|
|
|
|
|
|
|
|
|
|
|
|
|
|
|
|
|
| |||||||||||||||||||||||||||||||||||||||||||||||||||||||||||||||||
| | Averages - MHC Conversions: | | $ | 174 | 12.39 | % | 0.22 | % | 562 | % | $ | 10.0 | 45 | % | 124 | % | 12.2 | % | 8.7 | % | 4.4 | % | 10.9 | % | 7.0 | % | 0.00 | % | 55.8 | % | 35.4x | 11.6 | % | 0.4 | % | 16.0 | % | 2.6 | % | $ | 10.00 | $ | 10.10 | 1.0 | % | $ | 10.27 | 2.7 | % | $ | 10.27 | 2.7 | % | $ | 10.92 | 9.2 | % | |||||||||||||||||||||||||||||||||||||||||||||||||||||||||||||||
| | Medians - MHC Conversions: | | $ | 174 | 12.39 | % | 0.22 | % | 562 | % | $ | 10.0 | 45 | % | 124 | % | 12.2 | % | 8.7 | % | 4.4 | % | 10.9 | % | 7.0 | % | 0.00 | % | 55.8 | % | 35.4x | 11.6 | % | 0.4 | % | 16.0 | % | 2.6 | % | $ | 10.00 | $ | 10.10 | 1.0 | % | $ | 10.27 | 2.7 | % | $ | 10.27 | 2.7 | % | $ | 10.92 | 9.2 | % | |||||||||||||||||||||||||||||||||||||||||||||||||||||||||||||||
| | Averages - All Conversions: | | $ | 650 | 12.89 | % | 0.75 | % | 275 | % | $ | 75.2 | 78 | % | 119 | % | 4.0 | % | 8.1 | % | 4.0 | % | 10.1 | % | 3.6 | % | 0.38 | % | 66.8 | % | 48.6x | 13.9 | % | 0.2 | % | 20.7 | % | 1.2 | % | $ | 10.00 | $ | 11.98 | 19.8 | % | $ | 12.00 | 20.0 | % | $ | 11.96 | 19.6 | % | $ | 12.97 | 29.7 | % | |||||||||||||||||||||||||||||||||||||||||||||||||||||||||||||||
| Medians - All Conversions: | $ | 364 | 11.60 | % | 0.66 | % | 162 | % | $ | 49.0 | 83 | % | 124 | % | 3.7 | % | 8.0 | % | 4.0 | % | 10.0 | % | 2.3 | % | 0.00 | % | 66.2 | % | 35.0x | 13.0 | % | 0.2 | % | 19.7 | % | 0.7 | % | $ | 10.00 | $ | 11.41 | 14.1 | % | $ | 11.85 | 18.5 | % | $ | 11.46 | 14.6 | % | $ | 12.51 | 25.1 | % | |||||||||||||||||||||||||||||||||||||||||||||||||||||||||||||||||
| Note: * - Appraisal performed by RP Financial; BOLD = RP Financial assisted in the business plan preparation, “NT” - Not Traded; “NA” - Not Applicable, Not Available; C/S-Cash/Stock. | ||||
(1) As a percent of MHC offering for MHC transactions. | (5) Mutual holding company pro forma data on full conversion basis. | |||
(2) Does not take into account the adoption of SOP 93-6. | (6) Simultaneously completed acquisition of another financial institution. | |||
(3) Latest price if offering is less than one week old. | (7) Simultaneously converted to a commercial bank charter. | |||
(4) Latest price if offering is more than one week but less than one month old. | (8) Former credit union. | February 18, 2022 | ||
| RP® Financial, LC. | VALUATION ANALYSIS | |
| IV.19 |
* * * * * * * * * * *
In determining our valuation adjustment for marketing of the issue, we considered trends in both the overall thrift market, the new issue market including the new issue market for thrift conversions and the local acquisition market for thrift stocks. Taking these factors and trends into account, RP Financial concluded that no adjustment was appropriate in the valuation analysis for purposes of marketing of the issue.
Summary of Adjustments
Overall, based on the factors discussed above, we concluded that the Bank’s pro forma market value should reflect the following valuation adjustments relative to the Peer Group:
Valuation Adjustments
Key Valuation Parameters: | Valuation Adjustment | |
| Financial Condition | Slight Upward | |
| Profitability, Growth and Viability of Earnings | Slight Downward | |
| Asset Growth | Slight Upward | |
| Primary Market Area | Slight Upward | |
| Dividends | No Adjustment | |
| Liquidity of the Shares | No Adjustment | |
| Marketing of the Issue | Slight Downward | |
| Management | No Adjustment | |
| Effect of Government Regulations and Regulatory Reform | No Adjustment |
Valuation Approaches
In applying the accepted valuation methodology promulgated by the FDIC and the Massachusetts Division of Banks. i.e., the pro forma market value approach, we considered the three key pricing ratios in valuing the Bank’s to-be-issued stock – price/earnings (“P/E”), price/book (“P/B”), and price/assets (“P/A”) approaches – all performed on a pro forma basis including the effects of the stock proceeds. In computing the pro forma impact of the conversion and the related pricing ratios, we have incorporated the valuation parameters as incorporated into the offering prospectus for reinvestment rate, effective tax rate, stock benefit plan assumptions and expenses and for the foundation contribution. The assumptions for the transaction have been summarized in Exhibits IV-7 and IV-8.
| RP® Financial, LC. | VALUATION ANALYSIS | |
| IV.20 |
In our estimate of value, we assessed the relationship of the pro forma pricing ratios relative to the Peer Group and recent conversion offerings.
RP Financial’s valuation placed an emphasis on the following:
| • | P/E Approach. The P/E approach is generally the best indicator of long-term value for a stock. However, given that the Bank’s pro forma earnings reflect a net loss on both a reported and core earnings basis, the P/E approach was less meaningful for the Bank’s valuation. |
| • | P/B Approach. P/B ratios have generally served as a useful benchmark in the valuation of thrift stocks, particularly in the context of an initial public offering, as the earnings approach involves assumptions regarding the use of proceeds. RP Financial considered the P/B approach to be a valuable indicator of pro forma value, taking into account the pricing ratios under the P/E and P/A approaches. We have also modified the P/B approach to exclude the impact of intangible assets (i.e., price/tangible book value or “P/TB”), in that the investment community frequently makes this adjustment in its evaluation of this pricing approach. |
| • | P/A Approach. P/A ratios are generally a less reliable indicator of market value, as investors typically assign less weight to assets and attribute greater weight to book value and earnings. Furthermore, this approach as set forth in the regulatory valuation guidelines does not take into account the amount of stock purchases funded by deposit withdrawals, thus understating the pro forma P/A ratio. At the same time, the P/A ratio is an indicator of franchise value, and, in the case of highly capitalized institutions, high P/A ratios may limit the investment community’s willingness to pay market multiples for earnings or book value when ROE is expected to be low. |
The Bank will adopt “Employers’ Accounting for Employee Stock Ownership Plans” (“ASC 718-40”), which will cause earnings per share computations to be based on shares issued and outstanding excluding unreleased ESOP shares. For purposes of preparing the pro forma pricing analyses, we have reflected all shares issued in the offering, including all ESOP shares, to capture the full dilutive impact, particularly since the ESOP shares are economically dilutive, receive dividends and can be voted. However, we did consider the impact of the adoption of ASC 718-40 in the valuation.
Based on the application of the three valuation approaches, taking into consideration the valuation adjustments discussed above and the dilutive impact of the stock contribution to the Foundation, RP Financial concluded that, as of February 18. 2022, the pro forma market value of Everett Co-Operative Bank’s conversion stock was $95,100,000 at the midpoint, equal to $9,510,000 shares at $10.00 per share.
| RP® Financial, LC. | VALUATION ANALYSIS | |
| IV.21 |
1. Price-to-Earnings (“P/E”). The application of the P/E valuation method requires calculating the Bank’s pro forma market value by applying a valuation P/E multiple to the pro forma earnings base. In applying this technique, we considered both reported earnings and a recurring earnings base, that is, earnings adjusted to exclude any one-time non-operating items, plus the estimated after-tax earnings benefit of the reinvestment of the net proceeds. The Bank’s reported earnings equaled $4,042,000 for the twelve months ended December 31, 2021. As noted in the financial analysis in Section One, the only material non-recurring expenses was related to the freezing the pension plan which resulted in a preliminary estimated termination expense of $2.0 million on a pre-tax basis or $1.48 million after tax assuming a 26% effective tax rate. However, the actual cost could be higher since the actual cost is primarily dependent on the value of the Pension Plan’s assets and interest rates at the time of termination.
Based on the Bank’s reported earnings and incorporating the impact of the pro forma assumptions discussed previously, the Bank’s pro forma core P/E multiples at the $95.1 million midpoint value equaled 20.36x, indicating premiums of 26.6% and 22.6% relative to the Peer Group’s average and median core earnings multiples of 16.08x and 16.61x, respectively (see Table 4.3). In comparison to the Peer Group’s average and median reported earnings multiples of 15.13x and 15.17x, respectively, the Bank’s pro forma reported and core P/E multiples at the midpoint value indicated premiums of 97.0% and 96.5%, respectively. The Bank’s pro forma P/E ratios based on core earnings at the minimum and the maximum equaled 16.96x and 28.28x, respectively.
2. Price-to-Book (“P/B”). The application of the P/B valuation method requires calculating the Bank’s pro forma market value by applying a valuation P/B ratio, as derived from the Peer Group’s P/B ratio, to the Bank’s pro forma book value. Based on the $95.1 million midpoint valuation, the Bank’s pro forma P/B and P/TB ratios both equaled 60.90%. In comparison to the average P/B and P/TB ratios for the Peer Group of 94.49% and 96.63%, the Bank’s ratios reflected a discount of 35.6% on a P/B basis and a discount of 37.0% on a P/TB basis. In comparison to the Peer Group’s median P/B and P/TB ratios of 89.96% and 94.54%, respectively, the Bank’s pro forma P/B and P/TB ratios at the midpoint value reflected discounts of 32.3% and 35.6%, respectively. At the top of the super maximum, the Bank’s P/B and P/TB ratios both equaled 68.59%. In comparison to the Peer Group’s average P/B and P/TB ratios, the Bank’s P/B and P/TB ratios at the top of the super maximum reflected discounts of 27.4% and 29.0%, respectively. In comparison to the Peer Group’s median P/B and P/TB
| RP® Financial, LC. | VALUATION ANALYSIS | |
| IV.22 |
Table 4.3
Public Market Pricing Versus Peer Group
As of February 18, 2022
| Market | ||||||||||||||||||||||||||||||||||||||||||||||||||||||||||||||||||||||||||||||||||
| Capitalization | Dividends(4) | Financial Characteristics(6) | ||||||||||||||||||||||||||||||||||||||||||||||||||||||||||||||||||||||||||||||||
| Price/ | Market | Pricing Ratios(3) | Amount/ | Payout | Total | Equity/ | Tang. Eq./ | NPAs/ | Reported (5) | Core (5) | ||||||||||||||||||||||||||||||||||||||||||||||||||||||||||||||||||||||||
| Share(1) | Value | P/E | P/B | P/A | P/TB | P/Core | Share | Yield | Ratio | Assets | Assets | T. Assets | Assets | ROAA | ROAE | ROAA | ROAE | |||||||||||||||||||||||||||||||||||||||||||||||||||||||||||||||||
| ($) | ($Mil) | (x) | (%) | (%) | (%) | (x) | ($) | (%) | (%) | ($Mil) | (%) | (%) | (%) | (%) | (%) | (%) | (%) | |||||||||||||||||||||||||||||||||||||||||||||||||||||||||||||||||
Everett Co-Operative Bank | ||||||||||||||||||||||||||||||||||||||||||||||||||||||||||||||||||||||||||||||||||
Supermaximum | $ | 10.00 | $ | 124.93 | 42.55x | 68.59 | % | 16.20 | % | 68.59 | % | 28.28x | $ | 0.00 | 0.00 | % | 0.00 | % | $ | 771 | 23.61 | % | 23.61 | % | 0.13 | % | 0.38 | % | 1.61 | % | 0.57 | % | 2.43 | % | ||||||||||||||||||||||||||||||||||||||||||||||||
Maximum | $ | 10.00 | $ | 108.98 | 35.47x | 64.77 | % | 14.39 | % | 64.77 | % | 23.94x | $ | 0.00 | 0.00 | % | 0.00 | % | $ | 757 | 22.21 | % | 22.21 | % | 0.13 | % | 0.41 | % | 1.83 | % | 0.60 | % | 2.71 | % | ||||||||||||||||||||||||||||||||||||||||||||||||
Midpoint | $ | 10.00 | $ | 95.10 | 29.81x | 60.90 | % | 12.76 | % | 60.90 | % | 20.36x | $ | 0.00 | 0.00 | % | 0.00 | % | $ | 745 | 20.95 | % | 20.95 | % | 0.13 | % | 0.43 | % | 2.04 | % | 0.63 | % | 2.99 | % | ||||||||||||||||||||||||||||||||||||||||||||||||
Minimum | $ | 10.00 | $ | 81.23 | 24.56x | 56.37 | % | 11.08 | % | 56.37 | % | 16.96x | $ | 0.00 | 0.00 | % | 0.00 | % | $ | 733 | 19.65 | % | 19.65 | % | 0.13 | % | 0.45 | % | 2.30 | % | 0.65 | % | 3.32 | % | ||||||||||||||||||||||||||||||||||||||||||||||||
Comparable Group | ||||||||||||||||||||||||||||||||||||||||||||||||||||||||||||||||||||||||||||||||||
Averages | $ | 15.54 | $ | 146.52 | 15.13 | 94.49 | % | 12.17 | % | 96.63 | % | 16.08 | $ | 0.28 | 1.77 | % | 46.26 | % | $ | 1,168 | 13.47 | % | 13.22 | % | 0.79 | % | 0.81 | % | 7.02 | % | 0.79 | % | 6.83 | % | ||||||||||||||||||||||||||||||||||||||||||||||||
Medians | $ | 15.03 | $ | 146.20 | 15.17 | 89.96 | % | 10.81 | % | 94.54 | % | 16.61 | $ | 0.24 | 1.88 | % | 27.53 | % | $ | 959 | 12.44 | % | 12.18 | % | 0.69 | % | 0.87 | % | 6.44 | % | 0.85 | % | 6.56 | % | ||||||||||||||||||||||||||||||||||||||||||||||||
| All Fully-Converted, Publicly-Traded Savings Institutions | ||||||||||||||||||||||||||||||||||||||||||||||||||||||||||||||||||||||||||||||||||
Averages | $ | 26.62 | $ | 558.75 | 14.46x | 109.03 | % | 14.63 | % | 119.49 | % | 14.49x | $ | 0.46 | 2.11 | % | 39.86 | % | $ | 3,902 | 13.95 | % | 12.87 | % | 0.63 | % | 0.93 | % | 7.33 | % | 0.98 | % | 7.59 | % | ||||||||||||||||||||||||||||||||||||||||||||||||
Medians | $ | 15.65 | $ | 178.76 | 13.10x | 100.86 | % | 13.28 | % | 107.72 | % | 13.46x | $ | 0.35 | 1.91 | % | 28.57 | % | $ | 1,561 | 12.32 | % | 11.24 | % | 0.59 | % | 0.93 | % | 7.23 | % | 0.96 | % | 7.23 | % | ||||||||||||||||||||||||||||||||||||||||||||||||
| State of Massachusettes Publicly Traded Thrifts (6) | ||||||||||||||||||||||||||||||||||||||||||||||||||||||||||||||||||||||||||||||||||
Averages | $ | 65.81 | $ | 365.02 | 12.57x | 124.10 | % | 14.13 | % | 127.16 | % | 13.19x | $ | 0.52 | 1.30 | % | 31.48 | % | $ | 2,428 | 11.75 | % | 11.47 | % | 1.25 | % | 1.25 | % | 10.65 | % | 1.30 | % | 10.57 | % | ||||||||||||||||||||||||||||||||||||||||||||||||
Medians | $ | 17.00 | $ | 297.14 | 11.94x | 113.73 | % | 13.28 | % | 113.75 | % | 12.59x | $ | 0.24 | 0.95 | % | 17.37 | % | $ | 2,538 | 11.84 | % | 11.84 | % | 1.29 | % | 1.29 | % | 9.31 | % | 1.32 | % | 9.51 | % | ||||||||||||||||||||||||||||||||||||||||||||||||
| Peer Group | ||||||||||||||||||||||||||||||||||||||||||||||||||||||||||||||||||||||||||||||||||
ESSA | ESSA Bancorp, Inc. | PA | $ | 18.05 | $ | 176.87 | 10.56x | 91.19 | % | 9.47 | % | 97.92 | % | 10.65x | $ | 0.48 | 2.66 | % | 28.07 | % | $ | 1,868 | 11.11 | % | 10.43 | % | 1.02 | % | 0.90 | % | 8.40 | % | 0.89 | % | 8.32 | % | ||||||||||||||||||||||||||||||||||||||||||||||
GBNY | Generations Bancorp NY, Inc. | (7 | ) | NY | $ | 11.98 | $ | 29.45 | 22.19x | 69.35 | % | 7.80 | % | 72.05 | % | 26.85x | NA | NA | NA | $ | 377 | 11.25 | % | 10.88 | % | 1.73 | % | 0.35 | % | 3.60 | % | 0.28 | % | 2.93 | % | |||||||||||||||||||||||||||||||||||||||||||||||
HVBC | HV Bancorp, Inc. | (7 | ) | PA | $ | 21.44 | $ | 43.65 | 7.55x | 109.83 | % | 8.14 | % | 109.83 | % | 7.65x | NA | NA | NA | $ | 536 | 7.92 | % | 7.92 | % | 0.67 | % | 0.93 | % | 14.73 | % | 0.92 | % | 14.53 | % | |||||||||||||||||||||||||||||||||||||||||||||||
MGYR | Magyar Bancorp, Inc. | NJ | $ | 12.05 | $ | 85.53 | 12.95x | 86.88 | % | 10.96 | % | 86.88 | % | 13.46x | $ | 0.12 | 1.00 | % | 16.12 | % | $ | 781 | 12.61 | % | 12.61 | % | 1.29 | % | 0.83 | % | 8.25 | % | 0.80 | % | 7.93 | % | ||||||||||||||||||||||||||||||||||||||||||||||
NECB | Northeast Community Bancorp, Inc. | NY | $ | 12.78 | $ | 197.92 | 17.04x | 83.26 | % | 16.16 | % | 83.48 | % | 16.61x | $ | 0.24 | 1.88 | % | 26.99 | % | $ | 1,225 | 20.52 | % | 20.48 | % | 0.16 | % | 1.13 | % | 6.03 | % | 1.16 | % | 6.18 | % | ||||||||||||||||||||||||||||||||||||||||||||||
PBIP | Prudential Bancorp, Inc. | PA | $ | 14.87 | $ | 115.53 | 15.17x | 86.48 | % | 10.66 | % | 90.78 | % | 17.91x | $ | 0.28 | 1.88 | % | 28.57 | % | $ | 1,084 | 12.32 | % | 11.81 | % | 1.21 | % | 0.69 | % | 5.93 | % | 0.58 | % | 5.02 | % | ||||||||||||||||||||||||||||||||||||||||||||||
PCSB | PCSB Financial Corporation | NY | $ | 18.82 | $ | 288.60 | 18.27x | 105.03 | % | 15.29 | % | 107.47 | % | 18.87x | $ | 0.24 | 1.28 | % | 23.30 | % | $ | 1,888 | 14.56 | % | 14.27 | % | 0.39 | % | 0.80 | % | 5.45 | % | 0.78 | % | 5.27 | % | ||||||||||||||||||||||||||||||||||||||||||||||
PVBC | Provident Bancorp, Inc. | MA | $ | 17.00 | $ | 297.14 | 18.28x | 129.83 | % | 17.18 | % | 129.83 | % | 18.08x | $ | 0.16 | 0.94 | % | 17.20 | % | $ | 1,729 | 13.52 | % | 13.52 | % | 1.46 | % | 1.02 | % | 6.86 | % | 1.03 | % | 6.93 | % | ||||||||||||||||||||||||||||||||||||||||||||||
RNDB | Randolph Bancorp, Inc. | MA | $ | 22.44 | $ | 106.64 | 11.94x | 113.73 | % | 13.28 | % | 113.75 | % | 11.68x | $ | 0.60 | 2.67 | % | 122.34 | % | $ | 803 | 12.56 | % | 12.56 | % | 0.48 | % | 1.29 | % | 9.31 | % | 1.32 | % | 9.51 | % | ||||||||||||||||||||||||||||||||||||||||||||||
WMPN | William Penn Bancorporation | PA | $ | 12.51 | $ | 178.76 | NM | 88.73 | % | 21.43 | % | 91.16 | % | NM | $ | 0.03 | 0.24 | % | 117.86 | % | $ | 834 | 25.65 | % | 25.14 | % | 0.70 | % | 0.50 | % | 2.18 | % | 0.51 | % | 2.22 | % | ||||||||||||||||||||||||||||||||||||||||||||||
WNEB | Western New England Bancorp, Inc. | MA | $ | 9.35 | $ | 211.84 | 9.17x | 94.70 | % | 8.35 | % | 101.53 | % | 9.30x | $ | 0.24 | 2.57 | % | 20.59 | % | $ | 2,538 | 8.81 | % | 8.27 | % | 0.35 | % | 0.96 | % | 10.64 | % | 0.94 | % | 10.49 | % | ||||||||||||||||||||||||||||||||||||||||||||||
WVFC | WVS Financial Corp. | PA | $ | 15.19 | $ | 26.31 | 23.37x | 74.88 | % | 7.40 | % | 74.88 | % | 25.87x | $ | 0.40 | 2.63 | % | 61.54 | % | $ | 356 | 10.75 | % | 10.75 | % | 0.00 | % | 0.33 | % | 2.92 | % | 0.30 | % | 2.64 | % | ||||||||||||||||||||||||||||||||||||||||||||||
| (1) | Closing price at date indicated, market value equal to public (minority shares) times current stock price. |
| (2) | Core earnings reflect net income less non-recurring items |
| (3) | P/E = Price to earnings; P/B = Price to book; P/A = Price to assets; P/TB = Price to tangible book value; and P/Core = Price to core earnings. P/E and P/Core =NM if the ratio is negative or above 35x. |
| (4) | Dividend is as of most recent quarterly dividend. Indicated 12 month dividend as a percent of trailing 12 month earnings. |
| (5) | ROAA (return on average assets) and ROAE (return on average equity) are indicated ratios based on trailing 12 month earnings and average equity and assets balances. |
| (6) | Excludes from averages and medians those companies the subject of actual or rumored acquisition activities or unusual operating characteristics. |
| (7) | Current Quarter is December 31, 2021, footnote reflects data as of September 30, 2021. |
Source: S&P Global Market Intelligence and RP Financial, LC. calculations. The information provided in this report has been obtained from sources we believe are reliable, but we cannot guarantee the accuracy or completeness of such information.
| RP® Financial, LC. | VALUATION ANALYSIS | |
| IV.23 |
ratios, the Bank’s P/B and P/TB ratios at the top of the super maximum reflected discounts of 23.8% and 27.4%, respectively. RP Financial considered the discounts under the P/B approach to be reasonable, given the nature of the calculation of the P/B ratio which mathematically results in a ratio discounted to book value. The discounts reflected under the P/B approach were also supported by the indicated premiums to Bank’s pro forma earnings multiples which were in a range of 23% to 97% based on the midpoint valuation and 70% to 181% at the superrange of value.
3. Price-to-Assets (“P/A”). The P/A valuation methodology determines market value by applying a valuation P/A ratio to the Bank’s pro forma asset base, conservatively assuming no deposit withdrawals are made to fund stock purchases. In all likelihood there will be deposit withdrawals, which results in understating the pro forma P/A ratio which is computed herein. At the $95.1 million midpoint of the valuation range, the Bank’s value equaled 12.76% of pro forma assets. Comparatively, the Peer Group companies exhibited an average P/A ratio of 12.17%, which implies a premium of 4.79% has been applied to the Bank’s pro forma P/A ratio. In comparison to the Peer Group’s median P/A ratio of 10.81%, the Bank’s pro forma P/A ratio at the midpoint value reflects a premium of 18.06%.
Comparison to Recent Offerings
As indicated at the beginning of this chapter, RP Financial’s analysis of recent conversion offering pricing characteristics at closing and in the aftermarket has been limited to a “technical” analysis and, thus, the pricing characteristics of recent conversion offerings cannot be a primary determinate of value. Particular focus was placed on the P/TB approach in this analysis, since the P/E multiples do not reflect the actual impact of reinvestment and the source of the stock proceeds (i.e., external funds vs. deposit withdrawals). In comparison to the 66.2% closing forma P/TB ratio of Blue Foundry Bancorp’s standard conversion offering, the Bank’s P/TB ratio of 61.77% at the midpoint value reflects an implied discount of 7.93%. At the top of the super maximum, the Bank’s P/TB ratio of 68.59% reflects an implied premium of 3.77% relative to Blue Foundry Bancorp’s P/TB ratio at closing.
Valuation Conclusion
Based on the foregoing, it is our opinion that, as of February 18. 2022, the estimated aggregate pro forma market value of the shares to be issued immediately following the
| RP® Financial, LC. | VALUATION ANALYSIS | |
| IV.24 |
conversion, including shares to be issued to the Foundation, equaled $95,100,000 at the midpoint, equal to $9,510,000 shares offered at a per share value of $10.00. Pursuant to conversion guidelines, the 15% valuation range applied to the midpoint of the offering including the 260,000 shares issued to the Foundation indicates a minimum market value of $81,225,000 and a maximum market value of $108,975,000. Based on the $10.00 per share offering price determined by the Board, this valuation range equates to total shares outstanding of 8,122,500 at the minimum and 10,897,500 at the maximum. In the event the appraised value is subject to an increase, the aggregate pro forma market value may be increased up to a super maximum value of $124,931,250 without a resolicitation. Based on the $10.00 per share offering price, the super maximum value would result in total shares outstanding of 12,493,125. Based on this valuation range, the offering range is as follows: $78,625,000 at the minimum, $92,500,000 at the midpoint, $106,375,000 at the maximum and $122,331,250 at the super maximum. Based on the $10.00 per share offering price, the number of offering shares is as follows: 7,862,500 at the minimum, 9,250,000 at the midpoint, 10,637,500 at the maximum and 12,233,125 at the super maximum. The pro forma valuation calculations relative to the Peer Group are shown in Table 4.3 and are detailed in Exhibit IV-7 and Exhibit IV-8.
EXHIBITS
RP® Financial, LC.
LIST OF EXHIBITS
Exhibit Number | Description | |
| I-1 | Map of Branch Office Network | |
| I-2 | Audited Financial Statements | |
| I-3 | Key Operating Ratios | |
| I-4 | Investment Securities | |
| I-5 | Yields and Costs | |
| I-6 | Loan Loss Allowance Activity | |
| I-7 | Interest Rate Risk Analysis | |
| I-8 | Fixed Rate and Adjustable Rate Loans | |
| I-9 | Loan Portfolio Composition | |
| I-10 | Contractual Maturity By Loan Type | |
| I-11 | Non-Performing Assets | |
| I-12 | Deposit Composition | |
| I-13 | CDs >$250,000 in balance by Maturity | |
| I-14 | Borrowings Details | |
| II-1 | Historical Interest Rates | |
| II-2 | Market Area Demographic/Economic Information | |
| III-1 | General Characteristics of Publicly-Traded Savings Institutions | |
| III-2 | Publicly Traded MidAtlantic and New England Thrifts | |
| III-3 | Publicly Traded Midwest Thrifts | |
| III-4 | Peer Group Summary Demographic and Deposit Market Share Data | |
LIST OF EXHIBITS (continued)
Exhibit Number | Description | |
| IV-1 | Thrift Stock Prices: As of February 18, 2022 | |
| IV-2 | Historical Stock Price Indices | |
| IV-3 | Historical Thrift Stock Indices | |
| IV-4 | Market Area Acquisition Activity | |
| IV-5 | Director and Senior Management Summary Resumes | |
| IV-6 | Pro Forma Regulatory Capital Ratios | |
| IV-7 | Pro Forma Analysis Sheet | |
| IV-8 | Pro Forma Effect of Conversion Proceeds | |
| V-1 | Firm Qualifications Statement | |
EXHIBIT I-1
Everett Co-Operative Bank
Map of Branch Office Network
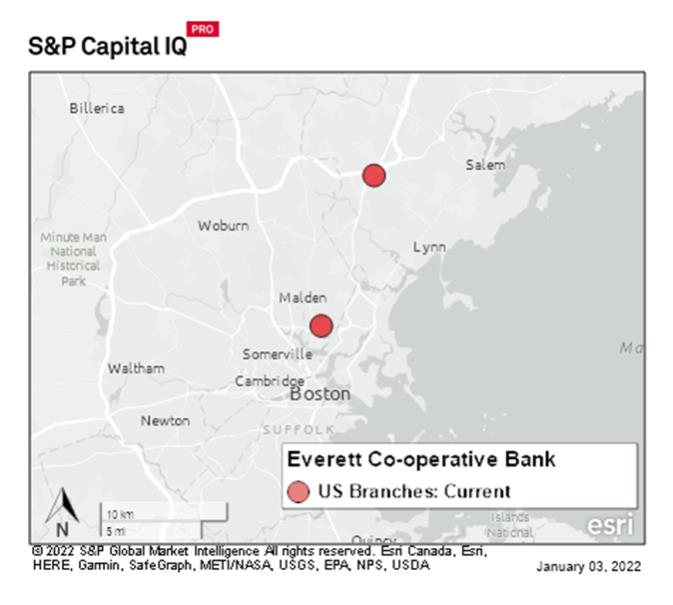
EXHIBIT I-2
Everett Co-Operative Bank
Audited Financial Statements
(Incorporated by Reference)
EXHIBIT I-3
Everett Co-Operative Bank
Key Operating Ratios
| At or For the Years Ended December 31, | ||||||||||||
| 2021 | 2020 | 2019 | ||||||||||
Performance Ratios: | ||||||||||||
Return on average assets | 0.64 | % | 0.89 | % | 0.85 | % | ||||||
Return on average equity | 5.34 | % | 6.88 | % | 6.57 | % | ||||||
Interest rate spread (1) | 2.91 | % | 2.68 | % | 2.65 | % | ||||||
Net interest margin (2) | 3.08 | % | 3.00 | % | 2.97 | % | ||||||
Noninterest expense to average assets | 2.24 | % | 1.89 | % | 1.93 | % | ||||||
Efficiency ratio (3) | 70.72 | % | 60.16 | % | 61.86 | % | ||||||
Average interest-earning assets to average interest-bearing liabilities | 128.39 | % | 125.90 | % | 122.03 | % | ||||||
Capital Ratios: | ||||||||||||
Average equity to average assets | 12.02 | % | 12.97 | % | 12.98 | % | ||||||
Total capital to risk-weighted assets | 17.77 | % | 18.13 | % | 19.24 | % | ||||||
Tier 1 capital to risk-weighted assets | 16.80 | % | 17.18 | % | 18.24 | % | ||||||
Common equity tier 1 capital to risk-weighted assets | 16.80 | % | 17.18 | % | 18.24 | % | ||||||
Tier 1 capital to average assets | 11.83 | % | 12.78 | % | 13.29 | % | ||||||
Asset Quality Ratios: | ||||||||||||
Allowance for loan losses as a percentage of total loans | 0.81 | % | 0.82 | % | 0.83 | % | ||||||
Allowance for loan losses as a percentage of non-performing loans | 431.46 | % | 231.98 | % | 346.64 | % | ||||||
Allowance for loan losses as a percentage of non-accrual loans | 431.46 | % | 231.98 | % | 346.64 | % | ||||||
Non-accrual loans as a percentage of total loans | 0.19 | % | 0.35 | % | 0.24 | % | ||||||
Net (charge-offs) recoveries to average outstanding loans during the year | 0.00 | % | 0.00 | % | (0.02 | )% | ||||||
Non-performing loans as a percentage of total loans | 0.19 | % | 0.35 | % | 0.24 | % | ||||||
Non-performing loans as a percentage of total assets | 0.15 | % | 0.28 | % | 0.20 | % | ||||||
Total non-performing assets as a percentage of total assets | 0.15 | % | 0.28 | % | 0.20 | % | ||||||
Other Data: | ||||||||||||
Number of offices | 2 | 2 | 2 | |||||||||
Number of full-time employees | 51 | 47 | 43 | |||||||||
Number of part-time employees | 6 | 7 | 8 | |||||||||
Source: Prospectus.
EXHIBIT I-4
Everett Co-Operative Bank
Investment Securities
| One Year or Less | More than One Year to Five Years | More than Five Years to Ten Years | More than Ten Years | Total | ||||||||||||||||||||||||||||||||||||||||
| Amortized Cost | Weighted Average Yield | Amortized Cost | Weighted Average Yield | Amortized Cost | Weighted Average Yield | Amortized Cost | Weighted Average Yield | Amortized Cost | Fair Value | Weighted Average Yield | ||||||||||||||||||||||||||||||||||
| (Dollars in thousands) | ||||||||||||||||||||||||||||||||||||||||||||
Securities held-to-maturity: | ||||||||||||||||||||||||||||||||||||||||||||
Debt securities issued by U.S. government-sponsored enterprises | $ | — | — | % | $ | 10,107 | 1.31 | % | $ | — | — | % | $ | — | — | % | $ | 10,107 | $ | 10,040 | 1.31 | % | ||||||||||||||||||||||
Mortgage-backed securities | 248 | 1.59 | % | $ | 3,912 | 2.21 | % | $ | 40,657 | 1.90 | % | $ | 44,818 | $ | 44,637 | 1.93 | % | |||||||||||||||||||||||||||
Corporate bonds | — | — | % | 1,550 | 2.01 | % | $ | 9,097 | 2.27 | % | $ | — | — | % | $ | 10,646 | $ | 10,880 | 2.23 | % | ||||||||||||||||||||||||
Total | $ | — | — | % | $ | 11,905 | 1.41 | % | $ | 13,009 | 2.25 | % | $ | 40,657 | 1.90 | % | $ | 65,571 | $ | 65,556 | 1.88 | % | ||||||||||||||||||||||
Source: Prospectus.
EXHIBIT I-5
Everett Co-Operative Bank
Yields and Costs
| For the Years Ended December 31, | ||||||||||||||||||||||||
| 2021 | 2020 | |||||||||||||||||||||||
| Average Outstanding Balance | Interest | Average Yield/Rate | Average Outstanding Balance | Interest | Average Yield/Rate | |||||||||||||||||||
| (Dollars in thousands) | ||||||||||||||||||||||||
Interest-earning assets: | ||||||||||||||||||||||||
Loans | $ | 496,915 | $ | 21,319 | 4.29 | % | $ | 440,261 | $ | 19,974 | 4.54 | % | ||||||||||||
Securities | 66,420 | 990 | 1.49 | % | 52,384 | 1,088 | 2.08 | % | ||||||||||||||||
Short term investments and federal funds sold | 43,375 | 44 | 0.10 | % | 32,588 | 112 | 0.34 | % | ||||||||||||||||
|
|
|
|
|
|
|
| |||||||||||||||||
Total interest-earning assets | 606,710 | 22,353 | 3.68 | % | 525,233 | 21,174 | 4.03 | % | ||||||||||||||||
Noninterest-earning assets | 23,140 | 19,656 | ||||||||||||||||||||||
|
|
|
| |||||||||||||||||||||
Total assets | $ | 629,850 | $ | 544,889 | ||||||||||||||||||||
|
|
|
| |||||||||||||||||||||
Interest-bearing liabilities: | ||||||||||||||||||||||||
Interest-bearing demand deposits | $ | 25,837 | 59 | 0.23 | % | $ | 21,068 | 54 | 0.26 | % | ||||||||||||||
Regular savings and other deposits | 47,042 | 30 | 0.06 | % | 38,117 | 39 | 0.10 | % | ||||||||||||||||
Money market deposits | 163,933 | 555 | 0.34 | % | 136,284 | 1,108 | 0.81 | % | ||||||||||||||||
Certificates of deposit | 223,366 | 2,902 | 1.30 | % | 200,281 | 4,060 | 2.03 | % | ||||||||||||||||
|
|
|
|
|
|
|
| |||||||||||||||||
Total interest-bearing deposits | 460,178 | 3,546 | 0.77 | % | 395,750 | 5,261 | 1.33 | % | ||||||||||||||||
Advances from the Federal Home Loan Bank | 12,359 | 135 | 1.09 | % | 21,421 | 376 | 1.76 | % | ||||||||||||||||
|
|
|
|
|
|
|
| |||||||||||||||||
Total interest-bearing liabilities | 472,537 | 3,681 | 0.78 | % | 417,171 | 5,637 | 1.35 | % | ||||||||||||||||
Noninterest-bearing demand deposits | 76,267 | 52,659 | ||||||||||||||||||||||
|
| |||||||||||||||||||||||
Other noninterest-bearing liabilities | 5,332 | 4,410 | ||||||||||||||||||||||
|
|
|
| |||||||||||||||||||||
Total liabilities | 554,136 | 474,240 | ||||||||||||||||||||||
Total equity | 75,714 | 70,649 | ||||||||||||||||||||||
|
|
|
| |||||||||||||||||||||
Total liabilities and equity | 629,850 | 544,889 | ||||||||||||||||||||||
|
|
|
| |||||||||||||||||||||
Net interest income | $ | 18,672 | $ | 15,537 | ||||||||||||||||||||
|
|
|
| |||||||||||||||||||||
Net interest rate spread (1) | 2.91 | % | 2.68 | % | ||||||||||||||||||||
Net interest-earning assets (2) | $ | 134,173 | $ | 108,062 | ||||||||||||||||||||
|
|
|
| |||||||||||||||||||||
Net interest margin (3) | 3.08 | % | 2.96 | % | ||||||||||||||||||||
Average interest-earning assets to interest-bearing liabilities | 128.39 | % | 125.90 | % | ||||||||||||||||||||
EXHIBIT I-6
Everett Co-Operative Bank
Loan Loss Allowance Activity
| At or For the Years Ended December 31, | ||||||||
| 2021 | 2020 | |||||||
| (Dollars in thousands) | ||||||||
Allowance for loan losses at beginning of year | $ | 3,876 | $ | 3,583 | ||||
Provision for loan losses | 360 | 293 | ||||||
Charge-offs: | ||||||||
Real estate loans: | ||||||||
One- to four-family residential | — | — | ||||||
Multi-family | — | — | ||||||
Commercial | — | (1 | ) | |||||
Home equity lines of credit | — | — | ||||||
Construction | — | — | ||||||
Commercial loans | — | — | ||||||
Consumer loans | (1 | ) | — | |||||
Consumer Other – Overdrafts | — | — | ||||||
PPP loans | — | — | ||||||
|
|
|
| |||||
Total charge-offs | (1 | ) | (1 | ) | ||||
|
|
|
| |||||
Recoveries: | ||||||||
Real estate loans: | ||||||||
One- to four-family residential | — | — | ||||||
Multi-family | — | — | ||||||
Commercial | — | 1 | ||||||
Home equity lines of credit | — | — | ||||||
Construction | — | — | ||||||
Commercial loans | — | — | ||||||
Consumer loans | 1 | — | ||||||
PPP loans | — | — | ||||||
|
|
|
| |||||
Total recoveries | 1 | 1 | ||||||
|
|
|
| |||||
Net (charge-offs) recoveries | — | — | ||||||
|
|
|
| |||||
Allowance for loan losses at end of year | $ | 4,236 | $ | 3,876 | ||||
|
|
|
| |||||
Allowance for loan losses to non-performing loans | 431.5 | % | 232.0 | % | ||||
Allowance for loan losses to total loans outstanding at the end of the year | 0.81 | % | 0.82 | % | ||||
Net (charge-offs) recoveries to average loans outstanding during the year | 0.00 | % | 0.00 | % | ||||
Source: Prospectus.
EXHIBIT I-7
Everett Co-Operative Bank
Interest Rate Risk Analysis
At December 31, 2021 | ||||||||
Change in Interest Rates (basis points) (1) | Net Interest Income Year 1 Forecast | Year 1 Change from Level | ||||||
| (Dollars in thousands) | ||||||||
400 | $ | 19,637 | 2.5 | % | ||||
300 | 19,548 | 2.0 | % | |||||
200 | 19,426 | 1.4 | % | |||||
100 | 19,283 | 0.6 | % | |||||
Level | 19,159 | 0.0 | % | |||||
(100) | 18,043 | (5.8 | )% | |||||
| (1) | Assumes an immediate uniform change in interest rates at all maturities. |
At December 31, 2021 | ||||||||||||||||||||
Change in Interest Rates (basis points) (1) | Estimated EVE (2) | EVE as a Percentage of Present Value of Assets (3) | ||||||||||||||||||
| Estimated Increase (Decrease) in EVE | EVE Ratio (4) | Increase (Decrease) (basis points) | ||||||||||||||||||
| Amount | Percent | |||||||||||||||||||
| (Dollars in thousands) | ||||||||||||||||||||
400 | $ | 77,482 | $ | (4,841 | ) | (5.9 | )% | 12.5 | % | 24 | ||||||||||
300 | 79,111 | (3,212 | ) | (3.9 | )% | 12.6 | % | 25 | ||||||||||||
200 | 80,603 | (1,720 | ) | (2.1 | )% | 12.5 | % | 24 | ||||||||||||
100 | 82,424 | 101 | 0.1 | % | 12.6 | % | 26 | |||||||||||||
Level | 82,323 | — | 0.0 | % | 12.3 | % | — | |||||||||||||
(100) | 72,539 | (9,784 | ) | (11.9 | )% | 10.7 | % | (157 | ) | |||||||||||
| (1) | Assumes an immediate uniform change in interest rates at all maturities. |
| (2) | EVE is the discounted present value of expected cash flows from assets, liabilities and off-balance sheet contracts. |
| (3) | Present value of assets represents the discounted present value of incoming cash flows on interest-earning assets. |
| (4) | EVE Ratio represents EVE divided by the present value of assets. |
Source: Prospectus.
EXHIBIT I-8
Everett Co-Operative Bank
Fixed Rate and Adjustable Rate Loans
| Due After December 31, 2022 | ||||||||||||
| Fixed | Adjustable | Total | ||||||||||
| (In thousands) | ||||||||||||
Real estate loans: | ||||||||||||
One- to four-family residential | $ | 101,243 | $ | 156,230 | $ | 257,473 | ||||||
Multi-family | 2,632 | 50,711 | 53,343 | |||||||||
Commercial | 2,279 | 92,166 | 94,445 | |||||||||
Home equity lines of credit | 305 | 21,600 | 21,905 | |||||||||
Construction | 3,907 | 6,428 | 10,335 | |||||||||
Commercial loans | 3,965 | 74 | 4,039 | |||||||||
Consumer loans | 164 | 281 | 445 | |||||||||
|
|
|
|
|
| |||||||
Total loans | $ | 114,495 | $ | 327,490 | $ | 441,985 | ||||||
|
|
|
|
|
| |||||||
Source: Prospectus.
EXHIBIT I-9
Everett Co-Operative Bank
Loan Portfolio Composition
| At December 31, | ||||||||||||||||
| 2021 | 2020 | |||||||||||||||
| Amount | Percent | Amount | Percent | |||||||||||||
| (Dollars in thousands) | ||||||||||||||||
Real estate loans: | ||||||||||||||||
One- to four-family residential | $ | 259,673 | 49.8 | % | $ | 231,756 | 49.2 | % | ||||||||
Multi-family | 59,517 | 11.4 | % | 37,955 | 8.1 | % | ||||||||||
Commercial | 99,953 | 19.2 | % | 95,544 | 20.3 | % | ||||||||||
Home equity lines of credit | 26,050 | 5.0 | % | 29,360 | 6.2 | % | ||||||||||
Construction | 70,668 | 13.5 | % | 66,202 | 14.0 | % | ||||||||||
Commercial loans | 5,439 | 1.0 | % | 10,053 | 2.1 | % | ||||||||||
Consumer | 500 | 0.1 | % | 423 | 0.1 | % | ||||||||||
|
|
|
|
|
|
|
| |||||||||
| 521,800 | 100.0 | % | 471,293 | 100.0 | % | |||||||||||
|
|
|
|
|
|
|
| |||||||||
Less: | ||||||||||||||||
Net deferred loan fees | (433 | ) | (258 | ) | ||||||||||||
Allowance for losses | (4,236 | ) | (3,876 | ) | ||||||||||||
|
|
|
| |||||||||||||
Total loans, net | $ | 517,131 | $ | 467,159 | ||||||||||||
|
|
|
| |||||||||||||
Source: Prospectus.
EXHIBIT I-10
Everett Co-Operative Bank
Contractual Maturity By Loan Type
| One- to Four-Family Residential Real Estate | Multi- Family Real Estate | Commercial Real Estate | Home Equity Lines of Credit | Construction | ||||||||||||||||
| (In thousands) | ||||||||||||||||||||
Amounts due in: | ||||||||||||||||||||
One year or less | $ | 2,200 | $ | 6,174 | $ | 5,508 | $ | 4,145 | $ | 60,333 | ||||||||||
After one year through five years | 875 | — | 7,149 | 129 | 10,335 | |||||||||||||||
After five years through 15 years | 28,651 | 4,918 | 8,594 | 968 | — | |||||||||||||||
After 15 years | 227,947 | 48,425 | 78,702 | 20,808 | — | |||||||||||||||
|
|
|
|
|
|
|
|
|
| |||||||||||
Total | $ | 259,673 | $ | 59,517 | $ | 99,953 | $ | 26,050 | $ | 70,668 | ||||||||||
|
|
|
|
|
|
|
|
|
| |||||||||||
| Commercial | Consumer | Total | ||||||||||
Amounts due in: | ||||||||||||
One year or less | $ | 1,400 | $ | 55 | $ | 79,815 | ||||||
After one year through five years | 3,774 | 325 | 22,587 | |||||||||
After five years through 15 years | 265 | 120 | 43,396 | |||||||||
After 15 years | — | — | 376,002 | |||||||||
|
|
|
|
|
| |||||||
Total | $ | 5,439 | $ | 500 | $ | 521,800 | ||||||
|
|
|
|
|
| |||||||
Source: Prospectus.
EXHIBIT I-11
Everett Co-Operative Bank
Non-Performing Assets
| At December 31, | ||||||||||||||||||||||||
| 2021 | 2020 | |||||||||||||||||||||||
| 30-59 Days Past Due | 60-89 Days Past Due | 90 Days or More Past Due | 30-59 Days Past Due | 60-89 Days Past Due | 90 Days or More Past Due | |||||||||||||||||||
| (In thousands) | ||||||||||||||||||||||||
Real estate loans: | ||||||||||||||||||||||||
One- to four-family residential | $ | — | $ | 88 | $ | 817 | $ | — | $ | 430 | $ | 243 | ||||||||||||
Multi-family | — | — | — | — | — | — | ||||||||||||||||||
Commercial | — | — | — | — | 224 | — | ||||||||||||||||||
Home equity lines of credit | 99 | — | — | — | — | — | ||||||||||||||||||
Construction | — | — | — | — | — | — | ||||||||||||||||||
Commercial loans | — | — | — | 778 | — | — | ||||||||||||||||||
Consumer loans | 1 | — | — | 1 | — | — | ||||||||||||||||||
PPP loans | — | — | — | — | — | — | ||||||||||||||||||
|
|
|
|
|
|
|
|
|
|
|
| |||||||||||||
Total | $ | 100 | $ | 88 | $ | 817 | $ | 779 | $ | 654 | $ | 243 | ||||||||||||
|
|
|
|
|
|
|
|
|
|
|
| |||||||||||||
| At December 31, | ||||||||
| 2021 | 2020 | |||||||
| (Dollars in thousands) | ||||||||
Non-accrual loans: | ||||||||
Real estate loans: | ||||||||
One- to four-family residential | $ | 883 | $ | 599 | ||||
Multi-family | — | — | ||||||
Commercial | — | 969 | ||||||
Home equity lines of credit | 99 | 99 | ||||||
Construction | — | — | ||||||
Commercial loans | — | 4 | ||||||
Consumer loans | — | — | ||||||
|
|
|
| |||||
Total non-accrual loans | $ | 982 | $ | 1,671 | ||||
|
|
|
| |||||
Accruing loans past due 90 days or more | ||||||||
Real estate owned: | ||||||||
One- to four-family residential | — | — | ||||||
Multi-family | — | — | ||||||
Commercial | — | — | ||||||
Construction | — | — | ||||||
Bank Owned Property held for sale | — | — | ||||||
|
|
|
| |||||
Total real estate owned | — | — | ||||||
|
|
|
| |||||
Total non-performing assets | $ | 982 | $ | 1,671 | ||||
|
|
|
| |||||
Total accruing troubled debt restructured loans | — | — | ||||||
Total non-performing loans to total loans | 0.19 | % | 0.35 | % | ||||
Total non-accruing loans to total assets | % | % | ||||||
Total non-performing assets to total assets | 0.15 | % | 0.28 | % | ||||
Source: Prospectus.
EXHIBIT I-12
Everett Co-Operative Bank
Deposit Composition
| At December 31, | ||||||||||||||||||||||||
| 2021 | 2020 | |||||||||||||||||||||||
| Amount | Percent | Average Rate | Amount | Percent | Average Rate | |||||||||||||||||||
| (Dollars in thousands) | ||||||||||||||||||||||||
Noninterest-bearing demand deposits | $ | 83,288 | 14.6 | % | 0.00 | % | $ | 59,425 | 12.1 | % | 0.00 | % | ||||||||||||
Interest-bearing demand deposits | 28,333 | 5.0 | % | 0.18 | % | 22,229 | 4.5 | % | 0.23 | % | ||||||||||||||
Regular savings deposits and other deposits | 50,044 | 8.8 | % | 0.05 | % | 42,703 | 8.7 | % | 0.10 | % | ||||||||||||||
Money market deposits | 183,246 | 32.1 | % | 0.28 | % | 149,860 | 30.5 | % | 0.57 | % | ||||||||||||||
Certificates of deposit | 226,820 | 39.7 | % | 0.98 | % | 217,181 | 44.2 | % | 1.55 | % | ||||||||||||||
|
|
|
|
|
|
|
|
|
|
|
| |||||||||||||
Total | $ | 571,731 | 100.0 | % | $ | 491,398 | 100.0 | % | ||||||||||||||||
|
|
|
|
|
|
|
| |||||||||||||||||
Source: Prospectus.
EXHIBIT I-13
Everett Co-Operative Bank
CDs >$250,000 in Balance by Maturity
As of December 31, 2020
As of December 31, 2021 and 2020, the aggregate amount of deposits in amounts greater than $250,000, which is the maximum amount for federal deposit insurance, was $191.5 million and $128.8 million, respectively. As of December 31, 2021, the aggregate amount of all our certificates of deposit in excess of $250,000 was $44.5 million.
All of our deposits are fully insured due to the additional insurance provided to a Massachusetts cooperative bank, such as Everett Co-operative Bank, under the Massachusetts Depositors Insurance Fund.
EXHIBIT I-14
Everett Co-Operative Bank
Borrowings Detail
Borrowing Capacity. As a member of the Federal Home Loan Bank of Boston, Everett Co-operative Bank is eligible to obtain advances upon the security of the Federal Home Loan Bank common stock owned and certain residential mortgage loans, provided certain standards related to credit-worthiness have been met. Federal Home Loan Bank advances are available pursuant to several credit programs, each of which has its own interest rate and range of maturities. At December 31, 2021, we had the ability to borrow an additional $112.5 million from the Federal Home Loan Bank of Boston, subject to certain collateral requirements and had advances of $9.0 million at such date.
Source: Prospectus.
EXHIBIT II-1
Everett Co-Operative Bank
Historical Interest Rates
Exhibit II-1
Historical Interest Rates(1)
| Prime | 90 Day | One Year | 10 Year | |||||||||||||||
Year/Qtr. Ended | Rate | T-Note | T-Note | T-Note | ||||||||||||||
2008: | Quarter 1 | 5.25 | % | 1.38 | % | 1.55 | % | 3.45 | % | |||||||||
Quarter 2 | 5.00 | % | 1.90 | % | 2.36 | % | 3.99 | % | ||||||||||
Quarter 3 | 5.00 | % | 0.92 | % | 1.78 | % | 3.85 | % | ||||||||||
Quarter 4 | 3.25 | % | 0.11 | % | 0.37 | % | 2.25 | % | ||||||||||
2009: | Quarter 1 | 3.25 | % | 0.21 | % | 0.57 | % | 2.71 | % | |||||||||
Quarter 2 | 3.25 | % | 0.19 | % | 0.56 | % | 3.53 | % | ||||||||||
Quarter 3 | 3.25 | % | 0.14 | % | 0.40 | % | 3.31 | % | ||||||||||
Quarter 4 | 3.25 | % | 0.06 | % | 0.47 | % | 3.85 | % | ||||||||||
2010: | Quarter 1 | 3.25 | % | 0.16 | % | 0.41 | % | 3.84 | % | |||||||||
Quarter 2 | 3.25 | % | 0.18 | % | 0.32 | % | 2.97 | % | ||||||||||
Quarter 3 | 3.25 | % | 0.18 | % | 0.32 | % | 2.97 | % | ||||||||||
Quarter 4 | 3.25 | % | 0.12 | % | 0.29 | % | 3.30 | % | ||||||||||
2011: | Quarter 1 | 3.25 | % | 0.09 | % | 0.30 | % | 3.47 | % | |||||||||
Quarter 2 | 3.25 | % | 0.03 | % | 0.19 | % | 3.18 | % | ||||||||||
Quarter 3 | 3.25 | % | 0.02 | % | 0.13 | % | 1.92 | % | ||||||||||
Quarter 4 | 3.25 | % | 0.02 | % | 0.12 | % | 1.89 | % | ||||||||||
2012: | Quarter 1 | 3.25 | % | 0.07 | % | 0.19 | % | 2.23 | % | |||||||||
Quarter 2 | 3.25 | % | 0.09 | % | 0.21 | % | 1.67 | % | ||||||||||
Quarter 3 | 3.25 | % | 0.10 | % | 0.17 | % | 1.65 | % | ||||||||||
Quarter 4 | 3.25 | % | 0.05 | % | 0.16 | % | 1.78 | % | ||||||||||
2013: | Quarter 1 | 3.25 | % | 0.07 | % | 0.14 | % | 1.87 | % | |||||||||
Quarter 2 | 3.25 | % | 0.04 | % | 0.15 | % | 2.52 | % | ||||||||||
Quarter 3 | 3.25 | % | 0.02 | % | 0.10 | % | 2.64 | % | ||||||||||
Quarter 4 | 3.25 | % | 0.07 | % | 0.13 | % | 3.04 | % | ||||||||||
2014: | Quarter 1 | 3.25 | % | 0.05 | % | 0.13 | % | 2.73 | % | |||||||||
Quarter 2 | 3.25 | % | 0.04 | % | 0.11 | % | 2.53 | % | ||||||||||
Quarter 3 | 3.25 | % | 0.02 | % | 0.13 | % | 2.52 | % | ||||||||||
Quarter 4 | 3.25 | % | 0.04 | % | 0.25 | % | 2.17 | % | ||||||||||
2015: | Quarter 1 | 3.25 | % | 0.03 | % | 0.26 | % | 1.94 | % | |||||||||
Quarter 2 | 3.25 | % | 0.01 | % | 0.28 | % | 2.35 | % | ||||||||||
Quarter 3 | 3.25 | % | 0.00 | % | 0.33 | % | 2.06 | % | ||||||||||
Quarter 4 | 3.50 | % | 0.16 | % | 0.65 | % | 2.27 | % | ||||||||||
2016: | Quarter 1 | 3.50 | % | 0.21 | % | 0.59 | % | 1.78 | % | |||||||||
Quarter 2 | 3.50 | % | 0.26 | % | 0.45 | % | 1.49 | % | ||||||||||
Quarter 3 | 3.50 | % | 0.29 | % | 0.59 | % | 1.60 | % | ||||||||||
Quarter 4 | 3.75 | % | 0.51 | % | 0.85 | % | 2.45 | % | ||||||||||
2017: | Quarter 1 | 4.00 | % | 0.76 | % | 1.03 | % | 2.40 | % | |||||||||
Quarter 2 | 4.25 | % | 1.03 | % | 1.24 | % | 2.31 | % | ||||||||||
Quarter 3 | 4.25 | % | 1.06 | % | 1.31 | % | 2.33 | % | ||||||||||
Quarter 4 | 4.50 | % | 1.39 | % | 1.76 | % | 2.40 | % | ||||||||||
2018: | Quarter 1 | 4.75 | % | 1.73 | % | 2.09 | % | 2.74 | % | |||||||||
Quarter 2 | 5.00 | % | 1.93 | % | 2.33 | % | 2.85 | % | ||||||||||
Quarter 3 | 5.25 | % | 2.19 | % | 2.59 | % | 3.05 | % | ||||||||||
Quarter 4 | 5.50 | % | 2.45 | % | 2.63 | % | 2.69 | % | ||||||||||
2019: | Quarter 1 | 5.50 | % | 2.40 | % | 2.40 | % | 2.41 | % | |||||||||
Quarter 2 | 5.00 | % | 2.12 | % | 1.92 | % | 2.00 | % | ||||||||||
Quarter 3 | 4.75 | % | 1.88 | % | 1.75 | % | 1.68 | % | ||||||||||
Quarter 4 | 4.75 | % | 1.55 | % | 1.59 | % | 1.92 | % | ||||||||||
2020: | Quarter 1 | 3.25 | % | 0.11 | % | 0.17 | % | 0.70 | % | |||||||||
Quarter 2 | 3.25 | % | 0.16 | % | 0.16 | % | 0.66 | % | ||||||||||
Quarter 3 | 3.25 | % | 0.10 | % | 0.12 | % | 0.69 | % | ||||||||||
Quarter 4 | 3.25 | % | 0.09 | % | 0.10 | % | 0.93 | % | ||||||||||
2021: | Quarter 1 | 3.25 | % | 0.05 | % | 0.07 | % | 1.74 | % | |||||||||
Quarter 2 | 3.25 | % | 0.05 | % | 0.07 | % | 1.45 | % | ||||||||||
Quarter 3 | 3.25 | % | 0.04 | % | 0.09 | % | 1.52 | % | ||||||||||
Quarter 4 | 3.25 | % | 0.06 | % | 0.39 | % | 1.52 | % | ||||||||||
2022: | 18-Feb-22 | 3.25 | % | 0.35 | % | 1.03 | % | 1.92 | % | |||||||||
| (1) | End of period data. |
Sources: Federal Reserve and The Wall Street Journal.
EXHIBIT II-2
Everett Co-Operative Bank
Market Area Demographic/Economic Information
Demographic Detail: Massachusetts
| Base 2010 | Current 2022 | Projected 2027 | % Change 2010-2022 | % Change 2022-2027 | ||||||||||||||||
Total Population (actual) | 6,547,629 | 7,078,512 | 7,380,261 | 8.11 | 4.26 | |||||||||||||||
0-14 Age Group (%) | 17.69 | 15.93 | 15.32 | (2.64 | ) | 0.26 | ||||||||||||||
15-34 Age Group (%) | 27.24 | 26.81 | 25.62 | 6.41 | (0.39 | ) | ||||||||||||||
35-54 Age Group (%) | 29.01 | 25.35 | 25.16 | (5.53 | ) | 3.46 | ||||||||||||||
55-69 Age Group (%) | 16.31 | 19.70 | 20.51 | 30.61 | 8.51 | |||||||||||||||
70+ Age Group (%) | 9.75 | 12.20 | 13.40 | 35.28 | 14.53 | |||||||||||||||
Median Age (actual) | 38.7 | 40.7 | 42.0 | 5.17 | 3.19 | |||||||||||||||
Female Population (actual) | 3,381,001 | 3,641,182 | 3,794,420 | 7.70 | 4.21 | |||||||||||||||
Male Population (actual) | 3,166,628 | 3,437,330 | 3,585,841 | 8.55 | 4.32 | |||||||||||||||
Population Density (#/ sq miles) | 840.04 | 908.15 | 946.86 | 8.11 | 4.26 | |||||||||||||||
Diversity Index (actual) | NA | NA | NA | NA | NA | |||||||||||||||
Black (%) | 6.63 | 7.96 | 8.49 | 29.72 | 11.22 | |||||||||||||||
Asian (%) | 5.34 | 7.43 | 8.30 | 50.32 | 16.50 | |||||||||||||||
White (%) | 80.41 | 74.60 | 72.18 | 0.29 | 0.89 | |||||||||||||||
Hispanic (%) | 9.59 | 13.38 | 14.98 | 50.92 | 16.68 | |||||||||||||||
Pacific Islander (%) | 0.03 | 0.05 | 0.05 | 44.89 | 15.27 | |||||||||||||||
American Indian/Alaska Native (%) | 0.29 | 0.34 | 0.36 | 27.89 | 11.12 | |||||||||||||||
Multiple races (%) | 2.63 | 3.54 | 3.93 | 45.88 | 15.67 | |||||||||||||||
Other (%) | 4.66 | 6.09 | 6.68 | 41.16 | 14.44 | |||||||||||||||
Total Households (actual) | 2,547,075 | 2,783,029 | 2,912,838 | 9.26 | 4.66 | |||||||||||||||
< $25K Households (%) | NA | 14.33 | 12.76 | NA | (6.78 | ) | ||||||||||||||
$25-49K Households (%) | NA | 14.08 | 12.82 | NA | (4.71 | ) | ||||||||||||||
$50-99K Households (%) | NA | 24.22 | 22.34 | NA | (3.44 | ) | ||||||||||||||
$100-$199K Households (%) | NA | 28.98 | 29.13 | NA | 5.21 | |||||||||||||||
$200K+ Households (%) | NA | 18.39 | 22.94 | NA | 30.57 | |||||||||||||||
Average Household Income ($) | NA | 133,318 | 149,157 | NA | 11.88 | |||||||||||||||
Median Household Income ($) | NA | 94,232 | 105,455 | NA | 11.91 | |||||||||||||||
Per Capita Income ($) | NA | 54,342 | 60,937 | NA | 12.14 | |||||||||||||||
Total Owner Occupied Housing Units (actual) | 1,587,158 | 1,730,066 | 1,810,777 | 9.00 | 4.67 | |||||||||||||||
Renter Occupied Housing Units (actual) | 959,917 | 1,052,963 | 1,102,061 | 9.69 | 4.66 | |||||||||||||||
Vacant Occupied Housing Units (actual) | 261,179 | 268,442 | 271,156 | 2.78 | 1.01 | |||||||||||||||
Source: Claritas
Demographic Detail: Essex, MA
|
| |||||||||||||||||||
| Base 2010 | Current 2022 | Projected 2027 | % Change 2010-2022 | % Change 2022-2027 | ||||||||||||||||
Total Population (actual) | 743,159 | 813,883 | 851,330 | 9.52 | 4.60 | |||||||||||||||
0-14 Age Group (%) | 18.85 | 17.02 | 16.56 | (1.12 | ) | 1.79 | ||||||||||||||
15-34 Age Group (%) | 24.35 | 25.15 | 24.58 | 13.10 | 2.23 | |||||||||||||||
35-54 Age Group (%) | 29.82 | 24.77 | 23.97 | (9.02 | ) | 1.22 | ||||||||||||||
55-69 Age Group (%) | 16.94 | 20.55 | 21.27 | 32.84 | 8.25 | |||||||||||||||
70+ Age Group (%) | 10.04 | 12.51 | 13.62 | 36.51 | 13.88 | |||||||||||||||
Median Age (actual) | 40.0 | 41.4 | 42.3 | 3.50 | 2.17 | |||||||||||||||
Female Population (actual) | 386,544 | 421,357 | 440,271 | 9.01 | 4.49 | |||||||||||||||
Male Population (actual) | 356,615 | 392,526 | 411,059 | 10.07 | 4.72 | |||||||||||||||
Population Density (#/ sq miles) | 1,509.98 | 1,653.68 | 1,729.77 | 9.52 | 4.60 | |||||||||||||||
Diversity Index (actual) | NA | NA | NA | NA | NA | |||||||||||||||
Black (%) | 3.77 | 5.28 | 5.92 | 53.48 | 17.35 | |||||||||||||||
Asian (%) | 3.12 | 3.87 | 4.19 | 35.65 | 13.18 | |||||||||||||||
White (%) | 81.86 | 74.84 | 71.85 | 0.12 | 0.42 | |||||||||||||||
Hispanic (%) | 16.52 | 24.17 | 27.43 | 60.27 | 18.70 | |||||||||||||||
Pacific Islander (%) | 0.04 | 0.05 | 0.06 | 44.88 | 15.26 | |||||||||||||||
American Indian/Alaska Native (%) | 0.37 | 0.47 | 0.52 | 41.28 | 14.61 | |||||||||||||||
Multiple races (%) | 2.62 | 3.65 | 4.09 | 52.61 | 17.17 | |||||||||||||||
Other (%) | 8.22 | 11.84 | 13.38 | 57.73 | 18.20 | |||||||||||||||
Total Households (actual) | 285,956 | 314,821 | 330,284 | 10.09 | 4.91 | |||||||||||||||
< $25K Households (%) | NA | 14.14 | 12.45 | NA | (7.59 | ) | ||||||||||||||
$25-49K Households (%) | NA | 14.80 | 13.56 | NA | (3.87 | ) | ||||||||||||||
$50-99K Households (%) | NA | 25.10 | 23.06 | NA | (3.64 | ) | ||||||||||||||
$100-$199K Households (%) | NA | 27.72 | 28.59 | NA | 8.20 | |||||||||||||||
$200K+ Households (%) | NA | 18.24 | 22.34 | NA | 28.52 | |||||||||||||||
Average Household Income ($) | NA | 132,494 | 147,621 | NA | 11.42 | |||||||||||||||
Median Household Income ($) | NA | 91,762 | 102,341 | NA | 11.53 | |||||||||||||||
Per Capita Income ($) | NA | 52,528 | 58,635 | NA | 11.63 | |||||||||||||||
Total Owner Occupied Housing Units (actual) | 182,572 | 201,221 | 211,177 | 10.21 | 4.95 | |||||||||||||||
Renter Occupied Housing Units (actual) | 103,384 | 113,600 | 119,107 | 9.88 | 4.85 | |||||||||||||||
Vacant Occupied Housing Units (actual) | 20,798 | 21,151 | 21,465 | 1.70 | 1.48 | |||||||||||||||
Source: Claritas
Demographic Detail: Middlesex, MA
| Base 2010 | Current 2022 | Projected 2027 | % Change 2010-2022 | % Change 2022-2027 | ||||||||||||||||
Total Population (actual) | 1,503,085 | 1,653,285 | 1,727,576 | 9.99 | 4.49 | |||||||||||||||
0-14 Age Group (%) | 17.54 | 15.97 | 15.48 | 0.16 | 1.26 | |||||||||||||||
15-34 Age Group (%) | 27.84 | 27.52 | 25.32 | 8.72 | (3.85 | ) | ||||||||||||||
35-54 Age Group (%) | 29.67 | 26.66 | 27.35 | (1.16 | ) | 7.19 | ||||||||||||||
55-69 Age Group (%) | 15.64 | 18.54 | 19.32 | 30.41 | 8.93 | |||||||||||||||
70+ Age Group (%) | 9.31 | 11.31 | 12.53 | 33.58 | 15.71 | |||||||||||||||
Median Age (actual) | 38.3 | 39.7 | 41.3 | 3.66 | 4.03 | |||||||||||||||
Female Population (actual) | 772,221 | 843,252 | 880,848 | 9.20 | 4.46 | |||||||||||||||
Male Population (actual) | 730,864 | 810,033 | 846,728 | 10.83 | 4.53 | |||||||||||||||
Population Density (#/ sq miles) | 1,839.08 | 2,022.86 | 2,113.76 | 9.99 | 4.49 | |||||||||||||||
Diversity Index (actual) | NA | NA | NA | NA | NA | |||||||||||||||
Black (%) | 4.66 | 5.60 | 6.01 | 32.33 | 12.00 | |||||||||||||||
Asian (%) | 9.31 | 13.65 | 15.49 | 61.20 | 18.62 | |||||||||||||||
White (%) | 80.00 | 72.94 | 69.94 | 0.30 | 0.20 | |||||||||||||||
Hispanic (%) | 6.54 | 9.00 | 10.04 | 51.27 | 16.62 | |||||||||||||||
Pacific Islander (%) | 0.03 | 0.04 | 0.04 | 20.74 | 7.82 | |||||||||||||||
American Indian/Alaska Native (%) | 0.17 | 0.21 | 0.22 | 32.59 | 12.00 | |||||||||||||||
Multiple races (%) | 2.54 | 3.49 | 3.90 | 51.04 | 16.57 | |||||||||||||||
Other (%) | 3.29 | 4.07 | 4.41 | 36.23 | 13.06 | |||||||||||||||
Total Households (actual) | 580,688 | 645,652 | 676,858 | 11.19 | 4.83 | |||||||||||||||
< $25K Households (%) | NA | 10.58 | 9.41 | NA | (6.75 | ) | ||||||||||||||
$25-49K Households (%) | NA | 10.96 | 9.55 | NA | (8.69 | ) | ||||||||||||||
$50-99K Households (%) | NA | 21.52 | 19.63 | NA | (4.39 | ) | ||||||||||||||
$100-$199K Households (%) | NA | 31.05 | 30.08 | NA | 1.55 | |||||||||||||||
$200K+ Households (%) | NA | 25.88 | 31.33 | NA | 26.90 | |||||||||||||||
Average Household Income ($) | NA | 164,341 | 182,834 | NA | 11.25 | |||||||||||||||
Median Household Income ($) | NA | 118,062 | 132,394 | NA | 12.14 | |||||||||||||||
Per Capita Income ($) | NA | 66,418 | 74,027 | NA | 11.46 | |||||||||||||||
Total Owner Occupied Housing Units (actual) | 361,089 | 401,273 | 420,661 | 11.13 | 4.83 | |||||||||||||||
Renter Occupied Housing Units (actual) | 219,599 | 244,379 | 256,197 | 11.28 | 4.84 | |||||||||||||||
Vacant Occupied Housing Units (actual) | 31,316 | 32,160 | 32,797 | 2.70 | 1.98 | |||||||||||||||
Source: Claritas
EXHIBIT III-1
Everett Co-Operative Bank
General Characteristics of Publicly-Traded Institutions
Peer Group of Publicly-Traded Banks & Thrifts
As of December 31, 2021 or the Most Recent Date Available
| As of | ||||||||||||||||||||||||||||||||
| February 18, 2022 | ||||||||||||||||||||||||||||||||
Ticker | Financial Institution | Exchange | Region | City | State | Total Assets | Offices | Fiscal | Stock Price | Market Value | ||||||||||||||||||||||
| ($Mil) | ($) | ($Mil) | ||||||||||||||||||||||||||||||
BCOW | 1895 Bancorp of Wisconsin, Inc. | NASDAQCM | MW | Greenfield | WI | $ | 541 | (1) | 6 | Dec | $ | 11.64 | $ | 74 | ||||||||||||||||||
AFBI | Affinity Bancshares, Inc. | NASDAQCM | SE | Covington | GA | $ | 790 | (1) | 3 | Dec | $ | 15.69 | $ | 108 | ||||||||||||||||||
AX | Axos Financial, Inc. | NYSE | WE | Las Vegas | NV | $ | 15,548 | 1 | Jun | $ | 54.12 | $ | 3,220 | |||||||||||||||||||
BLFY | Blue Foundry Bancorp | NASDAQGS | MA | Rutherford | NJ | $ | 1,914 | 18 | Dec | $ | 14.33 | $ | 377 | |||||||||||||||||||
BYFC | Broadway Financial Corporation | NASDAQCM | WE | Los Angeles | CA | $ | 1,064 | (1) | 3 | Dec | $ | 1.67 | $ | 73 | ||||||||||||||||||
CFFN | Capitol Federal Financial, Inc. | NASDAQGS | MW | Topeka | KS | $ | 9,609 | 54 | Sep | $ | 11.14 | $ | 1,511 | |||||||||||||||||||
CARV | Carver Bancorp, Inc. | NASDAQCM | MA | New York | NY | $ | 723 | 7 | Mar | $ | 8.41 | $ | 32 | |||||||||||||||||||
CNNB | Cincinnati Bancorp, Inc. | NASDAQCM | MW | Cincinnati | OH | $ | 248 | (1) | 6 | Dec | $ | 15.65 | $ | 46 | ||||||||||||||||||
CULL | Cullman Bancorp, Inc. | NASDAQCM | SE | Cullman | AL | $ | 373 | (1) | 4 | Dec | $ | 11.96 | $ | 89 | ||||||||||||||||||
ESSA | ESSA Bancorp, Inc. | NASDAQGS | MA | Stroudsburg | PA | $ | 1,868 | 22 | Sep | $ | 18.05 | $ | 177 | |||||||||||||||||||
FFBW | FFBW, Inc. | NASDAQCM | MW | Brookfield | WI | $ | 355 | (1) | 6 | Dec | $ | 12.05 | $ | 83 | ||||||||||||||||||
FNWB | First Northwest Bancorp | NASDAQGM | WE | Port Angeles | WA | $ | 1,921 | 14 | Dec | $ | 22.96 | $ | 208 | |||||||||||||||||||
FSBW | FS Bancorp, Inc. | NASDAQCM | WE | Mountlake Terrace | WA | $ | 2,286 | 23 | Dec | $ | 32.32 | $ | 260 | |||||||||||||||||||
GBNY | Generations Bancorp NY, Inc. | NASDAQCM | MA | Seneca Falls | NY | $ | 377 | (1) | 10 | Dec | $ | 11.98 | $ | 29 | ||||||||||||||||||
HONE | HarborOne Bancorp, Inc. | NASDAQGS | NE | Brockton | MA | $ | 4,553 | 30 | Dec | $ | 14.80 | $ | 737 | |||||||||||||||||||
HIFS | Hingham Institution for Savings | NASDAQGM | NE | Hingham | MA | $ | 3,431 | 8 | Dec | $ | 365.70 | $ | 783 | |||||||||||||||||||
HMNF | HMN Financial, Inc. | NASDAQGM | MW | Rochester | MN | $ | 1,070 | 14 | Dec | $ | 25.26 | $ | 111 | |||||||||||||||||||
HFBL | Home Federal Bancorp, Inc. of Louisiana | NASDAQCM | SW | Shreveport | LA | $ | 571 | 11 | Jun | $ | 20.65 | $ | 63 | |||||||||||||||||||
HVBC | HV Bancorp, Inc. | NASDAQCM | MA | Doylestown | PA | $ | 560 | 7 | Dec | $ | 21.44 | $ | 44 | |||||||||||||||||||
IROQ | IF Bancorp, Inc. | NASDAQCM | MW | Watseka | IL | $ | 773 | 8 | Jun | $ | 24.05 | $ | 74 | |||||||||||||||||||
KRNY | Kearny Financial Corp. | NASDAQGS | MA | Fairfield | NJ | $ | 7,186 | 45 | Jun | $ | 13.19 | $ | 925 | |||||||||||||||||||
MGYR | Magyar Bancorp, Inc. | NASDAQGM | MA | New Brunswick | NJ | $ | 781 | 7 | Sep | $ | 12.05 | $ | 86 | |||||||||||||||||||
MSVB | Mid-Southern Bancorp, Inc. | NASDAQCM | MW | Salem | IN | $ | 252 | (1) | 3 | Dec | $ | 15.00 | $ | 43 | ||||||||||||||||||
NYCB | New York Community Bancorp, Inc. | NYSE | MA | Hicksville | NY | $ | 59,527 | 238 | Dec | $ | 11.58 | $ | 5,385 | |||||||||||||||||||
NECB | Northeast Community Bancorp, Inc. | NASDAQCM | MA | White Plains | NY | $ | 1,225 | 11 | Dec | $ | 12.78 | $ | 198 | |||||||||||||||||||
NFBK | Northfield Bancorp, Inc. (Staten Island, NY) | NASDAQGS | MA | Woodbridge | NJ | $ | 5,431 | 38 | Dec | $ | 15.72 | $ | 774 | |||||||||||||||||||
NSTS | NSTS Bancorp, Inc. | NASDAQCM | MW | Waukegan | IL | $ | 260 | (1) | 3 | Dec | $ | 12.50 | $ | 67 | ||||||||||||||||||
PBBK | PB Bankshares, Inc. | NASDAQCM | MA | Coatesville | PA | $ | 312 | (1) | 4 | Dec | $ | 14.00 | $ | 39 | ||||||||||||||||||
PCSB | PCSB Financial Corporation | NASDAQCM | MA | Yorktown Heights | NY | $ | 1,888 | 15 | Jun | $ | 18.82 | $ | 289 | |||||||||||||||||||
PDLB | Ponce Financial Group, Inc. | NASDAQGM | MA | Bronx | NY | $ | 1,561 | (1) | 14 | Dec | $ | 10.64 | $ | 263 | ||||||||||||||||||
PVBC | Provident Bancorp, Inc. | NASDAQCM | NE | Amesbury | MA | $ | 1,729 | 7 | Dec | $ | 17.00 | $ | 297 | |||||||||||||||||||
PROV | Provident Financial Holdings, Inc. | NASDAQGS | WE | Riverside | CA | $ | 1,182 | 14 | Jun | $ | 16.75 | $ | 123 | |||||||||||||||||||
PFS | Provident Financial Services, Inc. | NYSE | MA | Jersey City | NJ | $ | 13,781 | 97 | Dec | $ | 23.76 | $ | 1,835 | |||||||||||||||||||
PBIP | Prudential Bancorp, Inc. | NASDAQGM | MA | Philadelphia | PA | $ | 1,084 | 10 | Sep | $ | 14.87 | $ | 116 | |||||||||||||||||||
RNDB | Randolph Bancorp, Inc. | NASDAQGM | NE | Quincy | MA | $ | 803 | 5 | Dec | $ | 22.44 | $ | 107 | |||||||||||||||||||
RVSB | Riverview Bancorp, Inc. | NASDAQGS | WE | Vancouver | WA | $ | 1,683 | 17 | Mar | $ | 7.80 | $ | 173 | |||||||||||||||||||
SBT | Sterling Bancorp, Inc. (Southfield, MI) | NASDAQCM | MW | Southfield | MI | $ | 2,874 | 28 | Dec | $ | 6.11 | $ | 308 | |||||||||||||||||||
TCBC | TC Bancshares, Inc. | NASDAQCM | SE | Thomasville | GA | $ | 387 | (1) | 2 | Dec | $ | 13.75 | $ | 67 | ||||||||||||||||||
TBNK | Territorial Bancorp Inc. | NASDAQGS | WE | Honolulu | HI | $ | 2,131 | 30 | Dec | $ | 25.03 | $ | 225 | |||||||||||||||||||
TCBS | Texas Community Bancshares, Inc. | NASDAQCM | SW | Mineola | TX | $ | 359 | (1) | 6 | Dec | $ | 17.75 | $ | 53 | ||||||||||||||||||
TCBX | Third Coast Bancshares, Inc. | NASDAQGS | SW | Humble | TX | $ | 2,499 | 12 | Dec | $ | 23.52 | $ | 314 | |||||||||||||||||||
TSBK | Timberland Bancorp, Inc. | NASDAQGM | WE | Hoquiam | WA | $ | 1,831 | 24 | Sep | $ | 27.57 | $ | 230 | |||||||||||||||||||
TBK | Triumph Bancorp, Inc. | NASDAQGS | SW | Dallas | TX | $ | 5,956 | 65 | Dec | $ | 94.94 | $ | 2,355 | |||||||||||||||||||
TRST | TrustCo Bank Corp NY | NASDAQGS | MA | Glenville | NY | $ | 6,197 | 144 | Dec | $ | 34.28 | $ | 659 | |||||||||||||||||||
WSBF | Waterstone Financial, Inc. | NASDAQGS | MW | Wauwatosa | WI | $ | 2,216 | 16 | Dec | $ | 19.52 | $ | 462 | |||||||||||||||||||
WNEB | Western New England Bancorp, Inc. | NASDAQGS | NE | Westfield | MA | $ | 2,538 | 27 | Dec | $ | 9.35 | $ | 212 | |||||||||||||||||||
WMPN | William Penn Bancorporation | NASDAQCM | MA | Bristol | PA | $ | 834 | 14 | Jun | $ | 12.51 | $ | 179 | |||||||||||||||||||
WSFS | WSFS Financial Corporation | NASDAQGS | MA | Wilmington | DE | $ | 15,777 | 125 | Dec | $ | 52.25 | $ | 3,423 | |||||||||||||||||||
WVFC | WVS Financial Corp. | NASDAQGM | MA | Pittsburgh | PA | $ | 356 | 5 | Jun | $ | 15.19 | $ | 26 | |||||||||||||||||||
| (1) | As of December 31, 2021 or the most recent date available. |
Source: S&P Capital IQ.
EXHIBIT III-2
Everett Co-Operative Bank
New England Savings Institutions
Exhibit III-2
New England Savings Institutions
As of February 18, 2022
| Market | Per Share Data | |||||||||||||||||||||||||||||||||||||||||||||||||||||||||||||||||||||||||||||||||
Capitalization | Core | Book | Dividends(4) | Financial Characteristics(6) | ||||||||||||||||||||||||||||||||||||||||||||||||||||||||||||||||||||||||||||||
| Price/ | Market | 12 Month | Value/ | Pricing Ratios(3) | Amount/ | Payout | Total | Equity/ | Tang. Eq./ | NPAs/ | Reported (5) | Core (5) | ||||||||||||||||||||||||||||||||||||||||||||||||||||||||||||||||||||||
Share(1) | Value | EPS(2) | Share | P/E | P/B | P/A | P/TB | P/Core | Share | Yield | Ratio | Assets | Assets | T. Assets | Assets | ROAA | ROAE | ROAA | ROAE | |||||||||||||||||||||||||||||||||||||||||||||||||||||||||||||||
| ($) | ($Mil) | ($) | ($) | (x) | (%) | (%) | (%) | (x) | ($) | (%) | (%) | ($Mil) | (%) | (%) | (%) | (%) | (%) | (%) | (%) | |||||||||||||||||||||||||||||||||||||||||||||||||||||||||||||||
All Fully-Converted, Publicly-Traded New England Savings Institutions |
| |||||||||||||||||||||||||||||||||||||||||||||||||||||||||||||||||||||||||||||||||
Averages | $85.86 | $ | 427.22 | $ | 6.12 | $ | 44.24 | 12.86 | 134.67 | % | 15.56 | % | 138.79 | % | 13.19 | $ | 0.68 | 1.63 | % | 37.38 | % | $ | 2,611 | 12.03 | % | 11.64 | % | #DIV/0! | 1.36 | % | 11.18 | % | 1.30 | % | 10.57 | % | ||||||||||||||||||||||||||||||||||||||||||||||
Medians | $17.00 | $ | 297.14 | $ | 1.18 | $ | 13.09 | 11.94 | 114.15 | % | 16.19 | % | 127.89 | % | 12.59 | $ | 0.24 | 1.35 | % | 17.54 | % | $ | 2,538 | 12.56 | % | 12.56 | % | #NUM! | 1.29 | % | 9.31 | % | 1.32 | % | 9.51 | % | ||||||||||||||||||||||||||||||||||||||||||||||
Peer Group | ||||||||||||||||||||||||||||||||||||||||||||||||||||||||||||||||||||||||||||||||||
PVBC | Provident Bancorp, Inc. | MA | $17.00 | $ | 297.14 | $ | 0.94 | $ | 13.09 | 18.28x | 129.83 | % | 17.18 | % | 129.83 | % | 18.08x | $ | 0.16 | 0.94 | % | 17.20 | % | $ | 1,729 | 13.52 | % | 13.52 | % | NA | 1.02 | % | 6.86 | % | 1.03 | % | 6.93 | % | ||||||||||||||||||||||||||||||||||||||||||||
HIFS | Hingham Institution for Savings | MA | $365.70 | $ | 783.48 | $ | 25.57 | $ | 165.52 | 11.93x | 220.94 | % | 22.83 | % | 220.94 | % | 14.30x | $ | 2.20 | 0.60 | % | 9.23 | % | $ | 3,431 | 10.34 | % | 10.34 | % | NA | 2.25 | % | 20.62 | % | 1.88 | % | 17.20 | % | ||||||||||||||||||||||||||||||||||||||||||||
RNDB | Randolph Bancorp, Inc. | MA | $22.44 | $ | 106.64 | $ | 1.92 | $ | 19.73 | 11.94x | 113.73 | % | 13.28 | % | 113.75 | % | 11.68x | $ | 0.60 | 2.67 | % | 122.34 | % | $ | 803 | 12.56 | % | 12.56 | % | NA | 1.29 | % | 9.31 | % | 1.32 | % | 9.51 | % | ||||||||||||||||||||||||||||||||||||||||||||
HONE | HarborOne Bancorp, Inc. | MA | $14.80 | $ | 737.02 | $ | 1.18 | $ | 12.97 | 12.98x | 114.15 | % | 16.19 | % | 127.89 | % | 12.59x | $ | 0.20 | 1.35 | % | 17.54 | % | $ | 4,553 | 14.92 | % | 13.53 | % | NA | 1.29 | % | 8.45 | % | 1.32 | % | 8.71 | % | ||||||||||||||||||||||||||||||||||||||||||||
WNEB | Western New England Bancorp, Inc. | MA | $9.35 | $ | 211.84 | $ | 1.01 | $ | 9.87 | 9.17x | 94.70 | % | 8.35 | % | 101.53 | % | 9.30x | $ | 0.24 | 2.57 | % | 20.59 | % | $ | 2,538 | 8.81 | % | 8.27 | % | NA | 0.96 | % | 10.64 | % | 0.94 | % | 10.49 | % | ||||||||||||||||||||||||||||||||||||||||||||
| (1) | Closing price at date indicated, market value equal to public (minority shares) times current stock price. |
| (2) | Core earnings reflect net income less non-recurring items |
| (3) | P/E = Price to earnings; P/B = Price to book; P/A = Price to assets; P/TB = Price to tangible book value; and P/Core = Price to core earnings. P/E and P/Core =NM if the ratio is negative or above 35x. |
| (4) | Dividend is as of most recent quarterly dividend. Indicated 12 month dividend as a percent of trailing 12 month earnings. |
| (5) | ROAA (return on average assets) and ROAE (return on average equity) are indicated ratios based on trailing 12 month earnings and average equity and assets balances. |
| (6) | Excludes from averages and medians those companies the subject of actual or rumored acquisition activities or unusual operating characteristics. |
| (7) | Current Quarter is December 31, 2021, footnote reflects data as of September 30, 2021. |
Source: S&P Global Market Intelligence and RP Financial, LC. calculations. The information provided in this report has been obtained from sources we believe are reliable, but we cannot guarantee the accuracy or completeness of such information.
EXHIBIT III-3
Everett Co-Operative Bank
Mid-Atlantic Savings Institutions
Exhibit III-3
Mid-Atlantic Savings Insitutions
As of February 18, 2022
| Market Capitalization | Per Share Data | Dividends(4) | Financial Characteristics(6) | |||||||||||||||||||||||||||||||||||||||||||||||||||||||||||||||||||||||||||||||||||||||
| Price/ Share(1) | Market Value | Core 12 Month EPS(2) | Book Value/ Share | Pricing Ratios(3) | Amount/ Share | Yield | Payout Ratio | Total Assets | Equity/ Assets | Tang. Eq./ T. Assets | NPA/ Assets | Reportrd (5) | Core (5) | |||||||||||||||||||||||||||||||||||||||||||||||||||||||||||||||||||||||||||||
| P/E | P/B | P/A | P/TB | P/Core | ROAA | ROAE | ROAA | ROAE | ||||||||||||||||||||||||||||||||||||||||||||||||||||||||||||||||||||||||||||||||||
| ($) | ($Mil) | ($) | ($) | (x) | (%) | (%) | (%) | (x) | ($) | (%) | (%) | ($Mil) | (%) | (%) | (%) | (%) | (%) | (%) | (%) | |||||||||||||||||||||||||||||||||||||||||||||||||||||||||||||||||||||||
All Fully-Converted, Publicly-Traded Mid-Atlantic Savings Institutions |
| |||||||||||||||||||||||||||||||||||||||||||||||||||||||||||||||||||||||||||||||||||||||||
Averages | $ | 17.68 | $ | 781.80 | $ | 1.26 | $ | 17.83 | 14.18 | 97.79 | % | 12.76 | % | 107.70 | % | 14.47 | $ | 0.45 | 2.37 | % | 41.08 | % | $ | 6,387 | 13.50 | % | 12.18 | % | 0.83 | % | 0.70 | % | 5.78 | % | 0.73 | % | 5.91 | % | ||||||||||||||||||||||||||||||||||||||||||||||||||||
Medians | $ | 14.33 | $ | 197.92 | $ | 0.99 | $ | 16.40 | 12.95 | 95.17 | % | 12.44 | % | 103.80 | % | 12.18 | $ | 0.42 | 2.26 | % | 35.86 | % | $ | 1,561 | 12.31 | % | 10.88 | % | 0.75 | % | 0.87 | % | 7.04 | % | 0.89 | % | 6.71 | % | ||||||||||||||||||||||||||||||||||||||||||||||||||||
Peer Group | ||||||||||||||||||||||||||||||||||||||||||||||||||||||||||||||||||||||||||||||||||||||||||
CARV | Carver Bancorp, Inc. | NY | $ | 8.41 | $ | 32.00 | ($ | 0.91 | ) | $ | 8.10 | NM | 103.80 | % | 4.43 | % | 103.80 | % | NM | $ | 0.00 | 0.00 | % | NA | $ | 723 | 7.98 | % | 7.98 | % | 1.84 | % | -0.28 | % | -3.67 | % | -0.32 | % | -4.16 | % | ||||||||||||||||||||||||||||||||||||||||||||||||||
GBNY | Generations Bancorp NY, Inc. | (7 | ) | NY | $ | 11.98 | $ | 29.45 | $ | 0.45 | $ | 17.27 | 22.19x | 69.35 | % | 7.80 | % | 72.05 | % | 26.85x | NA | NA | NA | $ | 377 | 11.25 | % | 10.88 | % | 1.73 | % | 0.35 | % | 3.60 | % | 0.28 | % | 2.93 | % | |||||||||||||||||||||||||||||||||||||||||||||||||||
HVBC | HV Bancorp, Inc. | (7 | ) | PA | $ | 21.44 | $ | 43.65 | $ | 2.80 | $ | 19.52 | 7.55x | 109.83 | % | 8.14 | % | 109.83 | % | 7.65x | NA | NA | NA | $ | 536 | 7.92 | % | 7.92 | % | 0.77 | % | 0.93 | % | 14.73 | % | 0.92 | % | 14.53 | % | |||||||||||||||||||||||||||||||||||||||||||||||||||
NECB | Northeast Community Bancorp, Inc. | NY | $ | 12.78 | $ | 197.92 | $ | 0.77 | $ | 15.35 | 17.04x | 83.26 | % | 16.16 | % | 83.48 | % | 16.61x | $ | 0.24 | 1.88 | % | 26.99 | % | $ | 1,225 | 20.52 | % | 20.48 | % | NA | 1.13 | % | 6.03 | % | 1.16 | % | 6.18 | % | |||||||||||||||||||||||||||||||||||||||||||||||||||
PBBK | PB Bankshares, Inc. | (7 | ) | PA | $ | 14.00 | $ | 38.88 | NA | $ | 16.40 | NA | 85.39 | % | 12.44 | % | 85.39 | % | NA | NA | NA | NA | $ | 312 | 14.57 | % | 14.57 | % | 0.73 | % | NA | -0.03 | % | NA | 1.07 | % | ||||||||||||||||||||||||||||||||||||||||||||||||||||||
PCSB | PCSB Financial Corporation | NY | $ | 18.82 | $ | 288.60 | $ | 1.00 | $ | 17.92 | 18.27x | 105.03 | % | 15.29 | % | 107.47 | % | 18.87x | $ | 0.24 | 1.28 | % | 23.30 | % | $ | 1,888 | 14.56 | % | 14.27 | % | 0.39 | % | 0.80 | % | 5.45 | % | 0.78 | % | 5.27 | % | ||||||||||||||||||||||||||||||||||||||||||||||||||
WMPN | William Penn Bancorporation | PA | $ | 12.51 | $ | 178.76 | $ | 0.29 | $ | 14.10 | NM | 88.73 | % | 21.43 | % | 91.16 | % | NM | $ | 0.03 | 0.24 | % | 117.86 | % | $ | 834 | 25.65 | % | 25.14 | % | 0.70 | % | 0.50 | % | 2.18 | % | 0.51 | % | 2.22 | % | ||||||||||||||||||||||||||||||||||||||||||||||||||
MGYR | Magyar Bancorp, Inc. | NJ | $ | 12.05 | $ | 85.53 | $ | 0.90 | $ | 13.87 | 12.95x | 86.88 | % | 10.96 | % | 86.88 | % | 13.46x | $ | 0.12 | 1.00 | % | 16.12 | % | $ | 781 | 12.61 | % | 12.61 | % | NA | 0.83 | % | 8.25 | % | 0.80 | % | 7.93 | % | |||||||||||||||||||||||||||||||||||||||||||||||||||
PDLB | Ponce Financial Group, Inc. | (7 | ) | NY | $ | 10.64 | $ | 262.94 | NA | $ | 7.19 | 20.62x | 147.96 | % | 16.85 | % | 147.96 | % | NA | NA | NA | NA | $ | 1,561 | 11.14 | % | 11.14 | % | NA | 0.84 | % | 7.20 | % | NA | NA | |||||||||||||||||||||||||||||||||||||||||||||||||||||||
PBIP | Prudential Bancorp, Inc. | PA | $ | 14.87 | $ | 115.53 | $ | 0.83 | $ | 17.19 | 15.17x | 86.48 | % | 10.66 | % | 90.78 | % | 17.91x | $ | 0.28 | 1.88 | % | 28.57 | % | $ | 1,084 | 12.32 | % | 11.81 | % | 1.21 | % | 0.69 | % | 5.93 | % | 0.58 | % | 5.02 | % | ||||||||||||||||||||||||||||||||||||||||||||||||||
WVFC | WVS Financial Corp. | PA | $ | 15.19 | $ | 26.31 | $ | 0.59 | $ | 20.29 | 23.37x | 74.88 | % | 7.40 | % | 74.88 | % | 25.87x | $ | 0.40 | 2.63 | % | 61.54 | % | $ | 356 | 10.75 | % | 10.75 | % | 0.00 | % | 0.33 | % | 2.92 | % | 0.30 | % | 2.64 | % | ||||||||||||||||||||||||||||||||||||||||||||||||||
BLFY | Blue Foundry Bancorp | NJ | $ | 14.33 | $ | 376.62 | ($ | 1.53 | ) | $ | 15.06 | NM | 95.17 | % | 19.67 | % | 91.26 | % | NM | NA | NA | NA | $ | 1,914 | 22.44 | % | NA | NA | -1.79 | % | -11.55 | % | -0.91 | % | -5.92 | % | ||||||||||||||||||||||||||||||||||||||||||||||||||||||
ESSA | ESSA Bancorp, Inc. | PA | $ | 18.05 | $ | 176.87 | $ | 1.69 | $ | 19.79 | 10.56x | 91.19 | % | 9.47 | % | 97.92 | % | 10.65x | $ | 0.48 | 2.66 | % | 28.07 | % | $ | 1,868 | 11.11 | % | 10.43 | % | 1.02 | % | 0.90 | % | 8.40 | % | 0.89 | % | 8.32 | % | ||||||||||||||||||||||||||||||||||||||||||||||||||
KRNY | Kearny Financial Corp. | NJ | $ | 13.19 | $ | 924.54 | $ | 0.99 | $ | 13.55 | 13.74x | 97.33 | % | 12.87 | % | 125.00 | % | 13.36x | $ | 0.44 | 3.34 | % | 43.75 | % | $ | 7,186 | 13.85 | % | NA | 1.13 | % | 1.01 | % | 7.04 | % | 1.04 | % | 7.23 | % | |||||||||||||||||||||||||||||||||||||||||||||||||||
NFBK | Northfield Bancorp, Inc. (Staten Island, NY) | NJ | $ | 15.72 | $ | 774.47 | $ | 1.43 | $ | 15.02 | 10.84x | 104.68 | % | 14.26 | % | 110.89 | % | 11.00x | $ | 0.52 | 3.31 | % | 35.86 | % | $ | 5,431 | 13.62 | % | 12.96 | % | 0.25 | % | 1.29 | % | 9.42 | % | 1.27 | % | 9.28 | % | ||||||||||||||||||||||||||||||||||||||||||||||||||
TRST | TrustCo Bank Corp NY | NY | $ | 34.28 | $ | 658.86 | $ | 3.19 | $ | 31.28 | 10.73x | 109.60 | % | 10.63 | % | 109.71 | % | 10.73x | $ | 1.40 | 4.08 | % | 43.25 | % | $ | 6,197 | 9.70 | % | 9.69 | % | NA | 1.01 | % | 10.61 | % | 1.01 | % | 10.61 | % | |||||||||||||||||||||||||||||||||||||||||||||||||||
WSFS | WSFS Financial Corporation | DE | $ | 52.25 | $ | 3,423.41 | $ | 5.57 | $ | 40.73 | 9.18x | 128.28 | % | 21.70 | % | 178.72 | % | 9.37x | $ | 0.52 | 1.00 | % | 9.14 | % | $ | 15,777 | 12.28 | % | 9.13 | % | 0.21 | % | 1.82 | % | 14.71 | % | 1.79 | % | 14.39 | % | ||||||||||||||||||||||||||||||||||||||||||||||||||
NYCB | New York Community Bancorp, Inc. | NY | $ | 11.58 | $ | 5,384.88 | $ | 1.24 | $ | 14.07 | 9.65x | 82.33 | % | 9.05 | % | 130.86 | % | 9.35x | $ | 0.68 | 5.87 | % | 56.67 | % | $ | 59,527 | 11.83 | % | 8.09 | % | NA | 1.04 | % | 8.60 | % | 1.07 | % | 8.86 | % | |||||||||||||||||||||||||||||||||||||||||||||||||||
PFS | Provident Financial Services, Inc. | NJ | $ | 23.76 | $ | 1,834.90 | $ | 2.19 | $ | 22.05 | 10.85x | 107.76 | % | 13.31 | % | 148.33 | % | 10.86x | $ | 0.96 | 4.04 | % | 42.92 | % | $ | 13,781 | 12.31 | % | 9.26 | % | NA | 1.26 | % | 10.03 | % | 1.26 | % | 10.02 | % | |||||||||||||||||||||||||||||||||||||||||||||||||||
| (1) | Closing price at date indicated, market value equal to public (minority shares) times current stock price. |
| (2) | Core earnings reflect net income less non-recurring items |
| (3) | P/E = Price to earnings; P/B = Price to book; P/A = Price to assets; P/TB = Price to tangible book value; and P/Core = Price to core earnings. P/E and P/Core =NM if the ratio is negative or above 35x. |
| (4) | Dividend is as of most recent quarterly dividend. Indicated 12 month dividend as a percent of trailing 12 month earnings. |
| (5) | ROAA (return on average assets) and ROAE (return on average equity) are indicated ratios based on trailing 12 month earnings and average equity and assets balances. |
| (6) | Excludes from averages and medians those companies the subject of actual or rumored acquisition activities or unusual operating characteristics. |
| (7) | Current Quarter is December 31, 2021, footnote reflects data as of September 30, 2021. |
Source: S&P Global Market Intelligence and RP Financial, LC. calculations. The information provided in this report has been obtained from sources we believe are reliable, but we cannot guarantee the accuracy or completeness of such information.
EXHIBIT III-4
Everett Co-Operative Bank
Peer Group Summary Demographic and Deposit Market Share Data
Exhibit III-4
Peer Group Market Area Comparative Analysis
| Per Capita Income | Deposit Market Share(2) | |||||||||||||||||||||||||||||||||
| Population (000s) | 2017-2022 % Change | 2022-2027 % Change | 2022 ($) | % State Average | ||||||||||||||||||||||||||||||
Institution | County | 2017 | 2022 | 2027(1) | ||||||||||||||||||||||||||||||
ESSA Bancorp, Inc. | Monroe, PA | 165,353 | 173,883 | 178,631 | 1.0 | % | 0.5 | % | 34,794 | 86.0 | % | 26.05 | % | |||||||||||||||||||||
Generations Bancorp NY, Inc. | Seneca, NY | 34,643 | 35,424 | 36,947 | 0.4 | % | 0.8 | % | 34,238 | 72.9 | % | 20.52 | % | |||||||||||||||||||||
HV Bancorp, Inc. | Bucks, PA | 628,165 | 639,897 | 655,104 | 0.4 | % | 0.5 | % | 53,743 | 132.8 | % | 0.43 | % | |||||||||||||||||||||
Magyar Bancorp, Inc. | Middlesex, NJ | 848,721 | 860,791 | 906,421 | 0.3 | % | 1.0 | % | 48,580 | 96.6 | % | 1.33 | % | |||||||||||||||||||||
Northeast Community Bancorp, Inc. | Westchester, NY | 983,338 | 1,012,888 | 1,068,778 | 0.6 | % | 1.1 | % | 65,953 | 140.4 | % | 0.15 | % | |||||||||||||||||||||
PCSB Financial Corporation | Westchester, NY | 983,338 | 1,012,888 | 1,068,778 | 0.6 | % | 1.1 | % | 65,953 | 140.4 | % | 0.40 | % | |||||||||||||||||||||
Provident Bancorp, Inc. | Essex, MA | 785,239 | 813,883 | 851,330 | 0.7 | % | 0.9 | % | 52,528 | 96.7 | % | 2.31 | % | |||||||||||||||||||||
Prudential Bancorp, Inc. | Philadelphia, PA | 1,577,265 | 1,608,965 | 1,653,410 | 0.4 | % | 0.5 | % | 33,063 | 81.7 | % | 0.92 | % | |||||||||||||||||||||
Randolph Bancorp, Inc. | Norfolk, MA | 702,290 | 730,106 | 763,762 | 0.8 | % | 0.9 | % | 63,448 | 116.8 | % | 1.60 | % | |||||||||||||||||||||
Western New England Bancorp, Inc. | Hampden, MA | 472,757 | 473,103 | 486,658 | 0.0 | % | 0.6 | % | 36,681 | 67.5 | % | 14.02 | % | |||||||||||||||||||||
William Penn Bancorporation | Bucks, PA | 628,165 | 639,897 | 655,104 | 0.4 | % | 0.5 | % | 53,743 | 132.8 | % | 1.26 | % | |||||||||||||||||||||
WVS Financial Corp. | Allegheny, PA | 1,229,961 | 1,229,092 | 1,249,076 | 0.0 | % | 0.3 | % | 47,223 | 116.7 | % | 0.07 | % | |||||||||||||||||||||
Averages: | 753,270 | 769,235 | 797,833 | 0.5 | % | 0.7 | % | 49,162 | 106.8 | % | 5.76 | % | ||||||||||||||||||||||
Medians: | 743,765 | 771,995 | 807,546 | 0.4 | % | 0.7 | % | 50,554 | 106.7 | % | 1.30 | % | ||||||||||||||||||||||
Everett Co-operative Bank | Middlesex, MA | 1,606,877 | 1,653,285 | 1,727,576 | 0.6 | % | 0.9 | % | 66,418 | 122.2 | % | 0.53 | % | |||||||||||||||||||||
Essex, MA | 785,239 | 813,883 | 851,330 | 0.7 | % | 0.9 | % | 52,528 | 96.7 | % | 0.30 | % | ||||||||||||||||||||||
| (1) | Projected population. |
| (2) | Total institution deposits in headquarters county as percent of total county deposits as of June 30, 2021. |
Sources: S&P Capital IQ, FDIC.
EXHIBIT IV-1
Everett Co-Operative Bank
Thrift Stock Prices: As of February 18, 2022
Exhibit IV-1A
Weekly Thrift Market Line - Part One
Prices As of February 18, 2022
| Market Capitalization | Price Change Data | Current Per Share Financials | ||||||||||||||||||||||||||||||||||||||||||||||||||||||
| Price/ | Shares | Market | 52 Week (1) | % Change From | LTM | LTM Core | BV/ | TBV/ | Assets/ | |||||||||||||||||||||||||||||||||||||||||||||||
| Share(1) | Outstanding | Capitalization | High | Low | Last Wk | Last Wk | 52 Wks (2) | MRY (2) | EPS(3) | EPS(3) | Share | Share (4) | Share | |||||||||||||||||||||||||||||||||||||||||||
| ($) | (000) | ($Mil) | ($) | ($) | ($) | (%) | (%) | (%) | ($) | ($) | ($) | ($) | ($) | |||||||||||||||||||||||||||||||||||||||||||
Financial Institutions, Fully Converted, Not Under Acquisition (49) | ||||||||||||||||||||||||||||||||||||||||||||||||||||||||
Average | 26.62 | 30,147 | 557.8 | 31.57 | 20.67 | 26.62 | 0.12 | 22.08 | -0.47 | 2.07 | 2.10 | 20.72 | 20.00 | 171.97 | ||||||||||||||||||||||||||||||||||||||||||
Median | 15.65 | 8,987 | 178.8 | 18.00 | 13.25 | 15.65 | 0.00 | 23.24 | -0.27 | 1.10 | 1.15 | 17.23 | 16.40 | 119.48 | ||||||||||||||||||||||||||||||||||||||||||
Financial Institutions, Fully Converted, Not Under Acquisition (49) | ||||||||||||||||||||||||||||||||||||||||||||||||||||||||
BCOW 1895 Bancorp of Wisconsin, Inc. | 11.64 | 6,372 | 74.2 | 11.75 | 5.83 | 11.64 | -0.09 | 100.28 | 5.92 | 0.12 | 0.12 | 14.47 | 14.47 | 84.94 | ||||||||||||||||||||||||||||||||||||||||||
AFBI Affinity Bancshares, Inc. | 15.69 | 6,873 | 107.9 | 18.00 | 11.10 | 15.69 | 3.86 | 41.63 | 1.90 | 1.10 | 1.12 | 17.42 | 14.68 | 114.94 | ||||||||||||||||||||||||||||||||||||||||||
BYFC Broadway Financial Corporation | 1.67 | 71,768 | 72.9 | 4.28 | 1.63 | 1.67 | -4.02 | -28.02 | -27.71 | -0.14 | 0.02 | 1.96 | 1.55 | 14.82 | ||||||||||||||||||||||||||||||||||||||||||
CARV Carver Bancorp, Inc. | 8.41 | 3,805 | 32.0 | 42.50 | 6.50 | 8.41 | -0.12 | -11.10 | -1.52 | -0.83 | -0.91 | 8.10 | 8.10 | 189.98 | ||||||||||||||||||||||||||||||||||||||||||
CNNB Cincinnati Bancorp, Inc. | 15.65 | 2,930 | 45.8 | 15.85 | 12.18 | 15.65 | 0.97 | 28.81 | 7.05 | 1.10 | 1.30 | 14.46 | 14.41 | 84.81 | ||||||||||||||||||||||||||||||||||||||||||
CULL Cullman Bancorp, Inc. | 11.96 | 7,406 | 88.6 | 15.49 | 8.62 | 11.96 | -1.40 | 38.68 | -2.61 | 0.34 | 0.52 | 13.35 | 13.35 | 50.31 | ||||||||||||||||||||||||||||||||||||||||||
FFBW FFBW, Inc. | 12.05 | 6,876 | 82.9 | 12.25 | 10.55 | 12.05 | 0.42 | 13.15 | 2.12 | 0.31 | NA | 13.86 | NA | 51.67 | ||||||||||||||||||||||||||||||||||||||||||
FSBW FS Bancorp, Inc. | 32.32 | 8,048 | 260.1 | 36.85 | 29.20 | 32.32 | -0.58 | 9.19 | -3.90 | 4.32 | 4.38 | 30.30 | 29.52 | 284.09 | ||||||||||||||||||||||||||||||||||||||||||
GBNY Generations Bancorp NY, Inc. | 11.98 | 2,458 | 29.5 | 13.50 | 9.42 | 11.98 | 1.96 | 27.04 | 0.55 | 0.54 | 0.45 | 17.27 | 16.63 | 153.50 | ||||||||||||||||||||||||||||||||||||||||||
HFBL Home Federal Bancorp, Inc. of Louisiana | 20.65 | 3,209 | 63.4 | 23.55 | 14.75 | 20.65 | -0.15 | 33.23 | 1.31 | 1.50 | 1.50 | 15.72 | 15.72 | 178.01 | ||||||||||||||||||||||||||||||||||||||||||
HVBC HV Bancorp, Inc. | 21.44 | 2,036 | 43.6 | 23.29 | 17.32 | 21.44 | 0.19 | 26.12 | -1.65 | 2.84 | 2.80 | 19.52 | 19.52 | 263.43 | ||||||||||||||||||||||||||||||||||||||||||
IROQ IF Bancorp, Inc. | 24.05 | 3,075 | 74.0 | 28.36 | 20.21 | 24.05 | -2.63 | 14.80 | -7.46 | 1.97 | 1.94 | 26.55 | 26.55 | 251.24 | ||||||||||||||||||||||||||||||||||||||||||
MSVB Mid-Southern Bancorp, Inc. | 15.00 | 2,840 | 42.6 | 16.30 | 14.16 | 15.00 | 0.00 | -7.80 | 0.00 | 0.49 | 0.49 | 15.32 | 15.32 | 88.81 | ||||||||||||||||||||||||||||||||||||||||||
NECB Northeast Community Bancorp, Inc. | 12.78 | 15,487 | 197.9 | 13.06 | 10.02 | 12.78 | -0.70 | 15.32 | 14.82 | 0.75 | 0.77 | 15.35 | 15.31 | 79.10 | ||||||||||||||||||||||||||||||||||||||||||
NSTS NSTS Bancorp, Inc. | 12.50 | 5,398 | 67.5 | 12.90 | 12.01 | 12.50 | 0.00 | -0.71 | -0.71 | NA | NA | NA | NA | 48.14 | ||||||||||||||||||||||||||||||||||||||||||
PBBK PB Bankshares, Inc. | 14.00 | 2,777 | 38.9 | 15.54 | 12.50 | 14.00 | -2.78 | 40.00 | 3.02 | NA | NA | 16.40 | 16.40 | 112.52 | ||||||||||||||||||||||||||||||||||||||||||
PCSB PCSB Financial Corporation | 18.82 | 15,335 | 288.6 | 20.75 | 15.60 | 18.82 | -0.21 | 17.85 | -1.16 | 1.03 | 1.00 | 17.92 | 17.51 | 123.13 | ||||||||||||||||||||||||||||||||||||||||||
PVBC Provident Bancorp, Inc. | 17.00 | 17,479 | 297.1 | 20.14 | 12.20 | 17.00 | 0.00 | 37.88 | -8.60 | 0.93 | 0.94 | 13.09 | 13.09 | 98.94 | ||||||||||||||||||||||||||||||||||||||||||
SBT Sterling Bancorp, Inc. (Southfield, MI) | 6.11 | 50,461 | 308.3 | 6.32 | 4.33 | 6.11 | 2.35 | 27.29 | 6.26 | 0.40 | NA | 6.75 | 6.75 | 56.95 | ||||||||||||||||||||||||||||||||||||||||||
TCBC TC Bancshares, Inc. | 13.75 | 4,898 | 67.4 | 14.15 | 11.80 | 13.75 | -0.79 | 37.50 | 3.00 | NA | NA | 17.38 | 17.38 | 78.94 | ||||||||||||||||||||||||||||||||||||||||||
TCBS Texas Community Bancshares, Inc. | 17.75 | 3,004 | 53.3 | 20.07 | 14.41 | 17.75 | 1.40 | 77.45 | 14.48 | NA | NA | 20.17 | 19.98 | 119.48 | ||||||||||||||||||||||||||||||||||||||||||
WMPN William Penn Bancorporation | 12.51 | 14,289 | 178.8 | 12.88 | 11.15 | 12.51 | -1.96 | 11.32 | 3.56 | 0.28 | 0.29 | 14.10 | 13.72 | 58.36 | ||||||||||||||||||||||||||||||||||||||||||
FNWB First Northwest Bancorp | 22.96 | 9,047 | 207.7 | 23.60 | 15.78 | 22.96 | 3.10 | 45.32 | 13.66 | 1.66 | 1.50 | 19.15 | 19.03 | 212.35 | ||||||||||||||||||||||||||||||||||||||||||
HIFS Hingham Institution for Savings | 365.70 | 2,142 | 783.5 | 432.19 | 241.02 | 365.70 | 1.01 | 51.54 | -12.90 | 30.65 | 25.57 | 165.52 | 165.52 | 1601.55 | ||||||||||||||||||||||||||||||||||||||||||
HMNF HMN Financial, Inc. | 25.26 | 4,382 | 110.7 | 25.98 | 19.32 | 25.26 | -2.09 | 31.02 | 2.39 | 3.01 | NA | 24.11 | 23.93 | 244.07 | ||||||||||||||||||||||||||||||||||||||||||
MGYR Magyar Bancorp, Inc. | 12.05 | 7,098 | 85.5 | 12.49 | 8.68 | 12.05 | -1.55 | 38.84 | -1.83 | 0.93 | 0.90 | 13.87 | 13.87 | 109.98 | ||||||||||||||||||||||||||||||||||||||||||
PDLB Ponce Financial Group, Inc. | 10.64 | 24,712 | 262.9 | 11.29 | 7.15 | 10.64 | 0.38 | 48.75 | 2.38 | 0.52 | NA | 7.19 | 7.19 | 63.15 | ||||||||||||||||||||||||||||||||||||||||||
PBIP Prudential Bancorp, Inc. | 14.87 | 7,769 | 115.5 | 15.95 | 13.25 | 14.87 | 3.99 | 11.72 | 9.50 | 0.98 | 0.83 | 17.19 | 16.38 | 139.54 | ||||||||||||||||||||||||||||||||||||||||||
RNDB Randolph Bancorp, Inc. | 22.44 | 4,752 | 106.6 | 27.40 | 19.20 | 22.44 | 0.85 | 11.64 | -6.50 | 1.88 | 1.92 | 19.73 | 19.73 | 169.03 | ||||||||||||||||||||||||||||||||||||||||||
TSBK Timberland Bancorp, Inc. | 27.57 | 8,350 | 230.2 | 30.75 | 26.18 | 27.57 | 0.80 | 2.11 | -0.47 | 3.05 | 3.08 | 25.20 | 23.24 | 219.31 | ||||||||||||||||||||||||||||||||||||||||||
WVFC WVS Financial Corp. | 15.19 | 1,732 | 26.3 | 16.79 | 14.87 | 15.19 | -0.33 | 2.15 | -0.07 | 0.65 | 0.59 | 20.29 | 20.29 | 205.32 | ||||||||||||||||||||||||||||||||||||||||||
BLFY Blue Foundry Bancorp | 14.33 | 26,282 | 376.6 | 15.47 | 12.32 | 14.33 | -1.17 | 43.30 | -2.05 | -2.99 | -1.53 | 15.06 | NA | 72.83 | ||||||||||||||||||||||||||||||||||||||||||
CFFN Capitol Federal Financial, Inc. | 11.14 | 135,674 | 1,511.4 | 14.38 | 10.67 | 11.14 | 1.74 | -13.58 | -1.68 | 0.58 | 0.57 | 8.76 | 8.67 | 70.83 | ||||||||||||||||||||||||||||||||||||||||||
ESSA ESSA Bancorp, Inc. | 18.05 | 9,799 | 176.9 | 18.30 | 14.79 | 18.05 | 1.35 | 17.59 | 4.15 | 1.71 | 1.69 | 19.79 | 18.43 | 190.67 | ||||||||||||||||||||||||||||||||||||||||||
HONE HarborOne Bancorp, Inc. | 14.80 | 49,799 | 737.0 | 15.49 | 11.34 | 14.80 | 2.35 | 27.75 | -0.27 | 1.14 | 1.18 | 12.97 | 11.57 | 91.44 | ||||||||||||||||||||||||||||||||||||||||||
KRNY Kearny Financial Corp. | 13.19 | 70,094 | 924.5 | 13.89 | 10.72 | 13.19 | -0.98 | 23.27 | -0.45 | 0.96 | 0.99 | 13.55 | NA | 102.52 | ||||||||||||||||||||||||||||||||||||||||||
NFBK Northfield Bancorp, Inc. (Staten Island, NY) | 15.72 | 49,267 | 774.5 | 18.41 | 13.27 | 15.72 | 1.62 | 18.28 | -2.72 | 1.45 | 1.43 | 15.02 | 14.18 | 110.23 | ||||||||||||||||||||||||||||||||||||||||||
PROV Provident Financial Holdings, Inc. | 16.75 | 7,370 | 123.4 | 18.48 | 14.50 | 16.75 | -1.41 | 6.28 | 1.33 | 1.30 | 0.92 | 17.31 | 17.31 | 160.44 | ||||||||||||||||||||||||||||||||||||||||||
RVSB Riverview Bancorp, Inc. | 7.80 | 22,177 | 173.0 | 8.22 | 5.64 | 7.80 | 0.65 | 36.84 | 1.43 | 0.95 | 0.90 | 7.36 | 6.11 | 75.89 | ||||||||||||||||||||||||||||||||||||||||||
TBNK Territorial Bancorp Inc. | 25.03 | 8,987 | 225.0 | 30.04 | 24.03 | 25.03 | 0.04 | 4.03 | -0.87 | 1.91 | 1.75 | 27.44 | 27.44 | 237.07 | ||||||||||||||||||||||||||||||||||||||||||
TCBX Third Coast Bancshares, Inc. | 23.52 | 13,354 | 314.1 | 30.50 | 23.11 | 23.52 | -0.63 | -5.96 | -9.47 | 1.40 | NA | 22.39 | 20.94 | 187.17 | ||||||||||||||||||||||||||||||||||||||||||
TBK Triumph Bancorp, Inc. | 94.94 | 24,803 | 2,354.8 | 136.02 | 69.02 | 94.94 | 3.25 | 36.55 | -20.27 | 4.35 | 4.65 | 32.35 | 21.34 | 240.15 | ||||||||||||||||||||||||||||||||||||||||||
TRST TrustCo Bank Corp NY | 34.28 | 19,220 | 658.9 | 41.47 | 29.78 | 34.28 | 0.56 | 2.48 | 2.91 | 3.19 | 3.19 | 31.28 | 31.25 | 322.40 | ||||||||||||||||||||||||||||||||||||||||||
WSBF Waterstone Financial, Inc. | 19.52 | 23,664 | 462.5 | 22.74 | 18.80 | 19.52 | -2.89 | -1.21 | -10.70 | 2.96 | 2.96 | 17.45 | 17.43 | 93.64 | ||||||||||||||||||||||||||||||||||||||||||
WNEB Western New England Bancorp, Inc. | 9.35 | 22,657 | 211.8 | 9.98 | 7.48 | 9.35 | 1.85 | 24.17 | 6.74 | 1.02 | 1.01 | 9.87 | 9.21 | 112.04 | ||||||||||||||||||||||||||||||||||||||||||
WSFS WSFS Financial Corporation | 52.25 | 65,520 | 3,423.4 | 56.30 | 42.58 | 52.25 | -0.61 | 18.11 | 4.25 | 5.69 | 5.57 | 40.73 | 29.24 | 240.80 | ||||||||||||||||||||||||||||||||||||||||||
AX Axos Financial, Inc. | 54.12 | 59,502 | 3,220.2 | 62.44 | 43.74 | 54.12 | -1.64 | 24.16 | -3.20 | 3.78 | 3.98 | 25.60 | 22.88 | 261.30 | ||||||||||||||||||||||||||||||||||||||||||
NYCB New York Community Bancorp, Inc. | 11.58 | 465,016 | 5,384.9 | 14.33 | 10.78 | 11.58 | -0.17 | 3.67 | -5.16 | 1.20 | 1.24 | 14.07 | 8.85 | 128.01 | ||||||||||||||||||||||||||||||||||||||||||
PFS Provident Financial Services, Inc. | 23.76 | 77,226 | 1,834.9 | 26.20 | 19.38 | 23.76 | 0.00 | 23.24 | -1.90 | 2.19 | 2.19 | 22.05 | 16.02 | 178.45 | ||||||||||||||||||||||||||||||||||||||||||
| (1) | Average of High/Low or Bid/Ask price per share. |
| (2) | Or since offering price if converted of first listed in the past 52 weeks. Percent change figures are actual year-to-date and are not annualized. |
| (3) | EPS (earnings per share) is based on actual trailing 12 month data and is not shown on a pro forma basis. |
| (4) | Excludes intangibles (such as goodwill, value of core deposits, etc.). |
| (5) | ROA (return on assets) and ROE (return on equity) are indicated ratios based on trailing 12 month common earnings and average common equity and total assets balances. |
| (6) | Annualized based on last regular quarterly cash dividend announcement. |
| (7) | Indicated dividend as a percent of trailing 12 month earnings. |
| (8) | Excluded from averages due to actual or rumored acquisition activities or unusual operating characteristics. |
| (9) | For MHC institutions, market value reflects share price multiplied by public (non-MHC) shares. |
Source: S&P Market Intelligence, LC. and RP® Financial, LC. calculations. The information provided in this table has been obtained from sources we believe are reliable, but we cannot guarantee the accuracy or completeness of such information. Copyright (c) 2022 by RP® Financial, LC.
Exhibit IV-1B
Weekly Thrift Market Line - Part
Two Prices As of February 18, 2022
| Key Financial Ratios | Asset Quality Ratios | Pricing Ratios | Dividend Data (6) | |||||||||||||||||||||||||||||||||||||||||||||||||||||||||||||
| Equity/ | Tg. Equity/ | Reported Earnings | Core Earnings | NPAs/ | Rsvs/ | Price/ | Price/ | Price/ | Price/ | Price/Core | Div/ | Dividend | Payout | |||||||||||||||||||||||||||||||||||||||||||||||||||
| Assets | Assets | ROA(5) | ROE(5) | ROA(5) | ROE(5) | Assets | NPLs | Earnings | Book | Assets | Tang Book | Earnings | Share | Yield | Ratio (7) | |||||||||||||||||||||||||||||||||||||||||||||||||
| (%) | (%) | (%) | (%) | (%) | (%) | (%) | (%) | (x) | (%) | (%) | (%) | (x) | ($) | (%) | (%) | |||||||||||||||||||||||||||||||||||||||||||||||||
Financial Institutions, Fully Converted, Not Under Acquisition (49) |
| |||||||||||||||||||||||||||||||||||||||||||||||||||||||||||||||
Average | 13.95 | 12.87 | 0.93 | 7.33 | 0.98 | 7.59 | 0.63 | 166.19 | 14.46 | 109.03 | 14.60 | 119.49 | 14.49 | 0.46 | 2.11 | 39.86 | ||||||||||||||||||||||||||||||||||||||||||||||||
Median | 12.32 | 11.24 | 0.93 | 7.23 | 0.96 | 7.23 | 0.59 | 113.55 | 13.10 | 100.86 | 13.38 | 107.72 | 13.46 | 0.35 | 1.91 | 28.57 | ||||||||||||||||||||||||||||||||||||||||||||||||
Financial Institutions, Fully Converted, Not Under Acquisition (49) |
| |||||||||||||||||||||||||||||||||||||||||||||||||||||||||||||||
BCOW 1895 Bancorp of Wisconsin, Inc. | 17.04 | 17.04 | 0.15 | 1.37 | 0.15 | 1.36 | NA | 160.78 | NM | 80.46 | 13.71 | 80.46 | NM | NA | NA | NM | ||||||||||||||||||||||||||||||||||||||||||||||||
AFBI Affinity Bancshares, Inc. | 15.15 | 13.08 | 0.95 | 7.26 | 0.97 | 7.40 | NA | NA | 14.27 | 90.10 | 13.65 | 106.88 | 13.99 | NA | NA | NM | ||||||||||||||||||||||||||||||||||||||||||||||||
BYFC Broadway Financial Corporation | 13.48 | 11.05 | -0.41 | -3.26 | 0.10 | 0.92 | 0.38 | 91.32 | NM | 85.41 | 11.30 | 107.72 | NM | 0.00 | 0.00 | NM | ||||||||||||||||||||||||||||||||||||||||||||||||
CARV Carver Bancorp, Inc. | 7.98 | 7.98 | -0.28 | -3.67 | -0.32 | -4.16 | 1.84 | 41.36 | NM 103.80 | 4.58 | 103.80 | NM | 0.00 | 0.00 | NM | |||||||||||||||||||||||||||||||||||||||||||||||||
CNNB Cincinnati Bancorp, Inc. | 17.08 | 17.03 | 1.26 | 8.31 | 1.51 | 10.02 | 0.45 | 148.45 | 14.23 | 108.21 | 18.48 | 108.61 | 12.00 | NA | NA | NM | ||||||||||||||||||||||||||||||||||||||||||||||||
CULL Cullman Bancorp, Inc. | 26.53 | 26.53 | 0.65 | 3.30 | 0.99 | 5.07 | NA | NA | 34.73 | 89.61 | 23.77 | 89.61 | 23.12 | 0.12 | 1.00 | 34.84 | ||||||||||||||||||||||||||||||||||||||||||||||||
FFBW FFBW, Inc. | 26.97 | NA | 0.62 | 2.18 | NA | NA | 0.19 | 362.63 | NM | 86.96 | 23.46 | NA | NA | NA | NA | NM | ||||||||||||||||||||||||||||||||||||||||||||||||
FSBW FS Bancorp, Inc. | 10.83 | 10.58 | 1.71 | 15.74 | 1.73 | 15.97 | NA | NA | 7.48 | 106.68 | 11.55 | 109.50 | 7.37 | 0.80 | 2.48 | 14.47 | ||||||||||||||||||||||||||||||||||||||||||||||||
GBNY Generations Bancorp NY, Inc. | 11.25 | 10.88 | 0.35 | 3.60 | 0.28 | 2.93 | 1.73 | 31.95 | 22.19 | 69.35 | 7.80 | 72.05 | 26.85 | NA | NA | NM | ||||||||||||||||||||||||||||||||||||||||||||||||
HFBL Home Federal Bancorp, Inc. of Louisiana | 9.35 | 9.35 | 0.94 | 9.99 | 0.94 | 9.99 | 0.24 | 418.40 | 13.77 | 131.40 | 12.28 | 131.40 | 13.77 | 0.40 | 1.94 | 25.50 | ||||||||||||||||||||||||||||||||||||||||||||||||
HVBC HV Bancorp, Inc. | 7.92 | 7.92 | 0.93 | 14.73 | 0.92 | 14.53 | 0.77 | 59.24 | 7.55 | 109.83 | 8.70 | 109.83 | 7.65 | NA | NA | NM | ||||||||||||||||||||||||||||||||||||||||||||||||
IROQ IF Bancorp, Inc. | 11.20 | 11.20 | 0.81 | 7.20 | 0.79 | 7.09 | 0.17 | 562.94 | 12.21 | 90.59 | 10.14 | 90.59 | 12.39 | 0.35 | 1.46 | 17.77 | ||||||||||||||||||||||||||||||||||||||||||||||||
MSVB Mid-Southern Bancorp, Inc. | 18.32 | 18.32 | 0.59 | 2.96 | 0.59 | 2.96 | 0.61 | 114.02 | 30.61 | 97.93 | 17.94 | 97.93 | 30.61 | 0.16 | 1.07 | 28.57 | ||||||||||||||||||||||||||||||||||||||||||||||||
NECB Northeast Community Bancorp, Inc. | 20.52 | 20.48 | 1.13 | 6.03 | 1.16 | 6.18 | NA | NA | 17.04 | 83.26 | 17.09 | 83.48 | 16.61 | 0.24 | 1.88 | 26.99 | ||||||||||||||||||||||||||||||||||||||||||||||||
NSTS NSTS Bancorp, Inc. | 17.68 | 17.68 | NA | NA | NA | NA | NA | NA | NA | NA | NA | NA | NA | NA | NA | NA | ||||||||||||||||||||||||||||||||||||||||||||||||
PBBK PB Bankshares, Inc. | 14.57 | 14.57 | NA | -0.03 | NA | 1.07 | 0.73 | 135.49 | NA | 85.39 | 12.44 | 85.39 | NA | NA | NA | NA | ||||||||||||||||||||||||||||||||||||||||||||||||
PCSB PCSB Financial Corporation | 14.56 | 14.27 | 0.80 | 5.45 | 0.78 | 5.27 | 0.39 | 113.55 | 18.27 | 105.03 | 15.29 | 107.47 | 18.87 | 0.24 | 1.28 | 23.30 | ||||||||||||||||||||||||||||||||||||||||||||||||
PVBC Provident Bancorp, Inc. | 13.52 | 13.52 | 1.02 | 6.86 | 1.03 | 6.93 | NA | NA | 18.28 | 129.83 | 17.55 | 129.83 | 18.08 | 0.16 | 0.94 | 17.20 | ||||||||||||||||||||||||||||||||||||||||||||||||
SBT Sterling Bancorp, Inc. (Southfield, MI) | 11.84 | 11.84 | 0.59 | 6.08 | NA | NA | NA | NA | 15.28 | 90.58 | 10.73 | 90.58 | NA | 0.00 | 0.00 | NM | ||||||||||||||||||||||||||||||||||||||||||||||||
TCBC TC Bancshares, Inc. | 22.02 | 22.02 | NA | 3.56 | NA | 5.52 | NA | NA | NA | 79.09 | 17.42 | 79.09 | NA | NA | NA | NA | ||||||||||||||||||||||||||||||||||||||||||||||||
TCBS Texas Community Bancshares, Inc. | 16.88 | 16.75 | NA | 0.57 | NA | 1.87 | 0.59 | 83.39 | NA | 88.00 | 14.85 | 88.82 | NA | NA | NA | NA | ||||||||||||||||||||||||||||||||||||||||||||||||
WMPN William Penn Bancorporation | 25.65 | 25.14 | 0.50 | 2.18 | 0.51 | 2.22 | 0.70 | 61.50 | NM | 88.73 | 22.76 | 91.16 | NM | 0.03 | 0.24 | 117.86 | ||||||||||||||||||||||||||||||||||||||||||||||||
FNWB First Northwest Bancorp | 9.92 | 9.86 | 0.85 | 7.96 | 0.77 | 7.21 | NA | NA | 13.83 | 119.91 | 11.92 | 120.65 | 15.28 | 0.28 | 1.22 | 15.66 | ||||||||||||||||||||||||||||||||||||||||||||||||
HIFS Hingham Institution for Savings | 10.34 | 10.34 | 2.25 | 20.62 | 1.88 | 17.20 | NA | NA | 11.93 | 220.94 | 22.83 | 220.94 | 14.30 | 2.20 | 0.60 | 9.23 | ||||||||||||||||||||||||||||||||||||||||||||||||
HMNF HMN Financial, Inc. | 10.29 | 10.22 | 1.38 | 12.62 | NA | NA | NA | NA | 8.39 | 104.79 | 10.78 | 105.57 | NA | 0.24 | 0.95 | 1.99 | ||||||||||||||||||||||||||||||||||||||||||||||||
MGYR Magyar Bancorp, Inc. | 12.61 | 12.61 | 0.83 | 8.25 | 0.80 | 7.93 | NA | NA | 12.95 | 86.88 | 10.96 | 86.88 | 13.46 | 0.12 | 1.00 | 16.12 | ||||||||||||||||||||||||||||||||||||||||||||||||
PDLB Ponce Financial Group, Inc. | 11.14 | 11.14 | 0.84 | 7.20 | NA | NA | NA | 97.37 | 20.62 | 147.96 | 16.49 | 147.96 | NA | NA | NA | NM | ||||||||||||||||||||||||||||||||||||||||||||||||
PBIP Prudential Bancorp, Inc. | 12.32 | 11.81 | 0.69 | 5.93 | 0.58 | 5.02 | 1.21 | 93.59 | 15.17 | 86.48 | 10.66 | 90.78 | 17.91 | 0.28 | 1.88 | 28.57 | ||||||||||||||||||||||||||||||||||||||||||||||||
RNDB Randolph Bancorp, Inc. | 12.56 | 12.56 | 1.29 | 9.31 | 1.32 | 9.51 | NA | NA | 11.94 | 113.73 | 14.29 | 113.75 | 11.68 | 0.60 | 2.67 | 122.34 | ||||||||||||||||||||||||||||||||||||||||||||||||
TSBK Timberland Bancorp, Inc. | 11.49 | 10.69 | 1.48 | 12.77 | 1.50 | 12.90 | 0.30 | 258.30 | 9.04 | 109.41 | 12.57 | 118.61 | 8.95 | 0.88 | 3.19 | 31.15 | ||||||||||||||||||||||||||||||||||||||||||||||||
WVFC WVS Financial Corp. | 10.75 | 10.75 | 0.33 | 2.92 | 0.30 | 2.64 | 0.00 | NM | 23.37 | 74.88 | 8.05 | 74.88 | 25.87 | 0.40 | 2.63 | 61.54 | ||||||||||||||||||||||||||||||||||||||||||||||||
BLFY Blue Foundry Bancorp | 22.44 | NA | -1.79 | -11.55 | -0.91 | -5.92 | NA | NA | NM | 95.17 | 21.35 | 91.26 | NM | NA | NA | NM | ||||||||||||||||||||||||||||||||||||||||||||||||
CFFN Capitol Federal Financial, Inc. | 12.66 | 12.54 | 0.82 | 6.29 | 0.81 | 6.22 | NA | NA | 19.21 | 127.13 | 16.10 | 128.49 | 19.43 | 0.34 | 3.05 | 165.52 | ||||||||||||||||||||||||||||||||||||||||||||||||
ESSA ESSA Bancorp, Inc. | 11.11 | 10.43 | 0.90 | 8.40 | 0.89 | 8.32 | 1.02 | 96.23 | 10.56 | 91.19 | 10.13 | 97.92 | 10.65 | 0.48 | 2.66 | 28.07 | ||||||||||||||||||||||||||||||||||||||||||||||||
HONE HarborOne Bancorp, Inc. | 14.92 | 13.53 | 1.29 | 8.45 | 1.32 | 8.71 | NA | NA | 12.98 | 114.15 | 17.03 | 127.89 | 12.59 | 0.20 | 1.35 | 17.54 | ||||||||||||||||||||||||||||||||||||||||||||||||
KRNY Kearny Financial Corp. | 13.85 | NA | 1.01 | 7.04 | 1.04 | 7.23 | 1.13 | 59.66 | 13.74 | 97.33 | 13.48 | 125.00 | 13.36 | 0.44 | 3.34 | 43.75 | ||||||||||||||||||||||||||||||||||||||||||||||||
NFBK Northfield Bancorp, Inc. (Staten Island, NY) | 13.62 | 12.96 | 1.29 | 9.42 | 1.27 | 9.28 | 0.25 | 289.93 | 10.84 | 104.68 | 14.26 | 110.89 | 11.00 | 0.52 | 3.31 | 35.86 | ||||||||||||||||||||||||||||||||||||||||||||||||
PROV Provident Financial Holdings, Inc. | 10.82 | 10.82 | 0.83 | 7.79 | 0.58 | 5.51 | 0.73 | 77.05 | 12.88 | 96.75 | 10.47 | 96.75 | 18.18 | 0.56 | 3.34 | 43.08 | ||||||||||||||||||||||||||||||||||||||||||||||||
RVSB Riverview Bancorp, Inc. | 9.69 | 8.19 | 1.31 | 13.38 | 1.24 | 12.70 | 0.05 | NM | 8.21 | 106.03 | 10.28 | 127.62 | 8.66 | 0.22 | 2.82 | 22.11 | ||||||||||||||||||||||||||||||||||||||||||||||||
TBNK Territorial Bancorp Inc. | 12.03 | 12.03 | 0.82 | 6.89 | 0.75 | 6.32 | NA | NA | 13.10 | 91.23 | 10.97 | 91.23 | 14.30 | 0.92 | 3.68 | 53.40 | ||||||||||||||||||||||||||||||||||||||||||||||||
TCBX Third Coast Bancshares, Inc. | 11.96 | 11.28 | 0.55 | 6.70 | NA | NA | 0.68 | 125.91 | 16.80 | 105.04 | 12.57 | 112.30 | NA | NA | NA | NM | ||||||||||||||||||||||||||||||||||||||||||||||||
TBK Triumph Bancorp, Inc. | 14.42 | 10.25 | 1.87 | 14.10 | 2.00 | 15.04 | 0.31 | 267.19 | 21.83 | 293.49 | 40.41 | 444.79 | 20.43 | NA | NA | NM | ||||||||||||||||||||||||||||||||||||||||||||||||
TRST TrustCo Bank Corp NY | 9.70 | 9.69 | 1.01 | 10.61 | 1.01 | 10.61 | NA | NA | 10.73 | 109.60 | 10.63 | 109.71 | 10.73 | 1.40 | 4.08 | 43.25 | ||||||||||||||||||||||||||||||||||||||||||||||||
WSBF Waterstone Financial, Inc. | 19.53 | 19.51 | 3.20 | 16.26 | 3.20 | 16.26 | NA | NA | 6.59 | 111.84 | 21.84 | 112.00 | 6.59 | 0.80 | 4.10 | 60.81 | ||||||||||||||||||||||||||||||||||||||||||||||||
WNEB Western New England Bancorp, Inc. | 8.81 | 8.27 | 0.96 | 10.64 | 0.94 | 10.49 | NA | NA | 9.17 | 94.70 | 8.35 | 101.53 | 9.30 | 0.24 | 2.57 | 20.59 | ||||||||||||||||||||||||||||||||||||||||||||||||
WSFS WSFS Financial Corporation | 12.28 | 9.13 | 1.82 | 14.71 | 1.79 | 14.39 | 0.21 | 308.31 | 9.18 | 128.28 | 15.76 | 178.72 | 9.37 | 0.52 | 1.00 | 9.14 | ||||||||||||||||||||||||||||||||||||||||||||||||
AX Axos Financial, Inc. | 9.80 | 8.85 | 1.57 | 16.05 | 1.62 | 16.63 | 0.94 | 96.27 | 14.32 | 211.41 | 20.71 | 236.56 | 13.60 | NA | NA | NM | ||||||||||||||||||||||||||||||||||||||||||||||||
NYCB New York Community Bancorp, Inc. | 11.83 | 8.09 | 1.04 | 8.60 | 1.07 | 8.86 | NA | NA | 9.65 | 82.33 | 9.12 | 130.86 | 9.35 | 0.68 | 5.87 | 56.67 | ||||||||||||||||||||||||||||||||||||||||||||||||
PFS Provident Financial Services, Inc. | 12.31 | 9.26 | 1.26 | 10.03 | 1.26 | 10.02 | NA | NA | 10.85 | 107.76 | 13.27 | 148.33 | 10.86 | 0.96 | 4.04 | 42.92 | ||||||||||||||||||||||||||||||||||||||||||||||||
| (1) | Average of High/Low or Bid/Ask price per share. |
| (2) | Or since offering price if converted of first listed in the past 52 weeks. Percent change figures are actual year-to-date and are not annualized. |
| (3) | EPS (earnings per share) is based on actual trailing 12 month data and is not shown on a pro forma basis. |
| (4) | Exludes intangibles (such as goodwill, value of core deposits, etc.). |
| (5) | ROA (return on assets) and ROE (return on equity) are indicated ratios based on trailing 12 month common earnings and average common equity and total assets balances. |
| (6) | Annualized based on last regular quarterly cash dividend announcement. |
| (7) | Indicated dividend as a percent of trailing 12 month earnings. |
| (8) | For MHC institutions, market value reflects share price multiplied by public (non-MHC) shares. |
| (9) | Excluded from averages due to actual or rumored acquisition activities or unusual operating characteristics. |
Source: S&P Market Intelligence, LC. and RP® Financial, LC. calculations. The information provided in this table has been obtained from sources we believe are reliable, but we cannot guarantee the accuracy or completeness of such information. Copyright (c) 2022 by RP® Financial, LC.
EXHIBIT IV-2
Everett Co-Operative Bank
Historical Stock Price Indices
Exhibit IV-2
Historical Stock Price Indices(1)
Year/Qtr. Ended | DJIA | S&P 500 | NASDAQ Composite | |||||||||||
2008: | Quarter 1 | 12262.9 | 1322.7 | 2279.1 | ||||||||||
| Quarter 2 | 11350.0 | 1280.0 | 2292.98 | |||||||||||
| Quarter 3 | 10850.7 | 1166.4 | 2082.3 | |||||||||||
| Quarter 4 | 8776.4 | 903.3 | 1577.03 | |||||||||||
2009: | Quarter 1 | 7608.9 | 797.9 | 1528.59 | ||||||||||
| Quarter 2 | 8447.0 | 919.3 | 1835.04 | |||||||||||
| Quarter 3 | 9712.3 | 1057.1 | 2122.42 | |||||||||||
| Quarter 4 | 10428.1 | 1115.1 | 2269.15 | |||||||||||
2010: | Quarter 1 | 10856.6 | 1169.4 | 2397.96 | ||||||||||
| Quarter 2 | 9744.0 | 1030.7 | 2109.24 | |||||||||||
| Quarter 3 | 9744.0 | 1030.7 | 2109.24 | |||||||||||
| Quarter 4 | 11577.5 | 1257.6 | 2652.87 | |||||||||||
2011: | Quarter 1 | 12319.7 | 1325.8 | 2781.07 | ||||||||||
| Quarter 2 | 12414.3 | 1320.6 | 2773.52 | |||||||||||
| Quarter 3 | 10913.4 | 1131.4 | 2415.4 | |||||||||||
| Quarter 4 | 12217.6 | 1257.6 | 2605.2 | |||||||||||
2012: | Quarter 1 | 13212.0 | 1408.5 | 3091.6 | ||||||||||
| Quarter 2 | 12880.1 | 1362.2 | 2935.1 | |||||||||||
| Quarter 3 | 13437.1 | 1440.7 | 3116.2 | |||||||||||
| Quarter 4 | 13104.1 | 1426.2 | 3019.5 | |||||||||||
2013: | Quarter 1 | 14578.5 | 1569.2 | 3267.5 | ||||||||||
| Quarter 2 | 14909.6 | 1606.3 | 3404.3 | |||||||||||
| Quarter 3 | 15129.7 | 1681.6 | 3771.5 | |||||||||||
| Quarter 4 | 16576.7 | 1848.4 | 4176.6 | |||||||||||
2014: | Quarter 1 | 16457.7 | 1872.3 | 4199.0 | ||||||||||
| Quarter 2 | 16826.6 | 1960.2 | 4408.2 | |||||||||||
| Quarter 3 | 17042.9 | 1972.3 | 4493.4 | |||||||||||
| Quarter 4 | 17823.1 | 2058.9 | 4736.1 | |||||||||||
2015: | Quarter 1 | 17776.1 | 2067.9 | 4900.9 | ||||||||||
| Quarter 2 | 17619.5 | 2063.1 | 4986.9 | |||||||||||
| Quarter 3 | 16284.7 | 1920.0 | 4620.2 | |||||||||||
| Quarter 4 | 17425.0 | 2043.9 | 5007.4 | |||||||||||
2016: | Quarter 1 | 17685.1 | 2059.7 | 4869.9 | ||||||||||
| Quarter 2 | 17930.0 | 2098.9 | 4842.7 | |||||||||||
| Quarter 3 | 18308.2 | 2168.3 | 5312.0 | |||||||||||
| Quarter 4 | 19762.6 | 2238.8 | 5383.1 | |||||||||||
2017: | Quarter 1 | 20663.2 | 2362.7 | 5911.7 | ||||||||||
| Quarter 2 | 21349.6 | 2423.4 | 6140.4 | |||||||||||
| Quarter 3 | 22405.1 | 2519.4 | 6496.0 | |||||||||||
| Quarter 4 | 24719.2 | 2673.6 | 6903.4 | |||||||||||
2018: | Quarter 1 | 24103.1 | 2640.9 | 7063.5 | ||||||||||
| Quarter 2 | 24271.4 | 2718.4 | 7510.3 | |||||||||||
| Quarter 3 | 26458.3 | 2914.0 | 8046.4 | |||||||||||
| Quarter 4 | 23327.5 | 2506.9 | 6635.3 | |||||||||||
2019: | Quarter 1 | 25928.7 | 2834.4 | 7729.3 | ||||||||||
| Quarter 2 | 26600.0 | 2941.8 | 8006.2 | |||||||||||
| Quarter 3 | 26916.8 | 2976.7 | 7999.3 | |||||||||||
| Quarter 4 | 28538.4 | 3230.8 | 8972.6 | |||||||||||
2020: | Quarter 1 | 21917.2 | 2584.6 | 7700.1 | ||||||||||
| Quarter 2 | 25812.9 | 3100.3 | 10058.8 | |||||||||||
| Quarter 3 | 27781.7 | 3363.0 | 11167.5 | |||||||||||
| Quarter 4 | 30606.5 | 3756.1 | 12888.3 | |||||||||||
2021: | Quarter 1 | 32981.6 | 3972.9 | 13246.9 | ||||||||||
| Quarter 2 | 34502.5 | 4297.5 | 14504.0 | |||||||||||
| Quarter 3 | 33842.9 | 4307.5 | 14448.6 | |||||||||||
| Quarter 4 | 36338.3 | 4766.2 | 15645.0 | |||||||||||
As of February 18, 2022 | 34079.2 | 4348.9 | 13548.1 | |||||||||||
| (1) | End of period data. |
Sources: S&P Global Market Intelligence and The Wall Street Journal.
EXHIBIT IV-3
Everett Co-Operative Bank
Historical Stock Indices
Index Summary (Change (%))
Industry Banking
Geography United States and Canada
| Change (%) | ||||||||||||||||||||||||||||||||||||
Index Name | Current Value | As Of | 1 Day | 1 Week | MTD | QTD | YTD | 1 Year | 3 Years | |||||||||||||||||||||||||||
Banking Indexes | ||||||||||||||||||||||||||||||||||||
S&P U.S. BMI Banks | 186.59 | 2/25/2022 | 3.49 | (1.21) | 0.21 | 1.38 | 1.38 | 12.62 | 31.01 | |||||||||||||||||||||||||||
KBW Nasdaq Bank Index | 135.94 | 2/25/2022 | 4.00 | (0.91) | 0.71 | 2.81 | 2.81 | 16.62 | 35.64 | |||||||||||||||||||||||||||
KBW Nasdaq Regional Bank Index | 131.61 | 2/25/2022 | 4.37 | 0.11 | 2.25 | 4.45 | 4.45 | 10.69 | 22.62 | |||||||||||||||||||||||||||
S&P 500 Bank | 423.16 | 2/25/2022 | 3.36 | (1.57) | (0.25) | 1.18 | 1.18 | 12.45 | 32.76 | |||||||||||||||||||||||||||
NASDAQ Bank | 5,078.61 | 2/25/2022 | 4.42 | 0.33 | 2.73 | 2.50 | 2.50 | 16.09 | 31.48 | |||||||||||||||||||||||||||
S&P 500 Commercial Banks | 604.55 | 2/25/2022 | 3.36 | (1.57) | (0.25) | 1.18 | 1.18 | 12.45 | 32.76 | |||||||||||||||||||||||||||
S&P 500 Diversified Banks | 700.76 | 2/25/2022 | 2.72 | (2.41) | (1.35) | 0.20 | 0.20 | 11.28 | 28.97 | |||||||||||||||||||||||||||
S&P 500 Regional Banks | 162.43 | 2/25/2022 | 5.11 | 0.77 | 2.83 | 3.93 | 3.93 | 15.38 | 44.06 | |||||||||||||||||||||||||||
Market Cap Indexes | ||||||||||||||||||||||||||||||||||||
Dow Jones U.S. MicroCap Banks | 32,278.24 | 2/25/2022 | 2.13 | (0.20) | 0.19 | 0.46 | 0.46 | 25.41 | 26.84 | |||||||||||||||||||||||||||
S&P U.S. SmallCap Banks | 277.36 | 2/25/2022 | 4.19 | 0.30 | 2.57 | 3.03 | 3.03 | 14.74 | 25.93 | |||||||||||||||||||||||||||
S&P U.S. MidCap Banks | 940.30 | 2/25/2022 | 4.93 | 0.35 | 4.25 | 1.96 | 1.96 | 15.17 | 45.02 | |||||||||||||||||||||||||||
S&P U.S. LargeCap Banks | 463.81 | 2/25/2022 | 3.00 | (2.01) | (1.27) | 0.68 | 0.68 | 11.35 | 30.25 | |||||||||||||||||||||||||||
Geographic Indexes | ||||||||||||||||||||||||||||||||||||
S&P U.S. BMI Banks - Mid-Atlantic Region | 711.92 | 2/25/2022 | 2.77 | (1.92) | (0.50) | (2.36) | (2.36) | 2.24 | 28.38 | |||||||||||||||||||||||||||
S&P U.S. BMI Banks - Midwest Region | 777.33 | 2/25/2022 | 3.90 | (0.30) | 1.07 | 3.30 | 3.30 | 13.17 | 20.20 | |||||||||||||||||||||||||||
S&P U.S. BMI Banks - New England Region | 683.42 | 2/25/2022 | 4.94 | 0.25 | 3.67 | 9.98 | 9.98 | 17.50 | 19.94 | |||||||||||||||||||||||||||
S&P U.S. BMI Banks - Southeast Region | 548.59 | 2/25/2022 | 4.05 | (0.86) | (0.68) | 2.74 | 2.74 | 19.21 | 44.18 | |||||||||||||||||||||||||||
S&P U.S. BMI Banks - Southwest Region | 1,548.40 | 2/25/2022 | 4.38 | 0.07 | 3.19 | 5.03 | 5.03 | 18.62 | 27.25 | |||||||||||||||||||||||||||
S&P U.S. BMI Banks - Western Region | 1,654.13 | 2/25/2022 | 3.52 | (1.24) | 1.42 | 4.64 | 4.64 | 27.20 | 23.05 | |||||||||||||||||||||||||||
Broad Market Indexes | ||||||||||||||||||||||||||||||||||||
DJIA | 34,058.75 | 2/25/2022 | 2.51 | (0.06) | (3.05) | (6.27) | (6.27) | 8.46 | 30.53 | |||||||||||||||||||||||||||
S&P 500 | 4,384.65 | 2/25/2022 | 2.24 | 0.82 | (2.90) | (8.00) | (8.00) | 14.50 | 56.81 | |||||||||||||||||||||||||||
S&P 400 Mid Cap | 2,661.60 | 2/25/2022 | 2.81 | 1.11 | 0.99 | (6.35) | (6.35) | 6.52 | 37.68 | |||||||||||||||||||||||||||
S&P 600 Small Cap | 1,310.76 | 2/25/2022 | 2.23 | 0.99 | 0.89 | (6.49) | (6.49) | 2.11 | 33.14 | |||||||||||||||||||||||||||
S&P 500 Financials | 649.25 | 2/25/2022 | 3.16 | (0.27) | (0.04) | (0.12) | (0.12) | 18.82 | 47.57 | |||||||||||||||||||||||||||
MSCI US IMI Financials | 2,321.49 | 2/25/2022 | 3.27 | (0.18) | (0.26) | (0.93) | (0.93) | 17.67 | 43.10 | |||||||||||||||||||||||||||
NASDAQ | 13,694.62 | 2/25/2022 | 1.64 | 1.08 | (3.83) | (12.47) | (12.47) | 4.38 | 81.28 | |||||||||||||||||||||||||||
NASDAQ Finl | 6,140.07 | 2/25/2022 | 3.07 | 0.13 | 1.39 | (4.73) | (4.73) | 8.02 | 32.23 | |||||||||||||||||||||||||||
NYSE | 16,427.96 | 2/25/2022 | 2.70 | 0.22 | (1.39) | (4.29) | (4.29) | 8.03 | 29.35 | |||||||||||||||||||||||||||
Russell 1000 | 2,426.43 | 2/25/2022 | 2.26 | 0.94 | (2.73) | (8.29) | (8.29) | 11.95 | 56.34 | |||||||||||||||||||||||||||
Russell 2000 | 2,040.93 | 2/25/2022 | 2.25 | 1.57 | 0.62 | (9.10) | (9.10) | (7.24) | 28.46 | |||||||||||||||||||||||||||
Russell 3000 | 2,555.48 | 2/25/2022 | 2.26 | 0.98 | (2.54) | (8.34) | (8.34) | 10.57 | 54.27 | |||||||||||||||||||||||||||
S&P TSX Composite | 21,106.00 | 2/25/2022 | 1.66 | 0.47 | 0.04 | (0.55) | (0.55) | 15.82 | 31.44 | |||||||||||||||||||||||||||
MSCI AC World (USD) | 698.53 | 2/25/2022 | 2.43 | (0.68) | (2.63) | (7.46) | (7.46) | 4.72 | 38.13 | |||||||||||||||||||||||||||
MSCI World | 2,980.20 | 2/25/2022 | 2.56 | (0.11) | (2.58) | (7.78) | (7.78) | 7.97 | 42.47 | |||||||||||||||||||||||||||
Bermuda Royal Gazette/BSX | 2,717.42 | 2/25/2022 | 1.60 | 1.10 | 1.96 | 4.71 | 4.71 | 13.21 | 10.20 | |||||||||||||||||||||||||||
EXHIBIT IV-4
Everett Co-Operative Bank
Market Area Acquisition Activity
Exhibit IV-4
Massachusetts Bank and Thrift Acquisitions 2017-Present
| Target Financials at Announcement | Deal Terms and Pricing at Announcement | |||||||||||||||||||||||||||||||||||||||||||||||||||||||||||||||||||||||
| Total | NPAs/ | Rsrvs/ | Deal | Value/ | Prem/ | |||||||||||||||||||||||||||||||||||||||||||||||||||||||||||||||||||
| Announce | Complete | Assets | E/A | TE/A | ROAA | ROAE | Assets | NPLs | Value | Share | P/B | P/TB | P/E | P/A | Cdeps | |||||||||||||||||||||||||||||||||||||||||||||||||||||||||
Date | Date | Buyer Name | Target Name | ($000) | (%) | (%) | (%) | (%) | (%) | (%) | ($M) | ($) | (%) | (%) | (x) | (%) | (%) | |||||||||||||||||||||||||||||||||||||||||||||||||||||||
04/22/2021 | 11/12/2021 | Independent Bank Corp. | MA | Meridian Bancorp, Inc. | MA | 6,503,925 | 12.13 | 11.84 | 1.17 | 10.12 | 0.07 | NM | 1150.6 | 21.882 | 145.39 | 149.55 | 14.49 | 17.69 | 8.71 | |||||||||||||||||||||||||||||||||||||||||||||||||||||
04/07/2021 | 11/12/2021 | Eastern Bankshares Inc. | MA | Century Bancorp, Inc. | MA | 7,289,324 | 5.23 | 5.20 | 0.68 | 11.97 | 0.04 | NM | 641.9 | 115.280 | 168.32 | 169.53 | 14.82 | 8.81 | 0.00 | |||||||||||||||||||||||||||||||||||||||||||||||||||||
01/04/2021 | 07/01/2021 | SVB Financial Group | CA | Boston Private Financial Holdings, Inc. | MA | 10,048,733 | 8.64 | 8.04 | 0.49 | 5.34 | 0.31 | 261.98 | 942.6 | 10.943 | 103.79 | 112.30 | 19.90 | 9.38 | 1.73 | |||||||||||||||||||||||||||||||||||||||||||||||||||||
02/18/2020 | 02/01/2021 | LendingClub Corp. | CA | Radius Bancorp, Inc. | MA | 1,390,254 | 8.82 | 8.70 | 0.38 | 4.12 | 0.92 | 64.83 | 188.3 | 0.000 | 176.41 | 179.49 | 35.39 | 13.54 | 9.37 | |||||||||||||||||||||||||||||||||||||||||||||||||||||
12/18/2019 | 06/01/2020 | Cambridge Financial Group Inc. | MA | Melrose Bancorp, Inc. | MA | 340,813 | 11.93 | 11.93 | 0.38 | 2.93 | 0.00 | 0.00 | 57.6 | 25.000 | 141.82 | 141.82 | 44.64 | 16.91 | 9.97 | |||||||||||||||||||||||||||||||||||||||||||||||||||||
12/05/2019 | 06/01/2020 | Cambridge Bancorp | MA | Wellesley Bancorp, Inc. | MA | 985,867 | 7.28 | 7.28 | 0.70 | 9.48 | 0.00 | 0.00 | 121.0 | 44.289 | 158.53 | 158.53 | 17.44 | 12.28 | 8.10 | |||||||||||||||||||||||||||||||||||||||||||||||||||||
12/04/2019 | 10/01/2020 | Bridgewater Financial MHC | MA | Mansfield Co-operative Bank | MA | 527,235 | 10.66 | 10.66 | 0.60 | 5.77 | 0.35 | 378.22 | 0.0 | 0.000 | 0.00 | 0.00 | 0.00 | 0.00 | 0.00 | |||||||||||||||||||||||||||||||||||||||||||||||||||||
06/18/2019 | 01/01/2020 | Fidelity MHC | MA | Family Federal Savings, F.A. | MA | 97,894 | 11.76 | 11.76 | 0.05 | 0.47 | 1.36 | 32.11 | 0.0 | 0.000 | 0.00 | 0.00 | 0.00 | 0.00 | 0.00 | |||||||||||||||||||||||||||||||||||||||||||||||||||||
04/09/2019 | 10/01/2019 | North Shore Bancorp | MA | Beverly Financial, MHC | MA | 486,825 | 8.53 | 8.53 | 0.72 | 8.40 | 0.30 | 294.09 | 0.0 | 0.000 | 0.00 | 0.00 | 0.00 | 0.00 | 0.00 | |||||||||||||||||||||||||||||||||||||||||||||||||||||
02/27/2019 | 10/21/2019 | Hometown Financial Group MHC | MA | Millbury Savings Bank | MA | 228,126 | 12.46 | 12.46 | 0.81 | 6.72 | 0.76 | 99.48 | 0.0 | 0.000 | 0.00 | 0.00 | 0.00 | 0.00 | 0.00 | |||||||||||||||||||||||||||||||||||||||||||||||||||||
02/06/2019 | 05/17/2019 | Hometown Financial Group MHC | MA | Abington Bank | MA | 314,124 | 10.55 | 9.92 | 0.47 | 4.45 | 1.31 | 37.00 | 0.0 | 0.000 | 0.00 | 0.00 | 0.00 | 0.00 | 0.00 | |||||||||||||||||||||||||||||||||||||||||||||||||||||
11/27/2018 | 04/01/2019 | People’s United Financial Inc. | CT | BSB Bancorp, Inc. | MA | 2,971,807 | 6.66 | 6.66 | 0.74 | 11.00 | 0.19 | 322.35 | 317.2 | 32.420 | 159.75 | 159.75 | 14.87 | 10.67 | 7.27 | |||||||||||||||||||||||||||||||||||||||||||||||||||||
11/06/2018 | 04/30/2019 | North Easton Savings Bank | MA | Mutual Bank | MA | 517,988 | 8.99 | 8.99 | 0.59 | 6.65 | 0.31 | 232.63 | 0.0 | 0.000 | 0.00 | 0.00 | 0.00 | 0.00 | 0.00 | |||||||||||||||||||||||||||||||||||||||||||||||||||||
09/20/2018 | 04/01/2019 | Independent Bank Corp. | MA | Blue Hills Bancorp, Inc. | MA | 2,741,162 | 14.60 | 14.31 | 0.70 | 4.54 | 0.52 | 189.63 | 725.4 | 25.872 | 173.71 | 177.91 | 34.96 | 26.46 | 19.21 | |||||||||||||||||||||||||||||||||||||||||||||||||||||
08/14/2018 | 04/01/2019 | Equitable Bancorp MHC | MA | South Shore Mutual Holding Company | MA | 522,836 | 9.15 | 8.87 | 0.29 | 3.07 | 1.12 | 117.09 | 0.0 | 0.000 | 0.00 | 0.00 | 0.00 | 0.00 | 0.00 | |||||||||||||||||||||||||||||||||||||||||||||||||||||
07/25/2018 | 01/31/2019 | Hometown Financial Group MHC | MA | Pilgrim Bancshares, Inc. | MA | 265,562 | 12.93 | 12.93 | 0.52 | 4.04 | 1.34 | 35.71 | 53.8 | 23.000 | 151.43 | 151.43 | 35.38 | 20.26 | 14.91 | |||||||||||||||||||||||||||||||||||||||||||||||||||||
05/29/2018 | 11/14/2018 | Independent Bank Corp. | MA | MNB Bancorp | MA | 365,356 | 8.19 | 8.19 | 0.55 | 6.19 | 0.44 | 258.96 | 54.3 | 0.000 | 203.72 | 203.72 | 41.35 | 14.87 | 13.10 | |||||||||||||||||||||||||||||||||||||||||||||||||||||
04/30/2018 | 08/20/2018 | Salem Five Bancorp | MA | Sage Bank | MA | 141,727 | 7.22 | 7.22 | -1.25 | -15.66 | 1.48 | 36.17 | 9.3 | 6.300 | 112.97 | 112.97 | 0.00 | 6.59 | 1.64 | |||||||||||||||||||||||||||||||||||||||||||||||||||||
09/21/2017 | 03/01/2018 | Brookline Bancorp Inc. | MA | First Commons Bank, National Association | MA | 323,797 | 10.83 | 10.83 | 0.74 | 7.45 | 0.00 | 0.00 | 55.5 | 16.700 | 158.31 | 158.31 | 22.06 | 17.15 | 11.47 | |||||||||||||||||||||||||||||||||||||||||||||||||||||
09/19/2017 | 04/01/2018 | Fidelity MHC | MA | Colonial Co-operative Bank | MA | 69,027 | 8.12 | 8.12 | 0.11 | 1.40 | 6.44 | 8.31 | 0.0 | 0.000 | 0.00 | 0.00 | 0.00 | 0.00 | 0.00 | |||||||||||||||||||||||||||||||||||||||||||||||||||||
07/18/2017 | 10/31/2017 | South Shore Bancorp MHC | MA | Braintree Bancorp MHC | MA | 258,583 | 8.09 | 8.09 | 0.20 | 2.54 | 1.69 | 35.95 | 0.0 | 0.000 | 0.00 | 0.00 | 0.00 | 0.00 | 0.00 | |||||||||||||||||||||||||||||||||||||||||||||||||||||
06/26/2017 | 12/29/2017 | Meridian Bancorp Inc. | MA | Meetinghouse Bancorp, Inc. | MA | 117,764 | 9.29 | 9.29 | 0.06 | 0.62 | 0.00 | 0.00 | 17.2 | 0.000 | 157.21 | 157.21 | NM | 14.60 | 10.32 | |||||||||||||||||||||||||||||||||||||||||||||||||||||
05/22/2017 | 10/13/2017 | Berkshire Hills Bancorp Inc. | MA | Commerce Bancshares Corp. | MA | 2,219,402 | 7.33 | 6.85 | 0.75 | 8.80 | 1.14 | 63.29 | 209.2 | 33.062 | 128.63 | 138.27 | 14.59 | 9.43 | 2.99 | |||||||||||||||||||||||||||||||||||||||||||||||||||||
05/17/2017 | 10/01/2017 | Abington Bank | MA | Avon Co-operative Bank | MA | 90,491 | 10.15 | 10.15 | 0.22 | 2.10 | 0.00 | 0.00 | 0.0 | 0.000 | 0.00 | 0.00 | 0.00 | 0.00 | 0.00 | |||||||||||||||||||||||||||||||||||||||||||||||||||||
|
|
|
|
|
|
|
|
|
|
|
|
|
|
|
|
|
|
|
|
|
|
|
|
|
|
|
| |||||||||||||||||||||||||||||||||||||||||||||
| Average: | 1,617,443 | 9.56 | 9.45 | 0.44 | 4.69 | 0.84 | 112.17 | 89.17 | 90.45 | 13.47 | 8.28 | 4.95 | ||||||||||||||||||||||||||||||||||||||||||||||||||||||||||||
| Median: | 426,091 | 9.07 | 8.93 | 0.54 | 4.94 | 0.40 | 50.15 | 120.80 | 125.62 | 14.49 | 9.10 | 1.69 | ||||||||||||||||||||||||||||||||||||||||||||||||||||||||||||
Source: S&P Capital IQ.
EXHIBIT IV-5
Everett Co-Operative Bank
Director and Senior Management Resumes
EXHIBIT IV-5
Everett Co-Operative Bank
Director and Senior Management Resumes
Directors
Paul A. Delory is a practicing attorney and is the founder and principal of the Law Office of Paul A. Delory, a law firm headquartered in Everett, Massachusetts, which specializes in residential and commercial real estate and trusts and estates planning law.
Mr. Delory knowledge of commercial and residential real estate issues as well his contacts in the local community make him a valuable resource for the board of directors and for Everett Co-operative Bank.
Elizabeth P. Jones is retired. Prior to her retirement in 2015, from 1999 until 2015, Ms. Jones served as President and Chief Executive Officer of Everett Co-operative Bank.
Ms. Jones’ history and experience with Everett Co-operative Bank brings institutional knowledge about Everett Co-operative Bank as well as general banking experience to the board of directors.
Dennis J. Leonard is President and Chief Executive Officer of Delta Dental of Massachusetts, one of the largest dental insurance providers in the United States.
Mr. Leonard’s extensive managerial and business experience provides the board of directors with general business acumen.
Richard J. O’Neil, Jr.is President and Chief Executive Officer of Everett Co-operative Bank. He has served as Chief Executive since 2016. Mr. O’Neil is also a licensed attorney and is a former partner at the law firm Silverstein & O’Neil, during which time he serves as outside general counsel to Everett Co-operative Bank.
Mr. O’Neil’s experience provides the board of directors with a perspective on the day-to-day operations of Everett Co-operative Bank and assists the board of directors in assessing the trends and developments in the financial institutions industry on a local and national basis. Mr. O’Neil has extensive ties to the community that support our business generation.
Joseph Sachetta is the founding member and principal of Sachetta, LLC, a full-service wealth and tax advisory firm based in Lynnfield, Massachusetts. Mr. Sachetta is a certified public accountant. [confirm]
Mr. Sachetta’s educational and professional experience assists the board of directors with assessing Everett Co-operative Bank’s accounting practices and tax matters. Additionally, his contacts in the local community make him a valuable resource for the board of directors and for Everett Co-operative Bank.
Susan Sgroi is Executive Vice President and Chief Human Resource Officer for Blue Cross Blue Shield of Massachusetts, the largest private health plan in Massachusetts and one of the largest independent, not-for-profit Blue Cross Blue Shield plans in the country.
Ms. Sgroi’s significant experience having worked for over 30 years in human resources for large corporations provides the board of directors with valuable knowledge and experience in compensation and benefits, employment and general corporate governance matters.
Marjorie A. White is retired. Prior to her retirement in December 2019, Ms. White served as President of Everett Co-operative Bank. Ms. White was employed by Everett Co-operative Bank in positions of increasing responsibility from 1968 until her retirement in 2019.
Ms. White’s history and experience with Everett Co-operative Bank brings institutional knowledge about Everett Co-operative Banka and general banking experience to the board of directors.
Executive Officers Who Are Not Also Directors
John A. Citrano is our Executive Vice President, Chief Operating Officer and Chief Financial Officer. He joined Everett Co-operative Bank in 2019 and is responsible for the leadership, direction and management of the accounting, finance and operations of the Bank. Prior to joining Everett Co-operative Bank, from 2011 until 2019 Mr. Citrano served as the Executive Vice President and Chief Financial Officer for Belmont Savings Bank. Mr. Citrano has 33 years of experience in the financial services industry, including more than 20 years as a senior level executive.
John Migliozzi is our Executive Vice President and Chief Lending Officer, positions he has held since January 2022. Prior to joining Everett Co-operative Bank, since 2010 Mr. Migliozzi served as Executive Vice President and Senior Lender for East Boston Savings Bank. Mr. Migliozzi was employed with East Boston Savings Bank for 23 where he had responsible for overseeing its commercial and residential real estate portfolios. Mr. Migliozzi has over 35 years of experience in the financial services industry and his responsibilities include general oversight of our loan portfolio, including credit quality, loan yield and portfolio growth.
Source: Prospectus.
EXHIBIT IV-6
Everett Co-Operative Bank
Pro Forma Regulatory Capital Ratios
| Everett Co-operative Bank Historical at December 31, 2021 | Everett Co-operative Bank Pro Forma at December 31, 2021 Based Upon the Sale in the Offering of: | |||||||||||||||||||||||||||||||||||||||
| 7,862,500 Shares | 9,250,000 Shares | 10,637,500 Shares | 12,233,125 Shares (1) | |||||||||||||||||||||||||||||||||||||
| Amount | Percent of Assets | Amount | Percent of Assets | Amount | Percent of Assets | Amount | Percent of Assets | Amount | Percent of Assets | |||||||||||||||||||||||||||||||
| (Dollars in thousands) | ||||||||||||||||||||||||||||||||||||||||
Equity | $ | 77,104 | 11.57 | % | $ | 105,548 | 14.98 | % | $ | 110,751 | 15.57 | % | $ | 115,954 | 16.14 | % | $ | 121,938 | 16.79 | % | ||||||||||||||||||||
|
|
|
|
|
|
|
|
|
| |||||||||||||||||||||||||||||||
Tier 1 leverage capital (2)(3) | $ | 77,403 | 11.83 | % | $ | 105,847 | 15.29 | % | $ | 111,050 | 15.88 | % | $ | 116,253 | 16.47 | % | $ | 122,237 | 17.12 | % | ||||||||||||||||||||
Tier 1 leverage requirement | 32,705 | 5.00 | 34,615 | 5.00 | 34,958 | 5.00 | 35,302 | 5.00 | 35,697 | 5.00 | ||||||||||||||||||||||||||||||
|
|
|
|
|
|
|
|
|
|
|
|
|
|
|
|
|
|
|
| |||||||||||||||||||||
Excess | $ | 44,698 | 6.83 | % | $ | 71,232 | 10.29 | % | $ | 76,092 | 10.88 | % | $ | 80,950 | 11.47 | % | $ | 86,540 | 12.12 | % | ||||||||||||||||||||
|
|
|
|
|
|
|
|
|
|
|
|
|
|
|
|
|
|
|
| |||||||||||||||||||||
Tier 1 risk-based capital (2)(3) | $ | 77,403 | 16.81 | % | $ | 105,847 | 22.61 | % | $ | 111,050 | 23.65 | % | $ | 116,253 | 24.69 | % | $ | 122,237 | 25.87 | % | ||||||||||||||||||||
Tier 1 risk-based requirement | 36,840 | 8.00 | 37,451 | 8.00 | 37,561 | 8.00 | 37,671 | 8.00 | 37,797 | 8.00 | ||||||||||||||||||||||||||||||
|
|
|
|
|
|
|
|
|
|
|
|
|
|
|
|
|
|
|
| |||||||||||||||||||||
Excess | $ | 40,563 | 8.81 | % | $ | 68,396 | 14.61 | % | $ | 73,489 | 15.65 | % | $ | 78,582 | 16.69 | % | $ | 84,440 | 17.87 | |||||||||||||||||||||
|
|
|
|
|
|
|
|
|
|
|
|
|
|
|
|
|
|
|
| |||||||||||||||||||||
Total risk-based capital (2)(3) | $ | 81,874 | 17.78 | % | $ | 110,318 | 23.57 | % | $ | 115,521 | 24.60 | % | $ | 120,724 | 25.64 | % | $ | 126,708 | 26.82 | % | ||||||||||||||||||||
Total risk-based requirement | 46,050 | 10.00 | 46,814 | 10.00 | 46,951 | 10.00 | 47,089 | 10.00 | 47,247 | 10.00 | ||||||||||||||||||||||||||||||
|
|
|
|
|
|
|
|
|
|
|
|
|
|
|
|
|
|
|
| |||||||||||||||||||||
Excess | $ | 35,824 | 7.78 | % | $ | 63,504 | 13.57 | % | $ | 68,570 | 14.60 | % | $ | 73,635 | 15.64 | % | $ | 79,461 | 16.82 | % | ||||||||||||||||||||
|
|
|
|
|
|
|
|
|
|
|
|
|
|
|
|
|
|
|
| |||||||||||||||||||||
Common equity tier 1 risk-based capital (2)(3) | $ | 77,403 | 16.81 | % | $ | 105,847 | 22.61 | % | $ | 115,050 | 23.65 | % | $ | 116,253 | 24.69 | % | $ | 122,237 | 25.87 | % | ||||||||||||||||||||
Common equity tier 1 risk-based requirement | 29,933 | 6.50 | 30,429 | 6.50 | 30,518 | 6.50 | 30,608 | 6.50 | 30,710 | 6.50 | ||||||||||||||||||||||||||||||
|
|
|
|
|
|
|
|
|
|
|
|
|
|
|
|
|
|
|
| |||||||||||||||||||||
Excess | $ | 47,470 | 10.31 | % | $ | 75,417 | 16.11 | % | $ | 80,532 | 17.15 | % | $ | 85,645 | 18.19 | % | $ | 91,527 | 19.37 | % | ||||||||||||||||||||
|
|
|
|
|
|
|
|
|
|
|
|
|
|
|
|
|
|
|
| |||||||||||||||||||||
Reconciliation of capital infused into Everett Co-operative Bank: |
| |||||||||||||||||||||||||||||||||||||||
Net proceeds |
| $ | 38,191 | $ | 45,059 | $ | 51,927 | $ | 59,825 | |||||||||||||||||||||||||||||||
Less: Common stock acquired by employee stock ownership plan |
| (6,498 | ) | (7,608 | ) | (8,718 | ) | (9,995 | ) | |||||||||||||||||||||||||||||||
Less: Common stock acquired by stock-based incentive plans |
| (3,249 | ) | (3,804 | ) | (4,359 | ) | (4,997 | ) | |||||||||||||||||||||||||||||||
|
|
|
|
|
|
|
| |||||||||||||||||||||||||||||||||
Pro forma increase |
| $ | 28,444 | $ | 33,647 | $ | 38,850 | $ | 44,833 | |||||||||||||||||||||||||||||||
|
|
|
|
|
|
|
| |||||||||||||||||||||||||||||||||
Source: Prospectus.
EXHIBIT IV-7
Everett Co-Operative Bank
Pro Forma Analysis Sheet
EXHIBIT IV-7
PRO FORMA ANALYSIS SHEET
Everett Co-Operative Bank
Prices as of February 18, 2022
| Subject at | Thrift Peer Group | All Public Thrifts | ||||||||||||||||||||||||
Valuation Pricing Multiples | Symbol | Midpoint | Mean | Median | Mean | Median | ||||||||||||||||||||
Price-earnings multiple | = | P/E | 29.81 | x | 15.13x | 15.17x | 14.46x | 13.10x | ||||||||||||||||||
Price-core earnings multiple | = | P/CE | 20.36 | x | 16.08x | 16.61x | 14.49x | 13.46x | ||||||||||||||||||
Price-book ratio | = | P/B | 60.89 | % | 94.49 | % | 89.96 | % | 109.03 | % | 100.86 | % | ||||||||||||||
Price-tangible book ratio | = | P/TB | 60.89 | % | 96.63 | % | 94.54 | % | 119.49 | % | 107.72 | % | ||||||||||||||
Price-assets ratio | = | P/A | 12.76 | % | 12.17 | % | 10.81 | % | 14.63 | % | 13.28 | % | ||||||||||||||
Valuation Parameters | % of Offering | % of Offering + Foundation | ||||||||||||||
Pre-Conversion Earnings (Y) | $ | 4,042,000 | (12 Mths 12/21) | ESOP Stock as % of Offering (E) | 8.2249 | % | 8.0000 | % | ||||||||
Pre-Conversion Core Earnings | $ | 5,523,000 | (12 Mths 12/21) | Cost of ESOP Borrowings (S) | 0.00 | % | ||||||||||
Pre-Conversion Book Value (B) | $ | 77,273,000 | (12/21) | ESOP Amortization (T) | 20.00 | years | ||||||||||
Intangibles | $ | 0 | (12/21) | SBP Stock as % of Offering (M) | 4.1124 | % | 4.0000 | % | ||||||||
|
| |||||||||||||||
Pre-Conv. Tang. Book Value (B) | $ | 77,273,000 | (12/21) | Stock Programs Vesting (N) | 5.00 | years | ||||||||||
Pre-Conversion Assets (A) | $ | 666,489,000 | (12/21) | Fixed Expenses | $ | 1,431,250 | ||||||||||
Reinv. Rate: (5 Yr Treas)@12/31/21 | 1.26 | % | Subscr/Dir Comm Exp (Mdpnt) | $ | 951,000 | 1.35 | % | |||||||||
|
| |||||||||||||||
Tax rate (TAX) | 25.08 | % | Total Expenses (Midpoint) | $ | 2,382,250 | |||||||||||
A-T Reinvestment Rate(R) | 0.94 | % | Syndicate Expenses (Mdpnt) | $ | 0 | 0.00 | % | |||||||||
Est. Conversion Expenses (1)(X) | 2.50 | % | Syndicate Amount | $ | 0 | |||||||||||
Insider Purchases ($) | $ | 0 | Percent Sold (PCT) | 100.00 | % | |||||||||||
Price/Share | $ | 10.00 | MHC Assets | $ | 0 | |||||||||||
Foundation Cash Contrib. (FC) | $ | 600,000 | Options as % of Offering (O1) | 10.2811 | % | 10.00 | % | |||||||||
Found. Stk Contrib (% of Total Shrs (FS) | 2.8108 | % | Estimated Option Value (O2) | 41.20 | % | |||||||||||
Foundation Tax Benefit (Z) | $ | 802,560 | Option Vesting Period (O3) | 5.00 | years | |||||||||||
Foundation Amount (Mdpt.) | $ | 2,600,000 | % of Options taxable (O4) | 25.00 | % | |||||||||||
Calculation of Pro Forma Value After Conversion | ||||||||||||
| 1. | V= | P/E * (Y) | V= | $ | 95,100,000 | |||||||
| 1—P/E * PCT * ((1-X-E-M-FC-FS)*R - (1-TAX)*E/T - (1-TAX)*M/N)-(1-(TAX*O4))*(O1*O2)/O3) | ||||||||||||
| 1. | V= | P/E * (Y) | V= | $ | 95,100,000 | |||||||
| 1—P/Core E * PCT * ((1-X-E-M-FC-FS)*R - (1-TAX)*E/T - (1-TAX)*M/N)-(1-(TAX*O4))*(O1*O2)/O3) | ||||||||||||
| 2. | V= | P/B * (B+Z) | V= | $ | 95,100,000 | |||||||
| 1 - P/B * PCT * (1-X-E-M-FC-FS) | ||||||||||||
| 2. | V= | P/TB * (TB+Z) | V= | $ | 95,100,000 | |||||||
| 1 - P/TB * PCT * (1-X-E-M-FC-FS) | ||||||||||||
| 3. | V= | P/A * (A+Z+PA) | V= | $ | 95,100,000 | |||||||
| 1 - P/A * PCT * (1-X-E-M-FC-FS) | ||||||||||||
Valuation Conclusion | Shares Sold to Public | Foundation Shares | Total Shares Issued | Price Per Share | Market Value of Stock Sold in Offering | |||||||||||||||
Supermaximum | 12,233,125 | 260,000 | 12,493,125 | $ | 10.00 | $ | 122,331,250 | |||||||||||||
Maximum | 10,637,500 | 260,000 | 10,897,500 | 10.00 | 106,375,000 | |||||||||||||||
Midpoint | 9,250,000 | 260,000 | 9,510,000 | 10.00 | 92,500,000 | |||||||||||||||
Minimum | 7,862,500 | 260,000 | 8,122,500 | 10.00 | 78,625,000 | |||||||||||||||
Valuation Conclusion | Shares Sold to Public | Foundation Shares | Total Shares Issued | |||||||||
Supermaximum | 97.919 | % | 2.081 | % | 100.000 | % | ||||||
Maximum | 97.614 | % | 2.386 | % | 100.000 | % | ||||||
Midpoint | 97.266 | % | 2.734 | % | 100.000 | % | ||||||
Minimum | 96.799 | % | 3.201 | % | 100.000 | % | ||||||
| (1) | Estimated offering expenses at midpoint of the offering. |
EXHIBIT IV-8
Everett Co-Operative Bank
Pro Forma Effect of Conversion Proceeds
Exhibit IV-8
PRO FORMA EFFECT OF CONVERSION PROCEEDS
Everett Co-Operative Bank
At the Minimum of the Range
1. | Market Value of Shares Sold In Offering: |
| $ | 78,625,000 | ||||||||||||||
| Market Value of Shares Issued to Foundation: |
| 2,600,000 | ||||||||||||||||
|
| |||||||||||||||||
| Total Market Value of Company: |
| $ | 81,225,000 | |||||||||||||||
2. | Offering Proceeds of Shares Sold In Offering |
| $ | 78,625,000 | ||||||||||||||
| Less: Estimated Offering Expenses |
| 2,243,500 | ||||||||||||||||
|
| |||||||||||||||||
| Net Conversion Proceeds |
| $ | 76,381,500 | |||||||||||||||
3. | Estimated Additional Equity and Income from Offering Proceeds |
| ||||||||||||||||
| Net Conversion Proceeds |
| $ | 76,381,500 | |||||||||||||||
| Less: Cash Contribution to Foundation |
| (600,000 | ) | |||||||||||||||
| Less: Non-Cash ESOP Stock Purchases (1) |
| (6,498,000 | ) | |||||||||||||||
| Less: Non-Cash SBP Stock Purchases (2) |
| (3,249,000 | ) | |||||||||||||||
|
| |||||||||||||||||
| Net Conversion Proceeds Reinvested |
| $ | 66,034,500 | |||||||||||||||
| Estimated After-Tax Reinvestment Rate |
| 0.94 | % | |||||||||||||||
|
| |||||||||||||||||
| Earnings from Reinvestment of Proceeds |
| $ | 623,360 | |||||||||||||||
| Less: Estimated cost of ESOP borrowings(1) |
| 0 | ||||||||||||||||
| Less: Amortization of ESOP borrowings(1) |
| (243,415 | ) | |||||||||||||||
| Less: Stock Programs Vesting (2) |
| (486,830 | ) | |||||||||||||||
| Less: Option Plan Vesting (3) |
| (627,329 | ) | |||||||||||||||
|
| |||||||||||||||||
| Net Earnings Increase |
| ($ | 734,214 | ) | ||||||||||||||
| Before Conversion | Net Earnings Increase | After Conversion | ||||||||||||||||
4. | Pro Forma Earnings | |||||||||||||||||
| 12 Months ended December 31, 2021 (reported) | $ | 4,042,000 | ($ | 734,214 | ) | $ | 3,307,786 | |||||||||||
| 12 Months ended December 31, 2021 (core) | $ | 5,523,000 | ($ | 734,214 | ) | $ | 4,788,786 | |||||||||||
| Before Conversion | Net Equity Proceeds | Tax Benefit of Foundation | After Conversion | |||||||||||||||
5. | Pro Forma Net Worth | |||||||||||||||||
| December 31, 2021 | $ | 77,273,000 | $ | 66,034,500 | $ | 802,560 | $ | 144,110,060 | ||||||||||
| December 31, 2021 (Tangible) | $ | 77,273,000 | $ | 66,034,500 | $ | 802,560 | $ | 144,110,060 | ||||||||||
| Before Conversion | Net Cash Proceeds | Tax Benefit of Foundation | After Conversion | |||||||||||||||
6. | Pro Forma Assets | |||||||||||||||||
| December 31, 2021 | $ | 666,489,000 | $ | 66,034,500 | $ | 802,560 | $ | 733,326,060 | ||||||||||
| (1) | ESOP stock (8% of offering and foundation) amortized over 25 years, amortization expense is tax effected at 25.08%. |
| (2) | Stock programs (4% of offering and foundation) amortized over 5 years, amortization expense is tax effected at 25.08%. |
| (3) | Option valuation based on Black-Scholes model, 5 year vesting, and assuming 25% taxable. |
Exhibit IV-8
PRO FORMA EFFECT OF CONVERSION PROCEEDS
Everett Co-Operative Bank
At the Midpoint of the Range
1. | Market Value of Shares Sold In Offering: |
| $ | 92,500,000 | ||||||||||||||
| Market Value of Shares Issued to Foundation: |
| 2,600,000 | ||||||||||||||||
|
| |||||||||||||||||
| Total Market Value of Company: |
| $ | 95,100,000 | |||||||||||||||
2. | Offering Proceeds of Shares Sold In Offering |
| $ | 92,500,000 | ||||||||||||||
| Less: Estimated Offering Expenses |
| 2,382,250 | ||||||||||||||||
|
| |||||||||||||||||
| Net Conversion Proceeds |
| $ | 90,117,750 | |||||||||||||||
3. | Estimated Additional Equity and Income from Offering Proceeds |
| ||||||||||||||||
| Net Conversion Proceeds |
| $ | 90,117,750 | |||||||||||||||
| Less: Cash Contribution to Foundation |
| (600,000 | ) | |||||||||||||||
| Less: Non-Cash ESOP Stock Purchases (1) |
| (7,608,000 | ) | |||||||||||||||
| Less: Non-Cash SBP Stock Purchases (2) |
| (3,804,000 | ) | |||||||||||||||
|
| |||||||||||||||||
| Net Conversion Proceeds Reinvested |
| $ | 78,105,750 | |||||||||||||||
| Estimated After-Tax Reinvestment Rate |
| 0.94 | % | |||||||||||||||
|
| |||||||||||||||||
| Earnings from Reinvestment of Proceeds |
| $ | 737,312 | |||||||||||||||
| Less: Estimated cost of ESOP borrowings(1) |
| 0 | ||||||||||||||||
| Less: Amortization of ESOP borrowings(1) |
| (284,996 | ) | |||||||||||||||
| Less: Stock Programs Vesting (2) |
| (569,991 | ) | |||||||||||||||
| Less: Option Plan Vesting (3) |
| (734,491 | ) | |||||||||||||||
|
| |||||||||||||||||
| Net Earnings Increase |
| ($ | 852,166 | ) | ||||||||||||||
| Before Conversion | Net Earnings Increase | After Conversion | ||||||||||||||||
4. | Pro Forma Earnings | |||||||||||||||||
| 12 Months ended December 31, 2021 (reported) | $ | 4,042,000 | ($ | 852,166 | ) | $ | 3,189,834 | |||||||||||
| 12 Months ended December 31, 2021 (core) | $ | 5,523,000 | ($ | 852,166 | ) | $ | 4,670,834 | |||||||||||
| Before Conversion | Net Capital Proceeds | Tax Benefit of Foundation | After Conversion | |||||||||||||||
5. | Pro Forma Net Worth | |||||||||||||||||
| December 31, 2021 | $ | 77,273,000 | $ | 78,105,750 | $ | 802,560 | $ | 156,181,310 | ||||||||||
| December 31, 2021 (Tangible) | $ | 77,273,000 | $ | 78,105,750 | $ | 802,560 | $ | 156,181,310 | ||||||||||
| Before Conversion | Net Cash Proceeds | Tax Benefit of Foundation | After Conversion | |||||||||||||||
6. | Pro Forma Assets | |||||||||||||||||
| December 31, 2021 | $ | 666,489,000 | $ | 78,105,750 | $ | 802,560 | $ | 745,397,310 | ||||||||||
| (1) | ESOP stock (8% of offering and foundation) amortized over 25 years, amortization expense is tax effected at 25.08%. |
| (2) | Stock programs (4% of offering and foundation) amortized over 5 years, amortization expense is tax effected at 25.08%. |
| (3) | Option valuation based on Black-Scholes model, 5 year vesting, and assuming 25% taxable. |
Exhibit IV-8
PRO FORMA EFFECT OF CONVERSION PROCEEDS
Everett Co-Operative Bank
At the Maximum of the Range
1. | Market Value of Shares Sold In Offering: |
| $ | 106,375,000 | ||||||||||||||
| Market Value of Shares Issued to Foundation: |
| 2,600,000 | ||||||||||||||||
|
| |||||||||||||||||
| Total Market Value of Company: |
| $ | 108,975,000 | |||||||||||||||
2. | Offering Proceeds of Shares Sold In Offering |
| $ | 106,375,000 | ||||||||||||||
| Less: Estimated Offering Expenses |
| 2,521,000 | ||||||||||||||||
|
| |||||||||||||||||
| Net Conversion Proceeds |
| $ | 103,854,000 | |||||||||||||||
3. | Estimated Additional Equity and Income from Offering Proceeds |
| ||||||||||||||||
| Net Conversion Proceeds |
| $ | 103,854,000 | |||||||||||||||
| Less: Cash Contribution to Foundation |
| (600,000 | ) | |||||||||||||||
| Less: Non-Cash ESOP Stock Purchases (1) |
| (8,718,000 | ) | |||||||||||||||
| Less: Non-Cash SBP Stock Purchases (2) |
| (4,359,000 | ) | |||||||||||||||
|
| |||||||||||||||||
| Net Conversion Proceeds Reinvested |
| $ | 90,177,000 | |||||||||||||||
| Estimated After-Tax Reinvestment Rate |
| 0.94 | % | |||||||||||||||
|
| |||||||||||||||||
| Earnings from Reinvestment of Proceeds |
| $ | 851,264 | |||||||||||||||
| Less: Estimated cost of ESOP borrowings(1) |
| 0 | ||||||||||||||||
| Less: Amortization of ESOP borrowings(1) |
| (326,576 | ) | |||||||||||||||
| Less: Stock Programs Vesting (2) |
| (653,153 | ) | |||||||||||||||
| Less: Option Plan Vesting (3) |
| (841,652 | ) | |||||||||||||||
|
| |||||||||||||||||
| Net Earnings Increase |
| ($ | 970,117 | ) | ||||||||||||||
| Before Conversion | Net Earnings Increase | After Conversion | ||||||||||||||||
4. | Pro Forma Earnings | |||||||||||||||||
| 12 Months ended December 31, 2021 (reported) | $ | 4,042,000 | ($ | 970,117 | ) | $ | 3,071,883 | |||||||||||
| 12 Months ended December 31, 2021 (core) | $ | 5,523,000 | ($ | 970,117 | ) | $ | 4,552,883 | |||||||||||
| Before Conversion | Net Capital Proceeds | Tax Benefit of Foundation | After Conversion | |||||||||||||||
5. | Pro Forma Net Worth | |||||||||||||||||
| December 31, 2021 | $ | 77,273,000 | $ | 90,177,000 | $ | 802,560 | $ | 168,252,560 | ||||||||||
| December 31, 2021 (Tangible) | $ | 77,273,000 | $ | 90,177,000 | $ | 802,560 | $ | 168,252,560 | ||||||||||
| Before Conversion | Net Cash Proceeds | Tax Benefit of Foundation | After Conversion | |||||||||||||||
6. | Pro Forma Assets | |||||||||||||||||
| December 31, 2021 | $ | 666,489,000 | $ | 90,177,000 | $ | 802,560 | $ | 757,468,560 | ||||||||||
| (1) | ESOP stock (8% of offering and foundation) amortized over 25 years, amortization expense is tax effected at 25.08%. |
| (2) | Stock programs (4% of offering and foundation) amortized over 5 years, amortization expense is tax effected at 25.08%. |
| (3) | Option valuation based on Black-Scholes model, 5 year vesting, and assuming 25% taxable. |
Exhibit IV-8
PRO FORMA EFFECT OF CONVERSION PROCEEDS
Everett Co-Operative Bank
At the Supermaximum Value
1. | Market Value of Shares Sold In Offering: |
| $ | 122,331,250 | ||||||||||||||
| Market Value of Shares Issued to Foundation: |
| 2,600,000 | ||||||||||||||||
|
| |||||||||||||||||
| Total Market Value of Company: |
| $ | 124,931,250 | |||||||||||||||
2. | Offering Proceeds of Shares Sold In Offering |
| $ | 122,331,250 | ||||||||||||||
| Less: Estimated Offering Expenses |
| 2,680,563 | ||||||||||||||||
|
| |||||||||||||||||
| Net Conversion Proceeds |
| $ | 119,650,688 | |||||||||||||||
3. | Estimated Additional Equity and Income from Offering Proceeds |
| ||||||||||||||||
| Net Conversion Proceeds |
| $ | 119,650,688 | |||||||||||||||
| Less: Cash Contribution to Foundation |
| (600,000 | ) | |||||||||||||||
| Less: Non-Cash ESOP Stock Purchases (1) |
| (9,994,494 | ) | |||||||||||||||
| Less: Non-Cash MRP Stock Purchases (2) |
| (4,997,242 | ) | |||||||||||||||
|
| |||||||||||||||||
| Net Conversion Proceeds Reinvested |
| $ | 104,058,952 | |||||||||||||||
| Estimated After-Tax Reinvestment Rate |
| 0.94 | % | |||||||||||||||
|
| |||||||||||||||||
| Earnings from Reinvestment of Proceeds |
| $ | 982,308 | |||||||||||||||
| Less: Estimated cost of ESOP borrowings(1) |
| 0 | ||||||||||||||||
| Less: Amortization of ESOP borrowings(1) |
| (374,394 | ) | |||||||||||||||
| Less: Stock Programs Vesting (2) |
| (748,788 | ) | |||||||||||||||
| Less: Option Plan Vesting (3) |
| (964,888 | ) | |||||||||||||||
|
| |||||||||||||||||
| Net Earnings Increase |
| ($ | 1,105,762 | ) | ||||||||||||||
| Before Conversion | Net Earnings Increase | After Conversion | ||||||||||||||||
4. | Pro Forma Earnings | |||||||||||||||||
| 12 Months ended December 31, 2021 (reported) | $ | 4,042,000 | ($ | 1,105,762 | ) | $ | 2,936,238 | |||||||||||
| 12 Months ended December 31, 2021 (core) | $ | 5,523,000 | ($ | 1,105,762 | ) | $ | 4,417,238 | |||||||||||
| Before Conversion | Net Capital Proceeds | Tax Benefit of Foundation | After Conversion | |||||||||||||||
5. | Pro Forma Net Worth | |||||||||||||||||
| December 31, 2021 | $ | 77,273,000 | $ | 104,058,952 | $ | 802,560 | $ | 182,134,512 | ||||||||||
| December 31, 2021 (Tangible) | $ | 77,273,000 | $ | 104,058,952 | $ | 802,560 | $ | 182,134,512 | ||||||||||
| Before Conversion | Net Cash Proceeds | Tax Benefit of Foundation | After Conversion | |||||||||||||||
6. | Pro Forma Assets | |||||||||||||||||
| December 31, 2021 | $ | 666,489,000 | $ | 104,058,952 | $ | 802,560 | $ | 771,350,512 | ||||||||||
| (1) | ESOP stock (8% of offering and foundation) amortized over 25 years, amortization expense is tax effected at 25.08%. |
| (2) | Stock programs (4% of offering and foundation) amortized over 5 years, amortization expense is tax effected at 25.08%. |
| (3) | Option valuation based on Black-Scholes model, 5 year vesting, and assuming 25% taxable. |
EXHIBIT V-1
RP® Financial, LC.
Firm Qualifications Statement
FIRM QUALIFICATION STATEMENT
RP® Financial (“RP®) provides financial and management consulting, merger advisory and valuation services to the financial services industry nationwide. We offer a broad array of services, high quality and prompt service, hands-on involvement by principals and senior staff, careful structuring of strategic initiatives and sophisticated valuation and other analyses consistent with industry practices and regulatory requirements. Our staff maintains extensive background in financial and management consulting, valuation and investment banking. Our clients include commercial banks, thrifts, credit unions, mortgage companies, insurance companies and other financial services companies.
STRATEGIC PLANNING SERVICES
RP®’s strategic planning services are designed to provide effective feasible plans with quantifiable results. We analyze strategic options to enhance shareholder value, achieve regulatory approval or realize other objectives. Such services involve conducting situation analyses; establishing mission/vision statements, developing strategic goals and objectives; and identifying strategies to enhance franchise and/or market value, capital management, earnings enhancement, operational matters and organizational issues. Strategic recommendations typically focus on: capital formation and management, asset/liability targets, profitability, return on equity and stock pricing. Our proprietary financial simulation models provide the basis for evaluating the impact of various strategies and assessing their feasibility and compatibility with regulations.
MERGER ADVISORY SERVICES
RP®’s merger advisory services include targeting potential buyers and sellers, assessing acquisition merit, conducting due diligence, negotiating and structuring merger transactions, preparing merger business plans and financial simulations, rendering fairness opinions, preparing mark-to-market analyses, valuing intangible assets and supporting the implementation of post-acquisition strategies. Our merger advisory services involve transactions of financially healthy companies and failed bank deals. RP® is also expert in de novo charters and shelf charters. Through financial simulations, comprehensive data bases, valuation proficiency and regulatory familiarity, RP®’s merger advisory services center on enhancing shareholder returns.
VALUATION SERVICES
RP®’s extensive valuation practice includes bank and thrift mergers, thrift mutual-to-stock conversions, goodwill impairment, insurance company demutualizations, ESOPs, subsidiary companies, merger accounting and other purposes. We are highly experienced in performing appraisals which conform to regulatory guidelines and appraisal standards. RP® is the nation’s leading valuation firm for thrift mutual-to-stock conversions, with appraised values ranging up to $4 billion.
OTHER CONSULTING SERVICES
RP® offers other consulting services including evaluating the impact of regulatory changes (TARP, etc.), branching and diversification strategies, feasibility studies and special research. We assist banks/thrifts in preparing CRA plans and evaluating wealth management activities on a de novo or merger basis. Our other consulting services are facilitated by proprietary valuation and financial simulation models.
KEY PERSONNEL (Years of Relevant Experience & Contact Information)
| Ronald S. Riggins, Managing Director (39) | (703) 647-6543 | rriggins@rpfinancial.com | ||
| William E. Pommerening, Managing Director (36) | (703) 647-6546 | wpommerening@rpfinancial.com | ||
| James P. Hennessey, Director (34) | (703) 647-6544 | jhennessey@rpfinancial.com | ||
| James J. Oren, Director (32) | (703) 647-6549 | joren@rpfinancial.com | ||
| Gregory E. Dunn, Director (36) | (703) 647-6548 | gdunn@rpfinancial.com |