0001914805 false --12-31 Q2 2023-06-30 6-K 2023 E9 0 P2Y 0001914805 2023-01-01 2023-06-30 0001914805 2023-06-30 0001914805 2022-12-31 0001914805 2022-01-01 2022-06-30 0001914805 us-gaap:CommonStockMember 2021-12-31 0001914805 us-gaap:AdditionalPaidInCapitalMember 2021-12-31 0001914805 us-gaap:RetainedEarningsMember 2021-12-31 0001914805 2021-12-31 0001914805 us-gaap:CommonStockMember 2022-12-31 0001914805 us-gaap:AdditionalPaidInCapitalMember 2022-12-31 0001914805 us-gaap:RetainedEarningsMember 2022-12-31 0001914805 us-gaap:CommonStockMember 2022-01-01 2022-06-30 0001914805 us-gaap:AdditionalPaidInCapitalMember 2022-01-01 2022-06-30 0001914805 us-gaap:RetainedEarningsMember 2022-01-01 2022-06-30 0001914805 us-gaap:CommonStockMember 2023-01-01 2023-06-30 0001914805 us-gaap:AdditionalPaidInCapitalMember 2023-01-01 2023-06-30 0001914805 us-gaap:RetainedEarningsMember 2023-01-01 2023-06-30 0001914805 us-gaap:CommonStockMember 2022-06-30 0001914805 us-gaap:AdditionalPaidInCapitalMember 2022-06-30 0001914805 us-gaap:RetainedEarningsMember 2022-06-30 0001914805 2022-06-30 0001914805 us-gaap:CommonStockMember 2023-06-30 0001914805 us-gaap:AdditionalPaidInCapitalMember 2023-06-30 0001914805 us-gaap:RetainedEarningsMember 2023-06-30 0001914805 BANL:BanleBVIMember BANL:MrChiaMember 2020-07-01 2020-07-31 0001914805 BANL:BanleBVIMember BANL:MrChiaMember 2020-07-31 0001914805 BANL:BanleBVIMember 2021-02-01 2021-02-28 0001914805 BANL:CBLAsiaLimitedMember 2021-02-01 2021-02-28 0001914805 BANL:StraitsEnergyResourcesBerhadMember 2021-02-01 2021-02-28 0001914805 BANL:MrChiaMember 2020-07-01 2020-07-31 0001914805 BANL:MrChiaMember 2022-02-01 2022-02-28 0001914805 BANL:MrChiaMember 2022-02-28 0001914805 BANL:SubdividedMember 2022-03-01 2022-03-31 0001914805 BANL:SubdividedMember 2022-03-31 0001914805 us-gaap:CommonStockMember 2022-03-31 0001914805 BANL:MrChiaMember 2022-03-01 2022-03-31 0001914805 BANL:MrChiaMember 2022-03-31 0001914805 BANL:CBLAsiaLimitedMember 2022-08-01 2022-08-31 0001914805 BANL:StraitsEnergyResourcesBerhadMember 2022-08-01 2022-08-31 0001914805 BANL:MrChiaMember 2022-08-01 2022-08-31 0001914805 BANL:BanleBVIMember 2022-08-31 0001914805 BANL:CBLAsiaLimitedMember BANL:BanleBVIMember 2022-08-31 0001914805 BANL:StraitsEnergyResourcesBerhadMember BANL:BanleBVIMember 2022-08-31 0001914805 us-gaap:IPOMember 2023-03-23 0001914805 us-gaap:IPOMember 2023-03-27 0001914805 BANL:CBLInternationalMember 2023-06-30 0001914805 BANL:StraitsMember 2023-06-30 0001914805 BANL:PublicShareholdersMember 2023-06-30 0001914805 BANL:TopFiveCustomersMember 2023-06-30 0001914805 BANL:TopFiveCustomersMember 2022-12-31 0001914805 us-gaap:AccountsReceivableMember us-gaap:CustomerConcentrationRiskMember BANL:TopFiveCustomersMember 2023-01-01 2023-06-30 0001914805 us-gaap:AccountsReceivableMember us-gaap:CustomerConcentrationRiskMember BANL:CustomerAMember 2023-01-01 2023-06-30 0001914805 us-gaap:AccountsReceivableMember us-gaap:CustomerConcentrationRiskMember BANL:TopFiveCustomersMember 2022-01-01 2022-12-31 0001914805 us-gaap:AccountsReceivableMember us-gaap:CustomerConcentrationRiskMember BANL:CustomerAMember 2022-01-01 2022-12-31 0001914805 2022-01-01 2022-12-31 0001914805 BANL:CommodityContractsMember us-gaap:FairValueInputsLevel1Member 2023-06-30 0001914805 BANL:CommodityContractsMember us-gaap:FairValueInputsLevel2Member 2023-06-30 0001914805 BANL:CommodityContractsMember us-gaap:FairValueInputsLevel3Member 2023-06-30 0001914805 BANL:CommodityContractsMember 2023-06-30 0001914805 BANL:CommodityContractsMember us-gaap:FairValueInputsLevel1Member 2022-12-31 0001914805 BANL:CommodityContractsMember us-gaap:FairValueInputsLevel2Member 2022-12-31 0001914805 BANL:CommodityContractsMember us-gaap:FairValueInputsLevel3Member 2022-12-31 0001914805 BANL:CommodityContractsMember 2022-12-31 0001914805 BANL:CommodityContractsMember us-gaap:LongTermDebtMember 2023-01-01 2023-06-30 0001914805 BANL:CommodityContractsMember us-gaap:LongTermDebtMember 2022-01-01 2022-12-31 0001914805 BANL:CommodityContractsMember us-gaap:ShortTermDebtMember 2023-01-01 2023-06-30 0001914805 BANL:CommodityContractsMember us-gaap:ShortTermDebtMember 2022-01-01 2022-12-31 0001914805 BANL:CommodityContractsMember 2023-01-01 2023-06-30 0001914805 BANL:CommodityContractsMember 2022-01-01 2022-06-30 0001914805 us-gaap:VehiclesMember 2023-01-01 2023-06-30 0001914805 us-gaap:ComputerEquipmentMember 2023-01-01 2023-06-30 0001914805 BANL:OfficeEquipmentAndFixturesMember 2023-06-30 0001914805 BANL:OfficeEquipmentAndFixturesMember 2022-12-31 0001914805 us-gaap:VehiclesMember 2023-06-30 0001914805 us-gaap:VehiclesMember 2022-12-31 0001914805 us-gaap:ComputerEquipmentMember 2023-06-30 0001914805 us-gaap:ComputerEquipmentMember 2022-12-31 0001914805 BANL:OfficeEquipmentAndFixturesMember 2023-01-01 2023-06-30 0001914805 BANL:OfficeEquipmentAndFixturesMember 2022-01-01 2022-06-30 0001914805 us-gaap:VehiclesMember 2022-01-01 2022-06-30 0001914805 2021-01-01 2021-12-31 0001914805 srt:MinimumMember 2023-06-30 0001914805 srt:MaximumMember 2023-06-30 0001914805 srt:MinimumMember 2022-12-31 0001914805 srt:MaximumMember 2022-12-31 0001914805 us-gaap:RelatedPartyMember BANL:FactoringArrangementMember 2023-01-01 2023-06-30 0001914805 us-gaap:RelatedPartyMember BANL:FactoringArrangementMember 2022-01-01 2022-06-30 0001914805 srt:MinimumMember 2023-01-01 2023-06-30 0001914805 srt:MaximumMember 2023-01-01 2023-06-30 0001914805 country:HK 2023-01-01 2023-06-30 0001914805 country:HK srt:MaximumMember 2023-01-01 2023-06-30 0001914805 country:HK 2022-01-01 2022-06-30 0001914805 country:MY 2023-01-01 2023-06-30 0001914805 country:MY 2022-01-01 2022-06-30 0001914805 country:HK 2023-01-01 2023-06-30 0001914805 country:HK 2022-01-01 2022-06-30 0001914805 country:MY 2023-01-01 2023-06-30 0001914805 country:MY 2022-01-01 2022-06-30 0001914805 country:CN 2023-01-01 2023-06-30 0001914805 country:CN 2022-01-01 2022-06-30 0001914805 country:SG 2023-01-01 2023-06-30 0001914805 country:SG 2022-01-01 2022-06-30 0001914805 country:KR 2023-01-01 2023-06-30 0001914805 country:KR 2022-01-01 2022-06-30 0001914805 BANL:OtherMember 2023-01-01 2023-06-30 0001914805 BANL:OtherMember 2022-01-01 2022-06-30 iso4217:USD xbrli:shares iso4217:USD xbrli:shares iso4217:MYR iso4217:HKD iso4217:CNY BANL:Integer utr:bbl utr:t xbrli:pure
Exhibit 99.2
INDEX TO THE UNAUDITED CONDENSED CONSOLIDATED FINANCIAL STATEMENTS
CBL INTERNATIONAL LIMITED AND ITS SUBSIDIARIES
TABLE OF CONTENTS
CBL INTERNATIONAL LIMITED AND ITS SUBSIDIARIES
UNAUDITED CONDENSED CONSOLIDATED BALANCE SHEETS
(Expressed in U.S. dollars, except for the number of shares)
| | | June 30, | | | December 31, | |
| | | 2023 | | | 2022 | |
| | | (Unaudited) | | | (Unaudited) | |
| Assets: | | | | | | | | |
| Current Assets | | | | | | | | |
| Cash | | $ | 10,430,980 | | | $ | 5,032,890 | |
| Accounts receivable | | | 30,929,095 | | | | 18,446,176 | |
| Prepayments and other current assets | | | 11,288,887 | | | | 253,779 | |
| Total current assets | | | 52,648,962 | | | | 23,732,845 | |
| | | | | | | | | |
| Property, plant and equipment, net | | | 859,160 | | | | 394,090 | |
| Right-of-use lease assets, net | | | 279,886 | | | | 341,625 | |
| Deferred offering costs | | | - | | | | 1,128,453 | |
| | | | | | | | | |
| Total assets | | $ | 53,788,008 | | | $ | 25,597,013 | |
| | | | | | | | | |
| Liabilities and Shareholders’ Equity: | | | | | | | | |
| Liabilities | | | | | | | | |
| Current liabilities | | | | | | | | |
| Accounts payable | | $ | 27,716,215 | | | $ | 12,652,514 | |
| Taxes payable | | | 314,017 | | | | 244,096 | |
| Accrued expenses and other current liabilities | | | 143,618 | | | | 125,701 | |
| Derivative liabilities | | | 8,688 | | | | 109,346 | |
| Short-term lease liabilities | | | 126,046 | | | | 124,095 | |
| Total current liabilities | | | 28,308,584 | | | | 13,255,752 | |
| | | | | | | | | |
| Long-term lease liabilities | | | 165,532 | | | | 229,076 | |
| Total liabilities | | | 28,474,116 | | | | 13,484,828 | |
| | | | | | | | | |
| Commitment and contingencies | | | - | | | | - | |
| | | | | | | | | |
| Shareholders’ equity: | | | | | | | | |
| Ordinary shares, $0.0001 par value, 500,000,000 shares authorized, 25,000,000 shares issued and outstanding as of June 30, 2023 and 21,250,000 shares as of December 31, 2022* | | | 2,500 | | | | 2,125 | |
| Additional paid-in capital | | | 12,536,085 | | | | 488,198 | |
| Retained earnings | | | 12,775,307 | | | | 11,621,862 | |
| Total shareholders’ equity | | | 25,313,892 | | | | 12,112,185 | |
| | | | | | | | | |
| Total liabilities and shareholders’ equity | | $ | 53,788,008 | | | $ | 25,597,013 | |
| * | Gives retroactive effect to reflect the reorganization in August 2022. |
The accompanying notes are an integral part of these unaudited consolidated financial statements.
CBL INTERNATIONAL LIMITED AND ITS SUBSIDIARIES
UNAUDITED CONDENSED CONSOLIDATED STATEMENTS OF INCOME AND COMPREHENSIVE INCOME
(Expressed in U.S. dollars, except for the number of shares)
| | | 2023 | | | 2022 | |
| | | For the Six Months Ended June 30, | |
| | | 2023 | | | 2022 | |
| | | (Unaudited) | | | (Unaudited) | |
| | | | | | | |
| Revenue | | $ | 191,955,811 | | | $ | 235,696,705 | |
| Cost of revenue | | | 187,949,993 | | | | 231,653,262 | |
| | | | | | | | | |
| Gross profit | | | 4,005,818 | | | | 4,043,443 | |
| | | | | | | | | |
| Operating expenses: | | | | | | | | |
| Selling and distribution | | | 601,149 | | | | 517,724 | |
| General and administrative | | | 1,909,922 | | | | 1,978,613 | |
| Total operating costs and expenses | | | 2,511,071 | | | | 2,496,337 | |
| | | | | | | | | |
| Income from operations | | | 1,494,747 | | | | 1,547,106 | |
| | | | | | | | | |
| Other (income) expense: | | | | | | | | |
| Interest expense, net | | | 116,434 | | | | 119,230 | |
| Currency exchange (gain) loss | | | (21,818 | ) | | | (14,812 | ) |
| | | | | | | | | |
| Total other expenses | | | 94,616 | | | | 104,418 | |
| | | | | | | | | |
| Provision for income taxes | | | 246,686 | | | | 353,792 | |
| Net income | | $ | 1,153,445 | | | $ | 1,088,896 | |
| | | | | | | | | |
| Comprehensive income | | $ | 1,153,445 | | | $ | 1,088,896 | |
| | | | | | | | | |
| Basic and diluted earnings per ordinary share* | | $ | 0.05 | | | $ | 0.05 | |
| | | | | | | | | |
| Weighted average number of ordinary shares outstanding - basic and diluted* | | | 25,000,000 | | | | 21,250,000 | |
| * | Gives retroactive effect to reflect the reorganization in August 2022. |
The accompanying notes are an integral part of these unaudited consolidated financial statements.
CBL INTERNATIONAL LIMITED AND ITS SUBSIDIARIES
UNAUDITED CONDENSED CONSOLIDATED STATEMENTS OF CHANGES IN SHAREHOLDERS’ EQUITY
(Expressed in U.S. dollars, except for the number of shares)
| | | Ordinary
shares* | | | Ordinary
shares
amount | | | Additional
paid-in
capital | | | Retained
earnings | | | Total
shareholders’
equity | |
| | | | | | | | | | | | | | | | |
| Balance as of December 31, 2021 | | | 21,250,000 | | | $ | 2,125 | | | $ | 488,198 | | | $ | 7,936,862 | | | $ | 8,427,185 | |
| | | | | | | | | | | | | | | | | | | | | |
| Net income | | | - | | | | - | | | | - | | | | 1,088,896 | | | | 1,088,896 | |
| | | | | | | | | | | | | | | | | | | | | |
| Balance as of June 30, 2022 | | | 21,250,000 | | | $ | 2,125 | | | $ | 488,198 | | | $ | 9,025,758 | | | $ | 9,516,081 | |
| | | Ordinary
shares* | | | Ordinary
shares
amount | | | Additional
paid-in
capital | | | Retained
earnings | | | Total
shareholders’
equity | |
| | | | | | | | | | | | | | | | |
| Balance as of December 31, 2022 | | | 21,250,000 | | | $ | 2,125 | | | $ | 488,198 | | | $ | 11,621,862 | | | $ | 12,112,185 | |
| Balance | | | 21,250,000 | | | $ | 2,125 | | | $ | 488,198 | | | $ | 11,621,862 | | | $ | 12,112,185 | |
| | | | | | | | | | | | | | | | | | | | | |
| Issuance of new ordinary shares | | | 3,750,000 | | | | 375 | | | | 12,047,887 | | | | - | | | | 12,048,262 | |
| | | | | | | | | | | | | | | | | | | | | |
| Net income | | | - | | | | - | | | | - | | | | 1,153,445 | | | | 1,153,445 | |
| | | | | | | | | | | | | | | | | | | | | |
| Balance as of June 30, 2023 | | | 25,000,000 | | | $ | 2,500 | | | $ | 12,536,085 | | | $ | 12,775,307 | | | $ | 25,313,892 | |
| Balance | | | 25,000,000 | | | $ | 2,500 | | | $ | 12,536,085 | | | $ | 12,775,307 | | | $ | 25,313,892 | |
| * | Gives retroactive effect to reflect the reorganization in August 2022. |
The accompanying notes are an integral part of these unaudited consolidated financial statements.
CBL INTERNATIONAL LIMITED AND ITS SUBSIDIARIES
UNAUDITED CONDENSED CONSOLIDATED STATEMENTS OF CASH FLOWS
(Expressed in U.S. dollars)
| | | 2023 | | | 2022 | |
| | | For the Six Months Ended June 30, | |
| | | 2023 | | | 2022 | |
| | | (Unaudited) | | | (Unaudited) | |
| Cash Flows from operating activities: | | | | | | | | |
| Net income | | $ | 1,153,445 | | | $ | 1,088,896 | |
| Adjustment to reconcile net income to net cash (used in) provided by operating activities: | | | | | | | | |
| Depreciation and amortization | | | 76,679 | | | | 42,376 | |
| Depreciation of right-of-use assets | | | 61,740 | | | | 36,029 | |
| Change in fair value of derivatives | | | (100,658 | ) | | | (311,277 | ) |
| Changes in operating assets and liabilities | | | | | | | | |
| Accounts receivable | | | (12,482,919 | ) | | | (5,170,468 | ) |
| Prepayments and other current assets | | | (11,035,107 | ) | | | 683,199 | |
| Due from related parties | | | - | | | | (271,413 | ) |
| Accounts payable | | | 15,063,701 | | | | 4,351,464 | |
| Accrued expenses and other liabilities | | | 17,919 | | | | (3,241 | ) |
| Lease liabilities | | | (61,593 | ) | | | (36,115 | ) |
| Taxes payable | | | 69,921 | | | | 349,639 | |
| Net cash provided by (used in) operating activities | | | (7,236,872 | ) | | | 759,089 | |
| | | | | | | | | |
| Cash flows from investing activities: | | | | | | | | |
| Purchase of property, plant and equipment | | | (541,750 | ) | | | (7,909 | ) |
| Net cash (used in) provided by investing activities | | | (541,750 | ) | | | (7,909 | ) |
| | | | | | | | | |
| Cash flows from financing activities: | | | | | | | | |
| Advance from a related party | | | - | | | | 719,773 | |
| Proceeds from issuance of new ordinary shares | | | 13,176,716 | | | | - | |
| Net cash provided by financing activities | | | 13,176,716 | | | | 719,773 | |
| | | | | | | | | |
| Net increase (decrease) in cash | | | 5,398,094 | | | | 1,470,953 | |
| Cash at the beginning of the period | | | 5,032,890 | | | | 3,035,321 | |
| Cash at the end of the year | | $ | 10,430,984 | | | $ | 4,506,274 | |
| | | | | | | | | |
| SUPPLEMENTAL DISCLOSURE OF CASH FLOWS INFORMATION: | | | | | | | | |
| Cash paid during the period for: | | | | | | | | |
| Interest | | $ | 138,086 | | | $ | 119,270 | |
| Income taxes | | $ | 176,765 | | | $ | 4,210 | |
The accompanying notes are an integral part of these unaudited consolidated financial statements.
NOTES TO THE UNAUDITED CONDENSED CONSOLIDATED FINANCIAL STATEMENTS
(Expressed in U.S. dollars, unless stated otherwise)
1. Organization and Principal Business
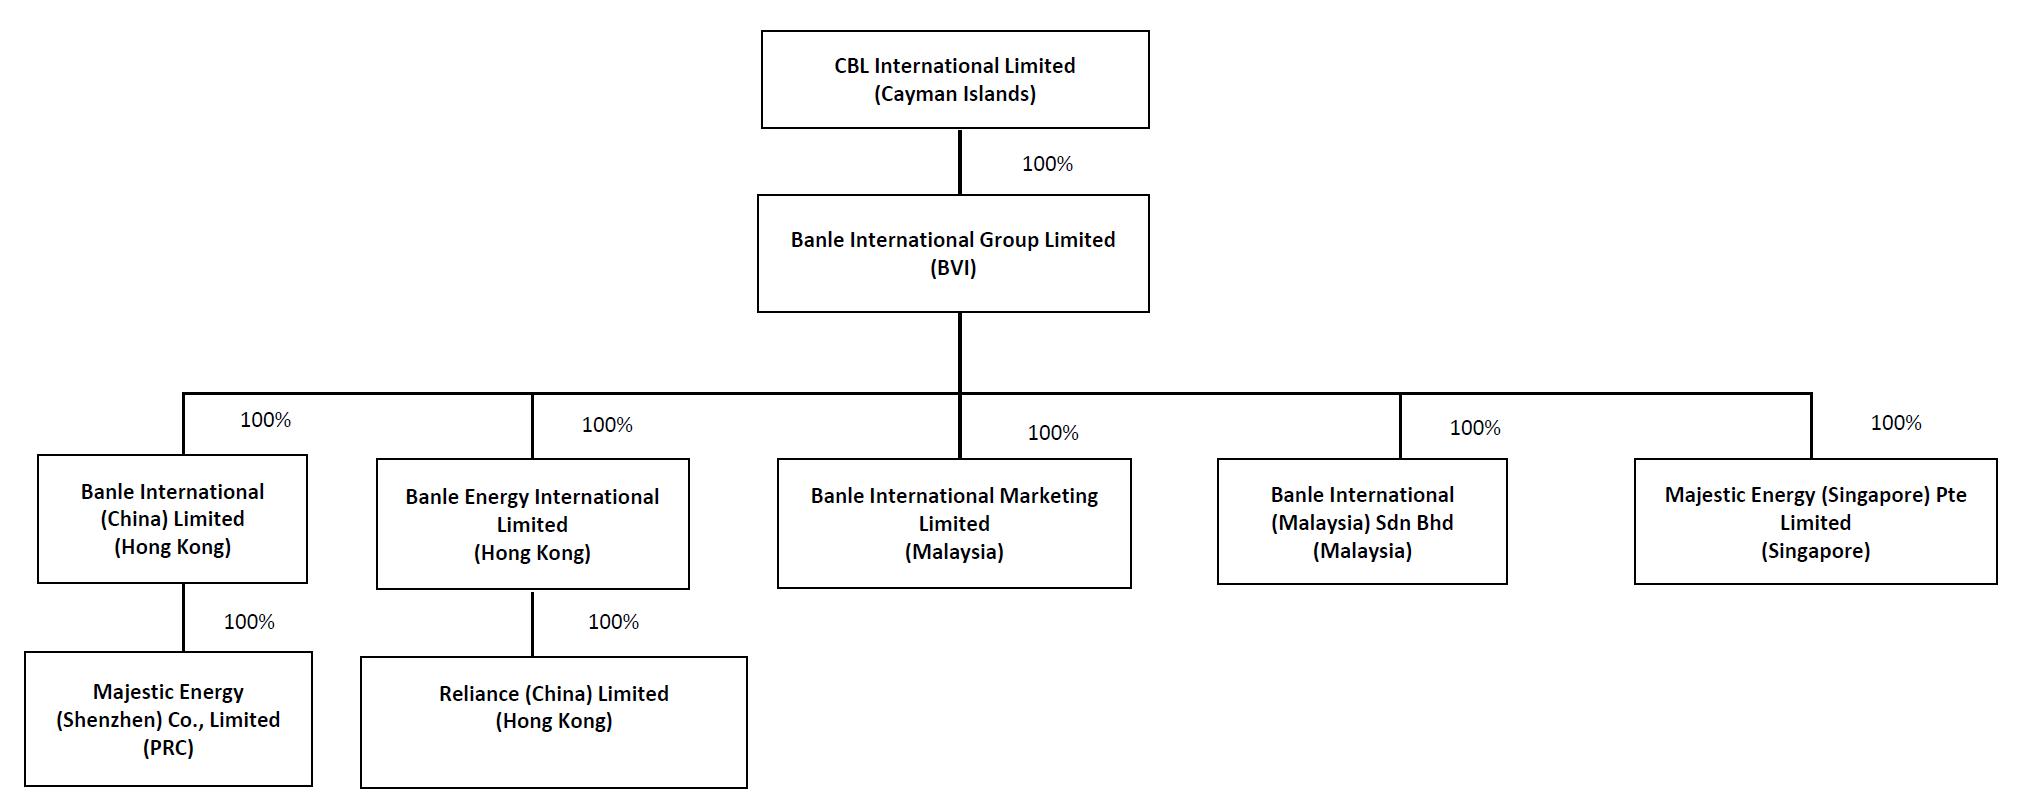
CBL International Limited (“CBL International”) was incorporated on February 8, 2022 in the Cayman Islands. CBL International is a holding company without any operations and it wholly owns Banle International Group Limited (“Banle BVI”) which was incorporated in the British Virgin Islands (collectively, the “Company”).
The Company is a marine fuel logistics company providing a one-stop solution for vessel refueling in the Asia Pacific region. As a bunkering facilitator, the Company expedites vessel refueling between ship operators and local physical distributors/traders of marine fuel. The Company purchases marine fuel from its suppliers and arranges its suppliers to deliver marine fuel to its customers, principally the container liner operators.
Business Reorganization and CBL International
A reorganization of the Company’s legal entity structure was completed in August 2022. The reorganization involved the incorporation of CBL International in February 2022, and the acquisition of Banle BVI by CBL International in August 2022. This transaction was treated as a recapitalization of the Company under common control and the financial statements give retroactive effect to this transaction.
Banle BVI was set up in July 2020 with 50,000 shares at $1.00 per share issued to Mr. Chia. In February 2021, Banle BVI issued 490,323 shares in total, of comprised 304,000 shares to CBL (Asia) Limited (“CBL (Asia)”) and 186,323 shares to Straits Energy Resources Berhad (“Straits”). The 50,000 shares originally issued to Mr. Chia were surrendered and cancelled at the same time.
CBL International was incorporated in the Cayman Islands with limited liability in February 2022, by issuing and allotting 50,000 shares at par value of $0.01 per share to Mr. Chia. In March 2022, each issued and unissued share was subdivided into 100 shares. Each share par value was reduced to $0.0001, and the authorized share capital was amended to 500,000,000 shares with $0.0001 par value per share. The number of shares held by Mr. Chia increased from 50,000 to 5,000,000 with a par value of $0.0001 each.
In August 2022, CBL (Asia) and Straits, as vendors, and CBL International, as purchaser, entered into a sale and purchase agreement, pursuant to which CBL International acquired the entire issued share capital of Banle BVI from its existing shareholders, CBL (Asia) and Straits, in consideration of which CBL International issued and allotted 13,175,000 shares and 8,075,000 shares, credited as fully paid, to CBL (Asia) and Straits, respectively. Upon completion of issuance and allotment of the shares to CBL (Asia) and Straits, the 5,000,000 shares of CBL International issued to Mr. Chia were surrendered and cancelled; and CBL International became the 100% shareholder of Banle BVI and itself being owned 62% by CBL (Asia) and 38% by Straits.
On March 23, 2023, the Company consummated the initial public offering of 3,325,000 ordinary shares, par value of $0.0001 per share at a price of $4.00 per share (the “Offering”), The Company’s underwriters exercised their over-allotment option in part for an additional 425,000 ordinary shares on March 27, 2023 (“Over-allotment Option”). The Over-allotment Option was closed with the Offering. Upon completion of the Offering, the ordinary share capital of the Company became $2,500, representing 25,000,000 shares of $0.0001 par value.
The total number of ordinary shares issued and outstanding as of June 30, 2023 was 25,000,000 shares. The Company’s ordinary shares began trading on the Nasdaq Capital Market on March 23, 2023 under the ticker symbol “BANL”.
Upon completion of issuance of the shares under the Offering, CBL International is effectively owned 52.7% by CBL (Asia), 32.3% by Straits and 15.0% by public shareholders.
2. Basis of Presentation, New Accounting Standards, and Significant Accounting Policies
The Unaudited Condensed Consolidated Financial Statements and related notes include all the accounts of the Company and its wholly owned subsidiaries. The Unaudited Condensed Consolidated Financial Statements are prepared in accordance with accounting principles generally accepted in the United States of America (“U.S. GAAP”), for the purposes of filing the 2023 Interim Report on Form 6-K (“2023 6-K Report”). Accordingly, they do not include all the information and footnotes required by U.S. GAAP for complete financial statements. However, except as disclosed herein, there has been no material change in the information disclosed in the Notes included in our 2022 Annual Report on Form 20-F (“2022 20-F Report”). All intercompany transactions have been eliminated in consolidation.
The information included in this 2023 6-K Report should be read in conjunction with the Consolidated Financial Statements and accompanying Notes included in our 2022 20-F Report. Certain amounts in the Unaudited Condensed Consolidated Financial Statements and accompanying Notes may not add due to rounding; however, all percentages have been calculated using unrounded amounts.
New Accounting Standards
Adoption of New Accounting Standards
Disclosure of Supplier Finance Program Obligations. In September 2022, Accounting Standards Update (“ASU”) 2022-04 was issued to require the buyer in a supplier finance program to disclose the key terms of the program, outstanding confirmed amounts as of the end of the period, a rollforward of such amounts during each annual period, and a description of where in the financial statements outstanding amounts are presented. The amendments do not affect the recognition, measurement or financial statement presentation of supplier finance program obligations. The amendments are effective for fiscal years beginning after December 15, 2022, including interim periods within those fiscal years. The amendments should be applied retrospectively to each period in which a balance sheet is presented, except for the rollforward, which should be applied prospectively. Early adoption was permitted. The Company did not adopt ASU 2022-04 in the first half of 2023 as we consider that it is not applicable to the Company.
Accounting Standards Issued but Not Yet Adopted
There are no recently issued accounting standards not yet adopted by us that are expected, upon adoption, to have a material impact on the Company’s Consolidated Financial Statements or processes.
Significant Accounting Policies
There have been no significant changes in the Company’s accounting policies from those disclosed in our 2022 20-F Report. The significant accounting policies we use for interim financial reporting are disclosed in Note 2 Summary of Significant Accounting Policies of the accompanying Notes to the Consolidated Financial Statements included in our 2022 20-F Report.
3. Accounts Receivable
Accounts receivable represent trade receivables from customers. We extend credit to our customers on an unsecured basis. Our exposure to credit losses depends on the financial conditions of them and macroeconomic factors beyond our controls, such as global economic conditions or adverse impacts in the industries we serve, changes in oil prices and political instability. The health of our accounts receivable is continuously monitored, taking into consideration both changes in our customers’ financial conditions and macroeconomic events. We adjust credits limits based upon payment history and creditworthiness of our customers. Because we extend credit on an unsecured basis to most of customers, there is possibility that any accounts receivable not collected may ultimately need to be written off.
The Company had accounts receivable of approximately $30,929,095 and $18,446,176 as of June 30, 2023 and December 31, 2022, respectively, of which accounts receivable from the top five customers accounted for approximately $23,958,875 and $9,253,060 As of June 30, 2023 and December 31, 2022 accounted for approximately 77.5% (the largest of which accounted for 25.0%) and 50.2% (the largest of which accounted for 22.4%) of total accounts receivable, respectively. The Company has no allowance for doubtful accounts as of June 30, 2023 and December 31, 2022 and no bad debt expense for the six months then ended.
Subsequent to June 30, 2023, all accounts receivable as of June 30, 2023 have been collected.
As of June 30, 2023, the Company did not sell any accounts receivable to a bank under a non-recourse factoring arrangement. As of December 31, 2022, accounts receivable in the amount of $4,134,637 were sold to a bank under a non-recourse factoring arrangement.
4. Derivative Instruments
The Company values its derivative instruments using alternative pricing sources and market observable inputs, and accordingly the Company classifies the valuation techniques that use these inputs as Level 2.
The following table presents the gross fair value of the Company’s derivative instruments not designated as hedging instruments and their locations on the consolidated balance sheets:
Schedule of Derivative Instruments
| | | As of June 30, 2023 (Unaudited) | |
| Derivative liabilities | | Level 1 input | | | Level 2 input | | | Level 3 input | | | Total fair value | |
| Commodity contracts | | $ | - | | | $ | 8,688 | | | $ | - | | | $ | 8,688 | |
| | | As of December 31, 2022 (Unaudited) | |
| Derivative liabilities | | Level 1 input | | | Level 2 input | | | Level 3 input | | | Total fair value | |
| Commodity contracts | | $ | - | | | $ | 109,346 | | | $ | - | | | $ | 109,346 | |
The following table summarizes the gross notional values of the Company’s commodity contracts used for risk management purposes that were outstanding as of June 30, 2023, and December 31, 2022:
Schedule of Gross Notional Value
| | | As of June 30, | | | As of December 31, |
| Derivative Instruments | | Units | | | 2023 | | | Units | | 2022 | |
| Commodity contracts | | | | | | | | | | | | | | |
| Long | | | Metric ton | | | | 4,550 | | | Metric ton | | | 3,600 | |
| Short | | | - | | | | - | | | Metric ton | | | 500 | |
The following table presents the effect and financial statement location of the Company’s derivative instruments not designated as hedging instruments on the Company’s consolidated statements of income and comprehensive income:
The following are the amounts of realized and unrealized gain during the six months ended June 30, 2023 and 2022:
Schedule of Realized and Unrealized Gain
| | | Location | | 2023 | | | 2022 | |
| | | | | (Unaudited) | | | (Unaudited) | |
| Realized and unrealized gain from commodity contracts | | Cost of revenue | | $ | 239,452 | | | $ | 1,594,504 | |
5. Prepayment and other current assets
Prepayment and other current assets as of June 30, 2023, and December 31, 2022, consist of the following:
Schedule of prepayment and other current assets
| | | As of June 30, | | | As of December 31, | |
| | | 2023 | | | 2022 | |
| | | | (Unaudited) | | | | (Unaudited) | |
| Prepayments | | $ | 11,215,181 | | | $ | 167,677 | |
| Deposit | | | 73,706 | | | | 86,102 | |
| Total | | $ | 11,288,887 | | | $ | 253,779 | |
Prepayments as of June 30, 2023, principally represent advance payments made to suppliers in an aggregated amount of approximately $10,980,000 for the purchase of marine fuel.
6. Property, Plant and Equipment
The details of property and equipment are as follows:
Schedule of Property Plant and Equipment
| | | As of June 30, 2023 | | | As of December 31, 2022 | |
| | | (Unaudited) | | | (Unaudited) | |
| Office equipment, furniture and fixtures | | $ | 375,262 | | | $ | 363,167 | |
| Less: accumulated depreciation and amortization | | | 76,572 | | | | 22,284 | |
| Office equipment, furniture and fixtures, net | | $ | 298,690 | | | $ | 340,883 | |
During the six months ended June 30, 2023 and 2022, the Company recorded depreciation charges of approximately $54,000 and $55,000, respectively.
The details of motor vehicle are as follows:
Schedule of Property Plant and Equipment
| | | As of June 30, 2023 | | | As of December 31, 2022 | |
| | | (Unaudited) | | | (Unaudited) | |
| Motor vehicle | | $ | 190,787 | | | $ | 98,632 | |
| Less: accumulated depreciation | | | 99,717 | | | | 84,542 | |
| Motor vehicle, net | | $ | 91,070 | | | $ | 14,090 | |
During the six months ended June 30, 2023, and 2022, the Company recorded depreciation charges of approximately $15,000 and $21,000 respectively.
The details of computer software costs are as follows:
Schedule of Property Plant and Equipment
| | | As of June 30, 2023 | | | As of December 31, 2022 | |
| | | (Unaudited) | | | (Unaudited) | |
| Computer software | | $ | 517,655 | | | $ | 80,155 | |
| Less: accumulated amortization | | | 48,255 | | | | 41,038 | |
| Computer software costs, net | | $ | 469,400 | | | $ | 39,117 | |
During the six months ended June 30, 2023, and 2022, the Company recorded amortization charges related to computer software of approximately $7,000 and $13,000 respectively.
7. Interest Income and Interest Expense
In 2021, the Company entered into a factoring agreement for $4.8 million with a commercial bank to purchase certain accounts receivable on a non-recourse basis. As of June 30, 2023, the factoring facility was increased to $13.6 million. As invoices were factored with the bank, they were not recorded as accounts receivable in the Company’s consolidated financial statements. As of June 30, 2023, accounts receivable factored were nil ($4.1 million as of December 31, 2022).
As of June 30, 2023, the unused portion of the financing facilities was approximately $13.6 million ($9.5 million as of December 31, 2022).
The interest rates under the factoring agreement range from 1.2% to 1.25% (2022: 1.2% to 1.25%) over the bank’s cost of funds per annum.
The following table provides additional information about the Company’s interest income, interest expense and other financing costs, net for the six months ended June 30, 2023, and 2022:
Schedule of Interest Income and Interest Expense
| | | 2023 | | | 2022 | |
| | | (Unaudited) | | | (Unaudited) | |
| Interest income | | $ | 21,652 | | | $ | 39 | |
| Interest expense on lease liabilities | | | (4,987 | ) | | | (1,435 | ) |
| Interest expense on factoring arrangement | | | (133,099 | ) | | | (117,834 | ) |
| Total | | $ | (116,434 | ) | | $ | (119,230 | ) |
8. Commitments and Contingencies
Sales and Purchase Commitments
As of June 30, 2023, the Company has committed to sell to certain customers a minimum of 102,450 MT to a maximum of 166,600 MT bunkers with delivery to be made in third quarter of 2023. As of June 30, 2023, the Company has committed to buy from certain suppliers a minimum of 57,000 MT to a maximum of 75,000 MT bunkers to be delivered in third quarter of 2023.
Contingencies
The Company is subject to legal proceedings and regulatory actions in the ordinary course of business. The results of such proceedings cannot be predicted with certainty, and the Company does not anticipate that the final outcome arising out of any such matter will have a material adverse effect on its consolidated financial position, cash flows or results of operations. As of June 30, 2023, and December 31, 2022, the Company is not a party to any material legal or administrative proceedings and did not have any significant contingencies.
9. Income Taxes
British Virgin Islands
Under the current laws of the British Virgin Islands, the Company is not subject to any income tax.
Hong Kong
Under the two-tiered profit tax rate regime of Hong Kong Profits Tax, the first HK$2,000,000 (approximately $258,000), profits will be taxed at 8.25%, and profits above HK$2,000,000 will be taxed at 16.5%. For the six months ended June 30, 2023, and 2022, the Company had $1,632,263 and $2,196,734, respectively, of income subject to the Hong Kong Profits Tax.
Malaysia
Malaysia Income Tax is calculated at 24% of the estimated assessable profits for the relevant year. For the six months ended June 30, 2023, and 2022, the Company had $19,235 and $8,232, respectively, of income subject to the Malaysia Income Tax.
The income tax provision for the six months ended June 30, 2023, and 2022, consists of the following:
Schedule of Income Before Income Taxes
| | | 2023 | | | 2022 | |
| | | (Unaudited) | | | (Unaudited) | |
| Current: | | | | | | | | |
| Hong Kong | | $ | 242,070 | | | $ | 351,816 | |
| Malaysia | | | 4,616 | | | | 1,976 | |
| Total | | $ | 246,686 | | | $ | 353,792 | |
| | | | | | | | | |
| Deferred | | | - | | | | - | |
| Total | | $ | 246,686 | | | $ | 353,792 | |
The following is a reconciliation of the Company’s total income tax expense to the income before income taxes for the six months ended June 30, 2023, and 2022, respectively.
Schedule of Components of Income Tax Expense
| | | 2023 | | | 2022 | |
| | | (Unaudited) | | | (Unaudited) | |
| Tax at the domestic income tax rate of 16.5% | | | 231,022 | | | | 238,044 | |
| Tax effect of Hong Kong graduated rates | | | (10,645 | ) | | | (10,645 | ) |
| Non-taxable gain | | | (16,609 | ) | | | - | |
| Foreign tax rate differentials | | | 1,443 | | | | 618 | |
| Non-deductible expenses for tax purpose | | | 19,767 | | | | 125,775 | |
| Unrecognized tax benefit | | | 21,708 | | | | - | |
| | | | | | | | | |
| Income tax expense | | $ | 246,686 | | | $ | 353,792 | |
10. Revenue Disaggregation
Geographic Information
The following table breaks down revenue for the six months ended June 30, 2023, and 2022, respectively by geographic location of the Company’s revenue. The geographical location is based on the locations at which the marine fuel is delivered to the customers.
Schedule of Revenue by Geographic Location
| | | 2023 | | | 2022 | |
| | | (Unaudited) | | | (Unaudited) | |
| China | | $ | 100,988,136 | | | $ | 114,427,297 | |
| Hong Kong | | | 63,594,042 | | | | 102,130,078 | |
| Malaysia | | | 21,358,117 | | | | 12,684,443 | |
| Singapore | | | 2,989,753 | | | | 3,356,084 | |
| South Korea | | | 2,848,406 | | | | - | |
| Other | | | 177,357 | | | | 3,098,803 | |
| Total: | | $ | 191,955,811 | | | $ | 235,696,705 | |
Other includes primarily Vietnam, Taiwan, and Thailand.
11. Finance and Operating Leases
The Company leases offices. The leases are for periods of two to five years.
For the six months ended June 30, 2023, and 2022, the Company recognized the following total lease cost related to the Company’s lease arrangements:
Schedule of Lease Cost
| | | 2023 | | | 2022 | |
| | | (Unaudited) | | | (Unaudited) | |
| Finance lease and operating lease costs | | | 66,726 | | | | 37,465 | |
| Expenses relating to short-term leases | | | 5,510 | | | | 11,210 | |
| Total lease cost | | $ | 72,236 | | | $ | 48,675 | |
During the six months ended June 30, 2023, the Company entered into new a lease for the rental of property which has not commenced as of June 30, 2023. In this connection, no right-of-use assets and lease liabilities were recognized.
As of June 30, 2023, the Company’s remaining lease payments are as follows:
Schedule of Remaining Lease Payments
| | | Leases | |
| | | (Unaudited) | |
| 2023 | | $ | 66,581 | |
| 2024 | | | 133,161 | |
| 2025 | | | 102,090 | |
| Total remaining lease payments (undiscounted) | | | 301,832 | |
| Less: imputed interest | | | 10,254 | |
| Present value of lease liabilities | | $ | 291,578 | |
Supplemental balance sheet information related to leases:
Schedule of Supplemental Balance Sheet Information
| | | Classification | | As of June 30, 2023 | | | As of December 31, 2022 | |
| | | | | (Unaudited) | | | (Unaudited) | |
| Assets: | | | | | | | | | | |
| Operating lease assets | | Right-of-use lease assets | | $ | 279,886 | | | $ | 341,625 | |
| Operating leases | | | | | | | | | | |
| Lease Liability - current | | Current liabilities – lease liabilities | | $ | 126,046 | | | $ | 124,095 | |
| Lease liability – non-current | | Non-current liabilities – lease liabilities | | $ | 165,532 | | | $ | 229,076 | |
Other information related to leases for the six months ended June 30, 2023 and 2022:
Schedule of Other Information Related to Leases
| | | 2023 | | | 2022 | |
| | | (Unaudited) | | | (Unaudited) | |
| Weighted-average remaining lease term (years) - operating leases | | | 1.3 | | | | 1.2 | |
| Weighted-average discount rate - operating leases | | | 3.2 | % | | | 2.9 | % |
| Cash paid for amounts included in the measurement of lease liabilities: | | | | | | | | |
| Operating cash flows from finance leases | | $ | - | | | $ | - | |
| Operating cash flows from operating leases | | $ | 61,594 | | | $ | 36,115 | |