Exhibit 99.1 INVESTOR PRESENTATION March 2022 NYSE: DINO
Disclosure Statement Statements made during the course of this presentation that are not historical facts are “forward-looking statements” within the meaning of the U.S. Private Securities Litigation Reform Act of 1995. Words such as “anticipate,” “project,” “will”, “expect,” “plan,” “goal,” “forecast,” “strategy,” “intend,” “should,” “would,” “could,” “believe,” “may,” and similar expressions and statements regarding our plans and objectives for future operations are intended to identify forward-looking statements. Forward- looking statements are inherently uncertain and necessarily involve risks that may affect the business prospects and performance of HF Sinclair Corporation (“HF Sinclair”) and/or Holly Energy Partners, L.P. (“HEP”), and actual results may differ materially from those discussed during the presentation. These statements are based on management’s beliefs and assumptions using currently available information and expectations as of the date thereof, are not guarantees of future performance and involve certain risks and uncertainties. All statements concerning HF Sinclair’s expectations for future results of operations are based on forecasts for our existing operations and do not include the potential impact of any future acquisitions. Although we believe that the expectations reflected in these forward- looking statements are reasonable, we cannot assure you that our expectations will prove correct. Therefore, actual outcomes and results could materially differ from what is expressed, implied or forecast in such statements. Any differences could be caused by a number of factors, including, but not limited to, the ability of HF Sinclair and HEP to successfully integrate the operations of Sinclair with their existing operations and fully realize the expected synergies of the Sinclair transactions or on the expected timeline, risks relating to the value of HF Sinclair common stock and the value of HEP’s common units from sales by the Sinclair holders following the closing of the Sinclair transactions, the ability of HF Sinclair to successfully integrate the operation of the Puget Sound refinery with its existing operations, the demand for and supply of crude oil and refined products, including uncertainty regarding the effects of the continuing COVID-19 pandemic on future demand, and increasing societal expectations that companies address climate change, risks and uncertainties with respect to the actions of actual or potential competitive suppliers and transporters of refined petroleum products or lubricant and specialty products in HF Sinclair’s and HEP’s markets, the spread between market prices for refined products and market prices for crude oil, the possibility of constraints on the transportation of refined products or lubricant and specialty products, the possibility of inefficiencies, curtailments or shutdowns in refinery operations or pipelines, whether due to infection in the workforce or in response to reductions in demand, the effects of current and/or future governmental and environmental regulations and policies, including the effects of current and/or future restrictions on various commercial and economic activities in response to the COVID-19 pandemic, the availability and cost of financing to HF Sinclair and HEP, the effectiveness of HF Sinclair’s and HEP’s capital investments and marketing strategies, HF Sinclair's and HEP’s efficiency in carrying out and consummating construction projects, including HF Sinclair’s and HEP’s ability to complete announced capital projects, such as the construction of the Artesia renewable diesel unit, on time and within capital guidance, HF Sinclair’s and HEP’s ability to timely obtain or maintain permits, including those necessary for operations or capital projects, the ability of HF Sinclair to acquire refined or lubricant product operations or pipeline and terminal operations on acceptable terms and to integrate any existing or future acquired operations, the possibility of terrorist or cyberattacks and the consequences of any such attacks, uncertainty regarding the effects and duration of global hostilities and any associated military campaigns, which may disrupt crude oil supplies and markets for our refined products and create instability in the financial markets that could restrict our ability to raise capital, general economic conditions, including uncertainty regarding the timing, pace and extent of an economic recovery in the United States, a prolonged economic slowdown due to the COVID-19 pandemic which could result in an impairment of goodwill and/or long-lived asset impairments, and other financial, operational and legal risks. Additional information on risks and uncertainties that could affect the business prospects and performance of HF Sinclair and HEP is provided in the most recent reports of HF Sinclair and HEP filed with the Securities and Exchange Commission. All forward-looking statements included in this presentation are expressly qualified in their entirety by the foregoing cautionary statements. The forward-looking statements speak only as of the date made and, other than as required by law, HF Sinclair and HEP undertake no obligation to publicly update or revise any forward-looking statements, whether as a result of new information, future events or otherwise. 2
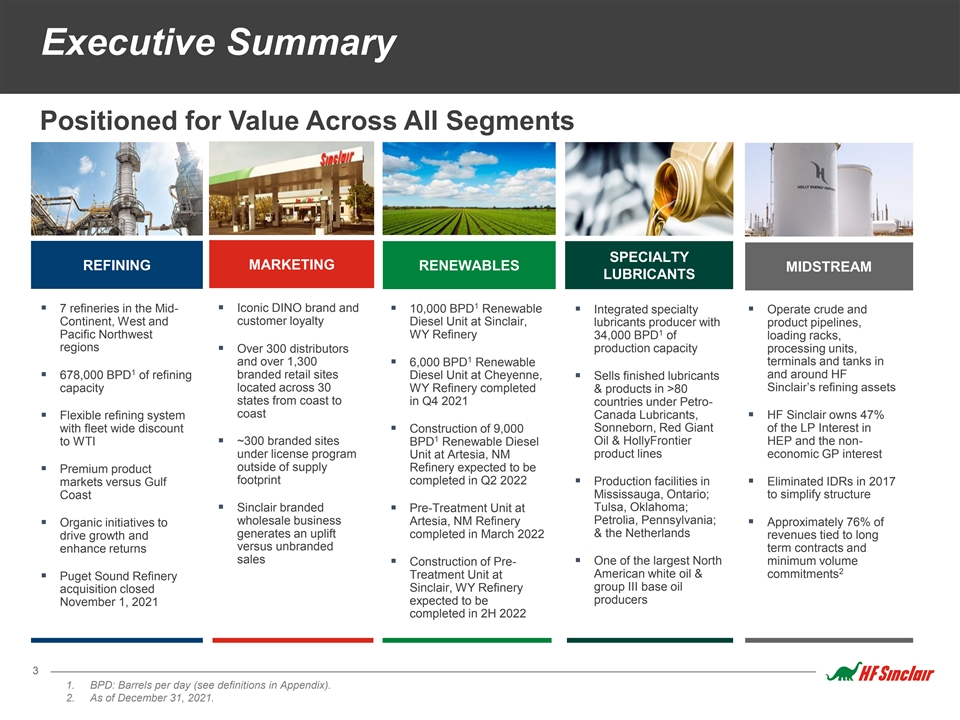
Executive Summary Positioned for Value Across All Segments SPECIALTY MARKETING REFINING RENEWABLES MIDSTREAM LUBRICANTS 1 § 7 refineries in the Mid-§ Iconic DINO brand and § 10,000 BPD Renewable § Integrated specialty § Operate crude and Continent, West and customer loyalty Diesel Unit at Sinclair, lubricants producer with product pipelines, 1 Pacific Northwest WY Refinery 34,000 BPD of loading racks, regions production capacity processing units, § Over 300 distributors 1 and over 1,300 terminals and tanks in § 6,000 BPD Renewable 1 § 678,000 BPD of refining branded retail sites and around HF Diesel Unit at Cheyenne, § Sells finished lubricants capacity located across 30 WY Refinery completed Sinclair’s refining assets & products in >80 states from coast to in Q4 2021 countries under Petro- coast Canada Lubricants, § HF Sinclair owns 47% § Flexible refining system Sonneborn, Red Giant of the LP Interest in with fleet wide discount § Construction of 9,000 1 to WTI§ ~300 branded sites BPD Renewable Diesel Oil & HollyFrontier HEP and the non- product lines under license program Unit at Artesia, NM economic GP interest outside of supply Refinery expected to be § Premium product footprint completed in Q2 2022§ Production facilities in § Eliminated IDRs in 2017 markets versus Gulf Coast Mississauga, Ontario; to simplify structure § Sinclair branded § Pre-Treatment Unit at Tulsa, Oklahoma; Petrolia, Pennsylvania; wholesale business Artesia, NM Refinery § Organic initiatives to § Approximately 76% of generates an uplift & the Netherlands completed in March 2022 revenues tied to long drive growth and versus unbranded term contracts and enhance returns sales § One of the largest North minimum volume § Construction of Pre- 2 American white oil & Treatment Unit at commitments § Puget Sound Refinery group III base oil Sinclair, WY Refinery acquisition closed producers expected to be November 1, 2021 completed in 2H 2022 3 1. BPD: Barrels per day (see definitions in Appendix). 2. As of December 31, 2021.

HF Sinclair Asset Footprint 4 Note: Renewable Diesel Unit at Artesia, NM expected to be completed in 2Q 2022.
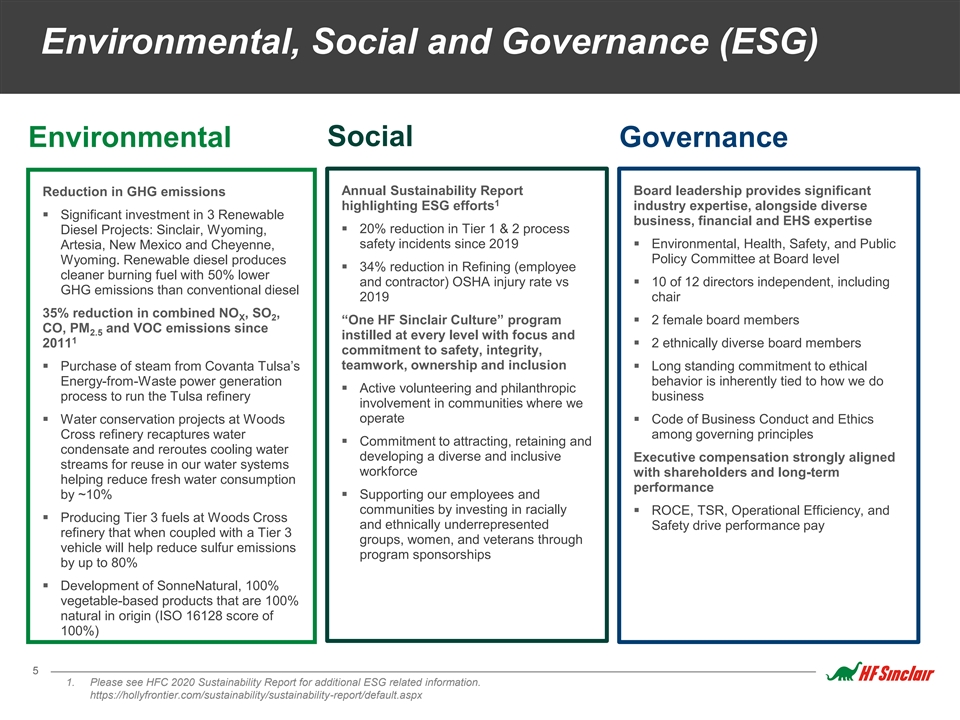
Environmental, Social and Governance (ESG) Environmental Social Governance Annual Sustainability Report Board leadership provides significant Reduction in GHG emissions 1 highlighting ESG efforts industry expertise, alongside diverse § Significant investment in 3 Renewable business, financial and EHS expertise § 20% reduction in Tier 1 & 2 process Diesel Projects: Sinclair, Wyoming, safety incidents since 2019§ Environmental, Health, Safety, and Public Artesia, New Mexico and Cheyenne, Wyoming. Renewable diesel produces Policy Committee at Board level § 34% reduction in Refining (employee cleaner burning fuel with 50% lower and contractor) OSHA injury rate vs § 10 of 12 directors independent, including GHG emissions than conventional diesel 2019 chair 35% reduction in combined NO , SO , X 2 “One HF Sinclair Culture” program § 2 female board members CO, PM and VOC emissions since 2.5 instilled at every level with focus and 1 2011§ 2 ethnically diverse board members commitment to safety, integrity, teamwork, ownership and inclusion § Purchase of steam from Covanta Tulsa’s § Long standing commitment to ethical Energy-from-Waste power generation behavior is inherently tied to how we do § Active volunteering and philanthropic process to run the Tulsa refinery business involvement in communities where we operate § Water conservation projects at Woods § Code of Business Conduct and Ethics Cross refinery recaptures water among governing principles § Commitment to attracting, retaining and condensate and reroutes cooling water developing a diverse and inclusive Executive compensation strongly aligned streams for reuse in our water systems workforce with shareholders and long-term helping reduce fresh water consumption performance by ~10%§ Supporting our employees and communities by investing in racially § ROCE, TSR, Operational Efficiency, and § Producing Tier 3 fuels at Woods Cross and ethnically underrepresented Safety drive performance pay refinery that when coupled with a Tier 3 groups, women, and veterans through vehicle will help reduce sulfur emissions program sponsorships by up to 80% § Development of SonneNatural, 100% vegetable-based products that are 100% natural in origin (ISO 16128 score of 100%) 5 1. Please see HFC 2020 Sustainability Report for additional ESG related information. https://hollyfrontier.com/sustainability/sustainability-report/default.aspx

Refining Overview Expanded Footprint centered around Mid-Continent, Southwest, Rocky Mountain and Pacific Northwest with 678,000 BPD oil processing capacity West Region Mid-Continent Region Puget Sound Refinery (Anacortes, WA) El Dorado Refinery (El Dorado, KS) § 149,000 BPD capacity § 135,000 BPD capacity § Crude slate: Canadian mixed sweet and sour and Alaskan North § Crude slate: WCS, Bakken and Permian sour crude Slope crude § Distributes to high-margin markets in CO, and Mid- § Distributes to high-margin markets in WA, OR, and British Columbia Continent states Navajo Refinery (Artesia, NM) Tulsa Refinery (Tulsa, OK) § 100,000 BPD capacity § 125,000 BPD capacity § Crude slate: Permian sweet and sour crude§ Crude slate: Domestic sweet with up to 10,000 BPD of WCS crude § Distributes to high-margin markets in AZ, NM, and west TX § Distributes to Mid-Continent states Sinclair Refinery (Sinclair, WY) § Integrated refinery with base oil and lubricant § 94,000 BPD capacity production § Crude slate: Canadian heavy and Rockies sweet crude § Distributes to high-margin markets in greater Rocky Mountain region Woods Cross Refinery (Salt Lake City, UT) § 45,000 BPD capacity § Crude slate: Regional sweet and heavy crude § Distributes to high-margin markets in UT, ID, NV, WY, and eastern WA Casper Refinery (Casper, WY) § 30,000 BPD capacity § Crude slate: Rockies sweet § Distributes to high-margin markets in greater Rocky Mountain region 6
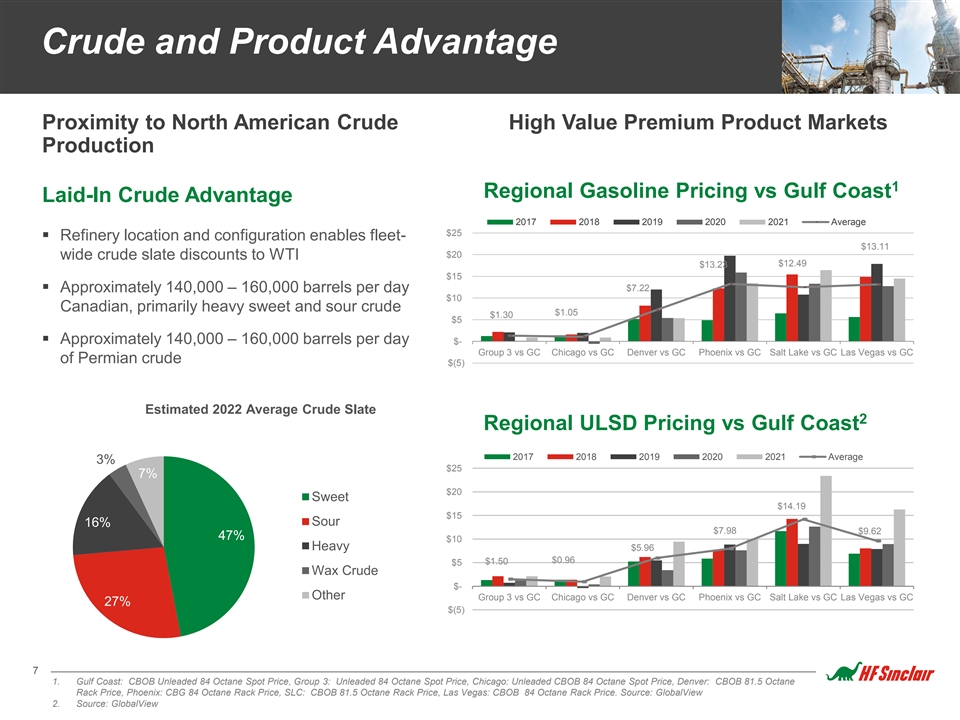
Crude and Product Advantage Proximity to North American Crude High Value Premium Product Markets Production 1 Regional Gasoline Pricing vs Gulf Coast Laid-In Crude Advantage 2017 2018 2019 2020 2021 Average $25 § Refinery location and configuration enables fleet- $13.11 $20 wide crude slate discounts to WTI $12.49 $13.23 $15 § Approximately 140,000 – 160,000 barrels per day $7.22 $10 Canadian, primarily heavy sweet and sour crude $1.05 $1.30 $5 § Approximately 140,000 – 160,000 barrels per day $- Group 3 vs GC Chicago vs GC Denver vs GC Phoenix vs GC Salt Lake vs GC Las Vegas vs GC of Permian crude $(5) Estimated 2022 Average Crude Slate 2 Regional ULSD Pricing vs Gulf Coast 2017 2018 2019 2020 2021 Average 3% $25 7% $20 Sweet $14.19 $15 16% Sour $7.98 $9.62 47% $10 Heavy $5.96 $1.50 $0.96 $5 Wax Crude $- Other Group 3 vs GC Chicago vs GC Denver vs GC Phoenix vs GC Salt Lake vs GC Las Vegas vs GC 27% $(5) 7 1. Gulf Coast: CBOB Unleaded 84 Octane Spot Price, Group 3: Unleaded 84 Octane Spot Price, Chicago: Unleaded CBOB 84 Octane Spot Price, Denver: CBOB 81.5 Octane Rack Price, Phoenix: CBG 84 Octane Rack Price, SLC: CBOB 81.5 Octane Rack Price, Las Vegas: CBOB 84 Octane Rack Price. Source: GlobalView 2. Source: GlobalView
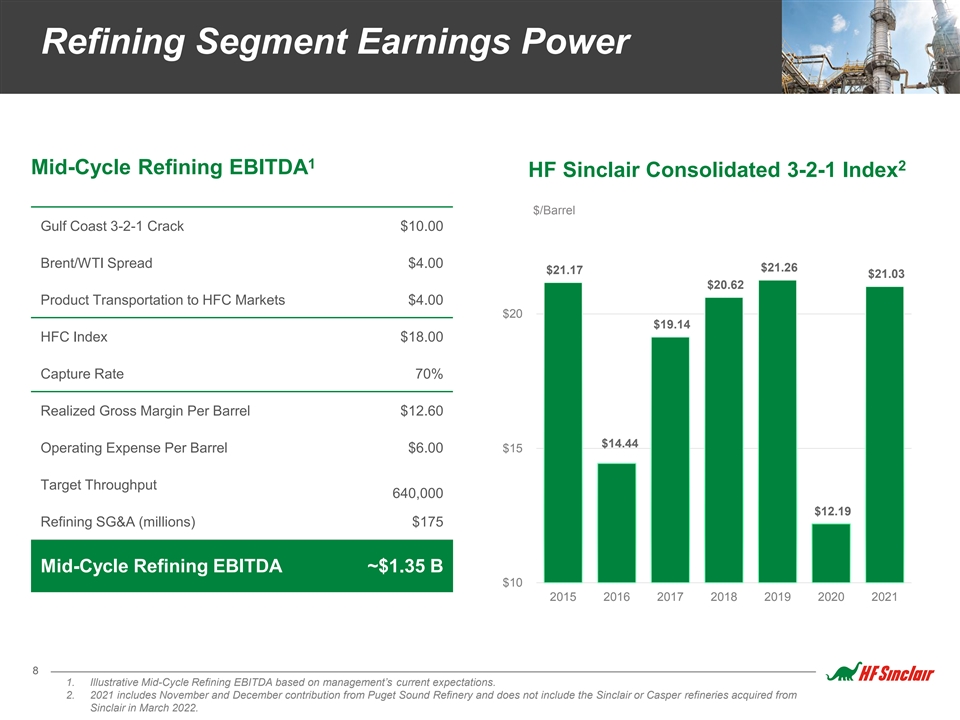
Refining Segment Earnings Power 1 2 Mid-Cycle Refining EBITDA HF Sinclair Consolidated 3-2-1 Index $/Barrel Gulf Coast 3-2-1 Crack $10.00 Brent/WTI Spread $4.00 $21.26 $21.17 $21.03 $20.62 Product Transportation to HFC Markets $4.00 $20 $19.14 HFC Index $18.00 Capture Rate 70% Realized Gross Margin Per Barrel $12.60 $14.44 $15 Operating Expense Per Barrel $6.00 Target Throughput 640,000 $12.19 Refining SG&A (millions) $175 Mid-Cycle Refining EBITDA ~$1.35 B $10 2015 2016 2017 2018 2019 2020 2021 8 1. Illustrative Mid-Cycle Refining EBITDA based on management’s current expectations. 2. 2021 includes November and December contribution from Puget Sound Refinery and does not include the Sinclair or Casper refineries acquired from Sinclair in March 2022.
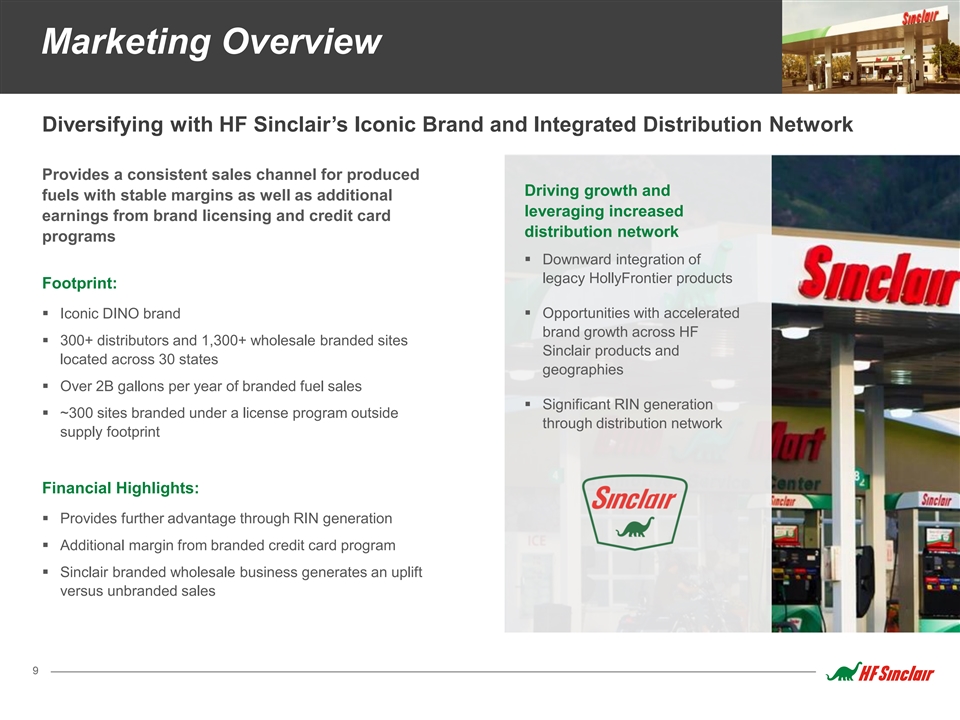
Marketing Overview Diversifying with HF Sinclair’s Iconic Brand and Integrated Distribution Network Provides a consistent sales channel for produced Driving growth and fuels with stable margins as well as additional leveraging increased earnings from brand licensing and credit card distribution network programs § Downward integration of legacy HollyFrontier products Footprint: § Iconic DINO brand § Opportunities with accelerated brand growth across HF § 300+ distributors and 1,300+ wholesale branded sites Sinclair products and located across 30 states geographies § Over 2B gallons per year of branded fuel sales § Significant RIN generation § ~300 sites branded under a license program outside through distribution network supply footprint Financial Highlights: § Provides further advantage through RIN generation § Additional margin from branded credit card program § Sinclair branded wholesale business generates an uplift versus unbranded sales 9
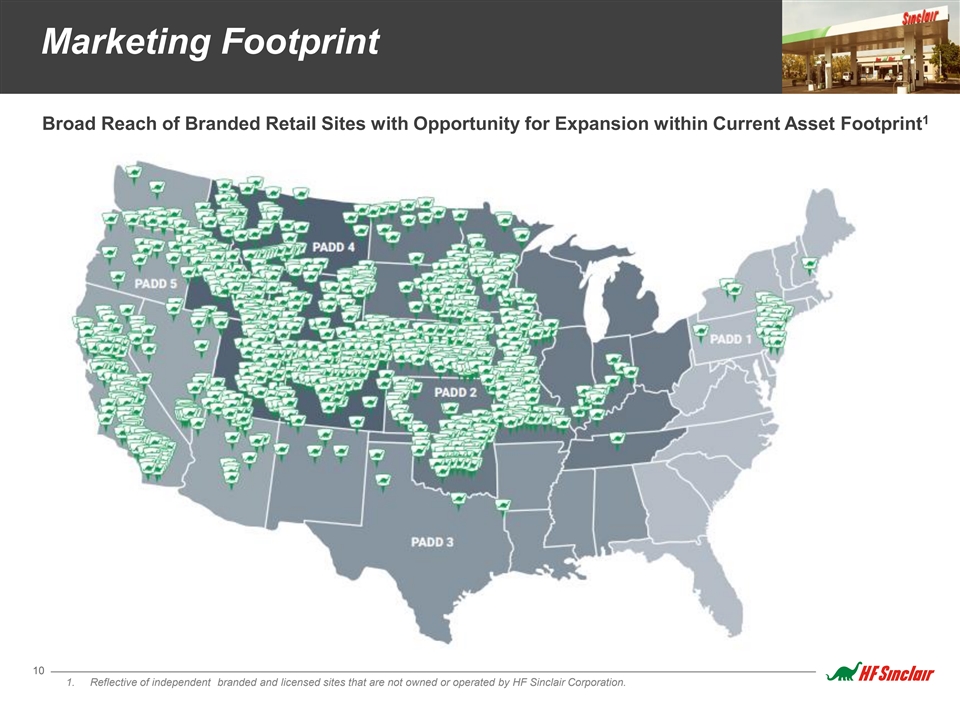
Marketing Footprint 1 Broad Reach of Branded Retail Sites with Opportunity for Expansion within Current Asset Footprint 10 1. Reflective of independent branded and licensed sites that are not owned or operated by HF Sinclair Corporation.
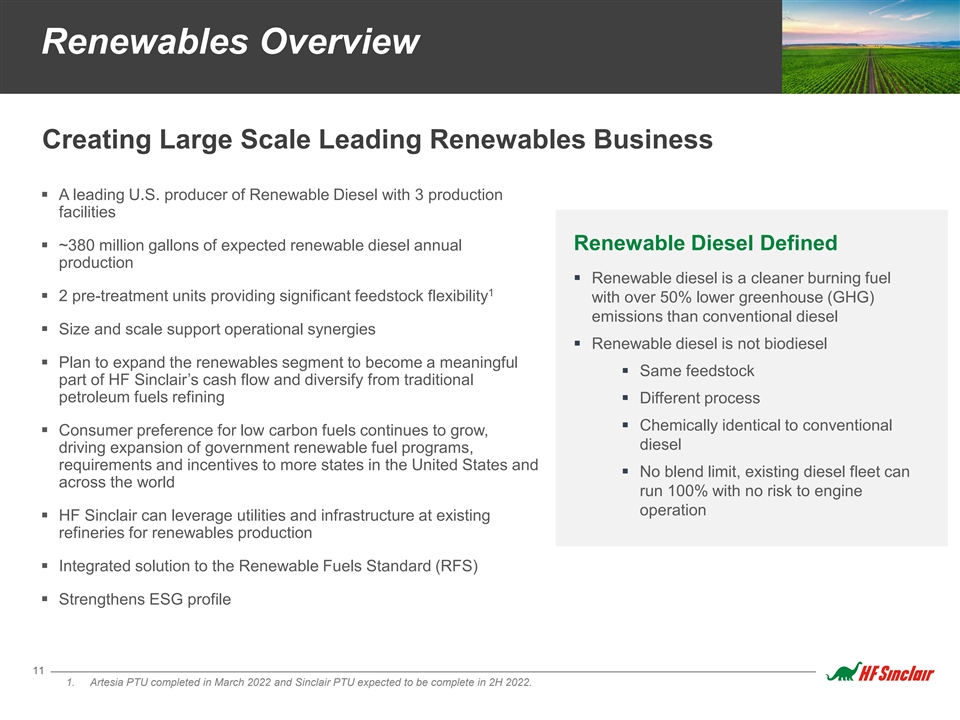
Renewables Overview Creating Large Scale Leading Renewables Business § A leading U.S. producer of Renewable Diesel with 3 production facilities § ~380 million gallons of expected renewable diesel annual Renewable Diesel Defined production § Renewable diesel is a cleaner burning fuel 1 § 2 pre-treatment units providing significant feedstock flexibility with over 50% lower greenhouse (GHG) emissions than conventional diesel § Size and scale support operational synergies § Renewable diesel is not biodiesel § Plan to expand the renewables segment to become a meaningful § Same feedstock part of HF Sinclair’s cash flow and diversify from traditional petroleum fuels refining § Different process § Chemically identical to conventional § Consumer preference for low carbon fuels continues to grow, diesel driving expansion of government renewable fuel programs, requirements and incentives to more states in the United States and § No blend limit, existing diesel fleet can across the world run 100% with no risk to engine operation § HF Sinclair can leverage utilities and infrastructure at existing refineries for renewables production § Integrated solution to the Renewable Fuels Standard (RFS) § Strengthens ESG profile 11 1. Artesia PTU completed in March 2022 and Sinclair PTU expected to be complete in 2H 2022.
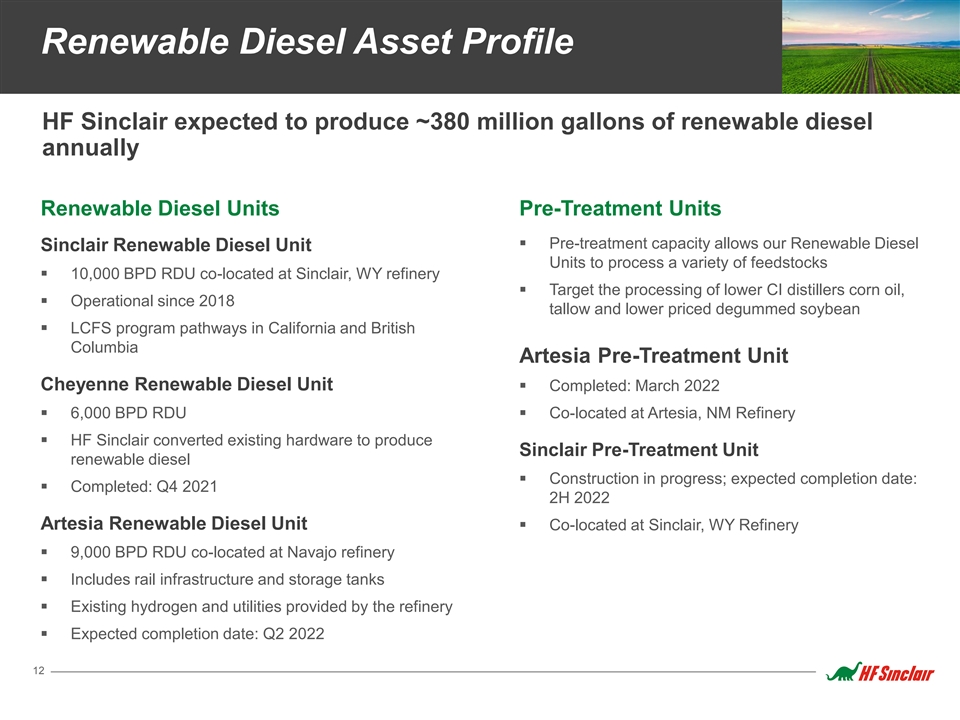
Renewable Diesel Asset Profile HF Sinclair expected to produce ~380 million gallons of renewable diesel annually Renewable Diesel Units Pre-Treatment Units § Pre-treatment capacity allows our Renewable Diesel Sinclair Renewable Diesel Unit Units to process a variety of feedstocks § 10,000 BPD RDU co-located at Sinclair, WY refinery § Target the processing of lower CI distillers corn oil, § Operational since 2018 tallow and lower priced degummed soybean § LCFS program pathways in California and British Columbia Artesia Pre-Treatment Unit Cheyenne Renewable Diesel Unit § Completed: March 2022 § 6,000 BPD RDU § Co-located at Artesia, NM Refinery § HF Sinclair converted existing hardware to produce Sinclair Pre-Treatment Unit renewable diesel § Construction in progress; expected completion date: § Completed: Q4 2021 2H 2022 Artesia Renewable Diesel Unit § Co-located at Sinclair, WY Refinery § 9,000 BPD RDU co-located at Navajo refinery § Includes rail infrastructure and storage tanks § Existing hydrogen and utilities provided by the refinery § Expected completion date: Q2 2022 12
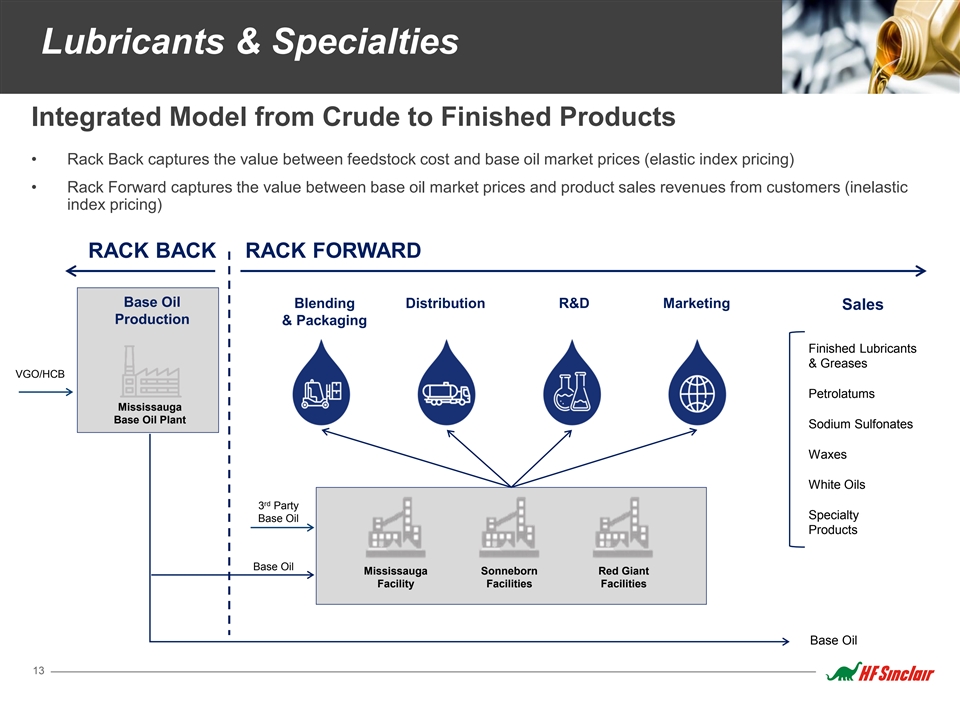
Lubricants & Specialties Integrated Model from Crude to Finished Products • Rack Back captures the value between feedstock cost and base oil market prices (elastic index pricing) • Rack Forward captures the value between base oil market prices and product sales revenues from customers (inelastic index pricing) RACK BACK RACK FORWARD Base Oil Blending Distribution R&D Marketing Sales Production & Packaging Finished Lubricants & Greases VGO/HCB Petrolatums Mississauga Base Oil Plant Sodium Sulfonates Waxes White Oils rd 3 Party Specialty Base Oil Products Base Oil Mississauga Sonneborn Red Giant Facility Facilities Facilities Base Oil 13
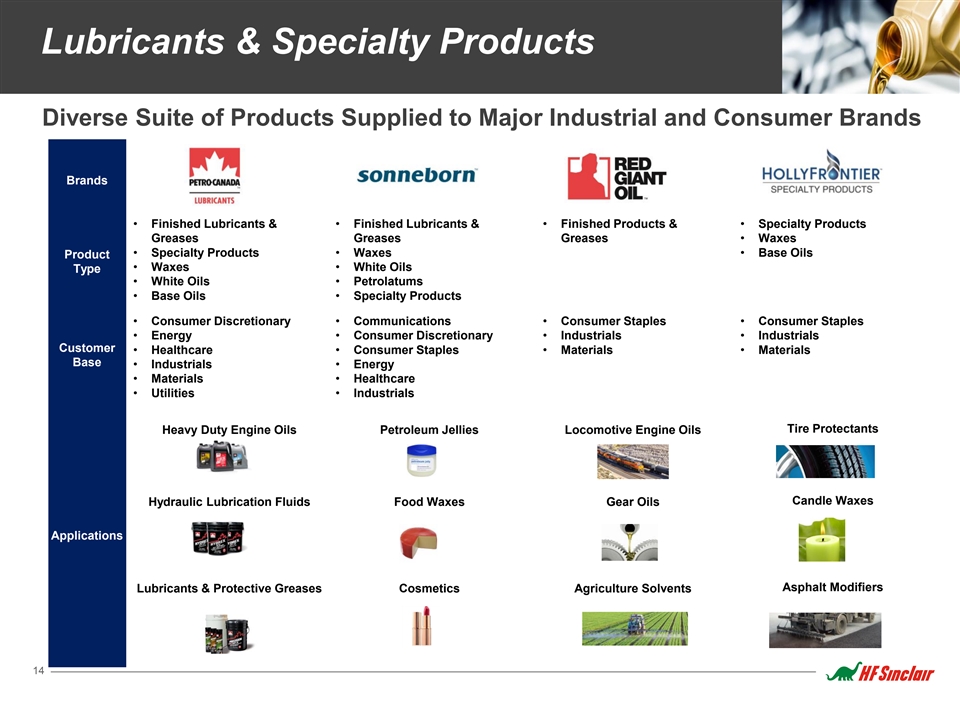
Lubricants & Specialty Products Diverse Suite of Products Supplied to Major Industrial and Consumer Brands Brands • Finished Lubricants & • Finished Lubricants & • Finished Products & • Specialty Products Greases Greases Greases • Waxes • Specialty Products • Waxes • Base Oils Product • Waxes • White Oils Type • White Oils • Petrolatums • Base Oils • Specialty Products • Consumer Discretionary • Communications • Consumer Staples • Consumer Staples • Energy • Consumer Discretionary • Industrials • Industrials Customer • Healthcare • Consumer Staples • Materials • Materials Base • Industrials • Energy • Materials • Healthcare • Utilities • Industrials Tire Protectants Heavy Duty Engine Oils Petroleum Jellies Locomotive Engine Oils Candle Waxes Hydraulic Lubrication Fluids Food Waxes Gear Oils Applications Lubricants & Protective Greases Cosmetics Agriculture Solvents Asphalt Modifiers 14

Opportunity Across the Value Chain Upgrade Existing Base Oils into Finished Products Converting one barrel of Base Oil sales into Finished Product sales results in an average margin uplift of ~$50/bbl Margin Value $/bbl 2021 Product Slate by Volume Finished Lubricants & Greases Coproducts 23% Petrolatums Base Oils 27% Waxes Petrolatums 3% Waxes 5% White Oils Specialty Products 15% White Oils 10% Specialty Products Finished Lubes & Greases 17% Base Oils 15 Note: Coproducts consist of Distillates, Intermediates and LPGs.
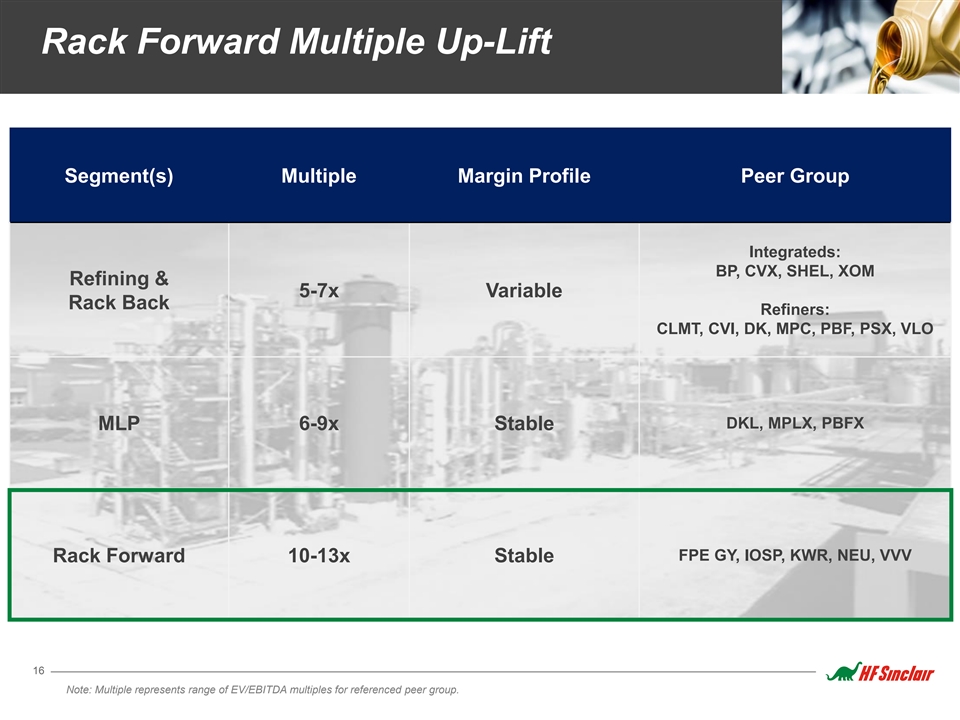
Rack Forward Multiple Up-Lift Segment(s) Multiple Margin Profile Peer Group Integrateds: BP, CVX, SHEL, XOM Refining & 5-7x Variable Rack Back Refiners: CLMT, CVI, DK, MPC, PBF, PSX, VLO DKL, MPLX, PBFX MLP 6-9x Stable FPE GY, IOSP, KWR, NEU, VVV Rack Forward 10-13x Stable 16 Note: Multiple represents range of EV/EBITDA multiples for referenced peer group.
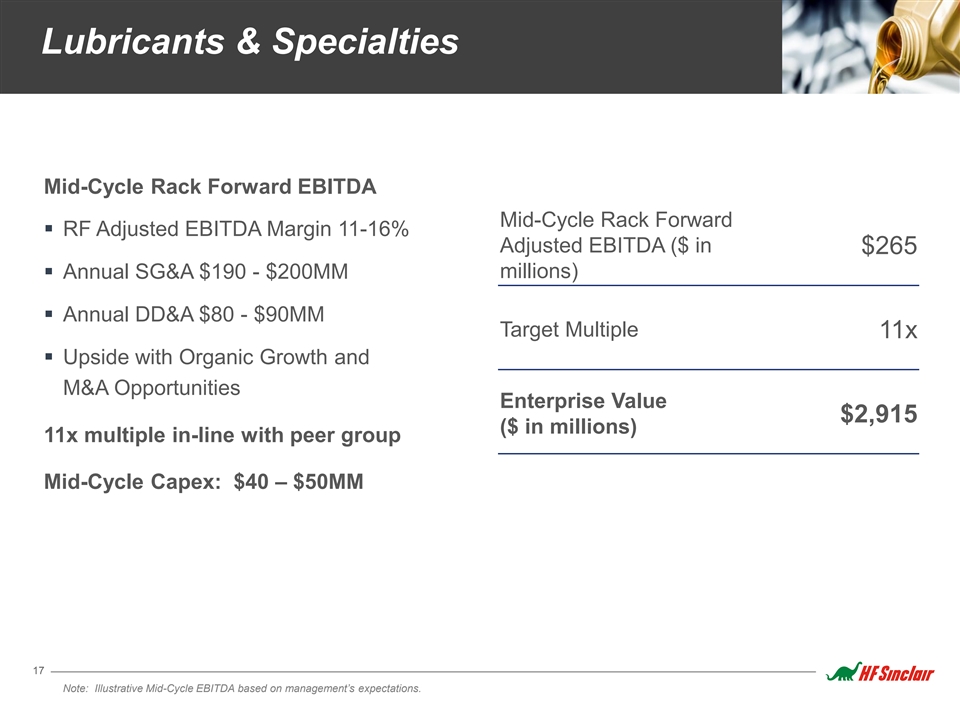
Lubricants & Specialties Mid-Cycle Rack Forward EBITDA Mid-Cycle Rack Forward § RF Adjusted EBITDA Margin 11-16% Adjusted EBITDA ($ in $265 § Annual SG&A $190 - $200MM millions) § Annual DD&A $80 - $90MM Target Multiple 11x § Upside with Organic Growth and M&A Opportunities Enterprise Value $2,915 ($ in millions) 11x multiple in-line with peer group Mid-Cycle Capex: $40 – $50MM 17 Note: Illustrative Mid-Cycle EBITDA based on management’s expectations.
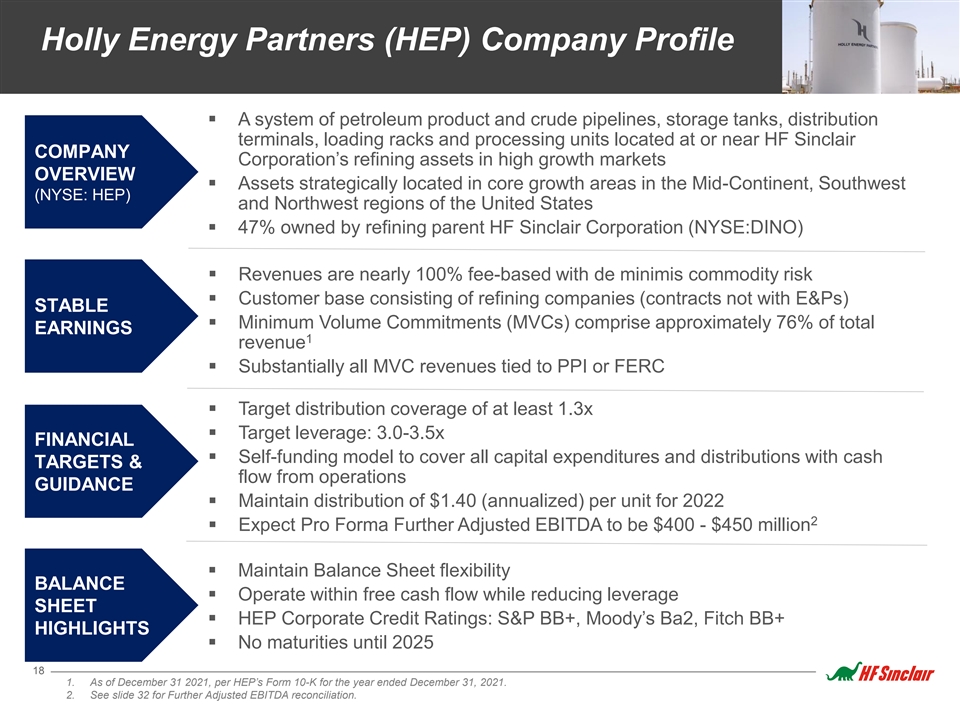
Holly Energy Partners (HEP) Company Profile § A system of petroleum product and crude pipelines, storage tanks, distribution terminals, loading racks and processing units located at or near HF Sinclair COMPANY Corporation’s refining assets in high growth markets OVERVIEW § Assets strategically located in core growth areas in the Mid-Continent, Southwest (NYSE: HEP) and Northwest regions of the United States § 47% owned by refining parent HF Sinclair Corporation (NYSE:DINO) § Revenues are nearly 100% fee-based with de minimis commodity risk § Customer base consisting of refining companies (contracts not with E&Ps) STABLE § Minimum Volume Commitments (MVCs) comprise approximately 76% of total EARNINGS 1 revenue § Substantially all MVC revenues tied to PPI or FERC § Target distribution coverage of at least 1.3x § Target leverage: 3.0-3.5x FINANCIAL § Self-funding model to cover all capital expenditures and distributions with cash TARGETS & flow from operations GUIDANCE § Maintain distribution of $1.40 (annualized) per unit for 2022 2 § Expect Pro Forma Further Adjusted EBITDA to be $400 - $450 million § Maintain Balance Sheet flexibility BALANCE § Operate within free cash flow while reducing leverage SHEET § HEP Corporate Credit Ratings: S&P BB+, Moody’s Ba2, Fitch BB+ HIGHLIGHTS § No maturities until 2025 18 1. As of December 31 2021, per HEP’s Form 10-K for the year ended December 31, 2021. 2. See slide 32 for Further Adjusted EBITDA reconciliation.
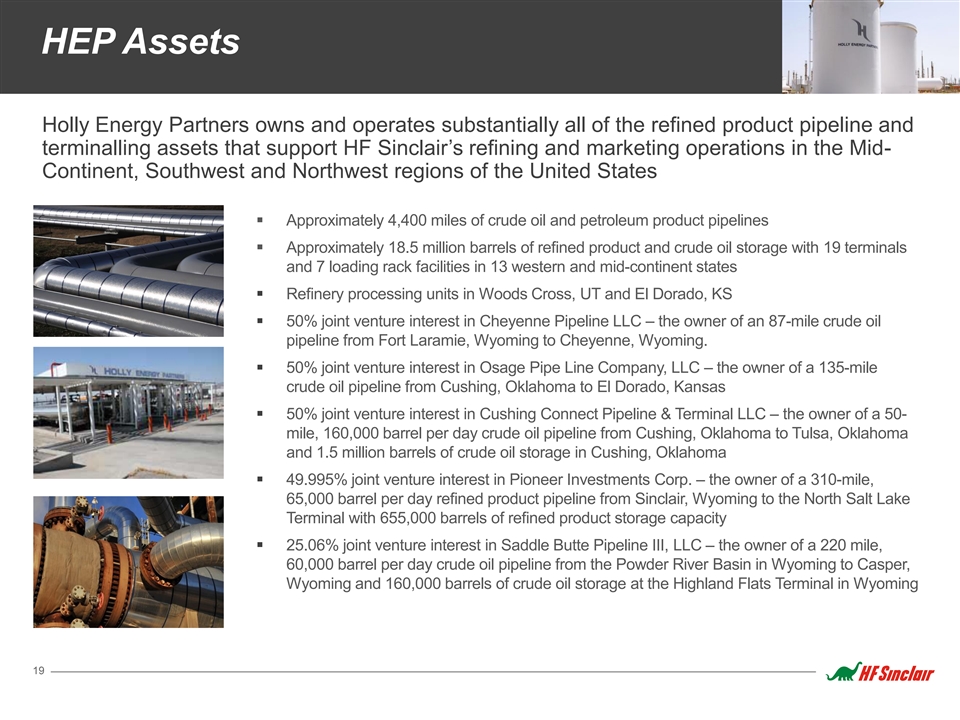
HEP Assets Holly Energy Partners owns and operates substantially all of the refined product pipeline and terminalling assets that support HF Sinclair’s refining and marketing operations in the Mid- Continent, Southwest and Northwest regions of the United States § Approximately 4,400 miles of crude oil and petroleum product pipelines § Approximately 18.5 million barrels of refined product and crude oil storage with 19 terminals and 7 loading rack facilities in 13 western and mid-continent states § Refinery processing units in Woods Cross, UT and El Dorado, KS § 50% joint venture interest in Cheyenne Pipeline LLC – the owner of an 87-mile crude oil pipeline from Fort Laramie, Wyoming to Cheyenne, Wyoming. § 50% joint venture interest in Osage Pipe Line Company, LLC – the owner of a 135-mile crude oil pipeline from Cushing, Oklahoma to El Dorado, Kansas § 50% joint venture interest in Cushing Connect Pipeline & Terminal LLC – the owner of a 50- mile, 160,000 barrel per day crude oil pipeline from Cushing, Oklahoma to Tulsa, Oklahoma and 1.5 million barrels of crude oil storage in Cushing, Oklahoma § 49.995% joint venture interest in Pioneer Investments Corp. – the owner of a 310-mile, 65,000 barrel per day refined product pipeline from Sinclair, Wyoming to the North Salt Lake Terminal with 655,000 barrels of refined product storage capacity § 25.06% joint venture interest in Saddle Butte Pipeline III, LLC – the owner of a 220 mile, 60,000 barrel per day crude oil pipeline from the Powder River Basin in Wyoming to Casper, Wyoming and 160,000 barrels of crude oil storage at the Highland Flats Terminal in Wyoming 19
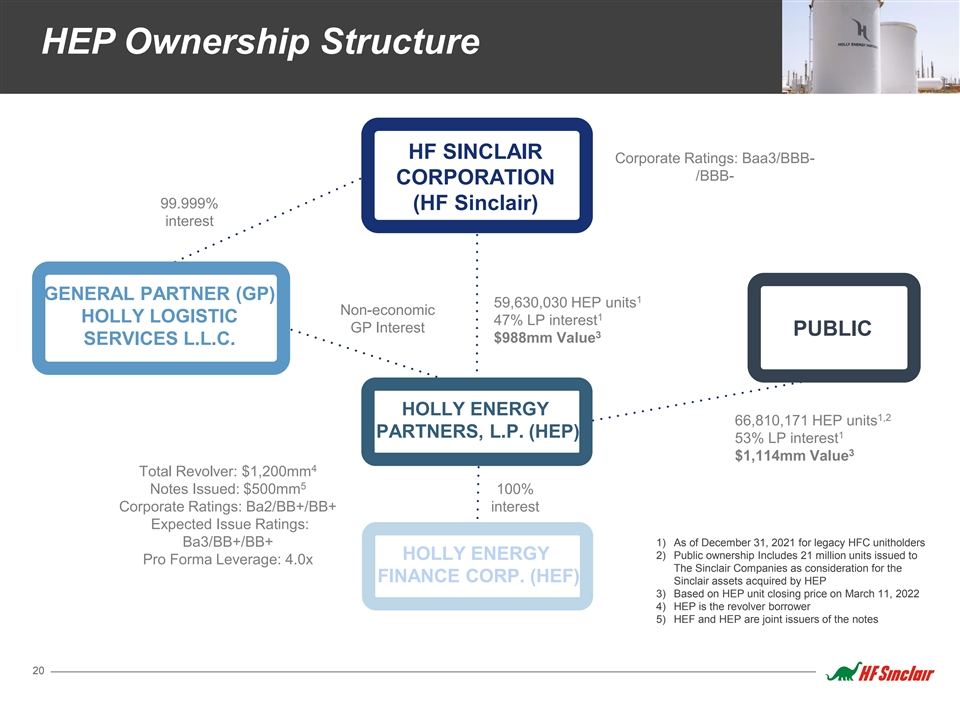
HEP Ownership Structure HF SINCLAIR Corporate Ratings: Baa3/BBB- /BBB- CORPORATION 99.999% (HF Sinclair) interest GENERAL PARTNER (GP) 1 59,630,030 HEP units Non-economic 1 HOLLY LOGISTIC 47% LP interest GP Interest PUBLIC 3 $988mm Value SERVICES L.L.C. HOLLY ENERGY 1,2 66,810,171 HEP units PARTNERS, L.P. (HEP) 1 53% LP interest 3 $1,114mm Value 4 Total Revolver: $1,200mm 5 Notes Issued: $500mm 100% Corporate Ratings: Ba2/BB+/BB+ interest Expected Issue Ratings: Ba3/BB+/BB+ 1) As of December 31, 2021 for legacy HFC unitholders 2) Public ownership Includes 21 million units issued to HOLLY ENERGY Pro Forma Leverage: 4.0x The Sinclair Companies as consideration for the FINANCE CORP. (HEF) Sinclair assets acquired by HEP 3) Based on HEP unit closing price on March 11, 2022 4) HEP is the revolver borrower 5) HEF and HEP are joint issuers of the notes 20
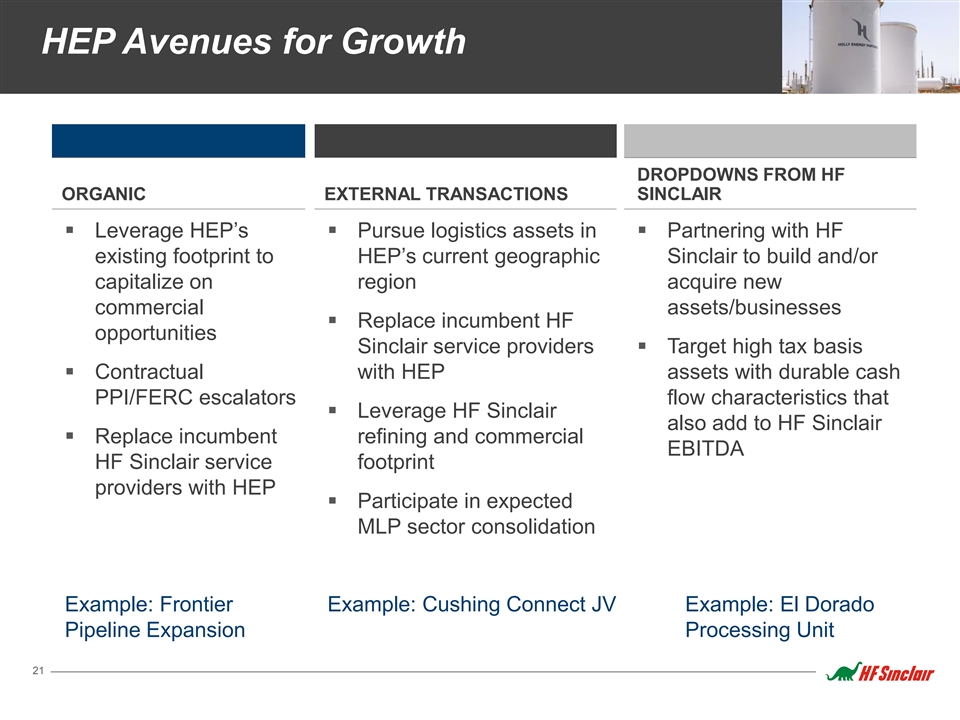
HEP Avenues for Growth DROPDOWNS FROM HF ORGANIC EXTERNAL TRANSACTIONS SINCLAIR § Leverage HEP’s § Pursue logistics assets in § Partnering with HF existing footprint to HEP’s current geographic Sinclair to build and/or capitalize on region acquire new commercial assets/businesses § Replace incumbent HF opportunities Sinclair service providers § Target high tax basis § Contractual with HEP assets with durable cash PPI/FERC escalators flow characteristics that § Leverage HF Sinclair also add to HF Sinclair § Replace incumbent refining and commercial EBITDA HF Sinclair service footprint providers with HEP § Participate in expected MLP sector consolidation Example: Frontier Example: Cushing Connect JV Example: El Dorado Pipeline Expansion Processing Unit 21
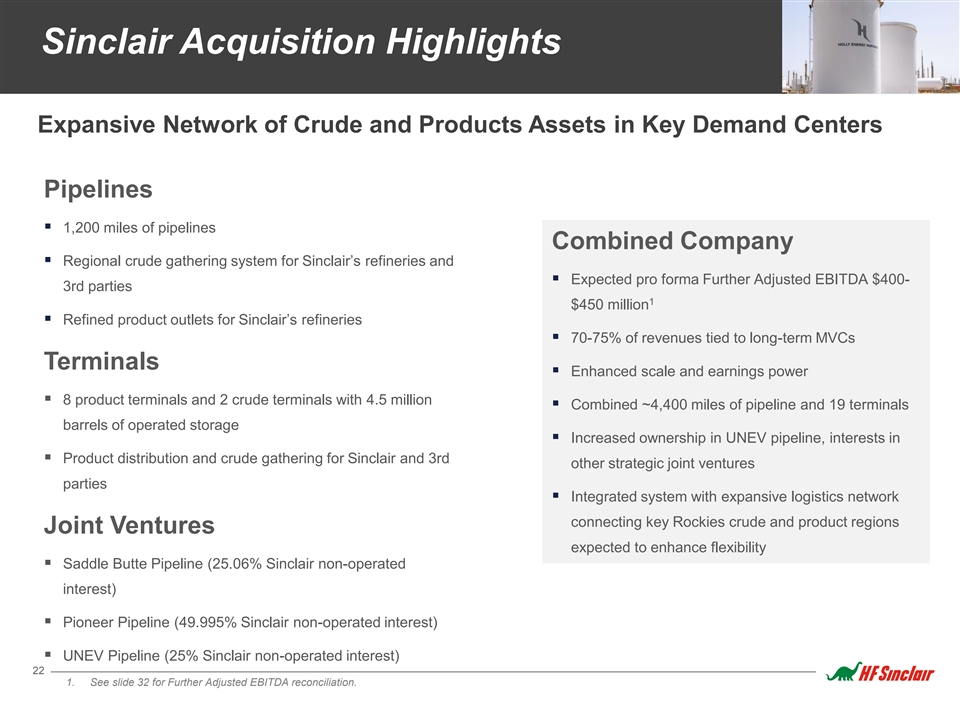
Sinclair Acquisition Highlights Expansive Network of Crude and Products Assets in Key Demand Centers Pipelines § 1,200 miles of pipelines Combined Company § Regional crude gathering system for Sinclair’s refineries and § Expected pro forma Further Adjusted EBITDA $400- 3rd parties 1 $450 million § Refined product outlets for Sinclair’s refineries § 70-75% of revenues tied to long-term MVCs Terminals § Enhanced scale and earnings power § 8 product terminals and 2 crude terminals with 4.5 million § Combined ~4,400 miles of pipeline and 19 terminals barrels of operated storage § Increased ownership in UNEV pipeline, interests in § Product distribution and crude gathering for Sinclair and 3rd other strategic joint ventures parties § Integrated system with expansive logistics network connecting key Rockies crude and product regions Joint Ventures expected to enhance flexibility § Saddle Butte Pipeline (25.06% Sinclair non-operated interest) § Pioneer Pipeline (49.995% Sinclair non-operated interest) § UNEV Pipeline (25% Sinclair non-operated interest) 22 1. See slide 32 for Further Adjusted EBITDA reconciliation.
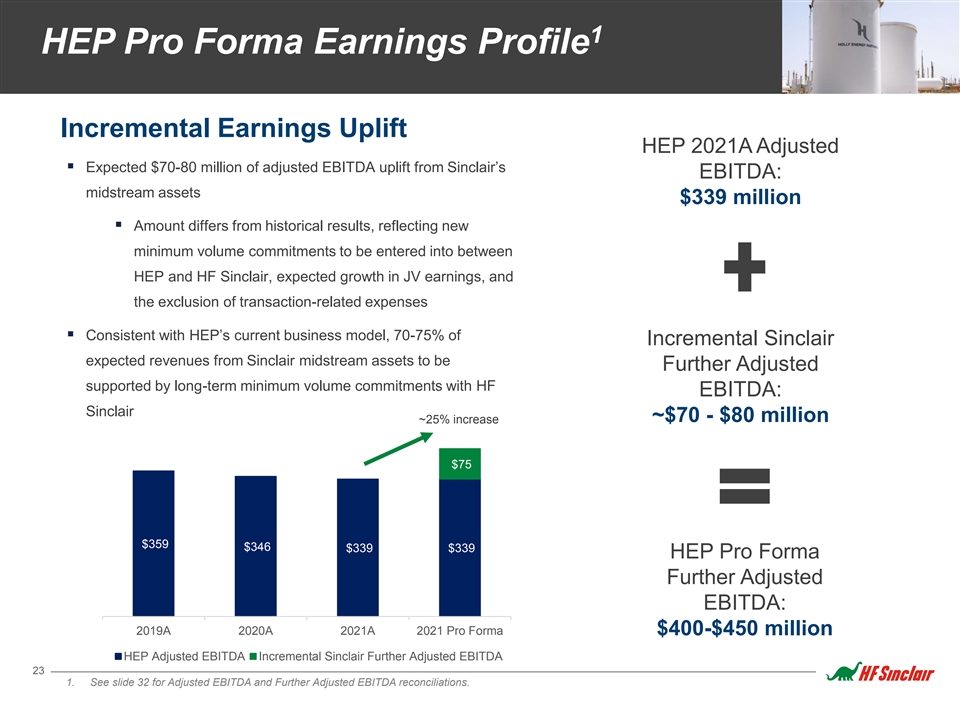
1 HEP Pro Forma Earnings Profile Incremental Earnings Uplift HEP 2021A Adjusted § Expected $70-80 million of adjusted EBITDA uplift from Sinclair’s EBITDA: midstream assets $339 million § Amount differs from historical results, reflecting new minimum volume commitments to be entered into between HEP and HF Sinclair, expected growth in JV earnings, and the exclusion of transaction-related expenses § Consistent with HEP’s current business model, 70-75% of Incremental Sinclair expected revenues from Sinclair midstream assets to be Further Adjusted supported by long-term minimum volume commitments with HF EBITDA: Sinclair ~$70 - $80 million ~25% increase $75 $359 $346 $339 $339 HEP Pro Forma Further Adjusted EBITDA: 2019A 2020A 2021A 2021 Pro Forma $400-$450 million HEP Adjusted EBITDA Incremental Sinclair Further Adjusted EBITDA 23 1. See slide 32 for Adjusted EBITDA and Further Adjusted EBITDA reconciliations.
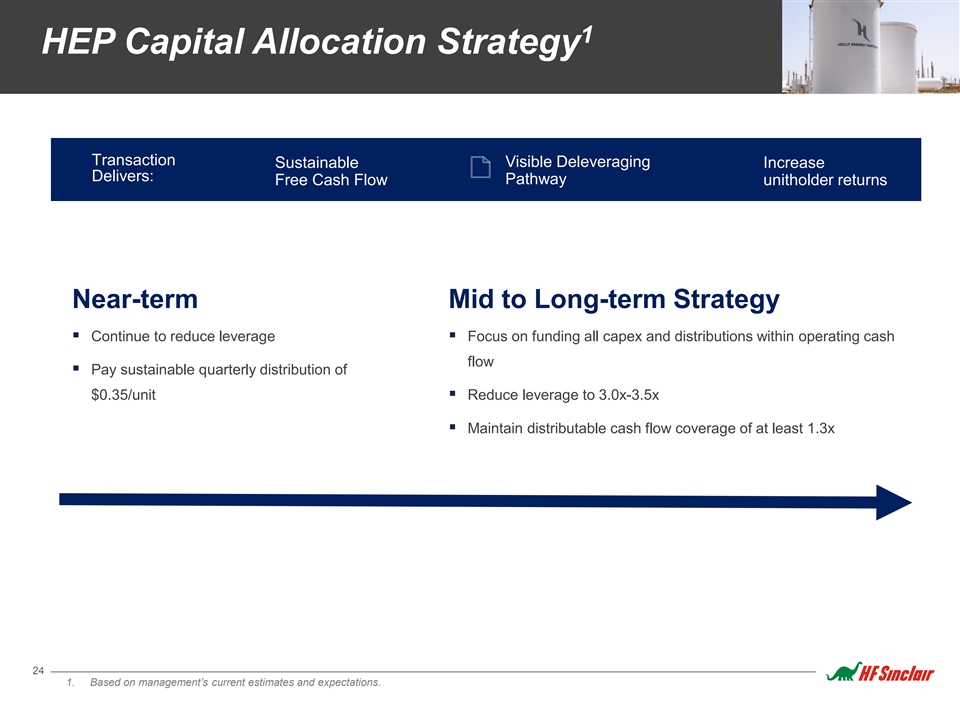
1 HEP Capital Allocation Strategy Transaction Visible Deleveraging Sustainable Increase Delivers: Pathway Free Cash Flow unitholder returns Near-term Mid to Long-term Strategy § Continue to reduce leverage§ Focus on funding all capex and distributions within operating cash flow § Pay sustainable quarterly distribution of $0.35/unit§ Reduce leverage to 3.0x-3.5x § Maintain distributable cash flow coverage of at least 1.3x 24 1. Based on management’s current estimates and expectations.

FINANCIAL STRATEGY RATEGY
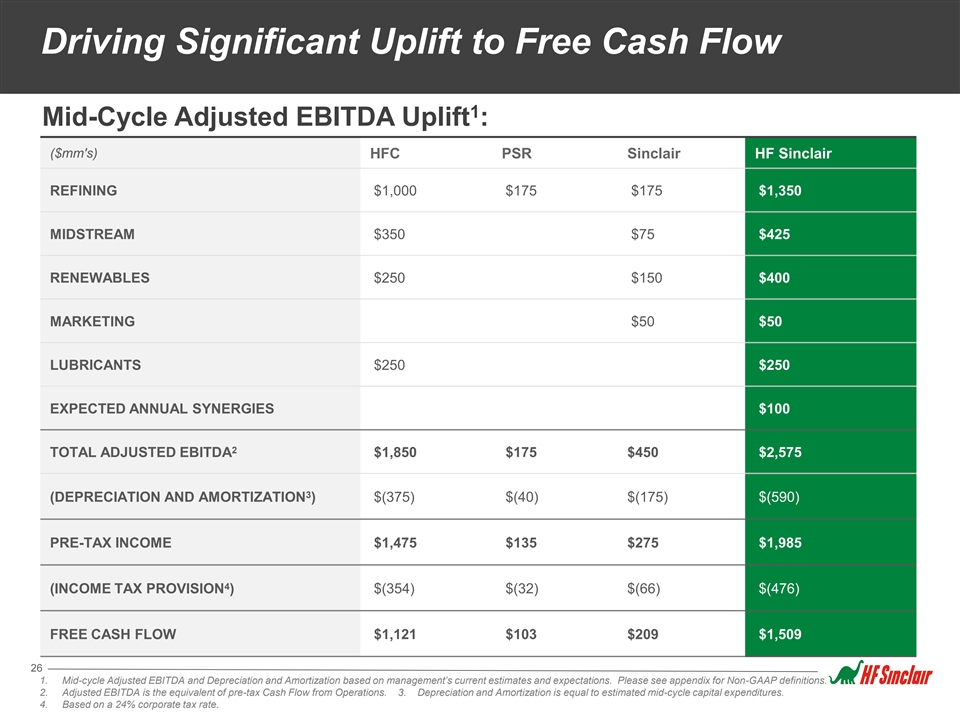
Driving Significant Uplift to Free Cash Flow 1 Mid-Cycle Adjusted EBITDA Uplift : ($mm's) HFC PSR Sinclair HF Sinclair REFINING $1,000 $175 $175 $1,350 MIDSTREAM $350 $75 $425 RENEWABLES $250 $150 $400 MARKETING $50 $50 LUBRICANTS $250 $250 EXPECTED ANNUAL SYNERGIES $100 2 TOTAL ADJUSTED EBITDA $1,850 $175 $450 $2,575 3 (DEPRECIATION AND AMORTIZATION ) $(375) $(40) $(175) $(590) PRE-TAX INCOME $1,475 $135 $275 $1,985 4 (INCOME TAX PROVISION ) $(354) $(32) $(66) $(476) FREE CASH FLOW $1,121 $103 $209 $1,509 26 1. Mid-cycle Adjusted EBITDA and Depreciation and Amortization based on management’s current estimates and expectations. Please see appendix for Non-GAAP definitions. 2. Adjusted EBITDA is the equivalent of pre-tax Cash Flow from Operations. 3. Depreciation and Amortization is equal to estimated mid-cycle capital expenditures. 4. Based on a 24% corporate tax rate.

Sinclair Acquisition Synergies Transaction to Drive Cost Savings & Efficiencies Annual Synergies Expected within two years $20 million $40 million $100 million $40 million Commercial Operating expense SG&A improvements reductions § Downward integration of § Renewable diesel logistics § Corporate savings Branded Wholesale business optimization § Improved procurement § Improved cost profile from Renewable Diesel offtake and activities feedstock advantages 27 1. Based on management’s current estimates and expectations.
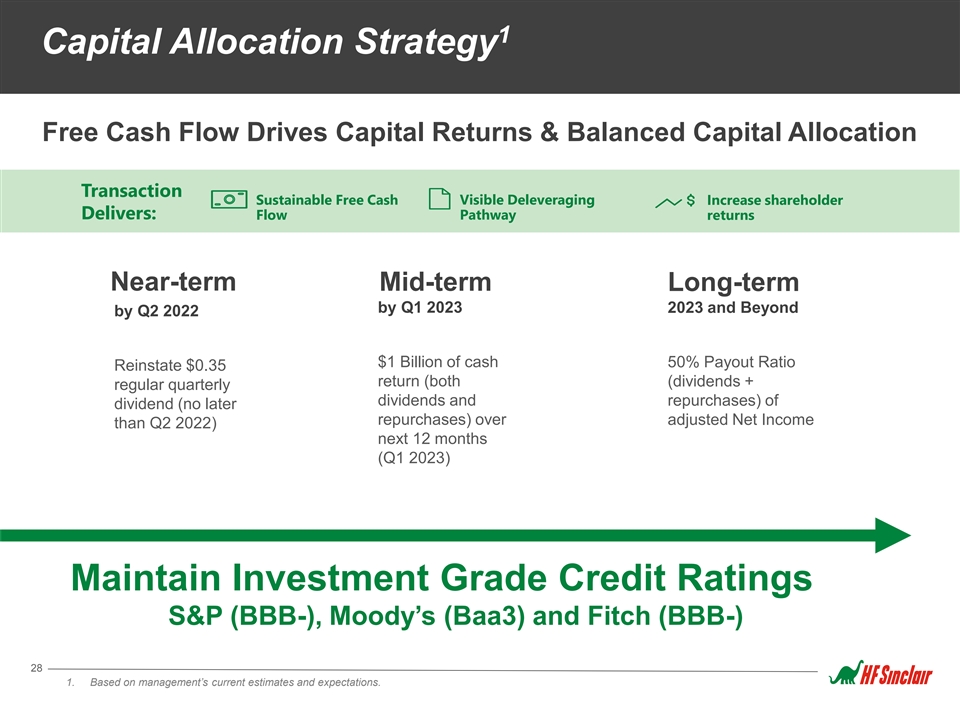
1 Capital Allocation Strategy Free Cash Flow Drives Capital Returns & Balanced Capital Allocation Transaction Sustainable Free Cash Visible Deleveraging Increase shareholder Delivers: Flow Pathway returns Near-term Mid-term Long-term by Q1 2023 2023 and Beyond by Q2 2022 $1 Billion of cash 50% Payout Ratio Reinstate $0.35 return (both (dividends + regular quarterly dividends and repurchases) of dividend (no later repurchases) over adjusted Net Income than Q2 2022) next 12 months (Q1 2023) Maintain Investment Grade Credit Ratings S&P (BBB-), Moody’s (Baa3) and Fitch (BBB-) 28 1. Based on management’s current estimates and expectations.
APPENDIX RATEGY
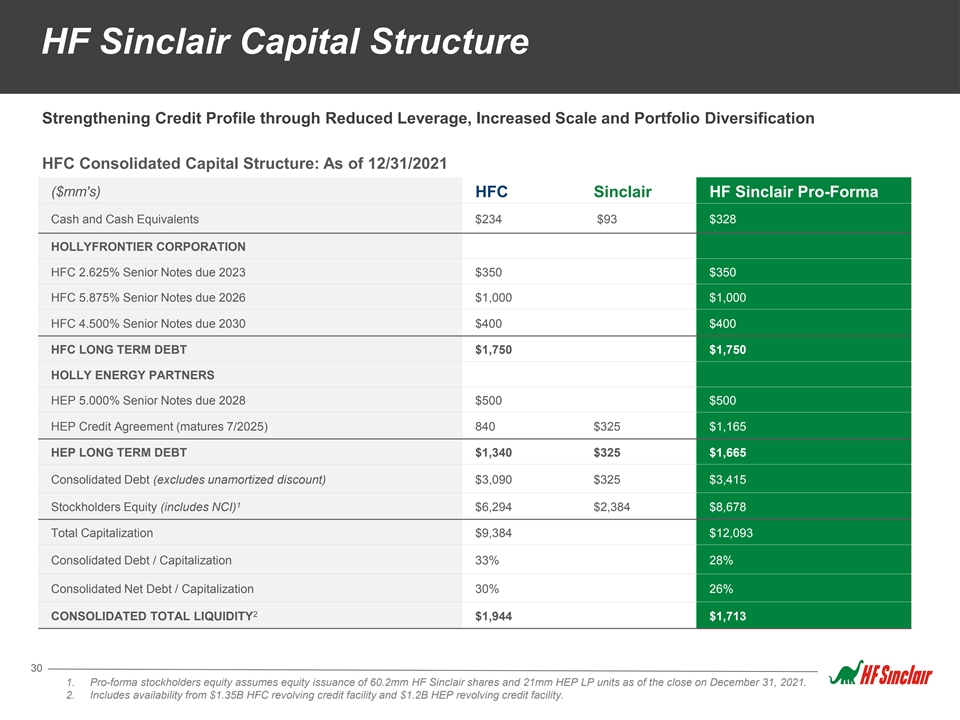
HF Sinclair Capital Structure Strengthening Credit Profile through Reduced Leverage, Increased Scale and Portfolio Diversification HFC Consolidated Capital Structure: As of 12/31/2021 ($mm's) HFC Sinclair HF Sinclair Pro-Forma Cash and Cash Equivalents $234 $93 $328 HOLLYFRONTIER CORPORATION HFC 2.625% Senior Notes due 2023 $350 $350 HFC 5.875% Senior Notes due 2026 $1,000 $1,000 HFC 4.500% Senior Notes due 2030 $400 $400 HFC LONG TERM DEBT $1,750 $1,750 HOLLY ENERGY PARTNERS HEP 5.000% Senior Notes due 2028 $500 $500 HEP Credit Agreement (matures 7/2025) 840 $325 $1,165 HEP LONG TERM DEBT $1,340 $325 $1,665 Consolidated Debt (excludes unamortized discount) $3,090 $325 $3,415 1 Stockholders Equity (includes NCI) $6,294 $2,384 $8,678 Total Capitalization $9,384 $12,093 Consolidated Debt / Capitalization 33% 28% Consolidated Net Debt / Capitalization 30% 26% 2 CONSOLIDATED TOTAL LIQUIDITY $1,944 $1,713 30 1. Pro-forma stockholders equity assumes equity issuance of 60.2mm HF Sinclair shares and 21mm HEP LP units as of the close on December 31, 2021. 2. Includes availability from $1.35B HFC revolving credit facility and $1.2B HEP revolving credit facility.
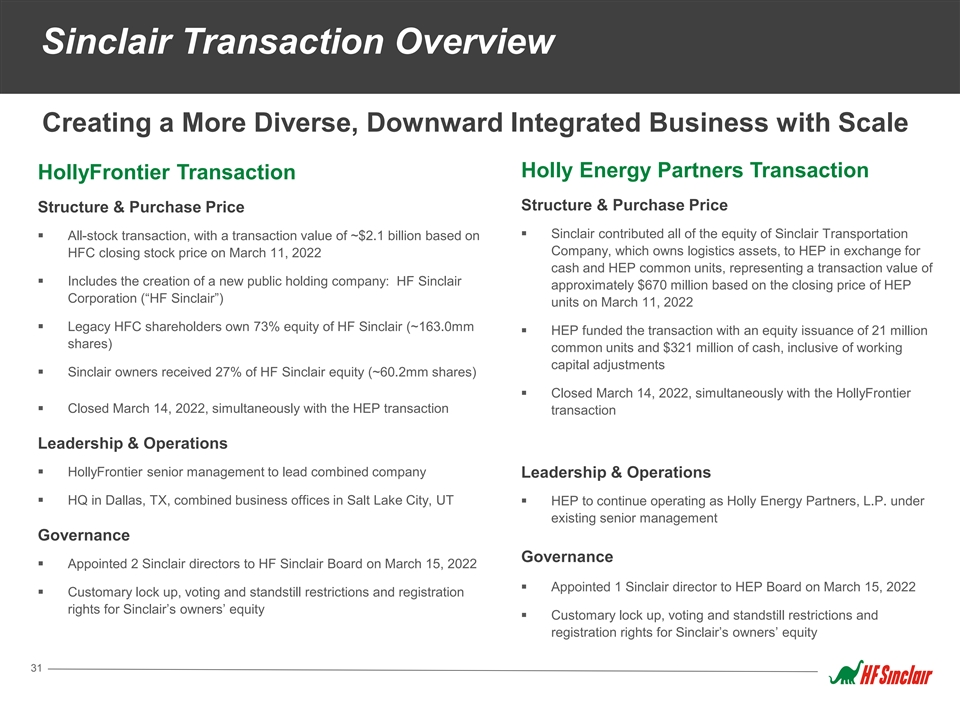
Sinclair Transaction Overview Creating a More Diverse, Downward Integrated Business with Scale Holly Energy Partners Transaction HollyFrontier Transaction Structure & Purchase Price Structure & Purchase Price § Sinclair contributed all of the equity of Sinclair Transportation § All-stock transaction, with a transaction value of ~$2.1 billion based on Company, which owns logistics assets, to HEP in exchange for HFC closing stock price on March 11, 2022 cash and HEP common units, representing a transaction value of § Includes the creation of a new public holding company: HF Sinclair approximately $670 million based on the closing price of HEP Corporation (“HF Sinclair”) units on March 11, 2022 § Legacy HFC shareholders own 73% equity of HF Sinclair (~163.0mm § HEP funded the transaction with an equity issuance of 21 million shares) common units and $321 million of cash, inclusive of working capital adjustments § Sinclair owners received 27% of HF Sinclair equity (~60.2mm shares) § Closed March 14, 2022, simultaneously with the HollyFrontier § Closed March 14, 2022, simultaneously with the HEP transaction transaction Leadership & Operations § HollyFrontier senior management to lead combined company Leadership & Operations § HQ in Dallas, TX, combined business offices in Salt Lake City, UT§ HEP to continue operating as Holly Energy Partners, L.P. under existing senior management Governance Governance § Appointed 2 Sinclair directors to HF Sinclair Board on March 15, 2022 § Appointed 1 Sinclair director to HEP Board on March 15, 2022 § Customary lock up, voting and standstill restrictions and registration rights for Sinclair’s owners’ equity § Customary lock up, voting and standstill restrictions and registration rights for Sinclair’s owners’ equity 31
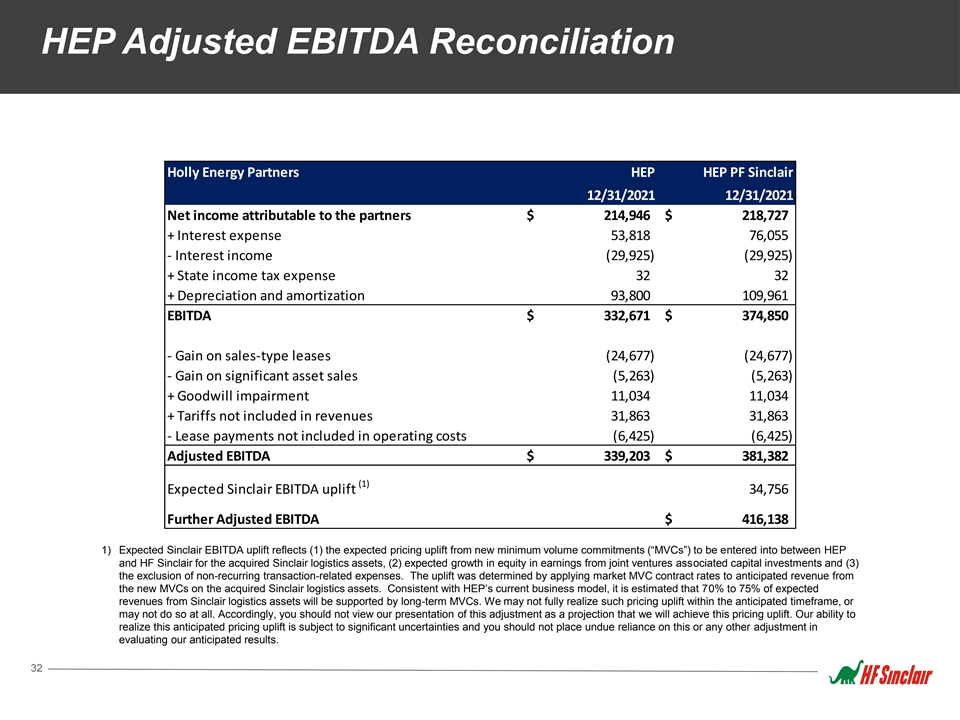
HEP Adjusted EBITDA Reconciliation Holly Energy Partners HEP HEP PF Sinclair 12/31/2021 12/31/2021 Net income attributable to the partners $ 214,946 $ 218,727 + Interest expense 5 3,818 76,055 - Interest income (29,925) (29,925) + State income tax expense 32 32 + Depreciation and amortization 9 3,800 109,961 EBITDA $ 332,671 $ 374,850 - Gain on sales-type leases (24,677) (24,677) - Gain on significant asset sales (5,263) (5,263) + Goodwill impairment 1 1,034 1 1,034 + Tariffs not included in revenues 3 1,863 3 1,863 - Lease payments not included in operating costs (6,425) (6,425) Adjusted EBITDA $ 339,203 $ 381,382 (1) Expected Sinclair EBITDA uplift 3 4,756 Further Adjusted EBITDA $ 416,138 1) Expected Sinclair EBITDA uplift reflects (1) the expected pricing uplift from new minimum volume commitments (“MVCs”) to be entered into between HEP and HF Sinclair for the acquired Sinclair logistics assets, (2) expected growth in equity in earnings from joint ventures associated capital investments and (3) the exclusion of non-recurring transaction-related expenses. The uplift was determined by applying market MVC contract rates to anticipated revenue from the new MVCs on the acquired Sinclair logistics assets. Consistent with HEP’s current business model, it is estimated that 70% to 75% of expected revenues from Sinclair logistics assets will be supported by long-term MVCs. We may not fully realize such pricing uplift within the anticipated timeframe, or may not do so at all. Accordingly, you should not view our presentation of this adjustment as a projection that we will achieve this pricing uplift. Our ability to realize this anticipated pricing uplift is subject to significant uncertainties and you should not place undue reliance on this or any other adjustment in evaluating our anticipated results. 32
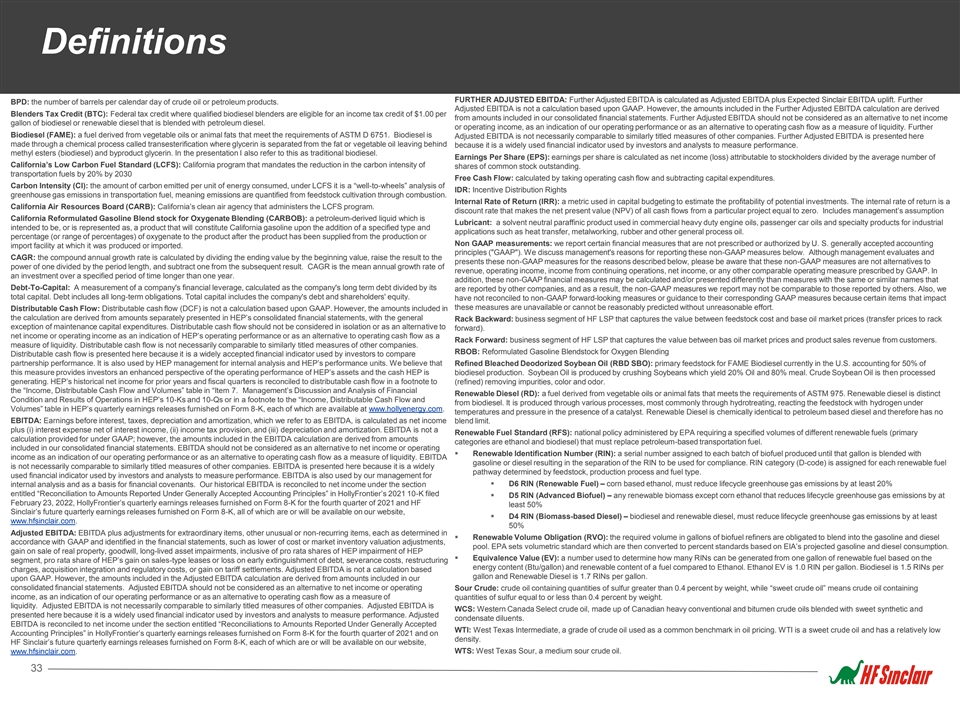
Definitions FURTHER ADJUSTED EBITDA: Further Adjusted EBITDA is calculated as Adjusted EBITDA plus Expected Sinclair EBITDA uplift. Further BPD: the number of barrels per calendar day of crude oil or petroleum products. Adjusted EBITDA is not a calculation based upon GAAP. However, the amounts included in the Further Adjusted EBITDA calculation are derived Blenders Tax Credit (BTC): Federal tax credit where qualified biodiesel blenders are eligible for an income tax credit of $1.00 per from amounts included in our consolidated financial statements. Further Adjusted EBITDA should not be considered as an alternative to net income gallon of biodiesel or renewable diesel that is blended with petroleum diesel. or operating income, as an indication of our operating performance or as an alternative to operating cash flow as a measure of liquidity. Further Biodiesel (FAME): a fuel derived from vegetable oils or animal fats that meet the requirements of ASTM D 6751. Biodiesel is Adjusted EBITDA is not necessarily comparable to similarly titled measures of other companies. Further Adjusted EBITDA is presented here made through a chemical process called transesterification where glycerin is separated from the fat or vegetable oil leaving behind because it is a widely used financial indicator used by investors and analysts to measure performance. methyl esters (biodiesel) and byproduct glycerin. In the presentation I also refer to this as traditional biodiesel. Earnings Per Share (EPS): earnings per share is calculated as net income (loss) attributable to stockholders divided by the average number of California’s Low Carbon Fuel Standard (LCFS): California program that mandates the reduction in the carbon intensity of shares of common stock outstanding. transportation fuels by 20% by 2030 Free Cash Flow: calculated by taking operating cash flow and subtracting capital expenditures. Carbon Intensity (CI): the amount of carbon emitted per unit of energy consumed, under LCFS it is a “well-to-wheels” analysis of IDR: Incentive Distribution Rights greenhouse gas emissions in transportation fuel, meaning emissions are quantified from feedstock cultivation through combustion. Internal Rate of Return (IRR): a metric used in capital budgeting to estimate the profitability of potential investments. The internal rate of return is a California Air Resources Board (CARB): California’s clean air agency that administers the LCFS program. discount rate that makes the net present value (NPV) of all cash flows from a particular project equal to zero. Includes management’s assumption California Reformulated Gasoline Blend stock for Oxygenate Blending (CARBOB): a petroleum-derived liquid which is Lubricant: a solvent neutral paraffinic product used in commercial heavy duty engine oils, passenger car oils and specialty products for industrial intended to be, or is represented as, a product that will constitute California gasoline upon the addition of a specified type and applications such as heat transfer, metalworking, rubber and other general process oil. percentage (or range of percentages) of oxygenate to the product after the product has been supplied from the production or Non GAAP measurements: we report certain financial measures that are not prescribed or authorized by U. S. generally accepted accounting import facility at which it was produced or imported. principles ( GAAP ). We discuss management's reasons for reporting these non-GAAP measures below. Although management evaluates and CAGR: the compound annual growth rate is calculated by dividing the ending value by the beginning value, raise the result to the presents these non-GAAP measures for the reasons described below, please be aware that these non-GAAP measures are not alternatives to power of one divided by the period length, and subtract one from the subsequent result. CAGR is the mean annual growth rate of revenue, operating income, income from continuing operations, net income, or any other comparable operating measure prescribed by GAAP. In an investment over a specified period of time longer than one year. addition, these non-GAAP financial measures may be calculated and/or presented differently than measures with the same or similar names that Debt-To-Capital: A measurement of a company's financial leverage, calculated as the company's long term debt divided by its are reported by other companies, and as a result, the non-GAAP measures we report may not be comparable to those reported by others. Also, we total capital. Debt includes all long-term obligations. Total capital includes the company's debt and shareholders' equity. have not reconciled to non-GAAP forward-looking measures or guidance to their corresponding GAAP measures because certain items that impact these measures are unavailable or cannot be reasonably predicted without unreasonable effort. Distributable Cash Flow: Distributable cash flow (DCF) is not a calculation based upon GAAP. However, the amounts included in the calculation are derived from amounts separately presented in HEP’s consolidated financial statements, with the general Rack Backward: business segment of HF LSP that captures the value between feedstock cost and base oil market prices (transfer prices to rack exception of maintenance capital expenditures. Distributable cash flow should not be considered in isolation or as an alternative to forward). net income or operating income as an indication of HEP’s operating performance or as an alternative to operating cash flow as a Rack Forward: business segment of HF LSP that captures the value between bas oil market prices and product sales revenue from customers. measure of liquidity. Distributable cash flow is not necessarily comparable to similarly titled measures of other companies. RBOB: Reformulated Gasoline Blendstock for Oxygen Blending Distributable cash flow is presented here because it is a widely accepted financial indicator used by investors to compare partnership performance. It is also used by HEP management for internal analysis and HEP’s performance units. We believe that Refined Bleached Deodorized Soybean Oil (RBD SBO): primary feedstock for FAME Biodiesel currently in the U.S. accounting for 50% of this measure provides investors an enhanced perspective of the operating performance of HEP’s assets and the cash HEP is biodiesel production. Soybean Oil is produced by crushing Soybeans which yield 20% Oil and 80% meal. Crude Soybean Oil is then processed generating. HEP’s historical net income for prior years and fiscal quarters is reconciled to distributable cash flow in a footnote to (refined) removing impurities, color and odor. the “Income, Distributable Cash Flow and Volumes” table in “Item 7. Management’s Discussion and Analysis of Financial Renewable Diesel (RD): a fuel derived from vegetable oils or animal fats that meets the requirements of ASTM 975. Renewable diesel is distinct Condition and Results of Operations in HEP’s 10-Ks and 10-Qs or in a footnote to the “Income, Distributable Cash Flow and from biodiesel. It is produced through various processes, most commonly through hydrotreating, reacting the feedstock with hydrogen under Volumes” table in HEP’s quarterly earnings releases furnished on Form 8-K, each of which are available at www.hollyenergy.com. temperatures and pressure in the presence of a catalyst. Renewable Diesel is chemically identical to petroleum based diesel and therefore has no EBITDA: Earnings before interest, taxes, depreciation and amortization, which we refer to as EBITDA, is calculated as net income blend limit. plus (i) interest expense net of interest income, (ii) income tax provision, and (iii) depreciation and amortization. EBITDA is not a Renewable Fuel Standard (RFS): national policy administered by EPA requiring a specified volumes of different renewable fuels (primary calculation provided for under GAAP; however, the amounts included in the EBITDA calculation are derived from amounts categories are ethanol and biodiesel) that must replace petroleum-based transportation fuel. included in our consolidated financial statements. EBITDA should not be considered as an alternative to net income or operating § Renewable Identification Number (RIN): a serial number assigned to each batch of biofuel produced until that gallon is blended with income as an indication of our operating performance or as an alternative to operating cash flow as a measure of liquidity. EBITDA gasoline or diesel resulting in the separation of the RIN to be used for compliance. RIN category (D-code) is assigned for each renewable fuel is not necessarily comparable to similarly titled measures of other companies. EBITDA is presented here because it is a widely pathway determined by feedstock, production process and fuel type. used financial indicator used by investors and analysts to measure performance. EBITDA is also used by our management for § D6 RIN (Renewable Fuel) – corn based ethanol, must reduce lifecycle greenhouse gas emissions by at least 20% internal analysis and as a basis for financial covenants. Our historical EBITDA is reconciled to net income under the section entitled “Reconciliation to Amounts Reported Under Generally Accepted Accounting Principles” in HollyFrontier’s 2021 10-K filed § D5 RIN (Advanced Biofuel) – any renewable biomass except corn ethanol that reduces lifecycle greenhouse gas emissions by at February 23, 2022, HollyFrontier’s quarterly earnings releases furnished on Form 8-K for the fourth quarter of 2021 and HF least 50% Sinclair’s future quarterly earnings releases furnished on Form 8-K, all of which are or will be available on our website, § D4 RIN (Biomass-based Diesel) – biodiesel and renewable diesel, must reduce lifecycle greenhouse gas emissions by at least www.hfsinclair.com. 50% Adjusted EBITDA: EBITDA plus adjustments for extraordinary items, other unusual or non-recurring items, each as determined in § Renewable Volume Obligation (RVO): the required volume in gallons of biofuel refiners are obligated to blend into the gasoline and diesel accordance with GAAP and identified in the financial statements, such as lower of cost or market inventory valuation adjustments, pool. EPA sets volumetric standard which are then converted to percent standards based on EIA’s projected gasoline and diesel consumption. gain on sale of real property, goodwill, long-lived asset impairments, inclusive of pro rata shares of HEP impairment of HEP § Equivalence Value (EV): a number used to determine how many RINs can be generated from one gallon of renewable fuel based on the segment, pro rata share of HEP’s gain on sales-type leases or loss on early extinguishment of debt, severance costs, restructuring energy content (Btu/gallon) and renewable content of a fuel compared to Ethanol. Ethanol EV is 1.0 RIN per gallon. Biodiesel is 1.5 RINs per charges, acquisition integration and regulatory costs, or gain on tariff settlements. Adjusted EBITDA is not a calculation based gallon and Renewable Diesel is 1.7 RINs per gallon. upon GAAP. However, the amounts included in the Adjusted EBITDA calculation are derived from amounts included in our consolidated financial statements. Adjusted EBITDA should not be considered as an alternative to net income or operating Sour Crude: crude oil containing quantities of sulfur greater than 0.4 percent by weight, while “sweet crude oil” means crude oil containing income, as an indication of our operating performance or as an alternative to operating cash flow as a measure of quantities of sulfur equal to or less than 0.4 percent by weight. liquidity. Adjusted EBITDA is not necessarily comparable to similarly titled measures of other companies. Adjusted EBITDA is WCS: Western Canada Select crude oil, made up of Canadian heavy conventional and bitumen crude oils blended with sweet synthetic and presented here because it is a widely used financial indicator used by investors and analysts to measure performance. Adjusted condensate diluents. EBITDA is reconciled to net income under the section entitled “Reconciliations to Amounts Reported Under Generally Accepted WTI: West Texas Intermediate, a grade of crude oil used as a common benchmark in oil pricing. WTI is a sweet crude oil and has a relatively low Accounting Principles” in HollyFrontier’s quarterly earnings releases furnished on Form 8-K for the fourth quarter of 2021 and on density. HF Sinclair’s future quarterly earnings releases furnished on Form 8-K, each of which are or will be available on our website, WTS: West Texas Sour, a medium sour crude oil. www.hfsinclair.com. 33
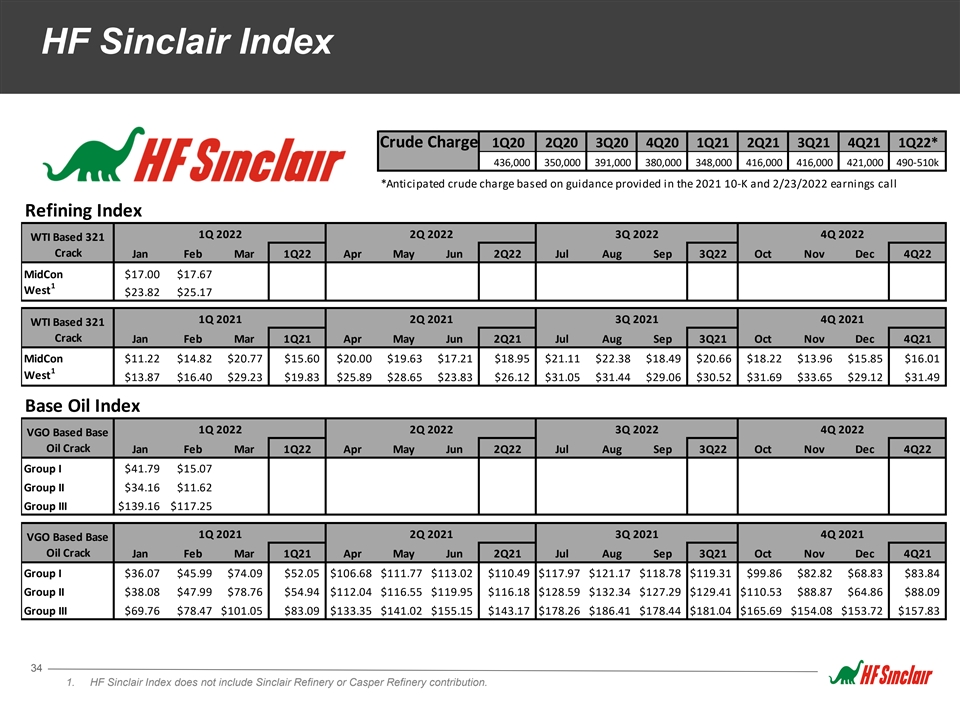
HF Sinclair Index Crude Charge 1Q20 2Q20 3Q20 4Q20 1Q21 2Q21 3Q21 4Q21 1Q22* 436,000 350,000 391,000 380,000 348,000 416,000 416,000 421,000 490-510k *Anticipated crude charge based on guidance provided in the 2021 10-K and 2/23/2022 earnings call Refining Index 1Q 2022 2Q 2022 3Q 2022 4Q 2022 WTI Based 321 Crack Jan Feb Mar 1Q22 Apr May Jun 2Q22 Jul Aug Sep 3Q22 Oct Nov Dec 4Q22 MidCon $17.00 $17.67 1 West $23.82 $25.17 1Q 2021 2Q 2021 3Q 2021 4Q 2021 WTI Based 321 Crack Jan Feb Mar 1Q21 Apr May Jun 2Q21 Jul Aug Sep 3Q21 Oct Nov Dec 4Q21 MidCon $11.22 $14.82 $20.77 $15.60 $20.00 $19.63 $17.21 $18.95 $21.11 $22.38 $18.49 $20.66 $18.22 $13.96 $15.85 $16.01 1 West $13.87 $16.40 $29.23 $19.83 $25.89 $28.65 $23.83 $26.12 $31.05 $31.44 $29.06 $30.52 $31.69 $33.65 $29.12 $31.49 Base Oil Index 1Q 2022 2Q 2022 3Q 2022 4Q 2022 VGO Based Base Oil Crack Jan Feb Mar 1Q22 Apr May Jun 2Q22 Jul Aug Sep 3Q22 Oct Nov Dec 4Q22 Group I $41.79 $15.07 Group II $34.16 $11.62 Group III $139.16 $117.25 1Q 2021 2Q 2021 3Q 2021 4Q 2021 VGO Based Base Oil Crack Jan Feb Mar 1Q21 Apr May Jun 2Q21 Jul Aug Sep 3Q21 Oct Nov Dec 4Q21 Group I $36.07 $45.99 $74.09 $52.05 $106.68 $111.77 $113.02 $110.49 $117.97 $121.17 $118.78 $119.31 $99.86 $82.82 $68.83 $83.84 Group II $38.08 $47.99 $78.76 $54.94 $112.04 $116.55 $119.95 $116.18 $128.59 $132.34 $127.29 $129.41 $110.53 $88.87 $64.86 $88.09 Group III $69.76 $78.47 $101.05 $83.09 $133.35 $141.02 $155.15 $143.17 $178.26 $186.41 $178.44 $181.04 $165.69 $154.08 $153.72 $157.83 34 1. HF Sinclair Index does not include Sinclair Refinery or Casper Refinery contribution.
HF Sinclair Disclosure HF Sinclair's actual pricing and margins may differ from benchmark indicators due to many factors. For example: • Crude Slate differences – HF Sinclair runs a wide variety of crude oils across its refining system and crude slate may vary quarter to quarter. • Product Yield differences – HF Sinclair’s product yield differs from indicator and can vary quarter to quarter as a result of changes in economics, crude slate, and operational downtime. • Other differences including but not limited to secondary costs such as product and feedstock transportation costs, purchases of environmental credits, quality differences, location of purchase or sale, and hedging gains/losses. Moreover, the presented indicators are generally based on spot sales, which may differ from realized contract prices. Market prices are available from a variety of sources, each of which may vary slightly. Please note that this data may differ from other sources due to adjustments made by data providers and due to differing data definitions. Below are indicator definitions used for purposes of this data. MidCon Indicator: (100% Group 3: Sub-octane and ULSD) – WTI West Indicator: 40% Navajo: (50% El Paso Subgrade, 50% Phoenix CBG; 50% El Paso ULSD, 50% Phoenix ULSD) – WTI 15% Woods Cross: (60% Salt Lake City Regular Gasoline, 40% Las Vegas Regular Gasoline; 80% Salt Lake City ULSD, 20% Las Vegas ULSD) – WTI 45% Puget Sound: (100% Pacific Northwest Sub-octane; 100% Pacific Northwest ULSD) - WTI Lubricants Index Appendix HF Sinclair's actual pricing and margins differ from benchmark indicators due to many factors. For example: • Retail/Distribution- HF Sinclair and PCLI use commodity base oils to produce finished lubricants, specialty products and white oils that are sold into the retail market worldwide and have a wide variety of price ranges. • Feedstock differences – HF Sinclair runs a variety of vacuum gas oil streams and hydrocracker bottoms across its refining system and feedstock slate may vary quarter to quarter. • Product Yield differences – HF Sinclair’s product yield differs from indicator and can vary quarter to quarter as a result of changes in economics and feedstocks. Other differences including, but not limited to secondary costs such as product and feedstock transportation costs, quality differences and location of purchase or sale. Moreover, the presented indicators are generally based on spot commodity base oil sales, which may differ from realized contract prices. • Market prices are available from a variety of sources, each of which may vary slightly. Please note that this data may differ from other sources due to adjustments made by data providers and due to differing data definitions. Below are indicator definitions used for purposes of this data. Group I Base Oil Indicator: (50% Group I SN150, 50% Group I SN500)-VGO Group II Base Oil Indicator: (33.3% Group II N100, 33.3% Group II N220, 33.3% Group II N600)-VGO Group III Base Oil Indicator: (33.3% Group III 4cst, 33.3% Group III 6cst, 33.3% Group III 8cst)-VGO VGO: (US Gulf Coast Low Sulfur Vacuum Gas Oil) 35 Note: HF Sinclair Index does does not include Sinclair Refinery or Casper Refinery weighting contribution

2828 N. Harwood, Suite 1300 Dallas, TX 75201 214-954-6510 HFSinclair.com Craig Biery | VP, Investor Relations Trey Schonter | Investor Relations investors@hollyfrontier.com 214-954-6510 NYSE: DINO