UNITED STATES
SECURITIES AND EXCHANGE COMMISSION
Washington, D.C. 20549
FORM N-CSR
CERTIFIED SHAREHOLDER REPORT OF REGISTERED MANAGEMENT INVESTMENT COMPANIES
Investment Company Act file number 811-23789
Touchstone ETF Trust
(Exact name of registrant as specified in charter)
303 Broadway, Suite 1100
Cincinnati, Ohio 45202-4203
(Address of principal executive offices) (Zip code)
E. Blake Moore Jr.
303 Broadway, Suite 1100
Cincinnati, Ohio 45202-4203
(Name and address of agent for service)
Registrant’s telephone number, including area code: 800-638-8194
Date of fiscal year end: December 31
Date of reporting period: December 31, 2022
Form N-CSR is to be used by management investment companies to file reports with the Commission not later than 10 days after the transmission to stockholders of any report that is required to be transmitted to stockholders under Rule 30e-1 under the Investment Company Act of 1940 (17 CFR 270.30e-1). The Commission may use the information provided on Form N-CSR in its regulatory, disclosure review, inspection, and policymaking roles.
A registrant is required to disclose the information specified by Form N-CSR, and the Commission will make this information public. A registrant is not required to respond to the collection of information contained in Form N-CSR unless the Form displays a currently valid Office of Management and Budget (“OMB”) control number. Please direct comments concerning the accuracy of the information collection burden estimate and any suggestions for reducing the burden to Secretary, Securities and Exchange Commission, 450 Fifth Street, NW, Washington, DC 20549-0609. The OMB has reviewed this collection of information under the clearance requirements of 44 U.S.C. § 3507.
Item 1. Reports to Stockholders.
| (a) | The Report to Shareholders is attached herewith. |
December 31, 2022
Annual Report
| Touchstone ETF Trust |
| Touchstone Dividend Select ETF |
| Touchstone Strategic Income Opportunities ETF |
| Touchstone Ultra Short Income ETF |
| Touchstone US Large Cap Focused ETF |

Table of Contents
This report identifies the Funds' investments on December 31, 2022. These holdings are subject to change. Not all investments in each Fund performed the same, nor is there any guarantee that these investments will perform as well in the future. Market forecasts provided in this report may not occur.
2
Letter from the President
Dear Shareholder:
We are pleased to provide you with the Touchstone ETF Trust Annual Report. Inside you will find key financial information, as well as manager commentaries for the Funds, from the Funds’ inception dates through the period ended December 31, 2022.
For the calendar year 2022, the U.S. Federal Reserve (Fed) initiated a series of Fed Funds rate hikes to combat persistent inflation. Over the course of the year, the Fed raised overnight rates by over 4 percent in an effort to slow down economic growth. The Fed’s attempt to engineer a “soft landing” for the economy created uncertainty at times throughout the year. This uncertainty contributed to a selloff in nearly every major asset class in the capital markets, a rare negative annual return for both U.S. equities and fixed income markets. Outside the U.S., global economic growth slowed due to various reasons such as the unexpected Russian invasion of Ukraine in February, disrupted supply chains and trade from continued COVID-related lockdowns in China, and political turbulence in the U.K. However, the capital markets absorption of the Russian-Ukrainian conflict by mid-year and the loosening of China’s COVID lockdowns later in the year, were not enough to squelch economic headwinds that had been occurring since the beginning of 2022 including higher rates of inflation, slowing demand and higher energy prices.
U.S. equity markets reported negative results for the year. The equity style shift from Growth to Value that began in late 2020 continued throughout 2022. Within the domestic markets, large cap value stocks outperformed their growth counterparts on a relative basis. The aforementioned Fed rate hikes disproportionately impacted growth stocks due to their higher implied growth rates and longer duration of earnings growth included in their valuation multiples. Value stocks generally benefit from higher commodity costs (e.g. Energy sector) and when equity investors seek refuge in defensive sectors such as Consumer Staples and Health Care – both of which occurred during 2022.
In the fixed income markets, Fed rate hikes and persistent inflation pushed shorter maturity yields up compared to longer maturities on the yield curve, providing a headwind for the investment grade bonds. Over the full year, credit spreads did not widen significantly despite slowing economic growth, hence below investment grade bonds outperformed their investment grade peers due to their yield advantage.
We are reminded especially in periods like these of the importance of the steady hands of financial professionals, trust in your investment strategy, and the risks of trying to time the market. Additionally, we believe that environments that are more volatile create more opportunity for active managers to add value, especially those that are Distinctively Active with high Active Share. We greatly value your continued support. Thank you for including Touchstone as part of your investment plan.
Sincerely,

E. Blake Moore Jr.
President
Touchstone ETF Trust
President
Touchstone ETF Trust
3
Management's Discussion of Fund Performance (Unaudited)
Touchstone Dividend Select ETF
Sub-Advised by Fort Washington Investment Advisors, Inc.
Investment Philosophy
The Touchstone Dividend Select ETF (the "Fund") seeks current income and capital appreciation by investing primarily in a portfolio of 40-55 dividend-paying large-capitalization equities.
Fund Performance
The Touchstone Dividend Select ETF outperformed its benchmark, the Russell 1000® Value Index, since its inception on August 2, 2022 through December 31, 2022. The Fund’s total return was 1.94 percent compared to the benchmark’s total return of 0.52 percent.
Market Environment
The period was characterized by increased volatility and high uncertainty amid persistently high inflation, tightening financial conditions, and increased geopolitical conflicts. Inflation remained elevated in the period and the U.S. Federal Reserve (Fed) solidified its hawkish stance, but the end of the period represented an important transition for markets. Data indicated slower growth and signs that inflation is beginning to ease, and the Fed slowed the pace of hikes.
Treasury yields moved sharply higher during the second half of the year, with short-term rates moving along with Fed hikes and at a faster pace than long-term rates. Following a 0.75% rate increase in November, the Fed stepped down the rate of increase to 0.50% in December, for a cumulative total of 4.25% of rate increases in 2022. Current expectations are for the Fed Funds rate to reach 4.75-5.00% in early-2023 and remain above 4.50% for the entire year. Credit spreads were somewhat volatile during the period but ended relatively unchanged to slightly tighter.
US economic growth (GDP) in the third quarter 2022 was 3.2%, a rebound from prior quarters. The headline growth number was positively impacted by an outsized change in net exports which is unlikely to repeat, and the rest of the details indicated slower, near-trend growth. Consumer and business demand rebounded from prior quarters, while residential investment (housing) and inventories subtracted from growth. This report, along with several other indicators, continues to signal that tighter financial conditions are having the desired effect of slowing the economy.
While other economic indicators show weakness, job gains and wages have remained solid, supporting spending. Higher consumer income, along with accumulated savings from pandemic-era programs, have enabled consumers to maintain solid levels of spending.
Business spending rebounded somewhat during the period, but forward-looking data indicates further softening and represents another downside risk. The downshift in global growth has negatively impacted demand and various surveys of business confidence have fallen sharply over the past several months. Importantly, inventories are plentiful and supply chains have largely normalized, contributing to reduced inflation pressures from this sector of the economy.
U.S. equities declined over the period as investors grappled with tight financial conditions and the looming possibility of an economic slowdown. The worst performing sectors in the Index for the period were Real Estate, Communication Services, and Information Technology. The benchmark sectors that outperformed the most during the period were Energy, Materials, and Consumer Staples.
Portfolio Review
The Fund’s outperformance was driven by positive stock selection within the Consumer Discretionary, Communication Services, and Materials sectors. Sectors where the Fund underperformed were Utilities, Energy, and Information Technology. The Fund’s overweight in Information Technology was a headwind which partially offset the Fund’s positive stock selection. Information Technology underperformed as higher interest rates and slowing economic growth pressured valuations for higher growth, long duration stocks.
Among the individual contributors to relative performance were overweight positions in Caterpillar Inc. (Industrials sector) ("Caterpillar"), and Merck & Co. Inc. (Health Care sector), and an underweight position to Starbucks Corp. (Consumer Discretionary sector) ("Starbucks").
Caterpillar outperformed during the period and added to performance. The company reported strong third quarter results on better than expected equipment demand, a welcomed change in tone from prior quarters. A zero weight exposure to Meta Platforms Inc. ("Meta") contributed to relative performance during the period. Meta fell nearly 25% after reporting quarterly
4
Management's Discussion of Fund Performance (Unaudited) (Continued)
results that missed expectations on advertising revenue and increased spending on the Metaverse. Meta does not pay a dividend, resulting in an underweight position for the Fund.
Starbucks also contributed to relative returns. Starbucks had been a relative underperformer for much of 2022 until the third quarter. Headwinds from lingering effects from the global pandemic, unionization efforts, and CEO uncertainty has pressured the stock for much of the past year. The third quarter brought a shift in tone as the company announced its new CEO while also providing an update on strategic guidance that impressed investors.
Outlook and Conclusion
Looking ahead, the key issue for investors is whether Fed tightening will spawn a U.S. recession, and if so, how severe it will be.
The consensus among economists is that a recession will unfold in 2023, as aggressive interest rate hikes by the Fed have resulted in a substantial tightening of financial market conditions. The positive aspect is that most forecasters envision a recession that is short and mild.
Another consideration for investors is where the Fed Funds Rate will peak and when the Fed will relax policy. In this regard, Fed officials have emphasized their commitment to bring inflation back to the 2% average annual target. Fed chair Jerome Powell stated at the December Federal Open Markets Committee (FOMC) meeting that there is still work to do to ensure this goal is attained. The median forecast of FOMC members is the Fed funds rate will peak at 5.0%-5.25% early this year and remain there for the balance of 2023.
Our take is the outcome hinges on how high the unemployment rate increases. Because Fed officials anticipate only a modest rise in unemployment to 4.6%, they are focusing on bringing inflation down. However, should unemployment rise to 5% or higher, we believe the Fed is more likely to lower rates.
Finally, another consideration is that conditions abroad are worse than in the U.S. Europe already may be in recession as policymakers face the daunting task of alleviating shortages in natural gas stemming from Russia’s invasion of Ukraine. A spike in consumer price inflation in the Eurozone to 10% is further exacerbating the situation.
At the same time, the Chinese government confronts its biggest challenge since the COVID-19 pandemic struck three years ago. It recently had to scrap its zero tolerance policy in the wake of national protests, but it lacked a strategy to limit the fallout, and the country now faces a massive outbreak.
Our view is that if a U.S. recession were to materialize, it is likely to be less severe than recent recessions for two reasons: there are no major sectoral imbalances and consumer fundamentals remain healthy and have shown resilience to tightening financial conditions. Furthermore, we do not believe a recession is necessary to control inflation. Recent inflation data has continued to trend downward and forward-looking expectations remain anchored, both encouraging signs of progress and confidence in the Fed’s ability to control inflation.
Within the Fund, we are maintaining a cautious stance but are selectively finding bottom-up opportunities while reducing outperforming defensive names where valuations have become stretched. Earnings expectations remain elevated and are at risk to fall amid slowing economic growth. Despite most equity indices ending the year near or in a bear market, downside still remains should equity earnings deteriorate.
Although risks have risen, valuations have adjusted to reasonable levels and the long-term economic outlook is still promising. As such, we remain constructive on U.S. equities. As investors seek to avoid the risks of inflation, higher interest rates, and recession, dividend strategies are a compelling option. Dividend strategies have the potential to provide both capital appreciation and a growing stream of income while also providing a cushion through lower volatility during times of distress.
5
Management's Discussion of Fund Performance (Unaudited) (Continued)
Comparison of the Change in Value of a $10,000 Investment in the Touchstone Dividend Select ETF and the Russell 1000® Value Index
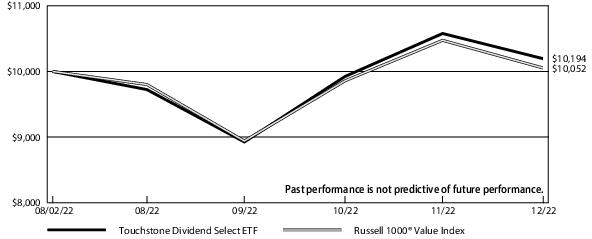
| Cumulative Total Returns** | |
| Touchstone Dividend Select ETF | Since Inception* |
| NAV | 1.94% |
| Market Price | 1.94% |
| Russell 1000® Value Index | 0.52% |
| * | The inception date of the Fund was August 2, 2022. The returns of the index listed above are based on the inception date of the Fund. |
| ** | Not annualized. |
The performance of the above Fund does not reflect the deduction of taxes that a shareholder would pay on Fund distributions or the redemption of Fund shares.
Investors buy and sell shares of an exchange-traded fund (“ETF”) at market price (not NAV) in the secondary market throughout the trading day. Shares of an ETF are not individually available for direct purchase from or direct redemption to the ETF. The ETF’s per share NAV is the value of one share of the ETF and is calculated by dividing the value of total assets less total liabilities by the number of shares outstanding. Market price returns are typically based upon the official closing price of the ETF’s shares. These returns do not represent investors’ returns had they traded shares at other times. NAV and market price returns assume that dividends and capital gain distributions have been reinvested in the Fund at NAV and market price, respectively. As with other ETFs, NAV returns and market price returns may differ because of factors such as the supply and demand for Fund shares and investors’ assessment of the underlying value of the Fund’s portfolio securities.
Information showing the Fund’s net asset value, market price, premiums and discounts, and bid-ask spreads for various time periods is available by visiting the Fund’s website at TouchstoneInvestments.com/ETFs.
Notes to Chart
Russell 1000® Value Index measures those Russell 1000 companies with lower price-to-book ratios and lower expected growth values.
The Frank Russell Company (FRC) is the source and owner of the data contained or reflected in this material and all trademarks and copyrights related thereto. The material may contain confidential information and unauthorized use, disclosure, copying, dissemination or redistribution is strictly prohibited. This is a Touchstone Investments presentation of the data, and FRC is not responsible for the formatting or configuration of this material or for any inaccuracy in the presentation thereof.
6
Management's Discussion of Fund Performance (Unaudited)
Touchstone Strategic Income Opportunities ETF
Sub-Advised by Fort Washington Investment Advisors, Inc.
Investment Philosophy
The Touchstone Strategic Income Opportunities ETF (the "Fund") seeks a high level of current income with a focus on capital preservation by investing primarily in income producing fixed income securities.
Fund Performance
The Touchstone Strategic Income Opportunities ETF outperformed its benchmark, the Bloomberg U.S. Aggregate Bond Index, since the Fund’s inception on July 21, 2022 through December 31, 2022. The Fund’s total return was -0.03 percent compared to the benchmark’s total return of -3.93 percent.
Market Environment
The second half of 2022 was characterized by increased volatility and high uncertainty amid persistently high inflation, tightening financial conditions, and increased geopolitical conflicts. Inflation remained elevated in the third quarter and the U.S. Federal Reserve (“Fed”) solidified its hawkish stance, but the fourth quarter represented an important transition for markets. Data indicated slower growth and signs that inflation is beginning to ease, and the Fed slowed the pace of hikes.
Treasury yields moved sharply higher during the second half of 2022, with short-term rates moving along with Fed hikes and at a faster pace than long-term rates. Following a 0.75% rate increase in November, the Fed stepped down the rate of increase to 0.50% in December, for a cumulative total of 4.25% of rate increases in 2022. Current expectations are for the Fed Funds rate to reach 4.75-5.00% in early-2023 and remain above 4.50% for the entire year. Credit spreads were somewhat volatile during the period but ended relatively unchanged to slightly tighter.
U.S. economic growth (GDP) in third quarter 2022 was 3.2%, a rebound from prior quarters. The headline growth number was positively impacted by an outsized change in net exports which is unlikely to repeat, and the rest of the details indicated slower, near-trend growth. Consumer and business demand rebounded from prior quarters, while residential investment (housing) and inventories subtracted from growth. This report, along with several other indicators, continues to indicate that tighter financial conditions are having the desired effect of slowing the economy.
Business spending rebounded somewhat in the period, but forward-looking data indicates further softening and represents another downside risk. The downshift in global growth has negatively impacted demand and various surveys of business confidence have fallen sharply over the past several months. Importantly, inventories are plentiful and supply chains have largely normalized, contributing to reduced inflation pressures from this sector of the economy.
An improvement in the inflation picture was a key driver of markets in the period, and will remain crucially important into 2023. During the period, inflation data decelerated notably, driven by declining commodity and other goods prices. Services inflation remained strong, but forward-looking data indicates it will also move lower in mid-2023. Along with slower growth, the improvement in inflation data allowed the Fed to downshift to a 0.50% rate increase in December. Further progress is needed to confidently say that inflation is heading back to 2.0%, but we believe recent optimism is justified and expect inflation to drift lower in 2023. For their part, we believe the Fed will continue to indicate tighter policy as inflation will remain well above target for the next several months. However, in our view, the path of policy priced into markets is appropriate and slower growth/lower inflation will put downward pressure on rates in 2023.
Credit spreads across sectors and quality ranges are generally in the 50-60 percentile relative to history after the recovery late in the period. Credit spreads reflect some uncertainty, but are not indicating significant concern of an imminent or deep recession. If the economy slows more/faster than expected, credit spreads are likely to widen. However, if a soft landing is achieved or a recession is shallow, the current level of spreads is compelling. As a result, we believe current valuations support a modest overweight to risk in portfolios.
Portfolio Review
The Fund’s outperformance during the period occurred as interest rate positioning added to relative performance versus the benchmark. The portfolio maintained a duration between 4 and 5 years during the period, compared to 6 to 6.5 years for the benchmark. Interest rates rose materially during the period, resulting in outperformance as the portfolio was positioned with a shorter duration compared to the benchmark. The yield curve moved materially higher and the curve flattened as short-term rates moved higher than long-term rates.
7
Management's Discussion of Fund Performance (Unaudited) (Continued)
Sector allocation added to relative performance during the period. An overweight allocation to High Yield and Emerging Market Debt were the primary drivers of positive sector allocation. The sectors outperformed as credit spreads tightened.
Security selection was also a positive factor for relative performance. All sectors generated positive security selection during the period, including Investment Grade Credit, Securitized, High Yield, and Emerging Markets Debt.
The Fund reduced its exposure to Investment Grade Credit and High Yield during the period, and modestly increased Emerging Markets Debt. Spreads were volatile but tightened during the period and valuations became less compelling, presenting an opportunity to modestly reduce exposure to spread sectors.
Outlook and Conclusion
Overall growth has slowed to below-trend pace, but expected softening in job growth is a downside risk over coming months. Inflation has declined from recent highs, a welcome signal for markets. However, further deceleration is needed throughout 2023 to move inflation back toward 2.0 percent. The Fed has aggressively raised rates to combat inflation and we believe will continue to indicate restrictive policy until they see a string of data that confirms a lower inflation trajectory. We believe slowing growth and tight monetary policy represents the biggest risk to markets, but we do not believe a hard recession is necessary to control inflation. As our view of the economy and monetary policy changes, we will adjust positioning as these risks evolve.
We believe the Fund is positioned to perform well in a stable to improving market environment. We believe an overweight to credit sectors should benefit investors as valuations are generally fair at current levels. The Fund had previously and currently continues to generate an above average yield through a high conviction multi-sector approach, and we believe should also perform well in a stable environment through its excess carry. The portfolio's yield rose to historically high levels during the period and we believe should help offset potential risks. In today’s volatile and uncertain environment, we believe the Fund provides a compelling solution for fixed income investors due to its flexible and risk-oriented approach.
8
Management's Discussion of Fund Performance (Unaudited) (Continued)
Comparison of the Change in Value of a $10,000 Investment in the Touchstone Strategic Income Opportunities ETF and the Bloomberg U.S. Aggregate Bond Index
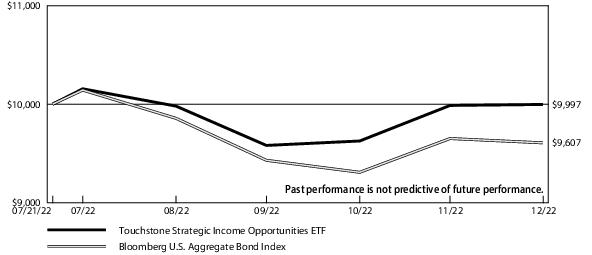
| Cumulative Total Returns** | |
| Touchstone Strategic Income Opportunities ETF | Since Inception* |
| NAV | -0.03% |
| Market Price | 0.25% |
| Bloomberg U.S. Aggregate Bond Index | -3.93% |
| * | The inception date of the Fund was July 21, 2022. The returns of the index listed above are based on the inception date of the Fund. |
| ** | Not annualized. |
The performance of the above Fund does not reflect the deduction of taxes that a shareholder would pay on Fund distributions or the redemption of Fund shares.
Investors buy and sell shares of an exchange-traded fund (“ETF”) at market price (not NAV) in the secondary market throughout the trading day. Shares of an ETF are not individually available for direct purchase from or direct redemption to the ETF. The ETF’s per share NAV is the value of one share of the ETF and is calculated by dividing the value of total assets less total liabilities by the number of shares outstanding. Market price returns are typically based upon the official closing price of the ETF’s shares. These returns do not represent investors’ returns had they traded shares at other times. NAV and market price returns assume that dividends and capital gain distributions have been reinvested in the Fund at NAV and market price, respectively. As with other ETFs, NAV returns and market price returns may differ because of factors such as the supply and demand for Fund shares and investors’ assessment of the underlying value of the Fund’s portfolio securities.
Information showing the Fund’s net asset value, market price, premiums and discounts, and bid-ask spreads for various time periods is available by visiting the Fund’s website at TouchstoneInvestments.com/ETFs.
Note to Chart
Bloomberg U.S. Aggregate Bond Index is an unmanaged index comprised of U.S. investment grade, fixed rate bond market securities, including government, government agency, corporate and mortgage-backed securities between one and ten years.
9
Management's Discussion of Fund Performance (Unaudited)
Touchstone Ultra Short Income ETF
Sub-Advised by Fort Washington Investment Advisors, Inc.
Investment Philosophy
The Touchstone Ultra Short Income ETF (the “Fund”) seeks maximum total return consistent with the preservation of capital by primarily investing in a diversified portfolio of fixed income securities of different maturities, including U.S. Treasury securities, U.S. government agency and U.S. government-sponsored enterprise securities, corporate bonds, mortgage-backed securities, commercial mortgage-backed securities, asset-backed securities, municipal bonds, collateralized loan obligations and cash equivalent securities including repurchase agreements and commercial paper. While the Fund may invest in securities of any maturity or duration, interest rate risk is managed by seeking to maintain an effective duration of one year or less under normal market conditions.
Fund Performance
The Touchstone Ultra Short Income ETF underperformed its primary benchmark, the ICE BofA 3-Month U.S. Treasury Bill Index, and outperformed its secondary benchmark, the ICE BofA 1-Year U.S. Treasury Note Index, since its inception on August 4, 2022 through December 31, 2022. The Fund’s total return was 0.87 percent while the total returns of its benchmarks were 1.22 percent and 0.20 percent, respectively.
Market Environment
The third quarter 2022 began on an optimistic note, as moderating energy and commodity prices fueled investor optimism that inflation may have peaked, and that the U.S. Federal Reserve (Fed) might soon be able to pare back its monetary tightening efforts and achieve the elusive soft landing. Risk markets enjoyed a brief rally—a welcomed reprieve from the steady negativity of the first half of the year. Optimism faded quickly, however, when Federal Reserve Chairman Jerome Powell delivered the annual speech at the Jackson Hole, Wyoming conference on August 26, 2022. While markets’ momentary optimism implied some expectation of a pivot to dovishness, Powell instead delivered a strong hawkish message. He reiterated the urgency of the Fed getting inflation under control at all costs, and conveyed his view that we were still a long way away from achieving that mandate.
August consumer price index (CPI) data was released in mid-September, showing worse-than expected persistence across all key segments—even acceleration in some areas. This undoubtedly contributed to the Fed’s decision to hike rates by 75 basis points in September (the third consecutive rate hike of that magnitude), bringing cumulative year-to-date Fed hikes to 300 basis points. In spite of this strong degree of monetary tightening, the labor market remained resilient, posting solid job gains throughout the quarter, and even a slight decline in the unemployment rate—back to the mid-summer low of 3.5%
The fourth quarter started with continued volatility across all markets and a divergence in spread movements across the fixed income sectors. With the Fed raising rates at the end of the third quarter, markets continued to process whether a soft landing might actually be achievable, or alternatively how soon a recession might start. Corporate spreads generally trended tighter during the quarter, while securitized spreads spent the first half of fourth quarter widening. That changed mid-November as buyer demand shifted into securitized, driving spreads in tighter throughout the remainder of the quarter. The Treasury curve was dynamic throughout the quarter, with movements divisible into three parts: during October, the entire curve shifted higher, as the short end (6 months and in) moved +60-90 basis points (bps) and the long end rose by 20-40 bps. A dramatic reversal occurred in November, as the front end 3 months and in rose by 25-30 bps, while the 3+year rallied 20-45 bps. December saw reversal again, as the longer part of the curve (5 years and longer) moved 20-25 bps higher and shorter tenors moved 10-15 bps higher. All-in for the quarter, markets saw short rates (1 year and in) rise 75-130 bps and longer rates move 5-10 bps in either direction.
The Fed raised rates twice in the period—75 bps in November and 50 basis points in December. After the November meeting, markets processed the possibility that the economy was slowing, and that we could see a hard landing. Markets began anticipating that the Fed would soon be pivoting from its hawkish tone, which helped drive the rally in longer treasury rates. The momentum was disrupted in December, however, as the Fed doubled down on its hawkish tone, reiterating the need to drag inflation down to the 2% target. This contrasted sharply with the September CPI of 7.7 and the October CPI at 7.1, although higher rates are certainly starting to have an effect on inflation. The Fed dots plot from the December meeting shows the Fed expecting no rate cuts until at least 2024, after rates topping off just above 5% in 2023.
The Fed ended the period maintaining their hawkish bias. Markets still generally believe there will be a recession, but are also expecting that rates will need to remain “higher for longer” in order to get inflation down to the target level. The Russian/Ukrainian war continues to threaten not just geopolitical stability but also energy and commodity markets, although a milder winter is helping by softening demand on the energy front. China is rescinding COVID restrictions to open up markets and manufacturing, while domestically we are starting to see large corporate layoffs being announced. Gross domestic product consensus forecast for 2023 is a soft 0.3%.
10
Management's Discussion of Fund Performance (Unaudited) (Continued)
Portfolio Review
The largest driver of performance was carry. Real short rates increased. While spreads tightened overall for the quarter, this was not enough to offset the movements in rates. Floating rate assets provided significant income, as coupons continued to reset at the higher rates.
Spreads across ultra short duration subsectors were volatile during the period. Markets stabilized toward period-end, especially at the top of the capital structure (AAA/AA). The strongest nominal subsector returns in the fund for the period were Collateralized Loan Obligations, Corporates, and Residential Mortgage-Backed Securities, while the lowest-returning subsectors were Commercial Mortgage-Backed Securities, and Asset- Backed Securities.
The Fund’s duration positioning at period end remained at the short end of our historical range for Ultra Short portfolios at 0.46 years. Given the rise in rates on the short end, it detracted from performance as longer duration 2.5-3 year assets tightened and yield curve was lower.
The rise in rates in the front end added to the carry on the portfolio. The reset to higher rates for floating rate assets also increased investment income in the portfolio. Carry offset the move in short rates, resulting in a positive return for the fourth quarter.
Outlook and Conclusion
We expect to see continued volatility to start the year but more stabilization in fund outflows. We also expect spreads to tighten given slower new issue pipeline for structured products. We believe the key driver for markets will continue to be the Fed as markets anticipate how high rates will go, and how long they will have to remain elevated in order to tame inflation. Financial conditions are tightening, given the higher rate environment, and consumers have continued to increase their overall debt load with higher credit card utilization rates. Nonetheless, most consumer and corporate balance sheets seem to be in good shape heading into this higher rate environment.
With the Fed keeping close watch on the markets, and our expectation for volatility to remain elevated, we continue to favor floating rate assets and shorter duration on our fixed rate securities. Although we increased cash equivalents during the fourth quarter as a defensive measure for potential seasonal outflows, we expect to reduce that to a normalized 7-10% range going forward. We continue to favor structured products over corporates given the pickup in spread and quality.
Going forward we believe the Fund is positioned well. The portfolio holds most securities marked at a discount, and will benefit from a “pull to par” as those bonds amortize and mature. We believe the higher yields from the move in rates and spreads should provide a higher carry than we have seen in quite a while, and we look to take advantage of that opportunity by reinvesting portfolio cash flow into higher-yielding assets. We still expect volatility to remain elevated, and we do expect to see some degree of recession in the near-term. With overall fund credit quality of AA-, we believe the Fund is positioned well to withstand that type of environment.
11
Management's Discussion of Fund Performance (Unaudited) (Continued)
Comparison of the Change in Value of a $10,000 Investment in the Touchstone Ultra Short Income ETF, the ICE BofA 3-Month U.S. Treasury Bill Index and the ICE BofA 1-Year U.S. Treasury Note Index
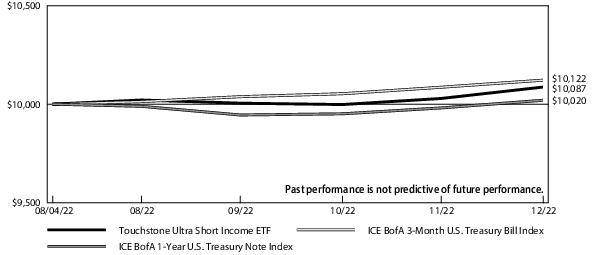
| Cumulative Total Returns** | |
| Touchstone Ultra Short Income ETF | Since Inception* |
| NAV | 0.87% |
| Market Price | 0.90% |
| ICE BofA 3-Month U.S. Treasury Bill Index | 1.22% |
| ICE BofA 1-Year U.S. Treasury Note Index | 0.20% |
| * | The inception date of the Fund was August 4, 2022. The returns of the index listed above are based on the inception date of the Fund. |
| ** | Not annualized. |
The performance of the above Fund does not reflect the deduction of taxes that a shareholder would pay on Fund distributions or the redemption of Fund shares.
Investors buy and sell shares of an exchange-traded fund (“ETF”) at market price (not NAV) in the secondary market throughout the trading day. Shares of an ETF are not individually available for direct purchase from or direct redemption to the ETF. The ETF’s per share NAV is the value of one share of the ETF and is calculated by dividing the value of total assets less total liabilities by the number of shares outstanding. Market price returns are typically based upon the official closing price of the ETF’s shares. These returns do not represent investors’ returns had they traded shares at other times. NAV and market price returns assume that dividends and capital gain distributions have been reinvested in the Fund at NAV and market price, respectively. As with other ETFs, NAV returns and market price returns may differ because of factors such as the supply and demand for Fund shares and investors’ assessment of the underlying value of the Fund’s portfolio securities.
Information showing the Fund’s net asset value, market price, premiums and discounts, and bid-ask spreads for various time periods is available by visiting the Fund’s website at TouchstoneInvestments.com/ETFs.
Notes to Chart
ICE BofA 3-Month U.S. Treasury Bill Index is an unmanaged index of Treasury securities maturing in 90 days that assumes reinvestment of all income.
ICE BofA 1-Year U.S. Treasury Note Index is an unmanaged index comprised of a single issue purchased at the beginning of the month and held for a full month. The issue selected at each month-end rebalancing is the outstanding two-year Treasury Note Bill that matures closest to, but, not beyond one year from the rebalancing date.
12
Management's Discussion of Fund Performance (Unaudited)
Touchstone US Large Cap Focused ETF
Sub-Advised by Fort Washington Investment Advisors, Inc.
Investment Philosophy
The Touchstone US Large Cap Focused ETF (the "Fund") seeks to provide investors with capital appreciation by investing in 25-45 U.S. companies of capitalizations above $5 billion at time of purchase that are trading below what is believed to be the estimate of their intrinsic value and have a sustainable competitive advantage or a high barrier to entry in place. The barrier(s) to entry can be created through a cost advantage, economies of scale, high customer loyalty or a government barrier (e.g. license or subsidy). Fort Washington believes that the strongest barrier to entry is the combination of economies of scale and high customer loyalty.
Fund Performance
The Touchstone US Large Cap Focused ETF outperformed its benchmark, the S&P 500® Index, since its inception on July 27, 2022 through December 31, 2022. The Fund’s total return was -3.25 percent compared to the benchmark’s total return of -3.82 percent.
Market Environment
U.S. equities declined over the five month period as investors grappled with tight financial conditions and the looming possibility of an economic slowdown. The worst performing sectors in the index for the period were Consumer Discretionary, Communication Services, and Real Estate. The benchmark sectors that outperformed the most during the period were Energy, Health Care, and Industrials.
Portfolio Review
Within the Fund’s holdings, sectors in which the Fund outperformed the benchmark include Energy, Materials, Industrials, Consumer Staples, Communication Services, Information Technology, and Health Care. Sectors where the Fund underperformed were Consumer Discretionary, Real Estate, and Financials. Sector allocation had a slightly negative impact to performance for the period.
Among the stocks that contributed to performance were Schlumberger Ltd. (Energy) ("Schlumberger"), Biomarin Pharmaceutical (Health Care) ("Biomarin"), and Hubbell Inc. (Industrials) ("Hubbell"). Schlumberger outperformed due to strong earnings and forward guidance as the company benefited from international oil and gas companies mobilizing rigs to capitalize on tight supply. Biomarin outperformed primarily due to third quarter results that surprised to the upside and promising activity in its pipeline. Hubbell outperformed primarily due to strong earnings results re-affirming that the company is a beneficiary of the need to improve the grid with the global energy transition.
Among the stocks that detracted the most from performance were Alphabet Inc. (Communication Services) ("Alphabet"), Amazon.com Inc. (Consumer Discretionary) ("Amazon"), and Salesforce Inc. (Information Technology) ("Salesforce"). Alphabet underperformed as online advertising has been under pressure for several reasons including consumer spending shifting toward offline channels post-COVID, inflationary pressures limiting discretionary spending, and Apple privacy changes impacting advertisers’ return on investment. Amazon underperformed due to pull forward of demand and overbuilding of fulfillment capacity. Salesforce underperformed primarily due to concerns that macroeconomic headwinds would expand the length of its sales cycle and reduce deal sizes.
Outlook and Conclusion
Despite the fourth quarter rally in equities, the path for a soft landing remains narrow and we continue to see indications of the slowdown we thought was likely in the back half of 2022 and into 2023 mainly due to the lag effects of higher interest rates and higher prices. The labor market and consumer spending have been resilient buoyed by elevated pandemic savings. But with sustained tight financial conditions, we see additional downside risk to growth.
Based on our outlook, we have been mitigating risk through a combination of long standing elements of our process and gradual shifts in portfolio positioning. Several components seek to mitigate the impact of higher inflation and interest rates. First, we believe focusing on barriers to entry in fundamental analysis, specifically businesses with pricing power, is especially important today as companies look to pass on cost pressures. Second, consistently using conservative discount rates provides a cushion as rates rise. Last, prioritizing a margin of safety with each holding provides additional risk mitigation for challenging market environments. Additionally, we seek to gradually reduce portfolio risk in terms of both sector weights and exposures within sectors. Within sectors,
13
Management's Discussion of Fund Performance (Unaudited) (Continued)
we also take opportunities to swap out of positions in favor of new positions that come with some combination of fundamental risk reduction and higher margin of safety in valuation.
The Fund continues to emphasize businesses with higher barriers to entry and returns on capital. Portfolio positioning is fairly defensive as we look for opportunities that fit our framework through the volatility. We believe this risk posture combined with continued disciplined execution of our process will benefit the portfolio going forward.
Comparison of the Change in Value of a $10,000 Investment in the Touchstone US Large Cap Focused ETF and the S&P 500® Index
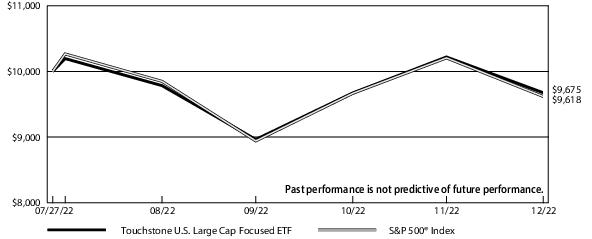
| Cumulative Total Returns** | |
| Touchstone US Large Cap Focused ETF | Since Inception* |
| NAV | -3.25% |
| Market Price | -3.29% |
| S&P 500® Index | -3.82% |
| * | The inception date of the Fund was July 27, 2022. The returns of the index listed above are based on the inception date of the Fund. |
| ** | Not annualized. |
The performance of the above Fund does not reflect the deduction of taxes that a shareholder would pay on Fund distributions or the redemption of Fund shares.
Investors buy and sell shares of an exchange-traded fund (“ETF”) at market price (not NAV) in the secondary market throughout the trading day. Shares of an ETF are not individually available for direct purchase from or direct redemption to the ETF. The ETF’s per share NAV is the value of one share of the ETF and is calculated by dividing the value of total assets less total liabilities by the number of shares outstanding. Market price returns are typically based upon the official closing price of the ETF’s shares. These returns do not represent investors’ returns had they traded shares at other times. NAV and market price returns assume that dividends and capital gain distributions have been reinvested in the Fund at NAV and market price, respectively. As with other ETFs, NAV returns and market price returns may differ because of factors such as the supply and demand for Fund shares and investors’ assessment of the underlying value of the Fund’s portfolio securities.
Information showing the Fund’s net asset value, market price, premiums and discounts, and bid-ask spreads for various time periods is available by visiting the Fund’s website at TouchstoneInvestments.com/ETFs.
Note to Chart
S&P 500® Index is a group of 500 widely held stocks and is commonly regarded to be representative of the large capitalization stock universe.
14
Tabular Presentation of Portfolios of Investments (Unaudited)
December 31, 2022
The tables below provide each Fund’s credit quality and/or sector allocation. We hope it will be useful to shareholders as it summarizes key information about each Fund’s investments.
Touchstone Dividend Select ETF
| Sector Allocation*(% of Net Assets) | |
| Information Technology | 23.2% |
| Health Care | 13.6 |
| Industrials | 11.1 |
| Consumer Discretionary | 10.2 |
| Financials | 10.1 |
| Consumer Staples | 7.3 |
| Communication Services | 6.3 |
| Energy | 4.4 |
| Materials | 4.1 |
| Utilities | 3.2 |
| Real Estate | 2.7 |
| Other Assets/Liabilities (Net) | 3.8 |
| Total | 100.0% |
Touchstone Strategic Income Opportunities ETF
| Credit Quality**(% of Fixed Income Securities) | |
| AAA/Aaa | 21.7% |
| AA/Aa | 4.5 |
| A/A | 7.6 |
| BBB/Baa | 41.7 |
| BB/Ba | 14.5 |
| B/B | 8.1 |
| CCC | 1.7 |
| CC | 0.2 |
| Total | 100.0% |
| Sector Allocation*(% of Net Assets) | |
| Corporate Bonds | 48.0% |
| U.S. Treasury Obligations | 19.6 |
| Asset-Backed Securities | 11.9 |
| Commercial Mortgage-Backed Securities | 7.3 |
| Common Stocks | |
| Industrials | 0.8 |
| Information Technology | 0.8 |
| Financials | 0.7 |
| Consumer Staples | 0.4 |
| Health Care | 0.4 |
| Materials | 0.4 |
| Energy | 0.4 |
| Communication Services | 0.4 |
| Sovereign Government Obligations | 3.9 |
| Non-Agency Collateralized Mortgage Obligations | 2.0 |
| Preferred Stocks | |
| Financials | 0.3 |
| Short-Term Investment Fund | 1.0 |
| Other Assets/Liabilities (Net) | 1.7 |
| Total | 100.0% |
* Sector classifications are based upon the Global Industry Classification Standard (GICS®).
** Credit quality ratings are from S&P Global Ratings ("S&P") and Moody's Investors Service (“Moody's”). If agency ratings differ, the higher rating will be used. Where no rating has been assigned, it may be for reasons unrelated to the creditworthiness of the issuer.
15
Tabular Presentation of Portfolios of Investments (Unaudited) (Continued)
Touchstone Ultra Short Income ETF
| Credit Quality*(% of Fixed Income Securities) | |
| AAA/Aaa | 46.4% |
| AA/Aa | 13.7 |
| A/A | 13.2 |
| BBB/Baa | 18.4 |
| BB/Ba | 1.3 |
| Cash Equivalents | 7.0 |
| Total | 100.0% |
Touchstone US Large Cap Focused ETF
| Sector Allocation**(% of Net Assets) | |
| Information Technology | 27.3% |
| Health Care | 17.9 |
| Financials | 11.9 |
| Communication Services | 11.0 |
| Industrials | 8.6 |
| Consumer Discretionary | 6.6 |
| Consumer Staples | 4.8 |
| Energy | 4.4 |
| Materials | 1.7 |
| Real Estate | 1.2 |
| Other Assets/Liabilities (Net) | 4.6 |
| Total | 100.0% |
* Credit quality ratings are from S&P Global Ratings ("S&P") and Moody's Investors Service (“Moody's”). If agency ratings differ, the higher rating will be used. Where no rating has been assigned, it may be for reasons unrelated to the creditworthiness of the issuer.
** Sector classifications are based upon the Global Industry Classification Standard (GICS®).
16
Portfolio of Investments
Touchstone Dividend Select ETF – December 31, 2022
| Shares | Market Value | |||
| Common Stocks — 96.2% | ||||
| Information Technology — 23.2% | ||||
| 4,032 | Apple, Inc. | $ 523,878 | ||
| 966 | Broadcom, Inc. | 540,120 | ||
| 10,290 | Cisco Systems, Inc. | 490,216 | ||
| 14,226 | Intel Corp. | 375,993 | ||
| 4,032 | International Business Machines Corp. | 568,068 | ||
| 1,470 | KLA Corp. | 554,234 | ||
| 3,738 | Microsoft Corp. | 896,447 | ||
| 8,106 | Oracle Corp. | 662,584 | ||
| 3,822 | QUALCOMM, Inc. | 420,191 | ||
| 3,066 | Texas Instruments, Inc. | 506,565 | ||
| 2,978 | Visa, Inc. - Class A | 618,709 | ||
| 6,157,005 | ||||
| Health Care — 13.6% | ||||
| 2,856 | AmerisourceBergen Corp. | 473,268 | ||
| 3,226 | Bristol-Myers Squibb Co. | 232,111 | ||
| 5,154 | CVS Health Corp. | 480,301 | ||
| 3,528 | Johnson & Johnson | 623,221 | ||
| 7,301 | Medtronic PLC | 567,434 | ||
| 5,670 | Merck & Co., Inc. | 629,086 | ||
| 1,128 | UnitedHealth Group, Inc. | 598,043 | ||
| 3,603,464 | ||||
| Industrials — 11.1% | ||||
| 2,968 | 3M Co. | 355,922 | ||
| 2,184 | Caterpillar, Inc. | 523,199 | ||
| 2,502 | Eaton Corp. PLC | 392,689 | ||
| 1,302 | Lockheed Martin Corp. | 633,410 | ||
| 5,964 | Raytheon Technologies Corp. | 601,887 | ||
| 5,967 | Stanley Black & Decker, Inc. | 448,241 | ||
| 2,955,348 | ||||
| Consumer Discretionary — 10.2% | ||||
| 1,882 | Dollar General Corp. | 463,442 | ||
| 1,680 | Home Depot, Inc. (The) | 530,645 | ||
| 2,065 | McDonald's Corp. | 544,189 | ||
| 6,300 | Starbucks Corp. | 624,960 | ||
| 4,284 | Yum! Brands, Inc. | 548,695 | ||
| 2,711,931 | ||||
| Financials — 10.1% | ||||
| 15,116 | Bank of America Corp. | 500,642 | ||
| 939 | BlackRock, Inc. | 665,404 | ||
| 1,764 | Goldman Sachs Group, Inc. (The) | 605,722 | ||
| 3,444 | JPMorgan Chase & Co. | 461,840 | ||
| 10,836 | Wells Fargo & Co. | 447,419 | ||
| 2,681,027 | ||||
| Consumer Staples — 7.3% | ||||
| 7,056 | Coca-Cola Co. (The) | 448,832 | ||
| 2,646 | PepsiCo, Inc. | 478,026 | ||
| 5,513 | Philip Morris International, Inc. | 557,971 | ||
| 3,318 | Walmart, Inc. | 470,459 | ||
| 1,955,288 | ||||
| Shares | Market Value | |||
| Communication Services — 6.3% | ||||
| 21,079 | AT&T, Inc. | $ 388,065 | ||
| 13,198 | Comcast Corp. - Class A | 461,534 | ||
| 10,878 | Fox Corp. - Class A | 330,365 | ||
| 12,883 | Verizon Communications, Inc. | 507,590 | ||
| 1,687,554 | ||||
| Energy — 4.4% | ||||
| 5,931 | Exxon Mobil Corp. | 654,190 | ||
| 4,077 | Valero Energy Corp. | 517,208 | ||
| 1,171,398 | ||||
| Materials — 4.1% | ||||
| 1,620 | Air Products & Chemicals, Inc. | 499,381 | ||
| 8,728 | DuPont de Nemours, Inc. | 599,003 | ||
| 1,098,384 | ||||
| Utilities — 3.2% | ||||
| 6,300 | Dominion Energy, Inc. | 386,316 | ||
| 4,410 | Duke Energy Corp. | 454,186 | ||
| 840,502 | ||||
| Real Estate — 2.7% | ||||
| 1,919 | American Tower Corp. REIT | 406,559 | ||
| 2,562 | Simon Property Group, Inc. REIT | 300,984 | ||
| 707,543 | ||||
| Total Common Stocks | $25,569,444 | |||
| Total Investment Securities—96.2% (Cost $25,198,627) | $25,569,444 | |||
| Other Assets in Excess of Liabilities — 3.8% | 1,000,816 | |||
| Net Assets — 100.0% | $26,570,260 | |||
| Portfolio Abbreviations: |
| PLC – Public Limited Company |
| REIT – Real Estate Investment Trust |
Other Information:
The inputs or methodology used for valuing securities may not be an indication of the risk associated with investing in those securities. For more information on valuation inputs, and their aggregation into the levels used in the table below, please refer to the security valuation section in the accompanying Notes to Financial Statements.
| Valuation Inputs at Reporting Date: | ||||
| Description | Level 1 | Level 2 | Level 3 | Total |
| Common Stocks | $25,569,444 | $— | $— | $25,569,444 |
See accompanying Notes to Financial Statements.
17
Portfolio of Investments
Touchstone Strategic Income Opportunities ETF – December 31, 2022
| Principal Amount | Market Value | |||
| Corporate Bonds — 48.0% | ||||
| Financials — 10.3% | ||||
| $ 800,000 | Allstate Corp. (The), Ser B, 5.750%, 8/15/53 | $ 752,000 | ||
| 826,000 | Bank of Nova Scotia (The) (Canada), 3.625%, 10/27/81 | 602,567 | ||
| 831,000 | Barclays PLC (United Kingdom), 2.894%, 11/24/32 | 635,350 | ||
| 363,000 | Charles Schwab Corp. (The), 5.000%(A) | 331,418 | ||
| 363,000 | Charles Schwab Corp. (The), Ser H, 4.000%(A) | 289,474 | ||
| 576,000 | Citigroup, Inc., Ser W, 4.000%(A) | 501,765 | ||
| 412,000 | Corestates Capital III, 144a, (3M LIBOR +0.570%), 5.176%, 2/15/27(B) | 383,740 | ||
| 327,000 | Credit Acceptance Corp., 6.625%, 3/15/26 | 309,878 | ||
| 561,000 | First Maryland Capital II, (3M LIBOR +0.850%), 5.290%, 2/1/27(B) | 518,603 | ||
| 230,000 | FirstCash, Inc., 144a, 4.625%, 9/1/28 | 201,931 | ||
| 898,000 | Golub Capital BDC, Inc., 2.050%, 2/15/27 | 731,248 | ||
| 422,000 | Icahn Enterprises LP / Icahn Enterprises Finance Corp., 5.250%, 5/15/27 | 386,383 | ||
| 650,000 | JPMorgan Chase & Co., 5.717%, 9/14/33 | 639,171 | ||
| 538,000 | Morgan Stanley, 5.297%, 4/20/37 | 493,522 | ||
| 611,000 | PNC Capital Trust, (3M LIBOR +0.570%), 5.331%, 6/1/28(B) | 563,270 | ||
| 604,000 | Prudential Financial, Inc., 5.125%, 3/1/52 | 549,640 | ||
| 419,000 | Sabra Health Care LP REIT, 3.900%, 10/15/29 | 351,455 | ||
| 815,000 | Sixth Street Specialty Lending, Inc., 2.500%, 8/1/26† | 713,832 | ||
| 832,000 | Truist Bank, Ser A, (3M LIBOR +0.670%), 5.320%, 5/15/27(B) | 771,041 | ||
| 508,000 | Truist Financial Corp., Ser Q, 5.100%(A) | 469,900 | ||
| 10,196,188 | ||||
| Consumer Discretionary — 7.2% | ||||
| 783,000 | Brunswick Corp., 4.400%, 9/15/32 | 663,241 | ||
| 385,000 | Carriage Services, Inc., 144a, 4.250%, 5/15/29 | 305,564 | ||
| 413,000 | Churchill Downs, Inc., 144a, 4.750%, 1/15/28 | 369,635 | ||
| 369,000 | Coty, Inc. / HFC Prestige Products, Inc. / HFC Prestige International US LLC, 144a, 4.750%, 1/15/29 | 333,945 | ||
| 727,000 | Ferguson Finance PLC, 144a, 4.650%, 4/20/32 | 663,827 | ||
| 204,000 | Ford Motor Co., 4.750%, 1/15/43 | 146,520 | ||
| 227,000 | Ford Motor Credit Co. LLC, 4.125%, 8/17/27 | 203,165 | ||
| 310,000 | GEMS MENASA Cayman Ltd. / GEMS Education Delaware LLC (United Arab Emirates), 7.125%, 7/31/26 | 297,850 | ||
| 1,173,000 | General Motors Financial Co., Inc., 3.100%, 1/12/32 | 922,368 | ||
| 525,000 | GENM Capital Labuan Ltd. (Malaysia), 144a, 3.882%, 4/19/31 | 393,333 | ||
| 831,000 | Imperial Brands Finance PLC (United Kingdom), 144a, 3.500%, 7/26/26 | 764,654 | ||
| 395,000 | Royal Caribbean Cruises Ltd., 144a, 5.375%, 7/15/27 | 319,832 | ||
| 722,000 | Toll Brothers Finance Corp., 3.800%, 11/1/29 | 617,163 | ||
| 168,000 | Warnermedia Holdings, Inc., 144a, 4.279%, 3/15/32 | 138,578 | ||
| 727,000 | Warnermedia Holdings, Inc., 144a, 5.141%, 3/15/52 | 531,086 | ||
| 529,000 | Wynn Macau Ltd. (Macao), 144a, 4.875%, 10/1/24† | 499,449 | ||
| 7,170,210 | ||||
| Industrials — 6.8% | ||||
| 377,000 | ADT Security Corp. (The), 144a, 4.875%, 7/15/32 | 320,385 | ||
| 425,000 | American Axle & Manufacturing, Inc., 6.500%, 4/1/27 | 383,435 | ||
| 367,000 | Amsted Industries, Inc., 144a, 4.625%, 5/15/30 | 312,868 | ||
| 267,000 | Boeing Co. (The), 5.805%, 5/1/50 | 248,585 | ||
| 381,000 | Canpack SA / Canpack US LLC (Poland), 144a, 3.125%, 11/1/25 | 333,825 | ||
| 415,000 | Cimpress PLC (Ireland), 144a, 7.000%, 6/15/26 | 286,890 | ||
| 458,000 | Fortress Transportation & Infrastructure Investors LLC, 144a, 6.500%, 10/1/25 | 430,613 | ||
| 634,000 | General Electric Co., Ser D, (3M LIBOR +3.330%), 8.099%(A) | 622,869 | ||
| 453,000 | Granite US Holdings Corp., 144a, 11.000%, 10/1/27 | 477,349 | ||
| 783,000 | Mohawk Industries, Inc., 3.625%, 5/15/30† | 676,507 | ||
| 782,000 | Oshkosh Corp., 3.100%, 3/1/30 | 661,555 | ||
| Principal Amount | Market Value | |||
| Industrials — (Continued) | ||||
| $ 434,000 | Pactiv Evergreen Group Issuer, Inc. / Pactiv Evergreen Group Issuer LLC, 144a, 4.000%, 10/15/27 | $ 384,675 | ||
| 392,000 | Seaspan Corp. (Hong Kong), 144a, 5.500%, 8/1/29 | 297,058 | ||
| 363,000 | Stericycle, Inc., 144a, 3.875%, 1/15/29 | 316,717 | ||
| 322,000 | TransDigm, Inc., 144a, 6.250%, 3/15/26 | 317,553 | ||
| 753,000 | Weir Group PLC (The) (United Kingdom), 144a, 2.200%, 5/13/26 | 668,580 | ||
| 6,739,464 | ||||
| Energy — 4.9% | ||||
| 502,000 | Cenovus Energy, Inc. (Canada), 5.250%, 6/15/37 | 459,354 | ||
| 344,000 | CQP Holdco LP / BIP-V Chinook Holdco LLC, 144a, 5.500%, 6/15/31 | 300,487 | ||
| 408,000 | DCP Midstream Operating LP, 144a, 5.850%, 5/21/43 | 398,012 | ||
| 218,000 | Genesis Energy LP / Genesis Energy Finance Corp., 5.625%, 6/15/24 | 210,369 | ||
| 158,000 | Genesis Energy LP / Genesis Energy Finance Corp., 6.500%, 10/1/25 | 150,068 | ||
| 382,000 | Hilcorp Energy I LP / Hilcorp Finance Co., 144a, 6.000%, 2/1/31 | 329,497 | ||
| 430,000 | MC Brazil Downstream Trading SARL (Brazil), 144a, 7.250%, 6/30/31 | 354,679 | ||
| 536,000 | Murphy Oil Corp., 6.375%, 7/15/28 | 515,927 | ||
| 596,000 | NGPL PipeCo LLC, 144a, 7.768%, 12/15/37 | 622,675 | ||
| 371,000 | Parkland Corp. (Canada), 144a, 4.500%, 10/1/29 | 309,559 | ||
| 770,000 | Petroleos Mexicanos (Mexico), 6.625%, 6/15/35 | 558,944 | ||
| 371,000 | Precision Drilling Corp. (Canada), 144a, 6.875%, 1/15/29 | 345,404 | ||
| 340,000 | YPF SA (Argentina), 9.000%, 2/12/26 | 325,658 | ||
| 4,880,633 | ||||
| Utilities — 4.7% | ||||
| 727,000 | CMS Energy Corp., 4.750%, 6/1/50 | 628,825 | ||
| 598,000 | Edison International, 4.125%, 3/15/28 | 555,713 | ||
| 452,000 | Edison International, Ser B, 5.000%(A) | 379,680 | ||
| 450,000 | Eskom Holdings SOC Ltd. (South Africa), 144a, 8.450%, 8/10/28 | 394,023 | ||
| 513,000 | FirstEnergy Transmission LLC, 144a, 5.450%, 7/15/44 | 480,025 | ||
| 515,000 | Minejesa Capital BV (Indonesia), 4.625%, 8/10/30 | 450,728 | ||
| 598,000 | Pacific Gas & Electric Co., 2.500%, 2/1/31 | 467,270 | ||
| 658,000 | PPL Capital Funding, Inc., Ser A, (3M LIBOR +2.665%), 7.395%, 3/30/67(B) | 565,551 | ||
| 844,000 | WEC Energy Group, Inc., (3M LIBOR +2.112%), 6.719%, 5/15/67(B) | 706,040 | ||
| 4,627,855 | ||||
| Communication Services — 3.9% | ||||
| 379,000 | Arches Buyer, Inc., 144a, 4.250%, 6/1/28 | 296,416 | ||
| 155,000 | Belo Corp., 7.750%, 6/1/27 | 151,319 | ||
| 472,000 | British Telecommunications PLC (United Kingdom), 5.125%, 12/4/28 | 459,138 | ||
| 341,000 | British Telecommunications PLC (United Kingdom), 144a, 3.250%, 11/8/29 | 291,301 | ||
| 597,000 | CCO Holdings LLC / CCO Holdings Capital Corp., 144a, 4.250%, 2/1/31 | 478,863 | ||
| 591,000 | Charter Communications Operating LLC / Charter Communications Operating Capital, 6.484%, 10/23/45 | 535,229 | ||
| 362,000 | Connect Finco SARL / Connect US Finco LLC (United Kingdom), 144a, 6.750%, 10/1/26 | 335,487 | ||
| 429,000 | CSC Holdings LLC, 144a, 4.625%, 12/1/30 | 237,046 | ||
| 374,000 | Gray Escrow II, Inc., 144a, 5.375%, 11/15/31 | 269,523 | ||
| 450,000 | Paramount Global, 4.200%, 5/19/32 | 369,608 | ||
18
Touchstone Strategic Income Opportunities ETF (Continued)
| Principal Amount | Market Value | |||
| Corporate Bonds — 48.0% (Continued) | ||||
| Communication Services — (Continued) | ||||
| $ 330,000 | Stagwell Global, 144a, 5.625%, 8/15/29 | $ 272,111 | ||
| 177,000 | TEGNA, Inc., 5.000%, 9/15/29 | 167,938 | ||
| 3,863,979 | ||||
| Materials — 3.1% | ||||
| 890,000 | Braskem Netherlands Finance BV (Brazil), 144a, 5.875%, 1/31/50 | 689,407 | ||
| 781,000 | Celanese US Holdings LLC, 6.165%, 7/15/27 | 771,438 | ||
| 500,000 | Freeport Indonesia PT (Indonesia), 144a, 5.315%, 4/14/32 | 458,617 | ||
| 760,000 | GCC SAB de CV, 144a, 3.614%, 4/20/32 | 632,500 | ||
| 116,000 | Hudbay Minerals, Inc. (Canada), 144a, 4.500%, 4/1/26 | 105,367 | ||
| 550,000 | OCP SA (Morocco), 3.750%, 6/23/31 | 459,800 | ||
| 3,117,129 | ||||
| Consumer Staples — 2.3% | ||||
| 285,000 | Coruripe Netherlands BV (Brazil), 144a, 10.000%, 2/10/27 | 228,000 | ||
| 571,000 | JBS USA LUX SA / JBS USA Food Co. / JBS USA Finance, Inc., 144a, 6.500%, 12/1/52 | 543,344 | ||
| 415,000 | QVC, Inc., 4.375%, 9/1/28 | 247,963 | ||
| 500,000 | Turning Point Brands, Inc., 144a, 5.625%, 2/15/26 | 431,255 | ||
| 450,000 | Ulker Biskuvi Sanayi AS (Turkey), 144a, 6.950%, 10/30/25 | 377,303 | ||
| 515,000 | United Rentals North America, Inc., 3.750%, 1/15/32 | 420,152 | ||
| 2,248,017 | ||||
| Health Care — 1.9% | ||||
| 519,000 | CVS Health Corp., 5.050%, 3/25/48 | 468,185 | ||
| 361,000 | Medline Borrower LP, 144a, 3.875%, 4/1/29 | 290,562 | ||
| 368,000 | MEDNAX, Inc., 144a, 5.375%, 2/15/30 | 319,781 | ||
| 569,000 | Mylan, Inc., 4.550%, 4/15/28 | 527,994 | ||
| 369,000 | US Acute Care Solutions LLC, 144a, 6.375%, 3/1/26 | 327,459 | ||
| 1,933,981 | ||||
| Real Estate — 1.9% | ||||
| 383,000 | Iron Mountain, Inc. REIT, 144a, 4.875%, 9/15/27 | 352,207 | ||
| 421,000 | RHP Hotel Properties LP / RHP Finance Corp. REIT, 144a, 4.500%, 2/15/29 | 363,152 | ||
| 703,000 | SBA Tower Trust REIT, 144a, 6.599%, 1/15/28 | 705,231 | ||
| 222,000 | STORE Capital Corp. REIT, 4.500%, 3/15/28 | 200,558 | ||
| 258,000 | STORE Capital Corp. REIT, 4.625%, 3/15/29 | 231,829 | ||
| 1,852,977 | ||||
| Information Technology — 1.0% | ||||
| 372,000 | Clarivate Science Holdings Corp., 144a, 4.875%, 7/1/29 | 316,330 | ||
| 589,000 | Micron Technology, Inc., 2.703%, 4/15/32 | 444,002 | ||
| 258,000 | Micron Technology, Inc., 6.750%, 11/1/29 | 262,969 | ||
| 1,023,301 | ||||
| Total Corporate Bonds | $47,653,734 | |||
| U.S. Treasury Obligations — 19.6% | ||||
| 1,273,609 | U.S. Treasury Bond, 0.125%, 2/15/52 | 824,712 | ||
| 2,925,000 | U.S. Treasury Bond, 2.375%, 2/15/42 | 2,249,279 | ||
| 1,285,000 | U.S. Treasury Bond, 3.250%, 5/15/42 | 1,134,213 | ||
| 3,600,000 | U.S. Treasury Note, 0.500%, 11/30/23 | 3,463,594 | ||
| 4,950,000 | U.S. Treasury Note, 0.750%, 5/31/26 | 4,420,002 | ||
| 8,015,000 | U.S. Treasury Note, 2.750%, 8/15/32 | 7,324,959 | ||
| Total U.S. Treasury Obligations | $19,416,759 | |||
| Asset-Backed Securities — 11.9% | ||||
| 900,000 | AMMC CLO 16 Ltd. (Cayman Islands), Ser 2015-16A, Class CR2, 144a, (3M LIBOR +1.950%), 5.961%, 4/14/29(B) | 873,498 | ||
| 1,000,000 | CFIP CLO Ltd. (Cayman Islands), Ser 2014-1A, Class BR, 144a, (3M LIBOR +1.850%), 5.791%, 7/13/29(B) | 978,926 | ||
| 1,000,000 | CFIP CLO Ltd. (Cayman Islands), Ser 2018-1A, Class D, 144a, (3M LIBOR +3.240%), 7.434%, 7/18/31(B) | 884,882 | ||
| Principal Amount | Market Value | |||
| Asset-Backed Securities — 11.9% (Continued) | ||||
| $1,099,688 | Driven Brands Funding LLC, Ser 2020-1A, Class A2, 144a, 3.786%, 7/20/50 | $ 942,763 | ||
| 1,080,000 | FOCUS Brands Funding LLC, Ser 2018-1, Class A2, 144a, 5.184%, 10/30/48 | 989,385 | ||
| 1,000,000 | Franklin Park Place CLO I LLC (Cayman Islands), Ser 2022-1A, Class B, 144a, (TSFR3M +2.000%), 5.827%, 4/14/35(B) | 935,881 | ||
| 1,000,000 | Golub Capital Partners CLO 25M Ltd. (Cayman Islands), Ser 2015-25A, Class BR, 144a, (3M LIBOR +1.900%), 6.432%, 5/5/30(B) | 955,122 | ||
| 1,019,738 | Hardee's Funding LLC, Ser 2018-1A, Class A2II, 144a, 4.959%, 6/20/48 | ��� 957,556 | ||
| 1,000,000 | NBC Funding LLC, Ser 2021-1, Class B, 144a, 4.970%, 7/30/51 | 856,073 | ||
| 1,182,000 | Neighborly Issuer LLC, Ser 2021-1A, Class A2, 144a, 3.584%, 4/30/51 | 945,211 | ||
| 685,000 | Prestige Auto Receivables Trust, Ser 2019-1A, Class E, 144a, 3.900%, 5/15/26 | 672,422 | ||
| 1,075,000 | Tesla Auto Lease Trust, Ser 2021-A, Class E, 144a, 2.640%, 3/20/25 | 1,006,038 | ||
| 987,500 | Zaxby's Funding LLC, Ser 2021-1A, Class A2, 144a, 3.238%, 7/30/51 | 794,323 | ||
| Total Asset-Backed Securities | $11,792,080 | |||
| Commercial Mortgage-Backed Securities — 7.3% | ||||
| 2,000,000 | BBCMS Mortgage Trust, Ser 2022-C17, Class XD, 144a, 3.040%, 9/15/55(B)(C)(D) | 408,010 | ||
| 800,000 | Benchmark Mortgage Trust, Ser 2020-B18, Class AGND, 144a, 3.744%, 7/15/53 | 679,253 | ||
| 752,659 | BX Commercial Mortgage Trust, Ser 2019-XL, Class A, 144a, (1M LIBOR +0.920%), 5.370%, 10/15/36(B) | 743,380 | ||
| 1,250,000 | BX Commercial Mortgage Trust, Ser 2020-VIV2, Class C, 144a, 3.542%, 3/9/44(B)(D) | 979,261 | ||
| 992,505 | CHC Commercial Mortgage Trust 2019 - CHC, Ser 2019-CHC, Class D, 144a, (1M LIBOR +2.050%), 6.368%, 6/15/34(B) | 911,947 | ||
| 1,125,000 | Citigroup Commercial Mortgage Trust, Ser 2013-375P, Class C, 144a, 3.518%, 5/10/35(B)(D) | 1,036,013 | ||
| 1,100,000 | Citigroup Commercial Mortgage Trust, Ser 2014-GC25, Class D, 144a, 3.548%, 10/10/47 | 957,289 | ||
| 1,250,000 | Citigroup Commercial Mortgage Trust, Ser 2017-P8, Class D, 144a, 3.000%, 9/15/50 | 896,761 | ||
| 600,000 | WFRBS Commercial Mortgage Trust, Ser 2013-C13, Class D, 144a, 4.147%, 5/15/45(B)(D) | 580,636 | ||
| Total Commercial Mortgage-Backed Securities | $7,192,550 | |||
| Shares | ||||
| Common Stocks — 4.3% | ||||
| Industrials — 0.8% | ||||
| 802 | Lockheed Martin Corp. | 390,165 | ||
| 4,080 | Raytheon Technologies Corp. | 411,753 | ||
| 801,918 | ||||
| Information Technology — 0.8% | ||||
| 2,668 | International Business Machines Corp. | 375,895 | ||
| 2,333 | Texas Instruments, Inc. | 385,458 | ||
| 761,353 | ||||
| Financials — 0.7% | ||||
| 10,569 | Bank of America Corp. | 350,045 | ||
| 1,036 | Goldman Sachs Group, Inc. (The) | 355,742 | ||
| 705,787 | ||||
| Consumer Staples — 0.4% | ||||
| 4,457 | Philip Morris International, Inc. | 451,093 | ||
19
Touchstone Strategic Income Opportunities ETF (Continued)
| Shares | MarketValue | |||
| Common Stocks — 4.3% (Continued) | ||||
| Health Care — 0.4% | ||||
| 2,326 | Johnson & Johnson | $ 410,888 | ||
| Materials — 0.4% | ||||
| 5,690 | DuPont de Nemours, Inc. | 390,505 | ||
| Energy — 0.4% | ||||
| 3,501 | Exxon Mobil Corp. | 386,160 | ||
| Communication Services — 0.4% | ||||
| 20,709 | AT&T, Inc. | 381,253 | ||
| Total Common Stocks | $4,288,957 | |||
| Principal Amount | ||||
| Sovereign Government Obligations — 3.9% | ||||
| $ 590,000 | Angolan Government International Bond, 144a, 8.000%, 11/26/29 | 516,581 | ||
| 350,000 | Bahamas Government International Bond, 144a, 6.000%, 11/21/28 | 266,913 | ||
| 350,000 | Chile Government International Bond, 3.100%, 5/7/41 | 250,942 | ||
| 450,000 | Colombia Government International Bond, 3.250%, 4/22/32 | 327,157 | ||
| 550,000 | Dominican Republic International Bond, 144a, 4.875%, 9/23/32 | 456,541 | ||
| 420,000 | Ecuador Government International Bond, 2.500%, 7/31/35 | 193,090 | ||
| 190,000 | Ecuador Government International Bond, 144a, 5.500%, 7/31/30 | 122,088 | ||
| 610,000 | Egypt Government International Bond, 144a, 8.500%, 1/31/47 | 405,452 | ||
| 290,000 | Gabon Government International Bond, 144a, 6.625%, 2/6/31 | 236,785 | ||
| 580,000 | Ghana Government International Bond, 144a, 8.627%, 6/16/49 | 199,810 | ||
| 490,000 | Nigeria Government International Bond, 144a, 7.625%, 11/28/47 | 314,394 | ||
| 290,000 | Republic of Uzbekistan International Bond, 144a, 3.700%, 11/25/30 | 242,303 | ||
| 400,000 | Serbia International Bond, 2.125%, 12/1/30 | 286,880 | ||
| 400,000 | Ukraine Government International Bond, 144a, 7.253%, 3/15/35* | 71,994 | ||
| Total Sovereign Government Obligations | $3,890,930 | |||
| Non-Agency Collateralized Mortgage Obligations — 2.0% | ||||
| 1,000,000 | Fannie Mae Connecticut Avenue Securities, Ser 2017-C06, Class 1B1, (1M LIBOR +4.150%), 8.539%, 2/25/30(B) | 1,029,533 | ||
| 1,000,000 | Freddie Mac STACR REMIC Trust, Ser 2022-DNA3, Class M1B, 144a, (SOFR30A +2.900%), 6.828%, 4/25/42(B) | 988,133 | ||
| Total Non-Agency Collateralized Mortgage Obligations | $2,017,666 | |||
| Shares | ||||
| Preferred Stocks — 0.3% | ||||
| Financials — 0.3% | ||||
| 18,000 | First Republic Bank, Ser K, 4.125%(A) | 288,000 | ||
| Total Preferred Stocks | $288,000 | |||
| Shares | MarketValue | |||
| Short-Term Investment Fund — 1.0% | ||||
| 941,841 | Dreyfus Institutional Preferred Government Plus Money Market, Institutional Class, 4.19%∞Ω** | $ 941,841 | ||
| Total Investment Securities—98.3% (Cost $99,572,524) | $97,482,517 | |||
| Other Assets in Excess of Liabilities — 1.7% | 1,717,845 | |||
| Net Assets — 100.0% | $99,200,362 | |||
| (A) | Perpetual Bond - A bond or preferred stock with no definite maturity date. |
| (B) | Variable rate security - Rate reflected is the rate in effect as of December 31, 2022. |
| (C) | Interest only security - This type of security represents the right to receive the monthly interest payments on an underlying pool of mortgages. Payments of principal on the pool reduce the value of the “interest only” holding. |
| (D) | Certain variable rate securities are not based on a published reference rate and spread but are determined by the issuer or agent and are based on current market conditions. These securities do not indicate a reference rate and spread in their description. |
| * | Non-income producing security. |
| ** | Represents collateral for securities loaned. |
| † | All or a portion of the security is on loan. The total market value of the securities on loan as of December 31, 2022 was $906,812. |
| ∞ | Open-End Fund. |
| Ω | Represents the 7-Day SEC yield as of December 31, 2022. |
| Portfolio Abbreviations: |
| CLO – Collateralized Loan Obligation |
| LIBOR – London Interbank Offered Rate |
| LLC – Limited Liability Company |
| LP – Limited Partnership |
| PLC – Public Limited Company |
| REIT – Real Estate Investment Trust |
| REMIC – Real Estate Mortgage Investment Conduit |
| SOC – State-Owned Company |
| SOFR30A – Secured Overnight Financing Rate 30 Day Average |
| TSFR3M – Three Month Term Secured Overnight Financing Rate |
| 144a - This is a restricted security that was sold in a transaction qualifying for the exemption under Rule 144a of the Securities Act of 1933. This security may be sold in transactions exempt from registration, normally to qualified institutional buyers. At December 31, 2022, these securities were valued at $43,713,334 or 44.1% of net assets. These securities were deemed liquid pursuant to procedures approved by the Board of Trustees. |
Other Information:
The inputs or methodology used for valuing securities may not be an indication of the risk associated with investing in those securities. For more information on valuation inputs, and their aggregation into the levels used in the table below, please refer to the security valuation section in the accompanying Notes to Financial Statements.
| Valuation Inputs at Reporting Date: | ||||
| Description | Level 1 | Level 2 | Level 3 | Total |
| Corporate Bonds | $— | $47,653,734 | $— | $47,653,734 |
| U.S. Treasury Obligations | — | 19,416,759 | — | 19,416,759 |
| Asset-Backed Securities | — | 11,792,080 | — | 11,792,080 |
| Commercial Mortgage-Backed Securities | — | 7,192,550 | — | 7,192,550 |
| Common Stocks | 4,288,957 | — | — | 4,288,957 |
| Sovereign Government Obligations | — | 3,890,930 | — | 3,890,930 |
| Non-Agency Collateralized Mortgage Obligations | — | 2,017,666 | — | 2,017,666 |
| Preferred Stocks | 288,000 | — | — | 288,000 |
| Short-Term Investment Fund | 941,841 | — | — | 941,841 |
| Total | $5,518,798 | $91,963,719 | $— | $97,482,517 |
See accompanying Notes to Financial Statements.
20
Portfolio of Investments
Touchstone Ultra Short Income ETF – December 31, 2022
| Principal Amount | Market Value | |||
| Asset-Backed Securities — 47.2% | ||||
| $ 900,000 | American Credit Acceptance Receivables Trust, Ser 2019-1, Class E, 144a, 4.840%, 4/14/25 | $ 899,006 | ||
| 1,000,000 | American Credit Acceptance Receivables Trust, Ser 2019-2, Class E, 144a, 4.290%, 6/12/25 | 993,987 | ||
| 715,137 | American Credit Acceptance Receivables Trust, Ser 2020-2, Class C, 144a, 3.880%, 4/13/26 | 711,879 | ||
| 1,000,000 | Americredit Automobile Receivables Trust, Ser 2019-1, Class D, 3.620%, 3/18/25 | 983,839 | ||
| 800,000 | Barings CLO Ltd. (Cayman Islands), Ser 2013-IA, Class BR, 144a, (3M LIBOR +1.250%), 5.493%, 1/20/28(A) | 786,278 | ||
| 837,022 | CarNow Auto Receivables Trust, Ser 2021-2A, Class B, 144a, 1.300%, 1/15/26 | 822,120 | ||
| 1,000,000 | CFIP CLO Ltd. (Cayman Islands), Ser 2014-1A, Class BR, 144a, (3M LIBOR +1.850%), 5.791%, 7/13/29(A) | 978,926 | ||
| 618,441 | Dell Equipment Finance Trust, Ser 2021-2, Class A2, 144a, 0.330%, 12/22/26 | 611,041 | ||
| 955,000 | Driven Brands Funding LLC, Ser 2018-1A, Class A2, 144a, 4.739%, 4/20/48 | 886,848 | ||
| 758,716 | DT Auto Owner Trust, Ser 2018-3A, Class E, 144a, 5.330%, 11/17/25 | 758,533 | ||
| 1,000,000 | DT Auto Owner Trust, Ser 2019-1A, Class E, 144a, 4.940%, 2/17/26 | 996,029 | ||
| 900,000 | First Investors Auto Owner Trust, Ser 2018-2A, Class E, 144a, 5.360%, 1/15/25 | 899,977 | ||
| 635,020 | First Investors Auto Owner Trust, Ser 2019-1A, Class D, 144a, 3.550%, 4/15/25 | 632,214 | ||
| 890,981 | GLS Auto Receivables Issuer Trust, Ser 2020-4A, Class C, 144a, 1.140%, 11/17/25 | 875,920 | ||
| 1,000,000 | Golub Capital Partners CLO 34M Ltd. (Cayman Islands), Ser 2017-34A, Class AR, 144a, (3M LIBOR +1.7000%), 6.232%, 3/14/31(A) | 978,139 | ||
| 301,327 | GreatAmerica Leasing Receivables Funding LLC Series, Ser 2021-2, Class A2, 144a, 0.380%, 3/15/24 | 296,163 | ||
| 1,000,000 | HPEFS Equipment Trust, Ser 2020-1A, Class D, 144a, 2.260%, 2/20/30 | 989,786 | ||
| 864,233 | JFIN CLO 2017 Ltd. (Cayman Islands), Ser 2017-1A, Class A1R, 144a, (3M LIBOR +1.000%), 5.325%, 4/24/29(A) | 853,556 | ||
| 865,079 | LCM XIII LP (Cayman Islands), Ser 13A, Class AR3, 144a, (3M LIBOR +0.870%), 5.097%, 7/19/27(A) | 855,456 | ||
| 433,691 | MVW Owner Trust, Ser 2017-1A, Class A, 144a, 2.420%, 12/20/34 | 423,813 | ||
| 1,000,000 | Prestige Auto Receivables Trust, Ser 2019-1A, Class D, 144a, 3.010%, 8/15/25 | 989,575 | ||
| 1,000,000 | Prestige Auto Receivables Trust, Ser 2020-1A, Class D, 144a, 1.620%, 11/16/26 | 976,552 | ||
| 626,731 | SCF Equipment Leasing LLC, Ser 2020-1A, Class A3, 144a, 1.190%, 10/20/27 | 614,450 | ||
| 971,856 | Shackleton CLO Ltd. (Cayman Islands), Ser 2015-8A, Class A1R, 144a, (3M LIBOR +0.920%), 5.163%, 10/20/27(A) | 962,951 | ||
| 905,333 | Sierra Timeshare Receivables Funding LLC, Ser 2018-2A, Class B, 144a, 3.650%, 6/20/35 | 871,714 | ||
| 825,934 | Sierra Timeshare Receivables Funding LLC, Ser 2018-3A, Class B, 144a, 3.870%, 9/20/35 | 809,601 | ||
| 733,763 | Sierra Timeshare Receivables Funding LLC, Ser 2019-1A, Class D, 144a, 4.750%, 1/20/36 | 691,248 | ||
| 1,000,000 | STWD Ltd. (Cayman Islands), Ser 2019-FL1, Class B, 144a, (TSFR1M +1.714%), 6.040%, 7/15/38(A) | 939,109 | ||
| 1,050,000 | Tesla Auto Lease Trust, Ser 2020-A, Class D, 144a, 2.330%, 2/20/24 | 1,038,792 | ||
| Total Asset-Backed Securities | $24,127,502 | |||
| Principal Amount | Market Value | |||
| Commercial Mortgage-Backed Securities — 21.6% | ||||
| $1,000,000 | ACRE Commercial Mortgage Ltd., Ser 2021-FL4, Class B, 144a, (1M LIBOR +1.400%), 5.739%, 12/18/37(A) | $ 968,329 | ||
| 500,000 | BFLD Trust, Ser 2020-OBRK, Class A, 144a, (1M LIBOR +2.050%), 6.368%, 11/15/28(A) | 494,152 | ||
| 95,000 | BPR Trust, Ser 2021-KEN, Class A, 144a, (1M LIBOR +1.250%), 5.568%, 2/15/29(A) | 92,399 | ||
| 1,009,316 | BX Commercial Mortgage Trust, Ser 2019-XL, Class A, 144a, (1M LIBOR +0.920%), 5.370%, 10/15/36(A) | 996,872 | ||
| 992,505 | CHC Commercial Mortgage Trust 2019 - CHC, Ser 2019-CHC, Class A, 144a, (1M LIBOR +1.120%), 5.438%, 6/15/34(A) | 968,533 | ||
| 1,000,000 | Citigroup Commercial Mortgage Trust, Ser 2013-GC11, Class B, 3.732%, 4/10/46(A)(B) | 992,583 | ||
| 1,000,000 | COMM Mortgage Trust, Ser 2013-CR7, Class B, 144a, 3.613%, 3/10/46 | 986,324 | ||
| 606,000 | Great Wolf Trust, Ser 2019-WOLF, Class B, 144a, (1M LIBOR +1.334%), 5.652%, 12/15/36(A) | 584,104 | ||
| 1,000,000 | GS Mortgage Securities Trust, Ser 2018-HART, Class A, 144a, (1M LIBOR +1.090%), 5.410%, 10/15/31(A) | 947,888 | ||
| 1,000,000 | JP Morgan Chase Commercial Mortgage Securities Trust, Ser 2018-WPT, Class BFX, 144a, 4.549%, 7/5/33 | 888,424 | ||
| 1,000,000 | JPMBB Commercial Mortgage Securities Trust, Ser 2013-C12, Class AS, 4.052%, 7/15/45(A)(B) | 986,732 | ||
| 1,000,000 | PFP Ltd. (Cayman Islands), Ser 2019-6, Class D, 144a, (1M LIBOR +2.450%), 6.776%, 4/14/37(A) | 983,184 | ||
| 859,544 | ReadyCap Commercial Mortgage Trust, Ser 2018-4, Class A, 144a, 3.390%, 2/27/51 | 814,674 | ||
| 336,357 | Slide, Ser 2018-FUN, Class C, 144a, (1M LIBOR +1.800%), 6.118%, 6/15/31(A) | 332,024 | ||
| Total Commercial Mortgage-Backed Securities | $11,036,222 | |||
| Corporate Bonds — 19.9% | ||||
| Financials — 4.9% | ||||
| 500,000 | Allstate Corp. (The), (3M LIBOR +0.630%), 5.356%, 3/29/23(A) | 500,553 | ||
| 500,000 | Metropolitan Life Insurance Co., 144a, 7.875%, 2/15/24 | 511,047 | ||
| 1,000,000 | Retail Opportunity Investments Partnership LP REIT, 5.000%, 12/15/23 | 988,684 | ||
| 500,000 | Synovus Financial Corp., 5.200%, 8/11/25 | 493,659 | ||
| 2,493,943 | ||||
| Health Care — 3.4% | ||||
| 750,000 | Elevance Health, Inc., 0.450%, 3/15/23 | 743,771 | ||
| 1,000,000 | Mylan, Inc., 144a, 3.125%, 1/15/23 | 999,232 | ||
| 1,743,003 | ||||
| Industrials — 2.9% | ||||
| 1,000,000 | CNH Industrial NV (United Kingdom), 4.500%, 8/15/23 | 993,647 | ||
| 500,000 | Graphic Packaging International LLC, 144a, 0.821%, 4/15/24 | 468,102 | ||
| 1,461,749 | ||||
| Energy — 2.0% | ||||
| 1,000,000 | Energy Transfer LP, 3.450%, 1/15/23 | 999,165 | ||
| Utilities — 1.9% | ||||
| 1,000,000 | National Fuel Gas Co., 3.750%, 3/1/23 | 997,310 | ||
| Real Estate — 1.9% | ||||
| 1,000,000 | American Tower Trust #1 REIT, Ser 13, Class 2A, 144a, 3.070%, 3/15/48 | 994,401 | ||
| Consumer Staples — 1.0% | ||||
| 500,000 | Coca-Cola Europacific Partners PLC (United Kingdom), 144a, 0.500%, 5/5/23 | 491,849 | ||
21
Touchstone Ultra Short Income ETF (Continued)
| Principal Amount | Market Value | |||
| Corporate Bonds — 19.9% (Continued) | ||||
| Communication Services — 1.0% | ||||
| $ 500,000 | Charter Communications Operating LLC / Charter Communications Operating Capital, 4.908%, 7/23/25 | $ 490,449 | ||
| Consumer Discretionary — 0.9% | ||||
| 500,000 | AutoNation, Inc., 3.500%, 11/15/24 | 480,108 | ||
| Total Corporate Bonds | $10,151,977 | |||
| Commercial Paper — 6.9% | ||||
| 2,000,000 | Ameren Illinois Co., 4.502%, 1/3/23(C) | 1,998,990 | ||
| 1,500,000 | Union Electric Co., 4.502%, 1/3/23(C) | 1,499,243 | ||
| Total Commercial Paper | $3,498,233 | |||
| Non-Agency Collateralized Mortgage Obligations — 3.9% | ||||
| 830,669 | CIM Trust, Ser 2018-R3, Class A1, 144a, 5.000%, 12/25/57(A)(B) | 814,211 | ||
| 855,232 | Metlife Securitization Trust, Ser 2019-1A, Class A1A, 144a, 3.750%, 4/25/58(A)(B) | 828,487 | ||
| 382,816 | Mill City Mortgage Loan Trust, Ser 2017-3, Class A1, 144a, 2.750%, 1/25/61(A)(B) | 370,075 | ||
| Total Non-Agency Collateralized Mortgage Obligations | $2,012,773 | |||
| Total Investment Securities—99.5% (Cost $51,161,867) | $50,826,707 | |||
| Other Assets in Excess of Liabilities — 0.5% | 253,464 | |||
| Net Assets — 100.0% | $51,080,171 | |||
| (A) | Variable rate security - Rate reflected is the rate in effect as of December 31, 2022. |
| (B) | Certain variable rate securities are not based on a published reference rate and spread but are determined by the issuer or agent and are based on current market conditions. These securities do not indicate a reference rate and spread in their description. |
| (C) | Rate reflects yield at the time of purchase. |
| Portfolio Abbreviations: |
| CLO – Collateralized Loan Obligation |
| LIBOR – London Interbank Offered Rate |
| LLC – Limited Liability Company |
| LP – Limited Partnership |
| PLC – Public Limited Company |
| REIT – Real Estate Investment Trust |
| TSFR1M – One Month Term Secured Overnight Financing Rate |
| 144a - This is a restricted security that was sold in a transaction qualifying for the exemption under Rule 144a of the Securities Act of 1933. This security may be sold in transactions exempt from registration, normally to qualified institutional buyers. At December 31, 2022, these securities were valued at $37,677,974 or 73.8% of net assets. These securities were deemed liquid pursuant to procedures approved by the Board of Trustees. |
Other Information:
The inputs or methodology used for valuing securities may not be an indication of the risk associated with investing in those securities. For more information on valuation inputs, and their aggregation into the levels used in the table below, please refer to the security valuation section in the accompanying Notes to Financial Statements.
| Valuation Inputs at Reporting Date: | ||||
| Description | Level 1 | Level 2 | Level 3 | Total |
| Asset-Backed Securities | $— | $24,127,502 | $— | $24,127,502 |
| Commercial Mortgage-Backed Securities | — | 11,036,222 | — | 11,036,222 |
| Corporate Bonds | — | 10,151,977 | — | 10,151,977 |
| Commercial Paper | — | 3,498,233 | — | 3,498,233 |
| Non-Agency Collateralized Mortgage Obligations | — | 2,012,773 | — | 2,012,773 |
| Total | $— | $50,826,707 | $— | $50,826,707 |
See accompanying Notes to Financial Statements.
22
Portfolio of Investments
Touchstone US Large Cap Focused ETF – December 31, 2022
| Shares | Market Value | |||
| Common Stocks — 95.4% | ||||
| Information Technology — 27.3% | ||||
| 11,958 | Apple, Inc. | $ 1,553,703 | ||
| 2,731 | International Business Machines Corp. | 384,771 | ||
| 8,113 | Microsoft Corp. | 1,945,660 | ||
| 6,844 | Oracle Corp. | 559,428 | ||
| 3,021 | PayPal Holdings, Inc.* | 215,156 | ||
| 3,164 | Salesforce, Inc.* | 419,515 | ||
| 5,591 | SS&C Technologies Holdings, Inc. | 291,067 | ||
| 3,137 | Texas Instruments, Inc. | 518,295 | ||
| 2,845 | Visa, Inc. - Class A | 591,077 | ||
| 1,580 | Workday, Inc. - Class A* | 264,381 | ||
| 6,743,053 | ||||
| Health Care — 17.9% | ||||
| 3,370 | AmerisourceBergen Corp. | 558,443 | ||
| 5,187 | BioMarin Pharmaceutical, Inc.* | 536,803 | ||
| 6,676 | Bristol-Myers Squibb Co. | 480,338 | ||
| 2,424 | HCA Healthcare, Inc. | 581,663 | ||
| 5,004 | Johnson & Johnson | 883,956 | ||
| 5,254 | Medtronic PLC | 408,341 | ||
| 1,837 | UnitedHealth Group, Inc. | 973,941 | ||
| 4,423,485 | ||||
| Financials — 11.9% | ||||
| 18,989 | Bank of America Corp. | 628,916 | ||
| 3,820 | Berkshire Hathaway, Inc. - Class B* | 1,179,998 | ||
| 2,031 | Goldman Sachs Group, Inc. (The) | 697,405 | ||
| 340 | Markel Corp.* | 447,946 | ||
| 2,954,265 | ||||
| Communication Services — 11.0% | ||||
| 12,572 | Alphabet, Inc. - Class C* | 1,115,514 | ||
| 9,847 | AT&T, Inc. | 181,283 | ||
| 10,607 | Comcast Corp. - Class A | 370,927 | ||
| 2,514 | Fox Corp. - Class A | 76,350 | ||
| 4,130 | Meta Platforms, Inc. - Class A* | 497,004 | ||
| 934 | Netflix, Inc.* | 275,418 | ||
| 2,179 | Walt Disney Co. (The)* | 189,311 | ||
| 2,408 | Warner Bros Discovery, Inc.* | 22,828 | ||
| 2,728,635 | ||||
| Industrials — 8.6% | ||||
| 1,951 | Boeing Co. (The)* | 371,646 | ||
| 578 | Deere & Co. | 247,823 | ||
| 919 | FedEx Corp. | 159,171 | ||
| 1,894 | Hubbell, Inc. | 444,484 | ||
| 6,276 | Raytheon Technologies Corp. | 633,374 | ||
| 7,810 | Southwest Airlines Co.* | 262,962 | ||
| 2,119,460 | ||||
| Shares | Market Value | |||
| Consumer Discretionary — 6.6% | ||||
| 2,170 | Airbnb, Inc. - Class A* | $ 185,535 | ||
| 9,614 | Amazon.com, Inc.* | 807,576 | ||
| 2,445 | Hilton Worldwide Holdings, Inc. | 308,950 | ||
| 3,243 | Starbucks Corp. | 321,706 | ||
| 1,623,767 | ||||
| Consumer Staples — 4.8% | ||||
| 5,798 | Monster Beverage Corp.* | 588,671 | ||
| 5,838 | Philip Morris International, Inc. | 590,864 | ||
| 1,179,535 | ||||
| Energy — 4.4% | ||||
| 6,066 | Exxon Mobil Corp. | 669,080 | ||
| 8,065 | Schlumberger Ltd. | 431,155 | ||
| 1,100,235 | ||||
| Materials — 1.7% | ||||
| 6,044 | DuPont de Nemours, Inc. | 414,800 | ||
| Real Estate — 1.2% | ||||
| 1,911 | Jones Lang LaSalle, Inc.* | 304,556 | ||
| Total Common Stocks | $23,591,791 | |||
| Total Investment Securities—95.4% (Cost $24,513,622) | $23,591,791 | |||
| Other Assets in Excess of Liabilities — 4.6% | 1,146,983 | |||
| Net Assets — 100.0% | $24,738,774 | |||
| * | Non-income producing security. |
| Portfolio Abbreviations: |
| PLC – Public Limited Company |
Other Information:
The inputs or methodology used for valuing securities may not be an indication of the risk associated with investing in those securities. For more information on valuation inputs, and their aggregation into the levels used in the table below, please refer to the security valuation section in the accompanying Notes to Financial Statements.
| Valuation Inputs at Reporting Date: | ||||
| Description | Level 1 | Level 2 | Level 3 | Total |
| Common Stocks | $23,591,791 | $— | $— | $23,591,791 |
See accompanying Notes to Financial Statements.
23
Statements of Assets and Liabilities
December 31, 2022
| Touchstone Dividend Select ETF | Touchstone Strategic Income Opportunities ETF | Touchstone Ultra Short Income ETF | Touchstone US Large Cap Focused ETF | |
| Assets | ||||
| Investments, at cost | $25,198,627 | $99,572,524 | $51,161,867 | $24,513,622 |
| Investments, at market value | $25,569,444 | $97,482,517 | $50,826,707 | $23,591,791 |
| Cash | 1,015,907 | 1,788,799 | 70,973 | 1,177,778 |
| Dividends and interest receivable | 27,659 | 964,045 | 231,310 | 14,149 |
| Receivable for securities lending income | — | 1,148 | — | — |
| Tax reclaim receivable | 788 | — | — | — |
| Other assets | 17,820 | 25,522 | 20,979 | 20,350 |
| Total Assets | 26,631,618 | 100,262,031 | 51,149,969 | 24,804,068 |
| Liabilities | ||||
| Payable for return of collateral for securities on loan | — | 941,841 | — | — |
| Payable to Investment Adviser | 12,589 | 46,634 | 10,846 | 15,007 |
| Payable to other affiliates | 5,337 | 14,311 | 8,184 | 5,511 |
| Payable to Trustees | 6,419 | 6,419 | 6,419 | 6,419 |
| Payable for custodian fees | — | 9,844 | — | — |
| Payable for professional services | 26,259 | 32,680 | 32,191 | 26,604 |
| Payable for reports to shareholders | 4,107 | 4,372 | 3,987 | 4,231 |
| Payable for transfer agent services | 2,349 | 2,818 | 3,130 | 2,818 |
| Other accrued expenses and liabilities | 4,298 | 2,750 | 5,041 | 4,704 |
| Total Liabilities | 61,358 | 1,061,669 | 69,798 | 65,294 |
| Net Assets | $26,570,260 | $99,200,362 | $51,080,171 | $24,738,774 |
| Net assets consist of: | ||||
| Paid-in capital | 26,264,381 | 101,334,509 | 51,360,868 | 25,771,629 |
| Distributable earnings (deficit) | 305,879 | (2,134,147) | (280,697) | (1,032,855) |
| Net Assets | $26,570,260 | $99,200,362 | $51,080,171 | $24,738,774 |
| Pricing of shares outstanding | ||||
| Net assets applicable to shares outstanding | $26,570,260 | $99,200,362 | $51,080,171 | $24,738,774 |
| Shares of beneficial interest outstanding (unlimited number of shares authorized, no par value) | 1,050,000 | 4,050,000 | 2,054,000 | 1,025,000 |
| Net asset value, offering price and redemption price per share | $25.31 | $24.49 | $24.87 | $24.14 |
| *Includes market value of securities on loan of: | $— | $906,812 | $— | $— |
See accompanying Notes to Financial Statements.
24
Statements of Operations For the Period December 31, 2022
| Touchstone Dividend Select ETF(A) | Touchstone Strategic Income Opportunities ETF(B) | Touchstone Ultra Short Income ETF(C) | Touchstone US Large Cap Focused ETF(D) | |
| Investment Income | ||||
| Dividends | $242,796 | $69,760 | $— | $120,950 |
| Interest | — | 2,070,458 | 780,109 | — |
| Income from securities loaned | — | 1,178 | — | — |
| Total Investment Income | 242,796 | 2,141,396 | 780,109 | 120,950 |
| Expenses | ||||
| Investment advisory fees | 48,000 | 228,193 | 48,867 | 62,856 |
| Administration fees | 12,105 | 57,399 | 27,070 | 12,449 |
| Compliance fees and expenses | 3,292 | 3,965 | 3,292 | 3,965 |
| Custody fees | 1,953 | 9,844 | 2,604 | 2,344 |
| Professional fees | 26,294 | 32,979 | 32,309 | 26,646 |
| Transfer Agent fees | 2,349 | 2,818 | 3,130 | 2,818 |
| Reports to Shareholders | 4,410 | 4,684 | 4,300 | 4,574 |
| Trustee fees | 12,966 | 12,966 | 12,966 | 12,966 |
| Other expenses | 11,328 | 14,961 | 12,053 | 9,731 |
| Total Expenses | 122,697 | 367,809 | 146,591 | 138,349 |
| Fees waived and/or reimbursed by the Adviser and/or Affiliates(E) | (64,225) | (98,127) | (79,410) | (76,391) |
| Net Expenses | 58,472 | 269,682 | 67,181 | 61,958 |
| Net Investment Income (Loss) | 184,324 | 1,871,714 | 712,928 | 58,992 |
| Realized and Unrealized Gains (Losses) on Investments | ||||
| Net realized gains (losses) on investments(F) | 263,630 | (7,826) | 27,875 | 139,950 |
| Net change in unrealized appreciation (depreciation) on investments | 370,817 | (2,090,007) | (335,160) | (921,831) |
| Net Realized and Unrealized Gains (Losses) on Investments | 634,447 | (2,097,833) | (307,285) | (781,881) |
| Change in Net Assets Resulting from Operations | $818,771 | $(226,119) | $405,643 | $(722,889) |
| (A) | Represents the period from commencement of operations (August 2, 2022) through December 31, 2022. |
| (B) | Represents the period from commencement of operations (July 21, 2022) through December 31, 2022. |
| (C) | Represents the period from commencement of operations (August 4, 2022) through December 31, 2022. |
| (D) | Represents the period from commencement of operations (July 27, 2022) through December 31, 2022. |
| (E) | See Note 4 in Notes to Financial Statements. |
| (F) | Net realized gains on investments includes realized gains of $329,192 and $251,613 for the Dividend Select ETF and the US Large Cap Focused ETF, respectively, for redemptions-in-kind activity, which will not be recognized by the Funds for tax purposes. |
See accompanying Notes to Financial Statements.
25
Statements of Changes in Net Assets
| Touchstone Dividend Select ETF | Touchstone Strategic Income Opportunities ETF | Touchstone Ultra Short Income ETF | Touchstone US Large Cap Focused ETF | |
| For the Period Ended December 31, 2022(A) | For the Period Ended December 31, 2022(B) | For the Period Ended December 31, 2022(C) | For the Period Ended December 31, 2022(D) | |
| From Operations | ||||
| Net investment income | $184,324 | $1,871,714 | $712,928 | $58,992 |
| Net realized gains (losses) on investments | 263,630 | (7,826) | 27,875 | 139,950 |
| Net change in unrealized appreciation (depreciation) on investments | 370,817 | (2,090,007) | (335,160) | (921,831) |
| Change in Net Assets from Operations | 818,771 | (226,119) | 405,643 | (722,889) |
| Distributions to Shareholders: | ||||
| Distributed earnings | (183,700) | (1,908,028) | (686,340) | (58,353) |
| Total Distributions | (183,700) | (1,908,028) | (686,340) | (58,353) |
| Share Transactions | ||||
| Proceeds from Shares issued | 27,851,716 | 101,334,509 | 51,360,868 | 27,969,085 |
| Cost of Shares redeemed | (1,916,527) | — | — | (2,449,069) |
| Change in Net Assets from Share Transactions | 25,935,189 | 101,334,509 | 51,360,868 | 25,520,016 |
| Total Increase (Decrease) in Net Assets | 26,570,260 | 99,200,362 | 51,080,171 | 24,738,774 |
| Net Assets | ||||
| Beginning of period | — | — | — | — |
| End of period | $26,570,260 | $99,200,362 | $51,080,171 | $24,738,774 |
| Share Transactions | ||||
| Shares issued | 1,125,000 | 4,050,000 | 2,054,000 | 1,125,000 |
| Shares redeemed | (75,000) | — | — | (100,000) |
| Change in Shares Outstanding | 1,050,000 | 4,050,000 | 2,054,000 | 1,025,000 |
| (A) | Represents the period from commencement of operations (August 2, 2022) through December 31, 2022. |
| (B) | Represents the period from commencement of operations (July 21, 2022) through December 31, 2022. |
| (C) | Represents the period from commencement of operations (August 4, 2022) through December 31, 2022. |
| (D) | Represents the period from commencement of operations (July 27, 2022) through December 31, 2022. |
See accompanying Notes to Financial Statements.
26
Financial Highlights
| Touchstone Dividend Select ETF | ||||||||||||||||||||||||||
| Period ended | Net asset value at beginning of period | Net investment income | Net realized and unrealized gains (losses) on investments | Total from investment operations | Distributions from net investment income | Total distributions | Net asset value at end of period | Total return based on NAV | Net assets at end of period (000's) | Ratio of net expenses to average net assets | Ratio of gross expenses to average net assets | Ratio of net investment income (loss) to average net assets | Portfolio turnover rate | |||||||||||||
| 12/31/22(1) | $25.00 | $0.18 | $0.31 | $0.49 | $(0.18) | $(0.18) | $25.31 | 1.94%(2) | $26,570 | 0.67%(3) | 1.41%(3) | 2.11%(3) | 28%(2)(4) | |||||||||||||
| (1) | Represents the period from commencement of operations (August 2, 2022) through December 31, 2022. |
| (2) | Not annualized. |
| (3) | Annualized. |
| (4) | Portfolio turnover excludes securities delivered from processing redemptions-in-kind and received from processing subscriptions-in-kind. |
| Touchstone Strategic Income Opportunities ETF | ||||||||||||||||||||||||||
| Period ended | Net asset value at beginning of period | Net investment income | Net realized and unrealized gains (losses) on investments | Total from investment operations | Distributions from net investment income | Total distributions | Net asset value at end of period | Total return based on NAV | Net assets at end of period (000's) | Ratio of net expenses to average net assets | Ratio of gross expenses to average net assets | Ratio of net investment income (loss) to average net assets | Portfolio turnover rate | |||||||||||||
| 12/31/22(1) | $25.00 | $0.48 | $(0.50) | $(0.02) | $(0.49) | $(0.49) | $24.49 | (0.03)%(2) | $99,200 | 0.65%(3) | 0.89%(3) | 4.51%(3) | 47%(2) | |||||||||||||
| (1) | Represents the period from commencement of operations (July 21, 2022) through December 31, 2022. |
| (2) | Not annualized. |
| (3) | Annualized. |
| Touchstone Ultra Short Income ETF | ||||||||||||||||||||||||||
| Period ended | Net asset value at beginning of period | Net investment income | Net realized and unrealized gains (losses) on investments | Total from investment operations | Distributions from net investment income | Total distributions | Net asset value at end of period | Total return based on NAV | Net assets at end of period (000's) | Ratio of net expenses to average net assets | Ratio of gross expenses to average net assets | Ratio of net investment income (loss) to average net assets | Portfolio turnover rate | |||||||||||||
| 12/31/22(1) | $25.00 | $0.35 | $(0.14) | $0.21 | $(0.34) | $(0.34) | $24.87 | 0.87%(2) | $51,080 | 0.34%(3) | 0.75%(3) | 3.65%(3) | 16%(2) | |||||||||||||
| (1) | Represents the period from commencement of operations (August 4, 2022) through December 31, 2022. |
| (2) | Not annualized. |
| (3) | Annualized. |
| Touchstone US Large Cap Focused ETF | ||||||||||||||||||||||||||
| Period ended | Net asset value at beginning of period | Net investment income | Net realized and unrealized gains (losses) on investments | Total from investment operations | Distributions from net investment income | Total distributions | Net asset value at end of period | Total return based on NAV | Net assets at end of period (000's) | Ratio of net expenses to average net assets | Ratio of gross expenses to average net assets | Ratio of net investment income (loss) to average net assets | Portfolio turnover rate | |||||||||||||
| 12/31/22(1) | $25.00 | $0.06 | $(0.86) | $(0.80) | $(0.06) | $(0.06) | $24.14 | (3.25)%(2) | $24,739 | 0.69%(3) | 1.54%(3) | 0.66%(3) | 3%(2)(4) | |||||||||||||
| (1) | Represents the period from commencement of operations (July 27, 2022) through December 31, 2022. |
| (2) | Not annualized. |
| (3) | Annualized. |
| (4) | Portfolio turnover excludes securities delivered from processing redemptions-in-kind and received from processing subscriptions-in-kind. |
See accompanying Notes to Financial Statements.
27
Notes to Financial Statements
December 31, 2022
1. Organization
The Touchstone ETF Trust (the “Trust”) is registered under the Investment Company Act of 1940, as amended (the “1940 Act”), as an open-end management investment company. The Trust was established as a Delaware statutory trust pursuant to an Agreement and Declaration of Trust dated February 1, 2022. The Trust consists of the following four funds (individually, a “Fund”, and collectively, the “Funds”):
| Touchstone Dividend Select ETF ("Dividend Select ETF”) |
| Touchstone Strategic Income Opportunities ETF ("Strategic Income Opportunities ETF”) |
| Touchstone Ultra Short Income ETF ("Ultra Short Income ETF”) |
| Touchstone US Large Cap Focused ETF ("US Large Cap Focused ETF”) |
Each Fund is diversified, with the exception of the US Large Cap Focused ETF, which is non-diversified.
The Agreement and Declaration of Trust permits the Trust to issue an unlimited number of shares of beneficial interest of each Fund. The Funds are actively managed exchange-traded funds (“ETFs”). Shares of the Dividend Select ETF (ticker: DVND) and the Strategic Income Opportunities ETF (ticker: SIO) are listed for trading on NYSE Arca, Inc. and shares of US Large Cap Focused ETF (ticker: LCF) and the Ultra Short Income ETF (ticker: TUSI) are listed for trading on Cboe BZX Exchange, Inc. The market price for a share of each Fund may be different from a Fund's most recent net asset value (“NAV”). ETFs are funds that trade like other publicly traded securities. Unlike shares of a mutual fund, which can be bought and redeemed from the issuing fund by all shareholders at a price based on NAV, shares of the Funds may be purchased or redeemed directly from the Funds at NAV solely by a member or participant of a clearing agency registered with the Securities and Exchange Commission ("SEC"), which has entered into an "Authorized Participant Agreement" with the funds' distributor and the transfer agent or purchase aggregations of a specific number of shares ("Creation Units") through a dealer that has entered into such an agreement ("Authorized Participants"). Also, unlike shares of a mutual fund, shares of the Funds are listed on an exchange and trade in the secondary market at market prices that change throughout the day.
The assets of each Fund are segregated, and a shareholder’s interest is limited to the Fund in which shares are held. The Funds’ prospectus provides a description of each Fund’s investment goal, policies, and strategies.
2. Significant Accounting Policies
The following is a summary of the Funds’ significant accounting policies:
Each Fund is an investment company that follows the accounting and reporting guidance of Accounting Standards Codification Topic 946 applicable to investment companies.
Security valuation and fair value measurements — U.S. generally accepted accounting principles (“U.S. GAAP”) define fair value as the price the Funds would receive to sell an asset or pay to transfer a liability in an orderly transaction between market participants at the measurement date. All investments in securities are recorded at their fair value. The Funds define the term “market value”, as used throughout this report, as the estimated fair value. The Funds use various methods to measure fair value of their portfolio securities on a recurring basis. U.S. GAAP fair value measurement standards require disclosure of a hierarchy that prioritizes inputs to valuation methods. These inputs are summarized in the three broad levels listed below:
• Level 1 − quoted prices in active markets for identical securities
• Level 2 − other significant observable inputs (including quoted prices for similar securities, interest rates, prepayment speeds, credit risk, etc.)
• Level 3 − significant unobservable inputs (including a Fund’s own assumptions in determining the fair value of investments)
The inputs or methodology used for valuing securities are not necessarily an indication of the risk associated with investing in those securities.
The aggregate value by input level, as of December 31, 2022, for each Fund’s investments, is included in each Fund's Portfolio of Investments, which also includes a breakdown of the Fund’s investments by credit quality and/or sector allocation. The Funds did not hold or transfer any Level 3 categorized securities during the period ended December 31, 2022.
Changes in valuation techniques may result in transfers into or out of an investment’s assigned level within the hierarchy.
The Funds’ portfolio securities are valued as of the close of the regular session of trading on the New York Stock Exchange (“NYSE”) (currently 4:00 p.m., Eastern Time or at the time as of which the NYSE establishes official closing prices). Portfolio securities traded on stock exchanges are valued at the last reported sale price, official close price, or last bid price if no sales are reported. Portfolio securities quoted by NASDAQ are valued at the NASDAQ Official Closing Price (“NOCP”) or from the primary exchange on which the security trades. To the extent these securities are actively traded, they are categorized in Level 1 of the fair value
28
Notes to Financial Statements (Continued)
hierarchy. Shares of mutual funds in which the Funds invest are valued at their respective net asset value (“NAV”) as reported by the underlying funds and are categorized in Level 1.
Debt securities held by the Funds are valued at their evaluated bid by an independent pricing service or at their last broker-quoted bid prices as obtained from one or more of the major market makers for such securities. Independent pricing services use information provided by market makers or estimates of market values through accepted market modeling conventions. Observable inputs to the models may include prepayment speeds, pricing spread, yield, trade information, dealer quotes, market color, cash flow models, the securities’ terms and conditions, among others, and are generally categorized in Level 2. Investments in asset-backed and mortgage-backed securities are valued by independent pricing services using models that consider estimated cash flows of each tranche of the security, establish a benchmark yield and develop an estimated tranche specific spread to the benchmark yield based on the unique attributes of the tranche, and are generally categorized in Level 2. Debt securities with remaining maturities of 60 days or less may be valued at amortized cost, provided such amount approximates market value and are categorized in Level 2. While this method provides consistency in valuation (and may only be used if it approximates market value), it may result in periods during which fair value, as determined by amortized cost, is higher or lower than the price that would be received if the Fund sold the investment.
Securities mainly traded on a non-U.S. exchange or denominated in foreign currencies are generally valued according to the preceding closing values on that exchange, translated to U.S. dollars using currency exchange rates as of the close of regular trading on the NYSE, and are generally categorized in Level 1. However, if an event that may change the value of a security occurs after the time that the closing value on the non-U.S. exchange was determined, but before the close of regular trading on the NYSE, the security may be priced based on fair value and is generally categorized in Level 2. This may cause the value of the security, if held on the books of a Fund, to be different from the closing value on the non-U.S. exchange and may affect the calculation of that Fund’s NAV. The Funds may use fair value pricing under the following circumstances, among others:
• If the value of a security has been materially affected by events occurring before the Funds' pricing time but after the close of the primary markets on which the security is traded.
• If the exchange on which a portfolio security is principally traded closes early or if trading in a particular portfolio security was halted during the day and did not resume prior to the Funds' NAV calculation.
• If a security is so thinly traded that reliable market quotations are unavailable due to infrequent trading.
• If the validity of market quotations is not reliable.
Securities held by the Funds that do not have readily available market quotations, significant observable inputs, or securities for which the available market quotations are not reliable, are priced at their estimated fair value using procedures established by Touchstone Advisors, Inc. (the “Adviser”) and adopted by the Funds' Board of Trustees (the “Board”) and are generally categorized in Level 3.
Collateralized Loan Obligations — The Strategic Income Opportunities ETF and Ultra Short Income ETF may invest in collateralized loan obligations (“CLOs”). CLOs are types of asset-backed securities. A CLO is an entity that is backed by syndicated bank loans. The cash flows of the CLO can be split into multiple segments, called “tranches,” which will vary in risk profile and yield. The riskiest segment is the subordinated or “equity” tranche. This tranche bears the greatest risk of defaults from the underlying assets in the CLO and serves to protect the other, more senior, tranches from default in all but the most severe circumstances. Since it is shielded from defaults by the more junior tranches, a “senior” tranche will typically have higher credit ratings and lower yields than their underlying securities, and often receive higher ratings from one or more of the nationally recognized rating agencies. Despite the protection from the more junior tranches, senior tranches can experience substantial losses due to actual defaults, increased sensitivity to future defaults and the disappearance of one or more protecting tranches as a result of changes in the credit profile of the underlying pool of assets.
Investment companies — The Funds may invest in securities of other investment companies, including ETFs, open-end funds and closed-end funds. Open-end funds are investment companies that issue new shares continuously and redeem shares daily. Closed-end funds are investment companies that typically issue a fixed number of shares that trade on a securities exchange or over-the-counter (“OTC”). An ETF is an investment company that typically seeks to track the performance of an index by holding in its portfolio shares of all the companies, or a representative sample of the companies, that are components of a particular index. ETF shares are traded on a securities exchange based on their market value. The risks of investment in other investment companies typically reflect the risks of the types of securities in which the other investment companies invest. Investments in ETFs and closed-end funds are subject to the additional risk that their shares may trade at a premium or discount to their NAV. When a Fund invests in another investment company, shareholders of the Fund indirectly bear their proportionate share of the other investment company’s fees and expenses, including operating, registration, trustee, licensing, and marketing, as well as their share of the Fund’s fees and expenses.
Foreign currency translation — The books and records of the Funds are maintained in U.S. dollars and translated into U.S. dollars on the following basis:
29
Notes to Financial Statements (Continued)
| (1) | market value of investment securities, assets and liabilities at the current rate of exchange on the valuation date; and |
| (2) | purchases and sales of investment securities, income, and expenses at the relevant rates of exchange prevailing on the respective dates of such transactions. |
The Funds do not isolate that portion of gains and losses on investments in equity securities that is due to changes in the foreign exchange rates from that which is due to changes in market prices of equity securities.
Real Estate Investment Trusts — The Funds may invest in real estate investment trusts (“REITs”) that involve risks not associated with investing in stocks. Risks associated with investments in REITs include declines in the value of real estate, general and economic conditions, changes in the value of the underlying property and defaults by borrowers. The value of assets in the real estate industry may go through cycles of relative underperformance and outperformance in comparison to equity securities markets in general. Dividend income is recorded using management’s estimate of the income included in distributions received from REIT investments. The actual amounts of income, return of capital and capital gains are only determined by each REIT after its fiscal year-end and may differ from the estimated amount. Estimates of income are adjusted in the Funds to the actual amounts when the amounts are determined.
Portfolio securities loaned — The Funds may lend their portfolio securities. Lending portfolio securities exposes the Funds to the risk that the borrower may fail to return the loaned securities or may not be able to provide additional collateral or that the Funds may experience delays in recovery of the loaned securities or loss of rights in the collateral if the borrower fails financially. To minimize these risks, the borrower must agree to maintain cash collateral with the Funds' custodian. The loaned securities are secured by collateral valued at least equal, at all times, to the market value of the loaned securities plus accrued interest, if any. When the collateral falls below specified amounts, the lending agent will use its best effort to obtain additional collateral on the next business day to meet required amounts under the security lending agreement. The cash collateral is reinvested by the Funds' custodian into an approved short-term investment vehicle. The approved short-term investment vehicle is subject to market risk.
As of December 31, 2022, the following Fund loaned securities and received collateral as follows:
| Fund | Security Type | Market Value of Securities Loaned* | Market Value of Collateral Received** | Net Amount*** |
| Strategic Income Opportunities ETF | Corporate Bonds | $906,812 | $941,841 | $35,029 |
| * | The remaining contractual maturity is overnight for all securities. |
| ** | Gross amount of recognized liabilities for securities lending included in the Statements of Assets and Liabilities. |
| *** | Net amount represents the net amount payable due to (received from) the borrower in the event of default. |
All cash collateral is received, held, and administered by the Funds' custodian for the benefit of the lending Fund in its custody account or other account established for the purpose of holding collateral in cash equivalents.
Funds participating in securities lending receive compensation in the form of fees. Securities lending income is derived from lending long securities from the Funds to creditworthy approved borrowers at rates that are determined based on daily trading volumes, float, short-term interest rates and market liquidity and is shown net of fees on the Statements of Operations. When a Fund lends securities, it retains the interest or dividends on the investment of any cash received as collateral, and the Fund continues to receive interest or dividends on the loaned securities.
Unrealized gain or loss on the market value of the loaned securities that may occur during the term of the loan is recognized by the Fund. The Fund has the right under the lending agreement to recover any loaned securities from the borrower on demand.
When-issued or delayed delivery transactions — Each Fund may purchase or sell securities on a when-issued or delayed delivery basis. These transactions involve a commitment by the Fund to purchase or sell securities for a predetermined price or yield, with payment and delivery taking place beyond the customary settlement period. When purchasing a security on a delayed delivery basis, the Fund assumes the rights and risks of ownership of the security, including the risk of price and yield fluctuations, and takes such fluctuations into account when determining NAV. The Fund may dispose of or renegotiate a delayed delivery transaction after it is entered into, and may sell when-issued securities before they are delivered, which may result in a capital gain or loss. When the Fund has sold a security on a delayed delivery basis, the Fund does not participate in future gains and losses with respect to the security. When-issued or delayed delivery transactions physically settling within 35-days are deemed not to involve a senior security. When-issued or delayed delivery transactions that do not physically settle within 35-days are required to be treated as derivatives transactions in compliance with the regulatory limitations set forth in Rule 18f-4 under the 1940 Act (the "Derivatives Rule"). Effective August 19, 2022 (the “Compliance Date”), the Derivatives Rule replaced the asset segregation regime of Investment Company Act Release No. 10666 (“Release 10666”) with a new framework for the use of derivatives by registered funds. As of the Compliance Date, the SEC rescinded Release 10666 and withdrew no-action letters and similar guidance addressing a fund’s use of derivatives and began requiring funds to satisfy the requirements of the Derivatives Rule. As a result, on or after the Compliance
30
Notes to Financial Statements (Continued)
Date, the Funds will no longer engage in “segregation” or “coverage” techniques with respect to derivatives transactions and will instead comply with the applicable requirements of the Derivatives Rule.
Share valuation — The NAV per share of each Fund is calculated daily by dividing the total value of a Fund’s assets, less liabilities, by the number of outstanding shares.
Investment income — Dividend income from securities is recognized on the ex-dividend date, net of foreign withholding taxes, if any, which are reduced by any amounts reclaimable by the Funds, where applicable. Interest income from securities is recorded on the basis of interest accrued, premium amortized and discount accreted. Realized gains and losses resulting from principal pay downs on mortgage-backed and asset-backed securities are included in interest income. Market discounts, original issue discounts and market premiums on debt securities are accreted/amortized to interest income over the life of the security or to the appropriate call date, as applicable, with a corresponding adjustment in the cost basis of that security. In addition, it is the Funds’ policy to accrue for foreign capital gains taxes, if applicable, on certain foreign securities held by the Funds. An estimated foreign capital gains tax is recorded daily on net unrealized gains on these securities and is payable upon the sale of such securities when a gain is realized.
Distributions to shareholders — Each Fund intends to distribute to its shareholders substantially all of its income and capital gains. The US Large Cap Focused ETF declares and distributes its income, if any, annually, as a dividend to shareholders. The Dividend Select ETF declares and distributes its income, if any, quarterly, as a dividend to shareholders. The Strategic Income Opportunities ETF and the Ultra Short Income ETF declare and distribute their income, if any, monthly as a dividend to shareholders. Each Fund makes distributions of capital gains, if any, at least annually, net of applicable capital loss carryforwards. Income distributions and capital gain distributions are determined in accordance with income tax regulations. Recognition of the Funds' net investment income from investments in underlying funds is affected by the timing of dividend declarations by the underlying funds.
Allocations — Expenses not directly billed to a Fund are allocated proportionally among all Funds in the Trust, and, if applicable, Touchstone Funds Group Trust, Touchstone Strategic Trust and Touchstone Variable Series Trust (collectively with the Trust, “Touchstone Fund Complex”), daily in relation to net assets of each Fund or another reasonable measure.
Security transactions — Security transactions are reflected for financial reporting purposes as of the trade date. Realized gains and losses on sales of portfolio securities are calculated using the identified cost basis.
Estimates — The preparation of financial statements in conformity with U.S. GAAP requires management to make estimates and assumptions that affect the reported amounts of assets and liabilities and disclosure of contingent assets and liabilities at the date of the financial statements and the reported amounts of income and expenses during the reporting period. Actual results could differ from those estimates.
LIBOR Transition — Many debt securities, derivatives and other financial instruments in which the Funds may invest, as well as any borrowings made by the Funds from banks or from other lenders, utilize the London Interbank Offered Rate (“LIBOR”) as the reference or benchmark index for interest rate calculations. LIBOR is a measure of the average interest rate at which major global banks can borrow from one another. Plans are underway to phase out the use of LIBOR by June 30, 2023. The ICE Benchmark Administration Limited, the administrator of LIBOR, ceased publishing certain LIBOR maturities, including some U.S. LIBOR maturities, on December 31, 2021, and is expected to cease publishing the remaining and most liquid U.S. LIBOR maturities on June 30, 2023. Before then, it is expected that market participants have or will transition to the use of different reference or benchmark indices. However, there is currently no definitive information regarding the future utilization of LIBOR or of any particular replacement index. As such, the potential effect of a transition away from LIBOR on the Funds’ investments cannot yet be determined.
3. Investment Transactions
Investment transactions (excluding short-term investments and U.S. Government securities) were as follows for the period ended December 31, 2022:
| Dividend Select ETF* | Strategic Income Opportunities ETF | Ultra Short Income ETF | US Large Cap Focused ETF* | |
| Purchases of investment securities | $5,275,845 | $87,774,303 | $48,285,336 | $554,709 |
| Proceeds from sales and maturities | $5,241,469 | $11,459,714 | $5,386,622 | $589,334 |
| * | The Dividend Select ETF and the US Large Cap Focused ETF had subscriptions-in-kind into the Fund of $26,817,240 and $26,769,137, respectively, which are excluded from purchases of investment securities. The Dividend Select ETF and the US Large Cap Focused ETF had redemptions-in-kind out of the Fund of $1,916,527 and $2,360,770, respectively, which are excluded from the proceeds from sales and maturities. |
31
Notes to Financial Statements (Continued)
For the period ended December 31, 2022, purchases and proceeds from sales and maturities in U.S. Government Securities were $45,672,480 and $24,676,545, respectively, for the Strategic Income Opportunities ETF.
4. Transactions with Affiliates and Other Related Parties
Certain officers of the Trust are also officers of the Adviser or The Bank of New York Mellon (“BNY Mellon”), the Sub-Administrator, custodian and transfer agent to the Funds. Such officers receive no compensation from the Trust. The Adviser is a wholly-owned subsidiary of Western & Southern Financial Group, Inc. ("Western & Southern").
On behalf of the Funds, the Adviser pays each Independent Trustee a quarterly retainer plus additional retainers to the Lead Independent Trustee and the chairs of each standing committee. Interested Trustees do not receive compensation from the Funds. Each Independent Trustee also receives compensation for each Board meeting and committee meeting attended. Each standing committee chair receives additional compensation for each committee meeting that he or she oversees. The Adviser is reimbursed by the Funds for the Independent Trustees’ compensation and out-of-pocket expenses relating to their services. The Funds accrued Trustee-related expenses of $51,864 for the Funds’ Board for the period ended December 31, 2022.
MANAGEMENT & EXPENSE LIMITATION AGREEMENTS
The Adviser provides general investment supervisory services for the Funds, under the terms of an advisory agreement (the “Advisory Agreement”). Under the Advisory Agreement, each Fund pays the Adviser a fee, which is computed and accrued daily and paid monthly, at an annual rate based on average daily net assets of each Fund as shown in the table below.
| Dividend Select ETF | 0.55% on the first $1 billion |
| 0.50% on assets over $1 billion | |
| Strategic Income Opportunities ETF | 0.55% on the first $250 million |
| 0.50% on the next $250 million | |
| 0.45% on assets over $500 million | |
| Ultra Short Income ETF | 0.25% on all assets |
| US Large Cap Focused ETF | 0.70% on the first $500 million |
| 0.65% on the next $300 million | |
| 0.60% on the next $200 million | |
| 0.50% on the next $1 billion | |
| 0.40% on assets over $2 billion |
The Adviser has entered into investment sub-advisory agreements with Fort Washington Investment Advisors, Inc. (the “Sub-Adviser”), an affiliate of the Adviser and wholly-owned subsidiary of Western & Southern. The Adviser pays sub-advisory fees to the Sub-Adviser from its advisory fee.
The Adviser entered into an expense limitation agreement (the “Expense Limitation Agreement”) to contractually limit the annual operating expenses of the Funds, excluding: dividend and interest expenses relating to short sales; interest; taxes; brokerage commissions and other transaction costs; portfolio transaction and investment related expenses, including expenses associated with the Funds’ interfund lending program, if any; other expenditures which are capitalized in accordance with U.S. GAAP; the cost of “Acquired Fund Fees and Expenses”, if any; and other extraordinary expenses not incurred in the ordinary course of business. The maximum annual operating expense limit in any year with respect to the Funds is based on a percentage of the average daily net assets of the Funds. The Adviser has agreed to waive a portion of its fees, and to reimburse certain fund expenses in order to maintain the following expense limitations for the Funds:
| Termination Date | ||
| Dividend Select ETF | 0.67% | August 31, 2023 |
| Strategic Income Opportunities ETF | 0.65% | August 31, 2023 |
| Ultra Short Income ETF | 0.34% | August 31, 2023 |
| US Large Cap Focused ETF | 0.69% | August 31, 2023 |
The Expense Limitation Agreement can be terminated with respect to a Fund by a vote of the Funds’ Board if it deems the termination to be beneficial to the Fund’s shareholders.
32
Notes to Financial Statements (Continued)
During the period ended December 31, 2022, the Adviser or its affiliates waived investment advisory fees, administration fees or other operating expenses, as follows:
| Fund | Investment Advisory Fees Waived | Administration Fees Waived | Other Operating Expenses Reimbursed/ Waived | Total |
| Dividend Select ETF | $— | $12,105 | $52,120 | $64,225 |
| Strategic Income Opportunities ETF | — | 57,399 | 40,728 | 98,127 |
| Ultra Short Income ETF | — | 27,070 | 52,340 | 79,410 |
| US Large Cap Focused ETF | 7,536 | 12,449 | 56,406 | 76,391 |
Under the terms of the Expense Limitation Agreement, the Adviser is entitled to recover, subject to approval by the Funds’ Board, such amounts waived or reimbursed for a period of up to three years from the date on which the Adviser reduced its compensation or assumed expenses for the Funds. A Fund will make repayments to the Adviser only if such repayment does not cause the Fund's operating expenses (after the repayment is taken into account) to exceed the Fund's expense limit in place when such amounts were waived or reimbursed by the Adviser and the Fund's current expense limitation.
As of December 31, 2022, the Adviser may seek recoupment of previously waived fees and reimbursed expenses as follows:
| Fund | Expires on or before December 31, 2025 | Total |
| Dividend Select ETF | $64,225 | $64,225 |
| Strategic Income Opportunities ETF | 98,127 | 98,127 |
| Ultra Short Income ETF | 79,410 | 79,410 |
| US Large Cap Focused ETF | 76,391 | 76,391 |
The Adviser did not recoup any amounts it previously waived or reimbursed during the period ended December 31, 2022.
ADMINISTRATION AGREEMENT
The Adviser entered into an Administration Agreement with the Trust, whereby the Adviser is responsible for: supplying executive and regulatory compliance services; supervising the preparation of tax returns; coordinating the preparation of reports to shareholders and reports to and filings with the SEC and state securities authorities, as well as materials for meetings of the Board; calculating the daily NAV per share; and maintaining the financial books and records of each Fund.
For its services, the Adviser’s annual administrative fee is:
0.145% on the first $20 billion of the aggregate average daily net assets;
0.11% on the next $10 billion of aggregate average daily net assets;
0.09% on the next $10 billion of aggregate average daily net assets; and
0.07% on the aggregate average daily net assets over $40 billion.
The fee is computed and allocated among the Touchstone Fund Complex on the basis of relative daily net assets.
The Adviser has engaged BNY Mellon as the Sub-Administrator to the Trust. BNY Mellon provides administrative and accounting services to the Trust and is compensated directly by the Adviser, not the Trust.
TRANSFER AGENT AGREEMENT
Under the terms of the Transfer Agent Agreement between the Trust and BNY Mellon, BNY Mellon provides the Trust with transfer agency services, which include Creation Unit order processing. For these services, BNY Mellon receives a monthly fee from each Fund. In addition, each Fund pays out-of-pocket expenses incurred by BNY Mellon, including, but not limited to, postage and supplies.
CUSTODIAN AGREEMENT
As custodian, BNY Mellon is responsible for custody of each Fund’s assets.
33
Notes to Financial Statements (Continued)
SECURITIES LENDING AGREEMENT
As securities lending agent, BNY Mellon administers the securities lending program for the Funds. BNY Mellon lends certain securities, which are held in custody accounts maintained with BNY Mellon, to borrowers that have been approved by the Funds.
PLANS OF DISTRIBUTION
The Trust has adopted a distribution plan pursuant to Rule 12b-1 under the 1940 Act. The plan allows each Fund to pay distribution fees up to a maximum of 0.25% of average daily net assets. No such fee is currently incurred and paid by the Funds. The Funds will not incur and pay distribution fees until such time as approved by the Fund's Board.
DISTRIBUTOR
Foreside Fund Services, LLC (the “Distributor”) will serve as the principal distributor of the Fund’s shares. The Adviser has agreed to compensate the Distributor for distribution-related services.
INTERFUND TRANSACTIONS
Pursuant to Rule 17a-7 under the 1940 Act, the Funds may engage in purchase and sale transactions with funds that have a common investment adviser (or affiliated investment advisers), common Trustees and/or common Officers. During the period ended December 31, 2022, the Funds did not engage in any Rule 17a-7 transactions.
5. Fund Share Transactions
Shares of each Fund are issued and redeemed only in Creation Units. Investors may acquire shares and shareholders may tender their shares for redemption only in Creation Units. The number of shares of a Fund that constitute a Creation Unit is as follows: 25,000 for the Dividend Select ETF, Strategic Income Opportunities ETF and US Large Cap Focused ETF and 50,000 for the Ultra Short Income ETF. Each Fund generally offers and issues shares either in exchange for (i) a basket of securities designated by the Fund (“Deposit Securities”) together with the deposit of a specified cash payment (“Cash Component”) or (ii) a cash payment equal in value to the Deposit Securities (“Deposit Cash”) together with the Cash Component. Transactions in capital shares of the Fund are disclosed in detail in the Statement of Changes in Net Assets. Authorized Participants are subject to standard creation and redemption transaction fees to offset transfer and other transaction costs associated with the issuance and redemption of Creation Units.
6. Liquidity
Interfund Lending — Pursuant to an Exemptive Order issued by the SEC on March 28, 2017, the Funds, along with certain other funds in the Touchstone Fund Complex, may participate in an interfund lending program. The interfund lending program provides an alternate credit facility that allows the Funds to lend to or borrow from other participating funds in the Touchstone Fund Complex, subject to the conditions of the Exemptive Order. The Funds may not borrow under the facility for leverage purposes and the loans’ duration may be no more than 7 days.
During the period ended December 31, 2022, the Funds did not utilize Interfund Lending.
7. Federal Tax Information
Federal Income Tax — It is each Fund’s policy to continue to comply with the special provisions of the Internal Revenue Code applicable to regulated investment companies. As provided therein, in any fiscal year in which a Fund so qualifies and distributes at least 90% of its investment company taxable income, the Fund (but not the shareholders) will be relieved of federal income tax on the income distributed. It is each Fund’s policy to distribute all of its taxable income and accordingly, no provision for income taxes has been made.
In order to avoid imposition of the excise tax applicable to regulated investment companies, it is also each Fund’s intention to declare and pay as dividends in each calendar year at least 98% of its investment company taxable income (earned during the calendar year) and 98.2% of its net realized capital gains (earned during the twelve months ending October 31) plus undistributed amounts from prior years.
34
Notes to Financial Statements (Continued)
The tax character of distributions paid for the period ended December 31, 2022 are as follows:
| Dividend Select ETF | Strategic Income Opportunities ETF | Ultra Short Income ETF | US Large Cap Focused ETF | |
| Period Ended December 31, 2022 | Period Ended December 31, 2022 | Period Ended December 31, 2022 | Period Ended December 31, 2022 | |
| From ordinary income | $183,700 | $1,908,028 | $686,340 | $58,353 |
| Total distributions | $183,700 | $1,908,028 | $686,340 | $58,353 |
The following information is computed on a tax basis for each item as of December 31, 2022:
| Touchstone Dividend Select ETF | Touchstone Strategic Income Opportunities ETF | Touchstone Ultra Short Income ETF | Touchstone US Large Cap Focused ETF | |
| Tax cost of portfolio investments | $25,209,576 | $99,641,499 | $51,161,867 | $24,513,622 |
| Gross unrealized appreciation on investments | 1,333,329 | 1,143,105 | 88,947 | 1,102,567 |
| Gross unrealized depreciation on investments | (973,461) | (3,302,087) | (424,107) | (2,024,398) |
| Net unrealized appreciation (depreciation) on investments | 359,868 | (2,158,982) | (335,160) | (921,831) |
| Capital loss carryforwards | (54,504) | — | — | (111,663) |
| Undistributed ordinary income | 515 | 24,835 | 54,463 | 639 |
| Accumulated earnings (deficit) | $305,879 | $(2,134,147) | $(280,697) | $(1,032,855) |
The difference between the tax cost of portfolio investments and the financial statement cost is primarily due to wash sale loss deferrals and taxable interest on defaulted securities.
As of December 31, 2022, the Funds had the following capital loss carryforwards for federal income tax purposes:
| Fund | No Expiration Short Term | No Expiration Long Term | Total |
| Dividend Select ETF | $ 54,504 | $ — | $ 54,504 |
| US Large Cap Focused ETF | 111,663 | — | 111,663 |
The capital loss carryforwards may be utilized in future years to offset net realized capital gains, if any, prior to distributing such gains to shareholders.
The Funds recognize tax benefits or expenses of uncertain tax positions only when the position is "more likely than not" to be sustained assuming examination by tax authorities. Management of the Funds has reviewed tax positions taken in tax years that remain subject to examination by all major tax jurisdictions, including federal (i.e., the previous three tax year ends and the interim tax period since then, as applicable) and has concluded that no provision for unrecognized tax benefits or expenses is required in these financial statements and does not expect this to change over the next twelve months. The Funds recognize interest and penalties, if any, related to unrecognized tax benefits in the Statements of Operations. During the period, the Funds did not incur any interest or penalties.
Certain reclassifications, the result of permanent differences between financial statement and income tax reporting requirements, have been made to the components of capital as presented on the Statements of Assets and Liabilities. These reclassifications have no impact on the net assets or NAV per share of the Funds. The following reclassifications, which are primarily attributed to the tax treatment of net operating losses, in-kind distributions for shareholder redemptions and reclassification of REIT distribution - ordinary income to capital gains have been made to the following Funds for the period ended December 31, 2022:
| Fund | Paid-In Capital | Distributable Earnings |
| Dividend Select ETF | $ 329,192 | $ (329,192) |
| US Large Cap Focused ETF | 251,613 | (251,613) |
35
Notes to Financial Statements (Continued)
8. Commitments and Contingencies
The Funds indemnify the Trust’s officers and Trustees for certain liabilities that might arise from their performance of their duties to the Funds. Additionally, in the normal course of business, the Funds enter into contracts that contain a variety of representations and warranties and which provide general indemnifications. The Funds' maximum exposure under these arrangements is unknown, as this would involve future claims that may be made against the Funds.
9. Principal Risks
Risks Associated with Foreign Investments – The Funds may invest in the securities of foreign issuers. Investing in securities issued by companies whose principal business activities are outside the U.S. may involve significant risks not present in domestic investments. For example, there is generally less publicly available information about foreign companies, particularly those not subject to the disclosure and reporting requirements of the U.S. securities laws. Foreign issuers are generally not bound by uniform accounting, auditing, and financial reporting requirements and standards of practice comparable to those applicable to domestic issuers. Investments in foreign securities also involve the risk of possible adverse changes in investment or exchange control regulations, expropriation or confiscatory taxation, limitations on the removal of funds or other assets of a Fund, political or financial instability or diplomatic and other developments which could affect such investments. Political and military events, including in China, North Korea, Venezuela, Russia, Ukraine, Iran, Syria, and other areas of the Middle East, and nationalist unrest in Europe and South America, may cause market disruptions. Foreign stock markets, while growing in volume and sophistication, are generally not as developed as those in the U.S., and securities of some foreign issuers (particularly those located in developing countries) may be less liquid and more volatile than securities of comparable U.S. companies. In general, there is less overall governmental supervision and regulation of foreign securities markets, broker-dealers, and issuers than in the U.S.
Risks Associated with Sector Concentration – Certain Funds may invest a high percentage of their assets in specific sectors of the market in order to achieve a potentially greater investment return. As a result, these Funds may be more susceptible to economic, political, and regulatory developments in a particular sector of the market, positive or negative, and may experience increased volatility in the Funds' NAVs and magnified effect on the total return.
Risks Associated with Credit – An issuer may be unable to make timely payments of either principal or interest. This may cause the issuer’s securities to decline in value. Credit risk is particularly relevant to those Funds that invest a significant amount of their assets in junk bonds or lower-rated securities.
Risks Associated with Cyber Security - With the increased use of technologies, such as mobile devices and "cloud"-based service offerings and the dependence on the Internet and computer systems to perform necessary business functions, the Funds' service providers are susceptible to cyber security risks that could result in losses to a Fund and its shareholders. Cyber security breaches are either intentional or unintentional events that allow an unauthorized party to gain access to Fund assets, customer data, or proprietary information, or cause a Fund or Fund service provider to suffer data corruption or lose operational functionality. A cyber security breach could result in the loss or theft of customer data or funds, loss or theft of proprietary information or corporate data, physical damage to a computer or network system, or costs associated with system repairs, any of which could have a substantial impact on a Fund. Cyber security incidents could cause a Fund, the Adviser, a Sub-Adviser, or other service provider to incur regulatory penalties, reputational damage, compliance costs associated with corrective measures, litigation costs, or financial loss. They may also result in violations of applicable privacy and other laws. In addition, such incidents could affect issuers in which a Fund invests, thereby causing the Fund’s investments to lose value.
Risks Associated with Interest Rate Changes – The price of debt securities is generally linked to the prevailing market interest rates. In general, when interest rates rise, the price of debt securities falls, and when interest rates fall, the price of debt securities rises. The price volatility of a debt security also depends on its maturity. Longer-term securities are generally more volatile, so the longer the average maturity or duration of these securities, the greater their price risk. Duration is a measure of the expected life, taking into account any prepayment or call features of the security, that is used to determine the price sensitivity of the security for a given change in interest rates. Specifically, duration is the change in the value of a fixed-income security that will result from a 1% change in interest rates, and generally is stated in years. For example, as a general rule a 1% rise in interest rates means a 1% fall in value for every year of duration. Maturity, on the other hand, is the date on which a fixed-income security becomes due for payment of principal. An increase in interest rates could negatively impact a Fund’s NAV. Recent and potential future changes in government monetary policy may affect interest rates. As the U.S. Federal Reserve "tapers" or reduces the amount of securities it purchases pursuant to its quantitative easing program, and/or raises the federal funds target rate, there is a heightened risk that interest rates will rise, which could expose fixed-income and related markets to heightened volatility and could cause the value of a Fund's investments, and the Fund's NAV, to decline, potentially suddenly and significantly, which may negatively impact the Fund's performance.
36
Notes to Financial Statements (Continued)
Risks Associated with Health Crises – A widespread health crisis such as a global pandemic could cause substantial market volatility, exchange trading suspensions and closures, which may lead to less liquidity in certain instruments, industries, sectors or the markets generally, and may ultimately affect Fund performance. For example, the COVID-19 pandemic has resulted and may continue to result in significant disruptions to global business activity and market volatility due to disruptions in market access, resource availability, facilities operations, imposition of tariffs, export controls and supply chain disruption, among others. The impact of a health crisis and other epidemics and pandemics that may arise in the future, could affect the global economy in ways that cannot necessarily be foreseen at the present time. A health crisis may exacerbate other pre-existing political, social and economic risks. Any such impact could adversely affect a Fund's performance, resulting in losses to your investment.
Please see the Funds’ prospectus and statement of additional information for a complete discussion of these and other risks.
10. Subsequent Events
Subsequent events occurring after the date of this report have been evaluated for potential impact to this report through the date the financial statements were issued. There were no subsequent events that necessitated recognition or disclosure in the Funds’ financial statements.
37
Report of Independent Registered Public Accounting Firm
To the Shareholders and the Board of Trustees of Touchstone ETF Trust
Opinion on the Financial Statements
We have audited the accompanying statements of assets and liabilities of Touchstone ETF Trust (the “Trust”) (comprising Touchstone Dividend Select ETF, Touchstone Strategic Income Opportunities ETF, Touchstone Ultra Short Income ETF and Touchstone US Large Cap Focused ETF and (collectively referred to as the “Funds”)), including the portfolios of investments, as of December 31, 2022, and the related statements of operations and changes in net assets, and the financial highlights for each of the periods indicated in the table below and the related notes (collectively referred to as the “financial statements”). In our opinion, the financial statements present fairly, in all material respects, the financial position of each of the Funds comprising Touchstone ETF Trust at December 31, 2022, the results of their operations, changes in net assets and financial highlights for each of the periods indicated in the table below, in conformity with U.S. generally accepted accounting principles.
| Funds comprising the Touchstone ETF Trust | Statement of Operations | Statements of changes in net assets | Financial highlights |
| Touchstone Dividend Select ETF | For the period from August 2, 2022 (commencement of operations) through December 31, 2022 | ||
| Touchstone Strategic Income Opportunities ETF | For the period from July 21, 2022 (commencement of operations) through December 31, 2022 | ||
| Touchstone Ultra Short Income ETF | For the period from August 4, 2022 (commencement of operations) through December 31, 2022 | ||
| Touchstone US Large Cap Focused ETF | For the period from July 27, 2022 (commencement of operations) through December 31, 2022 | ||
Basis for Opinion
These financial statements are the responsibility of the Trust’s management. Our responsibility is to express an opinion on each of the Funds’ financial statements based on our audits. We are a public accounting firm registered with the Public Company Accounting Oversight Board (United States) (“PCAOB”) and are required to be independent with respect to the Trust in accordance with the U.S. federal securities laws and the applicable rules and regulations of the Securities and Exchange Commission and the PCAOB.
We conducted our audits in accordance with the standards of the PCAOB. Those standards require that we plan and perform the audit to obtain reasonable assurance about whether the financial statements are free of material misstatement, whether due to error or fraud. The Trust is not required to have, nor were we engaged to perform, an audit of the Trust’s internal control over financial reporting. As part of our audits, we are required to obtain an understanding of internal control over financial reporting but not for the purpose of expressing an opinion on the effectiveness of the Trust’s internal control over financial reporting. Accordingly, we express no such opinion.
Our audits included performing procedures to assess the risks of material misstatement of the financial statements, whether due to error or fraud, and performing procedures that respond to those risks. Such procedures included examining, on a test basis, evidence regarding the amounts and disclosures in the financial statements. Our procedures included confirmation of securities owned as of December 31, 2022, by correspondence with the custodian and others. Our audits also included evaluating the accounting principles used and significant estimates made by management, as well as evaluating the overall presentation of the financial statements. We believe that our audits provide a reasonable basis for our opinion.

We have served as the auditor of one or more Touchstone Investments’ investment companies since 1999.
Cincinnati, Ohio
February 28, 2023
38
Other Items (Unaudited)
Qualified Dividend Income
Under the Jobs and Growth Tax Relief Reconciliation Act of 2003 (the “Act”), the following percentages of ordinary dividends paid during the fiscal year ended December 31, 2022 are designated as “qualified dividend income,” as defined in the Act, and are subject to reduced tax rates. The Funds intend to pass through the maximum allowable percentage for Form 1099 Div.
| Dividend Select ETF | 100.00 % |
| Strategic Income Opportunities ETF | 3.51 % |
| US Large Cap Focused ETF | 100.00 % |
Dividend Received Deduction
For corporate shareholders, the following ordinary distributions paid during the fiscal year ended December 31, 2022 qualify for the corporate dividends received deduction. The Funds intend to pass through the maximum allowable percentage.
| Dividend Select ETF | 100.00 % |
| Strategic Income Opportunities ETF | 3.51 % |
| US Large Cap Focused ETF | 100.00 % |
Proxy Voting Guidelines and Proxy Voting Records
The Sub-Advisers are responsible for exercising the voting rights associated with the securities purchased and held by the Funds. A description of the policies and procedures that the Sub-Advisers use in fulfilling this responsibility is available as an appendix to the most recent Statement of Additional Information, which can be obtained without charge by calling toll free 1.833.368.7383 or by visiting the Touchstone website at TouchstoneInvestments.com or on the Securities and Exchange Commission’s (the “Commission”) website sec.gov. Information regarding how those proxies were voted during the most recent twelve-month period ended June 30, which will be filed by August 31 of that year, is also available without charge by calling toll free 1.833.368.7383 or on the Commission’s website at sec.gov.
Quarterly Portfolio Disclosure
Each Fund’s holdings as of the end of the third month of every fiscal quarter will be disclosed on Form N-PORT within 60 days of the end of the fiscal quarter. The complete listing of each Fund’s portfolio holdings is available on the Commission’s website and will be made available to shareholders upon request by calling 1.833.368.7383.
Schedule of Shareholder Expenses
As a shareholder of the Funds, you incur two types of costs: (1) transaction costs, including sales charges (loads) and (2) ongoing costs, including investment advisory fees; shareholder servicing fees; and other Fund expenses. This example is intended to help you understand your ongoing costs (in dollars) of investing in the Funds and to compare these costs with the ongoing costs of investing in other mutual funds.
The example is based on an investment of $1,000 invested at the beginning of the period and held for the entire period (July 1, 2022 through December 31, 2022).
Actual Expenses
The first line for each share class of a Fund in the table below provides information about actual account values and actual expenses. You may use the information in this line, together with the amount you invested, to estimate the expenses that you paid over the period. Simply divide your account value by $1,000 (for example, an $8,600 account value divided by $1,000 = 8.6), then multiply the result by the number in the first line under the heading entitled “Expenses Paid During the Period Ended December 31, 2022” to estimate the expenses you paid on your account during this period.
Hypothetical Example for Comparison Purposes
The second line for each share class of a Fund in the table below provides information about hypothetical account values and hypothetical expenses based on the Funds’ actual expense ratio and an assumed rate of return of 5% per year before expenses, which is not the Funds’ actual return. The hypothetical account values and expenses may not be used to estimate the actual ending account
39
Other Items (Unaudited) (Continued)
balance or expenses you paid for the period. You may use this information to compare the ongoing costs of investing in the Funds and other funds. To do so, compare this 5% hypothetical example with the 5% hypothetical examples that appear in the shareholder reports of the other funds.
Please note that the expenses shown in the table below are meant to highlight your ongoing costs only and do not reflect any transactional costs such as brokerage commissions paid on purchases and sales of an ETF's Shares. Therefore, the second line for each share class of a Fund in the table below is useful in comparing ongoing costs only, and will not help you determine the relative total costs of owning different funds. In addition, if these transactional costs were included, your costs would have been higher.
| Net Expense Ratio Annualized December 31, 2022 | Beginning Account Value (as of Funds' inception date) | Ending Account Value December 31, 2022 | Expenses Paid During the Period Ended December 31, 2022 | ||
| Dividend Select ETF* | |||||
| Actual | 0.67% | $1,000.00 | $1,019.40 | $2.80 | |
| Hypothetical | 0.67% | $1,000.00 | $1,017.91 | $2.80 | |
| Strategic Income Opportunities ETF** | |||||
| Actual | 0.65% | $1,000.00 | $999.70 | $2.90 | |
| Hypothetical | 0.65% | $1,000.00 | $1,019.43 | $2.93 | |
| Ultra Short Income ETF*** | |||||
| Actual | 0.34% | $1,000.00 | $1,008.70 | $1.39 | |
| Hypothetical | 0.34% | $1,000.00 | $1,019.02 | $1.40 | |
| US Large Cap Focused ETF**** | |||||
| Actual | 0.69% | $1,000.00 | $967.50 | $2.92 | |
| Hypothetical | 0.69% | $1,000.00 | $1,018.54 | $3.00 |
| * | Represents the period from commencement of operations (August 2, 2022) through December 31, 2022. Expenses are equal to the Fund's annualized expense ratio, multiplied by the average account value over the period, multiplied by 151/365. |
| ** | Represents the period from commencement of operations (July 21, 2022) through December 31, 2022. Expenses are equal to the Fund's annualized expense ratio, multiplied by the average account value over the period, multiplied by 163/365. |
| *** | Represents the period from commencement of operations (August 4, 2022) through December 31, 2022. Expenses are equal to the Fund's annualized expense ratio, multiplied by the average account value over the period, multiplied by 149/365. |
| **** | Represents the period from commencement of operations (July 27, 2022) through December 31, 2022. Expenses are equal to the Fund's annualized expense ratio, multiplied by the average account value over the period, multiplied by 157/365. |
Liquidity Risk Management
The Funds have adopted and implemented a written liquidity risk management program (the “LRM Program”) as required by Rule 22e-4 under the Investment Company Act of 1940. Rule 22e-4 requires that each Fund adopt a program that is reasonably designed to assess and manage the Funds’ liquidity risk, which is the risk that a Fund could not meet redemption requests without significant dilution of remaining investors’ interests in a Fund.
Assessment and management of a Fund’s liquidity risk under the LRM Program takes into consideration certain factors, such as a Fund’s investment strategy and the liquidity of its portfolio investments during normal and reasonably foreseeable stressed conditions, its short- and long-term cash-flow projections during both normal and reasonably foreseeable stressed conditions, and its cash and cash-equivalent holdings and access to other funding sources. As required by the rule, the LRM Program includes policies and procedures for classification of fund portfolio holdings in four liquidity categories, maintaining certain levels of highly liquid investments, and limiting holdings of illiquid investments. To the extent a Fund is classified as an "In-Kind ETF" under Rule 22e-4, the Fund is not required to include in the LRM Program policies and procedures relating to classification of portfolio holdings into four liquidity categories or establishment of a highly liquid investment minimum.
The Board of Trustees of the Trust approved the appointment of a LRM Program administrator responsible for administering the LRM Program and for carrying out the specific responsibilities set forth in the LRM Program, including reporting to the Board on at least an annual basis regarding the LRM Program’s operation, its adequacy, and the effectiveness of its implementation for the past year (the “Program Administrator Report”) on May 19, 2022.
Advisory and Sub-Advisory Agreement Approval Disclosure
At a meeting held on May 19, 2022, the Board of Trustees (the “Board” or “Trustees”) of the Touchstone ETF Trust (the “Trust”), and by a separate vote, the Independent Trustees of the Trust, initially approved an Investment Advisory Agreement between the Trust and the Advisor with respect to the Touchstone Dividend Select ETF, Touchstone Strategic Income Opportunities ETF,
40
Other Items (Unaudited) (Continued)
Touchstone US Large Cap Focused ETF and Touchstone Ultra Short Income ETF (together, the “Funds”), and also initially approved a Sub-Advisory Agreement between the Advisor and Fort Washington Investment Advisors, Inc. (the “Sub-Advisor”) with respect to each of the Funds.
In determining whether to approve the Investment Advisory Agreement and the Sub-Advisory Agreements, the Advisor furnished information necessary for a majority of the Independent Trustees to make the determination that the initial approval of the Investment Advisory Agreement and the initial approval of the Sub-Advisory Agreements were in the best interests of each Fund and its respective shareholders. The information considered by the Board included: (1) a comparison of the Funds’ proposed advisory fee, proposed sub-advisory fee and estimated total expense ratios with those of comparable funds; (2) performance information regarding the Sub-Advisor’s strategies that the Advisor proposed the Sub-Advisor utilize in managing the Funds and comparable funds; (3) the Advisor’s and its affiliates’ estimated revenues and costs of providing services to the Funds; and (4) information about the Advisor’s and Sub-Advisor’s personnel.
Prior to voting, the Independent Trustees reviewed the proposed approval of the Investment Advisory Agreement and the Sub-Advisory Agreements with management and with experienced independent legal counsel and received materials from such counsel discussing the legal standards for their consideration of the approval of the Investment Advisory Agreement and the Sub-Advisory Agreements with respect to the Funds. The Independent Trustees also reviewed the proposed approval of the Investment Advisory Agreement and the Sub-Advisory Agreements with independent legal counsel in a private session at which no representatives of management were present.
In approving the Investment Advisory Agreement, the Board considered various factors, among them: (1) the nature, extent and quality of services to be provided to the Funds, including the personnel who would be providing such services; (2) the Advisor's anticipated compensation and profitability; (3) a comparison of estimated net expenses and relevant performance information; (4) anticipated economies of scale; and (5) the terms of the Investment Advisory Agreement. The Board's analysis of these factors is set forth below. The Independent Trustees were advised by independent legal counsel throughout the process.
Nature, Extent and Quality of Advisor Services. The Board considered the level and depth of knowledge of the Advisor, including the professional experience and qualifications of senior personnel. In evaluating the quality of services to be provided by the Advisor, the Board took into account its familiarity with the Advisor’s senior management through Board meetings, discussions and reports during the preceding year. The Board also took into account the Advisor’s compliance policies and procedures. The quality of administrative and other services provided to other funds managed by the Advisor, including the Advisor’s role in coordinating the activities of those funds’ other service providers, was also considered. The Board also considered the Advisor’s relationship with its affiliates and the resources available to them, as well as any potential conflicts of interest.
The Board discussed the Advisor’s effectiveness in monitoring the performance of the Sub-Advisor, an affiliate of the Advisor, and the Advisor’s timeliness in responding to performance issues. The Board considered the Advisor’s process for monitoring the Sub-Advisor, which would include an examination of both qualitative and quantitative elements of the Sub-Advisor’s organization, personnel, procedures, investment discipline, infrastructure and performance. The Board considered that the Advisor would conduct periodic compliance due diligence of the Sub-Advisor, during which the Advisor would examine a wide variety of factors, such as the financial condition of the Sub-Advisor, the quality of the Sub-Advisor’s systems, the effectiveness of the Sub-Advisor’s disaster recovery programs, trade allocation and execution procedures, compliance with the Sub-Advisor’s policies and procedures, results of regulatory examinations and any other factors that might affect the quality of services to be provided by the Sub-Advisor to the Funds. The Board noted that the Advisor’s compliance monitoring processes also would include quarterly reviews of compliance certifications, and that any issues arising from such certifications and the Advisor’s compliance reviews of the Sub-Advisor would be reported to the Board.
The Trustees concluded that they were satisfied with the nature, extent and quality of services to be provided to the Funds by the Advisor under the Investment Advisory Agreement.
Advisor’s Proposed Compensation and Anticipated Profitability. The Board took into consideration the financial condition and anticipated profitability of the Advisor and its affiliates (including the Sub-Advisor) and the anticipated direct and indirect benefits to be derived by the Advisor and its affiliates from the Advisor’s relationship with the Funds. The Board noted that the Advisor had contractually agreed to waive advisory fees and administrative fees and/or reimburse expenses in order to limit the Funds’ net operating expenses for at least one year and would pay sub-advisory fees out of the advisory fees the Advisor would receive from the Funds. The Board reviewed the anticipated profitability of the Advisor's relationship with the Funds and also considered whether the Advisor has the financial wherewithal to provide a high level of services to the Funds, noting the ongoing commitment of the Advisor’s parent company with respect to providing support and resources as needed. The Board also noted that the Advisor would derive benefits to its reputation and other benefits from its association with the Funds.
41
Other Items (Unaudited) (Continued)
The Board recognized that the Advisor should be entitled to earn a reasonable level of profits in exchange for the level of services it would provide to the Funds and the entrepreneurial risk that it would assume as Advisor. Based upon their review, the Trustees concluded that the Advisor’s and its affiliates’ level of profitability, if any, to be derived from their relationship with the Funds was reasonable and not excessive.
Estimated Expenses and Performance. The Board compared each Fund's proposed advisory and sub-advisory fees and estimated total expense ratios with those of comparable funds. The Board took into account that the Advisor had contractually agreed to limit the Funds’ net operating expenses for at least one year following the launch of the Funds.
The Board also considered the effect of each Fund’s potential growth and size on its performance and expenses. The Board noted that the Advisor had contractually agreed to waive a portion of its fees and/or reimburse expenses of each Fund in order to reduce the Fund’s operating expenses to a targeted level. The Board noted that the sub-advisory fees under the Sub-Advisory Agreement with respect to each Fund would be paid by the Advisor out of the advisory fee it would receive from the respective Fund and considered the impact of such sub-advisory fees on the anticipated profitability of the Advisor. In reviewing the proposed total expense ratios and relevant performance information, the Board also took into account the nature, extent and quality of the services to be provided to the Funds by the Advisor and its affiliates.
The Board considered, among other data, the specific factors set forth below with respect to each Fund:
Touchstone Dividend Select ETF. The Fund’s proposed maximum advisory fee and estimated net expense ratio (net of applicable expense waivers and reimbursements) were below the median and above the median, respectively, of its peer group. The Board noted that the strategy proposed to be employed by the Sub-Advisor to manage the Fund outperformed its benchmark and underperformed its peer group for the one-year period ended December 31, 2021.
Touchstone Strategic Income Opportunities ETF. The Fund’s proposed maximum advisory fee and estimated net expense ratio (net of applicable expense waivers and reimbursements) were below the median and above the median, respectively, of its peer group. The Board noted that the strategy proposed to be employed by the Sub-Advisor to manage the Fund outperformed its benchmark, and peer group for the one- and three-year periods ended December 31, 2021.
Touchstone US Large Cap Focused ETF. The Fund’s proposed maximum advisory fee and estimated net expense ratio (net of applicable expense waivers and reimbursements) were above the median and at the median, respectively, of its peer group. The Board noted that the strategy proposed to be employed by the Sub-Advisor to manage the Fund underperformed its benchmark and outperformed its peer group for the one- and five-year periods ended December 31, 2021.
Touchstone Ultra Short Income ETF. The Fund’s proposed maximum advisory fee and estimated expense ratio (net of applicable expense waivers and reimbursements) were each above the median of its peer group. The Board noted that the strategy proposed to be employed by the Sub-Advisor to manage the Fund outperformed its benchmark and peer group for the one-, five- and ten-year periods ended December 31, 2021.
Potential Economies of Scale. The Board considered the effect of each Fund's potential growth and size on its performance and expenses. The Board took into account management’s discussion of the Funds’ advisory fee structure. The Board considered the proposed advisory fees under the Investment Advisory Agreement and possible economies of scale that might be realized if the assets of the Fund increase. The Board noted that the proposed advisory fee schedule for all but one of the Funds contained one or more breakpoints that would reduce the advisory fee rate on assets above a specified level as the Funds’ assets increased and considered the necessity of adding breakpoints with respect to the one Fund that did not currently have any breakpoints in its proposed advisory fee schedule. The Board determined that adding breakpoints at specified levels to the proposed advisory fee schedule of that Fund was not appropriate at that time. The Board also noted that if the Funds’ assets increase over time, the Funds might realize other economies of scale if assets increase proportionally more than certain other expenses. The Board also considered the fact that, under the Investment Advisory Agreement, the advisory fee payable to the Advisor by the Funds would be reduced by the total sub-advisory fee paid by the Advisor to the Funds’ Sub-Advisor.
Conclusion. In considering the initial approval of the Investment Advisory Agreement, the Board, including the Independent Trustees, did not identify any single factor as controlling, and each Trustee may have attributed different weights to the various factors. The Trustees evaluated all information available to them. The Board reached the following conclusions regarding the Investment Advisory Agreement with the Advisor, among others: (a) the Advisor demonstrated that it possesses the capability and resources to perform the duties required of it under the Investment Advisory Agreement; (b) the Advisor maintains an appropriate compliance program; and (c) each Fund’s proposed advisory fee is reasonable relative to those of comparable funds and the services to be provided by the Advisor. Based on their conclusions, the Trustees determined with respect to the Funds that approval of the Investment Advisory Agreement was in the best interests of each Fund and its respective shareholders.
In initially approving the Sub-Advisory Agreement for each Fund, the Board considered various factors with respect to each Fund and the applicable Sub-Advisory Agreement, among them: (1) the nature, extent and quality of services to be provided to the Fund,
42
Other Items (Unaudited) (Continued)
including the personnel who would be providing such services; (2) the Sub-Advisor’s proposed sub-advisory fee; (3) the performance of the Sub-Advisor’s strategy that would be used in managing the Fund and that of comparable funds; (4) the terms of the Sub-Advisory Agreement. The Board’s analysis of these factors is set forth below. The Independent Trustees were advised by independent legal counsel throughout the process.
Nature, Extent and Quality of Services Provided; Investment Personnel. The Board considered information provided by the Advisor regarding the services to be provided by the Sub-Advisor. The Board noted the affiliation of the Sub-Advisor to the Advisor, noting any potential conflicts of interest. The Board also noted that, on a periodic basis, the Board meets with portfolio managers of the Sub-Advisor to discuss its respective performance and investment processes and strategies. The Board also considered the Sub-Advisor’s level of knowledge and investment style. The Board reviewed the experience and credentials of the applicable investment personnel of the Sub-Advisor who would be responsible for managing the Funds. The Board noted that the portfolio managers who would manage each Fund would be the same portfolio managers who currently manage the comparable Touchstone Funds. The Board also noted its familiarity with the Sub-Advisor, as it serves as a sub-advisor to various Touchstone Funds. The Board also took into consideration that the Advisor was satisfied with the Sub-Advisor’s in-house risk and compliance teams and its familiarity with the Sub-Advisor given its management of various Touchstone Funds.
Sub-Advisor’s Proposed Compensation. The Board also took into consideration the financial condition of the Sub-Advisor and any indirect benefits to be derived by the Sub-Advisor and its affiliates from the Sub-Advisor’s relationship with the Funds. In considering the anticipated profitability to the Sub-Advisor of its relationship with the Funds, the Board noted the proposed contractual undertaking of the Advisor to maintain expense limitations for the Funds and also noted that the sub-advisory fee under the Sub-Advisory Agreement would be paid by the Advisor out of the advisory fee that it would receive under the Investment Advisory Agreement. As a consequence, the anticipated profitability to the Sub-Advisor of its relationship with the Funds was not a substantial factor in the Board’s deliberations. For similar reasons, the Board did not consider the potential economies of scale in the Sub-Advisor’s management of the Funds to be a substantial factor in its consideration, although the Board noted that the proposed sub-advisory fee schedule for each Fund contained one or more breakpoints that would reduce the sub-advisory fee rate on assets above a specified level as the Fund’s assets increased.
Proposed Sub-Advisory Fees and Performance Information. The Board considered that the Fund would pay an advisory fee to the Advisor and that the Advisor would pay a sub-advisory fee to the Sub-Advisor out of the advisory fee it would receive from the Funds. The Board considered the amount to be retained by the Advisor and the sub-advisory fee to be paid to the Sub-Advisor with respect to the various services to be provided by the Advisor and the Sub-Advisor. Based on their review, the Trustees concluded that each Fund’s proposed sub-advisory fee was reasonable in light of the quality of services to be provided by the Sub-Advisor to the Fund and the other factors considered.
As noted above, the Board considered the performance of the Sub-Advisor’s strategies that would be used in managing the Funds and comparable funds. The Board also noted the Advisor’s expertise and resources in monitoring the performance, investment style and risk-adjusted performance of the Trust’s other sub-advisors. The Board was mindful of the Advisor's focus on the performance of sub-advisors and the Advisor's ways of addressing underperformance.
Conclusion. In considering the initial approval of the Sub-Advisory Agreements with respect to each Fund, the Board, including the Independent Trustees, did not identify any single factor as controlling, and each Trustee may have attributed different weights to the various factors. The Board reached the following conclusions regarding the Sub-Advisory Agreements, among others: (a) the Sub-Advisor is qualified to manage each Fund’s assets in accordance with the Fund's investment goals and policies; (b) the Sub-Advisor maintains an appropriate compliance program; (c) each Fund’s proposed advisory and sub-advisory fee structure is reasonable relative to those of similar funds and to the services to be provided by the Advisor and the Sub-Advisor; and (d) the Sub-Advisor’s proposed investment strategies are appropriate for pursuing the investment goals of the Funds. Based on its conclusions, the Board determined that approval of the Sub-Advisory Agreement with respect to each Fund was in the best interests of the Fund and its respective shareholders.
43
Management of the Trust (Unaudited)
Listed below is required information regarding the Trustees and principal officers of the Trust. The Trust’s Statement of Additional Information includes additional information about the Trustees and is available, without charge, upon request by calling 1-833-368-7383 or by visiting the Touchstone website at TouchstoneInvestments.com.
| Interested Trustees1: | |||||
| Name Address Year of Birth | Position Held with Trust | Term of Office And Length of Time Served | Principal Occupation(s) During Past 5 Years | Number of Funds Overseen in the Touchstone Fund Complex2 | Other Directorships Held During Past 5 Years3 |
| Jill T. McGruder Touchstone Advisors, Inc. 303 Broadway Suite 1100 Cincinnati, Ohio 45202 Year of Birth: 1955 | Trustee | Until retirement at age 75 or until she resigns or is removed Trustee since 1999 | President of Touchstone Funds from 1999 to 2020; Director and CEO of IFS Financial Services, Inc. (a holding company) since 1999; and Senior Vice President and Chief Marketing Officer of Western & Southern Financial Group, Inc. (a financial services company) since 2016. | 40 | Director, Integrity Life Insurance Co. and National Integrity Life Insurance Co. since 2005; Director, Touchstone Securities (the Distributor) since 1999; Director, Touchstone Advisors (the Advisor) since 1999; Director, W&S Brokerage Services, Inc. since 1999; Director, W&S Financial Group Distributors, Inc. since 1999; Director, Insurance Profillment Solutions LLC since 2014; Director, Columbus Life Insurance Co. since 2016; Director, The Lafayette Life Insurance Co. since 2016; Director, Gerber Life Insurance Company since 2019; Director, Western & Southern Agency, Inc. since 2018; and Director, LL Global, Inc. (not-for-profit trade organization with operating divisions LIMRA and LOMA) since 2016. |
| E. Blake Moore, Jr. Touchstone Advisors, Inc. 303 Broadway Suite 1100 Cincinnati, Ohio 45202 Year of Birth: 1958 | President and Trustee | Until retirement at age 75 or until he resigns or is removed Trustee since 2021 | President, Touchstone Funds since 2021; Chief Executive Officer of Touchstone Advisors, Inc. and Touchstone Securities, Inc. since 2020; President, Foresters Investment Management Company, Inc. from 2018 to 2020; President, North American Asset Management at Foresters Financial from 2018 to 2020; Managing Director, Head of Americas at UBS Asset Management from 2015 to 2017; and Executive Vice President, Head of Distribution at Mackenzie Investments from 2011 to 2014. | 40 | Trustee, College of Wooster since 2008; and Director, UBS Funds from 2015 to 2017. |
| Independent Trustees: | |||||
| Karen Carnahan c/o Touchstone Advisors, Inc. 303 Broadway Suite 1100 Cincinnati, Ohio 45202 Year of Birth: 1954 | Trustee | Until retirement at age 75 or until she resigns or is removed Trustee since 2019 | Retired; formerly Chief Operating Officer of Shred-it (a business services company) from 2014 to 2015; formerly President & Chief Operating Officer of the document management division of Cintas Corporation (a business services company) from 2008 to 2014. | 40 | Director, Cintas Corporation since 2019; Director, Boys & Girls Club of West Chester/Liberty from 2016 to 2022; and Board of Advisors, Best Upon Request from 2020 to 2021. |
| William C. Gale c/o Touchstone Advisors, Inc. 303 Broadway Suite 1100 Cincinnati, Ohio 45202 Year of Birth: 1952 | Trustee | Until retirement at age 75 or until he resigns or is removed Trustee since 2013 | Retired; formerly Senior Vice President and Chief Financial Officer of Cintas Corporation (a business services company) from 1995 to 2015. | 40 | None. |
44
Management of the Trust (Unaudited) (Continued)
| Independent Trustees (Continued): | |||||
| Name Address Year of Birth | Position Held with Trust | Term of Office And Length of Time Served | Principal Occupation(s) During Past 5 Years | Number of Funds Overseen in the Touchstone Fund Complex2 | Other Directorships Held During Past 5 Years3 |
| Susan M. King c/o Touchstone Advisors, Inc. 303 Broadway Suite 1100 Cincinnati, Ohio 45202 Year of Birth: 1963 | Trustee | Until retirement at age 75 or until she resigns or is removed Trustee since 2021 | Formerly, Partner of ID Fund LLC (2020 to 2021); formerly, Senior Vice President, Head of Product and Marketing Strategy of Foresters Financial (2018 to 2020); formerly, Managing Director, Head of Sales Strategy and Marketing, Americas of UBS Asset Management (2015 to 2017); formerly, Director, Allianz Funds, Allianz Funds Multi-Strategy Trust and AllianzGI Institutional Multi-Series Trust (2014 to 2015); and formerly, Director, Alliance Capital Cash Management Offshore Funds (2003 to 2005). | 40 | Trustee, Claremont McKenna College since 2017; Trustee, Israel Cancer Research Fund since 2019; and Board Member of WHAM! (Women's Health Access Matters) since 2021. |
| Kevin A. Robie c/o Touchstone Advisors, Inc. 303 Broadway Suite 1100 Cincinnati, Ohio 45202 Year of Birth: 1956 | Trustee | Until retirement at age 75 or until he resigns or is removed Trustee since 2013 | Retired; formerly Vice President of Portfolio Management at Soin LLC (private multinational holding company and family office) from 2004 to 2020. | 40 | Director, SaverSystems, Inc. since 2015; Director, Buckeye EcoCare, Inc. from 2013 to 2018; Director, Turner Property Services Group, Inc. since 2017; Trustee, Dayton Region New Market Fund, LLC (private fund) since 2010; and Trustee, Entrepreneurs Center, Inc. (business incubator) since 2006. |
| Sally J. Staley4 c/o Touchstone Advisors, Inc. 303 Broadway Suite 1100 Cincinnati, Ohio 45202 Year of Birth: 1956 | Trustee | Until retirement at age 75 or until she resigns or is removed Trustee since 2023 | Independent Consultant to Institutional Asset Owners since 2017; formerly Chief Investment Officer and Corporate Officer for Case Western Reserve University from 2006 to 2017; formerly Advisor to Fairport Asset Management LLC/Luma Wealth Advisors from 2011 to 2019. | 40 | Trustee, College of Wooster since 2006 (Chair since 2021); Trustee, Great Lakes Theater Festival since 2005; and Member of Advisory Committee, Certified Investment Fund Director Institute from 2015 to 2020. |
| William H. Zimmer III c/o Touchstone Advisors, Inc. 303 Broadway Suite 1100 Cincinnati, Ohio 45202 Year of Birth: 1953 | Trustee | Until retirement at age 75 or until he resigns or is removed Trustee since 2019 | Independent Treasury Consultant since 2014. | 40 | Director, Deaconess Associations, Inc. (healthcare) since 2001; Trustee, Huntington Funds (mutual funds) from 2006 to 2015; and Director, National Association of Corporate Treasurers from 2011 to 2015. |
1Ms. McGruder, as a director of the Adviser, and an officer of affiliates of the Adviser, is an “interested person” of the Trust within the meaning of Section 2(a)(19) of the 1940 Act. Mr. Moore, as an officer of the Adviser, is an “interested person” of the Trust within the meaning of Section 2(a)(19) of the 1940 Act.
2 As of December 31, 2022, the Touchstone Fund Complex consisted of 4 series of the Trust, 19 series of Touchstone Strategic Trust, 13 series of Touchstone Funds Group Trust and 4 variable annuity series of Touchstone Variable Series Trust.
3Each Trustee is also a Trustee of Touchstone Strategic Trust, Touchstone Funds Group Trust and Touchstone Variable Series Trust.
4 Ms. Staley was elected as a Trustee, effective as of January 1, 2023.
45
Management of the Trust (Unaudited) (Continued)
| Principal Officers: | |||
| Name Address Year of Birth | Position(s) Held with Trust1 | Term of Office And Length of Time Served | Principal Occupation(s) During Past 5 Years |
| E. Blake Moore, Jr. Touchstone Advisors, Inc. 303 Broadway Suite 1100 Cincinnati, Ohio 45202 Year of Birth: 1958 | President and Trustee | Until resignation, removal or disqualification President since January 2021 | See biography above. |
| Timothy D. Paulin Touchstone Advisors, Inc. 303 Broadway Suite 1100 Cincinnati, Ohio 45202 Year of Birth: 1963 | Vice President | Until resignation, removal or disqualification Vice President since 2010 | Senior Vice President of Investment Research and Product Management of Touchstone Advisors, Inc. |
| Timothy S. Stearns Touchstone Advisors, Inc. 303 Broadway Suite 1100 Cincinnati, Ohio 45202 Year of Birth: 1963 | Chief Compliance Officer | Until resignation, removal or disqualification Chief Compliance Officer since 2013 | Chief Compliance Officer of Touchstone Advisors, Inc. and Touchstone Securities, Inc. |
| Terrie A. Wiedenheft Touchstone Advisors, Inc. 303 Broadway Suite 1100 Cincinnati, Ohio 45202 Year of Birth: 1962 | Controller and Treasurer | Until resignation, removal or disqualification Controller and Treasurer since 2006 | Senior Vice President and Chief Administration Officer within the Office of the Chief Marketing Officer of Western & Southern Financial Group (since 2021); and Senior Vice President, Chief Financial Officer, and Chief Operations Officer of IFS Financial Services, Inc. (a holding company). |
| Meredyth A. Whitford-Schultz Western & Southern Financial Group 400 Broadway Cincinnati, Ohio 45202 Year of Birth: 1981 | Secretary | Until resignation, removal or disqualification Secretary since 2018 | Senior Counsel - Securities/Mutual Funds of Western & Southern Financial Group (2015 to present); Associate at Morgan Lewis & Bockius LLP (law firm) (2014 to 2015); Associate at Bingham McCutchen LLP (law firm) (2008 to 2014). |
1 Each officer also holds the same office with Touchstone Strategic Trust, Touchstone Funds Group Trust and Touchstone Variable Series Trust.
46
PRIVACY PROTECTION POLICY
We Respect Your Privacy
Thank you for your decision to invest with us. Touchstone and its affiliates have always placed a high value on the trust and confidence our clients place in us. We believe that confidence must be earned and validated through time. In today’s world, when technology allows the sharing of information at light speeds, trust must be reinforced by our sincere pledge to take the steps necessary to ensure that the information you share with us is treated with respect and confidentiality.
Our Pledge to Our Clients
• We collect only the information we need to service your account and administer our business.
• We are committed to keeping your information confidential and we place strict limits and controls on the use and sharing of your information.
• We make every effort to ensure the accuracy of your information.
We Collect the Following Nonpublic Personal Information About You:
• Information we receive from you on or in applications or other forms, correspondence, or conversations, including, but not limited to, your name, address, phone number, social security number, assets, income and date of birth; and
• Information about your transactions with us, our affiliates, or others, including, but not limited to, your account number and balance, payment history, parties to transactions, cost basis information, and other financial information.
Categories of Information We Disclose and Parties to Whom We Disclose
We do not disclose any nonpublic personal information about our current or former clients to nonaffiliated third parties, except as required or permitted by law.
We Place Strict Limits and Controls on the Use and Sharing of Your Information
• We restrict access to nonpublic personal information about you to authorized employees who need the information to administer your business.
• We maintain physical, electronic and procedural safeguards that comply with federal standards to protect this information.
• We do not disclose any nonpublic personal information about our current or former clients to anyone, except as required or permitted by law or as described in this document.
• We will not sell your personal information to anyone.
We May Provide Information to Service Your Account
Sometimes it is necessary to provide information about you to various companies such as transfer agents, custodians and broker-dealers to facilitate the servicing of your account. These organizations have a legitimate business need to see some of your personal information in order for us to provide service to you. We may disclose to these various companies the information that we collect as described above. We require that these companies, including our own subsidiaries and affiliates, strictly maintain the confidentiality of this information and abide by all applicable laws. We do not permit these companies to sell the information for their own purposes, and we never sell our customer information.
This policy is applicable to the following affiliated companies: Touchstone Funds Group Trust, Touchstone Strategic Trust, Touchstone Variable Series Trust and Touchstone ETF Trust.
The Privacy Protection Policy is not part of the Annual Report.
47


Touchstone Investments
Investment Adviser
Touchstone Advisors, Inc.*
303 Broadway
Cincinnati, Ohio 45202-4203
303 Broadway
Cincinnati, Ohio 45202-4203
Distributor
Foreside Fund Services, LLC
Three Canal Plaza, Suite 100
Portland, Maine 04101
Three Canal Plaza, Suite 100
Portland, Maine 04101
Transfer Agent
The Bank of New York Mellon
6023 Airport Road
Oriskany, New York 13424
Shareholder Service
1.833.368.7383
* A Member of Western & Southern Financial Group
TSF-2657-ETFT-AR-2212
| (b) | Not applicable. |
Item 2. Code of Ethics.
| (a) | The registrant, as of the end of the period covered by this report, has adopted a code of ethics that applies to the registrant’s principal executive officer, principal financial officer, principal accounting officer or controller, or persons performing similar functions, regardless of whether these individuals are employed by the registrant or a third party. |
| (c) | There have been no amendments, during the period covered by this report, to a provision of the code of ethics that applies to the registrant’s principal executive officer, principal financial officer, principal accounting officer or controller, or persons performing similar functions, regardless of whether these individuals are employed by the registrant or a third party, and that relates to any element of the code of ethics description. |
| (d) | The registrant has not granted any waivers, including an implicit waiver, from a provision of the code of ethics that applies to the registrant’s principal executive officer, principal financial officer, principal accounting officer or controller, or persons performing similar functions, regardless of whether these individuals are employed by the registrant or a third party, that relates to one or more of the items set forth in paragraph (b) of this item’s instructions. |
| (e) | Not applicable. |
| (f) | A copy of the code of ethics is attached hereto as Exhibit 13(a)(1). |
Item 3. Audit Committee Financial Expert.
The registrant’s Board of Trustees has determined that the registrant has at least one audit committee financial expert serving on its audit committee. Ms. Karen Carnahan is the registrant’s audit committee financial expert and is an independent trustee within the meaning of the Investment Company Act of 1940, as amended (the “1940 Act”).
Item 4. Principal Accountant Fees and Services.
Audit Fees
| (a) | Audit fees for Touchstone ETF Trust totaled $84,300 for the fiscal year ended December 31, 2022, including fees associated with the annual audits and filings of Form N-1A and Form N-CEN. |
Audit-Related Fees
| (b) | The aggregate fees billed in the last fiscal year for assurance and related services by the principal accountant that are reasonably related to the performance of the audit of the registrant’s financial statements and are not reported under paragraph (a) of this Item are $10,000 for the fiscal year ended December 31, 2022. The fees for 2022 relate to the initial seed audit. |
Tax Fees
| (c) | The aggregate fees billed in the last fiscal year for professional services rendered by the principal accountant for tax compliance, tax advice, and tax planning were $32,000 for the fiscal year ended December 31, 2022. The fees relate to the preparation of federal income and excise tax returns, and review of capital gains distribution calculations. |
All Other Fees
| (d) | The aggregate fees billed in the last fiscal year for products and services provided by the principal accountant, other than the services reported in paragraphs (a) through (c) of this Item are $0 for the fiscal year ended December 31, 2022. |
| (e)(1) | Disclose the audit committee’s pre-approval policies and procedures described in paragraph (c)(7) of Rule 2-01 of Regulation S-X. |
The Audit Committee’s pre-approval policies describe the types of audit, audit-related, tax and other services that have the general pre-approval of the Audit Committee. The pre-approval policies provide that annual audit service fees, tax services not specifically granted pre-approval, services exceeding pre-approved cost levels and other services that have not received general pre-approval will be subject to specific pre-approval by the Audit Committee. The pre-approval policies further provide that the Committee may grant general pre-approval to other audit services (statutory audits and services associated with SEC registration statements, periodic reports and other documents filed with the SEC or other documents issued in connection with securities offerings), audit-related services (accounting consultations related to accounting, financial reporting or disclosure matters not classified as “audit services,” assistance with understanding and implementing new accounting and financial reporting guidance from rulemaking authorities, agreed-upon or expanded audit procedures related to accounting and/or billing records required to respond to or comply with financial, accounting or regulatory reporting matters and assistance with internal control reporting requirements under Form N-CSR), tax services that have historically been provided by the auditor that the Committee believes would not impair the independence of the auditor and are consistent with the SEC’s rules on auditor independence and permissible non-audit services classified as “all other services” that are routine and recurring services.
| (e)(2) | All of the services described in paragraphs (b) through (d) of Item 4 were approved by the Audit Committee. |
| (f) | The percentage of hours expended on the principal accountant’s engagement to audit the registrant’s financial statements for the most recent fiscal year that were attributed to work performed by persons other than the principal accountant’s full-time, permanent employees was less than fifty percent. |
| (g) | The aggregate non-audit fees for Touchstone ETF Trust and certain entities*, totaled approximately $699,959 for the fiscal year ended December 31, 2022. |
| * | These include the advisers (excluding non-affiliated sub-advisers) and any entity controlling, controlled by or under common control with the advisers that provides ongoing services to the registrant (Funds). |
| (h) | The registrant’s audit committee of the board of trustees has considered whether the provision of non-audit services that were rendered to the registrant’s investment adviser (not including any sub-adviser whose role is primarily portfolio management and is subcontracted with or overseen by another investment adviser), and any entity controlling, controlled by, or under common control with the investment adviser that provides ongoing services to the registrant that were not pre-approved pursuant to paragraph (c)(7)(ii) of Rule 2-01 of Regulation S-X is compatible with maintaining the principal accountant’s independence. |
| (i) | Not applicable. |
| (j) | Not applicable. |
Item 5. Audit Committee of Listed Registrants.
Not applicable.
Item 6. Investments.
| (a) | Schedule of Investments in securities of unaffiliated issuers as of the close of the reporting period is included as part of the report to shareholders filed under Item 1 of this form. |
| (b) | Not applicable. |
Item 7. Disclosure of Proxy Voting Policies and Procedures for Closed-End Management Investment Companies.
Not applicable.
Item 8. Portfolio Managers of Closed-End Management Investment Companies.
Not applicable.
Item 9. Purchases of Equity Securities by Closed-End Management Investment Company and Affiliated Purchasers.
Not applicable.
Item 10. Submission of Matters to a Vote of Security Holders.
There have been no material changes to the procedures by which the shareholders may recommend nominees to the registrant’s board of trustees, where those changes were implemented after the registrant last provided disclosure in response to the requirements of Item 407(c)(2)(iv) of Regulation S-K (17 CFR 229.407) (as required by Item 22(b)(15) of Schedule 14A (17 CFR 240.14a-101)), or this Item.
Item 11. Controls and Procedures.
| (a) | The registrant’s principal executive and principal financial officers, or persons performing similar functions, have concluded that the registrant’s disclosure controls and procedures (as defined in Rule 30a-3(c) under the Investment Company Act of 1940, as amended (the “1940 Act”) (17 CFR 270.30a-3(c))) are effective, as of a date within 90 days of the filing date of the report that includes the disclosure required by this paragraph, based on their evaluation of these controls and procedures required by Rule 30a-3(b) under the 1940 Act (17 CFR 270.30a-3(b)) and Rules 13a-15(b) or 15d-15(b) under the Securities Exchange Act of 1934, as amended (17 CFR 240.13a-15(b) or 240.15d-15(b)). |
| (b) | There were no changes in the registrant’s internal control over financial reporting (as defined in Rule 30a-3(d) under the 1940 Act (17 CFR 270.30a-3(d))) that occurred during the period covered by this report that has materially affected, or is reasonably likely to materially affect, the registrant’s internal control over financial reporting. |
Item 12. Disclosure of Securities Lending Activities for Closed-End Management Investment Companies.
Not applicable.
Item 13. Exhibits.
| (a)(1) | Code of ethics, and any amendment thereto, that is the subject of disclosure required by Item 2 is attached hereto. |
| (a)(2) | Certifications pursuant to Rule 30a-2(a) under the 1940 Act and Section 302 of the Sarbanes-Oxley Act of 2002 are attached hereto. |
| (a)(2)(1) | Not applicable. |
| (a)(2)(2) | Not applicable. |
| (b) | Certifications pursuant to Rule 30a-2(b) under the 1940 Act and Section 906 of the Sarbanes-Oxley Act of 2002 are attached hereto. |
SIGNATURES
Pursuant to the requirements of the Securities Exchange Act of 1934 and the Investment Company Act of 1940, the registrant has duly caused this report to be signed on its behalf by the undersigned, thereunto duly authorized.
| (Registrant) | Touchstone ETF Trust |
| By (Signature and Title)* | /s/ E. Blake Moore Jr. | |
| E. Blake Moore Jr., President | ||
| (principal executive officer) | ||
| Date | March 3, 2023 |
Pursuant to the requirements of the Securities Exchange Act of 1934 and the Investment Company Act of 1940, this report has been signed below by the following persons on behalf of the registrant and in the capacities and on the dates indicated.
| By (Signature and Title)* | /s/ E. Blake Moore Jr. | |
| E. Blake Moore Jr., President | ||
| (principal executive officer) | ||
| Date | March 3, 2023 |
| By (Signature and Title)* | /s/ Terrie A. Wiedenheft | |
| Terrie A. Wiedenheft, Controller and Treasurer | ||
| (principal financial officer) | ||
| Date | March 3, 2023 |
* Print the name and title of each signing officer under his or her signature.