Exhibit 99.2
2022 FULL - YEAR RESULTS April 20, 2023 LANVIN GROUP LANVIN WOLFORD Sergio rOSSI ST. JOHN CARUSO
Forward-Looking Statements This presentation, including the sections “Overview of 2022 Achievements”, “2023 Guidance”, “Solid Brand-Level Performance” and “Appendix”, contain “forward-looking statements” within the meaning of the “safe harbor” provisions of the Private Securities Litigation Reform Act of 1995. Forward-looking statements generally are accompanied by words such as “believe,” “may,” “will,” “estimate,” “continue,” “anticipate,” “intend,” “expect,” “should,” “would,” “plan,” “predict,” “potential,” “seem,” “seek,” “future,” “outlook,” “guidance,” “project” and similar expressions that predict or indicate future events or trends or that are not statements of historical matters. These forward-looking statements include, but are not limited to, statements regarding estimates and forecasts of other financial and performance metrics and projections of market opportunity. These statements are based on various assumptions, whether or not identified in this presentation, and on the current expectations of the respective management of Lanvin Group and are not predictions of actual performance. These forward-looking statements are provided for illustrative purposes only and must not be relied on by an investor as, a guarantee, an assurance, a prediction or a definitive statement of fact or probability. Actual events and circumstances are difficult or impossible to predict and will differ from assumptions. Many actual events and circumstances are beyond the control of Lanvin Group. Potential risks and uncertainties that could cause the actual results to differ materially from those expressed or implied by forward-looking statements include, but are not limited to, changes adversely affecting the business in which Lanvin Group is engaged; Lanvin Group’s projected financial information, anticipated growth rate, profitability and market opportunity may not be an indication of its actual results or future results; management of growth; the impact of COVID-19 or similar public health crises on Lanvin Group’s business; Lanvin Group’s ability to safeguard the value, recognition and reputation of its brands and to identify and respond to new and changing customer preferences; the ability and desire of consumers to shop; Lanvin Group’s ability to successfully implement its business strategies and plans; Lanvin Group’s ability to effectively manage its advertising and marketing expenses and achieve desired impact; its ability to accurately forecast consumer demand; high levels of competition in the personal luxury products market; disruptions to Lanvin Group’s distribution facilities or its distribution partners; Lanvin Group’s ability to negotiate, maintain or renew its license agreements; Lanvin Group’s ability to protect its intellectual property rights; Lanvin Group’s ability to attract and retain qualified employees and preserve craftmanship skills; Lanvin Group’s ability to develop and maintain effective internal controls; general economic conditions; the result of future financing efforts; and those factors discussed in the reports filed by Lanvin Group from time to time with the SEC. If any of these risks materialize or Lanvin Group’s assumptions prove incorrect, actual results could differ materially from the results implied by these forward-looking statements. There may be additional risks that Lanvin Group presently does not know, or that Lanvin Group currently believes are immaterial, that could also cause actual results to differ from those contained in the forward-looking statements. In addition, forward-looking statements reflect Lanvin Group’s expectations, plans, or forecasts of future events and views as of the date of this presentation. Lanvin Group anticipates that subsequent events and developments will cause Lanvin Group’s assessments to change. However, while Lanvin Group may elect to update these forward-looking statements at some point in the future, Lanvin Group specifically disclaim any obligation to do so. These forward-looking statements should not be relied upon as representing Lanvin Group’s assessments of any date subsequent to the date of this presentation. Accordingly, reliance should not be placed upon the forward-looking statements. Use of Non-IFRS Financial Metrics This presentation includes certain non-IFRS financial measures (including on a forward-looking basis) such as contribution profit, contribution margin, adjusted earnings before interest and taxes (“Adjusted EBIT”), and adjusted earnings before interest, taxes, depreciation and amortization (“Adjusted EBITDA” and trade working capital). These non-IFRS measures are an addition, and not a substitute for or superior to measures of financial performance prepared in accordance with IFRS and should not be considered as an alternative to net income, operating income or any other performance measures derived in accordance with IFRS. Reconciliations of non-IFRS measures to their most directly comparable IFRS counterparts are included in the Appendix to this presentation. Lanvin Group believes that these non- IFRS measures of financial results (including on a forward-looking basis) provide useful supplemental information to investors about Lanvin Group. Lanvin Group’s management uses forward looking non-IFRS measures to evaluate Lanvin Group’s projected financial and operating performance. Lanvin Group believes that the use of these non-IFRS financial measures provides an additional tool for investors to use in evaluating projected operating results and trends in and in comparing Lanvin Group’s financial measures with other similar companies, many of which present similar non-IFRS financial measures to investors. However, there are a number of limitations related to the use of these non-IFRS measures and their nearest IFRS equivalents. For example, other companies may calculate non-IFRS measures differently, or may use other measures to calculate their financial performance, and therefore Lanvin Group’s non-IFRS measures may not be directly comparable to similarly titled measures of other companies. Lanvin Group does not consider these non-IFRS measures in isolation or as an alternative to financial measures determined in accordance with IFRS. The principal limitation of these non-IFRS financial measures is that they exclude significant expenses, income and tax liabilities that are required by IFRS to be recorded in Lanvin Group’s financial statements. In addition, they are subject to inherent limitations as they reflect the exercise of judgements by Lanvin Group about which expense and income are excluded or included in determining these non-IFRS financial measures. In order to compensate for these limitations, Lanvin Group presents non-IFRS financial measures in connection with IFRS results. 2
BUILDING THE NEWLUXURY
TABLE OF CONTENTS PAGE 5 GROUP CONSOLIDATED FINANCIAL RESULTS PAGE 25 SOLID BRAND-LEVEL PERFORMANCE PAGE 15 AUNIQUE GLOBAL LUXURY PLATFORM 4
OVERVIEW OF 2022 ACHIEVMENTS 01 RECORD SALES WITH 37% YOY GROWTH 02 ENHANCED CHANNEL CAPABILITIES 03 BALANCED REGIONAL DEVELOPMENT 04 IMPROVED OPERATIONAL EFFICIENCY 05 FOCUSED BRAND STRATEGIES 06 SOLIDIFIED CATEGORY EXPANSION
LANVIN GROUP"S NUMBERS AT A GLANCE 2022 Global Revenue €422MM 2022 DTC Revenue Growth +32% 2022 EMEA Revenue Growth +39% 2022 vs. 2021 Gross Margin Change +133BPS 2022 Global Revenue +37% 2022 Wholesale Revenue Growth +41% 2022 North America +36% 2022 vs. 2021 Contribution Profit%(1) Change +170bps 2020-2022 Global Revenue CAGR +38% 2022 e-Commerce Revenue Growth +28%2022 Greater China Revenue Growth +15% 2022 vs. 2021 Adj. EBITDA%(1) Change +205bps (1) These are Non-IFRS Financial Measures and will be mentioned throughout this presentation. Please see Page 54 for Non-IFRS Financial Measures and definition. 6
EVERY BRAND DELIVERED GROWTH FLAGSHIP BRAND LANVIN POWERING MOMENTUM WITH 64% YOY GROWTH Revenue Growth Bridge by Brand 2020-2022 (€ in mm) €223 €309 €47 €16 €33 €13 €6 -€2 €422 2020 2021 LANVIN Wolford SergIo rOSSI ST. JOHN CARUSQ Eliminations 2022 7
BALANCED DEVELOPMENT ACROSS REGIOSNS GREATER CHINA GREW BY 15% DESPITE NEGATIVE COVID IMPACT, DEMONSTRATING BRAND RESILIENCE FY2022 Revenue Growth by Region (€ in mm) FY2022 Revenue Breakdown by Region (%) €309 €58 €39 €6 €11 €422 Other(1) +95% Greater China +15% EMEA +39% North America +36% 5% 49% 34% 12% 2022 2021 EMEA North America Greater China Other(1) 2022 (1) Other includes: Japan, South Korea, Thailand, Malaysia, Vietnam, Indonesia, Philippines, Australia, New Zealand, India and other Southeast Asian countries. 8
ALL CHANNELS GREW BY DOUBLE DIGITS DRIVEN BY THE GROUP’S SUCCESSFUL GLOBAL OMNI-CHANNEL STRATEGIES FY22 Revenue Growth by Channel (€ in mm) Revenue Breakdown by Channel €309 €61 €48 €5 €422 2021 DTC Wholesale Other(1) 2022 Other(1) +88% Wholesale +41% DTC+32% 59% 39% 2% (1) Other includes: fees for royalties, licenses received from third party, and clearance. 9
CNSTANT MARGIN IMPROVEMENT YEAR-OVER-YEAR IMPROVEMENT IN THE GROUP’S GROSS PROFIT, CONTRIBUTION PROFIT AND ADJUSTED EBITDA MARGINS Lanvin Group Gross Profit (€ in mm) Lanvin Group Contribution Profit (1) (€ in mm) Lanvin Group Adjusted EBITDA(1) (€ in mm) GP% 53% 55% 56% CP% -15% 1% 3% Adj. EBITDA% -40% -19% -17% €117 €170 €238 FY2020 FY2021 FY2022 FY2020-€34 €4FY2021 €13 FY2022 FY2020-€88 FY2021-€59 FY2022 €72 (1) These are Non-IFRS Financial Measures and will be mentioned throughout this presentation. Please see Page 54 for Non-IFRS Financial Measures and definition. 10
CONTRIBUTION PROFIT BY BRAND Contribution Profit(1) Bridge by Brand 2021-2022(€ in mm) €4 -€15 €9 €9 €3 €2 €1 €13 2021 Wolford ST. JOHN LANVIN Sergio rOSSI CARUSO HQ and Eliminations 2022 (1) Non-IFRS Financial Measure. Please see Page 54 for Non-IFRS Financial Measures and definition. Note: HQ and eliminations are not allocated by brand and result mainly from intragroup transactions. Brand-level results are presented exclusive of eliminations. 11
CONTINUOUS STORE NETWORK OPTIMIZATION ONGOING UPGRADE OF STORE NETWORK, WITH DISCIPLINED NEW OPENINGS AND CLOSURES OF UNDERPERFORMING LOCATIONS Lanvin Group DOS Evolution by Brand Selected 2022 Newly Opened Boutiques 293 12 15 7 13 -49 291 FY 2021 LANVIN Wolford ST sergio rossi Total Closures FY 2022 Lanvin - Tokyo Ginza Sergio Rossi - Milan Spiga 26 Lanvin Group DOS Evolution by Region 293 7 15 23 2 -49 291 FY EMEA North America Greater China Othe Asia Total Clouseres FY 2022 St. John - Dallas NorthPark Sergio Rossi - Chengdu SKP Note: DOS as of 31st December 2022 and 2021 and refers to Directly Operated Stores which include shop-in-shop, retail, outlet & pop-up stores. 12
IMPEROVED WORKING CAPITAL EFFICIENCY Trade Working Capital(1) 2020-2022(€in mm) €85 €74 €51 €109 €92 €76 €40 €49 €22 Trade payables Inventories -€47 -€58 -€73 Trade receivables 2020 2021 2022 Cash Conversion Cycle(1) 134 123 113 % of Revenues 23% 22% 20% DSO(1) 36 43 42 DIO(1) 263 216 216 DPO(1) 165 136 145 (1) Non-IFRS Financial Measure. Please see Page 54 for Non-IFRS Financial Measures and definition. Trade working capital is defined as the sum of inventories as well as trade receivables less trade payables. DSO (Days Sales Outstanding)=Trade receivables/Total sales x 365; DIO (Days Inventory Outstanding)=Inventory/Cost of sales x 365; DPO (Days Payable Outstanding)=Trade payables/Cost of sales x 365; Cash Conversion Cycle =DSO+DIO-DPO 13
2023 GUIDANCE ANOTHER YEAR OF TOPLINE GROWTH AND MARGIN IMPROVEMENT 01 Momentum to continue in 2023 with China growth driving positive results; but global macro issues will persist 02 Topline growth driven by continued retail network optimization and expansion, digitalization, targeted branding and customer engagement, as well as strategic category expansion 03 Ongoing margin improvement through focused brand strategies and increasing operational efficiency; on track for EBITDA breakeven in 2024 04 Potential new investment and acquisition opportunities to further complete brand ecosystem and generate synergies
OUR UNIQUE GLOBAL PLATFORM HAS FURTHER PROVED ITS COMPETITIVE ADVANTAGE TO DELIVER GROWTH.
… LANVIN GROUP’S BRANDS WORK TOGETHER TO BUILD A WARDROBE OF MODERN, GENERATIONAL LUXURY FOR ITS CONSUMERS BY SYNERGIZING EACH BRANDS’ IDEAS AND CORE SKILLS IN DESIGN AND PRODUCTION SINCE SINCE 2022 Revenues –€86 million 2022 Revenues – €120 million % of Group Revenues – 20% % of Group Revenues – 28% A Foundation of American The Oldest Operating Luxury; Building Wardrobes French Couture House with Timeless yet Contemporary Style SINCE SINCE SINCE 2022 Revenues –€126 million 2022 Revenues – €31 million % of Group Revenues – 30% % of Group Revenues – 7% 2022 Revenues –€62 million Iconic Skinwear % of Group Revenues – 15% The Reference Luxury Brand Originated from Tailoring Manufacturer in Austria that Combines A Forerunner in Design; Manufacturing Italy, Combining Traditional Luxury, Technology, and Shoes and Accessories with Provocative, Skills with Innovation in Premier Manufacturing Modern Sophistication from Italy Shapes and Material Note: Revenue eliminations are not allocated by brand and result mainly from intragroup transactions. Brand-level results are presented exclusive of eliminations. 16
… KEY STRATEGIES AND INITIATIVES IN BRAND, PRODUCT, CHANNEL AND REGION DROVE RECORD GROWTH IN 2022 • Back to brand DNA and ethos • Continued investment in branding • Increased accessory contribution • All regions experienced growth • Strong growth in e-Commerce • Focus on core iconic offerings • Targeted brand collaborations • Successful category extension • Ongoing store network upgrade • Digital infrastructure implementation 17
… LANVIN GROUP IS THE FIRST AND ONLY GLOBAL LUXURY GROUP HEADQUARTERED IN CHINA WITH UNPARALLELED ACCESS TO THE LARGEST AND FASTEST GROWING LUXURY MARKET IN THE WORLD MARKET CAP Source: Market Cap as of April 12 2023, Capital IQ. 18
… … SMALL SIZE AND UNDERPENETRATED STORE FOOTPRINT PROVIDE SIGNIFICANT ROOM FOR GROWTH Luxury Peer Group DOS Luxury Peer Group DOS Luxury Peer Group DOS Lanvin Group DOS Lanvin Group DOS Lanvin Group DOS Lanvin Group DOS Note: DOS as of 31st December 2022. Includes shop-in-shop, retail, outlet & pop-up stores. 19
… HIGHLY ATTRACTIVE AND RESILIENT PERSONAL LUXURY GOODS MARKET, WITH CHINA BEING THE MAIN GROWTH DRIVER Global Personal Luxury Goods Market Size (€bn) Luxury Goods Spending Breakdown by Nationalities of Customers (€bn) Performance of Luxury Personal Goods vs Other Luxury Segments (Market Size Rebound % Index from 2017) €353 €540~580 €540-580 160% 140% 120% 60~62% €353 RoW 100% 81~83% €281 €290 80% €244 €220 60% €150 40% 38~40% €76 20% Chinese 2017 2018 2019 2020 2021 2022 2023 2024 2025 2026 2027 17~19% // Luxury Foodservice Luxury Hotels 1996 2006 2016 2019 2020 2021E 2022E 2030F 2022E 2030F Personal Luxury Travel Source: Bain – Renaissance in Uncertainty: Luxury Builds on Its Covid Rebound. Euromonitor. 20
SMALL SIXE AND START-UP MODE... NIMBLE APPROACH DIGITAL MIND-SET START-UP VALUE UNICORN TRACKRECORD 21
… TO QUICKLY SEIZE LOW-HANGING FRUIT UNICORN TRACKRECORD OF GROWTH ACHIEVED IN THE PAST THREE YEARS Lanvin 2020 – 2022 Lanvin 2020 – 2022 Wolford 2020 – 2022 Global Revenue Global Digital Revenue The % of W Collection in Seasonal Sales Lanvin Group 2020 – 2022 Lanvin Group 2020 – 2022 Lanvin Group 2020 – 2022 Global Revenue Global Digital Revenue Greater China Revenue 22
A CLEAR ROADMAP TO PROFIT ABILITY IDENTIFIED GROWTH DRIVERS ACROSS ALL BRANDS TO INCREASE SCALE Enhance On-brand Increase Post-COVID brand appeal category extensions brand footprint growth opportunities through innovative to seize opportunities and in underpenetrated from return of global travel marketing initiatives and create new regions and expand and increased consumer targeted story-telling volume drivers DTC channels confidence 23
A CLEAR ROADMAP TO PROFITABILITY (CONT’D) IDENTIFIED MARGIN DRIVERS ALONG WITH INCREASED SCALE TO TARGET EBITDA BREAKEVEN IN 2024 EBITDA Breakeven in 2024 Better controlled G&A EBITDA BREAKEVEN with established middle/back office and Absorption of selling and IT infrastructure Increased revenue scale marketing expenses with increased sales Reduce discounts and improved Improved towards full price gross margin channel efficiencies 2022 strategy and sharpen Adjusted product offering focus to Absorption of EBITDA core and less seasonal selling & marketing Lower production cost with categories expenses economies of scale and supply chain efficiencies Better HQ efficiency -17% GROSS MARGIN OPERATING EXPENSES 24
SOLID BRAND – LEVEL PERFORMANCE LAVIN GROUP
LANVIN
LANVIN 2022 RESULTS AND 2023 GUIDANCE Lanvin Global Revenue Bridge (€ in Thousands) €3,836 €119,847 €30,737 KEY HIGHLIGHTS €12,402 €72,872 • Revenue grew 64% from €73mm in 2021 to €120mm in 2022 €34,989 • Strong wholesale demand among global luxury retailers and specialty stores, notably for accessories 2020 2021 DTC Wholesale Other 2022 • DTC growth from improved product offerings, client engagement and digital activations • EMEA: 93% growth driven by wholesale Lanvin Key Financials FY2020 FY2021 FY2022 • North America: strong momentum from 2021 led to 79% growth (€ in Thousands) • Greater China: 9% growth despite COVID impact Revenues €34,989 €72,872 €119,847 • Gross profit margin increased from 39% in 2020 to 50% in 2022, from increasing YoY% 108% 64% economies of scale and higher sell-through rates for all categories Gross profit €13,573 €34,028 €60,513 • 2023 growth to be driven by expanding accessory offering, attracting new GP Margin% 39% 47% 50% consumer demographics, and the reopening of China Contribution profit (1) -€29,574 -€24,096 -€15,339 CP Margin% -85% -33% -13% (1) Non-IFRS Financial Measure. Please see Page 54 for Non-IFRS Financial Measures and definition. Note: Brand-level results are presented exclusive of eliminations. 27
2022 KEY STRATEGIES AND ACHIEVEMENTS Back to Brand Ethos Accessories Young Generation Retail Optimization Lanvin returns to elegance and Sneaker and leather goods businesses have Through striking a balance between Net increase of 4 new stores, including the sophistication, bridging the heritage and driven volume through hit styles, now making sophisticated and casual offerings and brand’s first flagship store in Japan - Ginza; authority of France’s oldest couture house up ~50% of the total business collaborations, Lanvin was able to expand store economics saw strong growth with the energy of contemporary style into younger consumer groups 28
Wolford
WOLFORD 2022 RESULTS AND 2023 GUIDANCE Wolford Global Revenue Bridge (€ in Thousands) €15,786 €680 €125,514 -€284 €109,332 KEY HIGHLIGHTS €95,384 • Revenue grew 15% from €109mm in 2021 to €126mm in 2022 • 44% growth in North America, driven by DTC channel as per brand strategy 2020 2021 DTC Wholesale Other 2022 • Impactful collaborations including GCDS, ALBERTA FERRETTI, MUGLER and Sergio Rossi created brand heat Wolford Key Financials FY2020 FY2021 FY2022 (€ in Thousands) • Refocused on core products while strengthening luxury athleisure line which became a key growth driver Revenues €95,384 €109,332 €125,514 • Increased selling and marketing expenses in 2022 related to legacy consulting YoY% 15% 15% costs and a cyberattack at a logistics provider delaying shipments led to a lower contribution profit Gross profit €65,865 €79,070 €86,228 be GP Margin% 69% 72% 69% • 2023 will an opportunity for continued fiscal and operational improvements and reinforcement of current product and branding strategies Contribution profit (1) €859 €19,719 €4,327 CP Margin% 1% 18% 3% (1) Non-IFRS Financial Measure. Please see Page 54 for Non-IFRS Financial Measures and definition. Note: Brand-level results are presented exclusive of eliminations. 30
2022 KEY STRATEGIES AND ACHIEVEMENTS Focus on the Icons Collaborations Atheisure Omni-Channel Refocused on core iconic classics for a W Lab: targeted collaborations GCDS, The W: Leveraging Wolford’s unique Flagship stores opened in Paris, New York clearer brand statement, more defined ALBERTA FERRETTI, MUGLER and know-how in creating the best skinwear, and Shanghai; continued to optimize product offering, and better supply chain Sergio Rossi generated constant athleisure is becoming a major growth digital and store network to increase management excitement for the brand driver for the brand channel efficiency 31
sergio rossi
SERGIO ROSSI 2022 RESULTS AND 2023 GUIDANCE Sergio Rossi Revenue Bridge (€ in Thousands) €59.206 €2,999 NM €61,929 -€276 KEY HIGHLIGHTS €28,737 • Acquired and integrated by the Group in July 2021; revenue grew 5% from €59mm (Pro Forma) in 2021 to €62mm in 2022 2021A 2021PF DTC Wholesale Other 2022 • DTC growth driven by strong performance of retail stores in Japan and digital sales in China • Strong results in EMEA, offset weakness in China from COVID-19 • Optimized product mix balancing carry-over and seasonal collections Sergio Rossi Key Financials FY2021 FY2022 (€ in Thousands) • Gross profit margin rose to 50% from increased DTC business, while higher marketing, personnel and rental expenses led to a lower contribution profit Revenues €28,737 €61,929 margin YoY% 116% • 2023 growth driven by new product launches and collaborations, recovery of Greater China, and continued improvement in DTC channel Gross profit €13,319 €31,048 GP Margin% 46% 50% Contribution profit (1) €3,830 €6,546 CP Margin% 13% 11% (1) Non-IFRS Financial Measure. Please see Page 54 for Non-IFRS Financial Measures and definition. Note: Brand-level results are presented exclusive of eliminations. Note: Lanvin Group acquired a majority stake in Sergio Rossi in July 2021 and Sergio Rossi was consolidated in Lanvin Group’s consolidated revenue starting from the acquisition date; audited 2021 revenue of the brand was €29 million. Pro Forma results assume Sergio Rossi’s revenue results for the full-year 2021. 33
2022 KEY STRATEGIES AND ACHIEVEMENTA Product Rationalization Brand Awareness Collaborations Regional Development Solidified the brand’s expertise and core Fashion capsules with the brand’s new Targeted collaborations with Sergio Rossi Fostered presence mostly in China and offerings of classic women’s shoes, Artistic Director generated hype and and others created constant brand buzz EMEA, cemented leading position in Japan, cementing its positioning as a leading coolness; new product lines (SI ROSSI) and attracted new traffic to the stores and reentered US market through e-Italian luxury shoemaker able to attract younger demographic website Commerce platform 34
ST. JOHN
ST.JHON 2022 RESULTS AND 2023 GUIDANCE €14,381 €395 €85,884 -€2,436 €73,094 KEY HIGHLIGHTS €66,512 • Revenue grew 17% from €73mm in 2021 to €86mm in 2022 • 29% growth in DTC channel benefiting from refocusing on core North American market, and targeted client and store network optimization • Successful implementation of full price strategy drove gross margin increase of St. John Key Financials FY2020 FY2021 FY2022 800bps; healthier mix of full price sales combined with better expense control (€ in Thousands) contributed to higher contribution profit margin Successfully launched mix-and-match seasonless product offering worn for Revenues €66,512 €73,094 €85,884 2020 2021 DTC Whlesale other 2022 • everyday and occasions YoY% 10% 17% • In 2023, continue growth trajectory and road to profitability with marketing Gross profit €32,987 €38,987 €52,642 initiatives, optimizing the retail experience, continuing transformation into lifestyle GP Margin% 50% 53% 61% brand, and completing manufacturing rationalization Contribution profit (1) -€9,286 €1,290 €10,144 CP Margin% -14% 2% 12% (1) Non-IFRS Financial Measure. Please see Page 54 for Non-IFRS Financial Measures and definition. Note: Brand-level results are presented exclusive of eliminations. 36
2022 KEY STRATEGIES AND ACHIEVMENTS Return to the Brand The FOUNDATION Client Engagement Margin Improvement At its 60th anniversary, St. John refocused Launched the Foundation Collection that’s Active store upgrade/relocation and retail Successful full price strategy both online and its products, clients and market, as an iconic comprised of building blocks of thoughtful and digital activations resulted in large offline led to better brand image and an 8% American luxury house founded on the anchor pieces that define looks for work, improvements in CRM and conversion gross margin increase premise of a simple, elegant and versatile social gatherings, and everyday life knit dress 37
CARUSO
€6,124 €30,819 NM €26,351 €24,695 NM KEY HIGHLIGHTS • Revenue grew 25% from €25mm in 2021 to €31mm in 2022 • Strong growth from proprietary brand business with attractive price and style positioning • B2B Maisons manufacturing business growth driven by new account acquisitions and made-to-measure production growth; built significant customer loyalty Caruso Key Financials • Gross margin increased from 18% to 23%, and contribution profit margin FY2020 FY2021 FY2022 (€ in Thousands) increased from 13% to 18% from 2021 to 2022, respectively, due to economies of scale and better management of factory labor costs and selling and marketing expenses Revenues €26,351 €24,695 €30,819 YoY% -6% 25% • 2023 to grow from focused investments in capacity expansion and increased operating efficiency, paired with concentrating client and product portfolio Gross profit €4,881 €4,449 €7,147 • Caruso will continue to benefit from the “back to elegance” trend that’s gaining momentum GP Margin% 19% 18% 23% Contribution profit (1) €3,173 €3,305 €5,701 CP Margin% 12% 13% 18% (1) Non-IFRS Financial Measure. Please see Page 54 for Non-IFRS Financial Measures and definition. Note: Brand-level results are presented exclusive of eliminations. 39
2022 KEY STRATEGIES ABD ACHIEVEMENTS Back to Elegance The ‘back-to-elegance’ trend has benefited both the B2B Maisons manufacturing business as well as Caruso brand business Caruso Brand Clear style positioning (luxurious Playful Elegance), defined collections and new e-Commerce touch point drove strong growth for the brand New OEM Clients B2B Maisons business increased solidly with new account acquisitions; diversifying customer concentration risk and building loyalty Production Efficiency Improved production efficiency and better economies of scale led to a 5% increase in gross margin 40
APPENDIX LANVIN GROUP
(€ in Thousands, unless otherwise noted) 2020A 2021A 2022A Lanvin Group Consolidated P&L FY % FY % FY % Revenue 222,612 100% 308,822 100% 422,312 100% Cost of sales -105,218 -47% -138,920 -45% -184,368 -44% Gross profit 117,394 53% 169,902 55% 237,944 56% Marketing and selling expenses -151,631 -68% -165,502 -54% -224,733 -53% General and administrative expenses -115,181 -52% -122,497 -40% -153,138 -36% Other operating income and expenses -18,399 -8% 10,083 3% -2,340 -1% Loss from operations before non-underlying items -167,817 -75% -108,014 -35% -142,267 -34% Non-underlying items(1) 43,546 20% 45,206 15% -83,057 -20% Loss from operations -124,271 -56% -62,808 -20% -225,324 -53% Finance cost – net -12,989 -6% -9,313 -3% -14,556 -3% Loss before income tax -137,260 -62% -72,121 -23% -239,880 -57% Income tax benefits / (expenses) 1,603 1% -4,331 -1% 129 0% Loss for the year -135,657 -61% -76,452 -25% -239,751 -57% Contribution profit (2) -34,237 -15% 4,400 1% 13,211 3% Adjusted EBIT (2) -162,428 -73% -100,806 -33% -134,836 -32% Adjusted EBITDA(2) -88,116 -40% -58,945 -19% -71,958 -17% (1) 2022 was impacted by a €84 million cost related to the Reverse Recapitalization that occurred as part of the SPAC merger; this cost is non-recurring in nature. (2) These are Non-IFRS Financial Measures and will be mentioned throughout this presentation. Please see Page 54 for Non-IFRS Financial Measures and definition. 42
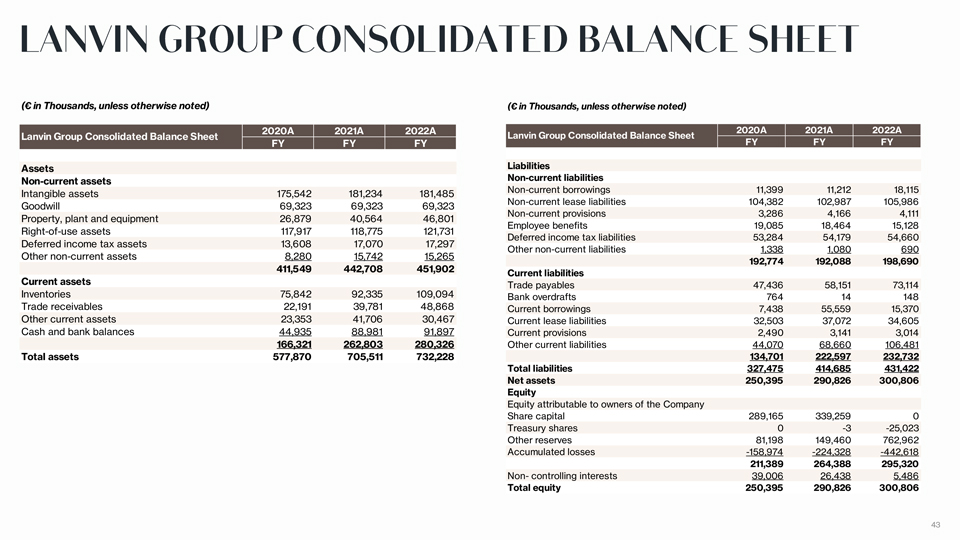
(€ in Thousands, unless otherwise noted) (€ in Thousands, unless otherwise noted) 2020A 2021A 2022A 2020A 2021A 2022A Lanvin Group Consolidated Balance Sheet Lanvin Group Consolidated Balance Sheet FY FY FY FY FY FY Assets Liabilities Non-current assets Non-current liabilities Intangible assets 175,542 181,234 181,485 Non-current borrowings 11,399 11,212 18,115 Goodwill 69,323 69,323 69,323 Non-current lease liabilities 104,382 102,987 105,986 Non-current provisions 3,286 4,166 4,111 Property, plant and equipment 26,879 40,564 46,801 Employee benefits 19,085 18,464 15,128 Right-of-use assets 117,917 118,775 121,731 Deferred income tax liabilities 53,284 54,179 54,660 Deferred income tax assets 13,608 17,070 17,297 Other non-current liabilities 1,338 1,080 690 Other non-current assets 8,280 15,742 15,265 192,774 192,088 198,690 411,549 442,708 451,902 Current liabilities Current assets Trade payables 47,436 58,151 73,114 Inventories 75,842 92,335 109,094 Bank overdrafts 764 14 148 Trade receivables 22,191 39,781 48,868 Current borrowings 7,438 55,559 15,370 Other current assets 23,353 41,706 30,467 Current lease liabilities 32,503 37,072 34,605 Cash and bank balances 44,935 88,981 91,897 Current provisions 2,490 3,141 3,014 166,321 262,803 280,326 Other current liabilities 44,070 68,660 106,481 Total assets 577,870 705,511 732,228 134,701 222,597 232,732 Total liabilities 327,475 414,685 431,422 Net assets 250,395 290,826 300,806 Equity Equity attributable to owners of the Company Share capital 289,165 339,259 0 Treasury shares 0 -3 -25,023 Other reserves 81,198 149,460 762,962 Accumulated losses -158,974 -224,328 -442,618 211,389 264,388 295,320 Non- controlling interests 39,006 26,438 5,486 Total equity 250,395 290,826 300,806 43
(€ in Thousands, unless otherwise noted) 2020A 2021A 2022A Lanvin Group Consolidated Cash Flow FY FY FY Net cash used in operating activities -87,297 -73,088 -80,851 Net cash flows from/(used in) investing activities 67,038 6,346 -21,799 Net cash flows generated from financing activities -41,447 110,065 104,937 Net increase/(decrease) in cash and cash equivalents -61,706 43,323 2,287 Cash and cash equivalents less bank overdrafts at the beginning of the year 106,642 44,171 88,658 Effect of foreign exchange rate changes -765 1,164 804 Cash and cash equivalents less bank overdrafts at end of the year 44,171 88,658 91,749 44
LANVIN BRAND KEY FINANCIALS (€ in Thousands, unless otherwise noted) 2020A 2021A 2022A 2021A v 2022A v 20-22 Lanvin Brand Key Financials FY % FY % FY % 2020A 2021A CAGR Key Financials on P&L Revenues 34,989 100% 72,872 100% 119,847 100% 108% 64% 85% Gross profit 13,573 39% 34,028 47% 60,513 50% Selling and distribution expenses -43,147 -123% -58,124 -80% -75,852 -63% Contribution profit(1) -29,574 -85% -24,096 -33% -15,339 -13% Revenues by Geography EMEA 18,501 53% 31,683 43% 61,092 51% 71% 93% 82% North America 4,525 13% 15,964 22% 28,524 24% 253% 79% 151% Greater China 10,054 29% 23,541 32% 25,742 21% 134% 9% 60% Other 1,909 5% 1,684 2% 4,489 4% -12% 167% 53% Revenues by Channel DTC 16,959 48% 46,134 63% 58,536 49% 172% 27% 86% Wholesale 12,974 37% 21,161 29% 51,898 43% 63% 145% 100% Other 5,056 14% 5,577 8% 9,413 8% 10% 69% 36% (1) Non-IFRS Financial Measure. Please see Page 54 for Non-IFRS Financial Measures and definition. Note: Brand-level results are presented exclusive of eliminations. 45
WOLFORD BRAND KEY FINANCIALS (€ in Thousands, unless otherwise noted) 2020A 2021A 2022A 2021A v 2022A v 20-22 Wolford Brand Key Financials FY % FY % FY % 2020A 2021A CAGR Key Financials on P&L Revenues 95,384 100% 109,332 100% 125,514 100% 15% 15% 15% Gross profit 65,865 69% 79,070 72% 86,228 69% Selling and distribution expenses -65,006 -68% -59,351 -54% -81,901 -65% Contribution profit(1) 859 1% 19,719 18% 4,327 3% Revenues by Geography EMEA 73,794 77% 79,236 72% 86,501 69% 7% 9% 8% North America 16,367 17% 21,824 20% 31,535 25% 33% 44% 39% Greater China 4,867 5% 7,289 7% 6,791 5% 50% -7% 18% Other 356 0% 983 1% 687 1% 176% -30% 39% Revenues by Channel DTC 62,323 65% 74,622 68% 90,408 72% 20% 21% 20% Wholesale 33,061 35% 34,710 32% 34,426 27% 5% -1% 2% Other 0 0% 0 0% 680 1% (1) Non-IFRS Financial Measure. Please see Page 54 for Non-IFRS Financial Measures and definition. Note: Brand-level results are presented exclusive of eliminations. 46
SERGIO ROSSI BRAND KEY FINANCIALS (€ in Thousands, unless otherwise noted) 2021PF 2021A 2022A 2022A v 2022A v Sergio Rossi Brand Key Financials FY % FY % FY % 2021PF 2021A Key Financials on P&L Revenues 59,206 100% 28,737 100% 61,929 100% 5% 116% Gross profit 13,319 46% 31,048 50% Selling and distribution expenses -9,489 -33% -24,502 -40% Contribution profit(1) 3,830 13% 6,546 11% Revenues by Geography EMEA 33,435 56% 17,009 59% 35,023 57% 5% 106% North America 1,290 2% 107 0% 1,181 2% -8% 1004% Greater China 11,331 19% 4,595 16% 10,809 17% -5% 135% Other 13,150 22% 7,027 24% 14,916 24% 13% 112% Revenues by Channel DTC 28,911 49% 14,349 50% 31,910 52% 10% 122% Wholesale 30,295 51% 14,389 50% 30,019 48% -1% 109% Other 0 0% 0 0% 0 0% (1) Non-IFRS Financial Measure. Please see Page 54 for Non-IFRS Financial Measures and definition. Note: Brand-level results are presented exclusive of eliminations. 47
ST.JOHN BRAND KEY FINANCIALS (€ in Thousands, unless otherwise noted) 2020A 2021A 2022A 2021A v 2022A v 20-22 St.John Brand Key Financials FY % FY % FY % 2020A 2021A CAGR Key Financials on P&L Revenues 66,512 100% 73,094 100% 85,884 100% 10% 17% 14% Gross profit 32,987 50% 38,987 53% 52,642 61% Selling and distribution expenses -42,273 -64% -37,697 -52% -42,498 -49% Contribution profit(1) -9,286 -14% 1,290 2% 10,144 12% Revenues by Geography EMEA 2,254 3% 779 1% 1,224 1% -65% 57% -26% North America 60,528 91% 65,534 90% 78,774 92% 8% 20% 14% Greater China 2,919 4% 6,467 9% 5,153 6% 122% -20% 33% Other 811 1% 315 0% 733 1% -61% 133% -5% Revenues by Channel DTC 44,778 67% 51,581 71% 66,412 77% 15% 29% 22% Wholesale 21,734 33% 21,513 29% 19,077 22% -1% -11% -6% Other 0 0% 0 0% 395 0% (1) Non-IFRS Financial Measure. Please see Page 54 for Non-IFRS Financial Measures and definition. Note: Brand-level results are presented exclusive of eliminations. 48
CARUSO BRAND KEY FINANCIALS (€ in Thousands, unless otherwise noted) 2020A 2021A 2022A 2021A v 2022A v 20-22 Caruso Brand Key Financials FY % FY % FY % 2020A 2021A CAGR Key Financials on P&L Revenues 26,351 100% 24,695 100% 30,819 100% -6% 25% 8% Gross profit 4,881 19% 4,449 18% 7,147 23% Selling and distribution expenses -1,708 -6% -1,144 -5% -1,446 -5% Contribution profit(1) 3,173 12% 3,305 13% 5,701 18% Revenues by Geography EMEA 20,318 77% 19,475 79% 23,050 75% -4% 18% 7% North America 4,252 16% 3,272 13% 5,833 19% -23% 78% 17% Greater China 480 2% 549 2% 559 2% 14% 2% 8% Other 1,301 5% 1,399 6% 1,377 4% 8% -2% 3% Revenues by Channel DTC 0 0% 0 0% 0 0% Wholesale 26,351 100% 24,695 100% 30,819 100% -6% 25% 8% Other 0 0% 0 0% 0 0% (1) Non-IFRS Financial Measure. Please see Page 54 for Non-IFRS Financial Measures and definition. Note: Brand-level results are presented exclusive of eliminations. 49
LANVIN GROUP BRAND FOOTPRINT 2021 2022 Footprint by Brand (1) (2) (1) (2) DOS POS DOS POS Lanvin 27 287 31 339 Wolford 167 227 163 225 St. John 48 133 46 106 Sergio Rossi 50 328 50 346 Caruso 1 144 1 189 Total 293 1,119 291 1,205 (1) DOS refers to Directly Operated Stores which include boutiques, outlets, concession shop-in-shops and pop-up stores. (2) POS refers to Point of Sales which include DOS and wholesale accounts. 50
NON-IFRS FINANCIAL MEASURES (€ in Thousands, unless otherwise noted) 2020A 2021A 2022A Reconciliation of Contribution Margin FY FY FY Revenue 222,612 308,822 422,312 Cost of sales -105,218 -138,920 -184,368 Gross profit 117,394 169,902 237,944 Marketing and selling expenses -151,631 -165,502 -224,733 Contribution profit (1) -34,237 4,400 13,211 (1) Non-IFRS Financial Measure. Please see Page 54 for Non-IFRS Financial Measures and definition. 51
NON-IFRS FINANCIAL MEASURES (€ in Thousands, unless otherwise noted) 2020A 2021A 2022A Reconciliation of Adjusted EBIT FY FY FY Loss for the year -135,657 -76,452 -239,751 Add / (Deduct) the impact of: Income tax benefits / (expenses) -1,603 4,331 -129 Finance cost—net 12,989 9,313 14,556 Non-underlying items(1) -43,546 -45,206 83,057 Loss from operations before non-underlying items -167,817 -108,014 -142,267 Add / (Deduct) the impact of: Share based compensation 5,389 7,208 7,431 Adjusted EBIT(2) -162,428 -100,806 -134,836 (1) 2022 was impacted by a €84 million cost related to the Reverse Recapitalization that occurred as part of the SPAC merger; this cost is non-recurring in nature. (2) These are Non-IFRS Financial Measures and will be mentioned throughout this presentation. Please see Page 54 for Non-IFRS Financial Measures and definition. 52
NON-IFRS FINANCIAL MEASURES (€ in Thousands, unless otherwise noted) 2020A 2021A 2022A Reconciliation of Adjusted EBITDA FY FY FY Loss for the year -135,657 -76,452 -239,751 Add / (Deduct) the impact of: Income tax benefits / (expenses) -1,603 4,331 -129 Finance cost—net 12,989 9,313 14,556 Non-underlying items(1) -43,546 -45,206 83,057 Loss from operations before non-underlying items -167,817 -108,014 -142,267 Add / (Deduct) the impact of: Share based compensation 5,389 7,208 7,431 Provisions and impairment losses 22,676 10,766 16,729 Net foreign exchange (gains) / losses 3,304 -10,489 339 Depreciation / Amortization 48,332 41,584 45,810 Adjusted EBITDA(2) -88,116 -58,945 -71,958 (1) 2022 was impacted by a €84 million cost related to the Reverse Recapitalization that occurred as part of the SPAC merger; this cost is non-recurring in nature. (2) These are Non-IFRS Financial Measures and will be mentioned throughout this presentation. Please see Page 54 for Non-IFRS Financial Measures and definition. 53
NON-IFRS FINANCIAL MEASURES AND DEFINITION Our management monitors and evaluates operating and financial performance using several non-IFRS financial measures including: contribution profit, contribution margin, Adjusted EBIT and Adjusted EBITDA. Our management believes that these non-IFRS financial measures provide useful and relevant information regarding our performance and improve their ability to assess financial performance and financial position. They also provide comparable measures that facilitate management’s ability to identify operational trends, as well as make decisions regarding future spending, resource allocations and other operational decisions. While similar measures are widely used in the industry in which we operate, the financial measures that we use may not be comparable to other similarly named measures used by other companies nor are they intended to be substitutes for measures of financial performance or financial position as prepared in accordance with IFRS. Contribution profit is defined as revenues less the cost of sales and selling and marketing expenses. Contribution profit subtracts the main variable expenses of selling and marketing expenses from gross profit, and our management believes this measure is an important indicator of profitability at the marginal level. Below contribution profit, the main expenses are general administrative expenses and other operating expenses (which include foreign exchange gains or losses and impairment losses). As we continue to improve the management of our portfolio brands, we believe we can achieve greater economy of scale across the different brands by maintaining the fixed expenses at a lower level as a proportion of revenue. We therefore use contribution profit margin as a key indicator of profitability at the group level as well as the portfolio brand level. Contribution margin is defined as contribution profit divided by revenues. Adjusted EBIT is defined as profit or loss before income taxes, net finance cost, share based compensation, adjusted for income and costs which are significant in nature and that management considers not reflective of underlying operational activities, mainly including net gains on disposal of long-term assets, negative goodwill from acquisition of Sergio Rossi, gain on debt restructuring and government grants. Adjusted EBITDA is defined as profit or loss before income taxes, net finance cost, exchange gains/(losses), depreciation, amortization, share based compensation and provisions and impairment losses adjusted for income and costs which are significant in nature and that management considers not reflective of underlying operational activities, mainly including net gains on disposal of long-term assets, negative goodwill from acquisition of Sergio Rossi, gain on debt restructuring and government grants. Trade working capital is defined as the sum of inventories as well as trade receivables less trade payables. 54