Exhibit 99.2 February 2024

Forward-Looking Statements This presentation, including the sections “LANVIN GROUP 2023 PRELIMINARY REVENUES”, “2024 GUIDANCE”, “BRAND-LEVEL 2023 PRELIMINARY REVENUE” and “APPENDIX”, contain “forward-looking statements” within the meaning of the “safe harbor” provisions of the Private Securities Litigation Reform Act of 1995. Forward-looking statements generally are accompanied by words such as “believe,” “may,” “will,” “estimate,” “continue,” “anticipate,” “intend,” “expect,” “should,” “would,” “plan,” “predict,” “potential,” “seem,” “seek,” “future,” “outlook,” “project” and similar expressions that predict or indicate future events or trends or that are not statements of historical matters. These forward-looking statements include, but are not limited to, statements regarding estimates and forecasts of other financial and performance metrics and projections of market opportunity. These statements are based on various assumptions, whether or not identified in this presentation, and on the current expectations of the respective management of Lanvin Group and are not predictions of actual performance. These forward-looking statements are provided for illustrative purposes only and must not be relied on by an investor as, a guarantee, an assurance, a prediction or a definitive statement of fact or probability. Actual events and circumstances are difficult or impossible to predict and will differ from assumptions. Many actual events and circumstances are beyond the control of Lanvin Group. Potential risks and uncertainties that could cause the actual results to differ materially from those expressed or implied by forward-looking statements include, but are not limited to, Lanvin Group’s ability to timely complete its financial closing procedures and finalize its consolidated financial statements for fiscal year 2023; changes adversely affecting the business in which Lanvin Group is engaged; Lanvin Group’s projected financial information, anticipated growth rate, profitability and market opportunity may not be an indication of its actual results or future results; management of growth; the impact of health epidemics, pandemics and similar outbreaks, including the COVID-19 pandemic on Lanvin Group’s business; Lanvin Group’s ability to safeguard the value, recognition and reputation of its brands and to identify and respond to new and changing customer preferences; the ability and desire of consumers to shop; Lanvin Group’s ability to successfully implement its business strategies and plans; Lanvin Group’s ability to effectively manage its advertising and marketing expenses and achieve desired impact; its ability to accurately forecast consumer demand; high levels of competition in the personal luxury products market; disruptions to Lanvin Group’s distribution facilities or its distribution partners; Lanvin Group’s ability to negotiate, maintain or renew its license agreements; Lanvin Group’s ability to protect its intellectual property rights; Lanvin Group’s ability to attract and retain qualified employees and preserve craftmanship skills; Lanvin Group’s ability to develop and maintain effective internal controls; general economic conditions; the result of future financing efforts; and those factors discussed in the reports filed by Lanvin Group from time to time with the SEC. If any of these risks materialize or Lanvin Group’s assumptions prove incorrect, actual results could differ materially from the results implied by these forward-looking statements. There may be additional risks that Lanvin Group presently does not know, or that Lanvin Group currently believes are immaterial, that could also cause actual results to differ from those contained in the forward-looking statements. In addition, forward-looking statements reflect Lanvin Group’s expectations, plans, or forecasts of future events and views as of the date of this presentation. Lanvin Group anticipates that subsequent events and developments will cause Lanvin Group’s assessments to change. However, while Lanvin Group may elect to update these forward-looking statements at some point in the future, Lanvin Group specifically disclaim any obligation to do so. These forward-looking statements should not be relied upon as representing Lanvin Group’s assessments of any date subsequent to the date of this presentation. Accordingly, reliance should not be placed upon the forward-looking statements. Preliminary Revenues Throughout this presentation, FY 2023 and 2023 first/second half-year revenues are preliminary and unaudited. The audit of our financial statements will be finalized at the time of our 2023 consolidated financial statements. These unaudited financial data are not a comprehensive statement of our financial results for the year and the three months ended December 31, 2023 or any period in that year, and should not be viewed as a substitute for our full annual financial statements prepared in accordance with IFRS. These preliminary unaudited financial results are subject to revision in connection with the Lanvin Group’s financial closing procedures, including the review of such financial results by Lanvin Group’s audit committee, and finalization and audit of Lanvin Group’s consolidated financial statements for the year ended December 31, 2023. During the preparation of Lanvin Group’s consolidated financial statements and related notes and the completion of the audit for the year ended December 31, 2023, additional adjustments to the preliminary estimated financial results presented above may be identified. Actual results for the periods reported may differ from these preliminary results. 2

LANVIN GROUP’S BRANDS WORK TOGETHER TO BUILD A WARDROBE OF MODERN, GENERATIONAL LUXURY FOR ITS CONSUMERS BY SYNERGIZING EACH BRAND’S CREATIVITIES AND CORE SKILLS IN DESIGN AND PRODUCTION SINCE SINCE 2023 Revenues – €90 million % of Group Revenues – 21% 2023 Revenues – €112 million % of Group Revenues – 26% A Foundation of American Luxury; Building Wardrobes A Leader in French Haute Couture with a Rich Heritage with Timeless yet Contemporary Style SINCE SINCE SINCE 2023 Revenues – €40 million 2023 Revenues – €127 million % of Group Revenues – 9% % of Group Revenues – 30% 2023 Revenues – €60 million % of Group Revenues – 14% The Reference Luxury Iconic Skinwear Tailoring Manufacturer in Brand that Combines Luxury, A Forerunner in Design; Manufacturing Italy, Combining Traditional Technology, and Premier Shoes and Accessories with Provocative, Skills with Innovation in Manufacturing Modern Sophistication Shapes and Material Source: Company website. Company information. Note: All financial figures are unaudited estimates as of December 31, 2023 and represent each brand’s revenues, net of eliminations. 4
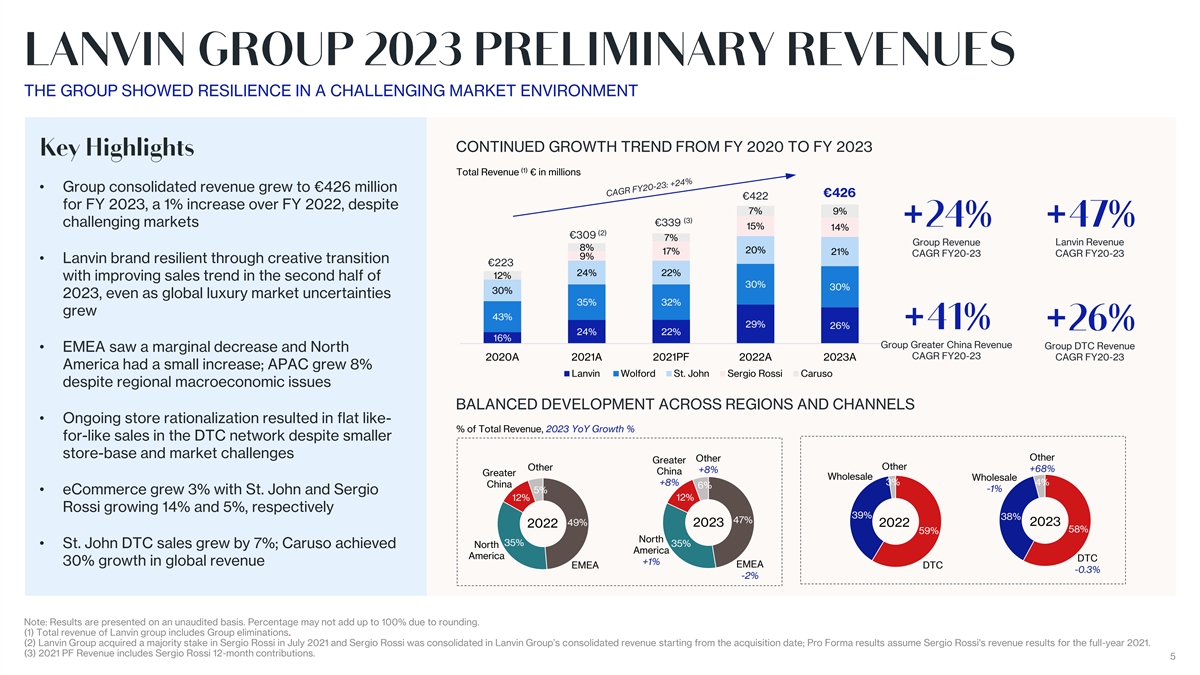
THE GROUP SHOWED RESILIENCE IN A CHALLENGING MARKET ENVIRONMENT CONTINUED GROWTH TREND FROM FY 2020 TO FY 2023 (1) Total Revenue € in millions • Group consolidated revenue grew to €426 million €426 €422 for FY 2023, a 1% increase over FY 2022, despite 7% 9% (3) €339 challenging markets 15% 14% (2) €309 7% Group Revenue Lanvin Revenue 8% 20% 17% 21% CAGR FY20-23 CAGR FY20-23 9% • Lanvin brand resilient through creative transition €223 24% 22% 12% with improving sales trend in the second half of 30% 30% 30% 2023, even as global luxury market uncertainties 35% 32% grew 43% 29% 26% 24% 22% 16% Group Greater China Revenue Group DTC Revenue • EMEA saw a marginal decrease and North CAGR FY20-23 2020A 2021A 2021PF 2022A 2023A CAGR FY20-23 America had a small increase; APAC grew 8% Lanvin Wolford St. John Sergio Rossi Caruso despite regional macroeconomic issues BALANCED DEVELOPMENT ACROSS REGIONS AND CHANNELS • Ongoing store rationalization resulted in flat like- % of Total Revenue, 2023 YoY Growth % for-like sales in the DTC network despite smaller store-base and market challenges Other Other Greater Other Other +68% +8% China Greater Wholesale Wholesale +8% 3% 4% China 6% -1% 5% • eCommerce grew 3% with St. John and Sergio 12% 12% Rossi growing 14% and 5%, respectively 39% 38% 47% 49% 2023 2023 2022 2022 58% 59% North 35% 35% • St. John DTC sales grew by 7%; Caruso achieved North America America DTC +1% 30% growth in global revenue EMEA EMEA DTC -0.3% -2% Note: Results are presented on an unaudited basis. Percentage may not add up to 100% due to rounding. (1) Total revenue of Lanvin group includes Group eliminations. (2) Lanvin Group acquired a majority stake in Sergio Rossi in July 2021 and Sergio Rossi was consolidated in Lanvin Group’s consolidated revenue starting from the acquisition date; Pro Forma results assume Sergio Rossi's revenue results for the full-year 2021. (3) 2021 PF Revenue includes Sergio Rossi 12-month contributions. 5
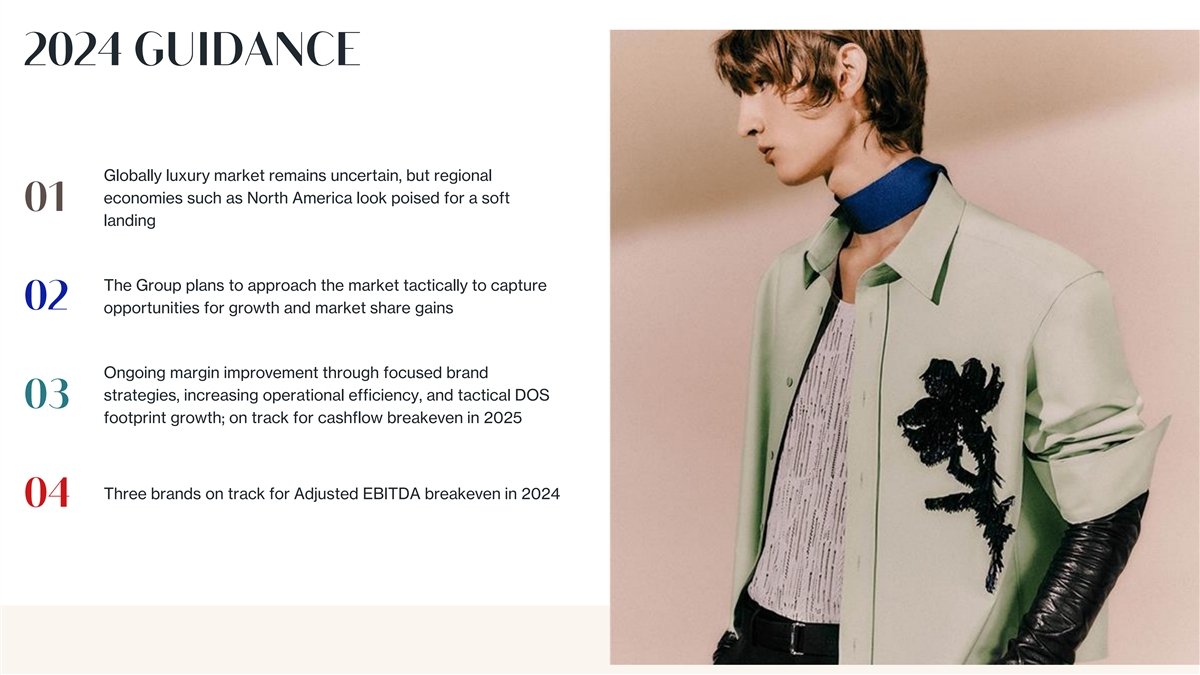
Globally luxury market remains uncertain, but regional economies such as North America look poised for a soft landing The Group plans to approach the market tactically to capture opportunities for growth and market share gains Ongoing margin improvement through focused brand strategies, increasing operational efficiency, and tactical DOS footprint growth; on track for cashflow breakeven in 2025 Three brands on track for Adjusted EBITDA breakeven in 2024 6 6

7
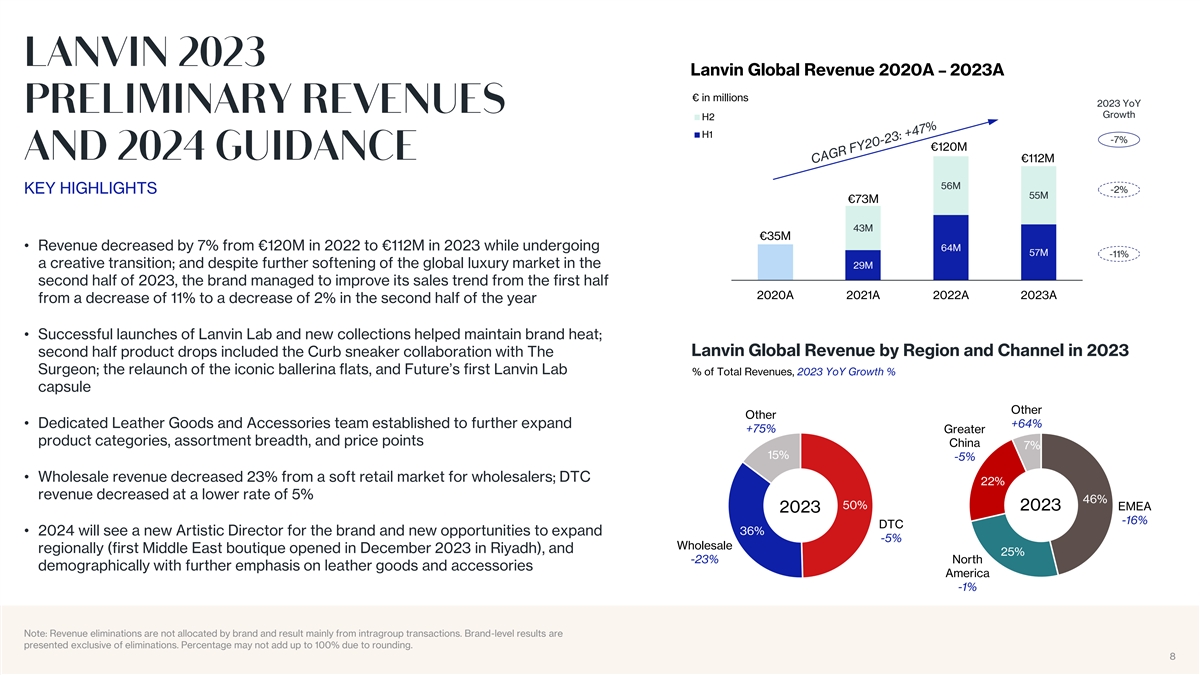
Lanvin Global Revenue 2020A – 2023A € in millions 2023 YoY Growth H2 H1 -7% €120M €112M 56M -2% KEY HIGHLIGHTS 55M €73M 43M €35M • Revenue decreased by 7% from €120M in 2022 to €112M in 2023 while undergoing 64M 57M -11% a creative transition; and despite further softening of the global luxury market in the 29M second half of 2023, the brand managed to improve its sales trend from the first half 2020A 2021A 2022A 2023A from a decrease of 11% to a decrease of 2% in the second half of the year • Successful launches of Lanvin Lab and new collections helped maintain brand heat; Lanvin Global Revenue by Region and Channel in 2023 second half product drops included the Curb sneaker collaboration with The Surgeon; the relaunch of the iconic ballerina flats, and Future’s first Lanvin Lab % of Total Revenues, 2023 YoY Growth % capsule Other Other • Dedicated Leather Goods and Accessories team established to further expand +64% +75% Greater product categories, assortment breadth, and price points China 7% 15% -5% • Wholesale revenue decreased 23% from a soft retail market for wholesalers; DTC 22% revenue decreased at a lower rate of 5% 46% 50% 2023 EMEA 2023 -16% DTC • 2024 will see a new Artistic Director for the brand and new opportunities to expand 36% -5% Wholesale regionally (first Middle East boutique opened in December 2023 in Riyadh), and 25% -23% North demographically with further emphasis on leather goods and accessories America -1% Note: Revenue eliminations are not allocated by brand and result mainly from intragroup transactions. Brand-level results are presented exclusive of eliminations. Percentage may not add up to 100% due to rounding. 8 8

9
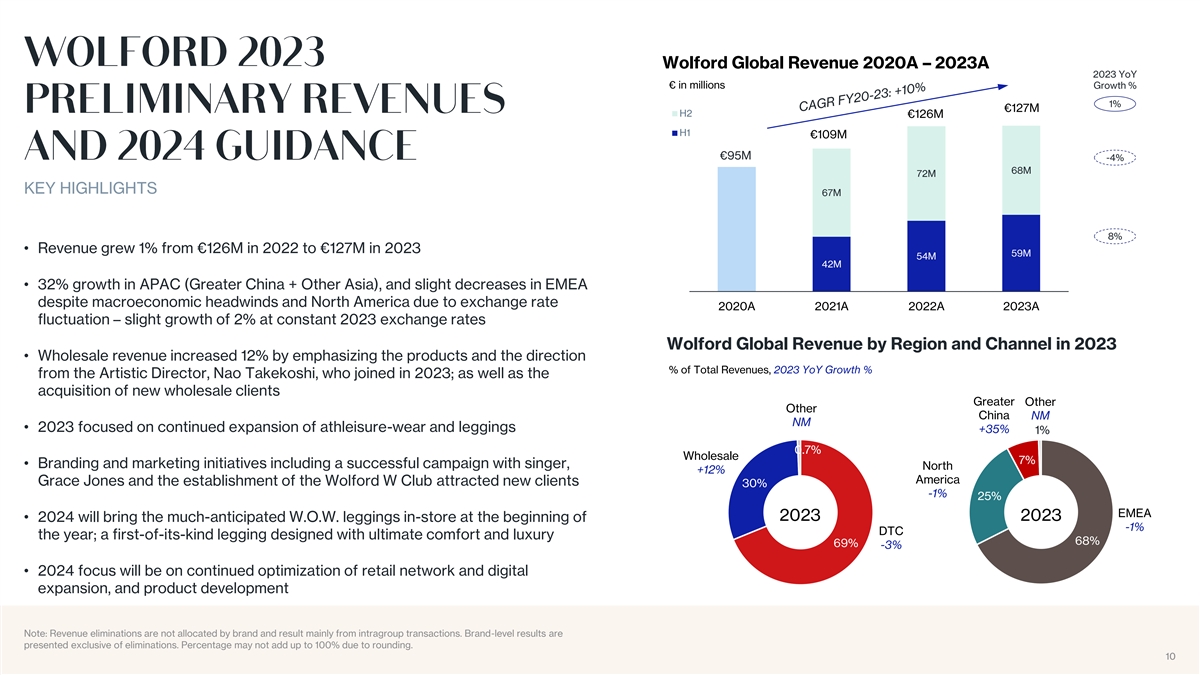
Wolford Global Revenue 2020A – 2023A 2023 YoY € in millions Growth % 1% €127M H2 €126M H1 €109M €95M -4% 68M 72M KEY HIGHLIGHTS 67M 8% • Revenue grew 1% from €126M in 2022 to €127M in 2023 59M 54M 42M • 32% growth in APAC (Greater China + Other Asia), and slight decreases in EMEA despite macroeconomic headwinds and North America due to exchange rate 2020A 2021A 2022A 2023A fluctuation – slight growth of 2% at constant 2023 exchange rates Wolford Global Revenue by Region and Channel in 2023 • Wholesale revenue increased 12% by emphasizing the products and the direction % of Total Revenues, 2023 YoY Growth % from the Artistic Director, Nao Takekoshi, who joined in 2023; as well as the acquisition of new wholesale clients Greater Other Other China NM NM • 2023 focused on continued expansion of athleisure-wear and leggings +35% 1% 0.7% Wholesale 7% • Branding and marketing initiatives including a successful campaign with singer, North +12% America Grace Jones and the establishment of the Wolford W Club attracted new clients 30% -1% 25% EMEA 2023 2023 • 2024 will bring the much-anticipated W.O.W. leggings in-store at the beginning of -1% DTC the year; a first-of-its-kind legging designed with ultimate comfort and luxury 68% 69% -3% • 2024 focus will be on continued optimization of retail network and digital expansion, and product development Note: Revenue eliminations are not allocated by brand and result mainly from intragroup transactions. Brand-level results are presented exclusive of eliminations. Percentage may not add up to 100% due to rounding. 10 10

11
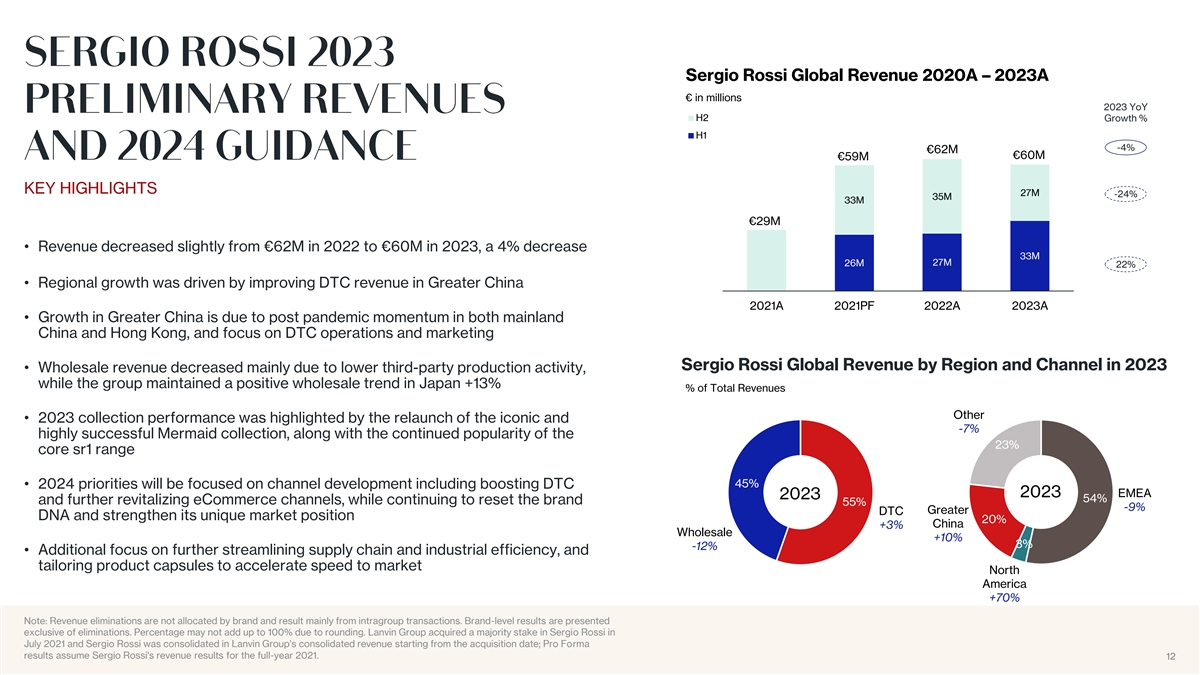
Sergio Rossi Global Revenue 2020A – 2023A € in millions 2023 YoY H2 Growth % H1 -4% €62M €60M €59M KEY HIGHLIGHTS 27M -24% 35M 33M €29M • Revenue decreased slightly from €62M in 2022 to €60M in 2023, a 4% decrease 33M 27M 26M 22% • Regional growth was driven by improving DTC revenue in Greater China 2021A 2021PF 2022A 2023A • Growth in Greater China is due to post pandemic momentum in both mainland China and Hong Kong, and focus on DTC operations and marketing Sergio Rossi Global Revenue by Region and Channel in 2023 • Wholesale revenue decreased mainly due to lower third-party production activity, while the group maintained a positive wholesale trend in Japan +13% % of Total Revenues Other • 2023 collection performance was highlighted by the relaunch of the iconic and -7% highly successful Mermaid collection, along with the continued popularity of the 23% core sr1 range 45% • 2024 priorities will be focused on channel development including boosting DTC EMEA 2023 2023 54% and further revitalizing eCommerce channels, while continuing to reset the brand 55% -9% Greater DTC DNA and strengthen its unique market position 20% China +3% Wholesale +10% 3% -12% • Additional focus on further streamlining supply chain and industrial efficiency, and tailoring product capsules to accelerate speed to market North America +70% Note: Revenue eliminations are not allocated by brand and result mainly from intragroup transactions. Brand-level results are presented exclusive of eliminations. Percentage may not add up to 100% due to rounding. Lanvin Group acquired a majority stake in Sergio Rossi in July 2021 and Sergio Rossi was consolidated in Lanvin Group’s consolidated revenue starting from the acquisition date; Pro Forma results assume Sergio Rossi's revenue results for the full-year 2021. 12 12

13
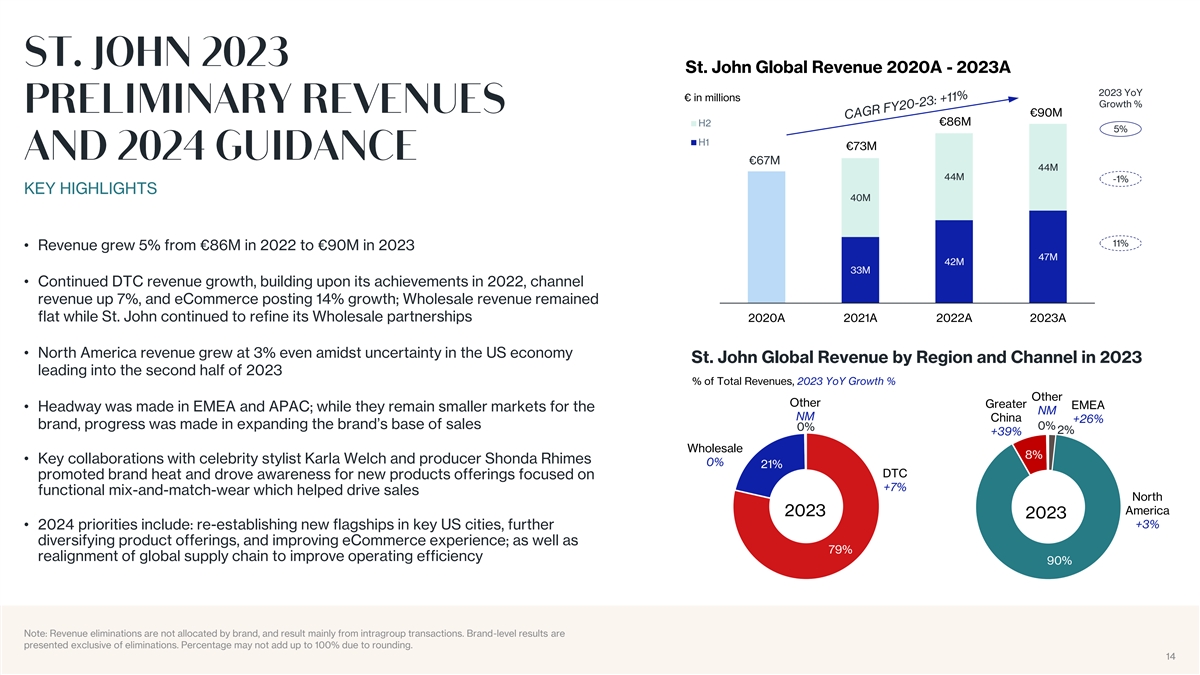
St. John Global Revenue 2020A - 2023A 2023 YoY € in millions Growth % €90M €86M H2 5% H1 €73M €67M 44M 44M -1% KEY HIGHLIGHTS 40M 11% • Revenue grew 5% from €86M in 2022 to €90M in 2023 47M 42M 33M • Continued DTC revenue growth, building upon its achievements in 2022, channel revenue up 7%, and eCommerce posting 14% growth; Wholesale revenue remained flat while St. John continued to refine its Wholesale partnerships 2020A 2021A 2022A 2023A • North America revenue grew at 3% even amidst uncertainty in the US economy St. John Global Revenue by Region and Channel in 2023 leading into the second half of 2023 % of Total Revenues, 2023 YoY Growth % Other Other Greater EMEA • Headway was made in EMEA and APAC; while they remain smaller markets for the NM NM China +26% brand, progress was made in expanding the brand’s base of sales 0% 0% 2% +39% Wholesale 8% • Key collaborations with celebrity stylist Karla Welch and producer Shonda Rhimes 0% 21% DTC promoted brand heat and drove awareness for new products offerings focused on +7% functional mix-and-match-wear which helped drive sales North America 2023 2023 +3% • 2024 priorities include: re-establishing new flagships in key US cities, further diversifying product offerings, and improving eCommerce experience; as well as 79% realignment of global supply chain to improve operating efficiency 90% Note: Revenue eliminations are not allocated by brand, and result mainly from intragroup transactions. Brand-level results are presented exclusive of eliminations. Percentage may not add up to 100% due to rounding. 14 14

15
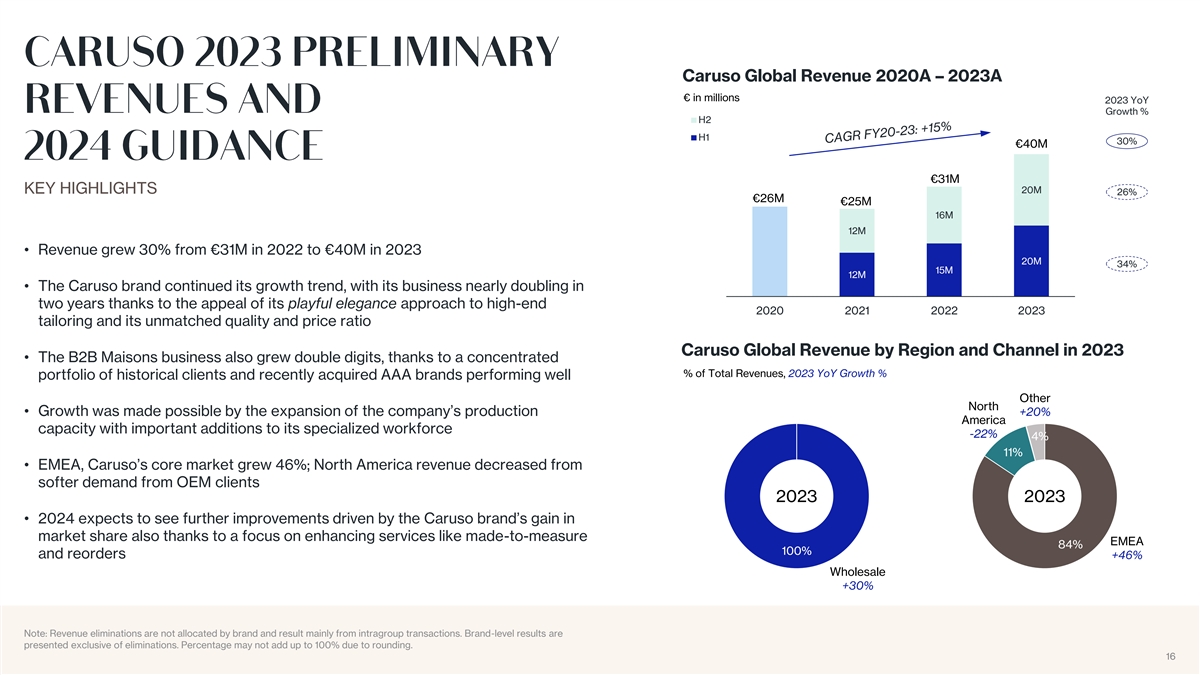
Caruso Global Revenue 2020A – 2023A € in millions 2023 YoY Growth % H2 H1 30% €40M €31M KEY HIGHLIGHTS 20M 26% €26M €25M 16M 12M • Revenue grew 30% from €31M in 2022 to €40M in 2023 20M 34% 15M 12M • The Caruso brand continued its growth trend, with its business nearly doubling in two years thanks to the appeal of its playful elegance approach to high-end 2020 2021 2022 2023 tailoring and its unmatched quality and price ratio Caruso Global Revenue by Region and Channel in 2023 • The B2B Maisons business also grew double digits, thanks to a concentrated % of Total Revenues, 2023 YoY Growth % portfolio of historical clients and recently acquired AAA brands performing well Other North • Growth was made possible by the expansion of the company’s production +20% America capacity with important additions to its specialized workforce -22% 4% 11% • EMEA, Caruso’s core market grew 46%; North America revenue decreased from softer demand from OEM clients 2023 2023 • 2024 expects to see further improvements driven by the Caruso brand’s gain in market share also thanks to a focus on enhancing services like made-to-measure EMEA 84% 100% and reorders +46% Wholesale +30% Note: Revenue eliminations are not allocated by brand and result mainly from intragroup transactions. Brand-level results are presented exclusive of eliminations. Percentage may not add up to 100% due to rounding. 16 16 16

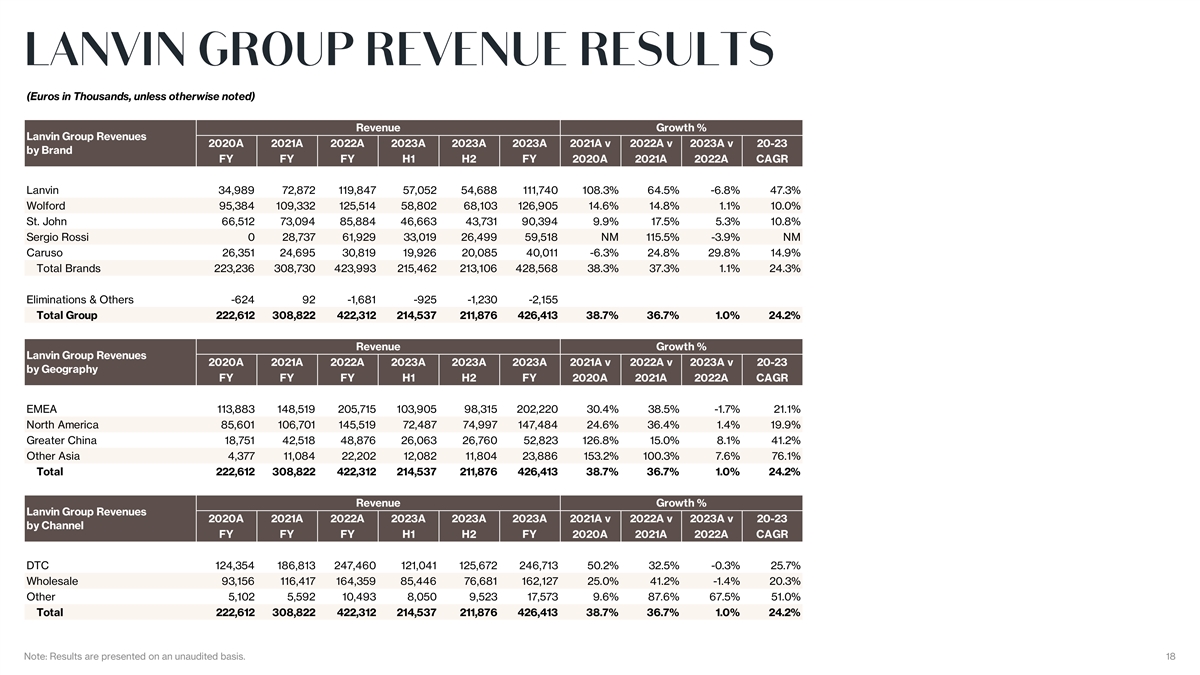
(Euros in Thousands, unless otherwise noted) Revenue Growth % Lanvin Group Revenues 2020A 2021A 2022A 2023A 2023A 2023A 2021A v 2022A v 2023A v 20-23 by Brand FY FY FY H1 H2 FY 2020A 2021A 2022A CAGR Lanvin 34,989 72,872 119,847 57,052 54,688 111,740 108.3% 64.5% -6.8% 47.3% Wolford 95,384 109,332 125,514 58,802 68,103 126,905 14.6% 14.8% 1.1% 10.0% St. John 66,512 73,094 85,884 46,663 43,731 90,394 9.9% 17.5% 5.3% 10.8% Sergio Rossi 0 28,737 61,929 33,019 26,499 59,518 NM 115.5% -3.9% NM Caruso 26,351 24,695 30,819 19,926 20,085 40,011 -6.3% 24.8% 29.8% 14.9% Total Brands 223,236 308,730 423,993 215,462 213,106 428,568 38.3% 37.3% 1.1% 24.3% Eliminations & Others -624 92 -1,681 -925 -1,230 -2,155 Total Group 222,612 308,822 422,312 214,537 211,876 426,413 38.7% 36.7% 1.0% 24.2% Revenue Growth % Lanvin Group Revenues 2020A 2021A 2022A 2023A 2023A 2023A 2021A v 2022A v 2023A v 20-23 by Geography FY FY FY H1 H2 FY 2020A 2021A 2022A CAGR EMEA 113,883 148,519 205,715 103,905 98,315 202,220 30.4% 38.5% -1.7% 21.1% North America 85,601 106,701 145,519 72,487 74,997 147,484 24.6% 36.4% 1.4% 19.9% Greater China 18,751 42,518 48,876 26,063 26,760 52,823 126.8% 15.0% 8.1% 41.2% Other Asia 4,377 11,084 22,202 12,082 11,804 23,886 153.2% 100.3% 7.6% 76.1% Total 222,612 308,822 422,312 214,537 211,876 426,413 38.7% 36.7% 1.0% 24.2% Revenue Growth % Lanvin Group Revenues 2020A 2021A 2022A 2023A 2023A 2023A 2021A v 2022A v 2023A v 20-23 by Channel FY FY FY H1 H2 FY 2020A 2021A 2022A CAGR DTC 124,354 186,813 247,460 121,041 125,672 246,713 50.2% 32.5% -0.3% 25.7% Wholesale 93,156 116,417 164,359 85,446 76,681 162,127 25.0% 41.2% -1.4% 20.3% Other 5,102 5,592 10,493 8,050 9,523 17,573 9.6% 87.6% 67.5% 51.0% Total 222,612 308,822 422,312 214,537 211,876 426,413 38.7% 36.7% 1.0% 24.2% Note: Results are presented on an unaudited basis. 18

Investors Lanvin Group James Kim james.kim@lanvin-group.com Media Lanvin Group Miya He miya.he@lanvin-group.com