UNITED STATES
SECURITIES AND EXCHANGE COMMISSION
Washington, D.C. 20549
FORM N-CSR
CERTIFIED SHAREHOLDER REPORT OF REGISTERED
MANAGEMENT INVESTMENT COMPANIES
Investment Company Act file number (811-23793)
Tidal Trust II
(Exact name of registrant as specified in charter)
234 West Florida Street, Suite 203
Milwaukee, Wisconsin 53204
(Address of principal executive offices) (Zip code)
Eric W. Falkeis
Tidal Trust II
234 West Florida Street, Suite 203
Milwaukee, Wisconsin 53204
(Name and address of agent for service)
(844) 986-7700
Registrant’s telephone number, including area code
Date of fiscal year end: September 30
Date of reporting period: September 30, 2024
Updated June 27, 2024
Item 1. Reports to Stockholders.
CoreValues Alpha Greater China Growth ETF Tailored Shareholder Report
annual Shareholder Report September 30, 2024 CoreValues Alpha Greater China Growth ETF CoreValues Alpha Greater China Growth ETF Ticker: CGRO (Listed on NYSE Arca, Inc.) |
This annual shareholder report contains important information about the CoreValues Alpha Greater China Growth ETF (the "Fund") for the period October 1, 2023 to September 30, 2024. You can find additional information about the Fund at www.cvafunds.com/cgro/. You can also request this information by contacting us at (855) 316-3778 or by writing to the CoreValues Alpha Greater China Growth ETF c/o U.S. Bank Global Fund Services, P.O. Box 701, Milwaukee, Wisconsin 53201-0701.
What were the Fund costs for the past year?
(based on a hypothetical $10,000 investment)
Fund Name | Costs of a $10,000 investment | Costs paid as a percentage of a $10,000 investment |
|---|
CoreValues Alpha Greater China Growth ETF | $80 | 0.75% |
The Fund commenced operations on October 16, 2023. Expenses for a full reporting period would be higher than the figures shown.
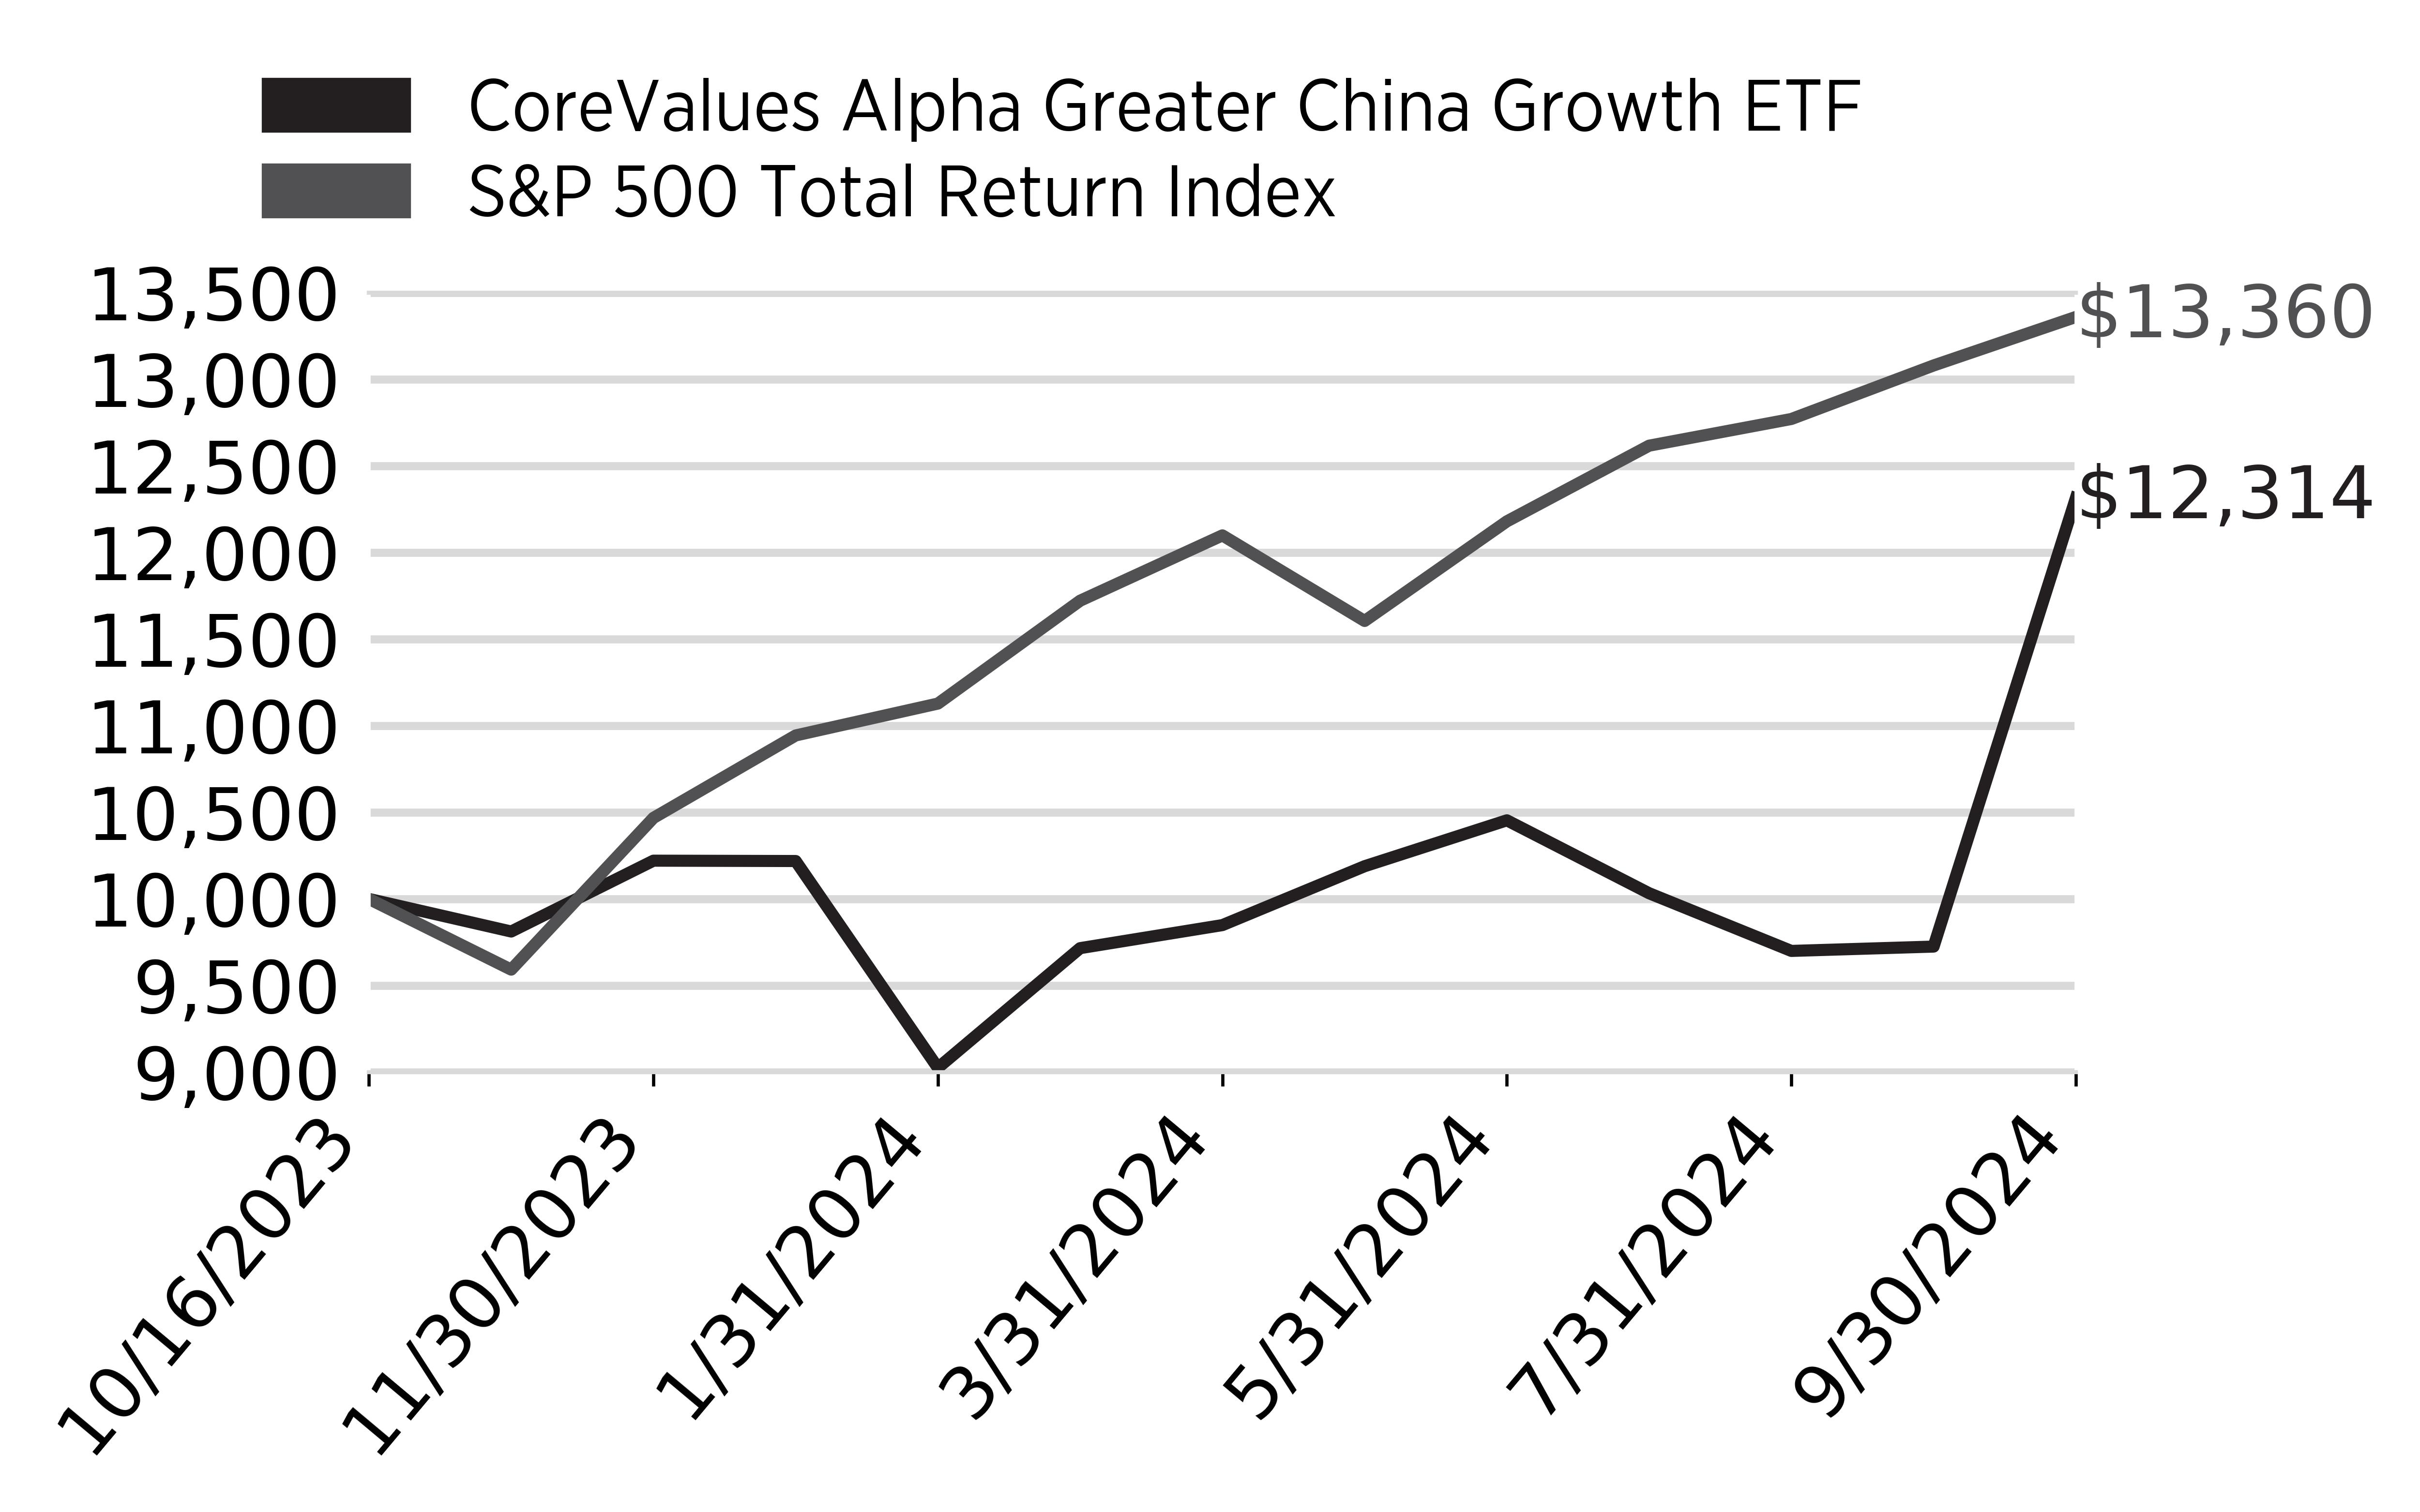
Cumulative Performance
(Initial Investment of $10,000)
Date | CoreValues Alpha Greater China Growth ETF | S&P 500 Total Return Index |
10/16/2023 | 10000 | 10000 |
10/31/2023 | 9812 | 9592 |
11/30/2023 | 10221 | 10468 |
12/31/2023 | 10219 | 10944 |
1/31/2024 | 9025 | 11128 |
2/29/2024 | 9716 | 11722 |
3/31/2024 | 9849 | 12099 |
4/30/2024 | 10189 | 11605 |
5/31/2024 | 10454 | 12180 |
6/30/2024 | 10033 | 12617 |
7/31/2024 | 9700 | 12771 |
8/31/2024 | 9725 | 13080 |
9/30/2024 | 12314 | 13360 |
Annual Performance
Annualized Returns for the Periods Ended September 30, 2024 | Since Inception (10/16/2023) |
|---|
CoreValues Alpha Greater China Growth ETF - at NAV | 23.01% |
S&P 500® Total Return Index | 33.60% |
The Fund's past performance is not a good indicator of how the Fund will perform in the future. The graph and table do not reflect the deduction of taxes that a shareholder would pay on fund distributions or redemption of fund shares.
Visit www.cvafunds.com/cgro/ for more recent performance information.
How Did the Fund Perform last year and what affected its performance?
During the reporting period, the Fund generated a positive total return of 23.01%. This compares to the 33.60% total return for the S&P 500 Index for the same period.
Based on our core key themes, we continue to attempt to position the strategy with strong and consistent advantages versus the benchmark and relative to the overall market. Portfolio positions have greater exposure to Mainland China, as we have a larger share of A-shares and H-shares.
What Factors Influenced Performance?
As interest rates remained high throughout the period, Chinese equities underperformed for most of the year. Furthermore, our A-share and H-share positions didn’t catch as much of the initial western capital rotation after the Chinese stimulus package was announced late September versus their American Depositary Receipt peers.
The current market environment will remain uncertain as the market awaits clarity in policies from a new incoming administration. In general, we believe this administration will have more flexibility to constructively collaborate with China vs. opposing it on ideological grounds.
Positioning of the Fund
The Fund aims to generate long term capital appreciation for investors looking for exposure to Chinese equities with a focus on next-generation themes not captured by products available today. We believe the Fund is positioned to capture growth of these companies as China continues to inject stimulus packages into its economy into 2025.
CoreValues Alpha Greater China Growth ETF Tailored Shareholder Report
CoreValues Alpha Greater China Growth ETF Tailored Shareholder Report
Key Fund Statistics
(as of September 30, 2024)
| |
|---|
Fund Size (Thousands) | $9,208 |
Number of Holdings | 25 |
Total Advisory Fee Paid | $52,448 |
Portfolio Turnover | 112%* |
| * | | Not annualized for periods less than one year. |
What did the Fund invest in?
(as of September 30, 2024)
Sector Breakdown (% of net assets)
Sector | % |
Communications | 0.628 |
Consumer, Cyclical | 0.221 |
Financial | 0.052 |
Consumer, Non-cyclical | 0.047 |
Technology | 0.027 |
Cash & Cash Equivalents | 0.025 |

Percentages are based on total net assets. Cash & Cash Equivalents represents short-term investments and other assets in excess of liabilities.
Top Ten Holdings | (% of net assets) |
|---|
PDD Holdings, Inc. - ADR | 11.3 |
Tencent Holdings Ltd. | 10.1 |
Meituan - Class B | 8.5 |
Trip.com Group Ltd. - ADR | 6.8 |
Xiaomi Corp. - Class B | 6.5 |
BYD Co. Ltd. - Class H | 6.0 |
Proya Cosmetics Co. Ltd. - Class A | 4.7 |
KE Holdings, Inc. - ADR | 4.3 |
JD.com, Inc. - Class A | 4.3 |
Full Truck Alliance Co. Ltd. - ADR | 4.1 |
How has the Fund changed?
There were no material changes during the reporting period.
Changes in and Disagreements with Accountants
There were no changes in or disagreements with accountants.
Householding
Householding is an option available to certain investors of the Fund. Householding is a method of delivery, based on the preference of the individual investor, in which a single copy of certain shareholder documents can be delivered to investors who share the same address, even if their accounts are registered under different names. Householding for the Fund is available through certain broker-dealers. If you are interested in enrolling in householding and receiving a single copy of prospectuses and other shareholder documents, please contact your broker-dealer. If you are currently enrolled in householding and wish to change your householding status, please contact your broker-dealer.
For additional information about the Fund, including its prospectus, financial information, holdings and proxy voting information, visit www.cvafunds.com/cgro/ .
CoreValues Alpha Greater China Growth ETF Tailored Shareholder Report
Item 2. Code of Ethics.
The registrant has adopted a code of ethics that applies to the registrant’s principal executive officer and principal financial officer. The registrant has not made any substantive amendments to its code of ethics during the period covered by this report. The registrant has not granted any waivers from any provisions of the code of ethics during the period covered by this report.
A copy of the registrant’s Code of Ethics is filed herewith.
Item 3. Audit Committee Financial Expert.
The registrant’s Board of Trustees of the Trust has determined that there is at least one audit committee financial expert serving on its audit committee. Mr. David Norris is the “audit committee financial expert” and is considered to be “independent” as each term is defined in Item 3 of Form N-CSR.
Item 4. Principal Accountant Fees and Services.
The registrant has engaged its principal accountant to perform audit services, audit-related services, tax services and other services during the past fiscal year. “Audit services” refer to performing an audit of the registrant’s annual financial statements or services that are normally provided by the accountant in connection with statutory and regulatory filings or engagements for these fiscal years. “Audit-related services” refer to the assurance and related services by the principal accountant that are reasonably related to the performance of the audit. “Tax services” refer to professional services rendered by the principal accountant for tax compliance, tax advice, and tax planning. There were no “Other services” provided by the principal accountant. The following table details the aggregate fees billed or expected to be billed for the fiscal year for audit fees, audit-related fees, tax fees and other fees by the principal accountant.
CoreValues Alpha Greater China Growth ETF
| | FYE 9/30/2024 |
| ( a ) Audit Fees | $11,500 |
| ( b ) Audit-Related Fees | N/A |
| ( c ) Tax Fees | $3,000 |
| ( d ) All Other Fees | N/A |
(e)(1) The audit committee has adopted pre-approval policies and procedures that require the audit committee to pre-approve all audit and non-audit services of the registrant, including services provided to any entity affiliated with the registrant.
(e)(2) The percentage of fees billed by Cohen & Company, Ltd. applicable to non-audit services pursuant to waiver of pre-approval requirement were as follows:
| | FYE 9/30/2024 |
| Audit-Related Fees | 0% |
| Tax Fees | 0% |
| All Other Fees | 0% |
(f) All of the principal accountant’s hours spent on auditing the registrant’s financial statements were attributed to work performed by full-time permanent employees of the principal accountant.
(g) The following table indicates the non-audit fees billed or expected to be billed by the registrant’s accountant for services to the registrant and to the registrant’s investment adviser (and any other controlling entity, etc.—not sub-adviser) for the last year.
| Non-Audit Related Fees | FYE 9/30/2024 |
| Registrant | N/A |
| Registrant’s Investment Adviser | N/A |
(h) The audit committee of the board of trustees/directors has considered whether the provision of non-audit services that were rendered to the registrant’s investment adviser is compatible with maintaining the principal accountant’s independence and has concluded that the provision of such non-audit services by the accountant has not compromised the accountant’s independence.
(i) The registrant has not been identified by the U.S. Securities and Exchange Commission as having filed an annual report issued by a registered public accounting firm branch or office that is located in a foreign jurisdiction where the Public Company Accounting Oversight Board is unable to inspect or completely investigate because of a position taken by an authority in that jurisdiction.
(j) The registrant is not a foreign issuer.
Item 5. Audit Committee of Listed Registrants.
(a) The registrant is an issuer as defined in Rule 10A-3 under the Securities Exchange Act of 1934, (the “Act”) and has a separately-designated standing audit committee established in accordance with Section 3(a)(58)(A) of the Act. The independent members of the committee are as follows: Javier Marquina, Michelle McDonough, and David Norris.
(b) Not applicable
Item 6. Investments.
| (a) | Schedule of Investments is included within the financial statements filed under Item 7 of this Form. |
Item 7. Financial Statements and Financial Highlights for Open-End Investment Companies.
(a)

Financial Statements
September 30, 2024
| Tidal Trust II |
| CoreValues Alpha Greater China Growth ETF | | CGRO | | NYSE Arca, Inc. |
CoreValues Alpha Greater China Growth ETF |
Table of Contents
| Schedule of Investments | CoreValues Alpha Greater
China Growth ETF |
| September 30, 2024 |
| COMMON STOCKS - 97.5% | | Shares | | | Value | |
| Auto Manufacturers - 8.4% | | | | | | | | |
| BYD Co. Ltd. - Class H | | | 15,138 | | | $ | 553,095 | |
| Yutong Bus Co. Ltd. - Class A | | | 59,600 | | | | 223,837 | |
| | | | | | | | 776,932 | |
| | | | | | | | | |
| Auto Parts & Equipment - 2.4% | | | | | | | | |
| Contemporary Amperex Technology Co. Ltd. - Class A | | | 6,208 | | | | 222,878 | |
| | | | | | | | | |
| Cosmetics & Personal Care - 4.7% | | | | | | | | |
| Proya Cosmetics Co. Ltd. - Class A | | | 27,700 | | | | 434,642 | |
| | | | | | | | | |
| Diversified Financial Services - 0.9% | | | | | | | | |
| Qifu Technology, Inc. - ADR | | | 2,846 | | | | 84,839 | |
| | | | | | | | | |
| Home Furnishings - 5.0% | | | | | | | | |
| Anker Innovations Technology Co. Ltd. - Class A | | | 23,000 | | | | 274,908 | |
| Midea Group Co. Ltd. - Class A | | | 17,003 | | | | 184,326 | |
| | | | | | | | 459,234 | |
| | | | | | | | | |
| Internet - 56.3%(a) | | | | | | | | |
| Alibaba Group Holding Ltd. - ADR | | | 3,419 | | | | 362,824 | |
| Baidu, Inc. - ADR (b) | | | 423 | | | | 44,538 | |
| Bilibili, Inc. - Class Z (b) | | | 9,366 | | | | 233,683 | |
| Full Truck Alliance Co. Ltd. - ADR | | | 42,300 | | | | 381,123 | |
| JD.com, Inc. - Class A | | | 18,334 | | | | 394,414 | |
| Kuaishou Technology – Class B (b)(c) | | | 19,213 | | | | 135,672 | |
| Meituan - Class B (b)(c) | | | 35,207 | | | | 779,608 | |
| PDD Holdings, Inc. - ADR (b) | | | 7,735 | | | | 1,042,755 | |
| Tencent Holdings Ltd. | | | 16,326 | | | | 934,476 | |
| Tencent Music Entertainment Group - ADR | | | 20,884 | | | | 251,652 | |
| Trip.com Group Ltd. - ADR (b) | | | 10,466 | | | | 621,994 | |
| | | | | | | | 5,182,739 | |
| | | | | | | | | |
| Real Estate - 4.3% | | | | | | | | |
| KE Holdings, Inc. - ADR | | | 19,964 | | | | 397,483 | |
| | | | | | | | | |
| Retail - 6.3% | | | | | | | | |
| ANTA Sports Products Ltd. | | | 22,365 | | | | 271,950 | |
| Luckin Coffee, Inc. - ADR (b) | | | 11,497 | | | | 304,556 | |
| | | | | | | | 576,506 | |
| | | | | | | | | |
| Software - 2.7% | | | | | | | | |
| Kingsoft Corp. Ltd. | | | 54,457 | | | | 207,172 | |
| NetEase, Inc. - ADR | | | 406 | | | | 37,965 | |
| | | | | | | | 245,137 | |
| | | | | | | | | |
| Telecommunications - 6.5% | | | | | | | | |
| Xiaomi Corp. - Class B (b)(c) | | | 207,111 | | | | 599,935 | |
| TOTAL COMMON STOCKS (Cost $6,897,291) | | | | | | | 8,980,325 | |
| | | | | | | | | |
| SHORT-TERM INVESTMENTS - 1.7% | | | | | | | | |
| Money Market Funds - 1.7% | | | | | | | | |
| First American Government Obligations Fund - Class X, 4.82% (d) | | | 152,317 | | | | 152,317 | |
| TOTAL SHORT-TERM INVESTMENTS (Cost $152,317) | | | | | | | 152,317 | |
| | | | | | | | | |
| TOTAL INVESTMENTS - 99.2% (Cost $7,049,608) | | | | | | | 9,132,642 | |
| Other Assets in Excess of Liabilities - 0.8% | | | | | | | 74,907 | |
| TOTAL NET ASSETS - 100.0% | | | | | | $ | 9,207,549 | |
| | | | | | | | | |
| The accompanying notes are an integral part of these financial statements. | 1 |
| Schedule of Investments | CoreValues Alpha Greater
China Growth ETF |
| September 30, 2024 |
Percentages are stated as a percent of net assets.
ADR - American Depositary Receipt
| (a) | To the extent that the Fund invests more heavily in a particular industry or sector of the economy, its performance will be especially sensitive to developments that significantly affect those industries or sectors. |
| (b) | Non-income producing security. |
| (c) | Security is exempt from registration pursuant to Rule 144A under the Securities Act of 1933, as amended. These securities may only be resold in transactions exempt from registration to qualified institutional investors. As of September 30, 2024, the value of these securities total $1,515,215 or 16.5% of the Fund’s net assets. |
| (d) | The rate shown represents the 7-day annualized effective yield as of September 30, 2024. |
| The accompanying notes are an integral part of these financial statements. | 2 |
Statement of
Assets and Liabilities | CoreValues Alpha Greater
China Growth ETF |
| September 30, 2024 |
| | | | |
| ASSETS: | | | |
| Investments, at value (Note 2) | | $ | 9,132,642 | |
| Receivable for investments sold | | | 209,239 | |
| Dividends receivable | | | 2,153 | |
| Interest receivable | | | 268 | |
| Total assets | | | 9,344,302 | |
| | | | | |
| LIABILITIES: | | | | |
| Payable for investments purchased | | | 132,171 | |
| Payable to adviser (Note 4) | | | 4,582 | |
| Total liabilities | | | 136,753 | |
| NET ASSETS | | $ | 9,207,549 | |
| | | | | |
| NET ASSETS CONSISTS OF: | | | | |
| Paid-in capital | | $ | 7,356,636 | |
| Total distributable earnings | | | 1,850,913 | |
| Total net assets | | $ | 9,207,549 | |
| | | | | |
| Net assets | | $ | 9,207,549 | |
| Shares issued and outstanding(a) | | | 375,000 | |
| Net asset value per share | | $ | 24.55 | |
| | | | | |
| COST: | | | | |
| Investments, at cost | | $ | 7,049,608 | |
| (a) | Unlimited shares authorized without par value. |
| The accompanying notes are an integral part of these financial statements. | 3 |
| Statement of Operations | CoreValues Alpha Greater
China Growth ETF |
| For the Period Ended September 30, 2024(a) |
| INVESTMENT INCOME: | | | |
| Dividend income | | $ | 109,211 | |
| Less: Dividend withholding taxes | | | (7,223 | ) |
| Less: Issuance fees | | | (3,056 | ) |
| Interest income | | | 9,883 | |
| Total investment income | | | 108,815 | |
| | | | | |
| EXPENSES: | | | | |
| Investment advisory fee (Note 4) | | | 62,238 | |
| Total expenses | | | 62,238 | |
| Expense reimbursement by Adviser | | | (9,790 | ) |
| Net expenses | | | 52,448 | |
| NET INVESTMENT INCOME | | | 56,367 | |
| | | | | |
| REALIZED AND UNREALIZED GAIN | | | 1,810,438 | |
| Net realized loss from: | | | | |
| Investments | | | (266,282 | ) |
| Foreign currency transactions | | | (6,236 | ) |
| Net realized loss | | | (272,518 | ) |
| Net change in unrealized appreciation on: | | | | |
| Investments | | | 2,083,034 | |
| Foreign currency translation | | | (78 | ) |
| Net change in unrealized appreciation | | | 2,082,956 | |
| Net realized and unrealized gain | | | 1,810,438 | |
| NET INCREASE IN NET ASSETS RESULTING FROM OPERATIONS | | $ | 1,866,805 | |
| (a) | Inception date of the Fund was October 16, 2023. |
| The accompanying notes are an integral part of these financial statements. | 4 |
| Statement of Changes in Net Assets | CoreValues Alpha Greater
China Growth ETF |
| | | Period ended September 30, 2024(a) | |
| OPERATIONS: | | | | |
| Net investment income | | $ | 56,367 | |
| Net realized loss | | | (272,518 | ) |
| Net change in unrealized appreciation | | | 2,082,956 | |
| Net increase in net assets from operations | | | 1,866,805 | |
| | | | | |
| | | | | |
| DISTRIBUTIONS TO SHAREHOLDERS: | | | | |
| Distributions to shareholders | | | (15,892 | ) |
| Total distributions to shareholders | | | (15,892 | ) |
| | | | | |
| CAPITAL TRANSACTIONS: | | | | |
| Subscriptions | | | 7,355,888 | |
| ETF transaction fees (See Note 7) | | | 748 | |
| Net increase in net assets from capital transactions | | | 7,356,636 | |
| | | | | |
| NET INCREASE IN NET ASSETS | | | 9,207,549 | |
| | | | | |
| NET ASSETS: | | | | |
| Beginning of the period | | | — | |
| End of the period | | $ | 9,207,549 | |
| | | | | |
| SHARES TRANSACTIONS | | | | |
| Subscriptions | | | 375,000 | |
| Total increase in shares outstanding | | | 375,000 | |
| (a) | Inception date of the Fund was October 16, 2023. |
| The accompanying notes are an integral part of these financial statements. | 5 |
| Financial Highlights | CoreValues Alpha Greater
China Growth ETF |
| For a share outstanding throughout the period presented | |
| | | Period ended September 30, 2024(a) | |
| PER SHARE DATA: | | | |
| | | | |
| Net asset value, beginning of period | | $ | 20.00 | |
| | | | | |
| INVESTMENT OPERATIONS: | | | | |
| Net investment income(b) | | | 0.15 | |
| Net realized and unrealized gain on investments(c) | | | 4.44 | |
| Total from investment operations | | | 4.59 | |
| | | | | |
| LESS DISTRIBUTIONS FROM: | | | | |
| Net investment income | | | (0.04 | ) |
| Total distributions | | | (0.04 | ) |
| CAPTIAL SHARE TRANSACTIONS: | | | | |
| ETF transaction fees per share | | | 0.00 | (d) |
| Net asset value, end of period | | $ | 24.55 | |
| | | | | |
| TOTAL RETURN(e) | | | 23.01 | % |
| | | | | |
| SUPPLEMENTAL DATA AND RATIOS: | | | | |
| Net assets, end of period (in thousands) | | $ | 9,208 | |
| Ratio of expenses to average net assets: | | | | |
| Before expense reimbursement/recoupment(f) | | | 0.89 | % |
| After expense reimbursement/recoupment(f) | | | 0.75 | % |
| Ratio of net investment income to average net assets(f) | | | 0.81 | % |
| Portfolio turnover rate(e)(g) | | | 112 | % |
| (a) | Inception date of the Fund was October 16, 2023. |
| (b) | Net investment income per share has been calculated based on average shares outstanding during the period. |
| (c) | Realized and unrealized gains and losses per share in the caption are balancing amounts necessary to reconcile the change in net asset value per share for the period, and may not reconcile with the aggregate gains and losses in the Statement of Operations due to share transactions for the period. |
| (d) | Amount represents less than $0.005 per share. |
| (e) | Not annualized for periods less than one year. |
| (f) | Annualized for periods less than one year. |
| (g) | Portfolio turnover rate excludes in-kind transactions. |
| The accompanying notes are an integral part of these financial statements. | 6 |
| Notes to the Financial Statements | CoreValues Alpha Greater
China Growth ETF |
September 30, 2024
The CoreValues Alpha Greater China Growth ETF (the “Fund”) is a non-diversified series of Tidal Trust II (the “Trust”). The Trust was organized as a Delaware statutory trust on January 13, 2022. The Trust is registered with the Securities and Exchange Commission (“SEC”) under the Investment Company Act of 1940, as amended (the “1940 Act”), as an open-end management investment company and the offering of the Fund’s shares (“Shares”) is registered under the Securities Act of 1933, as amended. The Trust is governed by the Board of Trustees (the “Board”). Tidal Investments LLC (“Tidal Investments” or the “Adviser”), a Tidal Financial Group company, serves as investment adviser to the Fund. MSA Power Funds, LLC (“Sub-Adviser” or “MSA”) serves as investment sub-adviser to the Fund. The Fund is an investment company and accordingly follows the investment company accounting and reporting guidance of the Financial Accounting Standards Board (“FASB”) Accounting Standards Codification Topic 946 “Financial Services – Investment Companies”. The Fund commenced operations on October 16, 2023.
The investment objective of the Fund is to seek long-term capital appreciation.
| NOTE 2 – SIGNIFICANT ACCOUNTING POLICIES |
The following is a summary of significant accounting policies consistently followed by the Fund. These policies are in conformity with accounting principles generally accepted in the United States of America (“U.S. GAAP”).
| A. | Security Valuation. Equity securities that are listed on a securities exchange, market or automated quotation system for which quotations are readily available (except for securities traded on the NASDAQ Stock Market, LLC (“NASDAQ”)), including securities traded over the counter, are valued at the last quoted sale price on the primary exchange or market (foreign or domestic) on which they are traded on the valuation date (or at approximately 4:00 p.m. EST if a security’s primary exchange is normally open at that time), or, if there is no such reported sale on the valuation date, at the most recent quoted bid price or mean between the most recent quoted bid and ask prices for long and short positions. For a security that trades on multiple exchanges, the primary exchange will generally be considered the exchange on which the security is generally most actively traded. For securities traded on NASDAQ, the NASDAQ Official Closing Price will be used. Prices of securities traded on the securities exchange will be obtained from recognized independent pricing agents each day that the Fund is open for business. |
Under Rule 2a-5 of the 1940 Act, a fair value will be determined for securities for which quotations are not readily available by the Valuation Designee (as defined in Rule 2a-5) in accordance with the Pricing and Valuation Policy and Fair Value Procedures, as applicable, of the Adviser, subject to oversight by the Board. When a security is “fair valued,” consideration is given to the facts and circumstances relevant to the particular situation, including a review of various factors set forth in the Adviser’s Pricing and Valuation Policy and Fair Value Procedures, as applicable. Fair value pricing is an inherently subjective process, and no single standard exists for determining fair value. Different funds could reasonably arrive at different values for the same security. The use of fair value pricing by a fund may cause the net asset value (“NAV”) of its shares to differ significantly from the NAV that would be calculated without regard to such considerations.
As described above, the Fund utilizes various methods to measure the fair value of its investments on a recurring basis. U.S. GAAP establishes a hierarchy that prioritizes inputs to valuation methods. The three levels of inputs are:
| Level 1 – | Unadjusted quoted prices in active markets for identical assets or liabilities that the Fund has the ability to access. |
| Level 2 – | Observable inputs other than quoted prices included in Level 1 that are observable for the asset or liability, either directly or indirectly. These inputs may include quoted prices for the identical instrument on an inactive market, prices for similar instruments, interest rates, prepayment speeds, credit risk, yield curves, default rates and similar data. |
| Level 3 – | Unobservable inputs for the asset or liability, to the extent relevant observable inputs are not available; representing the Fund’s own assumptions about the assumptions a market participant would use in valuing the asset or liability and would be based on the best information available. |
The availability of observable inputs can vary from security to security and is affected by a wide variety of factors, including, for example, the type of security, whether the security is new and not yet established in the marketplace, the liquidity of markets, and other characteristics particular to the security. To the extent that valuation is based on models or inputs that are less observable or unobservable in the market, the determination of fair value requires more judgment. Accordingly, the degree of judgment exercised in determining fair value is greatest for instruments categorized in Level 3.
| Notes to the Financial Statements | CoreValues Alpha Greater
China Growth ETF |
September 30, 2024
The inputs used to measure fair value may fall into different levels of the fair value hierarchy. In such cases, for disclosure purposes, the level in the fair value hierarchy within which the fair value measurement falls in its entirety, is determined based on the lowest level input that is significant to the fair value measurement in its entirety.
The following is a summary of the inputs used to value the Fund’s investments as of September 30, 2024:
| | Level 1 | | | Level 2 | | | Level 3 | | | Total | |
| Investments: | | | | | | | | | | | | | |
| Common Stocks | | $ | 8,980,325 | | | $ | — | | | $ | — | | | $ | 8,980,325 | |
| Money Market Funds | | | 152,317 | | | | — | | | | — | | | | 152,317 | |
| Total Investments | | $ | 9,312,642 | | | $ | — | | | $ | — | | | $ | 9,312,642 | |
Refer to the Schedule of Investments for further disaggregation of investment categories.
| B. | Federal Income Taxes. The Fund has elected to be taxed as a “regulated investment company” and intends to distribute substantially all taxable income to its shareholders and otherwise comply with the provisions of the Internal Revenue Code applicable to regulated investment companies. Therefore, no provision for federal income taxes or excise taxes has been made. |
In order to avoid imposition of the excise tax applicable to regulated investment companies, the Fund intends to declare as dividends in each calendar year at least 98.0% of its net investment income (earned during the calendar year) and at least 98.2% of its net realized capital gains (earned during the twelve months ended October 31) plus undistributed amounts, if any, from prior years. As a registered investment company, the Fund is subject to a 4% excise tax that is imposed if the Fund does not distribute by the end of any calendar year at least the sum of (i) 98% of its ordinary income (not taking into account any capital gain or loss) for the calendar year and (ii) 98.2% of its capital gain in excess of its capital loss (adjusted for certain ordinary losses) for a one year period generally ending on October 31 of the calendar year (unless an election is made to use the fund’s fiscal year). The Fund generally intends to distribute income and capital gains in the manner necessary to minimize (but not necessarily eliminate) the imposition of such excise tax. The Fund may retain income or capital gains and pay excise tax when it is determined that doing so is in the best interest of shareholders. Management, in consultation with the Board of Trustees, evaluates the costs of the excise tax relative to the benefits of retaining income and capital gains, including that such undistributed amounts (net of the excise tax paid) remain available for investment by the Fund and are available to supplement future distributions. Tax expense is disclosed in the Statement of Operations, if applicable.
As of September 30, 2024, the Fund did not have any tax positions that did not meet the threshold of being sustained by the applicable tax authority. Generally, tax authorities can examine all the tax returns filed for the last three years. The Fund identifies its major tax jurisdiction as U.S. Federal and the Commonwealth of Delaware; however, the Fund is not aware of any tax positions for which it is reasonably possible that the total amounts of unrecognized tax benefits will change materially. The Fund recognizes interest and penalties, if any, related to unrecognized tax benefits on uncertain tax positions as income tax expense in the Statement of Operations.
| C. | Securities Transactions and Investment Income. Investment securities transactions are accounted for on the trade date. Gains and losses realized on sales of securities are determined on a specific identification basis. Discounts/premiums on debt securities purchased are accreted/amortized over the life of the respective securities using the effective interest method. Dividend income is recorded on the ex-dividend date. Debt income is recorded on an accrual basis. Other non-cash dividends are recognized as investment income at the fair value of the property received. Withholding taxes on foreign dividends have been provided for in accordance with the Fund’s understanding of the applicable country’s tax rules and rates. |
| D. | Foreign Currency. Investment securities and other assets and liabilities denominated in foreign currencies are translated into U.S. dollar amounts at the date of valuation. Purchases and sales of investment securities and income and expense items denominated in foreign currencies are translated into U.S. dollar amounts on the respective dates of such transactions. |
| Notes to the Financial Statements | CoreValues Alpha Greater
China Growth ETF |
September 30, 2024
The Fund does not isolate that portion of the results of operations resulting from changes in foreign exchange rates on investments from the fluctuations arising from changes in market prices of securities held. Such fluctuations are included with the net realized and unrealized gain or loss from investments.
The Fund reports net realized foreign exchange gains or losses that arise from sales of foreign currencies, currency gains or losses realized between the trade and settlement dates on securities transactions, and the difference between the amounts of dividends, interest, and foreign withholding taxes recorded on the Fund’s books and the U.S. dollar equivalent of the amounts actually received or paid. Net unrealized foreign exchange gains and losses arise from changes in the fair values of assets and liabilities, other than investments in securities at period end, resulting from changes in exchange rates.
| E. | Distributions to Shareholders. Distributions to shareholders from net investment income, if any, for the Fund are declared and paid annually. Distributions to shareholders from net realized gains on securities, if any, for the Fund normally are declared and paid on an annual basis. Distributions are recorded on the ex-dividend date. |
| F. | Use of Estimates. The preparation of financial statements in conformity with U.S. GAAP requires management to make estimates and assumptions that affect the reported amounts of assets and liabilities and disclosure of contingent assets and liabilities at the date of the financial statements and the reported amount of increases and decreases in net assets from operations during the reporting period. Actual results could differ from those estimates. |
| G. | Share Valuation. The NAV per share of the Fund is calculated by dividing the sum of the value of the securities held by the Fund, plus cash or other assets, minus all liabilities by the total number of shares outstanding for the Fund, rounded to the nearest cent. The Fund’s shares will not be priced on the days on which the New York Stock Exchange (“NYSE”) is closed for trading. |
| H. | Guarantees and Indemnifications. In the normal course of business, the Fund enters into contracts with service providers that contain general indemnification clauses. The Fund’s maximum exposure under these arrangements is unknown as this would involve future claims that may be made against the Fund that have not yet occurred. However, based on experience, the Fund expects the risk of loss to be remote. |
| I. | Illiquid Securities. Pursuant to Rule 22e-4 under the 1940 Act, the Fund has adopted a Board-approved Liquidity Risk Management Program (the “Program”) that requires, among other things, that the Fund limit its illiquid investments that are assets to no more than 15% of the value of the Fund’s net assets. An illiquid investment is any investment that the Fund reasonably expects cannot be sold or disposed of in current market conditions in seven calendar days or less without the sale or disposition significantly changing the market value of the investment. If the Fund should be in a position where the value of illiquid investments held by the Fund exceeds 15% of the Fund’s net assets, the Fund will take such steps as set forth in the Program. |
| J. | Reclassification of Capital Accounts. U.S. GAAP requires that certain components of net assets relating to permanent differences be reclassified between financial and tax reporting. These reclassifications have no effect on net assets or net asset value per share. There were no reclassifications for the period ended September 30, 2024. |
| | NOTE 3 – PRINCIPAL INVESTMENT RISKS |
| A. | China Investing Risk. The Chinese economy is generally considered an emerging market and can be significantly affected by economic and political conditions and policy in China and surrounding Asian countries. A relatively small number of Chinese companies represent a large portion of China’s total market and thus may be more sensitive to adverse political or economic circumstances and market movements. The economy of China differs, often unfavorably, from the U.S. economy in such respects as structure, general development, government involvement, wealth distribution, rate of inflation, growth rate, allocation of resources and capital reinvestment, among others. The Public Company Accounting Oversight Board (“PCAOB”), which regulates auditors of U.S. public companies, has warned that it lacks the ability to inspect audit work and practices of PCAOB-registered accounting firms in China and Hong Kong. The PCAOB’s limited ability to oversee the operations of accounting firms in China and Hong Kong means that inaccurate or incomplete financial records of an issuer’s operations may not be detected, which could negatively impact the Fund’s investments in such companies. Under China’s political and economic system, the central government has historically exercised substantial control over virtually every sector of the Chinese economy through administrative regulation and/or state ownership. In addition, expropriation, including nationalization, confiscatory taxation, political, economic or social instability or other developments could adversely affect and significantly diminish the values of the Chinese companies in which the Fund invests. International trade tensions may arise from time to time which can result in trade tariffs, embargoes, trade limitations, trade wars and other negative consequences. These consequences may trigger a reduction in international trade, the oversupply of certain manufactured goods, substantial price reductions of goods and possible failure of individual companies and/or large segments of China’s export industry with a potentially severe negative impact to the Fund. From time to time and as recently as January 2020, China has experienced outbreaks of infectious illnesses, and the country may be subject to other public health threats or similar issues in the future. Any spread of an infectious illness, public health threat or similar issue could reduce consumer demand or economic output, result in market closures, travel restrictions or quarantines, and generally have a significant impact on the Chinese economy. |
| Notes to the Financial Statements | CoreValues Alpha Greater
China Growth ETF |
September 30, 2024
| B. | Sector Risks. To the extent the Fund invests more heavily in particular sectors of the Chinese economy, its performance will be especially sensitive to developments that significantly affect those sectors. The Fund may invest a significant portion of its assets in the following sectors and, therefore, the performance of the Fund could be negatively impacted by events affecting each of these sectors. |
| ● | Communications Services Sector. Companies in the communications services sector are subject to extensive government regulation. The costs of complying with governmental regulations, delays or failure to receive required regulatory approvals, or the enactment of new adverse regulatory requirements may adversely affect the business of such companies. Companies in the communications services sector also can be significantly affected by intense competition, including competition with alternative technologies such as wireless communications (including with 5G and other technologies), product compatibility, consumer preferences, rapid product obsolescence, and research and development of new products. Technological innovations may make the products and services of such companies obsolete. Media content creation carries risks of changing consumer tastes and running afoul of regulatory content guidelines, which could result in large fines or the loss of regulatory licenses. Media companies collect significant amounts of personal consumer data and are at risk of data breaches and fines for the unauthorized and unplanned public release of sensitive consumer data. |
| ● | Consumer Discretionary Sector. The consumer discretionary sector may be affected by changes in domestic and international economies, exchange and interest rates, competition, consumers’ disposable income, consumer preferences, social trends and marketing campaigns. |
| ● | Consumer Staples Sector. Investing in the consumer staples sector, which encompasses companies producing or selling essential products like food and household items, presents distinct challenges. Companies in this sector face fierce competition with numerous established brands fighting for market share. Additionally, fluctuations in commodity prices can impact production costs, and regulatory changes or global trade tensions can affect supply chains and profitability. Furthermore, shifts in consumer preferences, driven by health trends or sustainability concerns, can also pose risks. |
| ● | Financials Sector. The financials sector can be significantly affected by changes in interest rates, government regulation, the rate of defaults on corporate, consumer and government debt, the availability and cost of capital, and fallout from the housing and sub-prime mortgage crisis. Insurance companies, in particular, may be significantly affected by changes in interest rates, catastrophic events, price and market competition, the imposition of premium rate caps, or other changes in government regulation or tax law and/or rate regulation, which may have an adverse impact on their profitability. The financials sector has experienced significant losses in the recent past, and the impact of more stringent capital requirements and of recent or future regulation on any individual financial company or on the sector as a whole cannot be predicted. In recent years, cyberattacks and technology malfunctions and failures have become increasingly frequent in this sector and have caused significant losses. |
| ● | Healthcare Sector. Companies in the healthcare sector are subject to extensive government regulation and their profitability can be significantly affected by restrictions on government reimbursement for medical expenses, rising costs of medical products and services, pricing pressure (including price discounting), limited product lines, and an increased emphasis on the delivery of healthcare through outpatient services. The costs associated with developing new drugs can be significant, and the results are unpredictable. Newly developed drugs may be susceptible to product obsolescence due to intense competition from new products and less costly generic products. Moreover, the process for obtaining regulatory approval by governmental regulatory authorities is long and costly and there can be no assurance that the necessary approvals will be obtained or maintained. The values of many companies in the healthcare sector also are dependent on the development, protection and exploitation of intellectual property rights and other proprietary information, and the profitability of these companies may be significantly affected by such things as the expiration of patents or the loss of, or the inability to enforce, intellectual property rights. |
| Notes to the Financial Statements | CoreValues Alpha Greater
China Growth ETF |
September 30, 2024
| ● | Industrials Sector. Companies in the industrials sector can be significantly affected by supply and demand for specific products or services and for Industrials Sector products in general; a decline in demand for products due to rapid technological developments and frequent new product introduction; government regulation, world events and economic conditions; and the risks associated with potential environmental damage and product liability claims. |
| ● | Information Technology Sector. Market or economic factors impacting information technology companies and companies that rely heavily on technological advances could have a significant effect on the value of the Fund’s investments. The value of stocks of information technology companies and companies that rely heavily on technology is particularly vulnerable to rapid changes in technology product cycles, rapid product obsolescence, government regulation and competition, both domestically and internationally, including competition from foreign competitors with lower production costs. Stocks of information technology companies and companies that rely heavily on technology, especially those of smaller, less-seasoned companies, tend to be more volatile than the overall market. Information technology companies are heavily dependent on patent and intellectual property rights, the loss or impairment of which may adversely affect profitability. Information technology companies and companies that rely heavily on technology also may be prone to operational and information security risks resulting from cyberattacks and/or technological malfunctions. |
| C. | Growth Investing Risks. The Fund will invest in companies that appear to be growth-oriented. Growth companies are those that the Sub-Adviser believes will have revenue and earnings that grow faster than the economy as a whole, offering above-average prospects for capital appreciation and little or no emphasis on dividend income. If the Sub-Adviser’s perceptions of a company’s growth potential are wrong, the securities purchased may not perform as expected, reducing the Fund’s return. |
As with any investment, there is a risk that you could lose all or a portion of your principal investment in the Fund. The Fund is subject to the above principal risk, as well as other principal risks which may adversely affect the Fund’s NAV, trading price, yield, total return and/or ability to meet its objective. For more information about the risks of investing in the Fund, see the section in the Fund’s Prospectus titled “Additional Information About the Fund — Principal Risks of Investing in the Fund.”
| NOTE 4 – COMMITMENTS AND OTHER RELATED PARTY TRANSACTIONS |
The Adviser serves as investment adviser to the Fund pursuant to an investment advisory agreement between the Adviser and the Trust, on behalf of the Fund (the “Advisory Agreement”), and, pursuant to the Advisory Agreement, provides investment advice to the Fund and oversees the day- to-day operations of the Fund, subject to the direction and oversight of the Board. The Adviser provides oversight of the Sub-Adviser and review of the Sub-Adviser’s performance. The Adviser is also responsible for trading portfolio securities for the Fund, including selecting broker-dealers to execute purchase and sale transactions, subject to the supervision of the Board.
Pursuant to the Advisory Agreement, the Fund pays the Adviser a unitary management fee (the “Investment Advisory Fee”) based on the average daily net assets of the Fund as follows:
| Investment Advisory Fee | | Investment Advisory Fee After Waiver |
| 0.89% | | 0.75% |
The Adviser has contractually agreed to reduce its Management Fee for the Fund to 0.75% until at least January 31, 2026 (the “Fee Waiver Agreement”). The Fee Waiver Agreement may be terminated only by, or with the consent of, the Board. Any waived Investment Advisory Fees are not able to be recouped by the Adviser under the Fee Waiver Agreement. Investment Advisory Fees for the period ended September 30, 2024 are disclosed in the Statement of Operations.
Out of the Investment Advisory Fees, the Adviser is obligated to pay or arrange for the payment of substantially all expenses of the Fund, including the cost of sub- advisory, transfer agency, custody, fund administration, and all other related services necessary for the Fund to operate. Under the Advisory Agreement, the Adviser has agreed to pay, or require the Sub-Adviser to pay, all expenses incurred by the Fund except for interest charges on any borrowings, dividends and other expenses on securities sold short, taxes, brokerage commissions and other expenses incurred in placing orders for the purchase and sale of securities and other investment instruments, acquired fund fees and expenses, accrued deferred tax liability, extraordinary expenses, distribution fees and expenses paid by the Fund under any distribution plan adopted pursuant to Rule 12b-1 under the 1940 Act (collectively, “Excluded Expenses”). The Investment Advisory Fees incurred are paid monthly to the Adviser.
| Notes to the Financial Statements | CoreValues Alpha Greater
China Growth ETF |
September 30, 2024
MSA serves as investment sub-adviser to the Fund, pursuant to the sub-advisory agreement between the Adviser and the Sub-Adviser with respect to the Fund (the “Sub-Advisory Agreement”). Pursuant to the Sub-Advisory Agreement, MSA is responsible for the day- to- day management of the Fund’s portfolio, including determining the securities purchased and sold by the Fund, subject to the supervision of the Adviser and the Board. For its services, MSA is paid a fee by the Adviser, which fee is calculated daily and paid monthly, at an annual rate of 0.02% of the Fund’s average daily net assets (the “Sub-Advisory Fee”). The Sub-Adviser has agreed to assume the Adviser’s obligation to pay all expenses incurred by the Fund, except for the Sub-Advisory Fee payable to the Sub-Adviser and Excluded Expenses. For assuming the payment obligation, the Adviser has agreed to pay the Sub-Adviser a corresponding share of profits, if any, generated by the Fund’s Investment Advisory Fees, less a contractual fee retained by the Adviser. Expenses incurred by the Fund and paid by the Sub-Advisers include fees charged by Tidal, as defined below.
Tidal ETF Services LLC (“Tidal”), a Tidal Financial Group company and an affiliate of the Adviser, serves as the Fund’s administrator and, in that capacity, performs various administrative and management services for the Fund. Tidal coordinates the payment of Fund-related expenses and manages the Trust’s relationships with its various service providers.
U.S. Bancorp Fund Services, LLC, doing business as U.S. Bank Global Fund Services (“Fund Services”), serves as the Fund’s sub-administrator, fund accountant and transfer agent. In those capacities, Fund Services performs various administrative and accounting services for the Fund. Fund Services prepares various federal and state regulatory filings, reports and returns for the Fund, including regulatory compliance monitoring and financial reporting; prepares reports and materials to be supplied to the Board; and monitors the activities of the Fund’s custodian. U.S. Bank N.A. (the “Custodian”), an affiliate of Fund Services, serves as the Fund’s custodian.
Foreside Fund Services, LLC (the “Distributor”) acts as the Fund’s principal underwriter in a continuous public offering of the Fund’s shares.
Certain officers and a trustee of the Trust are affiliated with the Adviser. Neither the affiliated trustee nor the Trust’s officers receive compensation from the Fund.
The Board has adopted a Distribution (Rule 12b-1) Plan (the “Plan”) pursuant to Rule 12b-1 under the 1940 Act. In accordance with the Plan, the Fund is authorized to pay an amount up to 0.25% of its average daily net assets each year to pay distribution fees for the sale and distribution of its Shares. No Rule 12b-1 fees are currently paid by the Fund, and there are no plans to impose these fees. However, in the event Rule 12b-1 fees are charged in the future, because the fees are paid out of the Fund’s assets on an ongoing basis, over time these fees will increase the cost of your investment and may cost you more than certain other types of sales charges.
| NOTE 5 – PURCHASES AND SALES OF SECURITIES |
For the period ended September 30, 2024, the cost of purchases and proceeds from the sales or maturities of securities, excluding short-term investments, U.S. government securities, and in-kind transactions were $13,191,821 and $8,237,757, respectively.
For the period ended September 30, 2024, there were no purchases or sales of long-term U.S. government securities.
For the period ended September 30, 2024, in-kind transactions associated with creations and redemptions for the Fund were $2,209,544 and $0, respectively.
| NOTE 6 – INCOME TAXES AND DISTRIBUTIONS TO SHAREHOLDERS |
The tax character of distributions paid during the period ended September 30, 2024 were as follows:
| Distributions paid from: | | September 30, 2024 |
| Ordinary Income | | $15,892 |
| Notes to the Financial Statements | CoreValues Alpha Greater
China Growth ETF |
September 30, 2024
As of the most recent fiscal period ended September 30, 2024, the components of distributable earnings on a tax basis were as follows:
| Investments, at cost(a) | | $ | 7,188,767 | |
| Gross tax unrealized appreciation | | | 2,114,003 | |
| Gross tax unrealized depreciation | | | (170,206 | ) |
| Net tax unrealized appreciation (depreciation) | | | 1,943,797 | |
| Undistributed ordinary income (loss) | | | 175,958 | |
| Undistributed long-term capital gain (loss) | | | — | |
| Total distributable earnings | | | 175,958 | |
| Other accumulated gain (loss) | | | (268,842 | ) |
| Total distributable earnings (accumulated losses) | | $ | 1,850,913 | |
(a) The differences between book and tax-basis unrealized appreciation were attributable primarily to the treatment of wash sales and PFIC mark to market adjustments.
Net capital losses incurred after October 31 (post-October losses) and net investment losses incurred after December 31 (late-year losses), and within the taxable year, may be elected to be deferred to the first business day of the Fund’s next taxable year. As of the most recent fiscal period ended September 30, 2024, the Fund had not elected to defer any post-October or late year losses.
As of the most recent fiscal period ended September 30, 2024, the Fund had a short-term capital loss carryover of $268,842, which does not expire.
| NOTE 7 – SHARE TRANSACTIONS |
Shares of the Fund are listed and traded on the NYSE Arca, Inc. Market prices for the shares may be different from their NAV. The Fund issues and redeems shares on a continuous basis at NAV generally in large blocks of shares, called (“Creation Units”). Creation Units are issued and redeemed principally in-kind for securities included in a specified universe. Once created, shares generally trade in the secondary market at market prices that change throughout the day. Except when aggregated in Creation Units, shares are not redeemable securities of the Fund. Creation Units may only be purchased or redeemed by Authorized Participants. An Authorized Participant is either (i) a broker-dealer or other participant in the clearing process through the Continuous Net Settlement System of the National Securities Clearing Corporation or (ii) a Depository Trust Company participant and, in each case, must have executed a Participant Agreement with the Distributor. Most retail investors do not qualify as Authorized Participants nor have the resources to buy and sell whole Creation Units. Therefore, they are unable to purchase or redeem the shares directly from the Fund. Rather, most retail investors may purchase shares in the secondary market with the assistance of a broker and are subject to customary brokerage commissions or fees.
The Fund currently offers one class of shares, which has no front- end sales load, no deferred sales charge, and no redemption fee. A fixed transaction fee is imposed for the transfer and other transaction costs associated with the purchase or sale of Creation Units. The standard fixed transaction fee for the Fund is $500, payable to the Custodian. The fixed transaction fee may be waived on certain orders if the Fund’s Custodian has determined to waive some or all of the costs associated with the order or another party, such as the Adviser, has agreed to pay such fee. In addition, a variable fee may be charged on all cash transactions or substitutes for Creation Units and Redemption Units of up to a maximum of 2% of the value of the Creation Units and Redemption Units subject to the transaction. Variable fees received by the Fund, if any, are disclosed in the capital shares transactions section of the Statement of Changes in Net Assets. The Fund may issue an unlimited number of shares of beneficial interest, with no par value. All shares of the Fund have equal rights and privileges.
| NOTE 8 – RECENT MARKET EVENTS |
U.S. and international markets have experienced and may continue to experience significant periods of volatility in recent years and months due to a number of economic, political and global macro factors including rising inflation, uncertainty regarding central banks’ rates, the possibility of a national or global recession, trade tensions, political events, the war between Russia and Ukraine, and significant conflict between Israel and Hamas in the Middle East. As a result of continuing political tensions and armed conflicts, including the war between Ukraine and Russia, the U.S. and the European Union imposed sanctions on certain Russian individuals and companies, including certain financial institutions, and have limited certain exports and imports to and from Russia. The war has contributed to recent market volatility and may continue to do so. The Middle East conflict has led to significant loss of life, damaged infrastructure and escalated tensions both in the region and globally. These developments, as well as other events, could result in further market volatility and negatively affect financial asset prices, the liquidity of certain securities and the normal operations of securities exchanges and other markets, despite government efforts to address market disruptions. As a result, the risk environment remains elevated. The Adviser and Sub-Adviser will monitor developments and seek to manage the Fund in a manner consistent with achieving the Fund’s investment objective, but there can be no assurance that they will be successful in doing so.
| Notes to the Financial Statements | CoreValues Alpha Greater
China Growth ETF |
September 30, 2024
| NOTE 9 – SUBSEQUENT EVENTS |
In preparing these financial statements, management has evaluated events and transactions for potential recognition or disclosure through the date the financial statements were issued. Management has determined that there are no subsequent events that would need to be recorded or disclosed in the Fund’s financial statements.
| Report of Independent | CoreValues Alpha |
| Registered Public Accounting Firm | Greater China Growth ETF |
To the Shareholders of CoreValues Alpha Greater China Growth ETF and
Board of Trustees of Tidal Trust II
Opinion on the Financial Statements
We have audited the accompanying statement of assets and liabilities, including the schedule of investments, of CoreValues Alpha Greater China Growth ETF (the “Fund”), a series of Tidal Trust II, as of September 30, 2024, the related statements of operations and changes in net assets, the financial highlights, and the related notes for the period from October 16, 2023 (commencement of operations) through September 30, 2024 (collectively referred to as the “financial statements”). In our opinion, the financial statements present fairly, in all material respects, the financial position of the Fund as of September 30, 2024, the results of its operations, the changes in net assets, and the financial highlights for the period indicated above, in conformity with accounting principles generally accepted in the United States of America.
Basis for Opinion
These financial statements are the responsibility of the Fund’s management. Our responsibility is to express an opinion on the Fund’s financial statements based on our audit. We are a public accounting firm registered with the Public Company Accounting Oversight Board (United States) (“PCAOB”) and are required to be independent with respect to the Fund in accordance with the U.S. federal securities laws and the applicable rules and regulations of the Securities and Exchange Commission and the PCAOB.
We conducted our audit in accordance with the standards of the PCAOB. Those standards require that we plan and perform the audit to obtain reasonable assurance about whether the financial statements are free of material misstatement whether due to error or fraud.
Our audit included performing procedures to assess the risks of material misstatement of the financial statements, whether due to error or fraud, and performing procedures that respond to those risks. Such procedures included examining, on a test basis, evidence regarding the amounts and disclosures in the financial statements. Our procedures included confirmation of securities owned as of September 30, 2024, by correspondence with the custodian and brokers; when replies were not received from brokers, we performed other auditing procedures. Our audit also included evaluating the accounting principles used and significant estimates made by management, as well as evaluating the overall presentation of the financial statements. We believe that our audit provides a reasonable basis for our opinion.
We have served as the auditor of one or more of Tidal Investment LLC’s Investment companies since 2020.

COHEN & COMPANY, LTD.
Philadelphia, Pennsylvania
November 27, 2024
| Other Non-Audited Information | CoreValues Alpha Greater |
| | China Growth ETF |
September 30, 2024
QUALIFIED DIVIDEND INCOME/DIVIDENDS RECEIVED DEDUCTION
For the period ended September 30, 2024, certain dividends paid by the Fund may be subject to a maximum tax rate of 23.8%, as provided for by the Jobs and Growth Tax Relief Reconciliation Act of 2003 and the Tax Cuts and Jobs Act of 2017. The percentage of dividends declared from ordinary income designated as qualified dividend income for the period ended September 30, 2024, was as follows:
| CoreValues Alpha Greater China Growth ETF | 48.85% |
For corporate shareholders, the percent of ordinary income distributions qualifying for the corporate dividends received deduction for the period ended September 30, 2024, was as follows:
| CoreValues Alpha Greater China Growth ETF | 0.07% |
The percentage of taxable ordinary income distributions that are designated as short-term capital gain distributions under Internal Revenue Section 871(k)(2)(c) for the period ended September 30, 2024, was as follows:
| CoreValues Alpha Greater China Growth ETF | 0.00% |
| (b) | Financial Highlights are included within the financial statements filed under Item 7(a) of this Form.” |
Item 8. Changes in and Disagreements with Accountants for Open-End Investment Companies.
There have been no changes in or disagreements with the Funds’ accountants.
Item 9. Proxy Disclosure for Open-End Investment Companies.
There were no matters submitted to a vote of shareholders during the period covered by the report.
Item 10. Remuneration Paid to Directors, Officers, and Others of Open-End Investment Companies.
See Item 7(a). Under the Investment Advisory Agreement, in exchange for a single unitary management fee from each Fund, the Adviser has agreed to pay all expenses incurred by the Funds, including Trustee compensation, except for certain excluded expenses.
Item 11. Statement Regarding Basis for Approval of Investment Advisory Contract.
Not applicable.
Item 12. Disclosure of Proxy Voting Policies and Procedures for Closed-End Management Investment Companies.
Not applicable to open-end investment companies.
Item 13. Portfolio Managers of Closed-End Management Investment Companies.
Not applicable to open-end investment companies.
Item 14. Purchases of Equity Securities by Closed-End Management Investment Company and Affiliated Purchasers.
Not applicable to open-end investment companies.
Item 15. Submission of Matters to a Vote of Security Holders.
Not Applicable.
Item 16. Controls and Procedures.
| (a) | The Registrant’s President/Principal Executive Officer and Treasurer/Principal Financial Officer have reviewed the Registrant’s disclosure controls and procedures (as defined in Rule 30a-3(c) under the Investment Company Act of 1940 (the “Act”)) as of a date within 90 days of the filing of this report, as required by Rule 30a-3(b) under the Act and Rules 13a-15(b) or 15d-15(b) under the Securities Exchange Act of 1934. Based on their review, such officers have concluded that the disclosure controls and procedures are effective in ensuring that information required to be disclosed in this report is appropriately recorded, processed, summarized and reported and made known to them by others within the Registrant and by the Registrant’s service provider. |
| (b) | There were no changes in the Registrant’s internal control over financial reporting (as defined in Rule 30a-3(d) under the Act) that occurred during the period covered by this report that have materially affected, or are reasonably likely to materially affect, the Registrant’s internal control over financial reporting. |
Item 17. Disclosure of Securities Lending Activities for Closed-End Management Investment Companies
Not applicable to open-end investment companies.
Item 18. Recovery of Erroneously Awarded Compensation.
(a) Not Applicable
(b) Not Applicable
Item 19. Exhibits.
(2) Any policy required by the listing standards adopted pursuant to Rule 10D-1 under the Exchange Act (17 CFR 240.10D-1) by the registered national securities exchange or registered national securities association upon which the registrant’s securities are listed. Not applicable.
(3) A separate certification for each principal executive officer and principal financial officer pursuant to Section 302 of the Sarbanes-Oxley Act of 2002. Filed herewith.
(4) Any written solicitation to purchase securities under Rule 23c-1 under the Act sent or given during the period covered by the report by or on behalf of the registrant to 10 or more persons. Not applicable.
(5) Change in the registrant’s independent public accountant. Provide the information called for by Item 4 of Form 8-K under the Exchange Act (17 CFR 249.308). Unless otherwise specified by Item 4, or related to and necessary for a complete understanding of information not previously disclosed, the information should relate to events occurring during the reporting period. Not applicable.
SIGNATURES
Pursuant to the requirements of the Securities Exchange Act of 1934 and the Investment Company Act of 1940, the registrant has duly caused this report to be signed on its behalf by the undersigned, thereunto duly authorized.
| (Registrant) | Tidal Trust II | |
| | | |
| By (Signature and Title)* | /s/ Eric W. Falkeis | |
| | Eric W. Falkeis, President/Principal Executive Officer | |
| | | |
| Date | December 6, 2024 | |
Pursuant to the requirements of the Securities Exchange Act of 1934 and the Investment Company Act of 1940, this report has been signed below by the following persons on behalf of the registrant and in the capacities and on the dates indicated.
| By (Signature and Title)* | /s/ Eric W. Falkeis | |
| | Eric W. Falkeis, President/Principal Executive Officer | |
| | | |
| Date | December 6, 2024 | |
| By (Signature and Title)* | /s/ Aaron J. Perkovich | |
| | Aaron J. Perkovich, Treasurer/Principal Financial Officer | |
| | | |
| Date | December 6, 2024 | |
| * | Print the name and title of each signing officer under his or her signature. |