Exhibit 99.2
VCI Global Limited and Subsidiaries
BVI Registration Number: 2035574
Interim Condensed Consolidated Financial Statements
VCI Global Limited and Subsidiaries
Interim condensed consolidated financial statements (unaudited)
Interim condensed consolidated statements of financial position
| | | Note | | | As of
June 30, 2023
(Unaudited) | | | As of
December 31,
2022
(Audited) | |
| | | | | | RM | | | USD | | | RM | |
| ASSETS | | | | | | | | | | | | |
| | | | | | | | | | | | | |
| Non-current assets | | | | | | | | | | | | |
| Financial assets measured at fair value through other comprehensive income | | | 4 | | | | 7,002,234 | | | | 1,500,082 | | | | 12,819,747 | |
| Financial assets measured at fair value through profit and loss | | | 5 | | | | 76,044 | | | | 16,291 | | | | 72,295 | |
| Property and equipment | | | 6 | | | | 2,081,771 | | | | 445,976 | | | | 1,551,579 | |
| Right-of-use of assets | | | 7 | | | | 555,445 | | | | 118,992 | | | | 714,143 | |
| Deferred initial public offering expense | | | 8 | | | | - | | | | - | | | | 6,564,162 | |
| Deferred tax assets | | | 9 | | | | 339,650 | | | | 72,763 | | | | 339,650 | |
| Total non-current assets | | | | | | | 10,055,144 | | | | 2,154,104 | | | | 22,061,576 | |
| | | | | | | | | | | | | | | | | |
| Current assets | | | | | | | | | | | | | | | | |
| Trade and other receivables | | | 10 | | | | 55,983,342 | | | | 11,993,261 | | | | 15,759,533 | |
| Amount due from related parties | | | | | | | - | | | | - | | | | 7,000 | |
| Cash and bank balances | | | 11 | | | | 15,328,861 | | | | 3,283,888 | | | | 3,995,995 | |
| Total current assets | | | | | | | 71,312,203 | | | | 15,277,149 | | | | 19,762,528 | |
| | | | | | | | | | | | | | | | | |
| Total assets | | | | | | | 81,367,347 | | | | 17,431,253 | | | | 41,824,104 | |
| | | | | | | | | | | | | | | | | |
| LIABILITIES AND EQUITY | | | | | | | | | | | | | | | | |
| | | | | | | | | | | | | | | | | |
| Current liabilities | | | | | | | | | | | | | | | | |
| Trade and other payables | | | 12 | | | | 6,395,343 | | | | 1,370,068 | | | | 10,408,318 | |
| Bank and other borrowings | | | 15 | | | | 682,410 | | | | 146,192 | | | | 783,542 | |
| Lease liabilities | | | 14 | | | | 162,837 | | | | 34,884 | | | | 322,208 | |
| Income tax payable | | | | | | | 1,833,795 | | | | 392,852 | | | | 1,716,794 | |
| Total current liabilities | | | | | | | 9,074,385 | | | | 1,943,996 | | | | 13,230,862 | |
| | | | | | | | | | | | | | | | | |
| Non-current liabilities | | | | | | | | | | | | | | | | |
| Bank and other borrowings | | | 15 | | | | 309,331 | | | | 66,268 | | | | 309,331 | |
| Lease liabilities | | | 14 | | | | 422,751 | | | | 90,566 | | | | 422,751 | |
| Amount due to related parties | | | | | | | 2,017,705 | | | | 432,251 | | | | 3,586,646 | |
| Total non-current liabilities | | | | | | | 2,749,787 | | | | 589,085 | | | | 4,318,728 | |
| | | | | | | | | | | | | | | | | |
| Total liabilities | | | | | | | 11,824,172 | | | | 2,533,081 | | | | 17,549,590 | |
| | | | | | | | | | | | | | | | | |
| Capital and reserves | | | | | | | | | | | | | | | | |
| Share capital | | | 16 | | | | 37,069,050 | | | | 7,941,269 | | | | 13,127,427 | |
| Capital reserve | | | 17 | | | | 6,532,560 | | | | 1,399,465 | | | | 6,532,560 | |
| Currency translation reserve | | | 18 | | | | 1,272,834 | | | | 272,678 | | | | - | |
| Retained earnings | | | | | | | 27,459,238 | | | | 5,882,566 | | | | 6,255,851 | |
| Attributable to equity owners of the Company | | | | | | | 72,333,682 | | | | 15,495,978 | | | | 25,915,838 | |
| Non-controlling interests | | | | | | | (2,790,507 | ) | | | (597,806 | ) | | | (1,641,324 | ) |
| Total equity | | | | | | | 69,543,175 | | | | 14,898,172 | | | | 24,274,514 | |
| | | | | | | | | | | | | | | | | |
| Total equity and liabilities | | | | | | | 81,367,347 | | | | 17,431,253 | | | | 41,824,104 | |
The accompanying notes form an integral part of the unaudited interim condensed consolidated financial statements.
VCI Global Limited and Subsidiaries
Interim condensed consolidated financial statements (unaudited)
Interim condensed consolidated statements of comprehensive income (unaudited)
| | | Note | | Six months ended
June 30,
2023 | | | Six months
ended
June 30,
2022 | |
| | | | | RM | | | USD | | | RM | |
| Revenue | | 19 | | | 44,463,195 | | | | 9,525,310 | | | | 15,931,394 | |
| Revenue – related party | | | | | - | | | | - | | | | 5,443,238 | |
| Total revenue | | | | | 44,463,195 | | | | 9,525,310 | | | | 21,374,632 | |
| Other income | | 20 | | | 1,054,906 | | | | 225,992 | | | | 109,802 | |
| Fair value adjustment on financial assets measured at fair value through profit and loss | | | | | - | | | | - | | | | 1,679,842 | |
| Cost of services | | 21 | | | (6,049,234 | ) | | | (1,295,922 | ) | | | (2,216,929 | ) |
| Depreciation | | | | | (274,425 | ) | | | (58,790 | ) | | | (11,203 | ) |
| Directors’ fees | | | | | (5,435,664 | ) | | | (1,164,477 | ) | | | (141,000 | ) |
| Employee benefits expenses | | 22 | | | (7,770,225 | ) | | | (1,664,608 | ) | | | (4,807,371 | ) |
| Impairment allowance on trade receivables | | | | | - | | | | - | | | | (183,546 | ) |
| Rental expenses | | | | | (149,951 | ) | | | (32,124 | ) | | | (156,673 | ) |
| Legal and professional fees | | | | | (1,473,823 | ) | | | (315,736 | ) | | | (117,377 | ) |
| Finance cost | | 23 | | | (15,875 | ) | | | (3,401 | ) | | | (8,685 | ) |
| Other operating expenses | | 24 | | | (3,668,557 | ) | | | (785,912 | ) | | | (1,474,666 | ) |
| Profit before income tax | | 25 | | | 20,680,347 | | | | 4,430,332 | | | | 14,046,826 | |
| Income tax expense | | 26 | | | (626,143 | ) | | | (134,138 | ) | | | (283,648 | ) |
| Profit for the period | | | | | 20,054,204 | | | | 4,296,194 | | | | 13,763,178 | |
| Other comprehensive income (loss): | | | | | | | | | | | | | | |
| Exchange differences on translating foreign operations | | | | | 1,272,834 | | | | 272,678 | | | | - | |
| Fair value adjustment on financial assets measured at fair value through other comprehensive income | | | | | - | | | | - | | | | (4,199,770 | ) |
| Total comprehensive income for the period | | | | | 21,327,038 | | | | 4,568,872 | | | | 9,563,408 | |
| | | | | | | | | | | | | | | |
| Profit attributable to: | | | | | | | | | | | | | | |
| Equity owners of the Company | | | | | 21,203,387 | | | | 4,542,382 | | | | 13,568,156 | |
| Non-controlling interests | | | | | (1,149,183 | ) | | | (246,188 | ) | | | 195,022 | |
| Total | | | | | 20,054,204 | | | | 4,296,194 | | | | 13,763,178 | |
| | | | | | | | | | | | | | | |
| Total comprehensive income attributable to: | | | | | | | | | | | | | | |
| Equity owners of the Company | | | | | 22,476,221 | | | | 4,815,060 | | | | 9,368,386 | |
| Non-controlling interests | | | | | (1,149,183 | ) | | | (246,188 | ) | | | 195,022 | |
| | | | | | 21,327,038 | | | | 4,568,872 | | | | 9,563,408 | |
| | | | | | | | | | | | | | | |
| Earnings per share - Basic and diluted | | | | | 0.55 | | | | 0.12 | | | | 0.40 | |
EARNINGS PER SHARE
| | | June 30, | |
| | | 2023 | | | 2022 | |
| Weighted average number of ordinary shares used in computing basic earnings | | | 36,292,259 | | | | 33,636,100 | |
| Weighted average number of ordinary shares used in computing diluted earnings | | | 36,292,259 | | | | 33,636,100 | |
The accompanying notes form an integral part of the unaudited interim condensed consolidated financial statements.
VCI Global Limited and Subsidiaries
Interim condensed consolidated financial statements (unaudited)
Interim condensed consolidated statements of changes in equity (Unaudited)
| | | Attributable to equity owners of the Company | | | | | | | |
| | | Share | | | Capital | | | Foreign
exchange | | | Retained | | | | | | Non-
controlling | | | Total | |
| | | capital | | | reserves | | | reserves | | | earnings | | | Total | | | interests | | | equity | |
| | | RM | | | RM | | | RM | | | RM | | | RM | | | RM | | | RM | |
| Balance at January , 2022 | | | 220,000 | | | | 6,532,566 | | | | - | | | | 12,981,936 | | | | 19,734,502 | | | | (371,259 | ) | | | 19,363,243 | |
| | | | | | | | | | | | | | | | | | | | | | | | | | | | | |
| Profit for the period | | | - | | | | - | | | | - | | | | 13,568,156 | | | | 13,568,156 | | | | 195,022 | | | | 13,763,178 | |
| | | | | | | | | | | | | | | | | | | | | | | | | | | | | |
| Other comprehensive loss | | | - | | | | - | | | | - | | | | (4,199,770 | ) | | | (4,199,770 | ) | | | - | | | | (4,199,770 | ) |
| | | | | | | | | | | | | | | | | | | | | | | | | | | | | |
| Total comprehensive income for the period | | | - | | | | - | | | | - | | | | 9,368,386 | | | | 9,368,386 | | | | 195,022 | | | | 9,563,408 | |
| | | | | | | | | | | | | | | | | | | | | | | | | | | | | |
| Issuance of share capital | | | 2,615,477 | | | | - | | | | - | | | | - | | | | 2,615,477 | | | | - | | | | 2,615,477 | |
| | | | | | | | | | | | | | | | | | | | | | | | | | | | | |
| Balance at June 30, 2022 | | | 2,835,477 | | | | 6,532,566 | | | | - | | | | 22,350,322 | | | | 31,718,365 | | | | (176,237 | ) | | | 31,542,128 | |
| | | | | | | | | | | | | | | | | | | | | | | | | | | | | |
| Balance at January 1, 2023 | | | 13,127,427 | | | | 6,532,560 | | | | - | | | | 6,255,851 | | | | 25,915,838 | | | | (1,641,324 | ) | | | 24,274,514 | |
| | | | | | | | | | | | | | | | | | | | | | | | | | | | | |
| Profit for the period | | | - | | | | - | | | | - | | | | 21,203,387 | | | | 21,203,387 | | | | (1,149,183 | ) | | | 20,054,204 | |
| | | | | | | | | | | | | | | | | | | | | | | | | | | | | |
| Exchange differences on translating foreign operations | | | - | | | | - | | | | 1,272,834 | | | | - | | | | 1,272,834 | | | | - | | | | 1,272,834 | |
| | | | | | | | | | | | | | | | | | | | | | | | | | | | | |
| Total comprehensive income for the period | | | - | | | | - | | | | 1,272,834 | | | | 21,203,387 | | | | 22,476,221 | | | | (1,149,183 | ) | | | 21,327,038 | |
| | | | | | | | | | | | | | | | | | | | | | | | | | | | | |
| Issuance of ordinary shares in initial public offering, net of issuance costs | | | 16,939,389 | | | | - | | | | - | | | | - | | | | 16,939,389 | | | | - | | | | 16,939,389 | |
| | | | | | | | | | | | | | | | | | | | | | | | | | | | | |
| Issuance of ordinary shares via share-swap arrangement | | | 7,002,234 | | | | - | | | | - | | | | - | | | | 7,002,234 | | | | - | | | | 7,002,234 | |
| | | | | | | | | | | | | | | | | | | | | | | | | | | | | |
| Balance at June 30, 2023 | | | 37,069,050 | | | | 6,532,560 | | | | 1,272,834 | | | | 27,459,238 | | | | 72,333,682 | | | | (2,790,507 | ) | | | 69,543,175 | |
The accompanying notes form an integral part of the interim condensed consolidated financial statements.
VCI Global Limited and Subsidiaries
Interim condensed consolidated financial statements (unaudited)
Interim condensed consolidated statements of cash flows (unaudited)
| | | Note | | Six months ended
June 30,
2023 | | | Six months
ended
June 30,
2022 | |
| | | | | RM | | | USD | | | RM | |
| Operating activities | | | | | | | | | | | | | | |
| Profit before income tax | | | | | 20,680,347 | | | | 4,430,332 | | | | 14,046,826 | |
| Adjustments for: | | | | | | | | | | | | | | |
| Impairment allowance on trade receivable | | | | | - | | | | - | | | | 183,546 | |
| Unrealised foreign exchange loss | | | | | 805,197 | | | | 172,498 | | | | - | |
| Depreciation of property and equipment | | | | | 115,727 | | | | 24,792 | | | | 11,203 | |
| Depreciation of right-of-use of assets | | | | | 158,698 | | | | 33,998 | | | | - | |
| Fair value adjustment on financial assets measured at fair value through profit and loss | | | | | - | | | | - | | | | (1,679,842 | ) |
| Gain on disposal of investment | | | | | (780,319 | ) | | | (167,167 | ) | | | - | |
| Gain on disposal of property and equipment | | | | | - | | | | - | | | | (1,891 | ) |
| Interest expense | | | | | 15,875 | | | | 3,401 | | | | 8,685 | |
| Interest income | | | | | (942 | ) | | | (202 | ) | | | (22 | ) |
| Operating cash flow before movement in working capital | | | | | 20,994,583 | | | | 4,497,652 | | | | 12,568,505 | |
| Trade and other receivables | | | | | (40,216,809 | ) | | | (8,615,611 | ) | | | (8,629,924 | ) |
| Trade and other payables | | | | | 2,551,187 | | | | 546,538 | | | | (4,804,822 | ) |
| Cash used in operations | | | | | (16,671,039 | ) | | | (3,571,421 | ) | | | (866,241 | ) |
| Interest received | | | | | - | | | | - | | | | 22 | |
| Income tax paid | | | | | (509,142 | ) | | | (109,073 | ) | | | 224,626 | |
| Net cash used in operating activities | | | | | (17,180,181 | ) | | | (3,680,494 | ) | | | (641,593 | ) |
| | | | | | | | | | | | | | | |
| Investing activities | | | | | | | | | | | | | | |
| Purchase of property and equipment | | | | | (645,919 | ) | | | (138,375 | ) | | | (33,896 | ) |
| Proceeds from disposal of property and equipment | | | | | - | | | | - | | | | 11,706 | |
| Interest paid | | | | | - | | | | - | | | | - | |
| Interest received | | | | | 942 | | | | 202 | | | | - | |
| Acquisition of financial assets measured at fair value through profit and loss | | | | | - | | | | - | | | | (156,120 | ) |
| Proceeds from disposal of financial assets measured at fair value through other comprehensive income | | | | | 13,600,066 | | | | 2,913,530 | | | | - | |
| Net cash generated from / (used in) investing activities | | | | | 12,955,089 | | | | 2,775,357 | | | | (178,310 | ) |
| | | | | | | | | | | | | | | |
| Financing activities | | | | | | | | | | | | | | |
| Proceeds from issuance of shares | | | | | - | | | | - | | | | 2,615,477 | |
| Proceeds from initial public offering, net of issuance costs | | | | | 17,457,899 | | | | 3,739,990 | | | | - | |
| Interest paid | | | | | (15,875 | ) | | | (3,401 | ) | | | - | |
| Repayments of other borrowings | | | | | (101,132 | ) | | | (21,665 | ) | | | (54,781 | ) |
| Repayment of advances to related parties | | | | | (1,568,941 | ) | | | (336,113 | ) | | | (3,149,847 | ) |
| Repayment of operating leases | | | | | (159,371 | ) | | | (34,142 | ) | | | - | |
| Net cash generated from / (used in) financing activities | | | | | 15,612,580 | | | | 3,344,669 | | | | (589,151 | ) |
| | | | | | | | | | | | | | | |
| Net increase / (decrease) in cash and cash equivalents | | | | | 11,387,488 | | | | 2,439,532 | | | | (1,409,054 | ) |
| Effect of currency translation on cash and cash equivalents | | | | | (54,622 | ) | | | (11,702 | ) | | | - | |
| Cash and bank balances at beginning of the period | | | | | 3,995,995 | | | | 856,058 | | | | 3,122,947 | |
| Cash and bank balances at end of the period | | | | | 15,328,861 | | | | 3,283,888 | | | | 1,713,893 | |
The accompanying notes form an integral part of the unaudited interim condensed consolidated financial statements.
VCI Global Limited and Subsidiaries
Interim condensed consolidated financial statements (unaudited)
Notes to the unaudited interim condensed consolidated financial statements
These notes form an integral part of the unaudited interim condensed consolidated financial statements.
The unaudited interim condensed consolidated financial statements were authorised for issue by the Board of Directors on November 30, 2022.
| 1 | ORGANIZATION AND PRINCIPAL ACTIVITIES |
Organization and reorganization
VCI Global Limited was incorporated in the British Virgin Islands on April 29, 2020. The registered office of the Company is situated at Vistra Corporate Services Centre, Wickhams Cay II, Road Town, Tortola, British Virgin Islands. The principal place of business of the Company is situation at B03-C-8, Menara 3A, KL Eco City, No.3 Jalan Bangsar, 59200 Kuala Lumpur, Malaysia.
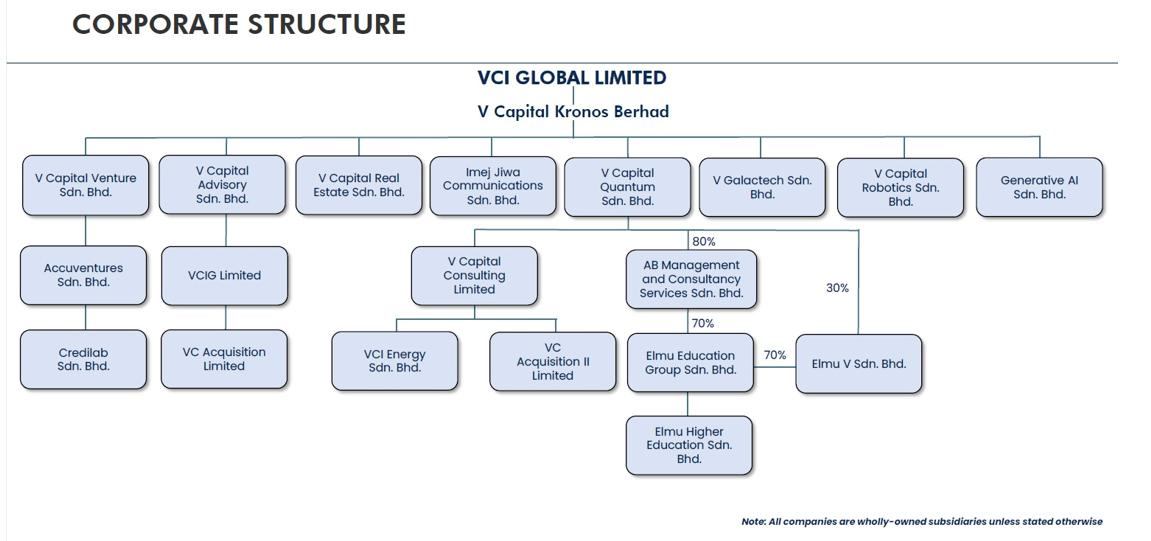
The Group structure which represents the operating subsidiaries and dormant companies as the reporting date is as follow:
VCI Global Limited and Subsidiaries
Interim condensed consolidated financial statements (unaudited)
The Company and its subsidiaries are in the table as follows:
| | | | | Percentage of effective ownership | | | | |
| Name | | Date of
incorporation | | June 30,
2023 | | 31 December
2022 | | Place of
incorporation | | Principal activities |
| | | | | % | | % | | | | |
| VCI Global Limited | | 29.04.2020 | | 100 | | 100 | | British Virgin Island | | Holding company |
| V Capital Kronos Berhad | | 01.09.2020 | | 100 | | 100 | | Malaysia | | Holding company |
| V Capital Venture Sdn Bhd | | 19.08.2014 | | 100 | | 100 | | Malaysia | | Provision of corporate and business advisory services in corporate finance, corporate structuring and restructuring, listings on recognised stock exchanges, and fintech advisory |
| Accuventures Sdn Bhd | | 22.06.2015 | | 100 | | 80 | | Malaysia | | Provision of technology development, computer software programming and holding company. |
| Credilab Sdn Bhd | | 26.10.2020 | | 100 | | 80 | | Malaysia | | Carry on licensed money lending activities, consulting, information technology development, and computer software programming |
| V Capital Advisory Sdn Bhd | | 12.02.2018 | | 100 | | 100 | | Malaysia | | Provision of corporate and business advisory in relation to corporate listing exercise, equity investment, corporate restructuring, merger and acquisition and corporate finance. |
| V Capital Quantum Sdn Bhd | | 18.01.2018 | | 100 | | 100 | | Malaysia | | Provision of information technology development, business consultancy services and holding company. |
| V Capital Consulting Limited | | 01.03.2016 | | 100 | | 100 | | British Virgin Island | | Provision of corporate and business advisory services in corporate finance, corporate structuring and restructuring, listings on recognised stock exchanges, and fintech advisory |
| Generative AI Sdn Bhd | | 21.07.2023 | | 100 | | - | | Malaysia | | Provision of Artificial Intelligence, image processing, communication, networking, & process control software services. |
| Imej Jiwa Communications Sdn Bhd | | 29.10.2012 | | 100 | | 100 | | Malaysia | | Provision of investor relation consultation services. |
| AB Management and Consultancy Services Sdn Bhd | | 05.04.2020 | | 80 | | 80 | | Malaysia | | Holding company |
| Elmu Education Group Sdn Bhd | | 03.12.2020 | | 56 | | 56 | | Malaysia | | Education and training services |
| Elmu V Sdn Bhd | | 18.05.2021 | | 69.2 | | 69.2 | | Malaysia | | Education and training services |
| Elmu Higher Education Sdn Bhd | | 24.05.2021 | | 56 | | 56 | | Malaysia | | Education and training services |
| V Capital Real Estate Sdn Bhd | | 05.07.2021 | | 100 | | 100 | | Malaysia | | Provision of consultancy services in relation to real estate |
| V Capital Robotics Sdn Bhd | | 12.10.2021 | | 100 | | 100 | | Malaysia | | Dormant |
| VCI Energy Sdn Bhd (F.K.A TGI V Sdn Bhd) | | 12.11.2021 | | 100 | | 100 | | Malaysia | | Dormant |
| VCIG Limited | | 29.04.2020 | | 100 | | 100 | | British Virgin Island | | Dormant |
| V Galactech Sdn Bhd | | 12.01.2022 | | 100 | | 100 | | Malaysia | | Provision of information technology development |
| VC Acquisition Ltd | | 04.01.2022 | | 100 | | 100 | | Malaysia | | Dormant |
| VC Acquisition II Ltd | | 04.01.2022 | | 100 | | 100 | | British Virgin Island | | Dormant |
VCI Global Limited and Subsidiaries
Interim condensed consolidated financial statements (unaudited)
Principal activities
The Company is a holding company. The principal activities of the Company and its subsidiaries (collectively referred to as the “Company” or “the Group”) are the provision of business strategy consultancy and technology development solution consultancy. The Company is headquartered in Malaysia and conducts its primary operations through its significant direct and indirectly held subsidiaries that are incorporated and domiciled in Malaysia, namely V Capital Kronos Berhad, V Capital Quantum Sdn. Bhd., and V Capital Consulting Limited where was incorporated in the British Virgin Islands.
| 2 | SUMMARY OF SIGNIFICANT ACCOUNTING POLICIES |
BASIS OF ACCOUNTING
The unaudited interim condensed consolidated financial statements have been prepared in accordance with the historical cost basis, except as disclosed in the accounting policies below, and are drawn up in accordance with the provisions of the International Financial Reporting Standards (“IFRS”) as issued by the International Accounting Standards Board (“IASB”).
Historical cost is generally based on the fair value of the consideration given in exchange for goods and services.
Fair value is the price that would be received to sell an asset or paid to transfer a liability in an orderly transaction between market participants at the measurement date, regardless of whether that price is directly observable or estimated using another valuation technique. In estimating the fair value of an asset or a liability, the Company takes into account the characteristics of the asset or liability which market participants would take into account when pricing the asset or liability at the measurement date. Fair value for measurement and/or disclosure purposes in these unaudited interim condensed consolidated financial statements is determined on such a basis.
In addition, for financial reporting purposes, fair value measurements are categorised into Level 1, 2 or 3 based on the degree to which the inputs to the fair value measurements are observable and the significance of the inputs to the fair value measurement in its entirety, which are described as follows:
| | ● | Level 1 inputs are quoted prices (unadjusted) in active markets for identical assets or liabilities that the entity can access at the measurement date; |
| | ● | Level 2 inputs are inputs, other than quoted prices included within Level 1, that are observable for the asset or liability, either directly or indirectly; and |
| | ● | Level 3 inputs are unobservable inputs for the asset or liability. |
ADOPTION OF NEW AND REVISED STANDARDS
At the date of authorisation of these unaudited interim condensed consolidated financial statements, management anticipates that the adoption of the new and revised IFRSs and amendments to IFRS in future periods will not have a material impact on the unaudited interim condensed consolidated financial statements of the Group in the period of their initial adoption.
NEW AND REVISED IFRS IN ISSUE BUT NOT YET EFFECTIVE
At the date of authorisation of these unaudited interim condensed consolidated financial statements, the Group has not adopted the new and revised IFRS, IFRS INT and amendments to IFRS that have been issued but are not yet effective to them. The Group do not anticipate that the adoption of these new and revised IFRS pronouncements in future periods will have a material impact on the Group’s unaudited interim condensed consolidated financial statements in the period of their initial adoption.
The preparation of these unaudited interim condensed consolidated financial statements in conformity with IFRS requires management to exercise its judgement in the process of applying the Group’s accounting policies. It also requires the use of certain critical accounting estimates and assumptions. The areas involving a higher degree of judgement or complexity, or areas where estimates and assumptions are significant to the unaudited interim condensed consolidated financial statements are disclosed in Note 3.
VCI Global Limited and Subsidiaries
Interim condensed consolidated financial statements (unaudited)
BASIS OF CONSOLIDATION
As the Group were under same control of the controlling shareholders and their entire equity interests were also ultimately held by the controlling shareholders immediately prior to the group reorganization, the unaudited interim condensed consolidated statements of profit or loss and other comprehensive income, unaudited interim condensed consolidated statements of changes in equity and unaudited interim condensed consolidated statements of cash flows statements are prepared as if the current group structure had been in existence throughout the period ended June 30, 2023 and 2022, or since the respective dates of incorporation/establishment of the relevant entity, where this is a shorter period. The consolidated statements of financial position as at June 30, 2022 and 2023 present the assets and liabilities of the aforementioned companies now comprising the Group which had been incorporated/established as at the relevant balance sheet date as if the current group structure had been in existence at those dates based on the same control aforementioned. The Group eliminates all significant intercompany balances and transactions in its consolidated unaudited interim condensed consolidated financial statements.
Subsidiary corporations are all entities (including structured entities) over which the Group has control. The Group controls an entity when the Group is exposed to, or has rights to, variable returns from its involvement with the entity and has the ability to affect those returns through its power over the entity. Subsidiary corporations are fully consolidated from the date on which control is transferred to the Group. They are deconsolidated from the date on that control ceases.
In preparing the unaudited interim condensed consolidated financial statements, transactions, balances and unrealized gains on transactions between group entities are eliminated. Unrealized losses are also eliminated unless the transaction provides evidence of an impairment indicator of the transferred asset. Accounting policies of subsidiary corporations have been changed where necessary to ensure consistency with the policies adopted by the Group.
Non-controlling interests comprise the portion of a subsidiary corporation’s net results of operations and its net assets, which is attributable to the interests that are not owned directly or indirectly by the equity holders of the Company. They are shown separately in the consolidated statements of comprehensive income, statements of changes in equity, and statements of financial position. Total comprehensive income is attributed to the non-controlling interests based on their respective interests in a subsidiary, even if this results in the non-controlling interests having a deficit balance.
Acquisition of entities under an internal reorganization scheme does not result in any change in economic substance. Accordingly, the unaudited interim condensed consolidated financial statements of the Group are a continuation of the acquired entities and is accounted for as follows:
| | (i) | The results of entities are presented as if the internal reorganization occurred from the beginning of the earliest period presented in the unaudited interim condensed consolidated financial statements; |
| | (ii) | The Group will consolidate the assets and liabilities of the acquired entities at the pre-combination carrying amounts. No adjustments are made to reflect fair values, or recognize any new assets or liabilities, at the date of the internal reorganization that would otherwise be done under the acquisition method; and |
| | (iii) | No new goodwill is recognized as a result of the internal reorganization. The only goodwill that is recognized is the existing goodwill relating to the combining entities. Any difference between the consideration paid/transferred and the equity acquired is reflected within equity as merger reserve or deficit. |
VCI Global Limited and Subsidiaries
Interim condensed consolidated financial statements (unaudited)
The acquisition method of accounting is used to account for business combinations entered into by the Group.
The consideration transferred for the acquisition of a subsidiary corporation or business comprises the fair value of the assets transferred, the liabilities incurred, and the equity interests issued by the Group. The consideration transferred also includes any contingent consideration arrangement and any pre-existing equity interest in the subsidiary measured at their fair values at the acquisition date.
Acquisition-related costs are expensed as incurred.
Identifiable assets acquired and liabilities and contingent liabilities assumed in a business combination are, with limited exceptions, measured initially at their fair values at the acquisition date.
On an acquisition-by-acquisition basis, the Group recognizes any non-controlling interest in the acquiree at the date of acquisition either at fair value or at the non-controlling interest’s proportionate share of the acquiree’s identifiable net assets.
The excess of (a) the consideration transferred, the amount of any non-controlling interest in the acquiree and the acquisition-date fair value of any previous equity interest in the acquiree over the (b) fair value of the identifiable net assets acquired is recorded as goodwill.
When a change in the Group’s ownership interest in a subsidiary corporation result in a loss of control over the subsidiary corporation, the assets and liabilities of the subsidiary corporation including any goodwill are derecognized. Amounts previously recognized in other comprehensive income in respect of that entity are also reclassified to profit or loss or transferred directly to retained earnings if required by a specific Standard.
Any retained equity interest in the entity is remeasured at fair value. The difference between the carrying amount of the retained interest at the date when control is lost, and its fair value is recognized in profit or loss.
| | (d) | Transactions with non-controlling interests |
Changes in the Group’s ownership interest in a subsidiary corporation that do not result in a loss of control over the subsidiary corporation are accounted for as transactions with equity owners of the Company. Any difference between the change in the carrying amounts of the non-controlling interest and the fair value of the consideration paid or received is recognized within equity attributable to the equity holders of the Company.
VCI Global Limited and Subsidiaries
Interim condensed consolidated financial statements (unaudited)
CONVENIENCE TRANSLATION
Translations of amounts in the unaudited interim condensed consolidated financial statements from RM into USD as of and for the year ended June 30, 2023 are solely for the convenience of the reader and were calculated at the noon buying rate of USD1 = RM 4.6679, as published in H.10 statistical release of the United States Federal Reserve Board. No representation is made that the RM amounts could have been, or could be, converted, realized or settled into USD at such rate or at any other rate.
FINANCIAL ASSETS
| | (a) | Classification and measurement |
The Group classifies its financial assets at fair value through other comprehensive income, fair value through profit and loss and amortized cost.
The classification depends on the Group’s business model for managing the financial assets as well as the contractual terms of the cash flows of the financial assets.
Financial assets at fair value through other comprehensive income (“FVTOCI”) are equity securities which are not held for trading but more for strategic investments or debt securities where contractual cash flows are solely principal and interest and the objective of the Group’s business model is achieved both by collecting contractual cash flow and selling financial assets.
On initial recognition, the Group may make an irrevocable election (on an instrument-by-instrument basis) to designate investments in equity instruments as at FVTOCI. Designation at FVTOCI is not permitted if the equity investment is held for trading or if it is contingent consideration recognised by an acquirer in a business combination.
Investments in equity instruments as at FVTOCI are initially measured at fair value plus transaction costs. Subsequently, they are measured at fair value with gains and losses arising from changes in fair value recognised in other comprehensive income (“OCI”) and accumulated in the retained earnings. The cumulative gain or loss will not be reclassified to profit or loss on disposal of the equity investments, and will be transferred to retained earnings.
The Group reclassifies debt instruments when and only when its business model for managing those assets changes.
At subsequent measurement - Debt instrument
Debt instruments mainly comprise of cash and cash equivalents and other receivables (excluding prepayments).
Debt instruments that are held for collection of contractual cash flows where those cash flows represent solely payments of principal and interest are measured at amortized cost. A gain or loss on a debt instrument that is subsequently measured at amortized cost and is not part of a hedging relationship is recognized in profit or loss when the asset is derecognized or impaired. Interest income from these financial assets is included in interest income using the effective interest rate method.
The Group recognises a loss allowance for ECL on financial assets which are subject to impairment assessment under IFRS 9. The amount of ECL is updated at each reporting date to reflect changes in credit risk since initial recognition of the respective financial instrument. The Group always recognises lifetime ECL for accounts receivables. The ECL on these financial assets are estimated using a provision matrix based on the Group’s historical credit loss experience, adjusted for factors that are specific to the debtors, general economic conditions and an assessment of both the current as well as the forecast direction of conditions at the reporting date, including time value of money where appropriate. For all other financial instruments, the Group measures the loss allowance equal to 12-month ECL, unless when there has a significant increase in credit risk since initial recognition, the Group recognises lifetime ECL. The assessment of whether lifetime ECL should be recognised is based on significant increase in the likelihood or risk of a default occurring since initial recognition.
VCI Global Limited and Subsidiaries
Interim condensed consolidated financial statements (unaudited)
Significant increase in credit risk
In assessing whether the credit risk has increased significantly since initial recognition, the Group compares the risk of a default occurring on the financial instrument as at the reporting date with the risk of a default occurring on the financial instrument as at the date of initial recognition. In making this assessment, the Group considers both quantitative and qualitative information that is reasonable and supportable, including historical experience and forward-looking information that is available without undue cost or effort. Forward-looking information considered includes the future prospects of the industries in which the Group’s debtors operate, obtained from economic expert reports, financial analysts, governmental bodies, relevant think-tanks and other similar organisations, as well as consideration of various external sources of actual and forecast economic information that relate to the Group’s operations.
In particular, the following information is taken into account when assessing whether credit risk has increased significantly:
| | ● | an actual or expected significant deterioration in the financial instrument’s external (if available) or internal credit rating; |
| | ● | significant deterioration in external market indicators of credit risk, e.g. a significant increase in the credit spread, the credit default swap prices for the debtor; |
| | ● | existing or forecast adverse changes in business, financial or economic conditions that are expected to cause a significant decrease in the debtor’s ability to meet its debt obligations; |
| | ● | an actual or expected significant deterioration in the operating results of the debtor; |
| | ● | significant increases in credit risk on other financial instruments of the same debtor; |
| | ● | an actual or expected significant adverse change in the regulatory, economic, or technological environment of the debtor that results in a significant decrease in the debtor’s ability to meet its debt obligations. |
Irrespective of the outcome of the above assessment, the Group presumes that the credit risk has increased significantly since initial recognition when contractual payments are more than 60 days past due, unless the Group has reasonable and supportable information that demonstrates otherwise.
| | (b) | Recognition and derecognition |
Regular way purchases and sales of financial assets are recognized on trade date – the date on which the Group commits to purchase or sell the asset.
Financial assets are derecognized when the rights to receive cash flows from the financial assets have expired or have been transferred and the Group has transferred substantially all risks and rewards of ownership.
On disposal of a debt instrument, the difference between the carrying amount and the sale proceeds is recognized in profit or loss.
VCI Global Limited and Subsidiaries
Interim condensed consolidated financial statements (unaudited)
FINANCIAL LIABILITIES AND EQUITY INSTRUMENTS
Classification as debt or equity
Debt and equity instruments issued by the Group are classified as either financial liabilities or as equity in accordance with substance of the contractual arrangements and the definitions of a financial liability and an equity instrument.
Equity instruments
An equity instrument is any contract that evidences a residual interest in the assets of an entity after deducting all of its liabilities. Equity instruments issued by the Group are recognised at the proceeds received, net of direct issue costs.
Financial liabilities
Except for derivative financial instruments which are stated at fair value through profit or loss, all other financial liabilities are subsequently measured at amortised cost using the effective interest method.
The effective interest method is a method of calculating the amortised cost of a financial liability and of allocating interest expense over the relevant period. The effective interest rate is the rate that exactly discounts estimated future cash payments (including all fees and points paid or received that form an integral part of the effective interest rate, transaction costs and other premiums or discounts) through the expected life of the financial liability, or (where appropriate) a shorter period, to the amortised cost of a financial liability.
Derecognition of financial liabilities
The Group derecognises financial liabilities when, and only when, the Group’s obligations are discharged, cancelled or expired. The difference between the carrying amount of the financial liability derecognised and the consideration paid and payable, including any non-cash assets transferred or liabilities assumed, is recognised in profit or loss.
Offsetting financial instruments
Financial assets and liabilities are offset, and the net amount reported in the balance sheet when there is a legally enforceable right to offset and there is an intention to settle on a net basis or realize the asset and settle the liability simultaneously.
PROPERTY AND EQUIPMENT
| | (i) | Property and equipment |
Property and equipment are initially recognized at cost and subsequently carried at cost less accumulated depreciation and accumulated impairment losses.
The cost of an item of property and equipment initially recognized includes its purchase price and any cost that is directly attributable to bringing the asset to the location and condition necessary for it to be capable of operating in the manner intended by management.
VCI Global Limited and Subsidiaries
Interim condensed consolidated financial statements (unaudited)
Depreciation on other items of property and equipment is calculated using the straight-line method to allocate their depreciable amounts over their estimated useful lives as followed;
| Office renovation | - | 10 years |
| Office equipment | - | 5 years |
| Furniture and fittings | - | 5 years |
| Electrical and fittings | - | 10 years |
| Right of use asset | - | 3 years |
No depreciation is charged on construction in progress.
The residual values estimated useful lives and depreciation method of property and equipment are reviewed, and adjusted as appropriate, at each balance sheet date. The effects of any revision are recognized in profit or loss when the changes arise.
| | (c) | Subsequent expenditure |
Subsequent expenditure relating to property and equipment that has already been recognized is added to the carrying amount of the asset only when it is probable that future economic benefits associated with the item will flow to the entity and the cost of the item can be measured reliably. All other repair and maintenance expenses are recognized in profit or loss when incurred.
On disposal of an item of property and equipment, the difference between the disposal proceeds and its carrying amount is recognized in profit or loss.
TRADE AND OTHER RECEIVABLES
A receivable is recognised when the Group has an unconditional right to receive consideration. A right to receive consideration is unconditional if only the passage of time is required before payment of that consideration is due. If revenue has been recognised before the Group has an unconditional right to receive consideration, the amount is presented as a contract asset. Trade receivables that do not contain a significant financing component are initially measured at their transaction price. Trade receivables that contain a significant financing component and other receivables are initially measured at fair value plus transaction costs. All receivables are subsequently stated at amortised cost, using the effective interest method and including an allowance for credit losses.
IMPAIRMENT OF NON-FINANCIAL ASSETS
Property and equipment are tested for impairment whenever there is any objective evidence or indication that these assets may be impaired.
For the purpose of impairment testing, the recoverable amount (i.e., the higher of the fair value less cost to sell and the value-in-use) is determined on an individual asset basis unless the asset does not generate cash inflows that are largely independent of those from other assets. If this is the case, the recoverable amount is determined for the Cash Generating units (“CGU”) to which the asset belongs.
If the recoverable amount of the asset (or CGU) is estimated to be less than its carrying amount, the carrying amount of the asset (or CGU) is reduced to its recoverable amount. The difference between the carrying amount and recoverable amount is recognized as an impairment loss in profit or loss.
An impairment loss for an asset is reversed if, and only if, there has been a change in the estimates used to determine the asset’s recoverable amount since the last impairment loss was recognized. The carrying amount of this asset is increased to its revised recoverable amount, provided that this amount does not exceed the carrying amount that would have been determined (net of any accumulated amortization or depreciation) had no impairment loss been recognized for the asset in prior years.
A reversal of impairment loss for an asset other than goodwill is recognized in profit or loss.
VCI Global Limited and Subsidiaries
Interim condensed consolidated financial statements (unaudited)
TRADE AND OTHER PAYABLES
Trade and other payables represent liabilities for goods and services provided to the Group prior to the end of financial year which are unpaid. They are classified as current liabilities if payment is due within one year or less (or in the normal operating cycle of the business if longer). Otherwise, they are presented as non-current liabilities.
Trade and other payables are initially recognized at fair value, and subsequently carried at amortized cost using the effective interest method.
CONTRACT LIABILITIES
A contract liability is recognised when the customer pays non-refundable consideration before the Group recognises the related revenue. A contract liability would also be recognised if the Group has an unconditional right to receive non-refundable consideration before the Group recognises the related revenue. In such cases, a corresponding receivable would also be recognised. Contract liabilities are recognized as revenue when the Group satisfied its performance obligation.
BANK AND OTHER BORROWINGS
Borrowings are presented as current liabilities unless the Group has an unconditional right to defer settlement for at least 12 months after the balance sheet date, in which case they are presented as non-current liabilities.
| | (a) | Borrowings - Borrowings are initially recognized at fair value (net of transaction costs) and subsequently carried at amortized cost. Any difference between the proceeds (net of transaction costs) and the redemption value is recognized in profit or loss over the period of the borrowings using the effective interest method. |
| | (b) | Borrowing costs - Borrowing costs directly attributable to the acquisition, construction or production of qualifying assets, which are assets that necessarily take a substantial period of time to get ready for their intended use or sale, are added to the cost of those assets, until such time as the assets are substantially ready for their intended use or sale. Investment income earned on the temporary investment of specific borrowings pending their expenditure on qualifying assets is deducted from the borrowing costs eligible for capitalisation. |
All other borrowing costs are recognised in profit or loss in the period in which they are incurred.
DEFERRED REVENUE
Deferred revenue refers to advance payment from clients for services that have not yet been rendered. Under the accrual basis of accounting, the Group records this payment as a liability. Once the services have been rendered, the liability is reversed and revenue is recorded instead.
LEASES
When the Group is the lessee
At the inception of the contract, the Group assesses if the contract contains a lease. A contract contains a lease if the contract conveys the right to control the use of an identified asset for a period of time in exchange for consideration. Reassessment is only required when the terms and conditions of the contract are changed.
VCI Global Limited and Subsidiaries
Interim condensed consolidated financial statements (unaudited)
The Group recognizes a right-of-use asset and lease liability at the date which the underlying asset is available for use. Right-of-use assets are measured at cost which comprises the initial measurement of lease liabilities adjusted for any lease payments made at or before the commencement date and lease incentive received. Any initial direct costs that would not have been incurred if the lease had not been obtained are added to the carrying amount of the right- of-use assets.
The right-of-use asset is subsequently depreciated using the straight-line method from the commencement date to the earlier of the end of the useful life of the right-of-use asset or the end of the lease term.
Right-of-use assets are presented within “Property and equipment”.
The initial measurement of a lease liability is measured at the present value of the lease payments discounted using the implicit rate in the lease, if the rate can be readily determined. If that rate cannot be readily determined, the Group shall use its incremental borrowing rate.
Lease payments include the following:
| | - | Fixed payment (including in-substance fixed payments), less any lease incentives receivables; |
| | - | Variable lease payment that are based on an index or rate, initially measured using the index or rate as at the commencement date; |
| | - | Amount expected to be payable under residual value guarantees; |
| | - | The exercise price of a purchase option if is reasonably certain to exercise the option; and |
| | - | Payment of penalties for terminating the lease, if the lease term reflects the Group exercising that option. |
For contracts that contain both lease and non-lease components, the Group allocates the consideration to each lease component on the basis of the relative stand-alone price of the lease and non-lease component. The Group has elected to not separate lease and non-lease component for property leases and account these as one single lease component.
Lease liability is measured at amortized cost using the effective interest method. Lease liability shall be remeasured when:
| | - | There is a change in future lease payments arising from changes in an index or rate; |
| | - | There is a change in the Group’s assessment of whether it will exercise an extension option; or |
| | - | There is modification in the scope or the consideration of the lease that was not part of the original term. |
Lease liability is remeasured with a corresponding adjustment to the right-of-use assets, or is recorded in profit or loss if the carrying amount of the right-of-use asset has been reduced to zero.
| | ● | Short-term and low-value leases |
The Group has elected to not recognized right-of-use assets and lease liabilities for short-term leases that have lease terms of 12 months or less and leases of low-value leases. Lease payments relating to these leases are expensed to profit or loss on a straight-line basis over the lease term.
Variable lease payments that are not based on an index or a rate are not included as part of the measurement and initial recognition of the lease liability. The Group shall recognize those lease payments in profit or loss in the periods that triggered those lease payments.
VCI Global Limited and Subsidiaries
Interim condensed consolidated financial statements (unaudited)
EMPLOYEE BENEFITS
Employee benefits are recognized as an expense, unless the cost qualifies to be capitalized as an asset.
| | (a) | Defined contribution plans |
Defined contribution plans are post-employment benefit plans under which the Group pays fixed contributions into separate entities such as the Employees Provident Fund on a mandatory, contractual or voluntary basis. The Group has no further payment obligations once the contributions have been paid.
| | (b) | Employee leave entitlement |
Employee entitlements to annual leave are recognized when they accrue to employees. A provision is made for the estimated liability for annual leave as a result of services rendered by employees up to the balance sheet date.
PROVISIONS
Provisions are recognised when the Group has a present obligation (legal or constructive) as a result of a past event, it is probable that the Group will be required to settle the obligation, and a reliable estimate can be made of the amount of the obligation.
The amount recognised as a provision is the best estimate of the consideration required to settle the present obligation at the end of the reporting period, taking into account the risks and uncertainties surrounding the obligation. Where a provision is measured using the cash flows estimated to settle the present obligation, its carrying amount is the present value of those cash flows.
When some or all of the economic benefits required to settle a provision are expected to be recovered from a third party, the receivable is recognised as an asset if it is virtually certain that reimbursement will be received and the amount of the receivable can be measured reliably.
REVENUE RECOGNITION
Revenue is recognised to depict the transfer of promised services to clients at an amount that reflects the consideration to which an entity expects to be entitled in exchange for those services. Specifically, the Group uses a five-step approach to recognise revenue:
| ● | Step 1: Identify the contract(s) with a client |
| ● | Step 2: Identify the performance obligations in the contract |
| ● | Step 3: Determine the transaction price |
| ● | Step 4: Allocate the transaction price to the performance obligations in the contract |
| ● | Step 5: Recognise revenue when (or as) the Group satisfies a performance obligation |
The Group recognises revenue when (or as) a performance obligation is satisfied, i.e., when “control” of the services underlying the particular performance obligations is transferred to clients.
A performance obligation represents a service (or a bundle of services) that is distinct or a series of distinct services that are substantially the same.
VCI Global Limited and Subsidiaries
Interim condensed consolidated financial statements (unaudited)
Control is transferred overtime and revenue is recognised overtime by reference to the progress towards complete satisfaction of the relevant performance obligation if one of the following criteria is met:
| | ● | the client simultaneously receives and consumes the benefits provided by the Group’s performance as the Group performs; |
| | ● | the Group’s performance creates or enhances an asset that the client controls as the asset is created or enhanced; or |
| | ● | the Group’s performance does not create an asset with an alternative use to the Group and the Group has an enforceable right to payment for performance completed to date. |
Otherwise, revenue is recognised at a point in time when the customer obtains control of the distinct service.
Advance payments received from clients are recognized as contract liabilities as the Group has not yet satisfied its performance obligation. Contract liabilities are recognized as revenue when the Group satisfied its performance obligation. The Group may receive payment for service prior to, or after it satisfies the performance obligation under a service agreement.
| | a) | Business Strategy Consultancy |
Business strategy consultancy services primarily included listing advisory and solutions, investors relations and boardroom strategies consultancy. The revenues generated from business strategy consultancy services are generally based on the fixed fee billing arrangements that require the clients to pay a pre-established fee in exchange for a predetermined set of professional services. The clients agree to pay a fixed fee periodically over the contract terms as specified in the service agreements.
Our contracts from business strategy consultancy are typically less than a year in duration. Revenues are generally recognised over time. When contractual billings represent an amount that corresponds directly with the value provided to the client, revenues are recognised as amount become billable in accordance with the contract terms. Revenues from fixed-priced contracts are generally recognised using costs incurred to date relative to total estimated costs at completion to measure progress toward satisfying the Company performance obligations. Incurred cost represents work performed, which corresponds with, and thereby best depicts, the transfer of control to client.
| | b) | Technology Development, Solutions and Consultancy |
Technology development, solutions and consultancy primarily included digital development, fintech solution and software solutions.
Technology Development
The contract is typically fixed priced and does not provide any post contract client support or upgrades. The Group designs system based on clients’ specific needs which require the Group to perform services including design/redesign, development, and integration. These services also require significant customization. Upon delivery of the services, client acceptance is generally required. The Group assesses that software development services is considered as a performance obligation. The duration of the development period is usually six months to two years.
The Group’s system development service revenues are generated primarily from contracts with clients across sectors. The contracts contain negotiated billing terms which generally include multiple payment phases throughout the contract term and a portion of contract amount usually is billed upon the completion of the related projects. Pursuant to the contract terms, the Group has enforceable right on payments for the work performed.
The Group’s revenue from technology development contracts is generally recognized over time. The Group uses an input method based on cost incurred as the Group believes that this method most accurately reflects the Group’s progress toward satisfaction of the performance obligation, which usually takes six months to two years. Under this method, the Group could appropriately measure the fulfilment of a performance obligation. Assumptions, risks, and uncertainties inherent in the estimates used to measure progress could affect the amount of revenues, receivables, and deferred revenues at each reporting period.
VCI Global Limited and Subsidiaries
Interim condensed consolidated financial statements (unaudited)
Solutions and Consultancy
Revenue from solutions and consulting services is primarily comprised of fixed-fee contracts, which require the Group to provide professional solutions and consulting services over contract terms beginning on the commencement date of each contract, which is the date its service is made available to clients. Billings to the clients are generally on a monthly or quarterly basis over the contract term, which is typically 6 to 12 months. The solutions and consulting services contracts typically include a single performance obligation. The revenue from solutions and consulting services is recognized over the contract term.
| | c) | Interest income received |
Interest income is received from the money lending other entities and individuals. Interest income is recognised on a time-proportion basis using the effective interest method. When a receivable is impaired, the Group reduces the carrying amount to its recoverable amount, being the estimated future cashflow discounted at original effective interest rate of the instrument, and thereafter amortising the discount as interest income.
GOVERNMENT GRANTS AND SUBSIDIES
Grants from the government are recognized as a receivable at their fair value when there is reasonable assurance that the grant will be received and the Group will comply with all the attached conditions.
Government grants receivable are recognized as income over the periods necessary to match them with the related costs which they are intended to compensate, on a systematic basis. Government grants relating to expenses are shown separately as other income.
Grants related to assets are presented as deferred income under trade and other payables.
CASH AND CASH EQUIVALENTS
For the purpose of presentation in the consolidated statements of cash flows, cash and cash equivalents include cash on hand, deposits with financial institutions which are subject to an insignificant risk of change in value.
SHARE CAPITAL
Ordinary shares are classified as equity. Incremental costs directly attributable to the issuance of new ordinary shares are deducted against the share capital account.
INCOME TAX
Current income tax for current and prior periods is recognized at the amount expected to be paid to or recovered from the tax authorities, using the tax rates and tax laws that have been enacted or substantively enacted by the end of the reporting period. Management periodically evaluates positions taken in tax returns with respect to situations in which applicable tax regulation is subject to interpretation and considers whether it is probable that a tax authority will accept an uncertain tax treatment. The Group measures its tax balances either based on the most likely amount or the expected value, depending on which method provides a better prediction of the resolution of the uncertainty.
Deferred income tax is recognized for all temporary differences arising between the tax bases of assets and liabilities and their carrying amounts in the financial statements except when the deferred income tax arises from the initial recognition of goodwill or an asset or liability in a transaction that is not a business combination and affects neither accounting nor taxable profit or loss at the time of the transaction.
A deferred income tax liability is recognized on temporary differences arising on investments in subsidiaries, associates and joint ventures, except where the Group is able to control the timing of the reversal of the temporary difference and it is probable that the temporary difference will not reverse in the foreseeable future.
A deferred income tax asset is recognized to the extent that it is probable that future taxable profit will be available against which the deductible temporary differences and tax losses can be utilized.
VCI Global Limited and Subsidiaries
Interim condensed consolidated financial statements (unaudited)
Deferred income tax is measured:
| | (i) | at the tax rates that are expected to apply when the related deferred income tax asset is realized or the deferred income tax liability is settled, based on tax rates and tax laws that have been enacted or substantively enacted by the balance sheet date; and |
| | (ii) | based on the tax consequence that will follow from the manner in which the Group expects, at the balance sheet date, to recover or settle the carrying amounts of its assets and liabilities except for investment properties. Investment property measured at fair value is presumed to be recovered entirely through sale. |
Current and deferred income taxes are recognized as income or expense in profit or loss, except to the extent that the tax arises from a business combination or a transaction which is recognized directly in equity. Deferred tax arising from a business combination is adjusted against goodwill on acquisition.
The Group accounts for investment tax credits (for example, productivity and innovation credit) similar to accounting for other tax credits where a deferred tax asset is recognized for unused tax credits to the extent that it is probable that future taxable profit will be available against which the unused tax credits can be utilized.
FOREIGN CURRENCY TRANSACTIONS
| | (a) | Functional and presentation currency |
Items included in the unaudited interim condensed consolidated financial statements of each entity in the Group are measured using the currency of the primary economic environment in which the entity operates (“functional currency”). The unaudited interim condensed consolidated financial statements are presented in Ringgit Malaysia (“RM”), which is the functional currency of the Company and the presentation currency of the Group.
The value of foreign currencies including, the US Dollar (“USD”), may fluctuate against the RM. Any significant variations of the aforementioned currencies relative to the RM may materially affect the Group’s financial condition in terms of reporting in RM. The following table outlines the currency exchange rates that were used in preparing the accompanying consolidated unaudited interim condensed consolidated financial statements:
| | | December 31, | | | June 30, | |
| | | 2022 | | | 2022 | | | 2023 | |
| RM to USD at the end of the period | | | 4.4025 | | | | 4.4075 | | | | 4.6679 | |
| RM to USD Average rate | | | 4.3983 | | | | 4.2867 | | | | 4.4863 | |
| | (b) | Transactions and balances |
Transactions in a currency other than the functional currency (“foreign currency”) are translated into the functional currency using the exchange rates at the dates of the transactions. Currency exchange differences resulting from the settlement of such transactions and from the translation of monetary assets and liabilities denominated in foreign currencies at the closing rates at the balance sheet date are recognized in profit or loss. Monetary items include primarily financial assets (other than equity investments), contract assets and financial liabilities. However, in the unaudited interim condensed consolidated financial statements, currency translation differences arising from borrowings in foreign currencies and net investment in foreign operations, are recognized in other comprehensive income and accumulated in the currency translation reserve.
When a foreign operation is disposed of or any loan forming part of the net investment of the foreign operation is repaid, a proportionate share of the accumulated currency translation differences is reclassified to profit or loss, as part of the gain or loss on disposal.
Non-monetary items measured at fair values in foreign currencies are translated using the exchange rates at the date when the fair values are determined.
VCI Global Limited and Subsidiaries
Interim condensed consolidated financial statements (unaudited)
| | (c) | Translation of Group entities’ financial statements |
The results and financial position of all the Group entities (none of which has the currency of a hyperinflationary economy) that have a functional currency different from the presentation currency are translated into the presentation currency as follows:
| | (i) | assets and liabilities are translated at the closing exchange rates at the reporting date; |
| | (ii) | income and expenses are translated at average exchange rates (unless the average is not a reasonable approximation of the cumulative effect of the rates prevailing on the transaction dates, in which case income and expenses are translated using the exchange rates at the dates of the transactions); and |
| | (iii) | all resulting currency translation differences are recognized in other comprehensive income and accumulated in the currency translation reserve. These currency translation differences are reclassified to profit or loss on disposal or partial disposal with loss of control of the foreign operation. |
Goodwill and fair value adjustments arising on the acquisition of foreign operations are treated as assets and liabilities of the foreign operations and translated at the closing rates at the reporting date.
RELATED PARTIES
| (a) | A person, or a close member of that person’s family, is related to the Group if that person: |
| (i) | has control or joint control over the Group; |
| | (ii) | has significant influence over the Group; or |
| | (iii) | is a member of the key management personnel of the Group or the Group’s parent. |
| | (b) | An entity is related to the Group if any of the following conditions applies: |
| (i) | The entity and the group are members of the same Group (which means that each parent, subsidiary and fellow subsidiary is related to the others). |
| | (ii) | One entity is an associate or joint venture of the other entity (or an associate or joint venture of a member of a Group of which the other entity is a member). |
| | (iii) | Both entities are joint ventures of the same third party. |
| | (iv) | One entity is a joint venture of a third entity and the other entity is an associate of the third entity. |
| | (v) | The entity is a post-employment benefit plan for the benefit of employees of either the Group or an entity related to the group. |
| | (vi) | The entity is controlled or jointly controlled by a person identified in (a). |
| | (vii) | A person identified in (a)(i) has significant influence over the entity or is a member of the key management personnel of the entity (or of a parent of the entity). |
| | (viii) | The entity, or any member of a Group of which it is a part, provides key management personnel services to the Group or to the Group’s parent. Close members of the family of a person are those family members who may be expected to influence, or be influenced by, that person in their dealings with the entity. |
EARNINGS PER SHARE
The Group presents basic and diluted earnings per share data for its ordinary shares. Basic earnings per share is calculated by dividing the profit or loss attributable to ordinary shareholders of the Company by the weighted-average number of ordinary shares outstanding during the year, adjusted for own shares held, if any. Diluted earnings per share is determined by adjusting the profit or loss attributable to ordinary shareholders and the weighted-average number of ordinary shares outstanding, adjusted for own shares held, if any, for the effects of all dilutive potential ordinary shares.
VCI Global Limited and Subsidiaries
Interim condensed consolidated financial statements (unaudited)
SEGMENT REPORTING
Operating segments, and the amounts of each segment item reported in the unaudited interim condensed consolidated financial statements, are identified from the financial information provided regularly to the Group’s most senior executive management for the purposes of allocating resources to, and assessing the performance of, the Group’s various lines of business and geographical locations.
Individually material operating segments are not aggregated for financial reporting purposes unless the segments have similar economic characteristics and are similar in respect of the nature of products and services, the nature of production processes, the type or class of customers, the methods used to distribute the products or provide the services, and the nature of the regulatory environment. Operating segments which are not individually material may be aggregated if they share a majority of these criteria.
| 3 | CRITICAL ACCOUNTING JUDGEMENTS AND KEY SOURCES OF ESTIMATION UNCERTAINTY |
In the application of the Group’s accounting policies, which are described in Note 2 to the unaudited interim condensed consolidated financial statements, management is required to make judgements, estimates and assumptions about the carrying amounts of assets and liabilities that are not readily apparent from other sources. The estimates and associated assumptions are based on historical experience and other factors that are considered to be relevant. Actual results may differ from these estimates.
The estimates and underlying assumptions are reviewed on an ongoing basis. Revisions to accounting estimates are recognised in the period in which the estimate is revised if the revision affects only that period, or in the period of the revision and future periods.
Critical judgements in applying the Group’s accounting policies
There are no critical judgements, apart from those involving estimation (see below) that the management has made in the process of applying the Group’s accounting policy and that has the most significant effect on the amounts recognised in the unaudited interim condensed consolidated financial statements.
Key sources of estimation uncertainty
The key assumptions concerning the future and other key sources of estimation uncertainty at the end of the reporting period, that have a significant risk of causing a material adjustment to the carrying amounts of assets and liabilities within the next financial year, are disclosed below:
Fair value measurement of unquoted shares (Note 5)
In determining the fair value of the unquoted shares, the Group relies on the net asset values of the investee companies or independent valuation report.
The availability of observable inputs can vary from investment to investment. For certain investments classified under Level 3 of the fair value hierarchy, the valuation could be based on models or inputs that are less observable or unobservable in the market and the determination of the fair values require significant judgement. Those estimated values do not necessarily represent the amounts that may be ultimately realized due to occurrence of future events which could not be reasonably determined as at the balance sheet date.
VCI Global Limited and Subsidiaries
Interim condensed consolidated financial statements (unaudited)
| 4 | FINANCIAL ASSETS MEASURED AT FAIR VALUE THROUGH OTHER COMPREHENSIVE INCOME |
| | | December 31, 2022 | | | June 30, 2023 | |
| | | RM | | | RM | | | USD | |
| Quoted shares measured at fair value through other comprehensive income (“FVTOCI”): | | | | | | | | | | | | |
| At beginning of year | | | 34,221,879 | | | | 12,819,747 | | | | 2,746,363 | |
| Addition | | | - | | | | 7,002,234 | | | | 1,500,082 | |
| Fair value adjustment | | | (21,402,132 | ) | | | - | | | | - | |
| Disposal | | | - | | | | (12,819,747 | ) | | | (2,746,363 | ) |
| At end of the period | | | 12,819,747 | | | | 7,002,234 | | | | 1,500,082 | |
Quoted shares measured at FVTOCI
In prior financial year, quoted investment in shares measured at FVTOCI related to an equity interest of 14.55% in Treasure Global Inc (“TGL”), an entity that is listed on the Nasdaq Stock Market. Hoo Voon Him is also a director in TGI. In January 2023, the Company disposed all of its shareholdings in TGL shares.
In May 2023, the Company acquired 500 shares from Globexus Holding Corp via a share-swap arrangement (Note 16).
| 5 | FINANCIAL ASSETS MEASURED AT FAIR VALUE THROUGH PROFIT AND LOSS |
| | | December 31,
2022 | | | June 30, 2023 | |
| | | RM | | | RM | | | USD | |
| Unquoted shares: | | | | | | | | | |
| At beginning of year | | | 1,309,134 | | | | 72,295 | | | | 15,488 | |
| Addition | | | 10,211 | | | | - | | | | - | |
| Disposal | | | (1,247,050 | ) | | | - | | | | - | |
| Adjustment – forex exchange | | | - | | | | 3,749 | | | | 803 | |
| At end of year | | | 72,295 | | | | 76,044 | | | | 16,291 | |
Other unquoted shares
Included in the unquoted shares are investment in the following:
| ● | 5% (December 31, 2022: 5%) equity interest in Zero Carbon Farms Ltd, an entity incorporated in United Kingdom. |
| ● | 0.1% (December 31, 2022: 0.1%) equity interest in Unique Fire Holdings Berhad, an entity incorporated in Malaysia. |
In September 2022, the Company disposed all of its shareholdings in DFA Robotic Co. Ltd to a third party.
The above valuations are categorised under Level 3 of the fair value hierarchy and are generally sensitive to the unobservable inputs. Any increase or decrease in transacted price would result in an increase or decrease in the fair value of the unquoted investments. Any significant movement in inputs would result in a significant change to the fair value of the unquoted investment. There are no transfers between Levels 1 and 2 and into or out of Level 3 during the year.
VCI Global Limited and Subsidiaries
Interim condensed consolidated financial statements (unaudited)
| 6 | PROPERTY, PLANT AND EQUIPMENT |
| | | Office equipment | | | Fixtures and fittings | | | Office renovations | | | Computer & software | | | Total | |
| | | RM | | | RM | | | RM | | | RM | | | RM | |
| Cost | | | | | | | | | | | | | | | |
| As of January 1, 2022 | | | 29,869 | | | | 146,711 | | | | 102,550 | | | | 142,198 | | | | 421,328 | |
| Additions | | | 157,518 | | | | 218,109 | | | | 1,221,412 | | | | 71,912 | | | | 1,668,951 | |
| Disposals | | | (2,302 | ) | | | (104,017 | ) | | | - | | | | (86,460 | ) | | | (192,779 | ) |
| As of December 31, 2022 | | | 185,085 | | | | 260,803 | | | | 1,323,962 | | | | 127,650 | | | | 1,897,500 | |
| Additions | | | 33,822 | | | | 20,457 | | | | 419,947 | | | | 171,693 | | | | 645,919 | |
| Disposals | | | - | | | | - | | | | - | | | | - | | | | - | |
| As of June 30, 2023 | | | 218,907 | | | | 281,260 | | | | 1,743,909 | | | | 299,343 | | | | 2,543,419 | |
| | | | | | | | | | | | | | | | | | | | | |
| Accumulated depreciation | | | | | | | | | | | | | | | | | | | | |
| As of January 1, 2022 | | | 20,145 | | | | 143,851 | | | | 48,909 | | | | 55,891 | | | | 268,796 | |
| Depreciation for the period | | | 17,944 | | | | 31,613 | | | | 135,552 | | | | 44,459 | | | | 229,568 | |
| Disposals | | | (2,300 | ) | | | (104,006 | ) | | | - | | | | (46,137 | ) | | | (152,443 | ) |
| As of December 31, 2022 | | | 35,789 | | | | 71,458 | | | | 184,461 | | | | 54,213 | | | | 345,921 | |
| Depreciation for the period | | | 10,931 | | | | 35,393 | | | | 68,070 | | | | 1,333 | | | | 115,727 | |
| As of June 30, 2023 | | | 46,720 | | | | 106,851 | | | | 252,531 | | | | 55,546 | | | | 461,648 | |
| | | | | | | | | | | | | | | | | | | | | |
| Carrying amounts | | | | | | | | | | | | | | | | | | | | |
| As of December 31, 2022 | | | 149,296 | | | | 189,345 | | | | 1,139,501 | | | | 73,437 | | | | 1,551,579 | |
| As of June 30, 2023 | | | 172,187 | | | | 174,409 | | | | 1,491,378 | | | | 243,797 | | | | 2,081,771 | |
| As of June 30, 2023 (USD) | | | 36,887 | | | | 37,364 | | | | 319,497 | | | | 52,228 | | | | 445,976 | |
VCI Global Limited and Subsidiaries
Interim condensed consolidated financial statements (unaudited)
| | | RM | |
| Cost | | | |
| At January 1, 2022 | | | - | |
| Additions | | | 952,191 | |
| At December 31,2022 | | | 952,191 | |
| Additions | | | - | |
| At June 30, 2023 | | | 952,191 | |
| | | | | |
| Accumulated depreciation | | | | |
| At January 1, 2022 | | | - | |
| Depreciation for the period | | | 238,048 | |
| At December 31, 2022 | | | 238,048 | |
| Depreciation for the period | | | 158,698 | |
| At June 30, 2023 | | | 396,746 | |
| | | | | |
| Carrying amount as of December 31, 2022 | | | 714,143 | |
| Carrying amount as of June 30, 2023 | | | 555,445 | |
| Carrying amount as of June 30, 2023 (USD) | | | 118,992 | |
| 8 | DEFERRED INITIAL PUBLIC OFFERING EXPENSE |
Initial public offering expense directly attributable to offering of securities are deferred and would be charged against the gross proceeds of the offering, as a reduction in share capital. As of June 30, 2023, the Company capitalised deferred of RM 6,564,162 and such cost have been offset against the offering proceeds at the closing of the initial public offering in April 2023.
VCI Global Limited and Subsidiaries
Interim condensed consolidated financial statements (unaudited)
The following are the major deferred tax assets recognised by the Group and the movements thereon, during the current and prior reporting periods:
| | | December 31, 2022 | | | June 30,
2023 | |
| | | RM | | | RM | | | USD | |
| Provisions: | | | | | | | | | |
| At beginning/end of year | | | 339,650 | | | | 339,650 | | | | 72,763 | |
| 10 | TRADE AND OTHER RECEIVABLES |
| | | As of
June 30,
2023 | | | As of
December 31,
2022 | |
| | | RM | | | USD | | | RM | |
| Trade receivables | | | | | | | | | |
| Third parties | | | 31,135,686 | | | | 6,670,170 | | | | 15,266,925 | |
| Less: Impairment allowance on trade receivables | | | (1,500,526 | ) | | | (321,456 | ) | | | (1,757,638 | ) |
| | | | 29,635,160 | | | | 6,348,714 | | | | 13,509,287 | |
| Related party | | | 117,757 | | | | 25,227 | | | | 1,305,724 | |
| Total trade receivables | | | 29,752,917 | | | | 6,373,941 | | | | 14,815,011 | |
| | | | | | | | | | | | | |
| Deposits | | | 1,253,629 | | | | 268,564 | | | | 195,507 | |
| Prepayments | | | 538,390 | | | | 115,339 | | | | 28,578 | |
| Other receivables | | | 24,438,406 | | | | 5,235,417 | | | | 720,437 | |
| Total | | | 55,983,342 | | | | 11,993,261 | | | | 15,759,533 | |
| | | | | | | | | | | | | |
| Movement in impairment allowance on trade receivables | | | (257,112 | ) | | | (55,081 | ) | | | 342,427 | |
| | | | | | | | | | | | | |
| Beginning balance | | | 1,757,638 | | | | 376,537 | | | | 1,415,211 | |
Exchange differences | | | (257,112 | ) | | | (55,081 | ) | | | 342,427 | |
| Ending balance | | | 1,500,526 | | | | 321,456 | | | | 1,757,638 | |
The average credit period for services rendered is 30 days. No interest is charged on the outstanding balances.
Other receivables consist of disposal of financial asset through other comprehensive income (Note 4). Furthermore, there are ordinary shares obtained from our customers as part of our business consultancy professional fee which disposed to third party investors.
VCI Global Limited and Subsidiaries
Interim condensed consolidated financial statements (unaudited)
| | | As of June 30, 2023 | | | As of December 31, 2022 | |
| | | RM | | | USD | | | RM | |
| Not past due | | | 22,912,675 | | | | 4,908,562 | | | | 11,643,721 | |
| Past due | | | 8,340,768 | | | | 1,786,835 | | | | 4,928,928 | |
| Less: Impairment allowance on trade receivables | | | (1,500,526 | ) | | | (321,456 | ) | | | (1,757,638 | ) |
| Net trade receivables | | | 29,752,917 | | | | 6,373,941 | | | | 14,815,011 | |
A majority of the Group’s trade receivables that are neither past due nor impaired are with creditworthy counterparties with good track record of credit history.
| (i) | Aging of receivables that are past due the average credit period: |
| | | As of
June 30,
2023 | | | As of
December 31,
2022 | |
| | | RM | | | USD | | | RM | |
| < 30 days | | | 290,053 | | | | 62,138 | | | | - | |
| 31 days to 60 days | | | 154,755 | | | | 33,153 | | | | 1,862,965 | |
| 61 days to 210 days | | | 6,395,434 | | | | 1,370,088 | | | | - | |
| 211 days to 240 days | | | - | | | | - | | | | - | |
| 241 days to < 1 year | | | 1,500,526 | | | | 321,456 | | | | 3,065,963 | |
| Total | | | 8,340,768 | | | | 1,786,835 | | | | 4,928,928 | |
In determining the recoverability of trade receivables, the Group considers any changes in the credit quality of the trade receivables from the date credit was initially granted up to the reporting date. There was no significant change in credit quality for the Group’s trade receivables balances which are past due and partially impaired.
| (ii) | These amounts are stated before any deduction for impairment losses and are not secured by any collateral or credit enhancements. |
The impairment allowance in trade receivable has been determined by taking into consideration recovery prospects and past doubtful experience.
As part of the Group’s credit risk management, the Group assesses the impairment for its customers based on different group of customers which share common risk characteristics that are representative of the customers’ abilities to pay all amounts due in accordance with the contractual terms.
Impairment allowance on trade receivables has been measured at an amount equal to lifetime expected credit losses (“ECL”). The ECL on trade receivables are estimated using a provision matrix by reference to past default experience of the debtor and an analysis of the debtor’s current financial position, adjusted for factors that are specific to the debtors, general economic conditions of the industry in which the debtors operate. The Group has recognized a loss allowance of 100% against general receivables over 240 days past due because historical experience has indicated that these receivables are generally not recoverable. For specific and individual trade receivables, the Group has access them individually to decide whether the trade receivables have recoverable issues based on the closely contact and past experience to justify it.
VCI Global Limited and Subsidiaries
Interim condensed consolidated financial statements (unaudited)
There has been no change in the estimation techniques or significant assumptions made during the current reporting period. A trade receivable is written-off when there is information indicating that the debtor is in severe financial difficulty and there is no realistic prospect of recovery.
The following table details the risk profile of trade receivables based on the Group’s provision matrix. As the Group’s historical credit loss experience does not show significantly different loss patterns for different customer segments, the provision for loss allowance based on past due status is not further distinguished between the Group’s different customer base:
| | | Trade receivables – days past due | |
| | | Not past
due | | | 1 to 30
days | | | 31-60
days | | | 61-210
days | | | 211-240
days | | | Over 241
days | | | Total | |
| | | RM | | | RM | | | RM | | | RM | | | RM | | | RM | | | RM | |
| Expected credit loss rate | | | - | | | | - | | | | - | | | | - | | | | - | | | | 100 | % | | | - | |
| Lifetime ECL – December 31, 2022 | | | - | | | | - | | | | - | | | | - | | | | - | | | | 1,757,638 | | | | 1,757,638 | |
| Lifetime ECL – June 30, 2023 | | | - | | | | - | | | | - | | | | - | | | | - | | | | 1,500,526 | | | | 1,500,526 | |
The above balances that are not denominated in the functional currency are as follows:
| | | December 31,
2022 | | | June 30,
2023 | |
| | | RM | | | RM | |
| United States dollar | | | 3,205,795 | | | | 3,625,681 | |
VCI Global Limited and Subsidiaries
Interim condensed consolidated financial statements (unaudited)
| | | As of
December 31,
2022 | | | As of
June 30,
2023 | |
| | | RM | | | RM | | | USD | |
| Cash and bank balances | | | 3,953,991 | | | | 15,287,897 | | | | 3,275,112 | |
| Cash at share trading accounts | | | 42,004 | | | | 40,964 | | | | 8,776 | |
| Total | | | 3,995,995 | | | | 15,328,861 | | | | 3,283,888 | |
Cash at share trading accounts are readily convertible to a known amount of cash which are subject to an insignificant risk of changes in value.
The above balances that are not denominated in the functional currency are as follows:
| | | December 31,
2022 | | | June 30,
2023 | |
| | | RM | | | RM | |
| Singapore dollar | | | 12,605 | | | | 22,566 | |
| United States dollar | | | 20,326 | | | | 588,335 | |
| 12 | TRADE AND OTHER PAYABLES |
| | | December 31,
2022 | | | June 30,
2023 | |
| | | RM | | | RM | | | USD | |
| Trade payables | | | 139,102 | | | | 1,148,594 | | | | 246,062 | |
| Accruals | | | 7,965,442 | | | | 4,657,361 | | | | 997,742 | |
| Sundry payables | | | 2,303,774 | | | | 589,388 | | | | 126,264 | |
| Total | | | 10,408,318 | | | | 6,395,343 | | | | 1,370,068 | |
Accruals consist mainly of staff salaries and sundry payables consist mainly of audit fees, secretarial fees and other professional fees.
The above balances that are not denominated in the functional currency are as follows:
| | | December 31,
2022 | | | June 30,
2023 | |
| | | RM | | | RM | |
| Singapore dollar | | | — | | | | 10,164 | |
| United States dollar | | | 6,008,843 | | | | 467,810 | |
VCI Global Limited and Subsidiaries
Interim condensed consolidated financial statements (unaudited)
| | | December
2022 | | | June 30,
2023 | |
| | | RM | | | RM | | | USD | |
| At beginning of year / period | | | 500,000 | | | | - | | | | - | |
| Amount recognised as revenue | | | (500,000 | ) | | | - | | | | - | |
| At of end of year / period | | | - | | | | - | | | | - | |
Contract liabilities relates to advances collected from customers upon contract fee billed but services have yet rendered. These will be recognised as revenue over the terms of the contract.
| | | December 31,
2022 | | | June 30,
2023 | |
| | | RM | | | RM | | | USD | |
| At beginning of year / period | | | - | | | | 744,959 | | | | 159,592 | |
| Additions | | | 952,191 | | | | - | | | | - | |
| Finance cost | | | 24,768 | | | | 14,629 | | | | 3,134 | |
| Payments | | | (232,000 | ) | | | (174,000 | ) | | | (37,276 | ) |
| At end of year / period | | | 744,959 | | | | 585,588 | | | | 125,450 | |
| | | | | | | | | | | | | |
| Future lease payment payables: | | | | | | | | | | | | |
| - Within one year | | | 348,000 | | | | 174,000 | | | | 37,276 | |
| - Within two to five years | | | 435,000 | | | | 435,000 | | | | 93,190 | |
| Total future minimum lease payments | | | 783,000 | | | | 609,000 | | | | 130,466 | |
| Less: Future finance charges | | | (38,041 | ) | | | (23,412 | ) | | | (5,016 | ) |
| | | | 744,959 | | | | 585,588 | | | | 125,450 | |
These are office lease contracts for premises with a tenure of 3 years. In contrast, the Group also has certain leases with lease terms of 12 months or less. The Group applies the “short-term lease” recognition exemptions for these leases.
Details of the carrying amounts of right-of-use assets recognized and the movements during the year/period are disclosed in Note 7 to the unaudited interim condensed consolidated financial statements.
The lease liabilities at the end of the reporting period bear weighted average incremental borrowing rate of 4.31% (2022: 4.31%) per annum.
| | | December 31,
2022 | | | June 30,
2023 | |
| | | RM | | | RM | | | USD | |
| Depreciation of right-of-use asset | | | 238,048 | | | | 158,698 | | | | 33,998 | |
| Interest expense on lease liabilities | | | 24,768 | | | | 14,629 | | | | 3,134 | |
| Lease expense not capitalised in lease liabilities: | | | | | | | - | | | | - | |
| -expense relating to short-term lease | | | 257,243 | | | | 149,951 | | | | 32,124 | |
| Total amount recognised in profit or loss | | | 520,059 | | | | 323,278 | | | | 69,256 | |
VCI Global Limited and Subsidiaries
Interim condensed consolidated financial statements (unaudited)
| 15 | BANK AND OTHER BORROWINGS |
| | | December 31,
2022 | | | June 30,
2023 | |
| | | RM | | | RM | | | USD | |
| Bank borrowings | | | | | | | | | | | | |
| - Current | | | 133,843 | | | | 32,711 | | | | 7,008 | |
| - Non-current | | | 309,331 | | | | 309,331 | | | | 66,268 | |
| Total bank borrowings | | | 443,174 | | | | 342,042 | | | | 73,276 | |
| | | | | | | | | | | | | |
| Other borrowings – current | | | 649,699 | | | | 649,699 | | | | 139,184 | |
| | | | | | | | | | | | | |
| Total borrowings | | | 1,092,873 | | | | 991,741 | | | | 212,460 | |
Notes:
This is made up of the following loans:
| Loan 1 : | A principal amount of RM 150,000 from a financial institution, which charged an interest rate at 5.00% per annum and repayable over 60 months in equal monthly instalments (principal and interest) of RM 3,318. The maturity date is June 2023. The loan has been fully settled by June 30, 2023. |
| Loan 2 : | A principal amount of RM 200,000 from a financial institution, which charged an interest rate at 3.50% per annum and repayable over 60 months in equal monthly instalments (principal and interest) of RM 3,639. The maturity date is August 2026. |
| Loan 3 : | A principal amount of RM 300,000 from a financial institution, which charged an interest rate at 3.50% per annum and repayable over 60 months in equal monthly instalments (principal and interest) of RM 6,136. The maturity date is August 2026. |
The bank borrowings of the Group are secured against:
| | a) | Guarantee in favour of the lender by Credit Guarantee Corporation (CGC) under the portfolio guarantee scheme for 70% of the approved limit; |
| | b) | Corporate guarantee in favour of the lender by a third party company which the Director have interests; |
| | c) | Assignment of single premium reducing term plan issued by Sun Life Malaysia Assurance Berhad under Director of the Company, for the sum insured of not less than RM 150,000 to the lender; and |
| | d) | Jointly and severally guaranteed in favour of the lender by a Director of the Company. |
This relates to redeemable preference shares issued by a subsidiary. The redeemable preference shares are liability in nature as the subsidiary has to redeem the shares at a particular date by paying agreed amount to the holder of the shares. Non-discretionary dividends paid on redeemable preference shares is recorded as expenses in income statement as any return paid towards liabilities is treated as an interest expense in the income statement.
The redeemable preference shares have a face value of RM 600,000 representing 600,000 shares at RM 1.00 each. It is redeemable at a fair value of RM 600,000.
VCI Global Limited and Subsidiaries
Interim condensed consolidated financial statements (unaudited)
| | | December 31,
2022 | | | June 30,
2023 | | | December 31,
2022 | | | June 30,
2023 | |
| | | Number of
ordinary
shares | | | Number of
ordinary
shares | | | RM | | | RM | | | USD | |
| Paid up capital: | | | | | | | | | | | | | | | |
| At beginning of year / period | | | 50,000 | | | | 34,412,259 | | | | 220,000 | | | | 13,127,427 | | | | 2,812,277 | |
| Share buyback | | | (50,000 | ) | | | - | | | | (220,000 | ) | | | - | | | | - | |
| Issuance of shares(1) | | | 33,400,100 | | | | - | | | | 3,330 | | | | - | | | | - | |
| Issuance of shares(2) | | | 1,012,159 | | | | - | | | | 13,124,097 | | | | - | | | | - | |
| Issuance of shares(3) | | | - | | | | 1,280,000 | | | | - | | | | 16,939,389 | | | | 3,628,910 | |
| Issuance of shares(4) | | | - | | | | 600,000 | | | | - | | | | 7,002,234 | | | | 1,500,082 | |
| At of end of year / period | | | 34,412,259 | | | | 36,292,259 | | | | 13,127,427 | | | | 37,069,050 | | | | 7,941,269 | |
As of December 31, 2021, the Company has authorized 50,000 ordinary shares at USD 1.00. The paid up ordinary shares has no par value and carry one vote per share and carry a right to dividends as and when declared by the Company.
| (1) | On April 8, 2022, VCI Global Limited issued a total of 33,400,100 shares at USD 0.0001 to V Capital Kronos Berhad’s shareholders in exchange of their shares in V Capital Kronos Berhad. For the purposes of comparative value in calculating the Group’s earnings per share (“EPS”), the Group has assumed that 33,400,100 shares were outstanding from 1 January 2020 to 31 December 2021 as would be included in the denominator of the EPS calculation. |
| (2) | From April 8, 2022 until November 1, 2022, a total of additional 1,012,159 ordinary shares have been issued to various investors between USD 2.50 to USD 4.00 per share. |
| (3) | On April 2023, a total of 1,280,000 ordinary shares is issued in initial offering at USD4.00 per ordinary share, after deduct the IPO expenses. |
| (4) | On May 31, 2023, a total of 600,000 ordinary shares is issued to Globexus Holding Corp as part of share-swap arrangement for 500 Globexus Holding Corp’s shares. |
This is in relation to merger reserves.
The merger reserve represents effects of changes in ownership interests in subsidiaries when there is no change in control. Under merger accounting, the assets, liabilities, revenue, expenses and cash flows of all the entities within the Group are combined after making such adjustments as are necessary to achieve consistency of accounting policies. This manner of presentation reflects the economic substance of combining companies, which were under common control throughout the relevant period, as a single economic enterprise.
VCI Global Limited and Subsidiaries
Interim condensed consolidated financial statements (unaudited)
| 18 | CURRENCY TRANSLATION RESERVE |
The translation reserve comprises all foreign exchange differences arising from the translation of the consolidated financial statements of foreign operations whose functional currency is different from that of the Group’s presentation currency and is non-distributable.
| | | Six months ended
June 30,
2022 | | | Six months ended
June 30, 2023 | |
| | | RM | | | RM | | | USD | |
| Business strategy consultancy | | | 11,359,388 | | | | 20,789,179 | | | | 4,453,647 | |
| Technology development, solutions and consultancy | | | 9,657,906 | | | | 19,733,018 | | | | 4,227,387 | |
| Interest income | | | - | | | | 1,118,641 | | | | 239,645 | |
| Others | | | 357,338 | | | | 2,822,357 | | | | 604,631 | |
| Total | | | 21,374,632 | | | | 44,463,195 | | | | 9,525,310 | |
This represents revenue arising from the Group’s contracts with customers for business strategy consultancy, technology development, solution and consultancy and investment.
| | | Six months ended
June 30,
2022 | | | Six months ended
June 30, 2023 | |
| | | RM | | | RM | | | USD | |
| Interest income | | | 22 | | | | 942 | | | | 202 | |
| Wage subsidy | | | 29,900 | | | | - | | | | - | |
| Gain on disposal of financial asset, FVTOCI | | | - | | | | 780,319 | | | | 167,167 | |
| Gain on disposal of property and equipment | | | 1,891 | | | | - | | | | - | |
| Foreign exchange gain | | | - | | | | 158,801 | | | | 34,020 | |
| Reimbursement income for expenses incurred | | | 77,989 | | | | 104,839 | | | | 22,460 | |
| Others | | | - | | | | 10,005 | | | | 2,143 | |
| Total | | | 109,802 | | | | 1,054,906 | | | | 225,992 | |
The Wage Subsidy Program (“WSP”) is a financial assistance introduced in Malaysia paid to employers of every enterprise, for each worker earning RM4,000 and below and for a period of six months only. The purpose of the WSP is to help employers affected economically by the COVID-19 pandemic to continue operations and avoid the loss of jobs and income streams for all enterprises.
VCI Global Limited and Subsidiaries
Interim condensed consolidated financial statements (unaudited)
| | | Six months ended
June 30,
2022 | | | Six months ended
June 30, 2023 | |
| | | RM | | | RM | | | USD | |
| Consultant fee | | | 610,797 | | | | 5,676,167 | | | | 1,216,000 | |
| IT expenses | | | 1,495,966 | | | | 180,669 | | | | 38,705 | |
| Training costs | | | - | | | | 192,398 | | | | 41,217 | |
| Others | | | 110,166 | | | | - | | | | - | |
| Total | | | 2,216,929 | | | | 6,049,234 | | | | 1,295,922 | |
The “consultant fee” refers to the Group’s costs incurred from assisting its clients, in engaging all the relevant professionals required during the listing process, including but not limited to legal counsel, auditors, finance consultants, the US capital markets consultant, which such consultant fee payment shall be included and be treated as part of our consultation services for its clients during the IPO’s process.
| 22 | EMPLOYEES BENEFIT EXPENSES |
| | | Six months ended
June 30,
2022 | | | Six months ended
June 30, 2023 | |
| | | RM | | | RM | | | USD | |
| Wages and salaries | | | 4,259,555 | | | | 6,860,747 | | | | 1,469,771 | |
| Defined contribution plan | | | 399,266 | | | | 514,817 | | | | 110,289 | |
| Other short-term benefits | | | 148,550 | | | | 394,661 | | | | 84,548 | |
| Total | | | 4,807,371 | | | | 7,770,225 | | | | 1,664,608 | |
Included in the employee benefit expenses is remuneration and benefits to the directors of the Company as disclosed below:
| | | Six months ended
June 30,
2022 | | | Six months ended
June 30, 2023 | |
| | | RM | | | RM | | | USD | |
| Wages and salaries | | | 1,178,000 | | | | 1,758,118 | | | | 376,640 | |
| Defined contribution plan | | | 141,000 | | | | 118,080 | | | | 25,296 | |
| Other short-term benefits | | | 1,660 | | | | 1,159 | | | | 248 | |
| Total | | | 1,320,660 | | | | 1,877,357 | | | | 402,184 | |
| | | Six months ended
June 30,
2022 | | | Six months ended
June 30, 2023 | |
| | | RM | | | RM | | | USD | |
| Interest expenses on: | | | | | | | | | |
| Bank borrowings | | | 8,685 | | | | 1,246 | | | | 267 | |
| Operating lease obligations | | | - | | | | 14,629 | | | | 3,134 | |
| | | | 8,685 | | | | 15,875 | | | | 3,401 | |
VCI Global Limited and Subsidiaries
Interim condensed consolidated financial statements (unaudited)
| 24 | OTHER OPERATING EXPENSES |
| | | Six months ended
June 30,
2022 | | | Six months ended
June 30, 2023 | |
| | | RM | | | RM | | | USD | |
| Regulatory compliance and statutory cost | | | 134,197 | | | | 103,237 | | | | 22,117 | |
| Regulatory consultancy fee | | | 181,409 | | | | - | | | | - | |
| Cost incurred to obtain licence | | | - | | | | 12,113 | | | | 2,595 | |
| Bad debt written off | | | - | | | | - | | | | - | |
| Bank charges | | | 15,088 | | | | 24,764 | | | | 5,305 | |
| Foreign exchange loss | | | 309,003 | | | | 841,902 | | | | 180,360 | |
| Marketing expenses | | | 231,189 | | | | 990,188 | | | | 212,127 | |
| Software and website usage fee | | | 28,847 | | | | 29,628 | | | | 6,347 | |
| Office expenses | | | 406,022 | | | | 981,729 | | | | 210,315 | |
| Preliminary expenses written off | | | 11,283 | | | | 280 | | | | 60 | |
| Recruitment fees | | | 36,392 | | | | 93,101 | | | | 19,945 | |
| Travelling expenses | | | 121,236 | | | | 512,997 | | | | 109,899 | |
| Net investment loss | | | - | | | | 78,618 | | | | 16,842 | |
| Total | | | 1,474,666 | | | | 3,668,557 | | | | 785,912 | |
Net investment loss is derived from the total net loss incurred from the trading of shares on recognized stock exchanges during the financial year.
| 25 | PROFIT BEFORE INCOME TAX |
In addition to the expenses disclosed in the notes to the unaudited interim condensed consolidated financial statements, profit before income tax has been arrived at after charging the following material expenses:
| | | Six months ended
June 30,
2022 | | | Six months ended
June 30, 2023 | |
| | | RM | | | RM | | | USD | |
| Legal and professional fees | | | 117,377 | | | | 1,473,823 | | | | 315,736 | |
| Director’s fees | | | 141,000 | | | | 5,435,664 | | | | 1,164,477 | |
| | | Six months ended
June 30,
2022 | | | Six months ended
June 30, 2023 | |
| | | RM | | | RM | | | USD | |
| Current income tax expense | | | 2,818,500 | | | | 800,000 | | | | 171,383 | |
| Overprovision for tax expense | | | (2,534,852 | ) | | | (173,857 | ) | | | (37,245 | ) |
| Income tax expense | | | 283,648 | | | | 626,143 | | | | 134,138 | |
VCI Global Limited and Subsidiaries
Interim condensed consolidated financial statements (unaudited)
| | | December 31,
2022 | | | June 30, 2023 | |
| | | RM | | | RM | | | USD | |
| Short-term leases | | | 257,243 | | | | 149,951 | | | | 32,124 | |
The Group has elected not to recognise right-of-use assets and lease liabilities for short-term leases that have lease terms of 12 months. Lease payments relating to these leases are expensed to profit or loss on a straight-line basis over the lease term.
| 28 | SIGNIFICANT RELATED PARTY TRANSACTIONS |
Related companies in these unaudited interim condensed consolidated financial statements refer to members of the ultimate holding company’s group of companies.
Some of the Group’s transactions and arrangements are between members of the Group and the effect of these on the basis determined between the parties is reflected in these unaudited interim condensed consolidated financial statements. The intercompany balances are unsecured, interest-free and repayable on demand, unless otherwise stated.
| | | December 31,
2022 | | | June 30, 2023 | |
| | | RM | | | RM | | | USD | |
| Balance with related parties (common shareholders) | | | | | | | | | |
| | | | | | | | | | |
| Trade receivables | | | | | | | | | |
| V Invesco Sdn Bhd | | | 1,305,724 | | | | 55,500 | | | | 11,890 | |
| V Capital Sdn Bhd | | | - | | | | 62,257 | | | | 13,337 | |
| | | | 1,305,724 | | | | 117,757 | | | | 25,227 | |
| | | | | | | | | | | | | |
| Non-trade receivables | | | | | | | | | | | | |
| | | | | | | | | | | | | |
| Elmu E Sdn Bhd | | | 3,000 | | | | - | | | | - | |
| Biosecure Integrators Sdn Bhd | | | 4,000 | | | | - | | | | - | |
| | | | | | | | | | | | | |
| Total amount due from related parties | | | 1,312,724 | | | | 117,757 | | | | 25,227 | |
| | | | | | | | | | | | | |
| Non-trade payables | | | | | | | | | | | | |
| | | | | | | | | | | | | |
| Hoo Voon Him | | | 966,797 | | | | 1,152,464 | | | | 246,891 | |
| Vincent Hong | | | - | | | | 466,783 | | | | 99,999 | |
| Noraini | | | 472,000 | | | | - | | | | - | |
| V Consortium Sdn Bhd | | | 100,000 | | | | 56,058 | | | | 12,009 | |
| V Invesco Sdn Bhd | | | 202,574 | | | | 10,000 | | | | 2,142 | |
| V Capital Sdn Bhd | | | 1,845,275 | | | | 327,307 | | | | 70,119 | |
| V Invesco Fund (L) Limited | | | - | | | | 5,093 | | | | 1,091 | |
| Amount due to related parties | | | 3,586,646 | | | | 2,017,705 | | | | 432,251 | |
Amount due to related parties are not expected to be repaid within the next 12 months.
VCI Global Limited and Subsidiaries
Interim condensed consolidated financial statements (unaudited)
Transactions with related parties
The following represents the significant related party transactions for the years ended June 30, 2022 and 2023.
| | | | | | | | | For the period
ended
June 30,
2022 | | | For the period
ended
June 30,
2023 | |
| | | Relationship | | Nature | | Description | | RM | | | RM | | | USD | |
| V Capital Sdn Bhd | | Common
shareholder | | Trade nature | | Purchase of services | | | - | | | | 62,257 | | | | 13,337 | |
| V Invesco Sdn Bhd | | Common
shareholder | | Trade nature | | Purchase of services | | | - | | | | 55,500 | | | | 11,890 | |
| V Capital Sdn Bhd | | Common
shareholder | | Non-trade nature | | Advances paid by V Capital Sdn Bhd | | | (1,845,275 | ) | | | (327,307 | ) | | | (70,119 | ) |
| V Invesco Sdn Bhd | | Common
shareholder | | Non-trade nature | | Advances paid by V Invesco Sdn Bhd | | | (202,574 | ) | | | (10,000 | ) | | | (2,142 | ) |
| V Invesco Sdn Bhd | | Common
shareholder | | Trade nature | | Sale of services | | | 1,304,478 | | | | - | | | | - | |
| V Invesco Fund (L) Limited | | Common
shareholder | | Non-trade nature | | Advances paid by V Invesco Fund (L) Limited | | | - | | | | (5,093 | ) | | | (1,091 | ) |
| V Consortium Sdn Bhd | | Common
shareholder | | Non-trade nature | | Advances paid by V Consortium Sdn Bhd | | | - | | | | (56,058 | ) | | | (12,009 | ) |
| | | | | | | | | | | | | | | | | | | |
| Hoo Voon Him | | Director | | Non-trade nature | | Advance receipt from Director | | | (966,797 | ) | | | (1,152,464 | ) | | | (246,891 | ) |
| Vincent Hong | | Director | | Non-trade nature | | Advance receipt from Director | | | - | | | | (466,783 | ) | | | (99,999 | ) |
Services from which reportable segments derive their revenues reported to the Group’s chief operating decision maker (CODM) for the purposes of resource allocation and assessment of segment performance focuses on the types of services provided. Management has chosen to organise the Group around differences in services. No operating segments have been aggregated in arriving at the reportable segments of the Group.
Segment revenues and results
| | | Revenue | | | Net profit | |
| | | June 30,
2022 | | | June 30,
2023 | | | June 30,
2022 | | | June 30,
2023 | |
| | | RM | | | RM | | | USD | | | RM | | | RM | | | USD | |
| | | | | | | | | | | | | | | | | | | |
| Business strategy consultancy | | | 11,359,388 | | | | 20,789,179 | | | | 4,453,647 | | | | 7,402,672 | | | | 6,498,804 | | | | 1,392,233 | |
| Technology development, solutions and consultancy | | | 9,657,906 | | | | 19,733,018 | | | | 4,227,387 | | | | 5,225,361 | | | | 11,772,361 | | | | 2,521,982 | |
| Others | | | 357,338 | | | | 3,940,998 | | | | 844,276 | | | | 1,720,928 | | | | 2,284,160 | | | | 489,334 | |
| Total | | | 21,374,632 | | | | 44,463,195 | | | | 9,525,310 | | | | 14,348,961 | | | | 20,555,325 | | | | 4,403,549 | |
| Other gains and losses | | | | | | | | | | | | | | | - | | | | 125,326 | | | | 26,848 | |
| Interest income | | | | | | | | | | | | | | | 22 | | | | 942 | | | | 202 | |
| Finance cost | | | | | | | | | | | | | | | - | | | | (1,246 | ) | | | (267 | ) |
| Transition loss | | | | | | | | | | | | | | | (290,874 | ) | | | - | | | | - | |
| Incorporation costs | | | | | | | | | | | | | | | (11,283 | ) | | | - | | | | - | |
| Profit before income tax | | | | | | | | | | | | | | | 14,046,826 | | | | 20,680,347 | | | | 4,430,332 | |
| Income tax expense | | | | | | | | | | | | | | | (283,648 | ) | | | (626,143 | ) | | | (134,138 | ) |
| Profit for the year | | | | | | | | | | | | | | | 13,763,178 | | | | 20,054,204 | | | | 4,296,194 | |
VCI Global Limited and Subsidiaries
Interim condensed consolidated financial statements (unaudited)
The accounting policies of the reportable segments are the same as the Group’s accounting policies described in Note 2. Segment profit represents the profit earned by each segment without allocation of central administration costs, finance income, finance cost and income tax expense. This is the measure reported to the chief operating decision maker for the purposes of resource allocation and assessment of segment performance.
Segment assets
| | | December 31,
2022 | | | June 30, 2023 | |
| | | RM | | | RM | | | USD | |
| Business strategy consultancy | | | 19,043,436 | | | | 34,734,543 | | | | 7,441,150 | |
| Technology development, solutions and consultancy | | | 1,175,112 | | | | 32,969,910 | | | | 7,063,114 | |
| Investments and others | | | 12,962,743 | | | | 13,662,894 | | | | 2,926,989 | |
| | | | 33,181,291 | | | | 81,367,347 | | | | 17,431,253 | |
| Unallocated assets | | | 8,642,813 | | | | - | | | | - | |
| Consolidated total assets | | | 41,824,104 | | | | 81,367,347 | | | | 17,431,253 | |
No geographical segment information presented as Group’s operations are conducted predominantly in Malaysia.
| 30 | FINANCIAL INSTRUMENTS, FINANCIAL RISKS AND CAPITAL RISKS MANAGEMENT |
| | a) | Categories of financial instruments |
The following table sets out the financial instruments as at the end of the reporting period:
| | | December 31,
2022 | | | June 30, 2023 | |
| | | RM | | | RM | | | USD | |
| Financial assets | | | | | | | | | |
| Loan and receivables (including cash and bank balances) | | | 19,733,950 | | | | 70,773,813 | | | | 15,161,810 | |
| Finance assets measured at fair value through other comprehensive income | | | 12,819,747 | | | | 7,002,234 | | | | 1,500,082 | |
| Finance assets measured at fair value through profit or loss | | | 72,295 | | | | 76,044 | | | | 16,291 | |
| | | | | | | | | | | | | |
| Financial liabilities | | | | | | | | | | | | |
| Payable at amortised cost | | | 15,711,758 | | | | 10,246,843 | | | | 2,195,171 | |
| Borrowings and lease liabilities at amortised cost | | | 1,837,832 | | | | 1,577,329 | | | | 337,910 | |
| | b) | Financial instruments subject to offsetting, enforceable master netting arrangements and similar agreements |
The Group does not have any financial instruments which are subject to enforceable master netting arrangements or similar netting agreements.
| | c) | Financial risk management policies and objectives |
The management of the Group monitors and manages the financial risks relating to the operations of the Group to ensure appropriate measures are implemented in a timely and effective manner. These risks include market risk (including foreign currency risk and interest rate risk), credit risk and liquidity risk.
| | (i) | Market risk management |
The Group activities are exposed primarily to the financial risks of changes in foreign currency exchange rates and interest rates. Management monitors risks associated with changes in foreign currency exchanges rates and interest rates and will consider appropriate measures should the need arise.
There has been no significant change to the Group’s exposure to market risk or the manner in which it manages and measures the risk.
VCI Global Limited and Subsidiaries
Interim condensed consolidated financial statements (unaudited)
| | (ii) | Foreign currency risk management |
The Group also transacts business in foreign currencies other than its functional currencies, as further disclosed below, and is therefore exposed to foreign exchange risk.
The currency exposure of financial assets and financial liabilities denominated in currencies other than the Group’s functional currency is as follows:
| | | Assets | | | Liabilities | |
| | | December 31,
2022 | | | June 30,
2023 | | | December 31,
2022 | | | June 30,
2023 | |
| | | RM | | | RM | | | RM | | | RM | |
| Singapore Dollar | | | 12,605 | | | | 22,566 | | | | - | | | | 10,164 | |
| United States Dollar | | | 3,226,121 | | | | 4,214,016 | | | | 6,008,843 | | | | 467,810 | |
Foreign currency sensitivity
The following table details the sensitivity to a 5% increase and decrease in the related foreign currencies against the functional currency (“RM”) with all the other variables held constant. 5% is the sensitivity rate used when reporting foreign currency risk internally to key management personnel and represents management’s assessment of the possible change in foreign exchange rates. The sensitivity analysis includes only outstanding foreign currency denominated monetary items and adjusts their translation at the period end for a 5% change in foreign currency rates.
| | | December 31,
2022 | | | June 30,
2023 | |
| | | RM | | | RM | |
| Singapore Dollar | | | 630 | | | | 620 | |
| United States Dollar | | | (139,136 | ) | | | 187,310 | |
| | (iii) | Interest rate risk management |
The Group is exposed to interest rate risk as the Group has bank loans which are interest bearing. The interest rates and terms of repayment of the loans are disclosed in the notes to the unaudited interim condensed consolidated financial statements. The Group currently does not have an interest rate hedging policy.
Interest rate sensitivity analysis
The sensitivity analysis below has been determined based on the exposure to interest rate for non-derivative instruments at the end of the reporting period. A 50 basis point increase or decrease is used when reporting interest rate risk internally to key management personnel and represents management’s assessment of the reasonably possible change in interest rates.
If interest rates on loans had been 50 basis points higher/lower and all other variables were held constant, the Group’s profit for the year would decrease/increase by approximately RM 50,000 (2022: RM 55,000).
| | (iv) | Credit risk management |
Credit risk refers to the risk that a counterparty will default on its contractual obligations resulting in financial loss to the Group. At the end of each reporting period, the Group’s maximum exposure to credit risk which will cause a financial loss to the Group due to failure to discharge an obligation by the counterparties arises from the carrying amount of the respective recognized financial assets as stated in the statements of financial position.
In order to minimise credit risk, the Group has delegated its finance team to develop and maintain the Group’s credit risk grading to categorise exposures according to their degree of risk of default. The finance team uses publicly available financial information and the Group’s own historical repayment records to rate its major customers and debtors. The Group’s exposure and the credit ratings of its counterparties are continuously monitored, and the aggregate value of transactions concluded is spread amongst approved counterparties.
The Group’s current credit risk grading framework comprises the following categories:
| Category | | Description | | Basis for
recognising ECL |
| Performing | | The counterparty has a low risk of default and does not have any past-due amounts | | 12-month ECL |
| Doubtful | | There has been a significant increase in credit risk since initial recognition | | Lifetime ECL-
not credit-impaired |
| In default | | There is evidence indicating the asset is credit impaired | | Lifetime ECL - credit impaired |
| Write-off | | There is evidence indicating that the debtor is in severe financial difficulty and the Company has no realistic prospect of recovery | | Amount is written off |
VCI Global Limited and Subsidiaries
Interim condensed consolidated financial statements (unaudited)
For trade receivables, the Group has applied the simplified approach allowed in the accounting standard to measure the loss allowance at lifetime ECL. The Group determines the ECL on these items by using a provision matrix, estimated based on historical credit loss experience based on the past default experience of the debtor, general economic conditions of the industry in which the debtors operate and an assessment of both the current as well as the forecast direction of conditions at the reporting date. To measure the expected credit losses, trade receivables has been grouped based on shared credit risk characteristics (including high risk, normal risk and low risk type).
As at the end of the reporting period, the impairment allowance for ECL is disclosed in Note 10 to the unaudited interim condensed consolidated financial statements. The directors of the Group considered that the ECL for non-credit impaired trade receivables is insignificant as at the end of the reporting period.
| | (v) | Liquidity risk management |
Liquidity risk is the risk that the Group will encounter difficulty in meeting financial obligations due to shortage of funds.
In assessing our liquidity, we monitor and analyse our cash and cash equivalents and our operating expenditure commitments. Our liquidity needs are to meet our working capital requirements and operating expenses obligations. To date, we have financed our operations primarily through cash flows from operations, equity financing, and short-term borrowing from banks and related parties.
Based on the above considerations, management is of the opinion that the Group has sufficient funds to meet its working capital requirements and debt obligations, for at least the next 12 months from end of the reporting period.
The Group maintains sufficient cash and cash equivalents, and internally generated cash flows to finance their activities.
Liquidity risk analyses
Non-derivative financial liabilities
The following table details the remaining contractual maturity for non-derivative financial liabilities. The tables have been drawn up based on the undiscounted cash flows of financial liabilities based on the earliest date on which the Group can be required to pay. The table includes both interest and principal cash flows. The adjustment column represents the possible future cash flows attributable to the instrument included in the carrying amount of the financial liabilities on the statement of financial position.
| | | Weighted | | | On | | | | | | | |
| | | average | | | demand | | | | | | | |
| | | effective | | | or within | | | Within | | | | |
| | | interest rate | | | 1 year | | | 2 to 5 years | | | Total | |
| | | % | | | RM | | | RM | | | RM | |
| | | | | | | | | | | | | |
| As of June 30, 2023 | | | | | | | | | | | | | | | | |
| Non-interest bearing | | | - | | | | 6,395,343 | | | | 2,017,705 | | | | 8,413,048 | |
| Fixed interest rate | | | 3.5-5 | % | | | 162,837 | | | | 422,751 | | | | 585,588 | |
| Variable interest rate | | | BLR+2.6 | % | | | 32,711 | | | | 309,331 | | | | 342,042 | |
| Total | | | | | | | 6,590,891 | | | | 2,749,787 | | | | 9,340,678 | |
| | | | | | | | | | | | | | | | | |
| 2022 | | | | | | | | | | | | | | | | |
| Non-interest bearing | | | - | | | | 10,408,318 | | | | 3,586,646 | | | | 13,994,964 | |
| Fixed interest rate | | | 3.5-5 | % | | | 1,114,999 | | | | 744,331 | | | | 1,859,330 | |
| Variable interest rate | | | BLR+2.6 | % | | | 16,543 | | | | - | | | | 16,543 | |
| Total | | | | | | | 11,539,860 | | | | 4,330,977 | | | | 15,870,837 | |
VCI Global Limited and Subsidiaries
Interim condensed consolidated financial statements (unaudited)
| | (vi) | Fair value of financial assets and financial liabilities |
The management considers that the carrying amounts of Group’s financial assets and financial liabilities approximate their respective fair values due to the relatively short-term maturity of these financial instruments. The fair values of other classes of financial assets and liabilities are disclosed in the respective notes to unaudited interim condensed consolidated financial statements.
| | (d) | Capital risk management policies and objectives |
The management manages its capital to ensure that the Group will be able to continue as a going concern in order to provide returns for shareholders and benefits for other stakeholders and to maintain an optimal capital structure to reduce cost of capital.
The capital structure of the Group consists of equity attributable to owners of the Company, comprising issued capital, reserve and retained earnings as disclosed in the notes to unaudited interim condensed consolidated financial statements.
Management monitors capital based on debt-to-equity ratio. The debt-to-equity ratio is calculated as total debt divided by total equity. Total debt is calculated as borrowings plus trade and other payables
| | | December 31,
2022 | | | June 30, 2023 | |
| | | RM | | | RM | | | USD | |
| Total debts | | | 15,832,796 | | | | 9,990,377 | | | | 2,140,229 | |
| Total equity | | | 24,274,514 | | | | 69,543,175 | | | | 14,898,172 | |
| | | | | | | | | | | | | |
| Debt-to-equity % | | | 65.22 | % | | | 14.37 | % | | | 14.37 | % |
The Group is not subject to externally imposed capital requirements for the financial years ended December 31, 2022 and for the financial period ended June 30, 2023.
The Group’s overall strategy remains unchanged from prior year.
Financial instruments that potentially expose the Group to concentrations of credit risk consist primarily of accounts receivables. The Group conducts credit evaluations of their customers, and generally do not require collateral or other security from them. The Group evaluates their collection experience and long outstanding balances to determine the need for an allowance for doubtful accounts. The Group conducts periodic reviews of the financial condition and payment practices of their customers to minimize collection risk on accounts receivable.
The following table sets forth a summary of single customers who represent 10% or more of the Group’s total revenue:
| | | June 30,
2022 | | | June 30, 2023 | |
| | | RM | | | RM | | | USD | |
| Amount of the Group’s revenue: | | | | | | | | | |
| Customer A | | | 19,134,493 | | | | 19,712,300 | | | | 4,222,948 | |
| Customer B | | | 9,462,273 | | | | - | | | | - | |
| Customer C | | | - | * | | | 8,263,840 | | | | 1,770,355 | |
The following table sets forth a summary of single customers who represent 10% or more of the Group’s total accounts receivable:
| | | December 31,
2022 | | | June 30, 2023 | |
| | | RM | | | RM | | | USD | |
| Amount of the Group’s revenue: | | | | | | | | | | | | |
| Customer A | | | 4,078,000 | | | | 3,604,500 | | | | 772,189 | |
| Customer B | | | - | | | | - | | | | - | |
| * | Revenue from relevant customer was less than 10% of the Group’s total revenue for the respective year. |
VCI Global Limited and Subsidiaries
Interim condensed consolidated financial statements (unaudited)
| | 31 | FAIR VALUE AND FAIR VALUE HIERARCHY OF FINANCIAL INSTRUMENTS |
The carrying amounts and fair values of the Group’s financial instruments, other than those with carrying amounts that reasonably approximate to fair values, are as follows:
| | | Carrying amount | | | Fair value | |
| | | December 31,
2022 | | | June 30,
2023 | | | December 31,
2022 | | | June 30,
2023 | |
| | | RM | | | RM | | | USD | | | RM | | | RM | | | USD | |
| Financial assets | | | | | | | | | | | | | | | | | | | | | | | | |
| Financial assets at fair value through profit or loss | | | 72,295 | | | | 76,044 | | | | 16,291 | | | | 72,295 | | | | 76,044 | | | | 16,291 | |
| Financial assets at fair value through other comprehensive income | | | 12,819,747 | | | | 7,002,234 | | | | 1,500,082 | | | | 12,819,747 | | | | 7,002,234 | | | | 1,500,082 | |
At each reporting date, management analyses the movements in the values of financial instruments and determines the major inputs applied in the valuation.
The valuation procedures applied include consideration of recent transactions in the same security or financial instrument, recent financing of the investee companies, economic and market conditions, current and projected financial performance of the investee companies, and the investee companies’ management team as well as potential future strategies to realize the investments.
Management believes that the estimated fair values resulting from the valuation technique, which are recorded in the consolidated statements of financial position, and the related changes in fair values, which are recorded in profit or loss, are reasonable, and that they were the most appropriate values at the end of the reporting periods.
VCI Global Limited and Subsidiaries
Interim condensed consolidated financial statements (unaudited)
Fair value hierarchy
The following tables illustrate the fair value measurement hierarchy of the Group’s financial instruments:
Assets measured at fair value:
| | | Fair value measurement using | |
| | | Quoted
prices in
active
markets
(Level 1) | | | Significant
observable
inputs
(Level 2) | | | Significant
unobservable
inputs
(Level 3) | | | Total | |
| | | RM | | | RM | | | RM | | | RM | |
| As at December 31, 2022 | | | | | | | | | | | | | | | | |
| Financial assets at fair value through profit or loss | | | - | | | | - | | | | 72,295 | | | | 72,295 | |
| Financial assets at fair value through other comprehensive income | | | 12,819,747 | | | | - | | | | - | | | | 12,819,747 | |
| As at June 30, 2023 | | | | | | | | | | | | | | | | |
| Financial assets at fair value through profit or loss | | | - | | | | - | | | | 76,044 | | | | 76,044 | |
| Financial assets at fair value through other comprehensive income | | | - | | | | - | | | | 7,002,234 | | | | 7,002,234 | |
During the year ended December 31, 2022, the financial assets at fair value through other comprehensive income has been transferred from Level 2 to Level 1 as the financial asset is quoted on Nasdaq Stock Market.
The movements in fair value measurements within Level 1 during the years are as follow:
| | | December 31,
2022 | | | June 30, 2023 | |
| | | RM | | | RM | | | USD | |
| | | | | | | | | | |
| Quoted/Unquoted equity shares at fair value through other comprehensive income | | | | | | | | | | | | |
| At beginning of year | | | 34,221,879 | | | | 12,819,747 | | | | 2,746,363 | |
| Total unrealized gain recognized in other comprehensive income/(loss) | | | (21,402,132 | ) | | | - | | | | - | |
| Disposal | | | - | | | | (12,819,747 | ) | | | (2,746,363 | ) |
| At end of year | | | 12,819,747 | | | | - | | | | - | |
| 32 | RECONCILIATIONS OF LIABILITIES ARISING FROM FINANCING ACTIVITIES |
| | | At
beginning
of year | | | Principal | | | Interest
charges | | | Interest
paid | | | At end of
year | |
| | | RM | | | RM | | | RM | | | RM | | | RM | |
| As of June 30, 2023 | | | | | | | | | | | | | | | |
| Bank borrowings | | | 443,174 | | | | (101,132 | ) | | | 192 | | | | (192 | ) | | | 342,042 | |
| Lease liabilities | | | 744,959 | | | | (159,371 | ) | | | 14,629 | | | | (14,629 | ) | | | 585,588 | |
| Other borrowings | | | 649,699 | | | | - | | | | - | | | | - | | | | 649,699 | |
| | | | 1,837,832 | | | | (260,503 | ) | | | 14,821 | | | | (14,821 | ) | | | 1,577,329 | |
| Repayment | | Within
one year | | | 2024 | | | 2025 | | | 2026 | | | Total | |
| | | RM | | | RM | | | RM | | | RM | | | RM | |
| As of June 30, 2023 | | | | | | | | | | | | | | | |
| Bank borrowings | | | 32,711 | | | | 117,300 | | | | 117,300 | | | | 74,731 | | | | 342,042 | |
| Lease liabilities | | | 162,837 | | | | 422,751 | | | | - | | | | - | | | | 585,588 | |
| Other borrowings | | | 649,699 | | | | - | | | | - | | | | - | | | | 649,699 | |
| | | | 845,247 | | | | 540,051 | | | | 117,300 | | | | 74,731 | | | | 1,577,329 | |
VCI Global Limited and Subsidiaries
Interim condensed consolidated financial statements (unaudited)
| | | At
beginning
of year | | | Proceeds
from
borrowings | | | Principal | | | Interest
charges | | | Interest
paid | | | At end of
year | |
| | | RM | | | RM | | | RM | | | RM | | | RM | | | RM | |
| As of December 31, 2022 | | | | | | | | | | | | | | | | | | |
| Bank borrowings | | | 542,384 | | | | - | | | | (99,210 | ) | | | 25,560 | | | | (25,560 | ) | | | 443,174 | |
| Lease liabilities | | | - | | | | 952,191 | | | | (207,232 | ) | | | 24,768 | | | | (24,768 | ) | | | 744,959 | |
| Other borrowings | | | 668,608 | | | | - | | | | (18,909 | ) | | | - | | | | - | | | | 649,699 | |
| | | | 1,210,992 | | | | 952,191 | | | | (325,351 | ) | | | 50,328 | | | | (50,328 | ) | | | 1,837,832 | |
| Repayment | | Within
one year | | | 2023 | | | 2024 | | | 2025 | | | Total | |
| | | RM | | | RM | | | RM | | | RM | | | RM | |
| As of December 31, 2022 | | | | | | | | | | | | | | | |
| Bank borrowings | | | 133,843 | | | | 117,300 | | | | 117,300 | | | | 74,731 | | | | 443,174 | |
| Lease liabilities | | | 322,208 | | | | 336,372 | | | | 86,379 | | | | - | | | | 744,959 | |
| Other borrowings | | | 649,699 | | | | - | | | | - | | | | - | | | | 649,699 | |
| | | | 1,105,750 | | | | 453,672 | | | | 203,679 | | | | 74,731 | | | | 1,837,832 | |
The Company evaluated all events and transactions that occurred from June 30, 2023 up through October 4, 2023, which is the date that these unaudited interim condensed consolidated financial statements are available for distribution. Other than the events disclosed below:
| ● | Generative AI Sdn Bhd, a private wholly-owned subsidiary of VCI Global Limited was incorporated on July 21, 2023 in Malaysia. Its principal activities include artificial intelligence, image processing, communications, networking and process control software. |
| ● | On August 1, 2023, the Company issued 286,533 restricted ordinary shares, at a value of USD$3.49 per share, to ZCity Sdn Bhd, as their service consideration pursuant to a software development agreement. |
| ● | On August 7, 2023, the Company issued 14,327 restricted ordinary shares, at a value of USD$3.49 per share, to Outside The Box Capital Inc., as their consideration pursuant to a marketing agreement. |
F-44
0.12 0.40 0.55 false --12-31 Q2 2023-06-30 0001930510 0001930510 2023-01-01 2023-06-30 0001930510 2023-06-30 0001930510 2022-12-31 0001930510 2022-01-01 2022-06-30 0001930510 ifrs-full:ClassesOfShareCapitalMember 2021-12-31 0001930510 ifrs-full:CapitalReserveMember 2021-12-31 0001930510 vcig:ForeignExchangeReservesMember 2021-12-31 0001930510 ifrs-full:RetainedEarningsMember 2021-12-31 0001930510 ifrs-full:IssuedCapitalMember 2021-12-31 0001930510 ifrs-full:NoncontrollingInterestsMember 2021-12-31 0001930510 2021-12-31 0001930510 ifrs-full:ClassesOfShareCapitalMember 2022-01-01 2022-06-30 0001930510 ifrs-full:CapitalReserveMember 2022-01-01 2022-06-30 0001930510 vcig:ForeignExchangeReservesMember 2022-01-01 2022-06-30 0001930510 ifrs-full:RetainedEarningsMember 2022-01-01 2022-06-30 0001930510 ifrs-full:IssuedCapitalMember 2022-01-01 2022-06-30 0001930510 ifrs-full:NoncontrollingInterestsMember 2022-01-01 2022-06-30 0001930510 ifrs-full:ClassesOfShareCapitalMember 2022-06-30 0001930510 ifrs-full:CapitalReserveMember 2022-06-30 0001930510 vcig:ForeignExchangeReservesMember 2022-06-30 0001930510 ifrs-full:RetainedEarningsMember 2022-06-30 0001930510 ifrs-full:IssuedCapitalMember 2022-06-30 0001930510 ifrs-full:NoncontrollingInterestsMember 2022-06-30 0001930510 2022-06-30 0001930510 ifrs-full:ClassesOfShareCapitalMember 2022-12-31 0001930510 ifrs-full:CapitalReserveMember 2022-12-31 0001930510 vcig:ForeignExchangeReservesMember 2022-12-31 0001930510 ifrs-full:RetainedEarningsMember 2022-12-31 0001930510 ifrs-full:IssuedCapitalMember 2022-12-31 0001930510 ifrs-full:NoncontrollingInterestsMember 2022-12-31 0001930510 ifrs-full:ClassesOfShareCapitalMember 2023-01-01 2023-06-30 0001930510 ifrs-full:CapitalReserveMember 2023-01-01 2023-06-30 0001930510 vcig:ForeignExchangeReservesMember 2023-01-01 2023-06-30 0001930510 ifrs-full:RetainedEarningsMember 2023-01-01 2023-06-30 0001930510 ifrs-full:IssuedCapitalMember 2023-01-01 2023-06-30 0001930510 ifrs-full:NoncontrollingInterestsMember 2023-01-01 2023-06-30 0001930510 ifrs-full:ClassesOfShareCapitalMember 2023-06-30 0001930510 ifrs-full:CapitalReserveMember 2023-06-30 0001930510 vcig:ForeignExchangeReservesMember 2023-06-30 0001930510 ifrs-full:RetainedEarningsMember 2023-06-30 0001930510 ifrs-full:IssuedCapitalMember 2023-06-30 0001930510 ifrs-full:NoncontrollingInterestsMember 2023-06-30 0001930510 vcig:VciGlobalLimitedMember 2023-01-01 2023-06-30 0001930510 vcig:VciGlobalLimitedMember 2022-01-01 2022-12-31 0001930510 vcig:VCapitalKronosBerhadMember 2023-01-01 2023-06-30 0001930510 vcig:VCapitalKronosBerhadMember 2022-01-01 2022-12-31 0001930510 vcig:VCapitalVentureSdnBhdMember 2023-01-01 2023-06-30 0001930510 vcig:VCapitalVentureSdnBhdMember 2022-01-01 2022-12-31 0001930510 vcig:AccuventuresSdnBhdMember 2023-01-01 2023-06-30 0001930510 vcig:AccuventuresSdnBhdMember 2022-01-01 2022-12-31 0001930510 vcig:CredilabSdnBhdMember 2023-01-01 2023-06-30 0001930510 vcig:CredilabSdnBhdMember 2022-01-01 2022-12-31 0001930510 vcig:VCapitalAdvisorySdnBhdMember 2023-01-01 2023-06-30 0001930510 vcig:VCapitalAdvisorySdnBhdMember 2022-01-01 2022-12-31 0001930510 vcig:VCapitalQuantumSdnBhdMember 2023-01-01 2023-06-30 0001930510 vcig:VCapitalQuantumSdnBhdMember 2022-01-01 2022-12-31 0001930510 vcig:VCapitalConsultingLimitedMember 2023-01-01 2023-06-30 0001930510 vcig:VCapitalConsultingLimitedMember 2022-01-01 2022-12-31 0001930510 vcig:ImejJiwaCommunicationSdnBhdMember 2023-01-01 2023-06-30 0001930510 vcig:ImejJiwaCommunicationSdnBhdMember 2022-01-01 2022-12-31 0001930510 vcig:AbManagementAndConsultancySdnBhdMember 2023-01-01 2023-06-30 0001930510 vcig:AbManagementAndConsultancySdnBhdMember 2022-01-01 2022-12-31 0001930510 vcig:ElmuEducationGroupSdnBhdMember 2023-01-01 2023-06-30 0001930510 vcig:ElmuEducationGroupSdnBhdMember 2022-01-01 2022-12-31 0001930510 vcig:ElmuVSdnBhdMember 2023-01-01 2023-06-30 0001930510 vcig:ElmuVSdnBhdMember 2022-01-01 2022-12-31 0001930510 vcig:ElmuHigherEducationSdnBhdMember 2023-01-01 2023-06-30 0001930510 vcig:ElmuHigherEducationSdnBhdMember 2022-01-01 2022-12-31 0001930510 vcig:VCapitalRealEstateSdnBhdMember 2023-01-01 2023-06-30 0001930510 vcig:VCapitalRealEstateSdnBhdMember 2022-01-01 2022-12-31 0001930510 vcig:VCapitalRoboticsSdnBhdMember 2023-01-01 2023-06-30 0001930510 vcig:VCapitalRoboticsSdnBhdMember 2022-01-01 2022-12-31 0001930510 vcig:TgiVSdnBhdMember 2023-01-01 2023-06-30 0001930510 vcig:TgiVSdnBhdMember 2022-01-01 2022-12-31 0001930510 vcig:VcigLimitedMember 2023-01-01 2023-06-30 0001930510 vcig:VcigLimitedMember 2022-01-01 2022-12-31 0001930510 vcig:VGalactechSdnBhdMember 2023-01-01 2023-06-30 0001930510 vcig:VGalactechSdnBhdMember 2022-01-01 2022-12-31 0001930510 vcig:VcAcquisitionLtdMember 2023-01-01 2023-06-30 0001930510 vcig:VcAcquisitionLtdMember 2022-01-01 2022-12-31 0001930510 vcig:VcAcquisitionIiLtdMember 2023-01-01 2023-06-30 0001930510 vcig:VcAcquisitionIiLtdMember 2022-01-01 2022-12-31 0001930510 vcig:OfficeRenovationMember 2023-01-01 2023-06-30 0001930510 ifrs-full:OfficeEquipmentMember 2023-01-01 2023-06-30 0001930510 vcig:FurnitureAndFittingsMember 2023-01-01 2023-06-30 0001930510 vcig:ElectricalAndFittingsMember 2023-01-01 2023-06-30 0001930510 ifrs-full:RightofuseAssetsMember 2023-01-01 2023-06-30 0001930510 2022-01-01 2022-12-31 0001930510 vcig:TreasureGlobalIncOneMember vcig:UnquotedInvestmentsInSharesMember 2023-06-30 0001930510 vcig:GlobexusHoldingCorpsMember 2023-05-31 0001930510 vcig:ZeroCarbonFarmsLtdMember vcig:OtherUnquotedSharesMember country:GB 2023-06-30 0001930510 vcig:ZeroCarbonFarmsLtdMember vcig:OtherUnquotedSharesMember country:GB 2022-12-31 0001930510 vcig:UniqueFireHoldingsBerhadMember vcig:OtherUnquotedSharesMember country:MY 2023-06-30 0001930510 vcig:UniqueFireHoldingsBerhadMember vcig:OtherUnquotedSharesMember country:MY 2022-12-31 0001930510 ifrs-full:FinancialAssetsAtFairValueThroughProfitOrLossCategoryMember 2021-12-31 0001930510 ifrs-full:FinancialAssetsAtFairValueThroughProfitOrLossCategoryMember 2022-12-31 0001930510 ifrs-full:FinancialAssetsAtFairValueThroughProfitOrLossCategoryMember 2022-01-01 2022-12-31 0001930510 ifrs-full:FinancialAssetsAtFairValueThroughProfitOrLossCategoryMember 2023-01-01 2023-06-30 0001930510 ifrs-full:FinancialAssetsAtFairValueThroughProfitOrLossCategoryMember 2023-06-30 0001930510 vcig:GrossCarryingCostMember ifrs-full:OfficeEquipmentMember 2021-12-31 0001930510 vcig:GrossCarryingCostMember ifrs-full:FixturesAndFittingsMember 2021-12-31 0001930510 vcig:GrossCarryingCostMember vcig:OfficeRenovationMember 2021-12-31 0001930510 vcig:GrossCarryingCostMember ifrs-full:ComputerSoftwareMember 2021-12-31 0001930510 vcig:GrossCarryingCostMember 2021-12-31 0001930510 vcig:GrossCarryingCostMember ifrs-full:OfficeEquipmentMember 2022-01-01 2022-12-31 0001930510 vcig:GrossCarryingCostMember ifrs-full:FixturesAndFittingsMember 2022-01-01 2022-12-31 0001930510 vcig:GrossCarryingCostMember vcig:OfficeRenovationMember 2022-01-01 2022-12-31 0001930510 vcig:GrossCarryingCostMember ifrs-full:ComputerSoftwareMember 2022-01-01 2022-12-31 0001930510 vcig:GrossCarryingCostMember 2022-01-01 2022-12-31 0001930510 vcig:GrossCarryingCostMember ifrs-full:OfficeEquipmentMember 2022-12-31 0001930510 vcig:GrossCarryingCostMember ifrs-full:FixturesAndFittingsMember 2022-12-31 0001930510 vcig:GrossCarryingCostMember vcig:OfficeRenovationMember 2022-12-31 0001930510 vcig:GrossCarryingCostMember ifrs-full:ComputerSoftwareMember 2022-12-31 0001930510 vcig:GrossCarryingCostMember 2022-12-31 0001930510 vcig:GrossCarryingCostMember ifrs-full:OfficeEquipmentMember 2023-01-01 2023-06-30 0001930510 vcig:GrossCarryingCostMember ifrs-full:FixturesAndFittingsMember 2023-01-01 2023-06-30 0001930510 vcig:GrossCarryingCostMember vcig:OfficeRenovationMember 2023-01-01 2023-06-30 0001930510 vcig:GrossCarryingCostMember ifrs-full:ComputerSoftwareMember 2023-01-01 2023-06-30 0001930510 vcig:GrossCarryingCostMember 2023-01-01 2023-06-30 0001930510 vcig:GrossCarryingCostMember ifrs-full:OfficeEquipmentMember 2023-06-30 0001930510 vcig:GrossCarryingCostMember ifrs-full:FixturesAndFittingsMember 2023-06-30 0001930510 vcig:GrossCarryingCostMember vcig:OfficeRenovationMember 2023-06-30 0001930510 vcig:GrossCarryingCostMember ifrs-full:ComputerSoftwareMember 2023-06-30 0001930510 vcig:GrossCarryingCostMember 2023-06-30 0001930510 vcig:AccumulatedAmortisationAndDepreciationMember ifrs-full:OfficeEquipmentMember 2021-12-31 0001930510 vcig:AccumulatedAmortisationAndDepreciationMember ifrs-full:FixturesAndFittingsMember 2021-12-31 0001930510 vcig:AccumulatedAmortisationAndDepreciationMember vcig:OfficeRenovationMember 2021-12-31 0001930510 vcig:AccumulatedAmortisationAndDepreciationMember ifrs-full:ComputerSoftwareMember 2021-12-31 0001930510 vcig:AccumulatedAmortisationAndDepreciationMember 2021-12-31 0001930510 vcig:AccumulatedAmortisationAndDepreciationMember ifrs-full:OfficeEquipmentMember 2022-01-01 2022-12-31 0001930510 vcig:AccumulatedAmortisationAndDepreciationMember ifrs-full:FixturesAndFittingsMember 2022-01-01 2022-12-31 0001930510 vcig:AccumulatedAmortisationAndDepreciationMember vcig:OfficeRenovationMember 2022-01-01 2022-12-31 0001930510 vcig:AccumulatedAmortisationAndDepreciationMember ifrs-full:ComputerSoftwareMember 2022-01-01 2022-12-31 0001930510 vcig:AccumulatedAmortisationAndDepreciationMember 2022-01-01 2022-12-31 0001930510 vcig:AccumulatedAmortisationAndDepreciationMember ifrs-full:OfficeEquipmentMember 2022-12-31 0001930510 vcig:AccumulatedAmortisationAndDepreciationMember ifrs-full:FixturesAndFittingsMember 2022-12-31 0001930510 vcig:AccumulatedAmortisationAndDepreciationMember vcig:OfficeRenovationMember 2022-12-31 0001930510 vcig:AccumulatedAmortisationAndDepreciationMember ifrs-full:ComputerSoftwareMember 2022-12-31 0001930510 vcig:AccumulatedAmortisationAndDepreciationMember 2022-12-31 0001930510 vcig:AccumulatedAmortisationAndDepreciationMember ifrs-full:OfficeEquipmentMember 2023-01-01 2023-06-30 0001930510 vcig:AccumulatedAmortisationAndDepreciationMember ifrs-full:FixturesAndFittingsMember 2023-01-01 2023-06-30 0001930510 vcig:AccumulatedAmortisationAndDepreciationMember vcig:OfficeRenovationMember 2023-01-01 2023-06-30 0001930510 vcig:AccumulatedAmortisationAndDepreciationMember ifrs-full:ComputerSoftwareMember 2023-01-01 2023-06-30 0001930510 vcig:AccumulatedAmortisationAndDepreciationMember 2023-01-01 2023-06-30 0001930510 vcig:AccumulatedAmortisationAndDepreciationMember ifrs-full:OfficeEquipmentMember 2023-06-30 0001930510 vcig:AccumulatedAmortisationAndDepreciationMember ifrs-full:FixturesAndFittingsMember 2023-06-30 0001930510 vcig:AccumulatedAmortisationAndDepreciationMember vcig:OfficeRenovationMember 2023-06-30 0001930510 vcig:AccumulatedAmortisationAndDepreciationMember ifrs-full:ComputerSoftwareMember 2023-06-30 0001930510 vcig:AccumulatedAmortisationAndDepreciationMember 2023-06-30 0001930510 vcig:CarryingAmountsMember ifrs-full:OfficeEquipmentMember 2022-12-31 0001930510 vcig:CarryingAmountsMember ifrs-full:FixturesAndFittingsMember 2022-12-31 0001930510 vcig:CarryingAmountsMember vcig:OfficeRenovationMember 2022-12-31 0001930510 vcig:CarryingAmountsMember ifrs-full:ComputerSoftwareMember 2022-12-31 0001930510 vcig:CarryingAmountsMember 2022-12-31 0001930510 vcig:CarryingAmountsMember ifrs-full:OfficeEquipmentMember 2023-06-30 0001930510 vcig:CarryingAmountsMember ifrs-full:FixturesAndFittingsMember 2023-06-30 0001930510 vcig:CarryingAmountsMember vcig:OfficeRenovationMember 2023-06-30 0001930510 vcig:CarryingAmountsMember ifrs-full:ComputerSoftwareMember 2023-06-30 0001930510 vcig:CarryingAmountsMember 2023-06-30 0001930510 vcig:CostMember 2021-12-31 0001930510 vcig:CostMember 2022-01-01 2022-12-31 0001930510 vcig:CostMember 2022-12-31 0001930510 vcig:CostMember 2023-01-01 2023-06-30 0001930510 vcig:CurrentTradeReceivablesMember vcig:OverTwoHundredFortyDaysMember 2023-06-30 0001930510 vcig:ReceivablesNotPastDueMember 2023-06-30 0001930510 vcig:ReceivablesNotPastDueMember 2022-12-31 0001930510 vcig:ReceivablesPastDueMember 2023-06-30 0001930510 vcig:ReceivablesPastDueMember 2022-12-31 0001930510 vcig:ReceivableDueMember 2023-06-30 0001930510 vcig:ReceivableDueMember 2022-12-31 0001930510 vcig:CurrentTradeReceivablesMember vcig:LessThanThirtyDaysMember 2023-06-30 0001930510 vcig:CurrentTradeReceivablesMember vcig:LessThanThirtyDaysMember 2022-12-31 0001930510 vcig:CurrentTradeReceivablesMember ifrs-full:LaterThanOneMonthAndNotLaterThanTwoMonthsMember 2023-06-30 0001930510 vcig:CurrentTradeReceivablesMember ifrs-full:LaterThanOneMonthAndNotLaterThanTwoMonthsMember 2022-12-31 0001930510 vcig:CurrentTradeReceivablesMember vcig:SixtyOneDaysToTwoHundredTenDaysMember 2023-06-30 0001930510 vcig:CurrentTradeReceivablesMember vcig:SixtyOneDaysToTwoHundredTenDaysMember 2022-12-31 0001930510 vcig:CurrentTradeReceivablesMember vcig:TwoHundredElevenDaysToTwoHunderedFortyDaysMember 2023-06-30 0001930510 vcig:CurrentTradeReceivablesMember vcig:TwoHundredElevenDaysToTwoHunderedFortyDaysMember 2022-12-31 0001930510 vcig:CurrentTradeReceivablesMember vcig:TwoHundredFortyOneDaysToOneYearMember 2023-06-30 0001930510 vcig:CurrentTradeReceivablesMember vcig:TwoHundredFortyOneDaysToOneYearMember 2022-12-31 0001930510 vcig:CurrentTradeReceivablesMember 2023-06-30 0001930510 vcig:CurrentTradeReceivablesMember 2022-12-31 0001930510 vcig:CurrentTradeReceivablesMember vcig:NotPastDueMember 2022-12-31 0001930510 vcig:CurrentTradeReceivablesMember vcig:OneToThirtyDaysMember 2022-12-31 0001930510 vcig:CurrentTradeReceivablesMember vcig:OverTwoHundredFortyOneDaysMember 2022-12-31 0001930510 vcig:CurrentTradeReceivablesMember vcig:NotPastDueMember ifrs-full:LifetimeExpectedCreditLossesMember 2022-12-31 0001930510 vcig:CurrentTradeReceivablesMember vcig:OneToThirtyDaysMember ifrs-full:LifetimeExpectedCreditLossesMember 2022-12-31 0001930510 vcig:CurrentTradeReceivablesMember ifrs-full:LaterThanOneMonthAndNotLaterThanTwoMonthsMember ifrs-full:LifetimeExpectedCreditLossesMember 2022-12-31 0001930510 vcig:CurrentTradeReceivablesMember vcig:SixtyOneDaysToTwoHundredTenDaysMember ifrs-full:LifetimeExpectedCreditLossesMember 2022-12-31 0001930510 vcig:CurrentTradeReceivablesMember vcig:TwoHundredElevenDaysToTwoHunderedFortyDaysMember ifrs-full:LifetimeExpectedCreditLossesMember 2022-12-31 0001930510 vcig:CurrentTradeReceivablesMember vcig:OverTwoHundredFortyOneDaysMember ifrs-full:LifetimeExpectedCreditLossesMember 2022-12-31 0001930510 vcig:CurrentTradeReceivablesMember ifrs-full:LifetimeExpectedCreditLossesMember 2022-12-31 0001930510 vcig:CurrentTradeReceivablesMember vcig:NotPastDueMember ifrs-full:LifetimeExpectedCreditLossesMember 2023-06-30 0001930510 vcig:CurrentTradeReceivablesMember vcig:OneToThirtyDaysMember ifrs-full:LifetimeExpectedCreditLossesMember 2023-06-30 0001930510 vcig:CurrentTradeReceivablesMember ifrs-full:LaterThanOneMonthAndNotLaterThanTwoMonthsMember ifrs-full:LifetimeExpectedCreditLossesMember 2023-06-30 0001930510 vcig:CurrentTradeReceivablesMember vcig:SixtyOneDaysToTwoHundredTenDaysMember ifrs-full:LifetimeExpectedCreditLossesMember 2023-06-30 0001930510 vcig:CurrentTradeReceivablesMember vcig:TwoHundredElevenDaysToTwoHunderedFortyDaysMember ifrs-full:LifetimeExpectedCreditLossesMember 2023-06-30 0001930510 vcig:CurrentTradeReceivablesMember vcig:OverTwoHundredFortyOneDaysMember ifrs-full:LifetimeExpectedCreditLossesMember 2023-06-30 0001930510 vcig:CurrentTradeReceivablesMember ifrs-full:LifetimeExpectedCreditLossesMember 2023-06-30 0001930510 currency:USD vcig:CurrentTradeReceivablesMember 2022-12-31 0001930510 currency:USD vcig:CurrentTradeReceivablesMember 2023-06-30 0001930510 currency:SGD 2022-12-31 0001930510 currency:SGD 2023-06-30 0001930510 currency:USD 2022-12-31 0001930510 currency:USD 2023-06-30 0001930510 2022-07-01 2022-12-31 0001930510 vcig:WithinOneYearMember 2022-07-01 2022-12-31 0001930510 vcig:WithinOneYearMember 2023-01-01 2023-06-30 0001930510 vcig:WithinTwoToFiveYearMember 2022-07-01 2022-12-31 0001930510 vcig:WithinTwoToFiveYearMember 2023-01-01 2023-06-30 0001930510 ifrs-full:LeaseLiabilitiesMember 2022-07-01 2022-12-31 0001930510 ifrs-full:LeaseLiabilitiesMember 2023-01-01 2023-06-30 0001930510 vcig:LoanOneMember 2023-06-30 0001930510 vcig:LoanOneMember 2023-01-01 2023-06-30 0001930510 vcig:LoanTwoMember 2023-06-30 0001930510 vcig:LoanTwoMember 2023-01-01 2023-06-30 0001930510 vcig:LoanThreeMember 2023-06-30 0001930510 vcig:LoanThreeMember 2023-01-01 2023-06-30 0001930510 vcig:CreditGuaranteeCorporationMember 2023-06-30 0001930510 vcig:SunLifeMalaysiaAssuranceBerhadMember 2023-01-01 2023-06-30 0001930510 vcig:RedeemablePreferenceSharesMember 2023-06-30 0001930510 vcig:RedeemablePreferenceSharesMember 2023-01-01 2023-06-30 0001930510 ifrs-full:OrdinarySharesMember 2021-12-31 0001930510 vcig:VciGlobalLimitedMember 2022-04-08 0001930510 vcig:VciGlobalLimitedMember 2021-12-31 0001930510 2022-04-08 2022-11-01 0001930510 ifrs-full:BottomOfRangeMember 2022-11-01 0001930510 ifrs-full:TopOfRangeMember 2022-11-01 0001930510 ifrs-full:OrdinarySharesMember 2023-04-30 0001930510 2023-05-31 0001930510 vcig:BusinessStrategyConsultancyMember 2022-01-01 2022-06-30 0001930510 vcig:BusinessStrategyConsultancyMember 2023-01-01 2023-06-30 0001930510 vcig:TechnologyDevelopmentSolutionsAndConsultancyMember 2022-01-01 2022-06-30 0001930510 vcig:TechnologyDevelopmentSolutionsAndConsultancyMember 2023-01-01 2023-06-30 0001930510 vcig:InterestIncomesMember 2022-01-01 2022-06-30 0001930510 vcig:InterestIncomesMember 2023-01-01 2023-06-30 0001930510 ifrs-full:AllOtherSegmentsMember 2022-01-01 2022-06-30 0001930510 ifrs-full:AllOtherSegmentsMember 2023-01-01 2023-06-30 0001930510 vcig:WageSubsidyProgramMember 2023-01-01 2023-06-30 0001930510 srt:DirectorMember 2022-01-01 2022-06-30 0001930510 srt:DirectorMember 2023-01-01 2023-06-30 0001930510 ifrs-full:TradeReceivablesMember vcig:VInvescoSdnBhdOneMember 2022-07-01 2022-12-31 0001930510 ifrs-full:TradeReceivablesMember vcig:VInvescoSdnBhdOneMember 2023-01-01 2023-06-30 0001930510 vcig:TradePayablesMember vcig:VCapitalSdnBhdOneMember 2022-07-01 2022-12-31 0001930510 vcig:TradePayablesMember vcig:VCapitalSdnBhdOneMember 2023-01-01 2023-06-30 0001930510 vcig:NonTradeReceivablesMember vcig:ElmuESdnBhdMember 2022-07-01 2022-12-31 0001930510 vcig:NonTradeReceivablesMember vcig:ElmuESdnBhdMember 2023-01-01 2023-06-30 0001930510 vcig:NonTradeReceivablesMember vcig:BiosecureIntegratorsSdnBhdMember 2022-07-01 2022-12-31 0001930510 vcig:NonTradeReceivablesMember vcig:BiosecureIntegratorsSdnBhdMember 2023-01-01 2023-06-30 0001930510 vcig:NonTradePayablesMember vcig:HooVoonHimOneMember 2022-07-01 2022-12-31 0001930510 vcig:NonTradePayablesMember vcig:HooVoonHimOneMember 2023-01-01 2023-06-30 0001930510 vcig:NonTradePayablesMember vcig:VincentHongMember 2023-01-01 2023-06-30 0001930510 vcig:NonTradePayablesMember vcig:NorainiMember 2022-07-01 2022-12-31 0001930510 vcig:NonTradePayablesMember vcig:NorainiMember 2023-01-01 2023-06-30 0001930510 vcig:NonTradePayablesMember vcig:VConsortiumSdnBhdMember 2022-07-01 2022-12-31 0001930510 vcig:NonTradePayablesMember vcig:VConsortiumSdnBhdMember 2023-01-01 2023-06-30 0001930510 vcig:NonTradePayablesMember vcig:VInvescoSdnBhdOneMember 2022-07-01 2022-12-31 0001930510 vcig:NonTradePayablesMember vcig:VInvescoSdnBhdOneMember 2023-01-01 2023-06-30 0001930510 vcig:NonTradePayablesMember vcig:VCapitalSdnBhdOneMember 2022-07-01 2022-12-31 0001930510 vcig:NonTradePayablesMember vcig:VCapitalSdnBhdOneMember 2023-01-01 2023-06-30 0001930510 vcig:NonTradeReceivablesMember vcig:VInvescoFundLLimitedMember 2022-07-01 2022-12-31 0001930510 vcig:NonTradeReceivablesMember vcig:VInvescoFundLLimitedMember 2023-01-01 2023-06-30 0001930510 vcig:VCapitalSdnBhdOneMember 2022-07-01 2022-12-31 0001930510 vcig:VCapitalSdnBhdOneMember 2023-01-01 2023-06-30 0001930510 vcig:VCapitalSdnBhdTwoMember 2022-07-01 2022-12-31 0001930510 vcig:VCapitalSdnBhdTwoMember 2023-01-01 2023-06-30 0001930510 vcig:VCapitalSdnBhdThreeMember 2022-07-01 2022-12-31 0001930510 vcig:VCapitalSdnBhdThreeMember 2022-01-01 2022-06-30 0001930510 vcig:VCapitalSdnBhdThreeMember 2023-01-01 2023-06-30 0001930510 vcig:VInvescoSdnBhdOneMember 2022-07-01 2022-12-31 0001930510 vcig:VInvescoSdnBhdOneMember 2022-01-01 2022-06-30 0001930510 vcig:VInvescoSdnBhdOneMember 2023-01-01 2023-06-30 0001930510 vcig:VInvescoSdnBhdTwoMember 2022-07-01 2022-12-31 0001930510 vcig:VInvescoSdnBhdTwoMember 2022-01-01 2022-06-30 0001930510 vcig:VInvescoSdnBhdTwoMember 2023-01-01 2023-06-30 0001930510 vcig:NonTradeReceivablesMember vcig:VInvescoFundLLimitedMember 2022-01-01 2022-06-30 0001930510 vcig:VConsortiumSdnBhdMember 2022-07-01 2022-12-31 0001930510 vcig:VConsortiumSdnBhdMember 2022-01-01 2022-06-30 0001930510 vcig:VConsortiumSdnBhdMember 2023-01-01 2023-06-30 0001930510 vcig:HooVoonHimTwoMember 2022-07-01 2022-12-31 0001930510 vcig:HooVoonHimTwoMember 2022-01-01 2022-06-30 0001930510 vcig:HooVoonHimTwoMember 2023-01-01 2023-06-30 0001930510 vcig:TreasureGlobalIncTwoMember 2022-07-01 2022-12-31 0001930510 vcig:TreasureGlobalIncTwoMember 2022-01-01 2022-06-30 0001930510 vcig:TreasureGlobalIncTwoMember 2023-01-01 2023-06-30 0001930510 ifrs-full:OperatingSegmentsMember vcig:BusinessStrategyAndConsultancyMember 2022-01-01 2022-06-30 0001930510 ifrs-full:OperatingSegmentsMember vcig:BusinessStrategyAndConsultancyMember 2022-07-01 2023-06-30 0001930510 ifrs-full:OperatingSegmentsMember vcig:BusinessStrategyAndConsultancyMember 2021-07-01 2022-06-30 0001930510 ifrs-full:OperatingSegmentsMember vcig:TechnologyDevelopmentSolutionsAndConsultancyMember 2022-01-01 2022-06-30 0001930510 ifrs-full:OperatingSegmentsMember vcig:TechnologyDevelopmentSolutionsAndConsultancyMember 2022-07-01 2023-06-30 0001930510 ifrs-full:OperatingSegmentsMember vcig:TechnologyDevelopmentSolutionsAndConsultancyMember 2021-07-01 2022-06-30 0001930510 ifrs-full:OperatingSegmentsMember vcig:OtherSegmentsMember 2022-01-01 2022-06-30 0001930510 ifrs-full:OperatingSegmentsMember vcig:OtherSegmentsMember 2022-07-01 2023-06-30 0001930510 ifrs-full:OperatingSegmentsMember vcig:OtherSegmentsMember 2021-07-01 2022-06-30 0001930510 ifrs-full:OperatingSegmentsMember 2022-01-01 2022-06-30 0001930510 ifrs-full:OperatingSegmentsMember 2022-07-01 2023-06-30 0001930510 ifrs-full:OperatingSegmentsMember 2021-07-01 2022-06-30 0001930510 ifrs-full:OperatingSegmentsMember vcig:BusinessStrategyAndConsultancyMember 2022-12-31 0001930510 ifrs-full:OperatingSegmentsMember vcig:BusinessStrategyAndConsultancyMember 2023-06-30 0001930510 ifrs-full:OperatingSegmentsMember vcig:TechnologyDevelopmentSolutionsAndConsultancyMember 2022-12-31 0001930510 ifrs-full:OperatingSegmentsMember vcig:TechnologyDevelopmentSolutionsAndConsultancyMember 2023-06-30 0001930510 ifrs-full:OperatingSegmentsMember vcig:OtherServicesMember 2022-12-31 0001930510 ifrs-full:OperatingSegmentsMember vcig:OtherServicesMember 2023-06-30 0001930510 ifrs-full:OperatingSegmentsMember 2022-12-31 0001930510 ifrs-full:OperatingSegmentsMember 2023-06-30 0001930510 ifrs-full:UnallocatedAmountsMember 2022-12-31 0001930510 vcig:ConsolidatedTotalAssetsMember 2022-12-31 0001930510 vcig:ConsolidatedTotalAssetsMember 2023-06-30 0001930510 ifrs-full:CurrencyRiskMember 2023-06-30 0001930510 2021-01-01 2021-12-31 0001930510 vcig:CustomerConcentrationMember 2023-01-01 2023-06-30 0001930510 vcig:PayableMember 2022-12-31 0001930510 vcig:PayableMember 2023-06-30 0001930510 vcig:BorrowingsAndLeaseLiabilitiesMember 2022-12-31 0001930510 vcig:BorrowingsAndLeaseLiabilitiesMember 2023-06-30 0001930510 currency:SGD 2022-01-01 2022-12-31 0001930510 currency:SGD 2023-01-01 2023-06-30 0001930510 currency:USD 2022-01-01 2022-12-31 0001930510 currency:USD 2023-01-01 2023-06-30 0001930510 vcig:PerformingMember 2023-01-01 2023-06-30 0001930510 vcig:DoubtfullMember 2023-01-01 2023-06-30 0001930510 vcig:InDefaultMember 2023-01-01 2023-06-30 0001930510 vcig:WriteOffMember 2023-01-01 2023-06-30 0001930510 vcig:WeightedAverageEffectiveInterestRateMember vcig:NonInterestBearingMember 2023-06-30 0001930510 vcig:OnDemandOrWithinOneYearMember vcig:NonInterestBearingMember 2023-06-30 0001930510 ifrs-full:LaterThanTwoYearsAndNotLaterThanFiveYearsMember vcig:NonInterestBearingMember 2023-06-30 0001930510 vcig:NonInterestBearingMember 2023-06-30 0001930510 vcig:WeightedAverageEffectiveInterestRateMember ifrs-full:BottomOfRangeMember ifrs-full:FixedInterestRateMember 2023-06-30 0001930510 vcig:WeightedAverageEffectiveInterestRateMember ifrs-full:TopOfRangeMember ifrs-full:FixedInterestRateMember 2023-06-30 0001930510 vcig:OnDemandOrWithinOneYearMember ifrs-full:FixedInterestRateMember 2023-06-30 0001930510 ifrs-full:LaterThanTwoYearsAndNotLaterThanFiveYearsMember ifrs-full:FixedInterestRateMember 2023-06-30 0001930510 ifrs-full:FixedInterestRateMember 2023-06-30 0001930510 vcig:WeightedAverageEffectiveInterestRateMember vcig:VariableInterestRateBorrowingsMember 2023-01-01 2023-06-30 0001930510 vcig:WeightedAverageEffectiveInterestRateMember vcig:VariableInterestRateBorrowingsMember 2023-06-30 0001930510 vcig:OnDemandOrWithinOneYearMember vcig:VariableInterestRateBorrowingsMember 2023-06-30 0001930510 ifrs-full:LaterThanTwoYearsAndNotLaterThanFiveYearsMember vcig:VariableInterestRateBorrowingsMember 2023-06-30 0001930510 vcig:VariableInterestRateBorrowingsMember 2023-06-30 0001930510 vcig:OnDemandOrWithinOneYearMember 2023-06-30 0001930510 ifrs-full:LaterThanTwoYearsAndNotLaterThanFiveYearsMember 2023-06-30 0001930510 vcig:WeightedAverageEffectiveInterestRateMember vcig:NonInterestBearingMember 2022-12-31 0001930510 vcig:OnDemandOrWithinOneYearMember vcig:NonInterestBearingMember 2022-12-31 0001930510 ifrs-full:LaterThanTwoYearsAndNotLaterThanFiveYearsMember vcig:NonInterestBearingMember 2022-12-31 0001930510 vcig:NonInterestBearingMember 2022-12-31 0001930510 vcig:WeightedAverageEffectiveInterestRateMember ifrs-full:BottomOfRangeMember ifrs-full:FixedInterestRateMember 2022-12-31 0001930510 vcig:WeightedAverageEffectiveInterestRateMember ifrs-full:TopOfRangeMember ifrs-full:FixedInterestRateMember 2022-12-31 0001930510 vcig:OnDemandOrWithinOneYearMember ifrs-full:FixedInterestRateMember 2022-12-31 0001930510 ifrs-full:LaterThanTwoYearsAndNotLaterThanFiveYearsMember ifrs-full:FixedInterestRateMember 2022-12-31 0001930510 ifrs-full:FixedInterestRateMember 2022-12-31 0001930510 vcig:WeightedAverageEffectiveInterestRateMember vcig:VariableInterestRateBorrowingsMember 2022-01-01 2022-12-31 0001930510 vcig:WeightedAverageEffectiveInterestRateMember vcig:VariableInterestRateBorrowingsMember 2022-12-31 0001930510 vcig:OnDemandOrWithinOneYearMember vcig:VariableInterestRateBorrowingsMember 2022-12-31 0001930510 ifrs-full:LaterThanTwoYearsAndNotLaterThanFiveYearsMember vcig:VariableInterestRateBorrowingsMember 2022-12-31 0001930510 vcig:VariableInterestRateBorrowingsMember 2022-12-31 0001930510 vcig:OnDemandOrWithinOneYearMember 2022-12-31 0001930510 ifrs-full:LaterThanTwoYearsAndNotLaterThanFiveYearsMember 2022-12-31 0001930510 vcig:CustomerConcentrationMember vcig:RevenueMember vcig:CustomerAMember 2022-01-01 2022-06-30 0001930510 vcig:CustomerConcentrationMember vcig:RevenueMember vcig:CustomerAMember 2023-01-01 2023-06-30 0001930510 vcig:CustomerAMember 2023-01-01 2023-06-30 0001930510 vcig:CustomerConcentrationMember vcig:RevenueMember vcig:CustomerBMember 2022-01-01 2022-06-30 0001930510 vcig:CustomerConcentrationMember vcig:RevenueMember vcig:CustomerBMember 2023-01-01 2023-06-30 0001930510 vcig:CustomerBMember 2023-01-01 2023-06-30 0001930510 vcig:CustomerConcentrationMember vcig:RevenueMember vcig:CustomerCMember 2022-01-01 2022-06-30 0001930510 vcig:CustomerConcentrationMember vcig:RevenueMember vcig:CustomerCMember 2023-01-01 2023-06-30 0001930510 vcig:CustomerCMember 2023-01-01 2023-06-30 0001930510 vcig:CustomerAMember 2022-12-31 0001930510 vcig:CustomerAMember 2023-06-30 0001930510 vcig:CustomerBMember 2022-12-31 0001930510 vcig:CustomerBMember 2023-06-30 0001930510 ifrs-full:CarryingAmountMember 2022-12-31 0001930510 ifrs-full:CarryingAmountMember 2023-06-30 0001930510 ifrs-full:Level1OfFairValueHierarchyMember 2022-12-31 0001930510 ifrs-full:Level2OfFairValueHierarchyMember 2022-12-31 0001930510 ifrs-full:Level3OfFairValueHierarchyMember 2022-12-31 0001930510 ifrs-full:Level1OfFairValueHierarchyMember 2023-06-30 0001930510 ifrs-full:Level2OfFairValueHierarchyMember 2023-06-30 0001930510 ifrs-full:Level3OfFairValueHierarchyMember 2023-06-30 0001930510 vcig:UnlistedEquityInvestmentsAtFairValueThroughOtherComprehensiveIncomeMember ifrs-full:Level1OfFairValueHierarchyMember 2021-12-31 0001930510 vcig:UnlistedEquityInvestmentsAtFairValueThroughOtherComprehensiveIncomeMember ifrs-full:Level1OfFairValueHierarchyMember 2022-12-31 0001930510 vcig:UnlistedEquityInvestmentsAtFairValueThroughOtherComprehensiveIncomeMember ifrs-full:Level1OfFairValueHierarchyMember 2022-01-01 2022-12-31 0001930510 vcig:UnlistedEquityInvestmentsAtFairValueThroughOtherComprehensiveIncomeMember ifrs-full:Level1OfFairValueHierarchyMember 2023-01-01 2023-06-30 0001930510 vcig:UnlistedEquityInvestmentsAtFairValueThroughOtherComprehensiveIncomeMember ifrs-full:Level1OfFairValueHierarchyMember 2023-06-30 0001930510 vcig:BankBorrowingsMember 2023-06-30 0001930510 vcig:BankBorrowingsMember 2023-01-01 2023-06-30 0001930510 ifrs-full:LeaseLiabilitiesMember 2023-06-30 0001930510 vcig:OtherBorrowingsMember 2023-06-30 0001930510 vcig:OtherBorrowingsMember 2023-01-01 2023-06-30 0001930510 vcig:BankBorrowingsMember 2022-12-31 0001930510 vcig:BankBorrowingsMember 2022-01-01 2022-12-31 0001930510 ifrs-full:LeaseLiabilitiesMember 2022-12-31 0001930510 ifrs-full:LeaseLiabilitiesMember 2022-01-01 2022-12-31 0001930510 vcig:OtherBorrowingsMember 2022-12-31 0001930510 vcig:OtherBorrowingsMember 2022-01-01 2022-12-31 0001930510 vcig:BankBorrowingMember ifrs-full:LaterThanOneMonthAndNotLaterThanSixMonthsMember 2023-06-30 0001930510 vcig:BankBorrowingMember ifrs-full:LaterThanOneYearAndNotLaterThanTwoYearsMember 2023-06-30 0001930510 vcig:BankBorrowingMember ifrs-full:LaterThanOneYearAndNotLaterThanThreeYearsMember 2023-06-30 0001930510 vcig:BankBorrowingMember ifrs-full:LaterThanThreeYearsAndNotLaterThanFourYearsMember 2023-06-30 0001930510 vcig:BankBorrowingMember 2023-06-30 0001930510 vcig:LeaseLiabilitieMember ifrs-full:LaterThanOneMonthAndNotLaterThanSixMonthsMember 2023-06-30 0001930510 vcig:LeaseLiabilitieMember ifrs-full:LaterThanOneYearAndNotLaterThanTwoYearsMember 2023-06-30 0001930510 vcig:LeaseLiabilitieMember ifrs-full:LaterThanOneYearAndNotLaterThanThreeYearsMember 2023-06-30 0001930510 vcig:LeaseLiabilitieMember ifrs-full:LaterThanThreeYearsAndNotLaterThanFourYearsMember 2023-06-30 0001930510 vcig:LeaseLiabilitieMember 2023-06-30 0001930510 vcig:OtherBorrowingMember ifrs-full:LaterThanOneMonthAndNotLaterThanSixMonthsMember 2023-06-30 0001930510 vcig:OtherBorrowingMember ifrs-full:LaterThanOneYearAndNotLaterThanTwoYearsMember 2023-06-30 0001930510 vcig:OtherBorrowingMember ifrs-full:LaterThanOneYearAndNotLaterThanThreeYearsMember 2023-06-30 0001930510 vcig:OtherBorrowingMember ifrs-full:LaterThanThreeYearsAndNotLaterThanFourYearsMember 2023-06-30 0001930510 vcig:OtherBorrowingMember 2023-06-30 0001930510 ifrs-full:LaterThanOneMonthAndNotLaterThanSixMonthsMember 2023-06-30 0001930510 ifrs-full:LaterThanOneYearAndNotLaterThanTwoYearsMember 2023-06-30 0001930510 ifrs-full:LaterThanOneYearAndNotLaterThanThreeYearsMember 2023-06-30 0001930510 ifrs-full:LaterThanThreeYearsAndNotLaterThanFourYearsMember 2023-06-30 0001930510 vcig:BankBorrowingMember ifrs-full:LaterThanOneMonthAndNotLaterThanSixMonthsMember 2022-12-31 0001930510 vcig:BankBorrowingMember vcig:LaterThanOneYearAndNotLaterThanOneYearsMember 2022-12-31 0001930510 vcig:BankBorrowingMember ifrs-full:LaterThanOneYearAndNotLaterThanTwoYearsMember 2022-12-31 0001930510 vcig:BankBorrowingMember ifrs-full:LaterThanThreeYearsAndNotLaterThanFourYearsMember 2022-12-31 0001930510 vcig:BankBorrowingMember 2022-12-31 0001930510 vcig:LeaseLiabilitieMember ifrs-full:LaterThanOneMonthAndNotLaterThanSixMonthsMember 2022-12-31 0001930510 vcig:LeaseLiabilitieMember vcig:LaterThanOneYearAndNotLaterThanOneYearsMember 2022-12-31 0001930510 vcig:LeaseLiabilitieMember ifrs-full:LaterThanOneYearAndNotLaterThanTwoYearsMember 2022-12-31 0001930510 vcig:LeaseLiabilitieMember ifrs-full:LaterThanThreeYearsAndNotLaterThanFourYearsMember 2022-12-31 0001930510 vcig:LeaseLiabilitieMember 2022-12-31 0001930510 vcig:OtherBorrowingMember ifrs-full:LaterThanOneMonthAndNotLaterThanSixMonthsMember 2022-12-31 0001930510 vcig:OtherBorrowingMember vcig:LaterThanOneYearAndNotLaterThanOneYearsMember 2022-12-31 0001930510 vcig:OtherBorrowingMember ifrs-full:LaterThanOneYearAndNotLaterThanTwoYearsMember 2022-12-31 0001930510 vcig:OtherBorrowingMember ifrs-full:LaterThanThreeYearsAndNotLaterThanFourYearsMember 2022-12-31 0001930510 vcig:OtherBorrowingMember 2022-12-31 0001930510 ifrs-full:LaterThanOneMonthAndNotLaterThanSixMonthsMember 2022-12-31 0001930510 vcig:LaterThanOneYearAndNotLaterThanOneYearsMember 2022-12-31 0001930510 ifrs-full:LaterThanOneYearAndNotLaterThanTwoYearsMember 2022-12-31 0001930510 ifrs-full:LaterThanThreeYearsAndNotLaterThanFourYearsMember 2022-12-31 0001930510 vcig:SubsequentEventsMember 2023-08-01 0001930510 vcig:SubsequentEventsMember 2023-08-07 iso4217:MYR iso4217:USD iso4217:MYR xbrli:shares iso4217:USD xbrli:shares xbrli:shares xbrli:pure