| FREE WRITING PROSPECTUS | ||
| FILED PURSUANT TO RULE 433 | ||
| REGISTRATION FILE NO.: 333-257991-05 | ||
 |  |  |
Free Writing Prospectus
Structural and Collateral Term Sheet
$1,089,749,733
(Approximate Initial Pool Balance)
$920,089,000
(Approximate Aggregate Certificate Balance of Offered Certificates)
BANK 2022-BNK43
as Issuing Entity
Wells Fargo Commercial Mortgage Securities, Inc.
as Depositor
Wells Fargo Bank, National Association
Morgan Stanley Mortgage Capital Holdings LLC
Bank of America, National Association
National Cooperative Bank, N.A.
as Sponsors and Mortgage Loan Sellers
Commercial Mortgage Pass-Through Certificates
Series 2022-BNK43
July 29, 2022
| WELLS FARGO SECURITIES | BofA SECURITIES | MORGAN STANLEY
|
Co-Lead Manager and Joint Bookrunner | Co-Lead Manager and Joint Bookrunner | Co-Lead Manager and Joint Bookrunner |
Academy Securities, Inc. Co-Manager | Drexel Hamilton Co-Manager | Siebert Williams Shank Co-Manager |
STATEMENT REGARDING THIS FREE WRITING PROSPECTUS
The depositor has filed a registration statement (including a prospectus) with the Securities and Exchange Commission (“SEC”) (SEC File No. 333-257991) for the offering to which this communication relates. Before you invest, you should read the prospectus in the registration statement and other documents the depositor has filed with the SEC for more complete information about the depositor, the issuing entity and this offering. You may get these documents for free by visiting EDGAR on the SEC Web site at www.sec.gov. Alternatively, the depositor, any underwriter, or any dealer participating in the offering will arrange to send you the prospectus after filing if you request it by calling toll free 1-800-745-2063 (8 a.m. – 5 p.m. EST) or by emailing wfs.cmbs@wellsfargo.com.
Nothing in this document constitutes an offer of securities for sale in any jurisdiction where the offer or sale is not permitted. The information contained herein is preliminary as of the date hereof, supersedes any such information previously delivered to you and will be superseded by any such information subsequently delivered and ultimately by the final prospectus relating to the securities. These materials are subject to change, completion, supplement or amendment from time to time.
This free writing prospectus has been prepared by the underwriters for information purposes only and does not constitute, in whole or in part, a prospectus for the purposes of (i) Regulation (EU) 2017/1129 (as amended), (ii) such Regulation as it forms part of UK domestic law, or (iii) Part VI of the UK Financial Services and Markets Act 2000, as amended; and does not constitute an offering document for any other purpose.
STATEMENT REGARDING ASSUMPTIONS AS TO SECURITIES, PRICING ESTIMATES AND OTHER INFORMATION
The attached information contains certain tables and other statistical analyses (the “Computational Materials”) which have been prepared in reliance upon information furnished by the Mortgage Loan Sellers. Numerous assumptions were used in preparing the Computational Materials, which may or may not be reflected herein. As such, no assurance can be given as to the Computational Materials’ accuracy, appropriateness or completeness in any particular context; or as to whether the Computational Materials and/or the assumptions upon which they are based reflect present market conditions or future market performance. The Computational Materials should not be construed as either projections or predictions or as legal, tax, financial or accounting advice. You should consult your own counsel, accountant and other advisors as to the legal, tax, business, financial and related aspects of a purchase of these securities. Any weighted average lives, yields and principal payment periods shown in the Computational Materials are based on prepayment and/or loss assumptions, and changes in such prepayment and/or loss assumptions may dramatically affect such weighted average lives, yields and principal payment periods. In addition, it is possible that prepayments or losses on the underlying assets will occur at rates higher or lower than the rates shown in the attached Computational Materials. The specific characteristics of the securities may differ from those shown in the Computational Materials due to differences between the final underlying assets and the preliminary underlying assets used in preparing the Computational Materials. The principal amount and designation of any security described in the Computational Materials are subject to change prior to issuance. None of Wells Fargo Securities, LLC, Morgan Stanley & Co. LLC, BofA Securities, Inc., Academy Securities, Inc., Drexel Hamilton, LLC, Siebert Williams Shank & Co., LLC or any of their respective affiliates, make any representation or warranty as to the actual rate or timing of payments or losses on any of the underlying assets or the payments or yield on the securities. The information in this presentation is based upon management forecasts and reflects prevailing conditions and management’s views as of this date, all of which are subject to change. In preparing this presentation, we have relied upon and assumed, without independent verification, the accuracy and completeness of all information available from public sources or which was provided to us by or on behalf of the Mortgage Loan Sellers or which was otherwise reviewed by us.
This free writing prospectus contains certain forward-looking statements. If and when included in this free writing prospectus, the words “expects”, “intends”, “anticipates”, “estimates” and analogous expressions and all statements that are not historical facts, including statements about our beliefs or expectations, are intended to identify forward-looking statements. Any forward-looking statements are made subject to risks and uncertainties which could cause actual results to differ materially from those stated. Those risks and uncertainties include, among other things, declines in general economic and business conditions, increased competition, changes in demographics, changes in political and social conditions, regulatory initiatives and changes in customer preferences, many of which are beyond our control and the control of any other person or entity related to this offering. The forward-looking statements made in this free writing prospectus are made as of the date stated on the cover. We have no obligation to update or revise any forward-looking statement.
Wells Fargo Securities is the trade name for the capital markets and investment banking services of Wells Fargo & Company and its subsidiaries, including but not limited to Wells Fargo Securities, LLC, a member of NYSE, FINRA, NFA and SIPC, Wells Fargo Prime Services, LLC, a member of FINRA, NFA and SIPC, and Wells Fargo Bank, N.A. Wells Fargo Securities, LLC and Wells Fargo Prime Services, LLC are distinct entities from affiliated banks and thrifts.
“BofA Securities” is the marketing name for the global banking and global markets businesses of Bank of America Corporation. Lending, derivatives, and other commercial banking activities are performed globally by banking affiliates of Bank of America Corporation, including Bank of America, N.A., member FDIC. Securities, strategic advisory, and other investment banking activities are performed globally by investment banking affiliates of Bank of America Corporation, including, in the United States, BofA Securities, Inc., which is a registered broker-dealer and member of FINRA and SIPC, and, in other jurisdictions, locally registered entities.
IMPORTANT NOTICE REGARDING THE OFFERED CERTIFICATES
The information herein is preliminary and may be supplemented or amended prior to the time of sale. In addition, the Offered Certificates referred to in these materials and the asset pool backing them are subject to modification or revision (including the possibility that one or more classes of certificates may be split, combined or eliminated at any time prior to issuance or availability of a final prospectus) and are offered on a “when, as and if issued” basis.
The underwriters described in these materials may from time to time perform investment banking services for, or solicit investment banking business from, any company named in these materials. The underwriters and/or their affiliates or respective employees may from time to time have a long or short position in any security or contract discussed in these materials.
The information contained herein supersedes any previous such information delivered to any prospective investor and will be superseded by information delivered to such prospective investor prior to the time of sale.
IMPORTANT NOTICE RELATING TO AUTOMATICALLY-GENERATED EMAIL DISCLAIMERS
Any legends, disclaimers or other notices that may appear at the bottom of any email communication to which this free writing prospectus is attached relating to (1) these materials not constituting an offer (or a solicitation of an offer), (2) any representation that these materials are accurate or complete and may not be updated or (3) these materials possibly being confidential, are not applicable to these materials and should be disregarded. Such legends, disclaimers or other notices have been automatically generated as a result of these materials having been sent via Bloomberg or another system.
| THE INFORMATION IN THIS STRUCTURAL AND COLLATERAL TERM SHEET IS NOT COMPLETE AND MAY BE AMENDED PRIOR TO THE TIME OF SALE. THIS TERM SHEET IS NOT AN OFFER TO SELL THESE SECURITIES AND IT IS NOT A SOLICITATION OF AN OFFER TO BUY THESE SECURITIES IN ANY JURISDICTION WHERE THE OFFER OR SALE IS NOT PERMITTED. | ||
| ||
| BANK 2022-BNK43 | Certificate Structure |
I. Certificate Structure
| Class | Expected Ratings (Fitch/KBRA/Moody’s)(1) | Approximate Initial Certificate Balance or Notional Amount(2) |
Approx. Initial Credit Support(3) | Pass-Through Rate Description | Weighted Average Life (Years)(4) | Expected Principal Window(4) | Certificate Principal to Value Ratio(5) | Certificate Principal U/W NOI Debt Yield(6) | |||
| Offered Certificates | |||||||||||
| A-1 | AAAsf/AAA(sf)/Aaa(sf) | $16,160,000 | 30.000% | (7) | 2.46 | 9/22 - 5/27 | 35.4% | 20.9% | |||
| A-2 | AAAsf/AAA(sf)/Aaa(sf) | $46,018,000 | 30.000% | (7) | 4.90 | 5/27 - 8/27 | 35.4% | 20.9% | |||
| A-3 | AAAsf/AAA(sf)/Aaa(sf) | $3,443,000 | 30.000% | (7) | 6.89 | 7/29 - 7/29 | 35.4% | 20.9% | |||
| A-SB | AAAsf/AAA(sf)/Aaa(sf) | $23,908,000 | 30.000% | (7) | 7.35 | 8/27 - 3/32 | 35.4% | 20.9% | |||
| A-4(8) | AAAsf/AAA(sf)/Aaa(sf) | (8)(9) | 30.000% | (7) | (9) | (9) | 35.4% | 20.9% | |||
| A-5(8) | AAAsf/AAA(sf)/Aaa(sf) | (8)(9) | 30.000% | (7) | (9) | (9) | 35.4% | 20.9% | |||
| X-A | AAAsf/AAA(sf)/Aaa(sf) | $724,683,000 | (10) | N/A | Variable(11) | N/A | N/A | N/A | N/A | ||
| X-B | A-sf/AAA(sf)/NR | $195,406,000 | (12) | N/A | Variable(13) | N/A | N/A | N/A | N/A | ||
| A-S(8) | AAAsf/AAA(sf)/Aa1(sf) | $100,938,000(8) | 20.250% | (7) | 9.91 | 7/32 - 8/32 | 40.3% | 18.3% | |||
| B(8) | AA-sf/AA(sf)/NR | $50,469,000(8) | 15.375% | (7) | 9.97 | 8/32 - 8/32 | 42.8% | 17.3% | |||
| C(8) | A-sf/A-(sf)/NR | $43,999,000(8) | 11.125% | (7) | 9.97 | 8/32 - 8/32 | 44.9% | 16.4% | |||
| Non-Offered Certificates | |||||||||||
| X-D | BBB-sf/BBB-(sf)/NR | $50,469,000 | (14) | N/A | Variable(15) | N/A | N/A | N/A | N/A | ||
| D | BBBsf/BBB+(sf)/NR | $28,470,000 | 8.375% | (7) | 9.97 | 8/32 - 8/32 | 46.3% | 15.9% | |||
| E | BBB-sf/BBB-(sf)/NR | $21,999,000 | 6.250% | (7) | 9.97 | 8/32 - 8/32 | 47.4% | 15.6% | |||
| F | BB-sf/BB-(sf)/NR | $20,705,000 | 4.250% | (7) | 9.97 | 8/32 - 8/32 | 48.4% | 15.3% | |||
| G | B-sf/B-(sf)/NR | $10,353,000 | 3.250% | (7) | 9.97 | 8/32 - 8/32 | 48.9% | 15.1% | |||
| H | NR/NR/NR | $33,646,246 | 0.000% | (7) | 9.97 | 8/32 - 8/32 | 50.6% | 14.6% | |||
| Non-Offered Eligible Vertical Interest | |||||||||||
| RR Interest | NR/NR/NR | $54,487,486.65 | N/A | WAC(16) | 9.44 | 9/22 - 8/32 | N/A | N/A | |||
| Notes: | |||||||||||
| (1) | The expected ratings presented are those of Fitch Ratings, Inc. (“Fitch”), Kroll Bond Rating Agency, LLC (“KBRA”) and Moody’s Investors Service, Inc. (“Moody’s”), which the depositor hired to rate the Offered Certificates. One or more other nationally recognized statistical rating organizations that were not hired by the depositor may use information they receive pursuant to Rule 17g-5 under the Securities Exchange Act of 1934, as amended (the “Exchange Act”) or otherwise, to rate or provide market reports and/or published commentary related to the Offered Certificates. We cannot assure you as to what ratings a non-hired nationally recognized statistical rating organization would assign or that its reports will not express differing, possibly negative, views of the mortgage loans and/or the Offered Certificates. The ratings of each Class of Offered Certificates address the likelihood of the timely distribution of interest and, except in the case of the Class X-A and X-B Certificates, the ultimate distribution of principal due on those Classes on or before the Rated Final Distribution Date. See “Risk Factors—Other Risks Relating to the Certificates—Nationally Recognized Statistical Rating Organizations May Assign Different Ratings to the Certificates; Ratings of the Certificates Reflect Only the Views of the Applicable Rating Agencies as of the Dates Such Ratings Were Issued; Ratings May Affect ERISA Eligibility; Ratings May Be Downgraded” and “Ratings” in the Preliminary Prospectus, expected to be dated August 2, 2022 (the “Preliminary Prospectus”). Fitch, KBRA and Moody’s have informed us that the “sf” designation in their ratings represents an identifier for structured finance product ratings. | ||||||||||
| (2) | The Certificate Balances and Notional Amounts set forth in the table are approximate. The actual initial Certificate Balances and Notional Amounts may be larger or smaller depending on the initial pool balance of the mortgage loans definitively included in the pool of mortgage loans, which aggregate cut-off date balance may be as much as 5% larger or smaller than the amount presented in the Preliminary Prospectus. In addition, the Notional Amounts of the Class X-A, X-B and X-D Certificates (collectively referred to herein as “Class X Certificates”) may vary depending upon the final pricing of the Classes of Principal Balance Certificates (as defined below) or trust components whose Certificate Balances comprise such Notional Amounts and, if as a result of such pricing the pass-through rate of any Class of the Class X Certificates would be equal to zero at all times, such Class of Certificates will not be issued on the closing date of this securitization. | ||||||||||
| (3) | The Approximate Initial Credit Support with respect to the Class A-1, A-2, A-3, A-SB, A-4 and A-5 Certificates represents the approximate credit enhancement for the Class A-1, A-2, A-3, A-SB, A-4 and A-5 Certificates in the aggregate, taking into account the Certificate Balances of the Class A-4 and Class A-5 trust components. The Approximate Initial Credit Support set forth for the Class A-S Certificates represents the approximate credit support for the underlying Class A-S trust component. The Approximate Initial Credit Support set forth for the Class B Certificates represents the approximate credit support for the underlying Class B trust component. The Approximate Initial Credit Support set forth for the Class C Certificates represents the approximate credit support for the underlying Class C trust component. The RR Interest only provides credit support to the limited extent that losses incurred on the underlying mortgage loans are allocated to it, on the one hand, and to the Offered Certificates and the Non-Offered Certificates, on the other hand, pro rata, in accordance with their respective Percentage Allocation Entitlements. | ||||||||||
| (4) | Weighted Average Lives and Expected Principal Windows are calculated based on an assumed prepayment rate of 0% CPR and the “Structuring Assumptions” described under “Yield and Maturity Considerations—Weighted Average Life” in the Preliminary Prospectus. | ||||||||||
| (5) | The Certificate Principal to Value Ratio for each Class of Certificates (other than the Class A-1, A-2, A-3, A-SB, A-4 and A-5 Certificates) is calculated as the product of (a) the weighted average Cut-off Date LTV Ratio for the mortgage loans and (b) a fraction, the numerator of which is the total initial Certificate Balance of such Class of Certificates and all Classes of Principal Balance Certificates (or, with respect to the Class A-4, A-5, A-S, B or C Certificates, the trust component with the same alphanumeric designation) senior to such Class of Certificates and the denominator of which is the total initial Certificate Balance of all of the Principal Balance Certificates (or, with respect to the Class A-4, A-5, A-S, B or C Certificates, the trust component with the same alphanumeric designation)(other than the RR Interest). The Certificate Principal to Value Ratio for each of the Class A-1, A-2, A-3, A-SB, A-4 and A-5 Certificates is calculated in the aggregate for those Classes as if they were a single Class and is calculated as the product of (a) the weighted average Cut-off Date LTV Ratio for the mortgage loans and (b) a fraction, the numerator of which is the total initial aggregate Certificate Balances of such Classes of Certificates (or, with respect to the Class A-4 or A-5 Certificates, the trust component with the same alphanumeric designation) and the denominator of which is the total initial Certificate Balance of all of the Principal Balance Certificates (or, with respect to the Class A-4, A-5, A-S, B or C Certificates, the trust component with the same alphanumeric designation)(other than the RR Interest). In any event, however, excess mortgaged property value associated with a mortgage loan will not be available to offset losses on any other mortgage loan. | ||||||||||
| THE INFORMATION IN THIS STRUCTURAL AND COLLATERAL TERM SHEET IS NOT COMPLETE AND MAY BE AMENDED PRIOR TO THE TIME OF SALE. THIS TERM SHEET IS NOT AN OFFER TO SELL THESE SECURITIES AND IT IS NOT A SOLICITATION OF AN OFFER TO BUY THESE SECURITIES IN ANY JURISDICTION WHERE THE OFFER OR SALE IS NOT PERMITTED. | ||
| ||
| BANK 2022-BNK43 | Certificate Structure |
| (6) | The Certificate Principal U/W NOI Debt Yield for each Class of Certificates (other than the Class A-1, A-2, A-3, A-SB, A-4 and A-5 Certificates) is calculated as the product of (a) the weighted average U/W NOI Debt Yield for the mortgage loans and (b) a fraction, the numerator of which is the total initial Certificate Balance of all of the Classes of Principal Balance Certificates (or, with respect to the Class A-4, A-5, A-S, B or C Certificates, the trust component with the same alphanumeric designation) (other than the RR Interest) and the denominator of which is the total initial Certificate Balance for such Class of Certificates and all Classes of Principal Balance Certificates (or, with respect to the Class A-4, A-5, A-S, B or C Certificates, the trust component with the same alphanumeric designation) senior to such Class of Certificates. The Certificate Principal U/W NOI Debt Yield for each of the Class A-1, A-2, A-3, A-SB, A-4 and A-5 Certificates is calculated in the aggregate for those Classes as if they were a single Class and is calculated as the product of (a) the weighted average U/W NOI Debt Yield for the mortgage loans and (b) a fraction, the numerator of which is the total initial Certificate Balance of all of the Classes of Principal Balance Certificates (or, with respect to the Class A-4, A-5, A-S, B or C Certificates, the trust component with the same alphanumeric designation)(other than the RR Interest) and the denominator of which is the total aggregate initial Certificate Balances for the Class A-1, A-2, A-3, A-SB, A-4 and A-5 Certificates (or, with respect to the Class A-4 or A-5 Certificates, the trust component with the same alphanumeric designation). In any event, however, cash flow from each mortgaged property supports only the related mortgage loan and will not be available to support any other mortgage loan. |
| (7) | The pass-through rates for the Class A-1, A-2, A-3, A-SB, A-4, A-5, A-S, B, C, D, E, F, G and H Certificates for any distribution date will, in each case, be one of the following: (i) a fixed rate per annum, (ii) a variable rate per annum equal to the weighted average of the net mortgage interest rates on the mortgage loans for the related distribution date, (iii) a variable rate per annum equal to the lesser of (a) a fixed rate and (b) the weighted average of the net mortgage interest rates on the mortgage loans for the related distribution date or (iv) a variable rate per annum equal to the weighted average of the net mortgage interest rates on the mortgage loans for the related distribution date minus a specified percentage. For purposes of the calculation of the weighted average of the net mortgage interest rates on the mortgage loans for each distribution date, the mortgage interest rates will be adjusted as necessary to a 30/360 basis. |
| (8) | The Class A-4-1, A-4-2, A-4-X1, A-4-X2, A-5-1, A-5-2, A-5-X1, A-5-X2, A-S-1, A-S-2, A-S-X1, A-S-X2, B-1, B-2, B-X1, B-X2, C-1, C-2, C-X1 and C-X2 Certificates are also offered certificates. Such Classes of Certificates, together with the Class A-4, A-5, A-S, B and C Certificates, constitute the “Exchangeable Certificates”. The Class A-1, A-2, A-3, A-SB, D, E, F, G and H Certificates, together with the RR Interest and the Exchangeable Certificates with a Certificate Balance, are referred to as the “Principal Balance Certificates.” Each Class of Exchangeable Certificates will have the Certificate Balance or Notional Amount and pass-through rate described below under “Exchangeable Certificates.” |
| (9) | The exact initial Certificate Balances or Notional Amounts of the Class A-4, A-4-X1, A-4-X2, A-5, A-5-X1 and A-5-X2 trust components (and consequently, the exact aggregate Initial Certificate Balances or Notional Amounts of the Exchangeable Certificates with an “A-4” or “A-5” designation) are unknown and will be determined based on the final pricing of those Classes of Certificates. However, the initial Certificate Balances, weighted average lives and principal windows of the Class A-4 and A-5 trust components are expected to be within the applicable ranges reflected in the following chart. The aggregate initial Certificate Balance of the Class A-4 and A-5 trust components is expected to be approximately $635,154,000, subject to a variance of plus or minus 5%. The Class A-4-X1 and A-4-X2 trust components will have initial Notional Amounts equal to the initial Certificate Balance of the Class A-4 trust component. The Class A-5-X1 and A-5-X2 trust components will have initial Notional Amounts equal to the initial Certificate Balance of the Class A-5 trust component. In the event that the Class A-5 trust component is issued with an initial certificate balance of $635,154,000, the Class A-4 trust component (and, correspondingly, the Class A-4 Exchangeable Certificates) will not be issued. |
| Trust Components | Expected Range of Approximate Initial Certificate Balance | Expected Range of Weighted Average Life (Years) | Expected Range of Principal Window | |||
| Class A-4 | $0 - $315,000,000 | N/A – 9.71 | N/A / 3/32 – 6/32 | |||
| Class A-5 | $320,154,000 - $635,154,000 | 9.79 – 9.88 | 3/32 - 7/32 / 6/32 - 7/32 |
| (10) | The Class X-A Certificates are notional amount certificates. The Notional Amount of the Class X-A Certificates will be equal to the aggregate Certificate Balance of the Class A-1, A-2, A-3 and A-SB Certificates and the Class A-4 and A-5 trust components outstanding from time to time. The Class X-A Certificates will not be entitled to distributions of principal. |
| (11) | The pass-through rate for the Class X-A Certificates for any distribution date will be a per annum rate equal to the excess, if any, of (a) the weighted average of the net mortgage interest rates on the mortgage loans for the related distribution date, over (b) the weighted average of the pass-through rates on the Class A-1, A-2, A-3 and A-SB Certificates and the Class A-4, A-4-X1, A-4-X2, A-5, A-5-X1 and A-5-X2 trust components for the related distribution date, weighted on the basis of their respective Certificate Balances or Notional Amounts outstanding immediately prior to that distribution date (but excluding trust components with a Notional Amount in the denominator of such weighted average calculation). For purposes of the calculation of the weighted average of the net mortgage interest rates on the mortgage loans for each distribution date, the mortgage interest rates will be adjusted as necessary to a 30/360 basis. |
| (12) | The Class X-B Certificates are notional amount certificates. The Notional Amount of the Class X-B Certificates will be equal to the aggregate Certificate Balance of the Class A-S, B and C trust components outstanding from time to time. The Class X-B Certificates will not be entitled to distributions of principal. |
| (13) | The pass-through rate for the Class X-B Certificates for any distribution date will be a per annum rate equal to the excess, if any, of (a) the weighted average of the net mortgage interest rates on the mortgage loans for the related distribution date, over (b) the weighted average of the pass-through rates on the Class A-S, A-S-X1, A-S-X2, B, B-X1, B-X2, C, C-X1 and C-X2 trust components for the related distribution date, weighted on the basis of their respective Certificate Balances or Notional Amounts outstanding immediately prior to that distribution date (but excluding trust components with a Notional Amount in the denominator of such weighted average calculation). For purposes of the calculation of the weighted average of the net mortgage interest rates on the mortgage loans for each distribution date, the mortgage interest rates will be adjusted as necessary to a 30/360 basis. |
| (14) | The Class X-D Certificates are notional amount certificates. The Notional Amount of the Class X-D Certificates will be equal to the aggregate Certificate Balance of the Class D and E Certificates outstanding from time to time. The Class X-D Certificates will not be entitled to distributions of principal. |
| (15) | The pass-through rate for the Class X-D Certificates for any distribution date will be a per annum rate equal to the excess, if any, of (a) the weighted average of the net mortgage interest rates on the mortgage loans for the related distribution date, over (b) the weighted average of the pass-through rates on the Class D and E Certificates for the related distribution date, weighted on the basis of their respective Certificate Balances outstanding immediately prior to that distribution date. For purposes of the calculation of the weighted average of the net mortgage interest rates on the mortgage loans for each distribution date, the mortgage interest rates will be adjusted as necessary to a 30/360 basis. |
| (16) | The effective interest rate for the RR Interest will be a variable rate per annum (described in the table as “WAC”) equal to the weighted average of the net mortgage interest rates on the mortgage loans for the related distribution date. For purposes of calculation of the weighted average of the net mortgage interest rates on the mortgage loans for each distribution date, the mortgage interest rates will be adjusted as necessary to a 30/360 basis. |
| THE INFORMATION IN THIS STRUCTURAL AND COLLATERAL TERM SHEET IS NOT COMPLETE AND MAY BE AMENDED PRIOR TO THE TIME OF SALE. THIS TERM SHEET IS NOT AN OFFER TO SELL THESE SECURITIES AND IT IS NOT A SOLICITATION OF AN OFFER TO BUY THESE SECURITIES IN ANY JURISDICTION WHERE THE OFFER OR SALE IS NOT PERMITTED. | ||
| ||
| BANK 2022-BNK43 | Transaction Highlights |
II. Transaction Highlights
Mortgage Loan Sellers:
Mortgage Loan Seller | Number of | Number of | Aggregate Cut-off Date Balance | Approx. % of Initial Pool | ||||
| Wells Fargo Bank, National Association | 21 | 21 | $533,314,594 | 48.9 | % | |||
| Morgan Stanley Mortgage Capital Holdings LLC | 18 | 60 | 372,124,318 | 34.1 | ||||
| Bank of America, National Association | 7 | 7 | 147,146,651 | 13.5 | ||||
| National Cooperative Bank, N.A. | 15 | 15 | 37,164,170 | 3.4 | ||||
Total | 61 |
| 103 |
| $1,089,749,73 | 3 | 100.0 | % |
Loan Pool:
| Initial Pool Balance: | $1,089,749,733 |
| Number of Mortgage Loans: | 61 |
| Average Cut-off Date Balance per Mortgage Loan: | $17,864,750 |
| Number of Mortgaged Properties: | 103 |
| Average Cut-off Date Balance per Mortgaged Property(1): | $10,580,094 |
| Weighted Average Interest Rate: | 5.2506% |
| Ten Largest Mortgage Loans as % of Initial Pool Balance: | 59.2% |
| Weighted Average Original Term to Maturity (months): | 117 |
| Weighted Average Remaining Term to Maturity (months): | 116 |
| Weighted Average Original Amortization Term (months)(2): | 360 |
| Weighted Average Remaining Amortization Term (months)(2): | 360 |
| Weighted Average Seasoning (months): | 1 |
| (1) | Information regarding mortgage loans secured by multiple properties is based on an allocation according to relative appraised values or the allocated loan amounts or property-specific release prices set forth in the related loan documents or such other allocation as the related mortgage loan seller deemed appropriate. |
| (2) | Excludes any mortgage loan that does not amortize. |
Credit Statistics:
| Weighted Average U/W Net Cash Flow DSCR(1): | 2.48x |
| Weighted Average U/W Net Operating Income Debt Yield(1): | 14.6% |
| Weighted Average Cut-off Date Loan-to-Value Ratio(1): | 50.6% |
| Weighted Average Balloon Loan-to-Value Ratio(1): | 48.9% |
| % of Mortgage Loans with Additional Subordinate Debt(2): | 7.7% |
| % of Mortgage Loans with Single Tenants(3): | 6.7% |
| (1) | With respect to any mortgage loan that is part of a whole loan, loan-to-value ratio, debt service coverage ratio and debt yield calculations include the related pari passu companion loan(s) but exclude any related subordinate companion loan(s) (unless otherwise stated). The information for each mortgaged property that relates to a mortgage loan that is cross-collateralized or cross-defaulted with one or more other mortgage loans is based upon the principal balance of that mortgage loan, except that the applicable loan-to-value ratio, debt service coverage ratio, and debt yield for each such mortgage loan is based upon the ratio or yield (as applicable) for the aggregate indebtedness evidenced by all loans in the group (without regard to any limitation on the amount of indebtedness secured by any mortgaged property in such cross-collateralized group). For mortgaged properties securing residential cooperative mortgage loans, the debt service coverage ratio and debt yield for each such mortgaged property are calculated using U/W Net Operating Income or U/W Net Cash Flow, as applicable, for the related residential cooperative property which is the projected net operating income or net cash flow, as applicable, reflected in the most recent appraisal obtained by or otherwise in the possession of the related mortgage loan seller as of the cut-off date, and the loan-to-value ratio is calculated based upon the appraised value of the residential cooperative property determined as if such residential cooperative property is operated as a residential cooperative, inclusive of the amount of the underlying debt encumbering such residential cooperative property. The debt service coverage ratio, debt yield and loan-to-value ratio information do not take into account any subordinate debt (whether or not secured by the related mortgaged property), that currently exists or is allowed under the terms of any mortgage loan. See “Description of the Mortgage Pool—Mortgage Pool Characteristics” in the Preliminary Prospectus and Annex A-1 to the Preliminary Prospectus. |
| (2) | Thirteen (13) of the mortgage loans, each of which is secured by a residential cooperative property sold to the depositor by National Cooperative Bank, N.A., currently have in place subordinate secured lines of credit to the related mortgage borrowers that permit future advances (such loans, collectively, the “Subordinate Coop LOCs”). The percentage figure expressed as “% of Mortgage Loans with Additional Subordinate Debt” is determined as a percentage of the initial pool balance and does not take into account any future subordinate debt (whether or not secured by the mortgaged property), if any, that may be permitted under the terms of any mortgage loan or the pooling and servicing agreement. See “Description of the Mortgage Pool—Additional Indebtedness—Other Unsecured Indebtedness” and “Description of the Mortgage Pool—Additional Indebtedness—Other Secured Indebtedness—Additional Debt Financing for Mortgage Loans Secured by Residential Cooperatives Sold to the Depositor by National Cooperative Bank, N.A.” in the Preliminary Prospectus. |
| (3) | Excludes mortgage loans that are secured by multiple single tenant properties. |
| THE INFORMATION IN THIS STRUCTURAL AND COLLATERAL TERM SHEET IS NOT COMPLETE AND MAY BE AMENDED PRIOR TO THE TIME OF SALE. THIS TERM SHEET IS NOT AN OFFER TO SELL THESE SECURITIES AND IT IS NOT A SOLICITATION OF AN OFFER TO BUY THESE SECURITIES IN ANY JURISDICTION WHERE THE OFFER OR SALE IS NOT PERMITTED. | ||
| ||
| BANK 2022-BNK43 | Transaction Highlights |
Loan Structural Features:
Amortization: Based on the Initial Pool Balance, 29.5% of the mortgage pool (26 mortgage loans) has scheduled amortization, as follows:
23.5% (21 mortgage loans) requires amortization during the entire loan term; and
6.0% (5 mortgage loans) provides for an interest-only period followed by an amortization period
Interest-Only: Based on the Initial Pool Balance, 70.5% of the mortgage pool (35 mortgage loans) provides for interest-only payments during the entire loan term through maturity. The weighted average Cut-off Date Loan-to-Value Ratio and weighted average U/W Net Cash Flow DSCR for those mortgage loans are 54.3% and 2.30x, respectively.
Hard Lockboxes: Based on the Initial Pool Balance, 65.1% of the mortgage pool (18 mortgage loans) has hard lockboxes in place.
Reserves: The mortgage loans require amounts to be escrowed monthly as follows (excluding any mortgage loans with springing provisions):
| Real Estate Taxes: | 75.0% of the pool |
| Insurance: | 24.1% of the pool |
| Capital Replacements: | 66.2% of the pool |
| TI/LC: | 40.1% of the pool (1) |
| (1) The percentage of Initial Pool Balance for mortgage loans with TI/LC reserves is based on the aggregate principal balance allocable to loans that include office, mixed use, retail and industrial properties. | |
Call Protection/Defeasance: Based on the Initial Pool Balance, the mortgage pool has the following call protection and defeasance features:
75.2% of the mortgage pool (36 mortgage loans) features a lockout period, then defeasance only until an open period;
7.7% of the mortgage pool (1 mortgage loan) features a lockout period, then the greater of a prepayment premium (1%) or yield maintenance, then defeasance or the greater of a prepayment premium (1%) or yield maintenance until an open period;
5.9% of the mortgage pool (3 mortgage loans) features a lockout period, then defeasance or greater of a prepayment premium (1%) or yield maintenance until an open period;
4.7% of the mortgage pool (5 mortgage loans) features a lockout period, then greater of a prepayment premium (1%) or yield maintenance until an open period;
3.4% of the mortgage pool (15 mortgage loans) features no lockout period, but requires the greater of a prepayment premium (1%) or yield maintenance, then a prepayment premium (1%) until an open period;
3.0% of the mortgage pool (1 mortgage loan) features no lockout period, but requires the greater of a prepayment premium (1%) or yield maintenance, then defeasance or the greater of a prepayment premium (1%) or yield maintenance until an open period;
Prepayment restrictions for each mortgage loan reflect the entire life of the mortgage loan. Please refer to Annex A-1 to the Preliminary Prospectus and the footnotes related thereto for further information regarding individual loan call protection.
| THE INFORMATION IN THIS STRUCTURAL AND COLLATERAL TERM SHEET IS NOT COMPLETE AND MAY BE AMENDED PRIOR TO THE TIME OF SALE. THIS TERM SHEET IS NOT AN OFFER TO SELL THESE SECURITIES AND IT IS NOT A SOLICITATION OF AN OFFER TO BUY THESE SECURITIES IN ANY JURISDICTION WHERE THE OFFER OR SALE IS NOT PERMITTED. | ||
| ||
| BANK 2022-BNK43 | Issue Characteristics |
III. Issue Characteristics
| Securities Offered: | $920,089,000 approximate monthly pay, multi-class, commercial mortgage REMIC pass-through certificates consisting of thirty-one classes (Classes A-1, A-2, A-3, A-SB, A-4, A-4-1, A-4-2, A-4-X1, A-4-X2, A-5, A-5-1, A-5-2, A-5-X1, A-5-X2, A-S, A-S-1, A-S-2, A-S-X1, A-S-X2, B, B-1, B-2, B-X1, B-X2, C, C-1, C-2, C-X1, C-X2, X-A and X-B), which are offered pursuant to a registration statement filed with the SEC (such Classes of certificates, the “Offered Certificates”). |
| Mortgage Loan Sellers: | Wells Fargo Bank, National Association (“WFB”), Morgan Stanley Mortgage Capital Holdings LLC (“MSMCH”), Bank of America, National Association (“BANA”) and National Cooperative Bank, N.A. (“NCB”). |
| Joint Bookrunners and Co-Lead Managers: | Wells Fargo Securities, LLC, Morgan Stanley & Co. LLC and BofA Securities, Inc. |
| Co-Manager: | Academy Securities, Inc., Drexel Hamilton, LLC and Siebert Williams Shank & Co., LLC |
| Rating Agencies: | Fitch Ratings, Inc., Kroll Bond Rating Agency, LLC and Moody’s Investors Service, Inc. |
| Master Servicers: | Wells Fargo Bank, National Association and National Cooperative Bank, N.A. |
| Special Servicers: | Greystone Servicing Company LLC and National Cooperative Bank, N.A. |
| Certificate Administrator: | Computershare Trust Company, N.A. |
| Trustee: | Wilmington Trust, National Association |
| Operating Advisor: | Pentalpha Surveillance LLC |
| Asset Representations Reviewer: | Pentalpha Surveillance LLC |
| U.S. Credit Risk Retention: | For a discussion of the manner in which the U.S. credit risk retention requirements are being addressed by Bank of America, National Association, as the retaining sponsor, see “Credit Risk Retention” in the Preliminary Prospectus. |
| EU Securitization Regulation and UK Securitization Regulation: | None of the sponsors, the depositor, the underwriters, or their respective affiliates, or any other person intends to retain a material net economic interest in the securitization constituted by the issue of the Certificates, or to take any other action in respect of such securitization, in a manner prescribed or contemplated by (i) Regulation (EU) 2017/2402, or (ii) such Regulation as it forms part of UK domestic law. In particular, no such person undertakes to take any action which may be required by any investor for the purposes of its compliance with any applicable requirement under either such Regulation. Furthermore, the arrangements described under “Credit Risk Retention” in the Preliminary Prospectus have not been structured with the objective of ensuring compliance by any person with any requirements of either such Regulation. See “Risk Factors—Other Risks Relating to the Certificates—EU Securitization Regulation and UK Securitization Regulation” in the Preliminary Prospectus.
|
| Initial Risk Retention Consultation Party: | Wells Fargo Bank, National Association |
| Initial Majority Controlling Class Certificateholder: | Greystone Investment Capital LLC |
| Cut-off Date: | The Cut-off Date with respect to each mortgage loan is the due date for the monthly debt service payment that is due in August 2022 (or, in the case of any mortgage loan that has its first due date after August 2022, the date that would have been its due date in August 2022 under the terms of that mortgage loan if a monthly debt service payment were scheduled to be due in that month). |
| Expected Closing Date: | On or about August 25, 2022. |
| Determination Dates: | The 11th day of each month (or if that day is not a business day, the next succeeding business day), commencing in September 2022. |
| Distribution Dates: | The fourth business day following the Determination Date in each month, commencing in September 2022. |
| Rated Final Distribution Date: | The Distribution Date in August 2055. |
| THE INFORMATION IN THIS STRUCTURAL AND COLLATERAL TERM SHEET IS NOT COMPLETE AND MAY BE AMENDED PRIOR TO THE TIME OF SALE. THIS TERM SHEET IS NOT AN OFFER TO SELL THESE SECURITIES AND IT IS NOT A SOLICITATION OF AN OFFER TO BUY THESE SECURITIES IN ANY JURISDICTION WHERE THE OFFER OR SALE IS NOT PERMITTED. | ||
| ||
| BANK 2022-BNK43 | Issue Characteristics |
| Interest Accrual Period: | With respect to any Distribution Date, the calendar month immediately preceding the month in which such Distribution Date occurs. |
| Day Count: | The Offered Certificates will accrue interest on a 30/360 basis. |
| Minimum Denominations: | $10,000 for each Class of Offered Certificates (other than the Class X-A and X-B Certificates) and $1,000,000 for the Class X-A and X-B Certificates. Investments may also be made in any whole dollar denomination in excess of the applicable minimum denomination. |
| Clean-up Call: | 1.0% |
| Delivery: | DTC, Euroclear and Clearstream Banking |
| ERISA/SMMEA Status: | Each Class of Offered Certificates is expected to be eligible for exemptive relief under ERISA. No Class of Offered Certificates will be SMMEA eligible. |
| Risk Factors: | THE CERTIFICATES INVOLVE CERTAIN RISKS AND MAY NOT BE SUITABLE FOR ALL INVESTORS. SEE THE “SUMMARY OF RISK FACTORS” AND “RISK FACTORS” SECTIONS OF THE PRELIMINARY PROSPECTUS. |
| Bond Analytics Information: | The Certificate Administrator will be authorized to make distribution date statements, CREFC® reports and certain supplemental reports (other than confidential information) available to certain financial modeling and data provision services, including Bloomberg, L.P., Trepp, LLC, Intex Solutions, Inc., Markit Group Limited, Interactive Data Corp., BlackRock Financial Management, Inc., CMBS.com, Inc., Moody’s Analytics, Inc., Morningstar Credit Information & Analytics, LLC, KBRA Analytics, LLC, MBS Data, LLC, RealInsight and Thomson Reuters Corporation. |
| Tax Treatment | For U.S. federal income tax purposes, the issuing entity will consist of one or more REMICs arranged in a tiered structure and a trust (the “grantor trust”). The upper-most REMIC will issue REMIC regular interests some of which will be held by the grantor trust (such grantor trust-held REMIC regular interests, the “trust components”). The Offered Certificates (other than the Exchangeable Certificates) will represent REMIC regular interests (other than the trust components). The Exchangeable Certificates will represent beneficial ownership of one or more of the trust components held by the grantor trust. |
| THE INFORMATION IN THIS STRUCTURAL AND COLLATERAL TERM SHEET IS NOT COMPLETE AND MAY BE AMENDED PRIOR TO THE TIME OF SALE. THIS TERM SHEET IS NOT AN OFFER TO SELL THESE SECURITIES AND IT IS NOT A SOLICITATION OF AN OFFER TO BUY THESE SECURITIES IN ANY JURISDICTION WHERE THE OFFER OR SALE IS NOT PERMITTED. | ||
| ||
| BANK 2022-BNK43 | Characteristics of the Mortgage Pool |
IV. Characteristics of the Mortgage Pool(1)
A. Ten Largest Mortgage Loans or Groups
| Mortgage Loan Seller | Mortgage Loan Name | City | State | Number of Mortgage Loans / Mortgaged Properties | Mortgage Loan Cut-off Date Balance ($) | % of Initial Pool Balance (%) | Property Type | Number of SF / Rooms | Cut-off Date Balance Per SF / Room ($) | Cut-off Date LTV Ratio (%) | Balloon LTV Ratio (%) | U/W NCF DSCR (x) | U/W NOI Debt Yield (%) | |||||
| WFB | High Street | Phoenix | AZ | 1 / 1 | $100,000,000 | 9.2 | % | Mixed Use | 630,083 | $220 | 71.5 | % | 71.5 | % | 1.61 | x | 8.8 | % |
| BANA | Katy Mills | Katy | TX | 1 / 1 | 91,000,000 | 8.4 | Retail | 1,181,987 | 110 | 33.0 | 27.8 | 2.91 | 21.8 | |||||
| MSMCH | Constitution Center | Washington | DC | 1 / 1 | 84,000,000 | 7.7 | Office | 1,410,049 | 282 | 43.5 | 43.5 | 4.30 | 14.1 | |||||
| WFB | The Boulders Resort | Scottsdale | AZ | 1 / 1 | 74,930,466 | 6.9 | Hospitality | 160 | 624,421 | 42.9 | 36.0 | 2.66 | 20.3 | |||||
| MSMCH | ExchangeRight Net Leased Portfolio #56 | Various | Various | 1 / 33 | 59,463,750 | 5.5 | Retail | 637,669 | 93 | 50.5 | 50.5 | 1.79 | 10.4 | |||||
| MSMCH | One Bridge Street | Irvington | NY | 1 / 1 | 52,000,000 | 4.8 | Office | 200,397 | 259 | 52.0 | 52.0 | 2.19 | 11.3 | |||||
| WFB | Clifton Commons | Clifton | NJ | 1 / 1 | 50,000,000 | 4.6 | Retail | 187,794 | 266 | 69.3 | 69.3 | 1.51 | 9.1 | |||||
| MSMCH | One Campus Martius | Detroit | MI | 1 / 1 | 46,200,000 | 4.2 | Office | 1,356,325 | 161 | 60.1 | 60.1 | 1.74 | 11.5 | |||||
| WFB | Hilton Sandestin Beach Resort | Miramar Beach | FL | 1 / 1 | 44,000,000 | 4.0 | Hospitality | 590 | 203,390 | 36.3 | 36.3 | 3.66 | 19.7 | |||||
| WFB | Plaza on Richmond | Houston | TX | 1 / 1 | 44,000,000 | 4.0 | Retail | 191,532 | 230 | 42.8 | 42.8 | 1.89 | 10.9 | |||||
| Top Three Total/Weighted Average | 3 / 3 | $275,000,000 | 25.2 | % | 50.2 | % | 48.5 | % | 2.86 | x | 14.7 | % | ||||||
| Top Five Total/Weighted Average | 5 / 37 | $409,394,216 | 37.6 | % | 48.9 | % | 46.5 | % | 2.67 | x | 15.1 | % | ||||||
| Top Ten Total/Weighted Average | 10 / 42 | $645,594,216 | 59.2 | % | 50.3 | % | 48.7 | % | 2.49 | x | 14.1 | % | ||||||
| Non-Top Ten Total/Weighted Average | 51 / 61 | $444,155,517 | 40.8 | % | 51.0 | % | 49.1 | % | 2.48 | x | 15.3 | % | ||||||
| (1) | With respect to any mortgage loan that is part of a whole loan, Cut-off Date Balance Per SF/Room($) loan-to-value ratio, debt service coverage ratio and debt yield calculations include the related pari passu companion loan(s) but exclude any related subordinate companion loan(s) (unless otherwise stated). With respect to each mortgage loan, debt service coverage ratio, debt yield and loan-to-value ratio information do not take into account subordinate debt (whether or not secured by the related mortgaged property), if any, that currently exists or is allowed under the terms of such mortgage loan. |
| THE INFORMATION IN THIS STRUCTURAL AND COLLATERAL TERM SHEET IS NOT COMPLETE AND MAY BE AMENDED PRIOR TO THE TIME OF SALE. THIS TERM SHEET IS NOT AN OFFER TO SELL THESE SECURITIES AND IT IS NOT A SOLICITATION OF AN OFFER TO BUY THESE SECURITIES IN ANY JURISDICTION WHERE THE OFFER OR SALE IS NOT PERMITTED. | ||
| ||
| BANK 2022-BNK43 | Characteristics of the Mortgage Pool |
B. Summary of the Whole Loans
| No. | Property Name | Mortgage Loan Seller in BANK 2022-BNK43 | Trust Cut-off Date Balance | Aggregate Pari-Passu Companion Loan Cut-off Date Balance(1) | Controlling Pooling / Trust & Servicing Agreement | Master Servicer | Special Servicer | Related Pari Passu Companion Loan(s) Securitizations | Related Pari Passu Companion Loan(s) Original Balance |
| 1 | High Street | WFB | $100,000,000 | $138,395,000 | BANK 2022-BNK43 | Wells Fargo Bank, National Association | Greystone Servicing Company LLC | Future Securitizations | $38,395,000 |
| 2 | Katy Mills | BANA | $91,000,000 | $130,000,000 | BANK 2022-BNK43 | Wells Fargo Bank, National Association | Greystone Servicing Company LLC | Future Securitizations | $39,000,000 |
| 3 | Constitution Center | MSMCH | $84,000,000 | $398,000,000 | MSC 2022-L8(2) | Midland Loan Services, a Division of PNC Bank National Association | LNR Partners, LLC | MSC 2022-L8 | $314,000,000 |
| 4 | The Boulders Resort | WFB | $74,930,466 | $99,907,288 | BANK 2022-BNK43 | Wells Fargo Bank, National Association | Greystone Servicing Company LLC | Future Securitizations | $25,000,000 |
| 8 | One Campus Martius | MSMCH | $46,200,000 | $218,000,000 | BMARK 2022-B36(3) | Midland Loan Services, a Division of PNC Bank National Association (3) | Midland Loan Services, a Division of PNC Bank National Association (3) | BMARK 2022-B36, Future Securitizations | $171,800,000 |
| 9 | Hilton Sandestin Beach Resort | WFB | $44,000,000 | $120,000,000 | BANK 2022-BNK42 | Wells Fargo Bank, National Association | LNR Partners, LLC | BANK 2022-BNK42 | $76,000,000 |
| 15 | 79 Fifth Avenue | WFB | $25,000,000 | $240,000,000 | CGCMT 2022-GC48 | Midland Loan Services, a Division of PNC Bank National Association | Greystone Servicing Company LLC | BANK 2022-BNK42, CGCMT 2022-GC48, BMO 2022-C2, Future Securitizations | $215,000,000 |
| 19 | 2355 and 2383 Utah Ave | MSMCH | $14,000,000 | $85,000,000 | BANK 2022-BNK42 | Wells Fargo Bank, National Association | LNR Partners, LLC | BANK 2022-BNK42 | $71,000,000 |
| (1) | The Aggregate Pari Passu Companion Loan Cut-off Date Balance excludes the related Subordinate Companion Loans. |
| (2) | Control rights are currently exercised by the holder of the related Subordinate Companion Loans until the occurrence and during the continuation of a control appraisal period for the related whole loan, as described under “Description of the Mortgage Pool—The Whole Loans—The Non-Serviced AB Whole Loan—The Constitution Center Whole Loan” in the Preliminary Prospectus. |
| (3) | The BMARK 2022-B36 transaction is expected to close on or prior to the closing date for this securitization. |
| THE INFORMATION IN THIS STRUCTURAL AND COLLATERAL TERM SHEET IS NOT COMPLETE AND MAY BE AMENDED PRIOR TO THE TIME OF SALE. THIS TERM SHEET IS NOT AN OFFER TO SELL THESE SECURITIES AND IT IS NOT A SOLICITATION OF AN OFFER TO BUY THESE SECURITIES IN ANY JURISDICTION WHERE THE OFFER OR SALE IS NOT PERMITTED. | ||
| ||
| BANK 2022-BNK43 | Characteristics of the Mortgage Pool |
C. Mortgage Loans with Additional Secured and Mezzanine Financing(1)
| Loan No. | Mortgage Loan Seller | Mortgage Loan Name | Mortgage Loan Cut-off Date Balance ($) | % of Cut-off Date Balance (%) | Sub Debt Cut-off Date Balance ($) | Mezzanine Debt Cut-off Date Balance ($) | Total Debt Interest Rate (%)(2) | Mortgage Loan U/W NCF DSCR (x)(3) | Total Debt U/W NCF DSCR (x) | Mortgage Loan Cut-off Date U/W NOI Debt Yield (%)(3) | Total Debt Cut-off Date U/W NOI Debt Yield (%) | Mortgage Loan Cut-off Date LTV Ratio (%)(3) | Total Debt Cut-off Date LTV Ratio (%) | |||||
| 3 | MSMCH | Constitution Center | $84,000,000 | 7.7% | $52,000,000 | NAP | 3.1500% | 4.30x | 3.68x | 14.1% | 12.5% | 43.5% | 49.2% | |||||
| Total/Weighted Average | $84,000,000 | 7.7% | $52,000,000 | NAP | 3.1500% | 4.30x | 3.68x | 14.1% | 12.5% | 43.5% | 49.2% | |||||||
| (1) | In addition, thirteen (13) of the mortgage loans, each of which is secured by a residential cooperative property sold to the depositor by National Cooperative Bank, N.A, currently have in place Subordinate Coop LOCs. See “Description of the Mortgage Pool—Additional Indebtedness—Other Unsecured Indebtedness” and “Description of the Mortgage Pool—Additional Indebtedness—Other Secured Indebtedness—Additional Debt Financing for Mortgage Loans Secured by Residential Cooperatives Sold to the Depositor by National Cooperative Bank, N.A.” in the Preliminary Prospectus. With respect to Mortgage Loan No. 26 (5500 South Hattie), the Mortgaged Property is encumbered by a subordinate mortgage that secures a subordinate A note in the original principal amount of $3,590,000 and a subordinate B note in the original principal amount of $1,410,000, each related to a New Markets Tax Credit financing on the Mortgaged Property. The subordinate notes have an annual interest rate of 1.4745%, payable quarterly, and a maturity date in November 4048. Additionally, a $50,000 payment is due on the subordinate B note in September 2025, which amount was reserved with the junior lender (the “Fee Reserve”) at origination of the subordinate mortgage. Quarterly principal payments based on a 23-year amortization schedule are due on both subordinate notes commencing in December 2025. Including the subordinate notes, the related Cut-off Date LTV Ratio, LTV Ratio at Maturity, U/W NCF DSCR and U/W NOI Debt Yield would be 100.4%, 100.4%, 1.34x and 6.1%, respectively. The investor which purchased the New Market Tax Credits has the right to put its interest in an indirect owner of the borrower to Western Industries Corporation (the recourse carveout guarantor, which is an affiliate of the borrower and is also the sole tenant at the Mortgaged Property), during a 180 day period commencing September 22, 2025, and Western Industries Corporation has a call option as to such interest if the put option is not exercised. Upon exercise of either option, the lender of the subordinate debt (the “5500 South Hattie Subordinate Lender”) would become controlled by Western Industries Corporation. There is no assurance that either option will be exercised. The 5500 South Hattie Subordinate Lender entered into an intercreditor agreement with the mortgage lender pursuant to which it agreed the subordinate notes will be subordinate to the mortgage loan. See “Description of the Mortgage Pool—Certain Terms of the Mortgage Loans—Other Secured Indebtedness”. |
| (2) | Total Debt Interest Rate for any specified mortgage loan reflects the weighted average of the interest rates on the respective components of the total debt. |
| (3) | With respect to any mortgage loan that is part of a whole loan, the loan-to-value ratio, debt service coverage ratio and debt yield calculations include the related pari passu companion loan(s) but exclude any related subordinate companion loan(s) (unless otherwise stated). |
| THE INFORMATION IN THIS STRUCTURAL AND COLLATERAL TERM SHEET IS NOT COMPLETE AND MAY BE AMENDED PRIOR TO THE TIME OF SALE. THIS TERM SHEET IS NOT AN OFFER TO SELL THESE SECURITIES AND IT IS NOT A SOLICITATION OF AN OFFER TO BUY THESE SECURITIES IN ANY JURISDICTION WHERE THE OFFER OR SALE IS NOT PERMITTED. | ||
| ||
| BANK 2022-BNK43 | Characteristics of the Mortgage Pool |
D. Previous Securitization History(1)
| Loan No. | Mortgage Loan Seller | Mortgage Loan or Mortgaged Property Name | City | State | Property Type | Mortgage Loan or Mortgaged Property Cut-off Date Balance ($) | % of Initial Pool Balance (%) | Previous Securitization | |
| 1 | WFB | High Street | Phoenix | AZ | Mixed Use | $100,000,000 | 9.2 | % | TRTX 2018-FL1 |
| 2 | BANA | Katy Mills | Katy | TX | Retail | 91,000,000 | 8.4 | GSMS 2013-G1 | |
| 4 | WFB | The Boulders Resort | Scottsdale | AZ | Hospitality | 74,930,466 | 6.9 | CSAIL 2017-CX10 | |
| 6 | MSMCH | One Bridge Street | Irvington | NY | Office | 52,000,000 | 4.8 | WFRBS 2013-C17 | |
| 7 | WFB | Clifton Commons | Clifton | NJ | Retail | 50,000,000 | 4.6 | UBSBB 2012-C4 | |
| 8 | MSMCH | One Campus Martius | Detroit | MI | Office | 46,200,000 | 4.2 | JPMBB 2015-C28 | |
| 9 | WFB | Hilton Sandestin Beach Resort | Miramar Beach | FL | Hospitality | 44,000,000 | 4.0 | WFRBS 2013-C17 | |
| 10 | WFB | Plaza on Richmond | Houston | TX | Retail | 44,000,000 | 4.0 | WFRBS 2012-C8 | |
| 13 | WFB | Tisch Tower | San Jose | CA | Office | 30,000,000 | 2.8 | UBSBB 2013-C5 | |
| 14 | BANA | Homewood Suites – Oxnard, CA | Oxnard | CA | Hospitality | 27,850,000 | 2.6 | MSBAM 2013-C8 | |
| 17 | WFB | Marnell Corporate Center 3 | Las Vegas | NV | Office | 16,000,000 | 1.5 | PFP 2017-3 | |
| 24 | WFB | Melville Corporate Plaza | Melville | NY | Office | 8,980,123 | 0.8 | WFCM 2017-C42 | |
| 25 | WFB | Omega Self Storage - Mineola | Mineola | NY | Self Storage | 7,981,633 | 0.7 | WFRBS 2013-C13 | |
| 32 | WFB | Crossings at Indian Lake Village | Hendersonville | TN | Retail | 6,660,000 | 0.6 | UBSBB 2012-C2 | |
| 48 | NCB | Georgian House Owners Corp. | Kew Gardens | NY | Multifamily | 3,782,000 | 0.3 | WFRBS 2013-C13 | |
| Total | $603,384,222 | 55.4 | % | ||||||
| (1) | The table above represents the most recent securitization with respect to the mortgaged property securing the related mortgage loan, based on information provided by the related borrower or obtained through searches of a third-party database. While loans secured by the above mortgaged properties may have been securitized multiple times in prior transactions, mortgage loans in this securitization are only listed in the above chart if the mortgage loan paid off a loan in another securitization. The information has not otherwise been confirmed by the mortgage loan sellers. |
| THE INFORMATION IN THIS STRUCTURAL AND COLLATERAL TERM SHEET IS NOT COMPLETE AND MAY BE AMENDED PRIOR TO THE TIME OF SALE. THIS TERM SHEET IS NOT AN OFFER TO SELL THESE SECURITIES AND IT IS NOT A SOLICITATION OF AN OFFER TO BUY THESE SECURITIES IN ANY JURISDICTION WHERE THE OFFER OR SALE IS NOT PERMITTED. | ||
| ||
| BANK 2022-BNK43 | Characteristics of the Mortgage Pool |
E. Mortgage Loans with Scheduled Balloon Payments and Related Classes
| Class A-2(1) | |||||||||||||||||||||
| Loan No. | Mortgage Loan Seller | Mortgage Loan Name | State | Property Type | Mortgage Loan Cut-off Date Balance ($) | % of Initial Pool Balance (%) | Mortgage Loan Balance at Maturity ($) | % of Class A-2 Certificate Principal Balance (%)(2) | SF | Loan per SF ($) | U/W NCF DSCR (x) | U/W NOI Debt Yield (%) | Cut-off Date LTV Ratio (%) | Balloon LTV Ratio (%) | Rem. IO Period (mos.) | Rem. Term to Maturity (mos.) | |||||
| 12 | MSMCH | City Brewery | WI | Industrial | $33,000,000 | 3.0 | % | $33,000,000 | 71.7 | % | 730,584 | $45 | 1.84x | 10.7 | % | 55.4 | % | 55.4 | % | 60 | 60 |
| 19 | MSMCH | 2355 and 2383 Utah Ave | CA | Office | 14,000,000 | 1.3 | 14,000,000 | 30.4 | 202,813 | 419 | 1.51 | 9.4 | 57.4 | 57.4 | 57 | 57 | |||||
| Total/Weighted Average | $47,000,000 | 4.3 | % | $47,000,000 | 102.1 | % | 1.74x | 10.3 | % | 56.0 | % | 56.0 | % | 59 | 59 | ||||||
| (1) | The table above presents the mortgage loan whose balloon payments would be applied to pay down the principal balance of the Class A-2 Certificates, assuming a 0% CPR and applying the “Structuring Assumptions” described in the Preliminary Prospectus, including the assumptions that (i) none of the mortgage loans in the pool experience prepayments prior to maturity, defaults or losses; (ii) there are no extensions of maturity dates of any mortgage loans in the pool; and (iii) each mortgage loan in the pool is paid in full on its stated maturity date. Each Class of Certificates evidences undivided ownership interests in the entire pool of mortgage loans. Debt service coverage ratio, debt yield and loan-to-value ratio information do not take into account subordinate debt (whether or not secured by the related mortgaged property), if any, that currently exists or is allowed under the terms of any mortgage loan. See Annex A-1 to the Preliminary Prospectus. |
| (2) | Reflects the percentage equal to the Balloon Balance divided by the initial Class A-2 Certificate Balance. |
| Class A-3(1) | ||||||||||||||||
| Loan No. | Mortgage Loan Seller | Mortgage Loan Name | State | Property Type | Mortgage Loan Cut-off Date Balance ($) | % of Initial Pool Balance (%) | Mortgage Loan Balance at Maturity ($) | % of Class A-3 Certificate Principal Balance (%)(2) | SF | Loan per SF ($) | U/W NCF DSCR (x) | U/W NOI Debt Yield (%) | Cut-off Date LTV Ratio (%) | Balloon LTV Ratio (%) | Rem. IO Period (mos.) | Rem. Term to Maturity (mos.) |
| 46 | BANA | 4330 Miraloma Avenue Medical Office | CA | Office | $4,293,707 | 0.4% | $3,634,557 | 105.6% | 31,300 | $137 | 2.04x | 17.2% | 39.4% | 33.3% | 0 | 83 |
| Total/Weighted Average | $4,293,707 | 0.4% | $3,634,557 | 105.6% | 2.04x | 17.2% | 39.4% | 33.3% | 0 | 83 | ||||||
| (1) | The table above presents the mortgage loan whose balloon payments would be applied to pay down the principal balance of the Class A-3 Certificates, assuming a 0% CPR and applying the “Structuring Assumptions” described in the Preliminary Prospectus, including the assumptions that (i) none of the mortgage loans in the pool experience prepayments prior to maturity, defaults or losses; (ii) there are no extensions of maturity dates of any mortgage loans in the pool; and (iii) each mortgage loan in the pool is paid in full on its stated maturity date. Each Class of Certificates evidences undivided ownership interests in the entire pool of mortgage loans. Debt service coverage ratio, debt yield and loan-to-value ratio information do not take into account subordinate debt (whether or not secured by the related mortgaged property), if any, that currently exists or is allowed under the terms of any mortgage loan. See Annex A-1 to the Preliminary Prospectus. |
| (2) | Reflects the percentage equal to the Balloon Balance divided by the initial Class A-3 Certificate Balance. |
| THE INFORMATION IN THIS STRUCTURAL AND COLLATERAL TERM SHEET IS NOT COMPLETE AND MAY BE AMENDED PRIOR TO THE TIME OF SALE. THIS TERM SHEET IS NOT AN OFFER TO SELL THESE SECURITIES AND IT IS NOT A SOLICITATION OF AN OFFER TO BUY THESE SECURITIES IN ANY JURISDICTION WHERE THE OFFER OR SALE IS NOT PERMITTED. | ||
| ||
| BANK 2022-BNK43 | Characteristics of the Mortgage Pool |
F. Property Type Distribution(1)
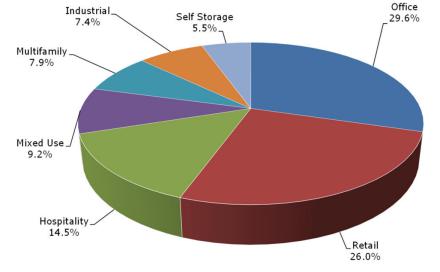
| Property Type | Number of Mortgaged Properties | Aggregate Cut-off Date Balance ($) | % of Cut-off Date Balance (%) | Weighted Average Cut-off Date LTV Ratio (%) | Weighted Average Balloon LTV Ratio (%) | Weighted Average U/W NCF DSCR (x) | Weighted Average U/W NOI Debt Yield (%) | Weighted Average U/W NCF Debt Yield (%) | Weighted Average Interest Rate (%) | ||||||||
| Office | 11 | $322,073,830 | 29.6 | % | 53.0 | % | 51.7 | % | 2.53x | 12.1 | % | 11.4 | % | 4.7042 | % | ||
| Suburban | 7 | 162,580,123 | 14.9 | 55.1 | 52.6 | 1.99 | 11.8 | 11.0 | 5.1369 | ||||||||
| CBD | 3 | 155,200,000 | 14.2 | 51.2 | 51.2 | 3.10 | 12.4 | 11.7 | 4.2350 | ||||||||
| Medical | 1 | 4,293,707 | 0.4 | 39.4 | 33.3 | 2.04 | 17.2 | 14.7 | 5.2800 | ||||||||
| Retail | 41 | 283,573,750 | 26.0 | 46.5 | 44.6 | 2.18 | 14.4 | 13.6 | 5.5721 | ||||||||
| Anchored | 3 | 108,000,000 | 9.9 | 55.3 | 55.3 | 1.85 | 10.8 | 10.3 | 5.5421 | ||||||||
| Super Regional Mall | 1 | 91,000,000 | 8.4 | 33.0 | 27.8 | 2.91 | 21.8 | 20.4 | 5.7670 | ||||||||
| Single Tenant | 34 | 66,763,750 | 6.1 | 47.8 | 47.4 | 1.85 | 11.0 | 10.5 | 5.3824 | ||||||||
| Unanchored | 3 | 17,810,000 | 1.6 | 56.6 | 55.3 | 1.75 | 10.8 | 10.2 | 5.4690 | ||||||||
| Hospitality | 5 | 157,633,410 | 14.5 | 44.4 | 40.5 | 2.88 | 19.2 | 17.2 | 5.3987 | ||||||||
| Full Service | 2 | 118,930,466 | 10.9 | 40.5 | 36.1 | 3.03 | 20.1 | 17.8 | 5.2141 | ||||||||
| Extended Stay | 1 | 27,850,000 | 2.6 | 55.3 | 55.3 | 2.61 | 16.7 | 15.5 | 5.8400 | ||||||||
| Limited Service | 2 | 10,852,944 | 1.0 | 60.3 | 51.1 | 1.88 | 16.2 | 14.4 | 6.2896 | ||||||||
| Mixed Use | 1 | 100,000,000 | 9.2 | 71.5 | 71.5 | 1.61 | 8.8 | 8.7 | 5.3520 | ||||||||
| Office/Retail/Multifamily | 1 | 100,000,000 | 9.2 | 71.5 | 71.5 | 1.61 | 8.8 | 8.7 | 5.3520 | ||||||||
| Multifamily | 20 | 85,999,238 | 7.9 | 34.4 | 32.8 | 4.61 | 28.8 | 28.2 | 5.4918 | ||||||||
| Cooperative | 16 | 43,149,238 | 4.0 | 13.0 | 11.5 | 7.55 | 45.9 | 45.2 | 4.9451 | ||||||||
| Low Rise | 3 | 37,250,000 | 3.4 | 55.5 | 53.7 | 1.64 | 11.7 | 11.3 | 6.0966 | ||||||||
| Garden | 1 | 5,600,000 | 0.5 | 58.3 | 58.3 | 1.76 | 11.0 | 10.2 | 5.6810 | ||||||||
| Industrial | 5 | 80,675,000 | 7.4 | 56.6 | 56.6 | 1.86 | 10.7 | 10.2 | 5.4116 | ||||||||
| Warehouse | 3 | 34,925,000 | 3.2 | 62.7 | 62.7 | 1.75 | 10.3 | 9.9 | 5.6045 | ||||||||
| Light Manufacturing | 1 | 33,000,000 | 3.0 | 55.4 | 55.4 | 1.84 | 10.7 | 10.1 | 5.3900 | ||||||||
| Flex | 1 | 12,750,000 | 1.2 | 42.6 | 42.6 | 2.23 | 11.9 | 11.2 | 4.9390 | ||||||||
| Self Storage | 20 | 59,794,505 | 5.5 | 52.9 | 51.4 | 1.89 | 11.4 | 11.2 | 5.5439 | ||||||||
| Self Storage | 20 | 59,794,505 | 5.5 | 52.9 | 51.4 | 1.89 | 11.4 | 11.2 | 5.5439 | ||||||||
| Total | 103 | $1,089,749,733 | 100.0 | % | 50.6 | % | 48.9 | % | 2.48x | 14.6 | % | 13.8 | % | 5.2506 | % | ||
| (1) | Because this table presents information relating to the mortgaged properties and not the mortgage loans, (a) the information for mortgage loans secured by more than one mortgaged property (other than through cross-collateralization with other mortgage loans) is based on allocated loan amounts (allocating the principal balance of the mortgage loan to each of those properties according to the relative appraised values of the mortgaged properties or the allocated loan amounts or property-specific release prices set forth in the related mortgage loan documents or such other allocation as the related mortgage loan seller deemed appropriate) and (b) the information for each mortgaged property that relates to a mortgage loan that is cross-collateralized or cross-defaulted with other mortgage loans is based upon the principal balance of that mortgage loan, except that the applicable loan-to-value ratio, debt service coverage ratio and debt yield for each such mortgage loan is based upon the ratio or yield (as applicable) for the aggregate indebtedness evidenced by all loans in the group (without regard to any limitation on the amount of indebtedness secured by any mortgaged property in such cross-collateralized group). On an individual basis, without regard to the cross-collateralization feature, any mortgage loan that is part of a cross-collateralized group of mortgage loans may have a higher loan-to-value ratio, lower debt service coverage ratio and/or lower debt yield than is presented herein. For mortgaged properties securing residential cooperative mortgage loans, the debt service coverage ratio and debt yield for each such mortgaged property is calculated using U/W Net Operating Income or U/W Net Cash Flow, as applicable, for the related residential cooperative property which is the projected net operating income or net cash flow, as applicable, reflected in the most recent appraisal obtained by or otherwise in the possession of the related mortgage loan seller as of the cut-off date and the loan-to-value ratio, is calculated based upon the appraised value of the residential cooperative property determined as if such residential cooperative property is operated as a residential cooperative, inclusive of the amount of the underlying debt encumbering such residential cooperative property. With respect to any mortgage loan that is part of a whole loan, the loan-to-value ratio, debt service coverage ratio and debt yield calculations include the related pari passu companion loan(s) but exclude any related subordinate companion loan(s) (unless otherwise stated). With respect to each mortgage loan, debt service coverage ratio, debt yield and loan-to-value ratio information do not take into account any subordinate debt (whether or not secured by the related mortgaged property) that currently exists or is allowed under the terms of such mortgage loan. See Annex A-1 to the Preliminary Prospectus. |
| THE INFORMATION IN THIS STRUCTURAL AND COLLATERAL TERM SHEET IS NOT COMPLETE AND MAY BE AMENDED PRIOR TO THE TIME OF SALE. THIS TERM SHEET IS NOT AN OFFER TO SELL THESE SECURITIES AND IT IS NOT A SOLICITATION OF AN OFFER TO BUY THESE SECURITIES IN ANY JURISDICTION WHERE THE OFFER OR SALE IS NOT PERMITTED. | ||
| ||
| BANK 2022-BNK43 | Characteristics of the Mortgage Pool |
G. Geographic Distribution(1)(2)

| Location | Number of Mortgaged Properties | Aggregate Cut-off Date Balance ($) | % of Cut-off Date Balance (%) | Weighted Average Cut-off Date LTV Ratio (%) | Weighted Average Balloon LTV Ratio (%) | Weighted Average U/W NCF DSCR (x) | Weighted Average U/W NOI Debt Yield (%) | Weighted Average U/W NCF Debt Yield (%) | Weighted Average Interest Rate (%) | ||||||||
| Arizona | 2 | $174,930,466 | 16.1 | % | 59.2 | % | 56.3 | % | 2.06 | x | 13.7 | % | 12.8 | % | 5.4424 | % | |
| Texas | 7 | 151,259,844 | 13.9 | 38.8 | 35.2 | 2.48 | 17.6 | 16.6 | 5.7627 | ||||||||
| New York | 22 | 149,913,297 | 13.8 | 40.9 | 39.2 | 3.47 | 20.4 | 19.8 | 4.9287 | ||||||||
| California | 8 | 134,168,707 | 12.3 | 53.0 | 51.5 | 2.13 | 13.0 | 12.2 | 5.3660 | ||||||||
| Southern California | 5 | 86,418,707 | 7.9 | 59.8 | 57.5 | 1.93 | 12.7 | 11.9 | 5.5505 | ||||||||
| Northern California | 3 | 47,750,000 | 4.4 | 40.7 | 40.7 | 2.50 | 13.7 | 12.8 | 5.0322 | ||||||||
| District of Columbia | 1 | 84,000,000 | 7.7 | 43.5 | 43.5 | 4.30 | 14.1 | 13.3 | 3.0494 | ||||||||
| New Jersey | 3 | 61,135,068 | 5.6 | 63.7 | 63.1 | 2.03 | 12.5 | 11.9 | 5.4752 | ||||||||
| Michigan | 6 | 55,788,250 | 5.1 | 59.9 | 59.9 | 1.72 | 11.2 | 10.4 | 5.9617 | ||||||||
| Other(3) | 54 | 278,554,100 | 25.6 | 52.9 | 51.9 | 2.10 | 12.5 | 11.6 | 5.4416 | ||||||||
| Total/Weighted Average | 103 | $1,089,749,733 | 100.0 | % | 50.6 | % | 48.9 | % | 2.48 | x | 14.6 | % | 13.8 | % | 5.2506 | % | |
| (1) | The mortgaged properties are located in 30 states and the District of Columbia. |
| (2) | Because this table presents information relating to the mortgaged properties and not the mortgage loans, (a) the information for mortgage loans secured by more than one mortgaged property (other than through cross-collateralization with other mortgage loans) is based on allocated loan amounts (allocating the principal balance of the mortgage loan to each of those properties according to the relative appraised values of the mortgaged properties or the allocated loan amounts or property-specific release prices set forth in the related mortgage loan documents or such other allocation as the related mortgage loan seller deemed appropriate) and (b) the information for each mortgaged property that relates to a mortgage loan that is cross-collateralized or cross-defaulted with other mortgage loans is based upon the principal balance of that mortgage loan, except that the applicable loan-to-value ratio, debt service coverage ratio and debt yield for each such mortgage loan is based upon the ratio or yield (as applicable) for the aggregate indebtedness evidenced by all loans in the group (without regard to any limitation on the amount of indebtedness secured by any mortgaged property in such cross-collateralized group). On an individual basis, without regard to the cross-collateralization feature, any mortgage loan that is part of a cross-collateralized group of mortgage loans may have a higher loan-to-value ratio, lower debt service coverage ratio and/or lower debt yield than is presented herein. For mortgaged properties securing residential cooperative mortgage loans, the debt service coverage ratio and debt yield for each such mortgaged property is calculated using U/W Net Operating Income or U/W Net Cash Flow, as applicable, for the related residential cooperative property, which is the projected net operating income or net cash flow, as applicable, reflected in the most recent appraisal obtained by or otherwise in the possession of the related mortgage loan seller as of the cut-off date, and the loan-to-value ratio, is calculated based upon the appraised value of the residential cooperative property determined as if such residential cooperative property is operated as a residential cooperative, inclusive of the amount of the underlying debt encumbering such residential cooperative property. With respect to any mortgage loan that is part of a whole loan, the loan-to-value ratio, debt service coverage ratio and debt yield calculations include the related pari passu companion loan(s) but exclude any related subordinate companion loan(s) (unless otherwise stated). With respect to each mortgage loan, debt service coverage ratio, debt yield and loan-to-value ratio information do not take into account any subordinate debt (whether or not secured by the related mortgaged property) that currently exists or is allowed under the terms of such mortgage loan. See Annex A-1 to the Preliminary Prospectus. |
| (3) | Includes 24 other states. |
| THE INFORMATION IN THIS STRUCTURAL AND COLLATERAL TERM SHEET IS NOT COMPLETE AND MAY BE AMENDED PRIOR TO THE TIME OF SALE. THIS TERM SHEET IS NOT AN OFFER TO SELL THESE SECURITIES AND IT IS NOT A SOLICITATION OF AN OFFER TO BUY THESE SECURITIES IN ANY JURISDICTION WHERE THE OFFER OR SALE IS NOT PERMITTED. | ||
| ||
| BANK 2022-BNK43 | Characteristics of the Mortgage Pool |
H. Characteristics of the Mortgage Pool(1)
| CUT-OFF DATE BALANCE | ||||
| Range of Cut-off Date Balances ($) | Number of Mortgage Loans | Aggregate Cut-off Date Balance ($) | Percent by Aggregate Cut-off Date Pool Balance (%) | |
| 997,606 - 1,000,000 | 3 | $2,997,606 | 0.3 | % |
| 1,000,001 - 2,000,000 | 3 | 5,147,626 | 0.5 | |
| 2,000,001 - 3,000,000 | 4 | 9,651,848 | 0.9 | |
| 3,000,001 - 4,000,000 | 5 | 17,972,146 | 1.6 | |
| 4,000,001 - 5,000,000 | 5 | 22,998,651 | 2.1 | |
| 5,000,001 - 6,000,000 | 7 | 40,115,385 | 3.7 | |
| 6,000,001 - 7,000,000 | 3 | 19,035,000 | 1.7 | |
| 7,000,001 - 8,000,000 | 7 | 52,607,133 | 4.8 | |
| 8,000,001 - 9,000,000 | 1 | 8,980,123 | 0.8 | |
| 9,000,001 - 10,000,000 | 1 | 10,000,000 | 0.9 | |
| 10,000,001 - 15,000,000 | 4 | 52,600,000 | 4.8 | |
| 15,000,001 - 20,000,000 | 2 | 31,400,000 | 2.9 | |
| 20,000,001 - 30,000,000 | 4 | 103,650,000 | 9.5 | |
| 30,000,001 - 50,000,000 | 6 | 251,200,000 | 23.1 | |
| 50,000,001 - 70,000,000 | 2 | 111,463,750 | 10.2 | |
| 70,000,001 - 80,000,000 | 1 | 74,930,466 | 6.9 | |
| 80,000,001 - 90,000,000 | 1 | 84,000,000 | 7.7 | |
| 90,000,001 - 100,000,000 | 2 | 191,000,000 | 17.5 | |
| Total: | 61 | $1,089,749,733 | 100.0 | % |
| Average: | $17,864,750 | |||
| UNDERWRITTEN NOI DEBT SERVICE COVERAGE RATIO | ||||
| Range of U/W NOI DSCRs (x) | Number of Mortgage Loans | Aggregate Cut-off Date Balance ($) | Percent by Aggregate Cut-off Date Pool Balance (%) | |
| 1.30 | 1 | $15,400,000 | 1.4 | % |
| 1.46 - 1.50 | 3 | 27,050,000 | 2.5 | |
| 1.51 - 1.60 | 3 | 16,725,000 | 1.5 | |
| 1.61 - 1.70 | 8 | 246,010,000 | 22.6 | |
| 1.71 - 1.80 | 1 | 3,100,000 | 0.3 | |
| 1.81 - 1.90 | 5 | 72,108,444 | 6.6 | |
| 1.91 - 2.00 | 7 | 185,773,750 | 17.0 | |
| 2.01 - 2.25 | 2 | 13,981,633 | 1.3 | |
| 2.26 - 2.50 | 7 | 95,183,830 | 8.7 | |
| 2.51 - 3.00 | 4 | 138,267,839 | 12.7 | |
| 3.01 - 3.50 | 3 | 108,600,000 | 10.0 | |
| 3.51 - 4.00 | 1 | 1,999,064 | 0.2 | |
| 4.01 - 6.00 | 7 | 143,278,792 | 13.1 | |
| 6.01 - 8.00 | 3 | 9,533,630 | 0.9 | |
| 8.01 - 10.00 | 3 | 7,240,146 | 0.7 | |
| 10.01 - 20.00 | 2 | 4,497,606 | 0.4 | |
| 20.01 - 28.91 | 1 | 1,000,000 | 0.1 | |
| Total: | 61 | $1,089,749,733 | 100.0% | |
| Weighted Average: | 2.64x | |||
| UNDERWRITTEN NOI DEBT YIELD | ||||
| Range of U/W NOI Debt Yields (%) | Number of Mortgage Loans | Aggregate Cut-off Date Balance ($) | Percent by Aggregate Cut-off Date Pool Balance (%) | |
| 8.1 - 9.0 | 5 | $151,025,000 | 13.9 | % |
| 9.1 - 10.0 | 8 | 110,015,500 | 10.1 | |
| 10.1 - 11.0 | 11 | 231,083,750 | 21.2 | |
| 11.1 - 12.0 | 4 | 116,950,000 | 10.7 | |
| 12.1 - 13.0 | 1 | 5,000,000 | 0.5 | |
| 13.1 - 14.0 | 1 | 7,981,633 | 0.7 | |
| 14.1 - 15.0 | 4 | 135,850,000 | 12.5 | |
| 15.1 - 16.0 | 3 | 22,273,067 | 2.0 | |
| 16.1 - 17.0 | 3 | 45,450,000 | 4.2 | |
| 17.1 - 18.0 | 2 | 9,153,707 | 0.8 | |
| 18.1 - 19.0 | 1 | 5,487,372 | 0.5 | |
| 19.1 - 20.0 | 1 | 44,000,000 | 4.0 | |
| 20.1 - 135.7 | 17 | 205,479,704 | 18.9 | |
| Total: | 61 | $1,089,749,733 | 100.0 | % |
| Weighted Average: | 14.6% | |||
LOAN PURPOSE | ||||
| Loan Purpose | Number of Mortgage Loans | Aggregate Cut-off Date Balance ($) | Percent by Aggregate Cut-off Date Pool Balance (%) | |
| Refinance | 52 | $835,175,983 | 76.6 | % |
| Acquisition | 8 | 229,573,750 | 21.1 | |
| Recapitalization | 1 | 25,000,000 | 2.3 | |
| Total: | 61 | $1,089,749,733 | 100.0 | % |
| MORTGAGE RATE | ||||
| Range of Mortgage Rates (%) | Number of Mortgage Loans | Aggregate Cut-off Date Balance ($) | Percent by Aggregate Cut-off Date Pool Balance (%) | |
| 3.0494 | 1 | $84,000,000 | 7.7 | % |
| 4.5500 - 4.7500 | 7 | 110,950,614 | 10.2 | |
| 4.7501 - 5.0000 | 9 | 65,012,511 | 6.0 | |
| 5.0001 - 5.2500 | 4 | 41,979,187 | 3.9 | |
| 5.2501 - 5.5000 | 16 | 309,639,011 | 28.4 | |
| 5.5001 - 5.7500 | 11 | 230,005,466 | 21.1 | |
| 5.7501 - 6.0000 | 4 | 132,800,000 | 12.2 | |
| 6.0001 - 6.2500 | 6 | 95,870,000 | 8.8 | |
| 6.2501 - 6.4110 | 3 | 19,492,944 | 1.8 | |
| Total: | 61 | $1,089,749,733 | 100.0 | % |
| Weighted Average: | 5.2506% | |||
| UNDERWRITTEN NCF DEBT SERVICE COVERAGE RATIO | ||||
| Range of U/W NCF DSCRs (x) | Number of Mortgage Loans | Aggregate Cut-off Date Balance ($) | Percent by Aggregate Cut-off Date Pool Balance (%) | |
| 1.28 | 1 | $15,400,000 | 1.4 | % |
| 1.43 - 1.50 | 3 | 27,050,000 | 2.5 | |
| 1.51 - 1.60 | 7 | 96,175,000 | 8.8 | |
| 1.61 - 1.70 | 6 | 175,652,944 | 16.1 | |
| 1.71 - 1.80 | 3 | 111,263,750 | 10.2 | |
| 1.81 - 1.90 | 8 | 140,625,500 | 12.9 | |
| 1.91 - 2.00 | 1 | 6,000,000 | 0.6 | |
| 2.01 - 2.25 | 5 | 81,885,339 | 7.5 | |
| 2.26 - 2.50 | 3 | 21,280,123 | 2.0 | |
| 2.51 - 2.75 | 3 | 132,780,466 | 12.2 | |
| 2.76 - 3.00 | 3 | 110,487,372 | 10.1 | |
| 3.01 - 3.50 | 1 | 3,600,000 | 0.3 | |
| 3.51 - 4.00 | 2 | 45,999,064 | 4.2 | |
| 4.01 - 6.00 | 6 | 99,278,792 | 9.1 | |
| 6.01 - 8.00 | 4 | 11,783,630 | 1.1 | |
| 8.01 - 10.00 | 2 | 4,990,146 | 0.5 | |
| 10.01 - 18.52 | 2 | 4,497,606 | 0.4 | |
| 28.76 | 1 | 1,000,000 | 0.1 | |
| Total: | 61 | $1,089,749,733 | 100.0 | % |
| Weighted Average: | 2.48x | |||
| UNDERWRITTEN NCF DEBT YIELD | ||||
| Range of U/W NCF Debt Yields (%) | Number of Mortgage Loans | Aggregate Cut-off Date Balance ($) | Percent by Aggregate Cut-off Date Pool Balance (%) | |
| 8.0 - 9.0 | 7 | $215,025,000 | 19.7 | % |
| 9.1 - 10.0 | 10 | 124,889,250 | 11.5 | |
| 10.1 - 11.0 | 10 | 256,410,000 | 23.5 | |
| 11.1 - 12.0 | 1 | 12,750,000 | 1.2 | |
| 12.1 - 13.0 | 1 | 5,000,000 | 0.5 | |
| 13.1 - 14.0 | 6 | 149,824,577 | 13.7 | |
| 14.1 - 15.0 | 1 | 4,293,707 | 0.4 | |
| 15.1 - 16.0 | 5 | 62,990,123 | 5.8 | |
| 16.1 - 17.0 | 1 | 3,600,000 | 0.3 | |
| 17.1 - 18.0 | 1 | 44,000,000 | 4.0 | |
| 18.1 - 19.0 | 2 | 80,417,839 | 7.4 | |
| 19.1 - 135.0 | 16 | 130,549,238 | 12.0 | |
| Total: | 61 | $1,089,749,733 | 100.0 | % |
| Weighted Average: | 13.8% | |||
| (1) | The information for each mortgaged property that relates to a mortgage loan that is cross-collateralized or cross-defaulted with one or more other mortgage loans is based upon the principal balance of that mortgage loan, except that the applicable loan-to-value ratio, debt service coverage ratio, and debt yield for each such mortgage loan is based upon the ratio or yield (as applicable) for the aggregate indebtedness evidenced by all loans in the group (without regard to any limitation on the amount of indebtedness secured by any mortgaged property in such cross-collateralized group). For mortgaged properties securing residential cooperative mortgage loans, the debt service coverage ratio and debt yield for each such mortgaged property is calculated using U/W Net Operating Income or U/W Net Cash Flow, as applicable, for the related residential cooperative property, which is the projected net operating income or net cash flow, as applicable, reflected in the most recent appraisal obtained by or otherwise in the possession of the related mortgage loan seller as of the cut-off date, and the loan-to-value ratio is calculated based upon the appraised value of the residential cooperative property determined as if such residential cooperative property is operated as a residential cooperative, inclusive of the amount of the underlying debt encumbering such residential cooperative. With respect to any mortgage loan that is part of a whole loan, the loan-to-value ratio, debt service coverage ratio and debt yield calculations include the related pari passu companion loan(s) but exclude any related subordinate companion loan(s) (unless otherwise stated). With respect to each mortgage loan, debt service coverage ratio, debt yield and loan-to-value ratio information do not take into account any subordinate debt (whether or not secured by the related mortgaged property), that currently exists or is allowed under the terms of such mortgage loan. See Annex A-1 to the Preliminary Prospectus. Prepayment provisions for each mortgage loan reflects the entire life of the loan (from origination to maturity). |
| THE INFORMATION IN THIS STRUCTURAL AND COLLATERAL TERM SHEET IS NOT COMPLETE AND MAY BE AMENDED PRIOR TO THE TIME OF SALE. THIS TERM SHEET IS NOT AN OFFER TO SELL THESE SECURITIES AND IT IS NOT A SOLICITATION OF AN OFFER TO BUY THESE SECURITIES IN ANY JURISDICTION WHERE THE OFFER OR SALE IS NOT PERMITTED. | ||
| ||
| BANK 2022-BNK43 | Characteristics of the Mortgage Pool |
ORIGINAL TERM TO MATURITY | ||||
| Original Terms to Maturity (months) | Number of Mortgage Loans | Aggregate Cut- off Date Balance | Percent by Aggregate Cut-off Date Pool Balance (%) | |
| 60 | 2 | $47,000,000 | 4.3 | % |
| 84 | 1 | 4,293,707 | 0.4 | |
| 120 | 58 | 1,038,456,026 | 95.3 | |
| Total: | 61 | $1,089,749,733 | 100.0 | % |
| Weighted Average: | 117 months | |||
| REMAINING TERM TO MATURITY | ||||
| Range of Remaining Terms to Maturity (months) | Number of Mortgage Loans | Aggregate Cut- off Date Balance | Percent by Aggregate Cut-off Date Pool Balance (%) | |
| 57 - 60 | 2 | $47,000,000 | 4.3 | % |
| 83 | 1 | 4,293,707 | 0.4 | |
| 115 - 120 | 58 | 1,038,456,026 | 95.3 | |
| Total: | 61 | $1,089,749,733 | 100.0 | % |
| Weighted Average: | 116 months | |||
| ORIGINAL AMORTIZATION TERM(1) | ||||
| Original Amortization Terms (months) | Number of Mortgage Loans | Aggregate Cut- off Date Balance | Percent by Aggregate Cut-off Date Pool Balance (%) | |
| Non-Amortizing | 35 | $767,824,250 | 70.5 | % |
| 300 | 2 | 10,286,651 | 0.9 | |
| 360 | 21 | 305,615,714 | 28.0 | |
| 480 | 3 | 6,023,118 | 0.6 | |
| Total: | 61 | $1,089,749,733 | 100.0 | % |
| Weighted Average(3): | 360 months | |||
| REMAINING AMORTIZATION TERM(2) | ||||
| Range of Remaining Amortization Terms (months) | Number of Mortgage Loans | Aggregate Cut- off Date Balance | Percent by Aggregate Cut-off Date Pool Balance (%) | |
| Non-Amortizing | 35 | $767,824,250 | 70.5 | % |
| 299 | 2 | 10,286,651 | 0.9 | |
| 358 - 360 | 21 | 305,615,714 | 28.0 | |
| 479 - 480 | 3 | 6,023,118 | 0.6 | |
| Total: | 61 | $1,089,749,733 | 100.0 | % |
| Weighted Average(3): | 360 months | |||
| LOCKBOXES | ||||
| Type of Lockbox | Number of Mortgage Loans | Aggregate Cut- off Date Balance | Percent by Aggregate Cut-off Date Pool Balance (%) | |
| Hard/ Springing Cash Management | 11 | $407,082,457 | 37.4 | % |
| Hard/ In Place Cash Management | 7 | 302,330,466 | 27.7 | |
| Springing | 24 | 243,187,572 | 22.3 | |
| Soft/ Springing Cash Management | 3 | 94,000,000 | 8.6 | |
| None | 16 | 43,149,238 | 4.0 | |
| Total: | 61 | $1,089,749,733 | 100.0 | % |
| PREPAYMENT PROVISION SUMMARY | ||||
| Prepayment Provision | Number of Mortgage Loans | Aggregate Cut- off Date Balance | Percent by Aggregate Cut-off Date Pool Balance (%) | |
| Lockout / Defeasance / Open | 36 | $819,915,495 | 75.2 | % |
| Lockout / GRTR 1% or YM / GRTR 1% or YM or Defeasance / Open | 1 | 84,000,000 | 7.7 | |
| Lockout / GRTR 1% or YM or Defeasance / Open | 3 | 64,660,000 | 5.9 | |
| Lockout / GRTR 1% or YM / Open | 5 | 51,010,068 | 4.7 | |
| GRTR 1% or YM / 1% / Open | 15 | 37,164,170 | 3.4 | |
| GRTR 1% or YM / GRTR 1% or YM or Defeasance / Open | 1 | 33,000,000 | 3.0 | |
| Total: | 61 | $1,089,749,733 | 100.0 | % |
CUT-OFF DATE LOAN-TO-VALUE RATIO | ||||
| Range of Cut-off Date LTV Ratios (%) | Number of Mortgage Loans | Aggregate Cut- off Date Balance | Percent by Aggregate Cut-off Date Pool Balance (%) | |
| 1.9 - 20.0 | 14 | $36,854,294 | 3.4 | % |
| 20.1 - 25.0 | 1 | 1,800,000 | 0.2 | |
| 25.1 - 30.0 | 2 | 11,794,944 | 1.1 | |
| 30.1 - 35.0 | 2 | 96,487,372 | 8.9 | |
| 35.1 - 40.0 | 3 | 78,293,707 | 7.2 | |
| 40.1 - 45.0 | 8 | 251,642,222 | 23.1 | |
| 45.1 - 50.0 | 2 | 16,000,000 | 1.5 | |
| 50.1 - 55.0 | 6 | 143,123,750 | 13.1 | |
| 55.1 - 60.0 | 8 | 103,495,000 | 9.5 | |
| 60.1 - 65.0 | 8 | 126,608,444 | 11.6 | |
| 65.1 - 70.0 | 6 | 123,650,000 | 11.3 | |
| 70.1 - 71.5 | 1 | 100,000,000 | 9.2 | |
| Total: | 61 | $1,089,749,733 | 100.0 | % |
| Weighted Average: | 50.6% | |||
| BALLOON LOAN-TO-VALUE RATIO | ||||
| Range of Balloon LTV Ratios (%) | Number of Mortgage Loans | Aggregate Cut- off Date Balance | Percent by Aggregate Cut-off Date Pool Balance (%) | |
| 1.9 - 20.0 | 15 | $38,654,294 | 3.5 | % |
| 20.1 - 25.0 | 2 | 11,794,944 | 1.1 | |
| 25.1 - 30.0 | 2 | 96,487,372 | 8.9 | |
| 30.1 - 35.0 | 1 | 4,293,707 | 0.4 | |
| 35.1 - 40.0 | 5 | 165,892,222 | 15.2 | |
| 40.1 - 45.0 | 6 | 169,750,000 | 15.6 | |
| 45.1 - 50.0 | 3 | 23,842,944 | 2.2 | |
| 50.1 - 55.0 | 5 | 131,273,750 | 12.0 | |
| 55.1 - 60.0 | 9 | 119,495,000 | 11.0 | |
| 60.1 - 65.0 | 9 | 159,765,500 | 14.7 | |
| 65.1 - 70.0 | 3 | 68,500,000 | 6.3 | |
| 70.1 - 71.5 | 1 | 100,000,000 | 9.2 | |
| Total: | 61 | $1,089,749,733 | 100.0 | % |
| Weighted Average: | 48.9% | |||
| AMORTIZATION TYPE | ||||
| Amortization Type | Number of Mortgage Loans | Aggregate Cut- off Date Balance | Percent by Aggregate Cut-off Date Pool Balance (%) | |
| Interest Only | 35 | $767,824,250 | 70.5 | % |
| Amortizing Balloon | 21 | 256,065,483 | 23.5 | |
| Interest Only, Amortizing Balloon | 5 | 65,860,000 | 6.0 | |
| Total: | 61 | $1,089,749,733 | 100.0 | % |
| ORIGINAL TERM OF INTEREST-ONLY PERIOD FOR PARTIAL IO LOANS | ||||
IO Terms (months) | Number of Mortgage Loans | Aggregate Cut- off Date Balance | Percent by Aggregate Cut-off Date Pool Balance (%) | |
| 48 | 1 | $4,860,000 | 0.4 | % |
| 60 | 4 | 61,000,000 | 5.6 | |
| Total: | 5 | $65,860,000 | 6.0 | % |
| Weighted Average: | 59 months | |||
| SEASONING | ||||
| Seasoning (months) | Number of Mortgage Loans | Aggregate Cut- off Date Balance | Percent by Aggregate Cut-off Date Pool Balance (%) | |
| 0 | 18 | $296,097,500 | 27.2 | % |
| 1 | 20 | 394,917,491 | 36.2 | |
| 2 | 15 | 167,799,742 | 15.4 | |
| 3 | 7 | 146,935,000 | 13.5 | |
| 5 | 1 | 84,000,000 | 7.7 | |
| Total: | 61 | $1,089,749,733 | 100.0 | % |
| Weighted Average: | 1 month | |||
| (1) | The original amortization term shown for any mortgage loan that is interest only for part of its term does not include the number of months in its interest only period and reflects only the number of months as of the commencement of amortization remaining from the end of such interest-only period. |
| (2) | The remaining amortization term shown for any mortgage loan that is interest only for part of its term does not include the number of months in its interest only period and reflects only the number of months as of the commencement of amortization remaining from the end of such interest-only period. |
| (3) | Excludes the non-amortizing mortgage loans. |
| THE INFORMATION IN THIS STRUCTURAL AND COLLATERAL TERM SHEET IS NOT COMPLETE AND MAY BE AMENDED PRIOR TO THE TIME OF SALE. THIS TERM SHEET IS NOT AN OFFER TO SELL THESE SECURITIES AND IT IS NOT A SOLICITATION OF AN OFFER TO BUY THESE SECURITIES IN ANY JURISDICTION WHERE THE OFFER OR SALE IS NOT PERMITTED. | ||
| ||
| BANK 2022-BNK43 | Certain Terms and Conditions |
V. Certain Terms and Conditions
| Allocation Between the RR Interest and the Non-Retained Certificates: | Amounts available for distributions to the holders of the Certificates (including the RR Interest) will be allocated between amounts available for distribution to the holders of the RR Interest, on the one hand, and to all other Certificates, referred to herein as the “Non-Retained Certificates”, on the other hand. The portion of such amount allocable to (a) the RR Interest will at all times be the product of such amount multiplied by 5% and (b) the Non-Retained Certificates will at all times be the product of such amount multiplied by 95% (each, the respective “Percentage Allocation Entitlement”). |
| Interest Entitlements: | The interest entitlement of each Class of Non-Retained Certificates (other than the Class R Certificates) or trust component on each Distribution Date generally will be the interest accrued during the related Interest Accrual Period on the related Certificate Balance or Notional Amount at the related pass-through rate, net of any prepayment interest shortfalls allocated to that Class or trust component for such Distribution Date as described below. If prepayment interest shortfalls arise from voluntary prepayments (without the applicable Master Servicer consent) on particular non-specially serviced loans during any collection period, the applicable Master Servicer is required to make a compensating interest payment to offset those shortfalls, generally up to an amount equal to the portion of its master servicing fees that accrue at 0.25 basis points per annum. The remaining amount of prepayment interest shortfalls will be allocated between the RR Interest, on one hand, and the Non-Retained Certificates (other than the Class R Certificates) on the other hand, in accordance with their respective Percentage Allocation Entitlements. The prepayment interest shortfalls allocated to the Non-Retained Certificates (other than the Class R Certificates) will be allocated among such Classes of Certificates (other than the Exchangeable Certificates) and trust components that are entitled to interest, on a pro rata basis, based on their respective amounts of accrued interest for the related Distribution Date, to reduce the interest entitlement on each such Class of Certificates. For any distribution date, prepayment interest shortfalls allocated to a trust component will be allocated among the related Classes of Exchangeable Certificates, pro rata, in accordance with their Class Percentage Interests. If a Class or trust component receives less than the entirety of its interest entitlement on any Distribution Date, then the shortfall (excluding any shortfall due to prepayment interest shortfalls), together with interest thereon, will be added to its interest entitlement for the next succeeding Distribution Date. |
| Aggregate Principal Distribution Amount: | The Aggregate Principal Distribution Amount for each Distribution Date generally will be the aggregate amount of principal received or advanced in respect of the mortgage loans, net of any non-recoverable advances and interest thereon and workout-delayed reimbursement amounts that are reimbursed to the applicable Master Servicer, the Special Servicer or the Trustee during the related collection period. Non-recoverable advances and interest thereon are reimbursable from principal collections and advances before reimbursement from other amounts. Workout-delayed reimbursement amounts are reimbursable from principal collections. The Non-Retained Certificates will be entitled to the portion of the Aggregate Principal Distribution Amount equal to their Percentage Allocation Entitlement, which is referred to herein as the “Principal Distribution Amount”. |
| Subordination, Allocation of Losses and Certain Expenses: | The chart below describes the manner in which the payment rights of certain Classes of Non-Retained Certificates will be senior or subordinate, as the case may be, to the payment rights of other Classes of Non-Retained Certificates. The chart also shows the allocation between the RR Interest and the Non-Retained Certificates and the corresponding entitlement to receive principal and/or interest of certain Classes of Non-Retained Certificates on any distribution date in descending order. It also shows the manner in which losses are allocated between the RR Interest and the Non-Retained Certificates and the manner in which the Non-Retained Certificate allocations are further allocated to certain Classes of those Certificates in ascending order (beginning with the Non-Offered Certificates, other than the Class X-D and R Certificates and the RR Interest) to reduce the balance of each such Class to zero; provided that no principal payments or mortgage loan losses will be allocated to the Class X-A, X-B, X-D or R Certificates or any class of Exchangeable Certificates with an “X” suffix, although principal payments and losses may reduce the Notional Amounts of the Class X-A, X-B and X-D Certificates and any class of Exchangeable Certificates with an “X” suffix, and, therefore, the amount of interest they accrue. |
| THE INFORMATION IN THIS STRUCTURAL AND COLLATERAL TERM SHEET IS NOT COMPLETE AND MAY BE AMENDED PRIOR TO THE TIME OF SALE. THIS TERM SHEET IS NOT AN OFFER TO SELL THESE SECURITIES AND IT IS NOT A SOLICITATION OF AN OFFER TO BUY THESE SECURITIES IN ANY JURISDICTION WHERE THE OFFER OR SALE IS NOT PERMITTED. | ||
| ||
| BANK 2022-BNK43 | Certain Terms and Conditions |
![[GRAPHIC]](https://capedge.com/proxy/FWP/0001539497-22-001328/n3204tsimg006.jpg) |
| (1) | The maximum certificate balances of the Class A-4, A-5, A-S, B and C certificates (subject to the constraint on the aggregate initial certificate balance of the Class A-4 and A-5 trust components discussed in footnote (9) to the table under “Certificate Structure”) will be issued on the closing date, and the certificate balance or notional amount of each other class of Exchangeable Certificates will be equal to zero on the closing date. The relative priorities of the Exchangeable Certificates are described more fully under “Exchangeable Certificates.” | |
| (2) | The Class X-A, X-B and X-D Certificates are interest-only certificates. | |
| (3) | The Class X-D Certificates and the RR Interest are Non-Offered Certificates. | |
| (4) | Other than the Class X-D and R Certificates and the RR Interest. |
| Distributions: | On each Distribution Date, funds available for distribution from the mortgage loans, net of specified trust fees, expenses and reimbursements that are allocable to the Non-Retained Certificates will generally be distributed in the following amounts and order of priority (in each case to the extent of remaining available funds): |
| 1. Class A-1, A-2, A-3, A-SB, A-4, A-5, X-A, X-B and X-D Certificates: To interest on the Class A-1, A-2, A-3, A-SB, X-A, X-B and X-D Certificates and the Class A-4, A-4-X1, A-4-X2, A-5, A-5-X1 and A-5-X2 trust components, pro rata, according to their respective interest entitlements. | |
| 2. Class A-1, A-2, A-3 and A-SB Certificates and the Class A-4 and A-5 trust components: To principal on the Class A-1, A-2, A-3 and A-SB Certificates and the Class A-4 and A-5 trust components in the following amounts and order of priority: (i) first, to principal on the Class A-SB Certificates, in an amount up to the Principal Distribution Amount for such Distribution Date until their Certificate Balance is reduced to the Class A-SB Planned Principal Balance for such Distribution Date; (ii) second, to principal on the Class A-1 Certificates until their Certificate Balance is reduced to zero, up to the remainder of the Principal Distribution Amount for such Distribution Date; (iii) third, to principal on the Class A-2 Certificates until their Certificate Balance is reduced to zero, up to the remainder of the Principal Distribution Amount for such Distribution Date; (iv) fourth, to principal on the Class A-3 Certificates until their Certificate Balance is reduced to zero, up to the remainder of the Principal Distribution Amount for such Distribution Date; (v) fifth, to principal on the Class A-4 trust component, until its Certificate Balance is reduced to zero, up to the remainder of the Principal Distribution Amount for such Distribution Date; (vi) sixth, to principal on the Class A-5 trust component, until its Certificate Balance is reduced to zero, up to the remainder of the Principal Distribution Amount for such Distribution Date; and (vii) seventh, to principal on the Class A-SB Certificates until their Certificate Balance is reduced to zero, up to the remainder of the Principal Distribution Amount for such Distribution Date. However, if the Certificate |
| THE INFORMATION IN THIS STRUCTURAL AND COLLATERAL TERM SHEET IS NOT COMPLETE AND MAY BE AMENDED PRIOR TO THE TIME OF SALE. THIS TERM SHEET IS NOT AN OFFER TO SELL THESE SECURITIES AND IT IS NOT A SOLICITATION OF AN OFFER TO BUY THESE SECURITIES IN ANY JURISDICTION WHERE THE OFFER OR SALE IS NOT PERMITTED. | ||
| ||
| BANK 2022-BNK43 | Certain Terms and Conditions |
| Balance of each and every Class of Principal Balance Certificates, other than the Class A-1, A-2, A-3 and A-SB Certificates and the Class A-4 and A-5 trust components and the RR Interest, has been reduced to zero as a result of the allocation of Mortgage Loan losses and expenses and any of the Class A-1, A-2, A-3 and A-SB Certificates and the Class A-4 and A-5 trust components remains outstanding, then the Principal Distribution Amount will be distributed to the Class A-1, A-2, A-3 and A-SB Certificates and the Class A-4 and A-5 trust components, pro rata, based on their respective outstanding Certificate Balances, until their Certificate Balances have been reduced to zero. | |
| 3. Class A-1, A-2, A-3 and A-SB Certificates and the Class A-4 and A-5 trust components: To reimburse the holders of the Class A-1, A-2, A-3 and A-SB Certificates and the Class A-4 and A-5 trust components, pro rata, on the basis of previously allocated unreimbursed losses, for any previously unreimbursed losses (plus interest thereon) on the mortgage loans that were previously allocated in reduction of the Certificate Balances of such Classes or trust components. | |
4. Class A-S, A-S-X1 and A-S-X2 trust components: To make distributions on the Class A-S, A-S-X1 and A-S-X2 trust components as follows: (a) first, to interest on the Class A-S, A-S-X1 and A-S-X2 trust components, pro rata, according to their respective interest entitlements; (b) next, to the extent of the portion of the Principal Distribution Amount remaining after distributions in respect of principal to each Class with a higher distribution priority (in this case, the Class A-1, A-2, A-3 and A-SB Certificates and the Class A-4 and A-5 trust components), to principal on the Class A-S trust component until its Certificate Balance is reduced to zero; and (c) next, to reimburse the holders of the Class A-S trust component for any previously unreimbursed losses (plus interest thereon) on the mortgage loans that were previously allocated to that trust component in reduction of their Certificate Balance. 5. Class B, B-X1 and B-X2 trust components: To make distributions on the Class B, B-X1 and B-X2 trust components as follows: (a) first, to interest on the Class B, B-X1 and B-X2 trust components, pro rata, according to their respective interest entitlements; (b) next, to the extent of the portion of the Principal Distribution Amount remaining after distributions in respect of principal to each Class with a higher distribution priority (in this case, the Class A-1, A-2, A-3 and A-SB Certificates and the Class A-4, A-5 and A-S trust components), to principal on the Class B trust component until its Certificate Balance is reduced to zero; and (c) next, to reimburse the holders of the Class B trust component for any previously unreimbursed losses (plus interest thereon) on the mortgage loans that were previously allocated to that trust component in reduction of their Certificate Balance. 6. Class C, C-X1 and C-X2 trust components: To make distributions on the Class C, C-X1 and C-X2 trust components as follows: (a) first, to interest on the Class C, C-X1 and C-X2 trust components, pro rata, according to their respective interest entitlements; (b) next, to the extent of the portion of the Principal Distribution Amount remaining after distributions in respect of principal to each Class with a higher distribution priority (in this case, the Class A-1, A-2, A-3 and A-SB Certificates and the Class A-4, A-5, A-S and B trust components), to principal on the Class C trust component until its Certificate Balance is reduced to zero; and (c) next, to reimburse the holders of the Class C trust component for any previously unreimbursed losses (plus interest thereon) on the mortgage loans that were previously allocated to that trust component in reduction of their Certificate Balance. 7. Class D Certificates: To make distributions on the Class D Certificates as follows: (a) first, to interest on the Class D Certificates in the amount of the interest entitlement for that Class; (b) next, to the extent of the portion of the Principal Distribution Amount remaining after distributions in respect of principal to each Class with a higher distribution priority (in this case, the Class A-1, A-2, A-3 and A-SB Certificates and the Class A-4, A-5, A-S, B and C trust components), to principal on the Class D Certificates until their Certificate Balance is reduced to zero; and (c) next, to reimburse the holders of the Class D Certificates for any previously unreimbursed losses (plus interest thereon) on the mortgage loans that were previously allocated to that Class in reduction of their Certificate Balance. 8. After the Class A-1, A-2, A-3, A-SB and D Certificates and the Class A-4, A-5, A-S, B and C trust components are paid all amounts to which they are entitled, the remaining funds available for distribution will be used to pay interest, principal and loss reimbursement amounts on the Class E, F, G and H Certificates sequentially in that order in a manner analogous to the Class D Certificates. |
| THE INFORMATION IN THIS STRUCTURAL AND COLLATERAL TERM SHEET IS NOT COMPLETE AND MAY BE AMENDED PRIOR TO THE TIME OF SALE. THIS TERM SHEET IS NOT AN OFFER TO SELL THESE SECURITIES AND IT IS NOT A SOLICITATION OF AN OFFER TO BUY THESE SECURITIES IN ANY JURISDICTION WHERE THE OFFER OR SALE IS NOT PERMITTED. | ||
| ||
| BANK 2022-BNK43 | Certain Terms and Conditions |
| Principal and interest payable on the Class A-4, A-4-X1, A-4-X2, A-5, A-5-X1, A-5-X2, A-S, A-S-X1, A-S-X2, B, B-X1, B-X2, C, C-X1 and C-X2 trust components will be distributed pro rata to the corresponding classes of Exchangeable Certificates representing interests therein in accordance with their Class Percentage Interests therein as described below under “Exchangeable Certificates.” | |
| Exchangeable Certificates: | Each class of Exchangeable Certificates may be exchanged for the corresponding classes of Exchangeable Certificates set forth next to such class in the table below, and vice versa. Following any exchange of one or more classes of Exchangeable Certificates (the applicable “Surrendered Classes”) for one or more classes of other Exchangeable Certificates (the applicable “Received Classes”), the Class Percentage Interests (as defined below) of the outstanding certificate balances or Notional Amounts of the Corresponding Trust Components that are represented by the Surrendered Classes (and consequently their related certificate balances or notional amounts) will be decreased, and those of the Received Classes (and consequently their related certificate balances or notional amounts) will be increased. The dollar denomination of each of the Received Classes of certificates must be equal to the dollar denomination of each of the Surrendered Classes of certificates. No fee will be required with respect to any exchange of Exchangeable Certificates. |
| Surrendered Classes (or Received Classes) of Certificates | Received Classes (or Surrendered Classes) of Certificates | ||
| Class A-4 | Class A-4-1, Class A-4-X1 | ||
| Class A-4 | Class A-4-2, Class A-4-X2 | ||
| Class A-5 | Class A-5-1, Class A-5-X1 | ||
| Class A-5 | Class A-5-2, Class A-5-X2 | ||
| Class A-S | Class A-S-1, Class A-S-X1 | ||
| Class A-S | Class A-S-2, Class A-S-X2 | ||
| Class B | Class B-1, Class B-X1 | ||
| Class B | Class B-2, Class B-X2 | ||
| Class C | Class C-1, Class C-X1 | ||
| Class C | Class C-2, Class C-X2 |
| On the closing date, the issuing entity will issue the following “trust components,” each with the initial certificate balance (or, if such trust component has an “X” suffix, notional amount) and pass-through rate set forth next to it in the table below. Each trust component with an “X” suffix will not be entitled to distributions of principal. |
| Trust Component | Initial Certificate Balance or Notional Amount | Pass-Through Rate | |||
| Class A-4 | See footnote (9) to the table under “Certificate Structure” | Class A-4 Certificate Pass- Through Rate minus 1.00% | |||
| Class A-4-X1 | Equal to Class A-4 Trust Component Certificate Balance | 0.50% | |||
| Class A-4-X2 | Equal to Class A-4 Trust Component Certificate Balance | 0.50% | |||
| Class A-5 | See footnote (9) to the table under “Certificate Structure” | Class A-5 Certificate Pass- Through Rate minus 1.00% | |||
| Class A-5-X1 | Equal to Class A-5 Trust Component Certificate Balance | 0.50% | |||
| Class A-5-X2 | Equal to Class A-5 Trust Component Certificate Balance | 0.50% |
| THE INFORMATION IN THIS STRUCTURAL AND COLLATERAL TERM SHEET IS NOT COMPLETE AND MAY BE AMENDED PRIOR TO THE TIME OF SALE. THIS TERM SHEET IS NOT AN OFFER TO SELL THESE SECURITIES AND IT IS NOT A SOLICITATION OF AN OFFER TO BUY THESE SECURITIES IN ANY JURISDICTION WHERE THE OFFER OR SALE IS NOT PERMITTED. | ||
| ||
| BANK 2022-BNK43 | Certain Terms and Conditions |
| Trust Component | Initial Certificate Balance or Notional Amount | Pass-Through Rate | |||
| Class A-S | $ 100,938,000 | Class A-S Certificate Pass- Through Rate minus 1.00% | |||
| Class A-S-X1 | Equal to Class A-S Trust Component Certificate Balance | 0.50% | |||
| Class A-S-X2 | Equal to Class A-S Trust Component Certificate Balance | 0.50% | |||
| Class B | $ 50,469,000 | Class B Certificate Pass- Through Rate minus 1.00% | |||
| Class B-X1 | Equal to Class B Trust Component Certificate Balance | 0.50% | |||
| Class B-X2 | Equal to Class B Trust Component Certificate Balance | 0.50% | |||
| Class C | $ 43,999,000 | Class C Certificate Pass- Through Rate minus 1.00% | |||
| Class C-X1 | Equal to Class C Trust Component Certificate Balance | 0.50% | |||
| Class C-X2 | Equal to Class C Trust Component Certificate Balance | 0.50% |
| Each class of Exchangeable Certificates represents an undivided beneficial ownership interest in the trust components set forth next to it in the table below (the “Corresponding Trust Components”). Each class of Exchangeable Certificates has a pass-through rate equal to the sum of the pass-through rates of the Corresponding Trust Components and represents a percentage interest (the related “Class Percentage Interest”) in each Corresponding Trust Component, including principal and interest payable thereon, equal to (x) the certificate balance (or, if such class has an “X” suffix, notional amount) of such class of certificates, divided by (y) the certificate balance of the Class A-4 trust component (if such class of Exchangeable Certificates has an “A-4” designation), the Class A-5 trust component (if such class of Exchangeable Certificates has an “A-5” designation), the Class A-S trust component (if such class of Exchangeable Certificates has an “A-S” designation), the Class B trust component (if such class of Exchangeable Certificates has a “B” designation) or the Class C trust component (if such class of Exchangeable Certificates has a “C” designation). |
| Group of Exchangeable Certificates | Class of Exchangeable Certificates | Corresponding Trust Components | |||
| “Class A-4 Exchangeable Certificates” | Class A-4 | Class A-4, A-4-X1, A-4-X2 | |||
| Class A-4-1 | Class A-4, A-4-X2 | ||||
| Class A-4-2 | Class A-4 | ||||
| Class A-4-X1 | Class A-4-X1 | ||||
| Class A-4-X2 | Class A-4-X1, A-4-X2 |
| THE INFORMATION IN THIS STRUCTURAL AND COLLATERAL TERM SHEET IS NOT COMPLETE AND MAY BE AMENDED PRIOR TO THE TIME OF SALE. THIS TERM SHEET IS NOT AN OFFER TO SELL THESE SECURITIES AND IT IS NOT A SOLICITATION OF AN OFFER TO BUY THESE SECURITIES IN ANY JURISDICTION WHERE THE OFFER OR SALE IS NOT PERMITTED. | ||
| ||
| BANK 2022-BNK43 | Certain Terms and Conditions |
| Group of Exchangeable Certificates | Class of Exchangeable Certificates | Corresponding Trust Components | |||
| “Class A-5 Exchangeable Certificates” | Class A-5 | Class A-5, A-5-X1, A-5-X2 | |||
| Class A-5-1 | Class A-5, A-5-X2 | ||||
| Class A-5-2 | Class A-5 | ||||
| Class A-5-X1 | Class A-5-X1 | ||||
| Class A-5-X2 | Class A-5-X1, A-5-X2 | ||||
| “Class A-S Exchangeable Certificates” | Class A-S | Class A-S, A-S-X1, A-S-X2 | |||
| Class A-S-1 | Class A-S, A-S-X2 | ||||
| Class A-S-2 | Class A-S | ||||
| Class A-S-X1 | Class A-S-X1 | ||||
| Class A-S-X2 | Class A-S-X1, A-S-X2 | ||||
| “Class B Exchangeable Certificates” | Class B | Class B, B-X1, B-X2 | |||
| Class B-1 | Class B, B-X2 | ||||
| Class B-2 | Class B | ||||
| Class B-X1 | Class B-X1 | ||||
| Class B-X2 | Class B-X1, B-X2 | ||||
| “Class C Exchangeable Certificates” | Class C | Class C, C-X1, C-X2 | |||
| Class C-1 | Class C, C-X2 | ||||
| Class C-2 | Class C | ||||
| Class C-X1 | Class C-X1 | ||||
| Class C-X2 | Class C-X1, C-X2 |
| The maximum Certificate Balance or Notional Amount of each class of Class A-4 Exchangeable Certificates that could be issued in an exchange is equal to the Certificate Balance of the Class A-4 trust component, the maximum Certificate Balance or Notional Amount of each class of Class A-5 Exchangeable Certificates that could be issued in an exchange is equal to the Certificate Balance of the Class A-5 trust component, the maximum Certificate Balance or Notional Amount of each class of Class A-S Exchangeable Certificates that could be issued in an exchange is equal to the Certificate Balance of the Class A-S trust component, the maximum Certificate Balance or Notional Amount of each class of Class B Exchangeable Certificates that could be issued in an exchange is equal to the Certificate Balance of the Class B trust component and the maximum Certificate Balance or Notional Amount of each class of Class C Exchangeable Certificates that could be issued in an exchange is equal to the Certificate Balance of the Class C trust component. The maximum Certificate Balances of Class A-4, A-5, A-S, B and C certificates (subject to the constraint on the aggregate initial Certificate Balance of the Class A-4 and A-5 trust components discussed in footnote (9) to table under “Certificate Structure”) will be issued on the closing date, and the Certificate Balance or Notional Amount of each other class of Exchangeable Certificates will be equal to zero on the Closing Date. Each class of Class A-4 Exchangeable Certificates, Class A-5 Exchangeable Certificates, Class A-S Exchangeable Certificates, Class B Exchangeable Certificates and Class C Exchangeable Certificates will have a Certificate Balance or Notional Amount equal to its Class Percentage Interest multiplied by the Certificate Balance of the Class A-4 trust component, Class A-5 trust component, Class A-S trust component, Class B trust component or Class C trust component, respectively. Each class of Class A-4 Exchangeable Certificates, Class A-5 Exchangeable Certificates, Class A-S Exchangeable Certificates, Class B Exchangeable Certificates and Class C Exchangeable Certificates with a Certificate Balance will have the same Approximate Initial Credit Support, Weighted Average Life, Expected Principal Window, Certificate Principal U/W NOI Debt Yield and Certificate Principal to Value Ratio as the Class A-4 Certificates, Class A-5 Certificates, Class A-S Certificates, Class B Certificates or Class C Certificates, respectively, shown above. |
| THE INFORMATION IN THIS STRUCTURAL AND COLLATERAL TERM SHEET IS NOT COMPLETE AND MAY BE AMENDED PRIOR TO THE TIME OF SALE. THIS TERM SHEET IS NOT AN OFFER TO SELL THESE SECURITIES AND IT IS NOT A SOLICITATION OF AN OFFER TO BUY THESE SECURITIES IN ANY JURISDICTION WHERE THE OFFER OR SALE IS NOT PERMITTED. | ||
| ||
| BANK 2022-BNK43 | Certain Terms and Conditions |
| Allocation of Yield Maintenance Charges and Prepayment Premiums: | If any yield maintenance charge or prepayment premium is collected during any particular collection period with respect to any mortgage loan, then on the Distribution Date corresponding to that collection period, the certificate administrator will pay that yield maintenance charge or prepayment premium (net of liquidation fees payable therefrom) in the following manner: (x) to the Non-Retained Certificates (other than the Class X-D, F, G, H and R certificates), in the following amounts: (1) to each of the Class A-1, A-2, A-3, A-SB, A-4, A-4-1, A-4-2, A-5, A-5-1, A-5-2, A-S, A-S-1, A-S-2, B, B-1, B-2, C, C-1, C-2, D and E Certificates, the product of (a) the Non-Retained Percentage of the yield maintenance charge or prepayment premium, (b) the related Base Interest Fraction (as defined in the Preliminary Prospectus) for such class and the applicable principal prepayment, and (c) a fraction, the numerator of which is equal to the amount of principal distributed to such class for that Distribution Date, and the denominator of which is the total amount of principal distributed to the Class A-1, A-2, A-3, A-SB, D, E, F, G and H Certificates and the Class A-4 Exchangeable Certificates, the Class A-5 Exchangeable Certificates, the Class A-S Exchangeable Certificates, the Class B Exchangeable Certificates and the Class C Exchangeable Certificates for that Distribution Date, (2) to the Class A-4-X1 Certificates, the product of (a) the Non-Retained Percentage of such yield maintenance charge or prepayment premium, (b) a fraction, the numerator of which is equal to the amount of principal distributed to the Class A-4-1 Certificates for that Distribution Date, and the denominator of which is the total amount of principal distributed to the Class A-1, A-2, A-3, A-SB, D, E, F, G and H Certificates and the Class A-4 Exchangeable Certificates, the Class A-5 Exchangeable Certificates, the Class A-S Exchangeable Certificates, the Class B Exchangeable Certificates and the Class C Exchangeable Certificates for that Distribution Date and (c) the difference between (i) the Base Interest Fraction for the Class A-4 Certificates and the applicable principal prepayment and (ii) the Base Interest Fraction for the Class A-4-1 Certificates and the applicable principal prepayment, (3) to the Class A-4-X2 Certificates, the product of (a) the Non-Retained Percentage of such yield maintenance charge or prepayment premium, (b) a fraction, the numerator of which is equal to the amount of principal distributed to the Class A-4-2 Certificates for that Distribution Date, and the denominator of which is the total amount of principal distributed to the Class A-1, A-2, A-3, A-SB, D, E, F, G and H Certificates and the Class A-4 Exchangeable Certificates, the Class A-5 Exchangeable Certificates, the Class A-S Exchangeable Certificates, the Class B Exchangeable Certificates and the Class C Exchangeable Certificates for that Distribution Date and (c) the difference between (i) the Base Interest Fraction for the Class A-4 Certificates and the applicable principal prepayment and (ii) the Base Interest Fraction for the Class A-4-2 Certificates and the applicable principal prepayment, (4) to the Class A-5-X1 Certificates, the product of (a) the Non-Retained Percentage of such yield maintenance charge or prepayment premium, (b) a fraction, the numerator of which is equal to the amount of principal distributed to the Class A-5-1 Certificates for that Distribution Date, and the denominator of which is the total amount of principal distributed to the Class A-1, A-2, A-3, A-SB, D, E, F, G and H Certificates and the Class A-4 Exchangeable Certificates, the Class A-5 Exchangeable Certificates, the Class A-S Exchangeable Certificates, the Class B Exchangeable Certificates and the Class C Exchangeable Certificates for that Distribution Date and (c) the difference between (i) the Base Interest Fraction for the Class A-5 Certificates and the applicable principal prepayment and (ii) the Base Interest Fraction for the Class A-5-1 Certificates and the applicable principal prepayment, (5) to the Class A-5-X2 Certificates, the product of (a) the Non-Retained Percentage of such yield maintenance charge or prepayment premium, (b) a fraction, the numerator of which is equal to the amount of principal distributed to the Class A-5-2 Certificates for that Distribution Date, and the denominator of which is the total amount of principal distributed to the Class A-1, A-2, A-3, A-SB, D, E, F, G and H Certificates and the Class A-4 Exchangeable Certificates, the Class A-5 Exchangeable Certificates, the Class A-S Exchangeable Certificates, the Class B
|
| THE INFORMATION IN THIS STRUCTURAL AND COLLATERAL TERM SHEET IS NOT COMPLETE AND MAY BE AMENDED PRIOR TO THE TIME OF SALE. THIS TERM SHEET IS NOT AN OFFER TO SELL THESE SECURITIES AND IT IS NOT A SOLICITATION OF AN OFFER TO BUY THESE SECURITIES IN ANY JURISDICTION WHERE THE OFFER OR SALE IS NOT PERMITTED. | ||
| ||
| BANK 2022-BNK43 | Certain Terms and Conditions |
Exchangeable Certificates and the Class C Exchangeable Certificates for that Distribution Date and (c) the difference between (i) the Base Interest Fraction for the Class A-5 Certificates and the applicable principal prepayment and (ii) the Base Interest Fraction for the Class A-5-2 Certificates and the applicable principal prepayment, (6) to the Class A-S-X1 Certificates, the product of (a) the Non-Retained Percentage of such yield maintenance charge or prepayment premium, (b) a fraction, the numerator of which is equal to the amount of principal distributed to the Class A-S-1 Certificates for that Distribution Date, and the denominator of which is the total amount of principal distributed to the Class A-1, A-2, A-3, A-SB, D, E, F, G and H Certificates and the Class A-4 Exchangeable Certificates, the Class A-5 Exchangeable Certificates, the Class A-S Exchangeable Certificates, the Class B Exchangeable Certificates and the Class C Exchangeable Certificates for that Distribution Date and (c) the difference between (i) the Base Interest Fraction for the Class A-S Certificates and the applicable principal prepayment and (ii) the Base Interest Fraction for the Class A-S-1 Certificates and the applicable principal prepayment, (7) to the Class A-S-X2 Certificates, the product of (a) the Non-Retained Percentage of such yield maintenance charge or prepayment premium, (b) a fraction, the numerator of which is equal to the amount of principal distributed to the Class A-S-2 Certificates for that Distribution Date, and the denominator of which is the total amount of principal distributed to the Class A-1, A-2, A-3, A-SB, D, E, F, G and H Certificates and the Class A-4 Exchangeable Certificates, the Class A-5 Exchangeable Certificates, the Class A-S Exchangeable Certificates, the Class B Exchangeable Certificates and the Class C Exchangeable Certificates for that Distribution Date and (c) the difference between (i) the Base Interest Fraction for the Class A-S Certificates and the applicable principal prepayment and (ii) the Base Interest Fraction for the Class A-S-2 Certificates and the applicable principal prepayment, (8) to the Class B-X1 Certificates, the product of (a) the Non-Retained Percentage of such yield maintenance charge or prepayment premium, (b) a fraction, the numerator of which is equal to the amount of principal distributed to the Class B-1 Certificates for that Distribution Date, and the denominator of which is the total amount of principal distributed to the Class A-1, A-2, A-3, A-SB, D, E, F, G and H Certificates and the Class A-4 Exchangeable Certificates, the Class A-5 Exchangeable Certificates, the Class A-S Exchangeable Certificates, the Class B Exchangeable Certificates and the Class C Exchangeable Certificates for that Distribution Date and (c) the difference between (i) the Base Interest Fraction for the Class B Certificates and the applicable principal prepayment and (ii) the Base Interest Fraction for the Class B-1 Certificates and the applicable principal prepayment, (9) to the Class B-X2 Certificates, the product of (a) the Non-Retained Percentage of such yield maintenance charge or prepayment premium, (b) a fraction, the numerator of which is equal to the amount of principal distributed to the Class B-2 Certificates for that Distribution Date, and the denominator of which is the total amount of principal distributed to the Class A-1, A-2, A-3, A-SB, D, E, F, G and H Certificates and the Class A-4 Exchangeable Certificates, the Class A-5 Exchangeable Certificates, the Class A-S Exchangeable Certificates, the Class B Exchangeable Certificates and the Class C Exchangeable Certificates for that Distribution Date and (c) the difference between (i) the Base Interest Fraction for the Class B Certificates and the applicable principal prepayment and (ii) the Base Interest Fraction for the Class B-2 Certificates and the applicable principal prepayment, (10) to the Class C-X1 Certificates, the product of (a) the Non-Retained Percentage of such yield maintenance charge or prepayment premium, (b) a fraction, the numerator of which is equal to the amount of principal distributed to the Class C-1 Certificates for that Distribution Date, and the denominator of which is the total amount of principal distributed to the Class A-1, A-2, A-3, A-SB, D, E, F, G and H Certificates and the Class A-4 Exchangeable Certificates, the Class A-5 Exchangeable Certificates, the Class A-S Exchangeable Certificates, the Class B Exchangeable Certificates and the Class C Exchangeable Certificates for that Distribution Date and (c) the difference between (i) the Base Interest Fraction for |
| THE INFORMATION IN THIS STRUCTURAL AND COLLATERAL TERM SHEET IS NOT COMPLETE AND MAY BE AMENDED PRIOR TO THE TIME OF SALE. THIS TERM SHEET IS NOT AN OFFER TO SELL THESE SECURITIES AND IT IS NOT A SOLICITATION OF AN OFFER TO BUY THESE SECURITIES IN ANY JURISDICTION WHERE THE OFFER OR SALE IS NOT PERMITTED. | ||
| ||
| BANK 2022-BNK43 | Certain Terms and Conditions |
the Class C Certificates and the applicable principal prepayment and (ii) the Base Interest Fraction for the Class C-1 Certificates and the applicable principal prepayment, (11) to the Class C-X2 Certificates, the product of (a) the Non-Retained Percentage of such yield maintenance charge or prepayment premium, (b) a fraction, the numerator of which is equal to the amount of principal distributed to the Class C-2 Certificates for that Distribution Date, and the denominator of which is the total amount of principal distributed to the Class A-1, A-2, A-3, A-SB, D, E, F, G and H Certificates and the Class A-4 Exchangeable Certificates, the Class A-5 Exchangeable Certificates, the Class A-S Exchangeable Certificates, the Class B Exchangeable Certificates and the Class C Exchangeable Certificates for that Distribution Date and (c) the difference between (i) the Base Interest Fraction for the Class C Certificates and the applicable principal prepayment and (ii) the Base Interest Fraction for the Class C-2 Certificates and the applicable principal prepayment, (12) to the Class X-A Certificates, the excess, if any, of (a) the product of (i) the Non-Retained Percentage of such yield maintenance charge or prepayment premium and (ii) a fraction, the numerator of which is equal to the total amount of principal distributed to the Class A-1, A-2, A-3 and A-SB Certificates and the Class A-4 Exchangeable Certificates and the Class A-5 Exchangeable Certificates for that Distribution Date, and the denominator of which is the total amount of principal distributed to the Class A-1, A-2, A-3, A-SB, D, E, F, G and H Certificates and the Class A-4 Exchangeable Certificates, the Class A-5 Exchangeable Certificates, the Class A-S Exchangeable Certificates, the Class B Exchangeable Certificates and the Class C Exchangeable Certificates for that Distribution Date, over (b) the total amount of such yield maintenance charge or prepayment premium distributed to the Class A-1, A-2, A-3 and Class A-SB Certificates and the Class A-4 Exchangeable Certificates and the Class A-5 Exchangeable Certificates as described above, and (13) to the Class X-B Certificates, any remaining portion of the Non-Retained Percentage of such yield maintenance charge or prepayment premium not distributed as described above, and (y) to the RR Interest, its Percentage Allocation Entitlement of the yield maintenance charge or prepayment premium; provided, however, that after the notional amounts of the Class X-A and X-B Certificates and the Certificate Balances of the Class A-1, A-2, A-3, A-SB, D and E Certificates and the Class A-4, A-5, A-S, B and C trust components have been reduced to zero, the Non-Retained Percentage of all prepayment premiums and yield maintenance charges with respect to the mortgage loans will be allocated among the holders of the Class F, G and H certificates as provided in the BANK 2022-BNK43 pooling and servicing agreement. No prepayment premiums or yield maintenance charges will be distributed to the holders of the Class X-D or R Certificates. For a description of when prepayment premiums and yield maintenance charges are generally required on the mortgage loans, see Annex A-1 to the Preliminary Prospectus. See also “Risk Factors—Risks Relating to the Mortgage Loans—Risks Relating to Enforceability of Yield Maintenance Charges, Prepayment Premiums or Defeasance Provisions” and “Risk Factors—Other Risks Relating to the Certificates—Your Yield May Be Affected by Defaults, Prepayments and Other Factors” in the Preliminary Prospectus. Prepayment premiums and yield maintenance charges will be distributed on each Distribution Date only to the extent they are actually received on the mortgage loans as of the related Determination Date. | |
| Realized Losses: | The Certificate Balances of the Class A-1, A-2, A-3, A-SB, D, E, F, G and H Certificates and the Class A-4, A-5, A-S, B and C trust components will be reduced without distribution on any Distribution Date as a write-off to the extent of the Non-Retained Percentage of any losses realized on the mortgage loans allocated to such Class on such Distribution Date. Such losses will be applied in the following order, in each case until the related Certificate Balance is reduced to zero: first, to the Class H Certificates; second, to the Class G Certificates; third, to the Class F Certificates; fourth, to the Class E Certificates; fifth, to the Class D Certificates; sixth, to the Class C trust component; seventh, to the Class B trust component; eighth, to the Class A-S trust component; and, finally, pro rata, to the Class A-1, A-2, A-3 and A-SB Certificates and the Class A-4 and A-5 trust components based on their outstanding Certificate Balances. |
| THE INFORMATION IN THIS STRUCTURAL AND COLLATERAL TERM SHEET IS NOT COMPLETE AND MAY BE AMENDED PRIOR TO THE TIME OF SALE. THIS TERM SHEET IS NOT AN OFFER TO SELL THESE SECURITIES AND IT IS NOT A SOLICITATION OF AN OFFER TO BUY THESE SECURITIES IN ANY JURISDICTION WHERE THE OFFER OR SALE IS NOT PERMITTED. | ||
| ||
| BANK 2022-BNK43 | Certain Terms and Conditions |
Any portion of such amount applied to the Class A-4, A-5, A-S, B or C trust component will reduce the Certificate Balance or Notional Amount of each Class of Certificates in the related group of Exchangeable Certificates by an amount equal to the product of (x) its Certificate Balance or Notional Amount, divided by the Certificate Balance of such trust component prior to the applicable reduction, and (y) the amount applied to such trust component. The Notional Amount of the Class X-A Certificates will be reduced by the amount of all losses that are allocated to the Class A-1, A-2, A-3 or A-SB Certificates or the Class A-4 or A-5 trust components as write-offs in reduction of their Certificate Balances. The Notional Amount of the Class X-B Certificates will be reduced by the amount of all losses that are allocated to the Class A-S, B or C trust components as write-offs in reduction of their Certificate Balances. The Notional Amount of the Class X-D Certificates will be reduced by the amount of all losses that are allocated to the Class D or E Certificates as write-offs in reduction of their Certificate Balances. | |
| P&I Advances: | Each Master Servicer or, if such Master Servicer fails to do so, the Trustee, will be obligated to advance delinquent debt service payments with respect to the mortgage loans it services (other than balloon payments, excess interest and default interest) and assumed debt service payments on mortgage loans with delinquent balloon payments (excluding any related companion loan), except to the extent any such advance is deemed non-recoverable from collections on the related mortgage loan. In addition, if an Appraisal Reduction Amount exists for a given mortgage loan, the interest portion of any P&I advance for such mortgage loan will be reduced, which will have the effect of reducing the amount of interest available for distribution to the Certificates, which with respect to the Non-Retained Certificates (other than the Class R Certificates) will be applied in reverse alphabetical order of their Class designations (except that interest payments on the Class A-1, A-2, A-3, A-SB, A-4, A-4-X1, A-4-X2, A-5, A-5-X1, A-5-X2, X-A, X-B and X-D Certificates would be affected on a pari passu basis). |
| Servicing Advances: | Each Master Servicer or, if such Master Servicer fails to do so, the Trustee, will be obligated to make servicing advances, including the payment of delinquent property taxes, insurance premiums and ground rent, except to the extent that those advances are deemed non-recoverable from collections on the related mortgage loan. The related Master Servicer or the Trustee, as applicable, will have the primary obligation to make any required servicing advances with respect to any serviced whole loan. With respect to any non-serviced whole loan, the master servicer or trustee, as applicable, under the related lead securitization servicing agreement will have the primary obligation to make any required servicing advances with respect to such non-serviced whole loan. |
Appraisal Reduction Amounts and Collateral Deficiency Amounts: | An “Appraisal Reduction Amount” generally will be created in the amount, if any, by which the principal balance of a required appraisal loan (which is a mortgage loan (other than a non-serviced mortgage loan) with respect to which certain defaults, modifications or insolvency events have occurred as further described in the Preliminary Prospectus) plus other amounts overdue or advanced in connection with such mortgage loan exceeds 90% of the appraised value of the related mortgaged property (together with any other mortgage loan cross-collateralized with such mortgage loan) plus certain escrows and reserves (including letters of credit) held with respect to the mortgage loan. With respect to any serviced whole loan, any Appraisal Reduction Amount will be allocated first to the related subordinate companion loan(s), if any, and then, pro rata, to the related mortgage loan and the related pari passu companion loan(s). With respect to any non-serviced mortgage loan, appraisal reduction amounts are expected to be calculated in a similar manner under the related non-serviced pooling and servicing agreement. A mortgage loan will cease to be a required appraisal loan when the same has ceased to be a specially serviced loan (if applicable), has been brought current for at least three consecutive months and no other circumstances exist that would cause such mortgage loan to be a required appraisal loan. A “Collateral Deficiency Amount” will exist with respect to any mortgage loan that is modified into an AB loan structure and remains a corrected mortgage loan and will generally equal the excess of (i) the stated principal balance of such AB modified loan (taking into account the related junior note(s) and any pari passu notes included therein), over (ii) the sum of (in the case of a whole loan, solely to the extent allocable to the subject mortgage loan) (x) the most recent appraised value of the related mortgaged property plus (y) solely to the extent not reflected or taken into account in such appraised value (or in the calculation of any related Appraisal Reduction Amount) and to the extent on deposit with, or otherwise under the control of, the lender as of the date of such determination, any capital or additional collateral contributed by the related borrower at the time the mortgage loan (and as part of the modification thereto) became an AB modified loan plus (z) any other escrows or reserves (in addition to any amounts set forth in the immediately preceding clause (y) and solely to the extent not reflected or taken into account in the calculation of any related Appraisal Reduction Amount) held by the lender with respect to the mortgage loan as of the date of such determination. |
| THE INFORMATION IN THIS STRUCTURAL AND COLLATERAL TERM SHEET IS NOT COMPLETE AND MAY BE AMENDED PRIOR TO THE TIME OF SALE. THIS TERM SHEET IS NOT AN OFFER TO SELL THESE SECURITIES AND IT IS NOT A SOLICITATION OF AN OFFER TO BUY THESE SECURITIES IN ANY JURISDICTION WHERE THE OFFER OR SALE IS NOT PERMITTED. | ||
| ||
| BANK 2022-BNK43 | Certain Terms and Conditions |
A “Cumulative Appraisal Reduction Amount” with respect to any mortgage loan will be the sum of any Appraisal Reduction Amount and any Collateral Deficiency Amount. Appraisal Reduction Amounts will affect the amount of debt service advances in respect of the related mortgage loan. Additionally, Cumulative Appraisal Reduction Amounts will be taken into account in the determination of the identity of the Class whose majority constitutes the “majority controlling class certificateholder” and is entitled to appoint the directing certificateholder. | |
Clean-Up Call and Exchange Termination: | On each Distribution Date occurring after the aggregate unpaid principal balance of the pool of mortgage loans is less than 1.0% of the principal balance of the mortgage loans as of the cut-off date, certain specified persons will have the option to purchase all of the remaining mortgage loans (and the trust’s interest in all property acquired through exercise of remedies in respect of any mortgage loan) at the price specified in the Preliminary Prospectus. Exercise of the option will terminate the trust and retire the then-outstanding Certificates. If the aggregate Certificate Balances of each of the Class A-1, A-2, A-3, A-SB, D and E Certificates and the Class A-4, A-5, A-S, B and C trust components have been reduced to zero, the trust may also be terminated in connection with an exchange of all the then-outstanding Certificates (other than the Class R Certificates and the RR Interest) for the mortgage loans and REO properties then remaining in the issuing entity, subject to payment of a price specified in the Preliminary Prospectus, but all of the holders of those outstanding Classes of Certificates (other than the Class R Certificates and the RR Interest) would have to voluntarily participate in the exchange. |
| Liquidation Loan Waterfall: | Following the liquidation of any mortgage loan or mortgaged property, the net liquidation proceeds generally will be applied (after reimbursement of advances and certain trust fund expenses), first, as a recovery of accrued interest, other than delinquent interest that was not advanced as a result of Appraisal Reduction Amounts, second, as a recovery of principal until all principal has been recovered, and then as a recovery of delinquent interest that was not advanced as a result of Appraisal Reduction Amounts. Please see “Description of the Certificates—Distributions—Application Priority of Mortgage Loan Collections or Whole Loan Collections” in the Preliminary Prospectus. |
| Control Eligible Certificates: | The Class F, G and H Certificates. |
| Directing Certificateholder/ Controlling Class: | A directing certificateholder may be appointed by the “majority controlling class certificateholder”, which will be the holder(s) of a majority of the Controlling Class. The “Controlling Class” will be, as of any time of determination, the most subordinate Class of Control Eligible Certificates then-outstanding that has an aggregate Certificate Balance (as notionally reduced by any Cumulative Appraisal Reduction Amounts allocable to such Class) at least equal to 25% of the initial Certificate Balance of that Class; provided, however, that if at any time the Certificate Balances of the Certificates other than the Control Eligible Certificates and the RR Interest have been reduced to zero as a result of principal payments on the Mortgage Loans, then the Controlling Class will be the most subordinate Class of Control Eligible Certificates that has a Certificate Balance greater than zero without regard to any Cumulative Appraisal Reduction Amounts. The Controlling Class as of the Closing Date will be the Class H Certificates. |
| Control and Consultation/ Replacement of Special Servicer by Directing Certificateholder: | The rights of various parties to replace the Special Servicer and approve or consult with respect to major actions of the Special Servicer will vary according to defined periods. A “Control Termination Event” will occur when the Class F Certificates have a Certificate Balance (taking into account the application of any Cumulative Appraisal Reduction Amounts to notionally reduce the Certificate Balance of such Class) of less than 25% of the initial Certificate Balance of that Class; provided, that a Control Termination Event will not be deemed continuing in the event that the Certificate Balances of the Certificates other than the Control Eligible Certificates and the RR Interest have been reduced to zero as a result of principal payments on the Mortgage Loans. A “Consultation Termination Event” will occur when there is no Class of Control Eligible Certificates that has a then-outstanding Certificate Balance at least equal to 25% of the initial Certificate Balance of that Class, in each case, without regard to the application of any Cumulative Appraisal Reduction Amounts; provided, however, that a Consultation Termination Event will not be deemed continuing in the event that the Certificate Balances of the Certificates other than the Control Eligible Certificates and the RR Interest have been reduced to zero as a result of principal payments on the Mortgage Loans. If no Control Termination Event has occurred and is continuing, except with respect to the Excluded Loans (as defined below) with respect to the directing certificateholder (i) the directing certificateholder will be entitled to grant or withhold approval of asset status reports prepared, and material servicing actions proposed, by the Special Servicer, and (ii) the directing certificateholder will be entitled to terminate and replace the Special Servicer with or without |
| THE INFORMATION IN THIS STRUCTURAL AND COLLATERAL TERM SHEET IS NOT COMPLETE AND MAY BE AMENDED PRIOR TO THE TIME OF SALE. THIS TERM SHEET IS NOT AN OFFER TO SELL THESE SECURITIES AND IT IS NOT A SOLICITATION OF AN OFFER TO BUY THESE SECURITIES IN ANY JURISDICTION WHERE THE OFFER OR SALE IS NOT PERMITTED. | ||
| ||
| BANK 2022-BNK43 | Certain Terms and Conditions |
cause, and appoint itself or another person as the successor special servicer. It will be a condition to such appointment that Fitch, KBRA and Moody’s (and any rating agency rating any securities backed by any pari passu companion loan(s) serviced under this transaction) confirm that the appointment would not result in a qualification, downgrade or withdrawal of any of their then-current ratings of Certificates (and any certificates backed by any pari passu companion loan(s) serviced under this transaction). If a Control Termination Event has occurred and is continuing but no Consultation Termination Event has occurred and is continuing, the Special Servicer will be required to consult with the directing certificateholder (other than with respect to Excluded Loans as to such party) and the Operating Advisor in connection with asset status reports and material special servicing actions. If a Consultation Termination Event has occurred and is continuing, the Special Servicer must seek to consult with the Operating Advisor in connection with asset status reports and material special servicing actions, and, in general, no directing certificateholder will be recognized or have any right to terminate the Special Servicer or approve, direct or consult with respect to servicing matters. With respect to each serviced whole loan, the rights of the directing certificateholder described above will be subject to the consultation rights of the holders of the related pari passu companion loans. Those consultation rights will generally extend to asset status reports and material special servicing actions involving the related whole loan, will be as set forth in the related intercreditor agreement, and will be in addition to the rights of the directing certificateholder in this transaction described above. With respect to each non-serviced whole loan, the applicable servicing agreement for the related controlling pari passu companion loan(s) generally grants (or will grant) the directing certificateholder under the related securitization (or, in some cases, a controlling companion loan holder) control rights that may include the right to approve or disapprove various material servicing actions involving the related whole loan. The directing certificateholder for this securitization (so long as no Consultation Termination Event has occurred and is occurring) generally will nonetheless have the right to be consulted on a non-binding basis with respect to such actions. For purposes of the servicing of any such whole loan contemplated by this paragraph, the occurrence and continuance of a Control Termination Event or Consultation Termination Event under this securitization will not limit the control or other rights of the directing certificateholder (or equivalent) under the securitization of the related controlling pari passu companion loan(s). The control rights and consent and consultation rights described in the preceding paragraphs are subject to various limitations, conditions and exceptions as described in the Preliminary Prospectus. Notwithstanding any contrary description set forth above, in the event that, with respect to any mortgage loan, the majority controlling class certificateholder or the directing certificateholder is a Borrower Party, the majority controlling class certificateholder and the directing certificateholder will have no right to receive asset status reports or such other information as may be specified in the BANK 2022-BNK43 pooling and servicing agreement, to grant or withhold approval of, or consult with respect to, asset status reports prepared, and material servicing actions proposed, by the Special Servicer, with respect to such mortgage loan, and such mortgage loan will be referred to as an “Excluded Loan” as to such party. In addition, notwithstanding any contrary description set forth above, in the event that, with respect to any mortgage loan, a controlling class certificateholder is a Borrower Party, such controlling class certificateholder will have no right to receive asset status reports or such other information as may be specified in the BANK 2022-BNK43 pooling and servicing agreement with respect to such mortgage loan. “Borrower Party” means a borrower, a mortgagor or a manager of a mortgaged property, an Accelerated Mezzanine Loan Lender, or any Borrower Party Affiliate. “Accelerated Mezzanine Loan Lender” means a mezzanine lender under a mezzanine loan that has been accelerated or as to which foreclosure or enforcement proceedings have been commenced against the equity collateral pledged to secure such mezzanine loan. “Borrower Party Affiliate” means, with respect to a borrower, a mortgagor, a manager of a Mortgaged Property or an Accelerated Mezzanine Loan Lender, (x) any other person controlling or controlled by or under common control with such borrower, mortgagor, manager or Accelerated Mezzanine Loan Lender, as applicable, or (y) any other person owning, directly or indirectly, 25% or more of the beneficial interests in such borrower, mortgagor, manager or Accelerated Mezzanine Loan Lender. With respect to a mortgage loan secured by a residential cooperative property, a person will not be considered a “Borrower Party” solely by reason of such person holding one or more cooperative unit loans that are secured by direct equity interests in the related borrower or owning one or more residential |
| THE INFORMATION IN THIS STRUCTURAL AND COLLATERAL TERM SHEET IS NOT COMPLETE AND MAY BE AMENDED PRIOR TO THE TIME OF SALE. THIS TERM SHEET IS NOT AN OFFER TO SELL THESE SECURITIES AND IT IS NOT A SOLICITATION OF AN OFFER TO BUY THESE SECURITIES IN ANY JURISDICTION WHERE THE OFFER OR SALE IS NOT PERMITTED. | ||
| ||
| BANK 2022-BNK43 | Certain Terms and Conditions |
| cooperative units comprising the related mortgaged property as a result of any foreclosure, transfer in lieu of foreclosure or other exercise of remedies with respect to any such unit loan(s). | |
| Risk Retention Consultation Party: | A risk retention consultation party may be appointed by the holder or holders of more than 50% of the RR Interest, by Certificate Balance. The majority RR Interest holder will have a continuing right to appoint, remove or replace the risk retention consultation party in its sole discretion. This right may be exercised at any time and from time to time. Except with respect to an Excluded Loan as to such party, the risk retention consultation party will be entitled to consult with each Special Servicer, upon request of the risk retention consultation party, with respect to certain material servicing actions proposed by such Special Servicer. |
| Replacement of Special Servicer by General Vote of Certificateholders: | If a Control Termination Event has occurred and is continuing, either Special Servicer may be removed and replaced without cause upon the affirmative direction of certificate owners holding not less than 66-2/3% of a certificateholder quorum, following a proposal from certificate owners holding not less than 25% of the appraisal-reduced voting rights of all Principal Balance Certificates other than the RR Interest. The certificateholders who initiate a vote on a termination and replacement of a Special Servicer without cause must cause Fitch, KBRA and Moody’s to confirm the then-current ratings of the Certificates (or decline to review the matter) and cause the payment of the fees and expenses incurred in the replacement. If no Control Termination Event has occurred and is continuing, either Special Servicer may be replaced by the directing certificateholder, subject to Fitch, KBRA and Moody’s (and any rating agency rating any securities backed by any pari passu companion loan(s) serviced under this transaction) confirming the then-current ratings of the Certificates (and any certificates backed by any pari passu companion loans serviced under this transaction) or declining to review the matter. |
| Excluded Special Servicer: | In the event that, with respect to any mortgage loan, a Special Servicer is a Borrower Party, such Special Servicer will be required to resign as special servicer of such mortgage loan (referred to as an “excluded special servicer loan”). If no Control Termination Event has occurred and is continuing, the directing certificateholder will be entitled to appoint (and may replace with or without cause) a separate special servicer that is not a Borrower Party (referred to as an “excluded special servicer”) with respect to such excluded special servicer loan unless such excluded special servicer loan is also an excluded loan. Otherwise, upon resignation of the applicable Special Servicer with respect to an excluded special servicer loan, such resigning Special Servicer will be required to use reasonable efforts to appoint the excluded special servicer. |
| Appraisal Remedy: | If the Class of Certificates comprising the Controlling Class loses its status as Controlling Class because of the application of an Appraisal Reduction Amount or Collateral Deficiency Amount, the holders of a majority of the voting rights of such Class may require the applicable Special Servicer to order a second appraisal for any mortgage loan in respect of which an Appraisal Reduction Amount or Collateral Deficiency Amount has been applied. Such Special Servicer must thereafter determine whether, based on its assessment of such second appraisal, any recalculation of the Appraisal Reduction Amount or Collateral Deficiency Amount is warranted, and if so warranted, the Special Servicer will recalculate such Appraisal Reduction Amount or Collateral Deficiency Amount. Such Class will not be able to exercise any direction, control, consent and/or similar rights of the Controlling Class unless and until reinstated as the Controlling Class through such determination; and pending such determination, the rights of the Controlling Class will be exercised by the Control Eligible Certificates, if any, that would be the Controlling Class taking into account the subject appraisal reduction amount. |
| Sale of Defaulted Assets: | There will be no “fair value” purchase option. Instead, the BANK 2022-BNK43 pooling and servicing agreement will authorize the Special Servicer to sell defaulted mortgage loans serviced by such Special Servicer to the highest bidder in a manner generally similar to sales of REO properties. The sale of a defaulted loan (other than a non-serviced whole loan) for less than par plus accrued interest and certain other fees and expenses owed on the loan will be subject to consent or consultation rights of the directing certificateholder and/or Operating Advisor, as described in the Preliminary Prospectus. Generally speaking, the holder of a pari passu companion loan will have consent and/or consultation rights, as described in the Preliminary Prospectus. If the subject whole loan includes one or more subordinate companion loans, those subordinate companion loans may be included in such sale as well. With respect to each serviced whole loan, if such whole loan becomes a defaulted loan under the BANK 2022-BNK43 pooling and servicing agreement, the Special Servicer will generally be required to sell both the mortgage loan and the related pari passu companion loan(s) as a single whole loan. If the subject whole loan includes one or more subordinate companion loans, those subordinate companion loans may be included in such sale as well. |
| THE INFORMATION IN THIS STRUCTURAL AND COLLATERAL TERM SHEET IS NOT COMPLETE AND MAY BE AMENDED PRIOR TO THE TIME OF SALE. THIS TERM SHEET IS NOT AN OFFER TO SELL THESE SECURITIES AND IT IS NOT A SOLICITATION OF AN OFFER TO BUY THESE SECURITIES IN ANY JURISDICTION WHERE THE OFFER OR SALE IS NOT PERMITTED. | ||
| ||
| BANK 2022-BNK43 | Certain Terms and Conditions |
With respect to each non-serviced whole loan, the applicable servicing agreement governing the servicing of such whole loan generally will provide that, if the related pari passu companion loan(s) serviced under such agreement become a defaulted loan under such servicing agreement, then the related special servicer may offer to sell to any person (or may offer to purchase) for cash such whole loan during such time as such applicable pari passu companion loan(s) constitutes a defaulted loan under such servicing agreement. Generally speaking, in connection with any such sale, the related special servicer is required to sell both the mortgage loan and the related pari passu companion loan(s) as a whole loan. The directing certificateholder for this securitization generally will have consent and/or consultation rights as the holder of an interest in the related mortgage loan, as described in the Preliminary Prospectus. If the subject whole loan includes one or more subordinate companion loans, those subordinate companion loans may be included in such sale as well. The procedures for the sale of any whole loan that becomes a defaulted whole loan, and any associated consultation rights, are subject to various limitations, conditions and exceptions as described in the Preliminary Prospectus. | |
| “As-Is” Appraisals: | Appraisals must be conducted on an “as-is” basis, and must be no more than 12 months old, for purposes of determining Appraisal Reduction Amounts and market value in connection with REO sales. Required appraisals may consist of updates of prior appraisals. Internal valuations by the applicable Special Servicer are permitted if the principal balance of a mortgage loan is less than $2,000,000. |
| Operating Advisor: | The Operating Advisor will perform certain review duties if a Control Termination Event has occurred and is continuing, which will generally include a limited annual review of, and the delivery of a report regarding, certain actions of each Special Servicer with respect to the resolution and/or liquidation of specially serviced loans to the Certificate Administrator. The review and report generally will be based on any asset status reports and additional information delivered to the Operating Advisor by each Special Servicer. In addition, if a Control Termination Event has occurred and is continuing, each Special Servicer must seek to consult with the Operating Advisor (in addition to the directing certificateholder if no Consultation Termination Event has occurred and is continuing) in connection with material special servicing actions with respect to specially serviced loans serviced by such Special Servicer. Furthermore, under certain circumstances, but only if a Consultation Termination Event has occurred and is continuing, the Operating Advisor may recommend the replacement of a Special Servicer, in which case the Certificate Administrator will deliver notice of such recommendation to the certificateholders, and certificateholders with specified percentages of the voting rights may direct the replacement of such Special Servicer at their expense. If a Consultation Termination Event has occurred and is continuing, the Operating Advisor may be removed and replaced without cause upon the affirmative direction of certificate owners holding at least 75% of the appraisal-reduced voting rights of all Certificates (other than the RR Interest), following a proposal from certificate owners holding not less than 25% of the appraisal-reduced voting rights of all Certificates (other than the RR Interest). The certificateholders who initiate a vote on a termination and replacement of the Operating Advisor without cause must cause Fitch, KBRA and Moody’s to confirm the then-current ratings of the Certificates (or decline to review the matter) and cause the payment of the fees and expenses incurred in the replacement. The Operating Advisor generally may be discharged from its duties if and when the Class A-1, A-2, A-3, A-SB, D and E Certificates and the Class A-4, A-5, A-S, B and C trust components are retired. |
| Asset Representations Reviewer: | The Asset Representations Reviewer will be required to review certain delinquent mortgage loans after a specified delinquency threshold has been exceeded (an “Asset Review Trigger”) and the required percentage of certificateholders vote to direct a review of such delinquent loans. An Asset Review Trigger will occur when either (1) mortgage loans with an aggregate outstanding principal balance of 25.0% or more of the aggregate outstanding principal balance of all of the mortgage loans (including any REO loans (or a portion of any REO loan in the case of a whole loan)) held by the issuing entity as of the end of the applicable collection period are delinquent loans or (2)(A) prior to and including the second anniversary of the Closing Date, at least 10 mortgage loans are delinquent loans as of the end of the applicable collection period and the outstanding principal balance of such delinquent loans in the aggregate constitutes at least 15.0% of the aggregate outstanding principal balance of all of the mortgage loans (including any REO loans (or a portion of any REO loan in the case of a whole loan)) held by the issuing entity as of the end of the applicable collection period, or (B) after the second anniversary of the Closing Date, at least 15 mortgage loans are delinquent loans as of the end of the applicable collection period and the outstanding principal balance of such delinquent loans in the aggregate constitutes at least 20.0% of the aggregate outstanding principal balance of all of the mortgage loans (including any REO loans (or a portion of any REO loan in the case of a whole loan)) held by the |
| THE INFORMATION IN THIS STRUCTURAL AND COLLATERAL TERM SHEET IS NOT COMPLETE AND MAY BE AMENDED PRIOR TO THE TIME OF SALE. THIS TERM SHEET IS NOT AN OFFER TO SELL THESE SECURITIES AND IT IS NOT A SOLICITATION OF AN OFFER TO BUY THESE SECURITIES IN ANY JURISDICTION WHERE THE OFFER OR SALE IS NOT PERMITTED. | ||
| ||
| BANK 2022-BNK43 | Certain Terms and Conditions |
issuing entity as of the end of the applicable collection period. See “Pooling and Servicing Agreement—The Asset Representations Reviewer—Asset Review” in the Preliminary Prospectus. The Asset Representations Reviewer may be terminated and replaced without cause. Upon (i) the written direction of certificateholders evidencing not less than 25% of the voting rights (without regard to the application of any Cumulative Appraisal Reduction Amounts) requesting a vote to terminate and replace the Asset Representations Reviewer with a proposed successor Asset Representations Reviewer that is an eligible asset representations reviewer, and (ii) payment by such holders to the certificate administrator of the reasonable fees and expenses to be incurred by the certificate administrator in connection with administering such vote, the certificate administrator will promptly provide notice to all certificateholders and the Asset Representations Reviewer of such request by posting such notice on its internet website, and by mailing such notice to all certificateholders and the Asset Representations Reviewer. Upon the written direction of certificateholders evidencing at least 75% of a certificateholder quorum (without regard to the application of any Cumulative Appraisal Reduction Amounts), the Trustee will terminate all of the rights and obligations of the Asset Representations Reviewer under the BANK 2022-BNK43 pooling and servicing agreement by written notice to the Asset Representations Reviewer, and the proposed successor Asset Representations Reviewer will be appointed. See “Pooling and Servicing Agreement—The Asset Representations Reviewer” in the Preliminary Prospectus. | |
| Dispute Resolution Provisions: | The mortgage loan sellers will be subject to the dispute resolution provisions set forth in the BANK 2022-BNK43 pooling and servicing agreement to the extent those provisions are triggered with respect to any mortgage loan sold to the depositor by a mortgage loan seller and such mortgage loan seller will be obligated under the related mortgage loan purchase agreement to comply with all applicable provisions and to take part in any mediation or arbitration proceedings that may result. Generally, in the event that a Repurchase Request (as defined in the Preliminary Prospectus) is not “Resolved” (as defined below) within 180 days after the related mortgage loan seller receives such Repurchase Request, then the enforcing servicer will be required to send a notice to the “Initial Requesting Certificateholder” (if any) and the Certificate Administrator indicating the enforcing servicer’s intended course of action with respect to the Repurchase Request. If (a) the enforcing servicer’s intended course of action with respect to the Repurchase Request does not involve pursuing further action to exercise rights against the related mortgage loan seller with respect to the Repurchase Request and the Initial Requesting Certificateholder, if any, or any other certificateholder or certificate owner wishes to exercise its right to refer the matter to mediation (including non-binding arbitration) or arbitration, or (b) the enforcing servicer’s intended course of action is to pursue further action to exercise rights against the related mortgage loan seller with respect to the Repurchase Request but the Initial Requesting Certificateholder, if any, or any other certificateholder or certificate owner does not agree with the dispute resolution method selected by the enforcing servicer, then the Initial Requesting Certificateholder, if any, or such other certificateholder or certificate owner may deliver a written notice to the applicable Special Servicer indicating its intent to exercise its right to refer the matter to either mediation or arbitration. “Resolved” means, with respect to a Repurchase Request, (i) that the related Material Defect has been cured, (ii) the related mortgage loan has been repurchased in accordance with the related mortgage loan purchase agreement, (iii) a mortgage loan has been substituted for the related mortgage loan in accordance with the related mortgage loan purchase agreement, (iv) the applicable mortgage loan seller has made a Loss of Value Payment (as defined in the Preliminary Prospectus), (v) a contractually binding agreement is entered into between the enforcing servicer, on behalf of the issuing entity, and the related mortgage loan seller that settles the related mortgage loan seller’s obligations under the related mortgage loan purchase agreement, or (vi) the related mortgage loan is no longer property of the issuing entity as a result of a sale or other disposition in accordance with the BANK 2022-BNK43 pooling and servicing agreement. See “Pooling and Servicing Agreement—Dispute Resolution Provisions” in the Preliminary Prospectus. |
| Investor Communications: | The certificate administrator is required to include on any Form 10–D any request received from a certificateholder to communicate with other certificateholders related to certificateholders exercising their rights under the terms of the BANK 2022-BNK43 pooling and servicing agreement. Any certificateholder wishing to communicate with other certificateholders regarding the exercise of its rights under the terms of the BANK 2022-BNK43 pooling and servicing agreement will be able to deliver a written request signed by an authorized representative of the requesting investor to the certificate administrator. |
| Certain Fee Offsets: | If a workout fee is earned by a Special Servicer following a loan default with respect to any mortgage loan that it services, then certain limitations will apply based on modification fees paid by the borrower. The modification fee generally must not exceed 1% of the principal balance of |
| THE INFORMATION IN THIS STRUCTURAL AND COLLATERAL TERM SHEET IS NOT COMPLETE AND MAY BE AMENDED PRIOR TO THE TIME OF SALE. THIS TERM SHEET IS NOT AN OFFER TO SELL THESE SECURITIES AND IT IS NOT A SOLICITATION OF AN OFFER TO BUY THESE SECURITIES IN ANY JURISDICTION WHERE THE OFFER OR SALE IS NOT PERMITTED. | ||
| ||
| BANK 2022-BNK43 | Certain Terms and Conditions |
| the loan as modified in any 12-month period. In addition, if the loan re-defaults, any subsequent workout fee on that loan must be reduced by a portion of the modification fees paid by the borrower in the previous 12 months. Likewise, liquidation fees collected in connection with a liquidation or partial liquidation of a mortgage loan must be reduced by a portion of the modification fees paid by the borrower in the previous 12 months. | |
| Deal Website: | The Certificate Administrator will be required to maintain a deal website, which will include, among other items: (a) summaries of asset status reports prepared by each Special Servicer, (b) inspection reports, (c) appraisals, (d) various “special notices” described in the Preliminary Prospectus, (e) the “Investor Q&A Forum”, (f) a voluntary “Investor Registry” and (g) the “Risk Retention Special Notices” tab. Investors may access the deal website following execution of a certification and confidentiality agreement. |
| Initial Majority Controlling Class Certificateholder: | It is expected that Greystone Investment Capital LLC or its affiliate will be the initial majority controlling class certificateholder. |
| Whole Loans: | Each of the mortgaged properties identified above under “V. Characteristics of the Mortgage Pool—B. Summary of the Whole Loans” secures both a mortgage loan to be included in the trust fund and one or more other mortgage loans that will not be included in the trust fund, each of which will be pari passu or subordinate in right of payment with the mortgage loan included in the trust fund. We refer to each such group of mortgage loans as a “whole loan”. Such “—Summary of the Whole Loans” section includes further information regarding the various notes in each whole loan, the holders of such notes, the lead servicing agreement for each such whole loan, and the applicable master servicer and applicable special servicer under such lead servicing agreement. |
| THE INFORMATION IN THIS STRUCTURAL AND COLLATERAL TERM SHEET IS NOT COMPLETE AND MAY BE AMENDED PRIOR TO THE TIME OF SALE. THIS TERM SHEET IS NOT AN OFFER TO SELL THESE SECURITIES AND IT IS NOT A SOLICITATION OF AN OFFER TO BUY THESE SECURITIES IN ANY JURISDICTION WHERE THE OFFER OR SALE IS NOT PERMITTED. | ||
| ||
| Mixed Use – Office/Retail/Multifamily | Loan #1 | Cut-off Date Balance: | $100,000,000 | |
| 5310-5455 High Street | High Street | Cut-off Date LTV: | 71.5% | |
| Phoenix, AZ 85054 | U/W NCF DSCR: | 1.61x | ||
| U/W NOI Debt Yield: | 8.8% |
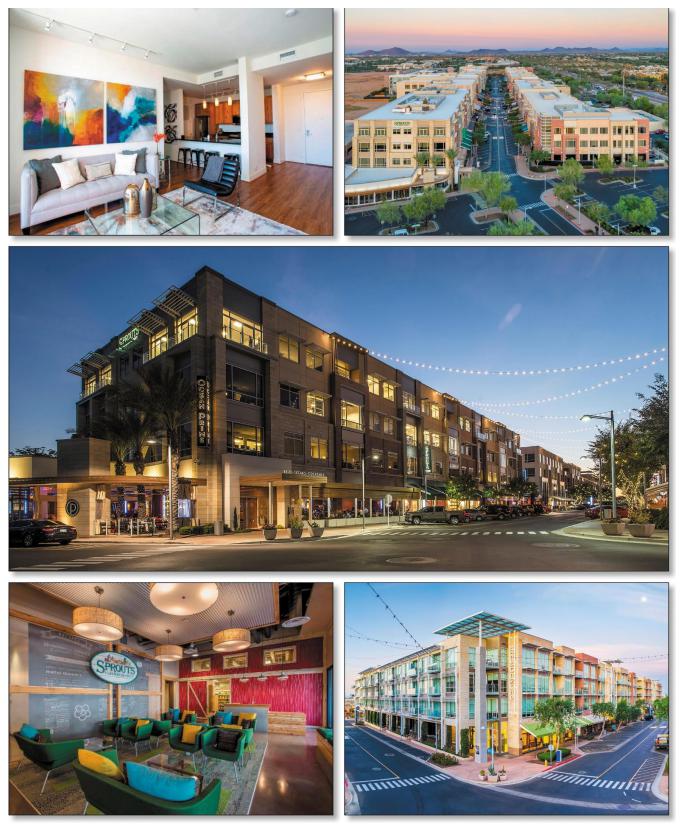
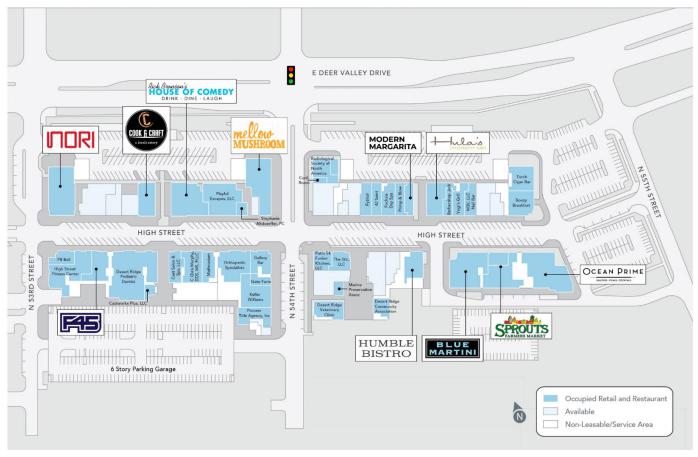
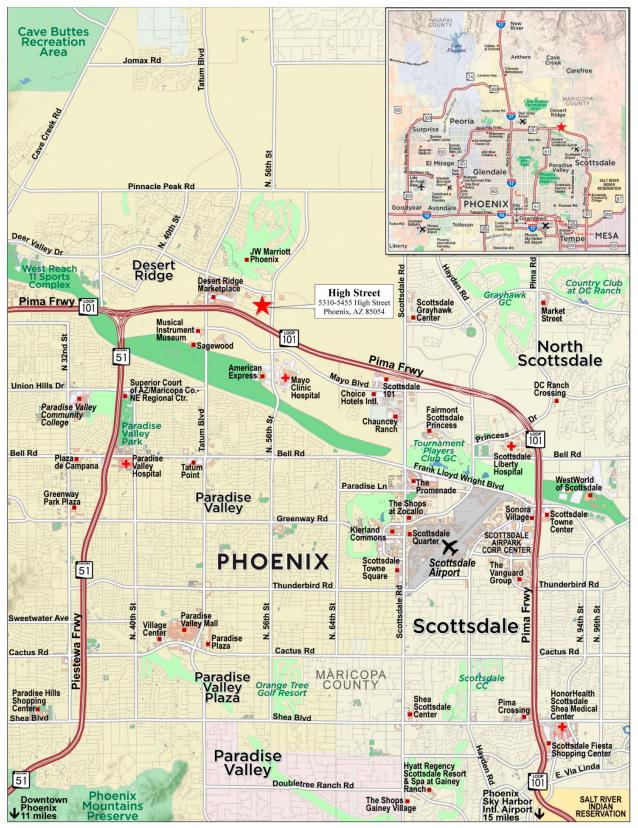
| THE INFORMATION IN THIS STRUCTURAL AND COLLATERAL TERM SHEET IS NOT COMPLETE AND MAY BE AMENDED PRIOR TO THE TIME OF SALE. THIS TERM SHEET IS NOT AN OFFER TO SELL THESE SECURITIES AND IT IS NOT A SOLICITATION OF AN OFFER TO BUY THESE SECURITIES IN ANY JURISDICTION WHERE THE OFFER OR SALE IS NOT PERMITTED. | ||
| ||
| No. 1 – High Street |
| Mortgage Loan Information | Mortgaged Property Information | |||||
| Mortgage Loan Sellers: | Wells Fargo Bank, National Association | Single Asset/Portfolio: | Single Asset | |||
Credit Assessment (Fitch/KBRA/Moody’s): | NR/NR/NR | Property Type – Subtype: | Mixed Use – Office/Retail/Multifamily | |||
| Original Principal Balance(1): | $100,000,000 | Location: | Phoenix, AZ | |||
| Cut-off Date Balance(1): | $100,000,000 | Size: | 630,083 SF | |||
| % of Initial Pool Balance: | 9.2% | Cut-off Date Balance Per SF(1): | $219.65 | |||
| Loan Purpose: | Acquisition | Maturity Date Balance Per SF(1): | $219.65 | |||
| Borrower Sponsors: | (2) | Year Built/Renovated: | 2008/NAP | |||
| Guarantors: | (2) | Title Vesting: | Leasehold | |||
| Mortgage Rate: | 5.3520% | Property Manager: | SKB PM I, LLC and GREP Southwest, LLC | |||
| Note Date: | June 17, 2022 | Current Occupancy (As of)(5): | 90.4% (6/8/2022) | |||
| Seasoning: | 1 month | 3/31/2022 TTM Occupancy(5): | 86.1% | |||
| Maturity Date: | July 11, 2032 | YE 2021 Occupancy(5): | 85.1% | |||
| IO Period: | 120 months | YE 2020 Occupancy(5): | 85.3% | |||
| Loan Term (Original): | 120 months | YE 2019 Occupancy(5): | 84.1% | |||
| Amortization Term (Original): | NAP | As-Is/As Stabilized Appraised Value(6): | $193,600,000 / $210,000,000 | |||
| Loan Amortization Type: | Interest Only | As-Is/As Stabilized Appraised Value Per SF(6): | $307.26 / $333.29 | |||
| Call Protection(3): | L(25),D(91),O(4) | As-Is/As Stabilized Appraisal Valuation Date(6): | May 10, 2022 / June 1, 2023 | |||
| Lockbox Type: | Hard/In Place Cash Management | Underwriting and Financial Information(7) | ||||
| Additional Debt(1): | Yes | TTM NOI (5/31/2022)(8): | $9,301,715 | |||
| Additional Debt Type (Balance)(1): | Pari Passu ($38,395,000) | YE 2021 NOI(9): | $9,224,773 | |||
| YE 2020 NOI(9): | $7,760,559 | |||||
| Escrows and Reserves(4) | YE 2019 NOI(9): | $6,788,355 | ||||
| Initial | Monthly | Cap | U/W Revenues: | $19,932,833 | ||
| Taxes | $436,773 | $145,591 | NAP | U/W Expenses: | $7,716,208 | |
| Insurance | $0 | Springing | NAP | U/W NOI(8): | $12,216,625 | |
| Replacement Reserve | $5,905,000 | Springing | $302,262 | U/W NCF: | $12,094,342 | |
| TI/LC Reserve | $8,992,000 | Springing | $1,520,073 | U/W DSCR based on NOI/NCF(1): | 1.63x / 1.61x | |
| Ground Rent Reserve | $30,583 | $30,583 | NAP | U/W Debt Yield based on NOI/NCF(1): | 8.8% / 8.7% | |
| Rent Concession Reserve | $708,593 | $0 | NAP | U/W Debt Yield at Maturity based on NOI/NCF(1): | 8.8% / 8.7% | |
| Existing TI/LC Reserve | $1,873,516 | $0 | NAP | As-Is/As Stabilized Cut-off Date LTV Ratio(1)(6): | 71.5% / 65.9% | |
| Prepaid Rent Reserve | $73,762 | $0 | NAP | As-Is/As Stabilized LTV Ratio at Maturity(1)(6): | 71.5% / 65.9% | |
| Sources and Uses | |||||||
| Sources | Uses | ||||||
| Whole loan amount | $138,395,000 | 65.4 | % | Purchase Price(10) | $192,103,940 | 90.7% | |
| Sponsor Equity | 70,165,911 | 33.1 | Upfront Reserves | 18,020,228 | 8.5% | ||
| Seller Credits(11) | 3,140,548 | 1.5 | Closing Costs | 1,577,292 | 0.7% | ||
| Total Sources | $211,701,459 | 100.0 | % | Total Uses | $211,701,459 | 100.0% | |
| (1) | The High Street Mortgage Loan (as defined below) is part of the High Street Whole Loan (as defined below) with an original aggregate principal balance of $138,395,000. The Cut-off Date Balance per SF, Maturity Date Balance per SF, U/W Debt Yield based on NOI/NCF, U/W Debt Yield based on NOI/NCF at Maturity, U/W DSCR based on NOI/NCF, As-Is/As Stabilized Cut-off Date LTV Ratio and As-Is/As Stabilized LTV Ratio at Maturity numbers presented above are based on the High Street Whole Loan. |
| (2) | The Borrower Sponsors and Guarantors are ScanlanKemperBard Companies, LLC, Todd M. Gooding, James V. Paul, Gary J. Rood, and Gary J. Rood and Christine C. Rood as co-trustees of the Rood Family Trust U/T/A dated September 8, 2005 |
| (3) | Defeasance of the High Street Whole Loan is permitted at any time after the earlier to occur of (a) the end of the two-year period commencing on the closing date of the securitization of the last promissory note representing a portion of the High Street Whole Loan to be securitized and (b) August 11, 2025. The assumed defeasance lockout period of 25 payments is based on the closing date of this transaction in August 2022. |
| (4) | See “Escrows” below for further discussion of reserve requirements. |
| (5) | Occupancy is based on the total NRSF of 630,083 comprising both the Commercial Component and Multifamily Component of the High Street Property (as defined below). |
| (6) | The appraiser also concluded to an “As stabilized” appraised value of $210,000,000 ($333.29 per SF, 65.9% Cut-off Date LTV Ratio and 65.9% LTV Ratio at Maturity) as of June 1, 2023, which assumes the retail space is 90.0% occupied and that there is an approximately 20.7% increase in post renovation multifamily market rent. At origination, the lender reserved $8,992,000 for TI/LCs and $5,905,000 for replacements. |
| (7) | The novel coronavirus pandemic is an evolving situation and could impact the High Street Whole Loan more severely than assumed in the underwriting of the High Street Whole Loan and could adversely affect the NOI, NCF and occupancy information, as well as the appraised value and the DSCR, LTV and Debt Yield metrics presented above |
| THE INFORMATION IN THIS STRUCTURAL AND COLLATERAL TERM SHEET IS NOT COMPLETE AND MAY BE AMENDED PRIOR TO THE TIME OF SALE. THIS TERM SHEET IS NOT AN OFFER TO SELL THESE SECURITIES AND IT IS NOT A SOLICITATION OF AN OFFER TO BUY THESE SECURITIES IN ANY JURISDICTION WHERE THE OFFER OR SALE IS NOT PERMITTED. | ||
| ||
| Mixed Use – Office/Retail/Multifamily | Loan #1 | Cut-off Date Balance: | $100,000,000 | |
| 5310-5455 High Street | High Street | Cut-off Date LTV: | 71.5% | |
| Phoenix, AZ 85054 | U/W NCF DSCR: | 1.61x | ||
| U/W NOI Debt Yield: | 8.8% |
| and herein. See "Risk Factors—Risks Related to Market Conditions and Other External Factors—The Coronavirus Pandemic Has Adversely Affected the Global Economy and Will Likely Adversely Affect the Performance of the Mortgage Loans" in the prospectus. | ||
| (8) | The increase in Net Operating Income between TTM 5/31/2022 and U/W is primarily due to (i) 15 new and renewal leases (23.5% of Commercial Component NRA and 30.2% of Commercial Component underwritten base rent) commencing between January 2022 and June 2023 and (ii) Commercial Base Rent includes contractual rent steps through August 2023 totaling $290,878. |
| (9) | The increase in Net Operating Income between 2019 and 2020 and, subsequently, between 2020 and 2021 was primarily due to 35 new and renewal leases (28.7% of Commercial Component NRA and 33.7% of Commercial Component underwritten base rent) commencing between January 2019 and December 2021. |
| (10) | SKB (as defined below) previously owned 15% of the High Street Property and, at origination, retained 10% ownership in the High Street Property. |
| (11) | Includes seller credits for outstanding TI/LCs and rent concessions. |
The Mortgage Loan. The largest mortgage loan (the “High Street Mortgage Loan”) is part of a whole loan (the “High Street Whole Loan”) secured by the leasehold interests in a 630,083 square foot mixed use property comprising office, retail, and multifamily components located in Phoenix, Arizona (the “High Street Property”). The High Street Whole Loan has an original aggregate principal balance of $138,395,000 and is comprised of two pari passu notes. The High Street Mortgage Loan, with an aggregate original principal balance of $100,000,000 is evidenced by the controlling Note A-1. The non-controlling Note A-2, with an aggregate original principal balance of $38,395,000, is currently held by WFB. The High Street Whole Loan will be serviced under the pooling and servicing agreement for the BANK 2022-BNK43 securitization trust. See “Description of the Mortgage Pool—The Whole Loans—The Non-Serviced Pari Passu Whole Loans” and “Pooling and Servicing Agreement—Servicing of the Non-Serviced Mortgage Loans” in the prospectus.
Whole Loan Note Summary
| Notes | Original Balance | Cut-off Date Balance | Note Holder | Controlling Piece |
| A-1 | $100,000,000 | $100,000,000 | BANK 2022-BNK43 | Yes |
| A-2 | $38,395,000 | $38,395,000 | WFB | No |
| Total (Whole Loan) | $138,395,000 | $138,395,000 |
The Borrower and Borrower Sponsors. The borrowers comprise four tenants in common, RI East County HS Owner, LLC, RI Glenwood Lofts HS Owner, LLC, RI Glenwood Place HS Owner, LLC, and SKB-HS Owner LLC, each a Delaware limited liability company and single-purpose entity with one independent director. The borrower sponsors and non-recourse carveout guarantors are ScanlanKemperBard Companies, LLC, Todd M. Gooding, James V. Paul, Gary J. Rood, and Gary J. Rood and Christine C. Rood as co-trustees of the Rood Family Trust U/T/A Dated September 8, 2005.
ScanlanKemperBard Companies, LLC (“SKB”) is a real estate investor, operator, and developer specializing in urban industrial and suburban mixed use commercial properties. SKB has over 25 years of experience and currently has a team of over 80 professionals. Headquartered in Portland, Oregon, SKB’s portfolio comprises 5.5 million square feet valued at approximately $1.4 billion. For additional information on the borrower sponsor and guarantors please see “Description of the Mortgage Pool - Loan Purpose; Default History, Bankruptcy Issues and Other Proceedings”.
Gary Rood and Christine Rood are CEO and President, respectively, and co-owners of Rood Investments. Founded in 2007, Rood Investments is a privately held asset management and real estate investment company located in Vancouver, Washington. Today, Rood Investments oversees the management of a 25 property portfolio of senior housing, retail, industrial, and multifamily holdings located across nine states valued at approximately $640 million.
The Property. The High Street Property is comprised of the borrowers’ leasehold interests in a 630,038 square foot mixed use office, retail and multifamily development as well as a six- and a three-level parking garage located in Phoenix, Arizona. Built in 2008 and situated on a 20.0-acre site, the High Street Property includes nine, three- and four-story buildings. The property features 506,691 square feet of commercial space (333,128 square feet of office and 173,563 square feet of retail) and 99 multifamily units (123,392 square feet). The property contains 2,090 garage and surface parking spaces, resulting in a parking ratio of 3.32 spaces per 1,000 SF of rentable area. As of June 8, 2022, the property was 90.4% leased.
Office
The High Street Property includes 333,128 square feet of office space (the “Office Component”) comprising 52.9% of net rentable area and 62.9% of underwritten base rent. Tenant suites range in size from 225 square feet to 89,220 square feet. As of June 8, 2022, the Office Component is 93.2% leased to 27 tenants and has averaged 86.6% occupancy since 2016. Since January 2020, there have been 19 new and renewal leases comprising 28.5% of commercial net rentable area and 38.2% of underwritten commercial base rent.
Retail
The High Street Property includes 173,563 square feet of retail space (the “Retail Component” and, together with the Office Component, the “Commercial Component”) comprising 27.5% of net rentable area and 19.7% of underwritten base rent. The largest tenants include Sprouts Farmers Market (“Sprouts”), Desert Ridge Pediatric Dentist, Ocean Prime, Nori Sushi, and Mellow Mushroom. As of June 8, 2022, the Retail Component is 80.1% leased to 39 tenants and has averaged 71.5% occupancy since 2016. The as-stabilized appraised value as of June 1, 2023 assumes the retail space is 90.0% occupied. At origination, the lender reserved $8,992,000 for TI/LCs.
Multifamily
The High Street Property includes 99 multifamily units totaling 123,392 square feet (the “Multifamily Component”) comprising 19.6% of net rentable area and 17.4% of underwritten base rent. The Multifamily Component amenities include a courtyard with a heated pool, two areas with gas BBQs with adjacent granite countertops, outdoor gas fireplace, pet area, fitness center, and EV charging
| THE INFORMATION IN THIS STRUCTURAL AND COLLATERAL TERM SHEET IS NOT COMPLETE AND MAY BE AMENDED PRIOR TO THE TIME OF SALE. THIS TERM SHEET IS NOT AN OFFER TO SELL THESE SECURITIES AND IT IS NOT A SOLICITATION OF AN OFFER TO BUY THESE SECURITIES IN ANY JURISDICTION WHERE THE OFFER OR SALE IS NOT PERMITTED. | ||
| ||
| Mixed Use – Office/Retail/Multifamily | Loan #1 | Cut-off Date Balance: | $100,000,000 | |
| 5310-5455 High Street | High Street | Cut-off Date LTV: | 71.5% | |
| Phoenix, AZ 85054 | U/W NCF DSCR: | 1.61x | ||
| U/W NOI Debt Yield: | 8.8% |
stations. Units feature a private patio or balcony, granite countertops, stainless steel appliances, inclusive of GE refrigerator, range, microwave and dishwasher. In total, there are 24 one-bedrooms, 66 two-bedrooms and 9 three-bedrooms, with unit sizes ranging from 753 square feet to 1,855 square feet. There are 188 parking spaces designated to the Multifamily Component (this equates to a parking ratio of 1.90 per unit). As of June 8, 2022, the Multifamily Component was 97.0% leased (by units) and has averaged 96.1% occupancy since 2014.
According to the appraisal, the borrowers plan to renovate certain portions of the Multifamily Component, including unit interiors and portions on the common areas, between 2022 and 2023 (as units turn) for an approximate cost of $2,500,000. At origination, the lender reserved $5,905,000 for replacements.
Major Tenants.
Sprouts (95,832 square feet, 18.9% commercial net rentable area, 19.6% underwritten commercial base rent, April 30, 2029 expiration). Sprouts, which currently has more than 370 stores, was founded in 2002 and focuses on farm fresh produce and other healthy, affordable items. Sprouts occupies 89,220 square feet of office space and 6,612 square feet of retail space at the property, which serves as its headquarters. Sprouts has been a tenant at the property since 2015 and has a lease expiring in April 2029 with two, 5-year renewal options remaining. Sprouts has the option to terminate its lease on April 30, 2024 and April 30, 2027 with 12 months’ notice and by paying a termination fee (for the first option only) equal to unamortized TI/LCs and free rent plus two months’ of rent and CAM reimbursements. Sprouts is not required to report sales.
Life Insurance Company of North America (23,562 square feet, 4.7% of commercial net rentable area; 6.4% of underwritten commercial base rent, July 31, 2023 expiration). Life Insurance Company of North America was acquired by New York Life in December 2020. New York Life is a top five insurer across group life, accident and disability insurance. Life Insurance Company of North America has been an office tenant at the property since 2012 and is on a lease expiring on July 31, 2023 with one, 5-year renewal option and no termination options.
Navitus Health Solutions, LLC (22,405 square feet; 4.4% of commercial net rentable area; 6.0% of underwritten commercial base rent, October 31, 2023 expiration). Navitus Health Solutions, LLC (“Navitus”), which is a subsidiary of SSM Health and Costco Wholesale Corporation (Fitch/Moody’s/S&P: NR/Aa3/NR), is a pass-through pharmacy benefit manager and industry alternative to traditional models. Navitus is focused on making prescriptions more affordable for plan sponsors and members. Navitus has been an office tenant at the property since 2015 and is on a lease expiring on October 31, 2023 with one, 5-year renewal option and no termination options.
The following table presents certain information relating to the tenancy of the Commercial Component at the High Street Property:
Major Tenants
| Tenant Name (Property) | Credit Rating (Fitch/ Moody’s/ | Tenant NRSF | % of NRSF(2) | Annual U/W Base Rent PSF(3) | Annual U/W Base Rent(3) | % of Total Annual U/W Base Rent(2) | Lease Expiration Date | Extension Options | Termination Option (Y/N) |
| Major Tenants | |||||||||
| Sprouts | NR/NR/NR | 95,832 | 18.9% | $28.65(4) | $2,746,026 | 19.6% | 4/30/2029 | 2, 5 year | Y(5) |
| Life Insurance Company of North America | AAA/Aaa/NR | 23,562 | 4.7% | $38.00 | $895,356 | 6.4% | 7/31/2023 | 1, 5 year | N |
| Navitus | NR/Aa3/NR | 22,405 | 4.4% | $37.25 | $834,586 | 6.0% | 10/31/2023 | 1, 5 year | N |
| RT Specialty | NR/NR/NR | 20,946 | 4.1% | $36.75 | $769,766 | 5.5% | 10/31/2027 | 2, 5 year | N |
| Healthiest You Teledoc | NR/NR/NR | 19,179 | 3.8% | $34.35 | $658,799 | 4.7% | 9/30/2023 | 1, 5 year | N |
| Total Major Tenants | 181,924 | 35.9% | $32.46 | $5,904,532 | 42.2% | ||||
| Non-Major Tenant | 267,533 | 52.8% | $30.24 | $8,090,008 | 57.8% | ||||
| Occupied Collateral Total | 449,457 | 88.7% | $31.14 | $13,994,540 | 100.0% | ||||
| Vacant Space | 57,234 | 11.3% | |||||||
| Collateral Total | 506,691(2) | 100.0% | |||||||
| (1) | Certain ratings are those of the parent company whether or not the parent company guarantees the lease. |
| (2) | Represents the % of NRSF based on the total net rental area for the Commercial Component of 506,691 and the % of Total Annual U/W Base Rent for the Commercial Component of $13,994,540. |
| (3) | Annual U/W Base Rent PSF and Annual U/W Base Rent include contractual rent steps through August 2023 totaling $290,878 |
| (4) | Sprouts pays $27.50 PSF on 77,391 SF of space and $33.50 PSF on 18,441 SF of space. |
| (5) | Sprouts may terminate its lease on April 30, 2024 and April 30, 2027 with 12 months’ notice and by paying a termination fee (for the first option only) equal to unamortized TI/LCs and free rent plus two months’ of rent and CAM reimbursements. |
| THE INFORMATION IN THIS STRUCTURAL AND COLLATERAL TERM SHEET IS NOT COMPLETE AND MAY BE AMENDED PRIOR TO THE TIME OF SALE. THIS TERM SHEET IS NOT AN OFFER TO SELL THESE SECURITIES AND IT IS NOT A SOLICITATION OF AN OFFER TO BUY THESE SECURITIES IN ANY JURISDICTION WHERE THE OFFER OR SALE IS NOT PERMITTED. | ||
| ||
| Mixed Use – Office/Retail/Multifamily | Loan #1 | Cut-off Date Balance: | $100,000,000 | |
| 5310-5455 High Street | High Street | Cut-off Date LTV: | 71.5% | |
| Phoenix, AZ 85054 | U/W NCF DSCR: | 1.61x | ||
| U/W NOI Debt Yield: | 8.8% |
The following table presents certain information relating to the lease rollover schedule of the Commercial Component at the High Street Property:
Lease Expiration Schedule(1)(2)(3)
| Year Ending December 31, | No. of Leases Expiring | Expiring NRSF | % of Total NRSF | Cumulative Expiring NRSF | Cumulative % of Total NRSF | Annual U/W Base Rent | % of Total Annual U/W Base Rent | Annual U/W Base Rent PSF(4) |
| MTM | 0 | 0 | 0.0% | 0 | 0.0% | $0 | 0.0% | $0.00 |
| 2022 | 1 | 829 | 0.2% | 829 | 0.2% | $21,140 | 0.2% | $25.50 |
| 2023 | 11 | 107,736 | 21.3% | 108,565 | 21.4% | $3,536,117 | 25.3% | $32.82 |
| 2024 | 9 | 28,682 | 5.7% | 137,247 | 27.1% | $972,855 | 7.0% | $33.92 |
| 2025 | 9 | 30,116 | 5.9% | 167,363 | 33.0% | $938,926 | 6.7% | $31.18 |
| 2026 | 10 | 45,817 | 9.0% | 213,180 | 42.1% | $1,627,033 | 11.6% | $35.51 |
| 2027 | 5 | 41,551 | 8.2% | 254,731 | 50.3% | $1,471,173 | 10.5% | $35.41 |
| 2028 | 4 | 26,028 | 5.1% | 280,759 | 55.4% | $819,956 | 5.9% | $31.50 |
| 2029 | 7 | 98,813 | 19.5% | 379,572 | 74.9% | $2,842,189 | 20.3% | $28.76 |
| 2030 | 5 | 24,290 | 4.8% | 403,862 | 79.7% | $768,471 | 5.5% | $31.64 |
| 2031 | 4 | 15,338 | 3.0% | 419,200 | 82.7% | $402,238 | 2.9% | $26.22 |
| 2032 | 5 | 17,593 | 3.5% | 436,793 | 86.2% | $468,507 | 3.3% | $26.63 |
| Thereafter | 4 | 12,664(5) | 2.5%(5) | 449,457 | 88.7% | $125,936 | 0.9% | $9.94 |
| Vacant | 0 | 57,234 | 11.3% | 506,691 | 100.0% | $0 | 0.0% | $0.00 |
| Total/Weighted Average | 74 | 506,691 | 100.0% | $13,994,540 | 100.0% | $31.14 |
| (1) | Information obtained from the underwritten rent roll. |
| (2) | Certain tenants may have lease termination options that are exercisable prior to the originally stated expiration date of the subject lease and that are not considered in the Lease Expiration Schedule. |
| (3) | Represents lease expiration information related to the Commercial Component at the High Street Property and excludes the Multifamily Component, which comprises 123,392 square feet and $2,952,497 of Annual U/W Base Rent |
| (4) | Total/Weighted Average Annual U/W Base Rent PSF excludes vacant space. |
| (5) | Includes 7,339 square feet of space occupied by management with no rent attributed to the space. |
The following table presents certain information relating to the unit mix of the Multifamily Component at the High Street Property:
Unit Mix Summary(1)
| Unit Type | Total No. of Units | Occupied Units | % of Total Units | Occupancy | Average Unit Size (SF) | Average Underwritten Monthly Rent per Unit |
| 1 Bedroom, 1 Bathroom | 24 | 23 | 24.2% | 95.8% | 876 | $1,951 |
| 2 Bedrooms, 2 Bathrooms | 60 | 58 | 60.6% | 96.7% | 1,263 | $2,570 |
| 2 Bedrooms, 2.5 Bathrooms | 6 | 6 | 6.1% | 100.0% | 1,696 | $3,374 |
| 3 Bedrooms, 2.5 Bathrooms | 9 | 9 | 9.1% | 100.0% | 1,822 | $3,540 |
| Total/Weighted Average | 99 | 96 | 100.0% | 97.0% | 1,246 | $2,563 |
The following table presents historical occupancy percentages at the High Street Property:
Combined Historical Occupancy
12/31/2019(1) | 12/31/2020(1) | 12/31/2021(1) | TTM 3/31/2022(1) | 6/8/2022(2) |
| 84.1% | 85.3% | 85.1% | 86.1% | 90.4% |
| (1) | Information obtained from the borrower. |
| (2) | Information obtained from the underwritten rent roll. |
| THE INFORMATION IN THIS STRUCTURAL AND COLLATERAL TERM SHEET IS NOT COMPLETE AND MAY BE AMENDED PRIOR TO THE TIME OF SALE. THIS TERM SHEET IS NOT AN OFFER TO SELL THESE SECURITIES AND IT IS NOT A SOLICITATION OF AN OFFER TO BUY THESE SECURITIES IN ANY JURISDICTION WHERE THE OFFER OR SALE IS NOT PERMITTED. | ||
| ||
| Mixed Use – Office/Retail/Multifamily | Loan #1 | Cut-off Date Balance: | $100,000,000 | |
| 5310-5455 High Street | High Street | Cut-off Date LTV: | 71.5% | |
| Phoenix, AZ 85054 | U/W NCF DSCR: | 1.61x | ||
| U/W NOI Debt Yield: | 8.8% |
Underwritten Net Cash Flow. The following table presents certain information relating to the underwritten net cash flow at the High Street Property:
Cash Flow Analysis
| 2019 | 2020 | 2021 | TTM 5/31/2022 | U/W | %(1) | U/W $ per SF(2) | |
| Commercial Base Rent | $10,313,704 | $10,866,962 | $11,799,778 | $12,346,127 | $13,994,540(3) | 64.5% | $27.62 |
| Percentage Rent | 455,003 | 335,077 | 673,113 | 750,934 | 518,745 | 2.4 | 1.02 |
| Grossed Up Vacant Space | 0 | 0 | 0 | 0 | 1,698,796 | 7.8 | 3.35 |
| Commercial Gross Potential Rent | $10,768,707 | $11,202,039 | $12,472,891 | $13,097,061 | $16,212,081 | 74.7% | $32.00 |
| Multifamily Base Rent | 2,355,590 | 2,344,540 | 2,616,933 | 2,800,614 | 2,952,497 | 13.6 | 23.93 |
| Grossed Up Vacant Space | 283,584 | 371,976 | 215,444 | 26,327 | 78,396 | 0.4 | 0.64 |
| Multifamily Gross Potential Rent | $2,639,174 | $2,716,516 | $2,832,376 | $2,826,941 | $3,030,893 | 14.0% | $24.56 |
| Gross Potential Rent | $13,407,881 | $13,918,554 | $15,305,268 | $15,924,002 | $19,242,974 | 88.6% | $30.54 |
| Other Income | 592,043 | 486,163 | 521,636 | 499,675 | 499,675 | 2.3 | 0.79 |
| Parking Income | 590,017 | 579,291 | 616,455 | 626,442 | 626,442 | 2.9 | 0.99 |
| Expense Reimbursements | 915,410 | 954,847 | 1,031,677 | 1,006,902 | 1,340,934 | 6.2 | 2.13 |
| Net Rental Income | $15,505,351 | $15,938,856 | $17,475,035 | $18,057,021 | $21,710,025 | 100.0% | $34.46 |
| (Commercial Vacancy) | 0 | 0 | 0 | 0 | (1,698,796) | (10.5)(4) | (3.35) |
| (Multifamily Vacancy) | (283,584) | (371,976) | (215,444) | (26,327) | (78,396) | (2.6)(5) | (0.64) |
| (Concessions & Collection Loss) | (1,586,084) | (1,016,644) | (949,605) | (1,344,475) | 0 | 0.0 | (0.00) |
| Effective Gross Income | $13,635,683 | $14,550,236 | $16,309,986 | $16,686,219 | $19,932,833 | 91.8% | $31.64 |
| Real Estate Taxes | 1,617,241 | 1,613,128 | 1,664,368 | 1,695,466 | 1,762,950 | 8.8 | 2.80 |
| Insurance | 128,281 | 161,446 | 179,204 | 194,752 | 250,444 | 1.3 | 0.40 |
| Ground Rent | 297,976 | 330,728 | 346,383 | 348,418 | 439,267 | 2.2 | 0.70 |
| Management Fee | 521,734 | 532,425 | 606,601 | 637,870 | 755,550 | 3.8 | 1.20 |
| Other Operating Expenses | 4,282,096 | 4,151,949 | 4,288,658 | 4,507,998 | 4,507,998 | 22.6 | 7.15 |
| Total Operating Expenses | $6,847,328 | $6,789,677 | $7,085,214 | $7,384,504 | $7,716,208 | 38.7% | $12.25 |
| Net Operating Income | $6,788,355(6) | $7,760,559(6) | $9,224,773(6) | $9,301,715(7) | $12,216,625(7) | 61.3% | $19.39 |
| Replacement Reserves | 0 | 0 | 0 | 0 | 100,754 | 0.5 | 0.16 |
| TI/LC | 0 | 0 | 0 | 0 | 21,529(8) | 0.1 | 0.03 |
| Net Cash Flow | $6,788,355 | $7,760,559 | $9,224,773 | $9,301,715 | $12,094,342 | 60.7% | $19.19 |
| NOI DSCR(9) | 0.90x | 1.03x | 1.23x | 1.24x | 1.63x | ||
| NCF DSCR(9) | 0.90x | 1.03x | 1.23x | 1.24x | 1.61x | ||
| NOI Debt Yield(9) | 4.9% | 5.6% | 6.7% | 6.7% | 8.8% | ||
| NCF Debt Yield(9) | 4.9% | 5.6% | 6.7% | 6.7% | 8.7% |
| (1) | Represents (i) percent of Net Rental Income for all revenue fields, (ii) percent of Commercial Gross Potential Rent for Commercial Vacancy, (iii) percent of Multifamily Gross Potential Rent for Multifamily Vacancy, and (iv) percent of Effective Gross Income for all other fields. |
| (2) | Represents (i) U/W $ PSF based on the commercial NRSF for commercial revenue and vacancy fields, (ii) U/W $ PSF based on the multifamily NRSF for multifamily revenue and vacancy fields, and (iii) U/W $ PSF based on the total NRSF for all other fields. |
| (3) | Includes contractual rent steps through August 2023 totaling $290,878. |
| (4) | The underwritten economic vacancy is 10.5%. The Commercial Component of the High Street Property was 88.7% leased as of June 8, 2022. |
| (5) | The underwritten economic vacancy is 2.6%. The Multifamily Component of the High Street Property was 97.0% leased as of June 8, 2022. |
| (6) | The increase in Net Operating Income between 2019 and 2020 and 2020 and 2021 was primarily due to 35 new and renewal leases (28.7% of Commercial Component NRA and 33.7% of Commercial Component underwritten base rent) commencing between January 2019 and December 2021. |
| (7) | The increase in Net Operating Income between TTM 5/31/2022 and U/W is primarily due to (i) 15 new and renewal leases (23.5% of Commercial Component NRA and 30.2% of Commercial Component underwritten base rent) commencing between January 2022 and June 2023, (ii) TTM 5/31/2022 includes rent concessions totaling $1,086,530, and (iii) U/W Commercial Base Rent includes contractual rent steps through August 2023 totaling $290,878. |
| (8) | Includes a credit totaling $899,200, which represents 10% of the upfront TI/LC reserve. |
| (9) | The NOI and NCF DSCR and NOI and NCF Debt Yield are based on the High Street Whole Loan. |
| THE INFORMATION IN THIS STRUCTURAL AND COLLATERAL TERM SHEET IS NOT COMPLETE AND MAY BE AMENDED PRIOR TO THE TIME OF SALE. THIS TERM SHEET IS NOT AN OFFER TO SELL THESE SECURITIES AND IT IS NOT A SOLICITATION OF AN OFFER TO BUY THESE SECURITIES IN ANY JURISDICTION WHERE THE OFFER OR SALE IS NOT PERMITTED. | ||
| ||
| Mixed Use – Office/Retail/Multifamily | Loan #1 | Cut-off Date Balance: | $100,000,000 | |
| 5310-5455 High Street | High Street | Cut-off Date LTV: | 71.5% | |
| Phoenix, AZ 85054 | U/W NCF DSCR: | 1.61x | ||
| U/W NOI Debt Yield: | 8.8% |
Appraisal. According to the appraisal, the High Street Property had an “As Is” appraised value of $193,600,000 as of May 10, 2022. The appraisal concluded to an “As stabilized” appraised value of $210,000,000 ($333.29 per SF, 65.9% cut-off date LTV) as of June 1, 2023, which assumes the Retail Component is 90.0% occupied (80.1% occupied as of June 8, 2022) and that there is an approximately 20.7% increase in post-renovation multifamily market rent. According to the appraisal, the borrowers plan to renovate certain portions of the Multifamily Component, including unit interiors and portions on the common areas, between 2022 and 2023 (as units turn) for an approximate cost of $2,500,000. At origination, the lender reserved $8,992,000 for TI/LCs and $5,905,000 for replacements.
Environmental Matters. According to the Phase I environmental site assessment dated March 25, 2022, there was no evidence of any recognized environmental conditions at the High Street Property.
Market Overview and Competition. The High Street Property is located in the Desert Ridge master-planned community in northeast Phoenix, approximately 17 miles from the central business district. Desert Ridge is a 5,700 acre master-planned community located to both the north and south of the Loop 101. Development of Desert Ridge began in 1997 and now includes the 1.1 million square foot Desert Ridge Marketplace power retail center, the 950-room JW Marriott Desert Ridge Resort and Spa, two 18-hole golf courses, and three schools. Desert Ridge is home to Mayo Clinic Hospital and an American Express regional office. According to the appraisal, the population’s average annual growth rate between 2010 and 2022 within a one-, three, and five-mile radius was 6.2%, 2.7%, and 2.0%, respectively. According to the appraisal, the estimated 2022 population within a one-, three- and five-mile radius was approximately 5,882, 65,634, and 199,129, respectively, and the average household income within the same radii was $120,361, $126,319 and $115,545, respectively.
According to a third party market research report, the Office Component is situated within the Paradise Valley submarket of the Phoenix office market. As of July 2022, the Paradise Valley submarket reported inventory of approximately 5.4 million SF with an 11.0% vacancy rate (and a 12.2% availability rate) and average asking rents of $27.75 PSF. The appraisal concluded to market rents ranging from $36.00 to $37.00 per square foot, modified gross, for the various floors of office space at the High Street Property (see table below).
According to a third party market research report, the Retail Component is located within the North Scottsdale submarket of the Phoenix retail market. As of July 2022, the North Scottsdale submarket reported total inventory of approximately 13.9 million SF with a 4.6% vacancy rate and average asking rent of $26.22 PSF. The appraisal concluded to market rents ranging from $21.00 to $29.00 per square foot, triple net, for the retail spaces at the High Street Property (see table below).
According to a third party market research report, the Multifamily Component is located within the North Phoenix submarket of the Phoenix multifamily market. As of July 2022, the North Phoenix multifamily submarket reported total inventory of 41,441 units with a 5.6% vacancy rate and average asking rents of $1,404 per unit (per month). The appraisal concluded to market rents ranging from $1,941 per unit (per month) to $3,625 per unit (per month) for various multifamily unit types at the High Street Property (see table below).
The following table presents certain information relating to the appraisal’s market rent conclusion for the Office Component at the High Street Property:
Office Component Market Rent Summary(1)
| >5,000 square feet | <5,000 square feet | Sprouts | |
| Market Rent (PSF) | $36.50 | $37.00 | $36.00 |
| Lease Term (Years) | 5.4 | 5.4 | 5.4 |
| Lease Type (Reimbursements) | BY Stop | BY Stop | BY Stop |
| Rent Increase Projection | $0.75 PSF annually | $0.75 PSF annually | $0.75 PSF annually |
| Tenant Improvements (New/Renewal) | $50/$20 | $50/$20 | $50/$20 |
| Leasing Commissions (New/Renewal) | 8.5%/5.5% | 8.5%/5.5% | 8.5%/5.5% |
| (1) | Information obtained from the appraisal. |
| THE INFORMATION IN THIS STRUCTURAL AND COLLATERAL TERM SHEET IS NOT COMPLETE AND MAY BE AMENDED PRIOR TO THE TIME OF SALE. THIS TERM SHEET IS NOT AN OFFER TO SELL THESE SECURITIES AND IT IS NOT A SOLICITATION OF AN OFFER TO BUY THESE SECURITIES IN ANY JURISDICTION WHERE THE OFFER OR SALE IS NOT PERMITTED. | ||
| ||
| Mixed Use – Office/Retail/Multifamily | Loan #1 | Cut-off Date Balance: | $100,000,000 | |
| 5310-5455 High Street | High Street | Cut-off Date LTV: | 71.5% | |
| Phoenix, AZ 85054 | U/W NCF DSCR: | 1.61x | ||
| U/W NOI Debt Yield: | 8.8% |
The following table presents certain information relating to the appraisal’s market rent conclusion for the Retail Component at the High Street Property:
Retail Component Market Rent Summary(1)
| Large Restaurants | Small Restaurants | Other | |
| Market Rent (PSF)(2) | $25.00 | $25.00 | $25.00 |
| Lease Term (Years) | 10 | 5 | 5 |
| Lease Type (Reimbursements) | NNN | NNN | NNN |
| Rent Increase Projection | 3.0% annually | 3.0% annually | 3.0% annually |
| Tenant Improvements (New/Renewal) | $60/$20 | $60/$20 | $40/$10 |
| Leasing Commissions (New/Renewal) | 8.5%/5.5% | 8.5%/5.5% | 8.5%/5.5% |
| (1) | Information obtained from the appraisal. |
| (2) | The appraiser did not include market rents for the market rent categories above but concluded to market rents ranging from $21.00 to $29.00 for the individual tenant suites at the property with an average of $25.00 PSF. |
The following table presents certain information relating to the appraisal’s market rent conclusion for the Multifamily Component at the High Street Property:
Multifamily Component Market Rent Summary
| Market Rent Summary | ||||||||
| Unit Mix / Type | Units(1)) | Average Unit Size (square feet)(1) | Avg. Monthly Rent per Unit(1) | Avg. Monthly Rent PSF (1) | Avg. Monthly Market Rent per Unit(2) | Avg. Monthly Market Rent PSF(2) | Avg. Monthly Market Rent per Unit (Renovated)(2) | Avg. Monthly Market Rent PSF(Renovated)(2) |
| 1 Bedroom, 1 Bathroom | 24 | 876 | $1,951 | $2.23 | $1,941 | $2.22 | $2,410 | $2.75 |
| 2 Bedrooms, 2 Bathrooms | 60 | 1,263 | $2,570 | $2.03 | $2,462 | $1.95 | $2,987 | $2.36 |
| 2 Bedrooms, 2.5 Bathrooms | 6 | 1,696 | $3,374 | $1.99 | $3,555 | $2.10 | $4,131 | $2.44 |
| 3 Bedrooms, 2.5 Bathrooms | 9 | 1,822 | $3,540 | $1.94 | $3,625 | $1.99 | $4,207 | $2.31 |
| (1) | Based on the borrower rent roll dated June 8, 2022. |
| (2) | Based on the appraisal. |
The table below presents certain information relating to comparable office sales pertaining to the Office Component of the High Street Property identified by the appraiser:
Comparable Office Sales(1)
| Property Name | Location | Year Built/Renovated | Rentable Area (SF) | Occupancy | Sale Date | Sale Price | Sale Price (PSF) |
| Office Component | Phoenix, AZ | 2008/NAP | 333,128(2) | 93.2%(2) | |||
| Camelback Esplanade | Phoenix, AZ | 1989-2002/NAP | 980,041 | 86.0% | Mar-2022 | $385,000,000 | $392.84 |
| Block 23 at Cityscape | Phoenix, AZ | 2019/NAP | 307,030 | 94.0% | Dec-2021 | $150,000,000 | $488.55 |
| Kierland Corporate Center | Scottsdale, AZ | 2000/NAP | 109,811 | 93.0% | Dec-2021 | $37,750,000 | $343.77 |
| Allred Park Place (1650 & 1700) | Chandler, AZ | 2020/NAP | 271,359 | 100.0% | Dec-2021 | $106,000,000 | $390.63 |
| CASA | Phoenix, AZ | 1990/2019 | 181,142 | 92.0% | Aug-2021 | $56,500,000 | $311.91 |
| Anchor Centre | Phoenix, AZ | 1984-1986/NAP | 333,014 | 95.0% | Jan-2021 | $103,500,000 | $310.80 |
| (1) | Information obtained from the appraisal. |
| (2) | Information obtained from the underwritten rent roll. |
| THE INFORMATION IN THIS STRUCTURAL AND COLLATERAL TERM SHEET IS NOT COMPLETE AND MAY BE AMENDED PRIOR TO THE TIME OF SALE. THIS TERM SHEET IS NOT AN OFFER TO SELL THESE SECURITIES AND IT IS NOT A SOLICITATION OF AN OFFER TO BUY THESE SECURITIES IN ANY JURISDICTION WHERE THE OFFER OR SALE IS NOT PERMITTED. | ||
| ||
| Mixed Use – Office/Retail/Multifamily | Loan #1 | Cut-off Date Balance: | $100,000,000 | |
| 5310-5455 High Street | High Street | Cut-off Date LTV: | 71.5% | |
| Phoenix, AZ 85054 | U/W NCF DSCR: | 1.61x | ||
| U/W NOI Debt Yield: | 8.8% |
The table below presents certain information relating to comparable retail sales pertaining to the Retail Component at the High Street Property identified by the appraiser:
Comparable Retail Sales(1)
| Property Name | Location | Year Built/Renovated | Rentable Area (SF) | Occupancy | Sale Date | Sale Price | Sale Price (PSF) |
| Retail Component | Phoenix, AZ | 2008/NAP | 173,563(2) | 80.1%(2) | |||
| Mountain Vista Marketplace | Mesa, AZ | 2019/NAP | 52,807 | 93.0% | Feb-2022 | $19,867,169 | $376.22 |
| Arcadia Crossing | Phoenix, AZ | 1995/NAP | 454,389 | 85.0% | Nov-2021 | $65,800,000 | $144.81 |
| Gilbert Gateway Towne Center | Gilbert, AZ | 2005/NAP | 265,878 | 85.0% | Nov-2021 | $50,200,000 | $188.81 |
| Camelback Colonnade | Phoenix, AZ | 1993-2005/NAP | 643,000 | 99.0% | Jun-2021 | $165,816,327 | $257.88 |
| Longbow Marketplace | Mesa, AZ | 2017-2020/NAP | 58,507 | 100.0% | May-2021 | $26,000,000 | $444.39 |
| (1) | Information obtained from the appraisal. |
| (2) | Information obtained from the underwritten rent roll. |
The table below presents certain information relating to comparable multifamily sales pertaining to the Multifamily Component at the High Street Property identified by the appraiser:
Comparable Multifamily Sales(1)
| Property Name | Location | Year Built/Renovated | Rentable Area (SF) | Occupancy | Sale Date | Sale Price | Sale Price (PSF) |
| Multifamily Component | Phoenix, AZ | 2008/NAP | 123,392(2) | 97.0%(2) | |||
| Ascent at Papago | Phoenix, AZ | 2007/NAP | 247,052 | 95.0% | Mar-2022 | $107,500,000 | $435.13 |
| Roadrunner on McDowell | Scottsdale, AZ | 2021/NAP | 296,904 | 95.0% | Feb-2022 | $193,500,000 | $651.73 |
| Slate Scottsdale | Scottsdale, AZ | 2016/NAP | 256,016 | 96.0% | Dec-2021 | $114,000,000 | $445.28 |
| Scottsdale Grand | Scottsdale, AZ | 2021/NAP | 251,737 | NAV | Dec-2021 | $130,000,000 | $516.41 |
| District at Scottsdale | Scottsdale, AZ | 2018/NAP | 307,123 | 94.0% | Jul-2021 | $150,500,000 | $490.03 |
| (1) | Information obtained from the appraisal. |
| (2) | Information obtained from the underwritten rent roll. |
Escrows.
Real Estate Taxes – The loan documents require an upfront deposit of $436,773 and ongoing monthly deposits of $145,591 for real estate taxes.
Insurance - The loan documents require ongoing monthly insurance reserves in an amount equal to 1/12th of the insurance premiums that the lender estimates will be payable for the renewal of the coverage afforded by the policies upon the expiration thereof. Notwithstanding the above, the borrower’s obligation to make insurance reserve payments will be waived so long as (i) no event of default is continuing, (ii) the insurance policies maintained by borrower are part of a blanket or umbrella policy approved by the lender in its reasonable discretion, (iii) the lender is provided with evidence of renewal of the insurance policies, and (iv) the lender is provided with paid receipts for the payment of the insurance premiums no later than ten business days prior to the expiration dates of said policies.
Replacement Reserve - The loan documents require an upfront deposit of $5,905,000. The loan documents require springing monthly deposits of $8,396 for replacements if the balance in the reserve falls below the cap of $302,262.
TI/LC Reserve - The loan documents require an upfront deposit of $8,992,000. The loan documents require springing monthly deposits of $21,112 for tenant improvements and leasing commissions if the balance in the reserve falls below the cap of $1,520,073.
Ground Rent Reserve – The loan documents require an upfront deposit of $30,583, and ongoing monthly reserves in an amount equal to 1/12th of the ground rent that lender reasonably estimates to be payable during the next twelve months in order to accumulate sufficient funds to pay the annual ground rent at least 30 days prior to the annual due date, initially estimated at $30,583.
Tenant Specific TI/LC Reserve – The loan documents require an upfront deposit of $1,873,516 for outstanding tenant improvements and leasing commissions related to Humble Bistro ($59,730), Cook & Craft ($26,853), Desert Ridge Veterinary Clinic ($238,877), Gallery Bar ($64,052), RT Specialty ($696,313), Blue Martini Lounge ($225,000), Patio 54 ($3,470), KeHe Distributors ($21,338), Transtar Insurance Brokers ($425,813), M3V Nail Bar ($4,026), State Farm ($6,374), and United Surgical Partners ($101,670).
| THE INFORMATION IN THIS STRUCTURAL AND COLLATERAL TERM SHEET IS NOT COMPLETE AND MAY BE AMENDED PRIOR TO THE TIME OF SALE. THIS TERM SHEET IS NOT AN OFFER TO SELL THESE SECURITIES AND IT IS NOT A SOLICITATION OF AN OFFER TO BUY THESE SECURITIES IN ANY JURISDICTION WHERE THE OFFER OR SALE IS NOT PERMITTED. | ||
| ||
| Mixed Use – Office/Retail/Multifamily | Loan #1 | Cut-off Date Balance: | $100,000,000 | |
| 5310-5455 High Street | High Street | Cut-off Date LTV: | 71.5% | |
| Phoenix, AZ 85054 | U/W NCF DSCR: | 1.61x | ||
| U/W NOI Debt Yield: | 8.8% |
Free Rent Reserve – The loan documents require an upfront deposit of $708,593 for certain future rent credits or abatements related to Transtar Insurance Brokers ($306,880), RT Specialty ($223,493), Desert Ridge Veterinary Clinic ($50,213), Gallery Bar ($41,012), United Surgical Partners ($39,655), Blue Martini Lounge ($25,219), Cook & Craft ($16,104), and State Farm ($6,017).
Prepaid Rent Reserve – The loan documents require an upfront deposit of $73,762 for one month of prepaid rent related to each of the following tenants: Cook & Craft ($3,523), Desert Ridge Veterinary Clinic ($7,402), and RT Specialty ($62,838).
Lockbox and Cash Management. The High Street Whole Loan requires a hard lockbox and in-place cash management. The borrowers are required to cause all rents to be deposited directly into the lockbox account, and all rents received by the borrowers or property manager be deposited into the lockbox account within two business days of receipt. Funds in the deposit account will be swept periodically into a cash management account and, prior to a Cash Trap Event Period, any funds remaining in the cash management account after the cash flow waterfall will be transferred to the borrowers. During a Cash Trap Event Period, any excess cash flow remaining after satisfaction of the waterfall items outlined in the High Street Whole Loan documents is required to be swept to an excess cash flow subaccount to be held as additional collateral for the High Street Whole Loan.
A “Cash Trap Event Period” will commence upon the earliest of the following:
| (i) | the occurrence and continuance of an event of default; or |
| (ii) | the net cash flow debt service coverage ratio (“NCF DSCR”) for the High Street Whole Loan falling below 1.10x at the end of any calendar quarter (based on a hypothetical 30 year amortization schedule). |
A Cash Trap Event Period will end upon the occurrence of the following:
| ● | with regard to clause (i) above, the cure of such event of default; or |
| ● | with regard to clause (ii) above: |
(a) the NCF DSCR for the High Street Whole Loan being greater than or equal to 1.15x for two consecutive calendar quarters; or
(b) the borrowers delivering to the lender as additional collateral and security for the payment of the debt, (x) cash to be held as an additional reserve fund that, if applied as a prepayment of the outstanding principal balance of the High Street Whole Loan, would cause the NCF DSCR to be at least 1.15x (the “Cash Management Sweep Cure Amount”), or (y) a letter of credit having an aggregate notional amount in the amount of the Cash Management Sweep Cure Amount.
Property Management. The High Street Property is self-managed by SKB PM I, LLC and GREP Southwest, LLC, each an affiliate of the borrowers.
Partial Release. Not permitted.
Real Estate Substitution. Not permitted.
Subordinate and Mezzanine Indebtedness. Not permitted.
Ground Lease. The High Street Property is subject to two long-term ground leases with the State of Arizona. The ground leases have 70 years remaining and both expire in July 2092 with one, 10-year renewal option. The ground lease payment is equal to the greater of: (i) the stipulated base rent per acre (currently $156,573 ($8,100 per acre)) increasing at an average rate of 7.4% every five years as outlined in the ground lease documents and (ii) 0.35% of the full cash value of the improvements as assessed annually by the Maricopa County Assessor (the “Alternative Rent”). For the lease period beginning in July 2022 and ending in July 2023, the Alternative Rent is $344,682, which is higher than the base rent per acre and used for underwriting purposes.
Letter of Credit. None; however, a letter of credit may be provided to avoid or terminate a Cash Trap Event Period due to clause (ii) as described above under “Lockbox and Cash Management” provided the aggregate amount of any letters of credit do not at any time exceed 10.0% of the outstanding principal balance of the High Street Whole Loan.
Terrorism Insurance. The loan documents require that the “all risk” insurance policy required to be maintained by the borrower, in an amount equal to the full replacement cost of the High Street Property contain no exclusion for damage or destruction caused by acts of terrorism, as well as business interruption insurance covering a period of restoration of 18 months and a 6-month extended period of indemnity.
| THE INFORMATION IN THIS STRUCTURAL AND COLLATERAL TERM SHEET IS NOT COMPLETE AND MAY BE AMENDED PRIOR TO THE TIME OF SALE. THIS TERM SHEET IS NOT AN OFFER TO SELL THESE SECURITIES AND IT IS NOT A SOLICITATION OF AN OFFER TO BUY THESE SECURITIES IN ANY JURISDICTION WHERE THE OFFER OR SALE IS NOT PERMITTED. | ||
| ||
| Retail – Super Regional Mall | Loan #2 | Cut-off Date Balance: | $91,000,000 | |
| 5000 Katy Mills Circle | Katy Mills | Cut-off Date LTV: | 33.0% | |
| Katy, TX 77494 | U/W NCF DSCR: | 2.91x | ||
| U/W NOI Debt Yield: | 21.8% |
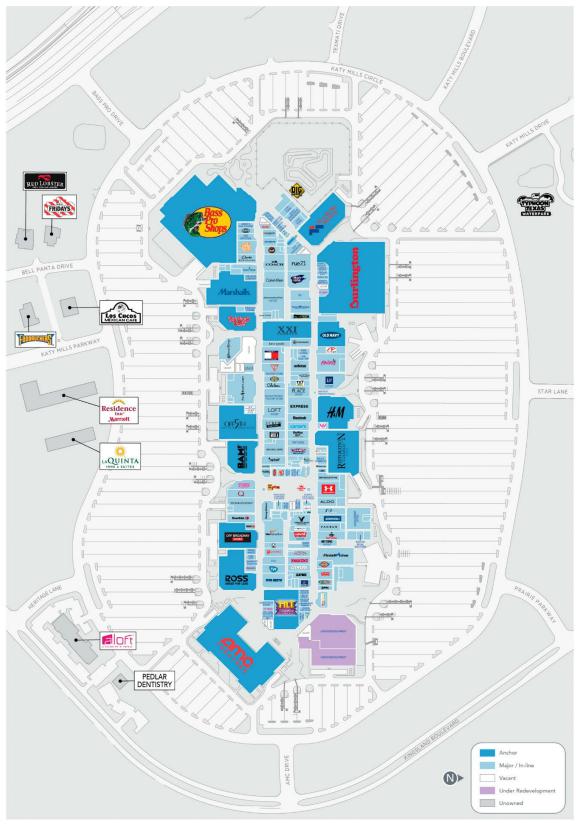
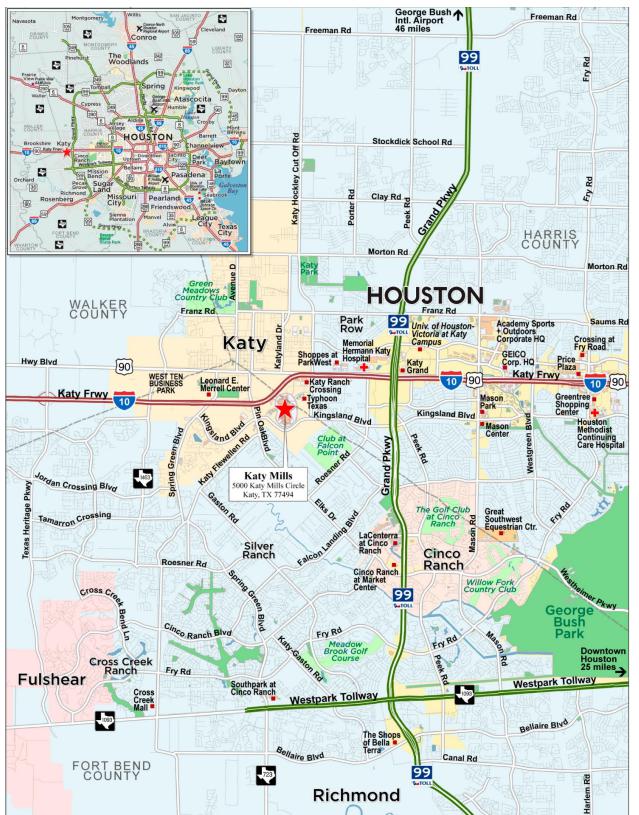
| THE INFORMATION IN THIS STRUCTURAL AND COLLATERAL TERM SHEET IS NOT COMPLETE AND MAY BE AMENDED PRIOR TO THE TIME OF SALE. THIS TERM SHEET IS NOT AN OFFER TO SELL THESE SECURITIES AND IT IS NOT A SOLICITATION OF AN OFFER TO BUY THESE SECURITIES IN ANY JURISDICTION WHERE THE OFFER OR SALE IS NOT PERMITTED. | ||
| ||
| No. 2 – Katy Mills |
| Mortgage Loan Information | Mortgaged Property Information | |||||
| Mortgage Loan Seller: | Bank of America, National Association | Single Asset/Portfolio: | Single Asset | |||
Credit Assessment (Fitch/KBRA/Moody’s): | NR/NR/Aa1 | Property Type – Subtype: | Retail – Super Regional Mall | |||
| Original Principal Balance(1): | $91,000,000 | Location: | Katy, TX | |||
| Cut-off Date Balance(1): | $91,000,000 | Size: | 1,181,987 SF | |||
| % of Initial Pool Balance: | 8.4% | Cut-off Date Balance Per SF(1): | $109.98 | |||
| Loan Purpose: | Refinance | Maturity Date Balance Per SF(1): | $92.82 | |||
| Borrower Sponsors: | Simon Property Group, L.P. and The KanAm Group | Year Built/Renovated: | 1999/2019 | |||
| Guarantor: | Simon Property Group, L.P. | Title Vesting: | Fee | |||
| Mortgage Rate: | 5.7670% | Property Manager: | Simon Management Associates II, LLC (borrower-related) | |||
| Note Date: | July 21, 2022 | Current Occupancy (As of)(4): | 86.3% (5/3/2022) | |||
| Seasoning: | 0 months | 12/31/2021 Occupancy(4): | 92.3% | |||
| Maturity Date: | August 1, 2032 | 12/31/2020 Occupancy(4): | 91.9% | |||
| IO Period: | 0 months | 12/31/2019 Occupancy(4): | 94.7% | |||
| Loan Term (Original): | 120 months | 12/31/2018 Occupancy(4): | 97.3% | |||
| Amortization Term (Original): | 360 months | As-Is Appraised Value(5): | $394,000,000 | |||
| Loan Amortization Type: | Amortizing Balloon | As-Is Appraised Value Per SF(5): | $333.34 | |||
| Call Protection(2): | L(24),D(90),O(6) | As-Is Appraisal Valuation Date: | May 17, 2022 | |||
| Lockbox Type: | Hard/Springing Cash Management | Underwriting and Financial Information(5) | ||||
| Additional Debt(1): | Yes | TTM 3/31/2022 NOI: | $27,420,178 | |||
| Additional Debt Type (Balance)(1): | Pari Passu ($39,000,000) | 12/31/2021 NOI: | $26,912,547 | |||
| 12/31/2020 NOI(6): | $24,343,858 | |||||
| 12/31/2019 NOI: | $29,158,868 | |||||
| U/W Revenues: | $42,515,577 | |||||
| U/W Expenses: | $14,235,384 | |||||
| Escrows and Reserves(3) | U/W NOI: | $28,280,193 | ||||
| Initial | Monthly | Cap | U/W NCF: | $26,546,115 | ||
| Taxes | $0 | Springing | NAP | U/W DSCR based on NOI/NCF(1): | 3.10x / 2.91x | |
| Insurance | $0 | Springing | NAP | U/W Debt Yield based on NOI/NCF(1): | 21.8% / 20.4% | |
| Replacement Reserve | $0 | $46,008 | $1,104,183 | U/W Debt Yield at Maturity based on NOI/NCF(1): | 25.8% / 24.2% | |
| TI/LC Reserve | $0 | $98,487 | $2,363,678 | Cut-off Date LTV Ratio(1): | 33.0% | |
| Outstanding TI/LC Reserve(7) | $1,013,945 | $0 | NAP | LTV Ratio at Maturity(1): | 27.8% | |
| Sources and Uses | |||||||
| Sources | Uses | ||||||
| Whole Loan Amount(1) | $130,000,000 | 91.2 | % | Loan Payoff | $140,430,426 | 98.5 | % |
| Sponsor Equity | 12,562,007 | 8.8 | Closing Costs | 1,117,635 | 0.8 | ||
| Upfront Reserves(7) | 1,013,945 | 0.7 | |||||
| Total Sources | $142,562,007 | 100.0 | % | Total Uses | $142,562,007 | 100.0 | % |
| (1) | The Cut-off Date Balance Per SF, Maturity Date Balance Per SF, U/W DSCR based on NOI/NCF, U/W Debt Yield based on NOI/NCF, U/W Debt Yield at Maturity based on NOI/NCF, Cut-off Date LTV Ratio and LTV Ratio at Maturity numbers presented above are based on the Katy Mills Whole Loan (as defined below). |
| (2) | Defeasance of the Katy Mills Whole Loan is permitted at any time after the earlier to occur of (a) the end of the two-year period commencing on the closing date of the securitization of the last portion of the Katy Mills Whole Loan to be securitized and (b) February 1, 2026. The assumed prepayment lockout period of 24 payments is based on the closing date of this transaction in August 2022. |
| (3) | See “Escrows and Reserves” below for further discussion of reserve information. |
| (4) | As of May 3, 2022, the Katy Mills Property (as defined below) was 94.7% occupied inclusive of Retail Development Program (“RDP”) tenants. These tenants have been excluded from the underwriting as RDP lease terms are for less than a year and can be terminated by the landlord at any time with 30 days’ notice. Historical occupancy is inclusive of RDP tenants. |
| (5) | The novel coronavirus pandemic is an evolving situation and could impact the Katy Mills Whole Loan more severely than assumed in the underwriting of the Katy Mills Whole Loan and could adversely affect the NOI, NCF and occupancy information, as well as the appraised value and the DSCR, LTV and Debt Yield metrics presented above and herein. See "Risk Factors—Risks Related to Market Conditions and Other External Factors—The Coronavirus Pandemic Has Adversely Affected the Global Economy and Will Likely Adversely Affect the Performance of the Mortgage Loans" in the Preliminary Prospectus. |
| (6) | The Katy Mills Property was closed between March 18, 2020 and April 30, 2020 due to COVID-19 restrictions. |
| (7) | Upfront Reserves include outstanding tenant improvement allowances and leasing commissions for eight tenants including the Cheesecake Factory. The borrower sponsor has deposited an additional $1,947,500 with the Chicago Title Insurance Company in order to fund certain tenant improvement cost allowances owed to the Cheesecake Factory which are being held outside the BANK 2022-BNK43 securitization trust. |
| THE INFORMATION IN THIS STRUCTURAL AND COLLATERAL TERM SHEET IS NOT COMPLETE AND MAY BE AMENDED PRIOR TO THE TIME OF SALE. THIS TERM SHEET IS NOT AN OFFER TO SELL THESE SECURITIES AND IT IS NOT A SOLICITATION OF AN OFFER TO BUY THESE SECURITIES IN ANY JURISDICTION WHERE THE OFFER OR SALE IS NOT PERMITTED. | ||
| ||
| Retail – Super Regional Mall | Loan #2 | Cut-off Date Balance: | $91,000,000 | |
| 5000 Katy Mills Circle | Katy Mills | Cut-off Date LTV: | 33.0% | |
| Katy, TX 77494 | U/W NCF DSCR: | 2.91x | ||
| U/W NOI Debt Yield: | 21.8% |
The Mortgage Loan. The mortgage loan (the “Katy Mills Mortgage Loan”) is part of a whole loan, evidenced by two pari passu promissory notes, with an aggregate original principal balance of $130,000,000 (together, the “Katy Mills Whole Loan”) that was co-originated by Bank of America, N.A. and JPMorgan Chase Bank, National Association. The Katy Mills Whole Loan is secured by a first priority fee mortgage encumbering a 1,181,987 square foot super regional mall located in Katy, Texas (the “Katy Mills Property”). The Katy Mills Mortgage Loan is evidenced by the controlling Note A-1 with an original principal balance of $91,000,000. The remaining promissory note is currently held by JPMorgan Chase Bank, National Association and is expected to be contributed to one or more future transactions. The Katy Mills Whole Loan will be serviced pursuant to the pooling and servicing agreement for the BANK 2022-BNK43 securitization trust. See “Description of the Mortgage Pool—The Whole Loans—The Serviced Pari Passu Whole Loans” and “Pooling and Servicing Agreement” in the Preliminary Prospectus.
Note Summary
| Notes | Original Balance | Cut-off Date Balance | Note Holder | Controlling Piece |
| A-1 | $91,000,000 | $91,000,000 | BANK 2022-BNK43 | Yes |
| A-2 | $39,000,000 | $39,000,000 | JPMorgan Chase Bank, National Association | No |
| Total | $130,000,000 | $130,000,000 |
The Borrower and Borrower Sponsors. The borrower is Mall at Katy Mills, L.P. (the “Katy Mills Borrower”), a Delaware limited partnership and single purpose entity with two independent directors. The borrower sponsors are a joint venture between Simon Property Group, L.P. (62.5%) and The KanAm Group (37.5%). The non-recourse carveout guarantor is Simon Property Group, L.P. Simon Property Group, L.P.’s liability as the non-recourse carveout guarantor is limited to 20% ($26,000,000) of the original principal amount of the Katy Mills Whole Loan, plus all reasonable out-of-pocket costs and expenses incurred in the enforcement of the guaranty or preservation of the lender’s rights under the guaranty. There is no separate environmental indemnitor for the Katy Mills Whole Loan.
Simon Property Group, L.P. (“Simon”) is the operating partnership of Simon Property Group Inc. (NYSE: SPG / Moodys:A3, S&P:A-), which is a global leader in the ownership of shopping, dining, entertainment and mixed-use destinations and an S&P 100 company. As of December 31, 2021, Simon owned or had an interest in 232 properties comprising 186 million square feet in North America, Asia and Europe. Simon also owns an 80% interest in The Taubman Realty Group, or TRG, which owns 24 regional, super-regional, and outlet malls in the U.S. and Asia. Additionally, as of December 31, 2021, Simon had a 22.4% ownership interest in Klépierre, a publicly traded, Paris-based real estate company, which owns shopping centers in 14 European countries. As of July 2022, Simon has an equity market capitalization of over $33.6 billion. See “Loan Purpose; Default History, Bankruptcy Issues and Other Proceedings” in the Preliminary Prospectus.
The KanAm Group ("KanAm"), with its main offices in Munich, Frankfurt and Atlanta, is one of Germany's leading sponsors of international real estate funds. Since its founding in 1978, KanAm has initiated forty-four real estate funds and private placements for private and institutional investors, including twenty-five closed-end funds in the United States. KanAm currently owns interests in 178 properties worldwide, including six Mills centers managed by Simon Property Group. As of March 2022, KanAm managed approximately $12.2 billion in assets.
The Property. The Katy Mills Property is a 1,181,987 square foot super regional mall located in Katy, Texas. The Katy Mills Property was constructed in 1999 by the Mills Corporation and was acquired by Simon in 2007. The borrower sponsor spent approximately $21.5 million between 2018 and 2019 on interior and exterior renovations to modernize the Katy Mills Property. The interior remodel included updating the food court and color palette, as well as installing a new movie theater courtyard and interactive play area. Exterior improvements included adding light towers with oversized, illuminated mall entry information, installing LED lighting, a new monument, directional signs, concrete walkways and applying new paint and décor.
Historical occupancy at the Katy Mills Property has averaged 95.2% over the last five years (2017-2021). As of May 3, 2022, the Katy Mills Property was 86.3% occupied by a granular rent roll consisting of 132 unique tenants (94.7% occupied including 23 RDP tenants), with no single tenant occupying more than 12.2% of net rentable area or contributing more than 9.1% of underwritten rent. The 10 largest tenants at the Katy Mills Property account for less than 25% of the underwritten rent. The Katy Mills Property is home to many national brands including Bass Pro Shops Outdoor, Burlington, Marshalls, Sun & Ski Sports, Saks Fifth Avenue Off 5th and Ross Dress for Less, and several entertainment and dining options including AMC Theatres, Rainforest Café, Tilt and Cheesecake Factory. The Katy Mills Property features non-collateral tenants including Walmart, Red Lobster, T.G.I. Fridays, Denny’s, Taco Bell, Jack in the Box, and Popeyes. There are several hotels surrounding the property, including a Hilton Garden Inn, Country Inn & Suites, Residence Inn, Marriott Courtyard, Holiday Inn, and La Quinta Inn.
Over the trailing-12 months ending March 31, 2022, the Katy Mills Property generated total sales of approximately $324 million, which is approximately 1.3% higher than 2021 sales and 33.4% higher than 2020 sales. Over the same time period, inline tenants (less than 10,000 square feet) generated sales of approximately $515 per SF (at an occupancy cost of 12.6%).
| THE INFORMATION IN THIS STRUCTURAL AND COLLATERAL TERM SHEET IS NOT COMPLETE AND MAY BE AMENDED PRIOR TO THE TIME OF SALE. THIS TERM SHEET IS NOT AN OFFER TO SELL THESE SECURITIES AND IT IS NOT A SOLICITATION OF AN OFFER TO BUY THESE SECURITIES IN ANY JURISDICTION WHERE THE OFFER OR SALE IS NOT PERMITTED. | ||
| ||
| Retail – Super Regional Mall | Loan #2 | Cut-off Date Balance: | $91,000,000 | |
| 5000 Katy Mills Circle | Katy Mills | Cut-off Date LTV: | 33.0% | |
| Katy, TX 77494 | U/W NCF DSCR: | 2.91x | ||
| U/W NOI Debt Yield: | 21.8% |
The following table contains sales history for the Katy Mills Property:
Tenant Sales
| 2017 | 2018 | 2019 | 2020(1) | 2021 | 3/31/2022 TTM(2) | |
| Gross Mall Sales | $308,258,146 | $308,143,698 | $307,604,057 | $243,217,327 | $320,186,705 | $324,431,353 |
| Sales PSF (Inline < 10,000 SF) | $421 | $423 | $432 | $335 | $502 | $515 |
| Occupancy Cost (Inline < 10,000 SF) | 13.6% | 14.1% | 14.1% | 18.0% | 12.9% | 12.6% |
| (1) | The Katy Mills Property was closed between March 18 and April 30, 2020 due to COVID-19 restrictions. |
| (2) | Information is as of March 31, 2022, as provided by the borrower sponsor, and only includes tenants reporting sales. |
Over the trailing-12 months ending March 31, 2022, several tenants with greater than 10,000 square feet generated higher sales figures compared to 2019 sales including Bass Pro Shops Outdoor ($258 per SF, 33.7% increase), XXI Forever ($241 per SF, 26.7% increase), Books-A-Million ($192 per SF, 27.7% increase), Abercrombie & Fitch Outlet ($459 per SF, 36.9% increase), and Nike Factory Store ($980 per SF, 36.3% increase), among others.
Major Tenant Sales
| Tenant Name | 2017 | 2018 | 2019 | 2020(1) | 2021 | TTM March 2022(2) | Sales PSF/Screen | 2019 vs 2022 |
| Bass Pro Shops Outdoor | $26,985,476 | $28,520,764 | $27,907,228 | $38,453,109 | $35,718,242 | $37,309,964 | $258 | 33.7% |
| Burlington | $18,849,632 | $22,203,414 | $23,231,266 | $18,769,566 | $25,162,868 | $25,761,364 | $257 | 10.9% |
| AMC Theatres | $8,725,160 | $8,558,017 | $9,024,943 | $2,634,416 | $3,003,203 | $3,003,203 | $150,160 | -66.7% |
| Marshalls | $10,222,052 | $10,155,157 | $10,162,554 | $9,357,886 | $7,477,111 | $7,477,111 | $233 | -26.4% |
| Sun & Ski Sports | $4,653,310 | $4,855,524 | $4,646,110 | $4,968,031 | $5,204,747 | $5,277,052 | $176 | 13.6% |
| Saks Fifth Avenue Off 5th | $5,819,296 | $5,745,796 | $5,158,062 | $2,594,491 | $5,544,008 | $6,206,327 | $229 | 20.3% |
| H&M | $6,072,855 | $4,893,038 | $6,073,082 | $4,081,886 | $5,947,923 | $6,128,053 | $264 | 0.9% |
| XXI Forever | $4,360,564 | $4,412,657 | $3,981,057 | $2,947,978 | $4,984,847 | $5,043,425 | $241 | 26.7% |
| Off Broadway Shoes | $3,326,583 | $3,792,362 | $3,686,186 | $2,553,776 | $4,210,496 | $4,334,745 | $211 | 17.6% |
| Books-A-Million | $3,536,104 | $3,455,594 | $3,076,134 | $2,258,366 | $3,744,939 | $3,928,232 | $192 | 27.7% |
| (1) | The Katy Mills Property was closed between March 18 and April 30, 2020 due to COVID-19 restrictions. |
| (2) | Information is as of March 31, 2022, as provided by the borrower sponsor, and only includes tenants reporting sales. |
Major Tenants.
Bass Pro Shops Outdoor (144,702 square feet, 12.2% of net rentable area, 0.6% of underwritten base rent). Bass Pro Shops Outdoor was founded in 1972 and is headquartered in Springfield, Missouri. Bass Pro Shops Outdoor is an outdoor equipment retailer that provides specialized gear and apparel for hunting, fishing, and camping. Bass Pro Shops Outdoor operates 177 stores across America and Canada that serve roughly 120 million sports enthusiasts annually and can draw customers from over 50 miles away. Bass Pro Shops Outdoor occupies 144,702 square feet at the Katy Mills Property under a lease expiring on October 25, 2024, with five, five-year extension options remaining. Bass Pro Shops Outdoor has been at the Katy Mills Property since 1999 and has renewed its lease multiple times. Bass Pro Shops Outdoor is currently paying percent in lieu rent, per its originally structured lease, currently equal to 2.0% of sales over a $30.0 million ($207 per square foot) sales breakpoint. Bass Pro Shops Outdoor reported sales at the Katy Mills Property of $258 per square foot for the trailing-12 months ended March 31, 2022. Reported sales per square foot were $247, $266 and $193 for 2021, 2020 and 2019, respectively.
Burlington (100,083 square feet, 8.5% of net rentable area, 2.7% of underwritten base rent). Burlington (NYSE: BURL) is an off-price apparel and home product retailer that offers coats, apparel, shoes, baby clothing, furniture, travel gear, toys, and home decor items. Founded in 1924 as Burlington Coat Factory Warehouse Corporation, the company opened its first outlet store in 1972 in Burlington, New Jersey. As of November 2021, the company operated 832 stores in 45 states and Puerto Rico. Burlington is currently rated “BB+” by S&P. Burlington occupies 100,083 square feet at the Katy Mills Property under a lease expiring on January 31, 2025, with one, five-year extension option remaining. Burlington has been at the Katy Mills Property since 1999 and has renewed its lease multiple times. The lease provides for a rental rate of $6.00 per square foot, which increases to $6.25 per square foot during the renewal term. Burlington also pays percentage rent equal to 1.50% over an $18,765,562 ($187.50 per square foot) sales breakpoint. Burlington reported sales at the Katy Mills Property of $257 per square foot for the trailing-12 months ended March 31, 2022. Reported sales per square foot were $251, $188 and $232 for 2021, 2020 and 2019, respectively.
AMC Theatres (76,671 square feet, 6.5% of net rentable area, 9.1% of underwritten base rent). AMC Theatres (NYSE: AMC) is one of the world's largest theatrical exhibition companies and owns, partially owns, or operates approximately 950 theaters with over 10,500 screens worldwide, most of which are in megaplexes (units with more than 10 screens and stadium seating). AMC Theatres owns approximately 185 (3D enabled) IMAX screens and has around 55% IMAX market share, and more than 4,520 3D screens in the United States. AMC Theatres is currently rated “Caa2” by Moody’s and “CCC+” by S&P. AMC Theatres occupies 76,671 square feet (20 screens) at the Katy Mills Property under a lease expiring on October 31, 2029, with three, five-year extension options remaining. AMC Theatres
| THE INFORMATION IN THIS STRUCTURAL AND COLLATERAL TERM SHEET IS NOT COMPLETE AND MAY BE AMENDED PRIOR TO THE TIME OF SALE. THIS TERM SHEET IS NOT AN OFFER TO SELL THESE SECURITIES AND IT IS NOT A SOLICITATION OF AN OFFER TO BUY THESE SECURITIES IN ANY JURISDICTION WHERE THE OFFER OR SALE IS NOT PERMITTED. | ||
| ||
| Retail – Super Regional Mall | Loan #2 | Cut-off Date Balance: | $91,000,000 | |
| 5000 Katy Mills Circle | Katy Mills | Cut-off Date LTV: | 33.0% | |
| Katy, TX 77494 | U/W NCF DSCR: | 2.91x | ||
| U/W NOI Debt Yield: | 21.8% |
has been at the Katy Mills Property since 1999 and has renewed its lease multiple times. In 2018, in conjunction with the broader renovation at the Katy Mills Property, the borrower sponsor provided $3.5 million to AMC Theaters to remodel its space with AMC subsequently extending its lease through 2029. The lease provides for a rental rate of $31.52 per square foot, increasing to $34.87 per square foot effective November 1, 2024. AMC Theatres also pays percentage rent equal to 6.0% over a $15,300,000 ($765,000 per screen) sales breakpoint. AMC Theatres reported sales at the Katy Mills Property of $150,160 per screen ($39 per square foot) for the trailing-12 months ended March 31, 2022. Reported sales per screen were $150,160, $131,721 and $451,247 for 2021, 2020 and 2019, respectively. Reported sales per square foot were $39, $34 and $118 for 2021, 2020 and 2019, respectively.
Saks Fifth Avenue Off 5th (27,122 square feet, 2.3% of net rentable area, 0.7% of underwritten base rent). Saks Fifth Avenue Off 5th (“Saks”) (NYSE: SKS) is a retail operator in the United States offering fashion apparel, shoes, accessories, jewelry, cosmetics and gifts. Founded in 1924 and headquartered in New York City, Saks operates stores under the brand names Saks Fifth Avenue and Saks Fifth Avenue Off 5th. Saks operates as a Saks Fifth Avenue Off 5th at the Katy Mills Property under a lease expiring on October 31, 2024, with one, five-year extension options remaining. Saks has been at the Katy Mills Property since 1999 and has renewed its lease multiple times. Saks is currently paying a base rent is $7.00 per square foot through the end of the term. Saks also pays percentage rent equal to 1.0% over a $6,780,500 ($250 per square foot) sales breakpoint. Saks reported sales at the Katy Mills Property of $229 per square foot for the trailing-12 months ended March 31, 2022. Reported sales per square foot were $204, $96 and $190 for 2021, 2020 and 2019, respectively.
The following table presents certain information relating to the tenancy at the Katy Mills Property:
Tenant Summary(1)
| Tenant Name | Credit Rating (Fitch/ Moody’s/ S&P)(2) | Tenant NRA | % of Total NRA | Annual U/W Base Rent PSF(3) | Annual U/W Base Rent(3) | % of Total Annual U/W Base Rent | Lease Expiration Date | Renewal Options | Termin. Options (Y/N) | March 2022 TTM Tenant Sales PSF / Occ. Cost |
| Anchor Tenants | ||||||||||
| Bass Pro Shops Outdoor | NR/NR/NR | 144,702 | 12.2% | $1.01 | $146,199 | 0.6% | 10/25/2024 | 5, 5-year | N | $258 / 0.4% |
| Burlington | NR/NR/BB+ | 100,083 | 8.5% | $7.05 | $705,435 | 2.7% | 1/31/2025 | 1, 5-year | N | $257 / 2.7% |
| AMC Theatres | NR/Caa2/CCC+ | 76,671 | 6.5% | $31.52 | $2,416,983 | 9.1% | 10/31/2029 | 3, 5-year | N | $39 / 80.5% |
| Saks Fifth Avenue Off 5th | NR/NR/NR | 27,122 | 2.3% | $7.00 | $189,854 | 0.7% | 10/31/2024 | 1, 5-year | N | $229 / 3.1% |
| Total Collateral Anchor Tenants | 348,578 | 29.5% | $9.92 | $3,458,471 | 13.1% | |||||
| Junior Anchor Tenants | ||||||||||
| Marshalls | NR/A2/A | 32,126 | 2.7% | $11.60 | $372,662 | 1.4% | 1/31/2030 | 2, 5-year | N | $233 / 5.0% |
| Sun & Ski Sports | NR/NR/NR | 30,002 | 2.5% | $17.60 | $528,000 | 2.0% | 3/31/2026 | NAP | N | $176 / 10.0% |
| Ross Dress For Less | NR/A2/BBB+ | 27,061 | 2.3% | $11.09 | $300,000 | 1.1% | 1/31/2025 | 4, 5-year | N | NAV |
| Tilt | NR/NR/NR | 25,140 | 2.1% | $8.95 | $225,000 | 0.9% | 1/31/2027 | NAP | N | $53 / 16.8% |
| H&M | NR/NR/BBB | 23,200 | 2.0% | $23.77 | $551,525 | 2.1% | 1/31/2025 | NAP | N | $264 / 9.0% |
| XXI Forever | NR/NR/NR | 20,921 | 1.8% | $54.55 | $1,141,327 | 4.3% | 6/30/2026 | NAP | N | $241 / 22.6% |
| Off Broadway Shoes | NR/NR/NR | 20,537 | 1.7% | $32.23 | $661,993 | 2.5% | 1/31/2023 | NAP | N | $211 / 15.3% |
| Books-A-Million | NR/NR/NR | 20,434 | 1.7% | $15.00 | $306,510 | 1.2% | 1/31/2025 | NAP | N | $192 / 7.8% |
| Rainforest Cafe | NR/Caa2/NR | 20,000 | 1.7% | $11.89 | $237,717 | 0.9% | 12/31/2023 | NAP | N | $170 / 7.0% |
| Total Junior Anchor Tenants | 219,421 | 18.6% | $19.71 | $4,324,733 | 16.4% | |||||
| Occupied In-Line Tenants(4) | 452,008 | 38.2% | $41.29 | $18,664,159 | 70.6% | |||||
| Vacant Space | 161,980 | 13.7% | $0.00 | $0 | 0.0% | |||||
| Collateral Total / Wtd. Avg. | 1,181,987 | 100.0% | $25.93(5) | $26,447,363 | 100.0% | |||||
| (1) | Information is based on the underwritten rent roll dated May 3, 2022. |
| (2) | Certain ratings are those of the parent company whether or not the parent guarantees the lease. |
| (3) | Annual U/W Base Rent PSF and Annual U/W Base Rent includes overage and percent in lieu rent as of trailing twelve months ended March 2022 sales for certain tenants. |
| (4) | Includes outlot tenants and cell tower leases that have no square footage associated. |
| (5) | Wtd. Avg. Annual U/W Base Rent PSF excludes vacant space. |
| THE INFORMATION IN THIS STRUCTURAL AND COLLATERAL TERM SHEET IS NOT COMPLETE AND MAY BE AMENDED PRIOR TO THE TIME OF SALE. THIS TERM SHEET IS NOT AN OFFER TO SELL THESE SECURITIES AND IT IS NOT A SOLICITATION OF AN OFFER TO BUY THESE SECURITIES IN ANY JURISDICTION WHERE THE OFFER OR SALE IS NOT PERMITTED. | ||
| ||
| Retail – Super Regional Mall | Loan #2 | Cut-off Date Balance: | $91,000,000 | |
| 5000 Katy Mills Circle | Katy Mills | Cut-off Date LTV: | 33.0% | |
| Katy, TX 77494 | U/W NCF DSCR: | 2.91x | ||
| U/W NOI Debt Yield: | 21.8% |
The following table presents certain information relating to the lease rollover schedule at the Katy Mills Property:
Lease Expiration Schedule(1)(2)
| Year Ending December 31, | No. of Leases Expiring | Expiring NRSF | % of Total NRSF Expiring | Cumulative Expiring NRSF | Cumulative % of Total NRSF Expiring | Annual U/W Base Rent Expiring(3) | % of Total Annual U/W Base Rent Expiring | Annual U/W Base Rent PSF Expiring(3) | |
| MTM / 2022 | 11 | 52,271 | 4.4% | 52,271 | 4.4% | $2,302,157 | 8.7% | $44.04 | |
| 2023 | 22 | 106,082 | 9.0% | 158,353 | 13.4% | $3,099,469 | 11.7% | $29.22 | |
| 2024 | 28 | 273,191 | 23.1% | 431,544 | 36.5% | $4,419,221 | 16.7% | $16.18 | |
| 2025 | 21 | 242,771 | 20.5% | 674,315 | 57.0% | $4,779,395 | 18.1% | $19.69 | |
| 2026 | 10 | 86,452 | 7.3% | 760,767 | 64.4% | $2,951,446 | 11.2% | $34.14 | |
| 2027 | 12 | 61,810 | 5.2% | 822,577 | 69.6% | $1,784,402 | 6.7% | $28.87 | |
| 2028 | 5 | 21,764 | 1.8% | 844,341 | 71.4% | $881,797 | 3.3% | $40.52 | |
| 2029 | 7 | 94,609 | 8.0% | 938,950 | 79.4% | $3,512,325 | 13.3% | $37.12 | |
| 2030 | 10 | 60,610 | 5.1% | 999,560 | 84.6% | $1,949,224 | 7.4% | $32.16 | |
| 2031 | 1 | 1,104 | 0.1% | 1,000,664 | 84.7% | $0 | 0.0% | $0.00 | |
| 2032 | 5 | 11,293 | 1.0% | 1,011,957 | 85.6% | $565,873 | 2.1% | $50.11 | |
| Thereafter | 3 | 8,050 | 0.7% | 1,020,007 | 86.3% | $202,055 | 0.8% | $25.10 | |
| Vacant | 0 | 161,980 | 13.7% | 1,181,987 | 100.0% | $0 | 0.0% | $0.00 | |
| Total/Wtd. Avg. | 135 | 1,181,987 | 100.0% | $26,447,363 | 100.0% | $25.93 | (4) | ||
| (1) | Information is based on the underwritten rent roll dated May 3, 2022 and includes outlot tenants and cell tower leases that have no square footage associated. |
| (2) | Certain tenants may have lease termination options that are exercisable prior to the originally stated expiration date of the subject lease and that are not considered in the lease expiration schedule. |
| (3) | Annual U/W Base Rent Expiring and Annual U/W Base Rent PSF Expiring includes overage and percent in lieu rent as of trailing twelve months ended March 2022 sales for certain tenants. |
| (4) | Total/Wtd. Avg. Annual U/W Base Rent PSF Expiring excludes vacant space. |
Historical occupancy including RDP tenants at the Katy Mills Property has averaged 95.2% over the last five years (2017-2021). The following table presents recent historical occupancy percentages at the Katy Mills Property:
Historical Occupancy
12/31/2019(1) | 12/31/2020(1) | 12/31/2021(1) | 5/3/2022(2) |
| 94.7% | 91.9% | 92.3% | 86.3% |
| (1) | Information obtained from the borrower and is inclusive of RDP tenants. |
| (2) | Information obtained from the underwritten rent roll. As of May 3, 2022, the Katy Mills Property was 94.7% occupied inclusive of Retail RDP tenants. These tenants have been excluded from the underwriting as RDP lease terms are for less than a year and can be terminated by the landlord at any time with 30 days’ notice. |
| THE INFORMATION IN THIS STRUCTURAL AND COLLATERAL TERM SHEET IS NOT COMPLETE AND MAY BE AMENDED PRIOR TO THE TIME OF SALE. THIS TERM SHEET IS NOT AN OFFER TO SELL THESE SECURITIES AND IT IS NOT A SOLICITATION OF AN OFFER TO BUY THESE SECURITIES IN ANY JURISDICTION WHERE THE OFFER OR SALE IS NOT PERMITTED. | ||
| ||
| Retail – Super Regional Mall | Loan #2 | Cut-off Date Balance: | $91,000,000 | |
| 5000 Katy Mills Circle | Katy Mills | Cut-off Date LTV: | 33.0% | |
| Katy, TX 77494 | U/W NCF DSCR: | 2.91x | ||
| U/W NOI Debt Yield: | 21.8% |
Historical Performance and Underwritten Net Cash Flow. The following table presents certain information relating to the historical performance and underwritten net cash flow at the Katy Mills Property:
Cash Flow Analysis
| 2018 | 2019 | 2020(1) | 2021 | TTM 3/31/2022 |
U/W | %(2) | U/W $ per SF | ||
| Base Rent(3) | $21,772,306 | $22,030,004 | $21,819,485 | $20,112,356 | $20,166,922 | $22,109,830 | 48.3 | % | $18.71 |
| Income from Vacant Units | 0 | 0 | 0 | 0 | 0 | 6,855,048 | 15.0 | 5.80 | |
| Overage Rent(4) | 1,144,902 | 840,454 | 247,538 | 1,753,032 | 2,149,529 | 2,300,076 | 5.0 | 1.95 | |
| Percent In Lieu(4) | 653,139 | 827,079 | 1,152,539 | 2,276,774 | 2,412,745 | 2,037,457 | 4.4 | 1.72 | |
| Expense Reimbursement | 15,026,043 | 15,308,612 | 15,034,456 | 14,066,341 | 13,930,857 | 12,509,222 | 27.3 |
| 10.58 |
| Net Rental Income | $38,596,390 | $39,006,149 | $38,254,018 | $38,208,503 | $38,660,053 | $45,811,633 | 100.0 | % | $38.76 |
| Temp / Specialty Leasing Income | 3,267,135 | 3,094,958 | 2,180,929 | 3,239,077 | 3,448,224 | 3,311,000 | 7.2 | 2.80 | |
| Other Income(5) | 495,873 | 524,445 | 275,126 | 451,615 | 466,985 | 299,000 | 0.7 | 0.25 | |
| (Vacancy & Concessions)(6) | (22,262) | (208,876) | (3,840,290) | (962,574) | (845,315) | (6,906,055) | (15.1 | ) | (5.84) |
| Effective Gross Income | $42,337,136 | $42,416,676 | $36,869,783 | $40,936,621 | $41,729,947 | $42,515,577 | 92.8 | % | $35.97 |
| Real Estate Taxes | $4,526,088 | $4,411,750 | $5,705,035 | $5,546,690 | $5,662,748 | $5,337,099 | 12.6 | % | $4.52 |
| Insurance | 928,710 | 970,748 | 1,163,868 | 1,240,791 | 1,246,358 | 1,439,028 | 3.4 | 1.22 | |
| Other Operating Expenses | 8,040,352 | 7,875,310 | 5,657,022 | 7,236,593 | 7,400,663 | 7,459,257 | 17.5 |
| 6.31 |
| Total Operating Expenses | $13,495,150 | $13,257,808 | $12,525,925 | $14,024,074 | $14,309,769 | $14,235,384 | 33.5 | % | $12.04 |
| Net Operating Income | $28,841,986 | $29,158,868 | $24,343,858 | $26,912,547 | $27,420,178 | $28,280,193 | 66.5 | % | $23.93 |
| Replacement Reserves | 0 | 0 | 0 | 0 | 0 | 552,091 | 1.3 | 0.47 | |
| TI/LC | 0 | 0 | 0 | 0 | 0 | 1,181,987 | 2.8 |
| 1.00 |
| Net Cash Flow | $28,841,986 | $29,158,868 | $24,343,858 | $26,912,547 | $27,420,178 | $26,546,115 | 62.4 | % | $22.46 |
| NOI DSCR(7) | 3.16x | 3.20x | 2.67x | 2.95x | 3.01x | 3.10x | |||
| NCF DSCR(7) | 3.16x | 3.20x | 2.67x | 2.95x | 3.01x | 2.91x | |||
| NOI Debt Yield(7) | 22.2% | 22.4% | 18.7% | 20.7% | 21.1% | 21.8% | |||
| NCF Debt Yield(7) | 22.2% | 22.4% | 18.7% | 20.7% | 21.1% | 20.4% | |||
| (1) | The Katy Mills Property was closed between March 18, 2020 and April 30, 2020 due to COVID-19 restrictions. |
| (2) | Represents (i) percent of Net Rental Income for all revenue fields and (ii) percent of Effective Gross Income for all other fields. |
| (3) | U/W Base Rent is based on the underwritten rent roll dated May 3, 2022, with adjustments made for executed leases and tenants that have given notice to vacate. U/W Base Rent also includes contractual rent steps ($307,677) taken through September 2023. |
| (4) | U/W Overage Rent and UW Percent In Lieu are based on the terms of applicable leases using TTM March 2022 sales figures. |
| (5) | U/W Other Income includes income from local/miscellaneous media, Simon ad panels and other miscellaneous income. |
| (6) | Historical Vacancy & Credit Loss represents bad debt write-offs net of recoveries. |
| (7) | Debt service coverage ratios and debt yields are based on the Katy Mills Whole Loan. |
Appraisal. The appraiser concluded to an “as-is” Appraised Value for the Katy Mills Property of $394,000,000 as of May 17, 2022.
Environmental Matters. According to the Phase I environmental site assessment dated May 24, 2022, there was no evidence of any recognized environmental conditions at the Katy Mills Property.
Market Overview and Competition. The Katy Mills Property is located in Katy, Harris County, Texas, in the Houston-The Woodlands-Sugar Land, Texas Metropolitan Statistical Area (“Houston MSA”). The Houston MSA is the fifth largest in the United States in terms of population and the fourth largest in terms of economic output. The Houston MSA is home to more than twenty major institutions of higher learning including Rice University, University of Houston, Texas Southern University, Prairie View A&M University, and University of St. Thomas. The city of Houston houses the Texas Medical Center, which comprises the largest concentration of expertise in medical treatment, research, and medical technology in the world. The Houston MSA’s energy industry has driven the local economy, encouraging population growth. According to the appraisal, the Houston MSA has a 2021 population of 7,246,553.
According to the appraisal, the 2021 population within a one-, three- and five-mile radius of the Katy Mills Property was 5,443, 91,802 and 240,077, respectively. The 2021 average household income within the same radii was $149,370, $131,968, and $136,494, respectively. Employment in the Houston MSA is concentrated in retail trade, government, health services and professional and business services, representing 13.4%, 9.9%, 9.8%, and 8.7%, respectively. Phillips 66, Sysco, Enterprise Partners, Hewlett Packard, Plaines GP Holdings and Baker Hughes are the six largest employers in the Houston MSA.
| THE INFORMATION IN THIS STRUCTURAL AND COLLATERAL TERM SHEET IS NOT COMPLETE AND MAY BE AMENDED PRIOR TO THE TIME OF SALE. THIS TERM SHEET IS NOT AN OFFER TO SELL THESE SECURITIES AND IT IS NOT A SOLICITATION OF AN OFFER TO BUY THESE SECURITIES IN ANY JURISDICTION WHERE THE OFFER OR SALE IS NOT PERMITTED. | ||
| ||
| Retail – Super Regional Mall | Loan #2 | Cut-off Date Balance: | $91,000,000 | |
| 5000 Katy Mills Circle | Katy Mills | Cut-off Date LTV: | 33.0% | |
| Katy, TX 77494 | U/W NCF DSCR: | 2.91x | ||
| U/W NOI Debt Yield: | 21.8% |
The Katy Mills Property is located in Katy, Harris County, Texas, approximately 30 miles west of Downtown Houston in the Houston retail market and Far Katy South retail submarket. Per a third party market report, as of March 2022, the Houston retail market vacancy was 5.4% with average asking market rents of $21.39 per square foot and the Far Katy South submarket vacancy was 4.9% with average asking rents of $25.26 per square foot. The Katy Mills Property fronts Interstate 10, just east of the intersection with Grand Parkway (Highway 99). The Katy Mills Property’s primary trade area spans an area encompassing approximately 25 miles around the center.
The following table presents information regarding certain competitive properties to the Katy Mills Property:
Competitive Property Summary(1)
| Katy Mills | West Oaks Mall (TX) | Houston Premium Outlets | Memorial City | First Colony Mall | PlazAmericas | |
Year Built/ Renovated | 1999 / 2019 | 1984 / 2012 | 2008 / NAP | 1966 / 2002 | 1996 / 2006 | 1961 / NAP |
| Total GLA | 1,181,987(2) | 1,100,000 | 548,188 | 1,700,000 | 1,160,000 | 1,360,000 |
| Ownership | Simon Property Group (63%) / Private Owner (37%) | Private Owner - 100% | Simon Property Group (SPG) - 100% | Metro National Corp - 100% | NYSCRF (50%) / Brookfield (45%) / Private Owner (5%) | Private Owner – 100% |
| Distance to Property | N/A | 10 miles | 15 miles | 16 miles | 17 miles | 18 miles |
| Occupancy % | 86.3%(2) | 60.0% | 99.0% | 92.0% | 100.0% | 80.0% |
| Inline Sales PSF(3) | $515 | $353 | $757 | $817 | $762 | $350 |
| Anchors | AMC Theatres; Bass Pro Shops; Burlington Coat Factory; Marshalls; Ross Dress for Less; Saks Off 5th | Dillard's | Saks Off 5th | Apple; Cinemark; Dillard's; JCPenney; Macy's; Office Depot; Target | AMC Theatres; Dick's Sporting Goods; Dillard's; JCPenney; Macy's | Burlington Coat Factory |
| (1) | Source: Third party research report, unless otherwise indicated. |
| (2) | Based on the underwritten rent roll dated May 3, 2022. The Katy Mills Property was 94.7% occupied as of May 3, 2022 including RDP tenants. |
| (3) | Per third party research for the competitive properties, excluding Apple/Tesla as applicable. The Katy Mills Property sales information is based on borrower sponsor’s provided information for in-line tenants for TTM March 2022. |
The following table presents certain information relating to the appraiser’s market rent conclusions for the Katy Mills Property:
Market Rent Summary
| Tenant Type | Market Rent (PSF) | Lease Term (Yrs) | Rent Increase Projection |
| Anchor | $6.00 | 10 | 10.0% in Year 6 |
| Junior Anchor | $20.00 | 10 | 10.0% in Year 6 |
| Major | $20.00 | 10 | 10.0% in Year 6 |
| Over 10,000 SF | $30.00 | 7 | 3.0% per annum |
| 5,000 -9,999 SF | $34.00 | 7 | 3.0% per annum |
| 2,500-4,999 SF | $33.00 | 7 | 3.0% per annum |
| 1,000-2,499 SF | $43.50 | 7 | 3.0% per annum |
| Less than 1,000 SF | $60.00 | 7 | 3.0% per annum |
| Jewelry | $100.00 | 7 | 3.0% per annum |
| Food Court | $100.00 | 7 | 3.0% per annum |
| THE INFORMATION IN THIS STRUCTURAL AND COLLATERAL TERM SHEET IS NOT COMPLETE AND MAY BE AMENDED PRIOR TO THE TIME OF SALE. THIS TERM SHEET IS NOT AN OFFER TO SELL THESE SECURITIES AND IT IS NOT A SOLICITATION OF AN OFFER TO BUY THESE SECURITIES IN ANY JURISDICTION WHERE THE OFFER OR SALE IS NOT PERMITTED. | ||
| ||
| Retail – Super Regional Mall | Loan #2 | Cut-off Date Balance: | $91,000,000 | |
| 5000 Katy Mills Circle | Katy Mills | Cut-off Date LTV: | 33.0% | |
| Katy, TX 77494 | U/W NCF DSCR: | 2.91x | ||
| U/W NOI Debt Yield: | 21.8% |
Escrows.
Real Estate Taxes – The Katy Mills Borrower is required to deposit monthly to a real estate tax reserve 1/12 of the annual estimated real estate taxes (i) during a Control Event (as defined below), (ii) during a Lockbox Event Period (as defined below), or (iii) upon the Katy Mills Borrower’s failure to provide the lender evidence of timely payment of taxes. In lieu of monthly deposits to the real estate tax reserve, the Katy Mills Borrower is permitted to provide a letter of credit or a guaranty for such amounts from a Katy Mills Borrower affiliate approved by the lender.
Insurance – The Katy Mills Borrower is required to deposit monthly 1/12 of the annual estimated insurance premiums to the insurance reserve (i) during a Control Event, (ii) during a Lockbox Event Period, or (iii) upon the Katy Mills Borrower’s failure to provide the lender evidence of the renewal of a blanket policy to the extent the Katy Mills Borrower maintains insurance pursuant to a blanket policy. In lieu of monthly deposits to the insurance reserve, the Katy Mills Borrower is permitted to provide a letter of credit or a guaranty for such amounts from a Katy Mills Borrower affiliate approved by the lender.
Replacement Reserve – On each payment date, the Katy Mills Borrower is required to deposit monthly approximately $46,008 to a reserve for replacements to the Katy Mills Property, subject to a cap of approximately $1,104,183 (except such cap will not apply during a Lockbox Event Period). In lieu of monthly deposits to the replacement reserve, the Katy Mills Borrower is permitted to provide a letter of credit or a guaranty for such amounts from a Katy Mills Borrower affiliate approved by the lender.
TI/LC Reserve – On each payment date, the Katy Mills Borrower is required to deposit monthly $98,487 for future tenant improvements and leasing commissions, subject to a cap of $2,363,678 (except such cap will not apply during a Lockbox Event Period). In lieu of monthly deposits to the TI/LC reserve, the Katy Mills Borrower is permitted to provide a letter of credit or a guaranty for such amounts from a Katy Mills Borrower affiliate approved by the lender.
Outstanding TI/LC Reserve – The Katy Mills Mortgage Loan documents provide for an upfront reserve of $1,013,945 for outstanding landlord obligations.
A “Control Event” means if one or more of Simon Property Group, L.P. and Simon Property Group, Inc. does not own at least 62.5% of the direct or indirect interests in the Katy Mills Borrower or does not control the Katy Mills Borrower.
A “Lockbox Event Period” will commence during the occurrence of: (i) an event of default, (ii) a bankruptcy action of the Katy Mills Borrower or manager, (iii) a Debt Yield Trigger Event (as defined below), or (iv) a Major Tenant Trigger Event (as defined below).
A “Debt Yield Trigger Event” will commence when, as of any date of determination, the debt yield based on the trailing four calendar quarter period immediately preceding such date of determination is less than 15.0% for two consecutive calendar quarters and will expire on the date that the debt yield is 15.0% or greater for two consecutive calendar quarters.
A “Major Tenant Trigger Event” will commence during any of a (i) Major Tenant Bankruptcy Event (as defined below), (ii) Major Tenant Operations Event (as defined below) or (iii) Major Tenant Renewal Event (as defined below).
A “Major Tenant” means (i) Bass Pro Shops Outdoor, (ii) Burlington, (iii) AMC Theaters and/or (iv) any replacement tenant that occupies at least 50% of the square footage of the premises occupied by one or more of such tenants.
A “Major Tenant Bankruptcy Event” will commence upon a bankruptcy action of a Major Tenant and will expire on the date that the Major Tenant has assumed, and any applicable bankruptcy court has affirmed such assumption of the Major Tenant lease, and such Major Tenant is in occupancy of its full space.
A “Major Tenant Operations Event” will commence upon the date on which a Major Tenant goes dark or vacates, on a permanent basis (or for more than 90 consecutive days with an intention to vacate permanently), its demised space at the Katy Mills Property; provided that none of the following will constitute a Major Tenant Operations Event: (a) a temporary closure in connection with a restoration or renovation, (b) any other temporary closure with a duration of less than 90 days, (c) a temporary closure in compliance with applicable law, regulations and/or governmental mandates, or (d) a temporary closure related to COVID mandated stay-at-home closures, and will expire when the applicable Major Tenant continuously operates its business at the Katy Mills Property for a period of no less than 30 consecutive days during normal business hours and is paying full rent as is required under the Major Tenant lease.
A “Major Tenant Renewal Event” will commence upon the earlier of (x) the date on which such Major Tenant gives notice that it will not be renewing the Major Tenant lease in accordance with its terms, and (y) the date that is six months prior to the date of lease expiration, and will expire upon (a) the date on which the Major Tenant renews and/or extends its lease, (b) not less than 50% of the space demised by the Major Tenant lease being leased to one or more new tenants, or (c) the applicable Major Tenant Threshold Amount (as defined below) being deposited in the excess cash reserve account.
A “Major Tenant Threshold Amount” means with respect to (i) the space occupied by Bass Pro Shops Outdoor, the amount of $7,235,100, (ii) with respect to the space occupied by Burlington, the amount of $5,004,150 and (iii) with respect to the space occupied by AMC Theatres, the amount of $3,833,550.
| THE INFORMATION IN THIS STRUCTURAL AND COLLATERAL TERM SHEET IS NOT COMPLETE AND MAY BE AMENDED PRIOR TO THE TIME OF SALE. THIS TERM SHEET IS NOT AN OFFER TO SELL THESE SECURITIES AND IT IS NOT A SOLICITATION OF AN OFFER TO BUY THESE SECURITIES IN ANY JURISDICTION WHERE THE OFFER OR SALE IS NOT PERMITTED. | ||
| ||
| Retail – Super Regional Mall | Loan #2 | Cut-off Date Balance: | $91,000,000 | |
| 5000 Katy Mills Circle | Katy Mills | Cut-off Date LTV: | 33.0% | |
| Katy, TX 77494 | U/W NCF DSCR: | 2.91x | ||
| U/W NOI Debt Yield: | 21.8% |
Lockbox and Cash Management. The Katy Mills Whole Loan is structured with a hard lockbox and springing cash management. All rents from the Katy Mills Property are required to be deposited directly to the lockbox account and, so long as a Lockbox Event Period is not continuing, funds in the lockbox account will be transferred to the Katy Mills Borrower’s operating account. During a Lockbox Event Period, the Katy Mills Borrower will not have access to the funds in the lockbox account and such funds will be transferred to the lender-controlled cash management account and disbursed according to the Katy Mills Whole Loan documents. During a Lockbox Event Period, all excess cash is required to be held by the lender as additional security for the Katy Mills Whole Loan; provided that excess cash will be disbursed at the direction of the Katy Mills Borrower in the event of shortfalls in certain monthly expense items.
Property Management. The Katy Mills Property is managed by Simon Management Associates II, LLC, an affiliate of the Katy Mills Borrower.
Partial Release. Not permitted.
Real Estate Substitution. Not permitted.
Subordinate and Mezzanine Indebtedness. None.
Ground Lease. None.
Right of First Offer / Right of First Refusal. None.
Terrorism Insurance. The Katy Mills Borrower is required to obtain and maintain property insurance and business interruption insurance for 24 months plus a 365-day extended period of indemnity. Such insurance is required to cover perils of terrorism and acts of terrorism; provided that the Katy Mills Borrower is permitted to maintain terrorism coverage with a licensed captive insurance company that is affiliated with the borrower sponsor if certain conditions set forth in the related Katy Mills Whole Loan documents are satisfied, and if the Terrorism Risk Insurance Program Reauthorization Act of 2015 is not in effect, the Katy Mills Borrower will only be required to pay for terrorism insurance through such captive insurance company a maximum of two times the annual insurance premiums payable for the Katy Mills Property at the time with respect to the property and business income or rental income insurance interruption policies (excluding the terrorism and earthquake components of such premiums). See “Risk Factors—Risks Relating to the Mortgage Loans—Terrorism Insurance May Not Be Available for All Mortgaged Properties” in the Preliminary Prospectus.
| THE INFORMATION IN THIS STRUCTURAL AND COLLATERAL TERM SHEET IS NOT COMPLETE AND MAY BE AMENDED PRIOR TO THE TIME OF SALE. THIS TERM SHEET IS NOT AN OFFER TO SELL THESE SECURITIES AND IT IS NOT A SOLICITATION OF AN OFFER TO BUY THESE SECURITIES IN ANY JURISDICTION WHERE THE OFFER OR SALE IS NOT PERMITTED. | ||
| ||
| Office – CBD | Loan #3 | Cut-off Date Balance: | $84,000,000 | |
| 400 7th Street Southwest | Constitution Center | Cut-off Date LTV: | 43.5% | |
| Washington, DC 20024 | U/W NCF DSCR: | 4.30x | ||
| U/W NOI Debt Yield: | 14.1% |
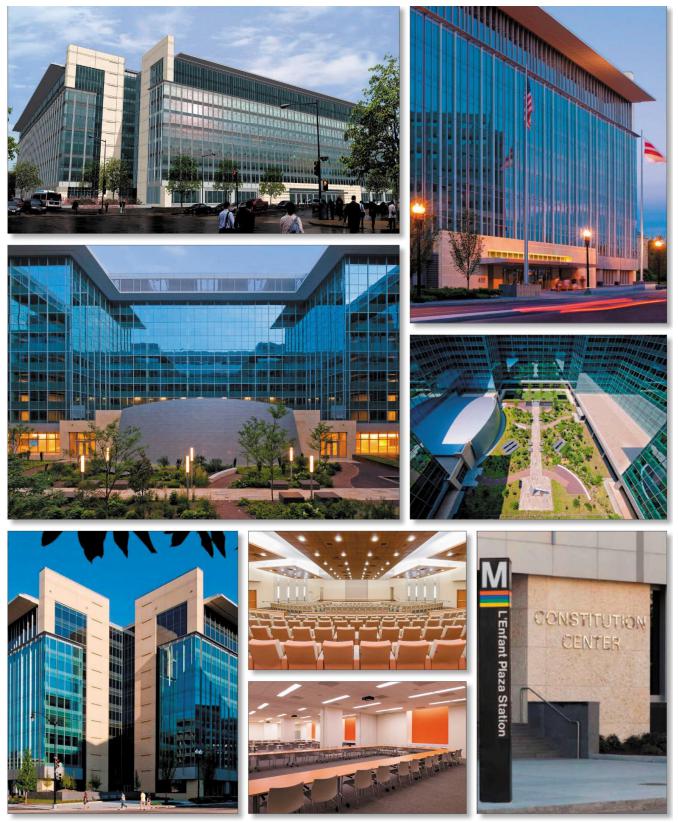
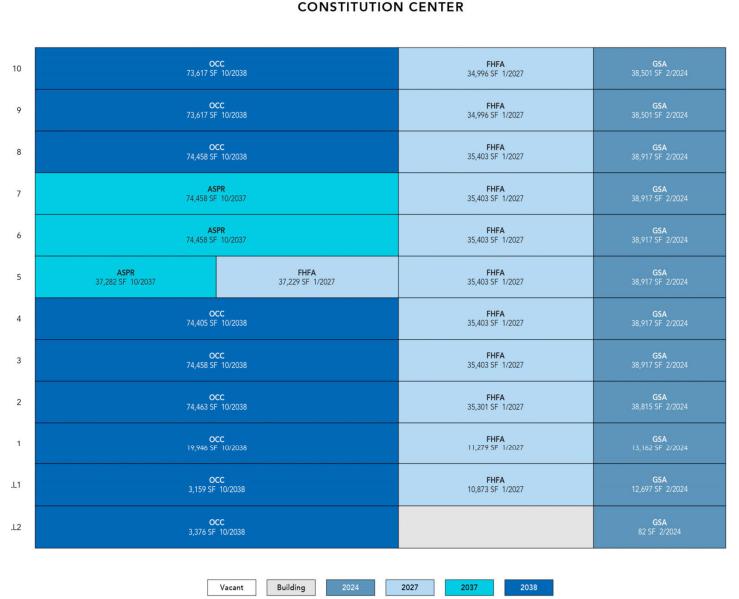
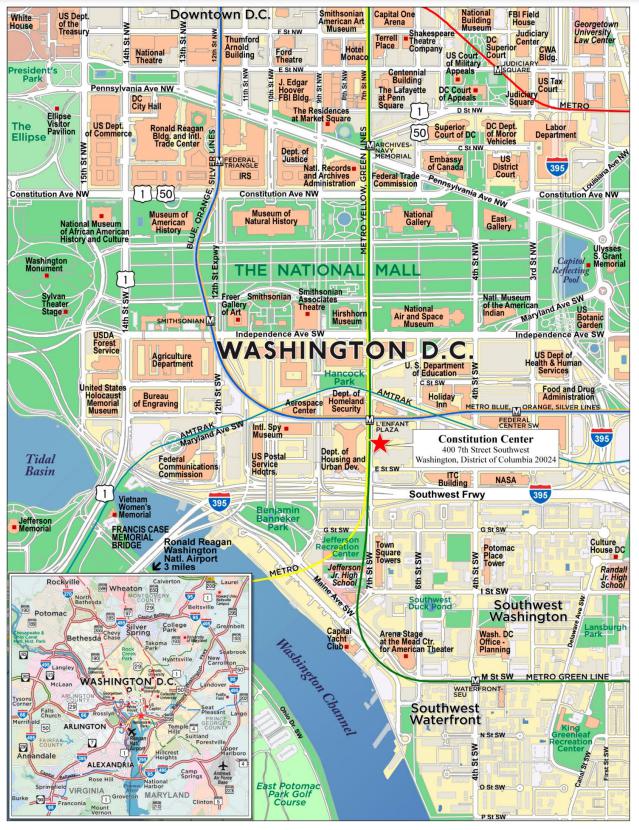
| THE INFORMATION IN THIS STRUCTURAL AND COLLATERAL TERM SHEET IS NOT COMPLETE AND MAY BE AMENDED PRIOR TO THE TIME OF SALE. THIS TERM SHEET IS NOT AN OFFER TO SELL THESE SECURITIES AND IT IS NOT A SOLICITATION OF AN OFFER TO BUY THESE SECURITIES IN ANY JURISDICTION WHERE THE OFFER OR SALE IS NOT PERMITTED. | ||
| ||
| No. 3 – Constitution Center |
| Mortgage Loan Information | Mortgaged Property Information | |||||
| Mortgage Loan Seller: | Morgan Stanley Mortgage Capital Holdings LLC | Single Asset/Portfolio: | Single Asset | |||
| Credit Assessment | A-sf*/AA/A2 | Property Type – Subtype: | Office – CBD | |||
| (Fitch/KBRA/Moody’s): | Location: | Washington, DC | ||||
| Original Principal Balance(1): | $84,000,000 | Size: | 1,410,049 SF | |||
| Cut-off Date Balance(1): | $84,000,000 | Cut-off Date Balance Per SF(1): | $282 | |||
| % of Initial Pool Balance: | 7.7% | Maturity Date Balance Per SF(1): | $282 | |||
| Loan Purpose: | Refinance | Year Built/Renovated: | 1968/2010 | |||
| Borrower Sponsor: | MetLife, Inc. and New York Common | Title Vesting: | Fee | |||
| Retirement Fund | Property Manager: | Hines GS Properties, Inc. | ||||
| Guarantor(2): | NAP | Current Occupancy (As of): | 100.0% (12/1/2021) | |||
| Mortgage Rate(3): | 3.0494% | 12/31/2021 TTM Occupancy | 100.0% | |||
| Note Date: | February 16, 2022 | YE 2020 Occupancy: | 100.0% | |||
| Seasoning: | 5 months | YE 2019 Occupancy: | 100.0% | |||
| Maturity Date: | March 9, 2032 | YE 2018 Occupancy: | 100.0% | |||
| IO Period: | 120 months | Appraised Value(8): | $914,000,000 | |||
| Loan Term (Original): | 120 months | Appraised Value Per SF(8): | $648 | |||
| Amortization Term (Original): | NAP | Appraisal Valuation Date(8): | December 29, 2021 | |||
| Loan Amortization Type: | Interest Only | |||||
| Call Protection(4): | L(24),YM1(5),DorYM1(84),O(7) | |||||
| Lockbox Type: | Hard/Springing Cash Management | Underwriting and Financial Information(7) | ||||
| Additional Debt: | Yes | YE 2021 NOI: | $52,895,989 | |||
| Additional Debt Type | Pari Passu ($314,000,000); | YE 2020 NOI: | $51,433,757 | |||
| (Balance)(1)(5): | Subordinate ($52,000,000) | YE 2019 NOI: | $49,648,892 | |||
| YE 2018 NOI: | $47,828,079 | |||||
| U/W Revenues: | $85,939,687 | |||||
| Escrows and Reserves(6) | U/W Expenses: | $29,664,589 | ||||
| Initial | Monthly | Cap | U/W NOI: | $56,275,098 | ||
| Taxes | $0 | Springing | NAP | U/W NCF: | $52,916,001 | |
| Insurance | $0 | Springing | NAP | U/W DSCR based on NOI/NCF(1): | 4.57x / 4.30x | |
| TI/LC Reserve | $416,036 | Springing | (6) | U/W Debt Yield based on NOI/NCF(1): | 14.1% / 13.3% | |
| Free Rent Reserve | $14,343,252 | $0 | NAP | U/W Debt Yield at Maturity based on | 14.1% / 13.3% | |
| NOI/NCF(1): | ||||||
| Cut-off Date LTV Ratio(1)(8): | 43.5% | |||||
| LTV Ratio at Maturity(1)(8): | 43.5% | |||||
| Sources and Uses | ||||||||
| Sources | Uses | |||||||
| Senior loan amount | $398,000,000 | 88.4 | % | Loan payoff | $372,749,794 | 82.8 | % | |
| Subordinate loan amount | 52,000,000 | 11.6 | Return of Equity | 59,412,042 | 13.2 | |||
| Closing Costs | 3,078,877 | 0.7 | ||||||
| Reserves: | 14,759,288 | 3.3 | ||||||
| Total Sources | $450,000,000 | 100.0 | % | Total Uses | $450,000,000 | 100.0 | % | |
| (1) | The Constitution Center Mortgage Loan (as defined below) is part of the Constitution Center Whole Loan (as defined below), which is comprised of eleven pari passu senior promissory notes with an aggregate original principal balance of $398,000,000 (collectively, the “Constitution Center Senior Loans”) and three promissory notes that are subordinate to the Constitution Center Senior Loans with an aggregate original principal balance of $52,000,000 (the “Constitution Center Subordinate Loans”, and together with the Constitution Senior Loans, the “Constitution Center Whole Loan”). The Cut-off Date Balance Per SF, Maturity Date Balance Per SF, UW DSCR based on NOI/NCF, UW Debt Yield based on NOI/NCF, UW NOI Debt Yield at Maturity based on NOI/NCF, Cut-off Date LTV Ratio and LTV Ratio at Maturity numbers presented above are based on the aggregate Cut-off Date principal balance of the Constitution Center Senior Loans, without regard to the Constitution Center Subordinate Loans. The Cut-off Date Balance Per SF, Maturity Date Balance Per SF, UW DSCR based on NOI/NCF, UW Debt Yield based on NOI/NCF, UW Debt Yield at Maturity based on NOI/NCF, Cut-off Date LTV Ratio and LTV Ratio at Maturity numbers based on the entire Constitution Center Whole Loan are $319, $319, 4.30x/3.68x, 12.5%/11.8%, 12.5%/11.8%, 49.2% and 49.2%, respectively. |
| (2) | There is no non-recourse carveout guarantor or separate environmental indemnitor with respect to the Constitution Center Whole Loan. |
| (3) | Represents solely the interest rate of the Constitution Center Senior Loans. The Constitution Center Subordinate Loans bear interest at the rate of 3.9200% per annum. |
| (4) | Defeasance of the Constitution Center Whole Loan is permitted at any time after the earlier of (i) February 16, 2025, or (ii) two years from the closing date of the securitization that includes the last pari passu note of the Constitution Center Whole Loan to be securitized. The assumed defeasance lockout period of 29 payments is based on the closing date of this transaction in August 2022. In addition, the Constitution Center Whole Loan may be prepaid, in whole but not in part, on and after the second anniversary of the first monthly payment date, together with, prior to the monthly payment date in September 2031, a prepayment fee equal to the greater of 1.00% of the amount prepaid and a yield maintenance premium. |
| (5) | See “The Mortgage Loan” and “Subordinate and Mezzanine Indebtedness” for a discussion of additional indebtedness. |
| (6) | See “Escrows” below for further discussion of reserve requirements. |
| (7) | The novel coronavirus pandemic is an evolving situation and could impact the Constitution Center Whole Loan more severely than assumed in the underwriting of the Constitution Center Whole Loan and could adversely affect the NOI, NCF and occupancy information, as well as the appraised value and the DSCR, LTV and Debt Yield metrics |
| THE INFORMATION IN THIS STRUCTURAL AND COLLATERAL TERM SHEET IS NOT COMPLETE AND MAY BE AMENDED PRIOR TO THE TIME OF SALE. THIS TERM SHEET IS NOT AN OFFER TO SELL THESE SECURITIES AND IT IS NOT A SOLICITATION OF AN OFFER TO BUY THESE SECURITIES IN ANY JURISDICTION WHERE THE OFFER OR SALE IS NOT PERMITTED. | ||
| ||
| Office – CBD | Loan #3 | Cut-off Date Balance: | $84,000,000 | |
| 400 7th Street Southwest | Constitution Center | Cut-off Date LTV: | 43.5% | |
| Washington, DC 20024 | U/W NCF DSCR: | 4.30x | ||
| U/W NOI Debt Yield: | 14.1% |
presented above and herein. See “Risk Factors—Risks Related to Market Conditions and Other External Factors—The Coronavirus Pandemic Has Adversely Affected the Global Economy and Will Likely Adversely Affect the Performance of the Mortgage Loans” in the prospectus.
| (8) | The Appraised Value constitutes the Hypothetical As Is value of $914,000,000, which is based on the assumption that a capital reserve account is established to address the GSA’s free rent under its lease agreement dated April 30, 2021 with a lease commencement date of May 1, 2022. At origination, the borrower deposited $14,343,252 into a free rent reserve. The Appraised Value per SF, Cut-off Date LTV Ratio and LTV Ratio at Maturity based on the “As Is” value of $900,000,000 as of December 29, 2021 for the Constitution Center Senior Loans are $638, 44.2%, and 44.2%, respectively, and for the Constitution Center Whole Loan are $638, 50.0% and 50.0%, respectively. |
The Mortgage Loan. The mortgage loan (the “Constitution Center Mortgage Loan”) is part of the Constitution Center Whole Loan in the original principal balance of $450,000,000. The Constitution Center Whole Loan is secured by a first priority fee mortgage encumbering a 1,410,049 SF Class A office property in Washington, DC (the “Constitution Center Property”). The Constitution Center Whole Loan is comprised of the Constitution Center Senior Loans, consisting of eleven pari passu senior promissory notes in the aggregate original principal balance of $398,000,000, and the Constitution Center Subordinate Loans, consisting of three subordinate promissory notes in the aggregate original principal balance of $52,000,000. The Constitution Center Senior Loans were originated by Morgan Stanley Bank, N.A. and the Constitution Center Subordinate Loans were originated by Morgan Stanley Mortgage Capital Holdings LLC. The non-controlling senior Note A-2-2 and Note A-4, with an aggregate original principal balance of $84,000,000, represent the Constitution Center Mortgage Loan and will be included in the BANK 2022-BNK43 securitization trust. The non-controlling senior Note A-2-1, Note A-3, and Note A-8 have been contributed to the BANK 2022-BNK42 securitization trust. The non-controlling senior Note A-1 and Note A-7 have been contributed to the BANK 2022-BNK41 securitization trust. The non-controlling senior Note A-5 and Note A-9 have been contributed to the MSC 2022-L8 securitization trust. The remaining Constitution Center Senior Loans (together with Note A-1, Note A-2-1, Note A-3, Note A-5, Note A-7, Note A-8 and Note A-9 the “Constitution Center Non-Serviced Pari Passu Companion Loans”) are currently held by Morgan Stanley Bank, N.A. and are expected to be contributed to one or more future securitization transactions. The Constitution Center Subordinate Loans have been sold to one or more third party purchasers. The Constitution Center Whole Loan is serviced under the MSC 2022-L8 pooling and servicing agreement. See “Description of the Mortgage Pool—The Whole Loans—The Non-Serviced Whole Loans—The Constitution Center Pari Passu-A/B Whole Loan” and “Pooling and Servicing Agreement—Servicing of the Non-Serviced Mortgage Loans” in the prospectus.
Whole Loan Note Summary
| Notes | Original Balance | Cut-off Date Balance | Note Holder | Controlling Piece |
| Senior Notes | ||||
| A-1 | $80,000,000 | $80,000,000 | BANK 2022-BNK41 | No |
| A-2-1 | $6,000,000 | $6,000,000 | BANK 2022-BNK42 | No |
| A-2-2 | $44,000,000 | $44,000,000 | BANK 2022-BNK43 | No |
| A-2-3 | $30,000,000 | $30,000,000 | Morgan Stanley Bank, N.A. | No |
| A-3 | $50,000,000 | $50,000,000 | BANK 2022-BNK42 | No |
| A-4 | $40,000,000 | $40,000,000 | BANK 2022-BNK43 | No |
| A-5 | $40,000,000 | $40,000,000 | MSC 2022-L8 | No |
| A-6 | $30,000,000 | $30,000,000 | Morgan Stanley Bank, N.A. | No |
| A-7 | $30,000,000 | $30,000,000 | BANK 2022-BNK41 | No |
| A-8 | $20,000,000 | $20,000,000 | BANK 2022-BNK42 | No |
| A-9 | $28,000,000 | $28,000,000 | MSC 2022-L8 | No |
| Total Senior Notes | $398,000,000 | $398,000,000 | ||
| Subordinate Notes | ||||
| B-1, B-2, B-3 | $52,000,000 | $52,000,000 | Third Party Purchaser | Yes |
| Total (Whole Loan) | $450,000,000 | $450,000,000 | ||
The Borrower and Borrower Sponsors. The borrower is CC Owner, LLC, a single-purpose Delaware limited liability company with two independent directors in its organizational structure. The borrower is indirectly owned and controlled 50% by MetLife, Inc. and 50% by New York Common Retirement Fund (together, the “Borrower Sponsor”), with MetLife, Inc. acting as managing partner. MetLife, Inc.’s real estate platform manages a portfolio of $109.8 billion, investing in real estate products including commercial mortgages and equities. MetLife, Inc. has over 200 senior real estate professionals across seven regional offices. New York State Common Retirement Fund is one of the largest public pension plans in the United States, with over one million New York State and local retirement system members, retirees and beneficiaries. Established in 1921, The New York Common Retirement Fund announced it ended the third quarter of fiscal year 2021-22 with an estimated value of $279.7 billion.
| THE INFORMATION IN THIS STRUCTURAL AND COLLATERAL TERM SHEET IS NOT COMPLETE AND MAY BE AMENDED PRIOR TO THE TIME OF SALE. THIS TERM SHEET IS NOT AN OFFER TO SELL THESE SECURITIES AND IT IS NOT A SOLICITATION OF AN OFFER TO BUY THESE SECURITIES IN ANY JURISDICTION WHERE THE OFFER OR SALE IS NOT PERMITTED. | ||
| ||
| Office – CBD | Loan #3 | Cut-off Date Balance: | $84,000,000 | |
| 400 7th Street Southwest | Constitution Center | Cut-off Date LTV: | 43.5% | |
| Washington, DC 20024 | U/W NCF DSCR: | 4.30x | ||
| U/W NOI Debt Yield: | 14.1% |
The Property. The Constitution Center Property is a Class A, 10-story office property totaling 1,410,049 SF located in Washington, DC. The Constitution Center Property was originally built in 1968 (known then as the “Nassif Building”) on a 5.4 acre site, and served as the headquarters of the United States Department of Transportation (“DOT”), which occupied the asset for nearly 40 years. Following the DOT’s departure in 2007, the Constitution Center Property underwent a $220 million renovation and was relet to other government tenants. The Constitution Center Property is located near other government buildings, across from the United States Department of Housing and Urban Development’s headquarters and the new Washington Metropolitan Area Transit Authority headquarters, with 16 other federal agencies within five blocks. A L’Enfant Metro station entrance is located on site and the Constitution Center Property is one block from the L’Enfant VRE Commuter rail station. The Constitution Center Property is a LEED Gold building, and has several specialized security features including Level IV security, a blast resistant curtain wall system, an auditorium, conference center, onsite cafeteria, underground parking garage, fitness center, and a one-acre interior courtyard. The Borrower Sponsor purchased the Constitution Center Property in 2012, and from 2016 to 2020 invested approximately $3.1 million in capital expenditures, including tenant improvement work, lobby renovations, and auditorium upgrades. The Constitution Center Property is currently 100.0% occupied by four government tenants.
Major Tenants.
The Office of the Comptroller of the Currency (471,499 SF, 33.4% of NRA, 36.0% of underwritten rent). The Office of the Comptroller of the Currency (“OCC”), an independent branch of the United States Department of the Treasury, charters, regulates, and supervises all national banks and federal savings associations as well as federal branches and agencies of foreign banks. The Constitution Center Property serves as OCC’s headquarters, employing over 3,500 employees across 57 operating locations and four district offices nationwide. OCC has been a tenant at the Constitution Center Property since 2012, has a lease expiration date of October 31, 2038, and has two 5-year renewal options remaining. OCC is entitled to receive twelve months of free rent, $36,255,840 of tenant improvements and $7,117,024 in respect of leasing commissions, all commencing November 1, 2027. OCC has the option to either utilize its tenant improvement allowance as well as the leasing commission allowance, or request the conversion of either or both such allowances to rental abatement by October 31, 2029. None of such tenant improvement allowance and leasing commissions and free rent have been reserved for.
Federal Housing Finance Agency (377,092 SF, 26.7% of NRA, 27.3% of underwritten rent). The Federal Housing Finance Agency (“FHFA”), was established by the Housing and Economic Recovery Act of 2008 and is responsible for the effective supervision, regulation, and housing mission oversight of Fannie Mae, Freddie Mac and the Federal Home Loan Bank system, which includes the 11 Federal Home Loan Banks and the Office of Finance. FHFA uses the Constitution Center Property as its headquarters, and has field offices in New York City/Newark, Chicago, Los Angeles, Tampa, St. Louis and Dallas, with over 700 employees nationwide. FHFA has been a tenant at the Constitution Center Property since 2012, has a lease expiration date of January 31, 2027, and has two 5-year renewal options remaining.
General Services Administration (375,260 SF, 26.6% of NRA, 24.7% of underwritten rent). General Services Administration (“GSA”) is an independent agency of the United States government established in 1949 to help manage and support the basic functions of federal agencies. GSA provides workplaces by constructing, managing, and preserving government buildings and by leasing and managing commercial real estate. Headquartered in Washington DC, GSA has eleven regional offices located across the country, and employs nearly 12,000 employees nationwide. GSA has been a tenant at the Constitution Center Property since 2014, has a lease expiration date of February 29, 2024, and has one 5-year renewal option remaining. GSA space is utilized by the Federal Trade Commission (251,805 SF), the National Endowment for the Arts (60,015 SF) and the National Endowment for the Humanities (63,440 SF).
Assistant Secretary for Preparedness and Response (186,198 SF, 13.2% of NRA, 12.0% of underwritten rent). Assistant Secretary for Preparedness and Response (“ASPR”) is part of the United States Department of Health and Human Services. ASPR was formed in 2006 to lead the nation in preventing, preparing for, and responding to the adverse health effects of public health emergencies and disasters. ASPR has been a tenant at the Constitution Center Property since 2022, has a lease expiration date of October 31, 2037, and has no renewal options. ASPR has $14,548,146 of free rent through December 2023, for which $14,343,252 was reserved at origination. ASPR leases its space through the GSA.
| THE INFORMATION IN THIS STRUCTURAL AND COLLATERAL TERM SHEET IS NOT COMPLETE AND MAY BE AMENDED PRIOR TO THE TIME OF SALE. THIS TERM SHEET IS NOT AN OFFER TO SELL THESE SECURITIES AND IT IS NOT A SOLICITATION OF AN OFFER TO BUY THESE SECURITIES IN ANY JURISDICTION WHERE THE OFFER OR SALE IS NOT PERMITTED. | ||
| ||
| Office – CBD | Loan #3 | Cut-off Date Balance: | $84,000,000 | |
| 400 7th Street Southwest | Constitution Center | Cut-off Date LTV: | 43.5% | |
| Washington, DC 20024 | U/W NCF DSCR: | 4.30x | ||
| U/W NOI Debt Yield: | 14.1% |
The following table presents certain information relating to the tenancy at the Constitution Center Property:
Major Tenants(1)
| Tenant Name | Credit Rating (Moody’s/ Fitch/ S&P)(2) | Tenant NRSF | % of NRSF | Annual U/W Gross Rent PSF | Annual U/W Gross Rent | % of Total Annual U/W Gross Rent | Lease Expiration Date | Extension Options | Termination Option (Y/N) | |||
| Major Tenants | ||||||||||||
| OCC | Aaa/AAA /AA+ | 471,499 | 33.4% | $57.13 | $26,936,849 | (3) | 36.0% | 10/31/2038 | 2x5 yr | N | ||
| FHFA | Aaa/AAA /AA+ | 377,092 | 26.7% | $54.18 | $20,432,612 | 27.3% | 1/31/2027 | 2x5 yr | N | |||
| GSA | Aaa/AAA /AA+ | 375,260 | 26.6% | $49.14 | $18,439,068 | 24.7% | 2/29/2024 | 1x5 yr | N | |||
| ASPR | Aaa/AAA /AA+ | 186,198 | 13.2% | $48.00 | $8,938,069 | (4) | 12.0% | 10/31/2037 | None | N | ||
| Total Major Tenants | 1,410,049 | 100.0% | $53.01 | $74,746,598 | 100.0% | |||||||
Non-Major Tenants | 0 | 0.0% | $00.00 | $0 | 0.0% | |||||||
| Occupied Collateral Total | 1,410,049 | 100.0% | $53.01 | $74,746,598 | 100.0% | |||||||
| Vacant Space | 0 | 0.0% | ||||||||||
| Collateral Total | 1,410,049 | 100.0% | ||||||||||
| (1) | Information is based on the underwritten rent roll. |
| (2) | Certain ratings are those of the parent entity or government, whether or not the parent entity or government guarantees the lease. |
| (3) | OCC is entitled to receive twelve months of free rent, $36,255,840 of tenant improvements and $7,117,024 in respect of leasing commissions, all commencing November 1, 2027. OCC has the option to either utilize its tenant improvement allowance as well as the leasing commission allowance or request the conversion of either or both such allowances to rental abatement by October 31, 2029. None of such tenant improvement allowance and leasing commissions or free rent have been reserved for. |
| (4) | ASPR has $14,548,146 of free rent through December 2023, for which $14,343,252 was reserved at origination. |
The following table presents certain information relating to the lease rollover schedule at the Constitution Center Property:
Lease Expiration Schedule(1)
| Year Ending December 31 | No. of Leases Expiring | Expiring NRSF | % of Total NRSF | Cumulative Expiring NRSF | Cumulative % of Total NRSF | Annual U/W Gross Rent | % of Total Annual U/W Gross Rent | Annual U/W Gross Rent PSF |
| 2022 | 0 | 0 | 0.0% | 0 | 0.0% | $0 | 0.0% | $0.00 |
| 2023 | 0 | 0 | 0.0% | 0 | 0.0% | $0 | 0.0% | $0.00 |
| 2024 | 1 | 375,260 | 26.6% | 375,260 | 26.6% | $18,439,068 | 24.7% | $49.14 |
| 2025 | 0 | 0 | 0.0% | 375,260 | 26.6% | $0 | 0.0% | $0.00 |
| 2026 | 0 | 0 | 0.0% | 375,260 | 26.6% | $0 | 0.0% | $0.00 |
| 2027 | 1 | 377,092 | 26.7% | 752,352 | 53.4% | $20,432,612 | 27.3% | $54.18 |
| 2028 | 0 | 0 | 0.0% | 752,352 | 53.4% | $0 | 0.0% | $0.00 |
| 2029 | 0 | 0 | 0.0% | 752,352 | 53.4% | $0 | 0.0% | $0.00 |
| 2030 | 0 | 0 | 0.0% | 752,352 | 53.4% | $0 | 0.0% | $0.00 |
| 2031 | 0 | 0 | 0.0% | 752,352 | 53.4% | $0 | 0.0% | $0.00 |
| 2032 | 0 | 0 | 0.0% | 752,352 | 53.4% | $0 | 0.0% | $0.00 |
| Thereafter | 2 | 657,697 | 46.6% | 1,410,049 | 100.0% | $35,874,918 | 48.0% | $54.55 |
| Vacant | 0 | 0 | 0.0% | 1,410,049 | 100.0% | $0 | 0.0% | $0.00 |
Total/ Wtd. Avg. | 4 | 1,410,049 | 100.0% | $74,746,598 | 100.0% | $53.01 | ||
| (1) | Information obtained from the underwritten rent roll. |
| THE INFORMATION IN THIS STRUCTURAL AND COLLATERAL TERM SHEET IS NOT COMPLETE AND MAY BE AMENDED PRIOR TO THE TIME OF SALE. THIS TERM SHEET IS NOT AN OFFER TO SELL THESE SECURITIES AND IT IS NOT A SOLICITATION OF AN OFFER TO BUY THESE SECURITIES IN ANY JURISDICTION WHERE THE OFFER OR SALE IS NOT PERMITTED. | ||
| ||
| Office – CBD | Loan #3 | Cut-off Date Balance: | $84,000,000 | |
| 400 7th Street Southwest | Constitution Center | Cut-off Date LTV: | 43.5% | |
| Washington, DC 20024 | U/W NCF DSCR: | 4.30x | ||
| U/W NOI Debt Yield: | 14.1% |
The following table presents historical occupancy percentages at the Constitution Center Property:
Historical Occupancy
12/31/2018(1) | 12/31/2019(1) | 12/31/2020(1) | 12/1/2021(2) |
| 100.0% | 100.0% | 100.0% | 100.0% |
| (1) | Information obtained from the appraisal. |
| (2) | Based on Underwritten Rent Roll dated December 1, 2021 |
Operating History and Underwritten Net Cash Flow. The following table presents certain information relating to the historical operating performance and underwritten net cash flow at the Constitution Center Property:
Cash Flow Analysis
| 2018 | 2019 | 2020 | 2021 | U/W | %(1) | U/W $ per SF | ||
| Base Rent | $68,424,283 | $70,158,070 | $71,355,483 | $72,427,586 | $74,746,598(2) | 84.5 | % | $53.01 |
| Free Rent | (1,147) | (1,147) | (1,147) | (1,147) | 0 | 0.0 | 0.00 | |
| Straight Line Rent(3) | 0 | 0 | 0 | 0 | 4,468,440 | 5.0 | 3.17 | |
| Grossed Up Vacant Space | 0 | 0 | 0 | 0 | 0 | 0.0 | 0.00 | |
| Gross Potential Rent | $68,423,136 | $70,156,923 | $71,354,336 | $72,426,439 | $79,215,037 | 89.5 | % | $56.18 |
| Other Income(4) | 4,079,598 | 4,046,891 | 4,062,096 | 4,393,495 | 5,451,525 | 6.2 | 3.87 | |
| Expense Reimbursements | 2,037,839 | 2,840,701 | 2,244,245 | 3,152,519 | 3,820,656 | 4.3 | 2.71 | |
| Net Rental Income | $74,540,573 | $77,044,515 | $77,660,677 | $79,972,453 | $88,487,218 | 100.0 | % | $62.75 |
| (Vacancy & Credit Loss) | 0 | 0 | 0 | 0 | (2,547,531) | (3.2) |
| (1.81) |
| Effective Gross Income | $74,540,573 | $77,044,515 | $77,660,677 | $79,972,453 | $85,939,687 | 97.1 | % | $60.95 |
| Real Estate Taxes | 14,499,868 | 14,856,597 | 14,927,387 | 14,463,167 | 13,549,234 | 15.8 | 9.61 | |
| Insurance | 497,217 | 528,288 | 394,008 | 396,060 | 364,902 | 0.4 | 0.26 | |
| Management Fee | 552,937 | 571,673 | 588,419 | 583,597 | 1,000,000 | 1.2 | 0.71 | |
| Other Operating Expenses | 11,162,472 | 11,439,065 | 10,317,106 | 11,633,640 | 14,750,453 | 17.2 |
| 10.46 |
| Total Operating Expenses | $26,712,494 | $27,395,623 | $26,226,920 | $27,076,464 | $29,664,589 | 34.5 | % | $21.04 |
| Net Operating Income | $47,828,079 | $49,648,892 | $51,433,757 | $52,895,989 | $56,275,098 | 65.5 | % | $39.91 |
| Replacement Reserves | 0 | 0 | 0 | 0 | 352,512 | 0.4 | 0.25 | |
| TI/LC | 0 | 0 | 0 | 0 | 3,006,585 | 3.5 |
| 2.13 |
| Net Cash Flow | $47,828,079 | $49,648,892 | $51,433,757 | $52,895,989 | $52,916,001 | 61.6 | % | $37.53 |
| NOI DSCR(5) | 3.89x | 4.03x | 4.18x | 4.30x | 4.57x | |||
| NCF DSCR(5) | 3.89x | 4.03x | 4.18x | 4.30x | 4.30x | |||
| NOI Debt Yield(5) | 12.0% | 12.5% | 12.9% | 13.3% | 14.1% | |||
| NCF Debt Yield(5) | 12.0% | 12.5% | 12.9% | 13.3% | 13.3% | |||
| (1) | Represents (i) percent of Net Rental Income for all revenue fields, (ii) percent of Gross Potential Rent for Vacancy and Concessions & Credit Loss and (iii) percent of Effective Gross Income for all other fields. |
| (2) | Underwritten Base Rent is based on the rent roll as of December 1, 2021. Gross Potential Rent includes payments from the GSA in repayment of its tenant allowance of $1.60 PSF, and operating rent from GSA of $9.89 PSF and ASPR of $10.90 PSF. |
| (3) | Includes rent steps for OCC of $2,820,218 through November 1, 2029, $7,559 through November 1, 2031, and $5,982 through November 1, 2030, rent steps for FHFA of $1,033,958 through November 1, 2026 and $18,720 through February 1, 2026, and rent steps for ASPR of $169,271 through November 1, 2027. |
| (4) | Other Income includes solar incentive revenue, energy revenue, garage and parking revenue, and income from antenna roof top, tenant service, other interest, health club, signs, and café. |
| (5) | Debt service coverage ratios and debt yields include the Constitution Center Senior Loans and exclude the Constitution Center Subordinate Loans. |
Appraisal. According to the appraisal, the Constitution Center Property had a “Hypothetical As Is” appraised value of $914,000,000 as of December 29, 2021, which is based on the assumption that a capital reserve account is established to address the GSA’s free rent under its lease agreement dated April 30, 2021 with a lease commencement date of May 1, 2022. At origination, the borrower deposited $14,343,252 into a free rent reserve. The “As Is” appraised value is $900,000,000 as of December 29, 2021.
Environmental Matters. According to the Phase I environmental site assessment dated January 19, 2022, there was no evidence of any recognized environmental conditions at the Constitution Center Property.
COVID-19 Update. As of July 27, 2022, the borrower sponsor has reported that the Constitution Center Property is open and operating. Plans to return to the office at the beginning of 2022 were pushed back, and currently, only about 32% of the space is being utilized due to COVID restrictions.
| THE INFORMATION IN THIS STRUCTURAL AND COLLATERAL TERM SHEET IS NOT COMPLETE AND MAY BE AMENDED PRIOR TO THE TIME OF SALE. THIS TERM SHEET IS NOT AN OFFER TO SELL THESE SECURITIES AND IT IS NOT A SOLICITATION OF AN OFFER TO BUY THESE SECURITIES IN ANY JURISDICTION WHERE THE OFFER OR SALE IS NOT PERMITTED. | ||
| ||
| Office – CBD | Loan #3 | Cut-off Date Balance: | $84,000,000 | |
| 400 7th Street Southwest | Constitution Center | Cut-off Date LTV: | 43.5% | |
| Washington, DC 20024 | U/W NCF DSCR: | 4.30x | ||
| U/W NOI Debt Yield: | 14.1% |
Market Overview and Competition. The Constitution Center Property is located in Washington, DC, within the Southwest submarket of the District of Columbia office market. The area is also known as the Cabinet submarket as it is dominated by federal government agency headquarters, such as the Department of Energy, the Federal Emergency Management Agency, the Department of Housing and Urban Development, and the Federal Aviation Administration. Eighteen federal agencies are located within five blocks of the Constitution Center Property. Access to the Constitution Center Property is provided by the L’Enfant Plaza Metrorail station, with an entrance from D and 7th Streets SW, at the Constitution Center Property’s D Street main entrance. According to the appraisal, as of the third quarter of 2021, the vacancy rate in the Southwest submarket was approximately 11.7%, with average asking rents of $49.90 per SF and inventory of approximately 12.9 million SF. According to the appraisal, as of the third quarter of 2021, the vacancy rate in the District of Columbia office market was approximately 14.3%, with average asking rents of $54.57 per SF and inventory of approximately 164.9 million SF. According to the appraisal, the 2021 population within a one-, three- and five-mile radius was 27,288, 338,563 and 823,034, respectively. The 2021 average household income within the same one-, three- and five-mile radius was $142,732, $148,138 and $139,184, respectively.
The following table presents certain information relating to the appraisal’s market rent conclusion for the Constitution Center Property:
Market Rent Summary(1)
| GSA Space | Agency Space | Concourse Level Space | Storage Space | |
| Market Rent (PSF) | $48.00 | $55.00 | $26.00 | $18.00 |
| Lease Term (Years) | 10 | 10 | 10 | 10 |
| Lease Type (Reimbursements) | GSA (FS) | Full Service | Full Service | None |
| Rent Increase Projection | None | 2% per annum | None | None |
| (1) | Information obtained from the appraisal. |
The table below presents leasing data at comparable office properties with respect to the Constitution Center Property:
Comparable Leases(1)
| Property Name |
Location | Year Built/Renovated | Rentable Area (SF) | Tenant Name | Tenant Size (SF) | Lease Date | Rent PSF | Lease Type |
| Constitution Center (2) | Washington, DC | 1968/2010 | 1,410,049 | OCC | 471,499 | May-2021 | $57.13 | GSA |
Union Square – North Tower | Washington, DC | 1972/2011 | 322,249 | Department of Justice | 164,000 | Oct-2021 | $46.75 | GSA |
| National Place | Washington, DC | 1984/NAP | 691,200 | US Commission on Civil Rights | 24,139 | Aug-2021 | $45.00 | GSA |
| L’Enfant Plaza North | Washington, DC | 1969/2014 | 299,476 | FAA | 65,734 | Jan-2021 | $48.15 | GSA |
| Aerospace Center | Washington, DC | 1987/NAP | 407,321 | Internal Revenue Service | 38,000 | Jun-2020 | $43.00 | GSA |
| Potomac Center South | Washington, DC | 1969/2003 | 429,256 | Department of Education | 290,000 | Feb-2020 | $46.90 | GSA |
| International Trade Commission | Washington, DC | 1987/NAP | 262,959 | International Trade Commission | 29,092 | Nov-2018 | $49.75 | GSA |
| (1) | Information obtained from the appraisal. |
| (2) | Information obtained from the underwritten rent roll other than year built/renovated and lease type. |
| THE INFORMATION IN THIS STRUCTURAL AND COLLATERAL TERM SHEET IS NOT COMPLETE AND MAY BE AMENDED PRIOR TO THE TIME OF SALE. THIS TERM SHEET IS NOT AN OFFER TO SELL THESE SECURITIES AND IT IS NOT A SOLICITATION OF AN OFFER TO BUY THESE SECURITIES IN ANY JURISDICTION WHERE THE OFFER OR SALE IS NOT PERMITTED. | ||
| ||
| Office – CBD | Loan #3 | Cut-off Date Balance: | $84,000,000 | |
| 400 7th Street Southwest | Constitution Center | Cut-off Date LTV: | 43.5% | |
| Washington, DC 20024 | U/W NCF DSCR: | 4.30x | ||
| U/W NOI Debt Yield: | 14.1% |
Escrows.
Tax Reserve - During the continuance of a Cash Management Sweep Period (as defined below), the borrower is required to make ongoing monthly deposits into a reserve for real estate taxes in an amount equal to 1/12 of the real estate taxes that the lender estimates will be payable during the next twelve months for the Constitution Center Property.
Insurance Reserve - During the continuance of a Cash Management Sweep Period, the borrower is required to make ongoing monthly deposits into a reserve for insurance premiums in an amount equal to 1/12 of the insurance premiums that the lender estimates will be payable for the renewal of coverage upon the expiration of the insurance policies. Notwithstanding the foregoing, the borrower is not required to reserve for insurance premiums, provided that no event of default is continuing under the Constitution Center Whole Loan, and the borrower provides the lender with satisfactory evidence that the insurance coverage for the Constitution Center Property is included in blanket policies approved by the lender in its reasonable discretion, and the insurance premiums have been prepaid for not less than one year in advance (or for the period of coverage for which insurance certificates were delivered at origination, if less than one year).
TI/LC Reserve - On each monthly payment date, during the continuance of a Cash Management Sweep Period, the borrower is required to deposit the Excluded Lease Funds (as defined below) as described below under “Lockbox and Cash Management” into a reserve for tenant improvements, tenant allowances and leasing commissions.
Outstanding TI/LC Reserve – At origination the borrower deposited $416,036 into a reserve for tenant improvements, tenant allowances and leasing commissions for ASPR outstanding as of the origination date.
Free Rent Reserve – At origination the borrower deposited $14,343,252 into a reserve for free rent for the tenant ASPR.
Lockbox and Cash Management. The Constitution Center Whole Loan is structured with a hard lockbox and springing cash management. All rents are required to be deposited into a lender-controlled lockbox account. The Constitution Center Whole Loan requires that the borrower deliver tenant direction letters to the tenants directing tenants to pay all rents into the lockbox account, and if the borrower or any of its affiliates receives rents from the Constitution Center Property despite such direction, to deposit such rents into the lockbox account within three business days of receipt. If no Cash Management Sweep Period exists, all funds in the lockbox account are required to be swept on each business day into the borrower’s operating account. Upon the occurrence of a Cash Management Sweep Period, the borrower is required to establish a lender-controlled cash management account, and during the continuance of a Cash Management Sweep Period all funds in the lockbox account are required to be swept on each business day to the cash management account to be applied (i) to make the monthly deposits into the tax and insurance reserve funds (if any), as described above under “Escrows,” (ii) to pay debt service on the Constitution Center Whole Loan, (iii) to pay monthly operating expenses in the amount set forth in the annual budget (which is required to be reasonably approved by the lender during the continuance of a Cash Management Sweep Period) and lender approved extraordinary expenses, (iv) to make Required REIT Distributions (as defined below), (v) to deposit any remaining amounts into the TI/LC reserve until the amount on deposit in such reserve equals $50 per rentable square foot for all Excluded Leases (as defined below) (the amount so deposited, the “Excluded Lease Funds”) and (vi) to deposit any funds remaining in the cash management account after the application described above into an excess cash flow reserve to be held as additional collateral for the Constitution Center Whole Loan (provided that, so long as no event of default is continuing, the lender is required to disburse funds in such reserve to pay the items in clauses (iii) and (iv) above). To the extent that no Cash Management Sweep Period is continuing, all funds in the excess cash flow reserve are required to be disbursed to the borrower.
A “Cash Management Sweep Period” will commence upon the earlier of the following: (i) the occurrence and continuance of an event of default and (ii) as of the origination date, or the last day of any calendar quarter following the origination date, the net operating income debt yield on the Constitution Center Whole Loan based on the succeeding 12-month period is less than 8.00%.
A Cash Management Sweep Period will end upon the occurrence of the following: with regard to clause (i) above, the cure of such event of default; or with regard to clause (ii) above, when the net operating income debt yield on the Constitution Center Whole Loan based on the succeeding 12-month period is at least 8.00% for one calendar quarter.
The borrower has the right to avoid or terminate a Cash Management Sweep Period caused by a decline in debt yield by delivering to the lender either (i) cash or (ii) a letter of credit, in each case, in an amount that, if applied to the reduction of the principal amount of the Constitution Center Whole Loan, would cause the net operating income debt yield of the Constitution Center Whole Loan to be equal to or greater than 8.00%. Such cash or letter of credit is required to be bifurcated into (i) an amount not exceeding $50 per rentable square foot for each Excluded Lease and (ii) the remaining portion of such cash or letter of credit after deducting the amount in clause (i). The amount in clause (ii) is required to be released to the borrower if the net operating income debt yield of the Constitution Center Whole Loan is equal to or greater than 8.00% for one calendar quarter (without giving effect to any cash or letter of credit). The amount in clause (i) is required to be deposited in the TI/LC reserve and released only in accordance with the provisions applicable to such reserve.
“Excluded Leases” means leases as to which the related rents are excluded from being included in the calculation of net operating income under the Constitution Center Whole Loan documents, which excluded leases include (i) leases for any tenant that is in bankruptcy and has not assumed its lease, (ii) leases for any tenant that has less than 12 months (or 18 months for FHFA under the current FHFA lease) remaining under its lease and has not renewed or extended its lease or delivered a notice of, or a letter of intent with respect to, such renewal or extension, (iii) other than the free rent due to OCC, leases that have any free or abated rent that exceeds 12 months for any lease to a tenant that has an investment grade rating (from any one or more of Fitch, S&P and Moody’s, and does not have a lower than investment grade rating from any such agency) or that exceeds six months for any other tenant (in
| THE INFORMATION IN THIS STRUCTURAL AND COLLATERAL TERM SHEET IS NOT COMPLETE AND MAY BE AMENDED PRIOR TO THE TIME OF SALE. THIS TERM SHEET IS NOT AN OFFER TO SELL THESE SECURITIES AND IT IS NOT A SOLICITATION OF AN OFFER TO BUY THESE SECURITIES IN ANY JURISDICTION WHERE THE OFFER OR SALE IS NOT PERMITTED. | ||
| ||
| Office – CBD | Loan #3 | Cut-off Date Balance: | $84,000,000 | |
| 400 7th Street Southwest | Constitution Center | Cut-off Date LTV: | 43.5% | |
| Washington, DC 20024 | U/W NCF DSCR: | 4.30x | ||
| U/W NOI Debt Yield: | 14.1% |
each case, unless such free rent has been reserved with the lender), (iv) rents relating to any tenants that are 90 or more days delinquent in the payment of base rent, and (v) with respect to any tenant that is not the United States government or a unit within such government, leases as to which the tenant is no longer in physical occupancy of more than 50% of its leased premises, other than tenants that are not in occupancy due to government mandates or suggestions or internal policies with respect to any communicable diseases.
“Required REIT Distributions” means distributions to the borrower’s direct or indirect owners that are real estate investment trusts (“REITS”) in the amount necessary for such entities to qualify for or maintain their REIT status and avoid the payment or imposition of entity level tax or excise taxes, provided that such distributions may not exceed $200,000 in any year.
Property Management. The Constitution Center Property is managed by Hines GS Properties, Inc., a third party property manager.
Partial Release. Not permitted.
Real Estate Substitution. Not permitted.
Subordinate and Mezzanine Indebtedness. In addition to the Constitution Center Mortgage Loan, the Constitution Center Property also secures the Constitution Center Non-Serviced Pari Passu Companion Loans, which have an aggregate Cut-off Date principal balance of $314,000,000, and the Constitution Center Subordinate Loans, which have an aggregate Cut-off Date principal balance of $52,000,000. The Constitution Center Non-Serviced Pari Passu Companion Loans bear interest at the same rate as the Constitution Center Mortgage Loan, and the Constitution Center Subordinate Loans bear interest at the rate of 3.9200% per annum. The Constitution Center Mortgage Loan and the Constitution Center Non-Serviced Pari Passu Companion Loans are pari passu in right of payment and together are senior in right of payment to the Constitution Center Subordinate Loans. The holders of the Constitution Center Mortgage Loan, the Constitution Center Non-Serviced Pari Passu Companion Loans and the Constitution Center Subordinate Loans have entered into a co-lender agreement which sets forth the allocation of collections on the Constitution Center Whole Loan. See “Description of the Mortgage Pool—The Whole Loans—The Constitution Center Pari Passu-A/B Whole Loan” in the prospectus.
The following table presents certain information relating to the Constitution Center Whole Loan:
| B-Note Original Principal Balance | Interest Rate | Original Term (mos.) | Original Amort. Term (mos.) | Original IO Term (mos.) | Whole Loan UW NCF DSCR | Whole Loan UW NOI DY | Whole Loan Cutoff Date LTV | |
| Constitution Center Senior Notes | $398,000,000 | 3.0494% | 120 | 0 | 120 | 4.30x | 14.1% | 43.5% |
| Subordinate Notes | $52,000,000 | 3.9200% | 120 | 0 | 120 | 3.68x | 12.5% | 49.2% |
Right of First Offer/Right of First Refusal. None.
Ground Lease. None.
Letter of Credit. None. However, the borrower has the right to provide a letter of credit to avoid or terminate a Cash Management Sweep Period caused by a decline in debt yield as described above under “Lockbox and Cash Management.”
Terrorism Insurance. The borrower is required to maintain terrorism insurance in an amount equal to the full replacement cost of the Constitution Center Property, as well as 24 months of rental loss and/or business interruption coverage. Notwithstanding the foregoing, for so long as the Terrorism Risk Insurance Act of 2002, as extended and modified by the Terrorism Risk Insurance Program Reauthorization Act of 2015 (“TRIPRA”), is in effect (including any extensions thereof or if another federal governmental program is in effect relating to “acts of terrorism” which provides substantially similar protections as TRIPRA), the lender is required to accept terrorism insurance which insures against “covered acts” as defined by TRIPRA (or such other program) but only in the event that TRIPRA (or such other program) continues to cover both domestic and foreign acts of terrorism. Notwithstanding the foregoing, if TRIPRA is no longer in effect, the borrower will not be required to pay terrorism insurance premiums in excess of an amount equal to two times the amount of the insurance premium that is payable in respect of the property and business interruption/rental loss insurance required under the Constitution Center Whole Loan documents (without giving effect to the cost of terrorism components of such property and business interruption/rental loss insurance) at the time that such terrorism coverage is excluded from the applicable policy. See “Risk Factors—Risks Relating to the Mortgage Loans—Terrorism Insurance May Not Be Available for All Mortgaged Properties” in the prospectus.
| THE INFORMATION IN THIS STRUCTURAL AND COLLATERAL TERM SHEET IS NOT COMPLETE AND MAY BE AMENDED PRIOR TO THE TIME OF SALE. THIS TERM SHEET IS NOT AN OFFER TO SELL THESE SECURITIES AND IT IS NOT A SOLICITATION OF AN OFFER TO BUY THESE SECURITIES IN ANY JURISDICTION WHERE THE OFFER OR SALE IS NOT PERMITTED. | ||
| ||
| Hospitality – Full Service | Loan #4 | Cut-off Date Balance: | $74,930,466 | |
34631 North Tom Darlington Drive Scottsdale, AZ 85266
| The Boulders Resort | Cut-off Date LTV: U/W NCF DSCR: U/W NOI Debt Yield: | 42.9% 2.66x 20.3% |

| THE INFORMATION IN THIS STRUCTURAL AND COLLATERAL TERM SHEET IS NOT COMPLETE AND MAY BE AMENDED PRIOR TO THE TIME OF SALE. THIS TERM SHEET IS NOT AN OFFER TO SELL THESE SECURITIES AND IT IS NOT A SOLICITATION OF AN OFFER TO BUY THESE SECURITIES IN ANY JURISDICTION WHERE THE OFFER OR SALE IS NOT PERMITTED. | ||
| ||
| No. 4 – The Boulders Resort |
| Mortgage Loan Information | Mortgaged Property Information | |||||
| Mortgage Loan Seller: | Wells Fargo Bank, National Association | Single Asset/Portfolio: | Single Asset | |||
Credit Assessment (Fitch/KBRA/Moody’s): | NR/NR/NR | Property Type – Subtype: | Hospitality – Full Service | |||
| Original Principal Balance(1): | $75,000,000 | Location: | Scottsdale, AZ | |||
| Cut-off Date Balance(1): | $74,930,466 | Size: | 160 Rooms | |||
| % of Initial Pool Balance: | 6.9% | Cut-off Date Balance Per Room(1): | $624,421 | |||
| Loan Purpose: | Refinance | Maturity Date Balance Per Room(1): | $524,370 | |||
| Borrower Sponsor: | William J. Yung III, Martha Yung, William J. Yung IV, Joseph A. Yung, Julie A. Haught, Judith A. Yung, Jennifer A. Yung, Michelle M. Christensen and Scott A. Yung | Year Built/Renovated: | 1985/2016 | |||
| Guarantor: | CSC Holdings, LLC | Title Vesting: | Fee | |||
| Mortgage Rate: | 5.5630% | Property Manager: | Crestview Management, LLC (borrower affiliate) | |||
| Note Date: | July 6, 2022 | Current Occupancy (As of): | 70.0% (4/30/2022) | |||
| Seasoning: | 1 month | YE 2021 Occupancy(4): | 68.8% | |||
| Maturity Date: | July 11, 2032 | YE 2020 Occupancy(4): | 46.3% | |||
| IO Period: | 0 months | YE 2019 Occupancy(4): | 69.4% | |||
| Loan Term (Original): | 120 months | YE 2018 Occupancy: | 71.1% | |||
| Amortization Term (Original): | 360 months | As-Is Appraised Value: | $232,800,000 | |||
| Loan Amortization Type: | Amortizing Balloon | As-Is Appraised Value Per Room: | $1,455,000 | |||
| Call Protection(2): | L(25),D(91),O(4) | As-Is Appraisal Valuation Date: | June 7, 2022 | |||
| Lockbox Type: | Hard / In Place Cash Management | Underwriting and Financial Information(5) | ||||
| Additional Debt(1): | Yes | TTM NOI (4/30/2022)(4): | $20,326,361 | |||
| Additional Debt Type (Balance) (1): | Pari Passu ($24,976,822) | YE 2021 NOI(4): | $15,904,330 | |||
| YE 2020 NOI(4): | $7,698,759 | |||||
| YE 2019 NOI: | $8,670,445 | |||||
| U/W Revenues: | $50,961,864 | |||||
| U/W Expenses: | $30,697,492 | |||||
| Escrows and Reserves(3) | U/W NOI: | $20,264,372 | ||||
| Initial | Monthly | Cap | U/W NCF: | $18,225,898 | ||
| Taxes | $187,374 | $62,459 | NAP | U/W DSCR based on NOI/NCF(1): | 2.95x / 2.66x | |
| Insurance | $0 | Springing | NAP | U/W Debt Yield based on NOI/NCF(1): | 20.3% / 18.2% | |
| FF&E Reserve | $0 | $169,873 | NAP | U/W Debt Yield at Maturity based on NOI/NCF(1): | 24.2% / 21.7% | |
| Seasonality Reserve | $1,800,000 | Springing | $1,800,000 | Cut-off Date LTV Ratio(1): | 42.9% | |
| PIP Reserve | $0 | Springing | NAP | LTV Ratio at Maturity(1): | 36.0% | |
| Sources and Uses | ||||||||
| Sources | Uses | |||||||
| Whole Loan amount | $100,000,000 | 100.0% | Loan payoff(6) | $68,398,713 | 68.4% | |||
| Upfront Reserves | 1,987,374 | 2.0 | ||||||
| Closing costs | 562,039 | 0.6 | ||||||
| Return of Equity | 29,051,874 | 29.1 | ||||||
| Total Sources | $100,000,000 | 100.0% | Total Uses | $100,000,000 | 100.0% | |||
| (1) | The Boulders Resort Mortgage Loan (as defined below) is part of The Boulders Resort Whole Loan (as defined below) with an original aggregate principal balance of $100,000,000. The Cut-off Date Balance per Room, Maturity Date Balance per Room, U/W Debt Yield based on NOI/NCF, U/W Debt Yield at Maturity based on NOI/NCF, U/W DSCR based on NOI/NCF, Cut-off Date LTV Ratio and LTV Ratio at Maturity numbers presented above are based on The Boulders Resort Whole Loan. |
| (2) | At any time after the earlier of (i) August 11, 2025 and (ii) two years from the closing date of the securitization that includes the last pari passu note of The Boulders Resort Whole Loan to be securitized, the borrower has the right to defease The Boulders Resort Whole Loan in whole or in part, in connection with the release of the El Pedregal Property (see “Partial Release” section). |
| (3) | See “Escrows” section. |
| (4) | The decrease in Occupancy and NOI from 2019 to 2020 and subsequent increase from 2020 to 2021 was primarily due to the effect of the novel coronavirus on the hospitality industry in 2020, and the recovery in 2021. The increase in NOI from 2020 to 2021 was also driven by an increase in ADR from $281 in 2020 to $337 in 2021, increased F&B and other revenue, and a decrease in departmental expense ratios. The further increase in NOI from 2021 to TTM NOI was primarily driven by an additional increase in ADR to $385, and increases to F&B, Villa, and other revenue. |
| (5) | While The Boulders Resort Whole Loan was originated after the emergence of the novel coronavirus pandemic and the economic disruption resulting from measures to combat the pandemic, the pandemic is an evolving situation and could impact The Boulders Resort Whole Loan more severely than |
| THE INFORMATION IN THIS STRUCTURAL AND COLLATERAL TERM SHEET IS NOT COMPLETE AND MAY BE AMENDED PRIOR TO THE TIME OF SALE. THIS TERM SHEET IS NOT AN OFFER TO SELL THESE SECURITIES AND IT IS NOT A SOLICITATION OF AN OFFER TO BUY THESE SECURITIES IN ANY JURISDICTION WHERE THE OFFER OR SALE IS NOT PERMITTED. | ||
| ||
| Hospitality – Full Service | Loan #4 | Cut-off Date Balance: | $74,930,466 | |
34631 North Tom Darlington Drive Scottsdale, AZ 85266
| The Boulders Resort | Cut-off Date LTV: U/W NCF DSCR: U/W NOI Debt Yield: | 42.9% 2.66x 20.3% |
assumed in the underwriting and could adversely affect the NOI, NCF and occupancy information, as well as the appraised value and the DSCR, LTV and Debt Yield metrics presented above. See “Risk Factors— Risks Related to Market Conditions and Other External Factors—Coronavirus Pandemic Has Adversely Affected the Global Economy and Will Likely Adversely Affect the Performance of the Mortgage Loans” in the Preliminary Prospectus.
| (6) | The loan proceeds were used to repay existing CMBS debt securitized in CSAIL 2017-CX9 and CSAIL 2017-CX10. |
The Mortgage Loan. The mortgage loan (the “The Boulders Resort Mortgage Loan”) is part of a whole loan (the “The Boulders Resort Whole Loan”) secured by first priority fee interests in a 160-room full-service hotel located in Scottsdale, Arizona (the “The Boulders Resort Property”). The Boulders Resort Whole Loan has an original aggregate principal balance of $100,000,000 and is comprised of two pari passu notes. The Boulders Resort Mortgage Loan, with an original principal balance of $75,000,000 is evidenced by the controlling Note A-1. The non-controlling Note A-2 is held by Column Financial, Inc. The Boulders Resort Whole Loan will be serviced under the pooling and servicing agreement for the BANK 2022-BNK43 securitization trust. See “Description of the Mortgage Pool—The Whole Loans—The Serviced Pari Passu Whole Loans” and “Pooling and Servicing Agreement—Servicing of the Serviced Mortgage Loans” in the Preliminary Prospectus.
| The Boulders Resort Whole Loan Summary | ||||
| Notes | Original Balance | Cut-off Date Balance | Note Holder | Controlling Note |
| A-1 | $75,000,000 | $74,930,466 | BANK 2022-BNK43 | Yes |
| A-2 | $25,000,000 | $24,976,822 | Column Financial, Inc. | No |
| Total | $100,000,000 | $99,907,288 | ||
The Borrower and Borrower Sponsors. The borrower is CP Boulders, LLC, a single-purpose, Delaware limited liability company with two independent directors. Legal counsel to the borrower delivered a non-consolidation opinion in connection with the origination of The Boulders Resort Whole Loan.
The borrower sponsors are William J. Yung III, Martha Yung, William J. Yung IV, Joseph A. Yung, Julie A. Haught, Judith A. Yung, Jennifer A. Yung, Michelle M. Christensen and Scott A. Yung. The non-recourse carveout guarantor is CSC Holdings, LLC, an affiliate of Columbia Sussex Corporation (“CSC”). Founded in 1972, CSC is a privately owned hospitality company headquartered in Crestview Hills, Kentucky. CSC currently owns 41 hotels across 18 states with major hospitality brands including Marriott, Hilton, and Hyatt.
The borrower owned property other than The Boulders Resort Property that it sold prior to origination of The Boulders Resort Whole Loan. See “Description of the Mortgage Pool – Mortgage Pool Characteristics – Property Types – Hospitality Properties” in the Preliminary Prospectus.
CSC has had numerous foreclosures and deeds in lieu since 2009. For additional information please see “Description of the Mortgage Pool - Loan Purpose; Default History, Bankruptcy Issues and Other Proceedings” in the Preliminary Prospectus.
The Property. The Boulders Resort Property is a 160-room, full-service hotel located in Scottsdale, AZ. Built in 1985, the property is currently operated as a Curio by Hilton. The Boulders Resort Property was repositioned from its former Waldorf Astoria affiliation in 2016 after undergoing a $15.4 million ($96,250/room) renovation. The Boulders Resort Property amenities include five food and beverage outlets, a tennis center, four outdoor pools, a full-service spa with 24 treatment rooms, 24,101 square feet of indoor meeting space and 28,348 of outdoor meeting space. The Boulders Resort Property also features two, 18-hole golf courses (one of which is closed for renovations and expected to re-open in October 2022) and The Boulders Club, which is a golf club that has 400 memberships and features its own swimming pool and restaurant. The golf facilities include one of the top golf schools in the country, The Boulders Academy, according to Golf Magazine and Travel and Leisure Magazine. The collateral also includes an 81,000 square foot multi-tenant retail component (the “El Pedregal Property”). The El Pedregal Property is an open-air center situated around an interior courtyard area that hosts outdoor concerts and events. It has been less than 50% leased for several years and currently includes the resort’s bakery, largest ballroom and an additional food and beverage outlet that is hotel-operated. Situated on an approximately 353-acre site, The Boulders Resort Property is spread out, with paved walking and cart paths and 854 surface parking spaces. The Boulders Resort Property operates under a Hilton franchise agreement which expires in 2035.
The Boulders Resort Property guestroom configuration consists of 127 king rooms and 33 double queen rooms. The guestrooms feature flat-screen televisions, high-speed internet, walk-in closets, fireplaces, desks, and a private patio or balcony.
The Boulders Resort Property also includes 57, one-, two-, and three- bedroom privately owned, non-collateral, villas and haciendas that participate in a rental management program, with a net revenue split to The Boulder Resort Property of 52.5%. The villas have daily housekeeping and the guests have access to all the resort amenities. The Boulders Resort Property pays for the operation of the villas including housekeeping, and property management, while the private owners pay for all property related expenses including taxes, insurance and utilities.
| THE INFORMATION IN THIS STRUCTURAL AND COLLATERAL TERM SHEET IS NOT COMPLETE AND MAY BE AMENDED PRIOR TO THE TIME OF SALE. THIS TERM SHEET IS NOT AN OFFER TO SELL THESE SECURITIES AND IT IS NOT A SOLICITATION OF AN OFFER TO BUY THESE SECURITIES IN ANY JURISDICTION WHERE THE OFFER OR SALE IS NOT PERMITTED. | ||
| ||
| Hospitality – Full Service | Loan #4 | Cut-off Date Balance: | $74,930,466 | |
34631 North Tom Darlington Drive Scottsdale, AZ 85266
| The Boulders Resort | Cut-off Date LTV: U/W NCF DSCR: U/W NOI Debt Yield: | 42.9% 2.66x 20.3% |
The following table presents historical occupancy, ADR, and RevPAR penetration rates of The Boulders Resort Property:
| Historical Occupancy, ADR, RevPAR(1)(2) | ||||||||||||
| Competitive Set | The Boulders Resort Property | Penetration Factor | ||||||||||
| Year | Occupancy | ADR | RevPAR | Occupancy | ADR | RevPAR | Occupancy | ADR | RevPAR | |||
| 4/30/2020 TTM | 61.1% | $287.29 | $175.42 | 59.9% | $252.71 | $151.45 | 98.2% | 88.0% | 86.3% | |||
| 4/30/2021 TTM | 30.5% | $352.98 | $107.53 | 54.3% | $283.72 | $154.06 | 178.2% | 80.4% | 143.3% | |||
| 4/30/2022 TTM | 58.7% | $404.99 | $237.90 | 69.9% | $371.79 | $259.89 | 119.0% | 91.8% | 109.2% | |||
| (1) | Source: Third-party research report. |
| (2) | According to a third party research report, the competitive set includes the Hyatt Regency Scottsdale Resort & Spa at Gainey, Fairmont Scottsdale Princess, The Phoenician, a Luxury Collection Resort, Scottsdale, Four Seasons Resort Scottsdale at Troon North, Westin Kierland Resort & Spa, and JW Marriott Phoenix Desert Ridge Resort & Spa. |
The following table presents historical occupancy percentages at The Boulders Resort Property:
Historical Occupancy(1)
12/31/2018 | 12/31/2019 | 12/31/2020 | 12/31/2021 | 4/30/2022 |
| 71.1% | 69.4% | 46.3% | 68.8% | 70.0% |
| (1) | Information obtained from the historical operating statements. |
| THE INFORMATION IN THIS STRUCTURAL AND COLLATERAL TERM SHEET IS NOT COMPLETE AND MAY BE AMENDED PRIOR TO THE TIME OF SALE. THIS TERM SHEET IS NOT AN OFFER TO SELL THESE SECURITIES AND IT IS NOT A SOLICITATION OF AN OFFER TO BUY THESE SECURITIES IN ANY JURISDICTION WHERE THE OFFER OR SALE IS NOT PERMITTED. | ||
| ||
| Hospitality – Full Service | Loan #4 | Cut-off Date Balance: | $74,930,466 | |
34631 North Tom Darlington Drive Scottsdale, AZ 85266
| The Boulders Resort | Cut-off Date LTV: U/W NCF DSCR: U/W NOI Debt Yield: | 42.9% 2.66x 20.3% |
Operating History and Underwritten Net Cash Flow. The following table presents certain information relating to the historical operating performance and underwritten net cash flow at The Boulders Resort Property:
Cash Flow Analysis
| 2019 | 2020 | 2021 | TTM 4/30/2022 | U/W | % of U/W Total Revenue(1) | U/W $ per Room | |
| Occupancy | 69.4% | 46.3% | 68.8% | 70.0% | 70.0% | ||
| ADR | $274.21 | $281.15 | $336.55 | $385.14 | $385.14 | ||
| RevPAR | $190.35 | $130.12 | $231.59 | $269.48 | $269.48 | ||
| Room Revenue | $11,116,714 | $7,619,559 | $13,524,783 | $15,737,427 | $15,737,427 | 30.9% | $98,359 |
| Food & Beverage Revenue | 12,720,349 | 6,993,092 | 10,597,997 | 13,150,500 | 13,150,500 | 25.8 | 82,191 |
| Villa Revenue(2) | 2,444,387 | 1,423,575 | 2,731,016 | 3,467,116 | 3,467,116 | 6.8 | 21,669 |
| Other Revenue(3) | 15,530,362 | 11,864,418 | 16,569,887 | 18,606,821 | 18,606,821 | 36.5 | 116,293 |
| Total Revenue | $41,811,812 | $27,900,644 | $43,423,683 | $50,961,864 | $50,961,864 | 100.0% | $318,512 |
| Room Expense | 4,846,247 | 2,789,802 | 3,602,342 | 3,830,154 | 3,830,154 | 24.3 | 23,938 |
| Food & Beverage Expense | 8,532,686 | 4,136,470 | 5,999,655 | 7,128,558 | 7,128,558 | 54.2 | 44,553 |
| Villa Expense(4) | 440,583 | 273,443 | 373,929 | 460,587 | 460,587 | 13.3 | 2,879 |
| Other Department Expense | 7,963,709 | 4,988,089 | 6,789,126 | 7,285,178 | 7,285,178 | 39.2 | 45,532 |
| Total Department Expenses | $21,783,225 | $12,187,804 | $16,765,052 | $18,704,477 | $18,704,477 | 36.7% | $116,903 |
| Gross Operating Income | $20,028,587 | $15,712,840 | $26,658,631 | $32,257,387 | $32,257,387 | 63.3% | $201,609 |
| Total Undistributed Expenses | 10,211,838 | 7,033,240 | 9,586,650 | 10,771,490 | 10,833,479 | 21.3 | 67,709 |
| Gross Operating Profit | $9,816,749 | $8,679,600 | $17,071,981 | $21,485,897 | $21,423,908 | 42.0% | $133,899 |
| Property Taxes | 710,545 | 723,208 | 720,782 | 720,783 | 720,783 | 1.4 | 4,505 |
| Insurance | 435,759 | 257,633 | 446,869 | 438,753 | 438,753 | 0.9 | 2,742 |
| Total Operating Expenses | $33,141,367 | $20,201,885 | $27,519,353 | $30,635,503 | $30,697,492 | 60.2% | $191,859 |
| Net Operating Income | $8,670,445 | $7,698,759(5) | $15,904,330(5) | $20,326,361(5) | $20,264,372 | 39.8% | $126,652 |
| FF&E | 0 | 0 | 0 | 0 | 2,038,475 | 4.0 | $12,740 |
| Net Cash Flow | $8,670,445 | $7,698,759 | $15,904,330 | $20,326,361 | $18,225,898 | 35.8% | $113,912 |
| NOI DSCR(6) | 1.26x | 1.12x | 2.32x | 2.96x | 2.95x | ||
| NCF DSCR(6) | 1.26x | 1.12x | 2.32x | 2.96x | 2.66x | ||
| NOI DY(6) | 8.7% | 7.7% | 15.9% | 20.3% | 20.3% | ||
| NCF DY(6) | 8.7% | 7.7% | 15.9% | 20.3% | 18.2% |
| (1) | % of U/W Total Revenue for Room Expense, F&B Expense, Villa Expense and Other Department Expenses are based on their corresponding revenue line items. All other line items represent percent of Total Revenue. |
| (2) | Villa revenue represents the net rental income from the 57 villas and haciendas that participate in the rental management program. |
| (3) | Other revenue consists primarily of golf, spa, and resort fees. |
| (4) | Represents maid, minor maintenance service, and property management fees for the villas. |
| (5) | The decrease in NOI from 2019 to 2020 and increase in NOI from 2020 to 2021 was primarily due to the effect of the novel coronavirus on the hospitality industry in 2020, and the subsequent recovery in 2021, as well as an increase in ADR from $281 in 2020 to $337 in 2021, increased F&B and other revenue, and a decrease in departmental expense ratios. The further increase in NOI from 2021 to TTM NOI was primarily driven by an additional increase in ADR to $385, and increases to F&B, Villa, and other revenue. |
| (6) | The NOI and NCF DSCRs and the NOI and NCF debt yields are based on The Boulders Resort Whole Loan. |
Appraisal. The appraised value of $232,800,000 is dated June 7, 2022 and represents the As-Is value of The Boulders Resort Property. The appraisal also provided a Prospective Market Value upon Stabilization of $254,800,000 as of June 7, 2024, representing a 39.2% Cut-Off Date LTV Ratio.
Environmental Matters. According to the Phase I environmental site assessment dated June 3, 2022, there was no evidence of any recognized environmental conditions at The Boulders Resort Property.
Market Overview and Competition. The Boulders Resort Property is located in north Scottsdale, Arizona, approximately 33.3 miles north of Phoenix. The immediate area is characterized as a mix of residential, recreational, and commercial uses surrounded by rugged desert terrain. The Boulders Resort Property is within 27 miles of numerous regional recreational venues including Camelback Mountain, the Talking Stick Entertainment District, and downtown Scottsdale. Scottsdale offers a variety of shopping, nightlife, art shows and restaurant options, as well as being the second largest employment center in Arizona. The Talking Stick Entertainment District is a 1.1 million square foot entertainment district that includes a casino, the 1.3 million square foot Pavilions shopping Center, a 36-hole golf course, and Salt River Fields, a major league baseball spring training facility.
| THE INFORMATION IN THIS STRUCTURAL AND COLLATERAL TERM SHEET IS NOT COMPLETE AND MAY BE AMENDED PRIOR TO THE TIME OF SALE. THIS TERM SHEET IS NOT AN OFFER TO SELL THESE SECURITIES AND IT IS NOT A SOLICITATION OF AN OFFER TO BUY THESE SECURITIES IN ANY JURISDICTION WHERE THE OFFER OR SALE IS NOT PERMITTED. | ||
| ||
| Hospitality – Full Service | Loan #4 | Cut-off Date Balance: | $74,930,466 | |
34631 North Tom Darlington Drive Scottsdale, AZ 85266
| The Boulders Resort | Cut-off Date LTV: U/W NCF DSCR: U/W NOI Debt Yield: | 42.9% 2.66x 20.3% |
The Boulders Resort Property has access throughout the region via State Route 101 and Interstate 17, located approximately 12.8 miles and 12.4 miles away, respectively. Additionally, The Boulders Resort Property is located approximately 32.6 miles from Phoenix Sky Harbor International Airport.
According to the appraisal, the 2021 population within a three- and five-mile radius of The Boulders Resort Property was 21,817 and 51,807, respectively. The 2021 average household income within the same three- and five-mile radii was $181,340 and $172,927, respectively.
The appraisal identified a proposed luxury resort that will be 25% competitive with The Boulders Resort Property. The Ritz-Carlton: The Palmeraie, is currently under construction with a projected opening date of January 2023 and will have 215 rooms. The property is located approximately 19 miles south of The Boulders Resort Property and only deemed partially competitive due to the location and the smaller complement of amenities available.
The table below presents certain information relating to comparable sales pertaining to The Boulders Resort Property identified by the appraisal:
| Comparable Sales Summary | |||||
Property Name | Location | Year Built | Rooms | Sale Date | Sale Price / Room |
| Sanctuary on Camelback Mountain | 5700 East McDonald Drive Paradise Valley, AZ | 1970 | 109 | 1/2021 | $1,201,835 |
| Four Seasons Napa | 400 Silverado Trail North Calistoga, CA | 2021 | 85 | 12/2021 | $2,088,235 |
| Montage Healdsburg | 100 Montage Way Healdsburg, CA | 2020 | 130 | 4/2021 | $2,038,462 |
| Former Montage Beverly Hills | 225 North Canon Drive Beverly Hills, CA | 2008 | 204 | 12/2019 | $2,524,510 |
| JW Marriott Desert Ridge | 5350 East Marriott Drive Phoenix, AZ | 2002 | 950 | 9/2019 | $633,684 |
Source: Appraisal
Escrows.
Real Estate Taxes – The loan documents require an upfront deposit of $187,374 and ongoing monthly deposits of $62,459 for real estate taxes.
Insurance – The loan documents require ongoing monthly insurance reserve in an amount equal to 1/12 of the insurance premiums that the lender reasonably estimates will be payable during the next ensuing 12 months. Notwithstanding the above, the borrower’s obligation to make insurance reserve payments will be waived so long as (i) no event of default is continuing, (ii) the insurance policies maintained by borrower are part of a blanket or umbrella policy approved by the lender in its reasonable discretion, and (iii) the lender is provided with paid receipts for the payment of the insurance premiums no later than 30 days after to the expiration dates of said policies.
FF&E Reserve - The loan documents require ongoing monthly deposits in an amount equal to 1/12th of the greater of (i) 4% of the operating income for the preceding fiscal year or (ii) the amount required to be reserved under the franchise agreement for FF&E, initially estimated at $169,873.
Seasonality Reserve – The loan documents require an upfront deposit of $1,800,000 (the “Seasonality Reserve Required Annual Balance”). These funds may be used for disbursements to or for the payment of any part of the monthly debt service payments occurring in July, August, September and October, to the extent that there is insufficient cash flow from The Boulders Resort Property to make the monthly debt service payment.
On each monthly payment date occurring in February, March, April, May, November, and December, the borrower is required to deposit $300,000 into the Seasonality Reserve, provided however, that the borrower is only required to make these deposits if the funds on deposit in the Seasonality Reserve are less than the Seasonality Reserve Required Annual Balance.
PIP Reserve - The loan documents require that if, at any time, PIP work is required under the franchise agreement, the borrower is required to deposit, within 15 days after receipt of notice from the franchisor, an amount equal to 110% of the estimated cost to complete the PIP work.
Lockbox and Cash Management. The Boulders Resort Whole Loan is structured with a hard lockbox and in-place cash management. The borrower and manager are required to cause all rents and credit card receipts to be deposited directly into the lockbox account, and to deposit any rents otherwise received into such account within one business day after receipt. Funds in the lockbox account are required to be swept periodically into a cash management account and, provided no event of default under the loan documents has occurred, prior to a Cash Trap Event Period, any funds remaining in the cash management account after the payment priorities set forth in The Boulders Resort Whole Loan documents will be transferred to the borrower. During a Cash Trap Event Period, any excess
| THE INFORMATION IN THIS STRUCTURAL AND COLLATERAL TERM SHEET IS NOT COMPLETE AND MAY BE AMENDED PRIOR TO THE TIME OF SALE. THIS TERM SHEET IS NOT AN OFFER TO SELL THESE SECURITIES AND IT IS NOT A SOLICITATION OF AN OFFER TO BUY THESE SECURITIES IN ANY JURISDICTION WHERE THE OFFER OR SALE IS NOT PERMITTED. | ||
| ||
| Hospitality – Full Service | Loan #4 | Cut-off Date Balance: | $74,930,466 | |
34631 North Tom Darlington Drive Scottsdale, AZ 85266
| The Boulders Resort | Cut-off Date LTV: U/W NCF DSCR: U/W NOI Debt Yield: | 42.9% 2.66x 20.3% |
cash flow remaining after satisfaction of the payment priorities outlined in The Boulders Resort Whole Loan documents is required to be swept to an excess cash flow subaccount to be held as additional collateral for The Boulders Resort Whole Loan.
A “Cash Trap Event Period” will commence upon the earlier of the following:
| (i) | an event of default; or |
| (ii) | the amortizing net cash flow debt service coverage ratio falling below 1.40x, tested quarterly. |
A Cash Trap Event Period will end upon the occurrence of the following:
| ● | with regard to clause (i), the cure of such event of default; or |
| ● | with regard to clause (ii), upon the amortizing net cash flow debt service coverage ratio is equal to or greater than 1.45x for three consecutive calendar months. |
Property Management. The Boulders Resort Property is managed by Crestview Management, LLC, an affiliate of the borrower.
Partial Release. From and after the prepayment lockout date, in connection with the sale to an unaffiliated third party, the borrower may obtain the release of the El Pedregal Retail Property, provided the following conditions, among others, are satisfied: (i) no event of default is continuing; (ii) defeasance of the greatest of (a) 95% of the net proceeds of the sale, (b) $12,125,000, (c) an amount that would result in the debt yield following the release being no less than the greater of 14.0% and the debt yield immediately prior to the release, (d) an amount that would result in the loan to value ratio being not more than the lesser of 60.0% or the loan to value ratio prior to release, and (e) such greater amount as may be required to maintain REMIC requirements.
Real Estate Substitution. Not permitted.
Subordinate and Mezzanine Indebtedness. None.
Ground Lease. None.
Terrorism Insurance. The loan documents require that the “all risk” insurance policy required to be maintained by the borrower provides coverage for terrorism in an amount equal to the full replacement cost of The Boulders Resort Property, as well as business interruption insurance covering no less than the 18-month period following the occurrence of a casualty event, together with a 6-month extended period of indemnity.
| THE INFORMATION IN THIS STRUCTURAL AND COLLATERAL TERM SHEET IS NOT COMPLETE AND MAY BE AMENDED PRIOR TO THE TIME OF SALE. THIS TERM SHEET IS NOT AN OFFER TO SELL THESE SECURITIES AND IT IS NOT A SOLICITATION OF AN OFFER TO BUY THESE SECURITIES IN ANY JURISDICTION WHERE THE OFFER OR SALE IS NOT PERMITTED. | ||
| ||
| Retail – Single Tenant | Loan #5 | Cut-off Date Balance: | $59,463,750 | |
| Property Addresses – Various | ExchangeRight Net Leased Portfolio #56 | Cut-off Date LTV: | 50.5% | |
| U/W NCF DSCR: | 1.79x | |||
| U/W NOI Debt Yield: | 10.4% |
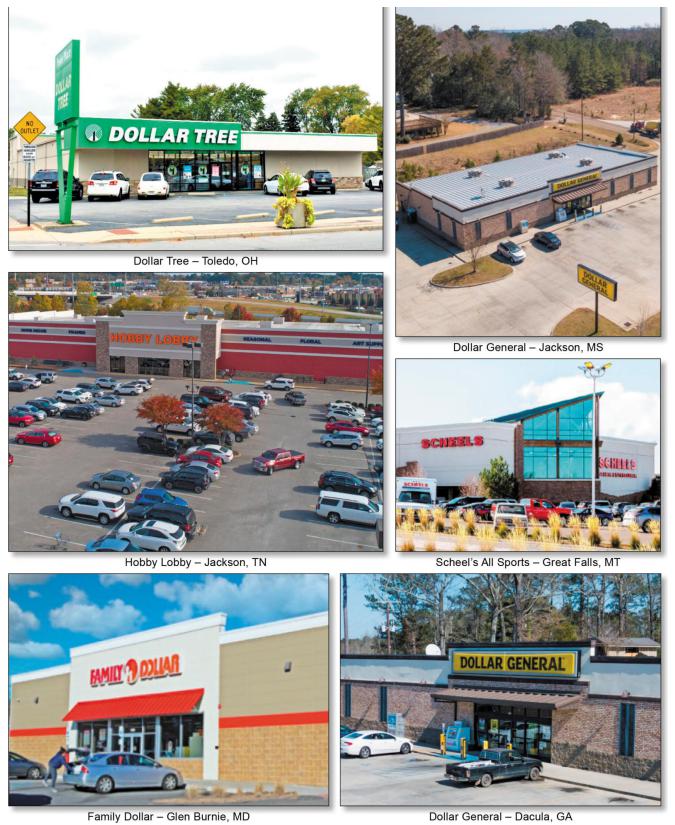
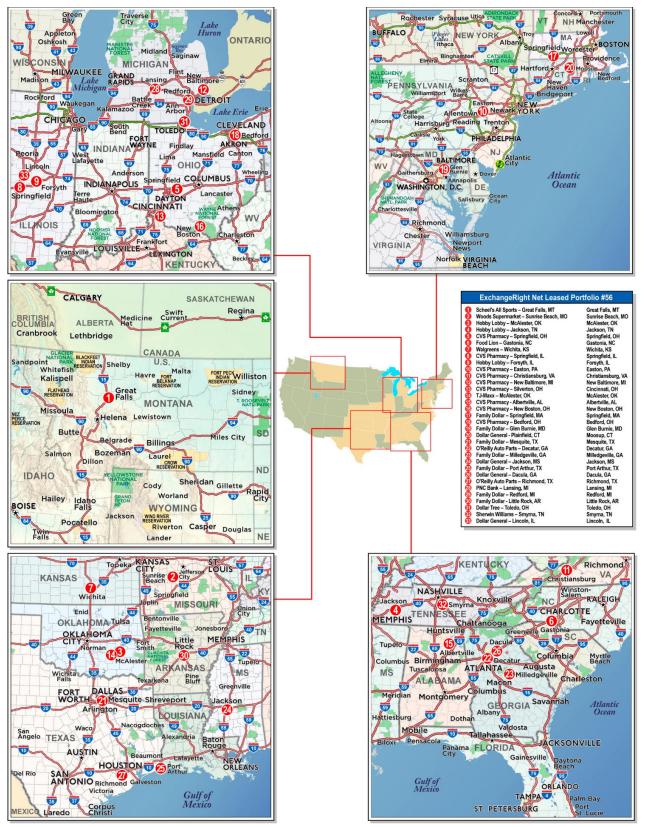
| THE INFORMATION IN THIS STRUCTURAL AND COLLATERAL TERM SHEET IS NOT COMPLETE AND MAY BE AMENDED PRIOR TO THE TIME OF SALE. THIS TERM SHEET IS NOT AN OFFER TO SELL THESE SECURITIES AND IT IS NOT A SOLICITATION OF AN OFFER TO BUY THESE SECURITIES IN ANY JURISDICTION WHERE THE OFFER OR SALE IS NOT PERMITTED. | ||
| ||
| No. 5 – ExchangeRight Net Leased Portfolio #56 |
| Mortgage Loan Information | Mortgaged Property Information | |||||
| Mortgage Loan Seller: | Morgan Stanley Mortgage Capital Holdings LLC | Single Asset/Portfolio: | Portfolio | |||
| Credit Assessment (Fitch/KBRA/Moody’s): | NR/NR/NR | Property Type – Subtype: | Retail – Single Tenant | |||
| Original Principal Balance: | $59,463,750 | Location(2): | Various | |||
| Cut-off Date Balance: | $59,463,750 | Size(2): | 637,669 SF | |||
| % of Initial Pool Balance: | 5.5% | Cut-off Date Balance Per SF: | $93.25 | |||
| Loan Purpose: | Acquisition | Maturity Date Balance Per SF: | $93.25 | |||
| Borrower Sponsor: | ExchangeRight Real Estate, LLC, | Year Built/Renovated(2): | Various / Various | |||
| David Fisher, Joshua Ungerecht and Warren Thomas | Title Vesting: | Fee | ||||
| Guarantors: | ExchangeRight Real Estate, LLC, | Property Manager: | NLP Management, LLC | |||
| David Fisher, Joshua Ungerecht and | (borrower related) | |||||
| Warren Thomas | Current Occupancy (As of): | 100.0% (8/1/2022) | ||||
| Mortgage Rate: | 5.3680% | |||||
| Note Date: | June 21, 2022 | YE 2021 Occupancy(3): | NAV | |||
| Seasoning: | 1 month | YE 2020 Occupancy(3): | NAV | |||
| Maturity Date: | July 1, 2032 | YE 2019 Occupancy(3): | NAV | |||
| IO Period: | 120 months | YE 2018 Occupancy(3): | NAV | |||
| Loan Term (Original): | 120 months | As-Is Appraised Value(4): | $117,750,000 | |||
| Amortization Term (Original): | NAP | As-Is Appraised Value Per SF: | $184.66 | |||
| Loan Amortization Type: | Interest Only | As-Is Appraisal Valuation Date(4): | Various | |||
| Call Protection: | L(25),D(90),O(5) | |||||
| Lockbox Type: | Hard/Springing Cash Management | Underwriting and Financial Information(5) | ||||
| Additional Debt: | None | YE 2021 NOI(3): | NAV | |||
| Additional Debt Type (Balance): | NAP | YE 2020 NOI(3): | NAV | |||
| YE 2019 NOI(3): | NAV | |||||
| YE 2018 NOI(3): | NAV | |||||
| U/W Revenues: | $6,381,569 | |||||
| U/W Expenses: | $191,447 | |||||
| Escrows and Reserves(1) | U/W NOI: | $6,190,122 | ||||
| Initial | Monthly | Cap | U/W NCF: | $5,799,609 | ||
| Taxes | $229,379 | $34,615 | NAP | U/W DSCR based on NOI/NCF: | 1.91x / 1.79x | |
| Insurance | $806 | $269 | NAP | U/W Debt Yield based on NOI/NCF: | 10.4% / 9.8% | |
| Replacement Reserve | $1,209,561 | $0 | NAP | U/W Debt Yield at Maturity based on NOI/NCF: | 10.4% / 9.8% | |
| TI/LC Reserve | $500,000 | Springing | NAP | Cut-off Date LTV Ratio: | 50.5% | |
| Free Rent | $16,656 | $0 | NAP | LTV Ratio at Maturity: | 50.5% | |
| Deferred Maintenance | $280,629 | $0 | NAP | |||
| Sources and Uses | ||||||||
| Sources | Uses | |||||||
| Mortgage Loan Amount | $59,463,750 | 49.4 | % | Purchase price | $116,615,539 | 96.9 | % | |
| Borrower Equity | 60,923,048 | 50.6 | Reserves | 2,237,031 | 1.9 | |||
| Closing Costs | 1,534,229 | 1.3 | ||||||
| Total Sources | $120,386,798 | 100.0 | % | Total Uses | $120,386,798 | 100.0 | % | |
| (1) | See “Escrows” section below for further discussion of reserve requirements. |
| (2) | See “The Properties” section below. |
| (3) | Historical occupancy and NOI are unavailable because the ExchangeRight Properties (as defined below) were acquired by the borrower between January 17, 2021 and April 25, 2022. |
| (4) | The individual appraisals are dated between March 1, 2022 and May 19, 2022. |
| (5) | The novel coronavirus pandemic is an evolving situation and could impact the ExchangeRight Net Leased Portfolio #56 Mortgage Loan (as defined below) more severely than assumed in the underwriting of the ExchangeRight Net Leased Portfolio #56 Mortgage Loan and could adversely affect the NOI, NCF and occupancy information, as well as the appraised value and the DSCR, LTV and Debt Yield metrics presented above. See "Risk Factors-—Risks Related to Market Conditions and Other External Factors—The Coronavirus Pandemic Has Adversely Affected the Global Economy and Will Likely Adversely Affect the Performance of the Mortgage Loans" in the Preliminary Prospectus |
The Mortgage Loan. The mortgage loan (the “ExchangeRight Net Leased Portfolio #56 Mortgage Loan”) is evidenced by a single promissory note in the original principal amount of $59,463,750 and secured by the fee interests in 33 net leased, retail properties located in nineteen states (the “ExchangeRight Properties”).
The Borrower and the Borrower Sponsors. The borrower for the ExchangeRight Net Leased Portfolio #56 Mortgage Loan is ExchangeRight Net-Leased Portfolio 56 DST (the “ExchangeRight Net Leased Portfolio #56 Borrower”), a Delaware statutory trust with at least one independent trustee. Legal counsel to the ExchangeRight Net Leased Portfolio #56 Borrower delivered a non-consolidation
| THE INFORMATION IN THIS STRUCTURAL AND COLLATERAL TERM SHEET IS NOT COMPLETE AND MAY BE AMENDED PRIOR TO THE TIME OF SALE. THIS TERM SHEET IS NOT AN OFFER TO SELL THESE SECURITIES AND IT IS NOT A SOLICITATION OF AN OFFER TO BUY THESE SECURITIES IN ANY JURISDICTION WHERE THE OFFER OR SALE IS NOT PERMITTED. | ||
| ||
| Retail – Single Tenant | Loan #5 | Cut-off Date Balance: | $59,463,750 | |
| Property Addresses – Various | ExchangeRight Net Leased Portfolio #56 | Cut-off Date LTV: | 50.5% | |
| U/W NCF DSCR: | 1.79x | |||
| U/W NOI Debt Yield: | 10.4% |
opinion in connection with the origination of the ExchangeRight Net Leased Portfolio #56 Mortgage Loan. The borrower sponsors are ExchangeRight Real Estate, LLC, David Fisher, Joshua Ungerecht and Warren Thomas. ExchangeRight Real Estate, LLC has more than 17 million square feet of commercial properties under management and owns more than 950 investment-grade retail and multifamily properties located in 40 states. ExchangeRight Real Estate, LLC and its three owners, David Fisher, Joshua Ungerecht and Warren Thomas (collectively, the “Individual Guarantors”), are the guarantors of certain non-recourse carveout liabilities under the ExchangeRight Net Leased Portfolio #56 Mortgage Loan. Warren Thomas was subject to a prior foreclosure sale. See “Description of the Mortgage Pool–Loan Purpose; Default History, Bankruptcy Issues and Other Proceedings” in the Preliminary Prospectus.
The ExchangeRight Net Leased Portfolio #56 Borrower has master leased the ExchangeRight Properties to a master tenant (the “ExchangeRight Net Leased Portfolio #56 Master Tenant”) owned by ExchangeRight Real Estate, LLC, which is in turn owned by the Individual Guarantors. The ExchangeRight Net Leased Portfolio #56 Master Tenant is a Delaware limited liability company structured to be bankruptcy-remote, with one independent director. The master lease generally imposes responsibility on the ExchangeRight Net Leased Portfolio #56 Master Tenant for the operation, maintenance and management of the ExchangeRight Properties and payment of all expenses incurred in the maintenance and repair of the ExchangeRight Properties, other than capital expenses. The ExchangeRight Net Leased Portfolio #56 Master Tenant’s interest in all tenant rents was assigned to the ExchangeRight Net Leased Portfolio #56 Borrower, which in turn collaterally assigned its interest to the lender. The master lease is subordinate to the ExchangeRight Net Leased Portfolio #56 Mortgage Loan and, upon an event of default under the ExchangeRight Net Leased Portfolio #56 Mortgage Loan, the lender has the right to cause the ExchangeRight Net Leased Portfolio #56 Borrower to terminate the master lease. A default under the master lease is an event of default under the ExchangeRight Net Leased Portfolio #56 Mortgage Loan and gives rise to recourse liability to the non-recourse carveout guarantors for losses, unless such default arises solely in connection with the failure of the ExchangeRight Net Leased Portfolio #56 Master Tenant to pay rent as a result of the ExchangeRight Properties not generating sufficient cash flow for the payment of such rent.
The lender has the right to require the ExchangeRight Net Leased Portfolio #56 Borrower to convert from a Delaware statutory trust to a limited liability company upon (i) an event of default or the lender’s good faith determination of imminent default under the ExchangeRight Net Leased Portfolio #56 Mortgage Loan, (ii) the lender’s good faith determination that the ExchangeRight Net Leased Portfolio #56 Borrower will be unable to make a material decision or take a material action required in connection with the operation and maintenance of the ExchangeRight Properties, and (iii) 90 days prior to the maturity date of the ExchangeRight Net Leased Portfolio #56 Mortgage Loan, if an executed commitment from an institutional lender to refinance the ExchangeRight Net Leased Portfolio #56 Mortgage Loan is not delivered to the lender.
The Properties. The ExchangeRight Properties are comprised of 33 single-tenant retail properties totaling 637,669 square feet and located across nineteen states. The ExchangeRight Properties are located in the following states: Montana (one property, 15.6% of NRA and 10.8% of underwritten rent), Illinois (three properties, 12.4% of NRA and 8.9% of underwritten rent), Oklahoma (two properties, 11.9% of NRA and 9.2% of underwritten rent), Tennessee (two properties, 9.6% of NRA and 7.0% of underwritten rent), Missouri (one property, 8.9% of NRA and 7.0% of underwritten rent) and Ohio (five properties, 7.4% of NRA and 13.2% of underwritten rent), with the nineteen remaining ExchangeRight Properties located in North Carolina, Georgia, Texas, Michigan, Pennsylvania, Kansas, Arkansas, Virginia, Maryland, Alabama, Massachusetts, Connecticut and Mississippi. Built between 1958 and 2021, the ExchangeRight Properties range in size from 2,784 SF to 99,279 square feet.
The ExchangeRight Properties are leased to the following thirteen nationally recognized tenants operating in diverse retail segments: Family Dollar, Walgreens, Dollar General, Dollar Tree, O'Reilly Auto Parts, CVS Pharmacy, Food Lion, Hobby Lobby, PNC Bank N.A., Scheels All Sports, TJ Maxx, Woods Supermarket and Sherwin Williams. Leases representing 45.0% of NRA and 46.6% of the underwritten base rent expire after the maturity date of the ExchangeRight Net Leased Portfolio #56 Mortgage Loan. For the purposes of the preceding sentence, the Walgreens lease at the Walgreens - Wichita, KS property, which grants early termination rights to Walgreens, was assumed to expire on the date when the earliest termination right under the lease, if exercised, would be effective.
| THE INFORMATION IN THIS STRUCTURAL AND COLLATERAL TERM SHEET IS NOT COMPLETE AND MAY BE AMENDED PRIOR TO THE TIME OF SALE. THIS TERM SHEET IS NOT AN OFFER TO SELL THESE SECURITIES AND IT IS NOT A SOLICITATION OF AN OFFER TO BUY THESE SECURITIES IN ANY JURISDICTION WHERE THE OFFER OR SALE IS NOT PERMITTED. | ||
| ||
| Retail – Single Tenant | Loan #5 | Cut-off Date Balance: | $59,463,750 | |
| Property Addresses – Various | ExchangeRight Net Leased Portfolio #56 | Cut-off Date LTV: | 50.5% | |
| U/W NCF DSCR: | 1.79x | |||
| U/W NOI Debt Yield: | 10.4% |
The following table presents certain information relating to the ExchangeRight Properties, which are presented in descending order of their Appraised Values.
ExchangeRight Properties Summary
Tenant Name City, State | Year Built
| Tenant NRSF | %of Portfolio NRSF | Lease Expiration Date | Appraised Value | % of Portfolio Appraised Value | Annual UW Base Rent | Annual UW Base Rent PSF | % of Annual UW Base Rent | Renewal Options |
Scheels All Sports Great Falls, MT | 1963 | 99,279 | 15.6% | 1/31/2037 | $12,600,000 | 10.7% | $724,819 | $7.30 | 10.8% | 4, 5 year |
Woods Supermarket Sunrise Beach, MO | 2013 | 56,509 | 8.9% | 6/30/2033 | $8,700,000 | 7.4% | $467,250 | $8.27 | 7.0% | 4, 5 year |
Hobby Lobby McAlester, OK | 2021 | 55,000 | 8.6% | 4/30/2037 | $7,500,000 | 6.4% | $412,500 | $7.50 | 6.2% | 4, 5 year |
Hobby Lobby Jackson, TN | 2005 | 56,447 | 8.9% | 1/31/2031 | $6,700,000 | 5.7% | $411,570 | $7.29 | 6.2% | 2, 5 year |
CVS Pharmacy Springfield, OH | 1999 | 9,908 | 1.6% | 3/31/2037 | $5,550,000 | 4.7% | $299,717 | $30.25 | 4.5% | 6, 5 year |
Food Lion Gastonia, NC | 2005 | 33,764 | 5.3% | 11/15/2025 | $5,250,000 | 4.5% | $340,000 | $10.07 | 5.1% | 4, 5 year |
Walgreens Wichita, KS | 2001 | 16,325 | 2.6% | 12/31/2028(1) | $5,070,000 | 4.3% | $292,000 | $17.89 | 4.4% | None |
CVS Pharmacy Springfield, IL | 2000 | 10,125 | 1.6% | 3/31/2037 | $4,760,000 | 4.0% | $250,000 | $24.69 | 3.7% | 6, 5 year |
Hobby Lobby Forsyth, IL | 1977 | 60,000 | 9.4% | 1/31/2032 | $4,670,000 | 4.0% | $290,468 | $4.84 | 4.3% | 2, 5 year |
CVS Pharmacy Easton, PA | 1958 | 17,380 | 2.7% | 3/31/2037 | $4,140,000 | 3.5% | $217,250 | $12.50 | 3.2% | 6, 5 year |
CVS Pharmacy Christiansburg, VA | 2000 | 11,455 | 1.8% | 3/31/2037 | $3,900,000 | 3.3% | $205,000 | $17.90 | 3.1% | 6, 5 year |
CVS Pharmacy New Baltimore, MI | 2000 | 10,870 | 1.7% | 3/31/2032 | $3,800,000 | 3.2% | $205,000 | $18.86 | 3.1% | 6, 5 year |
CVS Pharmacy Cincinnati, OH | 2000 | 9,562 | 1.5% | 3/31/2037 | $3,600,000 | 3.1% | $194,000 | $20.29 | 2.9% | 6, 5 year |
TJ Maxx McAlester, OK | 2021 | 21,000 | 3.3% | 3/1/2032 | $3,600,000 | 3.1% | $204,931 | $9.76 | 3.1% | 4, 5 year |
CVS Pharmacy Albertville, AL | 2000 | 10,336 | 1.6% | 3/31/2032 | $3,500,000 | 3.0% | $185,000 | $17.90 | 2.8% | 6, 5 year |
CVS Pharmacy New Boston, OH | 2000 | 8,200 | 1.3% | 3/31/2037 | $3,200,000 | 2.7% | $173,000 | $21.10 | 2.6% | 6, 5 year |
Family Dollar Springfield, MA | 2018 | 9,840 | 1.5% | 9/30/2033 | $3,050,000 | 2.6% | $174,607 | $17.74 | 2.6% | 6, 5 year |
PNC Bank, N.A. Lansing, MI | 1973 | 2,784 | 0.4% | 9/30/2027 | $2,550,000 | 2.2% | $122,496 | $44.00 | 1.8% | 2, 5 year |
CVS Pharmacy Bedford, OH | 1998 | 10,125 | 1.6% | 1/31/2029 | $2,400,000 | 2.0% | $131,984 | $13.04 | 2.0% | 5, 5 year |
Family Dollar Glen Burnie, MD | 1967 | 11,280 | 1.8% | 1/31/2031 | $2,400,000 | 2.0% | $145,512 | $12.90 | 2.2% | 2, 5 year |
Dollar General Moosup, CT | 2014 | 9,066 | 1.4% | 4/30/2029 | $2,180,000 | 1.9% | $131,350 | $14.49 | 2.0% | 5, 5 year |
Family Dollar Mesquite, TX | 2011 | 8,400 | 1.3% | 6/30/2027 | $2,030,000 | 1.7% | $121,600 | $14.48 | 1.8% | 5, 5 year |
O'Reilly Auto Parts Decatur, GA | 2009 | 6,955 | 1.1% | 1/31/2029 | $2,000,000 | 1.7% | $116,592 | $16.76 | 1.7% | 3, 5 year |
Family Dollar Milledgeville, GA | 1994 | 11,208 | 1.8% | 6/30/2028 | $1,930,000 | 1.6% | $119,500 | $10.66 | 1.8% | 4, 5 year |
Dollar General Jackson, MS | 2017 | 8,784 | 1.4% | 4/30/2032 | $1,850,000 | 1.6% | $101,988 | $11.61 | 1.5% | 5, 5 year |
Family Dollar Port Arthur, TX | 1993 | 8,640 | 1.4% | 1/31/2029 | $1,590,000 | 1.4% | $95,606 | $11.07 | 1.4% | 7, 5 year |
Dollar General Dacula, GA | 2013 | 9,352 | 1.5% | 11/30/2028 | $1,580,000 | 1.3% | $95,100 | $10.17 | 1.4% | 5, 5 year |
O’Reilly Auto Parts Richmond, TX | 2012 | 7,000 | 1.1% | 6/22/2032 | $1,560,000 | 1.3% | $84,270 | $12.04 | 1.3% | 4, 5 year |
Family Dollar Redford, MI | 2009 | 8,439 | 1.3% | 6/30/2027 | $1,500,000 | 1.3% | $102,850 | $12.19 | 1.5% | 2, 5 year |
Family Dollar/Dollar Tree Little Rock, AR | 2002 | 16,000 | 2.5% | 4/30/2032 | $1,350,000 | 1.1% | $80,000 | $5.00 | 1.2% | 6, 5 year |
Dollar Tree Toledo, OH | 1967 | 9,622 | 1.5% | 9/30/2029 | $1,230,000 | 1.0% | $81,787 | $8.50 | 1.2% | 4, 4 year |
Sherwin Williams Smyrna, TN | 1999 | 5,000 | 0.8% | 12/31/2031 | $1,100,000 | 0.9% | $59,904 | $11.98 | 0.9% | 3, 5 year |
Dollar General Lincoln, IL | 2005 | 9,014 | 1.4% | 6/30/2030 | $910,000 | 0.8% | $51,600 | $5.72 | 0.8% | 5, 5 year |
| Total/Weighted Average | 637,669 | 100.0% | $117,750,000 | 100.0% | $6,689,253 | $10.49 | 100.0% |
| (1) | For the purposes of the table and loan underwriting, the Walgreens lease at the Walgreens — Wichita, KS property, which grants early termination rights to Walgreens, was assumed to expire on the date as of when the earliest termination right under such lease, if exercised, would be effective. |
| THE INFORMATION IN THIS STRUCTURAL AND COLLATERAL TERM SHEET IS NOT COMPLETE AND MAY BE AMENDED PRIOR TO THE TIME OF SALE. THIS TERM SHEET IS NOT AN OFFER TO SELL THESE SECURITIES AND IT IS NOT A SOLICITATION OF AN OFFER TO BUY THESE SECURITIES IN ANY JURISDICTION WHERE THE OFFER OR SALE IS NOT PERMITTED. | ||
| ||
| Retail – Single Tenant | Loan #5 | Cut-off Date Balance: | $59,463,750 | |
| Property Addresses – Various | ExchangeRight Net Leased Portfolio #56 | Cut-off Date LTV: | 50.5% | |
| U/W NCF DSCR: | 1.79x | |||
| U/W NOI Debt Yield: | 10.4% |
Major Tenants. The following table presents certain information relating to the major tenants at the ExchangeRight Properties:
Major Tenants(1)
| Tenant Name | Credit Rating (S&P/ Moody’s/Fitch)(2) | Tenant NRSF | % of NRSF | Annual U/W Base Rent PSF | Annual U/W Base Rent | % of Total Annual U/W Base Rent | |||
| Major Tenants | |||||||||
| Hobby Lobby | NR / NR/ NR | 171,447 | 26.9 | % | $1,114,538 | $6.50 | 16.7% | ||
| Scheels All Sports | NR / NR/ NR | 99,279 | 15.6 | % | $724,819 | $7.30 | 10.8% | ||
| CVS Pharmacy | BBB / Baa2/ NR | 97,961 | 15.4 | % | $1,860,952 | $19.00 | 27.8% | ||
| Family Dollar | NR / Baa2/ NR | 57,807 | 9.1 | % | $759,675 | $13.14 | 11.4% | ||
| Woods Supermarket | NR / NR/ NR | 56,509 | 8.9 | % | $467,250 | $8.27 | 7.0% | ||
| Dollar General | BBB / Baa2/ NR | 36,216 | 5.7 | % | $380,038 | $10.49 | 5.7% | ||
| Food Lion | BBB / Baa1/ NR | 33,764 | 5.3 | % | $340,000 | $10.07 | 5.1% | ||
| TJ Maxx | A / A2/ NR | 21,000 | 3.3 | % | $204,931 | $9.76 | 3.1% | ||
| Walgreens | BBB / Baa2/ NR | 16,325 | 2.6 | % | $292,000 | $17.89 | 4.4% | ||
| Family Dollar/ Dollar Tree | BBB / Baa2/ NR | 16,000 | 2.5 | % | $80,000 | $5.00 | 1.2% | ||
| O'Reilly Auto Parts | NR / Baa1/ NR | 13,955 | 2.2 | % | $200,862 | $14.39 | 3.0% | ||
| Dollar Tree | BBB / Baa2/ NR | 9,622 | 1.5 | % | $81,787 | $8.50 | 1.2% | ||
| Sherwin Williams | BBB / Baa2/ BBB | 5,000 | 0.8 | % | $59,904 | $11.98 | 0.9% | ||
| PNC Bank, N.A. | A- / A3 / A+ | 2,784 | 0.4 | % | $122,496 | $44.00 | 1.8% | ||
| Total Major Tenants | 637,669 | 100.0 | % | $6,689,253 | $10.49 | 100.0% | |||
| Non-Major Tenants | 0 | 0.0 | % | ||||||
| Occupied Collateral Total | 637,669 | 100.0 | % | $6,689,253 | $10.49 | 100.0% | |||
| Vacant Space | 0 | 0.0 | % | ||||||
| Collateral Total | 637,669 | 100.0 | % | ||||||
| (1) | Information is based on the underwritten rent roll. |
| (2) | Certain ratings are those of the parent company whether or not the parent company guarantees the lease. |
The following table presents certain information relating to the lease rollover schedule at the ExchangeRight Properties:
Lease Expiration Schedule(1) (2)
| Year Ending December 31, | No. of Leases Expiring | Expiring NRSF | % of Total NRSF | Cumulative Expiring NRSF | Cumulative % of Total NRSF | Annual U/W Base Rent | % of Total Annual U/W Base Rent | Annual U/W Base Rent PSF |
| MTM | 0 | 0 | 0.0% | 0 | 0.0% | $0 | 0.0% | $0.00 |
| 2022 | 0 | 0 | 0.0% | 0 | 0.0% | $0 | 0.0% | $0.00 |
| 2023 | 0 | 0 | 0.0% | 0 | 0.0% | $0 | 0.0% | $0.00 |
| 2024 | 0 | 0 | 0.0% | 0 | 0.0% | $0 | 0.0% | $0.00 |
| 2025 | 1 | 33,764 | 5.3% | 33,764 | 5.3% | $340,000 | 5.1% | $10.07 |
| 2026 | 0 | 0 | 0.0% | 33,764 | 5.3% | $0 | 0.0% | $0.00 |
| 2027 | 3 | 19,623 | 3.1% | 53,387 | 8.4% | $346,946 | 5.2% | $17.68 |
| 2028 | 3 | 36,885 | 5.8% | 90,272 | 14.2% | $506,600 | 7.6% | $13.73 |
| 2029 | 5 | 44,408 | 7.0% | 134,680 | 21.1% | $557,320 | 8.3% | $12.55 |
| 2030 | 1 | 9,014 | 1.4% | 143,694 | 22.5% | $51,600 | 0.8% | $5.72 |
| 2031 | 3 | 72,727 | 11.4% | 216,421 | 33.9% | $616,986 | 9.2% | $8.48 |
| 2032 | 7 | 133,990 | 21.0% | 350,411 | 55.0% | $1,151,657 | 17.2% | $8.60 |
| Thereafter | 10 | 287,258 | 45.0% | 637,669 | 100.0% | $3,118,144 | 46.6% | $10.85 |
| Vacant | 0 | 0 | 0.0% | 637,669 | 100.0% | $0 | 0.0% | $0.00 |
| Total/Wtd. Avg. | 33 | 637,669 | 100.0% | $6,689,253 | 100.0% | $10.49 |
| (1) | Information is based on the underwritten rent roll. |
| (2) | For the purposes of the table and loan underwriting, the Walgreens lease at the Walgreens - Wichita, KS property, which grants early termination rights to Walgreens, was assumed to expire on the date as of when the earliest termination right under such lease, if exercised, would be effective. |
| THE INFORMATION IN THIS STRUCTURAL AND COLLATERAL TERM SHEET IS NOT COMPLETE AND MAY BE AMENDED PRIOR TO THE TIME OF SALE. THIS TERM SHEET IS NOT AN OFFER TO SELL THESE SECURITIES AND IT IS NOT A SOLICITATION OF AN OFFER TO BUY THESE SECURITIES IN ANY JURISDICTION WHERE THE OFFER OR SALE IS NOT PERMITTED. | ||
| ||
| Retail – Single Tenant | Loan #5 | Cut-off Date Balance: | $59,463,750 | |
| Property Addresses – Various | ExchangeRight Net Leased Portfolio #56 | Cut-off Date LTV: | 50.5% | |
| U/W NCF DSCR: | 1.79x | |||
| U/W NOI Debt Yield: | 10.4% |
The following table presents historical occupancy percentages at the ExchangeRight Properties:
Historical Occupancy
12/31/2019(1) | 12/31/2020(1) | 12/31/2021(1) | 8/1/2022(2) |
| NAV | NAV | NAV | 100.0% |
| (1) | The ExchangeRight Properties were acquired by the borrower sponsor between January 17, 2021 and April 25, 2022. Historical occupancy for the portfolio of ExchangeRight Properties is not available. |
| (2) | Information based on the underwritten rent roll. |
Underwritten Net Cash Flow. The following table presents certain information relating to the underwritten net cash flow at the ExchangeRight Properties:
Cash Flow Analysis(1)
| U/W | %(2) | U/W $ per SF | ||
| Gross Potential Rent | $6,689,253 | 100.0 | % | $10.49 |
| Recoveries | 0 | 0.0 | 0.00 | |
| Other Income | 0 | 0.0 | 0.00 | |
| Net Rental Income | $6,689,253 | 100.0 | % | $10.49 |
| Less Vacancy & Credit Loss | (307,683) | (4.6 | ) | (0.48) |
| Effective Gross Income | $6,381,569 | 95.4 | % | $10.01 |
| Real Estate Taxes | 0 | 0.0 | 0.00 | |
| Insurance | 0 | 0.0 | 0.00 | |
| Other Operating Expenses | 191,447 | 3.0 |
| 0.30 |
| Total Operating Expenses | $191,447 | 3.0 | % | $0.30 |
| Net Operating Income | $6,190,122 | 97.0 | % | $9.71 |
| Replacement Reserves | 95,650 | 1.5 | 0.15 | |
| TI/LC | 294,863 | 4.6 |
| 0.46 |
| Net Cash Flow | $5,799,609 | 90.9 | % | $9.10 |
| NOI DSCR | 1.91x | |||
| NCF DSCR | 1.79x | |||
| NOI Debt Yield | 10.4% | |||
| NCF Debt Yield | 9.8% | |||
| (1) | Historical occupancy and NOI are unavailable because the ExchangeRight Properties were acquired by the borrower sponsor between January 17, 2021 and April 25, 2022. |
| (2) | Represents (i) percent of Net Rental Income for all revenue fields, (ii) percent of Gross Potential Rent for Vacancy & Credit Loss and (iii) percent of Effective Gross Income for all other fields. |
Appraisal. The ExchangeRight Properties were valued individually between March 1, 2022 and May 19, 2022, with the individual values reflecting an aggregate “as-is” appraised value of $117,750,000.
Environmental Matters. The Phase I environmental site assessments for the ExchangeRight Properties dated from January 21, 2022 to May 19, 2022 identified recognized environmental conditions at the CVS Pharmacy—Christiansburg, VA property, the CVS Pharmacy —Springfield, OH property and the Walgreens—Wichita, KS property and identified a controlled recognized environmental condition at the CVS Pharmacy—Springfield, IL property. See “Description of the Mortgage Pool—Environmental Considerations” in the Preliminary Prospectus.
COVID-19 Update. As of June 21, 2022, the ExchangeRight Properties are open and operating, all tenants have remained current on all rent and lease obligations, and no lease modification or rent relief requests have been received.
| THE INFORMATION IN THIS STRUCTURAL AND COLLATERAL TERM SHEET IS NOT COMPLETE AND MAY BE AMENDED PRIOR TO THE TIME OF SALE. THIS TERM SHEET IS NOT AN OFFER TO SELL THESE SECURITIES AND IT IS NOT A SOLICITATION OF AN OFFER TO BUY THESE SECURITIES IN ANY JURISDICTION WHERE THE OFFER OR SALE IS NOT PERMITTED. | ||
| ||
| Retail – Single Tenant | Loan #5 | Cut-off Date Balance: | $59,463,750 | |
| Property Addresses – Various | ExchangeRight Net Leased Portfolio #56 | Cut-off Date LTV: | 50.5% | |
| U/W NCF DSCR: | 1.79x | |||
| U/W NOI Debt Yield: | 10.4% |
Escrows.
Real Estate Taxes – The ExchangeRight Net Leased Portfolio #56 Mortgage Loan documents provide for an upfront reserve of approximately $229,379 for real estate taxes. The ExchangeRight Net Leased Portfolio #56 Borrower will be required to make monthly deposits into a real estate tax reserve in an amount equal to 1/12th of the real estate taxes that the lender estimates will be payable during the next 12 months, initially approximately $34,615 per month, except that no deposits will be required on account of taxes with respect to the Direct Tax Pay Tenants (as defined below) for so long as (i) no event of default under the ExchangeRight Net Leased Portfolio #56 Mortgage Loan has occurred and is continuing, (ii) the ExchangeRight Net Leased Portfolio #56 Borrower provides proof of payment by the applicable tenant (or the ExchangeRight Net Leased Portfolio #56 Borrower) directly to the taxing authority on or before 15 days prior to the last date on which the taxes can be paid without the accrual of interest or penalties, (iii) the tenant’s lease is not subject to any default beyond any applicable grace or notice and cure period by either the ExchangeRight Net Leased Portfolio #56 Borrower or such tenant, and (iv) no material adverse change has (in the lender’s reasonable determination) occurred with respect to the tenant such that its ability to timely pay the taxes has been materially jeopardized. “Direct Tax Pay Tenant” means any tenant that has the right or the obligation pursuant to its lease to pay taxes for the applicable ExchangeRight Property directly to the applicable taxing authority and is actually exercising such right or complying with such obligation, as applicable. The ExchangeRight Net Leased Portfolio #56 Mortgage Loan documents provide that the initial such Direct Tax Pay Tenants are the tenants at the (i) CVS Pharmacy – Albertville, AL; (ii) CVS Pharmacy – Bedford, OH; (iii) CVS Pharmacy – Christiansburg, VA; (iv) CVS Pharmacy – Easton, PA; (v) CVS Pharmacy – New Baltimore, MI; (vi) CVS Pharmacy – New Boston, OH; (vii) CVS Pharmacy – Silverton, OH; (viii) CVS Pharmacy – Springfield, IL; (ix) CVS Pharmacy – Springfield, OH; (x) Family Dollar – Springfield, MA; (xi) Hobby Lobby – McAlester, OK; (xii) O'Reilly Auto Parts – Decatur, GA; (xiii) O'Reilly Auto Parts – Richmond, TX; (xiv) PNC Bank – Lansing, MI; (xv) Scheel's All Sports – Great Falls, MT; (xvi) Walgreens – Wichita, KS; and (xvii) Woods Supermarket – Sunrise Beach, MO ExchangeRight Properties.
Insurance – The ExchangeRight Net Leased Portfolio #56 Mortgage Loan documents provide for an upfront reserve of approximately $806 for insurance premiums related to flood insurance policies. In addition, the ExchangeRight Net Leased Portfolio #56 Borrower will be required to make monthly deposits into an insurance reserve in an amount equal to 1/12th of the insurance premiums that the lender estimates will be payable for the renewal of the coverage afforded by the insurance policies upon the expiration thereof (initially, approximately $269 for flood insurance policies), except that no deposits will be required on account of insurance premiums with respect to the Direct Insurance Pay Tenants (as defined below) for so long as (i) no event of default under the ExchangeRight Net Leased Portfolio #56 Mortgage Loan has occurred and is continuing, (ii) the ExchangeRight Net Leased Portfolio #56 Borrower provides proof of payment by the applicable tenant (or the ExchangeRight Net Leased Portfolio #56 Borrower) directly to the insurance company on or before 15 days prior to the due date for insurance premiums, (iii) the tenant’s lease is not subject to any default beyond any applicable grace or notice and cure period by either the ExchangeRight Net Leased Portfolio #56 Borrower or such tenant, and (iv) no material adverse change has (in the lender’s reasonable determination) occurred with respect to the tenant such that its ability to timely pay the insurance premiums has been materially jeopardized. In addition, if the casualty and liability insurance with respect to the ExchangeRight Properties are maintained under a lender-approved blanket policy and no event of default is continuing under the ExchangeRight Net Leased Portfolio #56 Mortgage Loan, the ExchangeRight Net Leased Portfolio #56 Borrower will not be required to make monthly deposits into an insurance reserve. “Direct Insurance Pay Tenant” means any tenant that has the right or the obligation pursuant to its lease to maintain all or a portion of the insurance for the applicable ExchangeRight Property and to pay insurance premiums directly to the applicable insurance company and is actually exercising such right or complying with such obligation, as applicable. The ExchangeRight Net Leased Portfolio #56 Mortgage Loan documents provide that the initial such Direct Insurance Pay Tenants (which maintain property and terrorism insurance for the applicable property) are the tenants at the (i) CVS Pharmacy – Albertville, AL; (ii) CVS Pharmacy – Bedford, OH; (iii) CVS Pharmacy – Christiansburg, VA; (iv) CVS Pharmacy – Easton, PA; (v) CVS Pharmacy – New Baltimore, MI; (vi) CVS Pharmacy – New Boston, OH; (vii) CVS Pharmacy – Silverton, OH; (viii) CVS Pharmacy – Springfield, IL; (ix) CVS Pharmacy – Springfield, OH; (x) Dollar General – Jackson, MS; (xi) Dollar General – Lincoln, IL; (xii) Dollar General – Plainfield, CT; (xiii) O'Reilly Auto Parts – Decatur, GA; (xiv) O'Reilly Auto Parts – Richmond, TX; (xv) PNC Bank – Lansing, MI; (xvi) Scheel's All Sports – Great Falls, MT; (xvii) Walgreens – Wichita, KS; and (xviii) Woods Supermarket – Sunrise Beach, MO ExchangeRight Properties.
Required Repairs – The ExchangeRight Net Leased Portfolio #56 Mortgage Loan documents provide for an upfront deposit of approximately $280,629 into a reserve for required repairs, including repairs of roofing, pavement, drainage, and sidewalks, and compliance with accessibility requirements.
Replacement Reserve – The ExchangeRight Net Leased Portfolio #56 Mortgage Loan documents provide for an upfront deposit of approximately $1,209,561 into a reserve for approved capital expenses. If the lender determines in its reasonable judgement that the funds in such reserve will be insufficient to pay amounts due for approved capital expenses, the lender may require additional deposits to such reserve, provided that the borrower may not require deposits to be made with respect to the (i) CVS Pharmacy - Albertville, AL, (ii) CVS Pharmacy – Bedford, OH, (iii) CVS Pharmacy – Christiansburg, VA, (iv) CVS Pharmacy – Easton, PA, (v) CVS Pharmacy – New Baltimore, MI, (vi) CVS Pharmacy – New Boston, OH, (vii) CVS Pharmacy – Silverton, OH, (viii) CVS Pharmacy – Springfield, IL, (ix) CVS Pharmacy – Springfield, OH, (x) Dollar General – Jackson, MS, (xi) Dollar General – Plainfield, CT, (xi) PNC Bank – Lansing, MI, (xii) Scheel's All Sports – Great Falls, MT and (xii) Woods Supermarket – Sunrise Beach, MO ExchangeRight Properties, in each case, to the extent the following conditions are satisfied (i) no event of default under the ExchangeRight Net Leased Portfolio #56 Mortgage Loan has occurred and is continuing, (ii) the ExchangeRight Net Leased Portfolio #56 Borrower provides proof of payment by the applicable tenant of all capital expenses promptly following request by the lender, (iii) the tenant’s lease is not subject to any default beyond any applicable grace or notice and cure period by either the ExchangeRight Net Leased Portfolio #56 Borrower or such tenant, and (iv) no material adverse change has (in the lender’s reasonable determination) occurred with respect to the tenant such that its ability to timely pay the capital expenses has been materially jeopardized.
| THE INFORMATION IN THIS STRUCTURAL AND COLLATERAL TERM SHEET IS NOT COMPLETE AND MAY BE AMENDED PRIOR TO THE TIME OF SALE. THIS TERM SHEET IS NOT AN OFFER TO SELL THESE SECURITIES AND IT IS NOT A SOLICITATION OF AN OFFER TO BUY THESE SECURITIES IN ANY JURISDICTION WHERE THE OFFER OR SALE IS NOT PERMITTED. | ||
| ||
| Retail – Single Tenant | Loan #5 | Cut-off Date Balance: | $59,463,750 | |
| Property Addresses – Various | ExchangeRight Net Leased Portfolio #56 | Cut-off Date LTV: | 50.5% | |
| U/W NCF DSCR: | 1.79x | |||
| U/W NOI Debt Yield: | 10.4% |
TI/LC Reserve – The ExchangeRight Net Leased Portfolio #56 Mortgage Loan documents provide for an upfront reserve of $500,000 for tenant improvements and leasing commissions. During a Cash Management Period (as defined below), the ExchangeRight Net Leased Portfolio #56 Borrower will be required to deposit monthly an amount equal to one-twelfth of the product obtained by multiplying $0.70 by the aggregate rentable square feet of space at the ExchangeRight Properties (initially approximately $37,197) for tenant improvements and leasing commissions.
Free Rent Reserve –The ExchangeRight Net Leased Portfolio #56 Mortgage Loan documents provide for an upfront reserve of approximately $16,656 for free rent periods or other concessions to which the tenants at the Dollar Tree—Toledo, OH and Family Dollar—Port Arthur, TX ExchangeRight Properties are entitled.
Lockbox and Cash Management. The ExchangeRight Net Leased Portfolio #56 Mortgage Loan is structured with a hard lockbox and springing cash management. The ExchangeRight Net Leased Portfolio #56 Borrower is required to (or to cause the ExchangeRight Net Leased Portfolio #56 Master Tenant or property manager to) cause all rents relating to the ExchangeRight Properties to be transmitted directly by the tenants into the lockbox account and, to the extent that such rents are received by the ExchangeRight Net Leased Portfolio #56 Borrower (or ExchangeRight Net Leased Portfolio #56 Master Tenant or property manager), cause such amounts to be deposited into the lockbox account within two business days following receipt. The lockbox account bank is required to sweep such funds into the ExchangeRight Net Leased Portfolio #56 Master Tenant’s operating account on each business day other than during a Cash Management Period. During a Cash Management Period, funds in the lockbox account are required to be swept into a lender controlled cash management account, and provided no event of default is continuing, funds in the cash management account are required to be applied (i) to make the next monthly deposits (to the extent required) into the real estate taxes and insurance reserves as described above under “Escrows”, (ii) to reserve the next monthly debt service payment due on the ExchangeRight Net Leased Portfolio #56 Mortgage Loan, (iii) to make the next monthly deposits (to the extent required) into the capital expenses reserve and the rollover reserve as described above under “Escrows”, (iv) to pay operating expenses set forth in the annual budget (which is required to be reasonably approved by the lender during a Cash Management Period) and, if a Cash Management Period exists solely as a result of a decline in the debt service coverage ratio, to pay additional operating expenses reasonably approved by the lender and (v) to deposit any remainder into a cash collateral subaccount to be held as additional security for the ExchangeRight Net Leased Portfolio #56 Mortgage Loan during such Cash Management Period. Upon cessation of a Cash Management Period, all available amounts on deposit in the cash management account must be released to the ExchangeRight Net Leased Portfolio #56 Borrower or ExchangeRight Net Leased Portfolio #56 Master Tenant.
A “Cash Management Period" means a period:
| (i) | commencing upon a default or an event of default under the ExchangeRight Net Leased Portfolio #56 Mortgage Loan and ending when such default or event of default has been cured or waived in writing by the lender, or |
| (ii) | commencing when the debt service coverage ratio (based on net operating income for the trailing 12 months) as of the end of any calendar quarter is less than 1.50x and ending when the debt service coverage ratio (based on net operating income for the trailing 12 months) is at least 1.50x as of the end of each of two consecutive calendar quarters, or |
| (iii) | commencing on the payment date that occurs in July, 2029 (thirty-six months before the maturity date of the ExchangeRight Net Leased Portfolio #56 Mortgage Loan), unless a Qualified Transfer (as defined below) has occurred as of such date, and ending when a Qualified Transfer occurs. |
Qualified Transfer. A “Qualified Transfer” means any time following June 21, 2023, the borrower sponsor has the right to effect a one-time transfer of all (but not less than all) of the outstanding ownership interests in the ExchangeRight Net Leased Portfolio #56 Borrower to an Approved Transferee (as defined below) and to replace the non-recourse carveout guarantors as the person who controls the ExchangeRight Net Leased Portfolio #56 Borrower with such Approved Transferee (or other approved replacement guarantor); provided that certain conditions are satisfied, including among others: (i) no event of default exists under the ExchangeRight Net Leased Portfolio #56 Mortgage Loan, (ii) the ExchangeRight Properties will continue to be managed by a qualified manager, (iii) prior to any release of the guarantor, the Approved Transferee executes a full guarantee and indemnity pursuant to which it agrees to be liable (from and after the transfer) for all indemnity obligations (including environmental liabilities and obligations) for which the existing non-recourse carveout guarantors are liable under the non-recourse carveout guaranty, (iv) the Approved Transferee owns 100% of the beneficial ownership interests in, and controls, the ExchangeRight Net Leased Portfolio #56 Borrower and ExchangeRight Net Leased Portfolio #56 Master Tenant, (v) the delivery of opinions regarding existence, authority, enforceability and non-consolidation satisfactory to the lender and (vi) if required by the lender, rating agency confirmation from each applicable rating agency.
"Approved Transferee" means either (A) an eligible institution that is, or is wholly-owned and controlled by, a bank, savings and loan association, investment bank, insurance company, trust company, real estate investment trust, commercial credit corporation, pension plan, pension fund or pension advisory firm, mutual fund, government entity or plan or institution similar to any of the foregoing or (B) any person that (1) is a Qualified Transferee (as defined below), (2) is regularly engaged in the business of owning or operating commercial properties, or interests therein, which are similar to the ExchangeRight Properties, (3) owns interests in, or operates, at least five retail properties with a minimum of 750,000 square feet in the aggregate, (4) maintains either (i) a minimum net worth of at least $500,000,000 and total assets of at least $1,000,000,000 or (ii) an investment grade rating by S&P or Moody’s, (5) at all times owns no less than 100% of the legal and beneficial ownership of the borrower, and (6) is not a Delaware statutory trust.
A “Qualified Transferee” means a transferee that (i) has never been indicted or convicted of, or pled guilty or no contest to a felony, (ii) has never been indicted or convicted of, or pled guilty or no contest to a Patriot Act offense and is not on any government watch
| THE INFORMATION IN THIS STRUCTURAL AND COLLATERAL TERM SHEET IS NOT COMPLETE AND MAY BE AMENDED PRIOR TO THE TIME OF SALE. THIS TERM SHEET IS NOT AN OFFER TO SELL THESE SECURITIES AND IT IS NOT A SOLICITATION OF AN OFFER TO BUY THESE SECURITIES IN ANY JURISDICTION WHERE THE OFFER OR SALE IS NOT PERMITTED. | ||
| ||
| Retail – Single Tenant | Loan #5 | Cut-off Date Balance: | $59,463,750 | |
| Property Addresses – Various | ExchangeRight Net Leased Portfolio #56 | Cut-off Date LTV: | 50.5% | |
| U/W NCF DSCR: | 1.79x | |||
| U/W NOI Debt Yield: | 10.4% |
list, (iii) has never been the subject of a voluntary or involuntary (to the extent the same has not been discharged) bankruptcy proceeding, (iv) has no material outstanding judgments, litigations or regulatory actions against it or its interests and (v) is not a crowdfunded entity or controlled by a crowdfunded entity.
In addition, at any time following June 21, 2023, the borrower sponsors have the right to effect a one-time transfer of all (but not less than all) of the outstanding ownership interests in the ExchangeRight Net Leased Portfolio #56 Borrower to an Approved REIT (as defined below) or a wholly owned subsidiary thereof that meets the requirements of a Qualified Transferee and to replace the non-recourse carveout guarantors as the person who controls the borrower with such Approved REIT.
“Approved REIT” means a real estate investment trust that (i) meets the requirements of a Qualified Transferee and for whom the lender receives a reasonably acceptable credit check; (ii) is at all times (a) owned, directly or indirectly, by the Individual Guarantors in an amount that is equal to either (x) 1% of all equity interests or (y) equity interests valued at not less than $15,000,000, and (b) under the control of one or more persons that (1) meet the requirements of a Qualified Transferee and for whom the lender receives a reasonably acceptable credit check, and (2) is at all times under management control by the Individual Guarantors (provided such management control is not required if the Approved REIT has acquired a controlling interest in ExchangeRight Real Estate, LLC and has total assets of at least $1,000,000,000 (excluding the ExchangeRight Properties) and at least $500,000,000 in shares of beneficial interest owned by investors; and (iii) is otherwise reasonably acceptable to the lender in all respects. Subject to the satisfaction of clauses (i) and (ii) above, ExchangeRight Income Fund (doing business as the ExchangeRight Essential Income Strategy), a Maryland statutory trust, will be deemed to have satisfied clause (iii) above provided such entity has total assets of at least $1,000,000,000 (excluding the ExchangeRight Properties) and at least $500,000,000 in shares of beneficial interest owned by investors.
Property Management. The ExchangeRight Properties are managed by NLP Management, LLC, an affiliate of the ExchangeRight Net Leased Portfolio #56 Borrower.
Partial Release. On any payment date after the expiration of the defeasance lockout period, the ExchangeRight Net Leased Portfolio #56 Borrower has the right to obtain the release of any individual ExchangeRight Property in connection with a bona fide third party sale of such ExchangeRight Property, upon defeasance of a release price equal to the greater of (x) 115% of the allocated loan amount of such ExchangeRight Property and (y) 90% of the net sales proceeds of such ExchangeRight Property, and satisfaction of the following conditions, among others: (i) after giving effect to such release, the debt service coverage ratio of the remaining ExchangeRight Properties is not less than the greater of the debt service coverage ratio immediately preceding the release and 1.79x, (ii) after giving effect to such release, the debt yield of the remaining ExchangeRight Properties is not less than the greater of the debt yield immediately preceding the release and 9.75%, and (iii) satisfaction of REMIC related conditions.
Real Estate Substitution. Not permitted.
Subordinate and Mezzanine Indebtedness. Not permitted.
Letter of Credit. None.
Right of First Offer / Right of First Refusal. The related single tenant at each of the following ExchangeRight Properties has a right of first refusal (“ROFR”) to purchase the related ExchangeRight Property: (i) CVS Pharmacy – Albertville, AL; (ii) O’Reilly Auto Parts – Decatur, GA, (iii) CVS Pharmacy – Springfield, IL, (iv) Walgreens –Wichita, KS, (v) CVS Pharmacy – New Baltimore, MI, (vi) CVS Pharmacy –New Boston, OH, (vii) CVS Pharmacy –Silverton, OH, (viii) CVS Pharmacy – Springfield, OH, (ix) CVS Pharmacy –Easton, PA, (x) O’Reilly Auto Parts – Richmond, TX, and (xi) CVS Pharmacy – Christiansburg, VA. Such ROFRs will (except in the case of the Walgreens—Wichita, KS property) apply to a foreclosure or deed-in-lieu thereof, and in all cases will apply to any transfers following a foreclosure or deed-in-lieu thereof. See “Description of the Mortgage Pool—Tenant Issues—Purchase Options and Rights of First Refusal” in the Preliminary Prospectus.
Ground Lease. None.
Terrorism Insurance. The ExchangeRight Net Leased Portfolio #56 Borrower is required to obtain and maintain an “all risk” property insurance policy that covers terrorist acts in an amount equal to the “full replacement cost” of the ExchangeRight Properties together with 18 months of business income insurance, plus a 365 day extended period of indemnity, provided that such coverage is available. See “Risk Factors—Risks Relating to the Mortgage Loans—Terrorism Insurance May Not Be Available for All Mortgaged Properties” in the Preliminary Prospectus.
| THE INFORMATION IN THIS STRUCTURAL AND COLLATERAL TERM SHEET IS NOT COMPLETE AND MAY BE AMENDED PRIOR TO THE TIME OF SALE. THIS TERM SHEET IS NOT AN OFFER TO SELL THESE SECURITIES AND IT IS NOT A SOLICITATION OF AN OFFER TO BUY THESE SECURITIES IN ANY JURISDICTION WHERE THE OFFER OR SALE IS NOT PERMITTED. | ||
| ||
| Office – Suburban | Loan #6 | Cut-off Date Balance: | $52,000,000 | |
| 1 Bridge Street | One Bridge Street | Cut-off Date LTV: | 52.0% | |
| Irvington, NY 10533 | UW NCF DSCR: | 2.19x | ||
| UW NOI Debt Yield: | 11.3% |
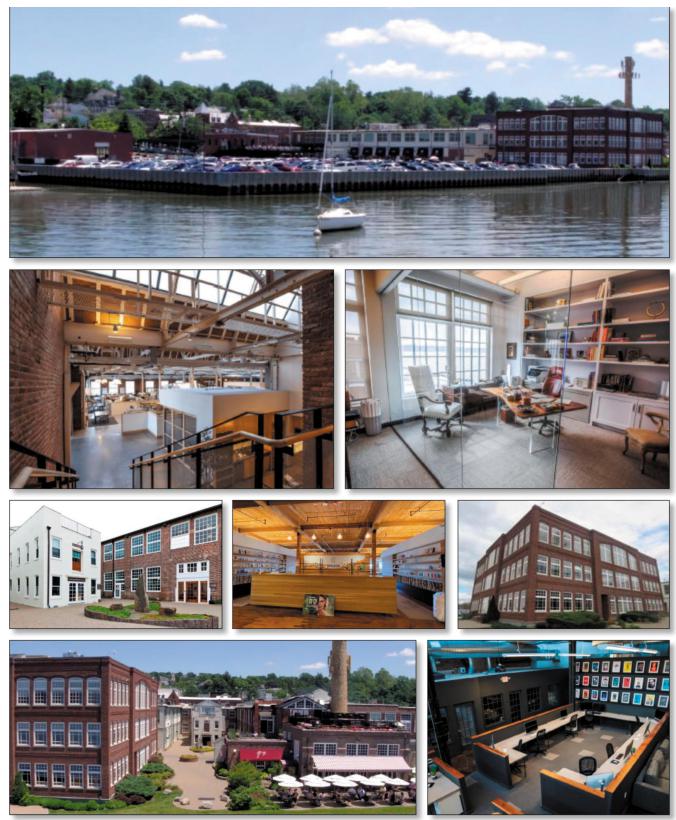
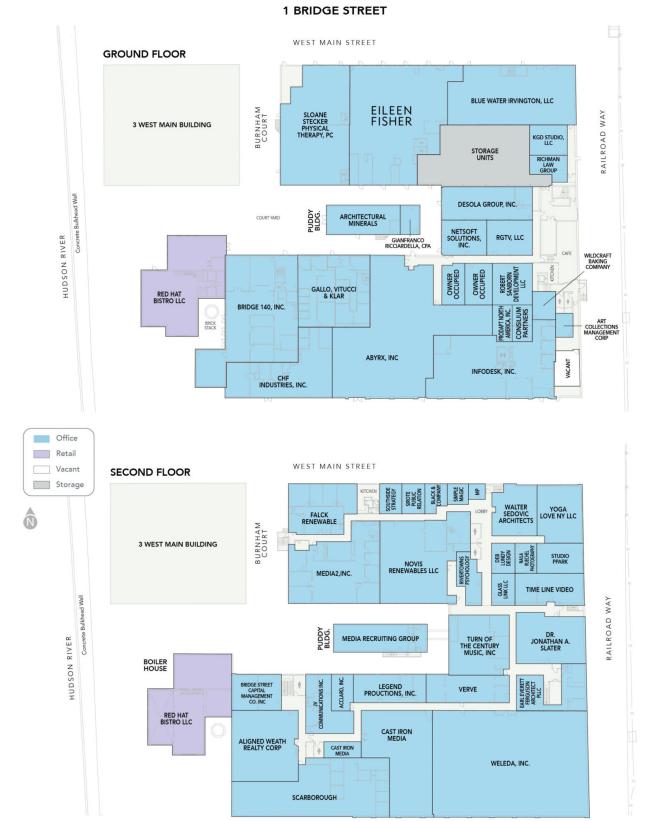
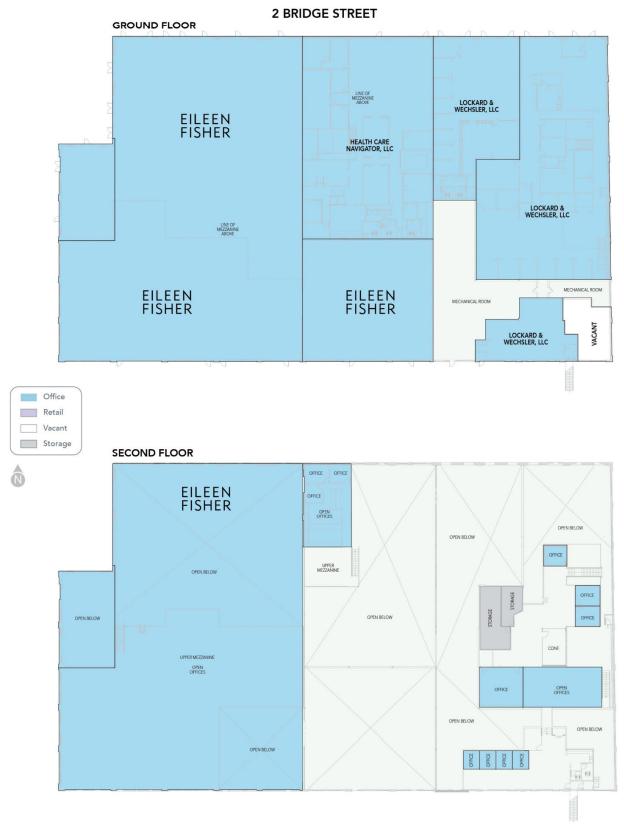
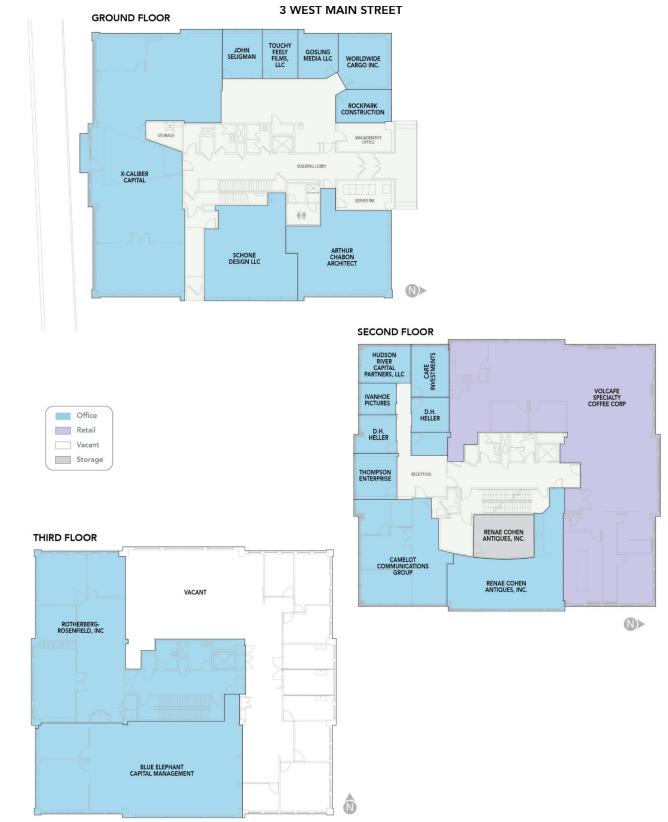
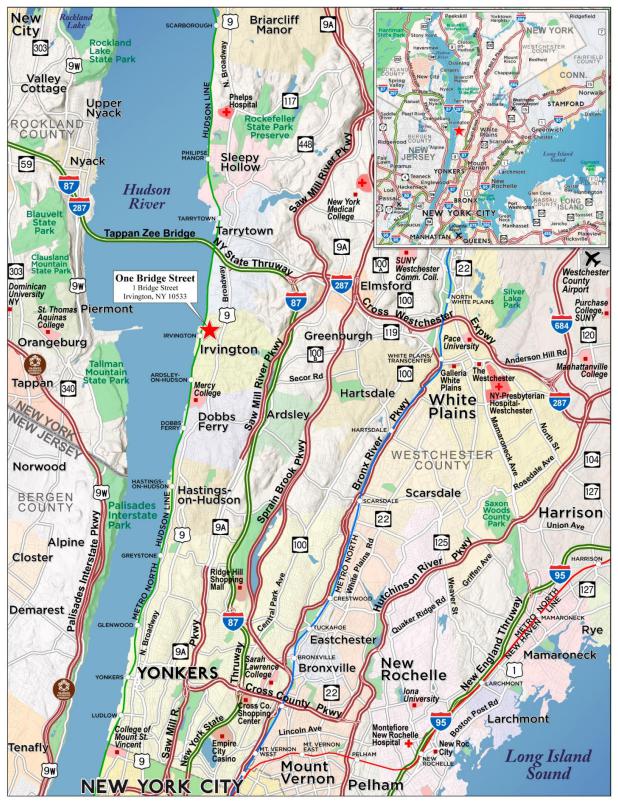
| THE INFORMATION IN THIS STRUCTURAL AND COLLATERAL TERM SHEET IS NOT COMPLETE AND MAY BE AMENDED PRIOR TO THE TIME OF SALE. THIS TERM SHEET IS NOT AN OFFER TO SELL THESE SECURITIES AND IT IS NOT A SOLICITATION OF AN OFFER TO BUY THESE SECURITIES IN ANY JURISDICTION WHERE THE OFFER OR SALE IS NOT PERMITTED. | ||
| ||
| No. 6 – One Bridge Street |
| Mortgage Loan Information | Mortgaged Property Information | |||||
| Mortgage Loan Seller: | Morgan Stanley Mortgage Capital | Single Asset/Portfolio: | Single Asset | |||
| Holdings LLC | Property Type – Subtype: | Office – Suburban | ||||
| Credit Assessment | NR/NR/NR | Location: | Irvington, NY | |||
| (Fitch/KBRA/Moody’s): | Size: | 200,397 SF | ||||
| Original Principal Balance: | $52,000,000 | Cut-off Date Balance Per SF: | $259.48 | |||
| Cut-off Date Balance: | $52,000,000 | Maturity Date Balance Per SF: | $259.48 | |||
| % of Initial Pool Balance: | 4.8% | Year Built/Renovated: | 1912/2003 | |||
| Loan Purpose: | Refinance | Title Vesting: | Fee | |||
| Borrower Sponsor: | William J. Thompson and Jeffrey | Property Manager: | Cushman & Wakefield, Inc. | |||
| P. Reich | Current Occupancy (As of): | 92.8% (5/2/2022) | ||||
| Guarantor: | William J. Thompson and Jeffrey | YE 2021 Occupancy: | 97.0% | |||
| P. Reich | YE 2020 Occupancy: | 95.4% | ||||
| Mortgage Rate: | 4.7000% | YE 2019 Occupancy: | 96.0% | |||
| Note Date: | June 1, 2022 | YE 2018 Occupancy: | 96.6% | |||
| Seasoning: | 2 months | As-Is Appraised Value: | $100,000,000 | |||
| Maturity Date: | June 1, 2032 | As-Is Appraised Value Per SF: | $499.01 | |||
| IO Period: | 120 months | Appraisal Valuation Date: | April 27, 2022 | |||
| Loan Term (Original): | 120 months | |||||
| Amortization Term (Original): | NAP | |||||
| Loan Amortization Type: | Interest Only | |||||
| Call Protection: | L(26),D(87),O(7) | |||||
| Lockbox Type: | Hard/In Place Cash Management | Underwriting and Financial Information(2) | ||||
| Additional Debt: | No | TTM NOI (3/30/2022): | $5,671,206 | |||
| Additional Debt Type (Balance): | NAP | YE 2021 NOI: | $5,451,159 | |||
| YE 2020 NOI: | $5,164,692 | |||||
| YE 2019 NOI: | $5,805,462 | |||||
| YE 2018 NOI: | $6,011,165 | |||||
| U/W Revenues: | $9,171,758 | |||||
| U/W Expenses: | $3,308,726 | |||||
| Escrows and Reserves(1) | U/W NOI: | $5,863,032 | ||||
| Initial | Monthly | Cap | U/W NCF: | $5,432,119 | ||
| Taxes: | $382,192 | $95,548 | NAP | U/W DSCR based on NOI/NCF: | 2.37x /2.19x | |
| Insurance: | $0 | Springing | NAP | U/W Debt Yield based on NOI/NCF: | 11.3% / 10.4% | |
| Replacement Reserve: | $0 | $3,376 | $40,510 | U/W Debt Yield at Maturity based on NOI/NCF: | 11.3% / 10.4% | |
| TI/LC Reserve: | $300,000 | $25,319 | $500,000 | Cut-off Date LTV Ratio: | 52.0% | |
| LTV Ratio at Maturity: | 52.0% | |||||
| Sources and Uses | |||||||
| Sources | Uses | ||||||
| Loan Amount | $52,000,000 | 100.0% | Refinance Existing Debt | $45,907,809 | 88.3 | % | |
| Reserves | $682,192 | 1.3 | |||||
| Closing Costs | $1,109,172 | 2.1 | |||||
| Return of Equity | $4,300,826 | 8.3 | |||||
| Total Sources | $52,000,000 | 100.0% | Total Uses | $52,000,000 | 100.0 | % | |
| (1) | See “Escrows” below for further discussion of reserve requirements. |
| (2) | The novel coronavirus pandemic is an evolving situation and could impact the One Bridge Street Mortgage Loan (as defined below) more severely than assumed in the underwriting of the One Bridge Street Mortgage Loan and could adversely affect the NOI, NCF and occupancy information, as well as the appraised value and the DSCR, LTV and Debt Yield metrics presented above and herein. See “Risk Factors—Risks Related to Market Conditions and Other External Factors—The Coronavirus Pandemic Has Adversely Affected the Global Economy and Will Likely Adversely Affect the Performance of the Mortgage Loans” in the Preliminary Prospectus. |
The Mortgage Loan. The mortgage loan (the “One Bridge Street Mortgage Loan”) is evidenced by a single promissory note in the original principal amount of $52,000,000 and secured by the fee interest in three low-rise office buildings in Irvington, New York (the “One Bridge Street Property”).
The Borrower and the Borrower Sponsors. The borrower is Bridge Street Commercial LLC (the “One Bridge Street Borrower”), a Delaware limited liability company with one independent director in its organizational structure. The One Bridge Street Borrower is indirectly owned by Jeffrey P. Reich, William J. Thompson and Bridge Street Capital Management Co., Inc., which is in turn owned by
| THE INFORMATION IN THIS STRUCTURAL AND COLLATERAL TERM SHEET IS NOT COMPLETE AND MAY BE AMENDED PRIOR TO THE TIME OF SALE. THIS TERM SHEET IS NOT AN OFFER TO SELL THESE SECURITIES AND IT IS NOT A SOLICITATION OF AN OFFER TO BUY THESE SECURITIES IN ANY JURISDICTION WHERE THE OFFER OR SALE IS NOT PERMITTED. | ||
| ||
| Office – Suburban | Loan #6 | Cut-off Date Balance: | $52,000,000 | |
| 1 Bridge Street | One Bridge Street | Cut-off Date LTV: | 52.0% | |
| Irvington, NY 10533 | UW NCF DSCR: | 2.19x | ||
| UW NOI Debt Yield: | 11.3% |
Matthew Callahan. Jeffrey P. Reich and William J. Thompson (together, the “Borrower Sponsor”) are the non-recourse carveout guarantors and environmental indemnitors with respect to the One Bridge Street Mortgage Loan.
Jeffrey P. Reich is the President, CEO and co-founder of Bridge Street Capital Management, a diversified investment management firm based in Irvington, New York. Prior to founding Bridge Street Capital in 1995, Mr. Reich worked on Wall Street in mortgage trading.
William J. Thompson is responsible for the day-to-day operations at the One Bridge Street Property, including management, construction and leasing.
The Property. The One Bridge Street Property is an office property, comprised of three 3-story buildings (known as the “One Bridge Street Building”, the “Two Bridge Street Building”, and the “Three West Main Building”), totaling 200,397 square feet located in Irvington, New York along the Hudson River waterfront. The two original buildings, constructed in 1912, were turn-of-the-century warehouses and were purchased by the Borrower Sponsor in 1995. Since then, the Borrower Sponsor has reportedly invested approximately $25 million in capital expenditures at the One Bridge Street Property, including a renovation in 2003, and the construction of a third building in 2005. The One Bridge Street Property is 92.8% leased as of May 2, 2022, by 66 office tenants and three retail tenants. Additional revenue is generated by storage space and two antenna leases. The One Bridge Street Property has 236 parking spaces, and also benefits from a parking easement for 252 spaces at a neighboring property owned by an affiliate of the borrower.
The One Bridge Street Property is located approximately 3.3 miles south of Tarrytown and 25 miles north of Midtown Manhattan. The
One Bridge Street Property is situated adjacent to the Metro North Irvington Station which provides both express and local railroad service into New York City’s Grand Central Terminal. The waterfront location provides many tenants direct unobstructed views of the Hudson River, the New Jersey Palisades, the Tappan Zee Bridge, and the Manhattan Skyline.
Major Tenants.
Eileen Fisher, Inc. (43,038 SF, 21.5% of NRA, 22.8% of underwritten rent). Eileen Fisher, Inc., a casual apparel brand, has been a tenant at the One Bridge Street Property since 1996. The One Bridge Street Property is home to part of the brand’s corporate headquarters. Over the years, Eileen Fisher, Inc. expanded its presence at the One Bridge Street Property, gradually increasing its footprint to 43,038 square feet. In February 2022, Eileen Fisher, Inc. leased an additional 5,800 square feet that expires on November 30, 2025, while the rest of its space expires on December 31, 2027. Eileen Fisher, Inc. also leases space at a Borrower Sponsor-owned building a few blocks from the One Bridge Street Property and at a third party owned building across the street from the One Bridge Street Property.
| THE INFORMATION IN THIS STRUCTURAL AND COLLATERAL TERM SHEET IS NOT COMPLETE AND MAY BE AMENDED PRIOR TO THE TIME OF SALE. THIS TERM SHEET IS NOT AN OFFER TO SELL THESE SECURITIES AND IT IS NOT A SOLICITATION OF AN OFFER TO BUY THESE SECURITIES IN ANY JURISDICTION WHERE THE OFFER OR SALE IS NOT PERMITTED. | ||
| ||
| Office – Suburban | Loan #6 | Cut-off Date Balance: | $52,000,000 | |
| 1 Bridge Street | One Bridge Street | Cut-off Date LTV: | 52.0% | |
| Irvington, NY 10533 | UW NCF DSCR: | 2.19x | ||
| UW NOI Debt Yield: | 11.3% |
The following table presents certain information relating to the major tenants at the One Bridge Street Property:
Major Tenants(1)
| Tenant Name | Credit Rating (Fitch/Moody’s/S&P)(2) | Tenant NRSF | % of NRSF | Annual U/W Base Rent PSF | Annual U/W Base Rent | % of Total Annual U/W Base Rent | Lease Expiration Date | Extension Options | Term. Option (Y/N) |
| Major Tenants | |||||||||
| Eileen Fisher, Inc. | NR/NR/NR | 43,038 | 21.5% | $39.02 | $1,679,408 | 22.8% | 12/31/2027(3) | None | Y(3) |
| Lockard & Wechsler, LLC | NR/NR/NR | 23,928 | 11.9% | $38.82 | $928,858 | 12.6% | 4/30/2028 | 1, 5-year | N(4) |
| Healthcare Navigator, LLC | NR/NR/NR | 12,100 | 6.0% | $42.30 | $511,879 | 6.9% | 11/30/2030 | 1, 5-year | N |
| Weleda, Inc. | NR/NR/NR | 8,700 | 4.3% | $28.44 | $247,406 | 3.4% | 6/30/2025 | None | N |
| Novis Renewables LLC | NR/NR/NR | 6,015 | 3.0% | $38.42 | $231,126 | 3.1% | 12/31/2023 | None | N |
| Total Major Tenants | 93,781 | 46.8% | $38.37 | $3,598,678 | 48.8% | ||||
| Non-Major Tenants | 92,104 | 46.0% | $40.93 | $3,769,459 | 51.2% | ||||
| Occupied Collateral Total | 185,885 | 92.8% | $39.64 | $7,368,136 | 100.0% | ||||
| Vacant Space | 14,512 | 7.2% | |||||||
| Collateral Total | 200,397 | 100.0% | |||||||
| (1) | Information is based on the underwritten rent roll. |
| (2) | Certain ratings are those of the parent company whether or not the parent company guarantees the lease. |
| (3) | Eileen Fisher, Inc. leases 37,238 square feet at the Two Bridge Street Building and 5,800 square feet at the One Bridge Street Building. The 37,238 square foot lease expires December 31, 2027, and the 5,800 square foot lease expires November 30, 2025. However, the tenant has the right to terminate its space at the One Bridge Street Building at any time upon 365 days’ prior written notice. |
| (4) | The landlord has the option to terminate the Lockard & Wechsler, LLC lease, which termination does not require the lender’s consent. |
The following table presents certain information relating to the lease rollover schedule at the One Bridge Street Property:
Lease Expiration Schedule(1)
| Year Ending December 31, | No. of Leases Expiring | Expiring NRSF | % of Total NRSF | Cumulative Expiring NRSF | Cumulative % of Total NRSF | Annual U/W Base Rent | % of Total Annual U/W Base Rent | Annual U/W Base Rent PSF(2) |
| MTM | 8 | 3,716 | 1.9% | 3,716 | 1.9% | $133,608 | 1.8% | $35.95 |
| 2022 | 7 | 7,784 | 3.9% | 11,500 | 5.7% | $295,177 | 4.0% | $37.92 |
| 2023 | 23 | 28,142 | 14.0% | 39,642 | 19.8% | $1,109,896 | 15.1% | $39.44 |
| 2024 | 6 | 7,896 | 3.9% | 47,538 | 23.7% | $250,827 | 3.4% | $31.77 |
| 2025 | 10 | 28,706 | 14.3% | 76,244 | 38.0% | $1,051,167 | 14.3% | $36.62 |
| 2026 | 9 | 11,263 | 5.6% | 87,507 | 43.7% | $365,173 | 5.0% | $32.42 |
| 2027 | 8 | 53,975 | 26.9% | 141,482 | 70.6% | $2,407,790 | 32.7% | $44.61 |
| 2028 | 2 | 28,053 | 14.0% | 169,535 | 84.6% | $1,087,365 | 14.8% | $38.76 |
| 2029 | 1 | 4,250 | 2.1% | 173,785 | 86.7% | $155,254 | 2.1% | $36.53 |
| 2030 | 1 | 12,100 | 6.0% | 185,885 | 92.8% | $511,879 | 6.9% | $42.30 |
| 2031 | 0 | 0 | 0.0% | 185,885 | 92.8% | $0 | 0.0% | $0.00 |
| 2032 | 0 | 0 | 0.0% | 185,885 | 92.8% | $0 | 0.0% | $0.00 |
| Thereafter | 0 | 0 | 0.0% | 185,885 | 92.8% | $0 | 0.0% | $0.00 |
| Vacant | 0 | 14,512 | 7.2% | 200,397 | 100.0% | $0 | 0.0% | $0.00 |
| Total/Wtd. Avg. (2) | 75 | 200,397 | 100.0% | $7,368,136 | 100.0% | $39.64 |
| (1) | Information is based on the underwritten rent roll. Certain tenants may have lease termination options that are exercisable prior to the stated expiration date of the subject lease or leases that are not considered in the lease expiration schedule. |
| (2) | Total/Wtd. Avg. Annual U/W Base Rent PSF excludes vacant space. |
| THE INFORMATION IN THIS STRUCTURAL AND COLLATERAL TERM SHEET IS NOT COMPLETE AND MAY BE AMENDED PRIOR TO THE TIME OF SALE. THIS TERM SHEET IS NOT AN OFFER TO SELL THESE SECURITIES AND IT IS NOT A SOLICITATION OF AN OFFER TO BUY THESE SECURITIES IN ANY JURISDICTION WHERE THE OFFER OR SALE IS NOT PERMITTED. | ||
| ||
| Office – Suburban | Loan #6 | Cut-off Date Balance: | $52,000,000 | |
| 1 Bridge Street | One Bridge Street | Cut-off Date LTV: | 52.0% | |
| Irvington, NY 10533 | UW NCF DSCR: | 2.19x | ||
| UW NOI Debt Yield: | 11.3% |
The following table presents historical occupancy percentages at the One Bridge Street Property:
Historical Occupancy
12/31/2018(1) | 12/31/2019(1) | 12/31/2020(1) | 12/31/2021(1) | 5/2/2022(2) |
| 96.6% | 96.0% | 95.4% | 97.0% | 92.8% |
| (1) | Information obtained from the borrower sponsor. |
| (2) | Information based on the underwritten rent roll. |
Operating History and Underwritten Net Cash Flow. The following table presents certain information relating to the historical operating performance and underwritten net cash flow at the One Bridge Street Property:
Cash Flow Analysis
| 2019 | 2020 | 2021 | 3/30/2022 TTM | U/W | %(1) | U/W $ per SF | |
| Gross Potential Rent | $6,795,022 | $6,354,994 | $6,700,502 | $6,995,911 | $7,901,297(2) | 80.5% | $39.43 |
| Reimbursements | 1,637,597 | 1,530,398 | 1,562,102 | 1,608,983 | 1,724,186 | 17.6 | 8.60 |
| Other Income(3) | 384,127 | 182,101 | 257,629 | 279,016 | 194,956 | 2.0 | 0.97 |
| Free Rent | (16,261) | (43,301) | (13,339) | (14,342) | 0 | 0.0 | 0.00 |
| Net Rental Income | $8,800,486 | $8,024,192 | $8,506,894 | $8,869,569 | $9,820,440 | 100.0% | $49.00 |
| Less Vacancy & Credit Loss | 0 | 0 | 0 | 0 | (648,681) | (8.2) | (3.24) |
| Effective Gross Income | $8,800,486 | $8,024,192 | $8,506,894 | $8,869,569 | $9,171,758 | 93.4% | $45.77 |
| Real Estate Taxes | $969,464 | $983,032 | $1,064,074 | $1,097,061 | $1,113,177 | 12.1% | $5.55 |
| Insurance | 154,947 | 163,288 | 171,867 | 174,160 | 180,563 | 2.0 | 0.90 |
| Management Fee | 131,310 | 123,552 | 140,421 | 143,986 | 275,153 | 3.0 | 1.37 |
| Other Operating Expenses | 1,739,303 | 1,589,627 | 1,679,373 | 1,783,154 | 1,739,833 | 19.0 | 8.68 |
| Total Operating Expenses | $2,995,024 | $2,859,499 | $3,055,735 | $3,198,362 | $3,308,726 | 36.1% | $16.51 |
| Net Operating Income(3) | $5,805,462 | $5,164,692 | $5,451,159 | $5,671,206 | $5,863,032 | 63.9% | $29.26 |
| Replacement Reserves | 0 | 0 | 0 | 0 | 40,079 | 0.4 | 0.20 |
| TI/LC | 0 | 0 | 0 | 0 | 390,834 | 4.3 | 1.95 |
| Net Cash Flow | $5,805,462 | $5,164,692 | $5,451,159 | $5,671,206 | $5,432,119 | 59.2% | $27.11 |
| NOI DSCR | 2.34x | 2.08x | 2.20x | 2.29x | 2.37x | ||
| NCF DSCR | 2.34x | 2.08x | 2.20x | 2.29x | 2.19x | ||
| NOI Debt Yield | 11.2% | 9.9% | 10.5% | 10.9% | 11.3% | ||
| NCF Debt Yield | 11.2% | 9.9% | 10.5% | 10.9% | 10.4% |
| (1) | Represents (i) percent of Net Rental Income for all revenue fields, (ii) percent of Gross Potential Rent for Vacancy & Credit Loss and (iii) percent of Effective Gross Income for all other fields. |
| (2) | U/W Gross Potential Rent is based on the rent roll as of May 2, 2022. |
| (3) | The decline in Net Operating Income in 2020 and 2021 compared to 2019 is primarily attributable to rent relief relating to the COVID-19 pandemic, which was provided to the tenants Eileen Fisher, Inc., Blue Water Irvington, LLC and Red Hat Bistro, LLC in the aggregate amounts of $354,648 in 2020 and $368,894 in 2021. There are currently no outstanding rent relief obligations. Other Income declined in 2020 primarily due to reduction in parking income as a result of the COVID-19 pandemic. |
Appraisal. The appraisal concluded to an “as-is” value as of April 27, 2022 of $100,000,000.
Environmental Matters. According to the Phase I environmental report dated May 5, 2022, there was no evidence of any recognized environmental conditions at the One Bridge Street Property.
Market Overview and Competition. The One Bridge Street Property is located in Irvington, New York, within the Westchester County submarket of the New York City metropolitan statistical area market. Primary access to the neighborhood is provided by the Saw Mill River Parkway, US Route 9, Interstate 87, and the Metro North train system, which can get passengers from Midtown Manhattan to the adjacent Irvington Station in approximately 40 minutes during peak travel time. The One Bridge Street Property is situated 25 miles north of Midtown Manhattan. According to the appraisal, as of the first quarter of 2022, the vacancy rate for offices in the Westchester County submarket was approximately 11.2%, with an inventory of approximately 53,626,299 square feet, and a base rent of $28.00 per square foot. As of the same period, the vacancy rate in the village of Irvington was approximately 2.9%, with average asking rents of $44.40 per square foot and inventory of 649,294 square feet. According to the appraisal, the 2021 population within a one-mile radius of the One Bridge Street Property was approximately 4,861. The populations within a three-mile and a five-mile radius were approximately 49,159 and 158,308 respectively. The 2021 median household income within the same one, three, and five-mile radius was $203,047, $195,865, and $176,327 respectively.
| THE INFORMATION IN THIS STRUCTURAL AND COLLATERAL TERM SHEET IS NOT COMPLETE AND MAY BE AMENDED PRIOR TO THE TIME OF SALE. THIS TERM SHEET IS NOT AN OFFER TO SELL THESE SECURITIES AND IT IS NOT A SOLICITATION OF AN OFFER TO BUY THESE SECURITIES IN ANY JURISDICTION WHERE THE OFFER OR SALE IS NOT PERMITTED. | ||
| ||
| Office – Suburban | Loan #6 | Cut-off Date Balance: | $52,000,000 | |
| 1 Bridge Street | One Bridge Street | Cut-off Date LTV: | 52.0% | |
| Irvington, NY 10533 | UW NCF DSCR: | 2.19x | ||
| UW NOI Debt Yield: | 11.3% |
The following table presents certain information relating to the appraisal’s market rent conclusion for the One Bridge Street Property:
Market Rent Summary
Adjusted Comparable Leases
| ||||||||
| Category | Market Rent (PSF) | Reimbursements | Annual Escalation | Tenant Improvements PSF (New/Renewal) | Free Rent (months) (New/Renewal) | Lease Term | Leasing Commissions (New) | Leasing Commissions (Renewal) |
| Office | $40.00 | Mod. Gross | 3.0% per year | $15.00 / $0.00 | 1 / 0 | 7 Years | 5.00% | 2.50% |
| Storage | $15.00 | None | 3.0% per year | $0.00 / $0.00 | 0 / 0 | 7 Years | 0.00% | 0.00% |
| Antenna | $14.32 | None | None | $0.00 / $0.00 | 0 / 0 | 5 Years | 0.00% | 0.00% |
| Retail | $60.00 | Net | 3.0% per year | $20.00 / $0.00 | 1 / 0 | 10 Years | 5.00% | 2.50% |
Source: Appraisal.
The following table presents comparable office leases with respect to the One Bridge Street Property:
Comparable Office Lease Summary
| Property/Location | Year Built | SF | Tenant Name | Tenant Size (SF) | Lease Date | Rent PSF | Lease Type |
One Bridge Street (subject)(1) Irvington, NY | 1912 | 200,397 | Various | Various | Various | Various | Various |
81 Main Street White Plains, NY | 1984 | 125,000 | Worby Vecchio Edelman, LLP | 4,385 | Mar. 2022 | $31.50 | Mod. Gross |
12 Greenridge Avenue White Plains, NY | 1973 | 24,816 | ELQ Industries | 1,271 | Oct. 2021 | $32.00 | Mod. Gross |
2 Overhill Road Scarsdale, NY | 1954 | 62,000 | Pelvic Rehabilitation Medicine | 1,817 | Apr. 2021 | $34.00 | Mod. Gross |
220-244 Westchester Avenue West Harrison, NY | 1983 | 85,000 | Northwell Health | 4,761 | Jan. 2021 | $32.00 | Mod. Gross |
50 Main Street White Plains, NY | 1980s | 300,806 | Luskin, Stern & Eisler, LLP | 6,101 | Oct. 2020 | $40.50 | Mod. Gross |
120 White Plains Road Tarrytown, NY | 1982 | 211,442 | Allstate Insurance | 14,890 | Jul. 2019 | $29.50 | Mod. Gross |
Source: Appraisal.
| (1) | Information based on the underwritten rent roll other than year built. |
Escrows.
Real Estate Taxes – At origination the One Bridge Street Borrower was required to deposit $382,192 into a reserve for real estate taxes. On each monthly payment date, the One Bridge Street Borrower is required to deposit into a reserve for real estate taxes an amount equal to 1/12 of the real estate taxes that the lender estimates will be payable during the next twelve months for the One Bridge Street Property (currently approximately $95,548).
Insurance – On each monthly payment date, the One Bridge Street Borrower is required to deposit into a reserve for insurance premiums an amount equal to 1/12 of the insurance premiums that the lender estimates will be payable for the renewal of coverage upon the expiration of the insurance policies. Notwithstanding the foregoing, the One Bridge Street Borrower is not required to reserve for insurance premiums, provided that (i) no event of default is continuing under the One Bridge Street Mortgage Loan documents, (ii) the liability and casualty insurance coverage for the One Bridge Street Property is included in blanket policies approved by the lender in its reasonable discretion, and (iii) the One Bridge Street Borrower provides the lender with evidence of renewal of the policies and paid receipts for the payment of the insurance premiums by no later than 10 days prior to the expiration date of the policies.
Replacement Reserve – On each monthly payment date, the One Bridge Street Borrower is required to deposit approximately $3,376 into a reserve for capital expenditures. Notwithstanding the foregoing, so long as no event of default is then continuing, the One Bridge Street Borrower will not be required to make such monthly deposits at any time the amount of funds then on deposit in such reserve exceeds approximately $40,510.
TI/LC Reserve – The One Bridge Street Borrower (i) was required to deposit with the lender on the origination date the sum of $300,000 and (ii) is required on each monthly payment date to deposit approximately $25,319, in each case into a reserve for tenant improvements and leasing commissions (the “TI/LC Reserve”). Notwithstanding the foregoing, so long as no event of default is then continuing and the debt service coverage ratio equals or exceeds 2.05x, the One Bridge Street Borrower will not be required to make such monthly deposits at any time the amount of funds then on deposit in the TI/LC Reserve (after deduction of any pending disbursement requests) exceeds $500,000.
| THE INFORMATION IN THIS STRUCTURAL AND COLLATERAL TERM SHEET IS NOT COMPLETE AND MAY BE AMENDED PRIOR TO THE TIME OF SALE. THIS TERM SHEET IS NOT AN OFFER TO SELL THESE SECURITIES AND IT IS NOT A SOLICITATION OF AN OFFER TO BUY THESE SECURITIES IN ANY JURISDICTION WHERE THE OFFER OR SALE IS NOT PERMITTED. | ||
| ||
| Office – Suburban | Loan #6 | Cut-off Date Balance: | $52,000,000 | |
| 1 Bridge Street | One Bridge Street | Cut-off Date LTV: | 52.0% | |
| Irvington, NY 10533 | UW NCF DSCR: | 2.19x | ||
| UW NOI Debt Yield: | 11.3% |
Lockbox and Cash Management. The One Bridge Street Mortgage Loan is structured with a hard lockbox and in place cash management. All rents are required to be deposited into a lender-controlled lockbox account. The One Bridge Street Mortgage Loan requires that the One Bridge Street Borrower deliver tenant direction letters to the tenants directing tenants to pay all rents into the lockbox account, and if the One Bridge Street Borrower or property manager receives rents from the One Bridge Street Property despite such direction, to deposit such rents into the lockbox account within two business days of receipt. All funds in the lockbox account are required to be swept on each business day into a lender-controlled cash management account, to be applied, provided no event of default is continuing under the One Bridge Street Mortgage Loan, (i) to make the monthly deposits into the tax and insurance reserve funds, as described above under “Escrows,” (ii) to pay debt service on the One Bridge Street Mortgage Loan, (iii) to make monthly deposits into the Replacement Reserve account and the TI/LC Reserve as described above under “Escrows,” (iv) if a Cash Sweep Event Period (as defined below) is continuing, to pay monthly operating expenses in the amount set forth in the lender-approved annual budget and lender approved extraordinary expenses, and (v) to apply any funds remaining in the cash management account after the application described above (x) if a Cash Sweep Event Period exists, to be deposited into an excess cash flow reserve to be held as additional collateral for the One Bridge Street Mortgage Loan during the continuance of such Cash Sweep Event Period and (y) otherwise, to be disbursed to the One Bridge Street Borrower.
A “Cash Sweep Event Period” will commence upon the earliest of the following: (i) the occurrence of an event of default, (ii) the interest only debt service coverage ratio on the One Bridge Street Mortgage Loan being less than 1.70x for any calendar quarter and (iii) the continuance of a Specified Tenant Trigger Event Period (as defined below).
A Cash Sweep Event Period will end: with regard to clause (i) above, upon the cure of such event of default; with regard to clause (ii) above, when the interest only debt service coverage ratio on the One Bridge Street Mortgage Loan is at least 1.70x for two consecutive calendar quarters; and with regard to clause (iii) above, when a Specified Tenant Trigger Event Period is no longer continuing.
“Specified Tenant Trigger Event Period” means a period: (A) commencing upon the first to occur of (i) any bankruptcy or similar insolvency of a Specified Tenant (as defined below); (ii) a Specified Tenant failing to be in actual, physical possession of the Specified Tenant space (or applicable portion thereof) or failing to be open for business and/or “going dark” in the Specified Tenant space (or applicable portion thereof); (iii) Specified Tenant giving notice that it intends to vacate, cancel or terminate its space or not renew its lease; and (iv) 12 months prior to a Specified Tenant’s lease expiration date in the event such Specified Tenant has failed to extend or renew its Specified Tenant lease on terms and conditions reasonably acceptable to the lender; provided, however, with respect to clauses (iii) and (iv) (collectively a “Specified Tenant Lease Expiration Event”) no Specified Tenant Trigger Event Period will commence if, at the time of each such event, the debt service coverage ratio is greater than 2.05x; and (B) expiring upon the first to occur of the lender’s receipt of reasonably acceptable evidence (which must include, without limitation, a duly executed estoppel certificate from the applicable Specified Tenant in form and substance reasonably acceptable to the lender) of: (1) the satisfaction of the Specified Tenant Cure Conditions (as defined below) or (2) the One Bridge Street Borrower leasing the entire Specified Tenant space (or applicable portion thereof) to one or more replacement tenants in accordance with the applicable terms and conditions of the loan documents, and the applicable replacement tenant(s) being in actual, physical occupancy of their leased space and paying full, unabated rent. Notwithstanding the foregoing, a Specified Tenant Trigger Event Period with respect to a Specified Tenant Lease Expiration Event will cease if at any time the debt service coverage ratio is greater than 2.05x for two consecutive quarters. In addition, a Specified Tenant Lease Expiration Event may be cured by delivery to the lender of a letter of credit in an amount which, if applied to the outstanding principal amount of the One Bridge Street Mortgage Loan at the time of delivery of such letter of credit, would cause the debt service coverage ratio to be at least 2.05x.
“Specified Tenant Cure Conditions” means each of the following, as applicable: (i) with respect to any applicable bankruptcy or insolvency proceedings involving the applicable Specified Tenant and/or the applicable Specified Tenant lease, the applicable Specified Tenant (x) is no longer insolvent or subject to any bankruptcy or insolvency proceedings and did not reject its lease or (y) has affirmed the applicable Specified Tenant lease pursuant to final, non-appealable order of a court of competent jurisdiction; (ii) with respect to any Specified Tenant vacating or failing to be open for business or “going dark,” the applicable Specified Tenant is in actual, physical possession of the Specified Tenant space, and not “dark” in the Specified Tenant space; and (iii) with respect to a Specified Tenant Lease Expiration Event, the applicable Specified Tenant (x)has renewed or extended its Specified Tenant lease on terms and conditions reasonably acceptable to the lender, (y) has revoked all notices to vacate, terminate or cancel the applicable Specified Tenant lease and (z) is paying full unabated rent due under its lease.
“Specified Tenant” means, (i) Eileen Fisher, Inc. – Two Bridge Street or any replacement tenant of its premises, and (ii) any other tenant which, individually or when aggregated with its affiliates, leases in excess of 37,000 square feet or more of the One Bridge Street Property’s gross leasable area. As of the origination date, Eileen Fisher Inc. – One Bridge Street, was not deemed to be a Specified Tenant. However, in the event Eileen Fisher, Inc. – One Bridge Street, individually or when aggregated with its affiliates (other than Eileen Fisher Inc. – Two Bridge Street), amends, restates, supplements or otherwise modifies its lease such that Eileen Fisher, Inc. – One Bridge Street, individually or when aggregated with its affiliates (other than Eileen Fisher, Inc. – Two Bridge Street) leases in excess of 5% or more of the One Bridge Street Property’s gross leasable area (excluding any retail space leased by Eileen Fisher, Inc. – One Bridge Street) as determined by the lender in the lender’s sole but reasonable discretion, Eileen Fisher, Inc. – One Bridge Street will become a Specified Tenant.
Property Management. The One Bridge Street Property is managed by Cushman & Wakefield, Inc., a third party property manager.
Partial Release. Not permitted.
| THE INFORMATION IN THIS STRUCTURAL AND COLLATERAL TERM SHEET IS NOT COMPLETE AND MAY BE AMENDED PRIOR TO THE TIME OF SALE. THIS TERM SHEET IS NOT AN OFFER TO SELL THESE SECURITIES AND IT IS NOT A SOLICITATION OF AN OFFER TO BUY THESE SECURITIES IN ANY JURISDICTION WHERE THE OFFER OR SALE IS NOT PERMITTED. | ||
| ||
| Office – Suburban | Loan #6 | Cut-off Date Balance: | $52,000,000 | |
| 1 Bridge Street | One Bridge Street | Cut-off Date LTV: | 52.0% | |
| Irvington, NY 10533 | UW NCF DSCR: | 2.19x | ||
| UW NOI Debt Yield: | 11.3% |
Real Estate Substitution. Not permitted.
Subordinate and Mezzanine Indebtedness. Not permitted.
Letter of Credit. None; provided that a letter of credit may be delivered to cure a Specified Tenant Lease Expiration Event as described above under “Lockbox and Cash Management.”
Right of First Offer / Right of First Refusal. None.
Ground Lease. None.
Terrorism Insurance. The One Bridge Street Borrower is required to obtain and maintain an “all risk” property insurance policy that covers terrorist acts in an amount equal to the “full replacement cost” of the One Bridge Street Property together with 18 months of business income insurance, plus an extended period of indemnity of up to six months. Notwithstanding the foregoing, for so long as the Terrorism Risk Insurance Act of 2002, as extended and modified by the Terrorism Risk Insurance Program Reauthorization Act of 2015 (“TRIPRA”), is in effect (including any extensions thereof or if another federal governmental program is in effect relating to “acts of terrorism” which provides substantially similar protections as TRIPRA), the lender is required to accept terrorism insurance which insures against “covered acts” as defined by TRIPRA (or such other program) but only in the event that TRIPRA (or such other program) continues to cover both domestic and foreign acts of terrorism. See “Risk Factors—Risks Relating to the Mortgage Loans—Terrorism Insurance May Not Be Available for All Mortgaged Properties” in the Preliminary Prospectus.
| THE INFORMATION IN THIS STRUCTURAL AND COLLATERAL TERM SHEET IS NOT COMPLETE AND MAY BE AMENDED PRIOR TO THE TIME OF SALE. THIS TERM SHEET IS NOT AN OFFER TO SELL THESE SECURITIES AND IT IS NOT A SOLICITATION OF AN OFFER TO BUY THESE SECURITIES IN ANY JURISDICTION WHERE THE OFFER OR SALE IS NOT PERMITTED. | ||
| ||
| Retail – Anchored | Loan #7 | Cut-off Date Balance: | $50,000,000 | |
405 Route 3 Clifton, NJ 07014
| Clifton Commons | Cut-off Date LTV: U/W NCF DSCR: U/W NOI Debt Yield: | 69.3% 1.51x 9.1% |
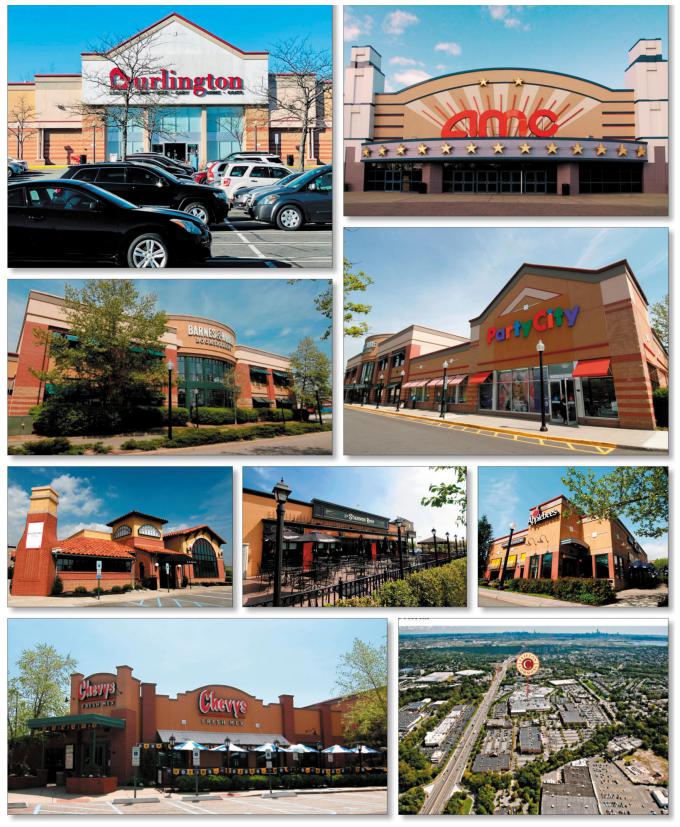
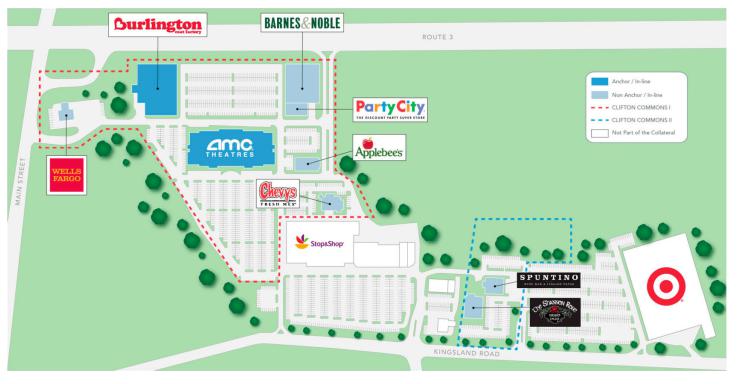

| THE INFORMATION IN THIS STRUCTURAL AND COLLATERAL TERM SHEET IS NOT COMPLETE AND MAY BE AMENDED PRIOR TO THE TIME OF SALE. THIS TERM SHEET IS NOT AN OFFER TO SELL THESE SECURITIES AND IT IS NOT A SOLICITATION OF AN OFFER TO BUY THESE SECURITIES IN ANY JURISDICTION WHERE THE OFFER OR SALE IS NOT PERMITTED. | ||
| ||
| No. 7 – Clifton Commons |
| Mortgage Loan Information | Mortgaged Property Information | |||||
| Mortgage Loan Seller: | Wells Fargo Bank, National Association | Single Asset/Portfolio: | Single Asset | |||
Credit Assessment (Fitch/KBRA/Moody’s): | NR/NR/NR | Property Type – Subtype: | Retail – Anchored | |||
| Original Principal Balance: | $50,000,000 | Location: | Clifton, NJ | |||
| Cut-off Date Balance: | $50,000,000 | Size: | 187,794 SF | |||
| % of Initial Pool Balance: | 4.6% | Cut-off Date Balance Per SF: | $266.25 | |||
| Loan Purpose: | Refinance | Maturity Date Balance Per SF: | $266.25 | |||
| Borrower Sponsor: | The Related Companies, L.P. | Year Built/Renovated: | 1999; 2003/NAP | |||
| Guarantor: | The Related Companies, L.P. | Title Vesting: | Fee/Leasehold | |||
| Mortgage Rate: | 5.5690% | Property Manager: | Related Management Company, L.P. (borrower affiliate) | |||
| Note Date: | May 6, 2022 | Current Occupancy (As of): | 100.0% (5/5/2022) | |||
| Seasoning: | 3 months | YE 2021 Occupancy: | 100.0% | |||
| Maturity Date: | May 11, 2032 | YE 2020 Occupancy: | 100.0% | |||
| IO Period: | 120 months | YE 2019 Occupancy: | 100.0% | |||
| Loan Term (Original): | 120 months | As-Is Appraised Value: | $72,200,000 | |||
| Amortization Term (Original): | NAP | As-Is Appraised Value Per SF: | $384.46 | |||
| Loan Amortization Type: | Interest Only | As-Is Appraisal Valuation Date: | March 22, 2022 | |||
| Call Protection: | L(27),D(89),O(4) | |||||
| Lockbox Type: | Hard / Springing Cash Management | Underwriting and Financial Information(2) | ||||
| Additional Debt: | None | TTM NOI (4/30/2022): | $4,473,150 | |||
| Additional Debt Type (Balance): | NAP | YE 2021 NOI(3): | $4,141,100 | |||
| YE 2020 NOI(3): | $4,940,891 | |||||
| YE 2019 NOI: | $4,769,430 | |||||
| U/W Revenues: | $8,066,189 | |||||
| U/W Expenses: | $3,498,397 | |||||
| Escrows and Reserves(1) | U/W NOI: | $4,567,792 | ||||
| Initial | Monthly | Cap | U/W NCF: | $4,256,747 | ||
| Taxes | $131,284 | $131,284 | NAP | U/W DSCR based on NOI/NCF: | 1.62x / 1.51x | |
| Insurance | $0 | Springing | NAP | U/W Debt Yield based on NOI/NCF: | 9.1% / 8.5% | |
| Replacement Reserves | $0 | $3,130 | $187,794 | U/W Debt Yield at Maturity based on NOI/NCF: | 9.1% / 8.5% | |
| TI/LC | $0 | $27,387 | $328,640 | Cut-off Date LTV Ratio: | 69.3% | |
| Existing TI/LC Obligations | $110,000 | $0 | NAP | LTV Ratio at Maturity: | 69.3% | |
| Sources and Uses | |||||||
| Sources | Uses | ||||||
| Original mortgage loan amount | $50,000,000 | 98.4 | % | Loan payoff(4) | $49,973,817 | 98.4 | % |
| Cash equity | 802,606 | 1.6 | Closing costs | 587,505 | 1.2 | ||
| Upfront reserves | 241,284 | 0.4 | |||||
| Total Sources | $50,802,606 | 100.0 | % | Total Uses | $50,802,606 | 100.0 | % |
| (1) | See “Escrows” section. |
| (2) | While the Clifton Commons Mortgage Loan (defined below) was originated after the emergence of the novel coronavirus pandemic and the economic disruption resulting from measures to combat the pandemic, the pandemic is an evolving situation and could impact the Clifton Commons Mortgage Loan more severely than assumed in the underwriting and could adversely affect the NOI, NCF and occupancy information, as well as the appraised value and the DSCR, LTV and Debt Yield metrics presented above. See “Risk Factors— Risks Related to Market Conditions and Other External Factors—Coronavirus Pandemic Has Adversely Affected the Global Economy and Will Likely Adversely Affect the Performance of the Mortgage Loans” in the Preliminary Prospectus. |
| (3) | The decrease from YE 2020 NOI to YE 2021 NOI is primarily driven by a $176,014 collection loss in 2021 and increased repairs and maintenance expenses in 2021. Please see “Operating History and Underwritten Net Cash Flow” below for additional information. |
| (4) | The Loan payoff includes the payoff (and corresponding costs) of a prior loan secured by the Clifton Commons Property (as defined below) that was securitized in the UBSBB 2012-C4 securitization trust. |
The Mortgage Loan. The seventh largest mortgage loan (the “Clifton Commons Mortgage Loan”) is evidenced by a promissory note in the original principal amount of $50,000,000 and secured by the first priority fee and leasehold interest in an anchored retail property located in Clifton, New Jersey (the “Clifton Commons Property”).
The Borrowers and Borrower Sponsor. The borrowers are Clifton Commons I, L.L.C. and Clifton II, LLC, each a Delaware limited liability company and single purpose entity with two independent directors. Legal counsel to the borrowers delivered a non-consolidation
| THE INFORMATION IN THIS STRUCTURAL AND COLLATERAL TERM SHEET IS NOT COMPLETE AND MAY BE AMENDED PRIOR TO THE TIME OF SALE. THIS TERM SHEET IS NOT AN OFFER TO SELL THESE SECURITIES AND IT IS NOT A SOLICITATION OF AN OFFER TO BUY THESE SECURITIES IN ANY JURISDICTION WHERE THE OFFER OR SALE IS NOT PERMITTED. | ||
| ||
| Retail – Anchored | Loan #7 | Cut-off Date Balance: | $50,000,000 | |
405 Route 3 Clifton, NJ 07014
| Clifton Commons | Cut-off Date LTV: U/W NCF DSCR: U/W NOI Debt Yield: | 69.3% 1.51x 9.1% |
opinion in connection with the origination of the Clifton Commons Mortgage Loan. The borrower sponsor and non-recourse carveout guarantor is The Related Companies, L.P., a New York limited partnership (“Related”).
Founded by Stephen M. Ross in 1972, Related is a privately owned, fully integrated and diversified real estate company with experience in development, acquisition, management, finance, marketing and sales. Headquartered in New York City, Related has over 45 years of experience and a real estate portfolio valued at over $60 billion. Related’s operating portfolio consists of a diversified mix of properties including 32 multifamily rental buildings with over 13,000 apartments, over 30 million square feet of commercial space, 5,500 luxury condominium residences and approximately 60,000 affordable and workforce housing units located throughout the United States. Related’s portfolio includes retail properties in New York City, Los Angeles, Chicago, San Francisco, Boston and West Palm Beach, Florida. Related has disclosed 12 prior foreclosures and defaults, primarily driven by the great recession. See “Description of the Mortgage Pool—Loan Purpose; Default History, Bankruptcy Issues and Other Proceedings” in the Preliminary Prospectus.
The Property. The Clifton Commons Property is an anchored retail center, located in Clifton, New Jersey consisting of eight, one-story buildings totaling 187,794 square feet, comprising Clifton Commons I and Clifton Commons II (defined below). The Clifton Commons Property is part of the larger Clifton Commons Shopping Center, and is anchored by a non-collateral Target and Stop & Shop. Built in 1999, Clifton Commons I is situated on a 21.8-acre site and consists of a freestanding 16-screen AMC Theaters, Barnes & Noble, Burlington and Party City, along with the outparcel tenants Wells Fargo, Chevy’s Fresh Mex and Applebee’s (“Clifton Commons I”). The outparcel tenants own their buildings situated on land pads leased from the borrowers. In addition to the improvements at Clifton Commons I, the borrowers ground lease a portion of the land from Target Corporation (“Clifton Commons II”) and sublease the land to two restaurant tenants (The Shannon Rose and Spuntino Wine Bar & Italian Tapas) that constructed their improvements on the premises (see the “Ground Lease” section below for additional details). Such improvements were originally constructed in 2003 and are situated on a 14.0-acre site (gross with Target). Collectively, the borrowers’ interest in Clifton Commons I and Clifton Commons II makes up the Clifton Commons Property. The Clifton Commons Property contains 2,164 surface parking spaces, resulting in a parking ratio of 11.5 spaces per 1,000 SF of rentable area.
As of May 5, 2022, the Clifton Commons Property was 100.0% leased to 9 tenants. It has been 100.0% leased since 2004, with the exception of 2016, when The Sports Authority, Inc. vacated and occupancy dropped to 77.0%. The space was subsequently backfilled by Burlington on a lease commencing in February 2017.
Major Tenants.
AMC Theaters (65,043 SF; 34.6% of NRA; 32.1% of underwritten base rent). AMC Theaters has been a tenant since 1999 and has a lease expiring in May 2024 with five, five-year renewal options remaining. The tenant may terminate its lease, with one year’s notice, if tenant’s cash flow is less than $500,000 for two consecutive years or negative for one year, with a termination fee equal to 80.0% of the remaining lease payments, discounted to present value at an interest rate equal to 2% over the rate of US Treasury obligations for a term equal to the period of time between termination and the end of the lease term. The entity on the lease is American Multi-Cinema, Inc.
Burlington (44,506 SF; 23.7% of NRA; 22.4% of underwritten base rent). Burlington has been a tenant since 2017 and has a lease expiring in February 2028 with three, five-year renewal options remaining. The entity on the lease is Burlington Coat Factory of New Jersey, LLC and the lease Guarantor is Burlington Coat Factory Warehouse Corporation.
Barnes & Noble (35,658 SF; 19.0% of NRA; 21.6% of underwritten base rent). Barnes & Noble has been a tenant since 1999 and has a lease expiring in May 2034 with no renewal options remaining. Barnes & Noble executed a 10-year renewal in May 2021, which extended the lease term from May 2024 to May 2034. The entity on the lease is Barnes & Noble Booksellers, Inc.
COVID-19 Update. As of May 6, 2022, the Clifton Commons Property was open and operational. Five tenants, representing 49.4% of the net rentable area and 45.8% of the underwritten rent, have outstanding rent deferrals in the approximate aggregate amount of $1.3 million that are expected to be paid back by July 2024. This includes AMC Theaters, which represents 34.6% of the net rentable area and 32.1% of the underwritten rent, which deferred $1.3 million of rent in 2020 which is expected to be repaid in 36 equal monthly installments from July 2021 to July 2024.
| THE INFORMATION IN THIS STRUCTURAL AND COLLATERAL TERM SHEET IS NOT COMPLETE AND MAY BE AMENDED PRIOR TO THE TIME OF SALE. THIS TERM SHEET IS NOT AN OFFER TO SELL THESE SECURITIES AND IT IS NOT A SOLICITATION OF AN OFFER TO BUY THESE SECURITIES IN ANY JURISDICTION WHERE THE OFFER OR SALE IS NOT PERMITTED. | ||
| ||
| Retail – Anchored | Loan #7 | Cut-off Date Balance: | $50,000,000 | |
405 Route 3 Clifton, NJ 07014
| Clifton Commons | Cut-off Date LTV: U/W NCF DSCR: U/W NOI Debt Yield: | 69.3% 1.51x 9.1% |
The following table presents certain information relating to the tenancy at the Clifton Commons Property:
Major Tenants
| Tenant Name | Credit Rating (Fitch/ Moody’s/ | Tenant NRSF | % of NRSF | Annual U/W Base Rent PSF(2) | Annual U/W Base Rent(2) | % of Total Annual U/W Base Rent | Lease Expiration Date | Ext. Options | Term. Option (Y/N) |
| Major Tenants | |||||||||
| AMC Theaters | NR/Caa2/CCC+ | 65,043 | 34.6% | $25.92 | $1,685,915 | 32.1% | 5/31/2024 | 5, 5-year | Y(3) |
| Burlington | NR/NR/BB+ | 44,506 | 23.7% | $26.40 | $1,174,958 | 22.4% | 2/29/2028 | 3, 5-year | N |
| Barnes & Noble | NR/NR/NR | 35,658 | 19.0% | $31.78 | $1,133,248 | 21.6% | 5/31/2034 | None | N |
| Party City | B-/NR/NR | 11,071 | 5.9% | $35.00 | $387,485 | 7.4% | 4/30/2029 | 2, 5-year | N |
| 156,278 | 83.2% | $28.04 | $4,381,606 | 83.4% | |||||
| Non-Major Tenants(4) | 31,516 | 16.8% | $27.72 | $873,738 | 16.6% | ||||
| Occupied Collateral Total | 187,794 | 100.0% | $27.98 | $5,255,344 | 100.0% | ||||
| Vacant Space | 0 | 0.0% | |||||||
| Collateral Total | 187,794 | 100.0% | |||||||
| (1) | Certain ratings are those of the parent company whether or not the parent company guarantees the lease. |
| (2) | Annual U/W Base Rent PSF and Annual U/W Base Rent include contractual rent steps through May 2023 totaling $123,562. |
| (3) | AMC Theaters may terminate its lease, with one year’s notice, if its cash flow is less than $500,000 for two consecutive years or negative for one year, with a termination fee equal to 80.0% of the remaining lease payments, discounted to present value at an interest rate equal to 2% over the rate on the date of termination of US Treasury obligations for a term equal to the period of time between termination and the end of the term. |
| (4) | Non-Major Tenants includes Chevy’s Fresh Mex, Applebee’s, Wells Fargo, Spuntino Wine Bar & Italian Tapas, and The Shannon Rose, each of which owns its respective building situated on such land pad leased from the borrowers. |
The following table presents a summary of sales and occupancy costs for certain tenants at the Clifton Commons Property.
Tenant Sales(1)(2)
| 2017 Sales (PSF) | 2018 Sales (PSF) | 2019 Sales (PSF) | 2020 Sales (PSF) | Most Recent TTM Sales (PSF) | Occupancy Cost(3) | |
| AMC Theaters(4) | $808,234 | $919,792 | $943,191 | $300,017 | $290,723 | 57.0% |
| Burlington(5) | $168 | $408 | $446 | $292 | $551 | 7.3% |
| Barnes & Noble(6) | NAV | $238 | $246 | $209 | $198 | 16.0% |
| (1) | Information obtained from the borrowers. |
| (2) | Tenants shown on the Tenant Summary table above and not included on the Tenant Sales table are not required to report sales. |
| (3) | Occupancy cost based on underwritten base rent and any applicable reimbursements divided by most recent reported sales. |
| (4) | AMC Theaters sales are shown on a per screen basis. Most Recent TTM Sales (PSF) are as of October 2021. |
| (5) | Most Recent TTM Sales (PSF) are as of December 2021. |
| (6) | Most Recent TTM Sales (PSF) are as of April 2021. |
| THE INFORMATION IN THIS STRUCTURAL AND COLLATERAL TERM SHEET IS NOT COMPLETE AND MAY BE AMENDED PRIOR TO THE TIME OF SALE. THIS TERM SHEET IS NOT AN OFFER TO SELL THESE SECURITIES AND IT IS NOT A SOLICITATION OF AN OFFER TO BUY THESE SECURITIES IN ANY JURISDICTION WHERE THE OFFER OR SALE IS NOT PERMITTED. | ||
| ||
| Retail – Anchored | Loan #7 | Cut-off Date Balance: | $50,000,000 | |
405 Route 3 Clifton, NJ 07014
| Clifton Commons | Cut-off Date LTV: U/W NCF DSCR: U/W NOI Debt Yield: | 69.3% 1.51x 9.1% |
The following table presents certain information relating to the lease rollover schedule at the Clifton Commons Property:
Lease Expiration Schedule(1)(2)
| Year Ending December 31, | No. of Leases Expiring | Expiring NRSF | % of Total NRSF | Cumulative Expiring NRSF | Cumulative % of Total NRSF | Annual U/W Base Rent | % of Total Annual U/W Base Rent | Annual U/W Base Rent PSF |
| MTM | 0 | 0 | 0.0% | 0 | 0.0% | $0 | 0.0% | $0.00 |
| 2022 | 0 | 0 | 0.0% | 0 | 0.0% | $0 | 0.0% | $0.00 |
| 2023 | 0 | 0 | 0.0% | 0 | 0.0% | $0 | 0.0% | $0.00 |
| 2024 | 2 | 68,855 | 36.7% | 68,855 | 36.7% | $1,839,653 | 35.0% | $26.72 |
| 2025 | 0 | 0 | 0.0% | 68,855 | 36.7% | $0 | 0.0% | $0.00 |
| 2026 | 0 | 0 | 0.0% | 68,855 | 36.7% | $0 | 0.0% | $0.00 |
| 2027 | 0 | 0 | 0.0% | 68,855 | 36.7% | $0 | 0.0% | $0.00 |
| 2028 | 1 | 44,506 | 23.7% | 113,361 | 60.4% | $1,174,958 | 22.4% | $26.40 |
| 2029 | 3 | 24,353 | 13.0% | 137,714 | 73.3% | $717,485 | 13.7% | $29.46 |
| 2030 | 0 | 0 | 0.0% | 137,714 | 73.3% | $0 | 0.0% | $0.00 |
| 2031 | 0 | 0 | 0.0% | 137,714 | 73.3% | $0 | 0.0% | $0.00 |
| 2032 | 0 | 0 | 0.0% | 137,714 | 73.3% | $0 | 0.0% | $0.00 |
| Thereafter | 3 | 50,080 | 26.7% | 187,794 | 100.0% | $1,523,248 | 29.0% | $30.42 |
| Vacant | 0 | 0 | 0.0% | 187,794 | 100.0% | $0 | 0.0% | $0.00 |
| Total/Weighted Average | 9 | 187,794 | 100.0% | $5,255,344 | 100.0% | $27.98 |
| (1) | Information obtained from the underwritten rent roll. |
| (2) | Certain tenants may have lease termination options that are exercisable prior to the originally stated expiration date of the related lease and are not considered in the rollover schedule. |
The following table presents historical occupancy percentages at the Clifton Commons Property:
Historical Occupancy
12/31/2019(1) | 12/31/2020(1) | 12/31/2021(1) | 5/5/2022(2) |
| 100.0% | 100.0% | 100.0% | 100.0% |
| (1) | Information obtained from the borrowers. |
| (2) | Information obtained from the underwritten rent roll. |
| THE INFORMATION IN THIS STRUCTURAL AND COLLATERAL TERM SHEET IS NOT COMPLETE AND MAY BE AMENDED PRIOR TO THE TIME OF SALE. THIS TERM SHEET IS NOT AN OFFER TO SELL THESE SECURITIES AND IT IS NOT A SOLICITATION OF AN OFFER TO BUY THESE SECURITIES IN ANY JURISDICTION WHERE THE OFFER OR SALE IS NOT PERMITTED. | ||
| ||
| Retail – Anchored | Loan #7 | Cut-off Date Balance: | $50,000,000 | |
405 Route 3 Clifton, NJ 07014
| Clifton Commons | Cut-off Date LTV: U/W NCF DSCR: U/W NOI Debt Yield: | 69.3% 1.51x 9.1% |
Operating History and Underwritten Net Cash Flow. The following table presents certain information relating to the historical operating performance and underwritten net cash flow at the Clifton Commons Property:
Cash Flow Analysis
| 2019 | 2020 | 2021 | TTM 4/30/2022 | U/W | %(1) | U/W $ per SF | |
| Base Rent | $4,759,153 | $4,835,051 | $4,705,757 | $5,111,315 | $5,131,782 | 61.6% | $27.33 |
| Rent Steps(2) | 0 | 0 | 0 | 0 | 123,562 | 1.5 | 0.66 |
| Free Rent Adjustment & Collection Loss | 0 | 0 | (176,014) | (176,014) | 0 | 0.0 | 0.00 |
| Grossed Up Vacant Space | 0 | 0 | 0 | 0 | 0 | 0.0 | 0.00 |
| Gross Potential Rent | $4,759,153 | $4,835,051 | $4,529,743 | $4,935,301 | $5,255,344 | 63.1% | $27.98 |
| Other Income | 108,228 | 118,083 | 118,724 | 119,658 | 130,989 | 1.6 | 0.70 |
| Percentage Rent | 84,940 | 43,158 | 23,656 | 163,269 | 261,415 | 3.1 | 1.39 |
| Total Recoveries | 4,161,122 | 3,293,008 | 3,491,102 | 3,250,741 | 2,681,209 | 32.2 | $14.28 |
| Net Rental Income | $9,113,443 | $8,289,300 | $8,163,225 | $8,468,969 | $8,328,956 | 100.0% | $44.35 |
| (Vacancy & Credit Loss) | 0 | 0 | 0 | 0 | (262,767)(3) | (5.0) | (1.40) |
| Effective Gross Income | $9,113,443 | $8,289,300 | $8,163,225 | $8,468,969 | $8,066,189 | 96.8% | $42.95 |
| Real Estate Taxes | $1,945,609 | $1,959,521 | $1,953,100 | $1,950,960 | $1,624,601 | 20.1% | $8.65 |
| Insurance | 52,868 | 66,288 | 83,037 | 88,704 | 95,911 | 1.2 | 0.51 |
| Management Fee | 380,060 | 278,802 | 383,786 | 420,256 | 241,986 | 3.0 | 1.29 |
| Other Operating Expenses | 1,965,476 | 1,043,798 | 1,602,202 | 1,535,899 | 1,535,899 | 19.0 | 8.18 |
| Total Operating Expenses | $4,344,013 | $3,348,409 | $4,022,125 | $3,995,819 | $3,498,397 | 43.4% | $18.63 |
| Net Operating Income | $4,769,430 | $4,940,891(4) | $4,141,100(4) | $4,473,150 | $4,567,792 | 56.6% | $24.32 |
| Replacement Reserves | 0 | 0 | 0 | 0 | 37,559 | 0.5 | 0.20 |
| TI/LC | 0 | 0 | 0 | 0 | 273,487 | 3.4 | 1.46 |
| Net Cash Flow | $4,769,430 | $4,940,891 | $4,141,100 | $4,473,150 | $4,256,747 | 52.8% | $22.67 |
| NOI DSCR | 1.69x | 1.75x | 1.47x | 1.58x | 1.62x | ||
| NCF DSCR | 1.69x | 1.75x | 1.47x | 1.58x | 1.51x | ||
| NOI Debt Yield | 9.5% | 9.9% | 8.3% | 8.9% | 9.1% | ||
| NCF Debt Yield | 9.5% | 9.9% | 8.3% | 8.9% | 8.5% |
| (1) | Represents (i) percent of Net Rental Income for all revenue fields, (ii) percent of Gross Potential Rent for Vacancy & Credit Loss and (iii) percent of Effective Gross Income for all other fields. |
| (2) | Represents contractual rent steps through May 2023. |
| (3) | The underwritten economic vacancy is 5.0%. The Clifton Commons Property was 100.0% occupied as of May 5, 2022. |
| (4) | The decrease from YE 2020 NOI to YE 2021 NOI is primarily driven by a $176,014 collection loss in 2021 and increased repairs and maintenance expenses in 2021. |
Appraisal. The appraiser concluded to an “as-is” Appraised Value for the Clifton Commons Property of $72,200,000 as of March 22, 2022.
Environmental Matters. According to the Phase I environmental site assessment dated March 14, 2022, there was no evidence of any recognized environmental conditions at the Clifton Commons Property. The environmental report identified a controlled recognized environmental condition relating to the property adjacent to the Clifton Commons Property being formerly equipped with 10 underground storage tanks which were reportedly removed between January 1957 and March 1990, with a No Further Action-A (Unrestricted Use) letter issued by the New Jersey Department of Environmental Protection on May 26, 1992. See “Description of the Mortgage Pool—Environmental Considerations” in the Preliminary Prospectus for additional information.
Market Overview and Competition. The Clifton Commons Property is located along State Route 3 in Clifton, Passaic County, New Jersey, approximately 12.9 miles west of Manhattan and 12.2 miles northwest of Jersey City, NJ. The Clifton Commons Property is situated along State Route 3, which provides access eastbound to New York. NJ State Route 21, which provides access southbound to Newark, NJ, is approximately 1.0 miles east of the Clifton Commons Property. According to the appraisal, State Route 3, is a heavily traveled roadway that contains a mixture of retail and commercial developments. Multifamily and single family residential homes are positioned along surrounding arterials. Additionally, the Clifton Commons Property is located approximately 11.1 miles northeast of Newark Liberty International Airport.
According to a third-party market research provider, the estimated April 2022 population within a three- and five-mile radius was approximately 245,493 and 605,233, respectively, and the average household income within the same radii was $107,702 and $105,174, respectively.
| THE INFORMATION IN THIS STRUCTURAL AND COLLATERAL TERM SHEET IS NOT COMPLETE AND MAY BE AMENDED PRIOR TO THE TIME OF SALE. THIS TERM SHEET IS NOT AN OFFER TO SELL THESE SECURITIES AND IT IS NOT A SOLICITATION OF AN OFFER TO BUY THESE SECURITIES IN ANY JURISDICTION WHERE THE OFFER OR SALE IS NOT PERMITTED. | ||
| ||
| Retail – Anchored | Loan #7 | Cut-off Date Balance: | $50,000,000 | |
405 Route 3 Clifton, NJ 07014
| Clifton Commons | Cut-off Date LTV: U/W NCF DSCR: U/W NOI Debt Yield: | 69.3% 1.51x 9.1% |
According to a third-party market research report, the Clifton Commons Property is located within the Route 3/GSP submarket of the New York - NY retail market. As of April 26, 2022, the submarket reported total inventory of approximately 8.2 million SF with a 2.2% vacancy rate and average asking rent of $22.58 PSF. Vacancy has averaged 3.8% from 2010 to 2021, with a high of 5.0% in 2016. Additionally, no new supply is under construction or expected to be delivered in the next eight calendar quarters. The appraiser concluded to market rents for the Clifton Commons Property ranging from $22.00 PSF for anchor space to $40.00 PSF for bank branch pad outparcel space (see table below).
The following table presents certain information relating to the appraiser’s market rent conclusions for the Clifton Commons Property:
Market Rent Summary(1)
| Movie Theater | Retail > 25,000 SF | Retail < 25,000SF | Bank Branch Pad | Retail Pad | |
| Market Rent (PSF) | $22.00 | $25.00 | $35.00 | $40.00 | $30.00 |
| Lease Term (Years) | 20 | 15 | 15 | 20 | 15 |
Lease Type (Reimbursements) | Net | Net | Net | Net | Net |
| Rent Increase Projection | 10.0%/5 year | 2.0%/year | 2.0%/year | 10.0%/5 year | 2.0%/year |
| (1) | Information obtained from the appraisal. |
The table below presents certain information relating to comparable sales pertaining to the Clifton Commons Property identified by the appraiser:
Comparable Sales(1)
Property Name | Location | Rentable Area (SF) | Sale Date | Sale Price | Sale Price (PSF) |
| Clifton Commons | 405 Route 3 Clifton, NJ | 187,794(2) | |||
| Cortlandt Crossing Shopping Center | 3144 E Main Street-US Route 6 Mohegan Lake, NY | 122,225 | 2/2022 | $65,882,735 | $539.03 |
| Midstate Mall | 300 State Route 18 East Brunswick, NJ | 380,000 | 12/21 | $70,700,000 | $186.05 |
| Wegmans Shopping Center | 34 Sylvan Way Parsippany, NJ | 133,276 | 9/2021 | $46,000,000 | $345.15 |
| Shops at Richmond Plaza | 2505 and 2535 Richmond Avenue Staten Island, NY | 76,140 | 3/2020 | $31,500,000 | $413.71 |
| Kearny Square | 160-196 Passaic Avenue Kearny, NJ | 138,895 | 6/2018 | $45,500,000 | $327.59 |
| Wall Towne Center | 2433-2455 State Route 34 Manasquan, NJ | 96,000 | 5/2018 | $41,500,000 | $432.29 |
| (1) | Information obtained from the appraisal. |
| (2) | Per underwritten rent roll. |
| THE INFORMATION IN THIS STRUCTURAL AND COLLATERAL TERM SHEET IS NOT COMPLETE AND MAY BE AMENDED PRIOR TO THE TIME OF SALE. THIS TERM SHEET IS NOT AN OFFER TO SELL THESE SECURITIES AND IT IS NOT A SOLICITATION OF AN OFFER TO BUY THESE SECURITIES IN ANY JURISDICTION WHERE THE OFFER OR SALE IS NOT PERMITTED. | ||
| ||
| Retail – Anchored | Loan #7 | Cut-off Date Balance: | $50,000,000 | |
405 Route 3 Clifton, NJ 07014
| Clifton Commons | Cut-off Date LTV: U/W NCF DSCR: U/W NOI Debt Yield: | 69.3% 1.51x 9.1% |
Escrows.
Real Estate Taxes – The loan documents require an upfront deposit of $131,284 for real estate taxes and ongoing monthly deposits of $131,284.
Insurance – The loan documents require ongoing monthly insurance reserves in an amount equal to 1/12th of the insurance premiums that the lender estimates will be payable for the renewal of the coverage afforded by the policies. Notwithstanding the above, the borrowers’ obligation to make insurance reserve payments will be waived so long as the insurance policies maintained by the borrowers are part of a blanket or umbrella policy approved by the lender in its reasonable discretion.
Replacement Reserve – The loan documents require ongoing monthly replacement reserve deposits of $3,130 ($0.20 per square foot per year) subject to a cap of $187,794.
Leasing Reserve – The loan documents require ongoing monthly reserves of $27,387 ($1.75 per square foot per year) for tenant improvements and leasing commissions, subject to a cap of $328,640.
Existing TI/LC Obligations – The loan documents require an upfront deposit of $110,000 for outstanding tenant improvements and leasing commissions related to Barnes & Noble.
Lockbox and Cash Management. The Clifton Commons Mortgage Loan is structured with a hard lockbox and springing cash management. The borrowers are required to deposit all rents within two business days of receipt, and to direct all tenants to make direct rent deposits into the lockbox account. As long as a Cash Trap Event Period (as defined below) is not in effect, all funds in the lockbox account are required to be distributed to the borrowers. During a Cash Trap Event Period, all excess funds in the lockbox account are required to be swept to a lender-controlled cash management account and applied in accordance with the cash flow waterfall in the loan documents. During the continuance of a Cash Trap Event Period, all excess cash flow will be held by the lender as additional cash collateral for the Clifton Commons Mortgage Loan.
A “Cash Trap Event Period” will commence upon the earliest of the following:
| (i) | the occurrence of an event of default; |
| (ii) | the net cash flow debt yield (“NCF DY”) falling below 7.0%, tested quarterly; |
| (iii) | AMC Theaters failing to exercise its extension option by February 28, 2023 (or 15 months prior to the then-current expiration date) or the lease otherwise being terminated for any reason; or |
| (iv) | Burlington providing notice to the borrowers that it does not intend to exercise its renewal option or the lease otherwise being terminated for any reason. |
A Cash Trap Event Period will end upon the occurrence of the following:
| ● | with regard to clause (i), the cure of such event of default; |
| ● | with regard to clause (ii), the NCF DY being greater than or equal to 7.5% for two consecutive calendar quarters; |
| ● | with regard to clause (iii), (a) AMC Theaters renewing or extending the term of its lease pursuant to the terms set forth in the lease or otherwise for at least the same period as it would have been if the applicable extension option had been exercised or (b) the lender having received reasonably satisfactory evidence via an estoppel certificate, that substantially all of the demised space pursuant to the AMC Theaters lease has been leased to one or more replacement tenants reasonably satisfactory to the lender, the tenant has taken occupancy of its entire premises and has commenced paying full, unabated rent and all tenant improvement costs and leasing commissions having been paid (or reserved for). |
| ● | with regard to clause (iv), (a) Burlington renewing or extending the term of its lease pursuant to the terms set forth in the lease or otherwise for at least the same period as it would have been if the applicable extension option had been exercised or (b) the lender having received reasonably satisfactory evidence via an estoppel certificate, that substantially all of the demised space pursuant to the Burlington lease has been leased to one or more replacement tenants reasonably satisfactory to the lender, the tenant has taken occupancy of its entire premises and has commenced paying full, unabated rent and all tenant improvement costs and leasing commissions having been paid (or reserved for). |
Property Management. The Clifton Commons Property is managed by Related Management Company, L.P., a New York limited partnership, an affiliate of the borrowers.
Partial Release. Not permitted.
Real Estate Substitution. Not permitted.
Subordinate and Mezzanine Indebtedness. None.
Ground Lease. The borrower sponsor has a leasehold interest from the abutting Target Corporation retail store (“Target”). The related ground lease expires in 2101, with a 98-year renewal option, and otherwise provides for de minimis rent (total rent of $10, which has been paid in advance). In addition, the borrowers pay their pro rata share of real estate taxes to Target, and pay their pro rata share of common area maintenance to Related Retail Management Corporation, as operator (which maintains the shopping center). The borrowers have entered into sub-ground leases with two restaurants, The Shannon Rose and Spuntino Wine Bar & Italian Tapas, each having constructed their respective improvements. Besides the two pad sites, the borrowers’ leasehold parcel also includes additional parking. The borrowers’ shared expenses with Target relating to the leasehold parcel have been included in loan underwriting.
| THE INFORMATION IN THIS STRUCTURAL AND COLLATERAL TERM SHEET IS NOT COMPLETE AND MAY BE AMENDED PRIOR TO THE TIME OF SALE. THIS TERM SHEET IS NOT AN OFFER TO SELL THESE SECURITIES AND IT IS NOT A SOLICITATION OF AN OFFER TO BUY THESE SECURITIES IN ANY JURISDICTION WHERE THE OFFER OR SALE IS NOT PERMITTED. | ||
| ||
| Retail – Anchored | Loan #7 | Cut-off Date Balance: | $50,000,000 | |
405 Route 3 Clifton, NJ 07014
| Clifton Commons | Cut-off Date LTV: U/W NCF DSCR: U/W NOI Debt Yield: | 69.3% 1.51x 9.1% |
Terrorism Insurance. The loan documents require that the “all risk” insurance policy required to be maintained by the borrowers provides coverage for terrorism in an amount equal to the full replacement cost of the Clifton Commons Property, as well as business interruption insurance covering no less than the 18-month period following the occurrence of a casualty event, together with a 6-month extended period of indemnity (provided that if TRIPRA or a similar statute is not in effect, the borrowers will not be obligated to pay terrorism insurance premiums in excess of two times the premium for the casualty and business interruption coverage on a stand-alone basis (without giving effect to the cost of terrorism, flood and earthquake and business interruption components of such coverage)).
The Clifton Commons Mortgage Loan documents provide that required terrorism insurance may be written by a non-rated captive insurer owned by The Related Companies, L.P., subject to certain conditions, including, among other things: (i) TRIPRA is in full force and effect; (ii) the terrorism policy issued by such captive insurer, together with any other qualified terrorism policies in-place, provide per occurrence limit in an amount not less than replacement cost and rent loss coverage as otherwise required; (iii) covered losses that are not reinsured by the federal government under TRIPRA and paid to the captive insurer are reinsured with a cut-through endorsement by an insurance company rated S&P “A-”/ A.M. Best “A-:VIII” or better; (iv) all reinsurance agreements between the captive insurer and other reinsurance providers are reasonably acceptable to the lender; (v) such captive insurer shall not be subject to a bankruptcy or similar insolvency proceeding; (vi) such captive insurer is licensed in the State of Vermont or other jurisdiction to the extent reasonably approved by the lender and qualified to issue the terrorism policy in accordance with applicable legal requirements; and (vii) the related policy will not contain a provision that terrorism coverage will expire or be excluded or limited in the event TRIPRA expires or is no longer in effect, so long as an insurance policy that does not contain such a provision is commercially available. See “Risk Factors—Risks Relating to the Mortgage Loans—Terrorism Insurance May Not Be Available for All Mortgaged Properties” in the Preliminary Prospectus.
| THE INFORMATION IN THIS STRUCTURAL AND COLLATERAL TERM SHEET IS NOT COMPLETE AND MAY BE AMENDED PRIOR TO THE TIME OF SALE. THIS TERM SHEET IS NOT AN OFFER TO SELL THESE SECURITIES AND IT IS NOT A SOLICITATION OF AN OFFER TO BUY THESE SECURITIES IN ANY JURISDICTION WHERE THE OFFER OR SALE IS NOT PERMITTED. | ||
| ||
| Office – CBD | Loan #8 | Cut-off Date Balance: | $46,200,000 | |
| 1000 Woodward Avenue | One Campus Martius | Cut-off Date LTV: | 60.1% | |
| Detroit, MI 48226 | U/W NCF DSCR: | 1.74x | ||
| U/W NOI Debt Yield: | 11.5% |
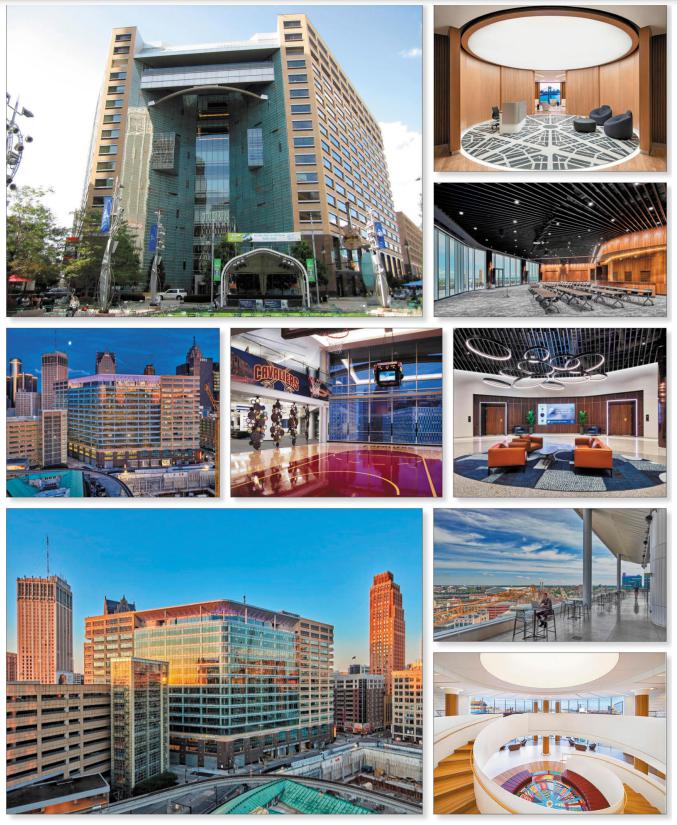
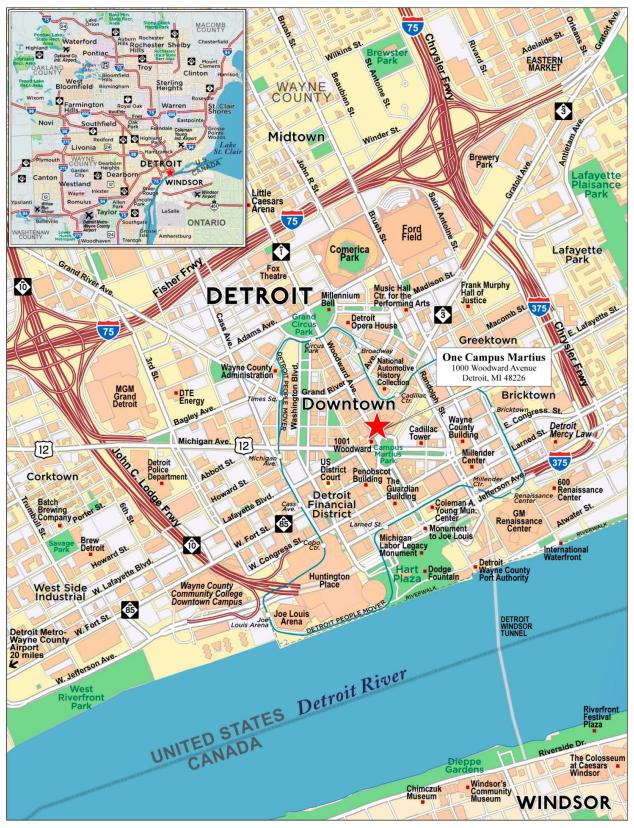
| THE INFORMATION IN THIS STRUCTURAL AND COLLATERAL TERM SHEET IS NOT COMPLETE AND MAY BE AMENDED PRIOR TO THE TIME OF SALE. THIS TERM SHEET IS NOT AN OFFER TO SELL THESE SECURITIES AND IT IS NOT A SOLICITATION OF AN OFFER TO BUY THESE SECURITIES IN ANY JURISDICTION WHERE THE OFFER OR SALE IS NOT PERMITTED. | ||
| ||
| No. 8 – One Campus Martius |
| Mortgage Loan Information | Mortgaged Property Information | |||||
| Mortgage Loan Seller: | Morgan Stanley Mortgage Capital Holdings LLC | Single Asset/Portfolio: | Single Asset | |||
| Credit Assessment (Fitch/KBRA/Moody’s): | NR/NR/NR | Property Type – Subtype: | Office – CBD | |||
| Original Principal Balance(1): | $46,200,000 | Location: | Detroit, MI | |||
| Cut-off Date Balance(1): | $46,200,000 | Size: | 1,356,325 SF | |||
| % of Initial Pool Balance: | 4.2% | Cut-off Date Balance Per SF(1): | $160.73 | |||
| Loan Purpose: | Refinance | Maturity Date Balance Per SF(1): | $160.73 | |||
| Borrower Sponsor: | Bedrock Detroit | Year Built/Renovated: | 2003/2019-2020 | |||
| Guarantor: | Rock Backer LLC | Title Vesting: | Fee | |||
| Mortgage Rate: | 6.0200% | Property Manager(5): | Bedrock Management Services LLC (borrower affiliated) | |||
| Note Date: | June 28, 2022 | Current Occupancy (As of): | 86.8% (6/27/2022) | |||
| Seasoning: | 1 month | TTM 3/31/2022 Occupancy: | 90.0% | |||
| Maturity Date: | July 1, 2032 | YE 2021 Occupancy(6): | 89.3% | |||
| IO Period: | 120 months | YE 2020 Occupancy(6): | 76.5% | |||
| Loan Term (Original): | 120 months | YE 2019 Occupancy(6): | 97.4% | |||
| Amortization Term (Original): | NAP | As-Is Appraised Value(7): | $362,500,000 | |||
| Loan Amortization Type: | Interest Only | As-Is Appraised Value Per SF(7): | $267.27 | |||
| Call Protection(2): | L(25),D(91),O(4) | As-Is Appraisal Valuation Date: | May 4, 2022 | |||
| Lockbox Type(3): | Hard/Springing Cash Management | |||||
| Additional Debt(1): | Yes | Underwriting and Financial Information(8) | ||||
| Additional Debt Type (Balance)(1): | Pari Passu ($171,800,000) | TTM NOI (3/31/2022): | $25,554,085 | |||
| YE 2021 NOI(9): | $25,025,321 | |||||
| YE 2020 NOI(9): | $18,537,846 | |||||
| YE 2019 NOI: | $19,338,306 | |||||
| U/W Revenues: | $46,224,574 | |||||
| U/W Expenses: | $21,145,889 | |||||
| Escrows and Reserves(4) | U/W NOI: | $25,078,685 | ||||
| Initial | Monthly | Cap | U/W NCF: | $23,186,453 | ||
| Taxes: | $3,926,163 | $560,880 | NAP | U/W DSCR based on NOI/NCF(1): | 1.88x / 1.74x | |
| Insurance: | $0 | Springing | NAP | U/W Debt Yield based on NOI/NCF(1): | 11.5% / 10.6% | |
| Replacement Reserve: | $28,230 | $28,230 | $677,530 | U/W Debt Yield at Maturity based on NOI/NCF(1): | 11.5% / 10.6% | |
| TI/LC: | $1,500,000 | $169,541 | $4,000,000 | Cut-off Date LTV Ratio(1): | 60.1% | |
| Outstanding TI/LC: | $3,851,373 | $0 | NAP | LTV Ratio at Maturity(1): | 60.1% | |
| Sources and Uses | |||||||
| Sources | Uses | ||||||
| Whole Loan Amount | $218,000,000 | 100.0% | Payoff of Existing Debt | $187,609,949 | 86.1 | % | |
| Return of Equity | 19,720,871 | 9.0 | |||||
| Reserves | 9,305,766 | 4.3 | |||||
| Closing Costs | 1,363,413 | 0.6 | |||||
| Total Sources | $218,000,000 | 100.0% | Total Uses | $218,000,000 | 100.0 | % | |
| (1) | The One Campus Martius Mortgage Loan (as defined below) is part of the One Campus Martius Whole Loan (as defined below), with an aggregate original principal amount of $218,000,000. The Cut-off Date Balance Per SF, Maturity Date Balance Per SF, U/W DSCR based on NOI/NCF, U/W Debt Yield based on NOI/NCF, U/W Debt Yield at Maturity based on NOI/NCF, Cut-off Date LTV Ratio and LTV Ratio at Maturity numbers presented above are based on the One Campus Martius Whole Loan. |
| (2) | Defeasance of the One Campus Martius Whole Loan is permitted at any time after the end of the two-year period commencing on the closing date of the securitization of the last promissory note of the One Campus Martius Whole Loan to be securitized (the “Permitted Defeasance Date”). If the Permitted Defeasance Date has not occurred by September 1, 2024, the One Campus Martius Whole Loan may be prepaid in whole at any time prior to the Permitted Defeasance Date with the payment of a prepayment fee equal to the greater of 1.0% of the amount prepaid and a yield maintenance premium. The assumed defeasance lockout period of 25 payments is based on the closing date of this transaction in August 2022. |
| (3) | The One Campus Martius Whole Loan is structured with a hard lockbox for the One Campus Martius Property (as defined below) other than with respect to the Parking Garage Portion (as defined below), the income from which is not required to be deposited into the lockbox account until the occurrence of a Cash Sweep Event (as defined below). |
| (4) | See “Escrows” below for further discussion of reserve requirements. |
| (5) | The Parking Garage Portion is sub-managed by Ultimate Parking Management LLC, a third-party management company. |
| (6) | In 2020, the One Campus Martius Property completed a 398,215 square foot expansion at an estimated cost of approximately $93.0 million, which resulted in a drop in occupancy from 2019 to 2020. The increase in occupancy from 2020 to 2021 is a result of the subsequent lease up of the expansion space. |
| (7) | The appraised value is based on the extraordinary assumption that all outstanding tenant improvements and leasing commissions have been paid. At origination, $3,851,373 was reserved for outstanding tenant improvements and leasing commissions. |
| (8) | The novel coronavirus pandemic is an evolving situation and could impact the One Campus Martius Whole Loan more severely than assumed in the underwriting of the One Campus Martius Whole Loan and could adversely affect the NOI, NCF and occupancy information, as well as the appraised value and the DSCR, LTV and Debt Yield metrics presented above and herein. See “Risk Factors—Risks Related to Market Conditions and Other External Factors—The Coronavirus Pandemic Has Adversely Affected the Global Economy and Will Likely Adversely Affect the Performance of the Mortgage Loans” in the Preliminary Prospectus. |
| (9) | The increase from 2020 NOI to 2021 NOI is primarily attributable to the delivery of the 398,215 square foot expansion space, and subsequent lease up. |
| THE INFORMATION IN THIS STRUCTURAL AND COLLATERAL TERM SHEET IS NOT COMPLETE AND MAY BE AMENDED PRIOR TO THE TIME OF SALE. THIS TERM SHEET IS NOT AN OFFER TO SELL THESE SECURITIES AND IT IS NOT A SOLICITATION OF AN OFFER TO BUY THESE SECURITIES IN ANY JURISDICTION WHERE THE OFFER OR SALE IS NOT PERMITTED. | ||
| ||
| Office – CBD | Loan #8 | Cut-off Date Balance: | $46,200,000 | |
| 1000 Woodward Avenue | One Campus Martius | Cut-off Date LTV: | 60.1% | |
| Detroit, MI 48226 | U/W NCF DSCR: | 1.74x | ||
| U/W NOI Debt Yield: | 11.5% |
The Mortgage Loan. The eighth largest mortgage loan (the “One Campus Martius Mortgage Loan”) is part of a whole loan (the “One Campus Martius Whole Loan”) evidenced by eight pari passu promissory notes with an aggregate original principal amount of $218,000,000. The One Campus Martius Whole Loan was co-originated on June 28, 2022, by JPMorgan Chase Bank, National Association (“JPCMB”) and Morgan Stanley Bank, N.A. The One Campus Martius Whole Loan is secured by a first priority fee mortgage encumbering a 1,356,325 square foot office property located in Detroit, Michigan (the “One Campus Martius Property”). The One Campus Martius Mortgage Loan is evidenced by the non-controlling Note A-6 with an original principal balance of $46,200,000. The remaining notes comprising the One Campus Martius Whole Loan are summarized in the table below. The One Campus Martius Whole Loan is expected to be serviced pursuant to the pooling and servicing agreement for the Benchmark 2022-B36 securitization trust. See “Description of the Mortgage Pool—The Whole Loans—The Non-Serviced Pari Passu Whole Loans” and “Pooling and Servicing Agreement—Servicing of the Non-Serviced Mortgage Loans” in the Preliminary Prospectus.
Whole Loan Note Summary
| Notes | Original Balance | Cut-off Date Balance | Note Holder | Controlling Piece |
| A-1 | $50,000,000 | $50,000,000 | JPMCB | Y |
| A-2 | $30,000,000 | $30,000,000 | JPMCB | N |
| A-3 | $25,000,000 | $25,000,000 | JPMCB | N |
| A-4 | $15,800,000 | $15,800,000 | JPMCB | N |
| A-5 | $10,000,000 | $10,000,000 | JPMCB | N |
| A-6 | $46,200,000 | $46,200,000 | BANK 2022-BNK43 | N |
| A-7 | $25,000,000 | $25,000,000 | Morgan Stanley Bank, N.A. | N |
| A-8 | $16,000,000 | $16,000,000 | Morgan Stanley Bank, N.A. | N |
| Total | $218,000,000 | $218,000,000 |
The Borrower and the Borrower Sponsors. The borrower for the One Campus Martius Whole Loan is 1000 Webward LLC, a Delaware limited liability company and a single purpose bankruptcy-remote entity with two independent directors in its organizational structure. Legal counsel to the borrower delivered a non-consolidation opinion in connection with the origination of the One Campus Martius Whole Loan. The borrower sponsor for the One Campus Martius Whole Loan is Bedrock Detroit, which is owned and controlled by Daniel (“Dan”) Gilbert and affiliated entities, and the non-recourse carveout guarantor is Rock Backer LLC, which is owned and controlled by Dan Gilbert and affiliates. Bedrock Detroit, a full service commercial real estate firm, specializing in the development of urban core areas, is one of the largest real estate companies in downtown Detroit. Since being founded in 2011, Bedrock Detroit and its affiliates have invested and committed to acquiring and developing more than 100 properties, including new construction of ground up developments in downtown Detroit and Cleveland totaling more than 20 million square feet. Bedrock Detroit’s real estate personnel provide a range of services with in-house teams for leasing, acquisition, finance, construction, architecture, historic rehabilitation, and property management. Bedrock Detroit’s tenants include technology companies and startups, restaurants and national retailers, as well as Detroit locals. Bedrock Detroit also leases mixed-income residential properties to individuals, and acquires and renovates properties for new development. Dan Gilbert and Rocket Companies Inc. and Rock Holdings Inc, each of which is controlled by Dan Gilbert, are named defendants in a consolidated federal class action lawsuit filed in the Eastern District of Michigan in 2021, alleging, among other things, violations by the defendants of securities laws relating to alleged misstatements made during earnings calls and insider trading with respect to the sale of Rocket Companies Inc. stock in March 2021 by Rock Holdings Inc. See “Description of the Mortgage Pool—Litigation and Other Considerations” in the Preliminary Prospectus.
The Property. The One Campus Martius Property is a Class A, 16-story, 1,356,325 square foot office building that is located in Detroit’s financial district. Built in 2003 and renovated between 2019-2020, the One Campus Martius Property contains an atrium, onsite retail and restaurants, a fitness and wellness center, a second-floor cafeteria, a day care facility led by Bright Horizons, along with a 12-story parking garage with 2,667 parking spaces, resulting in a parking ratio of approximately 2.0 spaces per 1,000 square feet of net rentable area. The One Campus Martius Property includes 40,538 square feet of ground floor retail space (approximately 3.0% of NRA and 2.8% of underwritten base rent), featuring tenants including Sugar Factory, Tohme Brothers XXXII LLC (Jimmy Johns), and Detroit Water Ice Factory, Inc. The borrower sponsor acquired the One Campus Martius Property in 2014 for approximately $142.0 million and has since invested approximately $120.5 million into capital improvements. More recently, between 2019 and 2020, the One Campus Martius Property completed a 398,215 square foot expansion at an estimated cost of approximately $93.0 million. The recent expansion added office space, event space and new amenity space to the One Campus Martius Property. From 2015 through 2019, prior to the expansion, average occupancy at the One Campus Martius Property was approximately 97.5%. As of June 27, 2022, the One Campus Martius Property was 86.8% leased, as the One Campus Martius Property continues to lease up following the addition of 398,215 square feet (approximately 29.4% of NRA) in 2020.
The One Campus Martius Property is subject to a condominium structure which is wholly owned and controlled by the borrower. Under the One Campus Martius Whole Loan documents, at all times during the term of the One Campus Martius Whole Loan, the condominium is required to be controlled by the borrower.
As of June 27, 2022, the One Campus Martius Property was 86.8% leased to 28 tenants. Approximately 22.9% of net rentable area and 27.8% of underwritten rent are attributable to investment grade rated tenants including Microsoft Corporation, Meridian Health, Huntington National Bank, and BMC Software Inc. The tenant roster at the One Campus Martius Property is predominately comprised of tenants in the financial and healthcare sector. The One Campus Martius Property benefits from long-term tenancy and a weighted
| THE INFORMATION IN THIS STRUCTURAL AND COLLATERAL TERM SHEET IS NOT COMPLETE AND MAY BE AMENDED PRIOR TO THE TIME OF SALE. THIS TERM SHEET IS NOT AN OFFER TO SELL THESE SECURITIES AND IT IS NOT A SOLICITATION OF AN OFFER TO BUY THESE SECURITIES IN ANY JURISDICTION WHERE THE OFFER OR SALE IS NOT PERMITTED. | ||
| ||
| Office – CBD | Loan #8 | Cut-off Date Balance: | $46,200,000 | |
| 1000 Woodward Avenue | One Campus Martius | Cut-off Date LTV: | 60.1% | |
| Detroit, MI 48226 | U/W NCF DSCR: | 1.74x | ||
| U/W NOI Debt Yield: | 11.5% |
average remaining lease term of approximately 4.5 years as of the Cut-off Date. Borrower sponsor affiliated tenants, including Rocket Mortgage, Rock Ventures, StockX LLC, Building Amenities Wellness Center LLC, Building Amenities Cafeteria LLC, and Building Amenities Day Care LLC account for approximately 55.7% of the One Campus Martius Property’s net rentable area and 63.1% of occupied underwritten rent.
The One Campus Martius Property is one of four properties (the “Transformational Project Sites”) developed or re-developed by Bedrock Management Services, LLC (the “Developer”), a borrower sponsor affiliate, which has entered into a reimbursement agreement (the “Reimbursement Agreement”), with the City of Detroit Brownfield Redevelopment Authority, the Michigan Strategic Fund and the Michigan Department of Treasury. The Reimbursement Agreement entitles the Developer to receive reimbursements for a certain portion of the cost of the developments of the Transformational Project Sites from certain tax revenues as well as sales and use tax exemptions. The borrower does not benefit from such reimbursements. The lender’s underwriting and all metrics shown herein are exclusive of the benefits afforded to the Developer pursuant to the Reimbursement Agreement. See “Description of the Mortgage Pool – Real Estate and Other Tax Considerations” in the Preliminary Prospectus for additional information.
Major Tenants.
Rocket Mortgage (570,214 square feet, 42.0% of net rentable area, 47.4% of underwritten rent). Rocket Mortgage (NYSE: RKT) is a large mortgage lending company in the United States which operates its corporate headquarters out of the One Campus Martius Property. Rocket Mortgage was formerly known as Quicken Loans prior to changing its name in 2021. Rocket Mortgage was founded by Dan Gilbert in 1985 and is affiliated with the borrower sponsor. In 2010, Dan Gilbert moved Rocket Mortgage’s headquarters from Livonia, Michigan to downtown Detroit. Rocket Mortgage operates a number of subsidiary companies such as Amrock, Rocket Auto, Core Digital Media, Rock Ventures and Rock Connections, among others. In 2021, Rocket Mortgage reportedly generated approximately $12.9 billion in revenue and posted net income of approximately $6.1 billion. Rocket Mortgage has a lease expiration date occurring on December 31, 2028 with four, five-year renewal options remaining.
Meridian Health (266,001 square feet, 19.6% of net rentable area, 21.5% of underwritten rent). Meridian Health (NYSE: CNC) provides government-based health plans (Medicare, Medicaid and the Health Insurance Marketplace) in Michigan, Illinois and Ohio. Meridian Health was purchased by WellCare Health Plans in 2018. WellCare Health Plans later merged with Centene Corporation in 2020 allowing Centene Corporation to expand its footprint to reach over 24 million members in all 50 states. Centene Corporation is headquartered in St. Louis, Missouri, while its subsidiary Meridian Health is headquartered at the One Campus Martius Property. Meridian Health has been at the One Campus Martius Property since December 2014. Centene Corporation reported that in 2021 it generated over $125.9 billion in revenue and posted net income of approximately $1.3 billion. Meridian Health has a lease expiration date occurring on December 31, 2024, with four, five-year renewal options remaining.
Rock Ventures (66,059 square feet, 4.9% of net rentable area, 6.0% of underwritten rent). Rock Ventures is a borrower sponsor affiliated holding company for Dan Gilbert’s portfolio of companies (which includes, but is not limited to, companies such as the Cleveland Cavaliers, Rocket Mortgage, StockX and Vroom) and operates its headquarters out of the One Campus Martius Property. The companies owned by Rock Ventures span various industries including fintech, professional services, charitable/community relations, sports/media/entertainment, hotels, and venture capital/private equity. Rock Ventures was founded in 1985 and since then has committed to over 103 investments. Rock Ventures has a lease expiration date occurring on December 31, 2028 with four, five-year renewal options remaining.
| THE INFORMATION IN THIS STRUCTURAL AND COLLATERAL TERM SHEET IS NOT COMPLETE AND MAY BE AMENDED PRIOR TO THE TIME OF SALE. THIS TERM SHEET IS NOT AN OFFER TO SELL THESE SECURITIES AND IT IS NOT A SOLICITATION OF AN OFFER TO BUY THESE SECURITIES IN ANY JURISDICTION WHERE THE OFFER OR SALE IS NOT PERMITTED. | ||
| ||
| Office – CBD | Loan #8 | Cut-off Date Balance: | $46,200,000 | |
| 1000 Woodward Avenue | One Campus Martius | Cut-off Date LTV: | 60.1% | |
| Detroit, MI 48226 | U/W NCF DSCR: | 1.74x | ||
| U/W NOI Debt Yield: | 11.5% |
The following table presents certain information relating to the major tenants at the One Campus Martius Property:
Major Tenants(1)
| Tenant Name | Credit Rating (Moody’s/ S&P/Fitch)(2) | Tenant NRSF | % of NRSF | Annual U/W Base Rent PSF | Annual U/W Base Rent | % of Total Annual U/W Base Rent | Lease Expiration Date | Extension Options | Term. Option (Y/N) |
| Major Tenants | |||||||||
| Rocket Mortgage(3)(4) | Ba1/BB+/BB+ | 570,214 | 42.0% | $28.81 | $16,427,828 | 47.4% | 12/31/2028 | Y(8) | N |
| Meridian Health(5) | Ba1/BBB-/BBB- | 266,001 | 19.6% | $28.00 | $7,448,028 | 21.5% | 12/31/2024 | Y(9) | N |
| Rock Ventures(4) | NR/NR/NR | 66,059 | 4.9% | $31.50 | $2,080,859 | 6.0% | 12/31/2028 | Y(10) | N |
| Building Amenities Wellness Center LLC(6) | NR/NR/NR | 50,116 | 3.7% | $28.00 | $1,403,248 | 4.0% | 12/31/2035 | N | N |
| Microsoft Corporation | Aaa/AAA/AAA | 43,795 | 3.2% | $28.56 | $1,250,759 | 3.6% | 7/31/2025 | Y(11) | N |
| Total Major Tenants | 996,185 | 73.4% | $28.72 | $28,610,722 | 82.5% | ||||
| Non-Major Tenants(6)(7) | 181,611 | 13.4% | $33.32 | $6,052,080 | 17.5% | ||||
| Occupied Collateral Total | 1,177,796 | 86.8% | $29.43 | $34,662,802 | 100.0% | ||||
| Vacant Space | 178,529 | 13.2% | |||||||
| Collateral Total | 1,356,325 | 100.0% | |||||||
| (1) | Information is based on the underwritten rent roll, inclusive of contractual rent steps through June 1, 2023 and straight-line average rent over the lease term for Microsoft Corporation due to its investment grade rating. |
| (2) | Certain ratings are those of the parent company whether or not the parent company guarantees the lease. |
| (3) | Rocket Mortgage currently subleases approximately 29,684 square feet of office space to StockX LLC, an affiliate, through December 31, 2024 at $27.50 per square foot. Such space was underwritten based on the prime lease rent. |
| (4) | Borrower sponsor affiliated. |
| (5) | Meridian Health U/W Base Rent PSF is inclusive of an approximately $700,000 per year data rack usage fees. |
| (6) | Amenity space is associated with affiliates of the borrower sponsor. |
| (7) | Includes signage space leased to StockX LLC and a data rack leased to BMC Software, Inc. with no attributable net rentable area. |
| (8) | Rocket Mortgage may elect to renew its lease for four, five-year periods. |
| (9) | Meridian Health may elect to renew its lease for four, five-year periods. |
| (10) | Rock Ventures may elect to renew its lease for four, five-year periods. |
| (11) | Microsoft Corporation may elect to renew its lease for two, five-year periods. |
The following table presents certain information relating to the lease rollover schedule at the One Campus Martius Property:
Lease Expiration Schedule(1)(2)
| Year Ending December 31, | No. of Leases Expiring | Expiring NRSF | % of Total NRSF | Cumulative Expiring NRSF | Cumulative % of Total NRSF | Annual U/W Base Rent(3) | % of Total Annual U/W Base Rent(3) | Annual U/W Base Rent PSF(2)(3) |
| MTM | 1 | 0 | 0.0% | 0 | 0.0% | $10,000 | 0.0% | $0.00 |
| 2022 | 3 | 5,853 | 0.4% | 5,853 | 0.4% | $114,904 | 0.3% | $19.63 |
| 2023 | 4 | 33,991 | 2.5% | 39,844 | 2.9% | $1,169,437 | 3.4% | $34.40 |
| 2024 | 5 | 272,016 | 20.1% | 311,860 | 23.0% | $8,268,942 | 23.9% | $30.40 |
| 2025 | 1 | 43795 | 3.2% | 355,655 | 26.2% | $1,250,759 | 3.6% | $28.56 |
| 2026 | 7 | 25,650 | 1.9% | 381,305 | 28.1% | $831,819 | 2.4% | $32.43 |
| 2027 | 1 | 4,189 | 0.3% | 385,494 | 28.4% | $119,638 | 0.3% | $28.56 |
| 2028 | 2 | 636,273 | 46.9% | 1,021,767 | 75.3% | $18,508,687 | 53.4% | $29.09 |
| 2029 | 0 | 0 | 0.0% | 1,021,767 | 75.3% | $0 | 0.0% | $0.00 |
| 2030 | 0 | 0 | 0.0% | 1,021,767 | 75.3% | $0 | 0.0% | $0.00 |
| 2031 | 0 | 0 | 0.0% | 1,021,767 | 75.3% | $0 | 0.0% | $0.00 |
| 2032 | 1 | 7,617 | 0.6% | 1,029,384 | 75.9% | $233,080 | 0.7% | $30.60 |
| Thereafter(4) | 4 | 148,412 | 10.9% | 1,177,796 | 86.8% | $4,155,536 | 12.0% | $28.00 |
| Vacant | 0 | 178,529 | 13.2% | 1,356,325 | 100.0% | $0 | 0.0% | $0.00 |
| Total/Wtd. Avg. | 29 | 1,356,325 | 100.0% | $34,662,802 | 100.0% | $29.43 |
| (1) | Information is based on the underwritten rent roll, inclusive of contractual rent steps through June 1, 2023 and straight-line average rent over the lease term for Microsoft Corporation due to its investment grade rating. |
| (2) | Certain tenants may have lease termination options that are exercisable prior to the stated expiration date of the subject lease or leases that are not considered in the lease expiration schedule. |
| (3) | Total Annual U/W Base Rent per square foot excludes vacant space. |
| (4) | Includes 148,412 square feet of cafeteria, wellness, day care and event amenity space that is associated with affiliates of the borrower sponsor. All amenity space is set to expire in 2035. |
| THE INFORMATION IN THIS STRUCTURAL AND COLLATERAL TERM SHEET IS NOT COMPLETE AND MAY BE AMENDED PRIOR TO THE TIME OF SALE. THIS TERM SHEET IS NOT AN OFFER TO SELL THESE SECURITIES AND IT IS NOT A SOLICITATION OF AN OFFER TO BUY THESE SECURITIES IN ANY JURISDICTION WHERE THE OFFER OR SALE IS NOT PERMITTED. | ||
| ||
| Office – CBD | Loan #8 | Cut-off Date Balance: | $46,200,000 | |
| 1000 Woodward Avenue | One Campus Martius | Cut-off Date LTV: | 60.1% | |
| Detroit, MI 48226 | U/W NCF DSCR: | 1.74x | ||
| U/W NOI Debt Yield: | 11.5% |
The following table presents historical occupancy percentages at the One Campus Martius Property:
Historical Occupancy
12/31/2019(1) | 12/31/2020(1)(2) | 12/31/2021(1) | 3/31/2022(1) | 6/27/2022(3) |
| 97.4% | 76.5% | 89.3% | 90.0% | 86.8% |
| (1) | Information obtained from the borrower sponsor. |
| (2) | Expansion space was delivered in 2020, which increased vacancy. |
| (3) | Information based on the underwritten rent roll dated June 27, 2022. |
Operating History and Underwritten Net Cash Flow. The following table presents certain information relating to the historical operating performance and underwritten net cash flow at the One Campus Martius Property:
Cash Flow Analysis
| 2019 | 2020 | 2021 | TTM 3/31/2022 | U/W | %(1) | U/W $ per SF | |
| Base Rent(2) | $26,180,074 | $25,935,421 | $33,372,181 | $34,425,490 | $34,662,802 | 65.0% | $25.56 |
| Vacant Income | 0 | 0 | 0 | 0 | 5,355,870 | 10.0 | 3.95 |
| Gross Potential Rent | $26,180,074 | $25,935,421 | $33,372,181 | $34,425,490 | $40,018,672 | 75.0% | $29.51 |
| Reimbursements | 5,028,329 | 3,377,400 | 2,912,952 | 2,944,892 | 3,992,858 | 7.5 | 2.94 |
| Parking and Storage Income | 8,241,523 | 7,637,983 | 7,824,181 | 8,071,735 | 9,336,660 | 17.5 | 6.88 |
| Other Income(3) | 80,135 | 6,164 | 7,646 | 1,015 | 16,200 | 0.0 | 0.01 |
| Net Rental Income | $39,530,062 | $36,956,967 | $44,116,961 | $45,443,132 | $53,364,390 | 100.0% | $39.34 |
| Less Vacancy & Credit Loss | (141,202) | (111,036) | 82,000 | 176,768 | (7,139,816) | -17.8 | (5.26) |
| Effective Gross Income | $39,388,859 | $36,845,931 | $44,198,961 | $45,619,900 | $46,224,574 | 86.6% | $34.08 |
| Real Estate Taxes | 4,891,776 | 4,979,934 | 5,014,462 | 5,452,043 | 6,730,563 | 14.6 | 4.96 |
| Insurance | 246,268 | 301,191 | 404,944 | 495,711 | 556,839 | 1.2 | 0.41 |
| Management Fee | 2,060,694 | 1,936,199 | 2,357,489 | 2,551,552 | 1,000,000 | 2.2 | 0.74 |
| Other Operating Expenses | 12,851,815 | 11,090,761 | 11,396,744 | 11,566,510 | 12,858,487 | 27.8 | 9.48 |
| Total Operating Expenses | $20,050,553 | $18,308,085 | $19,173,640 | $20,065,815 | $21,145,889 | 45.7% | $15.59 |
| Net Operating Income | $19,338,306 | $18,537,846(4) | $25,025,321(4) | $25,554,085 | $25,078,685 | 54.3% | $18.49 |
| Replacement Reserves | 0 | 0 | 0 | 0 | 188,765 | 0.4 | 0.14 |
| TI/LC | 0 | 0 | 0 | 0 | 1,703,467 | 3.7 | 1.26 |
| Net Cash Flow | $19,338,306 | $18,537,846 | $25,025,321 | $25,554,085 | $23,186,453 | 50.2% | $17.10 |
| NOI DSCR | 1.45x | 1.39x | 1.88x | 1.92x | 1.88x | ||
| NCF DSCR | 1.45x | 1.39x | 1.88x | 1.92x | 1.74x | ||
| NOI Debt Yield | 8.9% | 8.5% | 11.5% | 11.7% | 11.5% | ||
| NCF Debt Yield | 8.9% | 8.5% | 11.5% | 11.7% | 10.6% |
| (1) | Represents (i) percent of Net Rental Income for all revenue fields, (ii) percent of Gross Potential Rent for Vacancy & Credit Loss and (iii) percent of Effective Gross Income for all other fields. |
| (2) | UW Base Rent is inclusive of (i) the underwritten rent roll dated June 27, 2022 with contractual rent steps of $586,880 through June 1, 2023, (ii) vacant spaces underwritten to market rent and (iii) straight-line average rent over the lease term for Microsoft Corporation due to its investment grade rating. |
| (3) | Other Income is inclusive of miscellaneous income, tenant extras, late fees and NSF fees. |
| (4) | The increase from 2020 NOI to 2021 NOI is primarily attributable to the delivery of the 398,215 square foot expansion space, and subsequent lease up. |
Appraisal. The appraisal concluded to an “as-is” value as of May 4, 2022, of $362,500,000, based on the extraordinary assumption that all outstanding tenant improvements and leasing commissions have been paid. At origination, $3,851,373 was reserved for outstanding tenant improvements and leasing commissions.
Environmental Matters. The Phase I environmental report dated May 27, 2022, identified a recognized environmental condition at the One Campus Martius Property relating to historic onsite activities of various commercial purposes. See “Description of the Mortgage Pool—Environmental Considerations” in the Preliminary Prospectus.
Market Overview and Competition. The One Campus Martius Property is located in the Detroit central business district (“CBD”) submarket within the Detroit-Dearborn-Livonia metropolitan statistical area (“Detroit MSA”). The One Campus Martius Property is located in the Campus Martius Park neighborhood which is commonly considered to be the financial district of the city of Detroit. The boundaries of the immediate area are Gratiot Avenue to the north, Jefferson Avenue to the south, Randolph Street to the east and Cass Avenue to the west.
| THE INFORMATION IN THIS STRUCTURAL AND COLLATERAL TERM SHEET IS NOT COMPLETE AND MAY BE AMENDED PRIOR TO THE TIME OF SALE. THIS TERM SHEET IS NOT AN OFFER TO SELL THESE SECURITIES AND IT IS NOT A SOLICITATION OF AN OFFER TO BUY THESE SECURITIES IN ANY JURISDICTION WHERE THE OFFER OR SALE IS NOT PERMITTED. | ||
| ||
| Office – CBD | Loan #8 | Cut-off Date Balance: | $46,200,000 | |
| 1000 Woodward Avenue | One Campus Martius | Cut-off Date LTV: | 60.1% | |
| Detroit, MI 48226 | U/W NCF DSCR: | 1.74x | ||
| U/W NOI Debt Yield: | 11.5% |
Detroit’s MSA has recovered in the months following the pandemic, restoring about 90% of jobs lost during the pandemic, compared to the overall Midwest region of the United States, which has recovered approximately 75% of jobs lost. As of November 2021, the largest employment sectors in the Detroit MSA were services (46.2%), manufacturing (18.9%) and retail trade (10.1%) and the unemployment rate in the Detroit MSA was 4.2%. The largest employers in the area include The General Motors Co. (52,113 employees), Ford Motor Co. (48,000 employees), and the University of Michigan (34,904 employees).
As of first quarter 2022, the Detroit CBD office submarket had a total office inventory of approximately 15 million square feet, with 513,000 additional square feet under construction. The Detroit CBD had an overall vacancy rate of 14.7%, which is below the Detroit suburban area vacancy rate of 19.2%. The Class A office asking rents in the Detroit CBD were $28.87 per square foot, compared to the Detroit suburban area class A office asking rents of $22.05.
Between 2011 and 2019, the Detroit CBD averaged over 370,000 square feet of net absorption per year. Despite the pandemic, absorption in 2020 was 72,000 square feet. The global internet technology and customer services company, Majorel, announced that the firm is looking for up to 50,000 square feet in the Detroit CBD, and Ally Financial Inc. recently relocated hundreds of employees into the Detroit CBD.
Furthermore, the appraisal analyzed the Detroit MSA and Detroit CBD submarket, along with a specific subset of properties in Detroit’s financial district that are comparable to the One Campus Martius Property (“Comparable Properties”) (i.e., larger properties within the financial district that have associated parking structures). In the first quarter of 2022, vacancy rates were 11.3%, 9.3% and 5.8% for the Detroit MSA, Detroit CBD and Comparable Properties, respectively, with rents per square foot of $28.31 for the Detroit CBD. Generally, properties with associated parking decks (One Campus Martius included) tend to outperform the Detroit CBD as a whole, as parking is a major consideration for businesses to locate in downtown Detroit.
The appraisal identified eight comparable office leases with rents ranging from $28.65 to $39.78 per square foot, which factor in adjustments for expense structure, location, age/condition, and parking, among other factors to normalize various lease types for a comparison under a modified gross lease basis. According to the appraisal, the concluded market rent is $33.00 per square foot on a modified gross basis, which is higher than the average underwritten base rents across the office component of the One Campus Martius Property.
The following table presents certain information relating to the appraisal’s market rent conclusion for the One Campus Martius Property:
Market Rent Summary
| Category | Office | Retail |
| Market Rent (PSF) | $30.00 | $30.00 |
| Lease Term (Years) | 5 | 5 |
| Lease Type (Reimbursements) | MG | NNN |
| Source: Appraisal. |
| THE INFORMATION IN THIS STRUCTURAL AND COLLATERAL TERM SHEET IS NOT COMPLETE AND MAY BE AMENDED PRIOR TO THE TIME OF SALE. THIS TERM SHEET IS NOT AN OFFER TO SELL THESE SECURITIES AND IT IS NOT A SOLICITATION OF AN OFFER TO BUY THESE SECURITIES IN ANY JURISDICTION WHERE THE OFFER OR SALE IS NOT PERMITTED. | ||
| ||
| Office – CBD | Loan #8 | Cut-off Date Balance: | $46,200,000 | |
| 1000 Woodward Avenue | One Campus Martius | Cut-off Date LTV: | 60.1% | |
| Detroit, MI 48226 | U/W NCF DSCR: | 1.74x | ||
| U/W NOI Debt Yield: | 11.5% |
The following table presents comparable office leases with respect to the One Campus Martius Property:
Comparable Office Lease Summary
| Property/Location | Year Built / Renovated | SF | Tenant Name | Tenant Size (SF) | Lease Date | Rent PSF(1) | Lease Type |
One Campus Martius (subject)(1) Detroit, MI | 2003 / 2019-2020 | 1,356,325 | Various | 988,846(2) | Various | $28.96(2) | Various |
Ally Detroit Center(3) Detroit, MI | 1993 / NAP | 1,000,000 | Confidential | 10,571 | Mar. 2019 | $29.00 | MG |
500 Woodward Avenue Detroit, MI | 1911 / 2017 | 57,592 | Confidential | 7,156 | Dec. 2021 | $25.00 | NNN |
Marquette Building Detroit, MI | 1899 / 2020 | 170,000 | Confidential | 138,000 | Jan. 2021 | $29.00 | NNN |
First National Building(3) Detroit, MI | 1924 / 2015 | 840,436 | Confidential | 1,945 | Mar. 2020 | $29.50 | MG |
150 West Jefferson Detroit, MI | 1989 / NAP | 489,601 | Confidential | 20,465 | Jul. 2017 | $25.50 | MG |
220 Congress Detroit, MI | 1920 / 2020 | 41,000 | Confidential | 22,000 | May 2020 | $23.50 | MG |
Grand Park Centre Detroit, MI | 1921 / 2004 | 150,000 | Confidential | 2,438 | Nov. 2019 | $24.00 | MG |
The 607 Detroit, MI | 1925 / 2018 | 47,500 | Confidential | 4,263 | May 2019 | $23.50 | MG |
Source: Appraisal.
| (1) | Rent PSF for comparable properties has been normalized by the appraiser to represent modified gross leases due to the variety of comparable lease structures. |
| (2) | Based on the underwritten rent roll dated June 27, 2022, inclusive of contractual rent steps through June 1, 2023 and straight-line average rent over the lease term for Microsoft Corporation due to its investment grade rating. Tenant Size (SF) and Rent PSF for the One Campus Martius Property are solely based on the occupied office tenants. |
| (3) | Ally Detroit Center and First National Building are both owned by the borrower sponsor. |
Escrows.
Real Estate Taxes – At origination, the borrower was required to deposit $3,926,163 into an upfront reserve for real estate taxes, and the borrower is required to make ongoing monthly deposits into a reserve for real estate taxes in an amount equal to 1/12 of the real estate taxes that the lender estimates will be payable during the next twelve months for the One Campus Martius Property (currently, $560,880).
Insurance – On each monthly due date, the borrower is required to deposit into an insurance reserve an amount equal to 1/12th of estimated insurance premiums, unless the borrower maintains a blanket insurance policy in accordance with the One Campus Martius Whole Loan documents.
Replacement Reserve – At loan origination, the borrower deposited $28,230 into a replacement reserve. On each monthly due date, the borrower is required to deposit $28,230 into a replacement reserve, subject to a cap of $677,530.
TI/LC Reserve — At loan origination, the borrower deposited $1,500,000 into a reserve for tenant improvements and leasing commissions. On each monthly due date, the borrower is required to deposit $169,541 into such reserve, subject to a cap of $4,000,000.
Outstanding TI/LC Reserve — At loan origination, the borrower deposited $3,851,373 into a reserve for tenant improvements and leasing commissions owed to existing tenants.
Meridian/Rocket Reserve – On each monthly due date during the continuance of a Cash Sweep Event caused by a Meridian Health Trigger Event (as defined below) and/or a Rocket Mortgage Trigger Event (as defined below), all Excess Cash (as defined below) must be deposited with and held by the lender for tenant improvement and leasing commission obligations that may be incurred following the loan origination date with respect to the leases for the applicable leased space by Meridian Health and/or Rocket Mortgage.
Lockbox and Cash Management. The One Campus Martius Whole Loan is structured with a hard lockbox for the One Campus Martius Property except with respect to the parking garage portion (the “Parking Garage Portion”), for which the borrower is required to establish and maintain a lockbox account during the continuance of a Cash Sweep Event, and springing cash management. Upon the establishment of a lockbox account, the borrower is required to, or cause the property manager to, deliver tenant direction letters to all tenants under leases (other than parking passes relating to the Parking Garage Portion) at the One Campus Martius Property to deliver all rents payable directly to the applicable lockbox account. The borrower is required to, or to cause the property manager to, (i) at all times during the term of the One Campus Martius Whole Loan, deposit all amounts received by the borrower or the property manager constituting rents (other than rents from the Parking Garage Portion) into the lockbox account within one business day after receipt thereof and (ii) during the continuance of a Cash Sweep Event, deposit all amounts received by the borrower or the property manager constituting rents from the Parking Garage Portion into the lockbox account within seven days after receipt. If no Cash Sweep
| THE INFORMATION IN THIS STRUCTURAL AND COLLATERAL TERM SHEET IS NOT COMPLETE AND MAY BE AMENDED PRIOR TO THE TIME OF SALE. THIS TERM SHEET IS NOT AN OFFER TO SELL THESE SECURITIES AND IT IS NOT A SOLICITATION OF AN OFFER TO BUY THESE SECURITIES IN ANY JURISDICTION WHERE THE OFFER OR SALE IS NOT PERMITTED. | ||
| ||
| Office – CBD | Loan #8 | Cut-off Date Balance: | $46,200,000 | |
| 1000 Woodward Avenue | One Campus Martius | Cut-off Date LTV: | 60.1% | |
| Detroit, MI 48226 | U/W NCF DSCR: | 1.74x | ||
| U/W NOI Debt Yield: | 11.5% |
Event exists, all funds in the lockbox account are required to be disbursed to the borrower. During a Cash Sweep Event, the borrower is required to establish and maintain a lender-controlled cash management account, and on each due date during the continuance of a Cash Sweep Event, all funds on deposit in the cash management account after payment of debt service on the One Campus Martius Whole Loan, required reserves, budgeted operating expenses and approved non-budgeted operating expenses (“Excess Cash”) are required to be deposited into an excess cash flow reserve account as additional collateral for the One Campus Martius Whole Loan, except that during a Cash Sweep Event caused by a Meridian Health Trigger Event and/or a Rocket Mortgage Trigger Event, Excess Cash is required to be deposited into the Meridian/Rocket Reserve and held by the lender for tenant improvement and leasing commission obligations that may be incurred following the loan origination date with respect to the leases for the applicable space leased by Meridian Health and/or Rocket Mortgage.
A “Cash Sweep Event” means the occurrence of: (a) an event of default, (b) any bankruptcy action of the borrower, (c) any bankruptcy action of the property manager, (d) the debt coverage ratio based on the trailing three-month period immediately preceding the date of determination being less than 1.15x, (e) a Meridian Health Trigger Event and/or (f) a Rocket Mortgage Trigger Event.
A Cash Sweep Event may be cured upon the occurrence of the following: (i) with respect to clause (a) above, the acceptance by the lender of a cure of such event of default (provided, however, if the lender has applied for the appointment of a receiver for the One Campus Martius Property, declared the debt to be immediately due and payable or commenced a foreclosure action, the lender is not obligated to accept such cure and may reject or accept such cure in its sole and absolute discretion), (ii) with respect to clause (b) above, if the bankruptcy action is due to a person or persons filing an involuntary petition against the borrower and the borrower has not colluded with, or otherwise assisted, such person or persons, and has not solicited creditors for any involuntary petition against the borrower from any person, the dismissal of the bankruptcy action within 90 days from the filing of such bankruptcy action, (iii) with respect to clause (c) above, the borrower replacing such property manager with a qualified manager under a replacement management agreement acceptable to the lender in accordance with the One Campus Martius Whole Loan documents, (iv) with respect to clause (d) above, the achievement of a debt service coverage ratio based on the trailing three-month period immediately preceding the date of determination for two consecutive quarters of not less than 1.15x, (v) with respect to clause (e) above, the achievement of a Meridian Health Trigger Cure (as defined below), and (vi) with respect to clause (f) above, the achievement of a Rocket Mortgage Trigger Cure (as defined below).
“Meridian Health Trigger Event” means (i) a bankruptcy action of Meridian Health, (ii) Meridian Health failing to enter into a new lease or renew its then-existing lease, in either case, on substantially similar terms to its then-existing lease (or otherwise on market terms in accordance with the terms of the One Campus Martius Whole Loan documents) on or prior to the applicable extension deadline under the lease with the initial term of such new lease or renewal being no less than three years, or (iii) Meridian Health “goes dark” or takes a similar action as more fully described in the One Campus Martius Whole Loan documents (other than for commercially reasonable periods of time as a result of fire, casualty and/or condemnation).
“Meridian Health Trigger Cure” means either (i) the amount on deposit in the Meridian/Rocket Reserve being equal to or greater than $6,650,025, including any amounts deposited directly by the borrower from any source, or (ii) the Meridian Health leased space (or an alternative space that either (x) has substantially the same square footage as the Meridian Health leased space or (y) has sufficient square footage to provide for at a minimum, substantially similar rent as under the Meridian Health lease and that is reasonably approved by the lender) is re-leased to a replacement tenant that is reasonably acceptable to the lender, pursuant to a lease reasonably approved by the lender, and such replacement tenant delivers to the lender an estoppel certificate satisfactory to the lender in accordance with the One Campus Martius Whole Loan documents.
“Rocket Mortgage Trigger Event” means (i) a bankruptcy action of Rocket Mortgage or (ii) if the debt service coverage ratio based on the trailing three-month period immediately preceding the date of such determination is less than 1.15x and (x) Rocket Mortgage has not entered into a new lease or renewal of its existing lease (a “Rocket Mortgage Lease Extension”), in either case, on substantially similar terms to its existing lease (or otherwise on market terms in accordance with the terms of the One Campus Martius Whole Loan documents) on or prior to the applicable extension deadline under the lease with the initial term of such new lease or renewal being no less than three years and/or (y) Rocket Mortgage “goes dark” or takes a similar action as more fully described in the One Campus Martius Whole Loan documents (other than for commercially reasonable periods of time as a result of fire, casualty and/or condemnation).
“Rocket Mortgage Trigger Cure” means the Rocket Mortgage leased space (or an alternative space that either (i) has substantially the same square footage as the Rocket Mortgage leased space or (ii) has sufficient square footage to provide for at a minimum, substantially similar rent as under the Rocket Mortgage lease and that is reasonably approved by the lender) is re-leased to a replacement tenant that is reasonably acceptable to the lender, pursuant to a lease reasonably approved by the lender, and such replacement tenant delivers to the lender an estoppel satisfactory to the lender in accordance with the One Campus Martius Whole Loan documents.
Property Management. The One Campus Martius Property (other than the Parking Garage Portion) is managed by Bedrock Management Services LLC, an affiliate of the borrower, and the parking garage is managed by Ultimate Parking Management LLC, a third-party management company.
Partial Release. Not permitted.
Real Estate Substitution. Not permitted.
| THE INFORMATION IN THIS STRUCTURAL AND COLLATERAL TERM SHEET IS NOT COMPLETE AND MAY BE AMENDED PRIOR TO THE TIME OF SALE. THIS TERM SHEET IS NOT AN OFFER TO SELL THESE SECURITIES AND IT IS NOT A SOLICITATION OF AN OFFER TO BUY THESE SECURITIES IN ANY JURISDICTION WHERE THE OFFER OR SALE IS NOT PERMITTED. | ||
| ||
| Office – CBD | Loan #8 | Cut-off Date Balance: | $46,200,000 | |
| 1000 Woodward Avenue | One Campus Martius | Cut-off Date LTV: | 60.1% | |
| Detroit, MI 48226 | U/W NCF DSCR: | 1.74x | ||
| U/W NOI Debt Yield: | 11.5% |
Subordinate and Mezzanine Indebtedness. Not permitted.
Letter of Credit. None.
Right of First Offer / Right of First Refusal. None.
Ground Lease. None.
Terrorism Insurance. The borrower is required to obtain and maintain an “all risk” property insurance policy that covers acts of terrorism in an amount equal to the “full replacement cost” of the One Campus Martius Property, together with business income insurance covering the 24-month period commencing at the time of loss. Notwithstanding the foregoing, for so long as the Terrorism Risk Insurance Act of 2002, as extended and modified by the Terrorism Risk Insurance Program Reauthorization Act of 2007 or subsequent statute, reauthorization, extension thereof (“TRIPRA”), is in effect, the lender is required to accept terrorism insurance which covers against “certified” acts within the meaning of TRIPRA but only in the event that TRIPRA continues to cover both domestic and foreign acts of terrorism. However, if TRIPRA or a similar or subsequent statute is not in effect, then provided that terrorism insurance is commercially available, the borrower will not be required to spend on terrorism insurance coverage more than two times the amount of the insurance premium that is payable at such time in respect of the One Campus Martius Property and business interruption/rental loss insurance required under the loan documents on a stand-alone basis (without giving effect to the cost of terrorism and windstorm components of such property and flood loss insurance), See “Risk Factors—Risks Relating to the Mortgage Loans—Terrorism Insurance May Not Be Available for All Mortgaged Properties” in the Preliminary Prospectus.
| THE INFORMATION IN THIS STRUCTURAL AND COLLATERAL TERM SHEET IS NOT COMPLETE AND MAY BE AMENDED PRIOR TO THE TIME OF SALE. THIS TERM SHEET IS NOT AN OFFER TO SELL THESE SECURITIES AND IT IS NOT A SOLICITATION OF AN OFFER TO BUY THESE SECURITIES IN ANY JURISDICTION WHERE THE OFFER OR SALE IS NOT PERMITTED. | ||
| ||
| Hospitality – Full Service | Loan #9 | Cut-off Date Balance: | $44,000,000 | |
4000 South Sandestin Boulevard Miramar Beach, FL 32550
| Hilton Sandestin Beach Resort | Cut-off Date LTV: U/W NCF DSCR: U/W NOI Debt Yield: | 36.3% 3.66x 19.7% |
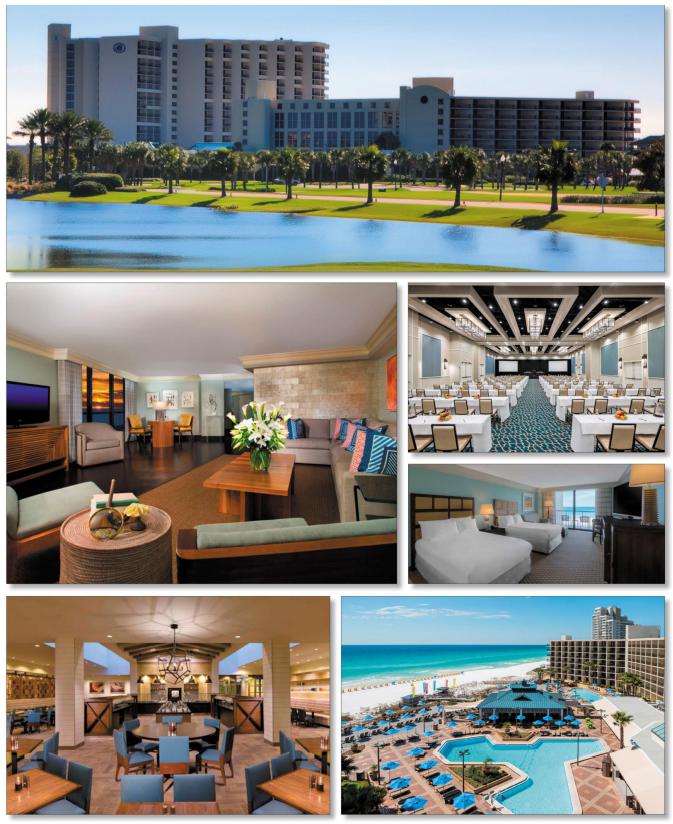
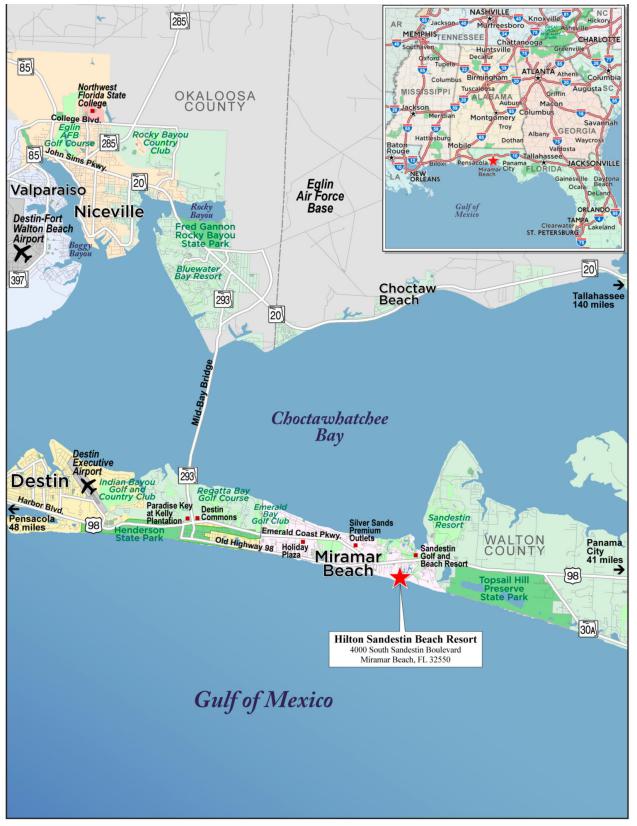
| THE INFORMATION IN THIS STRUCTURAL AND COLLATERAL TERM SHEET IS NOT COMPLETE AND MAY BE AMENDED PRIOR TO THE TIME OF SALE. THIS TERM SHEET IS NOT AN OFFER TO SELL THESE SECURITIES AND IT IS NOT A SOLICITATION OF AN OFFER TO BUY THESE SECURITIES IN ANY JURISDICTION WHERE THE OFFER OR SALE IS NOT PERMITTED. | ||
| ||
| No. 9 – Hilton Sandestin Beach Resort |
| Mortgage Loan Information | Mortgaged Property Information | |||||
| Mortgage Loan Seller: | Wells Fargo Bank, National Association | Single Asset/Portfolio: | Single Asset | |||
Credit Assessment (Fitch/KBRA/Moody’s): | NR/NR/NR | Property Type – Subtype: | Hospitality – Full Service | |||
| Original Principal Balance(1): | $44,000,000 | Location: | Miramar Beach, FL | |||
| Cut-off Date Balance(1): | $44,000,000 | Size: | 590 Rooms | |||
| % of Initial Pool Balance: | 4.0% | Cut-off Date Balance Per Room(1): | $203,390 | |||
| Loan Purpose: | Refinance | Maturity Date Balance Per Room(1): | $203,390 | |||
| Borrower Sponsor: | SH General Partner, Inc. | Year Built/Renovated: | 1984/2021 | |||
| Guarantor: | SH General Partner, Inc. | Title Vesting: | Fee | |||
| Mortgage Rate: | 4.6200% | Property Manager: | Sandcastle Resort of Sandestin, Inc. (borrower affiliate) | |||
| Note Date: | April 22, 2022 | Current Occupancy (As of): | 67.8% (3/31/2022) | |||
| Seasoning: | 3 months | YE 2021 Occupancy(4): | 65.1% | |||
| Maturity Date: | May 11, 2032 | YE 2020 Occupancy(4): | 45.0% | |||
| IO Period: | 120 months | YE 2019 Occupancy(4): | 66.5% | |||
| Loan Term (Original): | 120 months | YE 2018 Occupancy: | 69.9% | |||
| Amortization Term (Original): | NAP | Appraised Value(5): | $331,000,000 | |||
| Loan Amortization Type: | Interest Only | Appraised Value Per Room(5): | $561,017 | |||
| Call Protection(2): | L(27),D(89),O(4) | Appraisal Valuation Date(5): | March 8, 2022 | |||
| Lockbox Type: | Springing | Underwriting and Financial Information(6) | ||||
| Additional Debt(1): | Yes | TTM NOI (3/31/2022): | $22,283,807 | |||
| Additional Debt Type (Balance) (1): | Pari Passu ($76,000,000) | YE 2021 NOI(4): | $21,441,665 | |||
| YE 2020 NOI(4): | $2,222,403 | |||||
| YE 2019 NOI(4): | $19,859,428 | |||||
| U/W Revenues: | $75,104,831 | |||||
| U/W Expenses: | $51,506,519 | |||||
| Escrows and Reserves(3) | U/W NOI: | $23,598,313 | ||||
| Initial | Monthly | Cap | U/W NCF: | $20,594,119 | ||
| Real Estate Taxes | $148,475 | $49,489 | NAP | U/W DSCR based on NOI/NCF(1): | 4.20x / 3.66x | |
| Insurance | $286,032 | $286,038 | NAP | U/W Debt Yield based on NOI/NCF(1): | 19.7% / 17.2% | |
| FF&E Reserve | $0 | $239,176 | NAP | U/W Debt Yield at Maturity based on NOI/NCF(1): | 19.7% / 17.2% | |
| PIP Reserve | $25,189,000 | $0 | NAP | Cut-off Date LTV Ratio(1): | 36.3% | |
| LTV Ratio at Maturity(1): | 36.3% | |||||
| Sources and Uses | |||||||
| Sources | Uses | ||||||
| Whole Loan amount | $120,000,000 | 100.0% | Loan payoff(7) | $82,341,405 | 68.6 | % | |
| Upfront reserves | 25,623,507 | 21.4 | |||||
| Closing costs | 1,933,692 | 1.6 | |||||
| Return of equity | 10,101,396 | 8.4 | |||||
| Total Sources | $120,000,000 | 100.0% | Total Uses | $120,000,000 | 100.0 | % | |
| (1) | The Hilton Sandestin Beach Resort Mortgage Loan (as defined below) is part of the Hilton Sandestin Beach Resort Whole Loan (as defined below) with an original aggregate principal balance of $120,000,000. The Cut-off Date Balance Per Room, Maturity Date Balance Per Room, U/W Debt Yield based on NOI/NCF, U/W Debt Yield at Maturity based on NOI/NCF, U/W DSCR based on NOI/NCF, Cut-off Date LTV Ratio and LTV Ratio at Maturity numbers presented above are based on the Hilton Sandestin Beach Resort Whole Loan. |
| (2) | At any time after two years from the closing date of this securitization, the borrower has the right to defease the Hilton Sandestin Beach Resort Whole Loan in whole, but not in part. Additionally, the borrower may prepay the Hilton Sandestin Beach Resort Whole Loan with 30 days’ notice on or after February 11, 2032. |
| (3) | See “Escrows and Reserves” below. |
| (4) | The drop in NOI and Occupancy from 2019 to 2020 was due to the effect of the novel coronavirus on the hospitality industry in 2020 and the increase in NOI and Occupancy from 2020 to 2021 was due to the subsequent recovery in 2021. |
| (5) | The appraised value represents the hypothetical As if Renovated/Stabilized, assuming the Hilton Sandestin Beach Resort Property (defined below) property improvement plan (“PIP’) has been completed and is operating at a stabilized capacity as of the date of the value. The PIP is required to be completed by June 30, 2024 and all costs are reserved upfront. The appraisal also provided an As-Is Value of $297,000,000 as of March 8, 2022, representing a 40.4% Cut-off Date LTV Ratio, and an Upon Completion / Stabilization value of $352,000,000 as of March 8, 2024, representing a 34.1% Cut-off Date LTV Ratio. |
| (6) | While the Hilton Sandestin Beach Resort Whole Loan was originated after the emergence of the novel coronavirus pandemic and the economic disruption resulting from measures to combat the pandemic, the pandemic is an evolving situation and could impact the Hilton Sandestin Beach Resort Whole Loan more severely than assumed in the underwriting and could adversely affect the NOI, NCF and occupancy information, as well as the appraised value and the DSCR, LTV and Debt Yield metrics presented above. See “Risk Factors— Risks Related to Market Conditions and Other External Factors—Coronavirus Pandemic Has Adversely Affected the Global Economy and Will Likely Adversely Affect the Performance of the Mortgage Loans” in the Preliminary Prospectus. |
| (7) | The loan proceeds were used to repay existing CMBS debt securitized in WFRBS 2013-C17, and a junior loan of $4,528,340. |
| THE INFORMATION IN THIS STRUCTURAL AND COLLATERAL TERM SHEET IS NOT COMPLETE AND MAY BE AMENDED PRIOR TO THE TIME OF SALE. THIS TERM SHEET IS NOT AN OFFER TO SELL THESE SECURITIES AND IT IS NOT A SOLICITATION OF AN OFFER TO BUY THESE SECURITIES IN ANY JURISDICTION WHERE THE OFFER OR SALE IS NOT PERMITTED. | ||
| ||
| Hospitality – Full Service | Loan #9 | Cut-off Date Balance: | $44,000,000 | |
4000 South Sandestin Boulevard Miramar Beach, FL 32550
| Hilton Sandestin Beach Resort | Cut-off Date LTV: U/W NCF DSCR: U/W NOI Debt Yield: | 36.3% 3.66x 19.7% |
The Mortgage Loan. The mortgage loan (the “Hilton Sandestin Beach Resort Mortgage Loan”) is part of a whole loan (the “Hilton Sandestin Beach Resort Whole Loan”) secured by first priority fee interest in a 590 room full service hotel located in Miramar Beach, Florida (the “Hilton Sandestin Beach Resort Property”). The Hilton Sandestin Beach Resort Whole Loan has an original aggregate principal balance of $120,000,000 and is comprised of three pari passu notes. The Hilton Sandestin Beach Resort Mortgage Loan, with an original principal balance of $44,000,000 is evidenced by the non-controlling Notes A-2 and A-3. The controlling Note A-1, with an original principal balance of $76,000,000, was contributed to the BANK 2022-BNK42 securitization trust. The Hilton Sandestin Beach Resort Whole Loan will be serviced under the pooling and servicing agreement for the BANK 2022-BNK42 securitization trust. See “Description of the Mortgage Pool—The Whole Loans—The Non-Serviced Pari Passu Whole Loans” and “Pooling and Servicing Agreement—Servicing of the Non-Serviced Mortgage Loans” in the prospectus.
| Hilton Sandestin Beach Resort Whole Loan Summary | ||||
| Notes | Original Balance | Cut-off Date Balance | Note Holder | Controlling Note |
| A-1 | $76,000,000 | $76,000,000 | BANK 2022-BNK42 | Yes |
| A-2 | $20,000,000 | $20,000,000 | BANK 2022-BNK43 | No |
| A-3 | $24,000,000 | $24,000,000 | BANK 2022-BNK43 | No |
| Total | $120,000,000 | $120,000,000 | ||
The Borrower and Borrower Sponsor. The borrower is Sandestin Beach Hotel, Ltd., a single-purpose, Florida limited partnership with a Delaware limited liability company with one independent director as its general partner.
The borrower sponsor and non-recourse carveout guarantor is SH General Partner, Inc., which owns 1.1% of the borrower, with the remaining 98.9% owned by 271 limited partnership units, held by 212 separate parties (the “Limited Partners”). The non-recourse carveout guarantor does not have material assets other than its ownership interest in the SPE borrower. SH General Partner, Inc., is owned by the Limited Partners with each Limited Partner owning one share. The sponsor is controlled by a seven-member board of directors, which makes all decisions on behalf of the borrower and is elected on an annual basis.
The borrower is one of several landowner parties in litigation with Walton County, Florida regarding public access to beach areas that are currently privately owned. The closest proposed public access to the Hilton Sandestin Beach Resort Property is more than two miles away. See “Litigation and Other Considerations” in the prospectus.
The Property. The Hilton Sandestin Beach Resort Property is a 590-room, full service hotel located in Miramar Beach, FL, built in 1984, and located on the Gulf of Mexico. The Hilton Sandestin Beach Resort Property consists of three primary structures: The Emerald Tower, The Lobby Building, and The Spa Tower. The Hilton Sandestin Beach Resort Property is situated on an 18.7-acre site and amenities include four restaurants, a coffee shop, a tiki bar, 34,682 SF of indoor meeting space, more than 20,000 SF of outdoor venues, a 14,500 SF spa and health club with 20 treatment rooms, access to four golf courses, three swimming pools including 2 indoor, a kids’ program for children 5-12 year old, tennis courts and beach cabanas. The property includes 788 surface and garage parking spaces, equating to a parking ratio of 1.3 spaces per room. According to the appraisal, the demand segmentation at the Hilton Sandestin Beach Resort Property is 80% leisure and 20% group.
The Hilton Sandestin Beach Resort Property guestroom configuration consists of 265 standard double queen rooms, 288 standard king rooms, 22 king suites, and 15 ADA compliant rooms. The sponsor has invested in renovations at the property, with over $50 million spent between 2003 and 2014, equating to $84,746 per room. The guestrooms were extensively renovated in 2014, as well as an expansion of the meeting space and spa, and the lobby and food and beverage outlets were renovated and repositioned. Between 2017 and 2021, the sponsor invested an additional $20 million ($33,898 per room), to replace the soft goods in guestrooms, upgrade guest bathrooms, expand and renovate the pool deck, replace the chiller and elevator cabs, and replace the banquet equipment.
In conjunction with the origination of the Hilton Sandestin Beach Resort Whole Loan, the sponsor executed a renewal of the franchise agreement that extends through December 31, 2044. The franchise agreement renewal requires the completion of a PIP estimated to cost $25,189,000, equating to $42,693 per room. The plan includes comprehensive renovation of the guestrooms and hallways in the Emerald Tower, a soft goods refresh for the units in the Spa Tower and a refresh/minor upgrades for meeting rooms, spa, lobby and the food and beverage outlets. The franchise agreement requires the work to be completed by June 30, 2024, and all costs are reserved upfront.
| THE INFORMATION IN THIS STRUCTURAL AND COLLATERAL TERM SHEET IS NOT COMPLETE AND MAY BE AMENDED PRIOR TO THE TIME OF SALE. THIS TERM SHEET IS NOT AN OFFER TO SELL THESE SECURITIES AND IT IS NOT A SOLICITATION OF AN OFFER TO BUY THESE SECURITIES IN ANY JURISDICTION WHERE THE OFFER OR SALE IS NOT PERMITTED. | ||
| ||
| Hospitality – Full Service | Loan #9 | Cut-off Date Balance: | $44,000,000 | |
4000 South Sandestin Boulevard Miramar Beach, FL 32550
| Hilton Sandestin Beach Resort | Cut-off Date LTV: U/W NCF DSCR: U/W NOI Debt Yield: | 36.3% 3.66x 19.7% |
The following table presents historical occupancy, ADR, and RevPAR penetration rates of the Hilton Sandestin Beach Resort Property:
| Historical Occupancy, ADR, RevPAR(1) | ||||||||||||
| Competitive Set | Hilton Sandestin Beach Resort Property | Penetration Factor | ||||||||||
| Year | Occupancy | ADR | RevPAR | Occupancy | ADR | RevPAR | Occupancy | ADR | RevPAR | |||
| 1/31/2020 TTM | 45.9% | $217.35 | $99.76 | 65.8% | $258.01 | $169.84 | 143.4% | 118.7% | 170.2% | |||
| 1/31/2021 TTM | 33.6% | $203.01 | $68.21 | 46.3% | $263.23 | $121.75 | 137.7% | 129.7% | 178.5% | |||
| 1/31/2022 TTM | 53.0% | $272.85 | $144.55 | 65.3% | $316.83 | $207.02 | 123.3% | 116.1% | 143.2% | |||
| (1) | According to a third party research report, the competitive set includes the Autograph Collection The Grand Hotel Golf Resort, Omni Hilton Head Oceanfront Resort, Sandestin Golf & Beach Resort, Sheraton Panama City Beach Golf & Spa Resort, Embassy Suites by Hilton Destin Miramar Beach, and Hotel Effie Sandestin. |
The following table presents historical occupancy percentages at the Hilton Sandestin Beach Resort Property:
Historical Occupancy(1)
12/31/2018 | 12/31/2019 | 12/31/2020 | 12/31/2021 | 3/31/2022 |
| 69.9% | 66.5% | 45.0% | 65.1% | 67.8% |
| (1) | Information obtained from the underwritten rent roll. |
| THE INFORMATION IN THIS STRUCTURAL AND COLLATERAL TERM SHEET IS NOT COMPLETE AND MAY BE AMENDED PRIOR TO THE TIME OF SALE. THIS TERM SHEET IS NOT AN OFFER TO SELL THESE SECURITIES AND IT IS NOT A SOLICITATION OF AN OFFER TO BUY THESE SECURITIES IN ANY JURISDICTION WHERE THE OFFER OR SALE IS NOT PERMITTED. | ||
| ||
| Hospitality – Full Service | Loan #9 | Cut-off Date Balance: | $44,000,000 | |
4000 South Sandestin Boulevard Miramar Beach, FL 32550
| Hilton Sandestin Beach Resort | Cut-off Date LTV: U/W NCF DSCR: U/W NOI Debt Yield: | 36.3% 3.66x 19.7% |
Operating History and Underwritten Net Cash Flow. The following table presents certain information relating to the historical operating performance and underwritten net cash flow at the Hilton Sandestin Beach Resort Property:
Cash Flow Analysis
| ��� | 2019 | 2020 | 2021 | TTM 3/31/2022 | U/W | % of U/W Total Revenue(1) | U/W $ per Room |
| Occupancy | 66.5%(5) | 45.0%(5) | 65.1%(5) | 67.8% | 67.8% | ||
| ADR | $257.69 | $259.31 | $317.20 | $315.11 | $315.11 | ||
| RevPAR | $171.39 | $116.60 | $206.45 | $213.76 | $213.76 | ||
| Room Revenue | $37,659,759 | $23,503,238 | $44,457,540 | $46,032,664 | $46,033,159 | 61.3% | $78,022 |
| Food & Beverage Revenue | 18,544,868 | 9,586,465 | 17,966,845 | 19,396,191 | 19,396,191 | 25.8 | 32,875 |
| Other Revenue(2) | 8,848,012 | 6,130,918 | 9,328,503 | 9,675,481 | 9,675,481 | 12.9 | 16,399 |
| Total Revenue | $65,052,639 | $39,220,621 | $71,752,888 | $75,104,336 | $75,104,831 | 100.0% | $127,296 |
| Room Expense | 8,765,076 | 6,621,290 | 10,344,490 | 10,907,606 | 10,907,723 | 23.7 | 18,488 |
| Food & Beverage Expense | 10,227,736 | 8,245,191 | 11,656,578 | 12,421,690 | 11,249,791 | 58.0 | 19,067 |
| Other Department Expense | 3,810,210 | 2,481,556 | 3,540,634 | 3,784,780 | 3,784,780 | 39.1 | 6,415 |
| Total Department Expenses | $22,803,022 | $17,348,037 | $25,541,702 | $27,114,076 | $25,942,294 | 34.5 | $43,970 |
| Gross Operating Income | $42,249,617 | $21,872,584 | $46,211,186 | $47,990,260 | $49,162,537 | 65.5% | $83,326 |
| Total Undistributed Expenses | 19,971,368 | 17,069,018 | 21,529,922 | 22,450,170 | 20,883,631 | 27.8 | 35,396 |
| Gross Operating Profit | $22,278,249 | $4,803,566 | $24,681,264 | $25,540,090 | $28,278,907 | 37.7% | $47,930 |
| Property Taxes | 653,027 | 640,078 | 610,207 | 602,707 | 648,694 | 0.9 | 1,099 |
| Insurance | 1,063,663 | 1,162,521 | 1,849,606 | 1,855,789 | 3,227,321(3) | 4.3 | 5,470 |
| Other Fixed Expense | 702,131 | 778,564 | 779,786 | 797,787 | 804,579(4) | 1.1 | 1,364 |
| Total Operating Expenses | $45,193,211 | $36,998,218 | $50,311,223 | $52,820,529 | $51,506,519 | 68.6% | $87,299 |
| Net Operating Income | $19,859,428(5) | $2,222,403(5) | $21,441,665(5) | $22,283,807 | $23,598,313 | 31.4% | $39,997 |
| FF&E | 0 | 0 | 0 | 0 | (3,004,193) | (4.0) | (5,092) |
| Net Cash Flow | $19,859,428 | $2,222,403 | $21,441,665 | $22,283,807 | $20,594,119 | 27.4% | $34,905 |
| NOI DSCR(5) | 3.53x | 0.40x | 3.81x | 3.96x | 4.20x | ||
| NCF DSCR(5) | 3.53x | 0.40x | 3.81x | 3.96x | 3.66x | ||
| NOI Debt Yield(5) | 16.5% | 1.9% | 17.9% | 18.6% | 19.7% | ||
| NCF Debt Yield(5) | 16.5% | 1.9% | 17.9% | 18.6% | 17.2% |
| (1) | % of U/W Total Revenue for Room Expense, Food & Beverage Expense and Other Department Expenses are based on their corresponding revenue line items. All other line items represent percent of Total Revenue. |
| (2) | Other revenue consists primarily of spa income, resort fees, and miscellaneous income from laundry, valet, self-parking, and the gift shop. |
| (3) | The insurance is underwritten to the final premium of $2,852,320.83. Additionally, the sponsor is paying to buy down the named storm deductible from 5% to 3%. That expense is estimated at $300,000, with the final number not yet available. The underwritten insurance expense includes 125% of the $300,000 estimate. |
| (4) | The Other Fixed Expense represents the Sandestin HOA Fees based on year 1 of the Appraisal. |
| (5) | The drop in NOI and Occupancy from 2019 to 2020 was due to the effect of the novel coronavirus on the hospitality industry in 2020 and the increase in NOI and Occupancy from 2020 to 2021 was due to the subsequent recovery in 2021. |
| (6) | The debt service coverage ratios and the debt yields shown are based on the Hilton Sandestin Beach Resort Whole Loan. |
Appraisal. The appraised value is dated March 8, 2022 and represents the hypothetical As-if Renovated/Stabilized, assuming the Hilton Sandestin Beach Resort Property PIP has been completed and is operating at a stabilized capacity as of the date of the value. The PIP is required to be completed by June 30, 2024 and all costs are reserved upfront. The appraisal also provided an As-Is Value of $297,000,000 as of March 8, 2022, representing a 40.4% Cut-off Date LTV Ratio, and an Upon Completion / Stabilization value of $352,000,000 as of March 8, 2024, representing a 34.1% Cut-off Date LTV Ratio.
Environmental Matters. According to the Phase I environmental site assessment dated March 8, 2022, there was no evidence of any recognized environmental conditions at the Hilton Sandestin Beach Resort Property.
Market Overview and Competition. The Hilton Sandestin Beach Resort Property is located in Miramar Beach, Florida, on the Gulf of Mexico. The property is located within the mixed-use resort known as the Sandestin Golf and Beach Resort which is a 2,400-acre resort with more than 1,400 rental accommodations, four golf courses, 30 specialty market shops, 14 tennis courts, four swimming pools and a 98-slip marina. The area is heavily influenced by tourism, and as a result, most of the development and retail is geared
| THE INFORMATION IN THIS STRUCTURAL AND COLLATERAL TERM SHEET IS NOT COMPLETE AND MAY BE AMENDED PRIOR TO THE TIME OF SALE. THIS TERM SHEET IS NOT AN OFFER TO SELL THESE SECURITIES AND IT IS NOT A SOLICITATION OF AN OFFER TO BUY THESE SECURITIES IN ANY JURISDICTION WHERE THE OFFER OR SALE IS NOT PERMITTED. | ||
| ||
| Hospitality – Full Service | Loan #9 | Cut-off Date Balance: | $44,000,000 | |
4000 South Sandestin Boulevard Miramar Beach, FL 32550
| Hilton Sandestin Beach Resort | Cut-off Date LTV: U/W NCF DSCR: U/W NOI Debt Yield: | 36.3% 3.66x 19.7% |
toward tourists with the residential properties also oriented towards seasonal residents. Main attractions in the area include the beaches, Okaloosa Island, many shopping centers and restaurants, and cultural venues including Eden State Garden, Florida Cavern State Park, US. Air Force Armament Museum, Emerald Coast Science Center and Big Kahuna’s Water Park.
The Hilton Sandestin Beach Resort Property is located approximately 0.8 miles from U.S. Highway 98, which is the primary east/west thoroughfare, connecting with Pensacola to the west and Tallahassee to the east. Access to the mainland is provided via the Mid Bay Bridge and the US 331 Bridge, located 8.2 and 10.1 miles from the Hilton Sandestin Beach Resort Property, respectively. The closest airport to the Hilton Sandestin Beach Resort Property is the Destin-Fort Walton Beach airport located approximately 23.8 miles away, and the Pensacola International Airport is located approximately 62.0 miles to the west.
According to the appraisal, the 2021 population within a three- and five-mile radius of the Hilton Sandestin Beach Resort Property was 6,202 and 12,078, respectively. The 2021 average household income within the same three- and five-mile radii was $101,720 and $101,587, respectively.
The appraisal did not identify any competitive properties either under construction or proposed. It did identify nine hospitality properties, totaling 930 rooms, that were in the construction or planning phase, that were deemed non-competitive.
The table below presents certain information relating to comparable sales pertaining to the Hilton Sandestin Beach Resort Property identified by the appraisal:
| Comparable Sales Summary | |||||
Property Name | Location | Year Built/Renovated | Rooms | Sale Date | Sale Price / Room |
| Henderson Beach Resort | 200 Henderson Resort Way Destin, FL | 2016 / NAP | 170 | 12/2021 | $661,765 |
| Baker’s Cay Resort | 97000 South Overseas Highway Key Largo, FL | 1985 / NAP | 200 | 7/2021 | $1,000,000 |
| Margaritaville Beach Resort | 1111 North Ocean Drive Hollywood, FL | 2015 / NAP | 349 | 9/2021 | $773,639 |
| Zota Beach Resort | 4711 Gulf of Mexico Drive Longboat Key, FL | 1972 / 2017 | 187 | 1/2020 | $534,759 |
| PGA National Resort & Spa | 400 Avenue of the Champions Palm Beach Gardens, FL | 1981 / NAP | 339 | 12/2018 | $684,366 |
Source: Appraisal
Escrows and Reserves.
Real Estate Taxes – The loan documents require an upfront deposit of $148,475 and ongoing monthly deposits of $49,489 for real estate taxes.
Insurance – The loan documents require an upfront deposit of $286,032, and ongoing monthly insurance reserves in an amount equal to 1/12th of the insurance premiums that the lender estimates will be payable for the renewal of the coverage afforded by the policies upon the expiration thereof, initially estimated at $286,038.
FF&E Reserve - The loan documents require ongoing monthly deposits in an amount equal to 1/12th of the greater of (i) 4% of the operating income for the preceding calendar year and (ii) the amount required to be reserved under the franchise agreement for FF&E, initially estimated at $239,176.
PIP Reserve - The loan documents require an upfront deposit of $25,189,000, which represents the total estimated cost of the PIP required in connection with the franchise agreement renewal. Provided no event of default is continuing, the lender will make disbursements from the PIP reserve as requested by the borrower for actual, out-of-pocket expenses incurred with the performance of the PIP in connection with the annual approved budget by the lender, and provided that the borrower has delivered a standard draw request and proof that the work funded by the request has been completed.
| THE INFORMATION IN THIS STRUCTURAL AND COLLATERAL TERM SHEET IS NOT COMPLETE AND MAY BE AMENDED PRIOR TO THE TIME OF SALE. THIS TERM SHEET IS NOT AN OFFER TO SELL THESE SECURITIES AND IT IS NOT A SOLICITATION OF AN OFFER TO BUY THESE SECURITIES IN ANY JURISDICTION WHERE THE OFFER OR SALE IS NOT PERMITTED. | ||
| ||
| Hospitality – Full Service | Loan #9 | Cut-off Date Balance: | $44,000,000 | |
4000 South Sandestin Boulevard Miramar Beach, FL 32550
| Hilton Sandestin Beach Resort | Cut-off Date LTV: U/W NCF DSCR: U/W NOI Debt Yield: | 36.3% 3.66x 19.7% |
Lockbox and Cash Management. The Hilton Sandestin Beach Resort Whole Loan is structured with a springing lockbox and springing cash management. Upon the occurrence of a Trigger Event (defined below), the borrower is required to establish a deposit account for the benefit of the lender into which the borrower will deposit all rents. Upon the occurrence of a Cash Trap Event Period (defined below), the lender will establish a cash management account. During a Cash Trap Event Period, all funds in the deposit account will be swept into a lender controlled cash management account. After the satisfaction of the cash flow waterfall, all excess cash flow is required to be swept into an excess cash flow subaccount to be held as additional collateral for the loan.
A “Trigger Event” will commence upon the earlier of the following:
| (i) | an event of default; or |
| (ii) | the net operating income debt yield falling below 10.5% for two consecutive quarters. |
A “Cash Trap Event Period” will commence upon the earlier of the following:
| (i) | an event of default; or |
| (ii) | the net operating income debt yield falling below 8.5% for two consecutive quarters. |
A Cash Trap Event Period will end upon the occurrence of the following:
| ● | with regard to clause (i), the cure of such event of default; or |
| ● | with regard to clause (ii), the net operating income debt yield being equal to or greater than 9.5% for two consecutive calendar quarters. |
Property Management. The Hilton Sandestin Beach Resort Property is managed by Sandcastle Resort of Sandestin, Inc., an affiliate of the borrower.
Partial Release. Not permitted.
Real Estate Substitution. Not permitted.
Subordinate and Mezzanine Indebtedness. None.
Ground Lease. None.
Terrorism Insurance. The loan documents require that the “all risk” insurance policy required to be maintained by the borrower provides coverage for terrorism in an amount equal to the full replacement cost of the Hilton Sandestin Beach Resort Property, as well as business interruption insurance covering no less than the 18-month period following the occurrence of a casualty event, together with a 6-month extended period of indemnity. The in-place insurance provides for a 12-month extended period.
| THE INFORMATION IN THIS STRUCTURAL AND COLLATERAL TERM SHEET IS NOT COMPLETE AND MAY BE AMENDED PRIOR TO THE TIME OF SALE. THIS TERM SHEET IS NOT AN OFFER TO SELL THESE SECURITIES AND IT IS NOT A SOLICITATION OF AN OFFER TO BUY THESE SECURITIES IN ANY JURISDICTION WHERE THE OFFER OR SALE IS NOT PERMITTED. | ||
| ||
| Retail – Anchored | Loan #10 | Cut-off Date Balance: | $44,000,000 | |
5070-5176 Richmond Avenue and 3307 Sage Road Houston, TX 77056 | Plaza on Richmond | Cut-off Date LTV: U/W NCF DSCR: U/W NOI Debt Yield: | 42.8% 1.89x 10.9% |
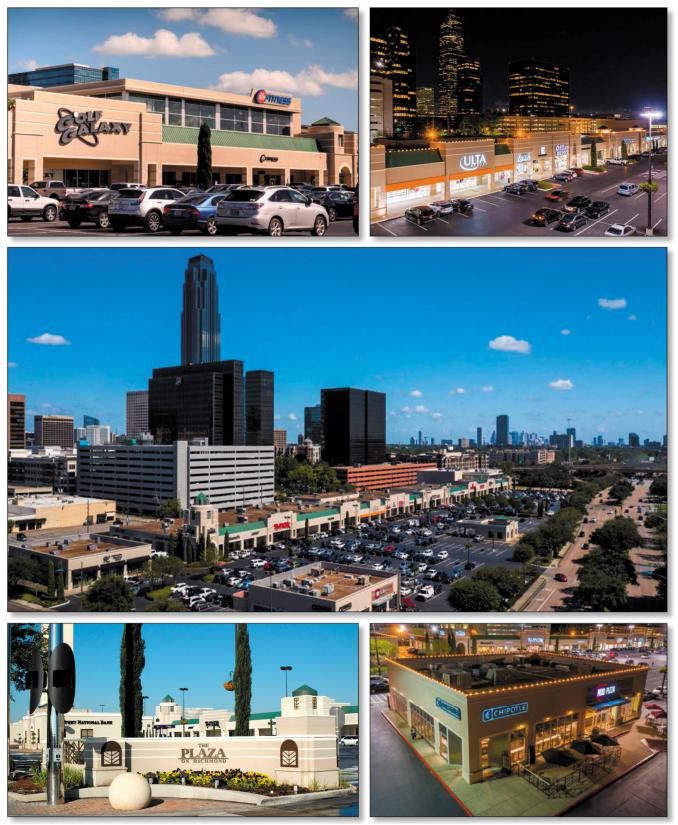
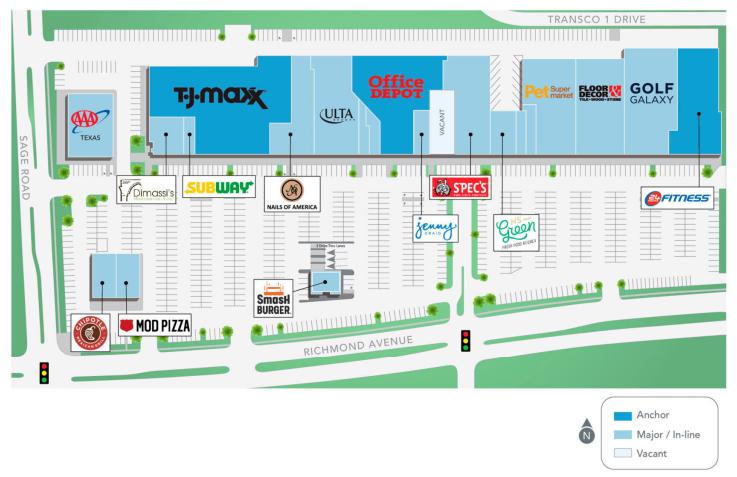
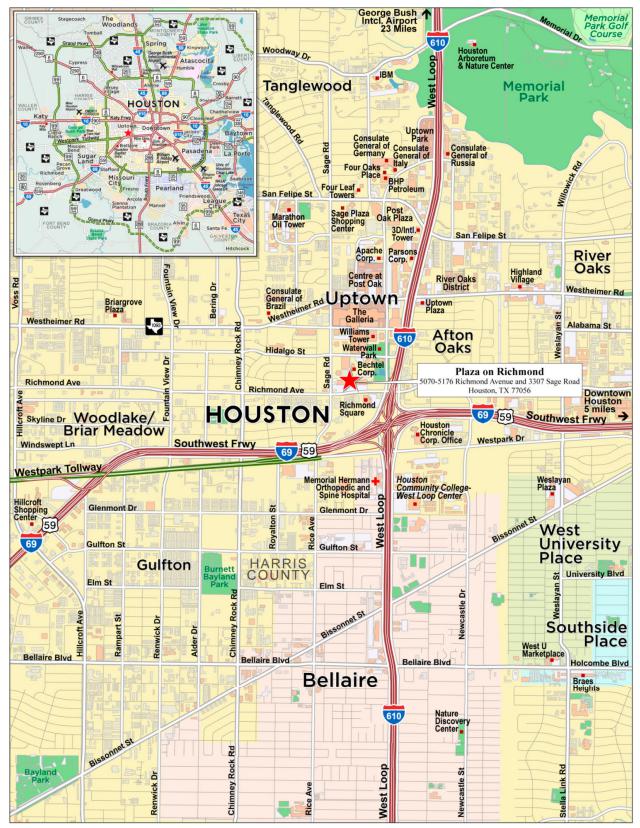
| THE INFORMATION IN THIS STRUCTURAL AND COLLATERAL TERM SHEET IS NOT COMPLETE AND MAY BE AMENDED PRIOR TO THE TIME OF SALE. THIS TERM SHEET IS NOT AN OFFER TO SELL THESE SECURITIES AND IT IS NOT A SOLICITATION OF AN OFFER TO BUY THESE SECURITIES IN ANY JURISDICTION WHERE THE OFFER OR SALE IS NOT PERMITTED. | ||
| ||
| No. 10 – Plaza on Richmond |
| Mortgage Loan Information | Mortgaged Property Information | |||||
| Mortgage Loan Seller: | Wells Fargo Bank, National Association | Single Asset/Portfolio: | Single Asset | |||
Credit Assessment (Fitch/KBRA/Moody’s): | NR/NR/NR | Property Type – Subtype: | Retail – Anchored | |||
| Original Principal Balance: | $44,000,000 | Location: | Houston, TX | |||
| Cut-off Date Balance: | $44,000,000 | Size: | 191,532 SF | |||
| % of Initial Pool Balance: | 4.0% | Cut-off Date Balance Per SF: | $229.73 | |||
| Loan Purpose: | Refinance | Maturity Date Balance Per SF: | $229.73 | |||
| Borrower Sponsor: | Anwar Barbouti | Year Built/Renovated: | 1960/2005; 2010 | |||
| Guarantor: | Anwar Barbouti | Title Vesting: | Fee | |||
| Mortgage Rate: | 5.595% | Property Manager: | Greenwich Management Co., Inc. | |||
| Note Date: | July 15, 2022 | Current Occupancy (As of): | 98.0% (7/1/2022) | |||
| Seasoning: | 0 months | YE 2021 Occupancy: | 93.0% | |||
| Maturity Date: | August 11, 2032 | YE 2020 Occupancy: | 92.0% | |||
| IO Period: | 120 months | YE 2019 Occupancy: | 92.0% | |||
| Loan Term (Original): | 120 months | As-Is Appraised Value(2): | $102,900,000 | |||
| Amortization Term (Original): | NAP | As-Is Appraised Value Per SF: | $537.25 | |||
| Loan Amortization Type: | Interest Only | As-Is Appraisal Valuation Date: | February 10, 2022 | |||
| Call Protection: | L(24),DorYM1(92),O(4) | |||||
| Lockbox Type: | Soft / Springing Cash Management | Underwriting and Financial Information(3) | ||||
| Additional Debt: | None | TTM NOI (5/31/2022): | $3,833,918 | |||
| Additional Debt Type (Balance): | NAP | YE 2021 NOI(4): | $3,896,313 | |||
| YE 2020 NOI: | $3,779,390 | |||||
| YE 2019 NOI: | $4,205,486 | |||||
| U/W Revenues: | $7,977,526 | |||||
| U/W Expenses: | $3,177,842 | |||||
| Escrows and Reserves(1) | U/W NOI(4): | $4,799,684 | ||||
| Initial | Monthly | Cap | U/W NCF: | $4,707,030 | ||
| Taxes | $996,960 | $124,620 | NAP | U/W DSCR based on NOI/NCF: | 1.92x / 1.89x | |
| Insurance | $147,952 | $36,988 | NAP | U/W Debt Yield based on NOI/NCF: | 10.9% / 10.7% | |
| Replacement Reserves | $0 | $3,192 | $114,915 | U/W Debt Yield at Maturity based on NOI/NCF: | 10.9% / 10.7% | |
| TI/LC | $2,250,000 | Springing | $1,000,000 | Cut-off Date LTV Ratio: | 42.8% | |
| Existing TI/LC Obligations | $430,000 | $0 | NAP | LTV Ratio at Maturity: | 42.8% | |
| Sources and Uses | |||||||
| Sources | Uses | ||||||
| Original Mortgage Loan amount | $44,000,000 | 100.0% | Loan payoff(5) | $38,002,740 | 86.4 | % | |
| Upfront Reserves | 3,824,912 | 8.7 | |||||
| Closing Costs | 795,350 | 1.8 | |||||
| Return of equity | 1,376,998 | 3.1 | |||||
| Total Sources | $44,000,000 | 100.0% | Total Uses | $44,000,000 | 100.0 | % | |
| (1) | See “Escrows” section. |
| (2) | The appraisal concluded to a fee simple land value of $103,200,000. The appraisal concluded to the land value based on the as-is vacant land value for comparable tracts in the Houston market, less the estimated cost of demolishing the existing improvements. |
| (3) | While the Plaza on Richmond Mortgage Loan (defined below) was originated after the emergence of the novel coronavirus pandemic and the economic disruption resulting from measures to combat the pandemic, the pandemic is an evolving situation and could impact the Plaza on Richmond Mortgage Loan more severely than assumed in the underwriting and could adversely affect the NOI, NCF and occupancy information, as well as the appraised value and the DSCR, LTV and Debt Yield metrics presented above. See “Risk Factors— Risks Related to Market Conditions and Other External Factors—Coronavirus Pandemic Has Adversely Affected the Global Economy and Will Likely Adversely Affect the Performance of the Mortgage Loans” in the Preliminary Prospectus. |
| (4) | The increase from YE 2021 NOI to U/W NOI is primarily due to three new leases commencing between February 2022 and January 2023 (anticipated) totaling approximately 10.9% of net rentable area and 12.5% underwritten base rent. |
| (5) | The Loan payoff includes the payoff (and corresponding costs) of a prior loan secured by the Plaza on Richmond Property (as defined below) that was securitized in the WFRBS 2012-C8 securitization trust. |
The Mortgage Loan. The tenth largest mortgage loan (the “Plaza on Richmond Mortgage Loan”) is evidenced by a promissory note in the original principal amount of $44,000,000 and secured by a first priority fee interest in an anchored retail property located in Houston, Texas (the “Plaza on Richmond Property”).
| THE INFORMATION IN THIS STRUCTURAL AND COLLATERAL TERM SHEET IS NOT COMPLETE AND MAY BE AMENDED PRIOR TO THE TIME OF SALE. THIS TERM SHEET IS NOT AN OFFER TO SELL THESE SECURITIES AND IT IS NOT A SOLICITATION OF AN OFFER TO BUY THESE SECURITIES IN ANY JURISDICTION WHERE THE OFFER OR SALE IS NOT PERMITTED. | ||
| ||
| Retail – Anchored | Loan #10 | Cut-off Date Balance: | $44,000,000 | |
5070-5176 Richmond Avenue and 3307 Sage Road Houston, TX 77056 | Plaza on Richmond | Cut-off Date LTV: U/W NCF DSCR: U/W NOI Debt Yield: | 42.8% 1.89x 10.9% |
The Borrower and Borrower Sponsor. The borrower is POR LP, a Delaware limited partnership and single purpose entity with one independent director. Legal counsel to the borrower delivered a non-consolidation opinion in connection with the origination of the Plaza on Richmond Mortgage Loan. The borrower sponsor and non-recourse carveout guarantor is Anwar Barbouti.
Anwar Barbouti has 15 years of real estate experience, currently serving as the President of Greenwich Management Inc. (“Greenwich”). Greenwich focuses on development, management and leasing of commercial real estate properties in the Houston, Texas area.
The Property. The Plaza on Richmond Property is an anchored retail center located in Houston, Texas consisting of four buildings totaling 191,532 square feet. Built in 1960, the Plaza on Richmond Property is situated on a 12.6-acre site and is anchored by 24 Hour Fitness, T.J. Maxx and Office Depot. The Plaza on Richmond Property contains 918 surface parking spaces, resulting in a parking ratio of 4.8 spaces per 1,000 SF of rentable area. The borrower sponsor renovated the Plaza on Richmond Property in 2005 and 2009-2010, which included a $3.8 million expansion of 24 Hour Fitness. Recent capital expenditures include parking lot repairs in 2019 and 2021, totaling approximately $212,000, and a partial roof replacement in 2021, totaling approximately $325,000.
As of July 1, 2022, the Plaza on Richmond Property was 98.0% leased to 21 tenants, including primarily fitness, apparel, beauty and wellness, personal services, and food and beverage tenants. The Plaza on Richmond Property has averaged 90.9% occupancy over the past 10 years. Additionally, the six largest tenants (comprising 63.9% of the net rentable area) have each been in occupancy at the center for at least 16 years. Only two tenants, 24 Hour Fitness and T.J. Maxx make up more than 9.2% net rentable area or 7.4% underwritten base rent.
Major Tenants.
Largest Tenant by UW Base Rent: 24 Hour Fitness (S&P: CCC-; 36,937 SF; 19.3% of NRA; 18.7% of underwritten base rent). 24 Hour Fitness has been a tenant since 1998 and has a lease expiring in October 2024 with one, five-year renewal option remaining. 24 Hour Fitness filed for bankruptcy protections at the corporate level in the second quarter of 2020. Ultimately, the company closed 134 gyms in the 2020 reorganization and exited bankruptcy in the fourth quarter of 2020. The entity on the lease is 24 Hour Fitness USA, Inc.
2nd Largest Tenant by UW Base Rent: T.J. Maxx (M/S: A2/A; 29,273 SF; 15.3% of NRA; 12.9% of underwritten base rent). T.J. Maxx has been a tenant since 1992 and has a lease expiring in January 2028 with one, five-year renewal option remaining. The entity on the lease is MarMaxx Operating Corp. and the lease guarantor is The TJX Companies, Inc.
3rd Largest Tenant by UW Base Rent: Golf Galaxy (M/S: Baa3/BBB (parent company); 15,078 SF; 7.9% of NRA; 7.4% of underwritten base rent). Founded in 1997, Golf Galaxy offers golf equipment, apparel, accessories and golf technology (including fitting bays, course simulators and on-site putting greens). Golf Galaxy has been a tenant since 2005 and has a lease expiring in May 2025 with one, five-year renewal option remaining. The entity on the lease is Golf Galaxy, LLC.
| THE INFORMATION IN THIS STRUCTURAL AND COLLATERAL TERM SHEET IS NOT COMPLETE AND MAY BE AMENDED PRIOR TO THE TIME OF SALE. THIS TERM SHEET IS NOT AN OFFER TO SELL THESE SECURITIES AND IT IS NOT A SOLICITATION OF AN OFFER TO BUY THESE SECURITIES IN ANY JURISDICTION WHERE THE OFFER OR SALE IS NOT PERMITTED. | ||
| ||
| Retail – Anchored | Loan #10 | Cut-off Date Balance: | $44,000,000 | |
5070-5176 Richmond Avenue and 3307 Sage Road Houston, TX 77056 | Plaza on Richmond | Cut-off Date LTV: U/W NCF DSCR: U/W NOI Debt Yield: | 42.8% 1.89x 10.9% |
The following table presents certain information relating to the tenancy at the Plaza on Richmond Property:
Major Tenants
| Tenant Name | Credit Rating (Fitch/ Moody’s/ | Tenant NRSF | % of NRSF | Annual U/W Base Rent PSF(2) | Annual U/W Base Rent(2) | % of Total Annual U/W Base Rent | Lease Expiration Date | Ext. Options | Term. Option (Y/N) |
| Major Tenants | |||||||||
| 24 Hour Fitness | NR/NR/CCC- | 36,937 | 19.3% | $26.38 | $974,436 | 18.7% | 10/31/2024 | 1, 5-year | N |
| T.J. Maxx | NR/A2/A | 29,273 | 15.3% | $22.99 | $672,986 | 12.9% | 1/31/2028 | 1, 5-year | N |
| Golf Galaxy | NR/Baa3/BBB | 15,078 | 7.9% | $25.75 | $388,259 | 7.4% | 5/31/2025 | 1, 5-year | N |
| Office Depot | NR/NR/NR | 17,566 | 9.2% | $18.16 | $318,999 | 6.1% | 8/31/2024 | 2, 5-year | N |
| Ulta Salon | NR/NR/NR | 11,871 | 6.2% | $25.85 | $306,865 | 5.9% | 1/31/2026 | 2, 5-year | N |
| 110,725 | 57.8% | $24.04 | $2,661,545 | 51.0% | |||||
| Non-Major Tenants(3) | 76,932 | 40.2% | $33.18 | $2,552,583 | 49.0% | ||||
| Occupied Collateral Total | 187,657 | 98.0% | $27.79 | $5,214,128 | 100.0% | ||||
| Vacant Space | 3,875 | 2.0% | |||||||
| Collateral Total | 191,532 | 100.0% | |||||||
| (1) | Certain ratings are those of the parent company, whether or not the parent company guarantees the lease. |
| (2) | Annual U/W Base Rent PSF and Annual U/W Base Rent include contractual rent steps through June 2023 totaling $177,539. |
| (3) | Non-Major Tenants includes two tenants that have signed leases but have not taken occupancy. The lease with Smashburger is expected to commence in September 2022 and the lease with Nails of America is expected to commence in January 2023. |
The following table presents a summary of sales and occupancy costs for certain tenants at the Plaza on Richmond Property.
Tenant Sales(1)(2)
| 2018 Sales (PSF) | 2019 Sales (PSF) | 2020 Sales (PSF) | 2021 Sales (PSF) | TTM March 2022 Sales (PSF) | Occupancy Cost(3) | |
| 24 Hour Fitness | $100 | $96 | $55 | $76 | $75 | 55.6% |
| T.J. Maxx | $622 | $613 | $416 | $683 | NAV | 5.5% |
| Golf Galaxy | $319 | $311 | $306 | $415 | NAV | 10.0% |
| Ulta Salon | $662 | $656 | $417 | $568 | $588 | 7.1% |
| (1) | Information obtained from the borrower. |
| (2) | Tenants shown on the Major Tenants table above and not included on the Tenant Sales table are not required to report sales. |
| (3) | Occupancy cost based on underwritten base rent and any applicable reimbursements, divided by most recent reported sales. |
| THE INFORMATION IN THIS STRUCTURAL AND COLLATERAL TERM SHEET IS NOT COMPLETE AND MAY BE AMENDED PRIOR TO THE TIME OF SALE. THIS TERM SHEET IS NOT AN OFFER TO SELL THESE SECURITIES AND IT IS NOT A SOLICITATION OF AN OFFER TO BUY THESE SECURITIES IN ANY JURISDICTION WHERE THE OFFER OR SALE IS NOT PERMITTED. | ||
| ||
| Retail – Anchored | Loan #10 | Cut-off Date Balance: | $44,000,000 | |
5070-5176 Richmond Avenue and 3307 Sage Road Houston, TX 77056 | Plaza on Richmond | Cut-off Date LTV: U/W NCF DSCR: U/W NOI Debt Yield: | 42.8% 1.89x 10.9% |
The following table presents certain information relating to the lease rollover schedule at the Plaza on Richmond Property:
Lease Expiration Schedule(1)(2)
| Year Ending December 31, | No. of Leases Expiring | Expiring NRSF | % of Total NRSF | Cumulative Expiring NRSF | Cumulative % of Total NRSF | Annual U/W Base Rent | % of Total Annual U/W Base Rent | Annual U/W Base Rent PSF |
| MTM | 0 | 0 | 0.0% | 0 | 0.0% | $0 | 0.0% | $0.00 |
| 2022 | 0 | 0 | 0.0% | 0 | 0.0% | $0 | 0.0% | $0.00 |
| 2023 | 2 | 9,434 | 4.9% | 9,434 | 4.9% | $331,926 | 6.4% | $35.18 |
| 2024 | 2 | 54,503 | 28.5% | 63,937 | 33.4% | $1,293,435 | 24.8% | $23.73 |
| 2025 | 9 | 42,539 | 22.2% | 106,476 | 55.6% | $1,245,921 | 23.9% | $29.29 |
| 2026 | 2 | 14,871 | 7.8% | 121,347 | 63.4% | $432,265 | 8.3% | $29.07 |
| 2027 | 1 | 9,672 | 5.0% | 131,019 | 68.4% | $260,660 | 5.0% | $26.95 |
| 2028 | 3 | 35,800 | 18.7% | 166,819 | 87.1% | $999,093 | 19.2% | $27.91 |
| 2029 | 0 | 0 | 0.0% | 166,819 | 87.1% | $0 | 0.0% | $0.00 |
| 2030 | 0 | 0 | 0.0% | 166,819 | 87.1% | $0 | 0.0% | $0.00 |
| 2031 | 0 | 0 | 0.0% | 166,819 | 87.1% | $0 | 0.0% | $0.00 |
| 2032 | 3 | 20,838 | 10.9% | 187,657 | 98.0% | $650,828 | 12.5% | $31.23 |
| Thereafter | 0 | 0 | 0.0% | 187,657 | 98.0% | $0 | 0.0% | $0.00 |
| Vacant | 0 | 3,875 | 2.0% | 191,532 | 100.0% | $0 | 0.0% | $0.00 |
| Total/Weighted Average | 22 | 191,532 | 100.0% | $5,214,128 | 100.0% | $27.79(3) |
| (1) | Information obtained from the underwritten rent roll. |
| (2) | Certain tenants may have lease termination options that are exercisable prior to the originally stated expiration date of the related lease and are not considered in the rollover schedule. |
| (3) | Total/Weighted Average Annual U/W Base Rent PSF excludes vacant space. |
The following table presents historical occupancy percentages at the Plaza on Richmond Property:
Historical Occupancy
12/31/2019(1) | 12/31/2020(1) | 12/31/2021(1) | 7/1/2022(2) |
| 92.0% | 92.0% | 93.0% | 98.0% |
| (1) | Information obtained from a third party servicing report. |
| (2) | Information obtained from the underwritten rent roll. |
| THE INFORMATION IN THIS STRUCTURAL AND COLLATERAL TERM SHEET IS NOT COMPLETE AND MAY BE AMENDED PRIOR TO THE TIME OF SALE. THIS TERM SHEET IS NOT AN OFFER TO SELL THESE SECURITIES AND IT IS NOT A SOLICITATION OF AN OFFER TO BUY THESE SECURITIES IN ANY JURISDICTION WHERE THE OFFER OR SALE IS NOT PERMITTED. | ||
| ||
| Retail – Anchored | Loan #10 | Cut-off Date Balance: | $44,000,000 | |
5070-5176 Richmond Avenue and 3307 Sage Road Houston, TX 77056 | Plaza on Richmond | Cut-off Date LTV: U/W NCF DSCR: U/W NOI Debt Yield: | 42.8% 1.89x 10.9% |
Operating History and Underwritten Net Cash Flow. The following table presents certain information relating to the historical operating performance and underwritten net cash flow at the Plaza on Richmond Property:
Cash Flow Analysis
| 2019 | 2020 | 2021 | TTM 5/31/2022 | U/W | %(1) | U/W $ per SF | |
| Base Rent(2) | $4,582,833 | $4,295,477 | $4,388,522 | $4,448,732 | $5,036,588 | 61.1% | $26.30 |
| Rent Steps(3) | 0 | 0 | 0 | 0 | 177,539 | 2.2 | 0.93 |
| Grossed Up Vacant Space | 0 | 0 | 0 | 0 | 155,000 | 1.9 | 0.81 |
| Gross Potential Rent | $4,582,833 | $4,295,477 | $4,388,522 | $4,448,732 | $5,369,128 | 65.1% | $28.03 |
| Other Income(4) | 0 | 0 | 33,137 | 7,447 | 0 | 0.0 | 0.00 |
| Total Recoveries | 2,682,307 | 2,542,033 | 2,678,173 | 2,631,467 | 2,876,855 | 34.9 | $15.02 |
| Net Rental Income | $7,265,139 | $6,837,510 | $7,099,832 | $7,087,646 | $8,245,982 | 100.0% | $43.05 |
| (Vacancy & Credit Loss) | 0 | 0 | 0 | 0 | (268,456)(5) | (5.0) | (1.40) |
| Effective Gross Income | $7,265,139 | $6,837,510 | $7,099,832 | $7,087,646 | $7,977,526 | 96.7% | $41.65 |
| Real Estate Taxes | $1,438,490 | $1,412,329 | $1,424,226 | $1,434,722 | $1,424,226 | 17.9% | $7.44 |
| Insurance | 328,827 | 380,056 | 426,278 | 435,557 | 422,722 | 5.3 | 2.21 |
| Management Fee | 293,849 | 288,594 | 277,024 | 291,881 | 239,326 | 3.0 | 1.25 |
| Other Operating Expenses | 998,488 | 977,141 | 1,075,990 | 1,091,568 | 1,091,568 | 13.7 | 5.70 |
| Total Operating Expenses | $3,059,653 | $3,058,120 | $3,203,518 | $3,253,728 | $3,177,842 | 39.8% | $16.59 |
| Net Operating Income | $4,205,486 | $3,779,390 | $3,896,313 | $3,833,918(6) | $4,799,684(6) | 60.2% | $25.06 |
| Replacement Reserves | 0 | 0 | 0 | 0 | 38,306 | 0.5 | 0.20 |
| TI/LC | 0 | 0 | 0 | 0 | 54,347(7) | 0.7 | 0.28 |
| Net Cash Flow | $4,205,486 | $3,779,390 | $3,896,313 | $3,833,918 | $4,707,030 | 59.0% | $24.58 |
| NOI DSCR | 1.68x | 1.51x | 1.56x | 1.54x | 1.92x | ||
| NCF DSCR | 1.68x | 1.51x | 1.56x | 1.54x | 1.89x | ||
| NOI Debt Yield | 9.6% | 8.6% | 8.9% | 8.7% | 10.9% | ||
| NCF Debt Yield | 9.6% | 8.6% | 8.9% | 8.7% | 10.7% |
| (1) | Represents (i) percent of Net Rental Income for all revenue fields, (ii) percent of Gross Potential Rent for Vacancy & Credit Loss and (iii) percent of Effective Gross Income for all other fields. |
| (2) | Base Rent includes two tenants that have signed leases but have not taken occupancy. The lease with Smashburger is expected to commence in September 2022 and the lease with Nails of America is expected to commence in January 2023. |
| (3) | Represents contractual rent steps through June 2023. |
| (4) | The Other Income in 2021 and TTM 5/31/2022 is comprised of two non-recurring items relating to reimbursed legal expenses for negotiating a shared easement with the adjacent property owner and a worker's compensation rebate. |
| (5) | The underwritten economic vacancy is 5.0%. The Plaza on Richmond Property was 98.0% occupied as of July 1, 2022. |
| (6) | The increase in Net Operating Income from TTM 5/31/2022 to U/W is primarily due to three new leases commencing between February 2022 and January 2023 (anticipated) totaling approximately 10.9% of net rentable area and 12.5% underwritten base rent. |
| (7) | The TI/LC line item includes a $225,000 credit for upfront reserves. Excluding such credit the TI/LC’s equate to $1.46 per square foot and 3.5% of the Effective Gross Income. |
Appraisal. The appraiser concluded to an “as-is” Appraised Value for the Plaza on Richmond Property of $102,900,000 as of February 10, 2022. The appraisal also concluded to a fee simple land value of $103,200,000. The appraisal concluded to the land value based on the as-is vacant land value for comparable tracts in the Houston market, less the estimated cost of demolishing the existing improvements.
Environmental Matters. According to the Phase I environmental site assessment dated February 9, 2022, there was no evidence of any recognized environmental conditions at the Plaza on Richmond Property.
Market Overview and Competition. The Plaza on Richmond Property is located in Houston, Texas, approximately 7.1 miles southwest of downtown Houston. The Plaza on Richmond Property has access throughout the Houston area via Interstate 601 and Interstate 69, located 0.2 miles and 0.6 miles from the property, respectively. The immediate surrounding area contains significant residential development including single-family homes, apartments and condominiums. Notable commercial development in the area includes The Galleria shopping mall, a Simon owned mall, located approximately 0.5 miles north of the Plaza on Richmond Property. The 2.4 million square foot mall features 400 stores including Chanel, Gucci, Louis Vuitton, Neiman Marcus, Nordstrom and Saks Fifth Avenue and many dining options including The Cheesecake Factory, Del Frisco’s Double Eagle Steak House, the Daily Grill, and a food court. The Galleria development also features over 1.1 million square feet of adjoining office space. There are four hotels within 0.8 miles of the Plaza on Richmond Property including the Courtyard by Marriott Houston by the Galleria, Hyatt House Houston/Galleria,
| THE INFORMATION IN THIS STRUCTURAL AND COLLATERAL TERM SHEET IS NOT COMPLETE AND MAY BE AMENDED PRIOR TO THE TIME OF SALE. THIS TERM SHEET IS NOT AN OFFER TO SELL THESE SECURITIES AND IT IS NOT A SOLICITATION OF AN OFFER TO BUY THESE SECURITIES IN ANY JURISDICTION WHERE THE OFFER OR SALE IS NOT PERMITTED. | ||
| ||
| Retail – Anchored | Loan #10 | Cut-off Date Balance: | $44,000,000 | |
5070-5176 Richmond Avenue and 3307 Sage Road Houston, TX 77056 | Plaza on Richmond | Cut-off Date LTV: U/W NCF DSCR: U/W NOI Debt Yield: | 42.8% 1.89x 10.9% |
and Home2 Suites by Hilton at the Galleria. Directly east of the Plaza on Richmond Property the proposed Rosewood development is expected to cost $500 million and include a 150-room Rosewood Hotel, 80 condominium units and 30,000 square feet of retail space.
According to the appraisal, the estimated 2021 population within a one-, three- and five-mile radius was approximately 25,330, 216,233, and 529,451, respectively, and the average household income within the same radii was $128,078, $131,326, and $126,821, respectively.
According to a third-party market research report, the Plaza on Richmond Property is located within the Uptown/Galleria retail submarket of the greater Houston retail market. As of July 19, 2022, the submarket reported total inventory of approximately 4.4 million square feet with a 3.2% vacancy rate and average asking rent of $42.83 per square foot. Vacancy in the retail submarket peaked in the second quarter of 2012 at 5.4%. Additionally, according to a third-party market research provider, there is nothing under construction in the retail submarket. The appraiser concluded to market rents for the Plaza on Richmond Property, ranging from $24.00 per square foot for junior anchor space, to $65.00 per square foot for pad outparcel space (see table below).
The following table presents certain information relating to the appraiser’s market rent conclusions for the Plaza on Richmond Property:
Market Rent Summary(1)
| Jr. Anchor | Inline | Pad | Storage | |
| Market Rent (PSF) | $24.00 | $40.00 | $65.00 | $28.00 |
| Lease Term (Years) | 10 | 5 | 10 | 5 |
Lease Type (Reimbursements) | Net | Net | Net | Net |
| Rent Increase Projection | 2.0%/year | 2.0%/year | 2.0%/year | 2.0%/year |
| Tenant Improvements (New / Renewal) | $40.00 / $0.00 | $45.00 / $0.00 | $75.00 / $0.00 | $0.00 / $0.00 |
| Leasing Commissions (New / Renewal) | 6.0% / 3.0% | 6.0% / 3.0% | 6.0% / 3.0% | 6.0% / 3.0% |
| Free Rent Months (New / Renewal) | 0 / 0 | 0 / 0 | 0 / 0 | 0 / 0 |
| (1) | Information obtained from the appraisal. |
The table below presents certain information relating to comparable sales pertaining to the Plaza on Richmond Property, as identified by the appraiser:
Comparable Sales(1)
Property Name | Location | Year Built/Renovated | Rentable Area (SF) | Occupancy | Sale Date | Sale Price | Sale Price (PSF) |
| Plaza on Richmond | 5070-5176 Richmond Avenue and 3307 Sage Road Houston, TX | 1960/2005 | 191,532 | 98.0%(2) | |||
| Ella Oaks | 3323 Ella Houston, TX | 1950/2020 | 27,042 | 100.0% | 12/2021 | $19,030,000 | $704 |
| Alec Center | 3200-3298 South Loop West Houston, TX | 1980/2003 | 34,091 | 100.0% | 12/2021 | $8,500,000 | $249 |
| Retail Center | 5201-5223 West Lovers Lane Dallas, TX | 1986/2002 | 50,306 | 100.0% | 12/2020 | $26,500,000 | $527 |
| Preston Forest Shopping Center | 11700 Preston Road Dallas, TX | 1960/NAP | 195,554 | 95.0% | 1/2020 | $64,000,000 | $327 |
| Lakewood Shopping Center | 1904 Abrams Road Dallas, TX | 1946/NAP | 66,629 | 93.0% | 12/2019 | $40,000,000 | $600 |
| The Mix at Midtown | 3201 Louisiana Street Houston, TX | 2008/NAP | 72,901 | 100.0% | 9/2019 | $34,300,000 | $471 |
| (1) | Information obtained from the appraisal. |
| (2) | Per underwritten rent roll. |
| THE INFORMATION IN THIS STRUCTURAL AND COLLATERAL TERM SHEET IS NOT COMPLETE AND MAY BE AMENDED PRIOR TO THE TIME OF SALE. THIS TERM SHEET IS NOT AN OFFER TO SELL THESE SECURITIES AND IT IS NOT A SOLICITATION OF AN OFFER TO BUY THESE SECURITIES IN ANY JURISDICTION WHERE THE OFFER OR SALE IS NOT PERMITTED. | ||
| ||
| Retail – Anchored | Loan #10 | Cut-off Date Balance: | $44,000,000 | |
5070-5176 Richmond Avenue and 3307 Sage Road Houston, TX 77056 | Plaza on Richmond | Cut-off Date LTV: U/W NCF DSCR: U/W NOI Debt Yield: | 42.8% 1.89x 10.9% |
Escrows.
Real Estate Taxes – The loan documents require an upfront deposit of $996,960 for real estate taxes and ongoing monthly deposits of $124,620.
Insurance – The loan documents require an upfront deposit of $147,952 for insurance premiums and ongoing monthly deposits of $36,988. Notwithstanding the above, the borrower’s obligation to make monthly insurance reserve payments will be waived if (i) no event of default is continuing, (ii) the insurance policies maintained by the borrower are part of a blanket or umbrella policy approved by the lender in its reasonable discretion and (iii) the borrower provides the lender paid receipts for the payment of the insurance premiums no later than 10 business days prior to policy expiration. For the avoidance of doubt, as of the time of loan origination, the policies maintained by the borrower covering the Plaza on Richmond Property are not part of a blanket or umbrella policy and the monthly reserve is active.
Replacement Reserve – The loan documents require ongoing monthly replacement reserve deposits of $3,192 ($0.20 per square foot per year) subject to a cap of $114,915.
Leasing Reserve – The loan documents require an upfront deposit of $2,250,000 and upon the reserve balance falling below $1,000,000, ongoing monthly reserves of $11,970 ($0.75 per square foot per year) for tenant improvements and leasing commissions, subject to a cap of $1,000,000.
Existing TI/LC Obligations – The loan documents require an upfront deposit of $430,000 for outstanding tenant improvements and leasing commissions related to the tenant Floor & Decor.
Lockbox and Cash Management. The Plaza on Richmond Mortgage Loan is structured with a soft lockbox and springing cash management. The borrower and property manager are required to deposit all rents into an established deposit account with two business days of receipt. Upon the occurrence of a Cash Trap Event Period (defined below), all amounts available in the deposit account will be transferred to a cash management account controlled by the lender on each business day and applied in accordance with the cash flow waterfall in the cash management agreement. During the continuance of a Cash Trap Event Period, all excess cash flow will be held by the lender as additional collateral.
A “Cash Trap Event Period” will commence upon the earliest of the following:
| (i) | the occurrence of an event of default; |
| (ii) | the hypothetical 30-year amortizing net cash flow debt service coverage ratio (“NCF DSCR”) falling below 1.10x, tested quarterly; |
| (iii) | either 24 Hour Fitness or T.J. Maxx (individually or collectively, as the context may require, “Major Tenant”) failing to exercise its respective extension option 6 months prior to the then-current expiration date; |
| (iv) | either Major Tenant going dark, vacating, or otherwise failing to occupy all or substantially all of its space (other than temporary cessation of operations in connection with remodelling, renovation, alteration, repair or restoration of the premises or a portion thereof, in each case, performed in accordance with the lease); |
| (v) | either Major Tenant filing as a debtor, bankruptcy or similar insolvency proceeding; or |
| (vi) | either Major Tenant surrendering, cancelling or terminating its lease prior to its then-scheduled expiration date (or giving notice thereof). |
A Cash Trap Event Period will end upon the occurrence of the following:
| ● | with regard to clause (i), the cure of such event of default; |
| ● | with regard to clause (ii), (x) the hypothetical 30-year amortizing NCF DSCR being greater than or equal to 1.15x for two consecutive calendar quarters or (y) the borrower sponsor having deposited the amount, posted as cash or an acceptable letter of credit, required to remain above the 1.15x threshold for the following 12 months (as estimated by the lender) with such amount being required to be trued-up after said 12 month period (“DSCR Trigger Avoidance Deposit”); |
| ● | with regard to clauses (iii) through (vi), (x) the occurrence of a Major Tenant Re-Tenanting Event (as defined below) or (y) the borrower sponsor having made the applicable Major Tenant Event Avoidance Deposit (as defined below); |
| ● | with regard to clause (iii), such Major Tenant having exercised its renewal or extension option pursuant to the terms of its lease or otherwise on terms and conditions reasonably satisfactory to the lender for a period not less than three years; |
| ● | with regard to clause (iv), such Major Tenant having resumed its normal business operations in 80% of its space for 30 consecutive calendar days; |
| ● | with regard to clause (v), such Major Tenant having its lease affirmed in the applicable bankruptcy proceeding, provided that such Major Tenant is required to be actually paying all rents and other amounts due under its lease; or |
| ● | with regard to clause (vi), such Major Tenant revoking such notice of any termination, cancellation or surrender of its lease and delivering to the lender a tenant estoppel certificate certifying that such lease is in full force and effect and that there are no existing circumstances that could reasonably be expected to give such Major Tenant the right to terminate, cancel or surrender its lease. |
“Major Tenant Re-Tenanting Event” means that the lender has received evidence in form and substance reasonably satisfactory (including delivery of an estoppel certificate) that either (i) at least 80% of the Major Tenant space has been leased to one or more satisfactory replacement tenants or (ii) the Major Tenant assigns its lease pursuant to an unilateral assignment right of Major Tenant thereunder or to an assignee pursuant to an assignment, and in either case (i) or (ii), such assignee is in occupancy of the space and
| THE INFORMATION IN THIS STRUCTURAL AND COLLATERAL TERM SHEET IS NOT COMPLETE AND MAY BE AMENDED PRIOR TO THE TIME OF SALE. THIS TERM SHEET IS NOT AN OFFER TO SELL THESE SECURITIES AND IT IS NOT A SOLICITATION OF AN OFFER TO BUY THESE SECURITIES IN ANY JURISDICTION WHERE THE OFFER OR SALE IS NOT PERMITTED. | ||
| ||
| Retail – Anchored | Loan #10 | Cut-off Date Balance: | $44,000,000 | |
5070-5176 Richmond Avenue and 3307 Sage Road Houston, TX 77056 | Plaza on Richmond | Cut-off Date LTV: U/W NCF DSCR: U/W NOI Debt Yield: | 42.8% 1.89x 10.9% |
is then paying full, unabated rent pursuant to the terms of its lease, and open for business (or the aggregate amount of such abatement has been deposited on reserve with the lender), and that all tenant improvement costs and leasing commissions provided in each such replacement lease have been paid.
“Major Tenant Event Avoidance Deposit” shall mean an amount equal to (a) $40.00 per rentable square foot, multiplied by the total amount of the applicable Major Tenant space less (b) the amount of funds then on deposit in the Cash Trap reserve applicable to such Major Tenant, posted as cash or an acceptable letter of credit.
Property Management. The Plaza on Richmond Property is managed by Greenwich Management Co, Inc., which is affiliated with the borrower sponsor.
Partial Release. Not permitted.
Real Estate Substitution. Not permitted.
Subordinate and Mezzanine Indebtedness. None.
Ground Lease. None.
Terrorism Insurance. The loan documents require that the “all risk” insurance policy required to be maintained by the borrower provides coverage for terrorism in an amount equal to the full replacement cost of the Plaza on Richmond Property, as well as business interruption insurance covering no less than the 18-month period following the occurrence of a casualty event, together with a 6-month extended period of indemnity (provided that if TRIPRA or a similar statute is not in effect, the borrower will not be obligated to pay terrorism insurance premiums in excess of two times the premium for the casualty and business interruption coverage on a stand-alone basis (without giving effect to the cost of terrorism, flood and earthquake and business interruption components of such coverage)).
| THE INFORMATION IN THIS STRUCTURAL AND COLLATERAL TERM SHEET IS NOT COMPLETE AND MAY BE AMENDED PRIOR TO THE TIME OF SALE. THIS TERM SHEET IS NOT AN OFFER TO SELL THESE SECURITIES AND IT IS NOT A SOLICITATION OF AN OFFER TO BUY THESE SECURITIES IN ANY JURISDICTION WHERE THE OFFER OR SALE IS NOT PERMITTED. | ||
| ||
| No. 11 – Cerritos Center Court |
| Mortgage Loan Information | Mortgaged Property Information | |||||
| Mortgage Loan Seller: | Wells Fargo Bank, National Association | Single Asset/Portfolio: | Single Asset | |||
Credit Assessment (Fitch/KBRA/Moody’s): | NR/NR/NR | Property Type – Subtype: | Office - Suburban | |||
| Original Principal Balance: | $34,000,000 | Location: | Cerritos, CA | |||
| Cut-off Date Balance: | $34,000,000 | Size: | 169,762 SF | |||
| % of Initial Pool Balance: | 3.1% | Cut-off Date Balance Per SF: | $200.28 | |||
| Loan Purpose: | Refinance | Maturity Date Balance Per SF: | $185.90 | |||
| Borrower Sponsors: | Rohit Kumar and Jayaprasad Vejendla | Year Built/Renovated: | 2002/2018 | |||
| Guarantors: | Rohit Kumar and Jayaprasad Vejendla | Title Vesting: | Leasehold | |||
| Mortgage Rate: | 5.3140% | Property Manager: | G&E Real Estate Management Services, Inc. | |||
| Note Date: | June 30, 2022 | Current Occupancy (As of): | 100.0% (6/28/2022) | |||
| Seasoning: | 1 month | YE 2021 Occupancy: | 97.4% | |||
| Maturity Date: | July 11, 2032 | YE 2020 Occupancy: | 97.4% | |||
| IO Period: | 60 months | YE 2019 Occupancy: | 83.0% | |||
| Loan Term (Original): | 120 months | YE 2018 Occupancy: | 94.1% | |||
| Amortization Term (Original): | 360 months | As-Is Appraised Value: | $50,400,000 | |||
| Loan Amortization Type: | Interest Only, Amortizing Balloon | As-Is Appraised Value Per SF: | $296.89 | |||
| Call Protection: | L(25),D(91),O(4) | As-Is Appraisal Valuation Date: | May 3, 2022 | |||
| Lockbox Type: | Soft/Springing Cash Management | Underwriting and Financial Information(3) | ||||
| Additional Debt: | None | TTM NOI (4/30/2022): | $3,585,124 | |||
| Additional Debt Type (Balance): | NAP | YE 2021 NOI: | $3,647,112 | |||
| YE 2020 NOI(4)(5): | $3,893,639 | |||||
| YE 2019 NOI(5): | $1,900,924 | |||||
| U/W Revenues: | $6,397,288 | |||||
| U/W Expenses: | $2,703,413 | |||||
| Escrows and Reserves | U/W NOI: | $3,693,875 | ||||
| Initial | Monthly | Cap | U/W NCF: | $3,645,068 | ||
| Taxes | $221,600 | $55,401 | NAP | U/W DSCR based on NOI/NCF: | 1.63x / 1.61x | |
| Insurance(1) | $0 | Springing | NAP | U/W Debt Yield based on NOI/NCF: | 10.9% / 10.7% | |
| Replacement Reserve | $0 | $3,254 | $117,136 | U/W Debt Yield at Maturity based on NOI/NCF: | 11.7% / 11.6% | |
| TI/LC Reserve(2) | $1,600,000 | Springing | $1,600,000 | Cut-off Date LTV Ratio: | 67.5% | |
| Existing TI/LC Reserve | $1,469,740 | $0 | NAP | LTV Ratio at Maturity: | 62.6% | |
| Rent Concession Reserve | $942,532 | $0 | NAP | |||
| Ground Rent Reserve | $41,000 | $41,000 | NAP | |||
| Sources and Uses | |||||||
| Sources | Uses | ||||||
| Original Mortgage Loan amount | $34,000,000 | 100.0% | Loan payoff | $26,259,661 | 77.2 | % | |
| Upfront reserves | 4,274,872 | 12.6 | |||||
| Closing costs | 407,729 | 1.2 | |||||
| Return of Equity | 3,057,739 | 9.0 | |||||
| Total Sources | $34,000,000 | 100.0% | Total Uses | $34,000,000 | 100.0 | % | |
| (1) | Ongoing monthly insurance reserve deposits in an amount equal to 1/12 of the insurance premiums that the lender estimates will be payable for the renewal of the required coverages will not be required as long as (a) no event of default is continuing (b) the policy maintained by the borrower is under one or more blanket policies reasonably acceptable to the lender, and (c) the lender has received evidence of the renewal of such policies no later than 10 business days prior to the expiration of the policies. |
| (2) | So long as the balance of the TI/LC Reserve is equal to or greater than $1,000,000, the monthly deposit will not be required. |
| (3) | While the Cerritos Center Court Mortgage Loan (defined below) was originated after the emergence of the novel coronavirus pandemic and the economic disruption resulting from measures to combat the pandemic, the pandemic is an evolving situation and could impact the Cerritos Center Court Mortgage Loan more severely than assumed in the underwriting and could adversely affect the NOI, NCF and occupancy information, as well as the appraised value and the DSCR, LTV and Debt Yield metrics presented above. See “Risk Factors— Risks Related to Market Conditions and Other External Factors—Coronavirus Pandemic Has Adversely Affected the Global Economy and Will Likely Adversely Affect the Performance of the Mortgage Loans” in the Preliminary Prospectus. |
| (4) | YE 2020 NOI represents the period from July 2020 through December, annualized, as the Cerritos Center Court Property (as defined below) was acquired by the borrower in July 2020 and operating history from 2020 is not available. |
| (5) | The increase from YE 2019 NOI to YE 2020 NOI was driven in part by the $970,215 free rent adjustment and two new leases with commencement dates in July 2019 and April 2020, collectively representing 16.7% of net rentable area and 17.6% of underwritten base rent. |
| THE INFORMATION IN THIS STRUCTURAL AND COLLATERAL TERM SHEET IS NOT COMPLETE AND MAY BE AMENDED PRIOR TO THE TIME OF SALE. THIS TERM SHEET IS NOT AN OFFER TO SELL THESE SECURITIES AND IT IS NOT A SOLICITATION OF AN OFFER TO BUY THESE SECURITIES IN ANY JURISDICTION WHERE THE OFFER OR SALE IS NOT PERMITTED. | ||
| ||
| Office - Suburban | Loan #11 | Cut-off Date Balance: | $34,000,000 | |
17777 Center Court Drive North Cerritos, CA 90703
| Cerritos Center Court | Cut-off Date LTV: U/W NCF DSCR: U/W NOI Debt Yield: | 67.5% 1.61x 10.9% |
The Mortgage Loan. The mortgage loan (the “Cerritos Center Court Mortgage Loan”) is evidenced by a promissory note in the original principal amount of $34,000,000 and secured by the first priority leasehold interest encumbering a multi-tenant office property totaling 169,762 square feet located in Cerritos, California (the “Cerritos Center Court Property”).
The Borrower and Borrower Sponsor. The borrower is Nome Cerritos Center Court LLC, a Delaware limited liability company and single purpose entity with one independent director. Legal counsel to the borrower delivered a non-consolidation opinion in connection with the origination of the Cerritos Center Court Mortgage Loan. The borrower sponsors and nonrecourse carveout guarantors are Rohit Kumar and Jayaprasad Vejendla.
Mr. Kumar is the Chief Executive Officer and one of the founders of Nome Capital Partners, a real estate investment management firm founded in 2014. Based in the San Francisco bay area, the firm invests in and manages a current portfolio totaling $768 million.
The Property. The Cerritos Center Court Property consists of an 8-story, 169,762 square foot, Class A, multi-tenant office building, located in Cerritos, Los Angeles County, California. Built in 2002, renovated in 2018 and situated on a 3.5-acre site, the Cerritos Center Court Property is immediately adjacent to the 203-room Sheraton Cerritos Hotel. The Cerritos Center Court Property is part of a 125-acre master planned central business district in Cerritos, including approximately 1MM SF of Class A office development, per the appraisal.
The borrower sponsor acquired the leasehold title to the Cerritos Center Court Property from Blackstone in July 2020. Prior to the sale, the seller spent approximately $2.2 million on renovations in 2018, including upgrades to the lobby, multi-tenant corridors, elevator lobbies, shared restrooms and mechanical systems. The borrower sponsor further spent approximately $2.5 million on interior improvements.
The Cerritos Center Court Property has access to 678 surface and garage parking spaces, resulting in a parking ratio of 4.0 spaces per 1,000 square feet. As of June 28, 2022, the Cerritos Center Court Property is 100.0% occupied by 15 tenants.
Major Tenants.
Largest Tenant by UW Base Rent: Spectrum Pacific West, LLC (“Spectrum”; 52,506 square feet; 30.9% of net rentable area; 31.8% of underwritten base rent; 3/31/2024 lease expiration). Spectrum Business is a division of Charter Communications dedicated to providing internet, phone, and TV services to small businesses across 41 states. Spectrum has been a tenant at the Cerritos Center Court Property since 2010 and expanded its space by 21,813 square feet in 2012 and by 21,480 square feet in 2013. The tenant has one remaining 5-year extension option and no termination options.
2nd Largest Tenant by UW Base Rent: Kabafusion (42,416 square feet; 25.0% of net rentable area; 23.1% of underwritten base rent; 2/28/2030 lease expiration). Founded in 2010, Kabafusion is a home infusion company specializing in intravenous immunoglobulin, subcutaneous immune globulin and acute home-infusion IV therapies. Kabafusion has service capabilities in over 40 states. Kabafusion has one of its two corporate headquarters at the Cerritos Center Court Property (the other its east-coast headquarters in Lexington, Massachusetts). The tenant has two remaining 5-year extension options. Kabafusion has a one-time termination option effective as of January 1, 2028, with notice required by February 1, 2027 and the payment of a $500,000 termination fee.
3rd Largest Tenant by UW Base Rent: CCC Information Services, Inc. (“CCC”; 22,031 square feet; 13.0% of net rentable area; 13.6% of underwritten base rent; 12/31/2027 lease expiration). CCC is a provider of software and services to help insurance companies, collision repair shops, and independent appraisers evaluate and settle automobile claims. The tenant has been at the Cerritos Center Court Property since April 2020 and has one remaining 5-year extension option and no termination options
| THE INFORMATION IN THIS STRUCTURAL AND COLLATERAL TERM SHEET IS NOT COMPLETE AND MAY BE AMENDED PRIOR TO THE TIME OF SALE. THIS TERM SHEET IS NOT AN OFFER TO SELL THESE SECURITIES AND IT IS NOT A SOLICITATION OF AN OFFER TO BUY THESE SECURITIES IN ANY JURISDICTION WHERE THE OFFER OR SALE IS NOT PERMITTED. | ||
| ||
| Office - Suburban | Loan #11 | Cut-off Date Balance: | $34,000,000 | |
17777 Center Court Drive North Cerritos, CA 90703
| Cerritos Center Court | Cut-off Date LTV: U/W NCF DSCR: U/W NOI Debt Yield: | 67.5% 1.61x 10.9% |
The following table presents certain information relating to the tenancy at the Cerritos Center Court Property:
Major Tenants
| Tenant Name | Credit Rating (Fitch/ Moody’s/ | Tenant NRSF | % of NRSF | Annual U/W Base Rent PSF(2) | Annual U/W Base Rent(2) | % of Total Annual U/W Base Rent | Lease Expiration Date | Ext. Options | Term. Option (Y/N) |
| Major Tenants | |||||||||
| Spectrum Pacific West, LLC | NR/Ba2/BB+ | 52,506 | 30.9% | $39.84 | $2,091,839 | 31.8% | 3/31/2024 | 1, 5-year | N |
| Kabafusion | NR/NR/NR | 42,416 | 25.0% | $35.84 | $1,520,189 | 23.1% | 2/28/2030 | 2, 5-year | Y(3) |
| CCC Information Services, Inc. | NR/NR/NR | 22,031 | 13.0% | $40.65 | $895,560 | 13.6% | 12/31/2027 | 1, 5-year | N |
| RGN-Cerritos I, LLC | NR/NR/NR | 14,830 | 8.7% | $35.40 | $524,982 | 8.0% | 9/30/2025 | 1, 43-month | N |
| Prologis, L.P. | NR/Baa1/A- | 10,668 | 6.3% | $40.65 | $433,648 | 6.6% | 5/31/2025 | 1, 5-year | Y(4) |
| 142,451 | 83.9% | $38.37 | $5,466,219 | 83.0% | |||||
| Non-Major Tenants | 27,311 | 16.1% | $40.99 | $1,119,344 | 17.0% | ||||
| Occupied Collateral Total | 169,762 | 100.0% | $38.79 | $6,585,563 | 100.0% | ||||
| Vacant Space | 0 | 0.0% | |||||||
| Collateral Total | 169,762 | 100.0% | |||||||
| (1) | Certain ratings are those of the parent company whether or not the parent company guarantees the lease. |
| (2) | Annual U/W Base Rent PSF and Annual U/W Base Rent include contractual rent steps through August 2023 totaling $161,531 and straight-line rent averaging credit over the remaining lease term for investment grade tenants Prologis, L.P., Western & Southern Life Insurance and Comptroller of Public Accounts totaling $54,647. |
| (3) | Kabafusion has a one-time termination option effective as of January 1, 2028, with notice required by February 1, 2027 and the payment of a $500,000 termination fee. |
| (4) | Prologis, L.P. has a one-time termination option effective as of March 31, 2023 with notice on or before August 31, 2022 with a termination fee of $274,204.45. The tenant may reduce said termination fee by $513.35 for every $1,000 of the refurbishment allowance that remains unused. |
The following table presents certain information relating to the lease rollover schedule at the Cerritos Center Court Property:
Lease Expiration Schedule(1)(2)
| Year Ending December 31, | No. of Leases Expiring | Expiring NRSF | % of Total NRSF | Cumulative Expiring NRSF | Cumulative % of Total NRSF | Annual U/W Base Rent(3) | % of Total Annual U/W Base Rent | Annual U/W Base Rent PSF(3) |
| MTM | 0 | 0 | 0.0% | 0 | 0.0% | $0 | 0.0% | $0.00 |
| 2022 | 3 | 3,584 | 2.1% | 3,584 | 2.1% | $139,794 | 2.1% | $39.00 |
| 2023 | 3 | 6,783 | 4.0% | 10,367 | 6.1% | $265,688 | 4.0% | $39.17 |
| 2024 | 5 | 55,845 | 32.9% | 66,212 | 39.0% | $2,231,373 | 33.9% | $39.96 |
| 2025 | 3 | 29,422 | 17.3% | 95,634 | 56.3% | $1,108,880 | 16.8% | $37.69 |
| 2026 | 0 | 0 | 0.0% | 95,634 | 56.3% | $0 | 0.0% | $0.00 |
| 2027 | 2 | 28,391 | 16.7% | 124,025 | 73.1% | $1,158,740 | 17.6% | $40.81 |
| 2028 | 1 | 3,092 | 1.8% | 127,117 | 74.9% | $160,898 | 2.4% | $52.04 |
| 2029 | 0 | 0 | 0.0% | 127,117 | 74.9% | $0 | 0.0% | $0.00 |
| 2030 | 4 | 42,416 | 25.0% | 169,533 | 99.9% | $1,520,189 | 23.1% | $35.84 |
| 2031 | 0 | 0 | 0.0% | 169,533 | 99.9% | $0 | 0.0% | $0.00 |
| 2032 | 0 | 0 | 0.0% | 169,533 | 99.9% | $0 | 0.0% | $0.00 |
| Thereafter(3) | 2 | 229 | 0.1% | 169,762 | 100.0% | $0 | 0.0% | $0.00 |
| Vacant | 0 | 0 | 0.0% | 169,762 | 100.0% | $0 | 0.0% | $0.00 |
| Total/Weighted Average | 23 | 169,762 | 100.0% | $6,585,563 | 100.0% | $38.79 |
| (1) | Information obtained from the underwritten rent roll. |
| (2) | Certain tenants may have lease termination options that are exercisable prior to the originally stated expiration date of the related lease and are not considered in the rollover schedule. |
| (3) | Thereafter includes two spaces attributable to engineering and janitorial, neither of which has a distinct lease agreement or any attributable Annual U/W Base Rent. |
| THE INFORMATION IN THIS STRUCTURAL AND COLLATERAL TERM SHEET IS NOT COMPLETE AND MAY BE AMENDED PRIOR TO THE TIME OF SALE. THIS TERM SHEET IS NOT AN OFFER TO SELL THESE SECURITIES AND IT IS NOT A SOLICITATION OF AN OFFER TO BUY THESE SECURITIES IN ANY JURISDICTION WHERE THE OFFER OR SALE IS NOT PERMITTED. | ||
| ||
| Office - Suburban | Loan #11 | Cut-off Date Balance: | $34,000,000 | |
17777 Center Court Drive North Cerritos, CA 90703
| Cerritos Center Court | Cut-off Date LTV: U/W NCF DSCR: U/W NOI Debt Yield: | 67.5% 1.61x 10.9% |
The following table presents historical occupancy percentages at the Cerritos Center Court Property:
Historical Occupancy
12/31/2018(1) | 12/31/2019(1) | 12/31/2020(1) | 12/31/2021(1) | 6/28/2022(2) |
| 94.1% | 83.0% | 97.4% | 97.4% | 100.0% |
| (1) | Information obtained from a third party research provider. |
| (2) | Information obtained from the underwritten rent roll. |
Market Overview and Competition. The Cerritos Center Court Property is located in Cerritos, California. The Cerritos Center Court Property is situated approximately 19.5 miles southeast of the Los Angeles central business district (“CBD”), 9.8 miles northwest of the Anaheim CBD and 23.5 miles southeast of the Los Angeles International Airport. The Cerritos Center Court Property is part of a 125-acre master planned central business district in Cerritos, including approximately 1MM SF of Class A office development, per the appraisal. The 600,000 square foot open-air Cerritos Towne Center is located approximately 0.2 miles northeast of the Cerritos Center Court Property and includes a Regal Edwards Cinema, Kohl’s, Planet Fitness, Trade Joe’s, PetSmart and Ulta Beauty.
According to a third-party market research provider, within a 1-, 3- and 5- mile radius of the Cerritos Center Court Property, the estimated 2022 population is 23,818, 202,066 and 613,613, respectively, and the 2022 average household income is $131,623, $110,200 and $105,356, respectively. According to a third-party market research report, the property is situated within the Mid-Cities office submarket of the greater Los Angeles office market. As of July 12, 2022, the submarket reported total inventory of approximately 11.9 million square feet with a 5.5% vacancy rate and average market rents of $31.27 per square foot. There is currently approximately 90,000 square feet under construction in the submarket. The appraiser identified five lease comparables with rents ranging from $35.40 to $36.00 per square foot, and concluded to a market rent of $35.40 per square foot.
The following table presents certain information relating to the appraiser’s market rent conclusions for the Cerritos Center Court Property:
Market Rent Summary(1)
| Market Rent (PSF) | $35.40 |
| Lease Term (Years) | 5 |
| Lease Type | Full Service Gross |
| Rent Increase Projection | 3.0%/Year |
| TI (New/Renewal) | $25.00 / $15.00 |
| LC (New/Renewal) | 6.0% / 3.0% |
| Free Rent (New/Renewal) | 5 months / 0 months |
| (1) | Information obtained from the appraisal. |
| THE INFORMATION IN THIS STRUCTURAL AND COLLATERAL TERM SHEET IS NOT COMPLETE AND MAY BE AMENDED PRIOR TO THE TIME OF SALE. THIS TERM SHEET IS NOT AN OFFER TO SELL THESE SECURITIES AND IT IS NOT A SOLICITATION OF AN OFFER TO BUY THESE SECURITIES IN ANY JURISDICTION WHERE THE OFFER OR SALE IS NOT PERMITTED. | ||
| ||
| Office - Suburban | Loan #11 | Cut-off Date Balance: | $34,000,000 | |
17777 Center Court Drive North Cerritos, CA 90703
| Cerritos Center Court | Cut-off Date LTV: U/W NCF DSCR: U/W NOI Debt Yield: | 67.5% 1.61x 10.9% |
The table below presents certain information relating to comparable sales pertaining to the Cerritos Center Court Property identified by the appraiser:
Comparable Sales(1)
| Property Name | Location | Year Built/Renovated | Rentable Area (SF) | Sale Date | Sale Price | Sale Price (PSF) |
Stadium Crossings 2125 E Katella Avenue
| Anaheim, CA | 2000/NAP | 106,068 | Mar-2022 | $31,500,000 | $297 |
MacArthur Place 2 MacArthur Place | Santa Ana, CA | 2001/NAP | 208,142 | Sep-2021 | $99,000,000 | $476 |
Westlake Park 2915, 2931, 2945, 3011 & 3027 Townsgate Road
| Westlake Village, CA | 2008/NAP | 239,003 | Jul-2021 | $80,800,000 | $338 |
Gramercy Plaza 2050 West 190th Street | Torrance, CA | 1991/NAP | 158,367 | Jun-2021 | $45,000,000 | $284 |
The Park Calabasas 4500 Park Granada | Calabasas, CA | 1986/2018 | 222,524 | Apr-2021 | $79,000,000 | $355 |
Summit IV 15 & 25 Enterprise | Aliso Viejo, CA | 2001/NAP | 297,277 | Mar-2021 | $92,000,000 | $309 |
| (1) | Information obtained from the appraisal. |
The following table presents certain information relating to the appraiser’s market rent conclusions for the Cerritos Center Court Property:
Comparable Office Leases(1)
| Property Name/Location | Year Built/ Renovated | Total GLA (SF) | Tenant | Tenant Size (SF) | Lease Start Date | Lease Term | Annual Base Rent PSF | Lease Type |
Cerritos Center Court (Subject) 17777 Center Court Drive North Cerritos, CA | 2002/2018 | 169,762(2) | ||||||
Cerritos Towne Center II 12750 Center Court Dr., Ste 290 Cerritos, CA | 1988/NAP | 142,119 | KT America | 2,527 | Sept-2022 (Anticipated) | 6.0 Yrs. | $36.00 |
FSG
|
Plaza Tower 18000 Studebaker Rd., Ste 670 Cerritos, CA | 1986/2013 | 191,940 | Oncology Group | 1,439 | Jun-2022 | 3.0 Yrs. | $35.40 |
FSG
|
Cerritos Towne Center III 17785 Center Court Dr., Ste 660 Cerritos, CA
| 1989/NAP | 137,711 | Resare Marketing | 2,012 | Feb-2022 | 3.3 Yrs. | $35.40 | FSG |
Centerpointe La Palma – Bldg A 4 Centerpointe Dr. La Palma, CA
| 1986/NAP | 82,662 | BP Corporation | 14,892 | Jan-2022 | 1.0 Yrs. | $35.40 | FSG |
Cerritos Towne Center 12800 Center Court Dr., Ste 575 Cerritos, CA
| 2009/NAP | 105,454 | Listing | 2,743 | May-2022 | NAV | $35.40 | FSG |
| (1) | Information obtained from the appraisal. |
| (2) | Information obtained from the underwritten rent roll. |
| THE INFORMATION IN THIS STRUCTURAL AND COLLATERAL TERM SHEET IS NOT COMPLETE AND MAY BE AMENDED PRIOR TO THE TIME OF SALE. THIS TERM SHEET IS NOT AN OFFER TO SELL THESE SECURITIES AND IT IS NOT A SOLICITATION OF AN OFFER TO BUY THESE SECURITIES IN ANY JURISDICTION WHERE THE OFFER OR SALE IS NOT PERMITTED. | ||
| ||
| Office - Suburban | Loan #11 | Cut-off Date Balance: | $34,000,000 | |
17777 Center Court Drive North Cerritos, CA 90703
| Cerritos Center Court | Cut-off Date LTV: U/W NCF DSCR: U/W NOI Debt Yield: | 67.5% 1.61x 10.9% |
Operating History and Underwritten Net Cash Flow. The following table presents certain information relating to the historical operating performance and underwritten net cash flow at the Cerritos Center Court Property:
Cash Flow Analysis
| 2019(1) | July 2020-December 2020 Annualized(1) | 2021 | TTM 4/30/2022 | U/W | %(2) | U/W $ per SF | |
| Base Rent | $5,354,579 | $6,001,451 | $6,046,411 | $6,108,340 | $6,585,563(3) | 97.9% | $38.79(3) |
| Grossed Up Vacant Space | 0 | 0 | 0 | 0 | 0 | 0.0 | 0.00 |
| Gross Potential Rent | $5,354,579 | $6,001,451 | $6,046,411 | $6,108,340 | $6,585,563 | 97.9% | $38.79 |
| Other Income | 7,541 | 7,401 | 8,007 | 8,623 | 8,623 | 0.1 | 0.05 |
| Less: Free Rent Adjustment | (970,215) | (0) | (0) | (0) | (0) | 0.0 | 0.00 |
| Total Recoveries | 56,747 | 91,602 | 130,026 | 132,381 | 132,381 | 2.0 | $0.78 |
| Net Rental Income | $4,448,652 | $6,100,453 | $6,184,444 | $6,249,344 | $6,726,567 | 100.0% | $39.62 |
| (Vacancy & Credit Loss) | 0 | 0 | 0 | 0 | (329,278)(4) | 5.0 | (1.94) |
| Effective Gross Income | $4,448,652 | $6,100,453 | $6,184,444 | $6,249,344 | $6,397,288 | 95.1% | $37.68 |
| Real Estate Taxes | $579,335 | $614,212 | $627,423 | $630,617 | $633,150 | 9.9% | $3.73 |
| Insurance | 114,097 | 37,874 | 42,487 | 45,240 | 48,559 | 0.8 | 0.29 |
| Ground Rent | 359,596 | 359,596 | 359,596 | 423,512 | 450,936 | 7.0 | 2.66 |
| Management Fee | 177,946 | 200,916 | 247,378 | 249,973 | 255,892 | 4.0 | 1.51 |
| Other Operating Expenses | 1,316,754 | 994,217 | 1,260,448 | 1,314,877 | 1,314,877 | 20.6 | 7.75 |
| Total Operating Expenses | $2,547,728 | $2,206,814 | $2,537,331 | $2,664,220 | $2,703,413 | 42.3% | $15.92 |
| Net Operating Income | $1,900,924 | $3,893,639 | $3,647,112 | $3,585,124 | $3,693,875 | 57.7% | $21.76 |
| Replacement Reserves | 0 | 0 | 0 | 0 | 39,045 | 0.6 | 0.23 |
| TI/LC | 0 | 0 | 0 | 0 | 9,762(5) | 0.2(5) | 0.06(5) |
| Net Cash Flow | $1,900,924 | $3,893,639 | $3,647,112 | $3,585,124 | $3,645,068 | 57.0% | $21.47 |
| NOI DSCR | 0.84x | 1.72x | 1.61x | 1.58x | 1.63x | ||
| NCF DSCR | 0.84x | 1.72x | 1.61x | 1.58x | 1.61x | ||
| NOI Debt Yield | 5.6% | 11.5% | 10.7% | 10.5% | 10.9% | ||
| NCF Debt Yield | 5.6% | 11.5% | 10.7% | 10.5% | 10.7% |
| (1) | The increase in Net Operating Income from 2019 to July 2020-December 2020 Annualized was driven in part by the $970,215 free rent adjustment and two new leases with commencement dates in July 2019 and April 2020, collectively representing 16.7% of net rentable area and 17.6% of underwritten base rent. |
| (2) | Represents (i) percent of Net Rental Income for all revenue fields, (ii) percent of Gross Potential Rent for Vacancy & Credit Loss and (iii) percent of Effective Gross Income for all other fields. |
| (3) | The U/W Base Rent PSF and U/W Base Rent include contractual rent steps through August 2023 totaling $161,531 and straight-line rent averaging credit over the remaining lease term for investment grade tenants Prologis, L.P., Western & Southern Life Insurance and Comptroller of Public Accounts totaling $54,647. |
| (4) | The underwritten economic vacancy is 5.0%. The Cerritos Center Court Property was 100.0% physically occupied as of June 28, 2022. |
| (5) | The underwritten TI/LC reserve is $169,762, however, $160,000 credit was netted out for the upfront reserve resulting in the $9,762 shown. The full $169,792 equates to 2.7% of Effective Gross Income and $1.00 U/W $ per SF. |
| THE INFORMATION IN THIS STRUCTURAL AND COLLATERAL TERM SHEET IS NOT COMPLETE AND MAY BE AMENDED PRIOR TO THE TIME OF SALE. THIS TERM SHEET IS NOT AN OFFER TO SELL THESE SECURITIES AND IT IS NOT A SOLICITATION OF AN OFFER TO BUY THESE SECURITIES IN ANY JURISDICTION WHERE THE OFFER OR SALE IS NOT PERMITTED. | ||
| ||
| No. 12 – City Brewery |
| Mortgage Loan Information | Mortgaged Property Information | |||||
| Mortgage Loan Seller: | Morgan Stanley Mortgage Capital Holdings LLC | Single Asset/Portfolio: | Single Asset | |||
| Credit Assessment (Fitch/KBRA/Moody’s): | NR/NR/NR | Property Type – Subtype: | Industrial – Light Manufacturing | |||
| Original Principal Balance: | $33,000,000 | Location: | La Crosse, WI | |||
| Cut-off Date Balance: | $33,000,000 | Size: | 730,584 SF | |||
| % of Initial Pool Balance: | 3.0% | Cut-off Date Balance Per SF: | $45.17 | |||
| Loan Purpose: | Acquisition | Maturity Date Balance Per SF: | $45.17 | |||
| Borrower Sponsor: | GIC Private Limited, Ancora Investors, Blue Owl Capital and Oak Street Real Estate Capital | Year Built/Renovated: | 1914 / 2002 | |||
| Guarantors: | Blue Owl Capital Holdings LP and | Title Vesting: | Fee | |||
| Blue Owl Capital Carry LP | Property Manager: | Self-managed | ||||
| Mortgage Rate: | 5.3900% | Current Occupancy (As of): | 100.0% (8/1/2022) | |||
| Note Date: | July 26, 2022 | YE 2021 Occupancy: | 100.0% | |||
| Seasoning: | 0 months | YE 2020 Occupancy: | 100.0% | |||
| Maturity Date: | August 1, 2027 | YE 2019 Occupancy: | 100.0% | |||
| IO Period: | 60 months | YE 2018 Occupancy: | 100.0% | |||
| Loan Term (Original): | 60 months | As-Is Appraised Value: | $59,600,000 | |||
| Amortization Term (Original): | NAP | As-Is Appraised Value Per SF: | $81.58 | |||
| Loan Amortization Type: | Interest Only | As-Is Appraisal Valuation Date: | June 21, 2022 | |||
| Call Protection: | YM1(24), DorYM1(29), O(7) | Underwriting and Financial Information(2) | ||||
| Lockbox Type: | Hard/In Place Cash Management | YE 2020 NOI(3): | NAV | |||
| Additional Debt: | None | YE 2019 NOI(3): | NAV | |||
| Additional Debt Type (Balance): | NAP | YE 2018 NOI(3): | NAV | |||
| YE 2017 NOI(3): | NAV | |||||
| U/W Revenues: | $3,642,432 | |||||
| U/W Expenses: | $109,437 | |||||
| Escrows and Reserves(1) | U/W NOI: | $3,532,995 | ||||
| Initial | Monthly | Cap | U/W NCF: | $3,322,791 | ||
| Taxes | $0 | $0 | NAP | U/W DSCR based on NOI/NCF: | 1.96x / 1.84x | |
| Insurance | $0 | $0 | NAP | U/W Debt Yield based on NOI/NCF: | 10.7% / 10.1% | |
| U/W Debt Yield at Maturity based on NOI/NCF: | 10.7% / 10.1% | |||||
| Cut-off Date LTV Ratio: | 55.4% | |||||
| LTV Ratio at Maturity: | 55.4% | |||||
| Sources and Uses | ||||||||
| Sources | Uses | |||||||
| Mortgage Loan Amount | $33,000,000 | 54.8 | % | Purchase price(4) | $58,656,720 | 97.3 | % | |
| Borrower Equity | 27,257,243 | 45.2 | Closing Costs | 1,600,523 | 2.7 | |||
| Total Sources | $60,257,243 | 100.0 | % | Total Uses | $60,257,243 | 100.0 | % | |
| (1) | On each monthly payment date following (i) an event of default under the City Brewing Company, LLC lease, (ii) City Brewing Company, LLC has failed to pay applicable taxes pursuant to its lease, or (iii) the borrower fails to furnish to the lender receipts for the payment of taxes, the borrower is required to reserve with the lender an amount equal to one-twelfth of the real estate taxes that the lender estimates will be payable during the next ensuing 12 months. On each monthly payment date following (i) an event of default under the City Brewing Company, LLC lease, (ii) City Brewing Company, LLC has failed to pay applicable insurance premiums pursuant to its lease, or (iii) the borrower fails to furnish to the lender receipts for the payment of insurance premiums, the borrower is required to reserve with the lender an amount equal to one-twelfth of the insurance premiums that the lender estimates will be payable for the renewal of the coverage afforded by the insurance policies maintained by the borrower upon the expiration thereof. Notwithstanding the foregoing, the borrower will not be required to reserve for insurance premiums if (i) no event of default is continuing under the City Brewery Mortgage Loan (as defined below), (ii) the liability and casualty policies maintained by the borrower are part of a blanket policy approved by the lender in its reasonable discretion, and (iii) the borrower provides the lender evidence of renewal of the insurance policies and paid receipts for the insurance premiums no later than 10 days prior to the expiration date of the insurance policies.. |
| (2) | The novel coronavirus pandemic is an evolving situation and could impact the City Brewery Mortgage Loan more severely than assumed in the underwriting of the City Brewery Mortgage Loan and could adversely affect the NOI, NCF and occupancy information, as well as the appraised value and the DSCR, LTV and Debt Yield metrics presented above. See "Risk Factors-—Risks Related to Market Conditions and Other External Factors—The Coronavirus Pandemic Has Adversely Affected the Global Economy and Will Likely Adversely Affect the Performance of the Mortgage Loans" in the Preliminary Prospectus. |
| (3) | The City Brewery Property (as defined below) was acquired from the related tenant in a sale-leaseback transaction on April 8, 2022. Prior to the sale-leaseback transaction the related tenant both owned and occupied the City Brewery Property, and accordingly historical financial information is not available. |
| (4) | The related sale-leaseback transaction took place in April 2022, and accordingly the City Brewery Mortgage Loan recapitalized the borrower following such transaction. |
The Mortgage Loan. The mortgage loan (the “City Brewery Mortgage Loan”) is evidenced by a single promissory note in the original principal amount of $33,000,000 and secured by a first priority fee mortgage encumbering an industrial light manufacturing property totaling 730,584 square feet and located in La Crosse, Wisconsin (the “City Brewery Property”).
| THE INFORMATION IN THIS STRUCTURAL AND COLLATERAL TERM SHEET IS NOT COMPLETE AND MAY BE AMENDED PRIOR TO THE TIME OF SALE. THIS TERM SHEET IS NOT AN OFFER TO SELL THESE SECURITIES AND IT IS NOT A SOLICITATION OF AN OFFER TO BUY THESE SECURITIES IN ANY JURISDICTION WHERE THE OFFER OR SALE IS NOT PERMITTED. | ||
| ||
| Industrial – Light Manufacturing | Loan # 12 | Cut-off Date Balance: | $33,000,000 | |
| 925 3rd Street South | City Brewery | Cut-off Date LTV: | 55.4% | |
| La Crosse, WI 54601 | UW NCF DSCR: | 1.84x | ||
| UW NOI Debt Yield: | 10.7% |
The Borrower and the Borrower Sponsors. The borrower of the City Brewery Mortgage Loan is CBLCWI001 LLC, a single-purpose Delaware limited liability company with one independent director in its organization structure. Legal counsel to the borrowers delivered a non-consolidation opinion in connection with the origination of the City Brewery Mortgage Loan. The borrower sponsors GIC Private Limited, Ancora Investors,Blue Owl Capital and Oak Street Real Estate Capital. The borrower is owned by a joint venture that is managed and controlled by Blue Owl Capital and Oak Street Real Estate Capital and in which GIC Private Limited and Ancora Investors own approximately 92.0% of the equity, with other parties owning the remainder. GIC Private Limited is Singapore’s sovereign wealth fund that was established in 1981. Ancora Investors is an asset management firm based in Cleveland that was founded in 2003. Blue Owl Capital acquired Oak Street Real Estate Capital in December 2021. The City Brewery Mortgage Loan non-recourse carveout guarantors are Blue Owl Capital Holdings LP and Blue Owl Capital Carry LP, which are affiliated with Blue Owl Capital and Oak Street Real Estate Capital.
The Property. The City Brewery Property is a 730,584 square foot industrial brewery complex located in La Crosse, Wisconsin. The City Brewery Property was built in 1858, on a 20.6-acre site that has been utilized as a brewery for over 150 years. The City Brewery Property consists of 10, one to four-story buildings featuring three drive-in doors, 24 dock high doors, two rail doors, and 184 parking spaces. The sole tenant at the City Brewery Property, City Brewing Company, LLC, has occupied the City Brewery Property for over 20 years. The tenant invested in its space over the years. The City Brewery Property has an estimated replacement cost of over $580 million and is equipped with approximately $119 million worth of specialized equipment and machinery across three can lines, three bottle lines, and one keg line. Since 2019, City Brewing Company, LLC has also completed approximately $4.2 million in capital improvements. The City Brewery Property was sold to the borrower by the tenant on April 8, 2022 in a sale-leaseback transaction at a price of $58,656,720.
Major Tenants.
City Brewing Company, LLC (730,584 square feet, 100.0% of net rentable area, 100.0% of underwritten rent). City Brewing Company, LLC is a full-service contract manufacturer of alcoholic and non-alcoholic beverages including hard seltzers, flavored malt beverages, spirit-based ready-to-drink cocktails, craft beer, soft drinks, teas and energy drinks. City Brewing Company, LLC was founded in 2000, carries a rating of “B” by S&P and “B2” by Moody’s and is backed by a consortium of institutional investors consisting of Blue Ribbon Partners (53%), Charlesbank Capital Partners (35%) and Oaktree Capital Management (12%). City Brewing Company, LLC currently produces approximately 40 different recipes for contract brewing customers. City Brewing Company, LLC operates out of the City Brewery Property as its headquarters, encompassing the company’s full spectrum of operations including brewing, aging, bottling, packaging, storage, and shipping functions. City Brewing Company, LLC operates out of three additional plants in Latrobe, PA, Memphis, TN and Irwindale CA, providing co-packaging and supply chain services. City Brewing Company, LLC has occupied the City Brewery Property since 2000. In connection with the sale-leaseback transaction with the borrower in April 2022, the tenant entered into a new lease with a lease expiration date of April 30, 2047 and five, five-year renewal options remaining. City Brewing Company, LLC currently pays rent of $5.10 per square foot, with annual 2.0% increases throughout the duration of the lease.
City Brewing Company, LLC has an ongoing option to repurchase the City Brewery Property from the borrower, with a purchase price equal to (i) if a repurchase notice is delivered prior to April 8, 2027, a price calculated using a 4.85% capitalization rate applied to the following 12 months’ then current rate of base rent as of the date of the repurchase notice and (ii) if a repurchase notice is delivered thereafter, a price calculated using a 5.35% capitalization rate applied to the following 12 months’ then-current rate of base rent as of the date of the repurchase notice. City Brewery’s repurchase option terminates on the later of (i) April 8, 2024, or (ii) the date on which there is (a) a change in control of the related borrower, (b) one or more persons or entities that are not affiliates of the related borrower acquire, in the aggregate, 49% or more of the direct or indirect beneficial interests in the related borrower, or (c) a sale of the leased premises to a third party that is not an affiliate of the related borrower, subject in certain cases to a 30 day extension to allow repurchase. In addition, City Brewing Company, LLC has both a right of first refusal and a right of first offer to purchase all or any material portion of the related borrower’s interest in the City Brewery Property. The sole tenant’s lease prohibits a sale of the City Brewery Property prior to April 8, 2024.
| THE INFORMATION IN THIS STRUCTURAL AND COLLATERAL TERM SHEET IS NOT COMPLETE AND MAY BE AMENDED PRIOR TO THE TIME OF SALE. THIS TERM SHEET IS NOT AN OFFER TO SELL THESE SECURITIES AND IT IS NOT A SOLICITATION OF AN OFFER TO BUY THESE SECURITIES IN ANY JURISDICTION WHERE THE OFFER OR SALE IS NOT PERMITTED. | ||
| ||
| Industrial – Light Manufacturing | Loan # 12 | Cut-off Date Balance: | $33,000,000 | |
| 925 3rd Street South | City Brewery | Cut-off Date LTV: | 55.4% | |
| La Crosse, WI 54601 | UW NCF DSCR: | 1.84x | ||
| UW NOI Debt Yield: | 10.7% |
The following table presents certain information relating to the sole tenant at the City Brewery Property:
Major Tenants(1)
| Tenant Name | Credit Rating (Fitch/ Moody’s/S&P) | Tenant NRSF | % of NRSF | Annual U/W Base Rent PSF | Annual U/W Base Rent | % of Total Annual U/W Base Rent | Lease Expiration Date | Extension Options | Term. Option (Y/N) |
| Major Tenants | |||||||||
| City Brewing Company, LLC | NR/B2/B | 730,584 | 100.0% | $5.10 | $3,724,702 | 100.0% | 4/30/2047 | Y(2) | N |
| Total Major Tenants | 730,584 | 100.0% | $5.10 | $3,724,702 | 100.0% | ||||
| Non-Major Tenants | 0 | 0.0% | |||||||
| Occupied Collateral Total | 730,584 | 100.0% | $5.10 | $3,724,702 | 100.0% | ||||
| Vacant Space | 0 | 0.0% | |||||||
| Collateral Total | 730,584 | 100.0% | |||||||
| (1) | Information is based on the underwritten rent roll. |
| (2) | City Brewing Company, LLC may elect to renew its lease for five, five-year periods at a 2.0% annual escalation. |
The following table presents certain information relating to the lease rollover schedule at the City Brewery Property:
Lease Expiration Schedule(1)
| Year Ending December 31, | No. of Leases Expiring | Expiring NRSF | % of Total NRSF | Cumulative Expiring NRSF | Cumulative % of Total NRSF | Annual U/W Base Rent | % of Total Annual U/W Base Rent | Annual U/W Base Rent PSF |
| MTM | 0 | 0 | 0.0% | 0 | 0.0% | $0 | 0.0% | $0.00 |
| 2022 | 0 | 0 | 0.0% | 0 | 0.0% | $0 | 0.0% | $0.00 |
| 2023 | 0 | 0 | 0.0% | 0 | 0.0% | $0 | 0.0% | $0.00 |
| 2024 | 0 | 0 | 0.0% | 0 | 0.0% | $0 | 0.0% | $0.00 |
| 2025 | 0 | 0 | 0.0% | 0 | 0.0% | $0 | 0.0% | $0.00 |
| 2026 | 0 | 0 | 0.0% | 0 | 0.0% | $0 | 0.0% | $0.00 |
| 2027 | 0 | 0 | 0.0% | 0 | 0.0% | $0 | 0.0% | $0.00 |
| 2028 | 0 | 0 | 0.0% | 0 | 0.0% | $0 | 0.0% | $0.00 |
| 2029 | 0 | 0 | 0.0% | 0 | 0.0% | $0 | 0.0% | $0.00 |
| 2030 | 0 | 0 | 0.0% | 0 | 0.0% | $0 | 0.0% | $0.00 |
| 2031 | 0 | 0 | 0.0% | 0 | 0.0% | $0 | 0.0% | $0.00 |
| 2032 | 0 | 0 | 0.0% | 0 | 0.0% | $0 | 0.0% | $0.00 |
| Thereafter | 1 | 730,584 | 100.0% | 730,584 | 100.0% | $3,724,702 | 100.0% | $5.10 |
| Vacant | 0 | 0 | 0.0% | 730,584 | 100.0% | $0 | 0.0% | $0.00 |
| Total/Wtd. Avg. | 1 | 730,584 | 100.0% | $3,724,702 | 100.0% | $5.10 |
| (1) | Information is based on the underwritten rent roll. |
The following table presents historical occupancy percentages at the City Brewery Property:
Historical Occupancy
12/31/2019(1) | 12/31/2020(1) | 12/31/2021(1) | 8/1/2022(2) |
| 100.0% | 100.0% | 100.0% | 100.0% |
| (1) | Information obtained from the appraisal. |
| (2) | Information based on the underwritten rent roll. |
| THE INFORMATION IN THIS STRUCTURAL AND COLLATERAL TERM SHEET IS NOT COMPLETE AND MAY BE AMENDED PRIOR TO THE TIME OF SALE. THIS TERM SHEET IS NOT AN OFFER TO SELL THESE SECURITIES AND IT IS NOT A SOLICITATION OF AN OFFER TO BUY THESE SECURITIES IN ANY JURISDICTION WHERE THE OFFER OR SALE IS NOT PERMITTED. | ||
| ||
| Industrial – Light Manufacturing | Loan # 12 | Cut-off Date Balance: | $33,000,000 | |
| 925 3rd Street South | City Brewery | Cut-off Date LTV: | 55.4% | |
| La Crosse, WI 54601 | UW NCF DSCR: | 1.84x | ||
| UW NOI Debt Yield: | 10.7% |
Underwritten Net Cash Flow. The following table presents certain information relating to the underwritten net cash flow at the City Brewery Property:
Cash Flow Analysis(1)
| U/W | %(2) | U/W $ per SF | |
| Gross Potential Rent | $3,724,702 | 97.1% | $5.10 |
| Recoveries | 109,437 | 2.9 | 0.15 |
| Net Rental Income | $3,834,139 | 100.0% | $5.25 |
| Less Vacancy & Credit Loss | (191,707) | (5.1) | (0.26) |
| Effective Gross Income | $3,642,432 | 95.0% | $4.99 |
| Real Estate Taxes | 0 | 0.0 | 0.00 |
| Insurance | 0 | 0.0 | 0.00 |
| Other Operating Expenses | 109,437 | 3.0 | 0.15 |
| Total Operating Expenses | $109,437 | 3.0% | $0.15 |
| Net Operating Income | $3,532,995 | 97.0% | $4.84 |
| Replacement Reserves | 73,058 | 2.0 | 0.10 |
| TI/LC | 137,145 | 3.8 | 0.19 |
| Net Cash Flow | $3,322,791 | 91.2% | $4.55 |
| NOI DSCR | 1.96x | ||
| NCF DSCR | 1.84x | ||
| NOI Debt Yield | 10.7% | ||
| NCF Debt Yield | 10.1% |
| (1) | The City Brewery Property was acquired from the related tenant in a sale-leaseback transaction on April 8, 2022. Prior to the sale-leaseback transaction the related tenant both owned and occupied the City Brewery Property, and accordingly historical financial information is not available. |
| (2) | Represents (i) percent of Net Rental Income for all revenue fields, (ii) percent of Gross Potential Rent for Vacancy and Concessions & Credit Loss and (iii) percent of Effective Gross Income for all other fields. |
Appraisal. The appraiser concluded to an “as is” Appraised Value for the City Brewery Property of $59,600,000 as of June 21, 2022.
Environmental Matters. According to the Phase I environmental site assessment dated February 24, 2022, there was no evidence of any recognized environmental conditions at the City Brewery Property. The assessment identified a controlled recognized environmental condition at the City Brewery Property related to releases from underground storage tanks previously located at the City Brewery Property.
Market Overview and Competition. The City Brewery Property is located in La Crosse, Wisconsin, within the La Crosse County submarket of the La Crosse-Onalaska industrial market. Primary access to the City Brewery Property is provided by Interstate 90. The City Brewery Property is located in an established mixed-use corridor situated on the southwest side of the City of La Crosse and is bound by the east shore of the Mississippi River. Surrounding land uses consist primarily of single-tenant industrial properties and other commercially oriented spaces including auto dealerships, retail buildings and restaurants. The University of Wisconsin – La Crosse campus is located approximately one mile northeast of the City Brewery Property, and the City of La Crosse is also home to Viterbo University and Western Technical College, with over 17,000 students in the city. The City Brewery Property is approximately one mile northwest of the Gundersen Medical Center campus. La Crosse is the largest city on Wisconsin’s western border, with major employers in the area including Gundersen Health system, Ashley Furniture Industries Inc., Mayo Clinic Health System, Trane and Fort McCoy.
According to the appraisal, as of the fourth quarter of 2021, the vacancy rate in the La Crosse County industrial submarket was approximately 1.0%, with average asking rents of $5.38 per square foot and inventory of approximately 8.99 million square feet. According to the appraisal, as of the fourth quarter of 2021, the vacancy rate in the La Crosse-Onalaska industrial market was 0.9%, with average asking rents of $4.88 per square foot and inventory of approximately 9.14 million square feet. According to the appraisal, the 2022 population within a one-, three- and five-mile radius was 12,908, 46,730 and 67,830, respectively. The 2022 average household income within the same one-, three- and five-mile radius was $50,103, $66,207 and $73,695, respectively.
| THE INFORMATION IN THIS STRUCTURAL AND COLLATERAL TERM SHEET IS NOT COMPLETE AND MAY BE AMENDED PRIOR TO THE TIME OF SALE. THIS TERM SHEET IS NOT AN OFFER TO SELL THESE SECURITIES AND IT IS NOT A SOLICITATION OF AN OFFER TO BUY THESE SECURITIES IN ANY JURISDICTION WHERE THE OFFER OR SALE IS NOT PERMITTED. | ||
| ||
| Industrial – Light Manufacturing | Loan # 12 | Cut-off Date Balance: | $33,000,000 | |
| 925 3rd Street South | City Brewery | Cut-off Date LTV: | 55.4% | |
| La Crosse, WI 54601 | UW NCF DSCR: | 1.84x | ||
| UW NOI Debt Yield: | 10.7% |
The following table presents certain information relating to the appraisal’s market rent conclusions for the City Brewery Property:
Market Rent Summary(1)
| Category | Market Rent (PSF) | Lease Term (Yrs) | Lease type | Rent Increase Projections |
| MLA 1 Space | $5.10 | 20 | NNN | 2.0% per annum |
| (1) | Information obtained from the appraisal. |
The following table presents certain information relating to comparable industrial leases to the City Brewery Property:
Comparable Industrial Leases(1)
| Property Name / Location | Year Built / Renovated | Total GLA (SF) | Tenant | Tenant Size (SF) | Lease Start Date | Lease Term | Annual Base Rent PSF | Lease Type |
City Brewery (Subject Property)(2) La Crosse, WI | 1914 / 2002 | 730,584 | City Brewing Company, LLC | 730,584 | April-2022 | 300 mos. | $5.10 | NNN |
Magna Industrial Holland, MI | 1987 / 2022 | 406,120 | Magna | 406,120 | Sep-2022 | 120 mos. | $4.98 | NNN |
4110 Northwest Helena Riverside, MO | 2013 / NAP | 336,383 | Yanfeng USA | 336,383 | Dec-2021 | 60 mos. | $5.75 | Net |
Whirlpool, Amana IA Middle Amana, IA | 1940 / 1995 | 1,572,343 | Whirlpool | 1,572,343 | Nov-2020 | 168 mos. | $4.13 | Absolute Net |
Food Grade Industrial Facility Manteno, IL | 1980 / NAP | 570,028 | McKesson Corporation | 570,028 | Oct-2020 | 24 mos. | $4.56 | NNN |
Ford Motor Company Warehouse Frenchtown Detroit, MI | 2020 / NAP | 1,026,513 | Ford Motor Company | 1,026,513 | Oct-2021 | 120 mos. | $5.75 | Absolute Net |
| (1) | Information obtained from the appraisal. |
| (2) | Other than Year Built / Renovated, information obtained from the underwritten rent roll. |
| THE INFORMATION IN THIS STRUCTURAL AND COLLATERAL TERM SHEET IS NOT COMPLETE AND MAY BE AMENDED PRIOR TO THE TIME OF SALE. THIS TERM SHEET IS NOT AN OFFER TO SELL THESE SECURITIES AND IT IS NOT A SOLICITATION OF AN OFFER TO BUY THESE SECURITIES IN ANY JURISDICTION WHERE THE OFFER OR SALE IS NOT PERMITTED. | ||
| ||
| No. 13 – Tisch Tower |
| Mortgage Loan Information | Mortgaged Property Information | |||||
| Mortgage Loan Seller: | Wells Fargo Bank, National Association | Single Asset/Portfolio: | Single Asset | |||
Credit Assessment (Fitch/KBRA/Moody’s): | NR/NR/Baa3 | Property Type – Subtype: | Office - Suburban | |||
| Original Principal Balance: | $30,000,000 | Location: | San Jose, CA | |||
| Cut-off Date Balance: | $30,000,000 | Size: | 173,064 SF | |||
| % of Initial Pool Balance: | 2.8% | Cut-off Date Balance Per SF: | $173.35 | |||
| Loan Purpose: | Refinance | Maturity Date Balance Per SF: | $173.35 | |||
| Borrower Sponsor: | Jon M. Muller, Stephen J. Muller | Year Built/Renovated: | 1970/2004 | |||
| Guarantor: | Jon M. Muller, Stephen J. Muller | Title Vesting: | Fee | |||
| Mortgage Rate: | 5.0350% | Property Manager: | The Muller Company, LLC (borrower affiliate) | |||
| Note Date: | June 3, 2022 | Current Occupancy (As of)(4): | 77.3% (6/1/2022) | |||
| Seasoning: | 2 months | YE 2021 Occupancy(5): | 75.0% | |||
| Maturity Date: | June 11, 2032 | YE 2020 Occupancy(5): | 86.0% | |||
| IO Period: | 120 months | YE 2019 Occupancy(5): | 84.0% | |||
| Loan Term (Original): | 120 months | YE 2018 Occupancy(5): | 94.0% | |||
| Amortization Term (Original): | NAP | As-Is Appraised Value(6): | $76,200,000 | |||
| Loan Amortization Type: | Interest Only | As-Is Appraised Value Per SF: | $440.30 | |||
| Call Protection: | L(26),D(90),O(4) | As-Is Appraisal Valuation Date: | April 27, 2022 | |||
| Lockbox Type: | Springing | Underwriting and Financial Information(7) | ||||
| Additional Debt: | None | TTM NOI (4/30/2022)(8): | $4,998,192 | |||
| Additional Debt Type (Balance): | NAP | YE 2021 NOI: | $5,032,645 | |||
| YE 2020 NOI: | $5,580,267 | |||||
| YE 2019 NOI: | $5,117,593 | |||||
| U/W Revenues: | $7,006,564 | |||||
| U/W Expenses: | $2,612,645 | |||||
| Escrows and Reserves | U/W NOI(8): | $4,393,919 | ||||
| Initial | Monthly | Cap | U/W NCF: | $4,022,591 | ||
| Taxes(1) | $0 | Springing | NAP | U/W DSCR based on NOI/NCF: | 2.87x / 2.63x | |
| Insurance(2) | $0 | Springing | NAP | U/W Debt Yield based on NOI/NCF: | 14.6% / 13.4% | |
| Balbix Reserve(3) | $254,034 | $0 | NAP | U/W Debt Yield at Maturity based on NOI/NCF: | 14.6% / 13.4% | |
| Cut-off Date LTV Ratio: | 39.4% | |||||
| LTV Ratio at Maturity: | 39.4% | |||||
| Sources and Uses | |||||||
| Sources | Uses | ||||||
| Original Mortgage Loan amount | $30,000,000 | 100.0% | Loan Payoff(9) | $22,957,970 | 76.5 | % | |
| Upfront Reserves | 254,034 | 0.8 | |||||
| Closing costs | 523,982 | 1.7 | |||||
| Return of Equity | 6,264,015 | 20.9 | |||||
| Total Sources | $30,000,000 | 100.0% | Total Uses | $30,000,000 | 100.0 | % | |
| (1) | Ongoing monthly tax reserve deposits in an amount equal to 1/12th of the estimated taxes payable during the next 12 months will not be required as long as (a) no event of default is continuing, (b) the borrower pays all taxes prior to delinquency, and (c) the borrower provides the lender with evidence of such payments no later than five business days following the payment date. |
| (2) | Ongoing monthly insurance reserve deposits in an amount equal to 1/12th of the insurance premiums that the lender estimates will be payable for the renewal of the required coverages will not be required as long as (a) no event of default is continuing (b) the policy maintained by the borrower satisfies the insurance requirements under the loan agreement, and (c) the lender has received evidence of the renewal of such policies no later than 10 business days prior to the expiration of the policies. |
| (3) | The Balbix Reserve represents the future rent credits and tenant improvement allowances under the proposed renewal lease with the tenant known as Balbix. Provided no event of default is continuing, the funds will be released upon receipt of satisfactory evidence that all of the 11,547 square feet currently leased to Balbix has been leased to one or more new leases with Balbix and/or a reasonably satisfactory replacement tenant and that the lease (a) has no early termination options, (b) has a minimum term of three years, (c) has a minimum net effective rent of $28.00, full service gross, in the first year, and (d) is otherwise reasonably satisfactory to the lender. |
| (4) | Includes 890 square feet of space leased on a month to month basis. |
| (5) | Information obtained from the borrower. The drop in occupancy from 2018 to 2019 was primarily caused by National University reducing its footprint by 10,481 square feet, approximately 6.0% of NRA. The further drop in occupancy from 2020 to 2021 was primarily due to the effects of the COVID-19 pandemic. |
| (6) | The appraisal also included an As-Stabilized value of $83,400,000 as of May 1, 2024, which results in a Cut-off Date LTV Ratio and LTV Ratio at Maturity of 36.0%. |
| (7) | While the Tisch Tower Mortgage Loan (defined below) was originated after the emergence of the novel coronavirus pandemic and the economic disruption resulting from measures to combat the pandemic, the pandemic is an evolving situation and could impact the Tisch Tower Mortgage Loan more severely than assumed in the underwriting and could adversely affect the NOI, NCF and occupancy information, as well as the appraised value and the DSCR, LTV and Debt Yield metrics presented above. See “Risk Factors— Risks Related to Market Conditions and Other External Factors—Coronavirus Pandemic Has Adversely Affected the Global Economy and Will Likely Adversely Affect the Performance of the Mortgage Loans” in the prospectus. |
| (8) | The U/W NOI is lower than the TTM NOI, primarily due to the underwritten rent for tenants with above market rents being rolled down to the high end of the appraisal market rent range of $51.60 per square foot. As of June 1, 2022, the in-place rent was $55.73 per square foot, versus the underwritten rent of $50.71 per square foot. |
| (9) | The Tisch Tower Mortgage Loan was used to pay off an existing CMBS loan securitized in UBSBB 2013-C5. |
| THE INFORMATION IN THIS STRUCTURAL AND COLLATERAL TERM SHEET IS NOT COMPLETE AND MAY BE AMENDED PRIOR TO THE TIME OF SALE. THIS TERM SHEET IS NOT AN OFFER TO SELL THESE SECURITIES AND IT IS NOT A SOLICITATION OF AN OFFER TO BUY THESE SECURITIES IN ANY JURISDICTION WHERE THE OFFER OR SALE IS NOT PERMITTED. | ||
| ||
| Office - Suburban | Loan #13 | Cut-off Date Balance: | $30,000,000 | |
3031 Tisch Way San Jose, CA 95128
| Tisch Tower | Cut-off Date LTV: U/W NCF DSCR: U/W NOI Debt Yield: | 39.4% 2.63x 14.6% |
The Mortgage Loan. The mortgage loan (the “Tisch Tower Mortgage Loan”) is evidenced by a promissory note in the original principal amount of $30,000,000 and secured by a first priority fee interest encumbering a multi-tenant office property totaling 173,064 square feet located in San Jose, California (the “Tisch Tower Property”).
The Borrower and Borrower Sponsors. The borrower is Muller-Sbot, LLC a Delaware limited liability company and single purpose entity with one independent director. The borrower sponsors and nonrecourse carveout guarantors are Jon M. Muller and Stephen J. Muller.
Jon M. Muller and Stephen J. Muller are principals of The Muller Company, an opportunistic real-estate investment, development and management firm founded by Stephen J. Muller in 1979. Since its inception, The Muller Company has acquired, developed and operated over 30 million square feet of office, industrial and retail space across Northern and Southern California, Arizona and Utah.
The borrower sponsors were involved in a prior maturity default on the Tisch Tower Property in 2010 as well as several other foreclosures and discounted payoffs. For additional information on the borrower sponsors and guarantors please see “Description of the Mortgage Pool - Loan Purpose; Default History, Bankruptcy Issues and Other Proceedings”.
The Property. The Tisch Tower Property consists of a 12-story, 173,064 square foot, Class B, multi-tenant office building, located in San Jose, California. Built in 1970 and renovated in 2004, the Tisch Tower Property is situated on a 2.6-acre site. There are 562 surface and garage parking spaces providing a parking ratio of 3.25 space per 1,000 square feet. The borrower has invested $5.4 million on capital improvements since 2012, including $1.3 million since 2017, which included a redesign of the lobby, addition of new lobby furniture, replacement of entry doors, and replacement of the cooling tower. Additionally, the borrower is planning to spend an additional $5.2 million on the property by 2024 on projects including the modernization of the elevators, the addition of a security desk in the lobby and refurbishment of the elevator lobbies, and making several of the vacant suites market ready. As of June 1, 2022, the Tisch Tower Property was 77.3% occupied by 40 tenants, including two month to month leases.
The Tisch Tower Property was subject to a maturity default in 2010. It was subsequently securitized in UBSBB 2013-C5, and performed throughout the term until pay off by the related borrower. For more information please see “Description of Mortgage Pool - Loan Purpose; Default History, Bankruptcy Issues and Other Proceedings.”
Major Tenants.
Largest Tenant by UW Base Rent: RGN-San Jose V, LLC (“Regus”) (29,456 square feet; 17.0% of net rentable area; 22.4% of underwritten base rent; 5/24/2027 lease expiration) – Regus is a coworking company that was founded in 1989 and has been known as IWG plc (“IWG”) since 2011. IWG is located in over 120 countries, with over 3,300 locations, 8 million users, and more than 10,000 team members. IWG operates several brands, with the Tisch Tower Property location operating under the Spaces brand. Spaces has over 200 city center locations, ranging from 20,000 to 100,000 square feet. The Spaces concept provides different options including private office space, coworking membership, dedicated desk, virtual office or meeting rooms. Regus has been a tenant at the Tisch Tower Property since 2016 and has two, 5-year renewal options.
2nd Largest Tenant by UW Base Rent: William Jessup University (11,955 square feet; 6.9% of net rentable area; 9.1% of underwritten base rent; 8/31/2026 lease expiration) – William Jessup University is a Christian University with two locations, one in Rocklin, California and the other at the Tisch Tower Property. Founded in 1939 as San Jose Bible College, the university now offers approximately 60 programs on campus and online, with a student enrollment of 1,289 for fall 2020. The Tisch Tower Property campus offers a Master of Arts in Teaching and Master of Business Administration. William Jessup University has been a tenant at the Tisch Tower Property since 2019 and has one, 5-year renewal option.
3rd Largest Tenant by UW Base Rent: Balbix, Inc. (11,547 square feet; 6.7% of net rentable area; 8.7% of underwritten base rent; 5/14/2028 lease expiration) – Balbix, Inc. (“Balbix”) is a private cybersecurity which has an automated cyber risk quantification solution designed to provide organizations with real-time visibility into cyber risks within their environment, in order to identify and mitigate risks using AI before an attacker has an opportunity to exploit the risk. Balbix recently raised $70MM in Series C funding. The company is headquartered at the Tisch Tower Property and has expanded since its original occupancy in 2016.
The tenant’s lease expires January 14, 2023, however, it is negotiating a 64-month renewal with the borrower, which is anticipated to have an expiration date of May 14, 2028, with one, 3-year renewal option. The contemplated free rent and leasing costs were reserved at loan closing.
COVID-19 Update. One tenant, TAPCLICKS, representing 4.5% of the net rentable area and 6.0% of the underwritten rent, is paying $8,060 per month in additional rent through the end of its lease term to repay delinquent rent from the pandemic. The tenant is current on the full rent payment and the additional rent payment.
| THE INFORMATION IN THIS STRUCTURAL AND COLLATERAL TERM SHEET IS NOT COMPLETE AND MAY BE AMENDED PRIOR TO THE TIME OF SALE. THIS TERM SHEET IS NOT AN OFFER TO SELL THESE SECURITIES AND IT IS NOT A SOLICITATION OF AN OFFER TO BUY THESE SECURITIES IN ANY JURISDICTION WHERE THE OFFER OR SALE IS NOT PERMITTED. | ||
| ||
| Office - Suburban | Loan #13 | Cut-off Date Balance: | $30,000,000 | |
3031 Tisch Way San Jose, CA 95128
| Tisch Tower | Cut-off Date LTV: U/W NCF DSCR: U/W NOI Debt Yield: | 39.4% 2.63x 14.6% |
The following table presents certain information relating to the tenancy at the Tisch Tower Property:
Major Tenants
| Tenant Name | Credit Rating (Fitch/ Moody’s/ | Tenant NRSF | % of NRSF | Annual U/W Base Rent PSF(1) | Annual U/W Base Rent(1) | % of Total Annual U/W Base Rent | Lease Expiration Date | Ext. Options | Term. Option (Y/N) |
| Major Tenants | |||||||||
| Regus | NR/NR/NR | 29,456 | 17.0% | $51.60 | $1,519,930 | 22.4% | 5/24/2027 | 2, 5-year | N |
| William Jessup University | NR/NR/NR | 11,955 | 6.9% | $51.60 | $616,878 | 9.1% | 8/31/2026 | 1, 5-year | N |
| Balbix(2) | NR/NR/NR | 11,547 | 6.7% | $51.00 | $588,897 | 8.7% | 5/14/2028 | 1, 3-year | N |
| TAPCLICKS(3) | NR/NR/NR | 7,865 | 4.5% | $51.60 | $405,834 | 6.0% | 1/31/2024 | N | N |
| Deep Valley Labs, LLC | NR/NR/NR | 5,216 | 3.0% | $51.60 | $269,146 | 4.0% | 5/31/2024 | 2, 2-year | N |
| 66,039 | 38.2% | $51.50 | $3,400,684 | 50.1% | |||||
| Non-Major Tenants(4) | 67,696 | 39.1% | $50.12 | $3,393,020 | 49.9% | ||||
| Occupied Collateral Total | 133,735 | 77.3% | $50.80 | $6,793,704 | 100.0% | ||||
| Vacant Space | 39,329 | 22.7% | |||||||
| Collateral Total | 173,064 | 100.0% | |||||||
| (1) | Annual U/W Base Rent PSF and Annual U/W Base Rent includes rent steps through August 2023, and adjusts above market rents down to the high end of the appraisal market rent of $51.60 per square foot. |
| (2) | Balbix current lease expires January 14, 2023. A lease renewal, extending the lease to May 14, 2028, is in process with a rental rate of $51.00 per square foot. The free rent and tenant improvement allowance associated with the renewal is reserved upfront. |
| (3) | TAPCLICKS leases a 4,941 square foot suite and a 2,924 square foot suite. The tenant is currently subleasing the smaller suite to Lumina Communications, co-terminus with the main lease. |
| (4) | Includes 890 square feet of space leased on a month to month basis. |
| THE INFORMATION IN THIS STRUCTURAL AND COLLATERAL TERM SHEET IS NOT COMPLETE AND MAY BE AMENDED PRIOR TO THE TIME OF SALE. THIS TERM SHEET IS NOT AN OFFER TO SELL THESE SECURITIES AND IT IS NOT A SOLICITATION OF AN OFFER TO BUY THESE SECURITIES IN ANY JURISDICTION WHERE THE OFFER OR SALE IS NOT PERMITTED. | ||
| ||
| Office - Suburban | Loan #13 | Cut-off Date Balance: | $30,000,000 | |
3031 Tisch Way San Jose, CA 95128
| Tisch Tower | Cut-off Date LTV: U/W NCF DSCR: U/W NOI Debt Yield: | 39.4% 2.63x 14.6% |
The following table presents certain information relating to the lease rollover schedule at the Tisch Tower Property:
Lease Expiration Schedule(1)
| Year Ending December 31, | No. of Leases Expiring | Expiring NRSF | % of Total NRSF | Cumulative Expiring NRSF | Cumulative % of Total NRSF | Annual U/W Base Rent | % of Total Annual U/W Base Rent | Annual U/W Base Rent PSF(2) |
| MTM | 2 | 890 | 0.5% | 890 | 0.5% | $148,642 | 2.2% | $167.01 |
| 2022 | 1 | 2,831 | 1.6% | 3,721 | 2.2% | $146,080 | 2.2% | $51.60 |
| 2023 | 9 | 12,725 | 7.4% | 16,446 | 9.5% | $656,226 | 9.7% | $51.57 |
| 2024 | 14 | 34,599 | 20.0% | 51,045 | 29.5% | $1,781,378 | 26.2% | $51.49 |
| 2025 | 5 | 10,890 | 6.3% | 61,935 | 35.8% | $551,033 | 8.1% | $50.60 |
| 2026 | 4 | 17,272 | 10.0% | 79,207 | 45.8% | $883,553 | 13.0% | $51.16 |
| 2027 | 6 | 40,036 | 23.1% | 119,243 | 68.9% | $2,037,895 | 30.0% | $50.90 |
| 2028 | 1 | 11,547 | 6.7% | 130,790 | 75.6% | $588,897 | 8.7% | $51.00 |
| 2029 | 0 | 0 | 0.0% | 130,790 | 75.6% | $0 | 0.0% | $0.00 |
| 2030 | 0 | 0 | 0.0% | 130,790 | 75.6% | $0 | 0.0% | $0.00 |
| 2031 | 0 | 0 | 0.0% | 130,790 | 75.6% | $0 | 0.0% | $0.00 |
| 2032 | 0 | 0 | 0.0% | 130,790 | 75.6% | $0 | 0.0% | $0.00 |
| Thereafter(3) | 3 | 2,945 | 1.7% | 133,735 | 77.3% | $0 | 0.0% | $0.00 |
| Vacant | 0 | 39,329 | 22.7% | 173,064 | 100.0% | $0 | 0.0% | $0.00 |
| Total/Weighted Average | 45 | 173,064 | 100.0% | $6,793,704 | 100.0% | $50.80 |
| (1) | Information obtained from the underwritten rent roll. |
| (2) | The Total Annual U/W Base Rent PSF excludes vacant space. |
| (3) | Includes 2,945 square feet of amenity space with no rent or lease expiration date, including a management office, conference center and an engineering office. |
The following table presents historical occupancy percentages at the Tisch Tower Property:
Historical Occupancy
12/31/2018(1) | 12/31/2019(1) | 12/31/2020(1) | 12/31/2021(1) | 6/1/2022(2) |
| 94.0% | 84.0% | 86.0% | 75.0% | 77.3% |
| (1) | Information obtained from the borrower. |
| (2) | Information obtained from the underwritten rent roll, including 890 square feet of space leased on a month to month basis. |
Market Overview and Competition. The Tisch Tower Property is located in San Jose, California, approximately 4.9 miles west of downtown. Located approximately 0.2 miles from Interstate 280 and 0.4 miles to Interstate 880, the Tisch Tower Property has access throughout the region. The surrounding area is nearly 100% developed with primary uses being commercial developments and new development reflecting redevelopment of older properties. Santana Row, a mixed-use, lifestyle development, is located approximately 0.2 miles north of the Tisch Tower Property. Santana Row includes 575,000 square feet of ground floor retail space, office space and 450 apartment and condominium units. Major retail tenants include, Best Buy, Crate & Barrel, H&M, Gucci, Sur La Table, and Urban Outfitters. In addition, the development includes a 213-room luxury hotel and multiple dining options. The Westfield Valley Fair Mall is also located approximately 1.1 miles north of the Tish Tower Property. It is one of the highest grossing malls in the country by sales volume and is anchored by Nordstrom and Macy’s. According to a third party report, within a 1-, 3- and 5- mile radius of the Tisch Tower Property, the estimated 2022 population is 22,805, 255,477, and 593,673, respectively, and the 2022 average household income is $147,833, $148,733, and $157,225, respectively.
According to a third party research report, the Tisch Tower Property is situated within the West San Jose office submarket. As of July 18, 2022, the submarket reported total inventory of approximately 3.5 million square feet with an 18.2% vacancy rate and average market rents of $54.44 per square foot. There is no office space currently under construction. The appraisal identified eight lease comparables with rents ranging from $42.00 to $57.00 per square foot. The appraisal concluded to a market rent ranging from $49.20 to $51.60 per square foot, with an average of $50.40.
| THE INFORMATION IN THIS STRUCTURAL AND COLLATERAL TERM SHEET IS NOT COMPLETE AND MAY BE AMENDED PRIOR TO THE TIME OF SALE. THIS TERM SHEET IS NOT AN OFFER TO SELL THESE SECURITIES AND IT IS NOT A SOLICITATION OF AN OFFER TO BUY THESE SECURITIES IN ANY JURISDICTION WHERE THE OFFER OR SALE IS NOT PERMITTED. | ||
| ||
| Office - Suburban | Loan #13 | Cut-off Date Balance: | $30,000,000 | |
3031 Tisch Way San Jose, CA 95128
| Tisch Tower | Cut-off Date LTV: U/W NCF DSCR: U/W NOI Debt Yield: | 39.4% 2.63x 14.6% |
The following table presents certain information relating to the appraiser’s market rent conclusions for the Tisch Tower Property:
Market Rent Summary(1)
| Office | |
| Market Rent (PSF) | $50.40 |
| Lease Term (Years) | 5.25 |
| Lease Type | Full Service Gross |
| Rent Increase Projection | 3.0%/Year |
| TI (New/Renewal) | $30.00 / $5.00 |
| LC (New/Renewal) | 8.0% / 4.0% |
| Free Rent (New/Renewal) | 3 mths / 1 mth |
| (1) | Information obtained from the appraisal. |
The table below presents certain information relating to comparable sales pertaining to the Tisch Tower Property identified by the appraiser:
Comparable Sales(1)
| Property Name | Location | Year Built/Renovated | Rentable Area (SF) | Occupancy | Sale Date | Sale Price | Sale Price (PSF) |
America Center I & II 6001 America Center Drive | San Jose, CA | 2009/NAP | 430,852 | 98.0% | Aug-2021 | $210,000,000 | $487 |
One Sixty West 160 West Santa Clara Street | San Jose, CA | 1987/2019 | 213,341 | 85.4% | Jun-2020 | $135,000,000 | $633 |
237@First 4353 North First Street | San Jose, CA | 2016/2019 | 368,702 | 64.5% | Jun-2020 | $226,000,000 | $613 |
Lakeside Atrium 2880 Lakeside Drive | Santa Clara, CA | 1986/NAP | 98,619 | 75.0% | Feb-2020 | $48,250,000 | $489 |
Santa Clara Towers 3945-3965 Freedom Circle | Santa Clara, CA | 1986/2012 | 417,876 | 65.0% | Feb-2020 | $225,200,000 | $539 |
| (1) | Information obtained from the appraisal. |
| THE INFORMATION IN THIS STRUCTURAL AND COLLATERAL TERM SHEET IS NOT COMPLETE AND MAY BE AMENDED PRIOR TO THE TIME OF SALE. THIS TERM SHEET IS NOT AN OFFER TO SELL THESE SECURITIES AND IT IS NOT A SOLICITATION OF AN OFFER TO BUY THESE SECURITIES IN ANY JURISDICTION WHERE THE OFFER OR SALE IS NOT PERMITTED. | ||
| ||
| Office - Suburban | Loan #13 | Cut-off Date Balance: | $30,000,000 | |
3031 Tisch Way San Jose, CA 95128
| Tisch Tower | Cut-off Date LTV: U/W NCF DSCR: U/W NOI Debt Yield: | 39.4% 2.63x 14.6% |
The following table presents certain information relating to the appraiser’s market rent conclusions for the Tisch Tower Property:
Comparable Office Leases(1)
| Property Name/Location | Year Built/ Renovated | Total GLA (SF) | Tenant | Tenant Size (SF) | Lease Start Date | Lease Term | Annual Base Rent PSF | Lease Type |
Tisch Tower Property (Subject) 3031 Tisch Way San Jose, CA | 1970/2004(2) | 173,064(2) | ||||||
10 South Almaden Boulevard San Jose, CA | 1988/2010 | 311,482 | Comcast | 3,237 | Mar-2022 | 5.4 Yrs. | $57.00 |
FSG
|
2953 Bunker Hill Lane Santa Clara, CA | 1985/2016 | 120,096 | Deepsight Technology | 4,027 | Jan-2022 | 4.3 Yrs. | $53.52 |
FSG
|
2880 Lakeside Drive Santa Clara, CA
| 1986/NAP | 98,619 | Artec Group | 4,586 | Oct-2021 | 4.3 Yrs. | $55.20 | FSG
|
333 West Santa Clara Street San Jose, CA
| 1983/NAP | 213,500 | Ropers Majeski | 3,972 | Sep-2021 | 3.3 Yrs. | $48.48 | FSG
|
60 South Market Street San Jose, CA
| 1986/NAP | 234,835 | LPA | 6,486 | Aug-2021 | 6.3 Yrs. | $57.00 |
FSG
|
2880 Stevens Creek Boulevard San Jose, CA
| 2001/NAP | 57,579 | Panzura | 10,778 | Jan-2021 | 5.0 Yrs. | $42.00 | FSG |
2105 South Bascom Avenue Campbell, CA
| 1985/NAP | 123,529 | Nomi & Takaichi | 3,011 | Dec-2020 | 5.0 Yrs. | $52.80 | FSG |
5201 Great American Parkway Santa Clara, CA
| 1986/NAP | 284,440 | Far East Trade Service | 3,166 | Nov-2020 | 3.3 Yrs. | $54.00 |
FSG
|
| (1) | Information obtained from the appraisal. |
| (2) | Information obtained from the underwritten rent roll. |
| THE INFORMATION IN THIS STRUCTURAL AND COLLATERAL TERM SHEET IS NOT COMPLETE AND MAY BE AMENDED PRIOR TO THE TIME OF SALE. THIS TERM SHEET IS NOT AN OFFER TO SELL THESE SECURITIES AND IT IS NOT A SOLICITATION OF AN OFFER TO BUY THESE SECURITIES IN ANY JURISDICTION WHERE THE OFFER OR SALE IS NOT PERMITTED. | ||
| ||
| Office - Suburban | Loan #13 | Cut-off Date Balance: | $30,000,000 | |
3031 Tisch Way San Jose, CA 95128
| Tisch Tower | Cut-off Date LTV: U/W NCF DSCR: U/W NOI Debt Yield: | 39.4% 2.63x 14.6% |
Operating History and Underwritten Net Cash Flow. The following table presents certain information relating to the historical operating performance and underwritten net cash flow at the Tisch Tower Property:
Cash Flow Analysis
| 2019 | 2020 | 2021 | TTM (4/30/2022) | U/W | %(1) | U/W $ per SF | |
| Base Rent | $7,347,827 | $7,832,544 | $7,336,386 | $7,291,762 | $6,793,704(2) | 75.6% | $39.26 |
| Grossed Up Vacant Space | 0 | 0 | 0 | 0 | 1,982,182 | 22.1% | 11.45 |
| Gross Potential Rent | $7,347,827 | $7,832,544 | $7,336,386 | $7,291,762 | $8,775,886 | 97.6% | $50.71 |
| Other Income | 46,625 | 52,008 | 57,301 | 61,744 | 61,744 | 0.7 | 0.36 |
| Parking Garage/Other | 5,000 | 1,250 | 0 | 0 | 0 | 0.0 | 0.00 |
| Total Recoveries | 229,750 | 215,249 | 261,379 | 254,631 | 151,116 | 1.7 | $0.87 |
| Net Rental Income | $7,629,202 | $8,101,051 | $7,655,066 | $7,608,136 | $8,988,746 | 100.0% | $51.94 |
| (Vacancy & Credit Loss) | 0 | 0 | 0 | 0 | (1,982,182)(3) | 22.6 | (11.45) |
| Effective Gross Income | $7,629,202 | $8,101,051 | $7,655,066 | $7,608,136 | $7,006,564 | 77.9% | $40.49 |
| Real Estate Taxes | $439,609 | $446,788 | $457,910 | $461,778 | $463,712 | 6.6% | $2.68 |
| Insurance | 56,678 | 76,251 | 64,968 | 66,042 | 65,359 | 0.9 | 0.38 |
| Management Fee | 236,145 | 239,295 | 225,287 | 208,747 | 210,197 | 3.0 | 1.21 |
| Other Operating Expenses | 1,779,177 | 1,758,450 | 1,874,256 | 1,873,378 | 1,873,377 | 26.7 | 10.82 |
| Total Operating Expenses | $2,511,609 | $2,520,784 | $2,622,421 | $2,609,945 | $2,612,645 | 37.3% | $15.10 |
| Net Operating Income | $5,117,593 | $5,580,267 | $5,032,645 | $4,998,192(4) | $4,393,919(4) | 62.7% | $25.39 |
| Replacement Reserves | 0 | 0 | 0 | 0 | 49,225 | 0.7 | 0.28 |
| TI/LC | 0 | 0 | 0 | 0 | 322,103 | 4.6 | 1.86 |
| Net Cash Flow | $5,117,593 | $5,580,267 | $5,032,645 | $4,998,192 | $4,022,591 | 57.4% | $23.24 |
| NOI DSCR | 3.34x | 3.64x | 3.29x | 3.26x | 2.87x | ||
| NCF DSCR | 3.34x | 3.64x | 3.29x | 3.26x | 2.63x | ||
| NOI Debt Yield | 17.1% | 18.6% | 16.8% | 16.7% | 14.6% | ||
| NCF Debt Yield | 17.1% | 18.6% | 16.8% | 16.7% | 13.4% |
| (1) | Represents (i) percent of Net Rental Income for all revenue fields, (ii) percent of Gross Potential Rent for Vacancy & Credit Loss and (iii) percent of Effective Gross Income for all other fields. |
| (2) | The U/W Base Rent PSF and U/W Base Rent includes rent steps through August 2023, and adjusts above market rents down to the high end of the appraisal market rent of $51.60 per square foot. |
| (3) | The underwritten economic vacancy is 22.6%. The Tisch Tower Property was 77.3% physically occupied as of June 1, 2022, including 890 square feet of space leased on a month to month basis. |
| (4) | The U/W NOI is lower than the TTM NOI primarily due to the underwritten rent for tenants with above market rents being rolled down to the high end of the appraisal market rent range of $51.60 per square foot. As of June 1, 2022, the in-place rent was $55.73 per square foot, versus the underwritten rent of $50.71 per square foot. |
| THE INFORMATION IN THIS STRUCTURAL AND COLLATERAL TERM SHEET IS NOT COMPLETE AND MAY BE AMENDED PRIOR TO THE TIME OF SALE. THIS TERM SHEET IS NOT AN OFFER TO SELL THESE SECURITIES AND IT IS NOT A SOLICITATION OF AN OFFER TO BUY THESE SECURITIES IN ANY JURISDICTION WHERE THE OFFER OR SALE IS NOT PERMITTED. | ||
| ||
| No. 14 – Homewood Suites – Oxnard, CA |
| Mortgage Loan Information | Mortgaged Property Information | |||||
| Mortgage Loan Seller: | Bank of America, National Association | Single Asset/Portfolio: | Single Asset | |||
| Credit Assessment (Fitch/KBRA/Moody’s): | NR/NR/NR | Property Type – Subtype: | Hospitality – Extended Stay | |||
| Original Principal Balance: | $27,850,000 | Location: | Oxnard, CA | |||
| Cut-off Date Balance: | $27,850,000 | Size: | 129 Rooms | |||
| % of Initial Pool Balance: | 2.6% | Cut-off Date Balance Per Room: | $215,891 | |||
| Loan Purpose: | Refinance | Maturity Date Balance Per Room: | $215,891 | |||
| Borrower Sponsor: | T.M. Mian | Year Built/Renovated: | 2010/2020 | |||
| Guarantor: | T.M. Mian | Title Vesting: | Fee | |||
| Mortgage Rate: | 5.8400% | Property Manager: | T.M. Mian & Associates, Inc. | |||
| Note Date: | July 15, 2022 | (borrower-related) | ||||
| Seasoning: | 0 months | Current Occupancy (As of): | 86.8% (5/31/2022) | |||
| Maturity Date: | August 1, 2032 | YE 2021 Occupancy: | 85.6% | |||
| IO Period: | 120 months | YE 2020 Occupancy(4): | 64.5% | |||
| Loan Term (Original): | 120 months | YE 2019 Occupancy: | 84.4% | |||
| Amortization Term (Original): | NAP | As Is Appraised Value(5)(6): | $50,400,000 | |||
| Loan Amortization Type: | Interest Only | As Is Appraised Value Per Room: | $390,698 | |||
| Call Protection: | L(24),YM1(91),O(5) | As Is Appraisal Valuation Date: | April 21, 2022 | |||
| Lockbox Type: | Hard/Springing Cash Management | Underwriting and Financial Information(6) | ||||
| Additional Debt: | None | TTM NOI (5/31/2022): | $6,391,542 | |||
| Additional Debt Type (Balance): | NAP | YE 2021 NOI: | $5,175,476 | |||
| YE 2020 NOI(4): | $2,685,796 | |||||
| YE 2019 NOI: | $4,661,653 | |||||
| U/W Revenues: | $8,964,735 | |||||
| U/W Expenses: | $4,302,865 | |||||
| U/W NOI: | $4,661,870 | |||||
| Escrows and Reserves | U/W NCF: | $4,303,281 | ||||
| Initial | Monthly | Cap | U/W DSCR based on NOI/NCF: | 2.83x / 2.61x | ||
| Taxes: | $66,813 | $16,703 | NAP | U/W Debt Yield based on NOI/NCF: | 16.7% / 15.5% | |
| Insurance(1): | $0 | Springing | NAP | U/W Debt Yield at Maturity based on NOI/NCF: | 16.7% / 15.5% | |
| FF&E Reserve(2): | $0 | $43,611 | NAP | Cut-off Date LTV Ratio: | 55.3% | |
| PIP Reserve(3): | $460,710 | $0 | NAP | LTV Ratio at Maturity: | 55.3% | |
| Sources and Uses | |||||||
| Sources | Uses | ||||||
| Loan Amount | $27,850,000 | 100.0% | Return of Equity(7) | $18,288,156 | 65.7 | % | |
| Loan Payoff | 8,828,124 | 31.7 | |||||
| Upfront Reserves | 527,523 | 1.9 | |||||
| Closing Costs | 206,197 | 0.7 | |||||
| Total Sources | $27,850,000 | 100.0% | Total Uses | $27,850,000 | 100.0 | % | |
| (1) | Monthly deposits for insurance are suspended as long as the Homewood Suites - Oxnard, CA Property (as defined below) is covered by a blanket insurance policy. |
| (2) | Represents 4% of revenues for general FF&E and an additional 1% of revenues unless the franchise agreement is renewed twelve months prior to expiration. |
| (3) | Represents 125% of a Hilton required refresh which includes renovating the front desk station, lobby lounge, restaurant seating, pantry shop, refrigeration and business center. The total projected costs are $368,568. |
| (4) | The decrease in occupancy and NOI in 2020 and the subsequent increase in 2021 was due to the impacts of the novel coronavirus pandemic. The Homewood Suites - Oxnard, CA Property has since improved and is performing in line with historical occupancy and financials. |
| (5) | The banquet hall at the Homewood Suites - Oxnard, CA Property does not feature a kitchen, and currently the food is prepared at the kitchen of the adjacent borrower sponsor-owned Hilton Garden Inn Oxnard Camarillo or provided by a caterer. There is an easement agreement in place dated December 17, 2012 between the Homewood Suites - Oxnard, CA Property and the Hilton Garden Inn Oxnard Camarillo that states that the Homewood Suites - Oxnard, CA Property has the right of access and use of the Hilton Garden Inn Oxnard Camarillo's kitchen and all surrounding areas, including ingress and egress of staff and permitted use of all equipment. The appraised value makes an extraordinary assumption that the access easement to the Hilton Garden Inn Oxnard Camarillo's kitchen facilities is transferrable to a new owner upon sale. |
| (6) | The novel coronavirus pandemic is an evolving situation and could impact the Homewood Suites - Oxnard, CA Mortgage Loan (as defined below) more severely than assumed in the underwriting of the Homewood Suites - Oxnard, CA Mortgage Loan and could adversely affect the NOI, NCF and occupancy information, as well as the appraised value and the DSCR, LTV and Debt Yield metrics presented above and herein. See "Risk Factors—Risks Related to Market Conditions and Other External Factors—The Coronavirus Pandemic Has Adversely Affected the Global Economy and Will Likely Adversely Affect the Performance of the Mortgage Loans" in the Preliminary Prospectus. |
| (7) | The Homewood Suites - Oxnard, CA Borrower (as defined below) developed the Homewood Suites - Oxnard, CA Property in 2010 and has a total cost basis of $22.8 million. |
The Mortgage Loan. The mortgage loan (the “Homewood Suites - Oxnard, CA Mortgage Loan”) is evidenced by a promissory note in the original principal amount of $27,850,000. The Homewood Suites - Oxnard, CA Mortgage Loan is secured by a first priority fee mortgage on a 129-room extended stay hotel located in Oxnard, California (the “Homewood Suites - Oxnard, CA Property”).
| THE INFORMATION IN THIS STRUCTURAL AND COLLATERAL TERM SHEET IS NOT COMPLETE AND MAY BE AMENDED PRIOR TO THE TIME OF SALE. THIS TERM SHEET IS NOT AN OFFER TO SELL THESE SECURITIES AND IT IS NOT A SOLICITATION OF AN OFFER TO BUY THESE SECURITIES IN ANY JURISDICTION WHERE THE OFFER OR SALE IS NOT PERMITTED. | ||
| ||
| Hospitality – Extended Stay | Loan #14 | Cut-off Date Balance: | $27,850,000 | |
| 1950 and 1975 Solar Drive | Homewood Suites - Oxnard, CA | Cut-off Date LTV: | 55.3% | |
| Oxnard, CA 93036 | UW NCF DSCR: | 2.61x | ||
| UW NOI Debt Yield: | 16.7% |
The Borrower and the Borrower Sponsors. The borrower is Mian Extended Stay, Inc. (the “Homewood Suites - Oxnard, CA Borrower”), a single-purpose Texas corporation with one independent director.
The non-recourse carveout guarantor is T.M. Mian, who is the founder and principal of The Mian Companies. Founded in 1984, The Mian Companies, consisting of Mian Development Corporation and T.M. Mian & Associates, Inc., are full-service real estate firms specializing in property management, partnership ventures and residential and commercial real estate brokerage and development. T.M. Mian & Associates, Inc. currently owns and/or manages three office buildings totaling 340,000 square feet and four hotels with 857 rooms.
The Property. The Homewood Suites - Oxnard, CA Property is a four-story 129-room, extended-stay hotel that contains approximately 103,289 square feet of gross building area and is located on a 3.76-acre site at the southwest corner of the intersection of the Ventura Freeway (101) and Highway 1. The Homewood Suites - Oxnard, CA Property was developed by the sponsor in 2010 and was renovated in 2020. The 2020 renovations included an approximate $1.56 million ($12,118 per room) guestroom upgrade. Additionally approximately $161,387 was invested in 2021 and approximately $240,741 was invested in 2022 in brand upgrades, and $460,710 has been reserved by the lender for an upcoming brand required refresh. In 2017, the Homewood Suites - Oxnard, CA Property received Hilton’s Connie Pride Award, which is awarded to the top 5% of properties within the brand excelling in all requirements.
The Homewood Suites - Oxnard, CA Property consists of 56 studio suites, 54 one-bedroom suites, 11 two-bedroom suites and 8 queen/queen suites. Each guestroom includes a sleeper sofa, flat screen television, kitchenette with full refrigerator, two-burner stovetop, microwave, coffeemaker, toaster and standard utensils, and free WiFi. Hotel amenities include an outdoor swimming pool, outdoor whirlpool, fitness room, guest laundry facilities, business center, sundry shop, sport court, daily complimentary breakfast and once weekly complimentary dinner. The Homewood Suites - Oxnard, CA Property also offers 129 parking spaces (1.0 spaces per room).
Additionally, the Homewood Suites - Oxnard, CA Property includes 950 square feet of meeting space and a 3,500 square feet of banquet space in a separate stand-alone building known as Adagio Bella Gardens. The banquet hall at the Homewood Suites - Oxnard, CA Property does not feature a kitchen, and currently the food is prepared at the kitchen of the adjacent borrower sponsor-owned Hilton Garden Inn Oxnard Camarillo or provided by a caterer. There is an easement agreement in place dated December 17, 2012 between the Homewood Suites - Oxnard, CA Property and the Hilton Garden Inn Oxnard Camarillo that states that the Homewood Suites - Oxnard, CA Property has the right of access and use of the Hilton Garden Inn Oxnard Camarillo's kitchen and all surrounding areas, including ingress and egress of staff and permitted use of all equipment.
Demand segmentation is 80% commercial/government, 10% meeting/group and 10% leisure. The top five accounts in 2021 included SnapNurse (1,916 room nights), DynCorp International (163 room nights), CleanSwitch (150 room nights), Northrup Grumman (103 room nights) and United Technologies (65 room nights).
The Homewood Suites - Oxnard, CA Property operates under a 22-year franchise agreement with Promus Hotels, Inc., a subsidiary of Hilton Hotels, through May 17, 2027. The Homewood Suites-Oxnard, CA Mortgage Loan is structured with a cash flow sweep twelve months prior to the franchise agreement expiration date or during any default under the franchise agreement.
The following table presents historical occupancy, ADR, and RevPAR penetration rates of the Homewood Suites - Oxnard, CA Property:
| Historical Occupancy, ADR, RevPAR(1) | |||||||||
| Homewood Suites - Oxnard, CA Property | Competitive Set(2) | Penetration Factor | |||||||
| Year | Occupancy | ADR | RevPAR | Occupancy | ADR | RevPAR | Occupancy | ADR | RevPAR |
| 12/31/2019 | 84.4% | $180.92 | $152.61 | 76.4% | $169.50 | $129.45 | 110.5% | 106.7% | 117.9% |
| 12/31/2020 | 64.5% | $165.69 | $106.88 | 53.3% | $159.14 | $84.77 | 121.1% | 104.1% | 126.1% |
| 12/31/2021 | 85.5% | $184.74 | $158.02 | 67.7% | $187.07 | $126.57 | 126.4% | 98.8% | 124.8% |
| TTM 4/30/2022 | 87.2% | $191.44 | $166.86 | 70.3% | $191.01 | $134.28 | 124.0% | 100.2% | 124.3% |
Source: Third party research report
| (1) | Variances between the underwriting, the appraisal and the industry report data with respect to Occupancy, ADR and RevPAR at the Homewood Suites - Oxnard, CA Property are attributable to variances in reporting methodologies and/or timing differences. |
| (2) | According to a third party research report, the competitive set includes the following hotels: Crowne Plaza Ventura Beach, Embassy Suites by Hilton Mandalay Beach Resort, Courtyard Oxnard Ventura, Residence Inn Oxnard River Ridge, Holiday Inn Express Port Hueneme and Hampton by Hilton Inn & Suites Camarillo. |
| THE INFORMATION IN THIS STRUCTURAL AND COLLATERAL TERM SHEET IS NOT COMPLETE AND MAY BE AMENDED PRIOR TO THE TIME OF SALE. THIS TERM SHEET IS NOT AN OFFER TO SELL THESE SECURITIES AND IT IS NOT A SOLICITATION OF AN OFFER TO BUY THESE SECURITIES IN ANY JURISDICTION WHERE THE OFFER OR SALE IS NOT PERMITTED. | ||
| ||
| Hospitality – Extended Stay | Loan #14 | Cut-off Date Balance: | $27,850,000 | |
| 1950 and 1975 Solar Drive | Homewood Suites - Oxnard, CA | Cut-off Date LTV: | 55.3% | |
| Oxnard, CA 93036 | UW NCF DSCR: | 2.61x | ||
| UW NOI Debt Yield: | 16.7% |
Operating History and Underwritten Net Cash Flow. The following table presents certain information relating to the historical operating performance and Underwritten Net Cash Flow at the Homewood Suites - Oxnard, CA Property:
Cash Flow Analysis
| 2019 | 2020(1) | 2021(1) | TTM 5/31/2022 | U/W | % of U/W Total Revenue(2) | U/W $ per Room | ||
| Occupancy | 84.4% | 64.5% | 85.6% | 86.8% | 86.8% | |||
| ADR | $182.69 | $165.17 | $184.70 | $192.43 | $192.43 | |||
| RevPAR | $154.12 | $106.58 | $158.08 | $167.03 | $167.01 | |||
| Room Revenue | $7,256,569 | $5,031,930 | $7,443,196 | $7,863,187 | $7,863,187 | 87.7 | % | $60,955 |
| Food & Beverage Revenue | 825,867 | 468,864 | 706,800 | 2,548,359 | 1,046,467 | 11.7 | 8,112 | |
| Other Revenue(3) | 38,994 | 39,094 | 49,469 | 55,081 | 55,081 | 0.6 | 427 | |
| Total Revenue | $8,121,430 | $5,539,888 | $8,199,465 | $10,466,627 | $8,964,735 | 100.0 | % | $69,494 |
| Room Expense | $1,551,375 | $1,141,181 | $1,131,413 | $1,197,282 | $1,457,178 | 18.5 | % | $11,296 |
| Food & Beverage Expense | 337,630 | 170,503 | 233,650 | 840,958 | 393,301 | 37.6 | 3,049 | |
| Other Department Expense | 15,051 | 5,831 | 7,587 | 11,672 | 13,976 | 25.4 | 108 | |
| Total Department Expenses | $1,904,056 | $1,317,515 | $1,372,650 | $2,049,912 | $1,864,455 | 20.8 | % | 14,453 |
| Gross Operating Income | $6,217,374 | $4,222,373 | $6,826,815 | $8,416,715 | $7,100,280 | 79.2 | % | $55,041 |
| Total Undistributed Expenses | 1,417,202 | 1,409,081 | 1,380,739 | 1,827,764 | 2,060,369 | 23.0 |
| 15,972 |
| Gross Operating Profit | $4,800,172 | $2,813,292 | $5,446,076 | $6,588,951 | $5,039,911 | 56.2 | % | $39,069 |
| Total Fixed Charges | 138,519 | 127,496 | 270,600 | 197,409 | 378,041 | 4.2 |
| 2,931 |
| Total Operating Expenses | $3,459,777 | $2,854,092 | $3,023,989 | $4,075,085 | $4,302,865 | 48.0 | % | $33,356 |
| Net Operating Income | $4,661,653 | $2,685,796 | $5,175,476 | $6,391,542 | $4,661,870 | 52.0 | % | $36,139 |
| FF&E | 213,075 | 271,986 | 234,431 | 203,427 | 358,589 | 4.0 |
| 2,780 |
| Net Cash Flow | $4,448,578 | $2,413,810 | $4,941,045 | $6,188,115 | $4,303,281 | 48.0 | % | $33,359 |
| NOI DSCR | 2.83x | 1.63x | 3.14x | 3.88x | 2.83x | |||
| NCF DSCR | 2.70x | 1.46x | 3.00x | 3.75x | 2.61x | |||
| NOI DY | 16.7% | 9.6% | 18.6% | 22.9% | 16.7% | |||
| NCF DY | 16.0% | 8.7% | 17.7% | 22.2% | 15.5% | |||
| (1) | The decrease in occupancy and revenues in 2020 and the subsequent increase in 2021 was due to the impacts of the novel coronavirus pandemic. The Homewood Suites - Oxnard, CA Property has since improved and is performing in line with historical occupancy and financials. |
| (2) | % of U/W Total Revenue for Room Expense, F&B Expense and Other Department Expenses are based on their corresponding revenue line items. All other line items represent percent of Total Revenue. |
| (3) | Other Revenue includes parking income, telephone, valet, coin laundry, vending, gift shop and other miscellaneous items. |
The Market. The Homewood Suites - Oxnard, CA Property is located in the greater Ventura County market and the Oxnard submarket and is located in the Los Angeles-Long Beach, CA combined statistical area (“CSA”). According to the appraisal, the greater Ventura County submarket comprises a total of 8.2 million SF of office space. The Los Angeles-Long Beach, CA CSA is home to major employers including United States Naval Base (19,000 employees), County of Ventura (9,146 employees), Amgen, Inc. (5,400), Bank of America (3,000 employees), and Blue Cross of California (2,500 employees). The Homewood Suites – Oxnard, CA Property is in close proximity to State Highway 101 to the north, and State Highway 1 to the east of the Homewood Suites – Oxnard, CA Property while providing convenient access to office buildings, retail shopping centers, hotels, and restaurants.
Primary commercial demand generators for the market include Southern California Edison, Community Memorial Hospital, Haas Automation, Patagonia, Amgen and Seminis Vegetable Seeds. Naval Base of Ventura County in Port Heuneme and Point Mugu serve as anchors for government demand. Additional government demand is generated by contractors such as Northrop Grumman and Lockheed Martin. Leisure demand generators include Ventura Pier Beach, Mission San Buenaventura, Ventura County Fairground and Channel Islands National Park.
According to the appraisal, the estimated 2022 population within a one-, three- and five-mile radius of the Homewood Suites - Oxnard, CA Property was 22,287, 134,370 and 262,823, respectively. The 2022 average household income within the same radii is $114,520, $113,210, and $113,215, respectively.
According to the appraisal, there are three hotels including the Residence Inn Ventura Beach (125 rooms), Camarillo Conference Center Home 2 Suites by Hilton (122 rooms) and Camarillo Conference Center Embassy Suites by Hilton (155 rooms) that are under construction and which are anticipated to compete with the Homewood Suites - Oxnard, CA Property.
| THE INFORMATION IN THIS STRUCTURAL AND COLLATERAL TERM SHEET IS NOT COMPLETE AND MAY BE AMENDED PRIOR TO THE TIME OF SALE. THIS TERM SHEET IS NOT AN OFFER TO SELL THESE SECURITIES AND IT IS NOT A SOLICITATION OF AN OFFER TO BUY THESE SECURITIES IN ANY JURISDICTION WHERE THE OFFER OR SALE IS NOT PERMITTED. | ||
| ||
| Hospitality – Extended Stay | Loan #14 | Cut-off Date Balance: | $27,850,000 | |
| 1950 and 1975 Solar Drive | Homewood Suites - Oxnard, CA | Cut-off Date LTV: | 55.3% | |
| Oxnard, CA 93036 | UW NCF DSCR: | 2.61x | ||
| UW NOI Debt Yield: | 16.7% |
The following table presents certain information relating to the primary competitive properties to the Homewood Suites - Oxnard, CA Property:
Competitive Property Summary(1)
| ||||||||
| Property Name | No. of Rooms | Year Built | Commercial | Meeting & Group | Leisure | Estimated 2021 Occupancy | Estimated 2021 ADR | Estimated 2021 RevPAR |
| Homewood Suites – Oxnard, CA | 129 | 2010 | 80% | 10% | 10% | 85.6% | $184.70 | $158.08 |
| Residence Inn by Marriott Oxnard River Ridge | 252 | 1987 | 50% | 15% | 35% | 65%-70% | $170-$180 | $115-$120 |
| Residence Inn by Marriott Camarillo | 128 | 2009 | 55% | 10% | 35% | 70%-75% | $170-$180 | $125-$130 |
| Embassy Suites by Hilton Mandalay Beach Resort | 250 | 1986 | 45% | 25% | 30% | 55%-60% | $230-$240 | $130-$140 |
| Crowne Plaza Ventura Beach | 235 | 1972 | 40% | 25% | 35% | 60%-65% | $210-$220 | $130-$140 |
| Marriott Ventura Beach | 286 | 1986 | 40% | 25% | 35% | 60%-65% | $170-$180 | $110-$115 |
| Hilton Garden Inn Oxnard Camarillo(2) | 170 | 2005 | 55% | 20% | 25% | 65%-70% | $160-$170 | $110-$115 |
Source: Appraisal
| (1) | Variances between the underwriting, the appraisal and the Historical Occupancy, ADR, RevPAR table above with respect to Occupancy, ADR and RevPAR at the Homewood Suites - Oxnard, CA Property are attributable to variances in reporting methodologies and/or timing differences. |
| (2) | The Hilton Garden Inn Oxnard Camarillo is owned by the borrower sponsor. |
| THE INFORMATION IN THIS STRUCTURAL AND COLLATERAL TERM SHEET IS NOT COMPLETE AND MAY BE AMENDED PRIOR TO THE TIME OF SALE. THIS TERM SHEET IS NOT AN OFFER TO SELL THESE SECURITIES AND IT IS NOT A SOLICITATION OF AN OFFER TO BUY THESE SECURITIES IN ANY JURISDICTION WHERE THE OFFER OR SALE IS NOT PERMITTED. | ||
| ||
| No. 15 – 79 Fifth Avenue |
| Mortgage Loan Information | Mortgaged Property Information | |||||
| Mortgage Loan Seller: | Wells Fargo Bank, National Association | Single Asset/Portfolio: | Single Asset | |||
Credit Assessment (Fitch/KBRA/Moody’s): | NR/NR/NR | Property Type – Subtype: | Office – CBD | |||
| Original Principal Balance(1): | $25,000,000 | Location: | New York, NY | |||
| Cut-off Date Balance(1): | $25,000,000 | Size: | 345,751 SF | |||
| % of Initial Pool Balance: | 2.3% | Cut-off Date Balance Per SF(1): | $694.14 | |||
| Loan Purpose: | Recapitalization | Maturity Date Balance Per SF(1): | $694.14 | |||
| Borrower Sponsor: | Albert Kalimian | Year Built/Renovated: | 1906/2016 | |||
| Guarantor: | Albert Kalimian | Title Vesting: | Fee | |||
| Mortgage Rate: | 4.9200% | Property Manager: | AMK Holdings Inc. | |||
| Note Date: | April 29, 2022 | Current Occupancy (As of): | 100.0% (2/15/2022) | |||
| Seasoning: | 3 months | YE 2021 Occupancy(4): | 100.0% | |||
| Maturity Date: | May 6, 2032 | YE 2020 Occupancy(4): | 99.4% | |||
| IO Period: | 120 months | YE 2019 Occupancy(4): | 100.0% | |||
| Loan Term (Original): | 120 months | YE 2018 Occupancy: | NAV | |||
| Amortization Term (Original): | NAP | As-Is Appraised Value: | $395,000,000 | |||
| Loan Amortization Type: | Interest Only | As-Is Appraised Value Per SF: | $1,142.44 | |||
| Call Protection(2): | L(27),D(88),O(5) | As-Is Appraisal Valuation Date: | February 24, 2022 | |||
| Lockbox Type: | Hard/Springing Cash Management | Underwriting and Financial Information(5) | ||||
| Additional Debt(1): | Yes | YE 2021 NOI: | $18,362,181 | |||
| Additional Debt Type (Balance) (1): | Pari Passu ($215,000,000) | YE 2020 NOI: | $17,160,810 | |||
| YE 2019 NOI: | $17,085,519 | |||||
| YE 2018 NOI: | NAV | |||||
| U/W Revenues: | $29,320,118 | |||||
| U/W Expenses: | $9,216,627 | |||||
| U/W NOI: | $20,103,491 | |||||
| U/W NCF: | $19,331,988 | |||||
| Escrows and Reserves | U/W DSCR based on NOI/NCF(1): | 1.68x / 1.61x | ||||
| Initial | Monthly | Cap | U/W Debt Yield based on NOI/NCF(1): | 8.4% / 8.1% | ||
| Taxes | $2,815,969 | $469,328 | NAP | U/W Debt Yield at Maturity based on NOI/NCF(1): | 8.4% / 8.1% | |
| Insurance | $0 | Springing(3) | NAP | Cut-off Date LTV Ratio(1): | 60.8% | |
| Replacement Reserves | $0 | $5,763 | $207,468 | LTV Ratio at Maturity(1): | 60.8% | |
| TI/LC Reserves | $1,000,000 | $57,760 | $3,500,000 | |||
| Sources and Uses | ||||||||
| Sources | Uses | |||||||
| Whole loan amount | $240,000,000 | 63.1 | % | Recapitalization price(7) | $369,000,000 | 97.0 | % | |
| Sponsor equity(6) | 140,421,540 | 36.9 | Upfront Reserves | 3,815,969 | 1.0 | |||
| Closing costs | 7,605,571 | 2.0 | ||||||
| Total Sources | $380,421,540 | 100.0 | % | Total Uses | $380,421,540 | 100.0 | % | |
| (1) | The 79 Fifth Avenue Mortgage Loan (as defined below) is part of the 79 Fifth Avenue Whole Loan (as defined below) with an original aggregate principal balance of $240,000,000. The Cut-off Date Balance per SF, Maturity Date Balance per SF, U/W Debt Yield based on NOI/NCF, U/W Debt Yield based on NOI/NCF at Maturity, U/W DSCR based on NOI/NCF, Cut-off Date LTV Ratio and LTV Ratio at Maturity numbers presented above are based on the 79 Fifth Avenue Whole Loan. |
| (2) | At any time after the earlier of (i) April 29, 2026 and (ii) two years from the closing date of the securitization that includes the last pari passu note of the 79 Fifth Avenue Whole Loan to be securitized, the borrower has the right to defease the 79 Fifth Avenue Whole Loan in whole, but not in part. Additionally, the borrower may prepay the 79 Fifth Avenue Whole Loan with 30 days’ notice on or after January 6, 2032. |
| (3) | The loan documents require ongoing monthly insurance reserves in an amount equal to 1/12th of the insurance premiums that the lender estimates will be payable for the renewal of the coverage afforded by the policies upon the expiration thereof. Notwithstanding the above, the borrower’s obligation to make insurance reserve payments will be waived so long as (i) no event of default is continuing and (ii) the insurance policies maintained by borrower are part of a blanket or umbrella policy approved by the lender in its reasonable discretion. |
| (4) | Information based on a third party market research report. |
| (5) | The novel coronavirus pandemic is an evolving situation and could impact the 79 Fifth Avenue Whole Loan more severely than assumed in the underwriting of the 79 Fifth Avenue Whole Loan and could adversely affect the NOI, NCF and occupancy information, as well as the appraised value and the DSCR, LTV and Debt Yield metrics presented above and herein. See "Risk Factors—Risks Related to Market Conditions and Other External Factors—The Coronavirus Pandemic Has Adversely Affected the Global Economy and Will Likely Adversely Affect the Performance of the Mortgage Loans" in the prospectus. |
| (6) | Sponsor equity is reflective of the prior equity members’ buyout of the borrower sponsor’s ownership interest in 10 other properties in the portfolio. |
| (7) | The 79 Fifth Avenue Property (as defined below) was recapitalized at a price of $369,000,000. At origination, the borrower sponsor bought out the equity partners’ 75% interest and paid off prior debt of $62,053,414. |
The Mortgage Loan. The mortgage loan (the “79 Fifth Avenue Mortgage Loan”) is part of a whole loan (the “79 Fifth Avenue Whole Loan”) that is evidenced by ten pari passu promissory notes in the aggregate original principal amount of $240,000,000. The 79 Fifth Avenue Whole Loan is secured by a first priority fee mortgage encumbering a 345,751 SF office property, which includes 28,345 SF of ground floor retail, in New York, New York (the “79 Fifth Avenue Property”). The 79 Fifth Avenue Whole Loan was co-originated by
| THE INFORMATION IN THIS STRUCTURAL AND COLLATERAL TERM SHEET IS NOT COMPLETE AND MAY BE AMENDED PRIOR TO THE TIME OF SALE. THIS TERM SHEET IS NOT AN OFFER TO SELL THESE SECURITIES AND IT IS NOT A SOLICITATION OF AN OFFER TO BUY THESE SECURITIES IN ANY JURISDICTION WHERE THE OFFER OR SALE IS NOT PERMITTED. | ||
| ||
| Office – CBD | Loan #15 | Cut-off Date Balance: | $25,000,000 | |
79 Fifth Avenue New York, NY 10003 | 79 Fifth Avenue | Cut-off Date LTV: U/W NCF DSCR: U/W NOI Debt Yield: | 60.8% 1.61x 8.4% |
Wells Fargo Bank, National Association (“WFB”), Citi Real Estate Funding Inc. (“CREFI”) and JPMorgan Chase Bank, National Association (“JPM”). The 79 Fifth Avenue Mortgage Loan is evidenced by the non-controlling promissory Notes A-2-2 and A-2-3-1, collectively in the original principal amount of $25,000,000. The controlling promissory Note A-1-1, in the original principal amount of $50,000,000, was contributed to the CGCMT 2022-GC48 securitization trust. The non-controlling promissory Notes A-2-1 and A-2-3-2, in the original principal amount of $71,000,000, were contributed to the BANK 2022-BNK42 securitization trust. The remaining promissory Notes A-1-3, A-3-1, A-3-2 and A-3-3 are expected to be contributed to one or more future securitizations. The 79 Fifth Avenue Whole Loan is serviced pursuant to the pooling and servicing agreement for the CGCMT 2022-GC48 securitization trust. See “Description of the Mortgage Pool—The Whole Loans—The Serviced Pari Passu Whole Loans”, “—The Non-Serviced Pari Passu Whole Loans” and “Pooling and Servicing Agreement Agreement—Servicing of the Non-Serviced Mortgage Loans” in the prospectus.
Whole Loan Note Summary
| Notes | Original Balance | Cut-off Date Balance | Note Holder | Controlling Piece |
| A-1-1 | $50,000,000 | $50,000,000 | CGCMT 2022-GC48 | Yes |
| A-2-1, A-2-3-2 | $71,000,000 | $71,000,000 | BANK 2022-BNK42 | No |
| A-1-2 | $23,000,000 | $23,000,000 | BMO 2022-C2 | No |
| A-2-2 | $13,000,000 | $13,000,000 | BANK 2022-BNK43 | No |
| A-2-3-1 | $12,000,000 | $12,000,000 | BANK 2022-BNK43 | No |
| A-1-3 | $23,000,000 | $23,000,000 | CREFI | No |
| A-3-1, A-3-2, A-3-3 | $48,000,000 | $48,000,000 | JPMCB | No |
| Total (Whole Loan) | $240,000,000 | $240,000,000 |
The Borrower and Borrower Sponsors. The borrowers comprise three tenants in common, AK 79 Fifth LLC, SAK 79 Fifth LLC, and DAK 79 Fifth LLC, each a Delaware limited liability company and single purpose entity with one independent director. The borrower sponsor and nonrecourse carveout guarantor is Albert Kalimian.
Albert Kalimian owns Kalimian Properties, a fully integrated privately held real estate investment firm with ownership interests in 10 commercial and multifamily properties in Manhattan, New York. Albert Kalimian had a 25% ownership stake in the property and is using the loan proceeds to buy out his equity partners to increase his ownership share to 100%.
The Property. The 79 Fifth Avenue Property consists of an 18-story office building totaling 345,751 SF, which includes 28,345 SF of ground floor retail space located in New York, New York. The property, which sits on 0.4 acre parcel of land, was built in 1906 and renovated in 2016. According to the appraisal, the borrower provided a $9.4 million capital improvement budget, which included landlord work on floors 2 through 4, new lot line windows on floors 2 through 4, sidewalk vault repairs, and general base building enhancements. As of February 24, 2022, there was $3.3 million of outstanding renovation costs. The 79 Fifth Avenue Property features a lobby with marble finishes and vaulted ceilings, functional, rectangular shaped floor plates and views of the surrounding Manhattan skyline. The retail units have frontage and visibility along Fifth Avenue with floor to ceiling glass storefronts. Five of the tenants (or their parent company), comprising 98.1% NRA and 96.6% of underwritten base rent, are investment grade rated. As of February 15, 2022, the property is 100% leased to six tenants and, according to a third party market research report, has averaged 96.3% occupancy over the past 10 years.
Major Tenants.
The New School (212,800 square feet, 61.5% of net rentable area; 51.7% of underwritten base rent; 9/30/2030 lease expiration) The New School (Fitch/Moody’s/S&P: NR/A3/NR) is a private research university in New York City. Founded in 1919, the university has grown to five colleges with courses in emerging social sciences, international affairs, liberal arts, history, and philosophy as well as art, design, management and performing arts. In 2021, The New School generated $319.1 million in operating revenue and, similar to other private universities, did not receive significant funding from the federal or state government. According to a third party report, The New School achieved record enrollment with 10,168 students in 2021. The New School has been at the property since 2004, has expanded multiple times and currently occupies 12 floors (5 through 12, 16 through 18, and ground floor and basement space). The tenant has two, 10-year renewal options and no termination options.
There is currently ongoing arbitration between The New School and the borrower. Between 2017 and 2021, an administrative error occurred whereby The New School was not charged its contractual rental increases. The landlord and tenant are expected to attend mediation over the back rent and rent escalations in Spring 2022. Underwritten base rent is based on the lower amount currently being paid by The New School. In the event the borrower wins the arbitration, the tenant’s current base rent would increase by approximately $1.3 million annually. See “Description of the Mortgage Pool—Litigation and Other Considerations” in the prospectus.
CapGemini America, Inc. (64,500 square feet, 18.7% of net rentable area; 20.7% of underwritten base rent; various lease expirations) CapGemini America, Inc. (“CapGemini”; Fitch/Moody’s/S&P: NR/NR/BBB) is a French multinational information technology services and consulting company. Headquartered in Paris, France, the company was founded in 1967 as an enterprise management and data processing company and launched US operations in 1981 following the acquisition of DASD Corporation. Today, CapGemini operates in 42 countries and reported 2021 revenues of €18,160 million, a 14.6% increase over 2020. CapGemini has been at the property since 2016 and currently occupies floors 2 through 4. The lease for the second and third floor space (collectively 43,000 SF) expires on September 30, 2027, and the lease on the fourth floor (21,500 SF) expires on January 31, 2027. The tenant has one, 5-year renewal option on all of their space. CapGemini may terminate the second and third floors any time after October 13, 2024, with at least 12 months’ notice and by paying a termination fee of $3,065,866.
| THE INFORMATION IN THIS STRUCTURAL AND COLLATERAL TERM SHEET IS NOT COMPLETE AND MAY BE AMENDED PRIOR TO THE TIME OF SALE. THIS TERM SHEET IS NOT AN OFFER TO SELL THESE SECURITIES AND IT IS NOT A SOLICITATION OF AN OFFER TO BUY THESE SECURITIES IN ANY JURISDICTION WHERE THE OFFER OR SALE IS NOT PERMITTED. | ||
| ||
| Office – CBD | Loan #15 | Cut-off Date Balance: | $25,000,000 | |
79 Fifth Avenue New York, NY 10003 | 79 Fifth Avenue | Cut-off Date LTV: U/W NCF DSCR: U/W NOI Debt Yield: | 60.8% 1.61x 8.4% |
Hulu, LLC (40,106 square feet, 11.6% of net rentable area; 12.9% of underwritten base rent; 5/31/2025 lease expiration) Hulu, LLC (“Hulu”) is an American streaming platform that launched in 2007 and offers a library of films and television series. Hulu is majority owned by The Walt Disney Company (Fitch/Moody’s/S&P: A-/A2/BBB+) with NBCUniversal holding a minority stake. For the year ended September 2021, Hulu reported $2.1 billion in ad revenue. Hulu has been at the property since 2014, doubled its space in 2018 and currently occupies the 14th and 15th floors. The tenant does not have any renewal options or termination options.
The following table presents certain information relating to the tenancy at the 79 Fifth Avenue Property:
Major Tenants
| Tenant Name | Credit Rating (Fitch/ Moody’s/ | Tenant NRSF | % of NRSF | Annual U/W Base Rent PSF(2) | Annual U/W Base Rent(2) | % of Total Annual U/W Base Rent | Lease Expiration Date | Ext. Options | Term. Option (Y/N) |
| Major Tenants | |||||||||
| The New School | NR/A3/NR | 212,800(3) | 61.5% | $64.02 | $13,622,601 | 51.7% | 6/30/2030 | 2, 10-year | N |
| CapGemini | NR/NR/BBB | 64,500 | 18.7% | $84.65 | $5,460,117 | 20.7% | Various(4) | 1, 5-year | Y(5) |
| Hulu | A-/A2/BBB+ | 40,106 | 11.6% | $85.00 | $3,408,977 | 12.9% | 5/31/2025 | N/A | N |
| Citibank, N.A. | A+/Aa3/A+ | 14,872 | 4.3% | $50.43 | $750,000 | 2.8% | 4/30/2028 | N/A | N |
| Coach Inc | NR/Baa2/BBB- | 7,073 | 2.0% | $311.76 | $2,205,067 | 8.4% | 1/31/2024(6) | N/A | N |
| Free People | NR/NR/NR | 6,400 | 1.9% | $140.69 | $900,407 | 3.4% | 4/30/2023 | N/A | N |
| 345,751 | 100.0% | $76.20 | $26,347,169 | 100.0% | |||||
| Vacant Space | 0 | 0.0% | |||||||
| Collateral Total | 345,751 | 100.0% | |||||||
| (1) | Certain ratings are those of the parent company whether or not the parent guarantees the lease. |
| (2) | The Annual U/W Base Rent and Annual U/W Base Rent PSF shown above include straight-line rent averaging for certain investment grade tenants (The New School and CapGemini) through lease maturity totaling $2,450,889 and contractual rent steps through February 2023 totaling $157,294. See “Cash Flow Analysis” below. |
| (3) | The New School currently subleases a portion of the 18th floor totaling 8,820 SF (2.6% of NRA; 4.1% of The New School NRA) to Gene Kaufman Architect, P.C. |
| (4) | CapGemini’s lease with respect to the fourth floor (21,500 SF) expires on January 31, 2027, and with respect to the second and third floors (43,000 SF) expires on September 30, 2027. |
| (5) | CapGemini may terminate its lease with respect to the second and third floors any time after October 13, 2024, with at least 12 months’ notice and by paying a termination fee of $3,065,866. |
| (6) | Coach Inc is expected to vacate at lease expiration. |
| THE INFORMATION IN THIS STRUCTURAL AND COLLATERAL TERM SHEET IS NOT COMPLETE AND MAY BE AMENDED PRIOR TO THE TIME OF SALE. THIS TERM SHEET IS NOT AN OFFER TO SELL THESE SECURITIES AND IT IS NOT A SOLICITATION OF AN OFFER TO BUY THESE SECURITIES IN ANY JURISDICTION WHERE THE OFFER OR SALE IS NOT PERMITTED. | ||
| ||
| Office – CBD | Loan #15 | Cut-off Date Balance: | $25,000,000 | |
79 Fifth Avenue New York, NY 10003 | 79 Fifth Avenue | Cut-off Date LTV: U/W NCF DSCR: U/W NOI Debt Yield: | 60.8% 1.61x 8.4% |
The following table presents certain information relating to the lease rollover schedule at the 79 Fifth Avenue Property:
Lease Expiration Schedule(1)(2)
| Year Ending December 31, | No. of Leases Expiring | Expiring NRSF | % of Total NRSF | Cumulative Expiring NRSF | Cumulative % of Total NRSF | Annual U/W Base Rent(3) | % of Total Annual U/W Base Rent | Annual U/W Base Rent PSF(3) |
| MTM | 0 | 0 | 0.0% | 0 | 0.0% | $0 | 0.0% | $0.00 |
| 2022 | 0 | 0 | 0.0% | 0 | 0.0% | $0 | 0.0% | $0.00 |
| 2023 | 1 | 6,400 | 1.9% | 6,400 | 1.9% | $900,407 | 3.4% | $140.69 |
| 2024 | 1 | 7,073 | 2.0% | 13,473 | 3.9% | $2,205,067 | 8.4% | $311.76 |
| 2025 | 2 | 40,106 | 11.6% | 53,579 | 15.5% | $3,408,977 | 12.9% | $85.00 |
| 2026 | 0 | 0 | 0.0% | 53,579 | 15.5% | $0 | 0.0% | $0.00 |
| 2027 | 2 | 64,500 | 18.7% | 118,079 | 34.2% | $5,460,117 | 20.7% | $84.65 |
| 2028 | 1 | 14,872 | 4.3% | 132,951 | 38.5% | $750,000 | 2.8% | $50.43 |
| 2029 | 0 | 0 | 0.0% | 132,951 | 38.5% | $0 | 0.0% | $0.00 |
| 2030 | 12 | 212,800 | 61.5% | 345,751 | 100.0% | $13,622,601 | 51.7% | $64.02 |
| 2031 | 0 | 0 | 0.0% | 345,751 | 100.0% | $0 | 0.0% | $0.00 |
| 2032 | 0 | 0 | 0.0% | 345,751 | 100.0% | $0 | 0.0% | $0.00 |
| Thereafter(3) | 0 | 0 | 0.0% | 345,751 | 100.0% | $0 | 0.0% | $0.00 |
| Vacant | 0 | 0 | 0.0% | 345,751 | 100.0% | $0 | 0.0% | $0.00 |
| Total/Weighted Average | 19 | 345,751 | 100.0% | $26,347,169 | 100.0% | $76.20 |
| (1) | Information obtained from the underwritten rent roll. |
| (2) | Certain tenants may have lease termination options that are exercisable prior to the originally stated expiration date of the related lease and are not considered in the rollover schedule. |
| (3) | Annual U/W Base Rent and Annual U/W Base Rent PSF include straight line rent averaging for investment grade tenants totaling $2,450,889 and contractual rent steps of $157,294 for various tenants through February 2023 and straight line rent. |
The following table presents historical occupancy percentages at the 79 Fifth Avenue Property:
Historical Occupancy
12/31/2019(1) | 12/31/2020(1) | 12/31/2021(1) | 2/15/2022(2) |
| 100.0% | 99.4% | 100.0% | 100.0% |
| (1) | Information obtained from the borrower. |
| (2) | Information obtained from the underwritten rent roll. |
Market Overview and Competition. The 79 Fifth Avenue Property is situated in the Flatiron neighborhood of New York, New York and is bordered by Park Avenue South to the east, Sixth Avenue to the west, 25th Street to the north and 13th Street to the south. The property is located directly west of Union Square and is three blocks northwest of the Union Square Subway station, which services the L, N, Q, R, W, 4, 5, and 6 lines.
According to a third party market research report, the property is located in the Gramercy Park office submarket of the New York City market. As of April 2022, the Gramercy Park submarket reported total inventory of approximately 28.5 million SF with a 10.3% vacancy rate and average asking rent of $72.08 PSF. The appraiser concluded to a market rent for the office space at the 79 Fifth Avenue Property of $80.00 PSF for floors 2 to 10, $85.00 PSF for floors 11 to 15, and $90.00 PSF for floors 16 to 18, all on a modified gross basis.
| THE INFORMATION IN THIS STRUCTURAL AND COLLATERAL TERM SHEET IS NOT COMPLETE AND MAY BE AMENDED PRIOR TO THE TIME OF SALE. THIS TERM SHEET IS NOT AN OFFER TO SELL THESE SECURITIES AND IT IS NOT A SOLICITATION OF AN OFFER TO BUY THESE SECURITIES IN ANY JURISDICTION WHERE THE OFFER OR SALE IS NOT PERMITTED. | ||
| ||
| Office – CBD | Loan #15 | Cut-off Date Balance: | $25,000,000 | |
79 Fifth Avenue New York, NY 10003 | 79 Fifth Avenue | Cut-off Date LTV: U/W NCF DSCR: U/W NOI Debt Yield: | 60.8% 1.61x 8.4% |
The following table presents certain information relating to the appraiser’s market rent conclusions for the 79 Fifth Avenue Property:
Market Rent Summary(1)
Office Floors 2-10 | Office Floors 11-15 |
Office Floors 16-18 | Retail Corner | Retail Fifth Avenue Large |
Retail Fifth Avenue Small | Retail Lower Level & Mezzanine | |
| Market Rent (PSF) | $80.00 | $85.00 | $90.00 | $275.00 | $175.00 | $225.00 | $50.00 |
| Lease Term (Years) | 10 | 10 | 10 | 10 | 10 | 10 | 10 |
| Lease Type | MG | MG | MG | MG | MG | MG | Gross |
| Rent Increase Projection | 2%/annually $5 PSF in year 5 | 2%/annually $5 PSF in year 5 | 2%/annually $5 PSF in year 5 | 3%/annually | 3%/annually | 3%/annually | 3%/annually |
| (1) | Information obtained from the appraisal. |
The table below presents certain information relating to comparable sales pertaining to the 79 Fifth Avenue Property identified by the appraiser:
Comparable Sales(1)
| Property Name | Location | Year Built/Renovated | Rentable Area (SF) | Occupancy | Sale Date | Sale Price | Sale Price (PSF) |
| 79 Fifth Avenue | New York, NY | 1906/2016 | 345,751(2) | 100.0%(2) | Aug-2021 | $369,000,000(3) | $1,067(3) |
| 475 Fifth Avenue | New York, NY | 1965/2017 | 276,000 | 97.0% | Dec-2021 | $299,460,000 | $1,085 |
| 375 West Broadway | New York, NY | 1863/2014 | 76,605 | 100.0% | Feb-2022 | $130,000,000 | $1,697 |
| 11 Madison Park North | New York, NY | 1913/NAP | 260,140 | 90.0% | Apr-2021 | $275,000,000 | $1,057 |
| 315 Park Avenue South | New York, NY | 1910/2016 | 332,614 | 97.0% | Dec-2021 | $361,700,000 | $1,087 |
| 245-249 West 17th Street | New York, NY | 1902-1909/2016 | 281,253 | 99.0% | Dec-2021 | $389,200,000 | $1,384 |
| 218 West 18th Street | New York, NY | 1912/2009 | 165,255 | 100.0% | Dec-2021 | $170,000,000 | $1,029 |
| 635-641 Avenue of the Americas | New York, NY | 1902/2015 | 273,983 | 94.0% | Jun-2021 | $325,000,000 | $1,186 |
| 1375 Broadway | New York, NY | 1927/NAP | 518,578 | 100.0% | Jul-2020 | $435,000,000 | $839 |
| (1) | Information obtained from the appraisal. |
| (2) | Information obtained from the underwritten rent roll. |
| (3) | The 79 Fifth Avenue Property was recapitalized at a price of $369,000,000. |
| THE INFORMATION IN THIS STRUCTURAL AND COLLATERAL TERM SHEET IS NOT COMPLETE AND MAY BE AMENDED PRIOR TO THE TIME OF SALE. THIS TERM SHEET IS NOT AN OFFER TO SELL THESE SECURITIES AND IT IS NOT A SOLICITATION OF AN OFFER TO BUY THESE SECURITIES IN ANY JURISDICTION WHERE THE OFFER OR SALE IS NOT PERMITTED. | ||
| ||
| Office – CBD | Loan #15 | Cut-off Date Balance: | $25,000,000 | |
79 Fifth Avenue New York, NY 10003 | 79 Fifth Avenue | Cut-off Date LTV: U/W NCF DSCR: U/W NOI Debt Yield: | 60.8% 1.61x 8.4% |
The following table presents certain information relating to the appraiser’s market rent conclusions for the 79 Fifth Avenue Property:
Comparable Office Properties(1)
| Property Name/Location | Total GLA (SF) | Year Built/Renovated | Stories | Sublease SF Available | % Occupied (Direct) | Average Asking Rent |
79 Fifth Avenue New York, NY | 345,751(2) | 1906/2016 | 18 | - | 100.0%(2) | $76.20(2)(3) |
55 Fifth Avenue New York, NY | 270,685 | 1926/NAP | 19 | 0 | 94.1% | $90.00 |
71 Fifth Avenue New York, NY | 165,000 | 1907/NAP | 11 | 0 | 91.0% | $90.00 |
80 Fifth Avenue New York, NY | 132,000 | 1908/NAP | 18 | 0 | 100.0% | NAP |
90 Fifth Avenue New York, NY | 138,211 | 1903/NAP | 11 | 0 | 100.0% | NAP |
91 Fifth Avenue New York, NY | 61,500 | 1894/NAP | 8 | 0 | 87.0% | $68.00 |
100-104 Fifth Avenue New York, NY | 305,000 | 1905/NAP | 20 | 42,807 | 93.7% | $75.00 |
110 Fifth Avenue New York, NY | 200,378 | 1890/NAP | 11 | 0 | 100.0% | NAP |
111 Fifth Avenue New York, NY | 234,700 | 1877/NAP | 13 | 0 | 100.0% | NAP |
114-116 Fifth Avenue New York, NY | 351,666 | 1910/NAP | 19 | 0 | 100.0% | NAP |
122 Fifth Avenue New York NY | 294,730 | 1900/NAP | 10 | 0 | 75.0% | $100.00 |
| (1) | Information obtained from the appraisal. |
| (2) | Information obtained from the underwritten rent roll. |
| (3) | Represents Annual UW Base Rent PSF. |
| THE INFORMATION IN THIS STRUCTURAL AND COLLATERAL TERM SHEET IS NOT COMPLETE AND MAY BE AMENDED PRIOR TO THE TIME OF SALE. THIS TERM SHEET IS NOT AN OFFER TO SELL THESE SECURITIES AND IT IS NOT A SOLICITATION OF AN OFFER TO BUY THESE SECURITIES IN ANY JURISDICTION WHERE THE OFFER OR SALE IS NOT PERMITTED. | ||
| ||
| Office – CBD | Loan #15 | Cut-off Date Balance: | $25,000,000 | |
79 Fifth Avenue New York, NY 10003 | 79 Fifth Avenue | Cut-off Date LTV: U/W NCF DSCR: U/W NOI Debt Yield: | 60.8% 1.61x 8.4% |
Operating History and Underwritten Net Cash Flow. The following table presents certain information relating to the historical operating performance and underwritten net cash flow at the 79 Fifth Avenue Property:
Cash Flow Analysis
| 2019 | 2020 | 2021 | U/W | %(1) | U/W $ per SF | |
| Gross Potential Base Rent | $21,523,248 | $21,892,938 | $22,660,998 | $23,738,986 | 81.0% | $68.66 |
| Rent Average Benefit | 0 | 0 | 0 | 2,450,889(2) | 8.4 | 7.09 |
| Rent Steps | 0 | 0 | 0 | 157,294(3) | 0.5 | 0.45 |
| Total Recoveries | 3,688,603 | 3,730,411 | 4,273,141 | 4,516,113 | 15.4 | 13.06 |
| Other Income | 158,823 | 54,402 | 0 | 0 | 0.0 | 0.00 |
| (Vacancy & Credit Loss) | 0 | 0 | 0 | (1,543,164)(4) | (6.5) | (4.46) |
| Effective Gross Income | $25,370,674 | $25,677,751 | $26,934,139 | $29,320,118 | 100.0% | $84.80 |
| Real Estate Taxes | $5,138,406 | $5,634,523 | $5,363,749 | $6,027,230 | 20.6% | $17.43 |
| Insurance | 196,714 | 206,760 | 255,873 | 250,673 | 0.9 | 0.73 |
| Management Fee | 761,120 | 770,333 | 808,024 | 879,604 | 3.0 | 2.54 |
| Other Operating Expenses | 2,188,915 | 1,905,325 | 2,144,312 | 2,059,120 | 7.0 | 5.96 |
| Total Operating Expenses | $8,285,155 | $8,516,941 | $8,571,958 | $9,216,627 | 31.4% | $26.66 |
| Net Operating Income | $17,085,519 | $17,160,810 | $18,362,181 | $20,103,491 | 68.6% | $58.14 |
| Replacement Reserves | 0 | 0 | 0 | 78,388 | 0.3 | 0.23 |
| TI/LC | 0 | 0 | 0 | 693,116 | 2.4 | 2.00 |
| Net Cash Flow | $17,085,519 | $17,160,810 | $18,362,181 | $19,331,988 | 65.9% | $55.91 |
| NOI DSCR(5) | 1.43x | 1.43x | 1.53x | 1.68x | ||
| NCF DSCR(5) | 1.43x | 1.43x | 1.53x | 1.61x | ||
| NOI Debt Yield(5) | 7.1% | 7.2% | 7.7% | 8.4% | ||
| NCF Debt Yield(5) | 7.1% | 7.2% | 7.7% | 8.1% |
| (1) | Represents (i) percent of Gross Potential Base Rent for Vacancy & Credit Loss and (ii) percent of Effective Gross Income for all other fields. |
| (2) | Represents straight-line rent averaging through each tenant’s lease expiration due to the investment-grade nature of the tenants. |
| (3) | Represents contractual rent steps through February 2023. |
| (4) | The underwritten economic vacancy is 5.0%. The 79 Fifth Avenue Property was 100.0% leased as of February 15, 2022. |
| (5) | The NOI and NCF DSCR and NOI and NCF Debt Yields are based on the 79 Fifth Avenue Whole Loan. |
| THE INFORMATION IN THIS STRUCTURAL AND COLLATERAL TERM SHEET IS NOT COMPLETE AND MAY BE AMENDED PRIOR TO THE TIME OF SALE. THIS TERM SHEET IS NOT AN OFFER TO SELL THESE SECURITIES AND IT IS NOT A SOLICITATION OF AN OFFER TO BUY THESE SECURITIES IN ANY JURISDICTION WHERE THE OFFER OR SALE IS NOT PERMITTED. | ||
| ||
| BANK 2022-BNK43 | Transaction Contact Information |
VI. Transaction Contact Information
Questions regarding this Structural and Collateral Term Sheet may be directed to any of the following individuals:
| Wells Fargo Securities, LLC | |
| Brigid Mattingly | Tel. (312) 269-3062 |
| A.J. Sfarra | Tel. (212) 214-5613 |
| Sean Duffy | Tel. (312) 827-1518 |
| BofA Securities, Inc. | |
| Leland F. Bunch, III | Tel. (646) 855-3953 |
| Danielle Caldwell | Tel. (646) 855-3421 |
| Morgan Stanley & Co. LLC | |
| Nishant Kapur | Tel. (212) 761-1483 |
| Jane Lam | Tel. (212) 761-3507 |
| Brandon Atkins | Tel. (212) 761-4846 |
| THE INFORMATION IN THIS STRUCTURAL AND COLLATERAL TERM SHEET IS NOT COMPLETE AND MAY BE AMENDED PRIOR TO THE TIME OF SALE. THIS TERM SHEET IS NOT AN OFFER TO SELL THESE SECURITIES AND IT IS NOT A SOLICITATION OF AN OFFER TO BUY THESE SECURITIES IN ANY JURISDICTION WHERE THE OFFER OR SALE IS NOT PERMITTED. | ||
| ||