Exhibit 99.1
EARNINGS RELEASE 1Q23
RESPONSE SEGMENT
| INCOME STATEMENT R$ million | 1Q23 | 1Q22 | Var. | 4Q22 | Var. | |||||||||||||||
| GROSS REVENUE | 627.1 | 350.4 | 79.0% | 667.8 | -6.1% | |||||||||||||||
| DEDUCTIONS | -30.9 | -28.4 | 8.8% | -35.5 | -13.0% | |||||||||||||||
| NET REVENUE | 596.3 | 321.9 | 85.2% | 632.3 | -5.7% | |||||||||||||||
| COSTS OF SERVICES PROVIDED | -452.1 | -229.0 | 97.4% | -454.2 | -0.5% | |||||||||||||||
| GROSS PROFIT | 144.1 | 92.9 | 55.1% | 178.1 | -19.1% | |||||||||||||||
| GROSS MARGIN | 24.2% | 28.9% | -4.7 p.p. | 28.2% | -4.0 p.p. | |||||||||||||||
| SELLING, GENERAL AND ADMINISTRATIVE EXPENSES | -5.1 | -7.6 | -32.9% | -5.1 | 0.0% |
GROSS REVENUE
| COMPOSITION OF GROSS REVENUE R$ million | 1Q21 | 2Q21 | 3Q21 | 4Q21 | 1Q22 | 2Q22 | 3Q22 | 4Q22 | 1Q23 | |||||||||||||||||||||||||||
| RESPONSE | ||||||||||||||||||||||||||||||||||||
| GROSS REVENUE | 161.6 | 215.2 | 262.4 | 281.5 | 350.4 | 363.3 | 431.8 | 667.8 | 627.1 | |||||||||||||||||||||||||||
| Brazil | 59.5 | 70.1 | 82.2 | 77.1 | 112.5 | 122.8 | 159.4 | 202.5 | 208.7 | |||||||||||||||||||||||||||
| International | 102.0 | 145.1 | 180.2 | 204.4 | 237.9 | 240.6 | 272.4 | 465.3 | 418.4 | |||||||||||||||||||||||||||
| Latam (ex Brazil) | 35.8 | 36.9 | 47.7 | 50.1 | 57.9 | 58.7 | 44.1 | 50.3 | 55.8 | |||||||||||||||||||||||||||
| Europe | 23.3 | 42.4 | 50.1 | 48.1 | 47.8 | 50.5 | 51.8 | 64.7 | 56.1 | |||||||||||||||||||||||||||
| North America | 42.9 | 65.8 | 82.4 | 106.2 | 132.2 | 131.3 | 176.5 | 350.3 | 306.5 | |||||||||||||||||||||||||||
| · | Gross revenue reached R$627 million in 1Q23, 79.0% higher than 1Q22 and 6.1% lower than 4Q22. Our operations had revenue variations as expected. Witt O’Brien’s contributed R$111 million to the result. Therefore, the gross income of Response ex-WOB would have been practically flat QoQ. |
Below we describe the revenue behavior of the different lines of business by geographic region.
BRAZIL
| COMPOSITION OF GROSS REVENUE R$ million | 1Q23 | 1Q22 | Chg. 1Q23 x1Q22 | 4Q22 | Chg. 1Q23 X4Q22 | |||||||||||||||
| RESPONSE | ||||||||||||||||||||
| GROSS REVENUES | 627.1 | 350.4 | 79.0% | 667.8 | -6.1% | |||||||||||||||
| Brazil | 208.7 | 112.5 | 85.5% | 202.5 | 3.1% | |||||||||||||||
| Subscriptions Brazil | 38.2 | 33.7 | 13.4% | 37.0 | 3.2% | |||||||||||||||
| Services Brazil | 170.5 | 78.8 | 116.4% | 165.5 | 3.0% | |||||||||||||||
| Attended Services | 1Q22 | 2Q22 | 3Q22 | 4Q22 | 1Q23 | Chg. 1Q23 x1Q22 | ||||||||||||||
| Brazil | Gross Revenue (BRL Million) | 78.8 | 89.0 | 123.5 | 165.5 | 170.5 | 116.5% | |||||||||||||
| Number of Services Provided | 1,754 | 1,853 | 2,435 | 2,594 | 2,727 | 55.5% | ||||||||||||||
| Average Ticket (BRL Thousand) | 44.9 | 48.1 | 50.7 | 63.8 | 62.5 | 39.3% |
| · | Gross Revenue in Brazil grew in all comparisons, mainly driven by the increase in more complex services and the result of investments for growth in the acquired companies. |
| · | The average ticket rose YoY, and QoQ remained stable, reflecting the strategy of bringing new services and creating a complementary portfolio. |
LATAM
| COMPOSITION OF GROSS REVENUE R$ million | 1Q23 | 1Q22 | Chg. 1Q23 x1Q22 | 4Q22 | Chg. 1Q23 X4Q22 | |||||||||||||||
| RESPONSE | ||||||||||||||||||||
| GROSS REVENUES | 627.1 | 350.4 | 79.0% | 667.8 | -6.1% | |||||||||||||||
| International | 418.4 | 237.9 | 75.9% | 465.3 | -10.1% | |||||||||||||||
| Latam (ex-Brazil) | 55.8 | 57.9 | -3.6% | 50.3 | 10.9% | |||||||||||||||
| Subscriptions Latam | 36.1 | 31.2 | 15.7% | 35.5 | 1.7% | |||||||||||||||
| Services Latam | 19.7 | 26.7 | -26.2% | 14.8 | 33.1% | |||||||||||||||
| Attended Services | 1Q22 | 2Q22 | 3Q22 | 4Q22 | 1Q23 | Chg. 1Q23 x1Q22 | ||||||||||||||
| Latam (Ex Brazil) | Gross Revenue (BRL Million) | 26.7 | 24.3 | 9.6 | 14.8 | 19.7 | -26.0% | |||||||||||||
| Number of Services Served | 89 | 82 | 80 | 104 | 95 | 6.7% | ||||||||||||||
| Average Ticket (BRL Thousand) | 299.6 | 296.4 | 119.6 | 142.3 | 207.6 | -30.7% |
| · | Latam gross revenue had a positive exchange rate impact between 4Q22 vs. 1Q23, due to the 11% devaluation of the Real against the Chilean Peso. Chile represents most of the Latam segment. |
| · | In Latin America, we had a YoY retraction due to the strong revenue comparison base, arising from an oil spill response in the region during 1Q22 and 2Q22. |
| · | The oscillation of the average ticket reflects changes in the complexity of emergencies. |
EUROPE
| COMPOSITION OF GROSS REVENUE R$ million | 1Q23 | 1Q22 | Chg. 1Q23 x1Q22 | 4Q22 | Chg. 1Q23 X4Q22 | |||||||||||||||
| RESPONSE | ||||||||||||||||||||
| GROSS REVENUES | 627.1 | 350.4 | 79.0% | 667.8 | -6.1% | |||||||||||||||
| International | 418.4 | 237.9 | 75.9% | 465.3 | -10.1% | |||||||||||||||
| Europe | 56.1 | 47.8 | 17.4% | 64.7 | -13.3% | |||||||||||||||
| Subscriptions Europe | 4.8 | 3.6 | 33.3% | 4.7 | 2.1% | |||||||||||||||
| Services Europe | 51.3 | 44.2 | 16.1% | 60.0 | -14.5% | |||||||||||||||
| Attended Services | 1Q22 | 2Q22 | 3Q22 | 4Q22 | 1Q23 | Chg. 1Q23 x1Q22 | ||||||||||||||
| Europe | Gross Revenue (BRL Million) | 44.2 | 46.7 | 48.1 | 60.0 | 51.3 | 16.1% | |||||||||||||
| Number of Services Served | 5,681 | 5,874 | 5,922 | 5,974 | 5,947 | 4.7% | ||||||||||||||
| Average Ticket (BRL Thousand) | 7.8 | 8.0 | 8.1 | 10.0 | 8.6 | 10.9% |
| · | Gross revenue increased in comparison to 1Q22 due to the start of price recovery and a marginal increase in the number of contracts. In local currency, revenues grew even more than in Reais, as the real appreciated by around 10% and 5% against Pound and Euro, respectively. |
| · | Services Gross Revenues in 1Q23 was lower QoQ due to the large maritime occurrence in the region in 4Q22. |
NORTH AMERICA
| COMPOSITION OF GROSS REVENUE R$ million | 1Q23 | 1Q22 | Chg. 1Q23 x1Q22 | 4Q22 | Chg. 1Q23 X4Q22 | |||||||||||||||
| RESPONSE | ||||||||||||||||||||
| GROSS REVENUES | 627.1 | 350.4 | 79.0% | 667.8 | -6.1% | |||||||||||||||
| International | 418.4 | 237.9 | 75.9% | 465.3 | -10.1% | |||||||||||||||
| North America | 306.5 | 132.2 | 131.8% | 350.3 | -12.5% | |||||||||||||||
| Subscriptions North America | 0.0 | 0.0 | NM | 0.0 | NM | |||||||||||||||
| Witt O’Brien’s | 111.2 | 0.0 | NM | 168.4 | NM | |||||||||||||||
| Services North America | 306.5 | 132.2 | 131.8% | 350.3 | -12.5% | |||||||||||||||
| Attended Services | 1Q22 | 2Q22 | 3Q22 | 4Q22 | 1Q23 | Chg. 1Q23 x1Q22 | ||||||||||||||
| North America | Gross Revenue (BRL Million) | 132.2 | 131.3 | 176.5 | 350.3 | 306.5 | 131.8% | |||||||||||||
| Number of Services Served | 2,556 | 2,597 | 2,991 | 3,117 | 3,228 | 26.3% | ||||||||||||||
| Average Ticket (BRL Thousand) | 51.7 | 50.6 | 59.0 | 112.4 | 95.0 | 83.6% |
| · | North America ex-WOB operations continue their growth trajectory. Disregarding Witt O’Brien’s revenue, in the North American region growth was 7.8% 1Q23 vs. 4Q22. |
| · | The decrease in quarterly revenue compared to the previous quarter is due to the natural volatility of WOB's business. |
| · | The long-term thesis of capturing a larger share of the emergency market with government funding in the US continues. We have already seen some large WOB contract sales with Ambipar Response in the corporate and government customer market. |
NET REVENUE
| R$ million | 1Q23 | 1Q22 | Chg. | 4Q22 | Chg. | |||||||||||||||
| Gross Revenues | 627.1 | 350.4 | 79.0% | 667.8 | -6.1% | |||||||||||||||
| Deductions | -30.9 | -28.4 | 8.8% | -35.5 | -13.0% | |||||||||||||||
| Net Revenues | 596.3 | 321.9 | 85.2% | 632.3 | -5.7% | |||||||||||||||
| · | The variation in net revenue accompanied the evolution of gross revenue by geography, and the revenue deductions for each region. There was no significant change in the tax structure of each market, with deductions in the Brazilian market being greater than in the international market. |
COST OF PRODUCTS/SERVICES (CASH)
| R$ million | 1Q23 | 1Q22 | Chg. | 4Q22 | Chg. | |||||||||||||||
| COST OF SERVICES | ||||||||||||||||||||
| Personnel | 237.6 | 118.0 | 101.4% | 271.5 | -12.5% | |||||||||||||||
| Third parties | 88.8 | 46.8 | 89.7% | 69.0 | 28.7% | |||||||||||||||
| Maintenance | 19.8 | 6.6 | 198.6% | 27.8 | -28.7% | |||||||||||||||
| Travel | 17.2 | 4.6 | 273.7% | 17.2 | -0.3% | |||||||||||||||
| Freight | 1.5 | 1.1 | 27.4% | 13.4 | -89.2% | |||||||||||||||
| Rentals | 10.7 | 9.6 | 11.3% | 8.6 | 24.7% | |||||||||||||||
| Fuel | 12.6 | 12.2 | 3.4% | 7.5 | 68.7% | |||||||||||||||
| Materiais | 7.9 | 3.3 | 144.1% | 5.2 | 51.9% | |||||||||||||||
| Telecomunications | 3.7 | 0.7 | 467.2% | 4.2 | -12.1% | |||||||||||||||
| Marketing | 3.1 | 0.5 | 485.7% | 4.1 | -24.6% | |||||||||||||||
| Taxes | 10.8 | 9.3 | 16.1% | -1.3 | NM | |||||||||||||||
| Others | 38.4 | 16.3 | 135.9% | 27.0 | 42.2% | |||||||||||||||
| TOTAL | 452.1 | 229.0 | 97.4% | 454.2 | -0.5% | |||||||||||||||
| R$ million | 1Q21 | 2Q21 | 3Q21 | 4Q21 | 1Q22 | 2Q22 | 3Q22 | 4Q22 | 1Q23 | |||||||||||||||||||||||||||
| COST OF SERVICES | ||||||||||||||||||||||||||||||||||||
| Net Revenue | 144.3 | 190.3 | 233.4 | 255.6 | 321.9 | 332.6 | 398.1 | 632.3 | 596.3 | |||||||||||||||||||||||||||
| Personnel | 57.5 | 73.0 | 91.3 | 96.4 | 118.0 | 120.2 | 137.7 | 271.5 | 237.6 | |||||||||||||||||||||||||||
| Third parties | 13.4 | 19.8 | 28.8 | 27.7 | 46.8 | 49.5 | 45.1 | 69.0 | 88.8 | |||||||||||||||||||||||||||
| Maintenance | 5.0 | 8.6 | 4.5 | 6.2 | 6.6 | 8.1 | 15.5 | 27.8 | 19.8 | |||||||||||||||||||||||||||
| Travel | 2.2 | 2.4 | 3.8 | 4.3 | 4.6 | 4.6 | 6.7 | 17.2 | 17.2 | |||||||||||||||||||||||||||
| Freight | 0.4 | 0.6 | 0.8 | 0.9 | 1.1 | 1.2 | 1.3 | 13.4 | 1.5 | |||||||||||||||||||||||||||
| Rentals | 5.1 | 7.3 | 7.2 | 7.1 | 9.6 | 9.5 | 3.3 | 8.6 | 10.7 | |||||||||||||||||||||||||||
| Fuel | 3.7 | 5.4 | 6.6 | 9.0 | 12.2 | 18.7 | 19.8 | 7.5 | 12.6 | |||||||||||||||||||||||||||
| Materiais | 1.4 | 2.3 | 3.2 | 3.5 | 3.3 | 3.5 | 10.4 | 5.2 | 7.9 | |||||||||||||||||||||||||||
| Telecomunications | 0.4 | 0.4 | 0.5 | 0.7 | 0.7 | 0.6 | 1.0 | 4.2 | 3.7 | |||||||||||||||||||||||||||
| Marketing | 0.7 | 0.9 | 0.3 | 1.5 | 0.5 | 0.7 | 5.5 | 4.1 | 3.1 | |||||||||||||||||||||||||||
| Taxes | 0.7 | 2.1 | 3.6 | 3.7 | 9.3 | 6.2 | 5.9 | -1.3 | 10.8 | |||||||||||||||||||||||||||
| Others | 6.8 | 9.2 | 9.0 | 14.4 | 16.3 | 20.8 | 30.5 | 27.0 | 38.4 | |||||||||||||||||||||||||||
| Total | 97.5 | 132.1 | 159.4 | 175.3 | 229.0 | 243.6 | 282.8 | 454.2 | 452.1 | |||||||||||||||||||||||||||
Percentage of Net Revenue
| R$ million | 1Q21 | 2Q21 | 3Q21 | 4Q21 | 1Q22 | 2Q22 | 3Q22 | 4Q22 | 1Q23 | |||||||||||||||||||||||||||
| COST OF SERVICES | ||||||||||||||||||||||||||||||||||||
| Net Revenue | 144.3 | 190.3 | 233.4 | 255.6 | 321.9 | 332.6 | 398.1 | 632.3 | 596.3 | |||||||||||||||||||||||||||
| Personnel | 39.9% | 38.3% | 39.1% | 37.7% | 36.7% | 36.1% | 34.6% | 42.9% | 39.9% | |||||||||||||||||||||||||||
| Third parties | 9.3% | 10.4% | 12.4% | 10.9% | 14.5% | 14.9% | 11.3% | 10.9% | 14.9% | |||||||||||||||||||||||||||
| Maintenance | 3.5% | 4.5% | 1.9% | 2.4% | 2.1% | 2.4% | 3.9% | 4.4% | 3.3% | |||||||||||||||||||||||||||
| Travel | 1.5% | 1.3% | 1.6% | 1.7% | 1.4% | 1.4% | 1.7% | 2.7% | 2.9% | |||||||||||||||||||||||||||
| Freight | 0.3% | 0.3% | 0.3% | 0.3% | 0.4% | 0.3% | 0.3% | 2.1% | 0.2% | |||||||||||||||||||||||||||
| Rentals | 3.6% | 3.9% | 3.1% | 2.8% | 3.0% | 2.9% | 0.8% | 1.4% | 1.8% | |||||||||||||||||||||||||||
| Fuel | 2.6% | 2.8% | 2.8% | 3.5% | 3.8% | 5.6% | 5.0% | 1.2% | 2.1% | |||||||||||||||||||||||||||
| Materiais | 0.9% | 1.2% | 1.3% | 1.4% | 1.0% | 1.1% | 2.6% | 0.8% | 1.3% | |||||||||||||||||||||||||||
| Telecomunications | 0.3% | 0.2% | 0.2% | 0.3% | 0.2% | 0.2% | 0.3% | 0.7% | 0.6% | |||||||||||||||||||||||||||
| Marketing | 0.5% | 0.5% | 0.1% | 0.6% | 0.2% | 0.2% | 1.4% | 0.6% | 0.5% | |||||||||||||||||||||||||||
| Taxes | 0.5% | 1.1% | 1.5% | 1.4% | 2.9% | 1.9% | 1.5% | -0.2% | 1.8% | |||||||||||||||||||||||||||
| Others | 4.7% | 4.8% | 3.9% | 5.6% | 5.1% | 6.2% | 7.7% | 4.3% | 6.4% | |||||||||||||||||||||||||||
| Total | 67.6% | 69.4% | 68.3% | 68.6% | 71.1% | 73.2% | 71.0% | 71.8% | 75.8% | |||||||||||||||||||||||||||
| Gross Margin | 32.4% | 30.6% | 31.7% | 31.4% | 28.9% | 26.8% | 29.0% | 28.2% | 24.2% | |||||||||||||||||||||||||||
Costs increased by 97.4% compared to 1Q22 and decreased by 0.5% compared to 4Q22. Four components have historically represented the bulk of our costs:
| · | Personnel: monitored the growth in revenues and the effect of the acquisition of Witt O'Brien's, which has a higher cost of personnel due to the nature of highly specialized consultancy work. |
| · | Third parties: the increase in the cost of third parties is due to the mix of operations, due to the greater use of third parties, occasionally, in North America in cases attended that required local service capacity greater than the availability of one of the Response operations. |
| · | Maintenance: has accompanied the increase in operational assets. |
| · | Fuel and freight: after increasing considerably over the past two years, freight and fuel prices have been gradually decreasing. The incorporation of WOB reduces the representativeness of these costs in relation to revenue, given its consulting business model. |
GROSS PROFIT
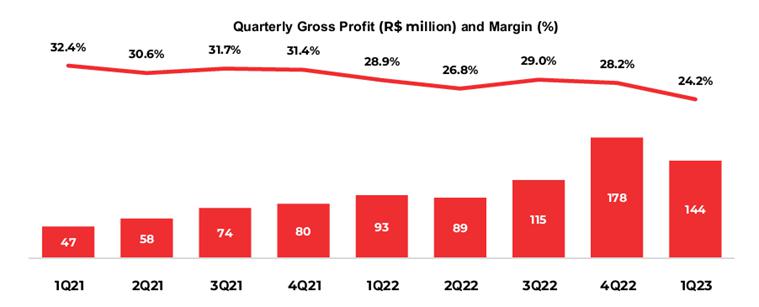
| · | Gross profit grew over 1Q22. Gross margin for 1Q23 reached 24.2%, a result 4.7 pp. and 4.0 pp. lower than that registered in 1Q22 and 4Q22, respectively. The reduction in gross margin is related to the acquisition of WOB in the consolidated numbers, as it has a structurally lower margin level, and the increase in the mix of industrial services, which represent a larger fraction of North America. |
CAPEX RESPONSE
In 1Q23, the addition of Fixed Assets was R$69.0 million. In Response, we invested in Brazil in vessels and helicopters adapted to emergencies, and in North America, in trucks and equipment to support growth in this market.
| Additions to Fixed Assets R$ million | 1Q21 | 2Q21 | 3Q21 | 4Q21 | 1Q22 | 2Q22 | 3Q22 | 4Q22 | 1Q23 | |||||||||||||||||||||||||||
| (+) Brazil | 13.4 | 16.4 | 32.5 | 7.1 | 49.9 | 8.9 | 52.3 | 37.9 | 43.8 | |||||||||||||||||||||||||||
| (+) LATAM ( ex-Brazil ) | 3.0 | 0.7 | 2.0 | 2.1 | 0.0 | 1.9 | 0.7 | 4.0 | 1.1 | |||||||||||||||||||||||||||
| (+) Europe | 0.6 | 0.1 | 2.6 | 2.8 | 3.2 | 0.5 | 2.4 | 2.1 | 1.8 | |||||||||||||||||||||||||||
| (+) North America | 1.6 | 3.7 | 9.2 | 0.9 | 11.8 | 14.7 | 14.4 | 28.5 | 22.2 | |||||||||||||||||||||||||||
| Total | 18.6 | 20.8 | 46.2 | 12.9 | 64.8 | 26.1 | 69.9 | 72.5 | 69.0 | |||||||||||||||||||||||||||
| Capex | Capex (R$ Million) | |||
| Expansion | 37.9 | |||
| Response Brazil | 25.6 | |||
| Response Latam (Ex. Brazil) | 0.6 | |||
| Response Europe | 0.3 | |||
| Response North America | 11.5 | |||
| Maintenance | 31.1 | |||
| Response Brazil | 18.3 | |||
| Response Latam (Ex. Brazil) | 0.5 | |||
| Response Europe | 1.6 | |||
| Response North America | 10.7 | |||