Exhibit_99.1

INDEX
2
HIGHLIGHTS
•Net Revenue expanded 21.0% vs 2Q23 and 9.0% compared to 1Q24;
•Result with greater contribution from operations in Brazil, with 65.3% growth in revenue;
•EBITDA of R$191.9 million, growth of 27.7% which represents an expansion of margin 1.4p.p. versus 2Q23 and +0.1p.p. compared to 1Q24;
•EBITDA margin in 2Q24 of 25.9%, expansion of 1.4 p.p. vs. 2Q23;
•Net Income of R$89.2 million, growth of 89.5% vs 2Q23;
•CAPEX reached R$49.5 million, a 20.0% reduction vs. 1Q24 and a growth of just R$7.6 million vs. 2Q23. As a % of Net Revenue, CAPEX represented 6.7% in 2Q24, a reduction of 2.7 p.p. vs. 1Q24
•Record of Net Revenue, EBITDA and Net Income.
| R$ million | 2Q24 | 2Q23 | Var. | 1Q24 | Var. | 6M24 | 6M23 | Var. | ||||||||||||||||||
| Gross Revenue | 808.9 | 660.4 | 22.5% | 737.1 | 9.7% | 1,546.1 | 1,287.5 | 20.1% | ||||||||||||||||||
| Deductions | (68.4) | (48.3) | 41.6% | (58.1) | 17.7% | (126.5) | (79.2) | 59.7% | ||||||||||||||||||
| Net Revenue | 740.5 | 612.1 | 21.0% | 679.1 | 9.0% | 1,419.6 | 1,208.3 | 17.5% | ||||||||||||||||||
| Gross profit | 200.2 | 157.9 | 26.8% | 184.0 | 8.8% | 384.2 | 303.2 | 26.7% | ||||||||||||||||||
| Gross margin | 27.0% | 25.8% | 1.2 p.p. | 27.1% | -0.1 p.p. | 27.1% | 25.1% | 2.0 p.p. | ||||||||||||||||||
| EBITDA | 191.9 | 150.3 | 27.7% | 175.4 | 9.4% | 367.4 | 290.3 | 26.5% | ||||||||||||||||||
| EBITDA margin | 25.9% | 24.6% | 1.4 p.p. | 25.8% | 0.1 p.p. | 25.9% | 24.0% | 1.9 p.p. | ||||||||||||||||||
| Financial result | (41.0) | (50.9) | (19.4%) | (61.9) | (33.7%) | (102.9) | (80.6) | 27.7% | ||||||||||||||||||
| Consolidated net profit (loss) | 89.2 | 47.1 | 89.5% | 33.2 | 168.6% | 122.4 | (20.5) | n.m. | ||||||||||||||||||
| Net debt¹ | 1,627.5 | 1,145.5 | 42.1% | 1,482.7 | 9.8% | 1,627.5 | 1,145.5 | 42.1% | ||||||||||||||||||
| Leverage (x) | 2.12 | 1.90 | 0.11 | 2.11 | 0.01 | 2.12 | 1.90 | 0.11 | ||||||||||||||||||
| CAPEX² | 49.5 | 41.9 | 18.0% | 61.9 | (20.0%) | 111.4 | 110.9 | 0.4% | ||||||||||||||||||
| % Capex Net Revenue | 6.7% | 6.9% | -0.2 p.p. | 9.1% | -2.7 p.p. | 7.8% | 9.2% | -1.5 p.p. | ||||||||||||||||||
| Operational ROIC LTM³ (%) | 37.6% | 51.3% | -13.7 p.p. | 40.4% | -2.8 p.p. | 37.6% | 51.3% | -13.7 p.p. | ||||||||||||||||||
| ROIC LTM (%) | 13.0% | 16.1% | -3.2 p.p. | 13.4% | -0.5 p.p. | 13.0% | 16.1% | -3.2 p.p. | ||||||||||||||||||
1- Net Debt / annualized EBITDA, which considers the EBITDA of the current quarter multiplied by 4.
2- Capex does not consider M&A; 3-ROIC ex intangible. *6M23 adjusted for the non-cash accounting effect of R$121.9 million on expenses.
3
LETTER TO SHAREHOLDERS
To our shareholders
We are pleased to present Ambipar Response the results for the second quarter of 2024, marking a period of record achievements in revenues, EBITDA, and net income. This represents our first formal quarterly earnings report, aligning with our commitment to enhance communication with the investor’s community, alongside improvements within our organizational structure and the overall Ambipar Group.
During this quarter, we reported net revenue of R$740.5 million (USD137.4 million), reflecting a growth of 22.5% when compared to the second quarter of 2023, with Brazil notably demonstrating an expansion of 65.3%.
EBITDA for this quarter amounted to R$191.9 million (USD35.6 million), achieving a margin of 25.9%. This indicates an increase of 27.7% in EBITDA and a 1.3 percentage point rise in the margin relative to 2Q23, primarily attributed to the substantial contribution from our Brazilian operations.
Our net income for the quarter reached R$89.2 million (USD16.6 million), representing an increase of 89% compared to the previous year’s second quarter. This growth can be attributed to an increase in EBIT, a reduction in financial expenses, and the recognition of tax credits associated with fiscal losses incurred in 2023.
In operational highlights, we emphasize our effective response to the Baltimore Bridge incident in the United States, where our dedicated team managed the situation from the outset until the successful removal of the vessel and reopening of the channel. We continued to offer critical support services for even after the vessel arrived in the port, including emergency responses to hazardous materials, waste de-characterization, transportation, and final disposal.
Furthermore, we were called to address the immediate aftermath of the floodings in Rio Grande do Sul, Brazil, which was recognized as one of the largest climate-related disasters in the country. In our Environmental Services division in Brazil, we initiated significant projects such as bioengineering, dredging, and the execution of marine monitoring programs. We also renewed our contract with the Maritime Agency and the National Coast Guard of England (MCA) for the management and operation of oil spill response in the United Kingdom.
To further strengthen our capabilities, we expanded our team by adding key personnel and finalized our objectives and key results (OKRs) for both the corporate structure and all business units.
4
Additionally, we are advancing with the first phase of our ERP implementation in North America and completed the initial phase of the Emergency Command Center in the United States. This progress will facilitate the integration and standardization of our operational services, consolidating our Level 1 (telephone service), Level 2 (crisis management), and Level 3 (field services), like the successful model we have developed in Brazil.
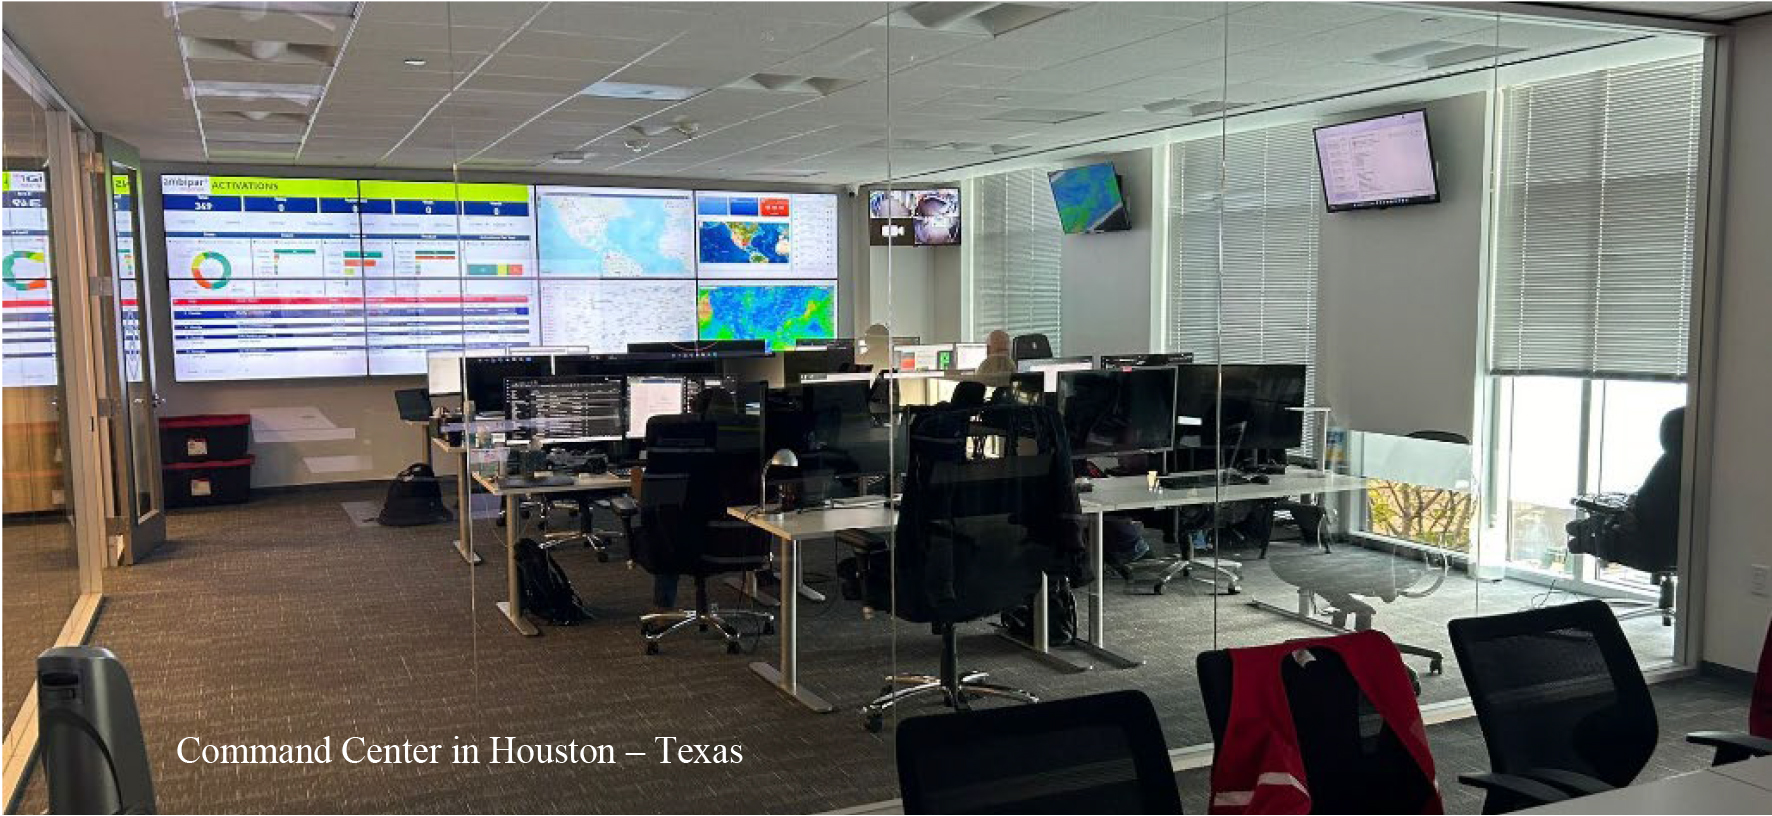
Command Center in Houston – Texas
We remain committed to focusing on organic growth, cross-selling opportunities, and the integration of operations to enhance synergies. Our continued emphasis on system implementation and the positive expansion of financial indicators will strengthen our balance sheet, improve cash flow generation, and support deleveraging efforts.
I would like to express my gratitude to all stakeholders, particularly our employees, for their trust and support. We reinforce our continuous dedication to ongoing improvement.
Sincerely,
Rafael Espirito Santo
5
GROSS REVENUE
| COMPOSITION OF GROSS REVENUE R$ million | 2Q24 | 2Q23 | Var. | 1Q24 | Var. | 6M24 | 6M23 | Var. | ||||||||||||||||||
| GROSS REVENUE | 808.9 | 660.4 | 22.5% | 737.1 | 9.7% | 1,546.1 | 1,287.5 | 20.1% | ||||||||||||||||||
| Brazil | 404.3 | 244.5 | 65.3% | 333.8 | 21.1% | 738.0 | 453.2 | 62.8% | ||||||||||||||||||
| International | 404.7 | 415.9 | (2.7%) | 403.4 | 0.3% | 808.1 | 834.3 | (3.1%) | ||||||||||||||||||
| LatAm (Ex Brazil) | 55.5 | 54.3 | 2.1% | 48.5 | 14.5% | 103.9 | 110.1 | (5.6%) | ||||||||||||||||||
| Europe | 50.7 | 46.0 | 10.1% | 50.2 | 1.0% | 100.9 | 102.1 | (1.2%) | ||||||||||||||||||
| North America | 298.5 | 315.5 | (5.4%) | 304.7 | (2.0%) | 603.2 | 622.0 | (3.0%) | ||||||||||||||||||
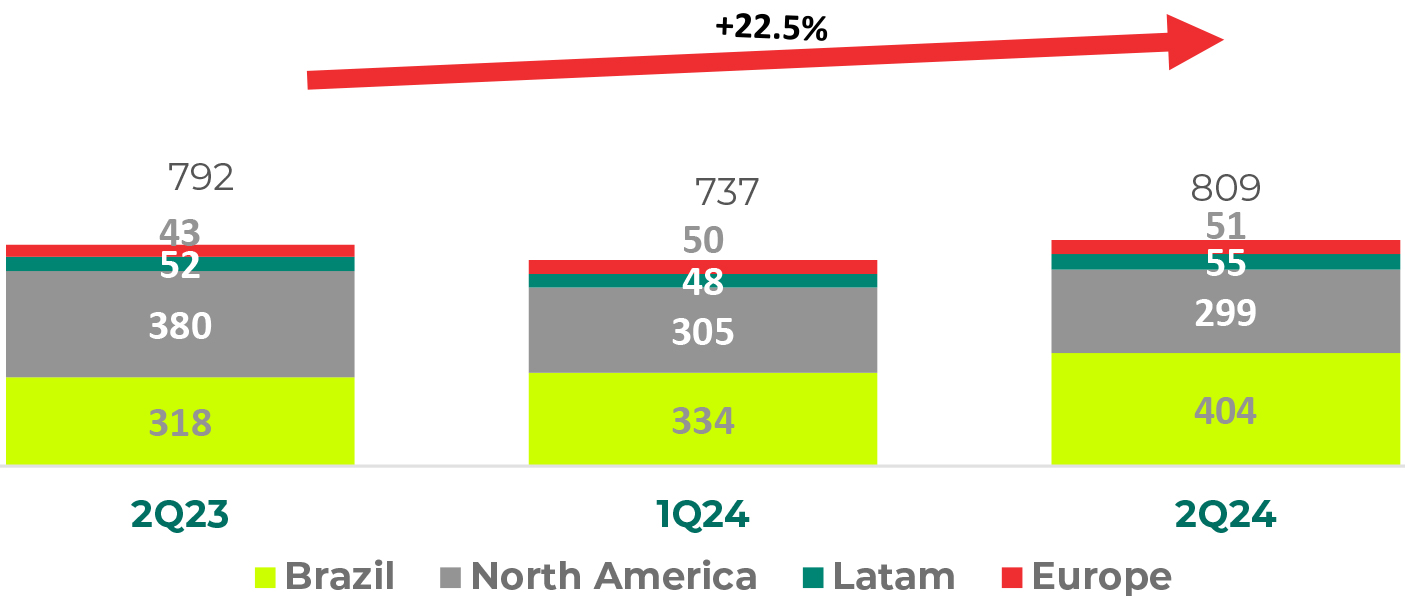
Geographic Distribution of Revenue
Geographic Distribution of Revenue (% Gross Revenue)
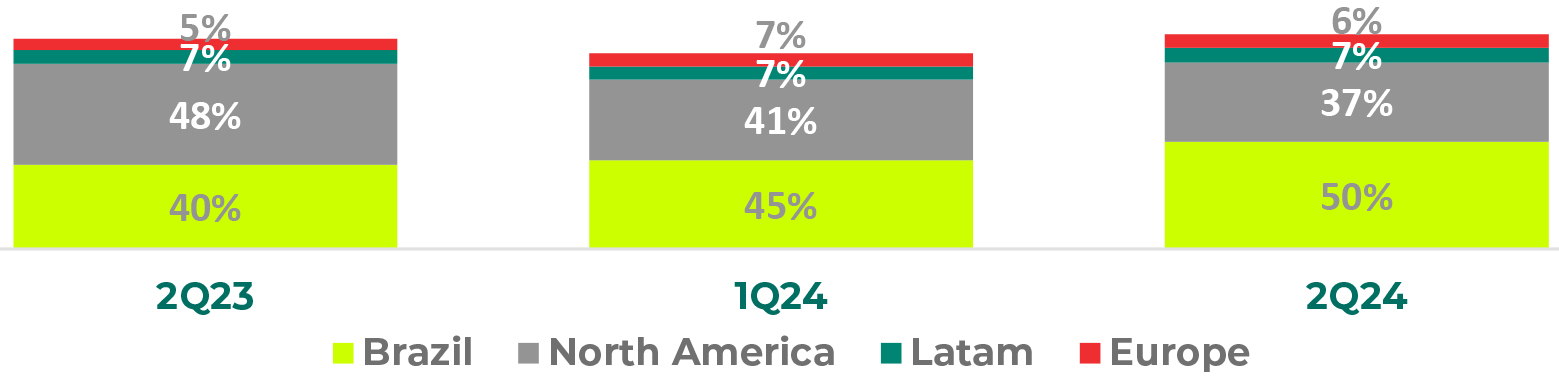
Gross revenue reached R$809 million in 2Q24, 22.5% higher than 2Q23, mainly due to revenue growth in Brazil (+65%), offset by the reduction in international revenue (-3%).
6
BRAZIL
| COMPOSITION OF GROSS REVENUE R$ million | 2Q24 | 2Q23 | Var. 2Q24 x2Q23 | 1Q24 | Var. 2Q24 x1Q24 | 6M24 | 6M23 | Var. | ||||||||||||||||||
| RESPONSE | ||||||||||||||||||||||||||
| TOTAL GROSS REVENUE | 808.9 | 660.4 | 22.5% | 737.1 | 9.7% | 1,546.1 | 1,287.5 | 20.1% | ||||||||||||||||||
| Brazil | 404.3 | 244.5 | 65.3% | 333.8 | 21.1% | 738.0 | 453.2 | 62.8% | ||||||||||||||||||
| Subscriptions Billing Brazil | 79.0 | 39.6 | 99.5% | 74.8 | 5.5% | 153.8 | 77.8 | 97.7% | ||||||||||||||||||
| Billing Services Brazil | 325.3 | 204.9 | 58.7% | 258.9 | 25.6% | 584.2 | 375.5 | 55.6% | ||||||||||||||||||
| Services Provided | 2Q23 | 1Q24 | 2Q24 | Var. 2Q24 vs 2Q23 | |||||||||||||
| Brazil | Gross Revenue (R$ million) | 204.9 | 258.9 | 325.3 | 58.7% | ||||||||||||
| Number of Services Provided | 3,075 | 3,697 | 3,802 | 23.6% | |||||||||||||
| Average Ticket (R$ thousand) | 66.6 | 70.0 | 85.6 | 28.4% | |||||||||||||
•Gross Revenue Brazil grew in all comparisons driven by the provision of emergency services, new contracts in the air response division, and the implementation of new contracts on environmental services, such as bioengineering, dredging and protection of fauna and flora;
•A relevant part of the revenue growth, presented as service billing, is anchored in multi-year contracts (3 to 5 years);
•Subscription revenue growth on YoY comparison is mainly due to medical services and compared to QoQ is organic growth in outsourcing services.

Ambipar employee rehabilitating bird after depetrolization, Angra dos Reis, RJ, Brazil
7
LATAM
| COMPOSITION OF GROSS REVENUE R$ million | 2Q24 | 2Q23 | Var. 2Q24 x2Q23 | 1Q24 | Var. 2Q24 x1Q24 | 6M24 | 6M23 | Var. | ||||||||||||||||||
| RESPONSE | ||||||||||||||||||||||||||
| TOTAL GROSS REVENUE | 808.9 | 660.4 | 22.5% | 737.1 | 9.7% | 1,546.1 | 1,287.5 | 20.1% | ||||||||||||||||||
| International | 404.7 | 415.9 | (2.7%) | 403.4 | 0.3% | 808.1 | 834.3 | (3.1%) | ||||||||||||||||||
| Latam ( ex-Brazil ) | 55.5 | 54.3 | 2.1% | 48.5 | 14.5% | 103.9 | 110.1 | (5.6%) | ||||||||||||||||||
| Latam Subscriptions Billing | 39.3 | 34.6 | 13.6% | 35.3 | 11.3% | 74.6 | 70.7 | 5.6% | ||||||||||||||||||
| Latam Services Billing | 16.2 | 19.7 | (18.1%) | 13.1 | 23.1% | 29.3 | 39.5 | (25.8%) | ||||||||||||||||||
| Services Provided | 2Q23 | 1Q24 | 2Q24 | Var. 2Q24 vs 2Q23 | |||||||||||||
| Latam ( Ex-Brazil) | Gross Revenue (R$ million) | 19.7 | 13.1 | 16.2 | (18.1%) | ||||||||||||
| Number of Services Provided | 90 | 87 | 82 | (8.9%) | |||||||||||||
| Average Ticket (R$ thousand) | 219.4 | 151.0 | 197.2 | (10.1%) | |||||||||||||
•Revenue growth in 2Q24 vs 2Q23 was negatively affected by exchange rate., the growth in local currency is 8.6%.
EUROPE
| COMPOSITION OF GROSS REVENUE R$ million | 2Q24 | 2Q23 | Var. 2Q24 x2Q23 | 1Q24 | Var. 2Q24 x1Q24 | 6M24 | 6M23 | Var. | ||||||||||||||||||
| RESPONSE | ||||||||||||||||||||||||||
| TOTAL GROSS REVENUE | 808.9 | 660.4 | 22.5% | 737.1 | 9.7% | 1,546.1 | 1,287.5 | 20.1% | ||||||||||||||||||
| International | 404.7 | 415.9 | (2.7%) | 403.4 | 0.3% | 808.1 | 834.3 | (3.1%) | ||||||||||||||||||
| Europe | 50.7 | 46.0 | 10.1% | 50.2 | 1.0% | 100.9 | 102.1 | (1.2%) | ||||||||||||||||||
| Billing Subscriptions Europe | 4.8 | 4.6 | 5.5% | 4.7 | 2.6% | 9.5 | 9.4 | 1.5% | ||||||||||||||||||
| Billing Services Europe | 45.9 | 41.5 | 10.7% | 45.5 | 0.9% | 91.4 | 92.7 | (1.5%) | ||||||||||||||||||
| Services Provided | 2Q23 | 1Q24 | 2Q24 | Var. 2Q24 vs 2Q23 | |||||||||||||
| Europe | Billing Services (R$Millions) | 41.5 | 45.5 | 45.9 | 10.7% | ||||||||||||
| Number of Services Provided | 5,798 | 5,953 | 5,879 | 1.4% | |||||||||||||
| Average Ticket (R$Thousand) | 7.2 | 7.6 | 7.8 | 9.1% | |||||||||||||
8
•Revenue grew in local currency (+4% YoY) and 10% in Brazilian Reais due to exchange rate variation.
•We stood out in the quarter in industrial services, with continued service to refineries, and renewal of the contract with the British coast guard.

Response diver responding to oil spill
NORTH AMERICA
| COMPOSITION OF GROSS REVENUE R$ million | 2Q24 | 2Q23 | Var. 2Q24 x2Q23 | 1Q24 | Var. 2Q24 x1Q24 | 6M24 | 6M23 | Var. | ||||||||||||||||||
| RESPONSE | ||||||||||||||||||||||||||
| TOTAL GROSS REVENUE | 808.9 | 660.4 | 22.5% | 737.1 | 9.7% | 1,546.1 | 1,287.5 | 20.1% | ||||||||||||||||||
| International | 404.7 | 415.9 | (2.7%) | 403.4 | 0.3% | 808.1 | 834.3 | (3.1%) | ||||||||||||||||||
| North America | 298.5 | 315.5 | (5.4%) | 304.7 | (2.0%) | 603.2 | 622.0 | (3.0%) | ||||||||||||||||||
| Services Provided | 2Q23 | 1Q24 | 2Q24 | Var. 2Q24 vs 2Q23 | |||||||||||||
| North America | Gross Revenue (R$ million) | 315.5 | 304.7 | 298.5 | (5.4%) | ||||||||||||
| Number of Services Provided | 3,660 | 4,525 | 3,488 | (4.7%) | |||||||||||||
| Average Ticket (R$ thousand) | 86.2 | 67.3 | 85.6 | (0.7%) | |||||||||||||
•Despite the decrease in North American revenues, USA posted a solid growth in local currency, while Canada presented a reduction.
•Last quarter's operational trends remained: (i) growth in the US in services and consultancy, and (ii) lower revenue in Canada, mainly due to the end of services linked to the Trans Mountain Pipeline project.
9
•In the 2Q24, negative seasonality was observed in Canada in comparison with 1Q24, due to the melting ice and consequent reduction in oil and gas exploration activity in the provinces of British Columbia and Alberta.
•Start of centralized command center in the United States.
•Ambipar Response continued to act as a key partner in responding to the bridge collapse from Baltimore.

Ambipar Response continued to serve as a key partner in responding to the Baltimore bridge collapse
NET REVENUE
| R$millions | 2Q24 | 2Q23 | Var. | 1Q24 | Var. | 6M24 | 6M23 | Var. | ||||||||||||||||||
| GROSS REVENUE | 808.9 | 660.4 | 22.5% | 737.1 | 9.7% | 1,546.1 | 1,287.5 | 20.1% | ||||||||||||||||||
| DEDUCTIONS | (68.4) | (48.3) | 41.6% | (58.1) | 17.7% | (126.5) | (79.2) | 59.7% | ||||||||||||||||||
| NET REVENUE | 740.5 | 612.1 | 21.0% | 679.1 | 9.0% | 1,419.6 | 1,208.3 | 17.5% | ||||||||||||||||||
| % Deductions / Gross Revenue | (8.5%) | (7.3%) | (1.1pp.) | (7.9%) | (0.6pp.) | (8.2%) | (6.1%) | (2.0pp.) | ||||||||||||||||||
•The variation in net revenue followed the evolution of gross revenue by geography, and the revenue deductions for each region. There was no significant change in the tax structure of each market, with deductions in the Brazilian market being greater than in the international market.
10
COST OF PRODUCTS/SERVICES (CASH)
| RESPONSE | ||||||||||||||||||||||||||
| Composition of the Costs of Services Provided R$ million | 2Q24 | 2Q23 | Var. | 1Q24 | Var. | 6M24 | 6M23 | Var. | ||||||||||||||||||
| Personnel | 319.3 | 253.4 | 26.0% | 292.7 | 9.1% | 612.0 | 491.0 | 24.6% | ||||||||||||||||||
| Third parties | 91.6 | 92.2 | (0.6%) | 79.2 | 15.8% | 170.8 | 181.0 | (5.6%) | ||||||||||||||||||
| Maintenance | 30.9 | 24.7 | 25.1% | 26.2 | 17.9% | 57.2 | 44.6 | 28.2% | ||||||||||||||||||
| Travel | 18.6 | 19.2 | (2.8%) | 13.0 | 43.2% | 31.7 | 36.4 | (12.9%) | ||||||||||||||||||
| Freight | 1.1 | 0.8 | 43.2% | 1.0 | 12.5% | 2.1 | 2.2 | (4.8%) | ||||||||||||||||||
| Rentals | 0.0 | 11.7 | (99.9%) | 0.2 | (94.3%) | 0.2 | 22.4 | (99.2%) | ||||||||||||||||||
| Fuel | 17.7 | 12.8 | 38.9% | 18.3 | (3.1%) | 36.0 | 25.3 | 42.2% | ||||||||||||||||||
| Materials | 9.8 | 5.2 | 89.3% | 10.7 | (9.3%) | 20.5 | 13.1 | 56.5% | ||||||||||||||||||
| Telecommunications | 5.3 | 2.9 | 84.8% | 3.3 | 59.2% | 8.6 | 6.6 | 31.2% | ||||||||||||||||||
| Marketing | 7.5 | 5.3 | 42.4% | 2.9 | 160.8% | 10.4 | 8.4 | 24.4% | ||||||||||||||||||
| Taxes | 6.7 | 4.2 | 58.0% | 3.1 | 114.1% | 9.8 | 15.1 | (35.0%) | ||||||||||||||||||
| Others | 31.7 | 21.9 | 45.1% | 44.4 | (28.5%) | 76.1 | 59.1 | 28.7% | ||||||||||||||||||
| TOTAL | 540.3 | 454.1 | 19.0% | 495.0 | 9.1% | 1,035.3 | 905.2 | 14.4% | ||||||||||||||||||
Percentage of Net Revenue
| Composition of the Costs of Services Provided R$ million | 2Q23 | 1Q24 | 2Q24 | ||||||||
| Net Revenue | 612.1 | 679.1 | 740.5 | ||||||||
| Personnel | 41.4% | 43.1% | 43.1% | ||||||||
| Third parties | 15.1% | 11.7% | 12.4% | ||||||||
| Maintenance | 4.0% | 3.9% | 4.2% | ||||||||
| Travel | 3.1% | 1.9% | 2.5% | ||||||||
| Freight | 0.1% | 0.1% | 0.2% | ||||||||
| Rentals | 1.9% | 0.0% | 0.0% | ||||||||
| Fuel | 2.1% | 2.7% | 2.4% | ||||||||
| Materials | 0.8% | 1.6% | 1.3% | ||||||||
| Telecommunications | 0.5% | 0.5% | 0.7% | ||||||||
| Marketing | 0.9% | 0.4% | 1.0% | ||||||||
| Taxes | 0.7% | 0.5% | 0.9% | ||||||||
| Others | 3.6% | 6.5% | 4.3% | ||||||||
| TOTAL | 74.2% | 72.9% | 73.0% | ||||||||
| GROSS MARGIN | 25.8% | 27.1% | 27.0% | ||||||||
In the quarter we presented gross margin stability compared to 1Q24, and an increase of 1.2 pp. when compared to 2Q23.
11
EBITDA
EBITDA (R$ million) and Margin (%)
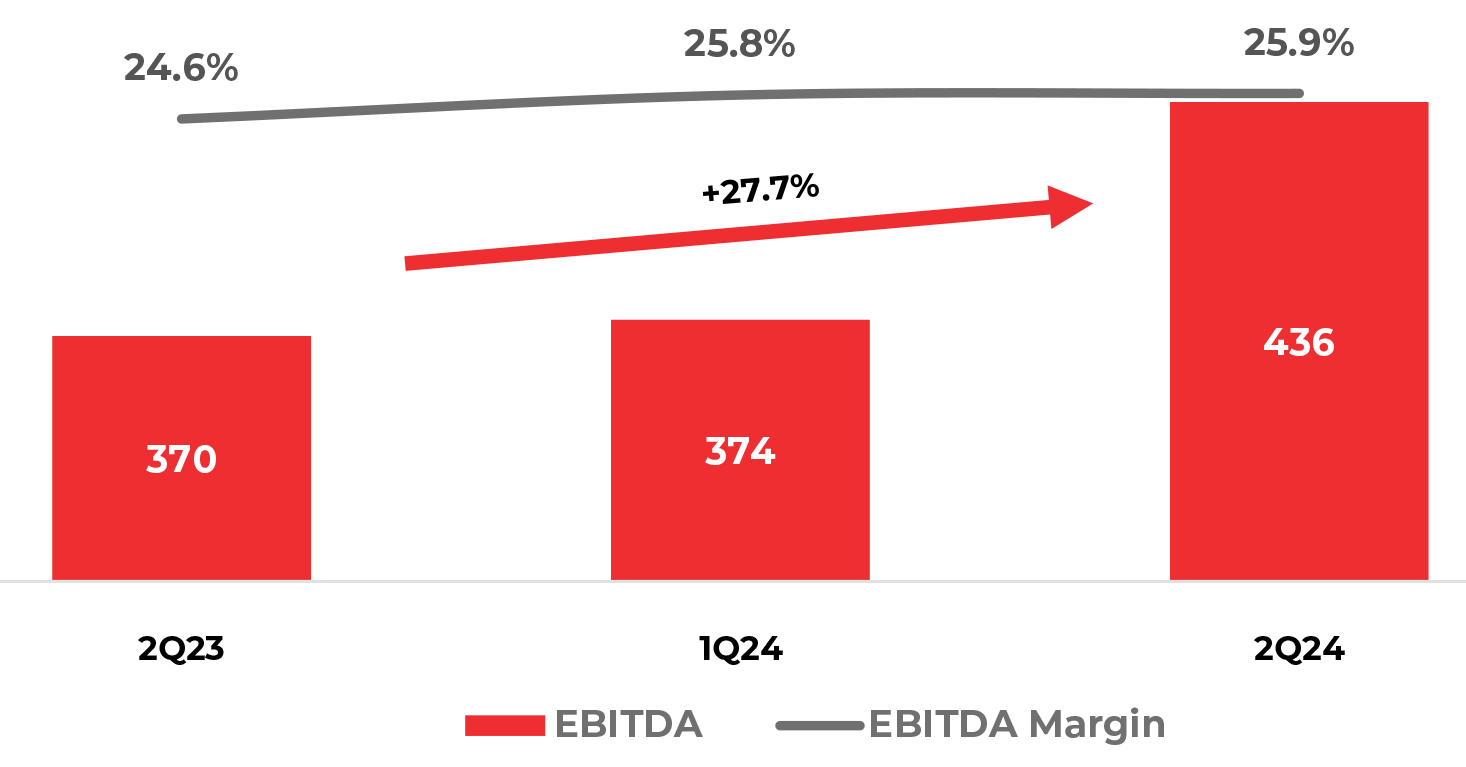
There was an increase in the EBITDA margin of 1.3 p.p. when compared to 2Q23, due to expenses dilution and the revenue mix by region.
FINANCIAL RESULTS
| R$ million | 2Q24 | 2Q23 | Var. | 1Q24 | Var. | 6M24 | 6M23 | Var. | ||||||||||||||||||
| Financial Results | (41.0) | (50.9) | (19.4%) | (61.9) | (33.7%) | (102.9) | (80.6) | 27.7% | ||||||||||||||||||
| Financial Expenses | (103.4) | (48.9) | 111.7% | (68.8) | 50.3% | (172.3) | (97.1) | 77.5% | ||||||||||||||||||
| Financial Income | 62.4 | (2.0) | N.M. | 7.0 | 797.6% | 69.4 | 16.5 | 321.0% | ||||||||||||||||||
In 2Q24, Ambipar Response presented a negative net financial result of R$41.0 million, R$9.9 million lower than 2Q23, mainly due to benefit of foreign-exchange income.
12
NET INCOME
| R$ million | 2Q24 | 2Q23 | Var. | 1Q24 | Var. | 6M24 | 6M23 | Var. | ||||||||||||||||||
| Net Income (Loss) | 89.2 | 47.1 | 89.5% | 33.2 | 168.6% | 122.4 | (20.5) | N.M. | ||||||||||||||||||
| Net Margin | 12.0% | 7.7% | 4.4 p.p. | 4.9% | 7.2 p.p. | 8.6% | (1.7%) | 10.3 p.p. | ||||||||||||||||||
Ambipar Response registered net income of R$89.2 million in 2Q24, with a net margin of 12.0%.
Compared to the same quarter of the previous year, net margin increased by 4.4 p.p. High margin is explained by higher EBIT margin, better financial result and the recognition of tax credits linked with fiscal loss in 2023.
CAPITAL STRUCTURE
On June 30, 2024, financial gross debt reached the amount of R$1,151.5 million, a reduction of R$96.2 million in relation to the balance as of December 31, 2023, mainly due to pre-payment from the 1st issue of debentures (Brazilian local bonds) and amortization of certain loans and financing.
In addition to the indebtedness with financial institutions, Ambipar Response also has a credit line with its parent company, Ambipar Participações. This line mimics the terms of the green bond raised by the parent company in the beginning of 2024 and amounts to US$200 million. Considering this related parties loan, the total amount of gross debt was R$2,355.0 million, an increase of R$486.5 million, partially explained by the monetary variation on the related party’s loan. This loan has been swapped to BRL and the SWAP results is accrued as a related party asset in the balance sheet.
| R$ Million | Jun/24 | Dec/23 | ||||||
| Short Term | 162.2 | 164.0 | ||||||
| Loans and financing | 155.4 | 84.4 | ||||||
| Debentures | 6.8 | 79.7 | ||||||
| Long Term | 989.3 | 1,083.6 | ||||||
| Loans and financing | 743.3 | 617.5 | ||||||
| Debentures | 246.0 | 466.1 | ||||||
| Short Term | 14% | 13% | ||||||
| Long Term | 86% | 87% | ||||||
| Financial Gross Debt | 1,151.5 | 1,247.7 | ||||||
| Related Parties | 1,203.5 | 620.8 | ||||||
| Total Gross Debt | 2,355.0 | 1,868.5 | ||||||
13
| Financial Gross Debt R$ Million | Financial charges - % p.a. | Maturity | Jun/24 | Dec/23 | ||||||||||
| Working capital | 6.36% and CDI + 3.94% | June 2033 | 577.5 | 560.1 | ||||||||||
| Working capital (4.131) | CDI+ 1.28% | May 2025 | 79.4 | - | ||||||||||
| Investment financing | 15.79% | June 2029 | 158.8 | 97.9 | ||||||||||
| Financial leases liabilities | 4.67% | May 2028 | 82.9 | 43.9 | ||||||||||
| Debentures | CDI + 2.65% and 3.5% | September 2028 | 252.8 | 545.8 | ||||||||||
| Total | 1,151.5 | 1,247.7 | ||||||||||||
Gross Debt Amortization schedule
R$ Million
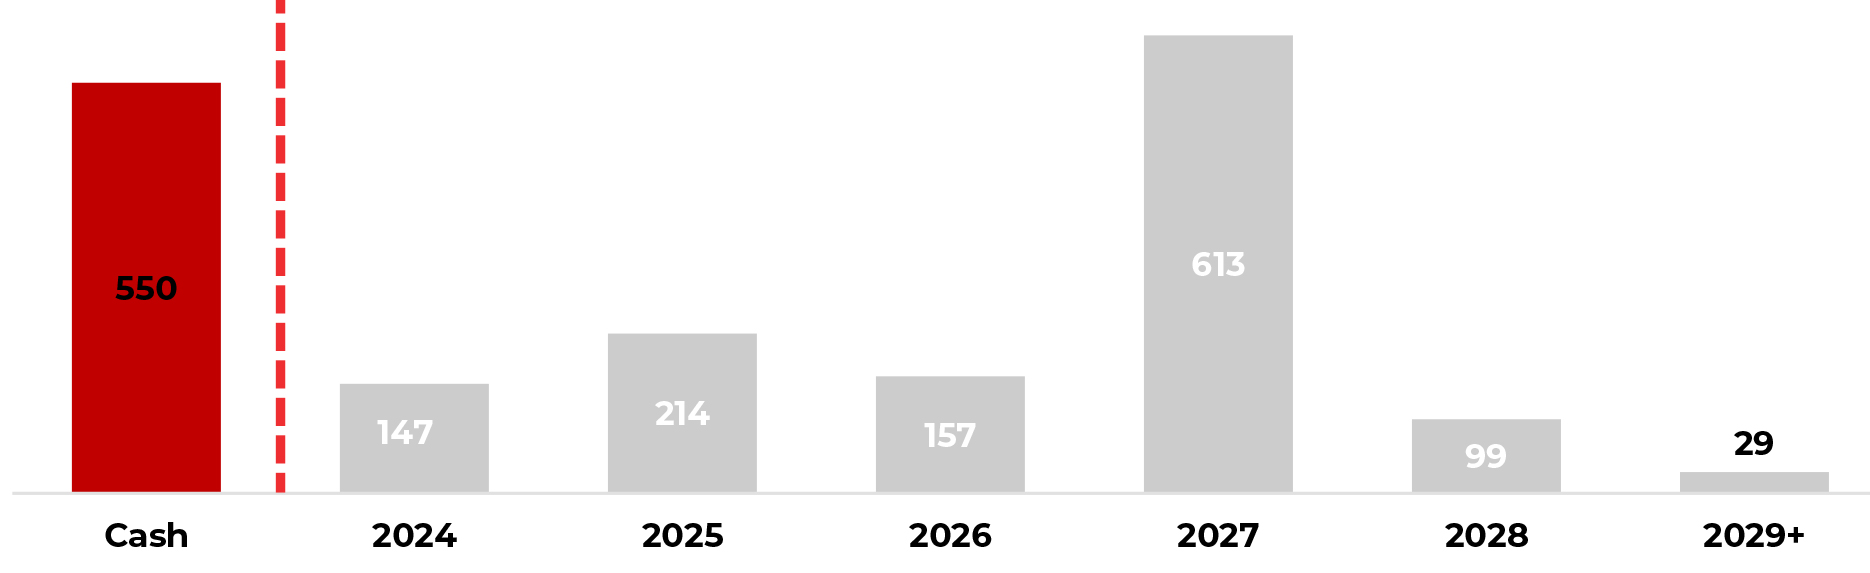
The debt maturity schedule has its most relevant portion in the year 2027. The related party debt has a bullet amortization in 2031.
| R$ Million | 2Q24 | 4Q23 | ||||||
| Financial Gross Debt | 1,151.5 | 1,247.7 | ||||||
| (-) Cash and equivalentes | 549.5 | 423.3 | ||||||
| (=) Financial Net Debt based on Covenants criteria | 601.9 | 824.4 | ||||||
| Pro forma annualized EBITDA¹ | 767.7 | 762.6 | ||||||
| Financial Leverage (x) | 0.78 | 1.08 | ||||||
| (=) Net Debt Including Related Parties² | 1,627.5 | 1,415.9 | ||||||
| Pro forma annualized EBITDA¹ | 767.7 | 762.6 | ||||||
| Financial Leverage (x) | 2.12 | 1.86 | ||||||
1-Calculated as the EBITDA multiplied by four. 2- Considers the amount of related Parties Loans and the correspondent SWAP balance..
Considering the related parties net balance, the total amount of net debt was R$1,627.5 million an increase of R$211.6 million YTD, mainly due to payments of deferred installments of past M&A’s, which amounted R$137 million in the period.
Financial Leverage based on Covenants criteria reduced from 1.08x to 0.78x in the comparison between June 2024 and December 2023. Also in June 2024, considering Related Parties loans, the leverage increased from 1.86x to 2.12x.
14
ROIC
| BRL million | 2Q24 LTM | 2Q23 LTM | Chg. 2Q24 LTM x 2Q23 LTM | ||||||||
| (+) EBIT | 514.1 | 428.4 | 20.0% | ||||||||
| (-) Tax¹ | (154.2) | (128.5) | 20.0% | ||||||||
| NOPAT | 359.9 | 299.9 | 20.0% | ||||||||
| (+) Average Shareholders' Equity | 1,385.9 | 730.8 | 89.6% | ||||||||
| (+) Average Net Debt | 1,392.6 | 1,127.5 | 23.5% | ||||||||
| Average Invested Capital | 2,778.5 | 1,858.3 | 49.5% | ||||||||
| (-) Average Intangible | 1,820.3 | 1,273.4 | 42.9% | ||||||||
| Average Invested Capital ex Intangible | 958.2 | 584.9 | 63.8% | ||||||||
| Operational ROIC LTM² (%) | 37.6% | 51.3% | (13.7 p.p.) | ||||||||
| ROIC LTM (%) | 13.0% | 16.1% | (3.1 p.p.) | ||||||||
1- Considers a 30% tax rate; 2- Disregard intangibles
Return on Invested Capital minus intangible assets (“operating ROIC”) allows for an approximate estimate of the return on investments made in operations.
Return on Invested Capital (“ROIC”), which incorporates intangible assets into the invested capital base, mainly composed of goodwill paid for acquisitions.
M&A investment, at first, presents a lower ROIC, due to goodwill paid on acquisition. Once acquisitions become part of our operations, the expected return on the marginal investment made tends to follow the Operating ROIC, since the invested capital is allocated to the acquiree's operations and does not include goodwill.
In the medium term, therefore, we expect convergence between the ROIC and the operational ROIC.
15
CAPEX
We continued to invest in the upgrade of our existing asset base and the organic expansion of our footprint, especially in North America. In 2Q24, the addition of fixed assets in Response was R$49.5 million. We invested in new aircrafts in Brazil, and in the implementation of contracts for monitoring coastal fauna and flora. Abroad, we made investments to open new operational bases during 2H24 in North America, in adjacent geographies to our current operations.
Gains from operational leverage have materialized in lower capex intensity per revenue, even when measured over the last twelve months.
| CAPEX R$ million | 2Q23 | 1Q24 | 2Q24 | Var. 2Q24 vs. 2Q23 | 6M23 | 6M24 | Var. | ||||||||||||||||
| Total Capex Response | 41,9 | 61,9 | 49,5 | 18,0% | 110,9 | 111,4 | 0,4% | ||||||||||||||||
| % Net Revenue Response | 6,9% | 9,1% | 6,7% | (0,2 p.p.) | 15,0% | 33,3% | 18,3 p.p. | ||||||||||||||||
| Expansion | 24,3 | 14,7 | 26,7 | 10,3% | 62,3 | 41,5 | (33,3%) | ||||||||||||||||
| % Net Revenue Response | 4,0% | 2,2% | 3,6% | (0,4 p.p.) | 8,4% | 12,4% | 4,0 p.p. | ||||||||||||||||
| Brazil | 6,3 | 0,0 | 11,2 | 78,3% | 31,9 | 11,2 | (64,8%) | ||||||||||||||||
| % Gross Revenue Brazil | 2,6% | 0,0% | 2,8% | 0,2 p.p. | 4,3% | 3,4% | (1,0 p.p.) | ||||||||||||||||
| Latam ( ex Brazil) | 18,0 | 0,0 | 0,0 | n.m. | 18,6 | 0,0 | n.m. | ||||||||||||||||
| % Gross Revenue Latam ( ex Brazil) | 4,3% | 0,0% | 0,0% | (4,3 p.p.) | 2,5% | 0,0% | (2,5 p.p.) | ||||||||||||||||
| Europe | 0,0 | 0,2 | 0,7 | n.m. | 0,3 | 0,9 | 196,0% | ||||||||||||||||
| % Gross Revenue Europe | 0,0% | 0,3% | 1,4% | 1,4 p.p. | 0,0% | 0,3% | 0,2 p.p. | ||||||||||||||||
| North America | 0,0 | 14,6 | 14,8 | n.m. | 11,5 | 29,4 | 155,4% | ||||||||||||||||
| % Gross Revenue North America | 0,0% | 4,8% | 5,0% | 5,0 p.p. | 1,6% | 8,8% | 7,2 p.p. | ||||||||||||||||
| Maintenance | 17,7 | 47,1 | 22,7 | 28,4% | 48,8 | 69,8 | 43,1% | ||||||||||||||||
| % Net Revenue Response | 2,9% | 6,9% | 3,1% | 0,2 p.p. | 6,6% | 20,9% | 14,3 p.p. | ||||||||||||||||
| Brazil | 5,3 | 33,3 | 10,0 | 89,0% | 23,6 | 43,3 | 83,6% | ||||||||||||||||
| % Gross Revenue Brazil | 2,2% | 10,0% | 2,5% | 0,3 p.p. | 3,2% | 12,9% | 9,8 p.p. | ||||||||||||||||
| Latam ( ex Brazil) | 1,8 | 3,2 | 0,9 | (48,3%) | 2,3 | 4,1 | 77,8% | ||||||||||||||||
| % Gross Revenue Latam ( ex Brazil) | 0,4% | 0,8% | 0,2% | (0,2 p.p.) | 0,3% | 1,2% | 0,9 p.p. | ||||||||||||||||
| Europe | 1,8 | 3,8 | 1,6 | (12,4%) | 3,4 | 5,4 | 56,8% | ||||||||||||||||
| % Gross Revenue Europe | 4,0% | 7,5% | 3,2% | (0,8 p.p.) | 0,5% | 1,6% | 1,1 p.p. | ||||||||||||||||
| North America | 8,7 | 6,8 | 10,2 | 16,4% | 19,4 | 17,0 | (12,5%) | ||||||||||||||||
| % Gross Revenue North America | 2,8% | 2,2% | 3,4% | 0,6 p.p. | 2,6% | 5,1% | 2,5 p.p. | ||||||||||||||||
16
ANNEXES
•Balance sheet
•Income Statement
•Cash flow
•Reconciliation of Non-GAAP Measures
BALANCE SHEET
| ASSETS BRL thousand | June 30th, 2024 | Dec. 31st, 2023 | ||||||
| Cash and cash equivalents | 549,513 | 423,266 | ||||||
| Trade and other receivables | 798,427 | 803,523 | ||||||
| Current income tax and social contribution recoverable | 23,708 | 14,143 | ||||||
| Other taxes recoverable | 80,485 | 63,955 | ||||||
| Prepaid expenses | 54,882 | 32,239 | ||||||
| Advances to suppliers | 32,585 | 23,125 | ||||||
| Inventories | 59,787 | 34,159 | ||||||
| Dividends Receivable | - | - | ||||||
| Other accounts equivalents | 59,319 | 45,814 | ||||||
| Total current assets | 1,658,706 | 1,440,224 | ||||||
| Trade and other receivables, net | 1,081 | 3,485 | ||||||
| Related parties loans | 177,956 | 29,322 | ||||||
| Non-current income tax and social contribuition recoverable | 13,829 | 1,472 | ||||||
| Non-current other taxes recoverable | 1,190 | 857 | ||||||
| Deferred taxes | 22,257 | 28,800 | ||||||
| Judicial deposits | 0,952 | 631 | ||||||
| Other accounts receivable | 34,019 | 32,245 | ||||||
| Investments | - | - | ||||||
| Property, plant and equipment | 879,391 | 787,561 | ||||||
| Right of use | 103,461 | 88,737 | ||||||
| Goodwill | 1,687,166 | 1,537,135 | ||||||
| Intangible assets | 387,474 | 358,703 | ||||||
| Total Non-current assets | 3,308,776 | 2,868,948 | ||||||
| Total assets | 4,967,483 | 4,309,172 | ||||||
17
BALANCE SHEET (continued)
| LIABILITIES AND SHAREHOLDERS EQUITY BRL thousand | June 30th, 2024 | Dec. 31st, 2023 | ||||||
| Loans and financing | 155,362 | 84,369 | ||||||
| Debentures | 6,818 | 79,677 | ||||||
| Trade and other payables | 159,493 | 184,618 | ||||||
| Labor obligations | 84,869 | 82,768 | ||||||
| Dividends Payable | 53,367 | 57,364 | ||||||
| Current income tax and social contribution payable | 8,875 | 21,684 | ||||||
| Other tax payable | 49,527 | 51,459 | ||||||
| Obligations from acquisition of investment | 157,948 | 183,825 | ||||||
| Lease liabilities | 23,436 | 22,620 | ||||||
| Other bills to pay | 24,582 | 34,638 | ||||||
| Total current liabilities | 724,277 | 803,022 | ||||||
| Loans and financing | 743,286 | 617,533 | ||||||
| Debentures | 245,985 | 466,073 | ||||||
| Other taxes payable | 11,344 | 8,638 | ||||||
| Related parties loans | 1,203,528 | 620,842 | ||||||
| Provision for loss on investments | - | - | ||||||
| Deferred income tax and social contribution | 223,316 | 187,784 | ||||||
| Obligations from acquisition of investment | 71,381 | 168,926 | ||||||
| Provision for contingencies | 0,377 | 393 | ||||||
| Lease liabilities | 35,335 | 34,860 | ||||||
| Warrant and Earn-out | 17,989 | 30,753 | ||||||
| Other bills to pay | 16,025 | 13,551 | ||||||
| Total Non-current liabilities | 2,568,566 | 2,149,353 | ||||||
| Capital | 1,443,109 | 1,443,109 | ||||||
| Profit reserves | - | - | ||||||
| Capital transactions | (106,427) | (91,232) | ||||||
| Accumulated translation adjustment | (17,556) | (216,341) | ||||||
| Retained earnings | 9,238 | (62,477) | ||||||
| Equity attributable to owners of the group | 1,328,364 | 1,073,059 | ||||||
| Non-controlling interest | 346,276 | 283,738 | ||||||
| Total Equity | 1,674,640 | 1,356,797 | ||||||
| Total shareholders' equity and liabilities | 4,967,483 | 4,309,172 | ||||||
18
INCOME STATEMENT
| R$ million | 2Q24 | 2Q23 | Chg | 1Q24 | Chg. | 6M24 | 6M23 | Chg. | ||||||||||||||||||
| Gross revenues | 808.9 | 660.4 | 22.5% | 737.1 | 9.7% | 1,546.1 | 1,287.5 | 20.1% | ||||||||||||||||||
| Deductions | (68.4) | (48.3) | 41.7% | (58.1) | 17.9% | (126.5) | (79.2) | 59.8% | ||||||||||||||||||
| Net Revenues | 740.5 | 612.1 | 21.0% | 679.1 | 9.0% | 1,419.6 | 1,208.3 | 17.5% | ||||||||||||||||||
| Cost of Services provided | (540.3) | (454.1) | 19.0% | (495.0) | 9.1% | (1,035.3) | (905.2) | 14.4% | ||||||||||||||||||
| SG&A | (8.3) | (7.6) | 8.8% | (8.6) | -4.0% | (16.9) | (12.9) | 31.3% | ||||||||||||||||||
| EBITDA | 191.9 | 150.3 | 27.7% | 175.4 | 9.4% | 367.4 | 290.3 | 26.5% | ||||||||||||||||||
| EBITDA Margin (%) | 25.9% | 24.6% | 1.4 p.p. | 25.8% | 0.1 p.p. | 25.9% | 24.0% | 1.9 p.p. | ||||||||||||||||||
| Financial Results | (41.0) | (50.9) | -19.4% | (61.9) | -33.7% | (102.9) | (80.6) | 27.7% | ||||||||||||||||||
| Financial Expenses | (103.4) | (48.9) | 111.7% | (68.8) | 50.3% | (172.3) | (97.1) | 77.5% | ||||||||||||||||||
| Financial Income | 62.4 | (2.0) | n.m. | 7.0 | 797.6% | 69.4 | 16.5 | 321.0% | ||||||||||||||||||
| Taxes | 6.2 | (15.1) | n.m. | (21.2) | n.m. | (15.0) | (35.3) | -57.4% | ||||||||||||||||||
| Current Taxes | (5.4) | (16.0) | -66.2% | (16.6) | -67.5% | (22.0) | (29.6) | -25.5% | ||||||||||||||||||
| Deferred Taxes | 11.6 | 0.9 | 1147.1% | (4.6) | -354.1% | 7.0 | (5.7) | n.m. | ||||||||||||||||||
| Net Income (Loss) | 89.2 | 47.1 | 89.5% | 33.2 | 168.6% | 122.4 | (20.5) | n.m. | ||||||||||||||||||
*6M23 EBITDA and margin excludes extraordinary expenses and non-cash from NYSE American listing.
19
CASH FLOW
| BRL thousand | 2Q24 | 2Q23 | 6M24 | 6M23 | ||||||||||
| Net income for the period | 89,192 | (68,028) | (20,522) | 122,393 | ||||||||||
| Adjustments to reconcile income to cash from (applied to) operations: | ||||||||||||||
| Depreciation and amortization | 67,888 | 37,305 | 73,090 | 127,029 | ||||||||||
| Expected credit losses | 1,732 | 141 | (15) | 1,882 | ||||||||||
| Residual value of written-off property, plant and equipment and intangible assets | (824) | (1,767) | 9,456 | 3,404 | ||||||||||
| Provision for contingencies | (16) | (361) | (225) | (16) | ||||||||||
| Income tax and social contribution - Deferred | (11,586) | (929) | 5,703 | (7,027) | ||||||||||
| Interest on loans and financing, debentures, leases and exchange rate variation | 38,801 | 52,615 | 78,049 | 95,073 | ||||||||||
| Changes in assets and liabilities: | ||||||||||||||
| Accounts receivable | (33,742) | 73,473 | 13,227 | 75,903 | ||||||||||
| Recoverable taxes | (23,412) | (2,420) | (7,544) | (34,387) | ||||||||||
| Prepaid expenses | (11,520) | (6,154) | 2,751 | (20,477) | ||||||||||
| Advances to suppliers | 707 | (16,933) | (28,406) | (9,394) | ||||||||||
| Inventories | (16,318) | (5,787) | (7,982) | (23,715) | ||||||||||
| Other accounts receivable | (1,278) | (18,096) | (7,018) | (9,249) | ||||||||||
| Suppliers | (14,022) | (31,464) | (52,106) | (30,369) | ||||||||||
| Salaries and social security charges | 6,436 | (5,619) | (32,317) | (1,917) | ||||||||||
| Taxes payable | (2,265) | (1,867) | 1,989 | 29,352 | ||||||||||
| Other accounts payable | (6,962) | (31,002) | (73,994) | (12,153) | ||||||||||
| Total | (102,376) | (45,869) | (191,400) | -36,406 | ||||||||||
| Cash generated from operating activities | 56,271 | 103,081 | (2,452) | 291,815 | ||||||||||
| Interest paid on loans and financing | (8,660) | (5,681) | (5,681) | (31,231) | ||||||||||
| Interest paid on debentures | (1) | 0 | 0 | (41,925) | ||||||||||
| Interest paid on leases | (858) | (660) | (660) | (1,606) | ||||||||||
| Income tax and social contribution | (7,063) | (4,926) | (4,926) | (44,019) | ||||||||||
| Total | (16,582) | (11,267) | (11,267) | (118,781) | ||||||||||
| Cash from (invested in) operations | 39,689 | 91,814 | (13,719) | 165,968 | ||||||||||
| Cash flow from investing activities | ||||||||||||||
| Cash spent on companies' acquisitions; net of cash received | 0 | (21,523) | (25,169) | 0 | ||||||||||
| Payment of obligations from acquisition of investments | (33,419) | (20,452) | (64,923) | (137,296) | ||||||||||
| Acquisition of property, plant and equipment and intangible assets | 23,087 | (38,416) | (108,955) | 9,552 | ||||||||||
| Net cash used in investing activities | (10,332) | (80,391) | (199,047) | (127,744) | ||||||||||
| Cash flow from financing activities | 0 | 0 | 0 | 0 | ||||||||||
| Attributed to shareholders | 0 | 0 | 0 | 0 | ||||||||||
| Profit distribution - prior periods | (5,452) | (16,744) | (47,900) | (4,375) | ||||||||||
| Increase in minority interest | 0 | 100,214 | 699,532 | 0 | ||||||||||
| Capital Increase | 0 | (104,040) | 0 | 0 | ||||||||||
| Attributed to financing | 0 | 0 | 0 | 0 | ||||||||||
| Related parties | 15,811 | 144,077 | 104,509 | 425,361 | ||||||||||
| Lease payments - Principal | (34,734) | (24,413) | (28,392) | (65,668) | ||||||||||
| Proceeds from loans and financing | 11,262 | 20,100 | 37,765 | 64,235 | ||||||||||
| Proceeds from debentures | (300) | 0 | 0 | (300) | ||||||||||
| Debentures payments - Principal | 0 | (17,553) | (63,980) | (279,583) | ||||||||||
| Payments of loans and financing - Principal | (14,917) | 542 | 1,028 | (70,486) | ||||||||||
| Payment of Share Issuance Costs | 0 | 0 | 0 | 0 | ||||||||||
| Net cash generated from financing activities | (28,330) | 102,183 | 702,562 | 69,184 | ||||||||||
| Increase (decrease) in cash and cash equivalents | 1,027 | 113,606 | 489,796 | 107,408 | ||||||||||
| Exchange rate change in cash and cash equivalents | 15,557 | (157,180) | (69,576) | 18,839 | ||||||||||
| Cash and cash equivalents at the beginning of the period | 532,929 | 735,403 | 271,607 | 423,266 | ||||||||||
| Cash and cash equivalents at the end of the period | 549,513 | 691,829 | 691,827 | 549,513 | ||||||||||
20
Reconciliation of Non-GAAP Measures
Reconciliation of our Loans and Financings and Debentures to Total Gross Debt, Financial Net Debt based on Covenants, Net Debt Including Related Parties and Financial Leverage, Financial Leverage including Related Parties
| R$ Million | 2Q24 | 4Q23 | ||||||
| (+) Short Term Loans and financing | 155.4 | 84.4 | ||||||
| (+) Short Term Debentures | 6.8 | 79.7 | ||||||
| (+) Long Term Loans and financing | 743.3 | 617.5 | ||||||
| (+) Long Term Debentures | 246.0 | 466.1 | ||||||
| Financial Gross Debt | 1,151.5 | 1,247.7 | ||||||
| (-) Cash and equivalents | 549.5 | 423.3 | ||||||
| (=) Financial Net Debt based on Covenants | 601.9 | 824.4 | ||||||
(/) Pro forma annualized EBITDA1 | 767.7 | 762.6 | ||||||
Financial Leverage (x) | 0.78 | 1.08 | ||||||
| Financial Gross Debt | 1,151.5 | 1,247.7 | ||||||
| (+) Related Parties Loans | 1,203.5 | 620.8 | ||||||
| Total Gross Debt | 2,355.0 | 1,868.5 | ||||||
| (-) Cash and equivalents | 549.5 | 423.3 | ||||||
| (-) Related Parties Assets | 178.0 | 29.3 | ||||||
| (=) Net Debt Including Related Parties | 1,627.5 | 1,415.9 | ||||||
(/) Pro forma annualized EBITDA1 | 767.7 | 762.6 | ||||||
| Financial Leverage Including Related Parties (x) | 2.12 | 1.86 | ||||||
1- Calculated as the EBITDA multiplied by four.
EBITDA and EBITDA Margin Reconciliation
| R$ Million | 2Q24 | 2Q23 | 6M24 | 6M23 | ||||||||||
| Profit for period | 89.2 | 47.1 | 122.4 | (20.5) | ||||||||||
| (+) Income tax and social contribution | 6.2 | (15.1) | (15.0) | (35.3) | ||||||||||
| (+) Financial Results | (41.0) | (50.9) | (102.9) | (80.6) | ||||||||||
| (+) Depreciation and amortization expenses | (59.1) | (37.3) | (118.3) | (73.1) | ||||||||||
| (+) NYSE American Listing expenses | - | - | - | (121.9) | ||||||||||
| EBITDA (a) | 191.9 | 150.3 | 367.4 | 290.3 | ||||||||||
| Net revenue (b) | 740.5 | 612.1 | 1,419.6 | 1,208.3 | ||||||||||
| EBITDA Margin (a)/(b) | 25.9% | 24.6% | 25.9% | 24.0% | ||||||||||
21
| R$ Million | 2Q24 LTM | 2Q23 LTM | 2Q24 (A) | 1Q24 (B) | 4Q23 (C) | 3Q23 (D) | 2Q23 (E) | 1Q23 (F) | 4Q22 (G) | 3Q22 (H) | ||||||||||||||||||||||
| Operating profit² | 514.1 | 428.4 | 132.8 | 116.3 | 133.4 | 131.6 | 113.0 | 103.3 | 138.1 | 73.0 | ||||||||||||||||||||||
Income tax adjustment1,2 | (154.2) | (128.5) | (39.8) | (34.9) | (40.0) | (39.5) | (33.9) | (31.0) | (41.4) | (21.9) | ||||||||||||||||||||||
| Net operating profit after tax (a)² | 359.9 | 299.9 | 92.9 | 81.4 | 93.4 | 92.1 | 79.1 | 72.3 | 96.7 | 51.1 | ||||||||||||||||||||||
| Total Shareholders’ equity³ | 1,385.9 | 730.8 | 1,674.6 | 1,403.5 | 1,356.8 | 1,314.9 | 1,179.7 | 1,204.4 | 447.1 | 435.8 | ||||||||||||||||||||||
| (+) Financial Gross Debt ³ | 1,392.6 | 1,127.5 | 1,627.5 | 1,482.7 | 1,415.9 | 1,194.0 | 1,256.4 | 1,092.8 | 1,790.1 | 929.0 | ||||||||||||||||||||||
| (-) Cash and cash equivalents³ | 512.3 | 504.8 | 549.5 | 532.9 | 423.3 | 510.9 | 691.8 | 735.4 | 271.6 | 668.1 | ||||||||||||||||||||||
| (+) Related parties loans (current and non-current)³ | 620.7 | 588.9 | 1,203.5 | 1,076.2 | 620.8 | 634.4 | 606.8 | 607.2 | 769.8 | 595.5 | ||||||||||||||||||||||
| (-) Related parties assets³ | 27.6 | 32.1 | 178.0 | 58.8 | 29.3 | 26.0 | 25.9 | 26.0 | 26.2 | 41.6 | ||||||||||||||||||||||
| Invested capital (b) | 2,778.5 | 1,858.3 | 3,302.2 | 2,886.2 | 2,772.7 | 2,606.3 | 1,558.1 | 1,573.8 | 1,612.5 | 892.3 | ||||||||||||||||||||||
| ROIC (a)/(b) | 13.0% | 16.1% | ||||||||||||||||||||||||||||||
| (-) Goodwill³ | 1,383.9 | 1,028.4 | 1,687.2 | 1,563.7 | 1,537.1 | 1,272.4 | 1,188.9 | 1,178.8 | 1,192.3 | 861.6 | ||||||||||||||||||||||
| (-) Intangibles assets³ | 1,820.3 | 1,273.4 | 2,074.6 | 1,923.7 | 1,895.8 | 376.9 | 369.3 | 395.0 | 420.2 | 30.7 | ||||||||||||||||||||||
| Invested capital ex Goodwill and intangible assets (c) | 958.2 | 584.9 | 1,227.5 | 962.5 | 876.9 | 957.0 | 767.1 | 723.3 | 624.7 | 472.5 | ||||||||||||||||||||||
| ROIC (a)/(c) | 37.6% | 51.3% | ||||||||||||||||||||||||||||||
1 Income tax adjustment is defined as operating profit for the period multiplied by our normalized effective tax rate for the period, the numerator of which is income tax and social contribution and the denominator of which is profit before tax.
2 Considers the sum of the last 4 quarters.
3 Considers the average of the last 5 quarters.
22
AMBIPAR RESPONSE
Ambipar Response has 4 businesses units:
1.Emergency response: specialist in crisis management and response to environmental emergencies, with command coordinated by a control center, managing services simultaneously, scalable and standardized. It has 5 HAZMAT training camps, training person according to National Technical Standards Fire Protection Association (“NFPA”, in the USA), a reference in the development of technical standards for emergency response. Also comprises Fire Response for the prevention and combat of forest and industrial fires and Medical Response to emergency medical care services.
2.Marine response: port support solutions, such as transporting people, material and ranch, dredging support, preventive fencing and emergency bases. It also offers solutions for maritime support, such as transporting materials to platforms, combating oil spills, chase-boats for seismic vessels, and vessels for FPSO support (Floating production storage and offloading).
3.Industrial response: meets demands for cleaning, maintenance, decontamination and treatment, painting of industrial and naval tanks, which typically involve a hazardous environment or material. It also performs decommissioning of FPSOs, vessels, platforms and industrial plants. It can perform these services for radioactive materials as well.
4.Environmental response: rehabilitation of fauna and flora, licensing, auditing and environmental due diligence, soil remediation, risk study, preparation and execution of environmental monitoring programs. Team formed by biologists, oceanographers, geologists, geographers and engineers.
For more details, watch the institutional video: https://www.youtube.com/watch?v=WimhiX_h6YU.
23