Exhibit 99.5
Fair Market Value Analysis
of
Courtside Group, Inc.
as of
December 31, 2022
Prepared for:
Mr. Robert Ellin
LiveOne, Inc.

February 20, 2023
Mr. Robert Ellin
Chairman and CEO
LiveOne, Inc.
269 South Beverly Drive
Beverly Hills, CA 90212
Re: Valuation Analysis of Courtside Group, Inc.
Dear Mr. Ellin:
Pursuant to your request, we were retained to perform an independent valuation analysis and prepare a valuation report (the “Report”). This analysis and Report were performed to establish the fair market value range of Courtside Group, Inc. (“Courtside” or the “Company” or the “Subject Interest”) as of December 31, 2022 (the “Valuation Date”).
PURPOSE
This third-party valuation analysis was performed for NASDAQ listing requirements to establish the fair market value of the Company.
DEFINITION OF VALUE
The standard of value is fair market value. Fair market value is defined by Section 20.2031-1(b) of the Estate Tax Regulations and Revenue Ruling 59-60, 1959-1 C.B. 237 as the price at which the property would change hands between a willing buyer and a willing seller when the former is not under any compulsion to buy and the latter is not under any compulsion to sell, both parties having reasonable knowledge of relevant facts.
950 E. State Highway 114 • Suite 120 • Southlake • Texas 76092 • Tel: 817.481.4900 • Fax: 817.481.4905
www.valuescopeinc.com
Mr. Robert Ellin
February 20, 2023
Page 2
To develop our conclusion of value for the Company, we considered all the factors listed in Revenue Ruling 59-60. These factors include:
| 1. | The nature of the business and its history from inception. |
| 2. | The economic outlook in general and the condition and outlook of the specific industry in which it operates. |
| 3. | The book value and the financial condition of the business. |
| 4. | The earning capacity of the business. |
| 5. | The dividend-paying capacity of the business. |
| 6. | Whether the enterprise had goodwill or other intangible value. |
| 7. | The market prices of the stocks of corporations engaged in the same or similar line of business having their stocks actively traded on an exchange or over-the- counter. |
| 8. | The marketability, or lack thereof, of the securities. |
The premise of value followed herein is going concern.1 The liquidation premise of value (both orderly and fixed) was considered and rejected as not applicable because the going- concern value results in the “highest and best use” for the Company.
SCOPE OF WORK
To gain an understanding of Courtside Group’s operations, we reviewed the Company’s financial and operational data. To understand the environment in which Courtside Group operates, we researched the internet radio broadcasting industry and researched the competition for services within Courtside Group’s primary areas of service. We also studied economic conditions as of the Valuation Date and their effects on Courtside Group and the industry. To better understand the Company’s financial condition, we analyzed its financial statements, as available.
In order to conclude the fair market value range of the Company, we considered all valuation approaches and methods and applied the most appropriate methods from the income, market, and cost approaches to derive an opinion of value. Our conclusion of value reflects these findings, our judgment and knowledge of the marketplace, and our expertise in valuation.
| 1 | The International Glossary of Business Valuation Terms defines “Going Concern” as “an ongoing operating business enterprise,” and “Going Concern Value” as “the value of a business enterprise that is expected to continue to operate into the future. The intangible elements of going concern value result from factors such as having a trained workforce, an operational plant, and the necessary licenses, systems, and procedures in place.” |
| VALUESCOPE, Inc. |
Mr. Robert Ellin
February 20, 2023
Page 3
Our valuation is set out in the attached Report. In performing our work, we were provided with and/or relied upon various sources of information, including (but not limited to):
| ● | Unaudited balance sheets as of December 31, 2022 |
| ● | Unaudited income statements for the twelve months ending December 31, 2022 |
| ● | The Company’s draft S-1 filing, dated December 27, 2022, which included the Company’s audited financial statements for the twelve months ended March 31, 2021 and March 31, 2022 |
| ● | A financial forecast model prepared by the Company’s management (“Management”), which included quarterly income statements through March 31, 2027 |
| ● | Information regarding the Company’s history and current operations |
| ● | LiveOne’s investor presentation dated January 2023, included within the LiveOne’s Form 8-K |
| ● | Discussions with the Company’s Management |
| ● | Data from Duff & Phelps 2022 Cost of Capital Navigator |
| ● | A Federal Reserve Statistical Release as of the Valuation Date |
| ● | IBISWorld Industry Report OD5987, Internet Radio Broadcasting, February 2022 |
The procedures employed in valuing the Company included such steps that we considered necessary, including (but not limited to):
| ● | An analysis of the general economic environment and industry as of the Valuation Date. |
| ● | Interviews with the management of the Company. |
| ● | An application of appropriate valuation techniques and procedures, including the income and market approaches. |
| ● | An analysis of other pertinent facts and data influencing our conclusion of value. |
There were no restrictions or limitations in the scope of our work or data available for analysis. We made a limited investigation as to the accuracy and completeness of such information and did not verify this information as part of this valuation. Therefore, we express no opinion or another form of assurance regarding the accuracy of such data.
| VALUESCOPE, Inc. |
Mr. Robert Ellin
February 20, 2023
Page 4
CONCLUSION OF VALUE
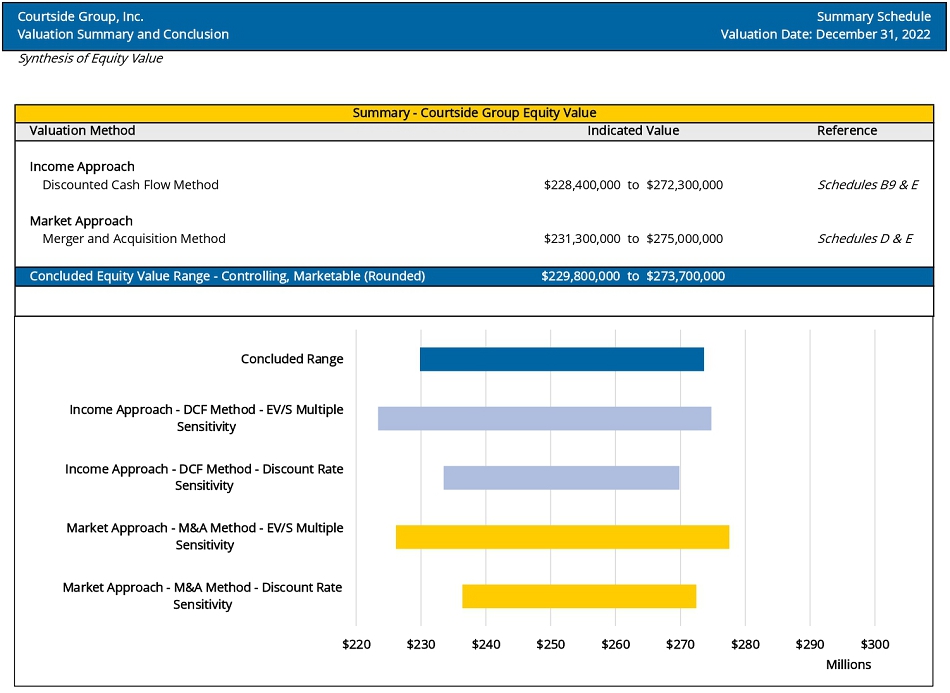
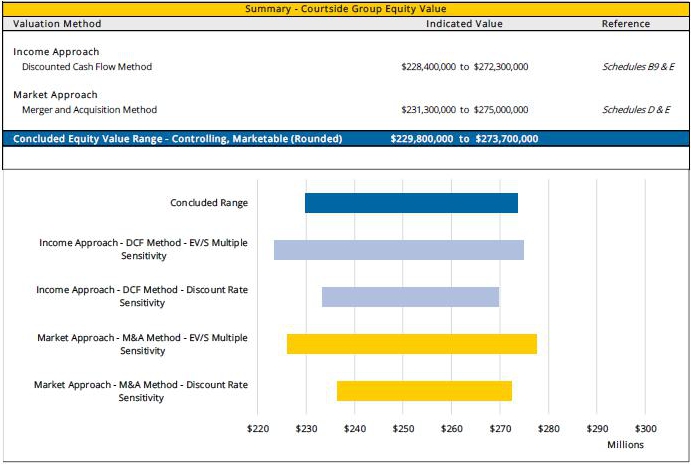
Based on the procedures and corresponding analysis as described in the attached Report, it is our opinion that the fair market value range of Courtside Group, Inc.’s equity, on a controlling, marketable interest basis, as of December 31, 2022, is reasonably stated as:
$229,800,000 to $273,700,000
Our conclusion of value is presented in the following table as well as in the Summary Schedule.
| VALUESCOPE, Inc. |
Mr. Robert Ellin
February 20, 2023
Page 5
We are independent of the Company and have no current or prospective economic interest in the assets that are the subject of this analysis. Our fee for these valuation services was in no way influenced by the results of our analysis. The Assumptions and Limiting Conditions and the Appraisal Certification are important components of this valuation report. Should you have questions regarding this report, please contact Martin Hanan, CFA at 817-481-4900.
| Very truly yours, | |
| /s/ ValueScope, Inc. | |
| ValueScope, Inc. |
| VALUESCOPE, Inc. |
TABLE OF CONTENTS
| ENGAGEMENT OVERVIEW | 1 | |
| Description of the Assignment | 1 | |
| Scope | 1 | |
| Procedures | 1 | |
| COMPANY OVERVIEW | 2 | |
| Description of Courtside Group, Inc | 2 | |
| Financial Position | 3 | |
| ECONOMIC AND INDUSTRY OVERVIEW | 6 | |
| Overview of Internet Radio Broadcasting Industry | 16 | |
| VALUATION METHODOLOGY | 17 | |
| Valuation Approaches | 17 | |
| Valuation Methods | 18 | |
| Summary of the Valuation Approaches and Methods | 18 | |
| FAIR MARKET VALUE DETERMINATION | 19 | |
| Income Approach Analysis | 19 | |
| Market Approach Analysis | 22 | |
| RECONCILIATION OF VALUATION METHODS | 23 | |
| CONCLUSION OF VALUE | 24 | |
| ASSUMPTIONS AND LIMITING CONDITIONS | 25 | |
| VALUATION CERTIFICATION | 30 |
| VALUESCOPE, Inc. |
TABLE OF SCHEDULES AND APPENDICES
| VALUATION SUMMARY AND CONCLUSION | SUMMARY | |
| FINANCIAL STATEMENT ANALYSIS | A | |
| Historical Income Statements | A.1 | |
| Historical Balance Sheets | A.2 | |
| Select Financial and Operating Ratios | A.3 | |
| DISCOUNTED CASH FLOW METHOD | B | |
| Summary of Projection Inputs | B.1 | |
| Projected Income Statements | B.2 | |
| Projected Balance Sheets | B.3 | |
| Projected Capital Expenditures – Economic / Book Schedule | B.4 | |
| Projected Capital Expenditures – Tax Schedule | B.5 | |
| Projected Tax Expenses | B.6 | |
| Pepperdine Cost of Capaital Estimate | B.7 | |
| Weighted Average Cost of Capital | B.8 | |
| Synthesis of Net Cash Flow | B.9 | |
| Review of Podcasting Revenue Growth | B.10 | |
| ANALYSIS OF GUIDELINE COMPANIES | C | |
| MERGER AND ACQUISITION METHOD | D | |
| SENSITIVITY ANALYSIS | E |
| VALUESCOPE, Inc. |
ENGAGEMENT OVERVIEW
DESCRIPTION OF THE ASSIGNMENT
Pursuant to your request, we were retained to perform an independent valuation analysis and prepare a valuation report (the “Report”). This analysis and Report were performed to establish the fair market value range of Courtside Group, Inc. (“Courtside” or the “Company” or the “Subject Interest”) as of December 31, 2022 (the “Valuation Date”).
SCOPE
This Report provides a detailed discussion of the valuation analysis we performed and is divided into seven major sections. The first section outlines the description, scope, and procedures of our analysis. The second section provides a brief description of the Company and the Company’s book value and financial position. The third section includes a discussion of the U.S. economy and the industry in which the Company operates. The fourth section details a discussion of valuation theory and methodology. The fifth section presents our determination of the fair market value of equity. The sixth section provides a reconciliation of the valuation methods used in our analysis. Finally, the seventh section presents our conclusion of value.
PROCEDURES
This valuation analysis was conducted in accordance with generally accepted valuation procedures. These procedures included such substantive valuation tests that we considered necessary and appropriate under the circumstances. We relied upon information received regarding the Company’s operations as a fair reflection and made limited investigation as to the accuracy and completeness of such information. Our analysis was based in part on this information, as well as on other data we researched. A full discussion of the methodologies employed appears in the following sections of this Report.
| VALUESCOPE, Inc. | Page 1 |
COMPANY OVERVIEW
DESCRIPTION OF COURTSIDE GROUP, INC.2
Courtside Group, Inc., operating as “PodcastOne,” is a podcast platform and publisher that makes its content available to audiences via all podcasting distribution platforms, including the Company’s website (www.podcastone.com), Apple Podcasts, Spotify, Amazon Music, and others. The Company is a majority owned subsidiary of LiveOne, Inc., a Delaware corporation and a Nasdaq-listed company (“LiveOne”). In January 2023, Courtside Group was ranked #13 on the list of Top Podcast Publishers by the podcast metric company, Podtrac.
Courtside Group also produces vodcasts (video podcasts), branded podcasts, merchandise, and live events on behalf of their talent and clients. With a 360-degree advertiser solution for multiplatform integration opportunities and hyper-targeting, the Company delivers millions of monthly impressions, monthly unique listeners, and Interactive Advertising Bureau monthly downloads. With content covering all verticals (i.e., sports, entertainment, true-crime, business, society & culture, self-help, etc.), the Company provides a platform for brands to reach their most sought after targeted audiences.
Courtside Group’s operating model is focused on offering white glove service to their shows, talent, and advertising clients. With an in-house sales, production, marketing and tech team, the Company strives to deliver more to clients and talent than any other publisher in the marketplace. This allows Courtside Group to scale their operations while attracting talent who in turn bring in additional brand advertisers and revenue. The Company generates revenue through the sale of embedded host-read ads, dynamic ads (host-read and otherwise), segment sponsorships, and programmatic monetization channels. Courtside Group also provides the opportunity for clients to have 100% share of voice with branded podcast episodes or series as well as live tours, merch, and IP ownership for original programming.
In addition to the Company’s core business, Courtside Group also built, owns, and operates a solution for the growing number of independent podcasters: LaunchPadOne. LaunchPadOne is the Company’s owned self-publishing podcast platform, created to provide a low or no cost tool for independent podcasters without access to parent podcasting networks or state of the art equipment to create and publish shows. LaunchPadOne serves as a talent pool for the Company to find new podcasts and talent.
| 2 | Description of the Company obtained from the Company’s draft S-1 filing, a review of the Company’s website, and discussions with Management |
| VALUESCOPE, Inc. | Page 2 |
COMPANY OVERVIEW
FINANCIAL POSITION
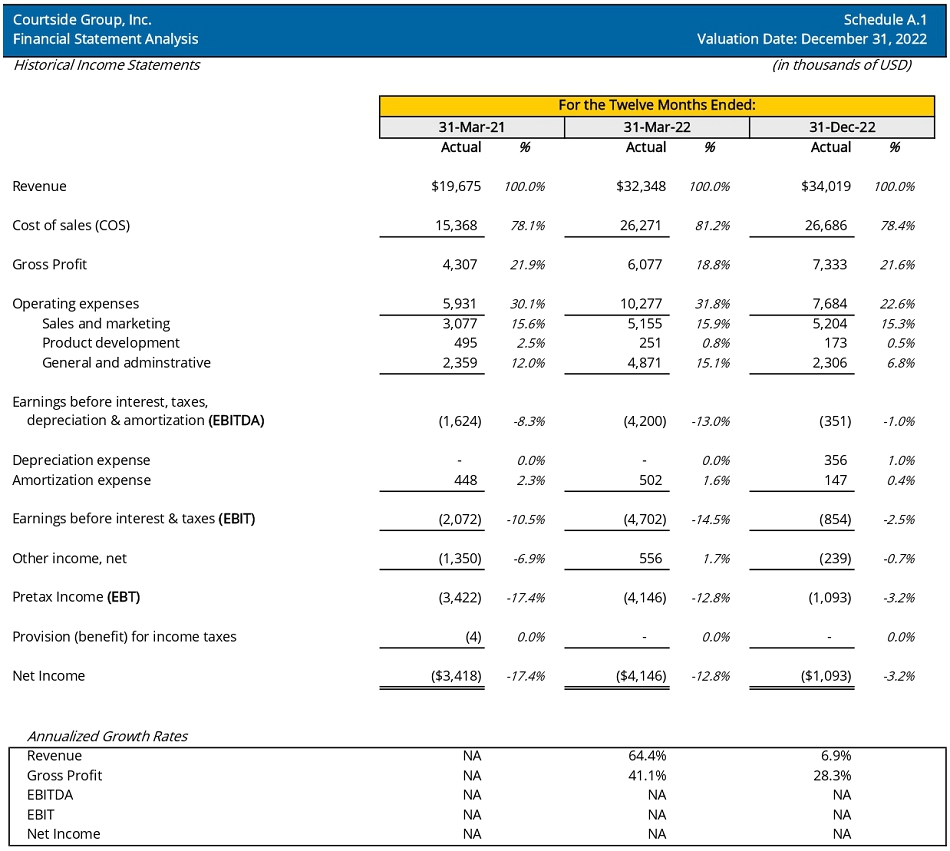
The Company provided unaudited income statements for the twelve months ended December 31, 2022, and audited financial statements for the twelve months ending March 31, 2022 and March 31, 2021, as part of the Company’s draft S-1 filing, (collectively the “Review Period”).
Historical Income Statements
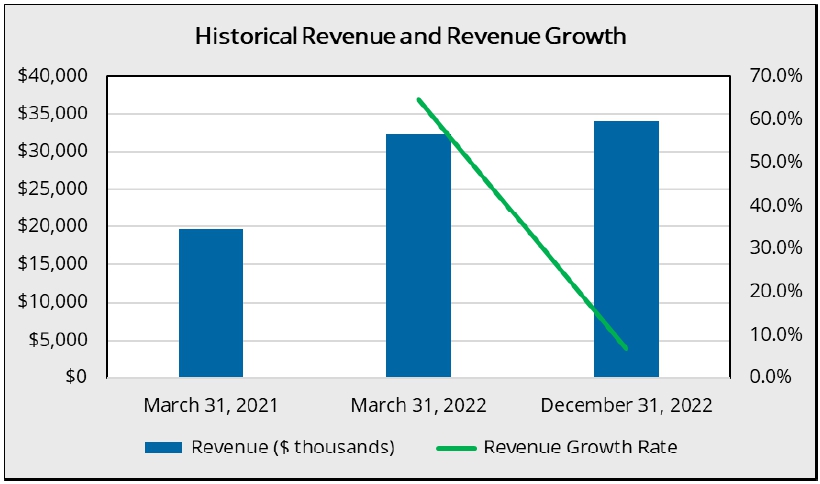
Courtside Group’s revenues increased from $19.7 million for the twelve months ending March 31, 2021 to $34.0 million for the twelve months ending December 31, 2022 (the “TTM” Period). The Company’s historical revenue and revenue growth are presented in the following chart.
The Company’s annual gross margins ranged from 78.1% to 81.2% throughout the Review Period.
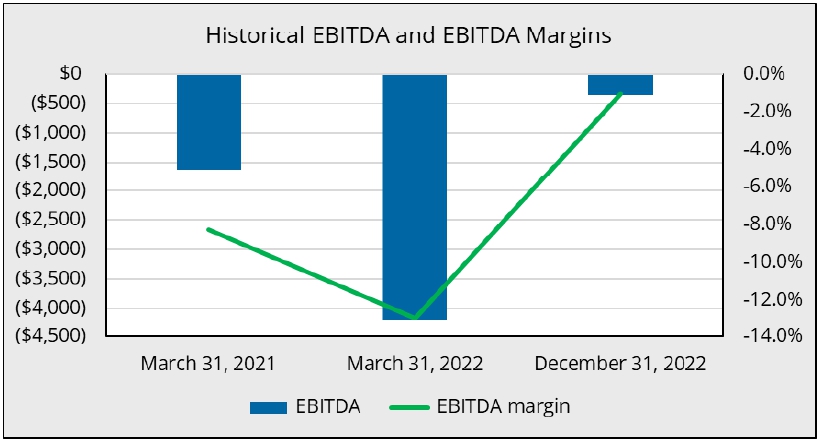
Courtside Group generated a loss of $351k of earnings before interest, taxes, depreciation, and amortization (EBITDA) in the Trailing Twelve Months as of the Valuation Date. The chart below presents the Company’s EBITDA figures and accompanying EBITDA margins throughout the Review Period.
| VALUESCOPE, Inc. | Page 3 |
COMPANY OVERVIEW
The Company’s historical income statements are presented in Schedule A.1.
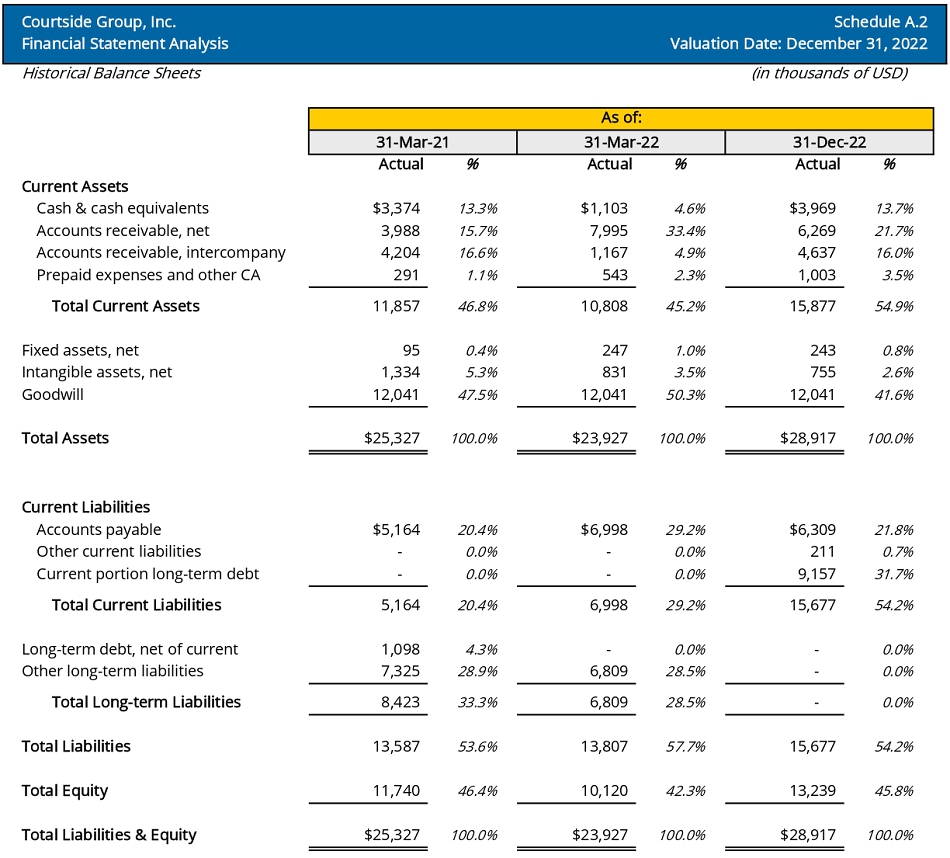
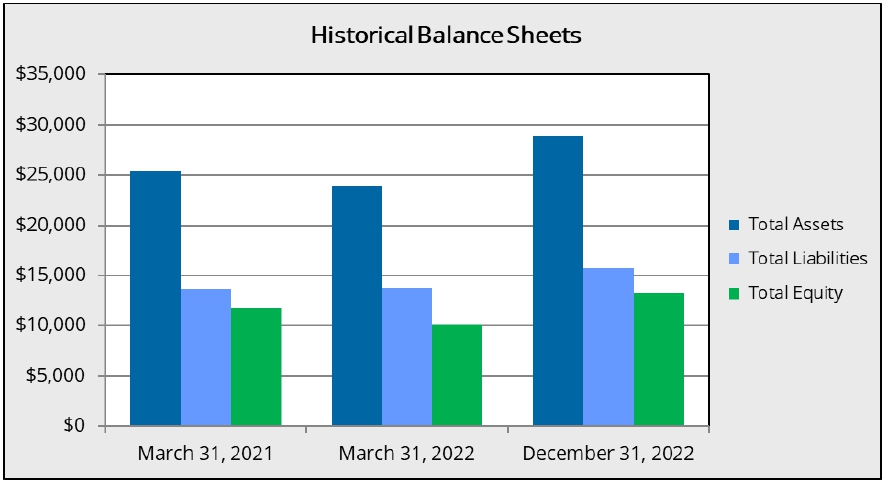
Historical Balance Sheets
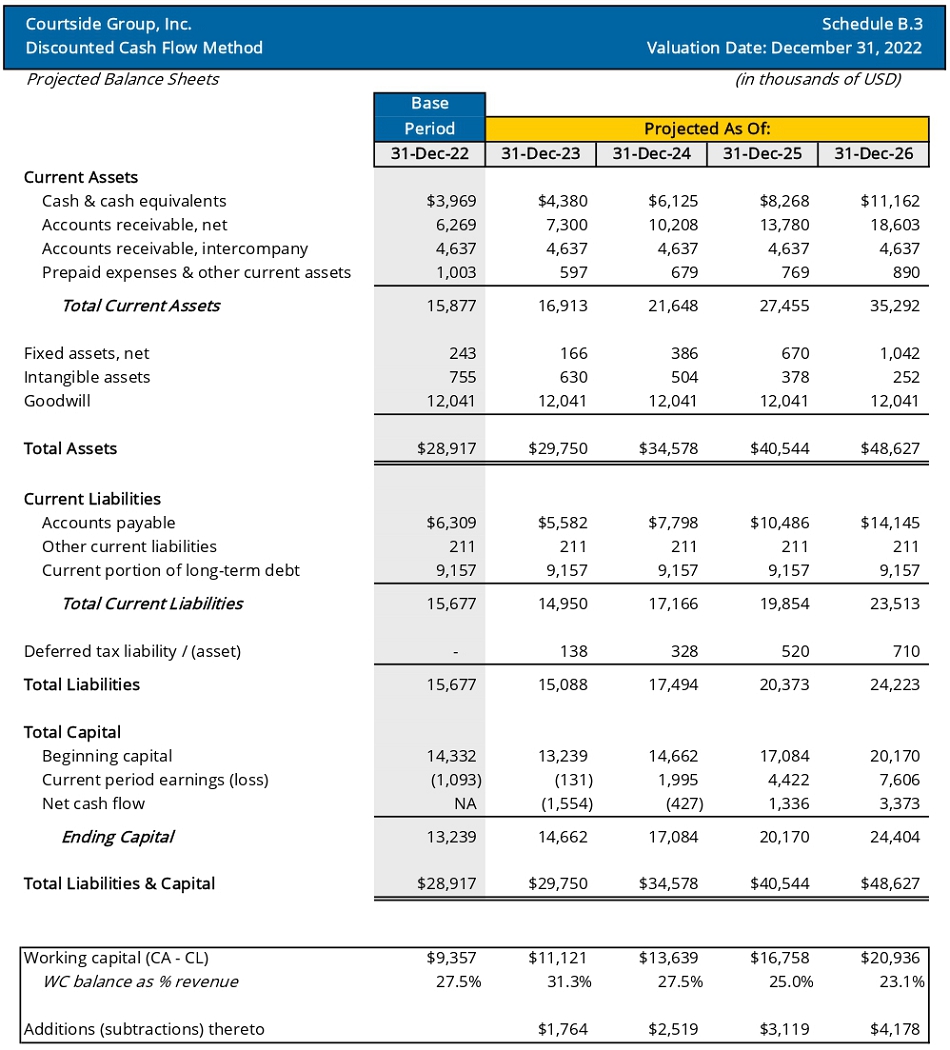
Based on a review of the balance sheet dated December 31, 2022, Courtside Group reported total assets of $28.9 million, including $4.0 million of cash and cash equivalents, $6.3 million of accounts receivable, $4.6 million of intercompany receivables, $1.0 million of prepaid expenses and other current assets, $243k of fixed assets, $755k of intangible assets, and $12.0 million of goodwill. The Company reported total liabilities of $15.7 million. Courtside Group reported $6.3 million of accounts payable, $211k of other current liabilities, and $9.2 million of the current portion of long-term debt. The Company reported $13.2 million of shareholders’ equity on its books as of the Valuation Date. The chart below presents the Company’s balance sheets as of each reporting date throughout the Review Period.
| VALUESCOPE, Inc. | Page 4 |
COMPANY OVERVIEW
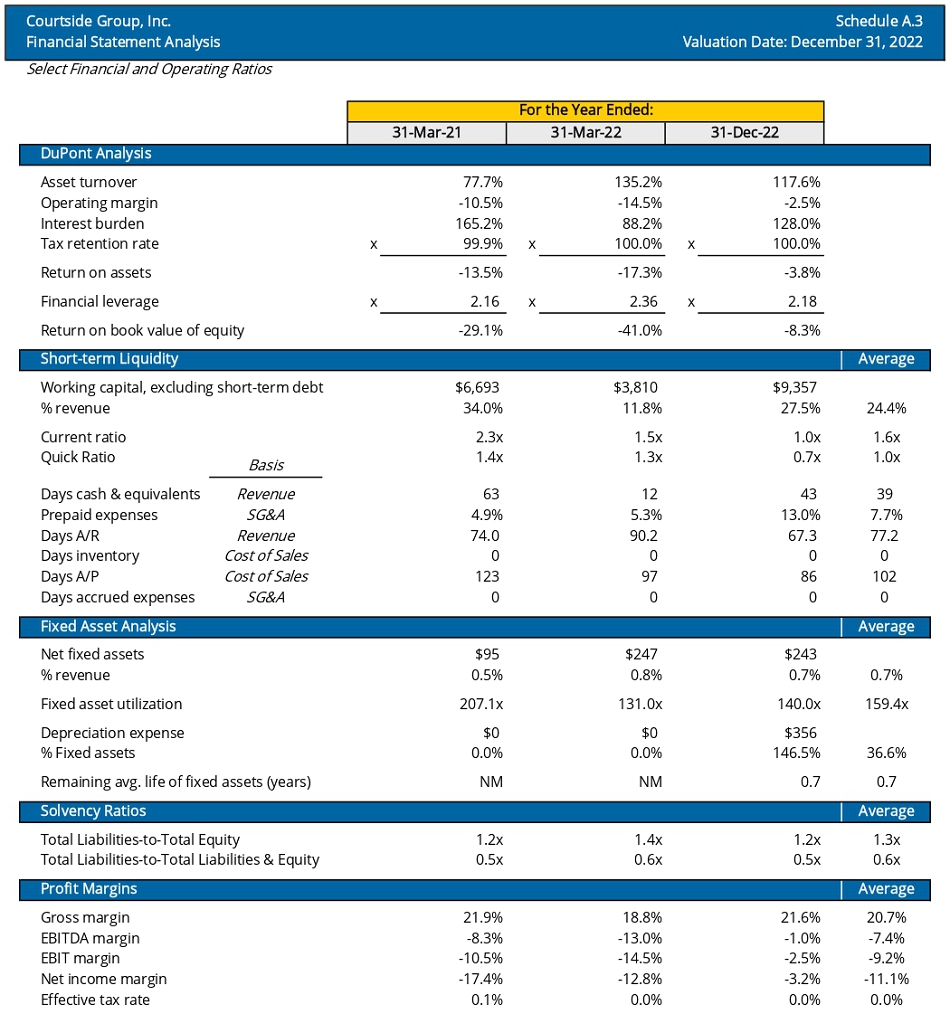
The Company’s balance sheet is presented in Schedule A.2, and the financial and operating ratios are presented in Schedule A.3.
| VALUESCOPE, Inc. | Page 5 |
ECONOMIC AND INDUSTRY OVERVIEW
Third quarter U.S. economic growth turned positive after negative growth in the first two quarters of 2022. Inflation has been displaying more persistence across both the goods and services categories. This has led to an upward revision to the near-term inflation outlook. As an attempt to mitigate the effects of high inflation, the Federal Reserve has continued increasing interest rates although this pace slowed down in December 2022. The US stock markets closed 2022 below their opening prices at the start of the year.
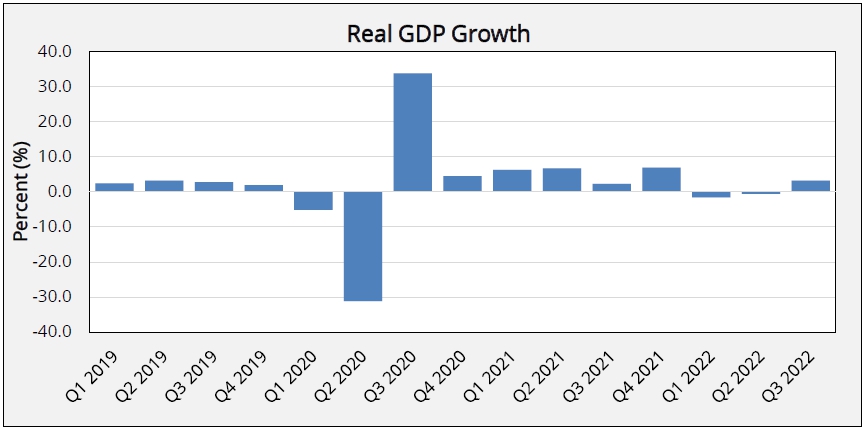
Gross Domestic Product
Real gross domestic product (GDP) increased at an annual rate of 3.2 percent in the third quarter of 2022, following a decrease of 0.6 percent in the second quarter. The increase in real GDP for the third quarter reflected increases in exports, consumer spending, nonresidential fixed investment, state and local government spending, and federal government spending, that were partly offset by decreases in residential fixed investment and private inventory investment. The increase in the third quarter, compared to the second quarter, primarily reflected accelerations in nonresidential fixed investment and consumer spending, a smaller decrease in private inventory investment, and upturns in state and local as well as federal government spending that were partly offset by a larger decrease in residential fixed investment. In the third quarter, private services-producing industries increased 4.9 percent, government increased 0.6 percent, and private goods-producing industries decreased 1.3 percent. The majority of industry groups contributed to the third-quarter increase in real GDP.3
| 3 | U.S. Department of Commerce, Bureau of Economic Analysis, Gross Domestic Product (Third Estimate), GDP by Industry, and Corporate Profits (Revised), 3rd Quarter 2022 and Annual Update. (Release Date: 12/22/2022). |
| VALUESCOPE, Inc. | Page 6 |
ECONOMIC AND INDUSTRY OVERVIEW
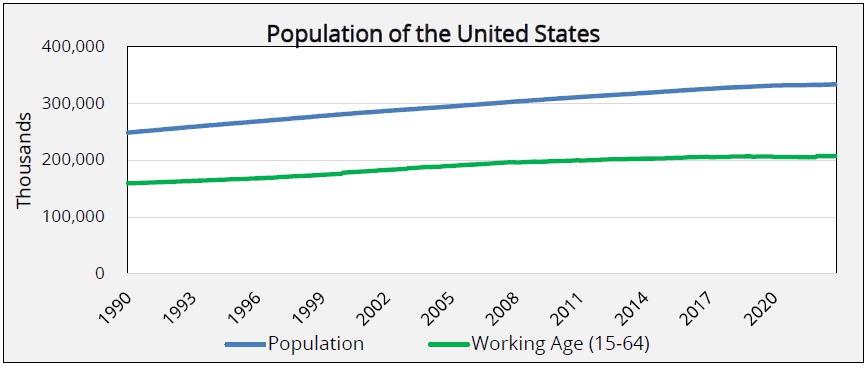
Population
Population growth is an important driver of long-term growth in an economy. The total population decreased from 332.59 million in November 2021 to 332.54 million in November 2022.4 The working-age population (15-64) increased from 205.1 million in November 2021 to 207.2 million in November 2022.5
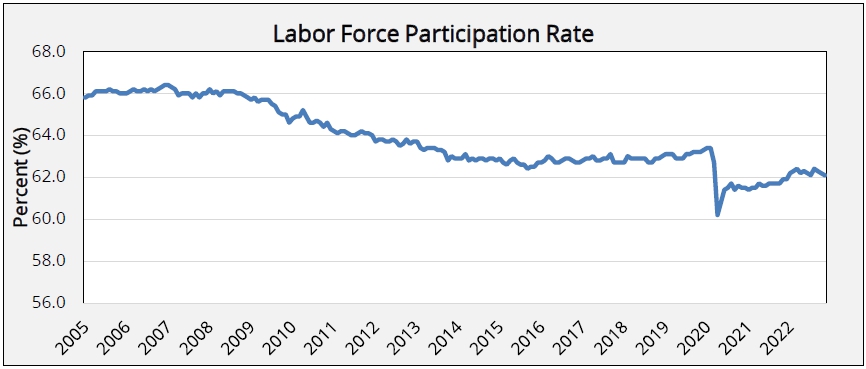
Labor force participation had a sharp decline at the onset of the COVID-19 pandemic. Although it partially recovered in just several months, it has increased only slightly since June 2020. In November 2021, the civilian labor force participation rate was 61.9% and stands at 62.1% as of November 2022.6
| 4 | U.S. Bureau of Economic Analysis, Population [POPTHM], retrieved from FRED, Federal Reserve Bank of St. Louis, last accessed January 4, 2023. |
| 5 | Organization for Economic Co-operation and Development, Working Age Population: Aged 15-64: All Persons for the United States [LFWA64TTUSM647N], retrieved from FRED, Federal Reserve Bank of St. Louis, last accessed January 4, 2023. |
| 6 | U.S. Bureau of Labor Statistics, Civilian Labor Force Participation Rate [CIVPART], retrieved from FRED, Federal Reserve Bank of St. Louis, last accessed January 4, 2023. |
| VALUESCOPE, Inc. | Page 7 |
ECONOMIC AND INDUSTRY OVERVIEW
Employment
Nonfarm payroll employment, according to the Bureau of Labor Statistics (BLS), rose by 263,000 in November 2022 and the unemployment rate remained unchanged at 3.7%. Notable job gains occurred in leisure and hospitality, healthcare, and government. Employment declined in retail trade and in transportation and warehousing.
The U6 unemployment rate, which includes all marginally attached workers and those employed part-time for economic reasons, has declined from 7.7% in November 2021 to 6.7% in November 2022.7
| 7 | U.S. Bureau of Labor Statistics, Total unemployed, plus all marginally attached workers plus total employed part time for economic reasons [U6RATE], Civilian Unemployment Rate [UNRATE], retrieved from FRED, Federal Reserve Bank of St. Louis, last accessed January 4, 2023. |
| VALUESCOPE, Inc. | Page 8 |
ECONOMIC AND INDUSTRY OVERVIEW
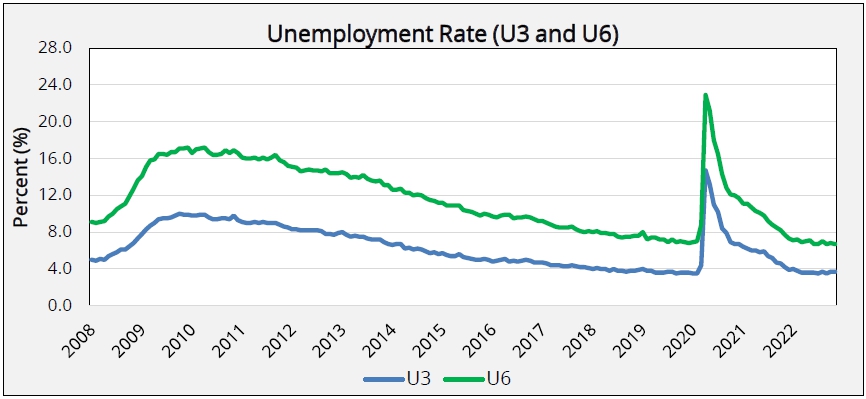
Forecasters surveyed by the Federal Reserve Bank of Philadelphia predicted the unemployment rate will increase from 3.7% in 2022 to 4.2% in 2023 and remain little changed over the following two years.8
| 8 | Federal Reserve Bank of Philadelphia, Survey of Professional Forecasters, November 14, 2022. |
| VALUESCOPE, Inc. | Page 9 |
ECONOMIC AND INDUSTRY OVERVIEW
Inflation
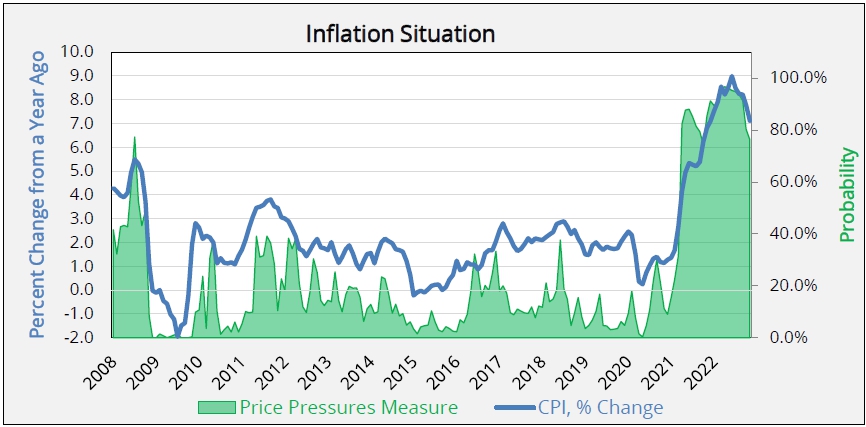
According to the BLS, the Consumer Price Index for All Urban Consumers (CPI-U) increased 0.1 percent in November on a seasonally adjusted basis, after increasing 0.4 percent in October. Over the last 12 months, the all items index increased 7.1 percent before seasonal adjustment. The index for shelter was by far the largest contributor to the monthly all items increase, more than offsetting decreases in energy indexes. The food index increased 0.5 percent over the month with the food at home index also rising 0.5 percent. The energy index decreased 1.6 percent over the month as the gasoline index, the natural gas index, and the electricity index all declined.9 The price pressures measure estimates the probability that the personal consumption expenditures price index inflation rate will exceed 2.5% over the next twelve months. This price pressures measure has increased dramatically since April 2021, increasing from 74.2% as of October 2021 to 96.6% in April 2022, and declined to 76.3% in November 202210. The forecasters predict current-quarter headline CPI inflation will average 5.4 percent at an annual rate, up from the forecast of 4.3 percent in the last survey11.
| 9 | United States Department of Labor, Bureau of Labor Statistics, Consumer Price Index: November 2022, (Last Modified Date: December 13, 2022) |
| 10 | Federal Reserve Bank of St. Louis, Price Pressures Measure [STLPPM], retrieved from FRED, Federal Reserve Bank of St. Louis, last accessed January 5. 2023. |
| 11 | Federal Reserve Bank of Philadelphia, Survey of Professional Forecasters, November 14, 2022. |
| VALUESCOPE, Inc. | Page 10 |
ECONOMIC AND INDUSTRY OVERVIEW
Interest Rates
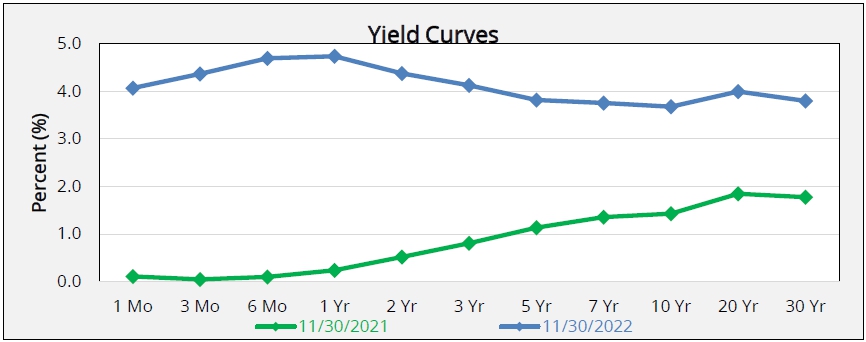
The interest rate on the three-month Treasury bill increased from 0.06% as of December 31, 2021, to 4.30% as of December 30, 2022.12 The interest rate on the ten-year Treasury note increased from 1.52% to 3.88% over the same period.13
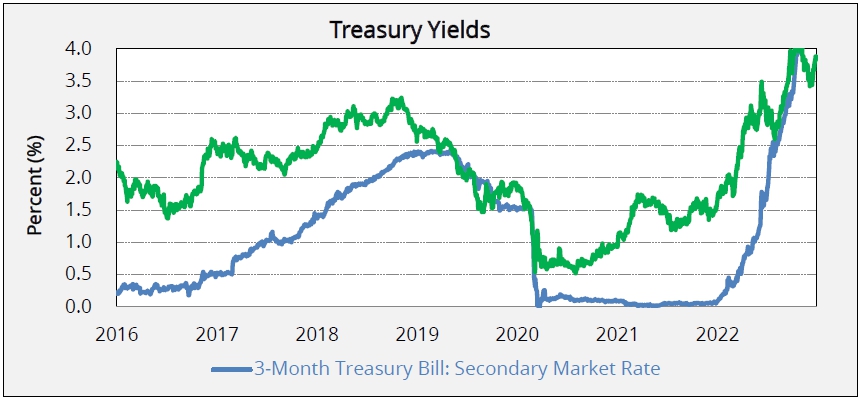
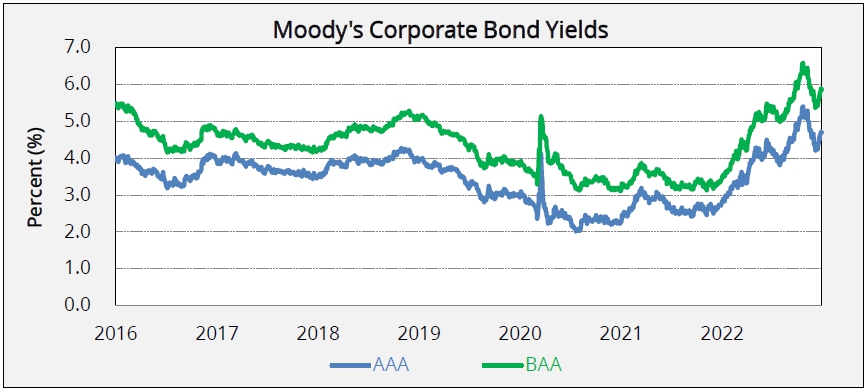
The interest rate on Moody’s Aaa-rated corporate bonds increased from 2.71% as of December 30, 2021 to 4.70% as of December 30, 2022.14 The interest rate on the Moody’s Baa-rated corporate bonds increased from 3.37% to 5.87% over the same period.15
| 12 | Board of Governors Federal Reserve System, 3-Month Treasury Bill: Secondary Market Rate [DTB3MS], retrieved from FRED, Federal Reserve Bank of St. Louis, last accessed January 5, 2023. |
| 13 | Board of Governors Federal Reserve System, 10-Year Treasury Constant Maturity Rate [DGS10], retrieved from FRED, Federal Reserve Bank of St. Louis, last accessed January 5, 2023. |
| 14 | Moody’s, Moody’s Seasoned Aaa Corporate Bond Yield© [DAAA], Moody’s Seasoned Aaa Corporate Bond Yield© [DAAA], retrieved from FRED, Federal Reserve Bank of St. Louis, last January 5, 2023. |
| 15 | Moody’s, Moody’s Seasoned Baa Corporate Bond Yield© [BAAA], Moody’s Seasoned Baa Corporate Bond Yield© [DBAA], retrieved from FRED, Federal Reserve Bank of St. Louis, last accessed January 5, 2023. |
| VALUESCOPE, Inc. | Page 11 |
ECONOMIC AND INDUSTRY OVERVIEW
The yield curve has flattened over the past twelve months as the spread between the twenty-year Treasury Bond and the one-year Treasury Bill decreased from 1.55% as of December 31, 2021, to negative 0.59% as of December 30, 2022.16
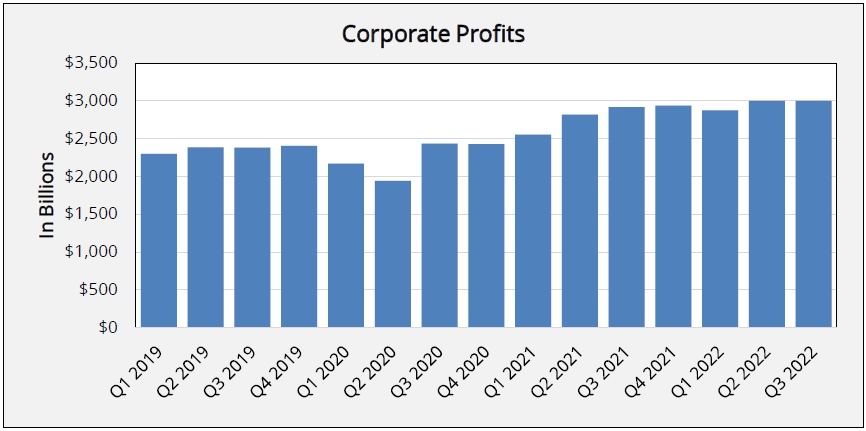
Corporate Profits
According to the BEA, profits from current production (corporate profits with inventory valuation and capital consumption adjustments) decreased $1.3 billion in the third quarter in contrast to an increase $128.6 billion in the second quarter.17
| 16 | U.S. Department of the Treasury, Daily Treasury Yield Curve Rates, last accessed January 5, 2023. |
| 17 | U.S. Department of Commerce, Bureau of Economic Analysis, Gross Domestic Product (Third Estimate), GDP by Industry, and Corporate Profits (Revised), 3rd Quarter 2022 and Annual Update. (Release Date: 12/22/2022) |
| VALUESCOPE, Inc. | Page 12 |
ECONOMIC AND INDUSTRY OVERVIEW
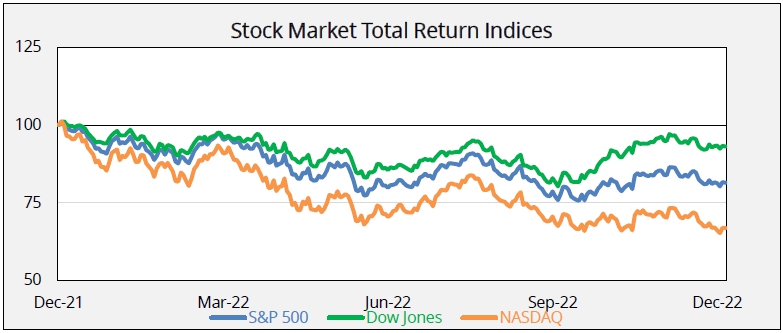
Stock Markets
The stock markets declined from December 31, 2021 to December 30, 2022. The S&P 500 Total Return18 Index closed at 8,761.59 on December 31, 2021 and closed lower at 7,138.77 on December 30, 2022. The Dow Jones Industrial Average Total Return Index closed at 85,602.9 on December 31, 2021 and closed lower at 79,728.48 on December 30, 2022. The NASDAQ Composite Total Return Index closed at 15,644.97 on December 31, 2021 and closed lower at 10,466.48 on December 30, 2022.19 In the graph below, the December 30, 2021, values were set to 100.
| 18 | Total return indices include returns from both income and capital gains. |
| 19 | S&P Capital IQ Database, last accessed January 10, 2023. |
| VALUESCOPE, Inc. | Page 13 |
ECONOMIC AND INDUSTRY OVERVIEW
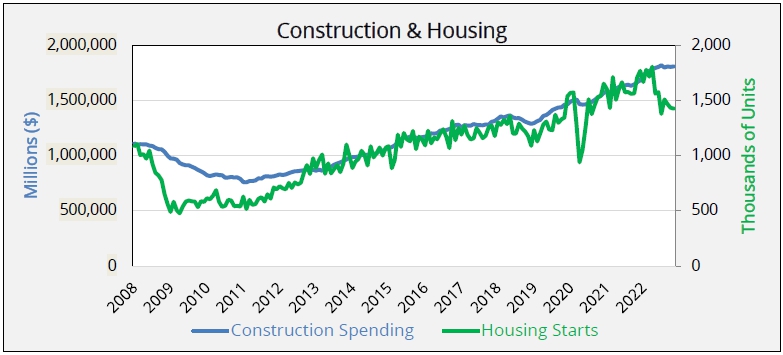
Construction & Housing Starts
Construction spending and housing starts are two other important indicators for the economy. Construction spending may indicate the sentiment in real estate markets and the soundness of the economy while housing starts are an alternative indicator of consumer sentiment. Increases in demand for newly constructed homes can lead to job growth in the construction industry, increased demand for appliances and furniture, and have ripple effects throughout the economy. Housing starts decreased from 1.706 million units in November 2021 to 1.5427 million units in November 2022.20 Construction spending, a seasonally adjusted annual figure, increased from $1.67 trillion in November 2021 to $1.81 trillion in November 2022.21
| 20 | U.S. Census Bureau and U.S. Department of Housing and Urban Development, Housing Starts, New Privately-Owned Housing Units Started [HOUST], retrieved from FRED, Federal Reserve Bank of St. Louis, last accessed January 5, 2023. |
| 21 | U.S. Census Bureau, Total Construction Spending, Seasonally Adjusted Annual Rate [TTLCONS], retrieved from FRED, Federal Reserve Bank of St. Louis, last accessed January 5, 2023. |
| VALUESCOPE, Inc. | Page 14 |
ECONOMIC AND INDUSTRY OVERVIEW
Consumer Confidence
The University of Michigan Survey of Consumers reported that the Index of Consumer Sentiment has decreased significantly since the post-COVID high of 88.3 in April 2021, coming in at 56.8 in November 2022.22 The index remains significantly lower than the December 2019 (pre-COVID) value of 99.3. The index is based on a survey of consumer perceptions of present economic conditions and expectations of future conditions. The survey is based on a sample of 500 phone interviews consisting of 50 core questions conducted across the continental U.S. This is considered a leading indicator of future consumer expenditures and economic activity.
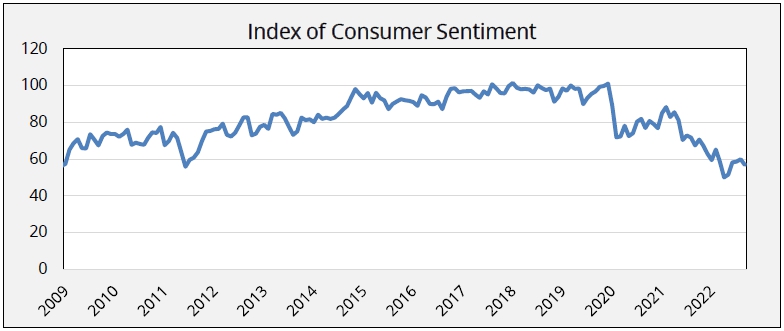
| 22 | University of Michigan, Surveys of Consumers, November 2022 |
| VALUESCOPE, Inc. | Page 15 |
ECONOMIC AND INDUSTRY OVERVIEW
OVERVIEW OF INTERNET RADIO BROADCASTING INDUSTRY23
Executive Summary
The Internet Radio Broadcasting industry has experienced strong growth since 2017 due to rising use of smart speakers and internet-connected mobile devices. The industry includes two main revenue sources: the online advertising revenue of established terrestrial (over-the-air) radio stations, and recommendation-based streaming platforms, such as Pandora. It does not include on-demand streaming platforms, such as Spotify, that provide users full control over their music selections. Such streaming platforms have presented a growing source of competition for the industry over the past five years. Yet, online listenership has grown as a share of traditional radio broadcasters’ audience, with advertising dollars following. As a result, over the five years to 2022, industry revenue is estimated to increase at an annualized rate of 14.9% to $5.0 billion, including a projected rise of 4.5% in 2022 alone. Furthermore, the industry was notably unaffected by the COVID-19 (coronavirus) pandemic’s adverse effect on the economy, as a higher percentage of people staying at home and conducting business online resulted in rising online radio subscription numbers.
It is notable that the industry’s growth, particularly in recent years, has stemmed mostly from increased online streaming of terrestrial radio stations. Radio has maintained modest but steady ad sales growth over the past five years, but the market is highly saturated. As a result, in many ways the industry’s growth should be viewed as a fast- growing segment of a mature industry. The 2018 bankruptcy of iHeartMedia underscores the fact that online radio’s growth has not necessarily resulted from overall audience and revenue growth at the companies participating in the industry.
Over the next five years, the industry is anticipated to continue growing, albeit at a slower rate as the online radio market begins to approach maturity. The industry competes with corporate- and investor-backed on-demand streaming services that are able to sacrifice short-term profit for long-term gains in market share, and this dynamic is only expected to be exacerbated over the next five years. During the period, industry revenue is projected to increase at an annualized rate of 6.4% to $6.8 billion.
Analyst Insights
Podcast participation
2020, as the COVID-19 (coronavirus) pandemic boosted the number of listeners seeking at-home entertainment, Sirius XM Radio Inc. (Sirius XM) invested heavily in podcasts and podcast infrastructure. In June, the company acquired the podcast-management system Simplecast for $28 million, which would operate in tandem with its AdsWizz Inc. subsidiary; that brand works help provide analytics and connections to advertisers to help monetize podcasts more efficiently. In October, it acquired podcast producer and distributor Stitcher (owner popular brand Earwolf) for $302 million from The E.W. Scripps Company.
Interest in podcasts heats up
iHeartMedia Inc. (iHeartMedia) is the largest commercial podcast publisher, with a unique monthly US audience of 33.4 million and 430.4 million global downloads and streams in February 2022, according to Podtrac. Podcasting generated $252.6 million in revenue for the company in 2021, up 148.4% from 2020. Despite extremely rapid growth in consumer demand for podcasts, the organization is experiencing a tremendous increase in competition for attracting and retaining audiences as many businesses are seeking to capture a segment of the quickly growing market.
| 23 | IBISWorld Industry Report OD5987, Internet Radio Broadcasting, February 2022 |
| VALUESCOPE, Inc. | Page 16 |
VALUATION METHODOLOGY
There are three conceptually distinct methodologies that can be applied to estimate indications of value of a business or asset: (a) the income approach, (b) the market approach, and (c) the cost approach.
VALUATION APPROACHES
Income Approach
The income approach quantifies the present value of anticipated future income generated by a business or an asset. Forecasts of future income require analyses of variables that influence income, such as revenues, expenses, and taxes. One form of the income approach, the discounted cash flow (DCF) method, defines future economic income as net cash flow and considers not only the profit-generating abilities of a business but also the investment in capital equipment and working capital required to sustain the projected net cash flow. The forecasted net cash flow is then discounted to present value using an appropriate rate of return or discount rate. The income approach is unique in its ability to account for the specific contribution to the overall value of various factors of production.
Market Approach
The market approach considers the implied pricing in third-party transactions of comparable businesses or assets. Transactions are analyzed to identify pricing patterns or trends that can be used to infer value on the subject business or asset. Adjustments are made to the transaction data to account for relative differences between the subject and the comparable transactions. The primary strength of the market approach is that it offers relatively objective pricing evidence from the market at large and, aside from certain adjustments to the transaction data, requires few assumptions to be made. The market approach is most applicable to highly homogeneous assets or businesses for which a ready market exists.
Cost Approach
The cost approach considers replacement cost as the primary indicator of value. The cost approach is based on the reasoning that a prudent investor would not pay more for the subject business or an asset than the cost to the investor to replace or re-create it. Historical cost data is often used to indicate the current cost of replacement or re-creation, with certain adjustments made for physical deterioration or obsolescence. Like the market approach, the cost approach makes fewer assumptions than the income approach, but the primary limitation inherent in the cost approach is its inability to capture the value of many categories of intangible assets.
| VALUESCOPE, Inc. | Page 17 |
VALUATION METHODOLOGY
VALUATION METHODS
The following are common valuation methods used under the three approaches:
| A. | Income Approach |
| 1. | Discounted Cash Flow Method (multi-period model) |
| 2. | Direct Capitalization Method (single-period model) |
| 3. | Excess Earnings Method |
| B. | Market Approach |
| 1. | Guideline Public Company Method |
| 2. | Merger and Acquisition Method |
| C. | Cost Approach |
| 1. | Reproduction Cost |
| 2. | Replacement Cost |
SUMMARY OF THE VALUATION APPROACHES AND METHODS
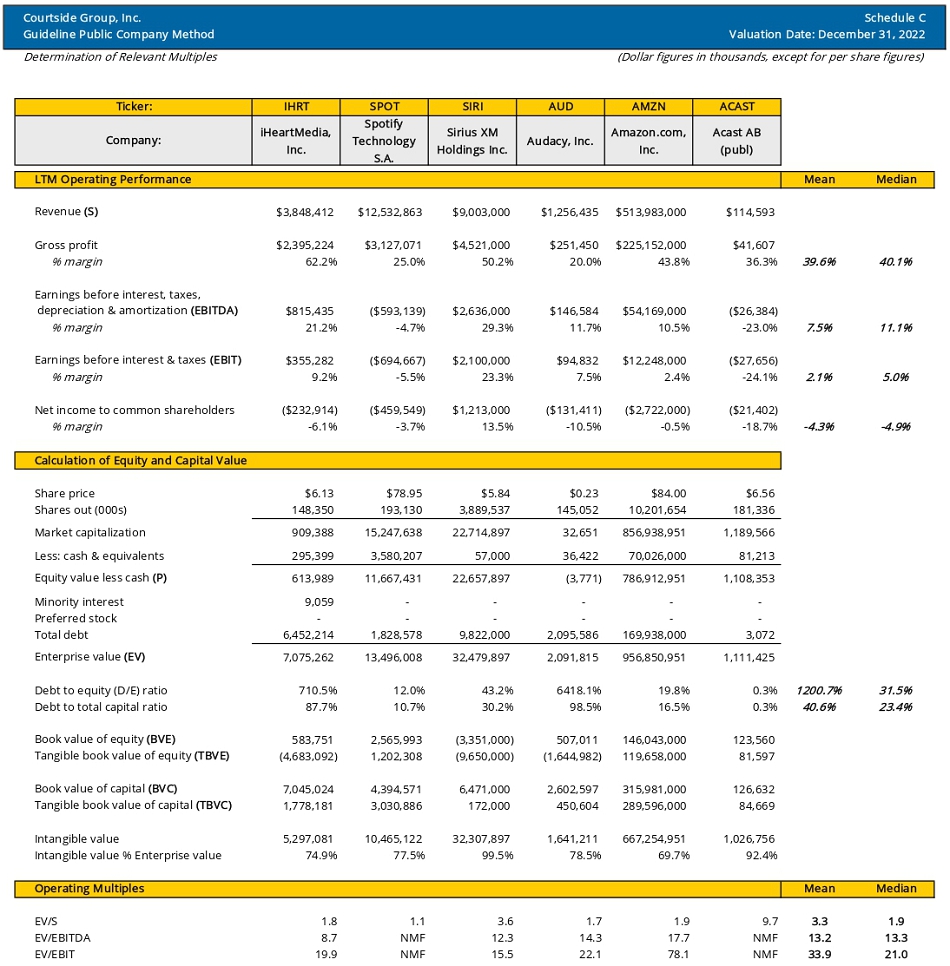
In our valuation of the Company, we considered all three approaches to value. Under the income approach, we utilized the DCF method. Under the market approach, we utilized the transaction method. We did not utilize the guideline public company method due to the lack of pure play guideline public companies. We considered and rejected the cost approach for the valuation of the Company because this approach tends to misstate the fundamental economic value of an ongoing business enterprise.
| VALUESCOPE, Inc. | Page 18 |
FAIR MARKET VALUE DETERMINATION
INCOME APPROACH ANALYSIS
The income approach estimates the fair market value of a company based on the earnings, cash flow, and dividend-paying capacity of the company. The approach evaluates the present worth of the future economic benefits that accrue to the investors in a business. These benefits are discounted to present value at a rate of return that is commensurate with the company’s risk. This present value determines the fair market value of a business.
Discounted Cash Flow Method
We developed a DCF model to arrive at the Company’s market value of invested capital (MVIC) as of the Valuation Date. The DCF method first projects the cash flow the business is expected to produce over a discrete period. Then, each discrete cash flow is discounted to a present value at a rate that reflects the risk of receiving that amount at the time anticipated in the projection. To better reflect these projections, items such as revenue, operating costs, capital expenses, and working capital were forecasted. These projections were used to determine the net cash flow generated by the business, which was then discounted to the present value, using an appropriate discount rate. Total cash and cash equivalents, if any, is then subtracted from the MVIC to arrive at the value of the business enterprise.
Financial Projections
Projected financials were developed based on Management’s projections, market industry data, and an analysis of the Company’s historical operating performance.
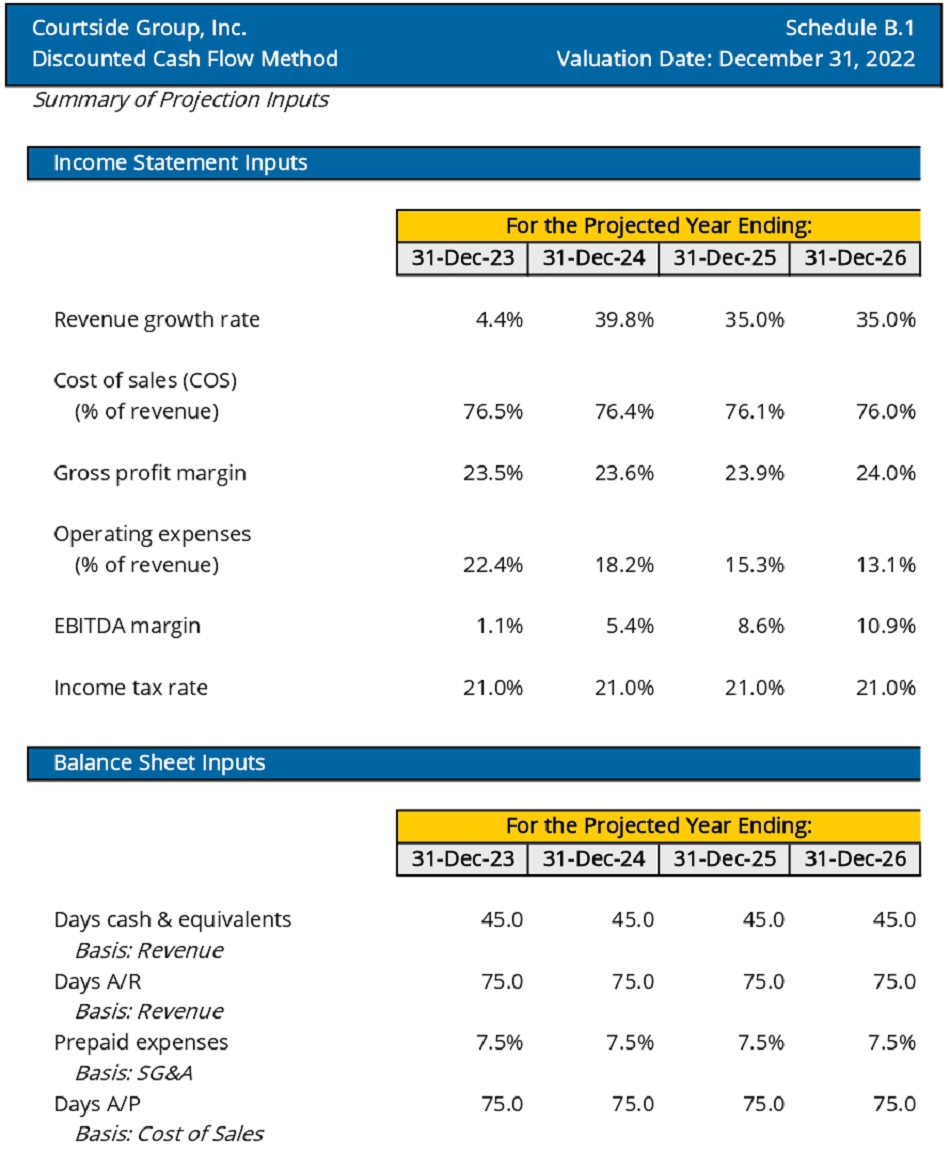
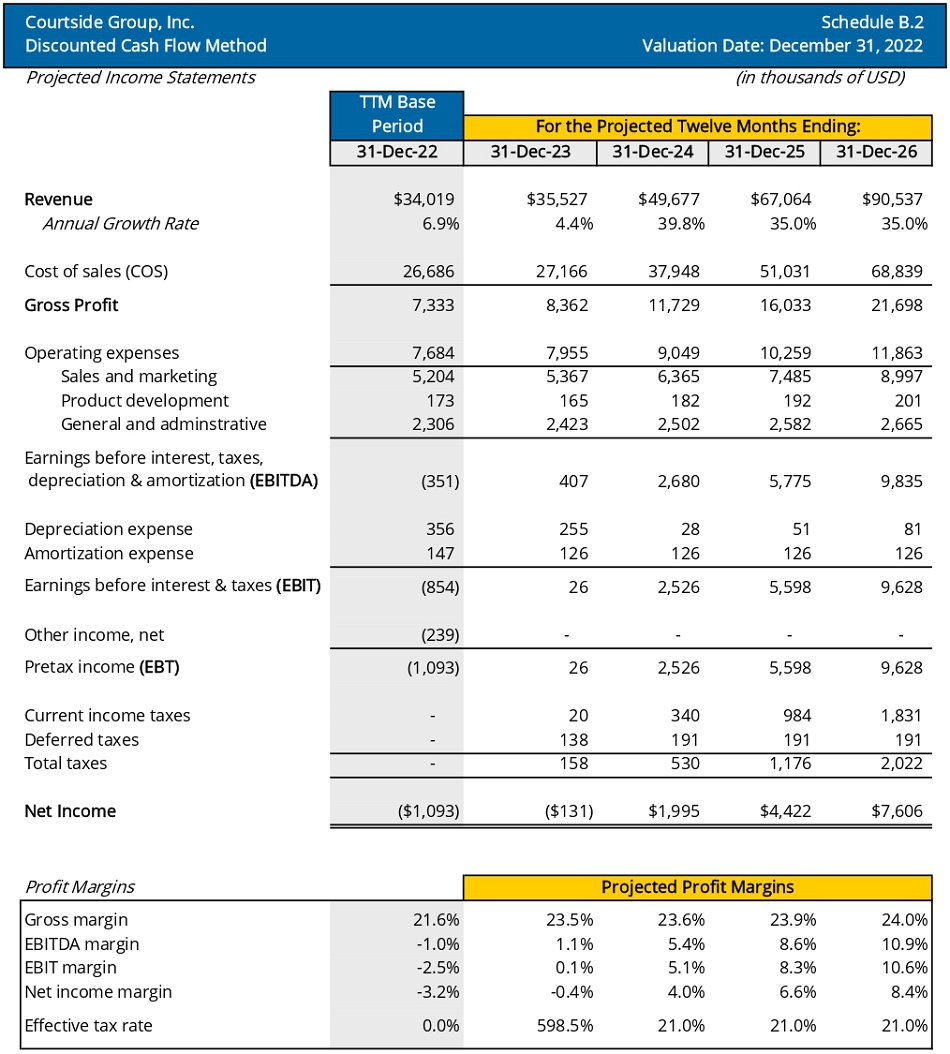
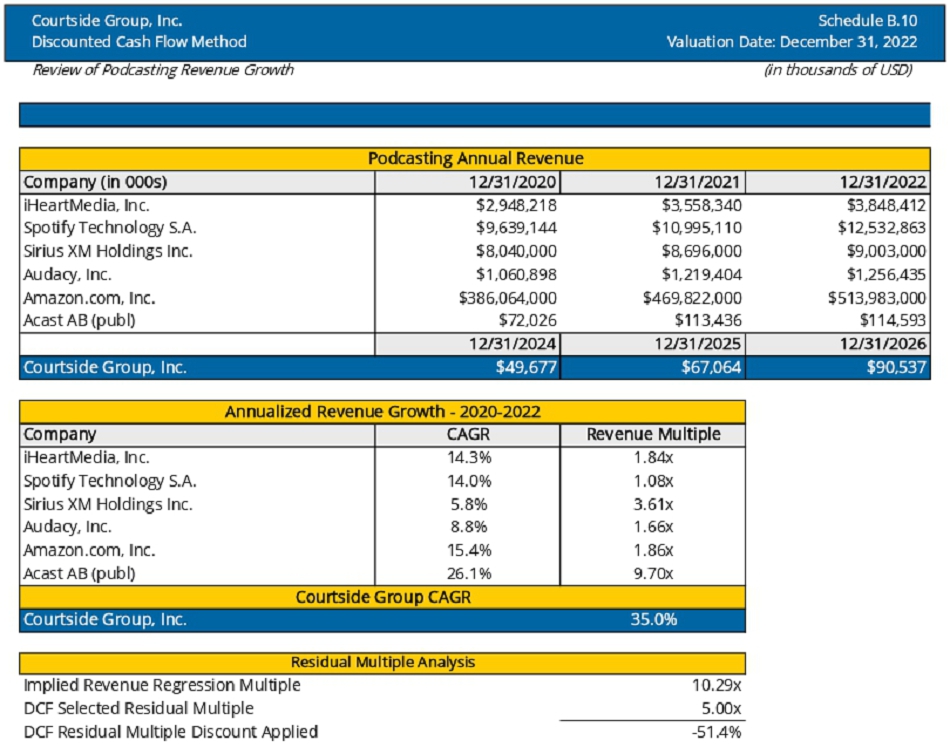
Based on Management’s projections, projected revenue growth was 4.4% for the twelve months ending December 31, 2023. Revenue was projected to grow at 39.8%, 35.0%, and 35.0% in 2024, 2025, and 2026, respectively.
Cost of sales (COS) as a percentage of revenue was projected at 76.5% for the twelve months ending December 31, 2023. We projected cost of sales as a percentage of revenue to decrease to 76.0% of revenue for the twelve months ending December 31, 2026.
Operating expenses were projected based on three categories: sales and marketing, product development, and general and administrative. Sales and marketing expenses were projected to increase at a decreasing rate from 15.1% of projected 2023 revenues to 9.9% of projected 2026 revenues. Product development expenses were projected to increase at a decreasing rate from 0.5% of projected 2023 revenues to 0.2% of projected 2023 revenues. General and administrative expenses were projected to increase at a decreasing rate from 6.8% of projected 2023 revenues to 2.9% of projected 2026 revenues.
| VALUESCOPE, Inc. | Page 19 |
FAIR MARKET VALUE DETERMINATION
Put together, our projected EBITDA margin for the Company increases from 1.1% of projected revenues in 2023 to 10.9% of projected revenues in 2026. These figures are consistent with the median guideline public company EBITDA margin of 11.1%. The projected income statement inputs and income statements are presented in Schedules B.1 and Schedule B.2, respectively.
Working capital projections are based on normalized current and average operating multiples involving current assets and liabilities and compared with industry data. Working capital projections represent 23.1% to 31.3% of projected revenues. The projection inputs for working capital and the projected balance sheets from which working capital projections are derived are presented in Schedules B.1 and B.3, respectively.
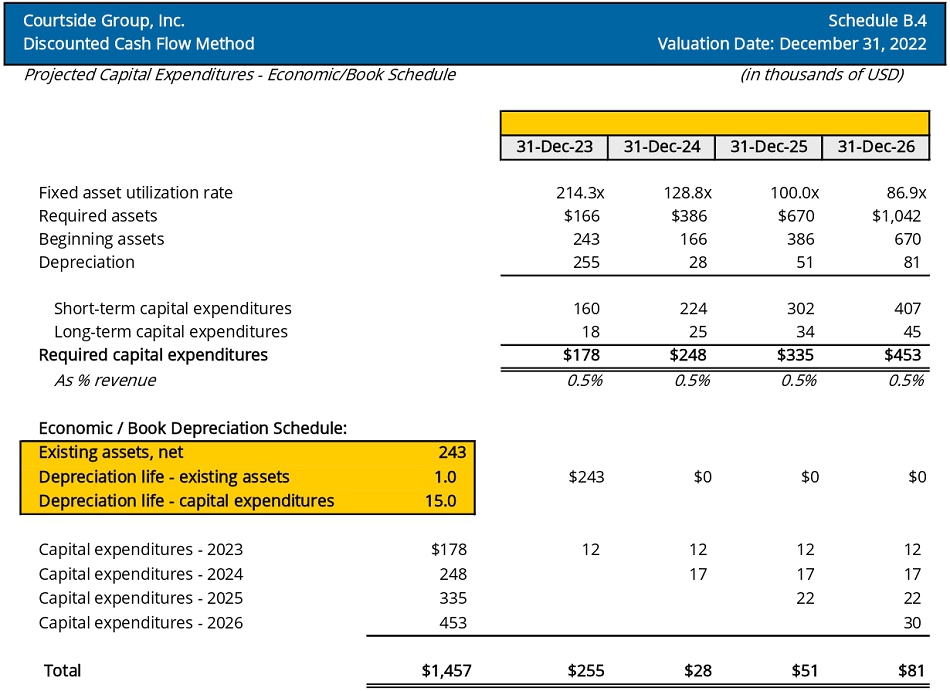
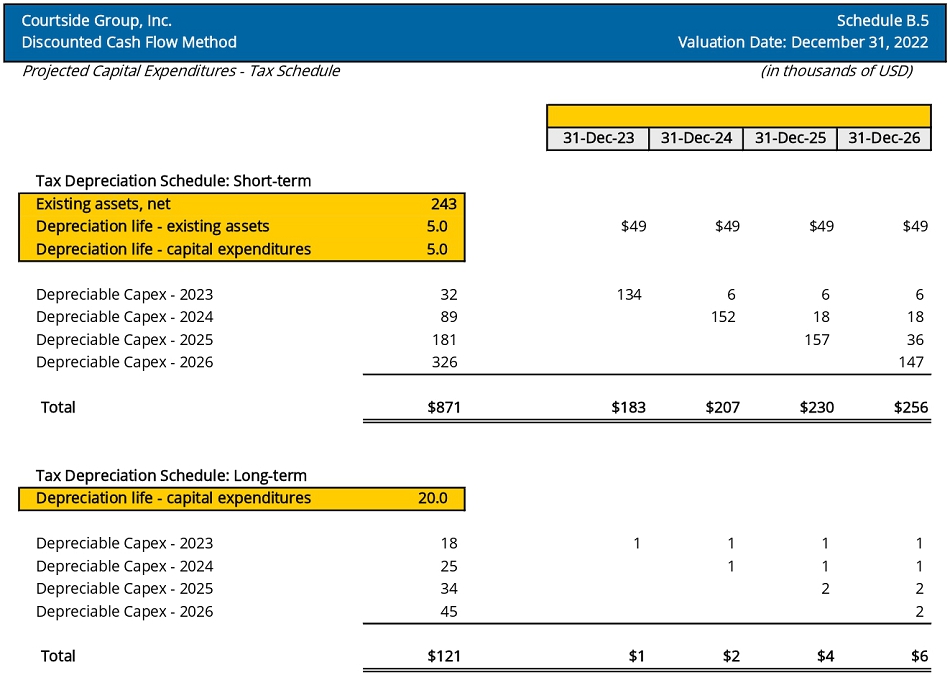
Capital expenditures were projected to be 0.5% of revenues, ranging from approximately $178k to $453k per year through 2026. The Company does not invest heavily in fixed assets. In determining the projections for depreciation for the Company, we assumed all capital expenditures would be depreciated for book purposes utilizing the straight-line method with a fifteen-year life expectancy. Tax depreciation of short-term capital expenditures are expensed over five years. Long-term capital expenditures are assumed to have a twenty-year life for purposes of calculating tax depreciation. The projections for capital expenditures and depreciation are presented in Schedules B.4 and B.5.
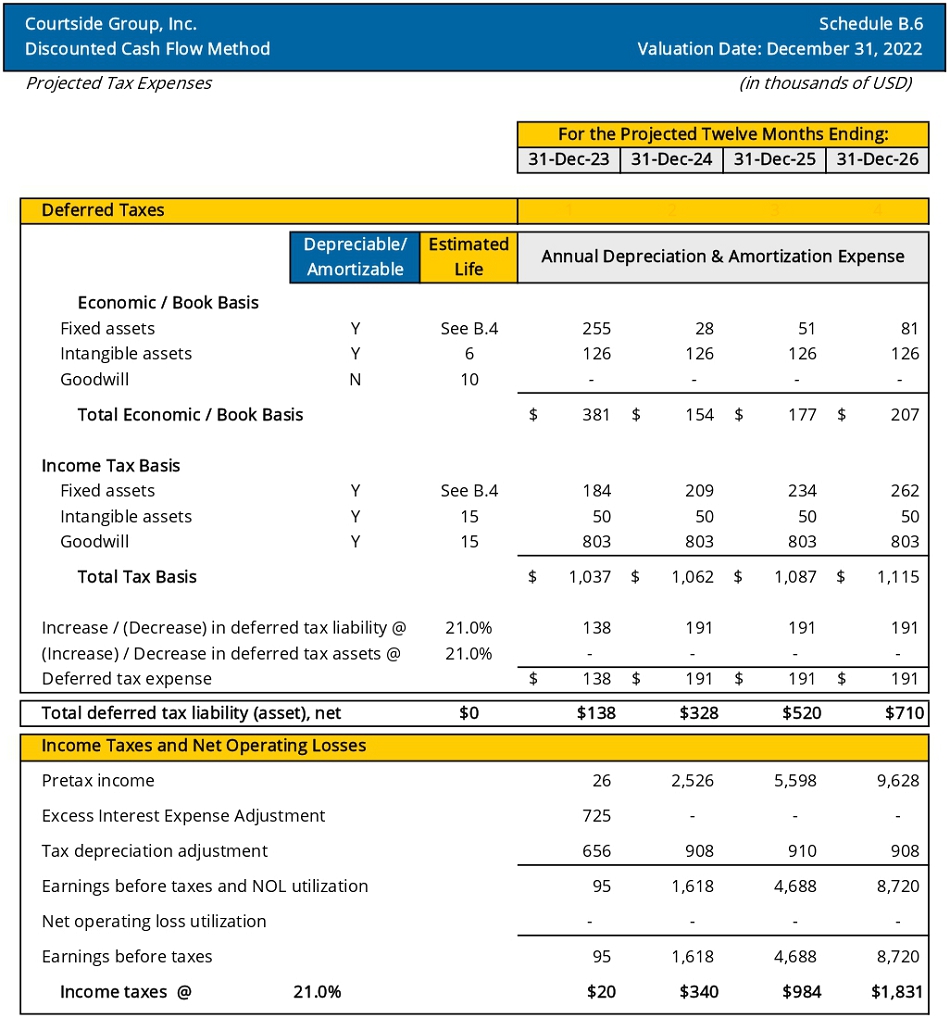
Tax Expenses
We utilize the United States corporate tax rate of 21% in our valuation analysis.
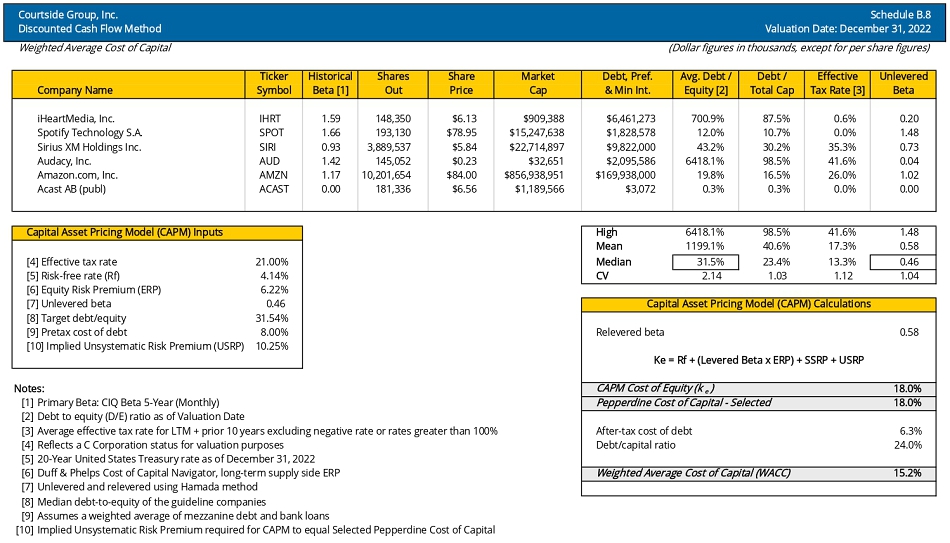
Weighted Average Cost of Capital
We determined the Company’s weighted average cost of capital of 15.2% based on a selected cost of equity of 18.0% and cost of debt of 8.0%.
Cost of Equity
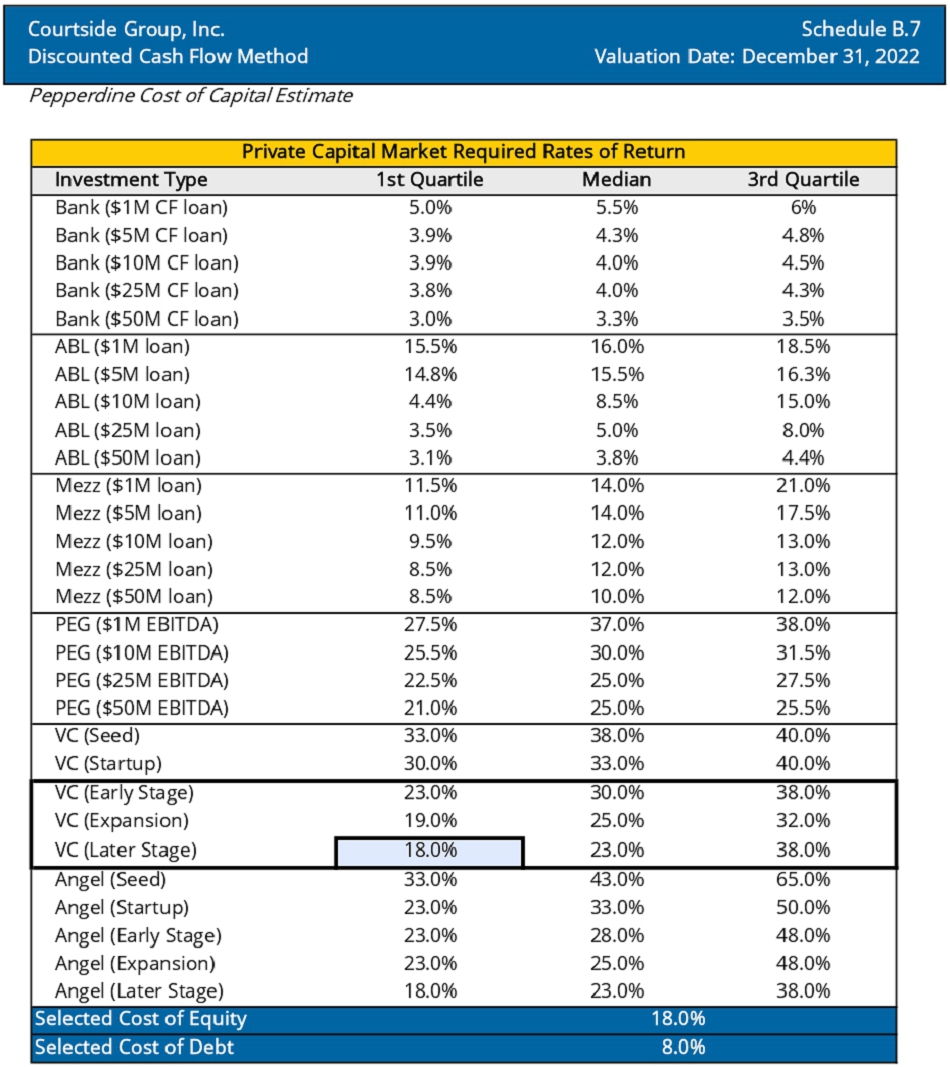
We selected a cost of equity of 18.0% based on the first quartile later stage venture capital required rate of return from the Pepperdine Cost of Capital Estimate.
| VALUESCOPE, Inc. | Page 20 |
FAIR MARKET VALUE DETERMINATION
Cost of Debt
We derived an estimate of the long-term cost of debt equal to 8.0% based on a weighted average of mezzanine debt and bank loans from the Pepperdine Cost of Capital Estimate.
Conclusion - WACC
The WACC calculation is a function of the cost of capital components and the capital structure of Courtside Group and its industries. The formula used for the calculation of the WACC is presented as follows:
| Ko | = | We* Ke + Wd* Kd * (1-Tm) |
where
| Ko | = | the WACC |
| We | = | the proportion of equity in the capital structure |
| Ke | = | the cost of equity |
| Wd | = | the proportion of debt in the capital structure |
| Kd | = | the pretax cost of debt |
| Tm | = | the marginal tax rate for a C corporation |
Using the costs of equity previously calculated and estimates for the capital structure, cost of debt, and effective tax rate, the WACC was determined to be 15.2%.
Schedule B.7 presents the private capital market required rates of return from the Pepperdine Cost of Capital Estimate, Schedule B.8 shows the details of the WACC calculation, and Schedule B.9 presents the DCF calculations.
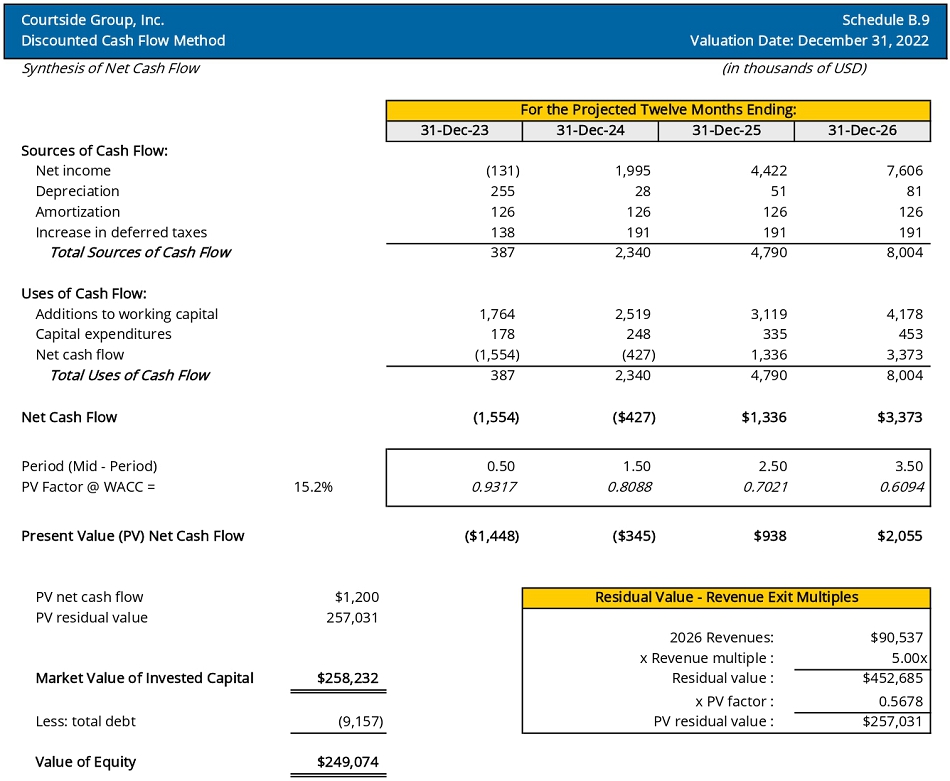
Conclusion – Income Approach Analysis
Our projected sources of cash flow less projected uses of cash flow such as working capital and capital expenditures indicate free cash flow to the firm (FCFF) of negative $1.4 million for the twelve months ending December 31, 2023. We did not project the Company to positive FCFF until the twelve months ending December 31, 2025. The amounts were discounted back to the Valuation Date using the Company’s WACC.
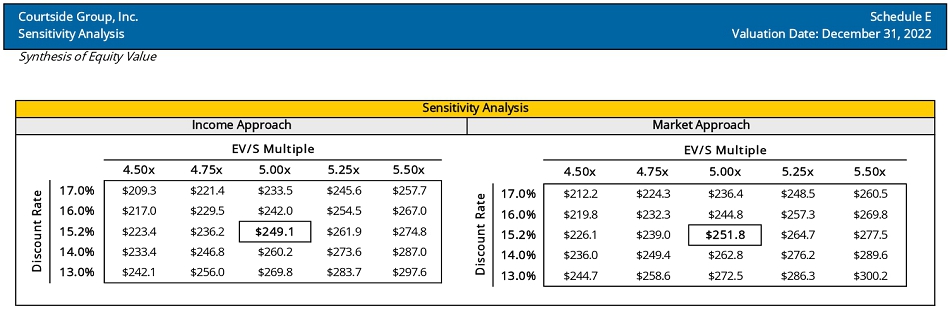
We applied a 5.0x enterprise value to revenue (EV/S) multiple to the Company’s projected 2026 revenues of $90.5 million to determine the residual value. We determined this multiple based on our observation and analysis of the Stitcher transaction discussed below under the market approach analysis as well as an analysis of guideline public company multiples as of the Valuation Date, discussions with management, and industry research.
| VALUESCOPE, Inc. | Page 21 |
FAIR MARKET VALUE DETERMINATION
Based on the forecasts and methodologies presented in this analysis, the income approach indicated an MVIC of $258.2 million for Courtside Group as of the Valuation Date. The Company reported $9.2 million debt as of the Valuation Date; therefore, the equity value can be reasonably stated as $249.1 million.
MARKET APPROACH ANALYSIS
Merger and Acquisition Method
It is possible to develop an indication of a company’s value based upon the multiples indicated by M&A transactions of companies in the same or a similar industry occurring in recent years.
In order to use M&A information in a valuation engagement, the following two conditions must be met:
| 1. | The target company must be similar to the company being valued in at least some respects. |
| 2. | One must be able to obtain details of the merger or acquisition transaction. If at least one of the parties in the M&A transaction (either the purchaser or the seller) is a public company, relevant information is often available. |
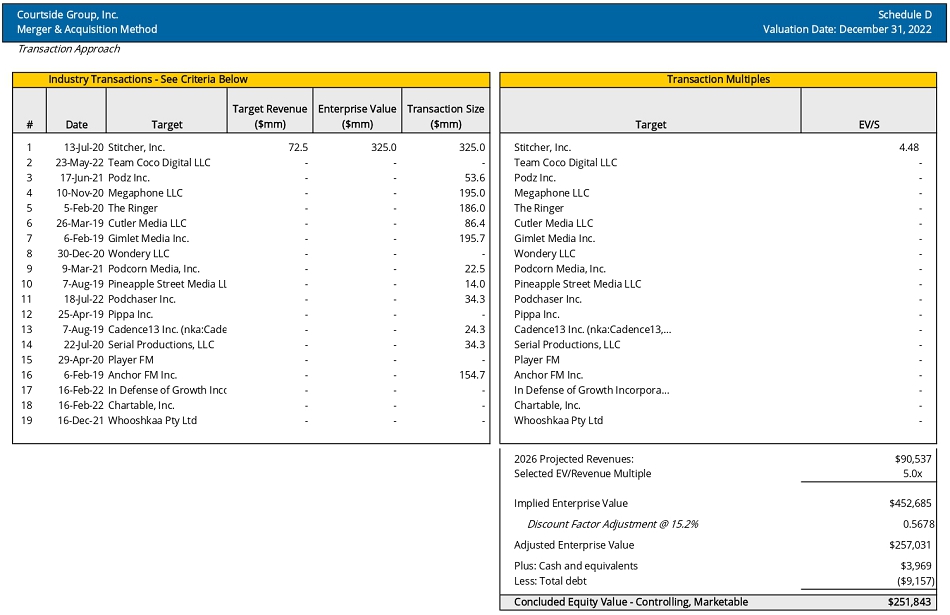
We considered this method and searched various databases for transactions involving podcasting companies that are similar in nature to Courtside Group. However, due to a lack of transactions with obtainable details involving companies in the podcasting industry, we analyzed one specific transaction.
Stitcher, Inc. (“Stitcher”) was fully purchased by Sirius XM Holdings Inc. on October 16, 2020 for approximately $325 million. Stitcher provides a full-service platform to create, monetize (via advertising), and distribute podcasts to listen to via its app and on multiple platforms. Top Stitcher podcasts include Freakonomics Radio, My Favorite Murder, SuperSoul Conversations from the Oprah Winfrey Network, Office Ladies, Conan O’Brien Needs a Friend, Literally! With Rob Lowe, LeVar Burton Reads, and WTF with Marc Maron.
The sale consideration was comprised of $265 million of upfront cash, an earnout of up to $30 million based on 2020 financial results to be paid in 2021 and an earnout of up to $30 million based on 2021 financial results to be paid in 2022. The purchase price of $325 million represents a multiple of 4.48x Stitcher’s 2019 revenues.
We calculated and applied the EV/S multiple of 5.0x to the Company’s projected 2026 revenue to determine the Company’s value under the transaction method of the market approach. We believe this multiple to be appropriate considering the continued growth in podcasting downloads, streams, and revenues generated, as well as industry consolidation.
Conclusion – Merger and Acquisition Method
The M&A method indicated an enterprise value of $257.0 million for Courtside Group. We added cash and equivalents and subtracted debt to obtain Courtside Group’s equity value of $251.8 million. Our conclusion for the M&A valuation method is presented in Schedule D.
| VALUESCOPE, Inc. | Page 22 |
RECONCILIATION OF VALUATION METHODS
The value indication using the income approach reflects the Company’s expected future operating performance as well as economic and industry expectations. The indication of value using this approach was $249.1 million.
For the market approach, we utilized the merger and acquisition method. We derived an indication of value of $251.8 million using the merger and acquisition method.
To conclude a range of value, we performed a sensitivity analysis on two key assumptions to the valuation: the discount rate and the residual enterprise value to sales multiple. Our sensitivity analysis is presented in Schedule E.
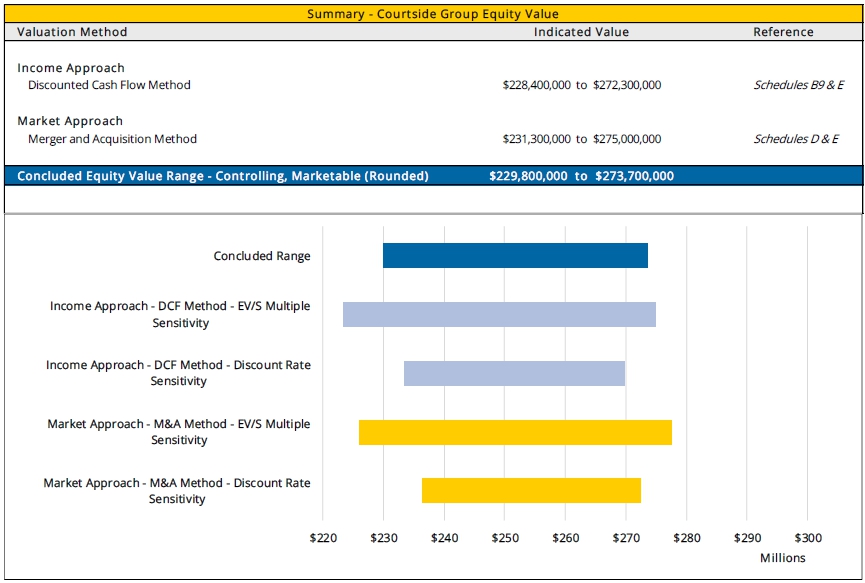
Our conclusion of the indicated equity value range of the Company was based on equal weightings of the income approach and market approaches. Based on the methodologies presented in this analysis, it is our opinion that the fair market value range of the Courtside Group’s equity on a controlling and marketable basis, as of the Valuation Date, can reasonably be stated as $229,800,000 to $273,700,000 (rounded).
| VALUESCOPE, Inc. | Page 23 |
CONCLUSION OF VALUE
Based on the procedures and corresponding analysis as described in the attached Report, it is our opinion that the fair market value of Courtside Group’s equity, on a controlling, marketable interest basis, as of December 31, 2022, is reasonably stated as:
$229,800,000 to $273,700,000
Our conclusion of value is presented in the following table as well as in the Summary Schedule.
| VALUESCOPE, Inc. | Page 24 |
ASSUMPTIONS AND LIMITING CONDITIONS
This valuation by ValueScope, Inc., is subject to and governed by the following Assumptions and Limiting Conditions and other terms, assumptions, and conditions contained in the engagement letter.
LIMITATION ON DISTRIBUTION AND USE
The Report, the final estimate of value, and the prospective financial analyses included therein are intended solely for the information of the person or persons to whom they are addressed and solely for the purposes stated; they should not be relied upon for any other purpose, and no party other than the Company may rely on them for any purpose whatsoever. Neither the valuation Report, nor its contents, nor any reference to the appraiser or ValueScope, Inc., may be referred to or quoted in any registration statement, prospectus, offering memorandum, sales brochure, another appraisal, loan, or other agreement or document given to third parties without our prior written consent. In addition, except as set forth in the Report, our analysis and Report are not intended for general circulation or publication, nor are they to be reproduced or distributed to third parties without our prior written consent; provided, however, that if ValueScope, Inc., fails to inform the Company whether ValueScope, Inc., will provide such consent within five (5) business days after receiving the Company’s request thereof, then ValueScope, Inc.’s consent shall be deemed conclusively to have been provided without any further action by the Company or ValueScope, Inc.
No change of any item in this Report shall be made by anyone other than ValueScope, and we shall have no responsibility for any such unauthorized change.
The valuation may not be used in conjunction with any other appraisal or study. The value conclusion(s) stated in this appraisal is based on the program of utilization described in the Report and may not be separated into parts. The appraisal was prepared solely for the purpose, function, and party so identified in the Report. The Report may not be reproduced, in whole or in part, and the findings of the Report may not be utilized by a third party for any purpose without the express written consent of ValueScope, Inc.
As required by U.S. Treasury rules, we inform you that, unless expressly stated otherwise, any U.S. federal tax advice contained in this Report, including attachments, is not intended, or written to be used, and cannot be used, by any person for the purpose of avoiding any penalties that may be imposed by the Internal Revenue Service.
| VALUESCOPE, Inc. | Page 25 |
ASSUMPTIONS AND LIMITING CONDITIONS
NOT A FAIRNESS OPINION
Neither our opinion nor our Report are to be construed as an opinion of the fairness of an actual or proposed transaction, a solvency opinion, or an investment recommendation but instead are the expression of our determination of fair market value as the price that would be received to sell an asset or paid to transfer a liability in an orderly transaction between market participants at the measurement date, including our analysis whether impairment of goodwill exists.
OPERATIONAL ASSUMPTIONS
Unless stated otherwise, our analysis (i) assumes that, as of the Valuation Date, the Company and its assets will continue to operate as configured as a going concern, (ii) is based on the past, present, and future projected financial condition of the Company and its assets as of the Valuation Date, and (iii) assumes that the Company has no undisclosed real or contingent assets or liabilities, other than in the ordinary course of business, that would have a material effect on our analysis.
We did not make an onsite visit to Company facilities.
COMPETENT MANAGEMENT ASSUMED
It should be specifically noted that the valuation assumes the property will be competently managed and maintained over the expected period of ownership. This appraisal engagement does not entail an evaluation of management’s effectiveness, nor are we responsible for future marketing efforts and other management or ownership actions upon which actual results will depend.
NO OBLIGATION TO PROVIDE SERVICES AFTER COMPLETION
Valuation assignments are accepted with the understanding that there is no obligation to furnish services after completion of this engagement. If the need for subsequent services related to a valuation assignment (e.g., including testimony, preparation for testimony, other activity compelled by legal process, updates, conferences, reprint or copy services, document production, or interrogatory response preparation, whether by request of the Company or by subpoena or other legal process initiated by a party other than the Company) is requested, special arrangements for such services acceptable to ValueScope, Inc., must be made in advance. ValueScope, Inc., reserves the right to make adjustments to the analysis, opinion, and conclusion set forth in the Report as we deem reasonably necessary based upon consideration of additional or more reliable data that may become available.
| VALUESCOPE, Inc. | Page 26 |
ASSUMPTIONS AND LIMITING CONDITIONS
In all matters that may be potentially challenged by a Court or other party, we do not take responsibility for the degree of reasonableness of contrary positions that others may choose to take, nor for the costs or fees that may be incurred in defense of our recommendations against challenge(s). We will, however, retain our supporting work papers for your matter(s) and will be available to assist in defending our professional positions taken, at our then-current rates, plus direct expenses at actual, and according to our then-current Standard Professional Agreement.
NO OPINION IS RENDERED AS TO LEGAL FEE OR PROPERTY TITLE
No opinion is rendered as to legal fee or property title. No opinion is intended in matters that require legal, engineering, or other professional advice that has been or will be obtained from professional sources.
LIENS AND ENCUMBRANCES
ValueScope will give no consideration to liens or encumbrances except as specifically stated. We will assume that all required licenses and permits are in full force and effect, and we make no independent on-site tests to identify the presence of any potential environmental risks. We assume no responsibility for the acceptability of the valuation approaches used in our Report as legal evidence in any particular court or jurisdiction.
INFORMATION PROVIDED BY OTHERS
Information furnished by others is presumed to be reliable; no responsibility, whether legal or otherwise, is assumed for its accuracy and cannot be guaranteed as being certain. All financial data, operating histories, and other data relating to income and expenses attributed to the business have been provided by management or its representatives and have been accepted without further verification except as specifically stated in the Report.
PROSPECTIVE FINANCIAL INFORMATION
Valuation Reports may contain prospective financial information, estimates, or opinions that represent reasonable expectations at a particular point in time, but such information, estimates, or opinions are not offered as forecasts, prospective financial statements or opinions, predictions, or as assurances that a particular level of income or profit will be achieved, that events will occur, or that a particular price will be offered or accepted. Actual results achieved during the period covered by our prospective financial analysis will vary from those described in our Report, and the variations may be material.
| VALUESCOPE, Inc. | Page 27 |
ASSUMPTIONS AND LIMITING CONDITIONS
Any use of management’s projections or forecasts in our analysis will not constitute an examination, review, or compilation of prospective financial statements in accordance with standards established by the American Institute of Certified Public Accountants (AICPA). We will not express an opinion or any other form of assurance on the reasonableness of the underlying assumptions or whether any of the prospective financial statements, if used, are presented in conformity with AICPA presentation guidelines.
REGULATORY AND ENVIRONMENTAL CONSIDERATIONS
The Report assumes all required licenses, certificates of occupancy, consents, or legislative or administrative authority from any local, state, or national government, or private entity or organization have been or can be obtained or reviewed for any use on which the opinion contained in the Report is based.
ValueScope is not an environmental consultant or auditor, and it takes no responsibility for any actual or potential environmental liabilities. Any person entitled to rely on this Report, wishing to know whether such liabilities exist or the scope and their effect on the value of the property, is encouraged to obtain a professional environmental assessment. ValueScope does not conduct or provide environmental assessments and has not performed one for the subject property.
ValueScope has not determined independently whether the Company is subject to any present or future liability relating to environmental matters (including, but not limited to CERCLA/Superfund liability) or the scope of any such liabilities. ValueScope’s valuation takes no such liabilities into account, except as they have been reported to ValueScope by the Company or by an environmental consultant working for the Company, and then only to the extent that the liability was reported to us in an actual or estimated dollar amount. Such matters, if any, are noted in the Report. To the extent such information has been reported to us, ValueScope has relied on it without verification and offers no warranty or representation as to its accuracy or completeness.
Unless otherwise stated, no effort has been made to determine the possible effect, if any, on the subject business due to future federal, state, or local legislation, including any environmental or ecological matters or interpretations thereof.
ValueScope has not made a specific compliance survey or analysis of the subject property to determine whether it is subject to, or in compliance with, the American Disabilities Act of 1990, and this valuation does not consider the effect, if any, of noncompliance.
ValueScope expresses no opinion on matters that require legal or other specialized expertise, investigation, or knowledge beyond that customarily employed by business appraisers.
| VALUESCOPE, Inc. | Page 28 |
ASSUMPTIONS AND LIMITING CONDITIONS
POTENTIAL FUTURE SALES
Any decision to purchase, sell, or transfer any interest in the subject company or its subsidiaries shall be your sole responsibility as well as the structure to be utilized and the price to be accepted.
The selection of the price to be accepted requires consideration of factors beyond the information we will provide or have provided. An actual transaction involving the subject business might be concluded at a higher value or at a lower value, depending upon the circumstances of the transaction and the business, and the knowledge and motivations of the buyers and sellers at that time. Due to the economic and individual motivational influences which may affect the sale of a business interest, the appraiser assumes no responsibility for the actual price of any subject business interest if sold or transferred.
INDEMNIFICATION BY THE COMPANY
The following indemnifications shall not apply (i) to the extent that any losses, claims, damages, judgments or liabilities are caused by fraud, bad faith, gross negligence or willful malfeasance on the part of ValueScope or (ii) with respect to any penalties or sanctions of any kind imposed on ValueScope by the Internal Revenue Service as a result of ValueScope’s violation of laws, rules, or IRS regulations in connection with this engagement.
The Estate agrees to indemnify and hold harmless ValueScope, and its respective principals, affiliates, agents and employees (“Indemnified Party”) against any losses, claims, damages, judgments or liabilities arising out of or based upon any professional advisory services rendered pursuant to this agreement. Furthermore, the Estate agrees to indemnify ValueScope and any Indemnified Party against any losses, claims, damages, judgments or liabilities incurred as a result of a third party initiating a lawsuit against any Indemnified Party based upon any consulting services rendered to Client or the Estate pursuant to this agreement. In consideration for this indemnification agreement, ValueScope will provide professional advisory services.
The Estate agrees to reimburse ValueScope and any Indemnified Party for any necessary and reasonable expenses, attorneys’ fees, or costs incurred in the enforcement of any part of the indemnity agreement 30 days after receiving written notice from ValueScope. This agreement shall commence on execution of this engagement letter and shall continue in full force.
The obligations of ValueScope under this agreement are solely corporate obligations, and no officer, director, employee, agent, shareholder, or controlling person in ValueScope shall be subjected to any personal liability whatsoever to any person, nor will any such claim be asserted by or on behalf of you or your affiliates.
| VALUESCOPE, Inc. | Page 29 |
VALUATION CERTIFICATION
I certify that to the best of my knowledge and belief:
| 1. | The statements of fact contained in this report are true and correct to the best of my knowledge. |
| 2. | The reported analyses, opinions, and conclusions of value are limited only by the reported assumptions and limiting conditions, and are my personal, impartial, independent, unbiased, objective professional analyses, opinions, and conclusions. |
| 3. | I have no present or prospective/contemplated financial or other interest in the Subject Interests or property that is the subject of this report, and I have no personal financial or other interest or bias with respect to the property or the parties involved. I currently maintain a board seat as a director of the Company. |
| 4. | My engagement in this assignment was not contingent upon developing or reporting predetermined results. |
| 5. | My compensation for completing this assignment is fee-based and is not contingent upon the development or reporting of a predetermined value or direction in value that favors the cause of the client, the outcome of the valuation, the amount of the value opinion, the attainment of a stipulated result, or the occurrence of a subsequent event directly related to the intended use of this appraisal. |
| 6. | The economic and industry data included in the valuation report have been obtained from various printed or electronic reference sources that I believe to be reliable. I have not performed any corroborating procedures to substantiate that data. |
| 7. | My analyses, opinions, and conclusions were developed, and this report has been prepared, in conformity with the requirements of the Code of Professional Ethics and the Standards of Professional Appraisal Practice of the Appraisal Institute, of the American Society of Appraisers, and other professional organizations of which I am a member. |
| 8. | The parties for which the information and use of the valuation report are restricted are identified; the valuation report is not intended to be and should not be used by anyone other than such parties. |
| 9. | I have no obligation to update the report or the opinion of value for information that comes to my attention after the date of the report. |
| /s/ Martin D Hanan, CFA | ||
| Martin D Hanan, CFA Principal ValueScope, Inc. |
| VALUESCOPE, Inc. | Page 30 |
SCHEDULES
| VALUESCOPE, Inc. | Page 31 |