Prospectus Supplement No. 6
(to Prospectus dated April 19, 2023) | Filed Pursuant to Rule 424(b)(3)
Registration No. 333-269456 |

Bridger Aerospace Group Holdings, Inc.
120,277,192 Shares of Common Stock
Up to 26,650,000 Shares of Common Stock Issuable Upon
Exercise of the Warrants
Up to 9,400,000 Warrants
This prospectus supplement updates and supplements the prospectus dated April 19, 2023 (the “Prospectus”), which forms a part of our Registration Statement on Form S-1, as amended (Registration No. 333-269456). This prospectus supplement is being filed to update and supplement the information in the Prospectus with the information contained in our Annual Report on Form 10-K for the year ended December 31, 2023, filed with the U.S. Securities and Exchange Commission on March 20, 2024 (the “Annual Report”), which is attached to this prospectus supplement.
The Prospectus and this prospectus supplement relate to the offer and sale from time to time by the selling securityholders named in the Prospectus, or their permitted transferees, of (a) up to 120,277,192 shares of our common stock, $0.0001 par value (“Common Stock”), consisting of (i) up to 102,322,388 shares of Common Stock issued or issuable to the direct and indirect equityholders of Legacy Bridger (as defined in the Prospectus) in connection with the Business Combination (as defined in the Prospectus) at an implied equity consideration value of $10.00 per share of Common Stock, inclusive of up to 63,240,644 shares of Common Stock that may be issuable upon the conversion of shares of Series A Preferred Stock (as defined in the Prospectus); (ii) up to 5,951,615 shares of Common Stock issuable to the holders of certain restricted stock units that were issued by Legacy Bridger and assumed by us in connection with the closing (the “Closing”) of the Business Combination, which were granted at no cost to the recipients thereof; (iii) up to 2,488,189 shares of Common Stock that were originally issued in a private placement to JCIC Sponsor (as defined in the Prospectus) prior to the JCIC IPO (as defined in the Prospectus) (75,000 of which were subsequently transferred by the JCIC Sponsor to independent directors of JCIC), which were acquired at a purchase price equivalent to approximately $0.003 per share; (iv) up to 115,000 shares of Common Stock originally issued at the Closing to JCIC Sponsor in full consideration of the outstanding $1,150,000 loan balance under the Promissory Note (as defined in the Prospectus) for an equivalent purchase price of $10.00 per share; and (v) up to 9,400,000 shares of Common Stock issuable upon the exercise, at an exercise price of $11.50 per share, of the private placement warrants originally issued in connection with the JCIC IPO (the “Private Placement Warrants”) and (b) up to 9,400,000 Private Placement Warrants originally acquired by JCIC Sponsor in connection with the JCIC IPO for $1.00 per Private Placement Warrant.
The Prospectus and this prospectus supplement also relate to the issuance by us of up to an aggregate of 26,650,000 shares of Common Stock that may be issued upon exercise of the Warrants (as defined in the Prospectus), including 9,400,000 Private Placement Warrants and 17,250,000 Public Warrants (as defined in the Prospectus).
This prospectus supplement should be read in conjunction with the Prospectus. This prospectus supplement updates and supplements the information in the Prospectus. If there is any inconsistency between the information in the Prospectus and this prospectus supplement, you should rely on the information in this prospectus supplement.
Our Common Stock and Public Warrants are listed on The Nasdaq Global Market under the symbols “BAER” and “BAERW,” respectively. On March 25, 2024, the closing price of our Common Stock was $5.11. On March 21, 2024, the closing price for our Public Warrants was $0.1975.
See the section entitled “Risk Factors” beginning on page 8 of the Prospectus and under similar headings in any further amendments or supplements to the Prospectus to read about factors you should consider before buying our securities.
Neither the Securities and Exchange Commission nor any state securities commission has approved or disapproved of these securities or determined if the Prospectus or this prospectus supplement is truthful of complete. Any representation to the contrary is a criminal offense.
The date of this prospectus supplement is March 26, 2024.
UNITED STATES
SECURITIES AND EXCHANGE COMMISSION
Washington, D.C. 20549
______________________
FORM 10-K
______________________
(Mark One)
| | | | | |
| ☒ | ANNUAL REPORT PURSUANT TO SECTION 13 OR 15(d) OF THE SECURITIES EXCHANGE ACT OF 1934 |
For the fiscal year ended December 31, 2023
OR
| | | | | |
| ☐ | TRANSITION REPORT PURSUANT TO SECTION 13 OR 15(d) OF THE SECURITIES EXCHANGE ACT OF 1934 |
For the transition period from to
Commission file number: 001-41603
______________________
BRIDGER AEROSPACE GROUP HOLDINGS, INC.
(Exact name of registrant as specified in its charter)
______________________
| | | | | |
| Delaware | 88-3599336 |
(State or other jurisdiction of incorporation or organization) | (I.R.S. Employer
Identification No.) |
| |
90 Aviation Lane Belgrade, MT | 59714 |
| (Address of principal executive offices) | (Zip Code) |
(406) 813-0079
(Registrant’s telephone number, including area code)
______________________
Securities registered pursuant to Section 12(b) of the Act:
| | | | | | | | | | | | | | |
| Title of each class | | Trading Symbols | | Name of each exchange on which registered |
| Common Stock, $0.0001 par value per share | | BAER | | The Nasdaq Stock Market LLC |
| | | | |
| Warrants, each whole warrant exercisable for one share of Common Stock at an exercise price of $11.50 per share | | BAERW | | The Nasdaq Stock Market LLC |
Securities registered pursuant to Section 12(g) of the Act: None
______________________
Indicate by check mark if the registrant is a well-known seasoned issuer, as defined in Rule 405 of the Securities Act. Yes ☐ No ☒
Indicate by check mark if the registrant is not required to file reports pursuant to Section 13 or 15(d) of the Act. Yes ☐ No ☒
Indicate by check mark whether the registrant: (1) has filed all reports required to be filed by Section 13 or 15(d) of the Securities Exchange Act of 1934 during the preceding 12 months (or for such shorter period that the registrant was required to file such reports), and (2) has been subject to such filing requirements for the past 90 days. Yes ☒ No ☐
Indicate by check mark whether the registrant has submitted electronically every Interactive Data File required to be submitted pursuant to Rule 405 of Regulation S-T (§232.405 of this chapter) during the preceding 12 months (or for such shorter period that the registrant was required to submit such files). Yes ☒ No ☐
Indicate by check mark whether the registrant is a large accelerated filer, an accelerated filer, a non-accelerated filer, a smaller reporting company or an emerging growth company. (See definitions of “large accelerated filer,” “accelerated filer,” “smaller reporting company” and “emerging growth company” in Rule 12b-2 of the Exchange Act).
| | | | | | | | | | | | | | |
| Large accelerated filer | ☐ | | Accelerated filer | ☐ |
| | | | |
| Non-accelerated filer | ☒ | | Smaller reporting company | ☒ |
| | | | |
| | | Emerging growth company | ☒ |
If an emerging growth company, indicate by check mark if the registrant has elected not to use the extended transition period for complying with any new or revised financial accounting standards provided pursuant to Section 13(a) of the Exchange Act. ☐
Indicate by check mark whether the registrant has filed a report on and attestation to its management’s assessment of the effectiveness of its internal control over financial reporting under Section 404(b) of the Sarbanes-Oxley Act (15 U.S.C. 7262(b)) by the registered public accounting firm that prepared or issued its audit report. ☐
If securities are registered pursuant to Section 12(b) of the Act, indicate by check mark whether the financial statements of the registrant included in the filing reflect the correction of an error to previously issued financial statements. ☐
Indicate by check mark whether any of those error corrections are restatements that required a recovery analysis of incentive-based compensation received by any of the registrant’s executive officers during the relevant recovery period pursuant to §240.10D-1(b). ☐
Indicate by check mark whether the registrant is a shell company (as defined in Rule 12b-2 of the Exchange Act). Yes ☐ No ☒
The aggregate market value of Common Stock held by non-affiliates on June 30, 2023, was approximately $38.3 million.
As of March 15, 2024, there were 44,842,587 shares of Common Stock, $0.0001 par value, issued and outstanding.
DOCUMENTS INCORPORATED BY REFERENCE
Portions of the registrant’s definitive proxy statement for the 2024 Annual Meeting of Stockholder, to be filed no later than 120 days after the end of the fiscal year to which this Annual Report on Form 10-K relates, are incorporated by reference into Part III of this Annual Report on Form 10-K.
TABLE OF CONTENTS
CAUTIONARY STATEMENT REGARDING FORWARD-LOOKING STATEMENTS
This Annual Report on Form 10-K contains forward-looking statements within the meaning of the federal securities laws. Statements that are not historical facts, including statements about the beliefs and expectations of Bridger Aerospace Group Holdings, Inc. (the “Company,” “Bridger,” “we” or “us”), are forward-looking statements, including for purposes of the safe harbor provisions under the United States Private Securities Litigation Reform Act of 1995. Forward-looking statements generally are accompanied by words such as “believe,” “may,” “will,” “estimate,” “continue,” “anticipate,” “intend,” “expect,” “should,” “would,” “plan,” “project,” “forecast,” “predict,” “poised,” “positioned,” “potential,” “seem,” “seek,” “future,” “outlook,” “target,” and similar expressions that predict or indicate future events or trends or that are not statements of historical matters, but the absence of these words does not mean that a statement is not forward-looking. These forward-looking statements include, but are not limited to, (1) anticipated expansion of Bridger’s operations and increased deployment of Bridger’s aircraft fleet, including references to Bridger’s acquisition of and/or right to use the four Super Scoopers from the Spanish government, including the expected closing timings thereof, the anticipated benefits therefrom, and the ultimate structure of such acquisitions and/or right to use arrangements; (2) Bridger’s business and growth plans and future financial performance; (3) current and future demand for aerial firefighting services, including the duration or severity of any domestic or international wildfire seasons; (4) the magnitude, timing, and benefits from any cost reduction actions; (5) Bridger’s exploration of, need for, or completion of any future financings; and (6) anticipated investments in additional aircraft, capital resources, and research and development and the effect of these investments. These statements are based on various assumptions and estimates, whether or not identified in this Annual Report on Form 10-K, and on the current expectations of Bridger’s management and are not predictions of actual performance. These forward-looking statements are provided for illustrative purposes only and are not intended to serve as, and must not be relied on by any investor as, a guarantee, an assurance, a prediction or a definitive statement of fact or probability. Actual events and circumstances are difficult or impossible to predict and will differ from assumptions. Many actual events and circumstances are beyond the control of Bridger. These forward-looking statements are subject to a number of risks and uncertainties, including: Bridger’s ability to identify and effectively implement any current or future anticipated cost reductions, including any resulting impacts to Bridger’s business and operations therefrom; the duration or severity of any domestic or international wildfire seasons; changes in domestic and foreign business, market, financial, political and legal conditions; Bridger’s failure to realize the anticipated benefits of any acquisitions; Bridger’s successful integration of any aircraft (including achievement of synergies and cost reductions); Bridger’s ability to successfully and timely develop, sell and expand its services, and otherwise implement its growth strategy; risks relating to Bridger’s operations and business, including information technology and cybersecurity risks, loss of requisite licenses, flight safety risks, loss of key customers and deterioration in relationships between Bridger and its employees; risks related to increased competition; risks relating to potential disruption of current plans, operations and infrastructure of Bridger, including as a result of the consummation of any acquisition; risks that Bridger is unable to secure or protect its intellectual property; risks that Bridger experiences difficulties managing its growth and expanding operations; Bridger’s ability to compete with existing or new companies that could cause downward pressure on prices, fewer customer orders, reduced margins, the inability to take advantage of new business opportunities, and the loss of market share; the ability to successfully select, execute or integrate future acquisitions into Bridger’s business, which could result in material adverse effects to operations and financial conditions; and those factors discussed in the section of this Annual Report on Form 10-K entitled “Risk Factors” contained in this Annual Report on Form 10-K. If any of these risks materialize or Bridger management’s assumptions prove incorrect, actual results could differ materially from the results implied by these forward-looking statements. The risks and uncertainties above are not exhaustive, and there may be additional risks that Bridger presently does not know or that Bridger currently believes are immaterial that could also cause actual results to differ from those contained in the forward-looking statements. In addition, forward-looking statements reflect Bridger’s expectations, plans or forecasts of future events and views as of the date of this Annual Report on Form 10-K. Bridger anticipates that subsequent events and developments will cause Bridger’s assessments to change. However, while Bridger may elect to update these forward-looking statements at some point in the future, Bridger specifically disclaims any obligation to do so. These forward-looking statements should not be relied upon as representing Bridger’s assessments as of any date subsequent to the date of this Annual Report on Form 10-K. Accordingly, undue reliance should not be placed upon the forward-looking statements contained in this Annual Report on Form 10-K.
PART I
ITEM 1. BUSINESS.
Business Overview
Bridger provides aerial wildfire surveillance, relief and suppression and aerial firefighting services using next-generation technology and environmentally friendly and sustainable firefighting methods primarily throughout the United States. Our mission is to save lives, property and habitats threatened by wildfires, leveraging our high-quality team, specialized aircraft and innovative use of technology and data. We are meeting an underserved and growing need for next-generation full-service aerial firefighting platforms.
Bridger was founded by our Chief Executive Officer and former Navy SEAL officer Timothy Sheehy, in Bozeman, Montana in 2014 with one aircraft and a vision to build a global enterprise to fight wildfires. Bridger has since grown into a full-spectrum aerial firefighting service provider in the U.S. and in the field of aerial wildfire management, offering technology and services to provide front-line firefighters and fire suppression decision-makers access to key fire data in order to effectively combat wildfires.
On January 24, 2023, Bridger completed a reverse recapitalization (the “Reverse Recapitalization”) with Jack Creek Investment Corp (“JCIC”). As a result of the Reverse Recapitalization, Bridger and its subsidiaries prior to the consummation of the Reverse Recapitalization (“Legacy Bridger”) and JCIC each became wholly-owned subsidiaries of the Company.
As of December 31, 2023, the Company has a team of 148 employees and has developed an ecosystem of solutions, services and technologies supporting firefighting ground crews and the public.
The areas in which human development meets or intermingles with undeveloped wildland and vegetative fuels that are both fire-dependent and fire-prone (“wildland-urban interface” or “WUI”) have grown by more than 179,000 square kilometers in the U.S. from 1990 to 2020, according to a 2023 article by the United States Forest Service (the “USFS” and the “USFS WUI Increase Article”). WUI areas, which comprise 9.4% of the U.S. land area, now include nearly one-third of all residences, according to the USFS WUI Increase Article. At the same time, the annual acres burned per fire between 1985 and 2022 have increased by more than three-fold according to data published by the National Interagency Fire Center (the “NIFC”). As the WUI areas continue to grow and wildfires grow larger, more aggressive firefighting strategies are necessary to ensure public safety. Additionally, data published by the NIFC shows that the total number of U.S. acres burned annually has increased by more than two-fold from 1985 to 2022.
These trends have led to a response by the U.S. federal government to increase spending on fire suppression since 1985 with a compound annual growth rate of 7.6% to $3.5 billion in 2022, according to the NIFC Suppression Costs Data. Even with this increased spending and demand, unfulfilled requests for fixed wing aircraft for aerial firefighting grew at a compound annual growth rate of 4.7% between 2002 and 2022, with 654 unfulfilled requests in 2022, according to National Interagency Coordination Center (“NICC”).
Bridger’s management estimates that aerial suppression spend represented approximately 42.7% of an estimated $21.9 billion firefighting market (defined as the sum of air-based suppression, ground, and fire data, aerial imagery-related, and emergency mobile application markets) globally in 2021. There is a rapidly growing global need for fire suppression assets, and Bridger’s management believes that a shift away from ground services to air-based suppression has already commenced. The market is anticipated to continue to expand as wildfires rage across Europe and the U.S.
Business Description
Our portfolio is organized across two core offerings:
Fire Suppression: Consists of deploying specialized Viking CL-415EAF (“Super Scooper”) aircraft to drop large amounts of water quickly and directly on wildfires.
Aerial Surveillance: Consists of providing aerial surveillance via manned (“Air Attack”) aircraft for fire suppression aircraft over an incident and providing tactical coordination with the incident commander.
Fire Suppression
We provide direct fire suppression aerial firefighting support for ground crews by operating the Super Scoopers. Aerial fire suppression is provided in conjunction with traditional ground firefighting approaches, and specialized aircraft drop high volumes of water directly onto active wildfires. Because wildfires largely occur within close proximity to a major water source, leveraging readily available resources is more time- and fuel-efficient in combating wildfires when time is of the essence. The Super Scoopers allow for rapid delivery of water strikes to extinguish wildfires, particularly when deployed in tandem or larger groups to allow for continuous water delivery as aircraft return to the water source.
Aerial Surveillance
Wildfires can spread quickly and change course in an instant. Our aerial surveillance services provide decision-makers rapid, current intelligence from useful aerial vantage points, giving them access to key information to support more effective deployment of ground firefighters and improved safety for the public at large. Our aerial surveillance services leverage Air Attack aircraft.
Our Air Attack fleet comprises twelve aircraft, including four Twin Commanders (“Twin Commanders”), four Daher Kodiak 100s (“Daher Kodiaks”), three Pilatus PC-12 (“Pilatus”) and one DeHaviland Twin Otter (“Twin Otter”). We have seven years of experience in providing USFS Type 1 Air Tactical Group Supervisors (“ATGS”), and the aerial platform to relay the necessary information, to ground-based Interagency Incident Commanders (“Incident Commanders”), who are responsible for the overall management of the wildfire and determine how resources are deployed. We are one of the largest ATGS platform providers in the U.S. and have contracts covering 100% of the U.S.
Our Aircraft
We deploy modern technology to track and attack wildfires and have an expansive fleet of specialized firefighting aircraft stationed in three hangars at the Bozeman Yellowstone International Airport in Belgrade, Montana. Our aircraft form the basis of our service offerings and, as such, we strive to continually invest in advancements in aerial firefighting platforms. We continually invest in our fleet to expand our capabilities while assessing opportunities to acquire next-generation firefighting assets to combat the rising threat of wildfires.
We currently operate an aircraft fleet of 18 planes, comprised of the following:
•Six Super Scoopers
•Four Twin Commanders
•Four Daher Kodiaks
•Three Pilatus (one owned and two leased)
•One Twin Otter (leased)
Super Scooper Fleet
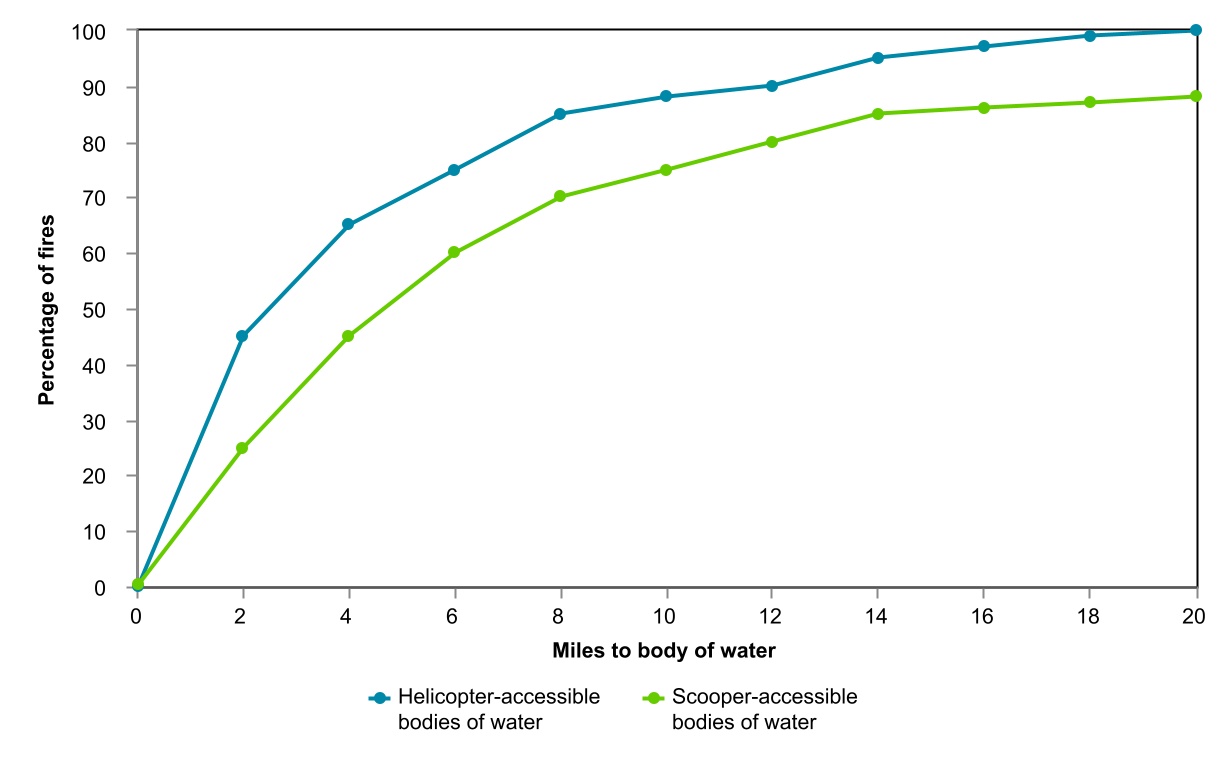
The Super Scooper is the only aircraft designed and built to fight fires and can fly more aggressively in extreme terrains than all other aircraft with equal or greater water capacity. The Super Scooper is an amphibious aircraft that skims the surface of a body of water to scoop water into onboard tanks to drop on a fire. The specific design of the Super Scooper allows for an aggressive low-altitude flight profile, which enables pilots to deliver their drops with more precision, hitting the fire harder and extinguishing it faster. Super Scoopers can scoop up to 1,412 gallons of water in approximately 12 seconds, and with 90% of wildfires within 20 miles of a major water source (see graph below), Super Scoopers provide an extremely effective tool to economically and expeditiously deliver water to a fire without having to return to an airport to refill the water tanks. With a water source within a five-mile radius, the Super Scooper can drop on its target up to every seven minutes for a total of approximately 35 drops, or 50,000 gallons of water, before needing to refuel. As a result of our operations of these Super Scooper assets, in conjunction with our Air Attack fleet, we believe that we are one of the most full-spectrum aerial fire service providers in North America.
Source: 2012 Air Attack Against Wildfire Study by the Rand Homeland Security and Defense Center.
The Super Scooper aircraft has an impeccable safety record, direct support from the original equipment manufacturer (the “OEM”), short take-off and landing capabilities (“STOL”) and a multi-crew flight deck. The Super Scooper has a cruising speed of 207 miles per hour. Additionally, the Super Scooper is a highly efficient aircraft when fighting wildland fires and has the ability to drop a higher volume of liquid than retardant-dropping fixed-wing aircraft over the same amount of time due to its ability to gather water from nearby bodies of water.
Our Super Scoopers have an immaculate safety record, as we have never been assessed with any safety violations and/or citations, nor have any of our aircraft ever been involved in any crashes or serious injuries. We have also adopted a safety management system (“SMS”) designed to reduce the likelihood of safety-related issues arising in the course of our overall operations. The SMS program has been audited by both the Federal Aviation Administration (the “FAA”) and the USFS.
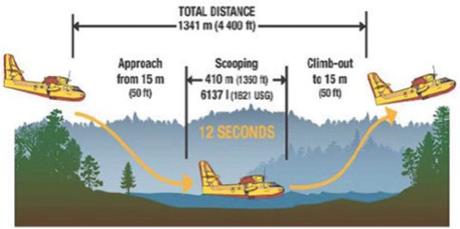
Furthermore, the Super Scooper has the ability to operate from smaller airports with runways as short as 2,500 feet in length while larger jet-powered aerial firefighting aircraft often need a runway of at least 4,000 feet in length. The Super Scooper is capable of scooping water in 12 seconds from bodies of water of 4,900 feet or more in length and can empty the water load in 3 seconds in one drop or split the drop into two. The Super Scooper’s water tank capacity is shown in the table below:
| | | | | | | | | | | | | | | | | | | | | | | | | | | | | | | | |
| | Volume | | Weight |
| | Liters | | Imp Gal | | U.S. Gal | | Kg | | Lbs |
| Each tank | | 2,673 | | 588 | | 706 | | 2,722 | | 6,000 |
| Total both tanks | | 5,346 | | 1,176 | | 1,412 | | 5,443 | | 12,000 |
A summary graphic of the Super Scooper and its efficiency in collecting water is provided below.
Source: United States Department of Agriculture Amphibious Water Scooper Aircraft Operations Plan 2016.
Air Attack Fleet
Our Air Attack fleet provides high level situational awareness of fire growth, ground firefighting elements, other aircraft within the fire traffic area, and changing weather conditions to Incident Commanders. Each aircraft is outfitted with a broad suite of communication technologies. The Daher Kodiaks and Pilatus, the newest additions to our Air Attack fleet, are particularly renowned for their rugged build and versatility in landing on challenging terrain which is an asset given the inconsistent and harsh flying conditions that challenge aerial firefighting. Our Air Attack fleet is suitable for STOL, allowing for deployment in a greater range of scenarios. A high level of reliability allows the aircraft to be serviced and available for contract for more days, with fewer unscheduled in-field maintenance events. Above active wildfires, the aircraft can maintain the fuel efficiency required to loiter for four to seven hours with slow and stable flight characteristics, offering the ATGS greater visibility.
Key Market Drivers and Opportunities
There are several key market drivers and opportunities for our business, including:
Longer and more severe fire seasons drive demand for fire suppression and aerial surveillance services
NIFC Suppression Costs Data supports that the acreage burned in the U.S. has increased over time. While there is variability in the acreage burned in any given year, the annual average of 7.1 million acres burned from 2000 to 2022 has more than doubled the annual average acreage burned from 1985 to 1999 of 3.2 million.
While the North American wildfire off-season is typically between October and May, fires are starting earlier in the spring and lasting deeper into the fall according to the United States Environmental Protection Agency (the “EPA”). The U.S. fire season is also lengthening on a consistent basis – according to Climate Central, the U.S. fire season is on average 105 days longer than it was in 1970. Climate Central also reported that the average number of large fires (greater than 1,000 acres) burning each year had tripled between the period of the 1970s to the 2010s, and the acres burned by such fires showed a six-fold increase in the 2010s compared to the 1970s. Climate Central attributes the lengthening wildfire season to factors including warmer springs, longer summer dry seasons and drier soils and vegetation, with climate change threatening to increase the extent and severity of these fires. The United States national fire preparedness level has increased over time. The five preparedness levels range from the lowest (1) to the highest (5); and are dictated by fuel and weather conditions, fire activity and fire suppression resource availability throughout the country. Level 5 represents that several geographic areas are experiencing large, complex wildfire incidents, which have the potential to exhaust national wildland firefighting resources, while Level 1 represents that there is very minimal fire activity. According to data provided by the NIFC, the average U.S. fire preparedness level during the main wildfire season (June through September) has increased over time by almost half of a level: during the past five years (2019 – 2023) the average U.S. fire preparedness level was 3.09, while the average U.S. fire preparedness level since 1990 was 2.80.
Federal and state funding for wildfire control
National funding for wildfire management is appropriated by the U.S. Congress (“Congress”) and each state pays for wildland firefighting slightly differently. While fire suppression activities on wildlands in the U.S. are financed through federal funds, budget-making processes may restrict the amount allocated. According to the NIFC Suppression Costs Data, the average annual federal government fire suppression spending was $3.0 billion for the five-year period from 2018 to 2022, an increase of 45%, compared to $2.1 billion of average annual spending for the previous five-year period from 2013 to 2017. The funding is allocated to the Department of the Interior (the “DOI”) and the USFS. Our company then enters into short, medium and long-term contracts with federal agencies during the firefighting season. On the state level, we are generally seeing significant increases in several state governments and private entities who are preparing themselves for the new fire reality. For example, in July 2023, the federal government announced the allocation of $185.0 million to support wildland fire management nationwide in 2023 and to assist land managers in planning for wildfire management activities in fiscal year 2024. This investment builds on $278.0 million, announced in March 2023 and December 2022, already allocated in 2023. In 2021, Washington State invested $328.0 million over the five following years to fight wildfires. While this level of commitment is unique, it is reflective of the increased awareness across many levels of government and private entities that wildfire risk has entered a new era of severity.
Given our long-standing customer relationships with governmental bodies, we have an opportunity to fulfill this increased demand for firefighting services driven by longer and more severe fire seasons. We view the increased demand as a means to further government agency ties and to capitalize on new aircraft investments.
Increased demand and limited supply of purpose-built suppression aircraft
According to the reports published by the NICC, demand for Type 3 multi-engine airtankers, which includes our Super Scooper aircraft, increased by over 56% for the two-year period of 2021 and 2022 compared to the prior two-year period of 2019 and 2020. The Wildland Fire Reports showed that the increase in demand led to a higher percentage of unfulfilled requests, and in 2022, 34.9% of Type 3 multi-engine airtankers requests were unfulfilled compared to 8.9% in 2020.
Super Scoopers are multi-engine airtankers built specifically for aerial firefighting. They are highly effective at fighting fires and have historically been owned and operated by foreign governments throughout Europe (there are approximately 40 amphibious scooping aircraft owned by France, Greece, Italy and Spain) and as a result, used amphibious scooping aircraft are difficult to locate and obtain in the United States. We are an original customer for Longview Aviation Services Inc.’s (“LAS”) launch of their Super Scooper CL-415EAF (Enhanced Aerial Firefighter) Program. LAS has only manufactured a limited number of Super Scoopers available for sale between 2020 and 2025, and pursuant to our purchase agreement with LAS and Viking, dated April 13, 2018 (as amended and supplemented from time to time, the “LAS Purchase Agreement”), which has been amended numerous times to add additional planes and upgrades, we agreed to purchase six of the limited number of Super Scoopers. On February 17, 2023, we received our sixth Super Scooper, which allows greater deployment of the Bridger aircraft fleet across the U.S. As we are a long-standing customer of LAS, and as LAS develops their next generation of aerial firefighting solutions, our continuous feedback informs advancements in firefighting technology.
On November 17, 2023, the Company entered into a series of agreements with MAB Funding, LLC (“MAB”) and its subsidiary designed to facilitate the purchase and return to service of four Canadair CL-215T Amphibious Aircraft (the “Spanish Scoopers”) originally awarded to the Company in September 2023 via a public tender process from the Government of Spain for €40.3 million. The terms of the agreements provide that the Company will manage the return to service upgrades of the Spanish Scoopers while they are owned and funded by MAB. The Company has the right, but not the obligation, to acquire each plane as it is ready to be contracted and returned to service. The Company plans to acquire the Spanish Scoopers in a sequential manner as they are modified and subsequently contracted for service.
Given the limited supply of purpose-built multi-engine airtankers, upkeep and maintenance of existing aircraft is vital to minimize lapses in firefighting services occurring during wildfire season and to reduce the impact of any disruptions that occur. The Super Scooper is the only aerial fire suppression aircraft with factory OEM support which aids in reducing downtime.
Our Competitive Strengths
Full spectrum of aerial firefighting services
We provide full-spectrum aerial firefighting services, offering both fire suppression and aerial surveillance services in the U.S. and internationally. We emphasize continued investment in new aerial surveillance and aerial fire suppression aircraft. Our aerial surveillance fleet has evolved since our inception from a single aircraft and pilot to the fleet operated today. The diversity of our service offerings affords customers the opportunity to select the appropriate services for their specific needs.
Purpose-built aircraft that can drop higher volumes of water
Our six Super Scooper aircraft are the latest model in the LAS production line and feature enhanced industry technology. Viking, a subsidiary of LAS, purchased the type certificate and is the OEM for the design of all the CL-215 and CL-415 models from Bombardier Aerospace. LAS then made significant improvements and introduced the Super Scooper, which includes the following improvements over the CL-415:
•Higher cruising speed;
•Improved air safety;
•Latest-generation technological reliability;
•New avionics and instrumentation;
•More accurate water discharge technology;
•Suitability for mountainous terrain;
•STOL on asphalt, gravel and water;
•Lower speed during water-bombing (low and slow flight);
•Improved operational efficiency; and
•Structural integrity.
The Super Scooper leverages modern turbine engines to deliver superior high-altitude performance. The Super Scooper is able to reload in under a minute, compared to a reload time of approximately 30 minutes to one hour, depending on base capabilities, for other air tankers enabling the Super Scooper to make more drops in the same amount of time. The Super Scooper can drop approximately 50,000 gallons before requiring refueling, while the largest tanker in the market can only drop 30,000 gallons of retardant before needing to refuel and reload retardant. The Super Scooper aircraft allow for rapid delivery of water strikes to extinguish wildfires, particularly when deployed in tandem or larger groups to allow for continuous water-delivery as aircraft return to the water source.
Highly-skilled crew of pilots and maintenance personnel
As of December 31, 2023, we have 15 captains on staff as part of the Super Scooper flight crew. Each captain has thousands of hours of flight time in the Super Scooper conducting firefighting operations. All flight crew have a minimum of four years of aerial firefighting experience. Recurrent training for all flight crew is required in a Level D full motion flight simulator.
Each of our pilots attends annual and recurrent training specific to the aircraft they operate and to meet our standards of safety and standard operating procedures. Each pilot that flies an aircraft on contract for a government agency receives a certification card on an annual basis that validates they are qualified by the government to safely operate the aircraft while on contract.
As of December 31, 2023, we have 10 crew chiefs on staff as part of the Super Scooper maintenance crew. Each crew chief has thousands of hours maintaining aircraft in the Viking family and are familiar with firefighting operations. Factory training is mandatory for all of the maintenance team specific to the aircraft and components they maintain. They are also required to complete company-specific training courses regarding safety, standard operating procedures and systems in which they track and sign-off on maintenance logs.
Long-standing client relationships
We have provided aerial firefighting services since 2015 to government agencies, including the USFS, California Department of Forestry and Fire Protection (“Cal Fire”) and multiple other state governments. We have been praised as an industry leader, specifically by the USFS, with regards to the SMS program and have been recommended by the USFS as a model for safe aircraft operations. Currently, we maintain active contracts with multiple federal agencies and the state governments of many high wildfire risk states. Historically, we have experienced a 100% renewal rate on our federal and state contracts. We bid upon and were awarded a USFS multi-year contract beginning with the 2021 fire season through the beginning of the 2025 fire season for the use of our Super Scooper planes.
Our relationship with the USFS involves three material service agreements: Contract No. 1202SA21T9009, dated as of June 3, 2021 (“Call-When-Needed Water Scooper Contract”), Contract No. 12024B19C9025, dated as of May 15, 2019 (“Exclusive Use Light Fixed Wing Contract”) and Contract No. 1202SA21G5100, dated as of February 22, 2021 (“Call-When-Needed Light Fixed Wing Contract”). Under the Call-When-Needed Water Scooper Contract, we provide Super Scooper aircraft services for wildland firefighting on a national basis for a period of four years from June 3, 2021. We generate revenue under the Call-When-Needed Water Scooper Contract from task orders placed by the USFS. Under the terms of the Call-When-Needed Water Scooper Contract, the USFS reserves the right to terminate the Call-When-Needed Water Scooper Contract, or any part thereof, for its sole convenience or in the event of any default by us. Under the Exclusive Use Light Fixed Wing Contract, we provide light fixed wing aircraft firefighting services on an exclusive use basis for the Northern, Rocky Mountain, Southwestern, Intermountain and Pacific Southwest regions, as defined by the U.S. Department of Agriculture. The original term of the Exclusive Use Light Fixed Wing Contract was for 12 months from May 15, 2019; however, the contract included an option to extend the contract for four additional periods of one year each, and the USFS has exercised its annual option to extend the contract for 12-month periods on each of March 18, 2020, April, 21, 2021, April 18, 2022, and March 14, 2023. We generate revenue under the Exclusive Use Light Fixed Wing Contract by providing guaranteed availability of our services for 120 calendar days per year, with different rates charged for standby hours and flight hours. Under the terms of the Exclusive Use Light Fixed Wing Contract, the USFS reserves the right to terminate the Exclusive Use Light Fixed Wing Contract, or any part thereof, for its sole convenience or in the event of any default by us. Under the Call-When-Needed Light Fixed Wing Contract, we provide light fixed wing aircraft firefighting services, on a call-when-needed basis, for the air tactical group supervision mission on behalf of the Northern Region, as defined by the USFS. The term of the Call-When-Needed Light Fixed Wing Contract is for a period of four years. We generate revenue under the Call-When-Needed Light Fixed Wing Contract by providing our services when called upon by the USFS, if available at time of call, with different rates charged for standby hours and flight hours. Under the terms of the Call-When- Needed Light Fixed Wing Contract, the USFS reserves the right to terminate the Call-When-Needed Light Fixed Wing Contract, or any part thereof, for its sole convenience or in the event of any default by us.
In 2023, the USFS discontinued the future use of multiple discrete contracts and instead consolidated its contracts into a National Multiple Award Task Order Contract (“MATOC”). Under this contract, it can award task orders for exclusive use aircraft instead of awarding multiple contracts. All of our light fixed-wing Air Attack aircraft and the multi-mission Pilatus are available under the MATOC subsequent to the expiration of the Exclusive Use Light Fixed Wing Contract in May 2024 .
Our Growth Strategy
Acquire and deploy additional aircraft to meet increased demand
We are an original customer for LAS’s launch of its Super Scooper CL-415EAF Program. There are approximately 40 amphibious scooping aircraft owned by France, Greece, Italy and Spain and as a result, used amphibious scooping aircraft are difficult to locate and obtain. LAS has only made a limited number available for sale between 2020 and 2025, of which the Company has purchased six.
Expanding our services
Fire Monitoring Technology: With roughly 70,000 wildfires occurring each year in the U.S. (according to the NIFC Suppression Costs Data), news feeds are saturated with reports of wildfires that have grown quickly and are out of control. Current consolidated fire data is controlled by wildfire agencies with limited to no access publicly available. On September 14, 2023, we acquired Ignis Technologies (“Ignis”) to develop a pioneering mobile and web platform that elevates firefighter situational awareness, creates an interoperable common operating picture across firefighting units, and produces real time, high value data to help fire organizations better manage wildfire risk.
Maintenance, Repair, Overhaul: We have an experienced and well-trained crew of maintenance professionals. Maintenance personnel and their maintenance support staff are current on all general aviation standards and requirements and are specifically trained to service our fleet of aircraft. We ensure our maintenance team has all the necessary equipment needed to exceed FAA maintenance standards and maintain USFS and DOI contract aircraft requirements. We are a FAA Certified Part 145 Repair Station offering in-house airframe and avionics repair capabilities for our aerial firefighting fleet. In April 2022, our Part 145 Certified Repair Station was awarded an ISO 9110, certification which is one of the highest standards in a repair organization recognized by the FAA. This certification was completed by the British Standards Institution, recognized as an industry leader in quality management systems.
Domestic and international expansion
We are committed to increasing our market share and service offering domestically and internationally. Given our competitive strengths, we believe we are well-positioned to take advantage of the growth in domestic demand for fire safety and environmental awareness. We currently have contracts in place with the USFS, the DOI, Bureau of Indian Affairs, Bureau of Land Management, Washington State Department of Natural Resources, Alaska Division of Forestry, Cal Fire, Colorado Department of Public Safety Division of Fire Prevention and Control, Idaho Department of Lands, Minnesota Department of Natural Resources, Montana Department of Natural Resources and Conservation, Nevada Department of Conservation and Natural Resources and Oregon Department of Forestry.
We intend to penetrate certain additional domestic markets through leveraging existing relationships and building local market teams. We have established this historically by maintaining relationships in the field with customers, gathering near real-time feedback to improve operations, as well as holding regular feedback sessions to incorporate points of improvement and planning for subsequent years.
We are exploring the possibility of operating internationally during the North American wildfire off-season, which generally occurs between October and May. We seek to become a global entity that provides aerial firefighting services worldwide. Our goal is to bring the Super Scooper to Europe through the agreement entered into for the Spanish Scoopers in November 2023. Additionally, we plan to bring the Super Scooper to Asia and/or South America in the future and to demonstrate the platform’s effectiveness. Currently, Super Scoopers are either not utilized on wildland fires in these areas or are not operated in a contractor-owned, contractor-operated business model. We plan to fill an underserved need to provide an alternative solution to aging and obsolete government-owned, government-operated fleets.
Pursuing Opportunistic Mergers & Acquisitions (“M&A”)
We intend to continue to evaluate M&A opportunities to expand our fleet, add new geographies or add additional services. Consistent with this strategy, we regularly evaluate potential acquisition opportunities, including ones that would be significant to us. We cannot predict the timing of any contemplated transactions, and none are currently probable.
Seasonality
Our operating results are impacted by seasonality. Climate conditions and other factors that may influence our revenues may vary each quarter and year. Many of these factors are outside of our control, including but not limited to:
•forest fires tend to have a higher occurrence during the summer months and during times of drought, but are ultimately unpredictable;
•climate change and changes in global temperatures occur over time;
•unexpected weather patterns, natural disasters or other events that increase or decrease the rate or intensity of wildfires or impair our ability to perform firefighting services; and
•changes in governmental regulations or in the status of our regulatory approvals or applications.
Historically, the demand for our services has been higher in the second and third quarters of each fiscal year due to the timing and duration of the North American wildfire season. Consequently, revenues, expenses, and operating cash flows from our services are generated mostly in the second and third quarters of our fiscal year. However, the seasonal fluctuation in the need to fight wildfires based upon location and the varying intensity of the wildfire season may lead our operating results to fluctuate significantly from quarter to quarter and year to year.
Our Customers
Our high-performing aircraft, including the Super Scooper, and full-service support platform have allowed us to enter into contracts with U.S. federal, state and local governmental entities and focus on growth while building additional services to map and analyze fire boundaries. Currently, we are engaged in short, medium and long-term contracts with multiple federal agencies such as the USFS and DOI and the state governments of many of the states most endangered by wildfires. Automatically renewing contracts with governmental entities provide stable revenue streams, allowing us to innovate in the aerial firefighting industry and diversify offerings to customers. We bid upon and were awarded a contract with the USFS for use of our Super Scooper aircraft, beginning in 2021 into 2025.
While a majority of our existing contracts are for a one-year base term, we enter into short, medium and long-term contracts with customers, primarily with the aforementioned government agencies during the firefighting season, to deploy aerial fire management assets. Contracts are based on either a Call-When-Needed (“CWN”) or Exclusive Use (“EU”) basis.
Rates established for CWN contracts are generally higher based on a customer's need for urgent or unanticipated deployment of our aerial fire management assets compared to EU contract rates which are generally more competitive based on the security of the revenue from the contract. Historically, we have experienced a 100% renewal rate on our federal and state contracts.
Facilities
Our headquarters are located in Belgrade, Montana, and our aircraft fleet resides at the Bozeman Yellowstone International Airport. We own three hangars and lease five existing lots at the airport on 20-year and 10-year ground leases.
Our international operations’ headquarters are located in Albacete, Spain. We currently own one hangar and lease one existing lot on a short-term ground lease at the Albacete Airport, where the return to service upgrades for the four Spanish Scoopers are being performed.
Our Competitors
Our primary competition is a private aerial firefighting operator that currently manages four CL-415s, three Type II Dash 8-400ATs and seven Avro RJ85s, which are designed to drop fire retardant. Additionally, from time-to-time we may compete with aerial firefighting companies that drop water from helicopters. However, our management does not view helicopters as a direct threat to our operations because while many helicopters are only able to pursue two-hour missions due to fuel capacity, our Super Scooper aircraft have four-hour fuel capacity.
Our Super Scooper program is not designed to replace the use of aircraft that drop fire retardant on wildfires. Fire retardant is a substance frequently deployed by large air tankers to slow down or stop the spread of fire and is frequently used to create a perimeter or border around a fire. While it is possible for a fire to burn through a fire line created by fire retardant, fire retardant remains a valuable tool in the fight and management of wildfires, and when combined with the deployment of Super Scoopers dropping water, can be effective in managing, controlling and slowing the spread of wildfires.
We believe our ability to compete successfully as an aerial firefighting service will depend on a number of factors, which may change in the future due to increased competition, including the price of our offerings, consumer confidence in the safety and efficacy of our offerings and consumer satisfaction for the solutions we offer. Additionally, we may compete with other aerial firefighting operators for federal and state budget dollars, and for various governmental service programs that support aerial firefighting programs.
Our Environmental Impact
According to an article on Climate Change Indicators by the United States Environmental Protection Agency, multiple studies have found that “climate change has already led to an increase in wildfire season length, wildfire frequency and burned area”, “climate change threatens to increase the frequency, extent and severity of fires through increased temperatures and drought” and wildfires release a significant amount of carbon emissions each year.
Amid raging wildfires and changing climate, we use sustainable and environmentally friendly firefighting methods. By sourcing water near the fire for our fire suppression services, we minimize harm to the local water system by keeping water in the local ecology and reducing flight time between scoops and drops. Our mission is to save lives, property, and habitats through our world-class team, specialized aircraft, and innovative use of technology and data.
Human Capital
Our employees are critical to our success. On December 31, 2023, we had 148 employees. We have high selection standards, recruiting individuals with specific technical skills and demonstrated ability to work independently in a wide variety of work environments. Prior to joining our company, many of our employees had prior experience working for a wide variety of reputed research, commercial and military aerospace and non-aerospace organizations. As a company founded by veterans, we seek to employ qualified veterans and draw upon the experiences of their shared military background including their strategic mindset, management skillset and high level of discipline. As of December 31, 2023, approximately one out of seven of our employees is a veteran of the U.S. military.
To date, we have not experienced any work stoppages, and we consider our relationship with our employees to be good. We routinely solicit feedback from our entire employee base and empower individuals by encouraging them to formulate solutions and process improvements no matter the level of role. Accordingly, our voluntary turnover is very low, employee engagement is high, and we have not experienced any interruptions of operations due to labor disagreements. Our employees are not subject to collective bargaining agreements or represented by labor union.
Health and Safety
We are committed to the safety of our employees. We maintain environmental, health and safety policies that seek to promote the operation of our business in a manner that is protective of the health and safety of the public and its employees. Our operations offer several health and welfare programs to employees to promote fitness and wellness and to encourage preventative healthcare. In addition, our employees are offered a confidential employee assistance program that provides professional counseling to employees and their family members. We have a holistic philosophy for our benefits offerings, supporting physical health, mental health, financial health, community support and a wide variety of insurance plans to hedge against uncertain losses (e.g., accident, short term disability, paid leaves, and life insurance).
Employee Trainings
To address the inherently dangerous nature of the job, we adhere to achieving operational excellence and providing our employees with the means to further their development. All of our pilots are given extensive training during the winter months, regardless of tenure or previous experience. The trainings include classroom and online courses, simulators, and in-plane time. We strive to have high industry standards and employ several dedicated pilot and airframe-specific trainers. Routinely, we fund enhanced workforce training in specific technical fields related to those employees’ desires. In one instance, we have had an employee who was hired as a facility cleaner. With further training and investment, the employee became a ground vehicle support manager and is now an aircraft mechanic. We also hire entry level mechanics and train them to obtain their airframe and powerplant certification, which allows them to perform maintenance on any aircraft unsupervised.
In addition to technical training, we invest heavily in leadership and management training as well as some of the most advanced safety training available in our industry. The State of Montana Job Grant program has been a tremendous help to us through our early years by providing state funded training to employees attending schooling to better their position as employees within the State of Montana. Before hiring externally as needs are identified, a careful analysis is done of our current staff to determine if the aptitude and interest is already in our employee base. By prioritizing training and promoting current employees, we enhance employee engagement and cut costs simultaneously.
Employee Retention and Opportunity
We believe that attraction and retention of top talent from a variety of backgrounds is important and we employ policies and procedures to recruit diverse talent as well as policies to ensure pay equality. We have an Equal Employment Opportunity Policy whereby we commit to providing equal employment opportunity, promotion, services, or activities which operates for all qualified employees and applicants without regard to race, color, sex, sexual orientation, gender identity, gender expression, parental status, citizenship status, religion, national origin, disability, veteran status, age, marital status, pregnancy, genetic information or other legally protected status. We drive a culture that understands and respects differences. We rely heavily on recruiting internationally to work on our purpose-built aerial firefighting aircraft and identify the cultural benefits that these individuals bring to our company.
Governmental Regulation
Federal Aviation Administration
The regulations, policies and guidance issued by the FAA apply to the use and operation of our aircraft. Operators of aircraft are required to have proper licenses, permits and authorizations from the FAA and comply with the FAA’s insurance requirements for third-party liability and government property. While our aircraft are currently registered with the FAA, in the event of a change in ownership, the FAA license will be updated with current information. In that instance, once any such new vehicle registration applications are filed, the applications will serve as registrations until the FAA issues the new vehicle registrations, which will allow operations to continue during that period.
Failure to comply with the FAA’s aviation or space transportation regulations may result in civil penalties or private lawsuits, or the suspension or revocation of licenses or permits, which would prevent operating our aircraft.
In addition to the FAA, our industry is regulated by multiple federal agencies who, in some cases, act as both customer and regulator. We are proud to have a stellar record of performance both in flight and on the ground with respect to all of our regulatory bodies.
ITEM 1A. RISK FACTORS.
Summary of Risk Factors
Below is a summary of the principal factors that could adversely affect our business, operations and financial results. This summary does not address all of the risks that we face. Additional discussion of the risks summarized in this summary, and other risks that we face (including general risk factors), can be found below following this summary.
Aviation and Firefighting Risks
•Our operation of aircraft involves a degree of inherent risk, and we could suffer losses and adverse publicity stemming from any accident, whether related to us or not, involving aircraft, helicopters, or commercial drones similar to the assets we use in our operations.
•Our business is inherently risky in that it is fighting wildfires which are powerful and unpredictable.
•The unavailability of an aircraft due to loss, mechanical failure, lack of pilots or maintenance personnel, especially one of the Viking Air CL-415EAFs, would result in lower operating revenues for us for a period of time that cannot be determined and would likely be prolonged.
•Our pilots and mechanics are required by contract to meet a minimum standard of operational experience. Finding and employing individuals with the necessary level of experience and certification has required us to hire Canadian personnel in addition to U.S. personnel. Inability to source and hire personnel with appropriate skills and experience would inhibit operations.
•The development of superior alternative firefighting tactics or technology that do not rely on our existing and planned capital assets could reduce demand for our services and result in a material reduction in our revenue and results of operations.
Operations Risks
•A cyber-based attack of our IT systems could disrupt our ability to deliver services to our customers and could lead to increased overhead costs, decreased sales, and harm to our reputation.
•Any failure to offer high-quality aerial firefighting services to customers may harm our relationships with our customers and could adversely affect our reputation, brand, business, financial condition and results of operations.
•We are subject to risks associated with climate change, including the potential increased impacts of severe weather events on our operations and infrastructure, and changes in weather patterns may result in lower demand for our services if such changes result in a reduced risk of wildfires.
•We are highly dependent on our senior management team and other highly skilled personnel with unique skills.
Seasonality Risks
•There is a seasonal fluctuation in the need to fight forest fires based upon location and a substantial majority of our revenue is currently concentrated in the Western United States. As a result, our operating results may fluctuate significantly from quarter to quarter and from year to year.
Sales and Customer Risks
•The aerial firefighting industry is expected to grow in the near future and is volatile, and if it does not develop, if it develops slower than we expect, if it develops in a manner that does not require use of our services, if it encounters negative publicity or if our solution does not drive commercial or governmental engagement, the growth of our business will be harmed.
•We depend significantly on government customers, which subjects us to risks including early termination, audits, investigations, sanctions and penalties. We are also subject to regulations applicable to government contractors which increase our operating costs and if we fail to comply, could result in the termination of our contracts with government entities.
•We may be unable to manage our future growth effectively, which could make it difficult to execute our business strategy.
•We rely on a few large customers for a majority of our business, and the loss of any of these customers, significant changes in the prices, marketing allowances or other important terms provided to any of these customers or adverse developments with respect to the financial condition of these customers could materially reduce our net income and operating results.
Supplier Risks
•We rely on a limited number of suppliers for certain raw materials and supplied components. We may not be able to obtain sufficient raw materials or supplied components to meet our maintenance or operating needs or obtain such materials on favorable terms or at all, which could impair our ability to provide our services in a timely manner or increase our costs of services and maintenance.
•There is a limited supply of new CL-415EAF aircraft to purchase, and an inability to purchase additional CL-415EAF aircraft could impede our ability to increase our revenue and net income.
•We currently rely and will continue to rely on third-party partners to provide and store the parts and components required to service and maintain our aircraft, and to supply critical components and systems, which exposes us to a number of risks and uncertainties outside our control.
Financial and Capital Strategy Risks
•We may require substantial additional funding to finance our operations and growth strategy, but adequate additional financing may not be available when we need it, on acceptable terms, or at all, and our ability to pursue equity financings may depend in part, on the market price of our shares of common stock, $0.0001 par value per share (“Common Stock”).
•Our systems, aircraft, technologies and services and related equipment may have shorter useful lives than we anticipate.
•We have a substantial amount of debt and servicing future interest or principal payments may impair our ability to operate our business or require us to change our business strategy to accommodate the repayment of our debt.
Early-Stage Company Risks
•Our liquidity position raises substantial doubt about our ability to continue as a going concern.
•We have incurred significant losses since inception, and we may not be able to achieve, maintain or increase profitability or positive cash flow.
•The requirements of being a public company may strain our resources, divert our management’s attention and affect our ability to attract and retain additional executive management and qualified board members.
•We have identified material weaknesses in our internal control over financial reporting, which we are in the process of, and are focused on, remediating.
Risks Related to the Ownership of Our Securities
•The price of our Common Stock and Warrants are likely to be highly volatile.
•Our Common Stock is subject to restrictions on ownership by non-U.S. citizens, which could require divestiture by non-U.S. citizen stockholders and could have a negative impact on the transferability of our Common Stock, its liquidity and market value, and such restrictions may deter a potential change of control transaction.
•We may issue additional shares of our Common Stock or other equity securities, which would dilute your ownership interest in us and may depress the market price of our Common Stock.
•There can be no assurance that we will be able to comply with the continued listing standards of Nasdaq.
•The holders of shares of Series A Preferred Stock have rights, preferences and privileges that are not held by, and are preferential to, the rights of holders of our Common Stock.
•A small number of Bridger’s stockholders could significantly influence its business.
•Future sales, or the perception of future sales, of a substantial number of shares of our Common Stock and Warrants, by us or our stockholders in the public market may cause the price of our Common Stock and Warrants to decline.
•Warrants are exercisable for our Common Stock and if exercised will increase the number of shares eligible for future resale in the public market and result in dilution to our stockholders.
The following risk factors and other information included in this Annual Report on Form 10-K should be carefully considered. The risks and uncertainties described below are not the only ones we face. Additional risks and uncertainties not currently known to us or that we currently deem less significant may also affect our business operations or financial results. If any of the following risks actually occur, our stock price, business, operating results and financial condition could be materially adversely affected and the market price of our securities could decline, causing our equityholders to lose all or a portion of their investment.
Aviation and Firefighting Risks
Our operation of aircraft involves a degree of inherent risk, and we could suffer losses and adverse publicity stemming from any accident, whether related to us or not, involving aircraft, helicopters, or commercial drones similar to the assets we use in our operations.
The operation of aircraft is subject to various risks, and demand for firefighting services, may in the future be impacted by accidents or other safety issues regardless of whether such accidents or issues involve Bridger flights, our aircraft operators, or aircraft flown by our aircraft operators. Air transportation hazards, such as adverse weather conditions and fire and mechanical failures, may result in death or injury to personnel and passengers which could impact client confidence in a particular aircraft type. Safety statistics for air travel are reported by multiple parties, including the Department of Transportation (the “DOT”) and National Transportation Safety Board, and are often separated into categories of transportation. Because our aerial firefighting services include a variety of aircraft, our clients may have a hard time determining how safe aerial firefighting services are, and their confidence in aerial firefighting may be impacted by, among other things, the classification of accidents in ways that reflect poorly on aerial firefighting services or the methods that aerial firefighting services utilize.
As the owners and operators of certain aircraft, including the CL-415EAFs, we believe that safety and reliability are two of the primary attributes that customers consider when selecting aerial firefighting services. Our failure to maintain standards of safety and reliability that are satisfactory to our customers may adversely impact our ability to retain current customers and attract new customers. We are at risk of adverse publicity stemming from any public incident involving our company, our people, or our brand. Such an incident could involve the actual or alleged behavior of any of our employees.
Increased accident history could bar us from certain contracts, thereby reducing demand for our services. Further, if our personnel or one of the aircraft models that is used by us is involved in a public incident, accident, catastrophe, or regulatory enforcement action, we could be exposed to significant reputational harm and potential legal liability. The insurance we carry may be inapplicable or inadequate to cover any such incident, accident, catastrophe, or action. In the event that our insurance is inapplicable or inadequate, we may be forced to bear substantial losses from an incident or accident. In addition, any such incident, accident, catastrophe, or action involving our employees or one of the aircraft models used by us could create an adverse public perception, which could harm our reputation, resulting in existing or potential customers being reluctant to use our services and adversely impacting our business, results of operations, and financial condition. If one or more of our operators were to suffer an accident or lose the ability to fly certain aircraft due to safety concerns or investigations, we may be required to cancel or delay certain aerial firefighting services until replacement aircraft and personnel are obtained.
Our operations may also be negatively impacted by accidents or other safety-related events or investigations that occur in or near the airports and the hangars we utilize for our aerial firefighting services. For example, if an accident were to occur at or near one of our hangars that we rely on for certain flights, we may be unable to utilize that hangar until the accident has been cleared, any damages to the facilities have been repaired, and any insurance, regulatory, or other investigations have been completed. Similarly, an adverse safety event by a third- party with respect to the CL-415EAF or any of the other planes in our fleet could result in temporary or permanent bans on certain aircraft models by our current or future customers.
Our business is inherently risky in that it is fighting wildfires which are powerful and unpredictable.
The performance of our services necessitates that we interact with wildfires. Wildfires can be massively unpredictable, and while we have implemented safety protocols and systems, these protocols and systems cannot eliminate the risk of accidents. Further, to effectively fight fires, flight operations often require low-level flights and involve performing services in mountainous terrain, both of which increase the risks involved with our services. To protect against these dangers, we may be required to incur more expenses and/or implement time- consuming safety protocols and systems, which could cause our expenses to be higher than anticipated. We may also be more likely to experience an adverse safety event.
The unavailability of an aircraft due to loss, mechanical failure, lack of pilots or maintenance personnel, especially one of the Viking Air CL-415EAFs, would result in lower operating revenues for us for a period of time that cannot be determined and would likely be prolonged.
Aircraft loss for any reason could impact our ability to provide services. Short- or long-term unavailability of an aircraft may also result from an aging fleet or parts obsolescence. Replacement aircraft or replacement parts may not be available or only available with significant delays.
Our revenues are disproportionately derived from the services of our Super Scoopers. The unavailability of one or more of our Super Scoopers could result in a significant reduction in our revenues and adversely affect our results of operations. For example, in 2022, we experienced a delay with the delivery of our fifth and sixth Super Scooper aircraft. We originally expected that the fifth Super Scooper and sixth Super Scooper would be delivered in May and July 2022, respectively, but ultimately, the delivery and subsequent preparation for deployment of the fifth Super Scooper was delayed until September 2022 and the sixth Super Scooper was not delivered until February 2023. As a result of such delays, our results of operations for the 2022 wildfire season were materially affected. Additionally, only pilots with significant flight hours can operate Super Scoopers, and there is a limited number of available pilots due to the demanding levels of training. There is a limited number of Super Scoopers in operation globally. Certain replacement parts may be unavailable or difficult to obtain, and we may be unable to hire sufficient mechanics trained to service Super Scoopers.
Our pilots and mechanics are required by contract to meet a minimum standard of operational experience. Finding and employing individuals with the necessary level of experience and certification has required us to hire Canadian personnel in addition to U.S. personnel. Inability to source and hire personnel with appropriate skills and experience would inhibit operations.
Our business’s success depends on our continued ability to attract, retain, and motivate highly qualified personnel with experience in the aviation space, including pilots and mechanics. However, competition for qualified personnel is intense. Our business may not be successful in attracting qualified personnel to fulfill our current or future needs. In the event that we are unable to fill critical open employment positions, we may need to delay our operational activities and goals, including the development and expansion of our business, and may have difficulty in meeting our obligations as a public company.
In addition, competitors and others may attempt to recruit our employees. The loss of the services of any of our key personnel, the inability to attract or retain highly qualified personnel in the future or delays in hiring such personnel, particularly senior management, pilots, and other technical personnel, could materially and adversely affect our business, financial condition and results of operations. In addition, the replacement of key personnel likely would involve significant time and costs and may significantly delay or prevent the achievement of our business objectives.
The development of superior alternative firefighting tactics or technology that do not rely on our existing and planned capital assets could reduce demand for our services and result in a material reduction in our revenue and results of operations.
Our aircraft have been modified to deploy our technology and support our existing firefighting tactics to fight wildfires. In particular, the Super Scooper is specially designed to fight forest fires with water and to refill from open bodies of water. If new technology or firefighting tactics are created or discovered that provide more powerful, more economic, faster, safer, more environmentally friendly or services that are otherwise superior in certain aspects to our current services, then we may see reduced demand for our services or be required to incur additional costs to adapt our fleet to such technologies or firefighting tactics. Additionally, current and potential government customers may push towards contracting services from customers with modernized fleets. All of these changes could narrow the scope of future contracts to exclude our existing assets, which could reduce demand for our services, our revenues, and earnings.
Operations Risks
We rely on our IT systems to manage numerous aspects of our business. A cyber-based attack of these systems could disrupt our ability to deliver services to our customers and could lead to increased overhead costs, decreased sales, and harm to our reputation.
We rely on IT networks and systems to operate and manage our business. Our IT networks and systems process, transmit and store personal and financial information, and proprietary information of our business. The technology also allows us to coordinate our business across our operation bases and communicate with our employees and externally with customers, suppliers, partners, and other third parties. While we believe we take reasonable steps to secure these IT networks and systems, and the data processed, transmitted, and stored thereon, such networks, systems, and data may be susceptible to cyberattacks, viruses, malware, or other unauthorized access or damage (including by environmental, malicious, or negligent acts), which could result in unauthorized access to, or the release and public exposure of, our proprietary information or our users’ personal information. In addition, cyberattacks, viruses, malware, or other damage or unauthorized access to our IT networks and systems could result in damage, disruptions, or shutdowns to our platform. Any of the foregoing could cause substantial harm to our business, require us to make notifications to our customers, governmental authorities, or the media, and could result in litigation, investigations or inquiries by government authorities, or subject us to penalties, fines, and other losses relating to the investigation and remediation of such an attack or other unauthorized access or damage to our IT systems and networks.
Our service, data and systems may be critical to operations or involve the storage, processing and transmission of sensitive data, including valuable intellectual property, other proprietary or confidential data, regulated data, and personal information of employees, and others. Successful breaches, employee malfeasance, or human or technological error could result in, for example, unauthorized access to, disclosure, modification, misuse, loss, or destruction of our or other third-party data or systems; theft of sensitive, regulated, or confidential data including personal information and intellectual property; the loss of access to critical data or systems; service or system disruptions or denials of service.
Our ability to attract and retain customers, to efficiently operate our business, and to compete effectively depends in part upon the sophistication, security, and reliability of our technology network, including our ability to provide features of service that are important to our customers, to protect our confidential business information and the information provided by our customers, and to maintain customer confidence in our ability to protect our systems and to provide services consistent with their expectations. As a result, we are subject to risks imposed by data breaches and operational disruptions, including through cyberattack or cyber-intrusion, by computer hackers, foreign governments, cyber terrorists and activists, cyber criminals, malicious employees or other insiders of the Company or third-party service providers, and other groups and individuals.
Data breaches of companies and governments continue to increase as the number, intensity, and sophistication of attempted attacks and intrusions from around the world have increased and we, our customers, and third parties increasingly store and transmit data by means of connected IT systems. Additionally, risks such as code anomalies, “Acts of God”, data leakage, cyber-fraud, and human error pose a direct threat to our services, systems, and data and could result in unauthorized or block legitimate access to sensitive or confidential data regarding our operations, customers, employees, and suppliers, including personal information.
We also depend on and interact with the technology and systems of third parties, including our customers and third-party service providers such as cloud service providers. Such third parties may host, process, or have access to information we maintain about our company, customers, employees, and vendors or operate systems that are critical to our business operations and services. Like us, these third parties are subject to risks imposed by data breaches, cyberattacks, and other events or actions that could damage, disrupt, or close down their networks or systems. We have security processes, protocols, and standards in place, including contractual provisions requiring such security measures, that are applicable to such third parties and are designed to protect information that is held by them, or to which they have access, as a result of their engagements with us. Nevertheless, a cyberattack could defeat one or more of such third parties’ security measures, allowing an attacker to obtain information about our company, customers, employees, and vendors or disrupt our operations. These third parties may also experience operational disruptions or human error that could result in unauthorized access to sensitive or confidential data regarding our operations, customers, employees, and suppliers, including personal information.
A disruption to our complex, global technology infrastructure, including those impacting our computer systems and website, could result in the loss of confidential business or customer information, require substantial repairs or replacements, resulting in significant costs, and lead to the temporary or permanent transfer by customers of some or all of their business to our competitors. The foregoing could harm our reputation and adversely impact our operations, customer service, and results of operations. Additionally, a security breach could require us to devote significant management resources to address the problems created. A significant data breach or any failure, or perceived failure, by us to comply with any federal, state, or foreign privacy laws, regulations, or other principles or orders to which we may be subject could adversely affect our reputation, brand, and business, and may result in claims, investigations, proceedings, or actions against us by governmental entities, litigation, including class action litigation, from our customers, fines, penalties, or other liabilities, or require us to change our operations or cease using certain data sets. Depending on the nature of the information compromised, we may also have obligations to notify users, law enforcement, government authorities, payment companies, consumer reporting agencies, or the media about the incident and may be required to expend additional resources in connection with investigating and remediating such an incident, and otherwise complying with applicable privacy and data security laws.
These types of adverse impacts could also occur in the event the confidentiality, integrity, or availability of company and customer information was compromised due to a data loss by us or a trusted third party. We or the third parties with which we share information may not discover any security breach and loss of information for a significant period of time after the security breach occurs.
We have invested and continue to invest in technology security initiatives, information-technology risk management, business continuity, and disaster recovery plans, including investments to retire and replace end-of-life systems. The development and maintenance of these measures is costly and requires ongoing monitoring and updating as technologies change and efforts to overcome security measures become increasingly more frequent, intense, and sophisticated. Despite our efforts, we are not fully insulated from data breaches, technology disruptions, data loss, and cyber-fraud, which could adversely impact our competitiveness and results of operations.
While we have significant security processes and initiatives in place, we may be unable to detect or prevent a breach or disruption in the future. Additionally, while we have insurance coverage designed to address certain aspects of cyber risks in place, such insurance coverage may be insufficient to cover all losses or all types of claims that may arise.
Failure to comply with federal, state and foreign laws and regulations relating to privacy, data protection and consumer protection, or the expansion of current laws and regulations or the enactment of new laws or regulations in these areas, could adversely affect our business and our financial condition.
We are subject to a wide variety of laws in the United States and other jurisdictions related to privacy, data protection and consumer protection that are often complex and subject to varying interpretations. As a result, these privacy, data protection and consumer protection laws may change or develop over time through judicial decisions or as new guidance or interpretations are provided by regulatory and governing bodies and such changes or developments may be contrary to our existing practices. This may cause us to expend resources on updating, changing or eliminating some of our privacy and data protection practices.
Our reputation and ability to do business may be impacted by the improper conduct of our employees, agents or business partners.
We have implemented compliance controls, training, policies and procedures designed to prevent and detect reckless or criminal acts from being committed by our employees, agents or business partners that would violate the laws of the jurisdictions in which we operate, including laws governing payments to government officials, such as the U.S. Foreign Corrupt Practices Act, the protection of export controlled or classified information, such as the International Traffic in Arms Regulations (“ITAR”), false claims, procurement integrity, cost accounting and billing, competition, information security and data privacy and the terms of our contracts. This risk of improper conduct may increase as we continue to grow and expand our operations. We cannot ensure, however, that our controls, training, policies and procedures will prevent or detect all such reckless or criminal acts, and we have been adversely impacted by such acts in the past, which have been immaterial in nature. If not prevented, such reckless or criminal acts could subject us to civil or criminal investigations, monetary and non-monetary penalties and suspension and debarment by the U.S. government and could have a material adverse effect on our ability to conduct business, our results of operations and our reputation. In addition, misconduct involving data security lapses resulting in the compromise of personal information or the improper use of our customer’s sensitive or classified information could result in remediation costs, regulatory sanctions against us and serious harm to our reputation and could adversely impact our ability to continue to contract with the U.S. government.
Any failure to offer high-quality aerial firefighting services to customers may harm our relationships with our customers and could adversely affect our reputation, brand, business, financial condition and results of operations.
We strive to create high levels of customer satisfaction and brand trust through our services and the support provided by our employees. Our customers depend on our team to resolve any issues relating to our services, which are often emergencies, in an efficient and accurate manner. Our ability to provide effective and timely services is largely dependent on numerous factors, including our ability to maintain our existing fleet and our ability to attract and retain skilled employees who can support our customers and are sufficiently knowledgeable about our services. As we continue to grow our business and improve our platform, we will face challenges related to providing quality support at scale. Any failure to provide efficient and timely services, or a market perception that we do not maintain high-quality or dependable services, could adversely affect our reputation, brand, business, financial condition and results of operations.
Natural disasters, unusual weather conditions, pandemic or epidemic outbreaks, terrorist acts and political events could disrupt our business.
The occurrence of one or more natural disasters such as fires, tornados, hurricanes, floods and earthquakes, unusual weather conditions, epidemic or pandemic outbreaks, terrorist attacks or disruptive political events where our facilities or the hangars where our aircraft fleets are located, could damage our fleet or other property and adversely affect our business, financial condition and results of operations. Severe weather, such as rainfall, snowfall or extreme temperatures, may impact the ability for our aerial firefighting services to occur as planned, resulting in additional expense to reschedule or cancel altogether, thereby reducing our sales and profitability. Terrorist attacks, actual or threatened acts of war or the escalation of current hostilities, or any other military or trade disruptions impacting our domestic or foreign suppliers of components of our aircraft, may impact our operations by, among other things, causing supply chain disruptions and increases in commodity prices, which could adversely affect our raw materials or transportation costs. To the extent these events also impact one or more of our suppliers or result in the closure of any of their facilities or our facilities, we may be unable to fulfill our other contracts.
We are subject to risks associated with climate change, including the potential increased impacts of severe weather events on our operations and infrastructure, and changes in weather patterns may result in lower demand for our services if such changes result in a reduced risk of wildfires.
All climate change-related regulatory activity and developments may adversely affect our business and financial results by requiring us to reduce our emissions, make capital investments to modernize certain aspects of our operations, purchase carbon offsets, or otherwise pay for our emissions. Such activity may also impact us indirectly by increasing our operating costs.
The potential physical effects of climate change, such as increased frequency and severity of storms, floods, fires, fog, mist, freezing conditions, sea-level rise, and other climate-related events, could affect our operations, infrastructure, and financial results. We could incur significant costs to improve the climate resiliency of our infrastructure and otherwise prepare for, respond to, and mitigate such physical effects of climate change. We are not able to accurately predict the materiality of any potential losses or costs associated with the physical effects of climate change. We believe that rising global temperatures have been, and in the future are expected to be, one factor contributing to increasing rates and severity of wildfires. Climate change and global temperatures are impacted my many variables, however, and cannot be predicted with certainty. If global temperatures were to decrease, then the rate and severity of wildfires may decrease as well, resulting in lower demand for our services.
Our business is dependent on the availability of aircraft fuel. Continued periods of significant disruption in the supply or cost of aircraft fuel could have a significant negative impact on consumer demand, our operating results and liquidity.
We are currently able to obtain adequate supplies of aircraft fuel but we cannot predict the future availability. Natural disasters (including hurricanes or similar events in the U.S. Southeast and on the Gulf Coast, where we have performed our aerial firefighting services), political disruptions or military conflicts involving oil-producing countries, economic sanctions imposed against oil-producing countries or specific industry participants, changes in fuel-related governmental policy, the strength of the U.S. dollar against foreign currencies, changes in the cost to transport or store petroleum products, changes in access to petroleum product pipelines and terminals, speculation in the energy futures markets, changes in aircraft fuel production capacity, environmental concerns and other unpredictable events may result in fuel supply shortages or distribution challenges in the future. Any of these factors or events could cause a disruption in or increased demands on oil production, refinery operations, pipeline capacity or terminal access and possibly result in diminished availability of aircraft fuel supply for our business. The impact of such events may limit our ability to perform our aerial firefighting services, which could result in loss of revenue and adversely affect our ability to provide our services.
System failures, defects, errors or vulnerabilities in our website, applications, backend systems, or other technology systems or those of third-party technology providers could harm our reputation and brand and adversely impact our business, financial condition and results of operations.
Our systems, or those of third parties upon which we rely, may experience service interruptions, outages or degradation because of hardware and software defects or malfunctions, human error, or malfeasance by third parties or our employees, contractors, or service providers, earthquakes, hurricanes, floods, fires, natural disasters, power losses, disruptions in telecommunications services, fraud, military or political conflicts, terrorist attacks, cyberattacks or other events. Our insurance may not be sufficient, and we may not have sufficient remedies available to us from our third-party service providers, to cover all of our losses that may result from such interruptions, outages or degradation.
If we fail to adequately protect our proprietary intellectual property rights, our competitive position could be impaired and we may lose market share, generate reduced revenue and/or incur costly litigation to protect our rights.
Our success depends, in part, on our ability to protect our proprietary intellectual property rights, including certain technologies we utilize in arranging air firefighting services. To date, we have relied primarily on trade secrets and trademarks to protect our proprietary technology. Our software is also subject to certain protection under copyright law, though we have chosen not to register any of our copyrights. We routinely enter into non-disclosure agreements with our employees, consultants, third party aircraft operators and other relevant persons and take other measures to protect our intellectual property rights, such as limiting access to our trade secrets and other confidential information. We intend to continue to rely on these and other means, including patent protection, in the future. However, the steps we take to protect our intellectual property may be inadequate, and unauthorized parties may attempt to copy aspects of our intellectual property or obtain and use information that we regard as proprietary and, if successful, may potentially cause us to lose market share, harm our ability to compete and result in reduced revenue. Moreover, our non-disclosure agreements do not prevent our competitors from independently developing technologies that are substantially equivalent or superior to our products, and there can be no assurance that our competitors or third parties will comply with the terms of these agreements, or that we will be able to successfully enforce such agreements or obtain sufficient remedies if they are breached. There can be no assurance that the intellectual property rights we own or license will provide competitive advantages or will not be challenged or circumvented by our competitors.
Further, obtaining and maintaining patent, copyright and trademark protection can be costly, and we may choose not to, or may fail to, pursue or maintain such forms of protection for our technology in the United States or foreign jurisdictions, which could harm our ability to maintain our competitive advantage in such jurisdictions. It is also possible that we will fail to identify patentable aspects of our technology before it is too late to obtain patent protection, that we will be unable to devote the resources to file and prosecute all patent applications for such technology, or that we will inadvertently lose protection for failing to comply with all procedural, documentary, payment and similar obligations during the patent prosecution process. The laws of some countries do not protect proprietary rights to the same extent as the laws of the United States, and mechanisms for enforcement of intellectual property rights in some foreign countries may be inadequate to prevent other parties from infringing our proprietary technology. To the extent we expand our international activities, our exposure to unauthorized use of our technologies and proprietary information may increase. We may also fail to detect unauthorized use of our intellectual property or be required to expend significant resources to monitor and protect our intellectual property rights, including engaging in litigation, which may be costly, time-consuming, and divert the attention of management and resources and may not ultimately be successful. If we fail to meaningfully establish, maintain, protect and enforce our intellectual property rights, our business, financial condition and results of operations could be adversely affected.
We use open-source software in connection with our platform, which may pose risks to our intellectual property.
We use open source software in connection with our technology products and plan to continue using open- source software in the future. Some licenses governing the use of open-source software contain requirements that we make available source code for modifications or derivative works we create based upon the open-source software. If we combine or link our proprietary source code with open-source software in certain ways, we may be required, under the terms of the applicable open-source licenses, to make our proprietary source code available to third parties. Although we monitor our use of open-source software, we cannot provide assurance that all open-source software is reviewed prior to use in our platform, that our developers have not incorporated open-source software into our platform that we are unaware of, or that they will not do so in the future. Additionally, the terms of open-source licenses have not been extensively interpreted by United States or international courts, and so there is a risk that open-source software licenses could be construed in a manner that imposes unanticipated conditions or restrictions on us or our proprietary software. If an author or other third party that distributes such open-source software were to allege that we had not complied with the conditions of an open-source license, we could incur significant legal costs defending ourselves against such allegations or remediating any alleged non-compliance with open-source licenses. Any such remediation efforts could require significant additional resources, and we may not be able to successfully complete any such remediation. Further, in addition to risks related to license requirements, use of certain open-source software can lead to greater risks than use of third-party commercial software, as open-source licensors generally do not provide warranties, and the open-source software may contain security vulnerabilities.
Our insurance may become too difficult or expensive for us to obtain or maintain. Increases in insurance costs or reductions in insurance coverage may materially and adversely impact our results of operations and financial position.
As the owners and operators of certain aircraft, we maintain general liability aviation premise insurance, non-owned aircraft liability coverage and directors and officers insurance, and we believe our level of coverage is customary in the industry and adequate to protect against claims. However, there can be no assurance that it will be sufficient to cover potential claims or that present levels of coverage will be available in the future at reasonable cost. Additionally, replacement aircraft, especially new Super Scoopers, may not be readily available for purchase, potentially resulting in lost revenue for extended periods of time. Further, we expect our insurance costs to increase as we anticipate adding aircraft, expanding our services, and entering into new markets.
We are highly dependent on our senior management team and other highly skilled personnel with unique skills. We will need to be able to continue to grow our workforce with highly skilled workers in the future. If we are not successful in attracting or retaining highly qualified personnel, we may not be able to successfully implement our business strategy.
Our success depends, in significant part, on the continued services of our senior management team and on our ability to attract, motivate, develop, and retain a sufficient number of other highly skilled personnel, including finance, marketing, sales, and technology and support personnel. We believe that the breadth and depth of our senior management team’s experience across multiple industries will be instrumental to our success. The loss of any one or more members of our senior management team, for any reason, including resignation or retirement, could impair our ability to execute our business strategy and have a material adverse effect on our business, financial condition, and results of operations. Additionally, our financial condition and results of operations may be adversely affected if we are unable to attract and retain skilled employees to support our operations and growth. In particular, Mr. Timothy Sheehy, our Chief Executive Officer, Co-Founder and a Director of Bridger, will resign as Chief Executive Officer if he is elected to U.S. Senate, as further described in the risk factor immediately below.
We are highly dependent on the services of Mr. Timothy Sheehy, our Chief Executive Officer, Co-Founder and a Director of Bridger, who is currently running for a seat in the U.S. Senate.
We are highly dependent on the services of Mr. Sheehy, the Company’s Chief Executive Officer, Co-Founder and Director. On June 27, 2023, Mr. Sheehy announced his entrance into the 2024 race for the U.S. Senate for the State of Montana. During his candidacy, Mr. Sheehy has continued to serve as our Chief Executive Officer with the continued support of Bridger’s existing management team, and Mr. Sheehy has not publicly announced a specific intention of resigning as our Chief Executive Officer. However, in the event that Mr. Sheehy is elected to serve as a U.S. Senator for the State of Montana, Mr. Sheehy would be required to resign as an officer and director of the Company pursuant to certain conflict of interest rules contained in the Senate Code of Official Conduct. The loss of Mr. Sheehy as an officer and director of the Company could adversely affect our business because this could make it more difficult to, among other things, compete with other market participants, manage our operations, execute our growth strategy and retain existing customers or cultivate new ones.
Although Mr. Sheehy continues to spend significant time with Bridger and remain highly active in our management during his candidacy, he has not devoted his full time and attention to Bridger. Mr. Sheehy has spent, and expects to continue to spend, time campaigning for the U.S. Senate seat.
Additionally, Mr. Sheehy and we may be the targets of one or more negative media campaigns in connection with Mr. Sheehy’s U.S. Senate campaign. Public perception of, or news related to, Mr. Sheehy or his U.S. Senate campaign may adversely affect our brand, relationship with customers, suppliers, employees or other of our stakeholders or our standing in the industry, any of which could materially impair our business and results of operations.
Our business may be adversely affected by labor and union activities.
None of our employees are currently represented by a labor union. However, it is common throughout the aerospace industry generally for many employees at aerospace companies to belong to a union, which can result in higher employee costs and increased risk of work stoppages. We may also directly and indirectly depend upon other companies with unionized work forces, such as parts suppliers and trucking and freight companies, and work stoppages or strikes organized by such unions could harm our business, financial condition or operating results.
Past performance by our management team or their respective affiliates may not be indicative of future performance of an investment in us.
Our management team has successfully grown and exited prior business ventures, including Ascent Vision Technologies by our founders, Mr. Matthew Sheehy and Mr. Timothy Sheehy. Any past experience or performance of our management team and their respective affiliates is not a guarantee of success with respect to Bridger.
We have entered into ground leases with terms of twenty (20) years and ten (10) years with the Gallatin Airport Authority (the “Airport Authority”) for each of our hangars. If the Airport Authority declines to renew any of our ground leases, our operations and results of operations could be materially and adversely impacted.
Our current hangars are located on certain land owned by the Airport Authority and leased to our subsidiaries. The initial term of each Ground Lease is either twenty (20) years or ten (10) years from its respective commencement date. These hangars are critical to our ability to provide maintenance on our aircraft. If the Airport Authority terminates our leases, or refuses to renew them when expired, we may incur significant costs to locate suitable alternative hangar locations and may incur increased costs to modify any replacement hangars for our business, and the process may require significant management attention.
Our lack of diversification with respect to the aircraft we use may subject us to negative economic, competitive and regulatory developments that disproportionately impact our aviation assets as compared to other fire suppression aircraft or alternative fire suppression services, which could adversely affect our ability to market and sell our services and our reputation.
Our fleet is comprised mainly of CL-415EAF aircraft, which is currently limited in supply (see the section of this Annual Report on Form 10-K entitled “Risk Factors — There is a limited supply of new CL-415EAF aircraft to purchase, and an inability to purchase additional CL-415EAF aircraft could impede our ability to increase our revenue and net income.”). Furthermore, regulations or restrictions that cause us to ground the fleet after a safety or maintenance event, whether or not in connection with us or our services, have the potential to significantly affect our ability to carry out our operations and generate revenue. A similar incident could also damage our reputation or the perception of safety or efficacy of the CL-415EAF in fighting wildfires, which could negatively impact our business and results of operations.
Any delays in the development, design and engineering of our products and services may adversely impact our business, financial condition and results of operations.
We have previously experienced, and may experience in the future, delays or other complications in the design, production, delivery and servicing ramp of our systems, products, technologies, services, and related technology. If delays like this arise or recur, if our remediation measures and process changes do not continue to be successful or if we experience issues with design and safety, we could experience issues or delays in increasing production further.
If we encounter difficulties in scaling our delivery or servicing capabilities, if we fail to develop and successfully commercialize our products and services, if we fail to develop such technologies before our competitors, or if such technologies fail to perform as expected, are inferior to those of our competitors or are perceived to offer less mission assurance than those of our competitors, our business, financial condition and results of operations could be materially and adversely impacted.
Seasonality Risks
There is a seasonal fluctuation in the need to fight forest fires based upon location. A significant portion of our total revenue currently occurs during the second and third quarters of the year due to the North American fire season, and the intensity of the fire season varies from year to year. As a result, our operating results may fluctuate significantly from quarter to quarter and from year to year.
Our quarterly and annual operating results may fluctuate significantly, which makes our future operating results difficult to predict and could cause our operating results to fall below expectations or any guidance we may provide. These fluctuations may occur due to a variety of factors, many of which are outside of our control, including but not limited to: forest fires tend to have a higher occurrence during the summer months and during times of drought, but are ultimately unpredictable; climate change and changes in global temperatures occur over time; unexpected weather patterns, natural disasters or other events that increase or decrease the rate or intensity of wildfires or impair our ability to perform firefighting services; changes in governmental regulations or in the status of our regulatory approvals or applications. The individual or cumulative effects of factors discussed above could result in large fluctuations and unpredictability in our quarterly and annual operating results. As a result, comparing our operating results on a period-to-period basis may not be meaningful or be a good indication of our current or future performance. For example, due to the condensed and less intense 2023 wildfire season, we experienced a decrease in demand for our wildfire surveillance, relief and suppression and aerial firefighting services and had less flight hours and standby days than prior years, which negatively impacted our results of operations for the 2023 wildfire season.
This variability and unpredictability could also result in our failing to meet the expectations of industry or financial analysts or investors for any period. If our revenue or operating results fall below the expectations of analysts or investors or below any guidance we may provide, or if any guidance we provide is below the expectations of analysts or investors, the price of our common stock could decline substantially. Such a stock price decline could occur even when we have met any previously publicly stated guidance we may provide. Furthermore, if we are unable to obtain access to working capital or if seasonal fluctuations are greater than anticipated, there could be a material adverse effect on our financial condition, results of operations or cash flows.
Extreme weather, drought and shifting climate patterns have intensified the challenges associated with many of the risks facing the Company, particularly wildfire management.
Extreme weather, drought and shifting climate patterns have intensified the challenges associated with many of the other risks facing our business, particularly wildfire management. Our service territory encompasses some of the most densely forested areas in the United States and, as a consequence, is subject to risks from vegetation- related ignition events. Further, environmental extremes, such as drought conditions and extreme heat followed by periods of wet weather, can drive additional vegetation growth (which can then fuel fires) and influence both the likelihood and severity of extraordinary wildfire events. Contributing factors other than environmental can include local land use policies and historical forestry management practices. The combined effects of extreme weather and climate change also impact this risk.
Further, we have been studying the potential effects of climate change (increased severity and frequency of storm events, sea level rise, land subsidence, change in temperature extremes, changes in precipitation patterns and drought, and wildfire) on Bridger’s assets, operations and services, and we are developing adaptation plans to set forth a strategy for those events and conditions that we believe are most significant. Consequences of these climate-driven events may vary widely and could include increased stress on our services due to new patterns of demand, physical damage to our fleet and infrastructure, higher operational costs and an increase in the number requests for our services. In addition, we could incur substantial costs to repair or replace aircraft and facilities.
Events or conditions caused by climate change could have a greater impact on our operations than our studies suggest and could result in a fluctuation in revenues and expenses. Conversely, the impact could be less than we anticipate, which we expect would result in reduce demand for our aerial firefighting services.
The substantial majority of our revenue currently is concentrated in the Western United States.
Currently, the substantial majority of our revenue is generated in the states of the United States located west of the Mississippi River, and if the weather patterns result in fewer wildfires in this region, demand for “flight hour” services would decrease and potentially result in a material decrease in revenue or net income.
Sales and Customer Risks
The aerial firefighting industry is expected to grow in the near future and is volatile, and if it does not develop, if it develops slower than we expect, if it develops in a manner that does not require use of our services, if it encounters negative publicity or if our solution does not drive commercial or governmental engagement, the growth of our business will be harmed.
The market for aerial firefighting is still rapidly evolving, characterized by rapidly changing technologies, competitive pricing and competitive factors, evolving government regulation and industry standards, and changing customer demands and behaviors. If the market for our services in general does not develop as expected, or develops more slowly than expected, our business, prospects, financial condition and operating results could be harmed.
In the future, there may be other businesses who attempt to provide the services that we provide, or our main private competitors could attempt to increase operations. In the future, federal, state and local governments and foreign governments may also decide to directly provide such services.
The industry in which we operate may become increasingly competitive as a result of the expansion of the demand for aerial firefighting operations or the entrance of federal, state, and local governments and foreign governments into the aerial firefighting space. We compete against a number of private operators with different business models, and new entrants may begin offering aerial firefighting services. Factors that affect competition in our industry include price, reliability, safety, regulations, professional reputation, aircraft availability, equipment and quality, consistency and ease of service, and willingness and ability to serve specific regions. There can be no assurance that our competitors will not be successful in capturing a share of our present or potential customer base. Certain governments may decide a government owned, government operated model is preferable, from a cost perspective or otherwise, to perform aerial firefighting services directly or to own their own aircraft and contract with independent operators. The materialization of any of these risks could adversely affect our business, financial condition and results of operations.
If we experience harm to our reputation and brand, our business, financial condition and results of operations could be adversely affected.
Continuing to increase the strength of our reputation and brand for reliable, experience-driven and cost- effective aerial firefighting services is critical to our ability to attract and retain qualified aircraft operators. In addition, our growth strategy may include international expansion through joint ventures, minority investments or other partnerships with local companies, as well as event activations and cross-marketing with other established brands, all of which benefit from our reputation and brand recognition. If we fail to protect our reputation and brand recognition, it could adversely affect our business, financial condition and results of operations.
We have government customers, which subjects us to risks including early termination, audits, investigations, sanctions and penalties. We are also subject to regulations applicable to government contractors which increase our operating costs and if we fail to comply, could result in the termination of our contracts with government entities.
We derive a substantial portion of our revenue from contracts with the U.S. government (accounting for approximately 72% and 96% of our total revenue for the years ended December 31, 2023 and 2022, respectively) and may enter into additional contracts with the U.S. or foreign governments in the future. This subjects us to statutes and regulations applicable to companies doing business with the government, including the FAA. These government contracts customarily contain provisions that give the government substantial rights and remedies, many of which are not typically found in commercial contracts and which are unfavorable to contractors. For instance, most U.S. government agencies include provisions that allow the government to unilaterally terminate or modify contracts for convenience, and in that event, the counterparty to the contract may generally recover only its incurred or committed costs and settlement expenses and profit on work completed prior to the termination. In addition, as a small business, we have been awarded certain government contracts based on our status under the applicable regulations of the Small Business Association. If we continue to expand and are unable to maintain this small business status, we may no longer be eligible to utilize the small business status to grow our business. If the government terminates a contract for default, the defaulting party may be liable for any extra costs incurred by the government in procuring undelivered items from another source.
All of our federal and state government contracts (accounting for approximately 88% and 99% of our total revenue for the years ended December 31, 2023 and 2022, respectively) are subject to the annual approval of appropriations being made by the applicable state or federal legislative bodies to fund the expenditures under these contracts. In addition, government contracts normally contain additional requirements that may increase our costs of doing business, reduce our profits, and expose us to liability for failure to comply with these terms and conditions. These requirements include, for example:
•specialized disclosure and accounting requirements unique to government contracts;
•financial and compliance audits that may result in potential liability for price adjustments, recoupment of government funds after such funds have been spent, civil and criminal penalties or administrative sanctions such as suspension or debarment from doing business with the U.S. government;
•public disclosures of certain contract and company information; and
•mandatory socioeconomic compliance requirements, including labor requirements, non-discrimination and affirmative action programs and environmental compliance requirements.
Government contracts are also generally subject to greater scrutiny by the government, which can initiate reviews, audits and investigations regarding our compliance with government contract requirements. In addition, if we fail to comply with government contracting laws, regulations and contract requirements, our contracts may be subject to termination, and we may be subject to financial and/or other liability under our contracts, the Federal Civil False Claims Act (including treble damages and other penalties) or criminal law. In particular, the False Claims Act’s “whistleblower” provisions also allow private individuals, including present and former employees, to sue on behalf of the U.S. government. Any penalties, damages, fines, suspension or damages could adversely affect our ability to operate our business and our financial results.
The U.S. government’s budget deficit and the national debt, as well as any inability of the U.S. government to complete its budget process for any government fiscal year and consequently having to shut down or operate on funding levels equivalent to its prior fiscal year pursuant to a “continuing resolution,” could have an adverse impact on our business, financial condition, results of operations and cash flows.
Considerable uncertainty exists regarding how future budget and program decisions will unfold, including the aerial firefighting spending priorities of the U.S. government, what challenges budget reductions will present for the aerial firefighting industry and whether annual appropriations bills for all agencies will be enacted for U.S. government fiscal year 2024 and thereafter due to many factors, including but not limited to, changes in the political environment, including before or after a change to the leadership within the government administration, and any resulting uncertainty or changes in policy or priorities and resultant funding. The U.S. government’s budget deficit and the national debt could have an adverse impact on our business, financial condition, results of operations and cash flows in a number of ways, including the following:
•The U.S. government could reduce or delay its spending on, reprioritize its spending away from, or decline to provide funding for the government programs in which we participate;
•U.S. government spending could be impacted by alternate arrangements to sequestration, which increases the uncertainty as to, and the difficulty in predicting, U.S. government spending priorities and levels; and
•We may experience declines in revenue, profitability and cash flows as a result of reduced or delayed orders or payments or other factors caused by economic difficulties of our customers and prospective customers, including U.S. federal, state and local governments.
Furthermore, we believe continued budget pressures could have serious negative consequences for the aerial firefighting industrial base and the customers, employees, suppliers, investors and communities that rely on companies in the aerial firefighting industrial base. Budget and program decisions made in this environment would have long-term implications for us and the entire aerial firefighting industry.
We depend significantly on U.S. government contracts, which often are only partially funded, subject to immediate termination, and heavily regulated and audited. The termination or failure to fund, or negative audit findings for, one or more of these contracts could have an adverse impact on our business, financial condition, results of operations and cash flows.
Over its lifetime, a U.S. government program may be implemented by the award of many different individual contracts and subcontracts. The funding of U.S. government programs is subject to U.S. Congressional appropriations. In recent years, U.S. government appropriations have been affected by larger U.S. government budgetary issues and related legislation. Although multi-year contracts may be authorized and appropriated in connection with major procurements, Congress generally appropriates funds on a government fiscal year basis. Procurement funds are typically made available for obligation over the course of one to three years. Consequently, programs often initially receive only partial funding, and additional funds are obligated only as Congress authorizes further appropriations. As a result of the restrictions on the authority of federal agencies to obligate federal funds without annual appropriations from Congress, most of our contracts are structured for one base year with options for up to four additional years. We cannot predict the extent to which total funding and/or funding for individual programs will be included, increased or reduced as part of the annual appropriations process ultimately approved by Congress and the President of the United States or in separate supplemental appropriations or continuing resolutions, as applicable. The termination of funding for a U.S. government program would result in a loss of anticipated future revenue attributable to that program, which could have an adverse impact on our operations. In addition, the termination of a program or the failure to commit additional funds to a program that already has been started could result in lost revenue and increase our overall costs of doing business.
Generally, U.S. government contracts are subject to oversight audits by U.S. government representatives. Such audits could result in adjustments to our contract costs. Any costs found to be improperly allocated to a specific contract will not be reimbursed, and such costs already reimbursed must be refunded. We have recorded contract revenue based on costs we expect to realize upon final audit. However, we do not know the outcome of any future audits and adjustments, and we may be required to materially reduce our revenue or profits upon completion and final negotiation of audits. Negative audit findings could also result in termination of a contract, forfeiture of profits, suspension of payments, fines or suspension or debarment from U.S. Government contracting or subcontracting for a period of time.
In addition, U.S. government contracts generally contain provisions permitting termination, in whole or in part, without prior notice at the U.S. government’s convenience upon payment only for work done and commitments made at the time of termination. For some contracts, we are a subcontractor and not the prime contractor, and in those arrangements, the U.S. Government could terminate the prime contractor for convenience without regard for our performance as a subcontractor. We can give no assurance that one or more of our U.S. government contracts will not be terminated under those circumstances. Also, we can give no assurance that we would be able to procure new contracts to offset the revenue or backlog lost as a result of any termination of our U.S. government contracts. Because a significant portion of our revenue is dependent on our performance and payment under our U.S. government contracts, the loss of one or more large contracts could have a material adverse impact on our business, financial condition, results of operations and cash flows.
Our U.S. government business also is subject to specific procurement regulations and a variety of socioeconomic and other requirements. These requirements, although customary in U.S. government contracts, increase our performance and compliance costs. These costs might increase in the future, thereby reducing our margins, which could have an adverse effect on our business, financial condition, results of operations and cash flows. In addition, the U.S. government has and may continue to implement initiatives focused on efficiencies, affordability and cost growth and other changes to its procurement practices. These initiatives and changes to procurement practices may change the way U.S. government contracts are solicited, negotiated and managed, which may affect whether and how we pursue opportunities to provide our products and services to the U.S. government, including the terms and conditions under which we do so, which may have an adverse impact on our business, financial condition, results of operations and cash flows. For example, contracts awarded under the United States Department of Defense’s Other Transaction Authority for research and prototypes generally require cost-sharing and may not follow, or may follow only in part, standard U.S. government contracting practices and terms, such as the Federal Acquisition Regulation and Cost Accounting Standards.
Failure to comply with applicable regulations and requirements could lead to fines, penalties, repayments, or compensatory or treble damages or suspension or debarment from U.S. government contracting or subcontracting for a period of time. Among the causes for debarment are violations of various laws and regulations, including those related to procurement integrity, export control (including ITAR), U.S. government security, employment practices, protection of the environment, accuracy of records, proper recording of costs and foreign corruption. The termination of a U.S. government contract or relationship as a result of any of these acts would have an adverse impact on our operations and could have an adverse effect on our standing and eligibility for future U.S. government contracts.
We may be blocked from or limited in providing or offering our services in certain jurisdictions and may be required to modify our business model in those jurisdictions as a result.
We face regulatory obstacles, including those lobbied for in local government, which could prevent us from operating our aerial firefighting services. We may incur significant costs in defending our right to operate in accordance with our business model in many jurisdictions. To the extent that efforts to block or limit our operations are successful, or we or third-party aircraft operators are required to comply with regulatory and other requirements applicable to our services, our revenue and growth would be adversely affected.
We may enter into firefighting contracts in the future with foreign governments, which may result in increased compliance and oversight risks and expenses.
If we enter into contracts with foreign governments in the future, we may be subject to further regulations and complicated procurement processes that require significant expense and/or management attention. Additionally, contracts with foreign governments often necessitate higher levels of compliance and oversight functions, which could increase our costs, making us less competitive and hurting our results from operations.
We may be unable to manage our future growth effectively, which could make it difficult to execute our business strategy.
If our operations continue to grow as planned, of which there can be no assurance, we will need to expand our sales, marketing, operations and the number of aircraft that we own and operate in connection with our aerial firefighting services. Our continued growth could increase the strain on our resources, and we could experience operating difficulties, including difficulties in hiring, training and managing an increasing number of employees. These difficulties may result in the erosion of our brand image, divert the attention of management and key employees and impact financial and operational results. In addition, in order to continue to increase our presence, we expect to incur substantial expenses and capital expenditures as we continue to attempt to increase our coverage areas, aircraft fleet and employee base. The continued expansion of our business may also require additional space for administrative support. If we are unable to drive commensurate growth, these costs, which include lease commitments, marketing costs and headcount, could result in decreased margins, which could have a material adverse effect on our business, financial condition and results of operations.
We rely on a few large customers for a majority of our business, and the loss of any of these customers, significant changes in the prices, marketing allowances or other important terms provided to any of these customers or adverse developments with respect to the financial condition of these customers could materially reduce our net income and operating results.
Our total revenues are concentrated among a small number of large customers. Sales to our three largest customers in the aggregate represented 88%, sales to our largest customer represented 65% of our total revenues for the year ended December 31, 2023, and two customers that accounted for 73% of accounts receivable as of December 31, 2023. Sales to our three largest customers in the aggregate represented 99%, sales to our largest customer represented 95% of our total revenues for the year ended December 31, 2022, and one customer that accounted for 62% of accounts receivable as of December 31, 2022. We are under continued pressure from our major customers to offer lower prices, extended payment terms, increased marketing and other allowances and other terms more favorable to these customers because our sales to these customers are concentrated, and the market in which we operate is very competitive. These customer demands have put continued pressure on our operating margins and profitability, resulted in periodic negotiations in connection with open requests for proposals to provide more favorable prices and terms to these customers and significantly increased our working capital needs. In addition, this customer concentration leaves us vulnerable to any adverse change in the financial condition of these customers. Changes in terms with, significant allowances for and collections from these customers could affect our operating results and cash flows. The loss of our main customers could adversely affect our business.
Our cash flow and profitability could be reduced if expenditures are incurred prior to the final receipt of a contract.
We provide services on behalf of our customers under various contractual arrangements. From time to time, in order to ensure that we satisfy our customers’ requirements and time-sensitive needs, we may elect to initiate procurement in advance of receiving final authorization from the government customer or a prime contractor. If our government or prime contractor customer’s requirements should change or if the government or the prime contractor should direct the anticipated procurement to another contractor, or if the anticipated contract award does not materialize, our investment might be at risk. This could reduce anticipated earnings or result in a loss, negatively affecting our cash flow and profitability.
If we are not able to successfully enter into new markets and offer new services and enhance our existing offerings, our business, financial condition and results of operations could be adversely affected.
Our growth will depend in part on our ability to successfully enter into new markets and expand on our existing services. Significant changes to our existing services may require us to obtain and maintain applicable permits, authorizations or other regulatory approvals. If these new services are unsuccessful or fail to attract a sufficient number of customers to be profitable, or we are unable to bring new or expanded services to market efficiently, our business, financial condition and results of operations could be adversely affected. Furthermore, new demands regarding our services, including the availability of superior services or a deterioration in the quality of our existing services, could negatively affect the attractiveness of our platform and the economics of our business and require us to make substantial changes to and additional investments in our routes or our business model. Developing and launching new services or enhancements to our existing services involves significant risks and uncertainties, including risks related to the reception of such services by existing and potential future customers, increases in operational complexity, unanticipated delays or challenges in implementing such services or enhancements, increased strain on our operational and internal resources (including an impairment of our ability to accurately forecast flier demand and the number of customers using our platform) and negative publicity in the event such new or enhanced routes are perceived to be unsuccessful. We have scaled our business rapidly, and significant new initiatives have in the past resulted in such operational challenges affecting our business. In addition, developing and launching new services and enhancements to our existing services may involve significant upfront investment, such as purchasing additional aircraft, and such investments may not generate return on investment.
Supplier Risks
We rely on a limited number of suppliers for certain raw materials and supplied components. We may not be able to obtain sufficient raw materials or supplied components to meet our maintenance or operating needs or obtain such materials on favorable terms or at all, which could impair our ability to provide our services in a timely manner or increase our costs of services and maintenance.
Our ability to produce our current and future systems, technologies and services and other components of operation is dependent upon sufficient availability of raw materials and supplied components, which we secure from a limited number of suppliers. Our reliance on suppliers to secure raw materials and supplied components exposes us to volatility in the prices and availability of these materials. We may not be able to obtain sufficient supplies of raw materials or supplied components on favorable terms or at all, which could result in delays in the provision of our services, our ability to repair and service our assets, or increased costs, any of which could harm our business, financial condition and results of operations. In particular, we rely on Viking, the manufacturer of our Super Scooper aircraft and an affiliate of LAS, to source and acquire the parts and materials needed to maintain our Super Scoopers and Bridger has not identified a readily available alternative supplier for certain of such parts. If we are unable to obtain (including as a result of a disruption to Viking’s business operations or supply lines) the necessary parts and materials to maintain our Super Scooper aircraft from Viking, and if we are unable to identify an alternative supplier for such parts and materials in a timely manner, then our business operations, including the maintenance and performance of our Super Scooper aircraft, and results of operations would be adversely affected.
Additionally, to maintain compliance with certain contractual structural inspection and analysis requirements under our agreements with the USFS, on January 5, 2021 we entered into Amendment 8 (SSLMP) (the “SSLMP Amendment”) to the LAS Purchase Agreement, for Viking’s provision of a Supplemental Structural Life Management Program. Viking agreed to provide us with a 5-year subscription service to a Super Scooper life management program based on the applicable FAA advisory material related to fatigue management and supplemental structural inspection programs, for which we pay a fixed subscription price. Viking does not have a termination for convenience right in respect of the services rendered pursuant to the SSLMP Amendment. If such services are nonetheless terminated or if Viking ceases to perform its obligations in respect thereof, or if we are unable to renew such services, then our business operations could be significantly disrupted and our results of operations could be adversely affected.
There is a limited supply of new CL-415EAF aircraft to purchase, and an inability to purchase additional CL-415EAF aircraft could impede our ability to increase our revenue and net income.
Currently, a majority of our revenue derives from services performed by the CL-415EAF. LAS has only made a limited number of CL-415EAFs available for sale between 2020 and 2025. If we continue to focus operations on a single airframe for fire suppression and we do not expand our fleet to other aircraft, our operations may be impacted by the limited supply of new CL-415EAF aircraft available to purchase, which creates a revenue ceiling until additional aircraft can be produced or acquired, which could adversely affect our results of operation and ability to obtain efficiencies of scale.
We currently rely and will continue to rely on third-party partners to provide and store the parts and components required to service and maintain our aircraft, and to supply critical components and systems, which exposes us to a number of risks and uncertainties outside our control. Disputes with our suppliers or the inability of our suppliers to perform, or our key suppliers to timely deliver our components, parts or services, could cause our services to be provided in an untimely or unsatisfactory manner.
We are substantially reliant on our relationships with our suppliers and service providers for the parts and components in our aircraft. If any of these suppliers or service partners were to experience delays, disruptions, capacity constraints or quality control problems in their manufacturing operations, or if they choose to not do business with us, we would have significant difficulty in procuring and preparing our aircraft for service, and our business prospects would be significantly harmed. These disruptions would negatively impact our revenues, competitive position and reputation. In addition, our suppliers or service partners may rely on certain state tax incentives that may be subject to change or elimination in the future, which could result in additional costs and delays in production if a new manufacturing site must be obtained. Further, if we are unable to successfully manage our relationship with our suppliers or service partners, the quality and availability of our aircraft may be harmed. Our suppliers or service partners could, under some circumstances, decline to accept new purchase orders from or otherwise reduce their business with us. If our suppliers or service partners stopped manufacturing our aircraft components for any reason or reduced manufacturing capacity, we may be unable to replace the lost manufacturing capacity on a timely and comparatively cost-effective basis, which would adversely impact our operations.
The manufacturing facilities of our suppliers or service partners and the equipment used to manufacture the components for our aircraft would be costly to replace and could require substantial lead time to replace and qualify for use. The manufacturing facilities of our suppliers or service partners may be harmed or rendered inoperable by natural or man-made disasters, including earthquakes, flooding, fire and power outages, or by public health issues, which may render it difficult or impossible for us to manufacture our aircraft for some period of time. The inability to manufacture our aircraft components or the backlog that could develop if the manufacturing facilities of our suppliers or service partners are inoperable for even a short period of time may result in the loss of customers or harm our reputation.
We do not control our suppliers or service partners or such parties’ labor and other legal compliance practices, including their environmental, health and safety practices. If our current suppliers or service partners, or any other suppliers or service partners which we may use in the future, violate U.S. or foreign laws or regulations, we may be subjected to extra duties, significant monetary penalties, adverse publicity, the seizure and forfeiture of products that we are attempting to import or the loss of our import privileges. The effects of these factors could render the conduct of our business in a particular country undesirable or impractical and have a negative impact on our operating results.
Legal and Regulatory Risks
Our business is subject to a wide variety of additional extensive and evolving government laws and regulations. Failure to comply with such laws and regulations could have a material adverse effect on our business.
We are subject to a wide variety of laws and regulations relating to various aspects of our business, including with respect to employment and labor, health care, tax, privacy and data security, health and safety, and environmental issues. Laws and regulations at the foreign, federal, state and local levels frequently change, especially in relation to new and emerging industries, and we cannot always reasonably predict the impact from, or the ultimate cost of compliance with, current or future regulatory or administrative changes. We monitor these developments and devote a significant amount of management’s time and external resources towards compliance with these laws, regulations and guidelines, and such compliance places a significant burden on management’s time and other resources, and it may limit our ability to expand into certain jurisdictions. Moreover, changes in law, the imposition of new or additional regulations or the enactment of any new or more stringent legislation that impacts our business could require us to change the way we operate and could have a material adverse effect on our sales, profitability, cash flows and financial condition.
Failure to comply with these laws, such as with respect to obtaining and maintaining licenses, certificates, authorizations and permits critical for the operation of our business, may result in civil penalties or private lawsuits, or the suspension or revocation of licenses, certificates, authorizations or permits, which would prevent us from operating our business. For example, aerial firefighting and the operation of any aircraft in the United States require licenses and permits from the FAA and review by other agencies of the U.S. government, including the USFS and the DOI. License approval can include an interagency review of safety, operational, national security, and foreign policy and international obligations implications, as well as a review of foreign ownership.
Compliance with existing or new laws can delay our operations and impair our ability to fully utilize our assets. For example, each of the aircraft acquired and operated by us is subject to a conformance and registration process with the FAA prior to use in commercial operations. This conformance carding and registration process takes some time and can be delayed from time to time due to events outside of our control, including such events as federal government shutdowns or slowdowns in operations of the FAA.
Additionally, regulation of our industry is still evolving, and new or different laws or regulations could affect our operations, increase direct compliance costs for us or cause any third-party suppliers or contractors to raise the prices they charge us because of increased compliance costs. Application of these laws to our business may negatively impact our performance in various ways, limiting the collaborations we may pursue, further regulating the export and re-export of our services and technology from the United States and abroad and increasing our costs and the time necessary to obtain required authorization. The adoption of a multi-layered regulatory approach to any one of the laws or regulations to which we are or may become subject, particularly where the layers are in conflict, could require changes to the performance of our services or operational parameters which may adversely impact our business. We may not be in complete compliance with all such requirements at all times and, even when we believe we are in complete compliance, a regulatory agency may determine that we are not.
Our operations are subject to various federal, state and local laws and regulations governing health and the environment.
We are subject to a wide variety of various federal, state and local laws and regulations governing health and the environment due to the nature of our operations. Changes in the legal and or regulatory framework relating to the environment could have significant impact on our operations. For example, certain local land use policies and forestry management practices could be restricted to reduce the construction and development of residential and commercial projects in high-risk fire areas, which could lead to a reduction in demand for our services. Likewise, certain or future state and local water use and access policies could restrict our ability to access the bodies of water necessary to combat wildfires with our existing fire suppression aircraft. In the future, we may be unable to secure exemptions to these policies, and demand for our services could decrease. If these or any other change in the legal or regulatory framework relating to the environmental impact the operation of our business and the provision of our services, our costs, revenue and results of operations may be adversely affected.
Financial and Capital Strategy Risks
We may require substantial additional funding to finance our operations and growth strategy, but adequate additional financing may not be available when we need it, on acceptable terms, or at all, and our ability to pursue equity financings may depend in part, on the market price of our Common Stock.
We financed our operations and capital expenditures during 2022 and 2023 primarily through private financing rounds, including the $160.0 million aggregate municipal bond financing that closed on July 21, 2022 and August 10, 2022. In the future, we could be required to raise capital through public or private financing or other arrangements. Such financing may not be available on acceptable terms, or at all, and our failure to raise capital when needed could harm our business. We may sell equity securities or debt securities in one or more transactions at prices and in a manner as we may determine from time to time for general corporate purposes or for specific purposes, including in order to pursue growth initiatives. Any debt financing, if available, may involve restrictive covenants and could reduce our operational flexibility or profitability. If we sell any securities in subsequent transactions, our current investors may be materially diluted. If we cannot raise funds on acceptable terms, we may not be able to grow our business or respond to competitive pressures. In addition, our ability to generate proceeds from equity financings will significantly depend on the market price of our Common Stock. For so long as the market price of our Common Stock is below the exercise price of our Warrants ($11.50 per share), our Warrants remain “out-of-the-money,” and our Warrant Holders are unlikely to cash exercise their Warrants, resulting in little or no cash proceeds to us. There can be no assurance that our Warrants will be in the money prior to their January 24, 2028 expiration date, and therefore, we may not receive any proceeds from the exercise of Warrants to fund our operations.
We currently have a shelf registration statement on Form S-3 effective and an existing “at-the-market” offering program. However, SEC regulations limit the amount that companies with a public float of less than $75 million may raise during any 12-month period pursuant to a shelf registration statement on Form S-3. Under General Instruction I.B.6 to Form S-3 (the “Baby Shelf Rule”), the amount of funds a company can raise through primary public offerings of securities in any 12-month period using a registration statement on Form S-3 pursuant to the Baby Shelf Rule is limited to one-third of the aggregate market value of its shares of common stock held by non-affiliates of the company. Currently, we are constrained by the Baby Shelf Rule. If we are required or choose to file a new registration statement on a form other than Form S-3, we may incur additional costs and be subject to delays due to review by the SEC staff.
In connection with the acquisition of the Spanish Scoopers by a subsidiary of MAB, we entered into a Services Agreement (the “MAB Services Agreement”) with such subsidiary that provides that, subject to the Company’s existing debt obligations, Bridger must apply the net cash proceeds from (i) 75% of the net cash proceeds of the issuance of equity securities in excess of $1.8 million, (ii) the net cash proceeds of the sale of equity interests, assets or properties other than in the ordinary course, (iii) the net cash proceeds of the incurrence of indebtedness in excess of $5 million, other than refinancing indebtedness, and (iv) the net cash proceeds of any sale, sale leaseback or other fundamental corporate transaction, in each case, towards the purchase of the Spanish Scoopers and/or other payment obligations under the Agreement. As a result, our use of proceeds from additional funding will be restricted during the term of the MAB Services Agreement. Additionally, the MAB Services Agreement restricts us from acquiring, leasing or operating any new Super Scooper or other firefighting aircraft during the term of the Agreement, excluding the Super Scoopers and other firefighting aircraft currently owned or leased by us. The MAB Services Agreement also prohibits us from purchasing other equity interests, assets or properties with cash or cash equivalents during the term of the agreement. As a result, the MAB Services Agreement may preclude us from pursuing acquisition or expansion plans that we would have otherwise pursued and may limit our growth options and strategy, other than the acquisition and return to service of the Spanish Scoopers under the MAB Services Agreement.
Any acquisitions, partnerships or joint ventures that we enter into could disrupt our operations and have a material adverse effect on our business, financial condition and results of operations. As part of growing our business, we have and may make acquisitions. If we fail to successfully select, execute or integrate our acquisitions, then our business, results of operations and financial condition could be materially adversely affected, and our stock price could decline.
From time to time, we may evaluate potential strategic acquisitions of businesses, including partnerships or joint ventures with third parties. We may not be successful in identifying acquisition, partnership and joint venture candidates. In addition, we may not be able to continue the operational success of such businesses or successfully finance or integrate any businesses that we acquire or with which we form a partnership or joint venture. We may have potential write-offs of acquired assets and/or an impairment of any goodwill recorded as a result of acquisitions. Furthermore, the integration of any acquisition may divert management’s time and resources from our core business and disrupt our operations or may result in conflicts with our business. Any acquisition, partnership or joint venture may not be successful, may reduce our cash reserves, may negatively affect our earnings and financial performance and, to the extent financed with the proceeds of debt, may increase our indebtedness. Further, depending on market conditions, investor perceptions of us and other factors, we might not be able to obtain financing on acceptable terms, or at all, to implement any such transaction. We cannot ensure that any acquisition, partnership or joint venture we make will not have a material adverse effect on our business, financial condition and results of operations.
Our systems, aircraft, technologies and services and related equipment may have shorter useful lives than we anticipate.
Our growth strategy depends in part on the acquisition and maintenance of additional assets, including Super Scoopers, Air Attack aircraft, and airport hangars. A number of factors will impact the useful lives of our aircraft and facilities, including, among other things, the quality of their design and construction, the durability of their component parts and availability of any replacement components, and the occurrence of any anomaly or series of anomalies or other risks affecting the technology during firefighting and surveillance operations. In addition, any improvements in technology may make our existing aircraft, designs, or any component of our aircraft prior to the end of its life obsolete. If our systems, aircraft, facilities, technologies, and related equipment have shorter useful lives than we currently anticipate, this may lead to higher costs, lower returns on capital, or customer price increases that could hinder our ability to obtain new business, any of which would have a material adverse effect on our business, financial condition and results of operations.
We have a substantial amount of debt and servicing future interest or principal payments may impair our ability to operate our business or require us to change our business strategy to accommodate the repayment of our debt. Our ability to operate our business is limited by certain agreements governing our debt, including restrictions on the use of the loan proceeds, operational and financial covenants, and restrictions on additional indebtedness. If we are unable to comply with the financial covenants or other terms of our debt agreements, we may become subject to cross-default or cross-acceleration provisions that could result in our debt being declared immediately due and payable, which could prolong the substantial doubt about our ability to continue as a going concern.
We completed municipal bond financings in July 2022 and August 2022 that raised gross proceeds in the aggregate of $160.0 million. As of December 31, 2023, we had $211.4 million of total debt outstanding. In connection with such bond financings, we have entered into various loan agreements, which contain certain financial covenants, that require, among other things, that we operate in a manner and to the extent permitted by applicable law, to produce sufficient gross revenues so as to be at all relevant times in compliance with the terms of such covenants, including that we maintain (i) beginning with the fiscal quarter ending December 31, 2023, a minimum debt service coverage ratio (generally calculated as the aggregate amount of our total gross revenues, minus operating expenses, plus interest, depreciation and amortization expense, for any period, over our maximum annual debt service requirements, as determined under such loan agreement) that exceeds 1.25x and (ii) beginning with the fiscal quarter ending September 30, 2022, a minimum liquidity of not less than $8.0 million in the form of unrestricted cash and cash equivalents, plus liquid investments and unrestricted marketable securities at all times.
Subject to the terms of the loan agreements, in the event we are unable to comply with the terms of the financial covenants, we may be required (among other potential remedial actions) to engage an independent consultant to review, analyze and make recommendations with respect to our operations or in some instances, this could result in an event of default and/or the acceleration of our debt obligations under the loan agreements. In addition, the acceleration of our debt obligations may in some instances (as set forth in our Amended and Restated Certificate of Incorporation (our “Amended and Restated Charter”)) result in an increase in the dividend rate of the shares of Preferred Stock that have the rights, powers, designations, preferences, and qualification, limitations and restrictions set forth in Section 4.5 of the Amended and Restated Charter (“Series A Preferred Stock”) of 2.00% per annum from the dividend rate otherwise in effect with respect to the Series A Preferred Stock.
The Company is not in compliance with the debt service coverage ratio covenant as of December 31, 2023 and management anticipates the Company to continue to not be in compliance with the debt service coverage ratio covenant at future quarterly measurement periods during the next 12 months, primarily attributable to the seasonal nature of our business and a less intense 2023 wildfire season. Although the Company is in compliance with the $8.0 million minimum liquidity requirement as of December 31, 2023, based on projected cash use, management anticipates that without additional cash funding the Company will not have sufficient cash on hand to comply with the minimum liquidity covenant or to fund operations, including $18.4 million of required interest payments associated with the Series 2022 Bonds, within the next 12 months, or until the Company begins to collect cash from its seasonal firefighting operations in 2024.
The agreements for the Gallatin municipal bond issuances by Bridger Aerospace Group Holdings, LLC totaling $160.0 million of gross proceeds that closed in July and August 2022 (the “Series 2022 Bonds”) provide that, with regard to covenant violations, other than non-payment of principal or interest, no event of default shall be deemed to have occurred so long as a reasonable course of action to remedy a violation commences within 30 days of written notice of non-compliance from the trustee and management diligently prosecutes the remediation plan to completion.
Management consulted with bond counsel on the impact of covenant violations and proactively developed a cost reduction plan, and began implementing the plan in November 2023, to help remedy the anticipated covenant breaches in 2024. However, this plan is in progress and there is no assurance that management will be able diligently prosecute the remediation plan to completion. The uncertainty regarding the company’s ability to diligently prosecute the remediation plan to completion and the potential impact on the bonds maturity as a result of the anticipated debt covenant violations at subsequent compliance dates or failure to make required interest payments, could result in the Series 2022 Bonds becoming immediately due and payable, which raises substantial doubt about our ability to continue as a going concern as of the date our financial statements are issued.
As further described under the section of this Annual Report on Form 10-K entitled “Management’s Discussion and Analysis of Financial Condition and Results of Operations—Liquidity and Capital Resources—Indebtedness”, we have also entered into various term loan agreements and other long-term debt to fund the purchase of additional aircraft and finance the construction of aircraft hangars. Under the terms of such agreements, we are subject to certain financial covenants including, a debt service coverage ratio, current assets to liabilities ratio and senior leverage ratio. As of December 31, 2021 and September 30, 2022, we were in violation of the current assets to liabilities and senior leverage ratios requirements, respectively, under the agreements of our credit facilities with Rocky Mountain Bank. On both occasions, Rocky Mountain Bank agreed to waive the violation of such covenants and not enforce its rights and remedies from the resulting events of default under such credit facilities. Additionally, we were considered in violation of a senior leverage ratio requirement as of June 30, 2023. The calculation for this Rocky Mountain Bank covenant based on quarterly financials is a violation for only June 30, 2023. The acceleration of the obligation has been waived for such quarter. The Company is in compliance with such financial covenants as of December 31, 2023. However, no assurance can be provided that we will be able to satisfy such financial covenants in future periods or that we will be able to obtain a waiver from our lenders in the event of non-compliance. A breach of any of these covenants or the occurrence of other events specified in the agreements or related debt documents could result in an event of default under the same and give rise to the lenders’ right to accelerate our debt obligations thereunder and pursue other remedial actions under our credit facilities and/or trigger a cross-default under our other debt agreements, including our Series 2022 Bonds.
Subject to the limits contained in some of the agreements governing our outstanding debt, we may incur additional debt in the future. Our maintenance of higher levels of indebtedness could have adverse consequences including impairing our ability to obtain additional debt and/or equity financing in the future.
Our level of debt places significant demands on our cash resources, which could:
•make it more difficult to satisfy our outstanding debt obligations;
•require us to dedicate a substantial portion of our cash for payments related to our debt, reducing the amount of cash flow available for working capital, capital expenditures, entitlement of our real estate assets, contributions to our tax-qualified pension plan, and other general corporate purposes;
•make it more difficult for us to satisfy certain financial tests and ratios under our loan or debt agreements, requiring us to seek waivers from lenders to not enforce their rights and remedies under the applicable agreements;
•limit our flexibility in planning for, or reacting to, changes in the industries in which we compete;
•place us at a competitive disadvantage with respect to our competitors, some of which have lower debt service obligations and greater financial resources than we do;
•limit our ability to borrow additional funds;
•limit our ability to expand our operations through acquisitions; and
•increase our vulnerability to general adverse economic and industry conditions if we are unable to generate sufficient cash flow to service our debt and fund our operating costs, our liquidity may be adversely affected.
There are no assurances that we will maintain a level of liquidity sufficient to permit us to pay the principal, premium and interest on our indebtedness. In addition to competitive conditions in the industry in which we operate, our financial condition and operating performance are also subject to prevailing economic conditions and certain financial, business and other factors beyond our control.
We do not expect to declare any dividends in the foreseeable future.
We intend to retain future earnings, if any, for future operations and expansion and there are no current plans to pay any cash dividends for the foreseeable future. The declaration, amount, and payment of any future dividends on shares of our common stock will be at the sole discretion of our Board of Directors (the “Board”). The Board may take into account general and economic conditions, our financial condition and results of operations, our available cash and current and anticipated cash needs, capital requirements, contractual, legal, tax, and regulatory restrictions, implications on the payment of dividends by us to our stockholders or by our subsidiaries to us, and such other factors as the Board may deem relevant. As a result, you may not receive any return on an investment in our common stock unless you sell our common stock for a price greater than that which you paid for it.
We may in the future invest significant resources in developing new offerings and exploring the application of our technologies for other uses and those opportunities may never materialize.
While our primary focus for the foreseeable future will be on our aerial firefighting services, we may invest significant resources in developing new technologies, services, products and offerings. However, we may not realize the expected benefits of these investments, and these anticipated technologies are unproven and these products or technologies may never materialize or be commercialized in a way that would allow us to generate ancillary revenue streams. Relatedly, if such technologies become viable offerings in the future, we may be subject to competition from our competitors.
Such research and development initiatives may also have a high degree of risk and involve unproven business strategies and technologies with which we have limited operating or development experience. They may involve claims and liabilities (including, but not limited to, personal injury claims), expenses, regulatory challenges and other risks that we may not be able to anticipate. There can be no assurance that consumer demand for such initiatives will exist or be sustained at the levels that we anticipate, or that any of these initiatives will gain sufficient traction or market acceptance to generate sufficient revenue to offset any new expenses or liabilities associated with these new investments. Further, any such research and development efforts could distract management from current operations and would divert capital and other resources from our more established offerings and technologies. Even if we were to be successful in developing new products, services, offerings or technologies, regulatory authorities may subject us to new rules or restrictions in response to our innovations that may increase our expenses or prevent us from successfully commercializing new products, services, offerings or technologies.
Our variable interest entities (or “VIEs”) may subject us to potential conflicts of interest, and such arrangements may not be as effective as direct ownership with respect to our relationships with the VIEs, which could have a material adverse effect on our ability to effectively control the VIEs and receive economic benefits from them.
We historically had four VIEs, two of which have been consolidated in Bridger’s financial statements: Northern Fire Management Services, LLC (“NFMS, LLC”) and Mountain Air, LLC (“MA, LLC”). NFMS, LLC is owned 50% by Bridger Aerospace Group, LLC (“BAG, LLC”), one of our wholly-owned subsidiaries, and 50% by a former employee of BAG, LLC, who is a Canadian citizen. We assisted in designing and organizing NFMS, LLC with a business purpose of employing Canadian aviation professionals for our business. We have a master services agreement with NFMS, LLC and Bridger Air Tanker, LLC, our wholly-owned subsidiary, to transfer all annual expenses incurred to us in exchange for the Canadian employees to support our water scooper aircraft. MA, LLC was a VIE for 2021, but subsequent to its acquisition on November 7, 2022 for $1.00, it is now a wholly-owned subsidiary.
On November 17, 2023, we entered into a series of agreements for the formation of MAB Funding, LLC (“MAB”) a joint venture entity owned by a fund for which Marathon Asset Management, L.P. acts as investment manager (“Marathon”), a fund for which Avenue Sustainable Solutions Fund, L.P. acts as investment manager (“Avenue”), and the Company that was created for the purpose of purchasing four Canadair CL-215T Amphibious Aircraft originally awarded to our wholly-owned subsidiary, Bridger Aerospace Europe, S.L.U. (“BAE”), in September 2023 via a public tender process from the Government of Spain for €40.3 million. Under the terms of the agreements, Marathon made capital contributions totaling $26.5 million in exchange for 26,488 voting Class A Units of MAB, Avenue made capital contributions totaling $13.0 million in exchange for 13,031 voting Class A Units of MAB, and the Company agreed to sell the entire outstanding equity interest in BAE to MAB and purchase $4.0 million of non-voting Class B units of MAB.
We also entered into a services agreement with MAB whereby we will manage the return to service upgrades of the Spanish Scoopers through our wholly-owned Spanish subsidiary, Albacete Aero, S.L., while they are owned and funded by MAB. The service agreement also provides that we have the right, but not the obligation, to acquire each Spanish Scooper as it is ready to be contracted and returned to service. The Company assessed both MAB and BAE for variable interest entity accounting under ASC 810-10-15 and determined that MAB is a voting interest entity and BAE is a variable interest entity. However, neither entity is consolidated in the consolidated financial statements as the Company does not have a controlling financial interest in MAB and the Company is not the primary beneficiary of BAE.
The contractual arrangements we have with the VIEs may not be as effective as direct ownership in respect of our relationship with the VIE. For example, the VIE and its shareholders could breach their contractual arrangements with us by, among other things, failing to conduct their operations in an acceptable manner or taking other actions that are detrimental to our interests. If we had direct ownership of the VIE, we would be able to exercise our rights as a shareholder to effect changes in the board of directors of the VIE, which in turn could implement changes, subject to any applicable fiduciary obligations, at the management and operational level. However, under the agreements with our VIEs, we rely on the performance by the VIE and its shareholders of their obligations under the contracts to exercise control over the VIE. The shareholders of the consolidated VIE may not act in the best interests of our company or may not perform their obligations under these contracts. Such risks exist throughout the period in which we intend to operate certain portions of our business through the contractual arrangements with the VIE.
As of the date of this Annual Report on Form 10-K, we are not aware of any conflicts between the shareholders of the VIE and us. However, the shareholders of the VIE may have actual or potential conflicts of interest with us in the future. These shareholders may refuse to sign or breach, or cause the VIE to breach, or refuse to renew, the existing contractual arrangements we have with them and the VIE, which would have a material adverse effect on our ability to effectively control the VIE and receive economic benefits from it. For example, the shareholders may be able to cause our agreements with the VIE to be performed in a manner adverse to us by, among other things, failing to remit payments due under the contractual arrangements to us on a timely basis. We cannot assure you that when conflicts of interest arise any or all of these shareholders will act in the best interests of our company or such conflicts will be resolved in our favor. Currently, we do not have any arrangements to address potential conflicts of interest between these shareholders and our company. If we cannot resolve any conflict of interest or dispute between us and these shareholders, we would have to rely on legal proceedings to enforce such arrangements, which could result in disruption of our business, require us to incur substantial costs and expend additional resources, and subject us to substantial uncertainty as to the outcome of any such legal proceedings.
Our results of operations may be adversely affected by other-than-temporary impairment charges related to our marketable securities.
We make investments in marketable securities classified as available-for-sale debt securities, consisting of commercial paper, corporate bonds and notes, and government securities. As of December 31, 2023 and 2022, we had $1.0 million and $55.0 million, respectively, of investments in debt securities classified as available-for-sale with short-term maturities of less than one year and carried at fair value. We are exposed to the risk that the issuers of these debt securities may experience significant deterioration in credit quality which could impact the market value of such issuer’s securities. We periodically evaluate our debt securities to determine if market value declines are other-than-temporary. If a decline is determined to be other-than-temporary, the credit related portion of the impairment would be recognized as an adjustment to income.
Early-Stage Company Risks
Our liquidity position raises substantial doubt about our ability to continue as a going concern.
The Company has an operating loss, net loss and negative operating cash flows for the year ended December 31, 2023, and the Company is not in compliance, or is projected to not be in compliance, with certain financial covenants associated with the Series 2022 Bonds during the next 12 months. Additionally, based on projected cash use, management anticipates that without additional cash funding the Company will not have sufficient cash on hand to achieve compliance or to fund operations within the next 12 months, until the Company begins to collect cash from its seasonal firefighting operations in 2024.
Management intends to improve the Company’s near-term cash position through a combination of cost reduction measures and the raising of funds through a number of potential avenues, including additional sales of our common stock through our at-the-market offering and issuing additional shares of common stock pursuant to our shelf registration statement. These sources of additional working capital are not currently assured, and consequently do not sufficiently mitigate the risks and uncertainties disclosed above. Our ability to raise additional funds will depend on, among other factors, financial, economic and market conditions, many of which are outside of our control and there can be no assurance that we will be able to obtain additional funding on satisfactory terms or at all.
Current and anticipated noncompliance with financial covenants and uncertainty regarding the Company’s ability to diligently prosecute the cost reduction plan and to raise additional cash funding raise substantial doubt about the Company’s ability to continue as a going concern within 12 months following the issuance date of the consolidated financial statements as of and for the period ended December 31, 2023.
We have incurred significant losses since inception, and we may not be able to achieve, maintain or increase profitability or positive cash flow.
We have incurred significant losses since inception. While we currently generate revenue from our aerial firefighting services, we are not currently profitable, and it is difficult for us to predict our future operating results. As a result, our losses may be larger than anticipated, and we may not be able to reach profitability in the foreseeable future. Further, our future growth is heavily dependent upon the necessity for our services.
The requirements of being a public company may strain our resources, divert our management’s attention and affect our ability to attract and retain additional executive management and qualified board members.
Prior to January 2023, we were not subject to the reporting requirements of the Securities Exchange Act of 1934 (the “Exchange Act”), the Sarbanes-Oxley Act of 2002 (the “Sarbanes-Oxley Act”), the Dodd-Frank Wall Street Reform and Consumer Protection Act of 2010, or the listing requirements of Nasdaq. Compliance with these rules and regulations has increased, and will continue to increase, our legal and financial compliance costs, make some activities more difficult, time-consuming, or costly, and increase demand on our systems and resources, particularly after we are no longer an emerging growth company. The Exchange Act requires, among other things, that we file annual, quarterly, and current reports with respect to our business and operating results. The Sarbanes-Oxley Act requires, among other things, that we maintain effective disclosure controls and procedures and internal control over financial reporting. In order to maintain and improve our disclosure controls and procedures and internal control over financial reporting to meet this standard, significant resources and management oversight have been and may in the future be required. As a result, management’s attention may be diverted from other business concerns, which could adversely affect our business and operating results. We may need to hire more employees in the future or engage outside consultants, which would increase our costs and expenses.
In addition, changing laws, regulations, and standards relating to corporate governance and public disclosure are creating uncertainty for public companies, increasing legal and financial compliance costs, and making some activities more time consuming. These laws, regulations, and standards are subject to varying interpretations, in many cases due to their lack of specificity, and, as a result, their application in practice may evolve or otherwise change over time as new guidance is provided by regulatory and governing bodies. This could result in continuing uncertainty regarding compliance matters and higher costs necessitated by ongoing revisions to disclosure and governance practices. We intend to invest resources to comply with evolving laws, regulations, and standards (or changing interpretations of them), and this investment may result in increased selling, general and administrative expenses and a diversion of management’s time and attention from revenue-generating activities to compliance activities. If our efforts to comply with new laws, regulations, and standards differ from the activities intended by regulatory or governing bodies due to ambiguities related to their application and practice, regulatory authorities may initiate legal proceedings against us, and our business may be adversely affected. As a public company, we have also had to incur increased expenses in order to obtain director and officer liability insurance, and we may be required to accept reduced coverage or incur substantially higher costs to maintain the same or similar coverage or obtain coverage in the future. These factors could also make it more difficult for us to attract and retain qualified members of our board of directors, particularly to serve on our audit committee, compensation committee, and nominating and governance committee, and qualified executive officers.
As a result of disclosure of information in the filings required of a public company, our business and financial condition is more visible, which may result in threatened or actual litigation, including by competitors. If such claims are successful, our business and operating results could be adversely affected, and even if the claims do not result in litigation or are resolved in our favor, these claims, and the time and resources necessary to resolve them, could divert the resources of our management and adversely affect our business and operating results. In addition, as a result of our disclosure obligations as a public company, we have reduced flexibility and are under pressure to focus on short-term results, which may adversely affect our ability to achieve long-term profitability.
If we do not develop and implement all required accounting practices and policies, we may be unable to provide the financial information required of a U.S. publicly traded company in a timely and reliable manner.
Prior to January 2023, we were a privately held company, and we were not required to adopt all of the financial reporting and disclosure procedures and controls required of a U.S. publicly traded company. The implementation of all required accounting practices and policies and the hiring of additional financial staff has increased and may continue to increase our operating costs and requires our management to devote significant time and resources to such implementation. If we fail to develop and maintain effective internal controls and procedures and disclosure procedures and controls, we may be unable to provide financial information and required SEC reports that are timely and reliable. Any such delays or deficiencies could harm us, including by limiting our ability to obtain financing, either in the public capital markets or from private sources and damaging our reputation, which in either cause could impede our ability to implement our growth strategy. In addition, any such delays or deficiencies could result in our failure to meet the requirements for continued listing of our Common Stock on Nasdaq.
The Series 2022 Bonds were marketed on the basis of our compliance with certain green and social bond principles. We may not continue to satisfy such principles and we may be unable to market bonds under such principles in the future.
We have publicly advertised, and the Series 2022 Bonds were marketed on the basis of, our compliance with the core components of International Capital Market Association (ICMA) Green Bond Principles and Social Bond Principles. There is no assurance that the eligible projects to which we allocate proceeds from such Series 2022 Bonds will satisfy, or continue to satisfy, investor criteria and expectations regarding environmental impact and sustainability performance, and no assurance is given that the use or allocation will satisfy present or future investor expectations or requirements, voluntary taxonomies or standards regarding any investment criteria or guidelines with which investors or their investments are required to comply, whether by any present or future applicable laws or regulations, by their own governing rules or investment portfolio mandates, ratings criteria, voluntary taxonomies or standards or other independent expectations. As a result, there may be impacts of failing to satisfy bond conditions under the Series 2022 Bonds, and we may be unable to market future bonds, which may result in increased financing costs for us.
Pursuant to the Jumpstart Our Business Startups Act of 2012 (the “JOBS Act”), our independent registered public accounting firm will not be required to attest to the effectiveness of our internal control over financial reporting pursuant to Section 404 of the Sarbanes-Oxley Act for so long as we are an “emerging growth company.”
A company’s internal control over financial reporting is a process designed by, or under the supervision of, that company’s principal executive and principal financial officers, or persons performing similar functions, and influenced by that company’s board of directors, management and other personnel, to provide reasonable assurance regarding the reliability of financial reporting and the preparation of financial statements in accordance with U.S. generally accepted accounting principles (“GAAP”).
Prior to January 2023, the Company was not required to evaluate our internal control over financial reporting in a manner that meets the standards of publicly traded companies required by Section 404(a) of the Sarbanes-Oxley Act. We are now required to adhere to these SEC rules, which will require management to certify financial and other information in our quarterly and annual reports and provide an annual management report on the effectiveness of internal controls over financial reporting beginning for the year ending December 31, 2023. Additionally, once we are no longer an emerging growth company, if we are an “accelerated filer” or a “large accelerated filer” (as defined in Rule 12b-2 of the Exchange Act), then we will be required to comply with the independent registered public accounting firm attestation requirement on our internal controls over financial reporting. If we are unable to establish or maintain appropriate internal control over financial reporting or implement these additional requirements in a timely manner or with adequate compliance, it could result in material misstatements in our consolidated financial statements, failure to meet our reporting obligations on a timely basis, increases in compliance costs, and subject us to adverse regulatory consequences, all of which may adversely affect investor confidence in, and the value of, our securities. Furthermore, if some investors find our securities less attractive as a result of the exemptions available us as an emerging growth company, there may be a less active trading market for our securities (assuming a market develops), and the trading price of our securities may be more volatile than that of an otherwise comparable company that does not avail itself of the same or similar exemptions.
We have identified material weaknesses in our internal control over financial reporting, which we are in the process of, and are focused on, remediating. If we are unable to maintain an effective system of internal control over financial reporting, we may not be able to accurately report our financial results in a timely manner, which may adversely affect investor confidence in us and materially and adversely affect our business and operating results.
A material weakness is a deficiency or combination of deficiencies, in internal control over financial reporting, such that there is a reasonable possibility that a material misstatement of our annual or interim financial statements will not be prevented or detected on a timely basis.
We have identified material weaknesses in our internal control over financial reporting, which we are in the process of, and are focused on, remediating. The first material weakness is related to properly accounting for complex transactions within our financial statement closing and reporting process. The second material weakness arises from our failure to design and maintain effective IT general controls over the IT systems used within the processing of key financial transactions. Specifically, we did not design and maintain user access controls to ensure appropriate segregation of duties and that adequately restrict user and privileged access to financial applications, programs, and data to appropriate company personnel. Additionally, we identified a material weakness in our internal control over financial reporting related to the period end account reconciliation review and entity level financial statement review controls which did not operate within a sufficient level of precision.
We have begun the process of, and are focused on, designing and implementing effective internal controls measures to improve our internal control over financial reporting and remediate the material weaknesses. Future remediation of the
material weaknesses is subject to ongoing management evaluation and will require validation and testing of the design and operating effectiveness of internal controls over a sustained period of financial reporting cycles.
Although we plan to complete this remediation process as quickly as possible, we are unable, at this time, to estimate how long it will take, and our efforts may not be successful in remediating the identified material weaknesses. In addition, even if we are successful in strengthening our controls and procedures, we can give no assurances that in the future such controls and procedures will be adequate to prevent or identify errors or irregularities or to facilitate the fair preparation and presentation of our consolidated financial statements. Any failure to design or maintain effective internal controls over financial reporting or any difficulties encountered in their implementation or improvement could increase compliance costs, negatively impact share trading prices, or otherwise harm our operating results or cause us to fail to meet our reporting obligations.
Risks Related to the Ownership of Our Securities
The price of our Common Stock and Warrants are likely to be highly volatile, and you may lose some or all of your investment.
The price of our Common Stock and Warrants may fluctuate significantly due to a number of factors, some of which may be beyond our control, including those factors discussed in this “Risk Factors” section and many others, such as:
•actual or anticipated fluctuations in our financial condition and operating results, including fluctuations in our quarterly and annual results;
•developments involving our competitors;
•changes in laws and regulations affecting our business;
•variations in our operating performance and the performance of our competitors in general;
•the public’s reaction to our press releases, our other public announcements and our filings with the SEC;
•additions and departures of key personnel;
•announcements of significant acquisitions, strategic partnerships, joint ventures or capital commitments by us or our competitors;
•our failure to meet the estimates and projections of the investment community or that we may otherwise provide to the public;
•publication of research reports about us or our industry, or positive or negative recommendations or withdrawal of research coverage by securities analysts;
•changes in the market valuations of similar companies;
•overall performance of the equity markets;
•sales of our Common Stock and Warrants by us or our stockholders in the future;
•trading volume of our Common Stock and Warrants;
•significant lawsuits, including shareholder litigation;
•failure to comply with the requirements of Nasdaq;
•the impact of any natural disasters or public health emergencies;
•general economic, industry and market conditions other events or factors, many of which are beyond our control; and
•changes in accounting standards, policies, guidelines, interpretations or principles.
These market and industry factors may materially reduce the market price of our Common Stock and our Warrants regardless of our operating performance.
Our Common Stock is subject to restrictions on ownership by non-U.S. citizens, which could require divestiture by non-U.S. citizen stockholders and could have a negative impact on the transferability of our common stock, its liquidity and market value, and such restrictions may deter a potential change of control transaction.
Under our Amended and Restated Charter and our Amended and Restated Bylaws, we have limited the ownership of non-U.S. citizens to 24.9% of the aggregate votes of all outstanding equity securities of our company or 49.0% of the aggregate number of outstanding equities securities in compliance with the regulations set forth by the FAA and the DOT. As a result, if we approach these limits, non-U.S. citizen demand for our equity securities may be reduced, and the price of our Common Stock may suffer.
We may issue additional shares of our Common Stock or other equity securities, which would dilute your ownership interest in us and may depress the market price of our Common Stock.
We may issue additional shares of our Common Stock or other equity securities in the future in connection with, among other things, the proposed sale of Common Stock (the “Shelf Registration”), future acquisitions, repayment of outstanding indebtedness or grants under our Bridger Aerospace Group Holdings, Inc. 2023 Omnibus Incentive Plan and the Bridger Aerospace Group Holdings, Inc. 2023 Employee Stock Purchase Plan without stockholder approval in a number of circumstances. Our issuance of additional shares of our Common Stock or other equity securities could have one or more of the following effects:
•our existing stockholders’ proportionate ownership interest in us will decrease;
•the amount of cash available per share, including for payment of dividends in the future, may decrease;
•the relative voting strength of each previously outstanding share of our Common Stock may be diminished; and
•the market price of our Common Stock may decline.
We are an “emerging growth company” and a “smaller reporting company” within the meaning of the Securities Act of 1933, as amended (the “Securities Act”) and if we take advantage of certain exemptions from disclosure requirements available to “emerging growth companies” or “smaller reporting companies,” this could make our securities less attractive to investors and may make it more difficult to compare our performance with other public companies.
We are an “emerging growth company” within the meaning of the Securities Act, as modified by the JOBS Act, and we may take advantage of certain exemptions from various reporting requirements that are applicable to other public companies that are not “emerging growth companies” including, but not limited to, not being required to comply with the auditor attestation requirements of Section 404, reduced disclosure obligations regarding executive compensation in our periodic reports and proxy statements, and exemptions from the requirements of holding a nonbinding advisory vote on executive compensation and stockholder approval of any golden parachute payments not previously approved. As a result, our stockholders may not have access to certain information they may deem important. We could be an emerging growth company for up to five years, although circumstances could cause us to lose that status earlier, including if the market value of our common stock held by non-affiliates exceeds $700.0 million as of the end of any second quarter of a fiscal year, in which case we would no longer be an emerging growth company as of the last day of such fiscal year. We cannot predict whether investors will find our securities less attractive because we will rely on these exemptions. If some investors find our securities less attractive as a result of our reliance on these exemptions, the trading prices of our securities may be lower than they otherwise would be, there may be a less active trading market for our securities and the trading prices of our securities may be more volatile.
Further, Section 102(b)(1) of the JOBS Act exempts “emerging growth companies” from being required to comply with new or revised financial accounting standards until private companies (that is, those that have not had a registration statement under the Securities Act declared effective or do not have a class of securities registered under the Exchange Act) are required to comply with the new or revised financial accounting standards. The JOBS Act provides that a company can elect to opt out of the extended transition period and comply with the requirements that apply to “non-emerging growth companies” but any such election to opt out is irrevocable. We have elected not to opt out of such extended transition period, which means that when a standard is issued or revised and it has different application dates for public or private companies, we, as an “emerging growth company”, can adopt the new or revised standard at the time private companies adopt the new or revised standard. This may make comparison of our financial statements with another public company that is not an “emerging growth company” or is an “emerging growth company” which has opted out of using the extended transition period difficult or impossible because of the potential differences in accounting standards used.
Additionally, we are a “smaller reporting company” as defined in Item 10(f)(1) of Regulation S-K. Smaller reporting companies may take advantage of certain reduced disclosure obligations, including, among other things, providing only two years of audited financial statements. We will remain a smaller reporting company until the last day of the fiscal year in which (i) the market value of our common stock held by non-affiliates is greater than or equal to $250.0 million as of the end of that fiscal year’s second fiscal quarter, and (ii) our annual revenues are greater than or equal to $100.0 million during the last completed fiscal year or the market value of our common stock held by non-affiliates exceeds $700.0 million as of the end of that fiscal year’s second fiscal quarter. To the extent we take advantage of such reduced disclosure obligations, it may also make comparison of our financial statements with other public companies difficult or impossible.
Provisions in our Amended and Restated Charter, our Amended and Restated Bylaws, the Stockholders Agreement and Delaware law could discourage a takeover that stockholders may consider favorable which could limit the price investors might be willing to pay in the future for our Common Stock and may lead to entrenchment of management.
Our Amended and Restated Charter and our Amended and Restated Bylaws contain provisions that could significantly reduce the value of our securities to a potential acquiror or delay or prevent changes in control or changes in our management without the consent of the Board. Such provisions may discourage unsolicited takeover proposals that stockholders may consider to be in their best interests. Our organizational documents include the following:
•a classified board of directors with three-year staggered terms, which may delay the ability of stockholders to change the membership of a majority of the Board;
•no cumulative voting in the election of directors, which limits the ability of minority stockholders to elect director candidates;
•the exclusive right of the Board, unless the Board grants such a right to the holders of any series of preferred stock, to elect a director to fill a vacancy created by the expansion of the Board or the resignation, death or removal of a director, which prevents stockholders from being able to fill vacancies on the Board;
•the prohibition on removal of directors without cause;
•the ability of the Board to authorize the issuance of shares of preferred stock and to determine the price and other terms of those shares, including preferences and voting rights, without stockholder approval, which could be used to significantly dilute the ownership of a hostile acquiror;
•the ability of the Board to alter our Amended and Restated Bylaws without obtaining stockholder approval;
•the required approval of at least 66-2/3% of the shares of our Common Stock entitled to vote to amend or repeal our Amended and Restated Bylaws or amend, alter or repeal certain provisions of our Amended and Restated Charter;
•a prohibition on stockholder action by written consent, which forces stockholder action to be taken at an annual or special meeting of our stockholders;
•an exclusive forum provision providing that the Court of Chancery of the State of Delaware will be the exclusive forum for certain actions and proceedings;
•the requirement that a special meeting of stockholders may be called only by the Board, the chair of the Board, the chief executive officer or the president, which may delay the ability of our stockholders to force consideration of a proposal or to take action, including the removal of directors; and
•advance notice procedures that stockholders must comply with in order to nominate candidates to the Board or to propose matters to be acted upon at a stockholders’ meeting, which may discourage or deter a potential acquiror from conducting a solicitation of proxies to elect the acquiror’s own slate of directors or otherwise attempting to obtain control of the company.
We are not subject to the anti-takeover provisions contained in Section 203 of the Delaware General Corporation Law. However, we may not engage in a business combination with any holder of 15% or more of our capital stock unless the holder has held the stock for three years or, among other exceptions, the Board has approved the transaction.
Additionally, the agreement, dated January 24, 2023 (the “Stockholders Agreement”), by and among the Company, the former direct and indirect equityholders of Bridger Element LLC and the equityholders of Bridger that are affiliates of Blackstone Inc. (“BTO Stockholders”), permits Blackstone Inc. to nominate up two directors to our board of directors while Blackstone Inc. holds a requisite amount of our Common Stock, which could have the effect of increasing the difficulty of shareholders engaged in a proxy campaign against an incumbent board of directors of the Company. Individually and collectively, these anti-takeover defenses could discourage, delay, or prevent a transaction involving a change in control of the Company. These provisions could also discourage proxy contests and make it more difficult for you and other stockholders to elect directors of your choosing and cause the Company to take corporate actions other than those you desire.
There can be no assurance that we will be able to comply with the continued listing standards of Nasdaq. Nasdaq may delist our securities from trading on its exchange, which could limit investors’ ability to make transactions in our securities and subject us to additional trading restrictions.
Our Common Stock and the Public Warrants are listed on Nasdaq under the symbols “BAER” and “BAERW,” respectively. We are required to demonstrate compliance with Nasdaq’s continued listing requirements in order to continue to maintain the listing of our securities on Nasdaq. If Nasdaq delists our securities from trading on its exchange and we are not able to list our securities on another national securities exchange, our securities could be quoted on an over-the-counter market. If this were to occur, we could face significant adverse consequences, including:
•a limited availability of market quotations for our securities;
•reduced liquidity for our securities;
•a determination that our Common Stock is a “penny stock” which will require brokers trading in our Common Stock to adhere to more stringent rules and possibly result in a reduced level of trading activity in the secondary trading market for our securities;
•a limited amount of news and analyst coverage; and
•a decreased ability to issue additional securities or obtain additional financing in the future.
The National Securities Markets Improvement Act of 1996, which is a federal statute, prevents or preempts the states from regulating the sale of certain securities, which are referred to as “covered securities.” Because our Common Stock and Public Warrants are listed on Nasdaq, our Common Stock and Public Warrants qualify as covered securities. Although states are preempted from regulating the sale of our securities, the federal statute does allow states to investigate companies if there is a suspicion of fraud. If there is a finding of fraudulent activity, then states can regulate or bar the sale of covered securities in a particular case. Further, if we were no longer listed on Nasdaq, our securities would not be covered securities and we would be subject to regulation in each state in which we offer our securities.
The holders of shares of Series A Preferred Stock have rights, preferences and privileges that are not held by, and are preferential to, the rights of holders of our Common Stock. We may be required, under certain circumstances, to repurchase the outstanding shares of Series A Preferred Stock for cash, and such obligations could adversely affect our liquidity and financial condition.
The Company currently has 315,789.473684 shares of Series A Preferred Stock that are issued and outstanding. The Series A Preferred Stock is convertible non-participating preferred stock, with a conversion price of $11.00 per share and accrues dividends at a rate of 7.0% per annum (payable in cash or in-kind, subject to specified limitations) to but excluding April 25, 2028, 9.0% per annum from (and including) April 25, 2028 to but excluding April 25, 2029, and 11.00% per annum from (and including) April 25, 2029.
In addition, under the terms of the Series A Preferred Stock, we may, at our option, redeem all or any portion of the outstanding shares of Preferred Stock under certain circumstances any time after April 25, 2027, and we must redeem the shares by on or before April 25, 2032. Upon certain fundamental changes to us and our ownership structure, the holders of Series A Preferred Stock may require us to redeem their shares of Series A Preferred Stock. The redemption price is generally equal to original purchase price of the Series A Preferred Stock plus all accrued and unpaid dividends thereon, and in certain circumstances, also includes a “make-whole” payment. Our obligations to the holders of Preferred Stock could also limit our ability to obtain additional financing or increase our borrowing costs, which could have an adverse effect on our financial condition. The preferential rights could also result in divergent interests between the holders of the Series A Preferred Stock and our common stockholders. If we elect to redeem all or a portion of the Series A Preferred Stock, our liquidity, financial condition, and amount of cash available for working capital, capital expenditures, growth opportunities, acquisitions, and other general corporate purposes would be adversely affected.
The Series A Preferred Stock may be converted at any time at the option of the holder into shares of our Common Stock. The conversion price of the Series A Preferred Stock is subject to customary anti-dilution adjustments, including in the event of any stock split, stock dividend, recapitalization or similar event. Adjustments to the conversion price could dilute the ownership interest of our common stockholders. Any conversion of the Series A Preferred Stock may significantly dilute our common stockholders and adversely affect both our net income per share and the market price of our common stock.
The holders of Series A Preferred Stock have consent rights over the issuance of any equity securities senior or pari passu with the Series A Preferred Stock; any amendments to our Amended and Restated Charter that would adversely affect the rights, preferences or privileges of the Series A Preferred Stock; payment of dividends; mergers, consolidations, or a sale of substantially all of our assets and liquidations, dissolutions and winding up, in certain cases, unless we satisfy certain conditions. Otherwise, holders of the Series A Preferred Stock have no voting rights with respect to the election of directors or other matters submitted for a vote of holders of our Common Stock.
A small number of Bridger’s stockholders could significantly influence its business.
As of December 31, 2023, the executive officers of Bridger and Mr. Matthew Sheehy (a co-founder and director of Bridger and the brother of Mr. Timothy Sheehy, the Bridger CEO), collectively beneficially owned 53.3% of the outstanding Common Stock, assuming no shares of Series A Preferred Stock have been converted. As a result, Bridger has a small number of significant stockholders who could significantly influence its business and operations.
In addition, the BTO Stockholders collectively beneficially owned 19.7% (assuming no shares of Series A Preferred Stock have been converted) of the outstanding Common Stock as of December 31, 2023. The BTO Stockholders may also exercise influence over the business through their rights under the Stockholder Agreement, pursuant to which, among other matters, the BTO stockholders can nominate up to two (2) directors for election to the Board and require at least one director nominated by the BTO Stockholders to be included on any committee of the Board, in each case subject to the terms and conditions set forth in the Stockholders Agreement.
As indicated above, Bridger has a few significant stockholders who own a substantial percentage of the outstanding Common Stock. These few significant stockholders, either individually or acting together, are able to exercise significant influence over matters requiring stockholder approval, including the election of directors and approval of significant corporate transactions, such as a merger or other sale of Bridger or its assets. In addition, Bridger’s executive officers and Mr. Matthew Sheehy collectively beneficially own a majority of the outstanding Common Stock (assuming no shares of Series A Preferred Stock have been converted) and may be able to control the outcome of most matters submitted to Bridger’s stockholders for a stockholder vote, including director elections. This concentration of ownership may make it more difficult for other stockholders to effect substantial changes in Bridger, may have the effect of delaying, preventing or expediting, as the case may be, a change in control of Bridger and may adversely affect the market price of our Common Stock. Further, the possibility that one or more of these significant stockholders may sell all or a large portion of their Common Stock in a short period of time could adversely affect the trading price of our Common Stock. The interests of these significant stockholders may not be in the best interests of all stockholders.
If our estimates or judgments relating to our critical accounting policies prove to be incorrect or financial reporting standards or interpretations change, our results of operations could be adversely affected.
The preparation of financial statements in conformity with generally accepted accounting principles in the United States requires management to make estimates and assumptions that affect the amounts reported in the financial statements and accompanying notes. We will base our estimates on historical experience, known trends and events, and various other factors that we believe to be reasonable under the circumstances, as provided in the section of this Annual Report on Form 10-K entitled “Management’s Discussion and Analysis of Financial Condition and Results of Operations — Critical Accounting Policies and Estimates.” The results of these estimates form the basis for making judgments about the carrying values of assets and liabilities that are not readily apparent from other sources. Significant assumptions and estimates used in preparing our financial statements include: (a) excess and aging aircraft support parts reserves, (b) allowance for doubtful accounts, (c) useful lives of property, plant and equipment, net (d) allocation of the purchase price to the fair value of assets acquired and liabilities assumed, (e) impairment of long-lived assets, goodwill and other intangible assets, (f) disclosure of fair value of financial instruments, (g) variable interest entities, (h) accounting for Series A Preferred Stock, (i) revenue recognition, (j) estimates and assumptions made in determining the carrying values of goodwill, other intangible assets, and contingent consideration, (k) incentive units and (l) the 17,250,000 warrants to purchase a share of Common Stock at an exercise price of $11.50 per share, which were issued in exchange for the 17,250,000 JCIC warrants originally issued as part of the units JCIC issued in the JCIC initial public offering (“Public Warrants”) and the 9,400,000 warrants to purchase a share of Common Stock at an exercise price of $11.50 per share, which were issued in exchange for 9,400,000 JCIC warrants (“Private Placement Warrants”) originally purchased in a private placement by JCIC Sponsor LLC, a Cayman Islands exempted limited partnership (“JCIC Sponsor”). Our results of operations may be adversely affected if our assumptions change or if actual circumstances differ from those in our assumptions, which could cause our results of operations to fall below the expectations of securities analysts and investors, resulting in a decline in the trading price of our Common Stock.
Additionally, we will regularly monitor our compliance with applicable financial reporting standards and review new pronouncements and drafts thereof that are relevant to us. As a result of new standards, changes to existing standards and changes in their interpretation, we might be required to change our accounting policies, alter our operational policies, and implement new or enhance existing systems so that they reflect new or amended financial reporting standards, or we may be required to restate our published financial statements. Such changes to existing standards or changes in their interpretation may have an adverse effect on our reputation, business, financial position, and profit.
If securities or industry analysts do not publish research or reports about us or publish negative reports, then the price of our securities and trading volumes could decline.
The trading market for our Common Stock and Warrants will depend, in part, on the research and reports that securities or industry analysts publish about us. We do not have any control over these analysts. If our financial performance fails to meet analyst estimates or one or more of the analysts who cover us downgrade our Common Stock or change their opinion, then the trading prices of our securities would likely decline. If one or more of these analysts cease coverage of us or fail to regularly publish reports on us, we could lose visibility in the financial markets, which could cause the trading prices of our securities or trading volume to decline.
We do not currently intend to pay dividends on our Common Stock, and, consequently, your ability to achieve a return
on your investment will depend on appreciation, if any, in the price of our Common Stock.
We have never declared or paid any cash dividend on our Common Stock. We currently anticipate that we will retain future earnings for the development, operation and expansion of the business and do not anticipate declaring or paying any cash dividends for the foreseeable future. Any return to stockholders will therefore be limited to the appreciation of their stock. There is no guarantee that shares of our Common Stock will appreciate in value or even maintain the price at which stockholders have purchased their shares.
Volatility in our share price could subject us to securities class action litigation.
In the past, securities class action litigation has often been brought against a company following a decline in the market price of its securities. If we face such litigation, it could result in substantial costs and a diversion of management’s attention and resources, which could harm our business.
Future sales, or the perception of future sales, of a substantial number of shares of our Common Stock and Warrants, by us or our stockholders in the public market may cause the price of our Common Stock and Warrants to decline.
If we or our existing stockholders sell, or indicate an intention to sell, substantial amounts of shares of our Common Stock or Warrants in the public market, the trading price of our Common Stock or Warrants could decline. In addition, the perception that such sales could occur, could harm the prevailing market price of shares of our Common Stock or Warrants. These sales, or the possibility that these sales may occur, also might make it more difficult for us to sell equity securities in the future at a time and at a price that we deem appropriate and to raise additional funds through future offerings of our shares of Common Stock or other securities.
Warrants are exercisable for our Common Stock and if exercised will increase the number of shares eligible for future resale in the public market and result in dilution to our stockholders.
Outstanding Warrants to purchase an aggregate of 26,649,874 shares of our Common Stock became exercisable in accordance with the terms of the Warrant Agreement (as defined below) governing those securities. These Warrants became exercisable commencing on February 23, 2023. The exercise price of these Warrants is $11.50 per share, subject to certain potential future adjustments. To the extent such Warrants are exercised, additional shares of our Common Stock will be issued, which will result in dilution to our holders and increase the number of shares eligible for resale in the public market. Sales of substantial numbers of such shares in the public market or the fact that the Warrants may be exercised could adversely affect the market price of our Common Stock. The price of our Common Stock may remain below $11.50 until expiration of the Warrant exercise period and as such, the Warrants may expire worthless. See the section of this Annual Report on Form 10-K entitled “Risk Factors—The price of our Common Stock may remain below $11.50 until expiration of the Warrant exercise period, and the Warrants may expire worthless and the terms of the Warrants may be amended in a manner adverse to a holder if holders of at least 65% of (i) the then-outstanding Public Warrants and/or (ii) the then-outstanding Private Placement Warrants, as applicable, approve of such amendment.”
The price of our Common Stock may remain below $11.50 until expiration of the Warrant exercise period, and the Warrants may expire worthless and the terms of the Warrants may be amended in a manner adverse to a holder if holders of at least 65% of (i) the then-outstanding Public Warrants and/or (ii) the then-outstanding Private Placement Warrants, as applicable, approve of such amendment.
As of the date of this Annual Report on Form 10-K, the exercise price for our Warrants is $11.50 per share of Common Stock. On March 15, 2024, the closing price of our Common Stock on Nasdaq was $4.92 per share. For so long as the market price of our Common Stock is below the exercise price of our Warrants ($11.50 per share), our Warrants remain “out-of-the money,” and our Warrant Holders are unlikely to cash exercise their Warrants, resulting in little or no cash proceeds to us. There can be no assurance that our Warrants will be in the money prior to their January 24, 2028 expiration date, and therefore, we may not receive any proceeds from the exercise of Warrants to fund our operations.
In addition, the Warrants were issued in registered form under the Warrant Agreement, dated January 26, 2021, by and between Continental Stock Transfer & Trust Company, as Warrant Agent, and JCIC, which was assumed by the Company by virtue of the Warrant Assumption Agreement, dated January 24, 2023, the Company (such agreement, as assumed, the “Warrant Agreement”). The Warrant Agreement provides that the terms of the Warrants may be amended without the consent of any holder to cure any ambiguity or correct any defective provision but requires the approval by the holders of at least 65% of the then-outstanding Public Warrants to make any other change that affects the interests of the registered holders of Public Warrants. Accordingly, we may amend the terms of the Public Warrants in a manner adverse to a holder if holders of at least 65% of the then-outstanding Public Warrants approve of such amendment.
Although our ability to amend the terms of the Public Warrants with the consent of at least 65% of the then-outstanding Public Warrants is unlimited, examples of such amendments could be amendments to, among other things, increase the exercise price of the Warrants, shorten the exercise period or decrease the number of shares of our Common Stock purchasable upon exercise of a Warrant.
We may redeem your unexpired Warrants prior to their exercise at a time that is disadvantageous to you, thereby making your Warrants worthless.
We have the ability to redeem the outstanding Warrants at any time and prior to their expiration, at a price of $0.01 per warrant if, among other things, the last reported sale price of our Common Stock for any 20 trading days within a 30-trading day period ending on the third trading day prior to the date on which we send the notice of redemption to the warrant holders (the “Reference Value”) equals or exceeds $18.00 per share (as adjusted for share splits, share dividends, rights issuances, subdivisions, reorganizations, recapitalizations and the like). If and when the Warrants become redeemable by us, we may exercise our redemption right even if we are unable to register or qualify the underlying securities for sale under all applicable state securities laws. As a result, we may redeem the Warrants as set forth above even if the holders are otherwise unable to exercise the Warrants. Redemption of the outstanding Warrants as described above could force you to: (i) exercise your Warrants and pay the exercise price therefor at a time when it may be disadvantageous for you to do so; (ii) sell your Warrants at the then-current market price when you might otherwise wish to hold your Warrants; or (iii) accept the nominal redemption price which, at the time the outstanding Warrants are called for redemption, we expect would be substantially less than the market value of your Warrants.
In addition, we have the ability to redeem the outstanding Warrants at any time and prior to their expiration, at a price of $0.10 per Warrant if, among other things, the Reference Value equals or exceeds $10.00 per share (as adjusted for share splits, share dividends, rights issuances, subdivisions, reorganization, recapitalizations and the like). In such case, the holders will be able to exercise their Warrants prior to the redemption for a number of shares of our Common Stock determined based on the redemption date and the fair market value of our Common Stock.
We have no obligation to notify holders of the Warrants that they have become eligible for redemption. However, pursuant to the Warrant Agreement, in the event we decide to redeem the Warrants, we are required to mail notice of such redemption to the registered warrant holders not less than 30 days prior to the redemption date. The Warrants may be exercised any time after notice of redemption is given and prior to the redemption date. None of the Private Placement Warrants will be redeemable by us so long as they are held by JCIC Sponsor or its permitted transferees; provided the Private Placement Warrants may be redeemed in accordance with the Warrant Agreement (and must be redeemed if the Public Warrants are being redeemed) if the Reference Value equals or exceeds $10.00 per share and does not equal or exceed $18.00 per share.
The exclusive forum clause set forth in the Warrant Agreement may have the effect of limiting an investor’s rights to bring legal action against us and could limit the investor’s ability to obtain a favorable judicial forum for disputes with us.
The Warrant Agreement provides that (i) any action, proceeding or claim against us arising out of or relating in any way to the Warrant Agreement will be brought and enforced in the courts of the State of New York or the United States District Court for the Southern District of New York and (ii) we irrevocably submit to such jurisdiction, which jurisdiction will be exclusive. We have waived or will waive any objection to such exclusive jurisdiction and that such courts represent an inconvenient forum. We note, however, that there is uncertainty as to whether a court would enforce these provisions and that investors cannot waive compliance with the federal securities laws and the rules and regulations thereunder. Section 22 of the Securities Act creates concurrent jurisdiction for state and federal courts over all suits brought to enforce any duty or liability created by the Securities Act or the rules and regulations thereunder.
Notwithstanding the foregoing, these provisions of the Warrant Agreement will not apply to suits brought to enforce any liability or duty created by the Exchange Act or any other claim for which the federal district courts of the United States of America are the sole and exclusive forum. Section 27 of the Exchange Act creates exclusive federal jurisdiction over all suits brought to enforce any duty or liability created by the Exchange Act or the rules and regulations thereunder. Any person or entity purchasing or otherwise acquiring any interest in any of the Warrants shall be deemed to have notice of and to have consented to the forum provisions in the Warrant Agreement. If any action, the subject matter of which is within the scope of the forum provisions of the Warrant Agreement, is filed in a court other than a court of the State of New York or the United States District Court for the Southern District of New York (a “foreign action”) in the name of any holder of the Warrants such holder shall be deemed to have consented to: (x) the personal jurisdiction of the state and federal courts located within the State of New York or the United States District Court for the Southern District of New York in connection with any action brought in any such court to enforce the forum provisions (an “enforcement action”), and (y) having service of process made upon such warrant holder in any such enforcement action by service upon such warrant holder’s counsel in the foreign action as agent for such warrant holder.
This choice-of-forum provision may limit a warrant holder’s ability to bring a claim in a judicial forum that it finds favorable for disputes with us, which may discourage such lawsuits. Alternatively, if a court were to find this provision of the Warrant Agreement inapplicable or unenforceable with respect to one or more of the specified types of actions or proceedings, we may incur additional costs associated with resolving such matters in other jurisdictions, which could materially and adversely affect our business, financial condition and results of operations and result in a diversion of the time and resources of our management and board of directors.
General Risk Factors
Net earnings and net assets could be materially affected by an impairment of goodwill.
We have, or in the future may have, a significant amount of goodwill recorded on our consolidated balance sheet. We are required at least annually to test the recoverability of goodwill. The recoverability test of goodwill is based on the current fair value of our identified reporting units. Fair value measurement requires assumptions and estimates of many critical factors, including revenue and market growth, operating cash flows and discount rates. If general market conditions deteriorate in portions of our business, we could experience a significant decline in the fair value of reporting units. This decline could lead to an impairment of all or a significant portion of the goodwill balance, which could materially affect our GAAP net earnings and net assets.
Changes in tax laws or regulations may increase tax uncertainty and adversely affect results of our operations and our effective tax rate.
The Company is subject to taxes in the United States and certain foreign jurisdictions. Due to economic and political conditions, tax rates in various jurisdictions, including the United States, may be subject to change. The Company’s future effective tax rates could be affected by changes in the mix of earnings in countries with differing statutory tax rates, changes in the valuation of deferred tax assets and liabilities and changes in tax laws or their interpretation. In addition, the Company may be or become subject to income tax audits by various tax jurisdictions. For example, the Inflation Reduction Act of 2022, which was recently enacted, imposed a 1% excise tax on certain share repurchases by publicly traded corporations, which may apply to share repurchases by the Company in the future, and imposed a 15% minimum tax on certain large corporations. Although the Company believes its income tax liabilities are reasonably estimated and accounted for in accordance with applicable laws and principles, an adverse resolution by one or more taxing authorities could have a material impact on the results of its operations.
Certain U.S. state tax authorities may assert that we have a state nexus and seek to impose state and local income taxes which could harm our results of operations.
There is a risk that certain state tax authorities where we do not currently file a state income tax return could assert that we are liable for state and local income taxes based upon income or gross receipts allocable to such states. States are becoming increasingly aggressive in asserting a nexus for state income tax purposes. If a state tax authority successfully asserts that our activities give rise to a nexus, we could be subject to state and local taxation, including penalties and interest attributable to prior periods. Such tax assessments, penalties and interest may adversely impact our results of operations.
Our Amended and Restated Charter requires, to the fullest extent permitted by law, that derivative actions brought in our name, actions against our directors, officers, other employees or stockholders for breach of fiduciary duty and other similar actions may be brought only in the Court of Chancery in the State of Delaware, which may have the effect of discouraging lawsuits against our directors, officers, other employees or stockholders.
Our Amended and Restated Charter provides that, unless a majority of the Board of Directors, acting on behalf of Bridger, consents in writing to the selection of an alternative forum (which consent may be given at any time, including during the pendency of litigation), the Court of Chancery of the State of Delaware (or, if the Court of Chancery does not have jurisdiction, another state court located within the State of Delaware or, if no court located within the State of Delaware has jurisdiction, the federal district court for the District of Delaware), to the fullest extent permitted by law, shall be the sole and exclusive forum for (i) any derivative action or proceeding brought on behalf of the Corporation, (ii) any action asserting a claim of breach of a fiduciary duty owed by any current or former director, officer or other employee of the Corporation to the Corporation or the Corporation’s stockholders, (iii) any action asserting a claim against the Corporation or any of its directors, officers or other employees arising pursuant to any provision of the Delaware General Corporation Law (“DGCL”), our Amended and Restated Charter or our Amended and Restated Bylaws (in each case, as may be amended from time to time), (iv) any action asserting a claim against the Corporation or any of its directors, officers or other employees governed by the internal affairs doctrine of the State of Delaware or (v) any other action asserting an “internal corporate claim,” as defined in Section 115 of the DGCL, in all cases subject to the court’s having personal jurisdiction over all indispensable parties named as defendants. Unless a majority of the Board, acting on behalf of the Corporation, consents in writing to the selection of an alternative forum (which consent may be given at any time, including during the pendency of litigation), the federal district courts of the United States of America, to the fullest extent permitted by law, shall be the sole and exclusive forum for the resolution of any action asserting a cause of action arising under the Securities Act.
We believe these provisions may benefit us by providing increased consistency in the application of Delaware law and federal securities laws by chancellors and judges, as applicable, particularly experienced in resolving corporate disputes, efficient administration of cases on a more expedited schedule relative to other forums and protection against the burdens of multi-forum litigation. Alternatively, if a court were to find these provisions of our Amended and Restated Charter inapplicable or unenforceable with respect to one or more of the specified types of actions or proceedings, we may incur additional costs associated with resolving such matters in other jurisdictions, which could materially adversely affect our business, financial condition, and results of operations and result in a diversion of the time and resources of our management and Board of Directors. For example, Section 22 of the Securities Act creates concurrent jurisdiction for federal and state courts over all suits brought to enforce any duty or liability created by the Securities Act or the rules and regulations thereunder. Accordingly, there is uncertainty as to whether a court would enforce such a forum selection provision as written in connection with claims arising under the Securities Act.
We may be required to take write-downs or write-offs, restructuring and impairment or other charges that could have a significant negative effect on our financial condition, results of operations and the price of our securities, which could cause you to lose some or all of your investment.
Factors outside of our control may, at any time, arise. As a result of these factors, we may be forced to later write-down or write-off assets, restructure operations, or incur impairment or other charges that could result in reporting losses. Unexpected risks may arise, and previously known risks may materialize. Even though these charges may be non-cash items and therefore not have an immediate impact on our liquidity, we must report charges of this nature which could contribute to negative market perceptions about us or our securities. In addition, charges of this nature may cause us to be unable to obtain future financing on favorable terms or at all.
ITEM 1B. UNRESOLVED STAFF COMMENTS.
None.
ITEM 1C. CYBERSECURITY.
Risk Management and Strategy
We recognize the importance of assessing, identifying, and managing material risks associated with cybersecurity threats, as defined in Item 106(a) of Regulation S-K, and are integrating them into our overall risk management systems and processes by implementing and maintaining various technical, physical, and organizational safeguards, such as policies, standards, and practices relating to:
•risk assessments;
•incident detection and response;
•vulnerability management;
•internal controls within our IT, Security and other departments;
•network security controls;
•access controls;
•physical security;
•asset management;
•system monitoring;
•employee cybersecurity awareness and training;
•phishing tests;
•the use of the internet, social media, email and wireless devices;
•firewalls and intrusion prevention systems;
•endpoint detection and response systems; and
•anti-malware functionality.
As part of this process, we engaged external consultants who assessed our internal cybersecurity programs and alignment with applicable practices and standards, such as the Internal Control - Integrated Framework issued by the Committee of Sponsoring Organizations of the Treadway Commission framework. We have also retained external service providers to monitor identified risk exposures, provide ongoing recommendations and software tools for their detection and mitigation, as well as evaluating the impact and coordinating the recovery from any incidents or breaches, should they occur.
Our risk management program also assesses third-party risks, and we perform third-party risk management to identify and mitigate risks from third parties such as vendors, suppliers, and other business partners associated with our use of third-party service providers. Cybersecurity risks are evaluated when determining the selection and oversight of service providers when handling and/or processing our employee, business or customer data. Further, in February 2024, we formalized our policy of monitoring third-party cybersecurity risks by requiring its consideration and approval by the IT change control board as a part of vendor selection and solution procurement.
Governance
Cybersecurity is an important part of our risk management processes and an area of focus for our Board and management.
Our Audit Committee is responsible for the oversight of risks from cybersecurity threats. It receives updates on matters of cybersecurity from senior management during regular quarterly meetings and in the interim, if warranted. This includes existing and new cybersecurity risks, how management is addressing and/or mitigating those risks, cybersecurity and data privacy incidents (if any) and key information security initiatives. Our Board members also engage in ad hoc conversations with management on cybersecurity-related news events and discuss any updates to our cybersecurity risk management and strategy programs.
Our cybersecurity risk management and strategy processes are coordinated by our Director of Technology. He maintains the Certified Information Systems Security Professional certification and has eight years of senior leadership experience in defensive cyber security in both the private sector and Department of Defense. He is supported by leaders from our Information Technology, Document Management, and Compliance teams, as well as management’s Disclosure Committee who have extensive work experience in various roles involving information technology, including security, auditing, compliance, systems and programming. They draw on their knowledge of daily information technology operations, ongoing cybersecurity initiatives and various monitoring tools to ultimately report through the Director of Technology and Director of Internal Controls to the Audit Committee on the monitoring, prevention, mitigation, detection and remediation of cybersecurity incidents. In the event the Audit Committee determines that a cybersecurity incident has occurred, the Audit Committee will evaluate whether to escalate the cybersecurity incident to the full Board.
The processes described above have not indicated, as of the date of this Annual Report on Form 10-K, any risks from cybersecurity threats, including as a result of any previous cybersecurity incidents, that we believe have materially affected us in the year ended December 31, 2023 or are reasonably likely to materially affect our company, including its business strategy, results of operations, or financial condition. .. For more information on our cybersecurity risks, see the section of this Annual Report on Form 10-K entitled “Risk Factors—We rely on our IT systems to manage numerous aspects of our business. A cyber-based attack of these systems could disrupt our ability to deliver services to our customers and could lead to increased overhead costs, decreased sales, and harm to our reputation.”
ITEM 2. PROPERTIES.
Our headquarters are located in Belgrade, Montana, and our aircraft fleet resides at the Bozeman Yellowstone International Airport. We own three hangars and lease five existing lots at the airport on 20-year and 10-year ground leases.
Our international operations’ headquarters are located in Albacete, Spain. We currently own one hangar and lease one existing lot on a short-term ground lease at the Albacete Airport, where the return to service upgrades for the four Spanish Scoopers are being performed.
ITEM 3. LEGAL PROCEEDINGS.
Information with respect to this item may be found in “Note 17 – Commitments and Contingencies” to the Consolidated Financial Statements included in “Part II - Item 8. Financial Statements and Supplementary Data” of this Annual Report on Form 10-K, under the caption “Legal Matters” which information is incorporated herein by reference.
ITEM 4. MINE SAFETY DISCLOSURES.
Not applicable.
PART II
ITEM 5. MARKET FOR REGISTRANT’S COMMON EQUITY, RELATED STOCKHOLDER MATTERS AND ISSUER PURCHASES OF EQUITY SECURITIES.
Market Information
Our Common Stock and Warrants are currently listed on Nasdaq Global Market under the symbols “BAER” and “BAERW,” respectively.
Holders
As of March 15, 2024, there were 24 stockholders of record of our Common Stock and 4 stockholders of record of our Warrants. This figure does not include an estimate of the indeterminate number of “street name” or beneficial holders whose shares may be held of record by brokerage firms and clearing agencies.
Dividend Policy
We have never declared or paid any cash dividends on our Common Stock, Series A Preferred Stock or the Warrants to date. Any determination to pay cash dividends or to institute a dividend policy will be at the discretion of the Board and will depend upon a number of factors, including the Company’s results of operations, financial condition, future prospects, contractual restrictions, covenants in the agreements governing current and future indebtedness, industry trends, restrictions imposed by applicable law and other factors the Board deems relevant. We currently intend to retain any future earnings for the development, operation and expansion of the business, and we do not anticipate declaring or paying any cash dividends on our Common Stock for the foreseeable future.
Notwithstanding the foregoing, our holders of the Series A Preferred Stock are entitled to receive dividends to be paid by us twice a year, in cash or, at our election, by increasing the per share liquidation preference for such shares of Series A Preferred Stock (such liquidation preference is equal to the initial issuance price plus all accrued and unpaid dividends, whether or not declared). The dividends on the Series A Preferred Stock accrue daily and are computed on the basis of a 365-day year, at a compounding rate initially anticipated to be 7.00% per annum. Such rate will increase to 9.00% per for the period from (and including) April 25, 2028 to (but excluding) April 25, 2029 and eventually will increase to 11.00% per annum from and after April 25, 2029 and subject to further increase upon the occurrence of certain events. No dividends shall be paid or payable to any other holders of our capital stock unless and until the holders of the Series A Preferred Stock have received cumulative distributions equal to the aggregate liquidation preference of the Series A Preferred Stock. For more information see the section entitled “Preferred Stock – Series A Preferred Stock” of Exhibit 4.3 (“Description of Securities”) to this Annual Report on Form 10-K.
Performance Graph
Not applicable.
Issuer Purchases of Equity Securities
None.
Recent Sales of Unregistered Securities
None.
ITEM 6. [RESERVED]
Not applicable.
ITEM 7. MANAGEMENT’S DISCUSSION AND ANALYSIS OF FINANCIAL CONDITION AND RESULTS OF OPERATIONS.
The following discussion and analysis is intended to help you understand our business, financial condition, results of operations, liquidity and capital resources. The discussion should be read together with the historical audited annual consolidated financial statements as of and for the years ended December 31, 2023 and 2022, and the related notes thereto, that are included elsewhere in this Annual Report on Form 10-K. This discussion contains forward-looking statements based upon our current expectations, estimates and projections that involve risks and uncertainties. Actual results could differ materially from those anticipated in these forward-looking statements due to, among other considerations, the matters discussed in the sections entitled “Risk Factors” and “Cautionary Statement Regarding Forward-Looking Statements.”
BUSINESS OVERVIEW
Bridger provides aerial wildfire surveillance, relief and suppression and aerial firefighting services using next-generation technology and environmentally friendly and sustainable firefighting methods primarily throughout the United States. Our mission is to save lives, property and habitats threatened by wildfires, leveraging our high-quality team, specialized aircraft and innovative use of technology and data. We are meeting an underserved and growing need for next-generation full-service aerial firefighting platforms.
Our portfolio is organized across two core offerings:
Fire Suppression: Consists of deploying specialized Viking CL-415EAF (“Super Scooper”) aircraft to drop large amounts of water quickly and directly on wildfires.
Aerial Surveillance: Consists of providing aerial surveillance via manned (“Air Attack”) aircraft for fire suppression aircraft over an incident and providing tactical coordination with the incident commander.
We manage our operations as a single segment for purposes of assessing performance, making operating decisions and allocating resources.
We have made and will continue to make significant investments in capital expenditures to build and expand our aerial forest fire management technologies. However, we do not expect that our existing cash and cash equivalents provided by equity and debt financing will be sufficient to meet our current working capital and capital expenditure requirements for a period of at least 12 months from the date of this Annual Report on Form 10-K. Refer to the Liquidity and Capital Resources section below and “Note 1 – Organization and Basis of Presentation” of the Notes to Consolidated Financial Statements included in this Annual Report on Form 10-K for additional details on management’s assessment of the Company’s ability to continue as a going concern.
The Reverse Recapitalization
On January 24, 2023 we consummated the Reverse Recapitalization. As a result of the Reverse Recapitalization, Legacy Bridger and JCIC each became wholly-owned subsidiaries of the Company, and the JCIC shareholders and the equity holders of Legacy Bridger converted their equity ownership in JCIC and Legacy Bridger, respectively, into equity ownership in the Company. Legacy Bridger has been determined to be the accounting acquirer with respect to the Reverse Recapitalization, which will be accounted for as a reverse recapitalization, with no goodwill or other intangible assets recorded, in accordance with GAAP.
Upon consummation of the Reverse Recapitalization, the most significant change in Legacy Bridger’s future reported financial position and results of operations was a gross decrease in cash and cash equivalents (as compared to Legacy Bridger’s balance sheet at December 31, 2022), of approximately $17.0 million. Total direct and incremental transaction costs of Bridger, JCIC and Legacy Bridger paid at the closing of the Reverse Recapitalization on January 24, 2023 (the “Closing”) were approximately $16.6 million and have been treated as a reduction of the cash proceeds and deducted from our additional paid-in capital.
Public Company Costs
We have become the successor to an SEC-registered and Nasdaq-listed company, which has required, and in the future may require, us to hire additional staff and implement procedures and processes to address public company regulatory requirements and customary practices. We have incurred and expect to incur additional annual expenses for, among other things, directors’ and officers’ liability insurance, director fees and additional internal and external accounting, legal and administrative resources and fees.
KEY FACTORS AFFECTING OUR RESULTS OF OPERATIONS
We are exposed to certain risks inherent to an aerial firefighting business. These risks are further described in the section entitled “Risk Factors” in this Annual Report on Form 10-K.
Seasonality Due to the North American Fire Season
Our operating results are impacted by seasonality. Climate conditions and other factors that may influence the revenues of our services may vary each season and year. Historically, the demand for our services has been higher in the second and third quarters of each fiscal year due to the timing and duration of the North American fire season. Consequently, revenues, expenses, and operating cash flows from our services are generated mostly in the second and third quarters of our fiscal year. However, the seasonal fluctuations in the need to fight wildfires based upon location and the varying intensity of the fire season have and may continue to lead our operating results to fluctuate significantly from quarter to quarter and year to year.
Weather Conditions and Climate Trends
Our business is highly dependent on the needs of government agencies to surveil and suppress fires. As such, our financial condition and results of operations are significantly affected by the weather, as well as environmental and other factors affecting climate change, which impact the number and severity of fires in any given period. The intensity and duration of the North American fire season is affected by multiple factors, some of which, according to a 2016 article by Climate Central, a nonprofit climate science news organization, are weather patterns including warmer springs and longer summers, lower levels of mountaintop snowpack which lead to drier soils and vegetation and frequency of lightning strikes. Based on the climate change indicators published by the Environmental Protection Agency (“EPA”), these factors have shown year over year increases linked to the effects of climate change and the overall trend in increased temperatures. We believe that rising global temperatures have been, and in the future are expected to be, one factor contributing to increasing rates and severity of wildfires. Historically, our revenue has been higher in the summer season of each fiscal year due to weather patterns which are generally correlated to a higher prevalence of wildfires in North America. Larger wildfires and longer seasons are expected to continue as droughts increase in frequency and duration, according to a 2022 article by the EPA.
However, revenue was lower than the Company initially anticipated for 2023 due to a less intense wildfire season. Per the 2023 National Centers for Environmental Information annual report, approximately 2.6 million acres of U.S. land burned in 2023, 62.4% lower than the 2001-2020 annual average and the total number of wildfires during 2023 was 19.1% lower than the 2001-2020 annual average. Additionally, according to data from the National Interagency Coordination Center, the national wildland fire preparedness level last reached Level 5 in 2021, while reaching only Level 4 in both 2023 and 2022. This decrease in the U.S. national level of wildland fire preparedness in 2022 was partially attributed to the Western United States, which experienced one of the slowest wildfire seasons in recent years due to increased and timely precipitation and cooler temperatures.
Limited Supply of Specialized Aircraft and Replacement and Maintenance Parts
Our results of operations are dependent on sufficient availability of aircraft, raw materials and supplied components provided by a limited number of suppliers. Our reliance on limited suppliers exposes us to volatility in the prices and availability of these materials which may lead to increased costs and delays in operations.
Economic and Market Factors
Our operations, supply chain, partners and suppliers are subject to various global macroeconomic factors. We expect to continue to remain vulnerable to a number of industry-specific and global macroeconomic factors that may cause our actual results of operations to differ from our historical results of operations or current expectations. The factors and trends that we currently believe are or will be most impactful to our results of operations and financial condition include, but are not limited to, the impact on us of significant operational challenges by third parties on which we rely, inflationary pressures, short-term and long-term weather patterns, potential labor and supply chain shortages affecting us and our partners, volatile fuel prices, aircraft delivery delays, and changes in general economic conditions in the markets in which we operate.
Historically, our results of operations have not been materially impacted by other factors. We continue to monitor the potential favorable or unfavorable impacts of these and other factors on our business, operations, financial condition and future results of operations, which are dependent on future developments. Our future results of operations may be subject to volatility and our growth plans may be delayed, particularly in the short term, due to the impact of the above factors and trends. However, we believe that our long-term outlook remains positive due to the increasing demand for our services and our ability to meet those demands consistently, despite adverse market factors. We believe that this expected long-term increase in demand will offset increased costs and that the operational challenges we may experience in the near term can be managed in a manner that will allow us to support increased demand, though we cannot provide any assurances.
KEY COMPONENTS OF OUR RESULTS OF OPERATIONS
Revenue
Our primary source of revenues is from providing services, which are disaggregated into fire suppression, aerial surveillance and other services. Revenues and growth for our fire suppression and aerial surveillance services are driven by climate trends, specifically the intensity and timing of the North American fire season. Other services primarily consist of extraneous fulfillment of contractual services such as extended availability and mobilizations. Other services also include maintenance services performed externally for third parties.
We charge daily and hourly rates depending upon the type of firefighting service rendered and under which contract the services are performed. The recognition of revenues for our services are primarily split into flight, standby and other revenues. Flight revenue is primarily earned at an hourly rate when the engines of the aircraft are cycled, upon request of the customer. Standby revenue is primarily earned as a daily rate when aircraft are available for use at a fire base, awaiting request from the customer for flight deployment. Other revenue consists of additional contractual items that can be charged to the customer, such as leasing revenues for facilities, as well as maintenance and repair on externally owned aircraft.
Cost of Revenues
Cost of revenues includes costs incurred directly related to flight operations including expenses associated with operating the aircraft on revenue generating contracts. These include labor, depreciation, subscriptions and fees, travel and fuel. Cost of revenues also includes routine aircraft maintenance expenses and repairs, consisting primarily of labor, parts, consumables, travel and subscriptions unique to each airframe.
Selling, General and Administrative Expense
Selling, general and administrative expenses include all costs that are not directly related to satisfaction of customer contracts. Selling, general and administrative expenses include costs for our administrative functions, such as finance, legal, human resources, and IT support, and business development costs that include contract procurement, public relations and business opportunity advancement. These functions include costs for items such as salaries, benefits, stock-based compensation and other personnel-related costs, maintenance and supplies, professional fees for external legal, accounting, and other consulting services, insurance, intangible asset amortization and depreciation expense. Selling, general and administrative expenses also include gains or losses on the disposal of fixed assets.
Interest Expense
Interest expense consists of interest costs related to our Gallatin municipal bond issuances by Legacy Bridger that closed in July and August 2022 (the “Series 2022 Bonds”), our permanent and term loan agreements, the Series C preferred shares of Legacy Bridger (the “Legacy Bridger Series C Preferred Shares”), the Series B preferred shares of Legacy Bridger (the “Legacy Bridger Series B Preferred Shares”), which were fully redeemed prior to Closing, the change in fair value of the freestanding derivative, and the net effect of our interest rate swap. Interest expense also includes amortization of debt issuance costs associated with our loan agreements. Refer to “Liquidity and Capital Resources—Indebtedness” included in this Annual Report on Form 10-K for a discussion of our loan commitments.
RESULTS OF OPERATIONS
Comparison of the Year Ended December 31, 2023 to the Year Ended December 31, 2022
The following table sets forth our Consolidated Statements of Operations information for the years ended December 31, 2023 and 2022 and should be reviewed in conjunction with the financial statements and notes included elsewhere in this Annual Report on Form 10-K.
| | | | | | | | | | | | | | | | | | | | | | | | | | |
| $s in thousands | | Year Ended December 31, 2023 | | Year Ended December 31, 2022 | | Period Over
Period
Change ($) | | Period Over
Period
Change (%) |
| Revenues | | $ | 66,708 | | | $ | 46,388 | | | $ | 20,320 | | | 44% |
| Cost of revenues: | | | | | | | | |
| Flight operations | | 24,412 | | | 18,762 | | | 5,650 | | | 30% |
| Maintenance | | 16,928 | | | 15,124 | | | 1,804 | | | 12% |
| Total cost of revenues | | 41,340 | | | 33,886 | | | 7,454 | | | 22% |
| Gross income | | 25,368 | | | 12,502 | | | 12,866 | | | 103% |
| Selling, general and administrative expense | | 82,863 | | | 35,128 | | | 47,735 | | | 136% |
| Operating loss | | (57,495) | | | (22,626) | | | (34,869) | | | 154% |
| Interest expense | | (23,218) | | | (20,020) | | | (3,198) | | | 16% |
| Other income | | 3,053 | | | 521 | | | 2,532 | | | 486% |
| Loss before income taxes | | (77,660) | | | (42,125) | | | (35,535) | | | 84% |
| Income tax benefit | | 302 | | | — | | | 302 | | | n/a |
| Net loss | | $ | (77,358) | | | $ | (42,125) | | | $ | (35,233) | | | 84% |
Revenues
Revenue increased by $20.3 million, or 44%, to $66.7 million for the year ended December 31, 2023, from $46.4 million for the year ended December 31, 2022.
Revenues by service offering for the years ended December 31, 2023 and 2022 were as follows:
| | | | | | | | | | | | | | | | | | | | | | | | | | |
| $s in thousands | | Year Ended December 31, 2023 | | Year Ended December 31, 2022 | | Period Over
Period
Change ($) | | Period Over
Period
Change (%) |
| Fire suppression | | $ | 56,022 | | | $ | 38,845 | | | $ | 17,177 | | | 44% |
| Aerial surveillance | | 9,730 | | | 7,216 | | | 2,514 | | | 35% |
| Other services | | 956 | | | 327 | | | 629 | | | 192% |
| Total revenues | | $ | 66,708 | | | $ | 46,388 | | | $ | 20,320 | | | 44% |
Fire suppression revenue increased by $17.2 million, or 44%, to $56.0 million for the year ended December 31, 2023, from $38.8 million for the year ended December 31, 2022. The increase was primarily driven by a higher number of aircraft operating for the full 2023 wildfire season compared to the 2022 wildfire season. The increase in fire suppression revenue accounted for 85% of the total increase in revenues for the year ended December 31, 2023.
Aerial surveillance revenue increased by $2.5 million, or 35%, to $9.7 million for the year ended December 31, 2023, from $7.2 million for the year ended December 31, 2022. The increase was primarily driven by the type of aircraft operating during 2023 compared to 2022.
Other services revenue increased by $0.6 million, or 192%, to $1.0 million for the year ended December 31, 2023, from $0.3 million for the year ended December 31, 2022. The increase was primarily due to labor, maintenance and improvements to an aircraft under the ownership of a related party and additional contractually specified items. Refer to “Note 19 – Related Party Transactions” of the Notes to Consolidated Financial Statements included in this Annual Report on Form 10-K for additional details.
Revenues by type for the years ended December 31, 2023 and 2022 were as follows:
| | | | | | | | | | | | | | | | | | | | | | | | | | |
| $s in thousands | | Year Ended December 31, 2023 | | Year Ended December 31, 2022 | | Period Over
Period
Change ($) | | Period Over
Period
Change (%) |
| Flight revenue | | $ | 34,171 | | | $ | 25,105 | | | $ | 9,066 | | | 36% |
| Standby revenue | | 30,650 | | | 20,772 | | | 9,878 | | | 48% |
| Other revenue | | 1,887 | | | 511 | | | 1,376 | | | 269% |
| Total revenues | | $ | 66,708 | | | $ | 46,388 | | | $ | 20,320 | | | 44% |
Flight revenue increased by $9.1 million, or 36%, to $34.2 million for the year ended December 31, 2023, from $25.1 million for the year ended December 31, 2022. The increase was primarily driven by a higher number of Super Scooper aircraft flying on deployment for the full 2023 wildfire season compared to the 2022 wildfire season.
Standby revenue increased by $9.9 million, or 48%, to $30.7 million for the year ended December 31, 2023, from $20.8 million for the year ended December 31, 2022. The increase was primarily driven by a higher number of Super Scooper aircraft available for deployment for the full 2023 wildfire season compared to the 2022 wildfire season.
Other revenue increased by $1.4 million, or 269%, to $1.9 million for the year ended December 31, 2023, from $0.5 million for the year ended December 31, 2022. The increase was primarily due to labor, maintenance and improvements to an aircraft under the ownership of a related party and additional contractually specified items. Refer to “Note 19 – Related Party Transactions” of the Notes to Consolidated Financial Statements included in this Annual Report on Form 10-K for additional details.
Revenues by geographic area for the years ended December 31, 2023 and 2022 were as follows:
| | | | | | | | | | | | | | | | | | | | | | | | | | |
| $s in thousands | | Year Ended December 31, 2023 | | Year Ended December 31, 2022 | | Period Over
Period
Change ($) | | Period Over
Period
Change (%) |
| United States | | $ | 49,534 | | | $ | 46,388 | | | $ | 3,146 | | | 7% |
| Canada | | 17,174 | | | — | | | 17,174 | | | n/a |
| Total revenues | | $ | 66,708 | | | $ | 46,388 | | | $ | 20,320 | | | 44% |
United States revenue increased by $3.1 million, or 7%, to $49.5 million for the year ended December 31, 2023, from $46.4 million for the year ended December 31, 2022. The increase was primarily driven by a higher number of aircraft operating during 2023 compared to 2022. The increase in Unites States revenue accounted for 15% of the total increase in revenues for the year ended December 31, 2023.
Canada revenue was $17.2 million for the year ended December 31, 2023 compared to zero for the year ended December 31, 2022. The increase was primarily driven by the result of our first expansion of aerial firefighting operations into Canada in 2023.
Cost of Revenues
Total cost of revenues increased by $7.5 million, or 22%, to $41.3 million for the year ended December 31, 2023, from $33.9 million for the year ended December 31, 2022.
Flight Operations
Flight operations costs increased by $5.7 million, or 30%, to $24.4 million for the year ended December 31, 2023, from $18.8 million for the year ended December 31, 2022. The increase was primarily attributable to an increase in employee labor expenses of $5.0 million and an increase in depreciation expense of $1.5 million, partially offset by a decrease in fuel expense of $0.8 million in 2023 compared to 2022. The increase in employee labor and depreciation was primarily due to an increase in flight hours associated with two additional Super Scooper aircraft placed into service in September 2022 and February 2023, respectively. 2023 employee labor expenses also include higher non-cash stock-based compensation from increased employee equity grants. The decrease in fuel expense is primarily attributable to a decrease in aerial surveillance, training and resource flight hours in 2023 compared to 2022.
Maintenance
Maintenance costs increased by $1.8 million, or 12%, to $16.9 million for the year ended December 31, 2023, from $15.1 million for the year ended December 31, 2022. The increase was primarily attributable to an increase in employee labor expenses of $1.4 million and an increase in other maintenance costs of $0.5 million, primarily attributable to two additional Super Scooper aircraft placed into service in September 2022 and February 2023, respectively.
Selling, General and Administrative Expense
Selling, general and administrative expense increased by $47.7 million, or 136%, to $82.9 million for the year ended December 31, 2023, from $35.1 million for the year ended December 31, 2022. The increase was primarily attributable to $45.7 million of non-cash stock-based compensation for RSUs issued to management and employees in 2023. The remaining increase was primarily attributable to a $10.7 million increase in business development, insurance, professional services and other expenses associated with operating as a publicly-traded company in 2023 and impairment charges of $2.4 million associated with three of our Twin Commander aircraft and our two Aurora eVTOL Skiron drone aircraft due to our plan to phase out our use of these specific platforms in our aerial surveillance operations. The increase was partially offset by $10.1 million of transaction related bonuses for employees recorded in the third quarter of 2022 in connection with the issuance of the Bridger Series C Preferred Shares, issuance of the Series 2022 Bonds, execution of the Transaction Agreements and initial filing of the proxy statement/prospectus.
Interest Expense
Interest expense increased by $3.2 million, or 16%, to $23.2 million for the year ended December 31, 2023, from $20.0 million for the year ended December 31, 2022. The increase was primarily driven by a full year, or $18.4 million, of interest expense on the Series 2022 Bonds issued in July 2022, partially offset by lower interest expense on the Legacy Bridger Series A-1 and Series A-2 Preferred Shares and Legacy Bridger Series B Preferred Shares which were fully redeemed in August 2022 and April 2022, respectively.
Other Income
Other income increased by $2.5 million, or 486%, to $3.1 million for the year ended December 31, 2023, from $0.5 million for the year ended December 31, 2022. The increase was primarily attributable to a $1.3 million increase in interest income, a $0.7 million decrease in losses on extinguishment of debt and a $0.5 million increase in gains on sales of marketable securities in 2023 compared to 2022.
Income Tax Benefit
Income tax benefit increased to $0.3 million for the year ended December 31, 2023, from zero for the year ended December 31, 2022. The increase was attributable to a discrete benefit generated from the Ignis acquisition during 2023.
NON-GAAP FINANCIAL MEASURES
Although we believe that net income or loss, as determined in accordance with GAAP, is the most appropriate earnings measure, we use EBITDA and Adjusted EBITDA as key profitability measures to assess the performance of our business. We believe these measures help illustrate underlying trends in our business and use the measures to establish budgets and operational goals, and communicate internally and externally, in managing our business and evaluating its performance. We also believe these measures help investors compare our operating performance with its results in prior periods in a way that is consistent with how management evaluates such performance.
Each of the profitability measures described below are not recognized under GAAP and do not purport to be an alternative to net income or loss determined in accordance with GAAP as a measure of our performance. Such measures have limitations as analytical tools and should not be considered in isolation or as substitutes for our results as reported under GAAP. EBITDA and Adjusted EBITDA exclude items that can have a significant effect on our profit or loss and should, therefore, be used only in conjunction with our GAAP profit or loss for the period. Our management compensates for the limitations of using non-GAAP financial measures by using them to supplement GAAP results to provide a more complete understanding of the factors and trends affecting the business than GAAP results alone. Because not all companies use identical calculations, these measures may not be comparable to other similarly titled measures of other companies.
EBITDA and Adjusted EBITDA
EBITDA is a non-GAAP profitability measure that represents net income or loss for the period before the impact of interest expense, income tax expense (benefit) and depreciation and amortization of property, plant and equipment and intangible assets. EBITDA eliminates potential differences in performance caused by variations in capital structures (affecting financing expenses), the cost and age of tangible assets (affecting relative depreciation expense) and the extent to which intangible assets are identifiable (affecting relative amortization expense).
Adjusted EBITDA is a non-GAAP profitability measure that represents EBITDA before certain items that are considered to hinder comparison of the performance of our businesses on a period-over-period basis or with other businesses. During the periods presented, we exclude from Adjusted EBITDA certain costs that are required to be expensed in accordance with GAAP, including stock-based compensation, business development and integration expenses, offering costs, loss on disposal of fixed assets and non-cash impairment charges, non-cash adjustments to the fair value of earnout consideration, non-cash adjustments to the fair value of Warrants issued in connection with the Reverse Recapitalization, loss on extinguishment of debt, and discretionary bonuses to employees and executives. Our management believes that the inclusion of supplementary adjustments to EBITDA applied in presenting Adjusted EBITDA are appropriate to provide additional information to investors about certain material non-cash items and about unusual items that we do not expect to continue at the same level in the future.
The reconciliation of Net loss, the most directly comparable GAAP measure, to EBITDA and Adjusted EBITDA for the years ended December 31, 2023 and 2022 is as follows:
| | | | | | | | | | | | | | | | | | | | | | | | | | |
| ($s in thousands) | | Year Ended December 31, 2023 | | Year Ended December 31, 2022 | | Period Over
Period
Change ($) | | Period Over
Period
Change (%) |
| Net loss | | $ | (77,358) | | | $ | (42,125) | | | $ | (35,233) | | | 84% |
| Income tax benefit | | (302) | | | — | | | (302) | | | n/a |
| Depreciation and amortization | | 11,089 | | | 9,091 | | | 1,998 | | | 22% |
| Interest expense | | 23,218 | | | 20,020 | | | 3,198 | | | 16% |
| EBITDA | | (43,353) | | | (13,014) | | | (30,339) | | | 233% |
Stock-based compensation1 | | 47,796 | | | 9 | | | 47,787 | | | 530,967% |
Business development & integration expenses2 | | 5,687 | | | 954 | | | 4,733 | | | 496% |
Offering costs3 | | 5,773 | | | 2,962 | | | 2,811 | | | 95% |
Loss on disposals and non-cash impairment charges4 | | 2,869 | | | 1,770 | | | 1,099 | | | 62% |
Change in fair value of earnout consideration5 | | 167 | | | — | | | 167 | | | n/a |
Change in fair value of Warrants6 | | (266) | | | — | | | (266) | | | n/a |
Loss on extinguishment of debt7 | | — | | | 845 | | | (845) | | | n/a |
Discretionary bonuses to employees and executives8 | | — | | | 10,137 | | | (10,137) | | | n/a |
| Adjusted EBITDA | | $ | 18,673 | | | $ | 3,663 | | | $ | 15,010 | | | 410% |
Net loss margin9 | | (116) | % | | (91) | % | | | | |
Adjusted EBITDA margin9 | | 28 | % | | 8 | % | | | | |
1 Represents stock-based compensation expense associated with employee and non-employee equity awards.
2 Represents expenses related to potential acquisition targets and additional business lines.
3 Represents one-time costs for professional service fees related to the preparation for potential offerings that have been expensed during the period.
4 Represents loss on the disposal of an aging aircraft and non-cash impairment charges on aircraft with projected cash flow losses.
5 Represents the fair value adjustment for earnout consideration issued in connection with the Ignis Acquisition.
6 Represents the fair value adjustment for Warrants issued in connection with the Reverse Recapitalization.
7 Represents loss on extinguishment of debt related to the Series 2021 Bond.
8 Represents one-time discretionary bonuses to certain employees and executives of Bridger in connection with the issuance of the Legacy Bridger Series C Preferred Shares, the issuance of the Series 2022 Bonds, execution of the Reverse Recapitalization transaction agreements and the initial filing of the proxy/statement/prospectus prepared in connection with the Reverse Recapitalization.
9 Net loss margin represents Net loss divided by Total revenue and Adjusted EBITDA margin represents Adjusted EBITDA divided by Total revenue.
LIQUIDITY AND CAPITAL RESOURCES
Going Concern
In accordance with Accounting Standards Codification (“ASC”) Topic 205-40, Going Concern, the Company has evaluated whether there are certain conditions and events, considered in the aggregate, that raise substantial doubt about the Company’s ability to continue as a going concern within 12 months after the date that these consolidated financial statements are issued. This evaluation includes considerations related to the covenants contained in the Company’s loan agreements as well as the Company’s liquidity position overall.
For the year ended December 31, 2023, the Company had an operating loss of $57.5 million, net loss of $77.4 million and cash flow used in operating activities of $26.8 million. In addition, as of December 31, 2023, the Company had unrestricted cash and investments of $24.0 million.
As disclosed in detail under the section entitled “Liquidity and Capital Resources—Indebtedness” below, the Company is not in compliance, or is projected to not be in compliance, with certain financial covenants associated with the Series 2022 Bonds during the next 12 months. Additionally, based on projected cash use, management anticipates that without additional cash funding the Company will not have sufficient cash on hand to fund operations within the next 12 months, until the Company begins to collect cash from its seasonal firefighting operations in 2024.
Beginning in November 2023, management has implemented steps to help improve the Company’s near-term cash position through a combination of cost reduction measures and the raising of funds through a number of potential avenues, including additional sales of our common stock through our at-the-market offering and issuing additional shares of common stock pursuant to our shelf registration statement. These sources of additional working capital are not currently assured, and consequently do not sufficiently mitigate the risks and uncertainties disclosed above. Our ability to raise additional funds will depend on, among other factors, financial, economic and market conditions, many of which are outside of our control and there can be no assurance that we will be able to obtain additional funding on satisfactory terms or at all.
Current and anticipated noncompliance with financial covenants and uncertainty regarding the Company’s ability to diligently prosecute the cost reduction plan and to raise additional cash funding raise substantial doubt about the Company’s ability to continue as a going concern within 12 months following the issuance date of the consolidated financial statements as of and for the period ended December 31, 2023.
Cash and Marketable Securities
As of December 31, 2023, our principal sources of liquidity were cash and cash equivalents of $23.0 million which were held for working capital purposes and restricted cash of $14.0 million. The restricted cash was procured through a county bond and is accessed for financing capital projects. As of December 31, 2023, the Company had $1.0 million of investments in debt securities classified as available-for-sale with short-term maturities of less than one year and carried at fair value. The Company’s available-for-sale securities investment portfolio is primarily invested in highly rated securities, with the primary objective of minimizing the potential risk of principal loss.
In connection with the Reverse Recapitalization, stockholders owning 34,245,643 JCIC Class A ordinary shares exercised their rights to have those shares redeemed for cash at a redemption price of approximately $10.16 per share, or an aggregate of $347.8 million. Following the payment of redemptions and expenses related to the Trust Account, there was approximately $2.4 million in remaining cash in the Trust Account, which was paid to UBS Securities LLC as a portion of its deferred underwriting fee from the JCIC’s initial public offering.
As a result, we did not receive any cash proceeds from the Reverse Recapitalization. Total direct and incremental transaction costs of Bridger, JCIC and Legacy Bridger paid at Closing were approximately $16.6 million.
We may receive up to $306.5 million from the exercise of the 9,400,000 private placement warrants and 17,249,874 public warrants of the Company outstanding (collectively, the “Warrants”), assuming the exercise in full of all the Warrants for cash, but not from the sale of the shares of Common Stock issuable upon such exercise. On December 29, 2023, the closing price of our Common Stock was $6.91 per share. For so long as the market price of our Common Stock is below the exercise price of our Warrants ($11.50 per share), our Warrants remain “out-of-the money,” and holders of our Warrants are unlikely to cash exercise their Warrants, resulting in little or no cash proceeds to us. There can be no assurance that our Warrants will be in the money prior to their January 24, 2028 expiration date, and therefore, we may not receive any cash proceeds from the exercise of our Warrants to fund our operations. Accordingly, we have not relied on the receipt of proceeds from the exercise of our Warrants in assessing our capital requirements and sources of liquidity.
We may in the future seek to raise additional funds through various potential sources, such as equity and debt financing for general corporate purposes or for specific purposes, including in order to pursue growth initiatives. Based on our unrestricted cash and cash equivalents balance as of December 31, 2023, and our projected cash use, we would anticipate the need to raise additional funds through equity or debt financing (or the issuance of stock as acquisition consideration) to pursue any significant acquisition opportunity, at the time of such acquisition opportunity. Our ability to generate proceeds from equity financings will significantly depend on the market price of our Common Stock.
On July 21, 2023, we entered into a Purchase and Sale Agreement (the “Bighorn Purchase Agreement”), through our subsidiary Bridger Bighorn, LLC, with Robert Eisele and Christopher Eisele (the “Bighorn Sellers”), the owners of Big Horn Airways, Inc. (“Bighorn”), pursuant to which we agreed to acquire 100% of the outstanding equity interests of Bighorn. The aggregate consideration for the Bighorn acquisition was $39.3 million, with $14.8 million payable in unregistered shares of Common Stock, and the remainder of $24.5 million payable in cash, as may be adjusted pursuant to the terms of the Bighorn Purchase Agreement, including for Bighorn’s cash, indebtedness, and net working capital as of the closing of the Bighorn acquisition. In November 2023, the Company and the Bighorn Sellers mutually agreed to terminate the Bighorn Purchase Agreement. There are no termination fees payable by either party and the Company has agreed to reimburse Bighorn $0.5 million for all fees incurred in connection with the proposed transaction.
On November 17, 2023, the Company entered into a series of agreements designed to facilitate the purchase and return to service of the Spanish Scoopers originally awarded to the Company’s wholly-owned subsidiary, Bridger Aerospace Europe, S.L.U. (“BAE”), in September 2023 via a public tender process from the Government of Spain for €40.3 million. Under the terms of the agreements, the Company agreed to sell its entire outstanding equity interest in BAE to MAB and purchase $4.0 million of non-voting Class B units of MAB. The Company also entered into a services agreement with MAB whereby the Company will manage the return to service upgrades of the Spanish Scoopers through the Company’s wholly-owned Spanish subsidiary, Albacete Aero, S.L., while they are owned and funded by MAB. The service agreement also provides that the Company has the right, but not the obligation, to acquire each Spanish Scooper as it is ready to be contracted and returned to service. Our management team estimates that the cost to renovate and upgrade these Spanish Scoopers will be approximately $8 million to $12 million per aircraft. Assuming timely completion of such renovations and upgrades, we expect these modified Spanish Scoopers to generate revenue and Adjusted EBITDA in-line with Bridger’s current fleet of Super Scoopers once contracting mechanics are negotiated with various foreign governments during their respective return-to-service timeframes. However, there can be no assurance that this acquisition will be completed upon the timeline discussed above or at all, nor that the Company will be able to successfully contract with various foreign governments to generate revenue.
Indebtedness
As of December 31, 2023, we held $25.4 million of current liabilities, $17.2 million of which was accrued expenses and other current liabilities.
As of December 31, 2023, we held $221.1 million of long-term liabilities with $204.6 million of total long-term debt, net of debt issuance costs, comprised of the Series 2022 Bonds, two separate credit facilities brokered through Live Oak Bank, two separate credit facilities with Rocky Mountain Bank and various short term vehicle loans through First Interstate Bank.
Series 2022 Bonds
On July 21, 2022, we closed our Series 2022 Bond Offering in a taxable industrial development revenue bond transaction with Gallatin County, Montana for $160.0 million (the “Series 2022 Bond Offering”). Pursuant to the Series 2022 Bond Offering, Gallatin County issued $135.0 million of bonds on July 21, 2022 and an additional $25.0 million of bonds on August 10, 2022. The proceeds from the offering, together with cash on hand, were used to redeem the capital contributions plus accrued interest for all of the remaining Legacy Bridger Series A-1 preferred shares and Legacy Bridger Series A-2 preferred shares totaling $134.0 million, the principal plus accrued interest for the Series 2021 Gallatin County municipal bond, totaling $7.7 million, to finance the construction and equipping of the Company’s third aircraft hangar in Belgrade, Montana and to fund the purchase of additional Super Scooper aircraft. The Series 2022 Bonds mature on September 1, 2027, with an annual interest rate of 11.5%. Interest is payable semiannually on March 1 and September 1 of each year until maturity and commenced on September 1, 2022. Debt issuance costs for the Series 2022 Bonds was $4.2 million.
Optional Redemption—We may redeem the Series 2022 Bonds (i) during the period beginning on September 1, 2025 through August 31, 2026, at a redemption price equal to 103% of the principal amount plus accrued interest; (ii) during the period beginning on September 1, 2026 through August 31, 2027, at a redemption price equal to 102% of the principal amount plus accrued interest; and (iii) on or after September 1, 2027, at a redemption price equal to 100% of the principal amount plus accrued interest. At our direction, the Series 2022 Bonds may be redeemed by Gallatin County at any time, at a redemption price equal to 100% of the principal amount plus accrued interest upon the occurrence of certain events set forth in that certain Amended and Restated Trust Indenture, dated as of June 1, 2022 (the “Indenture”), between Gallatin County and U.S. Bank Trust Company, National Association, Salt Lake City, Utah.
Mandatory and Extraordinary Redemptions—Subject to the terms of the Indenture, the Series 2022 Bonds must be redeemed, including, among other things, (i) from all the proceeds of the sale of any Super Scooper, (ii) in an amount equal to (a) 50% of our operating revenues less the portion used to pay or establish reserves for all our expenses, debt payments, capital improvements, replacements, and contingencies (“Excess Cash Flow”) or (b) 100% of Excess Cash Flow, in each case, in the event we fall below certain debt service coverage ratio requirements set forth in the Indenture, and (iii) upon a change of control (each a “Mandatory Redemption”). For each Mandatory Redemption, the Series 2022 Bonds will be redeemed in whole or in part, at a redemption price equal to 100% of the principal amount of each Series 2022 Bond redeemed plus any premium that would be applicable to an optional redemption of the Series 2022 Bonds on such date (and if such redemption occurs prior to September 1, 2025, the applicable premium shall be three percent (3%)) and accrued interest. Furthermore, subject to the terms of the Indenture, at our direction, the Series 2022 Bonds may be redeemed by Gallatin County at any time, at a redemption price equal to 100% of the principal amount plus accrued interest upon the occurrence of certain events, including, among other things, casualty, condemnation, or other unexpected events set forth in the Indenture.
Financial Covenants— In connection with the Series 2022 Bonds, we are a party to certain loan agreements that contain customary representation and warranties, negative covenants, including, limitations on indebtedness, reduction of liquidity below certain levels, and asset sales, merger and other transactions, and remedies on and events of default.
Under the terms of such loan agreements, we are subject to certain financial covenants, that require, among other things, that we operate in a manner and to the extent permitted by applicable law, to produce sufficient gross revenues so as to be at all relevant times in compliance with the terms of such covenants, including that we maintain (i) beginning with the fiscal quarter ending December 31, 2023, a minimum debt service coverage ratio (generally calculated as the aggregate amount of our total gross revenues, minus operating expenses, plus interest, depreciation and amortization expense, for any period, over our maximum annual debt service requirements, as determined under such loan agreement) that exceeds 1.25x and (ii) beginning with the fiscal quarter ending September 30, 2022, a minimum liquidity of not less than $8 million in the form of unrestricted cash and cash equivalents, plus liquid investments and unrestricted marketable securities at all times.
Subject to the terms of the loan agreements, in the event we are unable to comply with the terms of the financial covenants, we may be required (among other potential remedial actions) to engage an independent consultant to review, analyze and make recommendations with respect to our operations or in some instances, this could result in an event of default and/or the acceleration of our debt obligations under the loan agreements. In addition, the acceleration of our debt obligations may in some instances (as set forth in our Amended and Restated Charter) result in an increase in the dividend rate of the Series A Preferred Stock by 2.00% per annum from the dividend rate otherwise in effect at such time.
The Company is not in compliance with the debt service coverage ratio covenant as of December 31, 2023 and management anticipates the Company to continue to not be in compliance with the debt service coverage ratio covenant at future quarterly measurement periods during the next 12 months, primarily attributable to the seasonal nature of our business and a less intense 2023 wildfire season. Although the Company is in compliance with the $8.0 million minimum liquidity requirement as of December 31, 2023, based on projected cash use, management anticipates that without additional cash funding the Company will not have sufficient cash on hand to comply with the minimum liquidity covenant or to fund operations, including $18.4 million of required interest payments associated with the Series 2022 Bonds, within the next 12 months, until the Company begins to collect cash from its seasonal firefighting operations in 2024.
The Series 2022 Bonds agreements provide that, with regard to covenant violations, other than non-payment of principal or interest, no event of default shall be deemed to have occurred so long as a reasonable course of action to remedy a violation commences within 30 days of non-compliance and management diligently prosecutes the remediation plan to completion.
Management consulted with bond counsel on the impact of covenant violations and proactively developed a cost reduction plan, and began implementing the plan in November 2023, to help remedy the anticipated covenant breaches in 2024. However, this plan is in progress and there is no assurance that management will be able to diligently prosecute the remediation plan to completion. The uncertainty regarding the company’s ability to diligently prosecute the remediation plan to completion and the potential impact on the bonds maturity as a result of the anticipated debt covenant violations at subsequent compliance dates or failure to make required interest payments, could result in the Series 2022 Bonds becoming immediately due and payable, which raises substantial doubt about our ability to continue as a going concern.
Live Oak Bank Loans
Our loans with Live Oak Bank are subject to financial covenants requiring the Company to maintain a debt service coverage ratio, generally calculated as the ratio of the net cash flow (as defined in the applicable note agreements) to the amount of interest and servicing fees required to be paid over the succeeding 12 months on the principal amount of the note, as applicable, that will be outstanding on the payment date following such date of determination, that exceeds 1.25x at the aircraft or entity level and for the Company’s debt to worth ratio to not exceed 5.00x at the aircraft or entity level. The Company is in compliance with such financial covenants as of December 31, 2023.
Rocky Mountain Bank Loans
Through certain of our subsidiaries, we entered into two credit facilities with Rocky Mountain Bank to finance in part (i) the construction of airplane hangars on September 30, 2019 and (ii) the purchase of four Quest Kodiak aircraft on February 3, 2020. In connection with such credit facilities, we also entered into various term loan and other long-term debt agreements which contain certain financial covenants, including, that we maintain (i) a debt service coverage ratio that exceeds 1.25x (generally calculated as the ratio of the net operating income over the debt service payments made or as the ratio of adjusted EBITDA over the aggregate amount of interest and principal payments, in each case, as determined in the applicable agreement) and (ii) certain senior leverage ratios that do not exceed 7.00x through the third quarter of 2024, 6.00x through the third quarter of 2025, or 5.00x thereafter (generally calculated as the ratio of the senior funded debt over EBITDA, as determined in the applicable agreement). The Company is in compliance with such financial covenants as of December 31, 2023.
Mandatorily Redeemable Preferred Stock
Legacy Bridger Series B Preferred Shares
On April 25, 2022, we used a portion of the proceeds from the issuance of the Legacy Bridger Series C Preferred Shares to redeem all 60,000,000 of our outstanding Legacy Bridger Series B Preferred Shares for $70.0 million, inclusive of $10.0 million in accrued interest.
Legacy Bridger Series A Preferred Shares
On April 25, 2022, we and our investors included a new mandatory redemption provision requiring Legacy Bridger Series A Preferred Shares to be redeemed on April 25, 2032. Due to the mandatory redemption provision, Legacy Bridger Series A Preferred Shares were reclassified from mezzanine equity to liability. We elected the fair value option to measure the modification of the Legacy Bridger Series A Preferred Shares. On July 25, 2022, we used the proceeds from the Series 2022 Bonds plus cash on hand to redeem in full the remaining 6,055,556 shares of the Legacy Bridger Series A Preferred Shares for aggregate proceeds of $136.3 million. The fair values of the Legacy Bridger Series A Preferred Shares increased by $3.9 million from interest accrued since the modification on April 25, 2022 and no gain or loss were recorded to net loss upon redemption.
Mezzanine and Permanent Equity
Preferred Shares
On April 25, 2022, we authorized and issued 315,789.473684 Legacy Bridger Series C Preferred Shares for aggregate proceeds of $288.5 million, net of issuance costs of $11.5 million. Legacy Bridger Series C Preferred Shares rank senior to our Common Stock and ranked subordinate to Legacy Bridger Series A Preferred Shares with respect to the distribution of assets upon liquidation or certain triggering events. Upon the Closing, Legacy Bridger Series C Preferred Shares were exchanged for shares of Series A Preferred Stock on a one-to-one basis as a portion of the merger consideration issued in connection with the Reverse Recapitalization. The Series A Preferred Stock is classified as mezzanine equity as it remains probable that they may become redeemable upon the mandatory redemption date of April 25, 2032. Series A Preferred Stock does not participate in earnings and is non-voting. For additional information regarding the terms and conditions of the Series A Preferred Stock, see “Note 20 – Mezzanine Equity” for additional details.
Prior to the Closing, Legacy Bridger Series C Preferred Shares accrued interest daily at 7% per annum for the first year, 9% per annum for the second year and 11% per annum thereafter. Following the Closing, the Series A Preferred Stock will continue to accrue interest daily at 7% per annum for the first six years, 9% per annum for the seventh year and 11% per annum thereafter. Accrued interest for Series A Preferred Stock was $22.2 million as of December 31, 2023.
As of December 31, 2023, it was probable that the Series A Preferred Stock may become redeemable at the holder’s option on or after March 29, 2027. We have elected to recognize changes in redemption value immediately, adjusting the preferred shares to the maximum redemption value at each reporting date. Upon the Closing and exchange of Legacy Bridger Series C Preferred Shares for Series A Preferred Stock, the 50% multiplier, applicable to redemptions of Legacy Bridger Series C Preferred Shares, valued at $157.9 million as of December 31, 2022, was removed and treated as a deemed dividend. As of December 31, 2023, Series A Preferred Stock had a carrying value and redemption value of $354.8 million.
Common Stock
Legacy Bridger had 30,000,000 Legacy Bridger Class A common shares issued and outstanding as of December 31, 2022. The holders of these shares were entitled to one vote for each share held of record on all matters submitted to a vote of Legacy Bridger’s equityholders. These Legacy Bridger Class A common shares were issued to ElementCompany, LLC.
Legacy Bridger had 9,756,130 Legacy Bridger Class B common shares issued and outstanding as of December 31, 2022. The holders of these Legacy Bridger Class B common shares were entitled to one vote for each share held of record on all matters submitted to a vote of Legacy Bridger’s equityholders.
Legacy Bridger had 243,871 Legacy Bridger Class C common shares issued and outstanding as of December 31, 2022. Legacy Bridger also had 606,061 Legacy Bridger Class D common shares issued and outstanding as of December 31, 2022. These Legacy Bridger Class C common shares and Legacy Bridger Class D common shares were non-voting shares.
Prior to the Closing, Legacy Bridger’s voting power followed the structure of the elected board members with three (3) designees from the holders of Legacy Bridger Class A common shares and two (2) designees from the holders of Legacy Bridger Class B common shares. This remained in place until the Closing.
Upon the Closing on January 24, 2023 and at December 31, 2023, we had 43,769,290 and 44,776,926 shares of Common Stock issued and outstanding, respectively.
Historical Cash Flows
Our consolidated cash flows from operating, investing and financing activities for the years ended December 31, 2023 and 2022 were as follows:
| | | | | | | | | | | | | | |
| $s in thousands | | Year Ended December 31, 2023 | | Year Ended December 31, 2022 |
| Net cash used in operating activities | | $ | (26,808) | | | $ | (9,918) | |
| Net cash provided by (used in) investing activities | | 27,158 | | | (89,813) | |
| Net cash (used in) provided by financing activities | | (5,831) | | | 124,930 | |
| Effects of exchange rate changes | | (42) | | | — | |
| Net change in cash and cash equivalents | | $ | (5,523) | | | $ | 25,199 | |
Operating Activities
Net cash used in operating activities was $26.8 million for the year ended December 31, 2023, compared to Net cash used in operating activities of $9.9 million for the year ended December 31, 2022. Net cash used in operating activities reflects Net loss of $77.4 million for the year ended December 31, 2023 compared to $42.1 million for the year ended December 31, 2022. Net cash used in operating activities for the year ended December 31, 2023 reflects add-backs to Net loss for non-cash charges totaling $62.2 million, primarily attributable to stock-based compensation expense of $47.8 million and depreciation and amortization of $11.1 million. Net cash used in operating activities for the year ended December 31, 2022 reflects add-backs to Net loss for non-cash charges totaling $20.9 million, primarily attributable to depreciation and amortization of $9.1 million, change in fair value of Legacy Bridger Series A Preferred Shares of $3.9 million and interest accrued on Legacy Bridger Series B Preferred Shares of $3.6 million.
Investing Activities
Net cash provided by investing activities was $27.2 million for the year ended December 31, 2023, compared to Net cash used in investing activities of $89.8 million for the year ended December 31, 2022. Net cash provided by investing activities for the year ended December 31, 2023 primarily reflects proceeds from sales and maturities of marketable securities of $55.4 million, partially offset by purchases of property, plant and equipment of $20.7 million. Net cash used in investing activities for the year ended December 31, 2022 primarily reflects purchases of marketable securities of $60.2 million and purchases of property, plant and equipment and investments in construction in progress of $35.4 million.
Financing Activities
Net cash used in financing activities was $5.8 million for the year ended December 31, 2023, compared to Net cash provided by financing activities of $124.9 million for the year ended December 31, 2022. Net cash used in financing activities for the year ended December 31, 2023 primarily reflects costs incurred related to the Closing of $6.8 million and repayments of debt of $2.2 million partially offset by proceeds from the Closing of $3.2 million. Net cash provided by financing activities for the year ended December 31, 2022 primarily reflects borrowings from the Legacy Bridger Series C Preferred Shares and Series 2022 Bonds of $448.5 million, partially offset by payments to Legacy Bridger Series A and Series B Preferred Shares members of $306.2 million.
Contractual Obligations
Our principal commitments consist of obligations for outstanding leases and debt. The following table summarizes our contractual obligations as of December 31, 2023:
| | | | | | | | | | | | | | | | | | | | |
| | Payments Due by Period |
| $s in thousands | | Total | | Current | | Noncurrent |
| Lease obligations | | $ | 11,155 | | | $ | 2,179 | | | $ | 8,976 | |
| Debt obligations | | 211,374 | | | 2,993 | | | 208,381 | |
| Total | | $ | 222,529 | | | $ | 5,172 | | | $ | 217,357 | |
On February 14, 2023, we made the final $9.1 million payment for the purchase of aircraft under our purchase agreement with Longview Aviation Services Inc. and Viking Air Limited (the manufacturer of our Super Scooper aircraft and an affiliate of Longview Aviation Services Inc.), dated April 13, 2018.
On November 17, 2023, the Company entered into a series of agreements with MAB and its subsidiary designed to facilitate the purchase and return to service of four Spanish Scoopers originally awarded to the Company in September 2023 via a public tender process from the Government of Spain. The terms of the agreements provide that the Company will manage the return to service upgrades of the Spanish Scoopers while they are owned and funded by MAB. The Company has the right, but not the obligation, to acquire each plane as it is ready to be contracted and returned to service. In the event that the Company does not purchase the aircraft within the time periods set forth in the agreements, then either party may initiate a sales process for the sale of all aircraft that have not been purchased by the Company, which sales process the Company will oversee and manage. If the aircraft are sold to a third party through such process, then the Company must pay the MAB’s subsidiary a cash fee equal to the amount, if any, by which the aggregate price of the Company’s purchase options for such aircraft exceeds the consideration paid by the third-party purchaser for the same aircraft, not to exceed $15.0 million in aggregate. If the aircraft are not sold to a third party and MAB’s subsidiary has not otherwise entered into an operating lease with a third party for the aircraft, then the Company must pay MAB’s subsidiary $15.0 million.
Off-Balance Sheet Arrangements
On November 17, 2023, we entered into a series of agreements designed to facilitate the purchase and return to service of the Spanish Scoopers originally awarded to our wholly-owned subsidiary, BAE, in September 2023 via a public tender process from the Government of Spain for €40.3 million. Under the terms of the agreements, we agreed to sell the entire outstanding equity interest in BAE to MAB and purchase $4.0 million of non-voting Class B units of MAB. We also entered into a services agreement with MAB whereby we will manage the return to service upgrades of the Spanish Scoopers through our wholly-owned Spanish subsidiary, Albacete Aero, S.L., while they are owned and funded by MAB. The service agreement also provides that we have the right, but not the obligation, to acquire each Spanish Scooper as it is ready to be contracted and returned to service. The Company assessed both MAB and BAE for variable interest entity accounting under ASC 810-10-15 and determined that MAB is a voting interest entity and BAE is a variable interest entity. However, neither entity is consolidated in the consolidated financial statements as the Company does not have a controlling financial interest in MAB and the Company is not the primary beneficiary of BAE.
As of December 31, 2023 and 2022, we did not have any other relationships with special purpose or variable interest entities which have been established for the purpose of facilitating off-balance sheet arrangement, which have not been consolidated in the consolidated financial statements of the Company. Refer to “Note 2 – Summary of Significant Accounting Policies” of the Notes to Consolidated Financial Statements included in this Annual Report on Form 10-K for additional information.
CRITICAL ACCOUNTING POLICIES AND ESTIMATES
Our Consolidated Financial Statements and the related notes included elsewhere in this Annual Report on Form 10-K are prepared in accordance with GAAP. The preparation of these Consolidated Financial Statements requires us to make estimates and assumptions that affect the reported amounts of assets, liabilities, revenue, costs and expenses, provision for income taxes and related disclosures. We base our estimates on historical experience and on various other assumptions that we believe to be reasonable under the circumstances. Changes in accounting estimates are reasonably likely to occur from period to period. Accordingly, actual results could differ significantly from the estimates made by our management. We evaluate our estimates and assumptions on an ongoing basis. To the extent that there are material differences between these estimates and actual results, our future financial statement presentation, financial condition, results of operations and cash flows will be affected.
We believe that the following critical accounting policies involve a greater degree of judgment or complexity than our other accounting policies. Accordingly, these are the policies we believe are the most critical to aid in fully understanding and evaluating our consolidated financial condition and results of operations.
Investments in Marketable Securities
Investments in debt securities are classified as available-for-sale and are carried at fair value, with unrealized gains and losses reported as accumulated other comprehensive income. Gains and losses are recognized when realized. Unrealized losses are evaluated for impairment to determine if the impairment is credit related. An other-than-temporary credit impairment would be recognized as an adjustment to income. Gains and losses are determined using the first-in first-out method. Investments in marketable securities are classified as current assets with short-term maturities of less than one year.
Revenue Recognition
We charge daily and hourly rates depending upon the type of firefighting services rendered and under which contract the services are performed. These services are primarily split into flight revenue and standby revenue. Flight revenue is primarily earned at an hourly rate when the engines of the aircraft are started and stopped upon request of the customer, tracked via flight logs for Super Scoopers or a Hobbs meter for other aircraft. Standby revenue is earned primarily as a daily rate when aircraft are available for use at a fire base, awaiting request from the customer for flight deployment.
We enter into short, medium and long-term contracts with customers, primarily with government agencies to deploy aerial fire management assets during the firefighting season. Revenue is recognized when performance obligations under the terms of a contract with our customers are satisfied and payment is typically due within 30 days of invoicing. This occurs as the services are rendered and include the use of the aircraft, pilot, and field maintenance personnel to support the contract.
Contracts are based on either a CWN or EU basis. Rates established are generally more competitive based on the security of the revenue from the contract (i.e., an EU versus only on an as-needed basis in CWN). These rates are delineated by the type of service, generally flight time or time available for deployment. Once an aircraft is deployed on a contract the fees are earned at these rates and cannot be obligated to another customer. Contracts have no financing components and consideration is at pre-determined rates. No variable considerations are constrained within the contracts.
The transaction prices are allocated on the service performed and tracked real-time by each operator in a duty log. On at least a monthly basis, the services performed and rates are validated by each customer. Acceptance by the customer is evidenced by the provision of their funded task order or accepted invoice.
Other revenue consists of leasing revenues from the rental of BSI, LLC facilities to another related party as well as external repair work performed on customer aircraft by Bridger Aviation Repair, LLC.
Payment terms vary by customer and type of revenue contract. We generally expect that the period of time between payment and transfer of promised goods or services will be less than one year. In such instances, we have elected the practical expedient to not evaluate whether a significant financing component exists. As permitted under the practical expedient available under ASC 606, Revenue from Contracts with Customers, we do not disclose the value of unsatisfied performance obligations for (i) contracts with an original expected length of one year or less and (ii) contracts for which we recognize revenue at the amount which we have the right to invoice for services performed.
Sales taxes and value added taxes in foreign jurisdictions that are collected from customers and remitted to governmental authorities are accounted for on a net basis and therefore are excluded from Revenues.
Business Combinations
The Company records tangible and intangible assets acquired and liabilities assumed in business combinations under the acquisition method of accounting in accordance with ASC 805, Business Combinations. Under the acquisition method of accounting, amounts paid for the acquisition are allocated to the assets acquired and liabilities assumed based on their estimated fair values at the date of acquisition inclusive of identifiable intangible assets. Acquisition consideration includes contingent consideration with payment terms based on the achievement of certain targets of the acquired business. The estimated fair value of identifiable assets and liabilities, including intangibles, are based on valuations that use information and assumptions available to management. The Company allocates any excess purchase price over the fair value of the tangible and identifiable intangible assets acquired and liabilities assumed to goodwill. Significant management judgments and assumptions are required in determining the fair value of assets acquired and liabilities assumed, particularly acquired intangible assets, including estimated useful lives. The valuation of purchased intangible assets is based upon estimates of the future performance and discounted cash flows of the acquired business. Each asset acquired or liability assumed is measured at estimated fair value from the perspective of a market participant.
Contingent consideration represents an obligation of the acquirer to transfer additional assets or equity interests to the seller if future events occur or conditions are met and is recognized when probable and reasonably estimable. Contingent consideration recognized is included in the initial cost of the assets acquired. Subsequent changes in the estimated fair value of contingent consideration are recognized as Selling, general and administrative expenses within the Consolidated Statements of Operations.
Stock-Based Compensation
In January 2023, the Company along with the Board established and approved and assumed the Bridger Aerospace Group Holdings, Inc. 2023 Omnibus Incentive Plan (the “Omnibus Plan”). The Omnibus Plan was developed to motivate and reward employees and other individuals to perform at the highest level and contribute significantly to the success of the Company, thereby furthering the best interests of the Company and its shareholders. The Omnibus Plan provides, among other things, the ability for the Company to grant options, stock appreciation rights, restricted stock, restricted stock units (“RSUs”), performance awards and other stock-based and cash-based awards to employees, consultants and non-employee directors.
The Omnibus Plan expires on January 23, 2033 and authorizes 15,099,137 shares of common stock for grant over the life of the Omnibus Plan. As of December 31, 2023, 5,314,546 shares of common stock remain available for grant under the Omnibus Plan.
As of December 31, 2023, the Company has granted participants RSUs and bonuses paid in Common Stock under the Omnibus Plan. Upon satisfying the vesting conditions, each RSU provides the participant the right to receive one share of Common Stock. The fair value of RSUs is determined based on the quoted market price of the Common Stock on the date of grant. Compensation cost for the RSUs is recognized over the requisite service period based on a graded-vesting method. The Company accounts for forfeitures as they occur. Stock-based compensation is included in both Cost of revenues and Selling, general and administrative expense in the Consolidated Statements of Operations. Upon vesting of each RSU, the Company will issue one share of Common Stock to the RSU holder.
Prior to the adoption of the Omnibus Plan, Legacy Bridger granted incentive units (the “Legacy Bridger Incentive Units”) to selected board members and executives. Within each grant, 80% of the Legacy Bridger Incentive Units vest annually over a four-year period subject to continued service by the grantee (the “Time-Vesting Incentive Units”) and the remaining 20% of the Legacy Bridger Incentive Units vest upon a qualifying change of control event (the “Exit-Vesting Incentive Units”). In connection with the Reverse Recapitalization, the Company assumed all of the remaining 242,424 outstanding and unvested Legacy Bridger Incentive Units. Upon vesting of each Legacy Bridger Incentive Unit, the Company will issue Common Stock to the Incentive Unit holder at an exchange ratio of 0.96246 shares of Common Stock per Incentive Unit.
Notwithstanding the above, any unvested Time-Vesting Incentive Units will become vested Time-Vesting Incentive Units if a qualifying change of control event occurs prior to the respective award’s four-year service-based vesting period. Upon termination of the board member or executive, the Company has the right, but not the obligation, to repurchase all or any portion of the vested Incentive Units at fair market value.
For the Time-Vesting Incentive Units, compensation cost is recognized over the requisite service period on a straight-line basis. Upon a qualifying change of control event, the unrecognized compensation expense related to the Time-Vesting Incentive Units will be recognized when the change of control event is considered probable. For the Exit-Vesting Incentive Units, expense is recognized when a qualifying change of control event is considered probable, which has not occurred as of December 31, 2023. Forfeitures are accounted for as they occur.
Compensation cost for the Legacy Bridger Incentive Units was measured at their grant-date fair value. The value of Legacy Bridger common shares was derived through an option pricing model, which incorporated various assumptions. Refer to “Note 18 – Stock-Based Compensation” of the Notes to Consolidated Financial Statements included in this Annual Report on Form 10-K for a summary of the assumptions utilized in determining grant-date fair value.
Impairment of Goodwill and Long-Lived Assets
Goodwill
Goodwill represents the excess of purchase price over fair value of the net assets acquired in an acquisition. Beginning in 2023, the Company assesses goodwill for impairment as of October 1 annually or more frequently upon an indicator of impairment. Prior to 2023, the Company assessed goodwill for impairment as of December 31 annually or more frequently upon an indicator of impairment. The change to an October 1 annual goodwill impairment assessment date was made to ensure the completion of the Company’s assessment prior to the end of its annual reporting period, thereby aligning impairment testing procedures with its year-end financial reporting.
When we elect to perform a qualitative assessment and conclude it is more likely that the fair value of the reporting unit is greater than its carrying value, no further assessment of that reporting unit’s goodwill is necessary. Otherwise, a quantitative assessment is performed, and the fair value of the reporting unit is determined. If the carrying value of the reporting unit exceeds its fair value, an impairment loss equal to the excess is recorded. Conditions that would trigger an impairment assessment include, but are not limited to, a significant adverse change in legal factors or the business climate that could affect the value of an asset or an adverse reaction. As of the October 1, 2023 and December 31, 2022 annual goodwill impairment tests, the Company’s qualitative analysis indicated the fair value of the Company’s reporting unit exceeded its carrying value.
Long-Lived Assets
A long-lived asset (including amortizable identifiable intangible assets) or asset group is tested for recoverability whenever events or changes in circumstances indicate that its carrying amount may not be recoverable. Conditions that may indicate impairment include, but are not limited to, a significant adverse change in customer demand or business climate that could affect the value of an asset, or an adverse action or assessment by a regulator. When indicators of impairment are present, we evaluate the carrying value of the long-lived assets in relation to the operating performance and future undiscounted cash flows of the underlying assets. We adjust the net book value of the long-lived assets to fair value if the sum of the expected future cash flows is less than book value.
Property, Plant and Equipment, net
Property, plant and equipment is stated at net book value, cost less depreciation. Depreciation for aircraft, engines and rotable parts is recorded over the estimated useful life based on flight hours. Depreciation for vehicles and equipment and buildings is computed using the straight-line method over the estimated useful lives of the property, plant and equipment. Depreciable lives by asset category are as follows:
| | | | | | | | |
| | Estimated useful life |
| Aircraft, engines and rotable parts | | 1,500 – 6,000 flight hours |
| Vehicles and equipment | | 3 – 5 years |
| Buildings | | 40 years |
Property, plant and equipment are reviewed for impairment as discussed above under “Long-Lived Assets”.
Cost Method Investments
We hold equity securities without a readily determinable fair value, which are only adjusted for observable price changes in orderly transactions for the same or similar equity securities or any impairment, totaling $5.0 million and $1.0 million as of December 31, 2023 and 2022, respectively.
Variable Interest Entities
We follow ASC 810-10-15 guidance with respect to accounting for VIEs. These entities do not have sufficient equity at risk to finance their activities without additional subordinated financial support from other parties or whose equity investors lack any of the characteristics of a controlling financial interest. A variable interest is an investment or other interest that will absorb portions of a VIE’s expected losses or receive portions of its expected returns and are contractual, ownership or pecuniary in nature and that change with changes in the fair value of the entity’s net assets. A reporting entity is the primary beneficiary of a VIE and must consolidate it when that party has a variable interest, or combination of variable interests, that provide it with a controlling financial interest. A party is deemed to have a controlling financial interest if it meets both of the power and loss/benefits criteria. The power criterion is the ability to direct the activities of the VIE that most significantly impact its economic performance. The losses/benefits criterion is the obligation to absorb losses from, or right to receive benefits from, the VIE that could potentially be significant to the VIE. The VIE model requires an ongoing reconsideration of whether a reporting entity is the primary beneficiary of a VIE due to changes in the facts and circumstances. For the years ended December 31, 2023 and 2022, Northern Fire Management Services, LLC, a VIE of which the Company was identified as the primary beneficiary, is consolidated into our financial statements. Refer to “Note 2 – Summary of Significant Accounting Policies” of the Notes to Consolidated Financial Statements included in this Annual Report on Form 10-K for additional information.
Fair Value of Financial Instruments
We follow guidance in ASC 820, Fair Value Measurement, where fair value is defined as the price that would be received to sell an asset or paid to transfer a liability in an orderly transaction between market participants at the measurement date. Fair value measurements are determined within a framework that establishes a three-tier hierarchy which maximizes the use of observable market data and minimizes the use of unobservable inputs to establish a classification of fair value measurements for disclosure purposes. Inputs may be observable or unobservable. Observable inputs reflect the assumptions market participants would use in pricing the asset or liability based on market data obtained from sources independent of our business. Unobservable inputs reflect our own assumptions about the assumptions market participants would use in pricing the asset or liability based on the information available.
Warrant Liabilities
We account for the Warrants issued in connection with the Reverse Recapitalization in accordance with the guidance contained in accordance with ASC 480, Distinguishing Liabilities from Equity and ASC 815-40, Derivatives and Hedging—Contracts in Entity’s Own Equity, under which the Warrants do not meet the criteria for equity treatment and must be recorded as liabilities. Accordingly, we classify the Warrants as liabilities at their fair value and adjust the Warrants to fair value at each reporting period. The warrant liabilities are subject to remeasurement at each balance sheet date until exercised. Refer to “Note 13 – Accrued Expenses and Other Liabilities” of the Notes to Consolidated Financial Statements included in this Annual Report on Form 10-K for additional information.
RECENT ACCOUNTING PRONOUNCEMENTS
For additional information regarding recent accounting pronouncements adopted and under evaluation, refer to “Note 2 – Summary of Significant Accounting Policies” of the Notes to Consolidated Financial Statements included in this Annual Report on Form 10-K.
EMERGING GROWTH COMPANY AND SMALLER REPORTING COMPANY STATUS
Section 102(b)(1) of the JOBS Act exempts “emerging growth companies” as defined in Section 2(A) of the Securities Act of 1933, from being required to comply with new or revised financial accounting standards until private companies are required to comply with the new or revised financial accounting standards. The JOBS Act provides that a company can choose not to take advantage of the extended transition period and comply with the requirements that apply to non-emerging growth companies, and any such election to not take advantage of the extended transition period is irrevocable. We are an “emerging growth company” and have elected to take advantage of the benefits of this extended transition period.
We will use this extended transition period for complying with new or revised accounting standards that have different effective dates for public business entities and non-public business entities until the earlier of the date that we (a) are no longer an emerging growth company or (b) affirmatively and irrevocably opt out of the extended transition period provided in the JOBS Act. The extended transition period exemptions afforded by our emerging growth company status may make it difficult or impossible to compare our financial results with the financial results of another public company that is either not an emerging growth company or is an emerging growth company that has chosen not to take advantage of this exemption because of the potential differences in accounting standards used. Refer to “Note 2 – Summary of Significant Accounting Policies” of the Notes to Consolidated Financial Statements included in this Annual Report on Form 10-K for the recent accounting pronouncements adopted and the recent accounting pronouncements not yet adopted for the years ended December 31, 2023 and 2022.
We will remain an “emerging growth company” under the JOBS Act until the earliest of (a) December 31, 2028, (b) the last date of our fiscal year in which we have total annual gross revenue of at least $1.235 billion, (c) the last date of our fiscal year in which we are deemed to be a “large accelerated filer” under the rules of the SEC with at least $700.0 million of outstanding securities held by non-affiliates or (d) the date on which we have issued more than $1.0 billion in non-convertible debt securities during the previous three years.
We will be a “smaller reporting company” as defined in Item 10(f)(1) of Regulation S-K. Smaller reporting companies may take advantage of certain reduced disclosure obligations, including, among other things, providing only two years of audited financial statements. We will remain a smaller reporting company until the last day of the fiscal year in which (i) the market value of our common stock held by non-affiliates is greater than or equal to $250 million as of the end of that fiscal year’s second fiscal quarter, and (ii) our annual revenues are greater than or equal to $100 million during the last completed fiscal year or the market value of our common stock held by non-affiliates exceeds $700 million as of the end of that fiscal year’s second fiscal quarter.
INTERNAL CONTROL OVER FINANCIAL REPORTING
We have identified material weaknesses in our internal control over financial reporting, which we are in the process of, and are focused on, remediating. The first material weakness is related to reviewing third party accounting advice and properly accounting for complex transactions, especially related to merger and acquisition activity, within our financial statement closing and reporting process. The second material weakness arises from our failure to design and maintain effective IT general controls over the IT systems used within the processing of key financial transactions. Specifically, we did not design and maintain user access controls to ensure appropriate segregation of duties and that adequately restrict user and privileged access to financial applications, programs, and data to appropriate company personnel. Within the same material weakness, we have also failed to maintain adequate documentation around the process of implementing new software solutions. Lastly, we identified a third material weakness in our internal control over financial reporting related to the period-end account reconciliation and financial statement review controls which did not operate within a sufficient level of precision.
We have begun the process of, and are focused on, designing and implementing effective internal controls measures to improve our internal control over financial reporting and remediate the material weaknesses, including:
•the recruitment of additional personnel with extensive knowledge of GAAP, implementation of software to facilitate the accumulation and review of our financial information, and utilization of third party consultants and specialists to supplement our internal resources, as well as implementing processes and controls to segregate key functions within our finance systems, as appropriate;
•designing and following a formalized control plan related to IT general controls, including controls related to developing, implementing, and managing access to and implementing financially significant systems within our IT environment; and
•engaging internal and external resources to assist with the design and evaluation of internal controls and the remediation of deficiencies, as necessary.
While these actions and planned actions are subject to ongoing management evaluation and will require validation and testing of the design and operating effectiveness of internal controls over a sustained period of financial reporting cycles, we are committed to the continuous improvement of our internal control over financial reporting and will continue to diligently review our internal control over financial reporting.
Although we plan to complete this remediation process as quickly as possible, we are unable, at this time, to estimate how long it will take and our efforts may not be successful in remediating the identified material weaknesses. In addition, even if we are successful in strengthening our controls and procedures, we can give no assurances that in the future such controls and procedures will be adequate to prevent or identify errors or irregularities or to facilitate the fair preparation and presentation of our consolidated financial statements.
ITEM 7A. QUANTITATIVE AND QUALITATIVE DISCLOSURES ABOUT MARKET RISK.
Pursuant to Item 305(e) of Regulation S-K, the Company is not required to provide the information required by this Item as it is a “smaller reporting company.”
ITEM 8. FINANCIAL STATEMENTS AND SUPPLEMENTARY DATA.
BRIDGER AEROSPACE GROUP HOLDINGS, INC.
INDEX TO FINANCIAL STATEMENTS
REPORT OF INDEPENDENT REGISTERED PUBLIC ACCOUNTING FIRM
Stockholders and the Board of Directors of
Bridger Aerospace Group Holdings, Inc.
Belgrade, Montana
Opinion on the Financial Statements
We have audited the accompanying consolidated balance sheets of Bridger Aerospace Group Holdings, Inc. (the “Company”) as of December 31, 2023 and 2022, the related consolidated statements of operations, comprehensive loss, stockholders’ deficit, and cash flows for each of the two years in the period ended December 31, 2023, and the related notes (collectively referred to as the “financial statements”). In our opinion, the financial statements present fairly, in all material respects, the financial position of the Company as of December 31, 2023 and 2022, and the results of its operations and its cash flows for each of the two years in the period ended December 31, 2023, in conformity with accounting principles generally accepted in the United States of America.
Explanatory Paragraph – Going Concern
The accompanying financial statements have been prepared assuming that the Company will continue as a going concern. As discussed in Note 1 to the financial statements, the Company has suffered recurring losses from operations, operating cash flow deficits, debt covenant violations, and insufficient liquidity to fund its operations that raise substantial doubt about its ability to continue as a going concern. Management’s plans in regard to these matters are also described in Note 1. The financial statements do not include any adjustments that might result from the outcome of this uncertainty.
Basis for Opinion
These financial statements are the responsibility of the Company’s management. Our responsibility is to express an opinion on the Company’s financial statements based on our audits. We are a public accounting firm registered with the Public Company Accounting Oversight Board (United States) (“PCAOB”) and are required to be independent with respect to the Company in accordance with the U.S. federal securities laws and the applicable rules and regulations of the Securities and Exchange Commission and the PCAOB.
We conducted our audits in accordance with the standards of the PCAOB. Those standards require that we plan and perform the audit to obtain reasonable assurance about whether the financial statements are free of material misstatement, whether due to error or fraud. The Company is not required to have, nor were we engaged to perform, an audit of its internal control over financial reporting. As part of our audits we are required to obtain an understanding of internal control over financial reporting but not for the purpose of expressing an opinion on the effectiveness of the Company’s internal control over financial reporting. Accordingly, we express no such opinion.
Our audits included performing procedures to assess the risks of material misstatement of the financial statements, whether due to error or fraud, and performing procedures that respond to those risks. Such procedures included examining, on a test basis, evidence regarding the amounts and disclosures in the financial statements. Our audits also included evaluating the accounting principles used and significant estimates made by management, as well as evaluating the overall presentation of the financial statements. We believe that our audits provide a reasonable basis for our opinion.
/s/ Crowe LLP
We have served as the Company’s auditor since 2022.
Atlanta, Georgia
March 20, 2024
BRIDGER AEROSPACE GROUP HOLDINGS, INC.
CONSOLIDATED BALANCE SHEETS
(In thousands, except per share amounts)
| | | | | | | | | | | | | | |
| | As of December 31, |
| | 2023 | | 2022 |
| ASSETS | | | | |
| Current assets: | | | | |
| Cash and cash equivalents | | $ | 22,956 | | | $ | 30,163 | |
| Restricted cash | | 13,981 | | | 12,297 | |
| Investments in marketable securities | | 1,009 | | | 54,980 | |
| Accounts and note receivable | | 4,113 | | | 29 | |
| Aircraft support parts | | 488 | | | 1,761 | |
| Prepaid expenses and other current assets | | 2,648 | | | 1,835 | |
| Deferred offering costs | | — | | | 5,800 | |
| Total current assets | | 45,195 | | | 106,865 | |
| Property, plant and equipment, net | | 196,611 | | | 192,092 | |
| Intangible assets, net | | 1,730 | | | 208 | |
| Goodwill | | 13,163 | | | 2,458 | |
Other noncurrent assets1 | | 16,771 | | | 4,356 | |
| Total assets | | $ | 273,470 | | | $ | 305,979 | |
| LIABILITIES, MEZZANINE EQUITY AND STOCKHOLDERS’ DEFICIT | | | | |
| Current liabilities: | | | | |
Accounts payable2 | | $ | 3,978 | | | $ | 3,170 | |
Accrued expenses and other current liabilities3 | | 17,168 | | | 18,670 | |
Operating right-of-use current liability4 | | 2,153 | | | 21 | |
| Current portion of long-term debt, net of debt issuance costs | | 2,099 | | | 2,446 | |
| Total current liabilities | | 25,398 | | | 24,307 | |
| Long-term accrued expenses and other noncurrent liabilities | | 10,777 | | | 46 | |
Operating right-of-use noncurrent liability5 | | 5,779 | | | 755 | |
Long-term debt, net of debt issuance costs6 | | 204,585 | | | 205,471 | |
| Total liabilities | | 246,539 | | | 230,579 | |
| COMMITMENTS AND CONTINGENCIES | | | | |
| MEZZANINE EQUITY | | | | |
| Series A Preferred Stock, $0.0001 par value; 315,789.473684 shares authorized, issued and outstanding at December 31, 2023 | | 354,840 | | | — | |
| Legacy Bridger Series C Preferred Shares, $0.001 par value; 315,789.473684 shares authorized, issued and outstanding at December 31, 2022 | | — | | | 489,022 | |
| STOCKHOLDERS’ DEFICIT | | | | |
| Common Stock, $0.0001 par value; 1,000,000,000 shares authorized; 44,776,926 shares issued and outstanding at December 31, 2023; 39,081,744 shares issued and outstanding at December 31, 2022 | | 5 | | | 4 | |
| Additional paid-in capital | | 84,771 | | | — | |
| Accumulated deficit | | (413,672) | | | (415,304) | |
| Accumulated other comprehensive income | | 987 | | | 1,678 | |
| Total stockholders’ deficit | | (327,909) | | | (413,622) | |
| Total liabilities, mezzanine equity, and stockholders’ deficit | | $ | 273,470 | | | $ | 305,979 | |
1 Includes related party operating lease right-of-use assets of $6.3 million as of December 31, 2023.
2 Includes related party accounts payable of $0.1 million and $0.3 million as of December 31, 2023 and 2022, respectively.
3 Includes related party accrued interest expense of $0.4 million as of December 31, 2023 and 2022.
4 Includes related party operating lease right-of-use current liabilities of $1.7 million as of December 31, 2023.
5 Includes related party operating lease right-of-use noncurrent liabilities of $4.6 million as of December 31, 2023.
6 Includes related party debt of $10.0 million as of December 31, 2023 and 2022.
The accompanying notes are an integral part of these consolidated financial statements.
BRIDGER AEROSPACE GROUP HOLDINGS, INC.
CONSOLIDATED STATEMENTS OF OPERATIONS
(In thousands, except per share amounts)
| | | | | | | | | | | | | | |
| | For the years ended December 31, |
| | 2023 | | 2022 |
Revenues1 | | $ | 66,708 | | | $ | 46,388 | |
| Cost of revenues: | | | | |
Flight operations2 | | 24,412 | | | 18,762 | |
| Maintenance | | 16,928 | | | 15,124 | |
| Total cost of revenues | | 41,340 | | | 33,886 | |
| Gross income | | 25,368 | | | 12,502 | |
| Selling, general and administrative expense | | 82,863 | | | 35,128 | |
| Operating loss | | (57,495) | | | (22,626) | |
Interest expense3 | | (23,218) | | | (20,020) | |
| Other income | | 3,053 | | | 521 | |
| Loss before income taxes | | (77,660) | | | (42,125) | |
| Income tax benefit | | 302 | | | — | |
| Net loss | | $ | (77,358) | | | $ | (42,125) | |
| Series A Preferred Stock—adjustment for deemed dividend upon Closing | | (48,300) | | | — | |
| Series A Preferred Stock—adjustment to eliminate 50% multiplier | | 156,363 | | | — | |
| Series A Preferred Stock—adjustment to maximum redemptions value | | (22,181) | | | — | |
| Legacy Bridger Series A Preferred Shares—adjustment for redemption, extinguishment and accrued interest | | — | | | (85,663) | |
| Legacy Bridger Series C Preferred Shares - adjustment to maximum redemption value | | — | | | (202,689) | |
| Net income (loss) attributable to Common stockholders - basic and diluted | | $ | 8,524 | | | $ | (330,477) | |
| Net income (loss) per Common Stock - basic | | $ | 0.19 | | | $ | (8.20) | |
| Net income (loss) per Common Stock - diluted | | $ | 0.11 | | | $ | (8.20) | |
| Weighted average Common Stock outstanding – basic | | 45,269,201 | | 40,287,478 |
| Weighted average Common Stock outstanding – diluted | | 78,908,017 | | 40,287,478 |
1 Includes related party revenues of $0.4 million for the year ended December 31, 2023.
2 Includes related party cost of revenues of $1.2 million and $0.3 million for the years ended December 31, 2023 and 2022, respectively.
3 Includes related party interest of $1.2 million and $0.4 million for the years ended December 31, 2023 and 2022, respectively.
The accompanying notes are an integral part of these consolidated financial statements.
BRIDGER AEROSPACE GROUP HOLDINGS, INC.
CONSOLIDATED STATEMENTS OF COMPREHENSIVE LOSS
(In thousands)
| | | | | | | | | | | | | | |
| | For the years ended December 31, |
| | 2023 | | 2022 |
| Net loss | | $ | (77,358) | | | $ | (42,125) | |
| Other comprehensive loss, net of tax: | | | | |
| Foreign currency translation adjustment | | (42) | | | — | |
| Unrealized (loss) gain on derivative instruments | | (290) | | | 1,381 | |
| Unrealized gain on investments in marketable securities | | 247 | | | 272 | |
| Reclassification of realized gains on investments in marketable securities to earnings | | (606) | | | — | |
| Total other comprehensive (loss) income, net of tax | | (691) | | | 1,653 | |
| Comprehensive loss | | $ | (78,049) | | | $ | (40,472) | |
The accompanying notes are an integral part of these consolidated financial statements.
BRIDGER AEROSPACE GROUP HOLDINGS, INC.
CONSOLIDATED STATEMENTS OF STOCKHOLDERS’ DEFICIT
(In thousands, except share amounts)
| | | | | | | | | | | | | | | | | | | | | | | | | | | | | | | | | | | | | | | | | | | | | | | | | | | | | | | | | | | | | | | | | | | | | | | | | | | | | |
| | Legacy Bridger Series A Preferred Shares | | Legacy Bridger Series B Preferred Shares | | Legacy Bridger Series C Preferred Shares / Series A Preferred Stock | | | Common Stock | | | | | | | | |
| | Share | | Value | | Share | | Value | | Share | | Value | | | Share | | Value | | Additional Paid-in Capital | | Accumulated Deficit | | Accumulated Other Comprehensive Income | | Total Stockholders’
Deficit |
| Balance at December 31, 2021 | | 10,500,000 | | | $ | 1 | | | 60,000,000 | | | $ | 6 | | | — | | | $ | — | | | | 39,081,744 | | | $ | 4 | | | $ | — | | | $ | (84,844) | | | $ | 25 | | | $ | (84,815) | |
| Net loss | | — | | | — | | | — | | | — | | | — | | | — | | | | — | | | — | | | — | | | (42,125) | | | — | | | (42,125) | |
| Unrealized gain on derivative instruments | | — | | | — | | | — | | | — | | | — | | | — | | | | — | | | — | | | — | | | — | | | 1,381 | | | 1,381 | |
| Unrealized gain on investments on marketable securities | | — | | | — | | | — | | | — | | | — | | | — | | | | — | | | — | | | — | | | — | | | 272 | | | 272 | |
| Legacy Bridger Series A Preferred Shares adjustment for redemption, extinguishment and revaluation | | (10,500,000) | | | (1) | | | — | | | — | | | — | | | — | | | | — | | | — | | | — | | | (85,663) | | | — | | | (85,663) | |
| Legacy Bridger Series B Preferred Shares redemption | | — | | | — | | | (60,000,000) | | | (6) | | | — | | | — | | | | — | | | — | | | — | | | 6 | | | — | | | 6 | |
| Legacy Bridger Series C Preferred shares adjustment to maximum redemption value | | — | | | — | | | — | | | — | | | 315,789 | | | 489,022 | | | | — | | | — | | | — | | | (202,689) | | | — | | | (202,689) | |
| Stock based compensation attributable to Legacy Bridger holders prior to Reverse Recapitalization | | — | | | — | | | — | | | — | | | — | | | — | | | | — | | | — | | | — | | | 11 | | | — | | | 11 | |
| Balance at December 31, 2022 | | — | | | $ | — | | | — | | | $ | — | | | 315,789 | | | $ | 489,022 | | | | 39,081,744 | | | $ | 4 | | | $ | — | | | $ | (415,304) | | | $ | 1,678 | | | $ | (413,622) | |
| Net loss | | — | | | — | | | — | | | — | | | — | | | — | | | | — | | | — | | | — | | | (77,358) | | | — | | | (77,358) | |
| Foreign currency translation adjustment | | — | | | — | | | — | | | — | | | — | | | — | | | | — | | | — | | | — | | | — | | | (42) | | | (42) | |
| Unrealized loss on derivative instruments | | — | | | — | | | — | | | — | | | — | | | — | | | | — | | | — | | | — | | | — | | | (290) | | | (290) | |
| Unrealized gain on investments in marketable securities | | — | | | — | | | — | | | — | | | — | | | — | | | | — | | | — | | | — | | | — | | | 247 | | | 247 | |
| Reclassification of realized gains on investments in marketable securities to earnings | | — | | | — | | | — | | | — | | | — | | | — | | | | — | | | — | | | — | | | — | | | (606) | | | (606) | |
| Effect of the Closing | | — | | | — | | | — | | | — | | | — | | | (156,363) | | | | 4,687,546 | | | 1 | | | 52,085 | | | 78,990 | | | — | | | 131,076 | |
| Series A Preferred Stock adjustment to maximum redemption value | | — | | | — | | | — | | | — | | | — | | | 22,181 | | | | — | | | — | | | (22,181) | | | — | | | — | | | (22,181) | |
| Bonuses paid in Class A Common Stock | | — | | | — | | | — | | | — | | | — | | | — | | | | 736,554 | | | — | | | 3,829 | | | — | | | — | | | 3,829 | |
| Class A Common Stock issued in Acquisition | | — | | | — | | | — | | | — | | | — | | | — | | | | 426,531 | | | — | | | 3,242 | | | — | | | — | | | 3,242 | |
| Stock based compensation after Reverse Recapitalization | | — | | | — | | | — | | | — | | | — | | | — | | | | 2,268,129 | | | — | | | 47,796 | | | — | | | — | | | 47,796 | |
| Balance at December 31, 2023 | | — | | | $ | — | | | — | | | $ | — | | | 315,789 | | | $ | 354,840 | | | | 47,200,504 | | | $ | 5 | | | $ | 84,771 | | | $ | (413,672) | | | $ | 987 | | | $ | (327,909) | |
The accompanying notes are an integral part of these consolidated financial statements.
BRIDGER AEROSPACE GROUP HOLDINGS, INC.
CONSOLIDATED STATEMENTS OF CASH FLOWS
(In thousands)
| | | | | | | | | | | | | | |
| | For the years ended
December 31, |
| | 2023 | | 2022 |
| Cash Flows from Operating Activities: | | | | |
| Net loss | | $ | (77,358) | | | $ | (42,125) | |
| Adjustments to reconcile net loss to net cash used in operating activities, net of acquisitions: | | | | |
| Depreciation and amortization | | 11,089 | | | 9,091 | |
| Stock-based compensation expense | | 47,796 | | | 9 | |
| Impairment of long-lived assets | | 2,529 | | | — | |
| Amortization of debt issuance costs | | 968 | | | 601 | |
| Loss on disposal of fixed assets | | 1,183 | | | 1,770 | |
| Change in fair value of Warrants | | (267) | | | — | |
| Change in fair value of embedded derivative | | (155) | | | 1,039 | |
| Change in fair value of freestanding derivative | | 51 | | | 3 | |
| Change in fair value of earnout consideration | | 167 | | | — | |
| Realized gain on investments in marketable securities | | (794) | | | — | |
| Deferred tax benefit | | (342) | | | — | |
| Loss on extinguishment of debt | | — | | | 845 | |
| Change in fair value of Legacy Bridger Series A Preferred Shares | | — | | | 3,919 | |
| Interest accrued on Legacy Bridger Series B Preferred Shares | | — | | | 3,587 | |
| Changes in operating assets and liabilities, net: | | | | |
| Accounts receivable | | (1,085) | | | 6 | |
| Aircraft support parts | | 1,273 | | | 183 | |
| Prepaid expense and other current and noncurrent assets | | (2,381) | | | (372) | |
| Accounts payable, accrued expenses and other liabilities | | (9,482) | | | 11,526 | |
| Net cash used in operating activities | | (26,808) | | | (9,918) | |
| Cash Flows from Investing Activities: | | | | |
| Proceeds from sales and maturities of marketable securities | | 55,406 | | | 5,500 | |
| Purchases of marketable securities | | (999) | | | (60,207) | |
| Investment in equity securities | | (4,000) | | | — | |
Purchases of property, plant and equipment1 | | (20,738) | | | (25,582) | |
| Sale of property, plant and equipment | | 817 | | | 286 | |
| Expenditures for capitalized software | | (328) | | | — | |
| Issuance of note receivable | | (3,000) | | | — | |
| Investments in construction in progress - buildings | | — | | | (9,810) | |
| Net cash provided by (used in) investing activities | | 27,158 | | | (89,813) | |
| Cash Flows from Financing Activities: | | | | |
| Costs incurred related to the Closing | | (6,794) | | | — | |
| Proceeds from the Closing | | 3,194 | | | — | |
| Repayments on debt | | (2,201) | | | (2,036) | |
| Payment of finance lease liability | | (30) | | | (27) | |
| Payment to Legacy Bridger Series A Preferred Shares members | | — | | | (236,250) | |
| Payment to Legacy Bridger Series B Preferred Shares members | | — | | | (69,999) | |
| Borrowings from Legacy Bridger Series C Preferred Shares members, net of issuance costs | | — | | | 288,517 | |
Borrowings from 2022 taxable industrial revenue bond2 | | — | | | 160,000 | |
| Extinguishment of 2021 Taxable Industrial Revenue Bond | | — | | | (7,550) | |
| Borrowings from vehicle loans | | — | | | 202 | |
| Payment of debt issuance costs | | — | | | (4,418) | |
| Payment of offering costs | | — | | | (3,509) | |
| Net cash (used in) provided by financing activities | | (5,831) | | | 124,930 | |
| Effects of exchange rate changes | | (42) | | | — | |
| Net change in cash, cash equivalents and restricted cash | | (5,523) | | | 25,199 | |
| Cash, cash equivalents and restricted cash – beginning of the year | | 42,460 | | | 17,261 | |
| Cash, cash equivalents and restricted cash – end of the year | | $ | 36,937 | | | $ | 42,460 | |
| Less: Restricted cash – end of the year | | 13,981 | | | 12,297 | |
| Cash and cash equivalents – end of the year | | $ | 22,956 | | | $ | 30,163 | |
1 Includes purchase of related party aircraft of $3.9 million for the year ended December 31, 2022.
2 Includes related party debt of $10.0 million for the year ended December 31, 2022.
The accompanying notes are an integral part of these consolidated financial statements
BRIDGER AEROSPACE GROUP HOLDINGS, INC.
NOTES TO CONSOLIDATED FINANCIAL STATEMENTS
NOTE 1 – ORGANIZATION AND BASIS OF PRESENTATION
Nature of Business
Bridger Aerospace Group Holdings, Inc. and its subsidiaries (“Bridger”, “the Company,” “we,” “us” or “our”) provide aerial wildfire management, relief and suppression and delivery of firefighting services using next generation technology and sustainable and environmentally safe firefighting methods.
The Company was formed on November 20, 2018 and registered in the State of Delaware. The legal name of the Company was officially changed from ElementCompany Operations, LLC to Bridger Aerospace Group Holdings, LLC through an amendment with the State of Delaware, effective January 1, 2020.
As of December 31, 2023, the Company owns fifteen aircraft, including six Viking CL-415EAFs (“Super Scoopers”), four Twin Commander surveillance platforms (“Twin Commanders”), four Daher Kodiaks 100s (“Daher Kodiaks”), and one Pilatus PC-12 (“Pilatus”).
Liquidity and Going Concern
In accordance with Accounting Standards Codification (“ASC”) Topic 205-40, Going Concern, the Company has evaluated whether there are certain conditions and events, considered in the aggregate, that raise substantial doubt about the Company’s ability to continue as a going concern within 12 months after the date that these consolidated financial statements are issued. This evaluation includes considerations related to the covenants contained in the Company’s loan agreements as well as the Company’s liquidity position overall.
As detailed in Note 16 - Long-Term Debt, the Company’s municipal bond issuances by Legacy Bridger that closed in July and August 2022 (the “Series 2022 Bonds”) contain customary covenants and restrictions, including financial and non-financial covenants. The financial covenants require the Company to maintain a debt service coverage ratio (“DSCR”) that exceeds 1.25x commencing with the fiscal quarter ending December 31, 2023, operate in such a manner to produce gross revenues so as to be at all relevant times in compliance with the DSCR covenant and to maintain liquidity of $8.0 million in the form of unrestricted cash or investments (excluding margin accounts and retirement accounts) at all times. Failure to comply with these covenants could result in an event of default, subject to certain exceptions.
For the year ended December 31, 2023, the Company had an operating loss of $57.5 million, net loss of $77.4 million and cash flow used in operating activities of $26.8 million. In addition, as of December 31, 2023, the Company had unrestricted cash or investments of $24.0 million.
The Company is not in compliance with the DSCR covenant as of December 31, 2023 and management anticipates the Company to continue to not be in compliance with the DSCR covenant at future quarterly measurement periods in the next 12 months, primarily attributable to the seasonal nature of our business and a less intense 2023 wildfire season. Although the Company is in compliance with the $8.0 million minimum liquidity requirement as of December 31, 2023, based on projected cash use, management anticipates that without additional cash funding the Company will not have sufficient cash on hand to fund operations, including $18.4 million of required interest payments associated with the Series 2022 Bonds, or to comply with the minimum liquidity covenant within the next 12 months, or until the Company begins to collect cash from its seasonal firefighting operations in 2024.
The Series 2022 Bonds agreements provide that, with regard to covenant violations, other than non-payment of principal or interest, no event of default shall be deemed to have occurred so long as a reasonable course of action to remedy a violation commences within 30 days of written notice of non-compliance from the trustee and management diligently prosecutes the remediation plan to completion.
Management consulted with bond counsel on the impact of covenant violations and proactively developed a cost reduction plan, and began implementing the plan in November 2023, to help remedy the anticipated covenant breaches in 2024. However, this plan is in progress and there is no assurance that management will be able diligently prosecute the remediation plan to completion.
In addition to the cost reduction measures implemented in November 2023, the Company plans to seek additional cash funding through a number of potential avenues, including additional sales of our common stock through our at-the-market offering, described in further detail in Note 24 - Subsequent Events, and issuing additional shares of common stock pursuant to our shelf registration statement. These additional sources of working capital are not currently assured, and consequently do not sufficiently mitigate the risks and uncertainties disclosed above. Our ability to raise additional funds will depend on, among other factors, financial, economic and market conditions, many of which are outside of our control and there can be no assurance that we will be able to obtain additional funding on satisfactory terms or at all.
Current and anticipated noncompliance with financial covenants and uncertainty regarding the Company’s ability to diligently prosecute the cost reduction plan and to raise additional cash funding for operations, including required interest payments associated with the Series 2022 Bonds, raise substantial doubt about the Company’s ability to continue as a going concern within 12 months following the issuance date of the consolidated financial statements as of and for the period ended December 31, 2023. These consolidated financial statements do not include any adjustments to the amounts and classification of assets and liabilities that might be necessary should the Company be unable to continue as a going concern.
Basis of Presentation
The consolidated financial statements have been prepared in accordance with U.S. generally accepted accounting principles (“GAAP”). The consolidated financial statements include the financial statements of the Company, all entities that are wholly-owned by the Company and all entities in which the Company has a controlling financial interest.
Reverse Recapitalization
On January 24, 2023, (the “Closing Date”), Jack Creek Investment Corp (“JCIC”) completed the reverse recapitalization (the “Closing” and the “Reverse Recapitalization”) with the Company’s predecessor, Bridger Aerospace Group Holdings, LLC and its subsidiaries (collectively, “Legacy Bridger”), which operated the majority of the historical business and was identified as the acquirer and predecessor upon the consummation of the transactions contemplated by the agreement and plan of merger (the “Transaction Agreements”) entered into on August 3, 2022. On the Closing Date, pursuant to the Transaction Agreements, JCIC and Legacy Bridger became wholly owned subsidiaries of a new public entity that was renamed Bridger Aerospace Group Holdings, Inc., and JCIC shareholders and Legacy Bridger equity holders converted their equity ownership in JCIC and Legacy Bridger, respectively, into equity ownership in Bridger.
Upon the consummation of the Reverse Recapitalization, Bridger issued Common Stock to the Legacy Bridger equity holders and Series A Preferred Stock (as defined below) as summarized below:
•the surrender and exchange of all 606,061 Legacy Bridger incentive units (“Incentive Units”) into 583,308 shares of Bridger’s common stock, par value $0.0001, (“Common Stock”) at a deemed value of $10.00 per share as adjusted by the per share Common Stock consideration of approximately 0.96246 (the “Exchange Ratio”), rounded down to the nearest share for each holder;
•the direct or indirect surrender and exchange of the remaining 40,000,000 issued and outstanding shares of Legacy Bridger common shares (excluding Incentive Units) into 38,498,436 shares of Common Stock at a deemed value of $10.00 per share as adjusted by the Exchange Ratio, rounded down to the nearest share for each holder; and
•the surrender and exchange of all 315,789.473684 issued and outstanding Series C preferred shares of Legacy Bridger (the “Legacy Bridger Series C Preferred Shares”), which were surrendered and exchanged on a one-to-one basis in connection with the Reverse Recapitalization into 315,789.473684 shares of preferred stock of Bridger that have the rights, powers, designations, preferences, and qualifications, limitations and restrictions set forth in Section 4.5 of the Amended and Restated Certificate of Incorporation (the “Series A Preferred Stock”). The Series A Preferred Stock are convertible at the election of the holders into shares of Common Stock, without the payment of additional consideration by the holders into such number of shares of Common Stock as determined by dividing the original issue price, plus accrued interest by a conversion price equal to $11.00 at the time of conversion.
Other related events occurred in connection with the Reverse Recapitalization, are summarized below:
•the filing and effectiveness of the Amended and Restated Certificate of Incorporation of Bridger and the effectiveness of the Amended and Restated Bylaws of Bridger, each of which occurred immediately prior to the Closing;
•the adoption and assumption of the 2023 Omnibus Incentive Plan and any grants or awards issued thereunder and adoption of the 2023 Employee Stock Purchase Plan upon the Closing to grant equity awards to Bridger employees; and
•during the period from the Closing until five years following the Closing, JCIC subjected 20% of JCIC’s issued and outstanding common stock (“Sponsor Earnout Shares”), comprised of two separate tranches of 50% of the Sponsor Earnout Shares per tranche, to potential forfeiture to Bridger for no consideration until the occurrence (or deemed occurrence) of certain triggering events.
Immediately after giving effect to the Transaction Agreements, the following were outstanding:
•43,769,290 shares of Common Stock;
•315,789.473684 shares of Bridger Series A Preferred Stock;
•9,400,000 private placement warrants (“Private Placement Warrants”) to purchase shares of Common Stock at an exercise price of $11.50 per share;
•17,250,000 public warrants (“Public Warrants”) to purchase shares of Common Stock at an exercise price of $11.50 per share; and
•6,581,497 restricted stock units issued to the executives and senior management of the Company.
In connection with the Reverse Recapitalization, the Company paid transaction costs of $10.3 million as of the Closing.
The transactions contemplated by the Transaction Agreements were accounted for as a reverse recapitalization in accordance with GAAP. Under this method of accounting, JCIC was treated as the “acquired” company for financial reporting purposes. Accordingly, for accounting purposes, the financial statements of Bridger represent a continuation of the financial statements of Legacy Bridger with the Reverse Recapitalization treated as the equivalent of Legacy Bridger issuing stock for the net assets of JCIC, accompanied by a recapitalization. The net assets of JCIC will be stated at historical cost, with no goodwill or other intangible assets recorded. Operations prior to the Reverse Recapitalization will be those of Legacy Bridger in future reports of Bridger.
Legacy Bridger has been determined to be the accounting acquirer based on evaluation of the following facts and circumstances:
•Legacy Bridger equity holders have a relative majority of the voting power of Bridger;
•Bridger’s board of directors (the “Board”) has eleven members, and representatives or designees of the Legacy Bridger equity holders comprise the majority of the members of the Board;
•Legacy Bridger’s senior management comprise the senior management roles and are responsible for the day-to-day operations of Bridger;
•Bridger assumed Legacy Bridger’s name of business;
•The strategy and operations of Bridger continue Legacy Bridger’s former strategy and operations; and
•The Reverse Recapitalization created an operating public company, with management continuing to use Legacy Bridger operations to grow the business.
The Sponsor Earnout Shares are determined to be equity classified instruments of Bridger and the Public Warrants and Private Placement Warrants are determined to remain liability classified instruments upon the Closing.
In accordance with guidance applicable to these circumstances, the equity structure has been recast in all comparative periods up to the Closing to reflect the number of shares of Common Stock issued to Legacy Bridger’s stockholders in connection with the Reverse Recapitalization. As such, the shares and corresponding capital amounts and earnings per share related to Legacy Bridger’s common stock prior to the Reverse Recapitalization have been retroactively recast as shares of Common Stock using the Exchange Ratio.
On January 25, 2023, shares of the Company’s Common Stock began trading on the Nasdaq Global Market under the ticker symbol “BAER.”
NOTE 2 – SUMMARY OF SIGNIFICANT ACCOUNTING POLICIES
Principles of Consolidation
The Company consolidates those entities in which it, through the existing owners, has control over significant operating, financial or investing decisions of the entity. All significant intercompany balances and transactions have been eliminated in consolidation.
Variable Interest Entities
The Company follows ASC 810-10-15 guidance with respect to accounting for variable interest entities (“VIE”). These entities do not have sufficient equity at risk to finance their activities without additional subordinated financial support from other parties or whose equity investors lack any of the characteristics of a controlling financial interest. A variable interest is an investment or other interest that will absorb portions of a VIE’s expected losses or receive portions of its expected returns and are contractual, ownership or pecuniary in nature and that change with changes in the fair value of the entity’s net assets. A reporting entity is the primary beneficiary of a VIE and must consolidate it when that party has a variable interest, or combination of variable interests, that provide it with a controlling financial interest. A party is deemed to have a controlling financial interest if it meets both of the power and loss/benefits criteria. The power criterion is the ability to direct the activities of the VIE that most significantly impact its economic performance. The losses/benefits criterion is the obligation to absorb losses from, or right to receive benefits from, the VIE that could potentially be significant to the VIE. The VIE model requires an ongoing reconsideration of whether a reporting entity is the primary beneficiary of a VIE due to changes in the facts and circumstances.
Northern Fire Management Services, LLC (“NFMS, LLC”): The Company assisted in designing and organizing NFMS, LLC with a business purpose of employing Canadian aviation professionals to provide services to the Company. A master services agreement exists between NFMS, LLC and the Company, Bridger Air Tanker, LLC, a wholly owned subsidiary of the Company, to transfer all annual expenses incurred to the Company in exchange for the Canadian employees to support the Company’s water scooper aircraft. NFMS, LLC is 50% owned by a Canadian citizen, and 50% owned by Bridger Aerospace Group, LLC (“BAG, LLC”). NFMS, LLC was determined to be a VIE primarily due to the entity’s lack of sufficient equity investment at risk and the Company was determined to be the primary beneficiary of the VIE primarily attributable to the Company’s responsibility for all decisions related to NFMS, LLC’s expenditures. Accordingly, NFMS, LLC has been consolidated by the Company for the years ended December 31, 2023 and 2022 and all intercompany expenses associated with NFMS, LLC and its service agreement have been eliminated in consolidation. For the years ended December 31, 2023 and 2022, NFMS, LLC’s assets and liabilities were immaterial to the Company’s financial statements.
Mountain Air, LLC (“MA, LLC”): As of November 7, 2022, MA, LLC is a wholly-owned subsidiary of Bridger. Prior to MA, LLC becoming a wholly-owned subsidiary of the Company, MA, LLC was owned 50% by Timothy Sheehy, the Chief Executive Officer and a director of Bridger, and 50% by an entity affiliated with Matthew Sheehy, a director of Bridger. MA, LLC is a Federal Aviation Administration (“FAA”) part 135 certificate holder and is designed to hold aerial firefighting contracts. Bridger Aviation Services, LLC (“Bridger Aviation”), a wholly-owned subsidiary of Bridger, was a party to a certain Management Services Agreement (the “Aviation Agreement”), dated April 13, 2018, with MA, LLC. Pursuant to the Aviation Agreement, Bridger Aviation leased certain aircraft to MA, LLC. MA, LLC operated the aircraft and paid Bridger Aviation a fee equal to 99% of all revenue it received from the use and deployment of Bridger Aviation’s aircraft. MA, LLC was obligated to operate and maintain the aircraft in accordance with applicable FAA standards. MA, LLC was determined to be a VIE primarily due to the entity’s lack of sufficient equity investment at risk and the Company was determined to be the primary beneficiary of the VIE primarily attributable to the Company’s substantial control. Accordingly, the Company consolidated MA, LLC for the periods prior to November 7, 2022 and all intercompany expenses associated with MA, LLC and its Aviation Agreement were eliminated in consolidation.
On November 17, 2023, we entered into a series of agreements designed to facilitate the purchase and return to service of four Canadair CL-215T Amphibious Aircraft (the “Spanish Scoopers”) originally awarded to our wholly-owned subsidiary, Bridger Aerospace Europe, S.L.U. (“BAE”), in September 2023 via a public tender process from the Government of Spain for €40.3 million. Under the terms of the agreements, we agreed to sell the entire outstanding equity interest in BAE to MAB and purchase $4.0 million of non-voting Class B units of MAB. We also entered into a services agreement with MAB whereby we will manage the return to service upgrades of the Spanish Scoopers through our wholly-owned Spanish subsidiary, Albacete Aero, S.L., while they are owned and funded by MAB. The service agreement also provides that we have the right, but not the obligation, to acquire each Spanish Scooper as it is ready to be contracted and returned to service. The Company assessed both MAB and BAE for variable interest entity accounting under ASC 810-10-15 and determined that MAB is a voting interest entity and BAE is a variable interest entity. However, neither entity is consolidated in the consolidated financial statements as the Company does not have a controlling financial interest in MAB and the Company is not the primary beneficiary of BAE. Accordingly, neither of these entities have been consolidated in the consolidated financial statements of the Company for the year ended December 31, 2023. Refer to “Note 17 – Commitments and Contingencies” included in this Annual Report on Form 10-K for additional details.
Seasonality
The Company’s business is generally seasonal, with a significant portion of total revenue occurring during the second and third quarters of the fiscal year due to the North American fire season. However, the weather dependency and seasonal fluctuation in the need to fight wildfires based upon location and the varying intensity of the fire season may lead our operating results to fluctuate significantly from quarter to quarter and year to year.
Use of Estimates
The preparation of financial statements in conformity with GAAP, requires management to make assumptions and estimates that affect the reported amounts of assets and liabilities, disclosure of gain or loss contingencies as of the date of the financial statements and the reported amounts of revenues and expenses during the reporting period. Actual results could differ from their estimates and such differences could be material to the consolidated financial statements. Significant items subject to such estimates and assumptions include: (a) excess and aging aircraft support parts reserves, (b) allowance for doubtful accounts, (c) useful lives of property, plant and equipment, net, (d) allocation of the purchase price to the fair value of assets acquired and liabilities assumed, (e) impairment of long-lived assets, goodwill and other intangible assets, (f) disclosure of fair value of financial instruments, (g) variable interest entities, (h) accounting for Series A Preferred Stock and Legacy Bridger Series C Preferred Shares, (i) revenue recognition, (j) estimates and assumptions made in determining the carrying values of goodwill, other intangible assets, and contingent consideration and (k) Public Warrants and Private Placement Warrants.
Cash and Cash Equivalents
Cash and cash equivalents consist of cash and all highly liquid, readily convertible investments with a maturity of three months or less. Cash equivalents are placed primarily in time deposits and money market funds due in three months or less. The Company’s subsidiaries generally maintain cash account balances sufficient to meet their short-term working capital requirements and periodically remit funds to the parent company to pay intercompany lease, maintenance and other charges. Substantially all of the Company’s cash is concentrated in a few financial institutions. At times, deposits in these institutions exceed the federally insured limits.
Restricted Cash
Restricted cash includes cash and cash equivalents that are not readily available for use in the Company’s operating activities. The Company had $14.0 million and $12.3 million of restricted cash as of December 31, 2023 and 2022, respectively. These funds are held in a demand deposit account or highly rated money market fund. The Company had $14.0 million and $9.3 million in restricted cash related to the Series 2022 Bonds and zero and $3.0 million of restricted cash held in escrow as of December 31, 2023 and 2022, respectively.
Investments in Marketable Securities
Investments in debt securities are classified as available-for-sale and are carried at fair value, with unrealized gains and losses reported as accumulated other comprehensive income. Gains and losses are recognized when realized. Unrealized losses are evaluated for impairment to determine if the impairment is credit related. An other-than-temporary credit impairment would be recognized as an adjustment to income. Gains and losses are determined using the first-in first-out method. Investments in marketable securities are classified as current assets with short-term maturities of less than one year.
Accounts and Note Receivable
Accounts receivable consist of amounts due from our customers. The Company maintains an allowance for doubtful accounts equal to the estimated losses expected to be incurred based upon a review of the outstanding accounts receivable, historical collection information and existing economic conditions. For the years ended December 31, 2023 and 2022, the Company did not record any bad debt expense as accounts receivable have historically been collected in accordance with the policy and there is no history of write-offs.
Notes receivable consists of a promissory note to pay a specific sum, with interest, within a defined period. Each reporting period, the Company evaluates the collectability of the outstanding note receivable balance. If the promissory note is deemed uncollectible, the Company will record the value of the note and the accrued interest as bad debt expense. For the years ended December 31, 2023 and 2022, the Company did not record any bad debt expense based on the assessment of the receivable.
Aircraft Support Parts
Aircraft support parts consist of repairables and expendables that are used for servicing aircraft and support parts for universal application amongst the aviation fleet. Aircraft support parts are tracked by serial number and capitalized at cost in the Consolidated Balance Sheets and expensed in the Consolidated Statements of Operations when used in operations.
Property, Plant and Equipment, net
Property, plant and equipment are recorded at cost when acquired. Except for aircraft, engines and rotable parts, depreciation is computed on the straight-line basis over the estimated useful life of property, plant and equipment and is recorded in Cost of revenues and Selling, general and administrative expense in the Consolidated Statements of Operations. Depreciation for aircraft, engines and rotable parts is recorded over the estimated useful life based on flight hours. The table below summarizes depreciable lives by asset category:
| | | | | |
| Estimated Useful Life |
| Aircraft, engines and rotable parts | 1,500 – 6,000 flight hours |
| |
| Vehicles and equipment | 3 – 5 years |
| Buildings | 40 years |
Aircraft undergo maintenance activities including routine repairs, inspections, part replacements and overhauls as required by regulatory authorities or manufacturer specifications. Costs of routine maintenance of aircraft are expensed as incurred as Cost of revenues in the Consolidated Statements of Operations. Costs that increase the value of the aircraft are capitalized as Property, plant and equipment, net in the Consolidated Balance Sheets and are depreciated over the asset’s useful life.
Upon retirement or sale, the property, plant and equipment disposed of and the related accumulated depreciation are removed from the Consolidated Balance Sheets and any resulting gain or loss is recorded as Selling, general and administrative expense in the Consolidated Statements of Operations.
Interest on long-term debt for the development or manufacturing of Company assets is capitalized to the asset until the asset enters production or use, and thereafter all interest is charged to expense as incurred.
Business Combinations
The Company records tangible and intangible assets acquired and liabilities assumed in business combinations under the acquisition method of accounting in accordance with ASC 805, Business Combinations. Under the acquisition method of accounting, amounts paid for the acquisition are allocated to the assets acquired and liabilities assumed based on their estimated fair values at the date of acquisition inclusive of identifiable intangible assets. Acquisition consideration includes contingent consideration with payment terms based on the achievement of certain targets of the acquired business. The estimated fair value of identifiable assets and liabilities, including intangibles, are based on valuations that use information and assumptions available to management. The Company allocates any excess purchase price over the fair value of the tangible and identifiable intangible assets acquired and liabilities assumed to goodwill. Significant management judgments and assumptions are required in determining the fair value of assets acquired and liabilities assumed, particularly acquired intangible assets, including estimated useful lives. The valuation of purchased intangible assets is based upon estimates of the future performance and discounted cash flows of the acquired business. Each asset acquired or liability assumed is measured at estimated fair value from the perspective of a market participant.
Contingent consideration represents an obligation of the acquirer to transfer additional assets or equity interests to the seller if future events occur or conditions are met, is recognized when probable and reasonably estimable. Contingent consideration recognized is included in the initial cost of the assets acquired and recorded in Accrued expenses and other current liabilities and Long-term accrued expenses and other noncurrent liabilities in the Consolidated Balance Sheets. Subsequent changes in the estimated fair value of contingent consideration are recognized as Selling, general and administrative expenses in the Consolidated Statements of Operations.
Intangible Assets
Intangible assets consist of finite-lived intangible assets acquired through the Company’s historical business combinations and software developed for internal-use. In accordance with ASC Topic 350-40, Software - Internal-Use Software, the Company capitalizes certain direct costs of developing internal-use software that are incurred in the application development stage, when developing or obtaining software for internal use. Once the internal use software is ready for its intended use, it is amortized on a straight-line basis over its useful life. Refer to “Note 11 – Goodwill and Intangible Assets, Net” included in this Annual Report on Form 10-K.
Acquired intangible assets are initially recorded at fair value and subsequently amortized over their useful lives using the straight-line method, which reflects the pattern of benefit, and assumes no residual value. Intangible assets with definite lives are reviewed for impairment whenever events or circumstances indicate that the carrying value of an asset may not be recoverable. The carrying value of a long-lived asset is not recoverable if it exceeds the sum of the undiscounted cash flows expected to result from the use and eventual disposition of the asset. If the carrying value is deemed not to be recoverable, an impairment loss is recorded equal to the amount by which the carrying value of the long-lived asset exceeds its fair value. The remaining estimated useful lives of definite-lived intangible assets are routinely reviewed and, if the estimate is revised, the remaining unamortized balance is amortized over the revised estimated useful life.
Goodwill
Goodwill represents the excess of purchase price over fair value of the net assets acquired in an acquisition. Refer to “Note 11 – Goodwill and Intangible Assets, Net” included in this Annual Report on Form 10-K.
Beginning in 2023, the Company assesses goodwill for impairment as of October 1 annually or more frequently upon an indicator of impairment. Prior to 2023, the Company assessed goodwill for impairment as of December 31 annually or more frequently upon an indicator of impairment. The change to an October 1 annual goodwill impairment assessment date was made to ensure the completion of the Company’s assessment prior to the end of its annual reporting period, thereby aligning impairment testing procedures with its year-end financial reporting.
Goodwill is tested for impairment at the reporting unit level using a fair value approach. The Company first assesses qualitative factors to determine whether it is more likely than not that the fair value of a reporting unit is less than its carrying value. If, based on a review of qualitative factors, it is more likely than not that the fair value of a reporting unit is less than its carrying value the Company compares the fair value of a reporting unit with its carrying amount. The Company determines the fair value of a reporting unit by estimating the present value of expected future cash flows, discounted by the applicable discount rate. If the carrying value exceeds the fair value, the Company measures the amount of impairment loss, if any, by comparing the implied fair value of the reporting unit goodwill with its carrying amount. No impairment charges have been required.
Impairment of Long-Lived Assets
Long-lived assets are reviewed for impairment whenever events or changes in circumstances indicate that the carrying amount of an asset may not be recoverable. If the carrying amount of the asset exceeds its estimated undiscounted net cash flow, excluding interest, an impairment charge is recognized for the amount by which the carrying amount of the asset exceeds its fair value.
Investments accounted for under the equity method are recorded based upon the amount of the Company’s investment and are adjusted each period for the Company’s share of the investee’s income or loss. Investments are reviewed periodically for changes in circumstances or the occurrence of events that suggest an other-than-temporary event where the investment may not be recoverable.
Cost Method Investments
The Company holds equity securities without a readily determinable fair value, which are only adjusted for observable price changes in orderly transactions for the same or similar equity securities or any impairment. As of December 31, 2023 and 2022, the Company had $5.0 million and $1.0 million of cost method investments included in Other noncurrent assets in the Consolidated Balance Sheets, respectively.
Deferred Offering Costs
Deferred offering costs primarily consist of capitalized legal, accounting and other third-party costs incurred that are directly related to the Reverse Recapitalization, which has been accounted for as a reverse recapitalization. These costs were recorded to Stockholders’ deficit as a reduction of Additional paid-in capital generated upon the completion of the Reverse Recapitalization. As of December 31, 2023, the Company recorded $18.0 million to Stockholders’ deficit in the Consolidated Balance Sheets. For the year ended December 31, 2023, the Company recorded $0.5 million to Selling, general and administrative expense in the Consolidated Statements of Operations. As of December 31, 2022, the Company recorded $5.8 million of deferred offering costs in the Consolidated Balance Sheets.
Debt Issuance Costs
Debt issuance costs consist of expenditures associated with obtaining debt financing, principally legal and bank commitment fees. Such costs are deferred and amortized over the term of the related credit arrangements using a method that approximates the effective interest method. Debt issuance costs are included in the Consolidated Balance Sheets as a direct deduction from the carrying amount of long-term debt and are included in Interest expense in the Consolidated Statements of Operations. The payment of debt issuance costs is recorded under financing activities in the Consolidated Statements of Cash Flows.
Fair Value of Financial Instruments
The Company follows guidance in ASC 820, Fair Value Measurement (“ASC 820”), where fair value is defined as the price that would be received to sell an asset or paid to transfer a liability in an orderly transaction between market participants at the measurement date. Fair value measurements are determined within a framework that establishes a three-tier hierarchy which maximizes the use of observable market data and minimizes the use of unobservable inputs to establish a classification of fair value measurements for disclosure purposes. Inputs may be observable or unobservable. Observable inputs reflect the assumptions market participants would use in pricing the asset or liability based on market data obtained from sources independent of the Company. Unobservable inputs reflect the Company’s own assumptions about the assumptions market participants would use in pricing the asset or liability based on the information available.
ASC 820 classifies the inputs used to measure these fair values into the following hierarchy:
Level 1 — Unadjusted quoted prices in active markets for identical assets or liabilities.
Level 2 — Observable inputs and quoted prices in active markets for similar assets and liabilities.
Level 3 — Unobservable inputs and models that are supported by little or no market activity.
In all cases, the level in the fair value hierarchy within which the fair value measurement in its entirety has been determined based on the lowest level of input that is significant to the fair value measurement.
Revenue Recognition
The Company charges daily and hourly rates depending upon the type of firefighting service rendered and under which contract the services are performed. These services are primarily split into flight revenue and standby revenue. Flight revenue is earned primarily at an hourly rate when the engines of the aircraft are started and stopped upon request of the customer, tracked via flight logs for Super Scoopers or a Hobbs meter for other aircraft. Standby revenue is earned primarily as a daily rate when aircraft are available for use at a fire base, awaiting request from the customer for flight deployment.
The Company enters into short, medium and long-term contracts with customers, primarily with government agencies during the firefighting season, to deploy aerial fire management assets. Revenue is recognized when performance obligations under the terms of a contract with our customers are satisfied and payment is typically due within 30 days of invoicing. Invoicing occurs as the services are rendered and includes the use of the aircraft, pilot and field maintenance personnel to support the contract.
Contracts are based on either a Call-When-Needed (“CWN”) or Exclusive Use (“EU”) basis. Rates established are generally more competitive based on the security of the revenue from the contract (i.e., an EU versus only on an as-needed basis in CWN). These rates are delineated by the type of service, generally flight time or time available for deployment. Once an aircraft is deployed on a contract the fees are earned at these rates, the aircraft cannot be obligated to another customer. Contracts have no financing components and consideration is at pre-determined rates. No variable considerations are constrained within the contracts.
The transaction prices are allocated on the service performed and tracked real-time by each operator in a duty log. On at least a monthly basis, the services performed and rates are validated by each customer. Acceptance by the customer is evidenced by their funded task order or accepted invoice.
The Company has not incurred incremental costs for obtaining contracts with customers. In addition, the Company evaluates whether or not it should capitalize the costs of fulfilling a contract. Such costs would be capitalized when they are not within the scope of other standards and: (1) are directly related to a contract; (2) generate or enhance resources that will be used to satisfy performance obligations; and (3) are expected to be recovered. The Company has elected to use the practical expedient detailed in ASC 340-40, Other Assets and Deferred Costs-Contracts with Customers, to expense any costs to fulfill a contract as they are incurred when the amortization period would be one year or less.
Contract assets are classified as a receivable when the reporting entity’s right to consideration is unconditional, which is when payment is due only upon the passage of time. As the Company invoices customers for performance obligations that have been satisfied, at which point payment is unconditional, contracts do not typically give rise to contract assets. Contract liabilities are recorded when cash payments are received or due in advance of performance.
Payment terms vary by customer and type of revenue contract. The Company generally expects that the period of time between payment and transfer of promised goods or services will be less than one year. In such instances, the Company has elected the practical expedient to not evaluate whether a significant financing component exists. As permitted under the practical expedient available under ASC Topic 606, Revenue from Contracts with Customers (“ASC 606”), the Company does not disclose the value of unsatisfied performance obligations for (i) contracts with an original expected length of one year or less, and (ii) contracts for which the Company recognizes revenue at the amount which it has the right to invoice for services performed.
Other revenue consists of leasing revenues for facilities as well as external repair work performed on customer aircraft.
Revenue Disaggregation
The following table presents the disaggregation of revenue by service:
| | | | | | | | | | | | | | |
| | For the Years Ended December 31, |
| $s in thousands | | 2023 | | 2022 |
| Fire suppression | | $ | 56,022 | | | $ | 38,845 | |
| Aerial surveillance | | 9,730 | | | 7,216 | |
| Other services | | 956 | | | 327 | |
| Total revenues | | $ | 66,708 | | | $ | 46,388 | |
The following table presents the disaggregation of revenue by type:
| | | | | | | | | | | | | | |
| | For the Years Ended December 31, |
| $s in thousands | | 2023 | | 2022 |
| Flight revenue | | $ | 34,171 | | | $ | 25,105 | |
| Standby revenue | | 30,650 | | | 20,772 | |
| Other revenue | | 1,887 | | | 511 | |
| Total revenues | | $ | 66,708 | | | $ | 46,388 | |
The following table presents the disaggregation of revenue by geographic area:
| | | | | | | | | | | | | | |
| | For the Years Ended December 31, |
| $s in thousands | | 2023 | | 2022 |
| United States | | $ | 49,534 | | | $ | 46,388 | |
| Canada | | 17,174 | | | — | |
| Total revenues | | $ | 66,708 | | | $ | 46,388 | |
Concentration Risk
During the year ended December 31, 2023, the Company had three customers who individually accounted for 65%, 12%, and 11% of total revenues and two customers accounted for 39% and 34% of accounts receivable. During the year ended December 31, 2022, the Company had one customer who individually accounted for 95% of total revenues and one customer who individually accounted for 62% of accounts receivable.
Income Taxes
For periods prior to the Business Combination, Bridger Aerospace Group Holdings, LLC is a partnership for federal income tax purposes. Consequently, federal income taxes are not payable or provided for by Legacy Bridger. Members are taxed individually on their pro rata ownership share of the Legacy Bridger’s earnings. Legacy Bridger’s net income or loss is allocated among the members in accordance with the Company’s operating agreement.
Subsequent to the Business Combination, Bridger Aerospace Group Holdings, Inc. became the successor of Legacy Bridger as discussed in “Note 1 – Organization and Basis of Presentation.” Bridger is subject to U.S. federal income taxes, in addition to state and local income taxes, with respect to net taxable income or loss and any related tax credits of the Company. Bridger is also subject to taxes in foreign jurisdictions in which it operates.
The Company provides for income taxes and the related accounts under the asset and liability method. Income tax expense, deferred tax assets and liabilities and reserves for unrecognized tax benefits reflect management’s best assessment of estimated current and future taxes to be paid. The Company is subject to income taxes predominantly in the U.S. These tax laws are often complex and may be subject to different interpretations.
Deferred income taxes arise from temporary differences between the financial statement carrying amount and the tax basis of assets and liabilities and are measured using the enacted tax rates expected to be in effect during the year in which the basis difference reverses. In evaluating the ability to recover its deferred tax assets within the jurisdiction from which they arise, the Company considers all available positive and negative evidence. If based upon all available positive and negative evidence, it is more likely than not that the deferred tax assets will not be realized, a valuation allowance is established. The valuation allowance may be reversed in a subsequent reporting period if Bridger determines that it is more likely than not that all or part of the deferred tax asset will become realizable.
Segment Reporting
Operating segments are defined as components of an entity for which separate financial information is available and that is regularly reviewed by the Chief Operating Decision Maker (“CODM”) in deciding how to allocate resources to an individual segment and in assessing performance. The Company’s Chief Executive Officer is the Company’s CODM. The Company manages its operations as a single segment for purposes of assessing performance, making operating decisions and allocating resources. This one operating and reporting segment primarily focuses on aerial firefighting.
Concentration of Credit Risk
Financial instruments that potentially subject the Company to concentrations of credit risk consist of cash accounts in a financial institution, which, at times may exceed the Federal Depository Insurance Coverage of $250,000. During the years ended December 31, 2023 and 2022, the Company did not experience losses on these accounts and management believes the Company is not exposed to significant risks on such accounts.
Hedging Transactions and Derivative Financial Instruments
The Company is directly and indirectly affected by changes in certain market conditions. These changes in market conditions may adversely impact the Company’s financial performance and are referred to as “market risks.” The Company, when deemed appropriate, uses derivatives as a risk management tool to mitigate the potential impact of certain market risks. The Company manages interest rate risk through the use of derivative instruments, such as swap agreements. A swap agreement is a contract between two parties to exchange cash flows based on specified underlying notional amounts, assets and/or indices. The Company does not enter into derivative financial instruments for trading purposes.
The accounting for gains and losses that result from changes in the fair values of derivative instruments depends on whether the derivatives have been designated and qualify as hedging instruments and the type of hedging relationships. The changes in fair values of derivatives that have been designated and qualify as cash flow hedges are recorded in Accumulated other comprehensive income and are reclassified into the line item in the Consolidated Statements of Comprehensive Loss in which the hedged items are recorded in the same period the hedged items affect earnings.
The Company formally assesses whether the financial instruments used in hedging transactions are effective at offsetting changes in either the fair values or cash flows of the related underlying exposures. Any ineffective portion of a financial instrument’s change in fair value is immediately recognized into earnings. The fair value is based on prevailing market data and using standard valuation models based on reasonable estimates about future relevant market conditions. Refer to “Note 16 – Long-Term Debt” included in this Annual Report on Form 10-K. The notional amounts of the derivative financial instruments do not necessarily represent amounts exchanged by the parties and, therefore, are not a direct measure of the Company’s exposure to the financial risks described above.
Earnings (Loss) Per Share
Basic earnings per share is based on the weighted average number of shares of Common Stock outstanding during the period. Diluted earnings per share is based on the weighted average number of shares of Common Stock used for the basic earnings per share calculation, adjusted for the dilutive effect of restricted stock units (“RSUs”), Warrants, and Incentive Units, if any, using the “treasury stock” method, the Series A Preferred Stock that is convertible into shares of Common Stock, and the Sponsor Earnout Shares that will fully vest upon certain stock price metrics being achieved. In addition, earnings for diluted earnings per share is adjusted for the after-tax impact of changes to the fair value of the Warrants, to the extent they are dilutive.
As noted above, the Company accounted for the Closing as a reverse recapitalization. Earnings per share calculations for all periods prior to the Closing have been retrospectively adjusted by the Exchange Ratio for the equivalent number of shares of Common Stock outstanding immediately after the Closing to effect the reverse recapitalization. Subsequent to the Closing, earnings per share is calculated based on the weighted average number of shares of Common Stock outstanding.
Commitments and Contingencies
Liabilities for loss contingencies arising from claims, assessments, litigation, fines, penalties and other sources are recorded when it is probable that a liability has been incurred and the amount can be reasonably estimated. Legal costs incurred in connection with loss contingencies are expensed as incurred.
Collaboration Agreements
The Company analyzes its collaboration arrangement to assess if it is within the scope of ASC Topic 808, Collaborative Agreements (“ASC 808”) by determining whether such an arrangement involves joint operating activities performed by parties that are both active participants in the activities and exposed to significant risks and rewards dependent on the commercial success of such activities. This assessment is performed throughout the life of the arrangement based on changes in the responsibilities of all parties in the arrangement. If the Company concluded that it has a customer relationship with its collaborator, the collaboration arrangement would be accounted for under ASC 606.
Stock-Based Compensation
The Company accounts for its stock-based compensation in accordance with provisions of ASC 718, Compensation-Stock Compensation at the grant date fair value.
Legacy Bridger granted Incentive Units which contain service and performance vesting conditions to select board members and an executive officer. Compensation cost for Incentive Units is measured at their grant-date fair value and is equal to the value of the Legacy Bridger’s Class D Common shares, which was estimated using an option pricing model. Compensation cost for service-based units is recognized over the requisite service period on a straight-line basis. For performance related units, expense is recognized when the performance related condition is considered probable.
In connection with the Closing, the Company along with the Board established and approved and assumed the Bridger Aerospace Group Holdings, Inc. 2023 Omnibus Incentive Plan (the “Omnibus Plan”) which allowed the Company to grant RSUs to Bridger employees (the “Participants”). Upon satisfying the vesting conditions, each RSU provides the Participants the right to receive one share of Common Stock. The fair value of RSUs is determined based on the number of shares granted and the quoted market price of the Common Stock on the date of grant. Compensation cost for the RSUs is recognized as the performance condition of the Closing of the transaction was met and over the requisite service period based on the graded-vesting method. The Company accounts for forfeitures as they occur. Stock-based compensation is included in both Cost of revenues and Selling, general and administrative expense in the Consolidated Statements of Operations.
Advertising Expense
Advertising costs are expensed as incurred and are included in Selling, general and administrative expense in the Consolidated Statement of Operations. Advertising expense for the years ended December 31, 2023 and 2022 was $0.1 million and $0.7 million, respectively.
Recent Accounting Pronouncements
Recently Adopted Accounting Pronouncements
In June 2016, the FASB issued ASU No. 2016-13, Financial Instruments - Credit Losses (Topic 326): Measurement of Credit Losses on Financial Instruments. The amendments in this ASU replace the incurred loss model for recognition of credit losses with a methodology that reflects expected credit losses over the life of the loan and requires consideration of a broader range of reasonable and supportable information to calculate credit loss estimates. The Company adopted this standard on January 1, 2023. The adoption of this standard did not have a significant impact on the Company’s consolidated financial statements.
In January 2017, the FASB issued ASU No. 2017-04, Intangibles-Goodwill and Other (Topic 350): Intangibles - Goodwill and Other: Simplifying the Test for Goodwill Impairment. This update modifies the concept of impairment from the condition that exists when the carrying amount of goodwill exceeds its implied fair value to the condition that exists when the carrying amount of a reporting unit exceeds its fair value. In order to reduce complexity, an entity no longer will determine goodwill impairment by calculating the implied fair value of goodwill by assigning the fair value of a reporting unit to all of its assets and liabilities as if that reporting unit had been acquired in a business combination. The Company adopted this standard on January 1, 2023. The adoption of this standard did not have a significant impact on the Company’s consolidated financial statements.
Recently Issued Accounting Pronouncements
In October 2023, the FASB issued ASU No. 2023-06, Disclosure Improvements: Codification Amendments in Response to the SEC’s Disclosure Update and Simplification Initiative. This update modifies the disclosure or presentation requirements of a variety of topics in the codification. The effective date for each amendment will be the date on with the SEC’s removal of that related disclosure from Regulation S-X or Regulation S-K becomes effective. Early adoption is prohibited. The Company is currently evaluating the impact of adopting the new accounting guidance on the Company’s consolidated financial statements.
In November 2023, the FASB issued ASU No. 2023-07, Segment Reporting (Topic 280): Improvements to Reportable Segment Disclosures. This update expands annual and interim reportable segment disclosure requirements, primarily through enhanced disclosures about significant segment expenses. This new guidance is effective for the Company for its fiscal years beginning after December 15, 2023, and interim periods within fiscal years beginning after December 15, 2024. The Company does not expect the adoption of this standard to have a material impact on the Company’s consolidated financial statements.
In December 2023, the FASB issued ASU No. 2023-09, Income Taxes (Topic 740): Improvements to Income Tax Disclosures. This update enhances the transparency and decision usefulness of income tax disclosures to provide investors information to better assess how an entity’s operations and related tax risks and tax planning and operational opportunities affect its tax rate and prospects for future cash flows. This new guidance is effective for the Company for its fiscal years beginning after December 15, 2024. The Company is currently evaluating the impact of adopting the new accounting guidance on the Company’s consolidated financial statements.
NOTE 3 – STOCKHOLDERS’ DEFICIT
For periods prior to the Closing, Legacy Bridger had Class A, Class B, Class C and Class D Common Shares. As described in “Note 1 – Organization and Basis of Presentation,” on January 24, 2023, the Company consummated the Reverse Recapitalization between JCIC and Legacy Bridger. Subsequent to the Closing, the Company’s Common Stock is the only authorized and issued class of common stock.
Legacy Bridger Common Shares
Legacy Bridger had 30,000,000 Class A Common Shares issued and outstanding as of December 31, 2022. The holders of these shares were entitled to one vote for each share held of record on all matters submitted to a vote of our shareholders. These Class A Common Shares were issued to ElementCompany, LLC.
Legacy Bridger had 9,756,130 Class B Common Shares issued and outstanding as of December 31, 2022. The holders of these shares are entitled to one vote for each share held of record on all matters submitted to a vote of our shareholders.
Legacy Bridger had 243,871 Class C Common Shares issued and outstanding as of December 31, 2022. Legacy Bridger also had 606,061 shares of Class D Common Shares issued and outstanding as of December 31, 2022. The Class C and Class D shares were non-voting shares.
The voting power of Legacy Bridger followed the structure of the elected Board members with 3 designees from the holders of Class A Common Shares and 2 designees from the holders of Class B Common Shares. This was planned to remain in place while the holders of Class B Common Shares in aggregate hold at least 10% of the common shares outstanding and prior to any initial public offering, at which point voting power would change, based on the relevant shares outstanding.
Bridger Common Stock
In connection with the Reverse Recapitalization, the Company issued 43,769,290 shares of Common Stock, of which 39,081,744 shares were issued to Legacy Bridger Common shareholders, 2,084,357 shares were issued to the public shareholders of JCIC and 2,603,189 shares were issued to JCIC Sponsor and independent directors of JCIC upon Closing. Of the shares issued to Legacy Bridger Common shareholders and JCIC Sponsor, 233,323 and 855,000 shares are subject to continuing vesting conditions, respectively.
In connection with the Ignis Acquisition, the Company issued 426,531 shares of Common Stock which were issued to the shareholders of the Seller. Refer to “Note 10 – Acquisition Activity” included in this Annual Report on Form 10-K.
Holders of Common Stock are entitled to full economic rights, including the right to receive dividends when and if declared by the Board, subject to any statutory or contractual restrictions of the payment of dividends and any restrictions on the payment of dividends imposed by the vesting conditions of the unvested Common Stock. Each holder of Common Stock is entitled to one vote for each Common Stock held.
NOTE 4 – SUPPLEMENTAL CASH FLOW INFORMATION
| | | | | | | | | | | | | | |
| | For the Years Ended December 31, |
| $s in thousands | | 2023 | | 2022 |
| Interest paid | | $ | 23,220 | | | $ | 12,747 | |
| Fixed assets in accounts payable | | 205 | | | 911 | |
| Conversion of Promissory Note to Common Stock | | 897 | | | — | |
| Series A Preferred Stock - adjustment for deemed dividend upon Closing | | 48,300 | | | — | |
| Series A Preferred Stock - adjustment to eliminate 50% multiplier | | 156,363 | | | — | |
| Series A Preferred Stock - adjustment to maximum redemption value | | 22,181 | | | — | |
| Legacy Bridger Series A Preferred Shares - adjustment for redemption, extinguishment and accrued interest | | — | | | 85,663 | |
| Legacy Bridger Series C Preferred Shares - adjustment for maximum redemption value | | — | | | (202,689) | |
| | | | |
| Non-cash operating and financing activities: | | | | |
| Assumption of Jack Creek liabilities | | $ | 7,464 | | | $ | — | |
| Recognition of warrant liabilities | | 5,863 | | | — | |
| Cancellation of Deferred underwriting fee | | 1,500 | | | — | |
| Recognition of new right-of-use asset and corresponding operating lease liability | | 7,940 | | | 130 | |
| Bonuses paid in Class A Common Stock | | 3,829 | | | — | |
| Purchase consideration of Ignis acquisition paid in Class A Common Stock | | 3,242 | | | — | |
| Deferred offering costs included in accrued expenses and other current liabilities | | — | | | 2,291 | |
| | | | |
NOTE 5 – CASH EQUIVALENTS AND INVESTMENTS IN MARKETABLE SECURITIES
The investments in marketable securities are classified as available-for-sale debt securities with short-term maturities of less than one year. The fair values, gross unrealized gains and losses of the available-for-sale securities by type are as follows:
| | | | | | | | | | | | | | |
| | As of December 31, |
| | 2023 | | 2022 |
| $s in thousands | | Carrying Value |
| Cash equivalents: | | | | |
| Commercial paper | | $ | 1,974 | | | $ | 29,890 | |
| Money market fund | | 11,208 | | | 13 | |
| Total cash equivalents | | $ | 13,182 | | | $ | 29,903 | |
| Restricted cash: | | | | |
| Money market fund | | $ | 13,981 | | | $ | 9,284 | |
| | | | | | | | | | | | | | | | | | | | | | | | | | |
| | As of December 31, 2023 |
| $s in thousands | | Purchase
Price | | Unrealized
Gains | | Unrealized Losses | | Fair Value |
| Investments in marketable securities: | | | | | | | | |
| Government securities | | 999 | | | 10 | | | — | | | 1,009 | |
| Total investments in marketable securities | | $ | 999 | | | $ | 10 | | | $ | — | | | $ | 1,009 | |
| | | | | | | | | | | | | | | | | | | | | | | | | | |
| | As of December 31, 2022 |
| $s in thousands | | Purchase
Price | | Unrealized
Gains | | Unrealized
Losses | | Fair Value |
| Investments in marketable securities: | | | | | | | | |
| Commercial paper | | $ | 32,636 | | | $ | 278 | | | $ | — | | | $ | 32,914 | |
| Corporate bonds and notes | | 15,413 | | | 3 | | | — | | | 15,416 | |
| Government securities | | 6,659 | | | — | | | (9) | | | 6,650 | |
| Total investments in marketable securities | | $ | 54,708 | | | $ | 281 | | | $ | (9) | | | $ | 54,980 | |
The net unrealized gain included in accumulated other comprehensive income for the years ended December 31, 2023 and 2022 was $0.2 million and $0.3 million, respectively.
The proceeds from sales of available-for-sale securities and gross realized gains included in earnings for the years ended December 31, 2023 and 2022 are $55.4 million and $5.5 million, respectively, and $0.8 million and $0.6 million, respectively. The Company determines gains and losses using the first-in first-out method. There have been no impairments measured for the years ended December 31, 2023 and 2022. For the years ended December 31, 2023 and 2022, the Company reclassified out of accumulated other comprehensive income of $0.6 million and zero, respectively.
NOTE 6 – ACCOUNTS AND NOTE RECEIVABLE
Accounts and note receivable consist of the following:
| | | | | | | | | | | | | | |
| | As of December 31, |
| $s in thousands | | 2023 | | 2022 |
| Trade accounts receivable | | $ | 681 | | | $ | 29 | |
| Note receivable | | 3,000 | | | — | |
| Other | | 432 | | | — | |
| Total accounts and note receivable | | $ | 4,113 | | | $ | 29 | |
On September 5, 2023, the Company entered into a secured promissory note in the amount of $3.0 million. This note accrues interest at a rate of 8.5% per annum and is due and payable on January 20, 2024. Other receivables consists primarily of value-added taxes paid in 2023 and expected to be refunded in 2024.
NOTE 7 – AIRCRAFT SUPPORT PARTS
Aircraft support parts consist of the following:
| | | | | | | | | | | | | | |
| | As of December 31, |
| $s in thousands | | 2023 | | 2022 |
| Repairables and expendables | | $ | 488 | | | $ | 1,734 | |
| Other | | — | | | 27 | |
| Total aircraft support parts | | $ | 488 | | | $ | 1,761 | |
NOTE 8 – PREPAID EXPENSES AND OTHER CURRENT ASSETS
Prepaid expenses and other current assets consist of the following:
| | | | | | | | | | | | | | |
| | As of December 31, |
| $s in thousands | | 2023 | | 2022 |
| Prepaid insurance | | $ | 1,324 | | | $ | 969 | |
| Deposits | | 120 | | | 65 | |
| Prepaid subscriptions | | 1,115 | | | 771 | |
| Other | | 89 | | | 30 | |
| Total prepaid expenses and other current assets | | $ | 2,648 | | | $ | 1,835 | |
NOTE 9 – PROPERTY, PLANT AND EQUIPMENT, NET
Property, plant and equipment, net consist of the following:
| | | | | | | | | | | | | | |
| | As of December 31, |
| $s in thousands | | 2023 | | 2022 |
| Aircraft | | $ | 186,167 | | | $ | 160,113 | |
| Less: Accumulated depreciation | | (25,656) | | | (16,783) | |
| Aircraft, net | | 160,511 | | | 143,330 | |
| Construction-in-progress - Aircraft | | — | | | 16,992 | |
| Buildings | | 35,941 | | | 16,519 | |
| Vehicles and equipment | | 2,993 | | | 2,811 | |
| Construction-in-progress - Buildings | | 5 | | | 13,780 | |
| Finance lease right-of-use-asset | | 121 | | | 130 | |
| Licenses | | 235 | | | 235 | |
| Less: Accumulated depreciation | | (3,195) | | | (1,705) | |
| Buildings and equipment, net | | 36,100 | | | 31,770 | |
| Total property, plant and equipment, net | | $ | 196,611 | | | $ | 192,092 | |
For the year ended December 31, 2023, the Company recorded $9.6 million and $1.3 million of depreciation expense in Cost of revenues and Selling, general and administrative expense, respectively. For the year ended December 31, 2022, the Company recorded $7.9 million and $1.1 million of depreciation expense in Cost of revenues and Selling, general and administrative expense, respectively.
Aircraft are evaluated for impairment whenever events or changes in circumstances indicate that the carrying amount of an asset or asset group may not be recoverable. In 2023, the Company noted that increasing maintenance costs associated with three of our Twin Commander aircraft and the lack of customers for our two Aurora eVTOL Skiron drone aircraft indicated that these aircraft were not viable contract operating planes, resulting in anticipated cash flow losses as a result of being unable to generate revenues. The Company believes the lack of cash flow and continued maintenance expenditures render the carrying amount of the aircraft unrecoverable. For the year ended December 31, 2023, the Company recorded associated impairment charges of $2.4 million in Selling, general and administrative expense in the Consolidated Statements of Operations. For the year ended December 31, 2022, the Company recorded no impairment charges.
For the years ended December 31, 2023 and 2022, the Company recorded losses on disposals of assets of $1.2 million and $1.8 million, respectively, in Selling, general and administrative expense in the Consolidated Statements of Operations.
For the years ended December 31, 2023 and 2022, capitalized interest to equipment from debt financing was $1.2 million and $0.7 million, respectively. Aircraft that was being manufactured was considered construction in process and was not depreciated until the aircraft was placed into service.
NOTE 10 – ACQUISITION ACTIVITY
On September 12, 2023, the Company completed the acquisition of all outstanding equity interests of Ignis Technologies, Inc. (“Ignis”), a fire technology company developing mission-critical intelligence and technology solutions for firefighting organizations, for total consideration of $11.6 million, payable in unregistered shares of Bridger’s Common Stock, consisting of $3.3 million payable at closing (the “Acquisition”). At closing, 426,531 restricted shares of Common Stock were issued to the Ignis shareholders (determined based upon a volume-weighted average per-share price (“VWAP”) of the Common Stock for the 30 consecutive trading days ended September 11, 2023). The remaining $8.3 million of Common Stock consideration is contingent upon the achievement of certain operational milestones and, assuming achievement of such milestones, will be issued to the Ignis shareholders in 2024, 2025, and 2026, with the price per share determined based upon a trailing 120-day VWAP of the Common Stock at the time of each issuance. All of the shares of Common Stock to be issued in the Acquisition will be subject to transfer restrictions for a 12-month period after each issuance, with 1/12th of the total shares of Common Stock vesting each month over the one-year period after each issuance.
None of the shares of Common Stock issued or issuable in connection with the Acquisition were registered under the Securities Act of 1933, as amended (the “Securities Act”), on the Acquisition date in reliance on the exemption from registration provided by Section 4(a)(2) of the Securities Act. Recipients of shares of Common Stock in connection with the Acquisition will have customary resale registration rights with respect to such shares of Common Stock pursuant to the terms and conditions of the Acquisition.
The Company accounted for the Acquisition under the acquisition method of accounting and has reported the results of operations of the Acquisition as of the respective date of the Acquisition. The Company based the estimated fair values of intangible assets on an income approach utilizing the relief from royalties model. The income approach utilizes management’s estimates of future operating results and cash flows using a weighted average cost of capital that reflects market participant assumptions. For all other assets acquired and liabilities assumed, the fair value reflects the carrying value of the asset or liability due to their short maturity. The Company recorded the excess of the fair value of the consideration transferred in the Acquisition over the fair value of net assets acquired as goodwill. The goodwill reflects our expectations of favorable future growth opportunities. The Company expects that substantially all of the goodwill will not be deductible for federal income tax purposes.
Acquisition-related costs associated with the Acquisition of $0.1 million are included in Selling, general and administrative expense on the Consolidated Statements of Operations for the year ended December 31, 2023.
The Company has not presented pro forma combined results for the Acquisition because the impact on previously reported statements of operations was not material.
As of December 31, 2023, the Company finalized the purchase accounting for the Acquisition. The following table summarizes the final purchase price allocation:
| | | | | | | | |
| $s in thousands | | Purchase Price Allocation |
| Cash and cash equivalents | | $ | 3 | |
| Intangible assets | | 1,300 | |
| Accounts payable | | (37) | |
| Long-term accrued expenses and other noncurrent liabilities | | (67) | |
| Deferred tax liability | | (314) | |
| Total identifiable net assets | | 885 | |
| Goodwill | | 10,676 | |
| Total purchase price | | $ | 11,561 | |
Goodwill of $10.7 million arising from the acquisition is primarily attributable to the assembled workforce of Ignis and expected synergies from combining operations. None of the acquired goodwill is expected to be deductible for income tax purposes. Acquired intangible assets consist entirely of in-process research and development (“IPR&D”) and is expected to be amortized over its useful life of five years when placed into service. The Company concluded that the IPR&D is an identifiable intangible asset that would be accounted for as a single asset in a business combination. The fair value of the IPR&D was determined using an income approach based on significant unobservable inputs.
NOTE 11 – GOODWILL AND INTANGIBLE ASSETS, NET
The change in goodwill for the year ended December 31, 2023 was as follows:
| | | | | | | | |
| $s in thousands | | Goodwill |
| As of December 31, 2022 | | $ | 2,458 | |
| Ignis acquisition | | 10,676 | |
| Measurement period adjustment | | 29 | |
| As of December 31, 2023 | | $ | 13,163 | |
The Company’s goodwill as of December 31, 2022 originated from the acquisition of MA, LLC in April 2018. There were no impairment charges recorded for goodwill for the years ended December 31, 2023 and 2022.
Intangible assets consisted of the following:
| | | | | | | | | | | | | | | | | | | | | | | | | | |
| | | | As of December 31, 2023 |
| $s in thousands | | Estimated
Life (Years) | | Cost | | Accumulated
Amortization | | Net |
| Licenses | | 10 | | $ | 67 | | | $ | (54) | | | $ | 13 | |
| Internal-use software | | 3 | | 297 | | | (208) | | | 89 | |
| IPR&D | | 5 | | 1,628 | | | — | | | 1,628 | |
| Total intangible assets | | | | $ | 1,992 | | | $ | (262) | | | $ | 1,730 | |
| | | | | | | | | | | | | | | | | | | | | | | | | | |
| | | | As of December 31, 2022 |
| $s in thousands | | Estimated Life (Years) | | Cost | | Accumulated Amortization | | Net |
| Licenses | | 10 | | $ | 67 | | | $ | (47) | | | $ | 20 | |
| Internal-use software | | 3 | | 297 | | | (109) | | | 188 | |
| Total intangible assets | | | | $ | 364 | | | $ | (156) | | | $ | 208 | |
IPR&D is the historical know-how, software, formula protocols, designs, and procedures expected to be needed to complete the development of the technology asset and receive regulatory approval. The Company expects to amortize the IPR&D over its useful life of five years when placed into service. As of December 31, 2023, the Company capitalized costs of $0.3 million related to IPR&D.
Amortization expense for intangible assets and other noncurrent assets was $0.1 million for the years ended December 31, 2023 and 2022, respectively. Amortization expense is included in Selling, general and administrative expense in the Consolidated Statements of Operations.
Future amortization expense for intangible assets subject to amortization is expected to be as follows:
| | | | | | | | |
| $s in thousands | | Expected
Amortization |
| 2024 | | $ | 96 | |
| 2025 | | 6 | |
| 2026 | | — | |
| 2027 | | — | |
| 2028 | | — | |
| Thereafter | | — | |
| Total | | $ | 102 | |
NOTE 12 – OTHER NONCURRENT ASSETS
Other noncurrent assets consisted of the following:
| | | | | | | | | | | | | | |
| | As of December 31, |
| $s in thousands | | 2023 | | 2022 |
| Operating lease right-of-use asset | | $ | 7,777 | | | $ | 671 | |
| Investment in MAB Funding, LLC | | 4,000 | | | — | |
| Prepaid subscriptions | | 2,877 | | | 1,246 | |
| Interest rate swap | | 1,117 | | | 1,407 | |
| Investment in Overwatch Imaging, Inc. | | 1,000 | | | 1,000 | |
| Other | | — | | | 32 | |
| Total other noncurrent assets | | $ | 16,771 | | | $ | 4,356 | |
Investment in MAB Funding, LLC
On November 17, 2023, the Company entered into a series of agreements with MAB Funding, LLC (“MAB”) and its subsidiary designed to facilitate the purchase and return to service of four Canadair CL-215T Amphibious Aircraft (the “Spanish Scoopers”) originally awarded to the Company’s wholly-owned subsidiary, Bridger Aerospace Europe, S.L.U. (“BAE”), in September 2023 via a public tender process from the Government of Spain for €40.3 million. Under the terms of the agreements, the Company agreed to sell its entire outstanding equity interest in BAE to MAB and purchase $4.0 million of non-voting Class B units of MAB. The Company also entered into a services agreement with MAB whereby the Company will manage the return to service upgrades of the Spanish Scoopers through the Company’s wholly-owned Spanish subsidiary, Albacete Aero, S.L., while they are owned and funded by MAB. The service agreement also provides that the Company has the right, but not the obligation, to acquire each Spanish Scooper as it is ready to be contracted and returned to service.
The Company assessed both MAB and BAE for variable interest entity accounting under ASC 810-10-15 and determined that MAB is a voting interest entity and BAE is a variable interest entity. However, neither entity is consolidated in the consolidated financial statements as the Company does not have a controlling financial interest in MAB and the Company is not the primary beneficiary of BAE.
The Company accounts for its investment in MAB in accordance with ASC 321 as the Company determined that it did not have significant influence as its interests in MAB are non-voting and the Company does not have representation on the Board of Directors of MAB, which makes all significant decisions. Because MAB is privately held and there is no readily determinable fair value for its stock, the Company will avail itself of the accounting alternative provided by ASC 321 whereby the investment will be accounted for at cost less impairment charges, adjusted for observable price changes in orderly transactions for an identical or similar investment in MAB.
Investment in Overwatch Imaging, Inc.
On February 22, 2022, the Company entered into a collaboration agreement (the “Collaboration Agreement”) with Overwatch Imaging, Inc. (“Overwatch”), a Delaware corporation, under which the Company and Overwatch collaborate to develop and implement the technical and imaging needs of the Company.
Overwatch agrees to provide the products and services at a discount to the Company under the Collaboration Agreement. Overwatch’s products and services under the Collaboration Agreement include, but not limited to, imaging systems, software engineer labor related to software-as-a-service support, labor related to sensor operations, and cloud-based image data web service.
The Collaboration Agreement will end upon termination by (i) a mutual agreement between the Company and Overwatch, (ii) either or both parties upon revenue payment to Overwatch not meeting certain thresholds stipulated in the Collaboration Agreement within the second, third, or fourth anniversary of the effective date of the Collaboration Agreement, or (ii) either party upon a material breach of the Collaboration Agreement uncured within thirty (30) days after written notice from the non-breaching party.
The Company determined that both the Company and Overwatch are active participants and exposed to the significant risks and rewards of the collaboration under the Collaboration Agreement. The Company does not consider its obligations under the Collaboration Agreement as an output of the Company’s ordinary activities in exchange for consideration and Overwatch is not considered a customer under ASC 606. Therefore, the Company considers the collaboration to be within the scope of ASC 808.
For the years ended December 31, 2023 and 2022, the Company recorded zero and $0.8 million, respectively, of purchases of imaging systems under the Collaboration Agreement in Property, plant and equipment, net, and $39,000 and $0.4 million, respectively of engineering services provided by Overwatch under the Collaboration Agreement in Selling, general and administrative expense.
NOTE 13 – ACCRUED EXPENSES AND OTHER LIABILITIES
Accrued expenses and other liabilities consisted of the following:
| | | | | | | | | | | | | | |
| | As of December 31, |
| $s in thousands | | 2023 | | 2022 |
| Contingent consideration | | $ | 8,486 | | | $ | — | |
| Accrued interest expense | | 6,448 | | | 6,435 | |
| Warrant liabilities | | 5,596 | | | — | |
| Accrued foreign tax | | 2,707 | | | — | |
| Deferred underwriting fee payable | | 1,500 | | | — | |
| Accrued salaries, wages and bonuses | | 1,099 | | | 6,516 | |
| Embedded derivative of Series A Preferred Stock | | 885 | | | — | |
| Accrued professional fees | | 851 | | | 2,291 | |
| Finance right-of-use liability | | 46 | | | 68 | |
| Freestanding derivative on Legacy Bridger Series C Preferred Shares | | — | | | 2,186 | |
| Embedded derivative of Legacy Bridger Series C Preferred Shares | | — | | | 1,040 | |
| Other | | 327 | | | 180 | |
| Total accrued expenses and other liabilities | | 27,945 | | | 18,716 | |
| Less: Current accrued expenses and other current liabilities | | (17,168) | | | (18,670) | |
| Total long-term accrued expenses and other noncurrent liabilities | | $ | 10,777 | | | $ | 46 | |
On May 24, 2023, the Company issued $4.9 million in Class A Common Stock in lieu of bonuses paid for the bonus pool accrued as of December 31, 2022. The Company’s bonus pool was accrued throughout the year and was based upon 2022 performance milestones. On August 19, 2022, the Company also granted $10.1 million of discretionary cash bonuses to employees and executives in connection with the issuance of the Legacy Bridger Series C Preferred Shares, issuance of the Series 2022 Bonds for $160.0 million and execution of the Transaction Agreements.
Warrant liabilities
The warrant liabilities consist of the following Warrants issued by the Company in connection with the Reverse Recapitalization:
Public Warrants
The Company issued Public Warrants to purchase 17,250,000 shares of Common Stock at an exercise price of $11.50 per share in exchange for the 17,250,000 JCIC warrants originally issued by JCIC in its initial public offering. The Warrants may only be exercised for a whole number of shares of Common Stock. The exercise price and number of shares of Common Stock issuable upon exercise of the Warrants may also be adjusted in certain circumstances including in the event of a share dividend, recapitalization, reorganization, merger or consolidation. In no event will the Company be required to net cash settle any Warrant.
The Warrants became exercisable 30 days following the Reverse Recapitalization and will expire January 24, 2028.
Under certain circumstances, the Company may elect to redeem the Public Warrants at a redemption price of $0.01 per Public Warrant at any time during the term of the warrant in which the Common Stock trading price has been at least $18.00 per share for 20 trading days within the 30 trading-day period ending on the third trading day prior to the date on which the Company sends the notice of redemption to the Warrant holders. If the Company elects to redeem the Public Warrants, it must notify the Public Warrant holders in advance, who would then have at least 30 days from the date of notification to exercise their respective warrants. If the warrant is not exercised within that 30-day period, it will be redeemed pursuant to this provision. The Company may also elect to redeem the outstanding Warrants at a redemption price of $0.10 per Warrant at any time during the term of the Warrant in which the Common Stock trading price is between $10.00 per share and $18.00 per share (as adjusted for share splits, share dividends, rights issuances, subdivisions, reorganization, recapitalizations and the like) for any 20 trading days within the 30 trading-day period ending on the third trading day prior to the date on which the Company sends the notice of redemption to the Warrant holders. In such case, the Warrant holders will be able to exercise their Warrants on a cashless basis prior to the redemption for a number of shares of our Common Stock determined based on the redemption date and the fair market value of the Common Stock.
As of December 31, 2023, 17,249,874 Public Warrants remain outstanding. The Public Warrants are liability-classified with a balance of $3.6 million and a fair value of $0.21 per warrant as of December 31, 2023.
Private Placement Warrants
The Company issued Private Placement Warrants to purchase 9,400,000 shares of Common Stock at an exercise price of $11.50 per share in exchange for the 9,400,000 JCIC warrants originally purchased in a private placement by JCIC Sponsor, LLC (“JCIC Sponsor”) contemporaneously with JCIC’s initial public offering. JCIC Sponsor, or its permitted transferees, has the option to exercise the Private Placement Warrants on a cashless basis. If the Private Placement Warrants are held by holders other than JCIC Sponsor or its permitted transferees, the Private Placement Warrants will be redeemable by the Company in all redemption scenarios and exercisable by the holders on the same basis as the Public Warrants.
As of December 31, 2023, the Company had 9,400,000 outstanding Private Placement Warrants to purchase 9,400,000 shares of Common Stock. The Private Placement Warrants are liability-classified with a balance of $2.0 million and a fair value of $0.21 per warrant as of December 31, 2023.
Contingent consideration
The Company assumed Contingent consideration as part of the Acquisition discussed in “Note 10 – Acquisition Activity.” The Company is required to make contingent payments to the sellers based on the achievement of certain operational milestones. The fair value of the liability for the contingent payments was recognized upon the acquisition as part of the purchase accounting opening balance sheet. The initial cost was recognized at fair value on the closing date with subsequent changes in estimated fair value recognized as Selling, general and administrative expenses in the Consolidated Statements of Operations. As of December 31, 2023, the Company recognized $4.8 million in Accrued expenses and other current liabilities and $3.6 million in Long-term accrued expenses and other noncurrent liabilities in the Consolidated Balance Sheets.
The change in contingent consideration for the year ended December 31, 2023 was as follows:
| | | | | | | | |
| $s in thousands | | Contingent Consideration |
| As of December 31, 2022 | | $ | — | |
| Ignis acquisition | | 8,319 | |
| Change in fair value of contingent consideration | | 167 | |
| As of December 31, 2023 | | $ | 8,486 | |
NOTE 14 – INTEREST RATE SWAP AND FREESTANDING DERIVATIVE
The Company assesses interest rate cash flow risk by continually identifying and monitoring changes in interest rate exposures that may adversely affect expected future cash flows and by evaluating hedging opportunities.
The Company entered an interest rate swap with Rocky Mountain Bank (“RMB”) on March 12, 2020 to reduce risk related to variable-rate debt from the term loan, which was subject to changes in market rates of interest as discussed in “Note 16 – Long-Term Debt.” The interest rate swap is designated as a cash flow hedge. The Company records its corresponding derivative asset on a gross basis in Other noncurrent assets at fair value on the Consolidated Balance Sheets.
Each month, the Company made interest payments to RMB under its loan agreement based on the current applicable one-month LIBOR rate plus the contractual LIBOR margin then in effect with respect to the term loan, without reflecting the interest rate swap until June 30, 2023. Effective July 1, 2023, LIBOR was replaced by 1-month CME Term Secured Overnight Financing Rate (“SOFR”) plus 0.11448% tenor spread adjustment plus the 2.5% contractual SOFR margin then in effect with respect to the term loan. At the end of each calendar month, the Company receives or makes payments on the interest rate swap difference, if any, based on the received interest rate set forth in the table below. Interest payments on the Company’s term loan and payments received or made on the interest rate swap are reported net on the Consolidated Statements of Operations as interest expense.
The Company had the following interest rate swap designated as a cash flow hedge ($s in thousands):
| | | | | | | | | | | | | | | | | | | | | | | | | | | | | | | | |
| As of December 31, 2023 |
Effective
Date | | Maturity
Date | | Notional
Amount | | Fair Value | | Pay Fixed | | Receive Rate |
| 4/15/2020 | | 3/15/2030 | | $ | 10,466 | | | $ | 1,117 | | | 3.887 | % | | 1 Month SOFR + 2.61448% |
| | | | | | | | | | | | | | | | | | | | | | | | | | | | | | | | |
| As of December 31, 2022 |
Effective
Date | | Maturity
Date | | Notional
Amount | | Fair Value | | Pay Fixed | | Receive Rate |
| 4/15/2020 | | 3/15/2030 | | $ | 11,110 | | | $ | 1,407 | | | 3.887 | % | | 1 Month LIBOR + 2.5% |
The Company accounts for the interest rate swap as a cash flow hedge for accounting purposes under GAAP. The Company reflects the effect of this hedging transaction in the consolidated financial statements. The unrealized gain is reported in other comprehensive (loss) income. If the Company terminates the interest rate swap agreement, the cumulative change in fair value at the date of termination would be reclassified from Accumulated other comprehensive income, which is classified in stockholders’ deficit, into earnings in the Consolidated Statements of Operations.
Freestanding Derivative
On April 9, 2022, JPMorgan Chase Funding Inc. (“JPMCF”) entered into a letter agreement with the Company to receive an excess hold fee of 5% of the aggregate initial stated value of the Legacy Bridger Series C Preferred Shares held by JPMCF in excess of $157,894,736.84 as of March 15, 2023. The excess hold fee was considered a freestanding derivative instrument until March 15, 2023 and became a fee payable thereafter. The Company paid $1.1 million and the remaining $1.1 million of the excess hold fee in June and July 2023, respectively.
As of December 31, 2022, the fair value of the freestanding derivative on Legacy Bridger Series C Preferred Shares was $2.2 million. Realized gains and losses arising from changes in fair value of the freestanding derivative were recorded in earnings.
NOTE 15 – FAIR VALUE MEASUREMENTS
Long-term debt
As of December 31, 2023, the Company has $160.2 million of fixed rate and $51.2 million of variable rate debt outstanding. Based on current market rates, the fair value of the fixed rate debt as of December 31, 2023 was estimated to be $174.7 million. The Company estimated the fair value of the fixed rate debt using quoted market prices (Level 2 inputs) within the fair value hierarchy. When valuing fixed rate debt, the fair value is capped at par value. The variable rate debt approximates fair value based on the closing or estimated market prices of similar securities comparable to the Company’s debts as of December 31, 2023 and 2022. Debt financing activities and loan agreements are further described in “Note 16 – Long-Term Debt.”
Recurring Fair Value Measurement
Our cash and cash equivalents, accounts receivable, accounts payable, accrued expenses, and other current assets and liabilities (excluding derivative instruments) are carried at amounts which reasonably approximate their fair values due to their short-term nature.
The following tables summarizes the Company’s assets and liabilities that are measured at fair value on a recurring basis, by level, within the fair value hierarchy:
| | | | | | | | | | | | | | | | | | | | |
| | As of December 31, 2023 |
| $s in thousands | | Level 1 | | Level 2 | | Level 3 |
| Assets | | | | | | |
| Cash | | $ | 22,956 | | | $ | — | | | $ | — | |
| Restricted cash: | | | | | | |
| Money market fund | | 13,981 | | | — | | | — | |
| | | | | | |
| Total restricted cash | | 13,981 | | | — | | | — | |
| Investments in marketable securities | | — | | | 1,009 | | | — | |
| Interest rate swap | | — | | | 1,117 | | | — | |
| Total assets | | $ | 36,937 | | | $ | 2,126 | | | $ | — | |
| Liabilities | | | | | | |
| Warrant liabilities - Public Warrants | | 3,622 | | | — | | | — | |
| Warrant liabilities - Private Placement Warrants | | — | | | 1,974 | | | — | |
| Contingent consideration | | — | | | — | | | 8,486 | |
| Embedded derivative of Series A Preferred Stock | | — | | | — | | | 885 | |
| Total liabilities | | $ | 3,622 | | | $ | 1,974 | | | $ | 9,371 | |
| | | | | | | | | | | | | | | | | | | | |
| | As of December 31, 2022 |
| ($s in thousands) | | Level 1 | | Level 2 | | Level 3 |
| Assets | | | | | | |
| Cash | | $ | 260 | | | $ | — | | | $ | — | |
| Cash equivalents: | | | | | | |
| Commercial paper | | — | | | 29,890 | | | — | |
| Money market fund | | 13 | | | — | | | — | |
| Total cash and cash equivalents | | 273 | | | 29,890 | | | — | |
| Restricted cash: | | | | | | |
| Money market fund | | 9,284 | | | — | | | — | |
| Other restricted cash | | 3,013 | | | — | | | — | |
| Total restricted cash | | 12,297 | | | — | | | — | |
| Investments in marketable securities | | — | | | 54,980 | | | |
| Interest rate swap | | — | | | 1,407 | | | — | |
| Total assets | | $ | 12,570 | | | $ | 86,277 | | | $ | — | |
| Liabilities | | | | | | |
| Freestanding derivative on Legacy Bridger Series Preferred Shares | | $ | — | | | $ | — | | | $ | 2,186 | |
| Embedded derivative of Legacy Bridger Series C Preferred Shares | | — | | | — | | | 1,040 | |
| Total liabilities | | $ | — | | | $ | — | | | $ | 3,226 | |
Interest Rate Swap
The Company’s derivative financial instruments are measured at fair value on a recurring basis based on quoted market prices or using standard valuation models as described in “Note 14 – Interest Rate Swap and Freestanding Derivative.”
The notional amounts of the derivative financial instruments do not necessarily represent amounts exchanged by the parties and, therefore, are not a direct measure of our exposure to the financial risks described in “Note 2 – Summary of Significant Accounting Policies.”
The fair value of the Company’s interest rate swap agreement was determined based on the present value of expected future cash flows using discount rates appropriate with the terms of the swap agreement. The fair value indicates an estimated amount the Company would be required to receive if the contracts were canceled or transferred to other parties. The Company calculates the fair value of interest rate swap agreement quarterly based on the quoted market price for the same or similar financial instruments.
The fair value of the freestanding derivative was determined based on the present value of the excess hold fee expected to be owed on March 15, 2023, after taking into account the probability of such excess hold fee being outstanding on the same date. The excess hold fee was considered a freestanding derivative instrument until March 15, 2023 and became a fee payable thereafter, noted above as an excess hold fee payable on Series A Preferred Stock. The Company used a Level 3 valuation methodology to measure this freestanding derivative.
Mandatorily Redeemable Legacy Bridger Series B Preferred shares
The Company’s mandatorily redeemable Legacy Bridger Series B Preferred Shares are measured at fair value based on capital contributions, plus accrued but unpaid interest. The Legacy Bridger Series B Preferred Shares were redeemed during the year ended December 31, 2022 as furthered discussed in “Note 21 – Mandatorily Redeemable Preferred Shares.”
Embedded derivative of Legacy Bridger Series C Preferred Shares and Series A Preferred Stock
The Company identified a redemption feature of the Legacy Bridger Series C Preferred Shares that required bifurcation from the host instrument as an embedded derivative liability, as discussed in “Note 20 – Mezzanine Equity.” The embedded derivative was initially valued and remeasured using a “with-and-without” method. The “with-and-without” methodology involved valuing the entire instrument both with and without the embedded derivative using a discounted cash flow approach. Under this methodology, the difference in the estimated fair value between the instrument with the embedded derivative and the instrument without the embedded derivative represents the estimated fair value of the embedded derivative. This valuation methodology is based on unobservable estimates and judgements, and therefore is classified as a Level 3 fair value measurement. The significant unobservable input used in the estimated fair value measurement of the embedded derivative is the timing for which the Company may be in default of certain financing facilities that would require an increase of 2% interest per annum to be accrued by the holders of the Legacy Bridger Series C Preferred Shares. Legacy Bridger Series C Preferred Shares were re-issued as Series A Preferred Stock as part of the Closing, as further discussed in “Note 20 – Mezzanine Equity.”
Commercial Paper and Investments in marketable securities
The fair values of the commercial paper and available-for-sale marketable securities are based on observable market prices, and therefore classified as a Level 2 fair value measurement. Refer to “Note 5 – Cash Equivalents and Investment in Marketable Securities” included in this Annual Report on Form 10-K for additional details.
Warrant Liabilities
The Company issued Warrants in connection with the Reverse Recapitalization. The Company classifies the Warrants as liabilities at their fair value and adjust the Warrants to fair value at each reporting period. The warrant liabilities are subject to remeasurement at each balance sheet date until exercised, and any change in fair value are recorded in earnings through Selling, general and administrative expense on the Consolidated Statements of Operations.
The Public Warrants are publicly traded under the symbol “BAERW,” and the fair value of the Public Warrants at a specific date is determined by the closing price of the Public Warrants as of that date. Therefore, the Public Warrants are classified as Level 1 of the fair value hierarchy. The Public Warrants are redeemable at any time during the term of the warrant in which the Common Stock share trading price has been at least $18.00 per share for 20 trading days within the 30 trading-day period. JCIC Sponsor can redeem both the Private Placement Warrants and the Public Warrants when the stock price is between $10.00 to $18.00. As such, it is economically beneficial for the Company to redeem the Private Placement Warrants any time before the stock price crosses the $18.00 threshold. Therefore, the Warrants have similar economic value, hence Private Placement Warrants are deemed to have the same value as the Public Warrants and are classified Level 2 of the fair value hierarchy. Refer to “Note 13 – Accrued Expenses and Other Liabilities” included in this Annual Report on Form 10-K for additional details.
Contingent Consideration
In connection with the Acquisition, the Company is required to make contingent payments to the sellers based on the achievement of certain operational milestones. The fair value of the liability for the contingent payments recognized upon the acquisition as part of the purchase accounting opening balance sheet totaled $8.3 million. The fair value of the contingent consideration was determined using the Monte-Carlo simulation-based model discounted to present value. Assumptions used in this calculation are equity volatility, estimated future stock prices and various probability factors, including management’s estimate of the likelihood of meeting certain operational milestones. The ultimate settlement of the contingent consideration could deviate from current estimates based on the actual results of these financial measures. This liability is considered to be a Level 3 financial liability that is remeasured each reporting period. Changes in estimated fair value of contingent consideration are recognized as Selling, general and administrative expenses within the Unaudited Condensed Consolidated Statements of Operations. Refer to “Note 13 – Accrued Expenses and Other Liabilities” included in this Annual Report on Form 10-K for additional details.
Non-Recurring Fair Value Measurements
The Company measures certain assets at fair value on a non-recurring basis, including long-lived assets and goodwill and cost and equity method investments, which are evaluated for impairment. Long-lived assets include property, plant and equipment, net, and certain intangible assets. The inputs used to determine the fair value of long-lived assets are considered Level 3 measurements due to their subjective nature.
As of December 31, 2023, the Company recorded impairment charges of $2.4 million related to three of our Twin Commander aircraft and our two Aurora eVTOL Skiron drone aircraft. As of December 31, 2022, the Company did not have any other significant assets or liabilities that were remeasured at fair value on a non-recurring basis in periods subsequent to initial recognition. Refer to “Note 9 – Property, Plant and Equipment, Net” included in this Annual Report on Form 10-K for additional details.
NOTE 16 – LONG-TERM DEBT
Long-term debt consisted of the following:
| | | | | | | | | | | | | | |
| | As of December 31, |
| $s in thousands | | 2023 | | 2022 |
Taxable industrial revenue bonds, dated July 21, 2022, 11.5% interest rate, maturing September 1, 20271 | | $ | 160,000 | | | $ | 160,000 | |
Permanent loan agreement, dated August 21, 2020, greater of Prime +1.5% or 4.75% interest rate, maturing August 21, 20352 | | 18,391 | | | 18,852 | |
Permanent loan agreement, dated October 1, 2020, greater of Prime +1.5% or 4.75% interest rate, maturing October 1, 20352 | | 18,457 | | | 18,924 | |
Term loan agreement dated September 30, 2019, SOFR +2.61448% interest rate, maturing March 15, 20303 | | 10,466 | | | 11,111 | |
Term loan agreement dated February 3, 2020, SOFR +2.61448% interest rate, maturing February 3, 20274 | | 3,813 | | | 4,371 | |
Various term loan agreements, earliest start at September 9, 2021, 3.89-5.5% interest rates, latest maturation on November 17, 20275 | | 247 | | | 317 | |
| Loans payable | | 211,374 | | | 213,575 | |
| Less: noncurrent debt issuance costs | | (3,695) | | | (4,665) | |
| Less: current debt issuance costs | | (995) | | | (993) | |
| Less: current portion of long-term debt, net of debt issuance costs | | (2,099) | | | (2,446) | |
| Total long-term debt, net of debt issuance costs | | $ | 204,585 | | | $ | 205,471 | |
1 On July 21, 2022, the Company closed on the Series 2022 Bonds, upon which the Company received aggregate proceeds of $135.0 million on July 21, 2022 and $25.0 million on August 10, 2022. The proceeds were designated to redeem in full the 2021 Bonds and the Series A Preferred shares, to finance the construction and equipping of the Company’s third and fourth aircraft hangar in Belgrade, Montana and to fund the purchase of additional CL-415EAF aircraft. The Series 2022 Bonds mature on September 1, 2027, with an annual interest rate of 11.5% payable semiannually on March 1 and September 1 of each year, commencing on September 1, 2022. Debt issuance costs for the Series 2022 Bonds were $4.2 million. The Series 2022 Bonds are subject to redemption or prepayment prior to maturity, as follows: (a) optional redemption in whole or in part, on any day thereafter at par plus accrued interest, and on certain dates, a premium; (b) mandatory redemption at par plus any premium applicable to optional redemptions and a 3% premium if such redemptions are made prior to September 1, 2025, in whole or in part, in the event of the occurrence of certain events; and (c) extraordinary redemption at par plus accrued interest due to the occurrence of certain casualty, condemnation, or other unexpected events. Optional redemptions are subject to 3%, 2%, and 0% premiums if redemptions are made on or after September 1, 2025, September 2026, and September 2027, respectively. At the Company’s direction, the Series 2022 Bonds may be redeemed by Gallatin County at any time, at a redemption price equal to 100% of the principal amount plus accrued interest upon the occurrence of certain events
2 In 2020, the Company entered into two separate credit facilities brokered through Live Oak Bank (“LOB”) and backed by the US Department of Agriculture for the completed purchase of the Company’s first two Viking CL-415EAF aircraft. The Company issued two $19.0 million promissory notes to LOB, established as 15-year maturity, first two years interest only payments monthly, then 13-year term principal plus interest due monthly at the rate of the greater of prime plus 1.5% or 4.75% per annum. The first of these notes was issued on August 21, 2020 and the second was issued October 1, 2020 to BAT1, LLC and BAT2, LLC, respectively. Debt issuance costs for BAT1 and BAT2 were $1.0 million and $0.9 million, respectively.
3 On September 20, 2019, the Company entered into a credit facility with RMB for $12.9 million, established as a 10-year maturity, 6-month draw period, first 6 months interest only payments monthly, then 10-year term principal plus interest due monthly on a 20-year amortization at the rate of 1 month SOFR plus 2.61448%. Debt issuance costs for this loan were $0.1 million.
4 On February 3, 2020, the Company entered into a credit facility with RMB to finance in part the purchase of four Quest Kodiak aircraft. A promissory note was issued for $5.6 million, established as a 7-year maturity, first 8 months interest only payments monthly, 60 day draw period, then 76-month term plus principal interest due monthly on a 10-year amortization at the rate of 1 month SOFR plus 2.61448%. Debt issuance costs for this loan was $0.1 million.
5 On November 18, 2021, the Company re-entered into a new short-term loan to finance aviation insurance premiums with Insurance Premium Financing Leader. This was financed for $0.6 million with a maturity of one year and at a rate of 3.89%. No debt issuance costs were incurred. The Company also entered into various term loan agreements for the purchase of vehicles through First Interstate Bank with the earliest date of September 9, 2021. These loans ranged from $29,000 to $72,000 and were at rates from 4.8% to 5.5% and at durations from 5 to 6 years, with the latest maturation on November 17, 2027.
The Series 2022 Bonds are subject to financial covenants requiring the Company to maintain a DSCR that exceeds 1.25x commencing with the fiscal quarter ending December 31, 2023, operate in such a manner to produce gross revenues so as to be at all relevant times in compliance with the DSCR covenant and to maintain liquidity of $8.0 million in the form of unrestricted cash or investments (excluding margin accounts and retirement accounts) at all times and to be reported.
The Company is not in compliance with the DSCR covenant as of December 31, 2023 and management anticipates the Company to continue to not be in compliance with the DSCR covenant at future quarterly measurement periods during the next 12 months, primarily attributable to the seasonal nature of our business and a less intense 2023 wildfire season. Although the Company is in compliance with the $8.0 million minimum liquidity requirement as of December 31, 2023, based on projected cash use, management anticipates that without additional cash funding the Company will not have sufficient cash on hand to comply with the minimum liquidity covenant or to fund operations, including $18.4 million of required interest payments associated with the Series 2022 Bonds, within the next 12 months, until the Company begins to collect cash from its seasonal firefighting operations in 2024.
The Series 2022 Bonds agreements provide that, with regard to covenant violations, other than non-payment of principal or interest, no event of default shall be deemed to have occurred so long as a reasonable course of action to remedy a violation commences within 30 days of written notification of non-compliance from the trustee and management diligently prosecutes the remediation plan to completion.
Management consulted with bond counsel on the impact of covenant violations and proactively developed a cost reduction plan, and began implementing the plan in November 2023, to help remedy the anticipated covenant breaches in 2024. However, this plan is in progress and there is no assurance that management will be able diligently prosecute the remediation plan to completion. The uncertainty regarding the company’s ability to diligently prosecute the remediation plan to completion and the potential impact on the bonds maturity as a result of the anticipated debt covenant violations at subsequent compliance dates or failure to make required interest payments, could result in the Series 2022 Bonds becoming immediately due and payable, which raises substantial doubt about our ability to continue as a going concern as further disclosed in “Note 1 – Organization and Basis of Presentation.”
The LOB loans are subject to financial covenants requiring the Company to maintain a DSCR, generally calculated as the ratio of the net cash flow (as defined in the applicable note agreements) to the amount of interest and servicing fees required to be paid over the succeeding 12 months on the principal amount of the note, as applicable, that will be outstanding on the payment date following such date of determination, that exceeds 1.25x at the aircraft or entity level and for the Company’s debt to worth ratio to not exceed 5.00x at the aircraft or entity level. The Company is in compliance with such financial covenants as of December 31, 2023.
Both of the loans with RMB are subject to financial covenants requiring the Company to maintain a DSCR, calculated as the ratio of adjusted EBITDA (as defined in the applicable note agreements) to the amount of interest and principal payments for the fiscal year ending on the compliance date, that exceeds 1.25x for the Company. These notes are also subject to financial covenants requiring the Company to maintain a Senior Leverage Ratio on a quarterly basis not to exceed 7.00 to 1.00 through Quarter 3, 2024, 6.00 to 1.00 through Quarter 3, 2025 and 5.00 to 1.00 thereafter. This is calculated as Total Funded Senior Debt (as defined in the applicable note agreements) less municipal debt, divided by adjusted EBITDA (as defined in the applicable note agreements). As of December 31, 2022, the Company was in compliance with the Senior Leverage Ratio requirement related to the credit facilities entered with RMB, as RMB amended the loan agreements prior to year-end. These amendments modified the definition of EBITDA to be used in the Senior Leverage Ratio calculation to include certain allowable addbacks and modified the timing requirement of the Senior Leverage Ratio. The Company is in compliance with such financial covenants as of December 31, 2023.
Amortization of debt issuance costs was $1.0 million and $0.6 million for the years ended December 31, 2023 and 2022, respectively.
Principal maturities of the outstanding debt as of December 31, 2023 are as follows:
| | | | | | | | |
| $ in thousands | | Maturities |
| 2024 | | $ | 2,993 | |
| 2025 | | 3,193 | |
| 2026 | | 3,396 | |
| 2027 | | 165,149 | |
| 2028 | | 3,232 | |
| Thereafter | | 33,411 | |
| Total | | $ | 211,374 | |
NOTE 17 – COMMITMENTS AND CONTINGENCIES
Legal Matters
From time to time, the Company is subject to various litigation and other claims in the normal course of business. No amounts have been accrued in the consolidated financial statements with respect to any matters.
Due to the nature of our business, we may become, from time to time, involved in routine litigation or subject to disputes or claims related to our business activities. In the opinion of our management, there are no pending litigation, disputes or claims against us which, if decided adversely, will have a material adverse effect on our financial condition, cash flows or results of operations. In the ordinary course of its operations, the Company will continue to vigorously enforce its legal and contractual rights to ensure that its business and operations continue on an unimpaired basis.
Commitments
On April 13, 2018, the Company executed an aircraft purchase agreement with Longview Aviation Asset Management, Inc. and Viking Air Limited (“Viking”) for the purchase of six Viking CL-415EAF aircraft. For the year ended December 31, 2022, the Company paid $9.1 million and received its sixth Viking CL-415EAF, the final remaining aircraft under the aircraft purchase agreement, in 2023. Uninvoiced commitments were zero and $9.1 million as of December 31, 2023 and 2022.
On March 23, 2022, the Company entered into an agreement with Sievert Construction, Inc for the construction of a hangar at the Bozeman Yellowstone International Airport in Belgrade, Montana. Payments made under the agreement were $3.2 million and $9.8 million for the years ended December 31, 2023 and 2022, respectively. Un-invoiced commitments were zero and $3.8 million as of December 31, 2023 and 2022.
Leases
Under ASC 842, leases are separated into two classifications: operating leases and financial leases. Lease classification under ASC 842 is relatively similar to ASC 840. For a lease to be classified as a finance lease, it must meet one of the five finance lease criteria: (1) transference of title/ownership to the lessee, (2) reasonably certain to exercise a purchase option, (3) lease term for major part of the remaining economic life of the asset, (4) present value represents substantially all of the fair value of the asset and (5) asset specialization. Any lease that does not meet these criteria is classified as an operating lease. ASC 842 requires all leases to be recognized on the Company’s balance sheet. Specifically, for operating leases, the Company recognizes a right-of-use asset and a corresponding lease liability upon lease commitment.
Company as a lessee
The Company is the lessee in a lease contract when the Company obtains the right to use the asset. The right-of-use asset represents the Company’s right to use an underlying asset for the lease term and lease obligations represent the Company’s obligations to make lease payments arising from the lease, both of which are recognized based on the present value of the future minimum lease payments over the lease term at the commencement date. The Company has also elected the short-term lease exception whereby leases with a term of 12 months or less at inception are not recorded on the Consolidated Balance Sheets and are expensed on a straight-line basis over the lease term in our Consolidated Statements of Operations. The Company determines the lease term by agreement with the lessor. Options to renew are considered in lease terms if reasonably expected to be exercised.
ASC 842 requires a lessee to use the rate implicit in the lease whenever that rate is readily determinable, otherwise the incremental borrowing rate (“IBR”) should be used. Given the nature of the Company’s lease portfolio, which consists of leases of hangar spaces, aircraft, vehicles, copiers, buildings, aircraft equipment, the implicit rate is often unavailable. In such cases, the Company uses its incremental borrowing rate as the discount rate. The IBR is the rate of interest that a lessee would have to pay to borrow on a collateralized basis over a similar term an amount equal to the lease payments in a similar economic environment. The determination of the IBR requires judgment and is derived from the Company’s weighted average cost of capital.
Components of the Company’s operating and finance lease assets and liabilities as of December 31, 2023 and 2022 are as follows:
| | | | | | | | | | | | | | | | | | | | |
| | | | As of December 31, |
| $s in thousands | | Financial Statement Line Item | | 2023 | | 2022 |
| Assets | | | | | | |
| Operating lease right-of-use asset | | Other noncurrent assets | | $ | 7,777 | | | $ | 671 | |
| Finance lease right-of-use asset, net | | Property, plant and equipment, net | | 40 | | | 62 | |
| Liabilities | | | | | | |
| Operating lease right-of-use liabilities (current) | | Operating right-of-use liability (current) | | $ | 2,153 | | | $ | 21 | |
| Finance lease right-of-use liabilities (current) | | Accrued expenses and other current liabilities | | 22 | | | 23 | |
| Operating lease right-of-use liabilities (non-current) | | Operating right-of-use liability (noncurrent) | | 5,779 | | | 755 | |
| Finance lease right-of-use liabilities (non-current) | | Accrued expenses and other noncurrent liabilities | | 24 | | | 46 | |
The Company leases various property and premises on a short-term basis and leases some of its premises under non-cancelable operating leases that expire on various dates through January 2051.
The Company recorded $1.5 million and $0.5 million of expenses associated with these operating leases in Cost of Revenues and Selling, general and administrative expense in the Consolidated Statements of Operations for the years ended December 31, 2023 and 2022. The Company recorded expenses associated with finance leases in Cost of revenues and Selling, general and administrative expense in the Consolidated Statements of Operations. Operating lease cost includes approximately $40,000 of short-term lease expense and approximately $0.1 million of variable lease expense for the year ended December 31, 2023. Operating lease cost includes $0.2 million of short-term lease expense and $0.2 million of variable lease expense for the year ended December 31, 2022.
Supplemental cash flow information related to leases is as follows:
| | | | | | | | | | | | | | |
| | Year Ended December 31, |
| $s in thousands | | 2023 | | 2022 |
| Cash paid for amounts included in the measurement of lease liabilities: | | | | |
| Operating cash flows from operating leases | | $ | 1,208 | | | $ | 58 | |
| Operating cash flows from finance leases | | 22 | | | 27 | |
| Financing cash flows from finance leases | | 6 | | | 9 | |
| Right-of-use assets obtained in exchange for lease liabilities: | | | | |
| Operating leases | | $ | 7,940 | | | $ | 130 | |
As of December 31, 2023, future minimum lease payments are as follows:
| | | | | | | | | | | | | | |
| $s in thousands | | Operating Leases | | Finance Leases |
| Year Ending December 31: | | | | |
| 2024 | | $ | 2,153 | | | $ | 26 | |
| 2025 | | 2,153 | | | 21 | |
| 2026 | | 1,843 | | | 4 | |
| 2027 | | 1,742 | | | — | |
| 2028 | | 906 | | | — | |
| Thereafter | | 2,307 | | | — | |
| Total lease payments | | 11,104 | | | 51 | |
| Less: interest | | (3,172) | | | (5) | |
| Total lease liabilities | | $ | 7,932 | | | $ | 46 | |
| | | | |
| Weighted average remaining lease term: | | 8.8 years | | 2.0 years |
| Weighted average discount rate: | | 9.4 | % | | 10.6 | % |
Company as a lessor
The Company acts as a lessor of a facility and records this as Other Revenue in the Consolidated Statements of Operations. Lease revenue was $12,000 and $0.3 million for the years ended December 31, 2023 and 2022, respectively. The lease is a sublet arrangement and classified as an operating lease. This lease expired in 2023 and was not renewed. The minimum lease payments received were recognized on a straight-line basis over the lease term. The leased asset was included in Property, Plant and Equipment, net in the Consolidated Balance Sheets and depreciated over its estimated useful life. There were no variable lease conditions or purchase options.
Contingencies
On November 17, 2023, the Company entered into a series of agreements with MAB and its subsidiary designed to facilitate the purchase and return to service of four Spanish Scoopers originally awarded to the Company in September 2023 via a public tender process from the Government of Spain. The terms of the agreements provide that the Company will manage the return to service upgrades of the Spanish Scoopers while they are owned and funded by MAB. The Company has the right, but not the obligation, to acquire each plane as it is ready to be contracted and returned to service. In the event that Bridger does not purchase the aircraft within the time periods set forth in the agreements, then either party may initiate a sales process for the sale of all aircraft that have not been purchased by the Company, which sales process the Company will oversee and manage. If the aircraft are sold to a third party through such process, then the Company must pay the MAB’s subsidiary a cash fee equal to the amount, if any, by which the aggregate price of the Company’s purchase options for such aircraft exceeds the consideration paid by the third-party purchaser for the same aircraft, not to exceed $15.0 million in aggregate. If the aircraft are not sold to a third party and MAB’s subsidiary has not otherwise entered into an operating lease with a third party for the aircraft, then the Company must pay MAB’s subsidiary $15.0 million.
NOTE 18 – STOCK-BASED COMPENSATION
Incentive Units
During the year ended December 31, 2022, the Company granted Incentive Units to selected board members and executives. Within each grant, 80% of the Incentive Units vest annually over a four year period subject to continued service by the grantee (the “Time-Vesting Incentive Units”), and the remaining 20% of the Incentive Units vest upon a qualifying change of control event (the “Exit-Vesting Incentive Units”). Notwithstanding the above, any unvested Time-Vesting Incentive Units will become vested if a qualifying change of control event occurs prior to the respective award’s four year service-based vesting period. Upon termination of the board member or executive, the Company has the right, but not the obligation, to repurchase all or any portion of the vested Incentive Units at fair market value. Upon vesting of each Incentive Unit, the Company will issue 0.96246 shares of Common Stock to the Incentive Unit holder.
For the Time-Vesting Incentive Units, compensation cost is recognized over the requisite service period on a straight-line basis. Upon a qualifying change of control event, the unrecognized compensation expense related to the Time-Vesting Incentive Units will be recognized when the change of control event is considered probable. For the Exit-Vesting Incentive Units, expense is recognized when a qualifying change of control event is considered probable, which has not occurred as of December 31, 2023. Forfeitures are accounted for as they occur.
Compensation cost for the Incentive Units is measured at their grant-date fair value. The fair value of the Company’s Incentive Units was derived through an option pricing model, which incorporated various assumptions. Use of a valuation model required management to make certain assumptions with respect to selected model inputs. Expected volatility was calculated based on the observed equity volatility for comparable companies. The expected time to liquidity event was based on management’s estimate of time to an expected liquidity event. The dividend yield was based on the Company’s expected dividend rate. The risk-free interest rate was based on U.S. Treasury zero-coupon issues. The weighted-average assumptions the Company used in the option pricing model for 2022 are as follows:
| | | | | | | | |
| Dividend yield | | 0 | % |
| Expected volatility | | 46.5 | % |
| Risk-free interest rate | | 1.26 | % |
| Term | | 5.00 years |
| Discount for lack of marketability | | 30 | % |
Incentive Unit activity for the period from January 1, 2023 to December 31, 2023 is as follows:
| | | | | | | | | | | | | | | | | | | | | | | | | | |
| | Time-Vesting Incentive Units | | Exit-Vesting Incentive Units |
| | Number of
Awards | | Weighted
average
grant date
fair value | | Number of
Awards | | Weighted
average
grant date
fair value |
| Outstanding as of December 31, 2022 | | 161,616 | | $ | 0.17 | | | 80,808 | | $ | 0.11 | |
| Granted | | — | | — | | — | | — |
| Vested | | (40,404) | | 0.01 | | — | | — |
| Forfeited | | (121,212) | | 0.22 | | (40,404) | | 0.22 |
| Outstanding as of December 31, 2023 | | — | | $ | — | | | 40,404 | | $ | 0.01 | |
For the years ended December 31, 2023 and 2022, the Company recognized stock-based compensation expense related to Incentive Units of $0 and $9,000 within Selling, general and administrative expense on the Consolidated Statements of Operations, respectively. As of December 31, 2023 there was $0 of unrecognized compensation expense related to unvested Incentive Units.
Restricted Stock Units
In January 2023, in connection with the Closing, the Company and its Board established and approved and assumed the Omnibus Plan, which allowed the Company to grant RSUs to Bridger employees (the “Participants”). RSUs are settled in shares of Common Stock as the RSUs vest. The RSUs accrue dividend equivalents associated with the underlying shares of Common Stock as the Company declares dividends. Dividends are paid to holders of RSUs in cash upon the vesting date of the associated RSU and are forfeited if the RSU does not vest. For the purposes of calculating compensation expense, the fair value of RSUs is the closing stock price on the date of grant. Generally, RSUs vest over a period of six years, subject to the participant’s continued employment. Upon vesting of each RSU, the Company will issue one share of Common Stock to the RSU holder.
RSU activity for the period from January 1, 2023 to December 31, 2023 is as follows:
| | | | | | | | | | | | | | |
| | Number of
Awards | | Weighted
average
grant date
fair value |
| Outstanding as of December 31, 2022 | | — | | $ | — | |
| Granted | | 9,481,469 | | 8.34 | |
| Vested | | (2,423,578) | | 8.97 | |
| Forfeited/Cancelled | | (433,432) | | 5.50 | |
| Outstanding as of December 31, 2023 | | 6,624,459 | | $ | 8.30 | |
The total fair value of RSUs vested during the year ended December 31, 2023 was $24.6 million, based on the closing stock price on the date of vesting.
For the year ended December 31, 2023, the Company recorded stock-based compensation expense related to RSUs of $2.1 million and $44.6 million within Total cost of revenues and Selling, general and administrative expense, respectively, on the Consolidated Statements of Operations. Stock-based compensation expense recorded to Selling, general and administrative expense for the year ended December 31, 2023 includes $21.6 million of expense associated with 2,400,350 RSUs that vested immediately upon Closing.
As of December 31, 2023, there was $31.0 million of unrecognized total compensation expense related to unvested RSUs, which is expected to be recognized over a weighted-average period of 2.9 years.
NOTE 19 – RELATED PARTY TRANSACTIONS
For the year ended December 31, 2023, the Company earned $0.4 million in revenues from services performed on an aircraft under the ownership of Mr. Timothy Sheehy, the Company’s Chief Executive Officer.
For the years ended December 31, 2023 and 2022, the Company incurred $0.5 million and $0.3 million, respectively, in training expenses provided by an entity in which Mr. Timothy Sheehy has a partial ownership, with $0.1 million and $0.3 million in related outstanding accounts payable as of December 31, 2023 and 2022, respectively.
On November 17, 2023, the Company entered into a series of agreements designed to facilitate the purchase and return to service of the Spanish Scoopers originally awarded to our wholly-owned subsidiary, Bridger Aerospace Europe, S.L.U. (“BAE”), in September 2023 via a public tender process from the Government of Spain for €40.3 million. Under the terms of the agreements, we agreed to sell the entire outstanding equity interest in BAE to MAB and purchase $4.0 million of non-voting Class B units of MAB. ASSF Holdings LP (“Avenue Investor”) made capital contributions totaling $13.0 million in exchange for 13,031 voting Class A Units of MAB. Avenue Investor holds approximately 10% of Bridger’s outstanding convertible Series A Preferred Stock which represents approximately 6.6% interest in BAER Common Stock on a fully diluted basis.
On July 10, 2023, the Company entered into two operating lease agreements, each for a Pilatus PC-12 under the ownership of Mr. Timothy Sheehy. The Company recorded approximately $6.3 million of right-of-use assets, $1.7 million of right-of-use current liabilities, and $4.6 million of right-of-use noncurrent liabilities as of December 31, 2023, and incurred approximately $0.8 million in lease expense for year ended December 31, 2023, associated with the two related party leases.
On July 21, 2022, the Company closed on the Series 2022 Bonds, upon which the Company received from aggregate proceeds of $135.0 million on July 21, 2022 and $25.0 million on August 10, 2022. In connection with the original issuance, three senior executives of the Company purchased approximately $10.0 million of the Series 2022 Bonds, which purchases were entered into on an arm’s length basis during the public offering for the Series 2022 Bonds, and on the same terms and conditions that were offered to all Bond purchasers. The Company has paid approximately $1.2 million and $0.1 million in interest to these three bond holders during the years ended December 31, 2023 and 2022, respectively, and incurred $1.2 million and $0.4 million in interest expense for the years ended December 31, 2023 and 2022, respectively. Refer to “Note 16 – Long-Term Debt” included in this Annual Report on Form 10-K for additional information on the Series 2022 Bonds.
In July 2022, the Company paid $3.9 million for the acquisition of a Pilatus PC-12 aircraft from Mr. Timothy Sheehy without any guarantees given or received. After the purchase, the Company repaired and upgraded the Pilatus PC-12 aircraft for the Company’s operational use.
NOTE 20 – MEZZANINE EQUITY
Legacy Bridger Series C Preferred Shares
On April 25, 2022, Legacy Bridger authorized and issued 315,789.473684 Legacy Bridger Series C Preferred Shares for aggregate proceeds of $288.5 million, net of issuance costs of $11.5 million. The Legacy Bridger Series C Preferred Shares ranked senior to Legacy Bridger’s common shares and ranked subordinate to Legacy Bridger Series A Preferred Shares, which were later redeemed in 2022, with respect to the distribution of assets upon liquidation or certain triggering events. The Legacy Bridger Series C Preferred Shares did not participate in earnings of Legacy Bridger and were non-voting shares.
Prior to the consummation of the qualified public offering, the Legacy Bridger Series C Preferred Shares accrued interest daily at 7% per annum for the first year, 9% per annum for the second year and 11% per annum thereafter and were compounded semi-annually at June 30th and December 31st of each year. Following the consummation of a qualified public offering, the Legacy Bridger Series C Preferred Shares were to accrue interest daily at 7% per annum for the first 6 years, 9% per annum for the seventh year and 11% per annum thereafter, compounded semi-annually. Accrued interest for the Legacy Bridger Series C Preferred Shares was $15.3 million as of December 31, 2022 recorded to increase the redemption amount in mezzanine equity.
Upon the Closing, Legacy Bridger surrendered and exchanged all 315,789.473684 issued and outstanding Legacy Bridger Series C Preferred Shares into 315,789.473684 shares of Series A Preferred Stock. The Company’s Certificate of Incorporation included provisions of the Legacy Bridger Series C Preferred Shares that were already in effect prior to the consummation of the Reverse Recapitalization. As a result of the Reverse Recapitalization, the maximum redemption value of the Company’s Series A Preferred Stock changed to approximately $332.7 million and excluded the 50% multiplier which had historically been included in the maximum redemption value of Legacy Bridger Series C Preferred Shares.
The Legacy Bridger Series C Preferred Shares were convertible at the election of the holder into shares of Legacy Bridger’s Class B common shares after the occurrence of certain specified events, including after a qualified public offering, without the payment of additional consideration by the holder into such number of Legacy Bridger Class B common stock as determined by dividing the original issue price, plus accrued interest by a conversion price in effect at the time of conversion. The conversion price of Legacy Bridger Series C Preferred Shares was initially equal to $12.929104. The applicable conversion price was subject to future adjustments upon the occurrence of a qualified public offering.
The Legacy Bridger Series C Preferred Shares were mandatorily redeemable by Legacy Bridger on April 25, 2032 at an amount dependent on whether the redemption occurs prior or following a qualified public offering. If the mandatory redemption occurs prior to the consummation of a qualified public offering, the redemption amount was equal to the stated value, plus the initial issue price multiplied by 50%, plus accrued but unpaid interest. If the mandatory redemption occurs following the consummation of a qualified public offering, the redemption amount was equal to the stated value, plus accrued but unpaid interest. The Legacy Bridger Series C Preferred Shares were also redeemable upon certain triggering events outside of the control of Legacy Bridger. The redemption events include redemption by the holder after March 29, 2027 and prior to a qualified public offering, or a fundamental change in Legacy Bridger’s voting and governance structure such as the sale of Legacy Bridger or its subsidiaries representing more than 50% of Legacy Bridger’s voting stock or a similar liquidity event.
Given the conversion feature was considered substantive, the mandatory redemption date was not certain and the optional redemption was upon the occurrence of certain events that are considered not solely within Legacy Bridger’s control, the Legacy Bridger Series C Preferred Shares were classified as mezzanine equity.
The Company identified certain conversion and redemption features that are required to be bifurcated from the host instrument as embedded derivative liabilities. The Legacy Bridger Series C Preferred Shares contained a clause which allowed for an increase of 2% interest per annum to be accrued by the holders of the Legacy Bridger Series C Preferred Shares in the event of a default under certain financing facilities, including noncompliance with certain financial covenants, during the period from 30 days after the occurrence of such default until such default was cured or remediated. The Company expected to be exposed to the 2% interest rate increase for no more than 2 months. As of December 31, 2022, the fair value of the embedded derivative was $1.0 million recorded as a liability in the Condensed Consolidated Balance Sheets and remeasured to fair value at each balance sheet date with changes in fair value recorded within Interest expense in the Condensed Consolidated Statements of Operations. The Company also entered into a letter agreement with JPMCF on April 9, 2022 to pay an excess hold fee of 5% of the aggregate initial stated value of the Legacy Bridger Series C Preferred Shares held by JPMCF in excess of $157,894,736.84 as of March 15, 2023. Further details of the freestanding derivative and subsequent excess hold fee payable are described in “Note 14 – Interest Rate Swap and Freestanding Derivative.”
The Company determined the fair value of the other features requiring bifurcation, both individually and in the aggregate were immaterial at inception and as of December 31, 2022. The fair value of these features will be assessed at each reporting date and will be recognized and remeasured at fair value, if material.
As of December 31, 2022, it was probable that the Legacy Bridger Series C Preferred Shares may become redeemable at either the holder’s option on or after March 29, 2027 and prior to the consummation of a qualified public offering or in the event of a qualified public offering. The Company elected to recognize changes in redemption value immediately, adjusting the Legacy Bridger Series C Preferred Shares to the maximum redemption value at each reporting date. As of December 31, 2022, the Legacy Bridger Series C Preferred Shares were carried at their redemption value of $489.0 million.
Series A Preferred Stock
The Series A Preferred Stock are convertible at the election of the holders into shares of Common Stock, without the payment of additional consideration by the holders into such number of shares of Common Stock as determined by dividing the original issue price, plus accrued interest by a conversion price equal to $11.00 per share at the time of conversion.
Shares of Series A Preferred Stock are mandatorily redeemable by the Company on April 25, 2032 at a redemption amount that is equal to the stated value, plus accrued but unpaid interest. Accrued interest for the Series A Preferred Stock was $22.2 million as of December 31, 2023. Shares of Series A Preferred Stock are also redeemable upon certain triggering events outside of the control of the Company. The triggering events include redemption by the holder on or after April 25, 2027, or a fundamental change in the Company’s voting and governance structure such as the sale of the Company or its subsidiaries representing more than 50% of the Company’s voting stock or a similar liquidity event.
As of the Closing Date and December 31, 2023, it is probable that the Series A Preferred Stock may become redeemable on April 25, 2032. The Company has elected to recognize changes in redemption value immediately, adjusting the preferred stock to the maximum redemption value at each reporting date. Upon Closing, the Series A Preferred Stock had both a carrying value and redemption value of $332.7 million, the 50% multiplier, valued at $156.4 million, was removed. As of December 31, 2023, the Series A Preferred Stock had both a carrying value and redemption value of $354.8 million. Refer to table below.
As of December 31, 2023 the fair value of the embedded derivative related to the event of default is $0.9 million recorded as a liability on the Consolidated Balance Sheets and remeasured to fair value at each balance sheet date with changes in fair value recorded within Interest expense or income on the Consolidated Statements of Operations.
The Company determined the fair value of the other features requiring bifurcation, both individually and in the aggregate were immaterial at December 31, 2023. The fair value of these features will be assessed at each reporting date and will be recognized and remeasured at fair value, if material.
Additionally, the reduction of the conversion price from $12.90 per share to $11.00 per share triggered a down round conversion feature embedded in the Series A Preferred Stock upon Closing. The Company recognized the value of the effect of a down round feature as a deemed dividend, decreasing income attributable to common stockholders in the computation of the earnings (loss) per share by $48.3 million for the year ended December 31, 2023. As of December 31, 2023, there are 32,258,180 shares of Common Stock issuable upon conversion.
| | | | | | | | | | | | | | |
| | Redeemable Series A Preferred Stock |
| $s in thousands | | Shares | | Amounts |
| Issued as of closing date | | 315,789.473684 | | $ | 332,659 | |
| Adjustment to maximum redemption value | | — | | 22,181 | |
| Balance as of December 31, 2023 | | 315,789.473684 | | $ | 354,840 | |
| | | | | | | | | | | | | | |
| | Redeemable Legacy Bridger Series C Preferred Shares |
| $s in thousands | | Shares | | Amounts |
| Issuance of Legacy Bridger Series C Preferred shares | | 315,789.473684 | | $ | 286,333 | |
| Adjustment to maximum redemption value | | — | | 202,689 | |
| Balance as of December 31, 2022 | | 315,789.473684 | | $ | 489,022 | |
NOTE 21 – MANDATORILY REDEEMABLE PREFERRED SHARES
Legacy Bridger Series B Preferred Shares
Legacy Bridger had 60,000,000 shares of Legacy Bridger Series B Preferred shares issued and outstanding as of December 31, 2021 at $1.00 per share. The Legacy Bridger Series B Preferred shares were non-voting and accrued interest at 17.5% per annum, compounded quarterly. A mandatory redemption period was required for the Legacy Bridger Series B Preferred shares plus their accrued interest in March of 2022.
The shares were mandatorily redeemable by the Legacy Bridger at an amount equal to the capital contribution, plus accrued but unpaid interest on the earlier of certain redemption events or March 31, 2022. The redemption events included the sale of Legacy Bridger or its subsidiaries representing more than 50% of Legacy Bridger’s voting stock or assets, a qualified IPO or a similar liquidity event. The shares were redeemable at any time at the option of Legacy Bridger at a redemption price equal to face value, plus accrued, but unpaid interest. The shares had preference to the common shares of Legacy Bridger, were non-voting and did not participate in the earnings of Legacy Bridger. These Legacy Bridger Series B Preferred shares accrued interest at 17.5% annually, compounded quarterly. If not redeemed on or prior to March 31, 2022, the Legacy Bridger Series B preferred shares would have accrued interest at 21.5% annually, compounded quarterly.
As the shares of Legacy Bridger Series B Preferred shares were mandatorily redeemable at a specified date, the security was classified as a liability in the Consolidated Balance Sheets.
On April 25, 2022, Legacy Bridger used a portion of the proceeds from the issuance of the Legacy Bridger Series C Preferred shares to redeem all 60,000,000 of Legacy Bridger’s outstanding Legacy Bridger Series B Preferred shares for $70.0 million, inclusive of $10.0 million in accrued interest. There were no Legacy Bridger Series B Preferred Shares outstanding as of December 31, 2023 or December 31, 2022.
Legacy Bridger Series A Preferred Shares
Legacy Bridger was authorized to issue 10,500,000 shares of Series A-1 and A-2 Preferred shares (the “Legacy Bridger Series A-1 and A-2 Preferred Shares”) with a par value of $0.001 share for $105.0 million. The Series A-1 and A-2 Preferred Shares ranked senior to Legacy Bridger’s common shares and Legacy Bridger Series C Preferred shares with respect to distribution of assets upon liquidation or certain triggering events, but do not participate in earnings of Legacy Bridger. The Legacy Bridger Series A-1 and A-2 Preferred Shares were voting and non-voting shares, respectively.
On April 25, 2022, Legacy Bridger used the proceeds from the issuance of the Legacy Bridger Series C Preferred Shares to redeem 4,444,444 shares of the Legacy Bridger Series A-1 and A-2 Preferred shares for $100.0 million. The loss on redemption of $34.6 million was reflected as a reduction to Accumulated deficit on the Consolidated Balance Sheets.
On April 25, 2022, Legacy Bridger and its investors included a new mandatory redemption provision requiring the Legacy Bridger Series A-1 and Series A-2 Preferred Shares to be redeemed on April 25, 2032. Due to the mandatory redemption provision, the Legacy Bridger Series A-1 and A-2 Preferred Shares were reclassified from mezzanine equity to liability. Legacy Bridger elected the fair value option to measure the modification of the Legacy Bridger Series A-1 and A-2 Preferred Shares, recording a value of $132.3 million at modification. The modification of the Legacy Bridger Series A-1 and A-2 Preferred Shares was accounted for as an extinguishment, with the change in fair value of $45.6 million recorded to Accumulated deficit on the Consolidated Balance Sheets with no gain or loss recorded to net loss. The loss on extinguishment was included in net loss attributable to common shareholders used to calculate net loss per share.
The Legacy Bridger Series A-1 and A-2 Preferred Shares accrued interest on a liquidation preference defined as the combined capital contributions plus accrued preferred interest amounts at a rate of 12% per annum.
The Legacy Bridger Series A-1 and A-2 Preferred Shares were redeemable upon certain triggering events outside of the control of Legacy Bridger in the event of board expansion and deemed liquidation. Failure to pay the Legacy Bridger Series A-1 and A-2 Preferred Shares interest amount on a timely basis would trigger a board expansion event that provided the holders of the Legacy Bridger Series A-1 and A-2 Preferred Shares the option to obtain control of Legacy Bridger’s board of directors and initiate a triggering event. The triggering events included the sale of Legacy Bridger or its subsidiaries representing more than 50% of Legacy Bridger’s voting stock or assets, a qualified IPO or a similar liquidity event. The Legacy Bridger Series A-1 and A-2 Preferred Shares were redeemable at any time at the option of Legacy Bridger at a redemption price equal to the greater of the product of the investment amount multiplied by 2.25 plus any indemnification amounts or aggregate liquidation preference.
Legacy Bridger identified certain redemption features that would be required to be considered for bifurcation. Legacy Bridger elected the fair value option and as such, valued the host preferred shares and embedded features as one instrument.
On July 21, 2022 and August 10, 2022, Legacy Bridger used the proceeds from the Series 2022 Bonds plus cash on hand to redeem in full the remaining 6,055,556 shares of the Legacy Bridger Series A-1 and A-2 Shares for aggregate proceeds of $136.3 million. The fair values of the Legacy Bridger Series A-1 and A-2 Preferred Shares were increased by $3.9 million from interest accrued since the modification on April 25, 2022 and no gain or loss were recorded to net loss upon extinguishment. There were no Legacy Bridger Series A-1 and A-2 Preferred Shares outstanding as of December 31, 2023 or December 31, 2022.
NOTE 22 – INCOME TAXES
The components of our loss before income taxes for the years ended December 31, 2023 and 2022, are as follows:
| | | | | | | | | | | | | | |
| | For the Years Ended December 31, |
| $s in thousands | | 2023 | | 2022 |
| Domestic | | $ | (77,659) | | | $ | (42,125) | |
| Foreign | | (1) | | | — | |
| Loss before income taxes | | $ | (77,660) | | | $ | (42,125) | |
The components of the current tax provision and deferred tax benefit for the years ended December 31, 2023 and 2022, are as follows:
| | | | | | | | | | | | | | |
| | For the Years Ended December 31, |
| $s in thousands | | 2023 | | 2022 |
| Current tax provision: | | | | |
| U.S. Federal | | $ | — | | | $ | — | |
| State and local | | 40 | | | — | |
| Foreign | | — | | | — | |
| Total current tax provision | | 40 | | | — | |
| Deferred tax benefit: | | | | |
| U.S. Federal | | (273) | | | — | |
| State and local | | (69) | | | — | |
| Foreign | | — | | | — | |
| Total deferred tax benefit | | (342) | | | — | |
| Income tax benefit | | $ | (302) | | | $ | — | |
The reconciliation between the statutory federal income tax rate and the effective income tax rate for the years ended December 31, 2023 and 2022, are as follows:
| | | | | | | | | | | | | | |
| | For the Years Ended December 31, |
| | 2023 | | 2022 |
| Income tax - at U.S. statutory tax rate | | 21.0 | % | | — | % |
| State and local taxes - net of federal | | 3.3 | % | | — | % |
| Nondeductible officer compensation | | (7.5) | % | | — | % |
| Tax credits | | — | % | | — | % |
| Valuation allowance | | (15.5) | % | | — | % |
| Other | | (0.9) | % | | — | % |
| Effective rate of tax | | 0.4 | % | | — | % |
In addition to the US federal statutory income tax rate, significant recurring items that affect the Company’s income tax rate are state and local income taxes, nondeductible officer compensation, and change in valuation allowance recognition.
The components of the total net deferred tax assets and liabilities as of December 31, 2023 and 2022, consisted of the following:
| | | | | | | | | | | | | | |
| | As of December 31, |
| $s in thousands | | 2023 | | 2022 |
| Deferred tax assets: | | | | |
| Partnership | | $ | 17,750 | | | $ | — | |
| Stock compensation | | 6,282 | | | — | |
| Interest expense limitation - 163(j) | | 5,690 | | | — | |
| Net operating losses | | 21,400 | | | — | |
| Other | | 743 | | | — | |
| Total deferred tax assets | | 51,865 | | | — | |
| Valuation allowance for deferred tax assets | | (51,523) | | | — | |
| Net deferred tax assets | | 342 | | | — | |
| Deferred tax liabilities: | | | | |
| Intangibles - Ignis | | (342) | | | — | |
| Total deferred tax liabilities | | (342) | | | — | |
| Net deferred tax assets (liabilities) | | $ | — | | | $ | — | |
The total deferred tax liability presented in the financial statements as of December 31, 2023 is subject to certain significant estimates. The valuation allowance recorded as of December 31, 2023 is reliant on the scheduling of future taxable income. This is highly subjective in nature and may materially change within the next 12 months.
As of December 31, 2023, the Company had $81.2 million of federal net operating loss carryforwards available, and all have an unlimited carryforward period. Future federal NOL utilization is limited to 80% of taxable income on an annual basis. As of December 31, 2023, the Company had $81.2 million of state net operating loss carryforwards available. As of December 31, 2023, the Company had $21.6 million of interest expense limitation available, and all of the limitation has an unlimited carryforward period. Future interest expense utilization is limited to 30% of taxable income on an annual basis.
Due to uncertainty regarding future utilization, a valuation allowance has been recorded in respect of all federal and state deferred tax assets, inclusive of federal and state net operating loss carryforwards and state credit carryforwards. The Company has a valuation allowance of $51.5 million as of December 31, 2023 due to management’s determination that it is more likely than not that the benefit of such loss and credit carryforwards will not be fully realized.
NOTE 23 – EARNINGS (LOSS) PER SHARE
Earnings (loss) per share of Common Stock is calculated in accordance with ASC 260, Earnings per share. Earnings (loss) per share – Basic is calculated by dividing net income (loss) attributable to Common Stockholders by the weighted-average shares of Common Stock outstanding.
Earnings (loss) per share – Diluted is based on the average number of shares of Common Stock used for the Earnings (loss) per share - Basic calculation, adjusted for the weighted-average number of common share equivalents outstanding for the period determined using the treasury stock method and if-converted method, as applicable. Earnings (loss) attributable to Common Stockholders – Basic and Diluted is adjusted for the impact of changes in the fair value of the Public Warrants and Private Placement Warrants, to the extent they are dilutive.
Earnings (loss) per share calculations for all periods prior to the Closing have been retrospectively adjusted by the Exchange Ratio for the equivalent number of shares outstanding immediately after the Closing to effect the reverse recapitalization. Subsequent to the Closing, earnings (loss) per share is calculated based on the weighted average number of Common Stock outstanding.
The following table sets forth the computation of the Company’s earnings (loss) per share:
| | | | | | | | | | | | | | |
| | For the years ended December 31, |
| ($s in thousands, except per share amounts) | | 2023 | | 2022 |
| Net loss | | $ | (77,358) | | | $ | (42,125) | |
| Adjustments to Net loss: | | | | |
| Series A Preferred Stock—adjustment for deemed dividend upon Closing | | (48,300) | | | — | |
| Legacy Bridger Series A Preferred Shares—adjustment for redemption, extinguishment and accrued interest | | — | | | (85,663) | |
| Legacy Bridger Series C Preferred Shares - adjustment to maximum redemption value | | — | | | (202,689) | |
| Series A Preferred Stock—adjustment to eliminate 50% multiplier | | 156,363 | | | — | |
| Series A Preferred Stock—adjustment to maximum redemptions value | | (22,181) | | | — | |
| Earnings (loss) attributable to Common Stockholders – Basic and Diluted | | $ | 8,524 | | | $ | (330,477) | |
| | | | |
| Weighted average Common Stock outstanding—Basic | | 45,269,201 | | | 40,287,478 | |
| Weighted average effect of dilutive securities: | | | | |
| Series A Preferred Stock | | 32,258,180 | | | — | |
| Unvested Restricted Stock Units | | 540,713 | | | — | |
| Unvested Legacy Bridger Incentive Units | | 38,800 | | | — | |
| Sponsor Earnout Shares | | 801,123 | | | — | |
| Weighted average Common Stock outstanding - Diluted | | 78,908,017 | | | 40,287,478 | |
| | | | |
| Earnings (loss) per share - Basic | | $ | 0.19 | | | $ | (8.20) | |
| Earnings (loss) per share - Diluted | | $ | 0.11 | | | $ | (8.20) | |
The following table summarizes the potentially dilutive common shares that were excluded from diluted Earnings (loss) per share - Diluted computations because the effect would have been anti-dilutive:
| | | | | | | | | | | | | | |
| | For the years ended December 31, |
| | 2023 | | 2022 |
| Legacy Bridger Series C Preferred Shares | | — | | 25,611,505 |
| Public Warrants | | 17,249,874 | | — |
| Private Placement Warrants | | 9,400,000 | | — |
| Unvested Legacy Bridger Incentive Units | | — | | 242,424 |
NOTE 24 – SUBSEQUENT EVENTS
The Company evaluated its activities through the issuance date of the filing of the Consolidated Financial Statements.
In January 2024, we entered into a sales agreement with Stifel, Nicolaus & Company, Incorporated (“Stifel”) and Virtu Americas LLC (“Virtu”) under which we could offer and sell shares of our Common Stock having an aggregate offering proceeds of up to $100.0 million. From January 26, 2024 through the date of this filing, we sold an aggregate of 33,798 shares of common stock at a weighted-average price of $5.13 per share for net proceeds of $0.2 million, net of fees of $5,000.
ITEM 9. CHANGES IN AND DISAGREEMENTS WITH ACCOUNTANTS ON ACCOUNTING AND FINANCIAL DISCLOSURE.
None.
ITEM 9A. CONTROLS AND PROCEDURES.
Evaluation of Disclosure Controls and Procedures
Disclosure controls are procedures that are designed with the objective of ensuring that information required to be disclosed in our reports filed under the Exchange Act, such as this Annual Report on Form 10-K, is recorded, processed, summarized, and reported within the time period specified in the SEC’s rules and forms. Disclosure controls are also designed with the objective of ensuring that such information is accumulated and communicated to our management, including the chief executive officer and chief financial officer, as appropriate to allow timely decisions regarding required disclosure. Our management evaluated, with the participation of our current chief executive officer and chief financial officer (our “Certifying Officers”), the effectiveness of our disclosure controls and procedures as of December 31, 2023, pursuant to Rule 13a-15(b) under the Exchange Act. Based upon that evaluation, our Certifying Officers concluded that our disclosure controls and procedures were not effective as of December 31, 2023, due to the material weaknesses described below.
We do not expect that our disclosure controls and procedures will prevent all errors and all instances of fraud. Disclosure controls and procedures, no matter how well conceived and operated, can provide only reasonable, not absolute, assurance that the objectives of the disclosure controls and procedures are met. Further, the design of disclosure controls and procedures must reflect the fact that there are resource constraints, and the benefits must be considered relative to their costs. Because of the inherent limitations in all disclosure controls and procedures, no evaluation of disclosure controls and procedures can provide absolute assurance that we have detected all our control deficiencies and instances of fraud, if any. The design of disclosure controls and procedures also is based partly on certain assumptions about the likelihood of future events, and there can be no assurance that any design will succeed in achieving its stated goals under all potential future conditions.
Management’s Report on Internal Controls over Financial Reporting
Our management is responsible for establishing and maintaining adequate internal control over financial reporting as defined in Rules 13a-15(f) and 15(d)-15(f) under the Exchange Act. All internal control systems, no matter how well designed and operated, have inherent limitations. Therefore, even systems or system components which are deemed to be effective can provide only reasonable assurance with respect to financial statement preparation and presentation. Our management conducted an assessment of the effectiveness of the Company’s internal control over financial reporting as of December 31, 2023, based on criteria established in Internal Control-Integrated Framework (2013) issued by the Committee of Sponsoring Organizations of the Treadway Commission. Based on that assessment, our management has concluded that our internal control over financial reporting was not effective as of December 31, 2023, due to the material weaknesses described below.
Under standards established by the Public Company Accounting Oversight Board, a material weakness is a deficiency or combination of deficiencies, in internal control over financial reporting such that there is a reasonable possibility that a material misstatement of our annual or interim financial statements will not be prevented or detected on a timely basis. During the audit of our financial statements, for the fiscal years ended December 31, 2023 and 2022, we and our independent registered public accounting firm identified three material weaknesses, which are described below.
Material Weaknesses: We have identified material weaknesses in our internal control over financial reporting. The first material weakness is related to properly accounting for complex transactions, especially related to merger and acquisition activity, within our financial statement closing and reporting process. The second material weakness arises from our failure to design and maintain effective IT general controls over the IT systems used within the processing of key financial transactions. Specifically, we did not design and maintain user access controls to ensure appropriate segregation of duties and that adequately restrict user and privileged access to financial applications, programs, and data to appropriate company personnel. Within the same material weakness, we have also failed to maintain adequate documentation around the process of implementing new software solutions. Lastly, we identified a third material weakness in our internal control over financial reporting related to the period-end account reconciliation and financial statement review controls which did not operate within a sufficient level of precision.
Remediation Plan: We have begun the process of, and are focused on, designing and implementing effective internal controls measures to improve our internal control over financial reporting and remediate the material weaknesses, including:
•the recruitment of additional personnel with extensive knowledge of GAAP, implementation of software to facilitate the accumulation and review of our financial information, and utilization of third party consultants and specialists to supplement our internal resources, as well as implementing processes and controls to segregate key functions within our finance systems, as appropriate;
•designing and following a formalized control plan related to IT general controls, including controls related to developing, implementing, and managing access to and implementing financially significant systems within our IT environment; and
•engaging internal and external resources to assist with the design and evaluation of internal controls and the remediation of deficiencies, as necessary.
While these actions and planned actions are subject to ongoing management evaluation and will require validation and testing of the design and operating effectiveness of internal controls over a sustained period of financial reporting cycles, we are committed to the continuous improvement of our internal control over financial reporting and will continue to diligently review our internal control over financial reporting.
Although we plan to complete this remediation process as quickly as possible, we are unable, at this time, to estimate how long it will take and our efforts may not be successful in remediating the identified material weaknesses. In addition, even if we are successful in strengthening our controls and procedures, we can give no assurances that in the future such controls and procedures will be adequate to prevent or identify errors or irregularities or to facilitate the fair preparation and presentation of our consolidated financial statements.
Attestation Report of the Registered Public Accounting Firm
This Annual Report does not include an attestation report of our registered public accounting firm on management’s report on internal controls over financial reporting, as provided by an exception in Item 308 of Regulation S-K established for emerging growth companies. under the JOBS Act of 2012.
ITEM 9B. OTHER INFORMATION.
During the three months ended December 31, 2023, none of our directors or officers, as defined in Rule 16a-1(f) of the Exchange Act, has informed us of the adoption or termination of a “Rule 10b5-1 trading arrangement” or a “non-Rule 10b5-1 trading arrangement,” each as defined in Item 408 of Regulation S-K.
ITEM 9C. DISCLOSURE REGARDING FOREIGN JURISDICTIONS THAT PREVENT INSPECTIONS.
Not applicable.
PART III
ITEM 10. DIRECTORS, EXECUTIVE OFFICERS AND CORPORATE GOVERNANCE.
The information required by this Item of Form 10-K will be included in our definitive proxy statement (the “Proxy Statement”) to be filed with the SEC in connection with the solicitation of proxies for our 2024 Annual Meeting of Stockholders and is incorporated herein by reference. The Proxy Statement will be filed with the SEC within 120 days after the end of the fiscal year to which this Annual Report on Form 10-K relates.
ITEM 11. EXECUTIVE COMPENSATION.
The information required by this Item will be set forth in the Proxy Statement and is incorporated herein by reference.
ITEM 12. SECURITY OWNERSHIP OF CERTAIN BENEFICIAL OWNERS AND MANAGEMENT AND RELATED STOCKHOLDER MATTERS.
The information required by this Item will be set forth in the Proxy Statement and is incorporated herein by reference.
ITEM 13. CERTAIN RELATIONSHIPS AND RELATED TRANSACTIONS, AND DIRECTOR INDEPENDENCE.
The information required by this Item will be set forth in the Proxy Statement and is incorporated herein by reference.
ITEM 14. PRINCIPAL ACCOUNTANT FEES AND SERVICES.
The information required by this Item will be set forth in the Proxy Statement and is incorporated herein by reference.
PART IV
ITEM 15. EXHIBIT AND FINANCIAL STATEMENT SCHEDULES.
(a)The following documents are filed as part of this Annual Report on Form 10-K:
1.Financial Statements: Consolidated Financial Statements filed as part of this report are listed under Part II, Item 8 of this Form 10-K.
2.Financial Statement Schedules: No schedules are required because either the required information is not present or not present in amounts sufficient to require submission of the schedule, or because the information required is included in the Consolidated Financial Statements thereto filed as a part of this Form 10-K.
3.The exhibits listed in the “Exhibit Index” below to this Annual Report on Form 10-K are incorporated herein by reference or are filed with this Annual Report on Form 10-K, in each case as indicated therein (numbered in accordance with Item 601 of Regulation S-K).
| | | | | | | | |
Exhibit Number | | Description |
| | |
| 2.1+ | | Agreement and Plan of Merger, dated August 3, 2022, by and among Jack Creek Investment Corp., Wildfire New PubCo, Inc., Wildfire Merger Sub 1, Inc., Wildfire Merger Sub II, Inc., Wildfire Merger Sub III, LLC, Wildfire GP Sub IV, LLC, BTOF (Grannus Feeder) - NQ L.P. and Legacy Bridger. (incorporated by reference to Exhibit 2.1 of the Company’s Registration Statement on Form S-4 (File No. 333-266840), filed with the SEC on August 12, 2022). |
| | |
| 3.1 | | |
| | |
| 3.2 | | |
| | |
| 4.1 | | |
| | |
| 4.2 | | |
| | |
| 4.3 | | |
| | |
| 10.1 | | |
| | |
| 10.2 | | |
| | |
| 10.3 | | |
| | |
| 10.4# | | |
| | |
| 10.5# | | |
| | |
| | | | | | | | |
Exhibit Number | | Description |
| | |
| 10.6# | | |
| | |
| 10.7# | | |
| | |
| 10.8# | | |
| | |
| 10.9++# | | |
| | |
| 10.10 | | |
| | |
| 10.11++ | | |
| | |
| 10.12++ | | |
| | |
| 10.13++ | | |
| | |
| 10.14 | | Amended and Restated Loan Agreement, dated as of July 1, 2022, by and among Gallatin County, Montana and Bridger Aerospace Group, LLC, Bridger Air Tanker, LLC, Bridger Air Tanker 3, LLC, Bridger Air Tanker 4, LLC, Bridger Air Tanker 5, LLC, Bridger Air Tanker 6, LLC, Bridger Air Tanker 7, LLC, Bridger Air Tanker 8, LLC, Bridger Solutions International 1, LLC and Bridger Solutions International 2, LLC (incorporated by reference to Exhibit 10.11 of the Company’s Registration Statement on Form S-4 (File No. 333-266840), filed with the SEC on August 12, 2022). |
| | |
| 10.15 | | Second Amended and Restated Loan Agreement, dated as of August 1, 2022, by and among Gallatin County, Montana and Bridger Aerospace Group, LLC, Bridger Air Tanker, LLC, Bridger Air Tanker 3, LLC, Bridger Air Tanker 4, LLC, Bridger Air Tanker 5, LLC, Bridger Air Tanker 6, LLC, Bridger Air Tanker 7, LLC, Bridger Air Tanker 8, LLC, Bridger Solutions International 1, LLC and Bridger Solutions International 2, LLC (incorporated by reference to Exhibit 10.12 of the Company’s the Registration Statement on Form S-4 (File No. 333-266840), filed with the SEC on August 12, 2022). |
| | |
| 10.16 | | |
| | |
| 10.17 | | |
| | |
| 10.18 | | |
| | |
| | | | | | | | |
Exhibit Number | | Description |
| | |
| 10.19 | | |
| | |
| 10.20 | | |
| | |
| 10.21 | | |
| | |
| 10.22 | | |
| | |
| 10.23 | | |
| | |
| 10.24 | | |
| | |
| 10.25 | | |
| | |
| 10.26 | | |
| | |
| 10.27 | | |
| | |
| 10.28 | | |
| | |
| 10.29 | | |
| | |
| 10.30++ | | |
| | |
| 10.31++ | | |
| | |
| | | | | | | | |
Exhibit Number | | Description |
| | |
| 10.32++ | | |
| | |
| 10.33++ | | |
| | |
| 10.34++ | | |
| | |
| 10.35++ | | |
| | |
| 10.36++ | | |
| | |
| 10.37++ | | |
| | |
| 10.38++ | | |
| | |
| 10.39 | | |
| | |
| 10.40 | | |
| | |
| 10.41*+ | | |
| | |
| 10.42* | | |
| | |
| 17.1 | | |
| | |
| 21.1* | | |
| | |
| 31.1* | | |
| | |
| 31.2* | | |
| | |
| 32.1** | | |
| | |
| 97.1* | | |
| | |
| | | | | | | | |
Exhibit Number | | Description |
| | |
| 101.INS* | | XBRL Instance Document – the instance document does not appear in the Interactive Data File because its XBRL tags are embedded within the Inline XBRL document |
| | |
| 101.SCH* | | Inline XBRL Taxonomy Extension Schema Document |
| | |
| 101.CAL* | | Inline XBRL Taxonomy Extension Calculation Linkbase Document |
| | |
| 101.DEF* | | Inline XBRL Taxonomy Extension Definition Linkbase Document |
| | |
| 101.LAB* | | Inline XBRL Taxonomy Extension Label Linkbase Document |
| | |
| 101.PRE* | | Inline XBRL Taxonomy Extension Presentation Linkbase Document |
| | |
| 104* | | Cover Page Interactive Data File (formatted in Inline XBRL and contained in Exhibit 101) |
* Filed herewith.
** Furnished herewith.
+ Schedules and exhibits have been omitted pursuant to Item 601(a)(5) of Regulation S-K. Bridger Aerospace Group Holdings, Inc. agrees to furnish supplementally a copy of any omitted schedule or exhibit to the SEC upon request.
++ Portions of this exhibit have been redacted pursuant to Item 601(b)(10)(iv) of Regulation S-K.
# Indicates management contract or compensatory plan.
ITEM 16. FORM 10-K SUMMARY.
None.
SIGNATURES
Pursuant to the requirements of Section 13 or 15(d) of the Securities Exchange Act of 1934, the registrant has duly caused this report to be signed on its behalf by the undersigned, thereunto duly authorized, on the 20th day of March, 2024.
| | | | | | | | | | | |
| BRIDGER AEROSPACE GROUP HOLDINGS, INC. |
| | | |
| By: | | /s/ Timothy Sheehy |
| Name: | | Timothy Sheehy |
| Title: | | Chief Executive Officer |
Pursuant to the requirements of the Securities Exchange Act of 1934, this Annual Report on Form 10-K has been signed by the following persons in the capacities and on the dates indicated:
| | | | | | | | | | | | | | |
| Signatures | | Title | | Date |
| | | | |
| /s/ Timothy Sheehy | | Chief Executive Officer and Director (Principal Executive Officer) | | March 20, 2024 |
| Timothy Sheehy | | |
| | | | |
| /s/ Eric Gerratt | | Chief Financial Officer (Principal Accounting and Financial Officer) | | March 20, 2024 |
| Eric Gerratt | | |
| | | | |
| /s/ Jeffrey Kelter | | Director and Non-Executive Chairman of the Board | | March 20, 2024 |
| Jeffrey Kelter | | |
| | | | |
| /s/ Elizabeth Fascitelli | | Director | | March 20, 2024 |
| Elizabeth Fascitelli | | |
| | | | |
| /s/ Anne Hayes | | Director | | March 20, 2024 |
| Anne Hayes | | |
| | | | |
| /s/ Dean Heller | | Director | | March 20, 2024 |
| Dean Heller | | |
| | | | |
| /s/ Todd Hirsch | | Director | | March 20, 2024 |
| Todd Hirsch | | |
| | | | |
| /s/ Wyman Howard | | Director | | March 20, 2024 |
| Wyman Howard | | |
| | | | |
| /s/ McAndrew Rudisill | | Chief Investment Officer and Director | | March 20, 2024 |
| McAndrew Rudisill | | |
| | | | |
| /s/ Robert Savage | | Director | | March 20, 2024 |
| Robert Savage | | |
| | | | |
| /s/ David Schellenberg | | Director | | March 20, 2024 |
| David Schellenberg | | |
| | | | |
| /s/ Matthew Sheehy | | Director | | March 20, 2024 |
| Matthew Sheehy | | |
EXECUTION VERSION
SERVICES AGREEMENT
Dated as of the 17th day of November, 2023, by and between
Bridger Aerospace Group Holdings, Inc. and
Bridger Aerospace Europe, S.L.U., concerning the aircraft set forth on Exhibit A hereto
4890-0048-8592
This Services Agreement (“Agreement”), is entered into as of November 17, 2023 (the “Effective Date”) by and between Bridger Aerospace Group Holdings, Inc., a Delaware corporation (“Bridger”), and Bridger Aerospace Europe, S.L.U., a sociedad de responsabilidaed limitada organized under the laws of Spain (“Owner”). Bridger and Owner may be referred to herein individually as a “Party” and collectively as the “Parties.”
WHEREAS, Owner owns those aircraft described on Exhibit A attached hereto (each, an “Aircraft”, and, collectively, the “Aircraft”); and
WHEREAS, Owner and Bridger desire to enter into this Agreement to address, among other things, terms and conditions as to the retrofit, operation, maintenance, lease, purchase, and exclusivity obligations as to all of the Aircraft, in addition to certain other terms and conditions.
NOW, THEREFORE, in consideration of the mutual covenants and understandings contained herein, the Parties agree as follows:
SECTION 1
Lease
1.1Lease. With respect to each Aircraft, at the request of Owner at any time and from time to time, but no earlier than 90 days prior to the anticipated date that such Aircraft is equipped to be flown in revenue service for aerial firefighting purposes, Owner and Bridger shall negotiate in good faith for the entry into an operating lease with respect to the applicable Aircraft, together with all equipment, attachments, accessories and parts as may be installed thereon or appurtenant thereto from time to time, on the terms and subject to the conditions set forth on Exhibit B hereto (the “Lease Terms”) and otherwise containing such other customary terms and conditions for aircraft leases of this type and as to similar aircraft and otherwise as reasonably satisfactory to Owner (each, an “Operating Lease”); provided, however, that, as to each Aircraft, Owner and Bridger shall enter into an Operating Lease no later than the date such Aircraft is to be first operated. With respect to each Aircraft, during the term of this Agreement and at any time that an Operating Lease is not then in effect with respect to such Aircraft, Bridger agrees to hold such Aircraft as Owner’s bailee for the sole benefit of Owner. Substantially concurrently with the entry into any Operating Lease, the Parties shall cooperate in good faith to amend this Agreement as may be required in order to appropriately reflect the terms of such Operating Lease.
SECTION 2
Operation, Retrofitting and Management of Aircraft
2.1Commencement of Obligations. Bridger acknowledges and agrees that its obligations under this Section 2 with respect to the Aircraft shall commence as of the date the Aircraft are delivered by The Ministry for Ecological Transition and the Demographic Challenge (“MITECO”).
2.2Operation of Aircraft. For so long as this Agreement is in effect with respect to any Aircraft, Bridger shall not operate such Aircraft at any time that an Operating Lease is not then in effect with respect thereto other than any ferry flight, the purpose of which is to deliver such Aircraft to a third- party that is either (x) providing maintenance, repair or storage services pursuant to a Key Contract (as defined herein) or (y) to a third-party that is retained to perform the Work (defined below) in accordance with this Agreement. In all cases, the use and operational control of an Aircraft, other than as explicitly set out in this Section 2.2, shall be governed by the terms and subject to the conditions set forth in the
applicable Operating Lease and the Key Contracts relating to such Aircraft or as otherwise mutually agreed upon in writing by the Parties.
2.1Retrofit and Return to Service Process.
2.1.1The Parties acknowledge that the Aircraft are not currently equipped to be flown in revenue service for aerial firefighting purposes. Bridger (or an affiliate) shall be responsible for retrofitting each Aircraft to conform to the configuration as agreed to by Owner and to return such Aircraft to service for aerial firefighting purposes in accordance with applicable laws and in accordance with a scope of work plan in respect of the retrofit of each Aircraft for the following services: (i) C Check, including the maintenance, repair and overhaul of the airframe; (ii) maintenance, repair and overhaul of landing gears (nose and main); (iii) maintenance, repair and/or replacement of rotables, tires, seals, propellors, cockpit gauges and flight controls including any necessary testing for functionality and serviceability; (iv) Non-Destructive Testing of materials; and (v) overhaul of four (4) Pratt & Whitney PW123AF engines including full assembly and testing of operating conditions and airworthiness (as may be amended, modified or supplemented by mutual agreement of the Parties) (collectively, the “Work”). Bridger shall not cause, authorize or permit any Work to be performed on any of the Aircraft without the prior written consent of Owner (in its sole and absolute discretion).
2.1.2Bridger shall contract with one or more certified aircraft repair facilities reasonably acceptable to Owner to perform the Work. Bridger shall negotiate in good faith with qualified service providers as to proposed service contracts for the performance of the Work, and shall keep Owner reasonably informed, on a current and prompt basis, as to any material developments as to the negotiations and drafts of such proposed service contracts, and shall provide to Owner (a) a copy of the proposed service contracts for each Aircraft (including all exhibits, schedules, and ancillary document and agreements in connection therewith) reasonably in advance of the proposed execution thereof and
(b) a reasonable opportunity to review and comment thereon (which comments Bridger shall review and incorporate therein). Any such service contract entered into in full compliance with the foregoing shall be deemed a “Retrofit Contract”, and, collectively, shall be deemed, the “Retrofit Contracts”. Without the prior written consent of Owner, Bridger shall not, directly or indirectly, enter into, materially amend, materially modify, terminate, waive any material right under or waive any default under, any Retrofit Contract; provided, however, that after receiving Owner’s written consent to enter into any Retrofit Contract and beginning the Work, Bridger may enter into any change orders or other modifications to any Retrofit Contract so long as such change order or modification would neither (i) increase the aggregate annual expenditures under such Retrofit Contract by more than ten percent (10%) nor (ii) exceed the aggregate Retrofitting Costs for the applicable Aircraft set forth in the Retrofit Budget. Bridger shall perform its obligations under each Retrofit Contract in accordance with the terms thereof and shall notify Owner promptly in the event of any breach, default or dispute (or anticipated breach, default or dispute) under any Retrofit Contract.
2.1.3Notwithstanding anything in the foregoing to the contrary, without the prior written consent of, or unless otherwise directed by, Owner, as to Aircraft 3 and Aircraft 4, Bridger shall not cause, authorize or permit any material Work to be performed until Bridger has acquired Aircraft 1
and Aircraft 2 from Owner pursuant to the terms of Section 3.1 below or Owner has otherwise sold or disposed of Aircraft 1 and Aircraft 2.
2.1.4Owner shall be responsible for reimbursing Bridger for all costs and expenses incurred in connection with the Work, including amounts payable pursuant to each Retrofit Contract and expenses incurred by Bridger (or its affiliates) in connection therewith, in each case, solely to the extent set forth in, and pursuant to the applicable line item amounts of, the Retrofit Budget (collectively, the “Retrofitting Costs”). Bridger shall provide Owner with invoices for all Retrofitting Costs, together with reasonable and appropriate supporting documentation, in respect of each calendar month, within ten (10) business days of the end of such calendar month, provided that any invoices in respect of such month that are received by Bridger after such ten (10) business day period shall be included in the following month’s request. Within fifteen (15) business days of receipt of such invoices (subject to the timely delivery thereof pursuant to the immediately preceding sentence), Owner shall pay or cause to be paid to Bridger the aggregate amount of such Retrofitting Costs that are not being disputed pursuant to the following sentence; provided, that, Owner may delay any such payments to the extent they do not exceed
$100,000. Notwithstanding anything to the contrary herein, Owner shall have the right to (a) offset against any Retrofitting Costs owed to Bridger any amounts due to Owner and unpaid pursuant to this Agreement or any Operating Lease, including any Damages owed pursuant to Section 2.8 and (b) dispute any invoice (or component thereof) for any Retrofitting Cost that Owner reasonably believes to have been incurred in breach or violation of the terms of this Agreement or to be inconsistent with the Retrofit Budget.
2.1.5Bridger shall prepare an estimated quarterly budget (the “Retrofit Budget”) for Retrofitting Costs to be incurred in each fiscal quarter (or partial quarter) during the term of this Agreement and shall submit each such Retrofit Budget to Owner no later than 30 calendar days prior to the commencement of the applicable fiscal year of Bridger. Owner shall have the right to approve the amounts set forth in the Retrofit Budget, and Bridger shall not be entitled to reimbursement for any items not contained in an approved Retrofit Budget (other than in connection with any variance to the Retrofit Contract, as set forth in Section 2.3.2). In the event the Parties fail to agree to any Retrofit Budget, the most recent Retrofit Budget approved by Owner pursuant to this Section 2.3.5 shall continue to govern. 2.2Flight Operations; Key Contracts.
2.1.1Once the Work with respect to an Aircraft has been completed and such Aircraft has been returned to revenue service in accordance with the terms and conditions of this Agreement (including the requirement to execute and deliver an Operating Lease with respect to such Aircraft pursuant to Section 1 hereof), Bridger may deploy each Aircraft for aerial firefighting solely pursuant to the terms of Key Contracts (as defined herein) entered into in accordance with Section 2.4.2.
2.1.2Bridger shall provide to Owner (a) a draft copy of each proposed contract (including all exhibits, schedules, and ancillary documents and agreements in connection therewith) in respect of any Aircraft that would involve the payment by Bridger or any of its affiliates of $100,000 or more in any fiscal year (including in respect of the deployment, maintenance, storage, and insurance thereof but excluding any Retrofit Contract, which shall be governed by Section 2.3.2), reasonably in advance of the proposed execution thereof and (b) a reasonable opportunity to review and comment thereon (which comments Bridger shall review and incorporate therein). Any such contract entered into in full compliance with the foregoing shall be deemed a “Key Contract”, and, collectively, shall be
deemed, the “Key Contracts”. Each Key Contract shall provide that: (i) Owner shall be a third party beneficiary of the rights of Bridger thereunder, with a specific right of enforcement and (ii) such Key Contract shall be assignable by Bridger to Owner without any consent of, or notice to, the counterparty thereto, at any time that the Aircraft that is the subject of such Key Contract is owned by Owner at the time of such assignment. Without the prior written consent of Owner, Bridger shall not, directly or indirectly, enter into, materially amend, materially modify, terminate, waive any material right under or waive any default under, any Key Contract. Bridger shall perform its obligations under each Key Contract in accordance with the terms thereof and shall notify Owner promptly in the event of any breach, default or dispute (or anticipated breach, default or dispute) under any Key Contract.
2.1.3Bridger shall cause each flight crew assigned to an Aircraft to be fully trained and qualified for the operation of the Aircraft and to meet all requirements under applicable laws. All such flight crews shall be agents of or employees of Bridger or one of its subsidiaries and Bridger shall exercise sole control and supervision over all flight crews, and Bridger shall be responsible for and liable for any action or inaction of any such party (for the avoidance of doubt, any Damages related thereto that are indemnified by Bridger pursuant to Section 2.8.1 shall be subject to the other terms and limitations set forth in Section 2.8).
2.1.4At any time that an Aircraft is deployed, Bridger shall cause to be maintained flight log books showing the full flight time of the Aircraft and shall keep such logs in the Aircraft and available for inspection by Owner or its representatives at all reasonable times.
2.1.5Any revenue received by Bridger from deployment of an Aircraft shall be the sole and exclusive property of Bridger.
2.3Maintenance and Operating Costs.
2.1.1Bridger shall (a) take all requisite steps to maintain and keep the Aircraft in good repair and in an airworthy operating condition, (b) maintain in full force and effect all approvals, consents, licenses, permits and other authorizations of any governmental or regulatory authority applicable to the Aircraft and required to maintain, store, operate and/or deploy the Aircraft and (c) cause all maintenance and repair work to be performed in compliance with applicable laws and by persons duly licensed to do such work, which may include employees of Bridger or its affiliates and in each case, in the same manner and with the same degree of care as a reasonable and prudent operator of similar aircraft. Except as previously approved in writing by Owner (in its sole and absolute discretion) in a Retrofit Budget, under no circumstance shall Bridger transfer, sell, remove or otherwise encumber any engine of any Aircraft (including but not limited to an engine swap) without the prior written consent of Owner. If at any time any Aircraft (i) is not in revenue service or (ii) is not receiving maintenance, repair, overhaul or retrofit services pursuant to the terms of this Agreement, such Aircraft shall be held in accordance with an approved storage plan pursuant to a Key Contract.
2.1.2Other than the costs and expenses incurred in connection with the Work (solely to the extent set forth in, and pursuant to the applicable line item amounts of, the Retrofit Budget), Bridger shall be responsible for, and shall pay on a current basis, all costs and expenses related to the maintenance, repair and operation of each Aircraft, including but not limited to the following: flight crew, flight crew training (initial, re-current or otherwise), crew per diem while performing duties in conjunction with an Aircraft, hangar rent, insurance costs (as described in this Agreement), airframe &
avionics maintenance (including labor and parts), engine maintenance, engine reserves or other such engine, airframe, or avionics program costs, computerized maintenance tracking program subscriptions, landing fee, parking, ramp fee, crew transportation, transient hangar, de-icing, flight related trip expenses, chart subscriptions, avionics database subscriptions, fuel research program subscriptions, catering expenses, jet fuel, cleaning, and stocking, compliance (including compliance with all airworthiness directives, mandatory service bulletins, alert service bulletins and mandatory orders), registration and importation.
2.4Reimbursements.
2.1.1Notwithstanding anything to the contrary in this Agreement, as to any service or item the cost of which Owner is required to reimburse Bridger under this Agreement (whether by offset or otherwise), Owner may elect to provide or arrange to provide such service or item, provided that such service or item has a substantially similar quality or service level (to be determined by Owner in its reasonable discretion), in order to permit Owner to reduce its costs.
2.1.2Notwithstanding anything to the contrary in this Agreement, Bridger shall use commercially reasonable efforts to minimize costs incurred by it if such costs would be reimbursable by Owner to Bridger in accordance with the terms of this Agreement (whether by offset or otherwise). In connection therewith, Bridger shall use commercially reasonable efforts to cooperate with Owner to identify opportunities to manage expenses relating to the Aircraft.
2.1.3Bridger and Owner acknowledge and agree that Owner’s remittance obligations are not intended to be duplicative and as such, in the event of any unintended duplication of payments by Owner from time to time pursuant to this Section 2.6 or pursuant to any other provision of this Agreement to the extent relating to Retrofitting Costs, Owner and Bridger shall work together in good faith to remedy such duplication by crediting Owner’s future payment obligations under this Agreement (whether or not arising pursuant to this Section 2.6) against the aggregate amount of such duplicated payments.
2.5Insurance.
2.1.1Except as otherwise provided by an applicable Operating Lease, Bridger shall maintain, or cause to be maintained in effect, at all times during the term of this Agreement, (i) aviation general liability insurance coverage with respect to each Aircraft with minimum limits of $50,000,000.00 per occurrence, and (ii) “all-risk” ground and flight hull insurance on an agreed-value basis for the Aircraft. All insurance policies required under this Section 2.7 (“Required Insurance Policies”) shall name Owner, Marathon Member (as defined below), Avenue Member (as defined below) and Bridger as Insureds or Additional Insureds. The Required Insurance Policies shall, without limitation: (a) be primary without any right of contribution from any insurance maintained by Owner; and (b) shall include at minimum all territories over which the Aircraft will be operated. Bridger shall pay all premiums for all Required Insurance Policies and shall provide Owner with evidence of such policies of insurance, including providing Owner with a certificate of insurance and endorsements on or before the Effective Date and at any time thereafter as Owner may reasonably request. In the event that Bridger shall fail to maintain the Required Insurance Policies as herein provided, Owner may, at its option (and at the sole cost and expense of Bridger), obtain such insurance protecting the interests of Owner and Bridger.
2.6Indemnification; Waiver of Consequential Damages
2.1.1Bridger Indemnification. Bridger shall defend, indemnify and otherwise hold harmless Owner, each of its affiliates, and its and their respective officers, directors, equityholders, partners (general and limited), members, managers, employees, agents, representatives, and each of their respective successors and assigns, as the case may be (each, a “Owner Indemnified Party”), from and against any and all liability of whatever nature, and shall pay to each Owner Indemnified Party upon demand the amount as to any suits, claims, complaints, damages, penalties, fines, expenses, taxes costs and losses, including legal expenses and settlement costs, of whatsoever kind and nature (collectively, “Damages”), imposed on, incurred by or asserted against any Owner Indemnified Party in any way related to or arising from any of the following: (i) any breach or violation of any representation, warranty, covenant or agreement of Bridger in this Agreement and (ii) any other negligent or willful misconduct of Bridger arising out of or in connection with the execution, enforcement, or performance of this Agreement.
2.1.2Owner Indemnification. Owner shall defend, indemnify and otherwise hold harmless Bridger, each of its affiliates, and its and their respective officers, directors, equityholders, partners (general and limited), members, managers, employees, agents, representatives, and each of their respective successors and assigns, as the case may be (each, a “Bridger Indemnified Party”), from and against any and all liability of whatever nature, and shall pay to each Bridger Indemnified Party upon demand, the amount of any Damages actually incurred by a Bridger Indemnified Party, in any way related to or arising from any (i) any breach or violation of any representation, warranty, covenant or agreement of Owner in this Agreement; and (ii) any other negligent or willful misconduct of Owner arising out of or in connection with the execution, enforcement, or performance of this Agreement.
2.1.3Calculation of Damages. The amount of any Damages paid to any Indemnified Party hereunder shall be reduced by the amount of any insurance proceeds or indemnification proceeds from third parties actually received by such Bridger Indemnified Party or Owner Indemnified Party, as applicable (each, an “Indemnified Party”), in respect of such Damages (net of reasonable and out-of- pocket costs of recovery thereof).
2.1.4Limitations on Damages. In no event shall any Party be entitled to recover from any other Party consequential, indirect, special, statutory, exemplary or punitive damages or damages calculated using multiples of revenue or earnings, actual or potential lost profits or diminution in value in connection with this Agreement or any other agreement referenced herein, or the termination or abandonment of any of the transactions contemplated hereby, except to the extent actually paid by an Indemnified Party to a third party. Notwithstanding anything to the contrary in this Agreement, this Agreement shall not limit: (i) any Party from recovering direct damages, including in respect of lost profits or diminution in value but in each case only to the extent constituting direct damages; (ii) any indemnification obligation of Bridger pursuant to the terms of the Purchase Agreement (as defined below) and (iii) any obligation of Bridger to pay the Termination Fee or any other amounts payable pursuant to Section 3.4, when and if due.
2.1.5Indemnification Procedures.
(a)The applicable Indemnified Party shall promptly notify the other (as applicable, the “Indemnifying Party”) of the commencement of any action for which indemnification may be sought
hereunder, but the failure to so timely notify the Indemnifying Party will not relieve the Indemnifying Party from liability hereunder unless and to the extent the Indemnifying Party is materially prejudiced thereby. The Indemnifying Party shall be entitled to assume the defense of any action for which indemnification is sought hereunder with counsel of the Indemnifying Party’s choice at its expense, provided, however, that such counsel shall be reasonably satisfactory to the Indemnified Party (in which case, the Indemnified Party will have the right to employ separate counsel and to participate in the defense of such action at the Indemnifying Party’s expense). Notwithstanding the foregoing, the Indemnifying Party shall not have the right to assume the defense of such action on the Indemnified Party’s behalf and the Indemnified Party will have the right to employ one separate counsel (plus local counsel, if required, in any jurisdiction) for such defense, and the Indemnifying Party shall bear the reasonable fees, costs and expenses of such separate counsel (and local counsel) if (i) the Indemnifying Party shall not have employed counsel reasonably satisfactory to the Indemnified Party within a reasonable time after notice of the institution of such action; (ii) the use of counsel chosen by the Indemnifying Party would present such counsel with a conflict of interest; or (iii) the actual or potential defendants in, or targets of, any such action include both the Indemnifying Party and the Indemnified Party, and the Indemnified Party shall have reasonably concluded that there may be legal defenses available to the Indemnified Party which are different from or additional to those available to the Indemnifying Party. The Indemnifying Party shall not be liable for any settlement of any action for which indemnification is sought hereunder effected without its written consent (not to be unreasonably withheld, conditioned, or delayed).
(b)The Indemnifying Party agrees that it will not, without the prior written consent of the Indemnified Party (which consent shall not be unreasonably withheld, conditioned or delayed), settle any pending or threatened claim or proceeding related to or arising out of this Agreement (whether or not the Indemnified Party or any indemnified party is a party to such claim or proceeding), or otherwise facilitate or participate in any such settlement, unless such settlement includes a provision unconditionally releasing the Indemnified Party and each other indemnified party from all liability in respect of claims by any releasing party related to or arising out of the engagement or any transactions or conduct in connection therewith.
2.7Liens.
2.1.1Bridger shall ensure that no liens, encumbrances, levies or attachments (collectively, the “Liens”) are created or placed against any Aircraft as a result of Bridger’s actions. Bridger shall notify Owner promptly upon learning of any Liens not permitted by these terms.
2.1.2Bridger shall take all such actions as may be necessary to discharge and satisfy in full any such Lien promptly after the same becomes known to it. Owner shall promptly reimburse Bridger for any costs and expenses incurred by Bridger in causing such Liens to be removed.
2.3Taxes; Withholding. Notwithstanding anything to the contrary herein, all Retrofitting Costs, fees for service or other amounts paid or payable by Owner to Bridger as set forth in this Agreement shall be inclusive of any value-added tax or any other tax of a similar nature imposed in a member state of the European Union or imposed in any other jurisdiction in substitution for, or levied in addition to, such value-added tax (including consumption tax, goods and services tax, sales tax and turnover tax) (all such taxes, “VAT”). Bridger agrees to indemnify and keep indemnified Owner against all claims that may be made by the relevant authorities against Owner (or any of its equityholders or
affiliates) in respect of VAT in any jurisdiction (which shall include any penalties, fines or interest on or in respect of such VAT) relating to the services performed pursuant to this Agreement. Bridger shall pay to Owner any amount due to it pursuant to the terms of such indemnity within ten (10) days of a written request. Bridger shall co-operate with Owner and any Affiliate in respect of any tax compliance issue arising in respect hereof and in connection with the same agrees (i) on written request, to provide Owner or any Affiliate with full details of all tax arising in respect hereof, and (ii) to authorize the relevant tax authority to disclose such information to Owner. Notwithstanding anything to the contrary, Owner shall be entitled to, in its sole discretion, deduct and withhold from the amounts otherwise payable pursuant to this Agreement such amounts, if any, as are required to be deducted and withheld under applicable law, and to the extent amounts are so deducted or withheld, such amounts shall be treated for all purposes as having been paid to the Person in respect of which such deduction or withholding was made. In respect of any VAT, in the event of a conflict between the provisions of Section 2.8 and this Section 2.10, this Section 2.10 will govern.
SECTION 3
Purchase Right
3.1First Purchase. At any time during the first eighteen (18) months following the Effective Date (the date of such 18-month anniversary, the “First Purchase Date”, and such eighteen-month period, the “First Purchase Period”), Bridger (or an affiliate thereof) shall have the right, but not the obligation, to purchase both (and only both unless mutually agreed by the Parties) of Aircraft 1 and Aircraft 2 from Owner (the “First Purchase”) for aggregate consideration equal to $40,000,000, by delivery of an irrevocable written notice to Owner on or prior to the First Purchase Date (a “First Purchase Election Notice”). If Bridger fails to deliver a First Purchase Election Notice in accordance with this Section 3.1, all of its rights with respect to each of the First Purchase and the Second Purchase shall terminate, unless otherwise mutually agreed upon by the Parties.
3.2Second Purchase. Solely in the event that Bridger has consummated the First Purchase (unless otherwise mutually agreed by the Parties), Bridger (or an affiliate thereof) shall have the right, but not the obligation, at any time during the first thirty-six (36) months following the Effective Date (the date of such 36-month anniversary, the “Second Purchase Date”, and such 36-month period, the “Second Purchase Period”), to purchase both (and only both, unless mutually agreed upon by the Parties) of Aircraft 3 and Aircraft 4 from Owner (the “Second Purchase”), for aggregate consideration equal to the Second Payment (as defined below), by delivery of an irrevocable written notice to Owner on or prior to the Second Purchase Date (a “Second Purchase Election Notice”). If Bridger fails to deliver a Second Purchase Election Notice in accordance with this Section 3.2, all of its rights with respect to the Second Purchase shall terminate.
“Second Payment” shall mean an amount equal to the greater of (a) the IRR Calculated Price (as defined below) and (b) the MOIC Calculated Price (as defined below).
“IRR Calculated Price” shall mean the sum of (1)(A) the Purchase Price Amount (as defined below), plus (B) the RTS Amount (as defined below), plus (C) the amount accrued commencing as of the Effective Date through the closing date of the Second Purchase at a rate of 22.8% per annum, compounded monthly, on the sum of (1)(A) plus (1)(B), plus (2)(A) the aggregate amount of all Overage, plus (B) the amount accrued commencing as of the date of such costs through the closing date of the Second Purchase at a rate of 22.8% per annum, compounded monthly, on the amount in clause (2)(A),
minus (3) an amount equal to (A) $40,000,000, plus (B) the amount accrued commencing as of the date of the closing date of the First Purchase through the closing date of the Second Purchase at a rate of 22.8% per annum, compounded monthly, on $40,000,000, minus (4) an amount equal to (A) the aggregate amount of payments received by Owner under any Operating Lease, plus (B) the amount accrued commencing as of the date of the applicable Lease Payment through the closing date of the Second Purchase at a rate of 22.8% per annum, compounded monthly, on the amount in clause (4)(A) and, solely in the event that any portion of the RTS Amount in respect of Aircraft 4 has not been spent, minus (5) the difference between (A) the RTS Amount in respect of Aircraft 4 minus (B) the retrofitting costs actually spent in respect of Aircraft 4 as of the closing date of the Second Purchase. An illustrative calculation of the IRR Calculated Price is set forth on Schedule SP.
“MOIC Calculated Price” shall mean the amount necessary to provide Owner a return equal to
(i) 1.5 multiplied by (ii)(A) the portion of the Purchase Price Amount in respect of Aircraft 3 and Aircraft 4 only, plus (B) the portion of the RTS Amount in respect of Aircraft 3 and Aircraft 4 only, plus (C) the portion of the Overage in respect of Aircraft 3 and Aircraft 4 only.
“Purchase Price Amount” means the aggregate amount of purchase price paid by Owner to acquire Aircraft 1, Aircraft 2, Aircraft 3 and Aircraft 4, excluding the implied portion contributed by Bridger, in each case calculated in accordance with the PPA Schedule.
“RTS Amount” means the estimated retrofitting costs in respect of Aircraft 1, Aircraft 2, Aircraft 3 and Aircraft 4, in each case calculated in accordance with the RTS Schedule.
“Overage” means an amount equal to (i) the aggregate amount of all Retrofitting Costs and other costs paid by Owner to Bridger, minus (ii) the RTS Amount.
3.3Documentation. In connection with the First Purchase and the Second Purchase, the Parties shall work together in good faith to negotiate and enter into a purchase agreement and such other documents to effect such purchase that are customary for purchases by lessees on off-lease purchases for such purpose; provided, however, that such purchase agreement: (a) shall contemplate a simultaneous sign and close; (b) shall be conducted on an “as is, where is” basis and without any inspection or aircraft records requirements; (c) shall not be subject to any adjustments as to condition of aircraft; (d) shall not require Owner to make any representations and warranties other than as to ownership, due authorization, no conflicts, validity of agreement and brokers fees and (e) shall provide for an adjustment to the applicable purchase price for any amounts due to Bridger or Owner, respectively, under this Agreement in respect of the Aircraft that are the subject of the First Purchase or the Second Purchase, as applicable, and unpaid as of the closing date of such transaction. Closing of the First Purchase or the Second Purchase shall occur no later than thirty (30) days following the date of delivery of the First Purchase Election Notice or the Second Purchase Election Notice, as the case may be. Upon the consummation of any sale by Owner of any Aircraft (pursuant to Section 3.1, Section 3.2, Section 3.4 or otherwise), this Agreement shall terminate and be of no further force and effect solely with respect to such Aircraft.
3.4Failure to Consummate.
3.1.1In the event that (x) Bridger’s rights with respect to the Second Purchase have terminated in accordance with Section 3.1 or (y) the First Purchase is consummated and either (1) Bridger fails to deliver a Second Purchase Election Notice by the Second Purchase Date in accordance with Section 3.2 or (2) Bridger delivers a Second Purchase Election Notice in accordance with Section
3.2 but the Second Purchase is not consummated, in either case, within fifteen (15) days of the occurrence of any such event described by either (x) or (y) herein, either Party may elect, by delivery of a written notice to the other Party, to commence a good faith sales process to pursue a sale of all of the Aircraft or, solely in respect of the preceding clause (y), Aircraft 3 and Aircraft 4 (as applicable, the “Subject Aircraft”) to a third party (a “Sale Process”). If within fifteen (15) days of the occurrence of any such event (such date, the “Payment Date”), neither Party has elected to pursue a Sale Process and Owner has not otherwise entered into an operating lease with a third party with respect to the Subject Aircraft on terms and conditions satisfactory to Owner, in its sole and absolute discretion, then Bridger shall pay or cause to be paid to Owner the amount set forth in Section 3.4.4(b), unless and solely to the extent that
(i) Owner has confirmed in writing to Bridger that it is delaying the election period to commence a Sale Process, during which delayed period either Party may elect to pursue a Sale Process, or (ii) Owner has waived in writing the obligations of Bridger under this Section 3.4.
3.1.2Bridger shall oversee, manage and facilitate the Sale Process and at all times during the Sale Process shall pursue a sale of the Subject Aircraft in good faith; provided, that Owner shall, and shall cause its representatives to, provide such cooperation and assistance as may be reasonably required in connection therewith, during normal business hours and upon reasonable advance notice (including by provision of confidential information (subject to the execution by the recipients of such information of customary confidentiality agreements) and participation in meetings with and presentations to potential purchasers). Bridger agrees to keep Owner reasonably informed regarding the status of the Sale Process and provide at least weekly updates to Owner with respect thereto; provided, that Bridger shall provide Owner with prompt (and in any event within two (2) Business Days) notice of any material developments with respect to the Sale Process, including regarding any bids for the Subject Aircraft. Bridger shall provide Owner with true and complete copies of any written bids (or, in the case of oral bids, reasonably detailed summaries of the proposed purchase price and other terms and conditions thereof). Notwithstanding anything herein to the contrary, (i) the acceptance of any bid or offer resulting from the Sale Process, and the structuring, negotiation and consummation of any transaction arising from the Sale Process, including any Consummated Sale (as defined below), shall occur in the sole and absolute discretion of the Owner and (ii) any Sale Process pursued by Bridger shall not in any way limit or restrict Owner’s rights to otherwise sell or dispose of the Subject Aircraft, or to entertain, solicit, accept or negotiate with third parties with regards to any such sale, pursuant to Section
3.1herein.
3.4.3If, as of the date that is six (6) months following the commencement of the Sale Process, Bridger or Owner, as applicable, has not received any letter of intent, indicative term sheet, or similar commitment to purchase the Subject Aircraft and has not otherwise received any firm offers to purchase the Subject Aircraft from third parties, in any case, that (i) is not subject to any material contingencies and (ii) has not been revoked or rescinded (as determined by Owner in its sole and absolute discretion) (a “Viable Bid”), then the Sale Process shall terminate as of such date. If as of such date there is a Viable Bid, then the Sale Process shall be extended for an additional three-month period. If the transaction contemplated by the Viable Bid, or any other transaction in respect of the Subject Aircraft, is consummated during such three-month period, such transaction is referred to herein as a “Consummated Sale”. If a transaction is not consummated as a result of a Viable Bid during such
additional three-month period, the Sale Process shall terminate. The date that the Sale Process terminates pursuant to this Section 3.4.3 is referred to herein as the “Sale Process Termination Date”.
3.4.4Bridger shall pay or cause to be paid to Owner:
(a)if there is a Consummated Sale, an amount in cash equal to the difference (if positive) between (i) the amount that would have been payable to Owner in respect of the applicable Subject Aircraft if the First Purchase or the Second Purchase, as applicable, had been consummated in accordance with Section 3.1 or 3.2 (assuming for such purpose that the closing of the First Purchase was effective as of the First Purchase Date and the Second Purchase was effective as of the Second Purchase Date), respectively, minus (ii) the consideration paid in respect of the applicable Subject Aircraft pursuant to the Consummated Sale (provided, that in no event shall the amount required to be paid by Bridger pursuant to this Section 3.4.4(a) exceed $15 million);
(b)if (1) either (i) a Sale Process was commenced under this Section 3.4 and there has not been a Consummated Sale or (ii) a Sale Process was not commenced under this Section 3.4 and
(2) the Owner has not otherwise entered into an operating lease with a third party with respect to the Subject Aircraft on terms and conditions satisfactory to Owner, in its sole and absolute discretion, an amount in cash equal to $15 million, which amount shall be paid by wire transfer of immediately available funds (x) within five (5) Business Days of the Sale Process Termination Date, in the event of the circumstances set forth in the foregoing clause (b)(1)(i) or (y) on the Payment Date, in the event of the circumstances set forth in the foregoing clause (b)(1)(ii); or
(c)if both the First Purchase and the Second Purchase are consummated, no amount
shall be paid.
3.5Third Party Sale.
3.5.1If Bridger does not elect to make the First Purchase during the First Purchase Period or the First Purchase is otherwise not consummated by the Parties in accordance with the terms of Section 3.1 and Section 3.3, Owner shall have the right to sell any or all of the Aircraft, at its sole election, to a third party at any time and from time to time.
3.5.2If the First Purchase is consummated by the Parties but Bridger does not elect to make the Second Purchase during the Second Purchase Period, then Owner shall have the right to sell the Aircraft identified on Exhibit A as Aircraft 3 and/or Aircraft 4 to a third party at any time and from time to time.
3.5.3The terms and conditions of any sale by Owner of Aircraft under this Section 3.5 shall be determined by Owner, in its sole and absolute discretion, and shall not otherwise require any consent of or notice to Bridger, except to the extent expressly provided under the applicable Operating Lease.
SECTION 4
Board Observer Rights
4.1Beginning on the Effective Date and ending on the date that this Agreement terminates, Bridger hereby grants to each of MAM-MAB Member, LLC, a Delaware limited liability company (the
“Marathon Member”) and Avenue Sustainable Solutions Fund, L.P., a Delaware limited partnership, (the “Avenue Member”), the option and right to appoint a single representative (each, a “Board Observer” and together, the “Board Observers”), to attend all meetings (including, without limitation, telephonic meetings) of the full board of directors of Bridger (the “Board”) and any committee thereof (each, a “Committee”). The Board Observers shall not constitute members of the Board and shall not be entitled to vote on, or consent to, any matters presented to the Board. The Board Observers shall be provided access to all materials and information provided on the same terms and in the same manner as provided to the other members of the Board or the applicable Committee. The Board Observers shall have the right to request to attend the executive sessions of the Board in connection with meetings the Board Observers otherwise have a right to attend, subject to approval by the Board.
4.2Bridger shall (a) give the Board Observers notice of the applicable meeting or any proposed action taken by written consent at the same time and in the same manner as notice is given to the members of the Board or the applicable Committee, (b) provide the Board Observers with access to all materials and other information (including, without limitation, access to minutes of meetings or written consents of the full Board and any Committee) given to the members of the Board and the applicable Committee in connection with such meetings or actions taken by written consent at the same time and in the same manner such materials and information are furnished to such members of the Board or such Committee, and (c) provide the Board Observers with all rights to attend (whether in person or by telephone or other means of electronic communication as solely determined by the applicable Board Observer) such meetings as a member of the Board and each Committee. As promptly as practicable following the date hereof, Bridger, on the one hand, and each Board Observer, on the other hand, shall negotiate in good faith a board observer agreement containing indemnification provisions in favor of such Board Observer and confidentiality provisions in form and substance customary for transactions of this type.
4.3Notwithstanding any rights to be granted or provided to the Board Observers hereunder, Bridger reserves the right to exclude the Board Observers from access to any material or meeting or portion thereof if the Board reasonably determines, in good faith, that such access would prevent the members of the Board from engaging in attorney-client privileged communication; provided, however, that such exclusion shall be limited to the portion of the material and/or meeting that is the basis for such exclusion and shall not extend to any portion of the material and/or meeting that does not involve or pertain to such exclusion.
SECTION 5
Other Covenants
5.1Restrictive Covenants.
5.1.1Bridger acknowledges and agrees that, from and after the date of this Agreement and until the later of (i) the termination of this Agreement in accordance with its terms and (ii) such time as Owner or any of its affiliates no longer owns any of the Aircraft (the “Interim Period”), Bridger shall not, directly or indirectly, own, hold, invest in, lease or operate any Super Scooper or other firefighting aircraft, in each case, excluding the Aircraft and any other Super Scooper or other firefighting aircraft owned or leased by Bridger or any of its subsidiaries as of the date hereof.
5.1.2During the Interim Period, Bridger and its direct and indirect subsidiaries shall not, directly or indirectly, purchase or acquire any equity interests, assets or properties (whether by merger, purchase, sale, consolidation, exchange or otherwise) of any person or entity in any transaction or series of transactions in which the consideration to be paid therefor shall be paid in cash or cash equivalents.
5.2Application of Proceeds. Subject to the terms of the Loan Agreement and the Indenture, Bridger shall apply or cause to be applied the net cash proceeds of (i) the issuance of any equity securities (or securities convertible into or exchangeable for equity securities) of Bridger or any of its subsidiaries;
(ii) the sale, disposition, transfer or other disposal of any equity interests, assets or properties (whether by merger, purchase, sale, consolidation, exchange or otherwise) of Bridger or any of its subsidiaries, other than in the ordinary course (provided, that, the Parties acknowledge and agree that for purposes hereof, ordinary course shall not include any transaction involving Super Scooper aircraft or engines);
(iii) the incurrence of any indebtedness for borrowed money by Bridger or any of its subsidiaries in excess of $5 million, other than in respect of refinancing indebtedness for borrowed money by Bridger or any of its subsidiaries that is outstanding on the date hereof; and (iv) any sale-leaseback or other extraordinary or fundamental corporate transaction pursuant to which Bridger or any of its subsidiaries receives cash proceeds, in each case, to the extent received by Bridger or any of its subsidiaries, to satisfy its obligations under this Agreement, including pursuant to Section 3.
5.3Information and Access. During the term of this Agreement, Bridger shall provide, upon reasonable advance notice, full access to the Aircraft to Owner and Owner’s employees, agents and representatives for any purpose (including any inspection and demonstration flight) and shall deliver or otherwise make available, upon any written request of Owner (which may be delivered via email), accurate and complete copies of any records, contracts, notices or other documents (including any Aircraft technical records, maintenance records and operational records) related to the Aircraft.
5.4Publicity. The Parties shall agree on the form and content of any initial press releases or other public statements regarding the transactions contemplated by the Purchase Agreement and/or this Agreement and the transactions contemplated hereby and thereby, and thereafter shall consult with each other before issuing, and provide each other a reasonable opportunity to review and comment upon, any press release or other public statement with respect to any of the transactions contemplated hereby and thereby, and shall not issue directly or indirectly any such press release or make directly or indirectly any such public statement without the prior written consent of the other Parties following such opportunity to review and comment, which consent shall not be unreasonably withheld, conditioned or delayed. Notwithstanding the foregoing, (a) a Party or its representatives may issue a public announcement or other public disclosures required by applicable law or the rules of any stock exchange upon which such Party’s or its parent entity’s or affiliate’s capital stock is traded; provided that such Party affords the other Party and its representatives a reasonable opportunity to review the content of the proposed disclosure and provide reasonable comments regarding same (which comments such Party will consider in good faith) and (b) a Party and its representatives may issue any public announcement or make other public disclosure that is consistent with prior public announcements issued or public disclosures made in compliance with this Section 5.4 without the prior written consent of the other Party.
SECTION 6
Representations and Warranties
6.1Representations of Bridger.
6.1.1Organization; Good Standing. Bridger (i) is a corporation duly formed, validly existing and in good standing under the Laws of the State of Delaware and, to the extent required by applicable laws, the jurisdiction in which any of its assets or properties are located and (ii) is duly qualified and licensed to, own or lease the properties and assets now owned or leased by it and to carry on its business as it is currently conducted, except, in each case, as would not reasonably be expected to be material to the operations of Bridger as presently conducted or proposed to be conducted or materially impair or delay the consummation of the Transactions (as defined herein).
6.1.2Authorization. The execution, delivery of and performance by Bridger of this Agreement and each other agreement or document contemplated hereby, including each of the Operating Leases (each, a “Transaction Document”) to which it is or will be a party and the consummation of the transactions contemplated hereby and thereby (the “Transactions”) have been duly authorized by all necessary corporate action on the part of Bridger, and no other action or vote of equityholders of Bridger is required in connection therewith. Bridger has the necessary power, authority and capacity to execute this Agreement and the Transaction Documents to which it is or will be a party, to perform its obligations thereunder and to consummate the Transactions, and this Agreement and each such Transaction Document is, or will be when delivered by Bridger, enforceable in accordance with their respective terms subject only to applicable bankruptcy, insolvency, fraudulent transfer, reorganization, moratorium and similar laws of general applicability relating to or affecting creditors’ rights and to general equity principles (whether considered in a proceeding in equity or at law) (collectively, the “Enforceability Exceptions”).
6.1.3No Conflicts.
(a)The execution and delivery of this Agreement and each Transaction Document to be executed by Bridger or any of its subsidiaries, affiliates or other joint ventures, and the performance of the obligations of Bridger and any of its subsidiaries, affiliates or other joint ventures, as applicable, hereunder or thereunder do not and will not (i) result in the breach or violation of any organizational document of Bridger or any of its subsidiaries, affiliates or other joint ventures; (ii) result in the breach or violation of, or otherwise conflict with, the procedures prescribed by MITECO (as defined in the Purchase Agreement) in respect of the Public Auction (as defined in the Purchase Agreement) or any laws, regulations or any order of any court or governmental authority binding on Bridger or any of its subsidiaries, affiliates or other joint ventures; (iii) conflict with, or result in any default or event of default under, or give rise to or accelerate any obligation under, any contract, agreement or commitment to which Bridger or any of its subsidiaries, affiliates or other joint ventures is bound, including, without limitation, that certain Loan Agreement (as defined below), that certain Indenture (as defined below) and each other Financing Document (under and as defined in the Loan Agreement and Indenture) except to the extent that such conflict, default, event of default or obligation, as the case may be, (A) would not affect or impair the validity of this Agreement or the transactions contemplated hereby (including the Operating Leases) and (B) is not, and could not reasonably be expected to be, material to the operations of the Aircraft or of Bridger or any of its subsidiaries, affiliates or other joint ventures, as applicable, as presently conducted or proposed to be conducted or materially impair or delay the consummation of the Transactions, or (iv) require the approval, consent or action of, waiver or filing with, or notice to, any third party, including but not limited to, any governmental authority, and as of December 1, 2023, Bridger shall have delivered to Owner the opinion of outside
legal counsel contemplated by Section 17 of that certain Participations Sale and Purchase Agreement, dated as of November 16, 2023 (the “Purchase Agreement”), by and between Bridger and MAB Funding, LLC (“FundCo”).
(b)For purposes hereof:
(i)“Loan Agreement” means the Second Amended and Restated Loan Agreement, dated August 1, 2022, by and among, inter alios, Gallatin County, Montana, as lender, and Bridger Aerospace Group, LLC, a Delaware limited liability company, as borrower representative, the other entities parties thereto as borrowers (as amended, restated, amended and restated, modified, supplemented or waived); and
(ii)“Indenture” means the Amended and Restated Trust Indenture, dated as of July 1, 2022, by and between the County and the Trustee, as amended and supplemented by the First Supplemental Trust Indenture, dated as of August 1, 2022 (including any further amendments, restatements, amendments and restatements, modifications, supplements, waivers and/or indentures supplemental thereto made in conformity therewith).
6.1.4Solvency. Bridger and its subsidiaries are, and immediately after giving effect to the Transactions, will be, solvent. Bridger and its subsidiaries are, and immediately after giving effect to the Transactions, will: (i) be able to pay their debts as they become due, (ii) own property that has a fair saleable value greater than the amounts required to pay their debts (including a reasonable estimate of the amount of all contingent liabilities), and (iii) have adequate capital to carry on their business. No transfer of property is being made by Bridger or any of its subsidiaries and no obligation is being incurred by Bridger or any of its subsidiaries in connection with the Transactions with the intent to hinder, delay or defraud either present or future creditors of Bridger or any of its subsidiaries or affiliates.
6.1.5OFAC; Patriot Act. Bridger is not, and to its knowledge, no person holding any legal or beneficial interest whatsoever in it, are, (i) the target of any sanctions program that is established by Executive Order of the President or published by the Office of Foreign Assets Control, U.S. Department of the Treasury (“OFAC”); (ii) designated by the President or OFAC pursuant to the Trading with the Enemy Act, 50 U.S.C. App. § 5, the International Emergency Economic Powers Act, 50 U.S.C.
§§ 1701-06, the Patriot Act, Public Law 107-56, Executive Order 13224 (September 23, 2001) (the “Patriot Act”) or any Executive Order of the President issued pursuant to such statutes; or (iii) named on the following list that is published by OFAC: “List of Specially Designated Nationals and Blocked Persons” (collectively, “Prohibited Persons”). No funds tendered to Owner under this Agreement or any of the Transaction Documents are or will be directly or indirectly derived from activities that may contravene U.S. federal, state or international laws and regulations, including anti-money laundering laws. Bridger will not knowingly engage in any transactions or dealings, or knowingly be otherwise associated with, any Prohibited Persons in connection with the Transactions.
6.1.6Litigation; Investigations. There are no any appeals, pleas, actions, suits, claims, hearings, investigations, audits, charges, complaints, grievances, demands, investigations, proceedings, legal actions, litigation (whether at law or in equity, whether civil or criminal), mediations or arbitrations by or before any arbitrator, court or other governmental authority pending or, to the knowledge of Bridger, threatened (in writing) against or by Bridger or any of its affiliates that challenge or seek to prevent, enjoin or otherwise delay the Transactions.
6.1.7SEC Documents.
(a)All reports, schedules, forms, statements and other documents (including exhibits and all other information incorporated therein) required to be filed or furnished by Bridger with the United States Securities and Exchange Commission (the “SEC”) since August 8, 2022 (the “Bridger SEC Documents”) have been filed or furnished with the SEC on a timely basis. As of the time it was filed with the SEC (or, if amended or superseded by a filing prior to the date of this Agreement, then on the date of such filing): (i) each of the Bridger SEC Documents complied in all material respects with the applicable requirements of the Securities Act of 1933, as amended (the “Securities Act”), the Securities Exchange Act of 1934, as amended (the “Exchange Act”) and the Sarbanes-Oxley Act (as the case may be) and the applicable regulations promulgated thereunder; and (ii) none of the Bridger SEC Documents contained any untrue statement of a material fact or omitted to state a material fact required to be stated therein or necessary in order to make the statements therein, in light of the circumstances under which they were made, not misleading. As of its filing date (or, if amended or superseded by a filing prior to the date of this Agreement, on the date of such filing), each Bridger SEC Document complied as to form in all material respects with the applicable requirements of the Exchange Act, the Securities Act and the Sarbanes-Oxley Act and the rules and regulations thereunder.
(b)The financial statements (including any related notes) contained or incorporated by reference in Bridger SEC Documents: (i) complied as to form in all material respects with the published rules and regulations of the SEC applicable thereto; (ii) were prepared in accordance with United States generally accepted accounting principles (“GAAP”) applied on a consistent basis throughout the periods covered (except as may be indicated in the notes to such financial statements or, in the case of unaudited financial statements, as permitted by Form 10-Q or any successor form under the Exchange Act, and except that unaudited financial statements may not contain footnotes and are subject to normal and recurring year-end adjustments); (iii) fairly present, in all material respects, the financial position of Bridger and its consolidated subsidiaries as of the respective dates thereof and the results of operations and consolidated cash flows of Bridger and its consolidated subsidiaries for the periods covered thereby (subject, with respect to unaudited financial statements, to normal and recurring year-end adjustments); and (iv) have been prepared from, and are in accordance with, the books and records of Bridger and its consolidated subsidiaries in all material respects. No financial statements of any Person other than Bridger and its consolidated subsidiaries are required by GAAP to be included in the consolidated financial statements of Bridger.
(c)None of Bridger or any of its subsidiaries has effected, entered into or created, or has a commitment to effect, enter into or create, any securitization transaction, joint venture or any similar contract or transaction, including any contract relating to any transaction or relationship between or among Bridger or any of its subsidiaries, on the one hand, and any unconsolidated affiliate of Bridger or any of its subsidiaries, including any structured finance, special purpose or limited purpose entity, on the other hand, or any “off-balance sheet arrangements” (as defined in Item 303 of Regulation S-K) or any similar arrangements. None of Bridger or any of its subsidiaries has any liabilities of any nature or type, whether accrued, absolute, determined, contingent or otherwise and whether due or to become due, except for: (i) liabilities disclosed in the financial statements (including any related notes) contained in the balance sheet of Bridger for the quarterly period ended June 30, 2023 and filed on Form 10-Q (the “Bridger Balance Sheet”); (ii) liabilities incurred in the ordinary course of business since the date of the Bridger Balance Sheet; (iii) liabilities that would not, individually or in the aggregate, reasonably be expected to have be material to the business of Bridger or materially impair, hinder or delay the
transactions contemplated by this Agreement; and (iv) liabilities and obligations incurred in connection with the transactions contemplated by this Agreement.
6.1.1No Other Representations. Except as set forth in this Section 6.1, Bridger acknowledges and agrees that none of Owner, any of their Affiliates or any other Person, makes, or shall be deemed to have made by or on behalf of Owner, any representations or warranties of any kind or nature, express or implied, at law or in equity, in connection with the Transactions, including any representations or warranties with respect to any projections, forecasts, estimates or budgets of future revenues, future results of operations or future financial condition (or any component thereof) of Owner, or any of its affiliates, and Bridger hereby expressly disclaims reliance upon any such representation or warranty, whether by or on behalf of Owner, any of its Affiliates or any other Person and notwithstanding the delivery or disclosure to Bridger or any of its Affiliates, representatives or any other person of any documentation or other information by Owner, any of its Affiliates or representatives or any other Person with respect to any of the foregoing. For the avoidance of doubt, the foregoing shall not operate to limit or invalidate any representation or warranty contained in any Transaction Document.
6.1Representations of Owner.
6.1.1Organization; Good Standing. Owner is a limited liability company validly incorporated and existing under the Laws of Spain duly registered as such in the Commercial Registry of Madrid.
6.1.2Authorization. The execution, delivery of and performance by Owner of each Transaction Document to which it is or will be a party and the consummation of the Transactions have been duly authorized by all necessary corporate action on the part of Owner, and no other action or vote of equityholders of Owner is required in connection therewith. Owner has the necessary power, authority and capacity to execute this Agreement and the Transaction Documents to which it is or will be a party, to perform its obligations thereunder and to consummate the Transactions, and this Agreement and each such Transaction Document is, or will be when delivered by Bridger, enforceable in accordance with their respective terms subject only to applicable Enforceability Exceptions.
6.1.3No Other Representations. Except as set forth in this Section 6.2, Bridger acknowledges and agrees that none of Owner, any of their Affiliates or any other Person, makes, or shall be deemed to have made by or on behalf of Owner, any representations or warranties of any kind or nature, express or implied, at law or in equity, in connection with the Transactions, including any representations or warranties with respect to any projections, forecasts, estimates or budgets of future revenues, future results of operations or future financial condition (or any component thereof) of Owner, or any of its affiliates, and Bridger hereby expressly disclaims reliance upon any such representation or warranty, whether by or on behalf of Owner, any of its Affiliates or any other Person and notwithstanding the delivery or disclosure to Bridger or any of its Affiliates, representatives or any other person of any documentation or other information by Owner, any of its Affiliates or representatives or any other Person with respect to any of the foregoing. For the avoidance of doubt, the foregoing shall not operate to limit or invalidate any representation or warranty contained in any Transaction Document.
SECTION 7
Termination of Agreement
7.1Termination.
7.1.1This Agreement may be terminated at any time following the Effective Date as
follows:
(a)automatically, as of the date that none of Owner or any of its affiliates owns any
of the Aircraft and all amounts due and owing by Bridger to Owner hereunder and under the Operating Leases have been paid in full;
(b)by the mutual written consent of Owner and Bridger;
(c)by Owner, in the event any repudiation or material breach or failure to perform of any representation, warranty, covenant or agreement of Bridger in this Agreement, which breach is incapable of being cured or has not been cured within ten (10) days after delivery of written notice thereof from Owner (provided, that the right to terminate this Agreement pursuant to this Section 7.1(c) shall only be available to Owner if Owner is not then in material breach of its respective representations, warranties, covenants or agreements contained in this Agreement);
(d)by Bridger, in the event of any repudiation or any material breach or failure to perform of any representation, warranty, covenant or agreement of Owner in this Agreement, which breach is incapable of being cured or has not been cured within ten (10) days after delivery of written notice thereof from Bridger (provided, that the right to terminate this Agreement pursuant to this Section 7.1(d) shall only be available to Bridger if Bridger is not then in material breach of its respective representations, warranties, covenants or agreements contained in this Agreement);
(e)by Owner, at any time prior to the date that is three (3) years following the date hereof upon ninety (90) days’ written notice to Bridger;
(f)by Owner, upon delivery of written notice to Bridger in the event of (i) any material breach by Bridger of any of its representations, warranties, covenants or other agreements set forth in any Operating Lease or (ii) any Event of Default (or similar term) under any Operating Lease;
(g)by Owner, upon delivery of written notice to Bridger in the event of any Event of Default (or similar term), whether or not waived, or acceleration of any material indebtedness of Bridger or any of its subsidiaries, including under the Loan Agreement or the Indenture;
(h)by Owner, upon delivery of written notice to Bridger in the event of (i) the direct or indirect sale, lease, exclusive license or transfer of all or substantially all of the assets of Bridger and its subsidiaries (on a consolidated basis) or (ii) any transaction or series of transactions (whether by merger, consolidation, equity purchase or otherwise) resulting in the sale or transfer, directly or indirectly, of 50% or more of the equity interests of Bridger or Bridger Aerospace Group Holdings, LLC; or
(i)by Owner, upon delivery of written notice to Bridger in the event that Bridger or any of its subsidiaries shall have: (i) made a general assignment for the benefit of creditors; (ii) filed any voluntary petition in bankruptcy; (iii) suffered the filing of an involuntary petition by its creditors; (iv) suffered the appointment of a receiver to take possession of all, or substantially all, of its assets, (v) suffered the attachment or other judicial seizure of all, or substantially all, of its assets; (vi) admitted in
writing its inability to pay its debts as they come due or (vii) made an offer of settlement, extension or composition to its creditors generally.
7.2Effect of Termination. In the event of a termination of this Agreement by either Party, this Agreement shall thereupon become null and void and of no further force and effect, and each Party shall be relieved of its duties and obligations arising under this Agreement after such termination and such termination will be without liability to any Party; provided that (a) each of the provisions of this Section 7.2, Section 7.3 and Section 8 and, in each case, the definitions used therein or related thereto shall survive such termination and remain in full force and effect; (b) Owner shall remain obligated to pay all amounts due to Bridger under this Agreement and unpaid as of the date of such termination, including, without limitation, all due and unpaid Retrofitting Costs; (c) Bridger shall remain obligated to pay all amounts due to Owner under this Agreement and the Operating Leases and unpaid as of the date of such termination; and (d) nothing in this Agreement will relieve any Party from its obligations under the Operating Leases or any liability for fraud or any willful and material breach by such Party of the terms and provisions of this Agreement, in which case the aggrieved Party shall be entitled to all rights and remedies available at Law or in equity.
7.3Termination Fee. In the event that this Agreement is terminated by Owner pursuant to 7.1.1(c), 7.1.1(f), 7.1.1(g), or 7.1.1(i), then in each case, Bridger shall pay or cause to be paid, by wire transfer of immediately available funds, an amount in cash equal to $15 million, which amount shall be paid by wire transfer of immediately available funds within five (5) Business Days of the date of such termination. The Parties acknowledge and agree that any amounts payable by Bridger pursuant to Section
3.4.4 or this Section 7.3 are liquidated damages and not a penalty, and that damages of Owner resulting from failure of the transactions contemplated by this Agreement to be consummated are uncertain and incapable of accurate calculation and that the amounts payable by Bridger pursuant to Section 3.4.4 or Section 7.3 are reasonable forecasts of the actual damages that compensate Owner for its efforts and resources expended and the opportunities foregone in reliance upon this Agreement and on the expectation of the consummation of the transactions contemplated hereby in accordance with the terms of this Agreement, and for the loss suffered by reason of the transactions contemplated hereby.
SECTION 8
Miscellaneous Provisions
8.1Specific Performance; Enforcement of Costs. Each of the Parties acknowledges and agrees that money damages would not be a sufficient remedy for any breach or threatened breach of this Agreement by the other Party and that each Party shall be entitled to seek specific performance and injunctive or other equitable relief as a remedy for any such breach or threatened breach, and each Party further agrees to waive any requirement for the security or posting of any bond in connection with such remedy. Such remedy shall not be deemed to be the exclusive remedy for any breach or threatened breach of this Agreement but shall be in addition to all other remedies available at law or equity to such Party. The Parties hereto agree that in the event either Party finds it necessary to employ an attorney to prosecute or defend legal proceedings in court because of an alleged default by the other Party in performance of the terms of this Agreement, the Party who prevails in such court proceedings shall, in addition to all other relief which may be granted, be entitled to a monetary award for all costs and expenses incurred by the prevailing Party, including its reasonable attorneys’ fees, to be Party by the party against whom the issues are decided and such judgment is entered.
8.2Notices. All notices, demands or other communications to be delivered or given hereun- der shall be in writing and shall be deemed to be duly given if delivered or sent by certified or registered mail, return receipt requested, or by email transmission (subject to confirmation of delivery), as follows:
To Bridger: Bridger Aerospace Group Holdings, Inc.
90 Aviation Lane
Belgrade, MT 59714 Attention: James Muchmore
Email: james@bridgeraerospace.com
With a copy, which shall not constitute notice, to:
Brownstein Hyatt Farber Schreck, LLP 675 15th Street, Ste. 2900
Denver, CO 80202 Attention: Marc Diamant Email: diamant@bhfs.com
c/o Marathon Asset Management, L.P. One Bryant Park, 38th Floor
New York, NY 10036
Attention: Craig Thaler and Michael Alexander Email: cthaler@marathonfund.com;
malexander@marathonfund.com; legalteam@marathonfund.com and
c/o Avenue Sustainable Solutions Fund, L.P. 11 West 42nd Street, 9th
New York, NY 10036
Attention: Sean Coleman; Graham Feldman Email: scoleman@avenuecapital.com; gfeldman@avenuecapital.com
With copies, which shall not constitute notice, to:
Sidley Austin LLP 787 Seventh Avenue New York, NY 10019
Attention: David Form, Bart Biggers
Email: dform@sidley.com; bart.biggers@sidley.com
and
Paul, Weiss, Rifkind, Wharton & Garrison LLP 1285 6th Avenue
New York, NY 10019 Attention: Sung Pak
Email: spak@paulweiss.com
All notices shall be deemed received by a Party on the date when certified or registered mail is delivered or refused or on the date any email transmission is received (if received during the regular normal business hours of the recipient or otherwise on the next succeeding business day of the recipient). Either Party may change its notice information set forth in this Section 8.2 upon providing written notice of such change to the other Party. 8.3Entire Agreement; Amendments. This Agreement, together with the exhibits and schedules attached hereto and made a part hereof, contains the entire understanding between the Parties hereto in respect of the subject matter contained herein and may be amended only by a written instrument duly executed by the Parties hereto or their respective assignees.
8.4Assignment. This Agreement shall not be assigned by either Party except with the written consent of the other Party, which consent shall not be unreasonably withheld; provided that Owner may, without the consent of Bridger, assign this Agreement and/or transfer its interest and title (legal and/or beneficial title) of any Aircraft to any subsidiary of, or special purpose vehicle, trust or entity controlled by, FundCo to the extent (x) the Aircraft are transferred to such subsidiary, vehicle, trust or entity (such transfer, a “Re-Domiciling”) and (y) such Re-Domiciling is deemed appropriate by Owner or FundCo, in their respective sole discretion, in connection with optimizing the tax effects to FundCo or FundCo’s direct or indirect investors arising from the ownership and operation of such Aircraft. Bridger agrees to reimburse, indemnify and pay any deregistration fees, registration fees, exit fees, transfer taxes (including but not limited to any export and import duties), and any other reasonable out-of-pocket costs and expenses (including, but not limited all legal counsel costs, all legal opinions, and all jurisdictional reports or questionnaires) incurred by Owner or FundCo in connection with one such Re-Domiciling, not to exceed $250,000 in aggregate.
8.5Applicable Law; WAIVER OF JURY TRIAL; Jurisdiction. This Agreement shall be construed in accordance with the laws of the State of New York, without regard to its conflict of laws principles. EACH PARTY HERETO KNOWINGLY, VOLUNTARILY AND IRREVOCABLY WAIVES ANY RIGHT IT MAY HAVE TO ATRIAL BY JURY IN RESPECT OF ANY CLAIM BASED UPON, ARISING OUT OF OR IN CONNECTION WITH THIS AGREEMENT. In connection
with any dispute arising out of or relating to this Agreement, the negotiation, execution, delivery, performance or validity of this Agreement, or the transactions contemplated hereby, each of the Parties irrevocably and unconditionally (i) consents to submit to the sole and exclusive jurisdiction of the courts of competent jurisdiction located in the State of New York; (ii) agrees not to commence any litigation relating thereto (whether based on contract, tort or any other theory) except in the court identified in accordance with clause (i) hereof and waives any objection to the laying of venue of any such litigation in such court; and (iii) agrees not to plead or claim in such court that such litigation brought therein has been brought in an inconvenient forum.
8.6Disclaimer. EXCEPT AS EXPRESSLY SET FORTH HEREIN, NO REPRESENTATIONS, WARRANTIES, PROMISES, GUARANTEES OR AGREEMENTS HAVE BEEN MADE BY EITHER PARTY WITH RESPECT TO THIS AGREEMENT OR THE AIRCRAFT, ORAL OR WRITTEN, EXPRESSED OR IMPLIED, INCLUDING WARRANTIES OF
MERCHANTABILITY AND/OR FITNESS FOR A PARTICULAR PURPOSE, AND IN NO EVENT SHALL EITHER PARTY BE LIABLE TO THE OTHER FOR ANY SPECIAL, CONSEQUENTIAL OR INCIDENTAL LOSS OR DAMAGE.
8.7Remedies Cumulative. The rights and remedies of the Parties with respect to any of the terms and conditions of this Agreement shall be cumulative and not exclusive, and shall be in addition to all other rights and remedies in favor of either Party. Neither Party shall, by act, delay, omission or otherwise, be deemed to have waived any of its rights or remedies hereunder unless such waiver is in writing. A waiver on any one occasion shall not be construed as a waiver on any other occasion.
8.8Prior Representations. Except as specifically set forth herein, neither Party hereto shall be deemed at any time to have made any representation, promise or covenant, verbally or in writing in respect of the subject matter of this Agreement.
8.9Invalidity. Any provision of this Agreement which is prohibited or unenforceable shall be ineffective to the extent of such prohibition or unenforceability without invalidating the remaining provisions hereof.
8.10Headings. The headings of the sections contained in this Agreement are inserted for convenience only and shall not constitute a part hereof.
8.11Counterparts. This Agreement may for all purposes be executed in several counterparts, each of which shall be deemed an original, and all such counterparts, taken together, shall constitute the same instrument, even though all parties may not have executed the same counterpart of this Agreement. Each Party may transmit its/his/her signature by facsimile or other electronic means, and such faxed or other electronic signature shall have the same force and effect as an original signature.
8.12No Recourse. This Agreement and any Transaction Document may only be enforced against, and any claims or causes of action that may be based upon, arise out of or relate to (i) this Agreement or any Transaction Document or any other agreement referenced herein or therein, (ii) the negotiation, execution or performance of this Agreement or any Transaction Document or any other agreement referenced herein or therein (including any representation or warranty made in, in connection with, or as an inducement to, this Agreement, any Transaction Documents or such other agreement), (iii) the consummation of, or any failure to consummate, the Transaction contemplated by this Agreement or any Transaction Document or any other agreement referenced herein or therein to be consummated and
(iv) any breach or violation (whether or not intentional) of this Agreement, any Transaction Document or any other agreement referenced herein or therein, in each case, may only be made against (and are liabilities solely of) the entities that are expressly identified as parties hereto or thereto, as the case may be (in each case, solely in their capacity as such, “Contracting Parties”), and no past, present or future affiliate, director, officer, employee, incorporator, member, manager, partner (including limited partner or general partner), unit holder, equity holder, shareholder, stockholder, lender, agent, attorney or representative of any party or any of its affiliates (each a “Nonparty Affiliate”) has or shall have any liability for any obligations or liabilities of the Contracting Parties or for any claim (whether in tort, contract, in law, in equity or otherwise or granted by statute or otherwise, whether by or through attempted piercing of the corporate, limited partnership or limited liability company veil or any other theory or doctrine, including alter ego or otherwise) based on, in respect of, or by reason of, any of the items set forth in clauses (i) through (iv) above or in respect of any representations made or alleged to
be made in connection herewith (and, to the maximum extent permitted by applicable law, each Contracting Party hereby waives and releases all such claims, causes of action and liabilities against any such Nonparty Affiliates), in each case, except for claims that a Party may assert solely in accordance with, and pursuant to the terms and conditions of, and against the persons that are party to, this Agreement or any Transaction Document, it being expressly agreed and acknowledged that no personal liability or losses whatsoever shall attach to, be imposed on or otherwise be incurred by any of the aforementioned (other than the Contracting Parties), as such, arising under, out of, in connection with or related in any manner to the items in the immediately preceding clauses (i) through (iv); provided, however, that in the event that a Contracting Party (x) consolidates with or merges with any other entity or person and is not continuing or surviving entity of such consolidation or merger or (y) transfers or conveys all or a substantial portion of its properties and other assets to any entity or person, then, in each case, the applicable party may seek recourse, whether by the enforcement of any judgment or assessment or by any legal or equitable proceeding or by virtue of any applicable law, against such continuing or surviving entity or person as if such entity or person were the Contracting Party. The Parties acknowledge and agree that the Nonparty Affiliates are intended third-party beneficiaries of this Section 8.12.
[Signature Page Follows]
IN WITNESS WHEREOF, the Owner and Bridger have executed this Agreement to be effective as of the day and year first above written.
BRIDGER AEROSPACE GROUP HOLDINGS, INC.
By: /s/ James Muchmore Name: James Muchmore
Title: Chief Legal Officer and Executive Vice President
OWNER:
BRIDGER AEROSPACE EUROPE, S.L.U.
By: /s/ Craig H. Thaler
Name: Craig H. Thaler Title: Director
[Signature Page to Services Agreement]
FIRST AMENDMENT TO SERVICES AGREEMENT
This First Amendment to the Services Agreement (the “Amendment”) to that certain November 17, 2023 Services Agreement (the “Agreement”) by and between Bridger Aerospace Group Holdings, Inc. (“Bridger”) and Bridger Aerospace Europe, S.L.U. (the “Owner”), is dated as of January 18, 2024. Capitalized terms not defined herein shall have the same meaning as set forth in the Agreement.
WHEREAS, Bridger and the Owner entered into the Agreement to address, among other things, terms and conditions as to the retrofit, operation, maintenance, lease, purchase, and exclusivity obligations as to all of the Aircraft, in addition to certain other terms and conditions.
WHEREAS, the Parties now desire to enter into this Amendment to amend and revise Section 5.2 of the Agreement to reflect the Parties’ original intent.
NOW THEREFORE, the Parties hereby agree as follows:
1.Section 5.2 of the Agreement is hereby amended and restated in its entirety as follows:
“5.2 Application of Proceeds. Subject to the terms of the Loan Agreement and the Indenture, Bridger shall apply or cause to be applied (i) after Bridger and/or any of its subsidiaries has received $1,800,000 of net cash proceeds from the issuance of any equity securities (or securities convertible into or exchangeable for equity securities) of Bridger or any of its subsidiaries, 75% of the net cash proceeds of the issuance of any equity securities (or securities convertible into or exchangeable for equity securities) of Bridger or any of its subsidiaries; (ii) the net cash proceeds of the sale, disposition, transfer or other disposal of any equity interests, assets or properties (whether by merger, purchase, sale, consolidation, exchange or otherwise) of Bridger or any of its subsidiaries, other than in the ordinary course (provided, that, the Parties acknowledge and agree that for purposes hereof, ordinary course shall not include any transaction involving Super Scooper aircraft or engines); (iii) the net cash proceeds of the incurrence of any indebtedness for borrowed money by Bridger or any of its subsidiaries in excess of $5 million on a cumulative basis over the life of this Agreement (not, for the avoidance of doubt, in excess of $5 million per incurrence), other than in respect of refinancing indebtedness for borrowed money by Bridger or any of its subsidiaries that is outstanding on the date hereof; and (iv) the net cash proceeds of any sale, sale-leaseback, or other extraordinary or fundamental corporate transaction pursuant to which Bridger or any of its subsidiaries receives cash proceeds, in each case, to the extent received by Bridger or any of its subsidiaries, towards the purchase of the Aircraft subject to the terms of this Agreement, in particular as described in Section 3 hereof, and/or other payment obligations hereunder.”
2.The terms and provisions of Section 8.5 of the Agreement are incorporated herein by reference to the same extent as if expressly set forth herein. Except as specifically amended hereby, all other terms of the Agreement shall remain unchanged and in full force and effect. From and after the date hereof, any reference to “this Agreement”, “hereof”, “herein”, “hereunder” and
words or expressions of similar import in the Agreement shall be deemed a reference to the Agreement as amended hereby.
[Signature Pages Follow]
IN WITNESS WHEREOF, the Owner and Bridger have executed this Amendment to be effective as of the day and year first above written.
BRIDGER:
Bridger Aerospace Group Holdings, Inc.
By: /s/ James Muchmore
Name: James Muchmore
Title: Chief Legal Officer and Executive Vice President
OWNER:
Bridger Aerospace Europe S.L.U.
By: /s/ Craig H. Thaler
Name: Craig H. Thaler Title: Director
[Amendment No. 1 to Services Agreement]
Exhibit 21.1
SUBSIDIARIES
| | | | | | | | | | | | | | |
| | Subsidiary | | Jurisdiction of Organization |
| 1. | | AE Côte-Nord Canada Bioenergy Inc. | | Canada |
| 2. | | Albacete Aero, Sociedad Limitada | | Spain |
| 3. | | Bridger Aerospace Australia Pty Ltd | | Australia |
| 4. | | Bridger Aerospace Defense Services, LLC | | Montana |
| 5. | | Bridger Aerospace Europe, Sociedad Limitada | | Spain |
| 6. | | Bridger Aerospace Group Holdings, LLC | | Delaware |
| 7. | | Bridger Aerospace Group, LLC | | Delaware |
| 8. | | Bridger Aerospace Products and Services, LLC | | Montana |
| 9. | | Bridger Aerospace, LLC | | Montana |
| 10. | | Bridger Air Tanker, LLC | | Montana |
| 11. | | Bridger Air Tanker 1, LLC | | Montana |
| 12. | | Bridger Air Tanker 2, LLC | | Montana |
| 13. | | Bridger Air Tanker 3, LLC | | Montana |
| 14. | | Bridger Air Tanker 4, LLC | | Montana |
| 15. | | Bridger Air Tanker 5, LLC | | Montana |
| 16. | | Bridger Air Tanker 6, LLC | | Montana |
| 17. | | Bridger Air Tanker 7, LLC | | Montana |
| 18. | | Bridger Air Tanker 8, LLC | | Montana |
| 19. | | Bridger Aviation Repair, LLC | | Montana |
| 20. | | Bridger Aviation Services, LLC | | Delaware |
| 21. | | Bridger Bighorn, LLC | | Montana |
| 22. | | Bridger Ground Support, LLC | | Montana |
| 23. | | Bridger Merger Corp. | | Cayman Islands |
| 24. | | Bridger Software, LLC | | Montana |
| 25. | | Bridger Solutions International, LLC | | Montana |
| 26. | | Bridger Solutions International 1, LLC | | Montana |
| 27. | | Bridger Solutions International 2, LLC | | Montana |
| 28. | | Bridger Tanker, LLC | | Montana |
| 29. | | Bridger Training Services, LLC | | Montana |
| 30. | | BTOF (Grannus Feeder) - NQ L.P. | | Delaware |
| 31. | | Ensyn BioEnergy Canada, Inc. | | Canada |
| 32. | | Firetrac.com, LLC | | Montana |
| 33. | | Ignis Technologies, Inc. | | Montana |
| 34. | | Mountain Air, LLC (d/b/a Bridger Aerospace) | | Arkansas |
| 35. | | Northern Fire Management Services, LLC | | Montana |
| 36. | | Whitepeak BioEnergy, LLC | | Delaware |
| 37. | | Wildfire GP Sub IV, LLC | | Delaware |
Exhibit 31.1
CERTIFICATION
I, Timothy Sheehy, certify that:
1.I have reviewed this Annual Report on Form 10-K of Bridger Aerospace Group Holdings, Inc.;
2.Based on my knowledge, this report does not contain any untrue statement of a material fact or omit to state a material fact necessary to make the statements made, in light of the circumstances under which such statements were made, not misleading with respect to the period covered by this report;
3.Based on my knowledge, the financial statements, and other financial information included in this report, fairly present in all material respects the financial condition, results of operations and cash flows of the registrant as of, and for, the periods presented in this report;
4.The registrant’s other certifying officer(s) and I are responsible for establishing and maintaining disclosure controls and procedures (as defined in Exchange Act Rules 13a-15(e) and 15d-15(e)) and internal control over financial reporting (as defined in Exchange Act Rules 13a-15(f) and 15d-15(f)) for the registrant and have:
a)Designed such disclosure controls and procedures, or caused such disclosure controls and procedures to be designed under our supervision, to ensure that material information relating to the registrant, including its consolidated subsidiaries, is made known to us by others within those entities, particularly during the period in which this report is being prepared;
b)Designed such internal control over financial reporting, or caused such internal control over financial reporting to be designed under our supervision, to provide reasonable assurance regarding the reliability of financial reporting and the preparation of financial statements for external purposes in accordance with generally accepted accounting principles;
c)Evaluated the effectiveness of the registrant’s disclosure controls and procedures and presented in this report our conclusions about the effectiveness of the disclosure controls and procedures, as of the end of the period covered by this report based on such evaluation; and
d)Disclosed in this report any change in the registrant’s internal control over financial reporting that occurred during the registrant’s most recent fiscal quarter (the registrant’s fourth fiscal quarter in the case of an annual report) that has materially affected, or is reasonably likely to materially affect, the registrant’s internal control over financial reporting; and
5.The registrant’s other certifying officer(s) and I have disclosed, based on our most recent evaluation of internal control over financial reporting, to the registrant’s auditors and the audit committee of the registrant’s board of directors (or persons performing the equivalent functions):
a)All significant deficiencies and material weaknesses in the design or operation of internal control over financial reporting which are reasonably likely to adversely affect the registrant’s ability to record, process, summarize and report financial information; and
b)Any fraud, whether or not material, that involves management or other employees who have a significant role in the registrant’s internal control over financial reporting.
| | | | | | | | |
| Dated: March 20, 2024 | | |
| | |
| By: | /s/ Timothy Sheehy |
| | Name: Timothy Sheehy |
| | Title: Chief Executive Officer |
Exhibit 31.2
CERTIFICATION
I, Eric Gerratt, certify that:
1.I have reviewed this Annual Report on Form 10-K of Bridger Aerospace Group Holdings, Inc.;
2.Based on my knowledge, this report does not contain any untrue statement of a material fact or omit to state a material fact necessary to make the statements made, in light of the circumstances under which such statements were made, not misleading with respect to the period covered by this report;
3.Based on my knowledge, the financial statements, and other financial information included in this report, fairly present in all material respects the financial condition, results of operations and cash flows of the registrant as of, and for, the periods presented in this report;
4.The registrant’s other certifying officer(s) and I are responsible for establishing and maintaining disclosure controls and procedures (as defined in Exchange Act Rules 13a-15(e) and 15d-15(e)) and internal control over financial reporting (as defined in Exchange Act Rules 13a-15(f) and 15d-15(f)) for the registrant and have:
a)Designed such disclosure controls and procedures, or caused such disclosure controls and procedures to be designed under our supervision, to ensure that material information relating to the registrant, including its consolidated subsidiaries, is made known to us by others within those entities, particularly during the period in which this report is being prepared;
b)Designed such internal control over financial reporting, or caused such internal control over financial reporting to be designed under our supervision, to provide reasonable assurance regarding the reliability of financial reporting and the preparation of financial statements for external purposes in accordance with generally accepted accounting principles;
c)Evaluated the effectiveness of the registrant’s disclosure controls and procedures and presented in this report our conclusions about the effectiveness of the disclosure controls and procedures, as of the end of the period covered by this report based on such evaluation; and
d)Disclosed in this report any change in the registrant’s internal control over financial reporting that occurred during the registrant’s most recent fiscal quarter (the registrant’s fourth fiscal quarter in the case of an annual report) that has materially affected, or is reasonably likely to materially affect, the registrant’s internal control over financial reporting; and
5.The registrant’s other certifying officer(s) and I have disclosed, based on our most recent evaluation of internal control over financial reporting, to the registrant’s auditors and the audit committee of the registrant’s board of directors (or persons performing the equivalent functions):
a)All significant deficiencies and material weaknesses in the design or operation of internal control over financial reporting which are reasonably likely to adversely affect the registrant’s ability to record, process, summarize and report financial information; and
b)Any fraud, whether or not material, that involves management or other employees who have a significant role in the registrant’s internal control over financial reporting.
| | | | | | | | |
| Dated: March 20, 2024 | | |
| | |
| By: | /s/ Eric Gerratt |
| | Name: Eric Gerratt |
| | Title: Chief Financial Officer |
Exhibit 32.1
CERTIFICATION PURSUANT TO
18 U.S.C. SECTION 1350
AS ADOPTED PURSUANT TO
SECTION 906 OF THE SARBANES-OXLEY ACT OF 2002
In connection with the Annual Report of Bridger Aerospace Group Holdings, Inc. (the “Company”) on Form 10-K for the year ended December 31, 2023, as filed with the United States Securities and Exchange Commission on the date hereof, (the “Report”), the undersigned officers of the Company hereby certify, pursuant to 18 U.S.C. Section 1350, as adopted pursuant to Section 906 of the Sarbanes-Oxley Act of 2002, that to the best of his knowledge:
1.The Report fully complies with the requirements of section 13(a) or 15(d) of the Securities Exchange Act of 1934; and
2.The information contained in the Report fairly presents, in all material respects, the financial condition and results of operations of the Company as of and for the period covered by the Report.
| | | | | | | | |
| Dated: March 20, 2024 | | |
| | |
| By: | /s/ Timothy Sheehy |
| | Name: Timothy Sheehy |
| | Title: Chief Executive Officer |
| | |
| Dated: March 20, 2024 | | |
| | |
| By: | /s/ Eric Gerratt |
| | Name: Eric Gerratt |
| | Title: Chief Financial Officer |
BRIDGER AEROSPACE GROUP HOLDINGS, INC.
POLICY ON RECOUPMENT OF INCENTIVE COMPENSATION
Introduction
The Compensation Committee (the “Compensation Committee”) of the Board of Directors (the “Board”) of Bridger Aerospace Group Holdings, Inc. (the “Company”) has adopted this Policy on Recoupment of Incentive Compensation (this “Policy”), which provides for the recoupment of compensation in certain circumstances in the event of a restatement of financial results by the Company.1 This Policy shall be interpreted to comply with the requirements of U.S. Securities and Exchange Commission (“SEC”) rules and Nasdaq Stock Market (“Nasdaq”) listing standards implementing Section 954 of the Dodd-Frank Wall Street Reform and Consumer Protection Act of 2010 (the “Dodd-Frank Act”) and, to the extent this Policy is in any manner deemed inconsistent with such rules, this Policy shall be treated as retroactively amended to be compliant with such rules.
Administration
This Policy shall be administered by the Compensation Committee. Any determinations made by the Compensation Committee shall be final and binding on all affected individuals. The Compensation Committee is authorized to interpret and construe this Policy and to make all determinations necessary, appropriate or advisable for the administration of this Policy, in all cases consistent with the Dodd-Frank Act. The Board or Compensation Committee may amend this Policy from time to time in its discretion.
Covered Executives
This Policy applies to any current or former “executive officer,” within the meaning of Rule 10D-1 under the Securities Exchange Act of 1934, as amended, of the Company or a subsidiary of the Company (each such individual, an “Executive”). This Policy shall be binding and enforceable against all Executives and their beneficiaries, executors, administrators, and other legal representatives.
Recoupment Upon Financial Restatement
If the Company is required to prepare an accounting restatement due to the material noncompliance of the Company with any financial reporting requirement under the securities laws, including any required accounting restatement to correct an error in previously issued financial statements that is material to the previously issued financial statements, or that would result in a material misstatement if the error were corrected in the current period or left
1 Note to Company: Consider whether the Company should adopt another policy that is more expansive and covers misconduct triggers rather than just accounting restatements. For example, this policy could be expanded to provide for recoupment in the case of Detrimental Conduct which could be defined as follows: “Detrimental Conduct” means, on the part of any Executive, (i) any misconduct or fraud that impacted any financial result or performance metric used in any Incentive-Based Compensation arrangement; (ii) any material breach of any non-solicitation, noncompetition, confidentiality or other covenant owed to the Company; (iii) any material breach of an employment agreement; (iv) any material breach of any applicable Company policy, including the Company’s [Code of Ethics for Senior Financial Officers or Code of Business Conduct and Ethics]; (v) any material failure to cooperate with an investigation conducted by the Company or any governmental authority; (vi) any conviction of a felony or a crime of moral turpitude; (vii) any instance of fraud, theft, embezzlement or material dishonesty to the detriment of the Company; or (viii) the willful engagement in conduct that is demonstrably injurious to the Company (monetarily, reputationally or otherwise). For the avoidance of doubt, the definition of “Detrimental Conduct” does not include any disclosure or reporting of possible violations of applicable law or regulation to any governmental agency or entity, including the United States Department of Justice or the SEC, or making other disclosures that are protected under the whistleblower provisions of applicable law or regulation.” Discuss.
uncorrected in the current period (a “Financial Restatement”), the Compensation Committee shall cause the Company to recoup from each Executive, as promptly as reasonably possible, any erroneously awarded Incentive-Based Compensation, as defined below.
No-Fault Recovery
Recoupment under this Policy shall be required regardless of whether the Executive or any other person was at fault or responsible for accounting errors that contributed to the need for the Financial Restatement or engaged in any misconduct.
Compensation Subject to Recovery; Enforcement
This Policy applies to all compensation granted, earned or vested based wholly or in part upon the attainment of any financial reporting measure determined and presented in accordance with the accounting principles used in preparing the Company’s financial statements, and any measure that is derived wholly or in part from such measures, whether or not presented within the Company’s financial statements or included in a filing with the SEC, including stock price and total shareholder return (“TSR”), including but not limited to performance-based cash, stock, options or other equity-based awards paid or granted to the Executive (“Incentive-Based Compensation”). Compensation that is granted, vests or is earned based solely upon the occurrence of non-financial events, such as base salary, restricted stock or options with time-based vesting, or a bonus awarded solely at the discretion of the Board or Compensation Committee and not based on the attainment of any financial measure, is not subject to this Policy.
In the event of a Financial Restatement, the amount to be recovered will be the excess of (i) the Incentive-Based Compensation received by the Executive during the Recovery Period (as defined below) based on the erroneous data and calculated without regard to any taxes paid or withheld, over (ii) the Incentive-Based Compensation that would have been received by the Executive had it been calculated based on the restated financial information, as determined by the Compensation Committee. For purposes of this Policy, “Recovery Period” means the three completed fiscal years immediately preceding the date on which the Company is required to prepare the Financial Restatement, as determined in accordance with the last sentence of this paragraph, or any transition period that results from a change in the Company’s fiscal year (as set forth in Section 5608(b)(i)(D) of the Nasdaq Listing Rules). The date on which the Company is required to prepare a Financial Restatement is the earlier to occur of (A) the date the Board or a Board committee (or authorized officers of the Company if Board action is not required) concludes, or reasonably should have concluded, that the Company is required to prepare a Financial Restatement or (B) the date a court, regulator, or other legally authorized body directs the Company to prepare a Financial Restatement.
For Incentive-Based Compensation based on stock price or TSR, where the amount of erroneously awarded compensation is not subject to mathematical recalculation directly from the information in the Financial Restatement, then the Compensation Committee shall determine the amount to be recovered based on a reasonable estimate of the effect of the Financial Restatement on the stock price or TSR upon which the Incentive-Based Compensation was received and the Company shall document the determination of that estimate and provide it to Nasdaq.
Incentive-Based Compensation is considered to have been received by an Executive in the fiscal year during which the applicable financial reporting measure was attained or purportedly attained, even if the payment or grant of such Incentive-Based Compensation occurs after the end of that period.
The Company may use any legal or equitable remedies that are available to the Company to
recoup any erroneously awarded Incentive-Based Compensation, including but not limited to by collecting from the Executive cash payments or shares of Company common stock from or by forfeiting any amounts that the Company owes to the Executive.
No Indemnification
The Company shall not indemnify any Executive or pay or reimburse the premium for any insurance policy to cover any losses incurred by such Executive under this Policy or any claims relating to the Company’s enforcement of rights under this Policy.
Exceptions
The compensation recouped under this Policy shall not include Incentive-Based Compensation received by an Executive (i) prior to beginning service as an Executive or (ii) if he or she did not serve as an Executive at any time during the performance period applicable to the Incentive-Based Compensation in question. The Compensation Committee (or a majority of independent directors serving on the Board) may determine not to seek recovery from an Executive in whole or part to the extent it determines in its sole discretion that such recovery would be impracticable because (A) the direct expense paid to a third party to assist in enforcing recovery would exceed the recoverable amount (after having made a reasonable attempt to recover the erroneously awarded Incentive-Based Compensation and providing corresponding documentation of such attempt to Nasdaq), (B) recovery would violate the home country law that was adopted prior to November 28, 2022, as determined by an opinion of counsel licensed in the applicable jurisdiction that is acceptable to and provided to Nasdaq, or (C) recovery would likely cause the Company’s 401(k) plan or any other tax-qualified retirement plan to fail to meet the requirements of Section 401(a)(13) or Section 411(a) of the Internal Revenue Code of 1986, as amended, and the regulations thereunder.
Other Remedies Not Precluded
The exercise by the Compensation Committee of any rights pursuant to this Policy shall be without prejudice to any other rights or remedies that the Company, the Board or the Compensation Committee may have with respect to any Executive subject to this Policy, whether arising under applicable law (including pursuant to Section 304 of the Sarbanes-Oxley Act of 2002), regulation or pursuant to the terms of any other policy of the Company, employment agreement, equity award, cash incentive award or other agreement applicable to an Executive. Notwithstanding the foregoing, there shall be no duplication of recovery of the same Incentive-Based Compensation under this Policy and any other such rights or remedies.
Acknowledgment
To the extent required by the Compensation Committee, each Executive shall be required to sign and return to the Company the acknowledgement form attached hereto as Exhibit A pursuant to which such Executive will agree to be bound by the terms of, and comply with, this Policy. For the avoidance of doubt, each Executive shall be fully bound by, and must comply with, the Policy, whether or not such Executive has executed and returned such acknowledgment form to the Company.
Effective Date and Applicability
This Policy has been adopted by the Compensation Committee on November 22, 2023, and shall apply to any Incentive-Based Compensation that is received by an Executive on or after October 2, 2023.
EXHIBIT A
POLICY ON RECOUPMENT OF INCENTIVE COMPENSATION
ACKNOWLEDGEMENT FORM
Capitalized terms used but not otherwise defined in this Acknowledgement Form (this “Acknowledgement Form”) shall have the meanings ascribed to such terms in the Policy.
By signing this Acknowledgement Form, the undersigned acknowledges, confirms and agrees that the undersigned: (i) has received and reviewed a copy of the Policy; (ii) is and will continue to be subject to the Policy and that the Policy will apply both during and after the undersigned’s employment with the Company; and (iii) will abide by the terms of the Policy, including, without limitation, by reasonably promptly returning any recoverable compensation to the Company as required by the Policy, as determined by the Compensation Committee in its sole discretion.
Sign: _____________________________
Name: [Employee]
Date: _____________________________