Calamos Antetokounmpo Sustainable Equities Trust
Filed: 14 Feb 25, 2:04pm
UNITED STATES
SECURITIES AND EXCHANGE COMMISSION
Washington, D.C. 20549
FORM N-CSR
CERTIFIED SHAREHOLDER REPORT OF REGISTERED
MANAGEMENT INVESTMENT COMPANIES
| INVESTMENT COMPANY ACT FILE NUMBER: | 811-23822 |
| EXACT NAME OF REGISTRANT AS SPECIFIED IN CHARTER: | Calamos Antetokounmpo Sustainable Equities Trust |
| ADDRESS OF PRINCIPAL EXECUTIVE OFFICES: | 2020 Calamos Court, Naperville |
| Illinois 60563-2787 | |
| NAME AND ADDRESS OF AGENT FOR SERVICE: | John P Calamos, Sr., |
| Global Chief Investment Officer | |
| Calamos Antetokounmpo Asset Management LLC | |
| 2020 Calamos Court, | |
| Naperville, Illinois | |
| 60563-2787 |
| REGISTRANT’S TELEPHONE NUMBER, INCLUDING AREA CODE: | (630) 245-7200 |
| DATE OF FISCAL YEAR END: | December 31, 2024 |
| DATE OF REPORTING PERIOD: | January 1, 2024 through December 31, 2024 |
ITEM 1: REPORTS TO SHAREHOLDERS.

Class A: SROAX
Annual Shareholder Report - December 31, 2024
This annual shareholder report contains important information about the Calamos Antetokounmpo Sustainable Equities Fund for the period of January 1, 2024 to December 31, 2024. You can find additional information about the Fund at www.calamos.com/resources. You can also request this information by contacting us at 800-582-6959.
(based on a hypothetical $10,000 investment)
| Class Name | Costs of a $10,000 Investment | Costs Paid as a Percentage of a $10,000 Investment |
|---|---|---|
| Class A | $145 | 1.35% |
For the 12 months ended December 31, 2024 (“annual period”), the Fund delivered strong returns as the equity market enjoyed solid economic growth and tamer inflation through 2024. While the US economy and consumers fared well for the year, it should be noted that a smaller subset of names within the market drove its performance; the largest companies capitalizing on AI opportunities performed best. To put it in perspective, the top 10 names of the S&P 500 Index accounted for approximately 63% of the benchmark’s return for the period. The Fund’s focus on quality businesses trading at more attractive valuations contributed to absolute total returns. Fund holdings within information technology, communications services, and financials were the most additive. A collective underweight to the higher valuation, momentum-driven Mag 7 stocks was a relative detractor for the year.
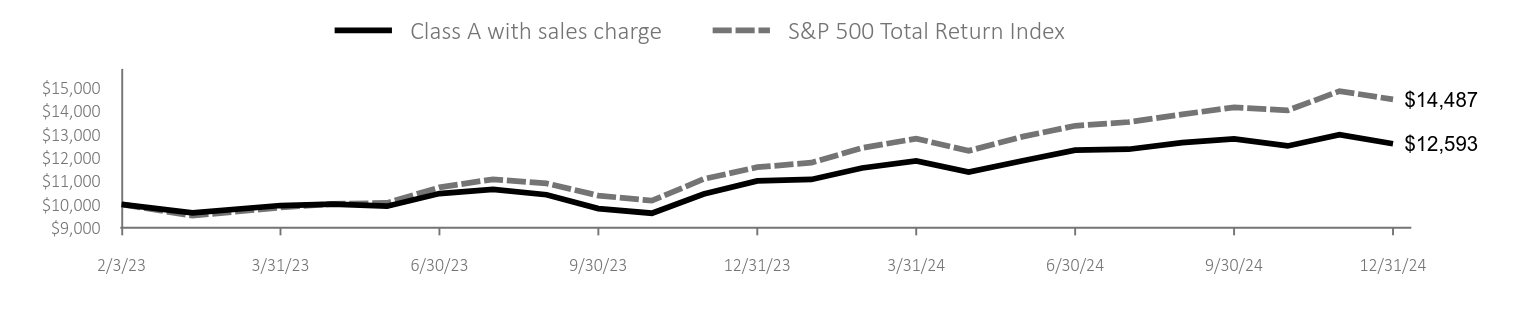
| Class A with sales charge | S&P 500 Total Return Index | |
|---|---|---|
| 2/3/23 | $10,000 | $10,000 |
| 2/28/23 | $9,640 | $9,514 |
| 3/31/23 | $9,950 | $9,864 |
| 4/30/23 | $10,010 | $10,018 |
| 5/31/23 | $9,920 | $10,061 |
| 6/30/23 | $10,460 | $10,726 |
| 7/31/23 | $10,640 | $11,071 |
| 8/31/23 | $10,410 | $10,894 |
| 9/30/23 | $9,820 | $10,375 |
| 10/31/23 | $9,620 | $10,157 |
| 11/30/23 | $10,440 | $11,084 |
| 12/31/23 | $11,003 | $11,588 |
| 1/31/24 | $11,063 | $11,783 |
| 2/29/24 | $11,554 | $12,412 |
| 3/31/24 | $11,855 | $12,811 |
| 4/30/24 | $11,384 | $12,288 |
| 5/31/24 | $11,865 | $12,897 |
| 6/30/24 | $12,316 | $13,360 |
| 7/31/24 | $12,357 | $13,522 |
| 8/31/24 | $12,637 | $13,850 |
| 9/30/24 | $12,798 | $14,146 |
| 10/31/24 | $12,497 | $14,018 |
| 11/30/24 | $12,978 | $14,841 |
| 12/31/24 | $12,593 | $14,487 |
| AATR | 1 YEAR | SINCE INCEPTION 2/3/23 |
|---|---|---|
| Class A without sales charge | 14.45 | 12.83 |
| Class A with sales charge | 8.99 | 12.83 |
| S&P 500 Total Return Index | 24.99 | 21.42 |
The Fund's past performance is not a good predictor of the Fund's future performance.
The graph and table do not reflect the deduction of taxes that a shareholder would pay on fund distributions or redemption of fund shares. Principal value and investment return of an investment will fluctuate so that your shares, when redeemed, may be worth more or less than their original cost. Average annual total return measures net investment income and capital gain or loss from portfolio investments as an annualized average. All performance shown assumes reinvestment of dividends and capital gains distributions. Visit https://www.calamos.com/funds/mutual/ for the most recent performance information.
| Total Net Assets | # of Portfolio Holdings | Portfolio Turnover Rate | Total Advisory Fees Paid |
|---|---|---|---|
| $4,580,414 | 51 | 20% | $34,032 |
Class A: SROAX
Annual Shareholder Report - December 31, 2024
The multi-cap equity Fund employs an integrated, fundamental, and sustainable process to invest in high-quality, primarily US companies that have strong financial metrics and address nonfinancial risks related to governance, ecological impact, and human development.
Sector weightings and top 10 holdings exclude, if any, cash or cash equivalents.
| SECTOR WEIGHTINGS | % OF NET ASSETS |
|---|---|
| Information Technology | 33.7 |
| Industrials | 12.8 |
| Financials | 11.9 |
| Health Care | 10.9 |
| Communication Services | 8.9 |
| Consumer Discretionary | 7.8 |
| Consumer Staples | 4.7 |
| Materials | 4.3 |
| Utilities | 2.6 |
| Real Estate | 2.4 |
| TOP 10 HOLDINGS | % OF NET ASSETS |
|---|---|
| Microsoft Corp. | 7.6 |
| Alphabet, Inc. - Class A | 7.4 |
| Apple, Inc. | 6.2 |
| NVIDIA Corp. | 5.3 |
| TJX Cos., Inc. | 3.0 |
| Broadcom, Inc. | 2.9 |
| Taiwan Semiconductor Manufacturing Co. Ltd. | 2.4 |
| Costco Wholesale Corp. | 2.4 |
| SAP SE | 2.2 |
| Visa, Inc. - Class A | 2.1 |
For additional information about the Fund, including its prospectus, financial information, holdings and proxy information, please visit www.calamos.com/resources. You can also request information by contacting us at 800-582-6959.
Calamos Investments LLC | 2020 Calamos Court | Naperville, IL 60563 | 800-582-6959 | www.calamos.com | SEQTSRA-A 24

Class C: SROCX
Annual Shareholder Report - December 31, 2024
This annual shareholder report contains important information about the Calamos Antetokounmpo Sustainable Equities Fund for the period of January 1, 2024 to December 31, 2024. You can find additional information about the Fund at www.calamos.com/resources. You can also request this information by contacting us at 800-582-6959.
(based on a hypothetical $10,000 investment)
| Class Name | Costs of a $10,000 Investment | Costs Paid as a Percentage of a $10,000 Investment |
|---|---|---|
| Class C | $224 | 2.10% |
For the 12 months ended December 31, 2024 (“annual period”), the Fund delivered strong returns as the equity market enjoyed solid economic growth and tamer inflation through 2024. While the US economy and consumers fared well for the year, it should be noted that a smaller subset of names within the market drove its performance; the largest companies capitalizing on AI opportunities performed best. To put it in perspective, the top 10 names of the S&P 500 Index accounted for approximately 63% of the benchmark’s return for the period. The Fund’s focus on quality businesses trading at more attractive valuations contributed to absolute total returns. Fund holdings within information technology, communications services, and financials were the most additive. A collective underweight to the higher valuation, momentum-driven Mag 7 stocks was a relative detractor for the year.
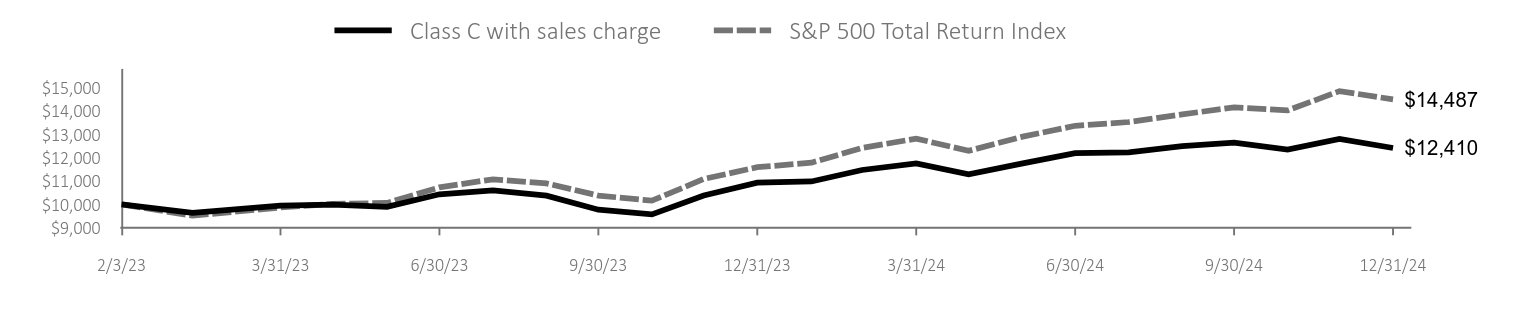
| Class C with sales charge | S&P 500 Total Return Index | |
|---|---|---|
| 2/3/23 | $10,000 | $10,000 |
| 2/28/23 | $9,640 | $9,514 |
| 3/31/23 | $9,940 | $9,864 |
| 4/30/23 | $9,990 | $10,018 |
| 5/31/23 | $9,890 | $10,061 |
| 6/30/23 | $10,430 | $10,726 |
| 7/31/23 | $10,600 | $11,071 |
| 8/31/23 | $10,370 | $10,894 |
| 9/30/23 | $9,770 | $10,375 |
| 10/31/23 | $9,570 | $10,157 |
| 11/30/23 | $10,380 | $11,084 |
| 12/31/23 | $10,930 | $11,588 |
| 1/31/24 | $10,980 | $11,783 |
| 2/29/24 | $11,470 | $12,412 |
| 3/31/24 | $11,750 | $12,811 |
| 4/30/24 | $11,280 | $12,288 |
| 5/31/24 | $11,750 | $12,897 |
| 6/30/24 | $12,190 | $13,360 |
| 7/31/24 | $12,220 | $13,522 |
| 8/31/24 | $12,490 | $13,850 |
| 9/30/24 | $12,640 | $14,146 |
| 10/31/24 | $12,340 | $14,018 |
| 11/30/24 | $12,800 | $14,841 |
| 12/31/24 | $12,410 | $14,487 |
| AATR | 1 YEAR | SINCE INCEPTION 2/3/23 |
|---|---|---|
| Class C without sales charge | 13.54 | 11.97 |
| Class C with sales charge | 12.54 | 11.97 |
| S&P 500 Total Return Index | 24.99 | 21.42 |
The Fund's past performance is not a good predictor of the Fund's future performance.
The graph and table do not reflect the deduction of taxes that a shareholder would pay on fund distributions or redemption of fund shares. Principal value and investment return of an investment will fluctuate so that your shares, when redeemed, may be worth more or less than their original cost. Average annual total return measures net investment income and capital gain or loss from portfolio investments as an annualized average. All performance shown assumes reinvestment of dividends and capital gains distributions. Visit https://www.calamos.com/funds/mutual/ for the most recent performance information.
| Total Net Assets | # of Portfolio Holdings | Portfolio Turnover Rate | Total Advisory Fees Paid |
|---|---|---|---|
| $4,580,414 | 51 | 20% | $34,032 |
Class C: SROCX
Annual Shareholder Report - December 31, 2024
The multi-cap equity Fund employs an integrated, fundamental, and sustainable process to invest in high-quality, primarily US companies that have strong financial metrics and address nonfinancial risks related to governance, ecological impact, and human development.
Sector weightings and top 10 holdings exclude, if any, cash or cash equivalents.
| SECTOR WEIGHTINGS | % OF NET ASSETS |
|---|---|
| Information Technology | 33.7 |
| Industrials | 12.8 |
| Financials | 11.9 |
| Health Care | 10.9 |
| Communication Services | 8.9 |
| Consumer Discretionary | 7.8 |
| Consumer Staples | 4.7 |
| Materials | 4.3 |
| Utilities | 2.6 |
| Real Estate | 2.4 |
| TOP 10 HOLDINGS | % OF NET ASSETS |
|---|---|
| Microsoft Corp. | 7.6 |
| Alphabet, Inc. - Class A | 7.4 |
| Apple, Inc. | 6.2 |
| NVIDIA Corp. | 5.3 |
| TJX Cos., Inc. | 3.0 |
| Broadcom, Inc. | 2.9 |
| Taiwan Semiconductor Manufacturing Co. Ltd. | 2.4 |
| Costco Wholesale Corp. | 2.4 |
| SAP SE | 2.2 |
| Visa, Inc. - Class A | 2.1 |
For additional information about the Fund, including its prospectus, financial information, holdings and proxy information, please visit www.calamos.com/resources. You can also request information by contacting us at 800-582-6959.
Calamos Investments LLC | 2020 Calamos Court | Naperville, IL 60563 | 800-582-6959 | www.calamos.com | SEQTSRA-C 24

Class I: SROIX
Annual Shareholder Report - December 31, 2024
This annual shareholder report contains important information about the Calamos Antetokounmpo Sustainable Equities Fund for the period of January 1, 2024 to December 31, 2024. You can find additional information about the Fund at www.calamos.com/resources. You can also request this information by contacting us at 800-582-6959.
(based on a hypothetical $10,000 investment)
| Class Name | Costs of a $10,000 Investment | Costs Paid as a Percentage of a $10,000 Investment |
|---|---|---|
| Class I | $118 | 1.10% |
For the 12 months ended December 31, 2024 (“annual period”), the Fund delivered strong returns as the equity market enjoyed solid economic growth and tamer inflation through 2024. While the US economy and consumers fared well for the year, it should be noted that a smaller subset of names within the market drove its performance; the largest companies capitalizing on AI opportunities performed best. To put it in perspective, the top 10 names of the S&P 500 Index accounted for approximately 63% of the benchmark’s return for the period. The Fund’s focus on quality businesses trading at more attractive valuations contributed to absolute total returns. Fund holdings within information technology, communications services, and financials were the most additive. A collective underweight to the higher valuation, momentum-driven Mag 7 stocks was a relative detractor for the year.
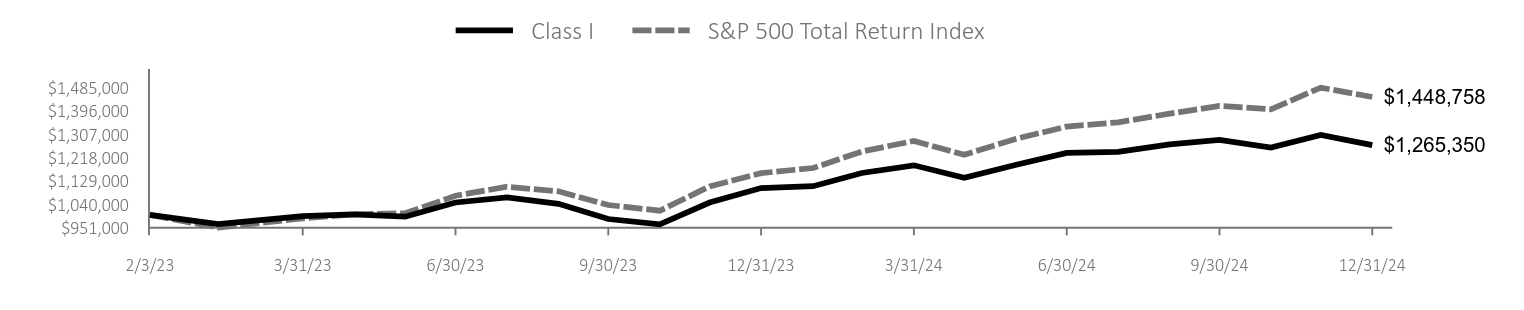
| Class I | S&P 500 Total Return Index | |
|---|---|---|
| 2/3/23 | $1,000,000 | $1,000,001 |
| 2/28/23 | $965,000 | $951,467 |
| 3/31/23 | $995,000 | $986,400 |
| 4/30/23 | $1,002,000 | $1,001,797 |
| 5/31/23 | $993,000 | $1,006,151 |
| 6/30/23 | $1,047,000 | $1,072,633 |
| 7/31/23 | $1,066,000 | $1,107,091 |
| 8/31/23 | $1,042,000 | $1,089,465 |
| 9/30/23 | $984,000 | $1,037,521 |
| 10/31/23 | $964,000 | $1,015,705 |
| 11/30/23 | $1,047,000 | $1,108,466 |
| 12/31/23 | $1,102,148 | $1,158,824 |
| 1/31/24 | $1,109,180 | $1,178,297 |
| 2/29/24 | $1,159,415 | $1,241,213 |
| 3/31/24 | $1,188,551 | $1,281,149 |
| 4/30/24 | $1,141,331 | $1,228,820 |
| 5/31/24 | $1,190,560 | $1,289,751 |
| 6/30/24 | $1,235,772 | $1,336,030 |
| 7/31/24 | $1,239,790 | $1,352,293 |
| 8/31/24 | $1,267,922 | $1,385,094 |
| 9/30/24 | $1,285,002 | $1,414,676 |
| 10/31/24 | $1,255,865 | $1,401,848 |
| 11/30/24 | $1,304,091 | $1,484,137 |
| 12/31/24 | $1,265,350 | $1,448,758 |
| AATR | 1 YEAR | SINCE INCEPTION 2/3/23 |
|---|---|---|
| Class I | 14.81 | 13.12 |
| S&P 500 Total Return Index | 24.99 | 21.42 |
The Fund's past performance is not a good predictor of the Fund's future performance.
The graph and table do not reflect the deduction of taxes that a shareholder would pay on fund distributions or redemption of fund shares. Principal value and investment return of an investment will fluctuate so that your shares, when redeemed, may be worth more or less than their original cost. Average annual total return measures net investment income and capital gain or loss from portfolio investments as an annualized average. All performance shown assumes reinvestment of dividends and capital gains distributions. Visit https://www.calamos.com/funds/mutual/ for the most recent performance information.
| Total Net Assets | # of Portfolio Holdings | Portfolio Turnover Rate | Total Advisory Fees Paid |
|---|---|---|---|
| $4,580,414 | 51 | 20% | $34,032 |
Class I: SROIX
Annual Shareholder Report - December 31, 2024
The multi-cap equity Fund employs an integrated, fundamental, and sustainable process to invest in high-quality, primarily US companies that have strong financial metrics and address nonfinancial risks related to governance, ecological impact, and human development.
Sector weightings and top 10 holdings exclude, if any, cash or cash equivalents.
| SECTOR WEIGHTINGS | % OF NET ASSETS |
|---|---|
| Information Technology | 33.7 |
| Industrials | 12.8 |
| Financials | 11.9 |
| Health Care | 10.9 |
| Communication Services | 8.9 |
| Consumer Discretionary | 7.8 |
| Consumer Staples | 4.7 |
| Materials | 4.3 |
| Utilities | 2.6 |
| Real Estate | 2.4 |
| TOP 10 HOLDINGS | % OF NET ASSETS |
|---|---|
| Microsoft Corp. | 7.6 |
| Alphabet, Inc. - Class A | 7.4 |
| Apple, Inc. | 6.2 |
| NVIDIA Corp. | 5.3 |
| TJX Cos., Inc. | 3.0 |
| Broadcom, Inc. | 2.9 |
| Taiwan Semiconductor Manufacturing Co. Ltd. | 2.4 |
| Costco Wholesale Corp. | 2.4 |
| SAP SE | 2.2 |
| Visa, Inc. - Class A | 2.1 |
For additional information about the Fund, including its prospectus, financial information, holdings and proxy information, please visit www.calamos.com/resources. You can also request information by contacting us at 800-582-6959.
Calamos Investments LLC | 2020 Calamos Court | Naperville, IL 60563 | 800-582-6959 | www.calamos.com | SEQTSRA-I 24

Class R6: SRORX
Annual Shareholder Report - December 31, 2024
This annual shareholder report contains important information about the Calamos Antetokounmpo Sustainable Equities Fund for the period of January 1, 2024 to December 31, 2024. You can find additional information about the Fund at www.calamos.com/resources. You can also request this information by contacting us at 800-582-6959.
(based on a hypothetical $10,000 investment)
| Class Name | Costs of a $10,000 Investment | Costs Paid as a Percentage of a $10,000 Investment |
|---|---|---|
| Class R6 | $115 | 1.07% |
For the 12 months ended December 31, 2024 (“annual period”), the Fund delivered strong returns as the equity market enjoyed solid economic growth and tamer inflation through 2024. While the US economy and consumers fared well for the year, it should be noted that a smaller subset of names within the market drove its performance; the largest companies capitalizing on AI opportunities performed best. To put it in perspective, the top 10 names of the S&P 500 Index accounted for approximately 63% of the benchmark’s return for the period. The Fund’s focus on quality businesses trading at more attractive valuations contributed to absolute total returns. Fund holdings within information technology, communications services, and financials were the most additive. A collective underweight to the higher valuation, momentum-driven Mag 7 stocks was a relative detractor for the year.
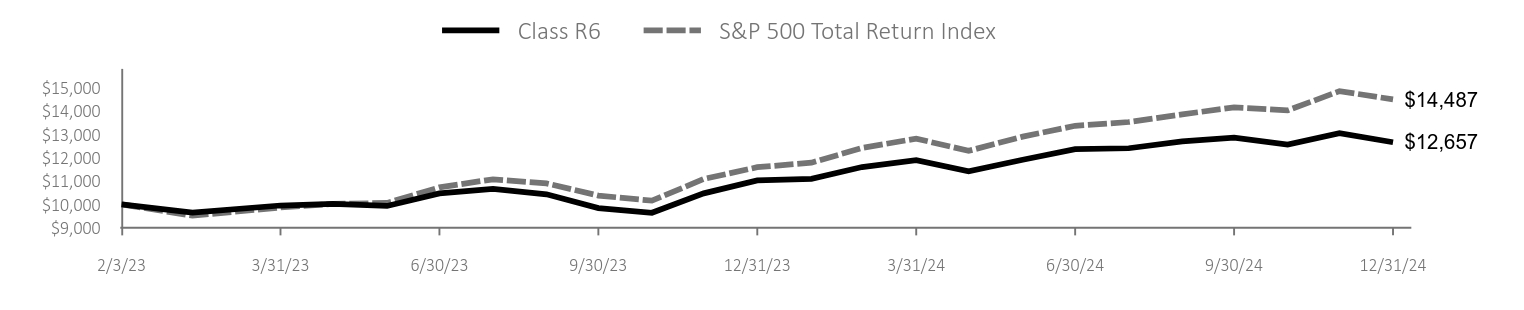
| Class R6 | S&P 500 Total Return Index | |
|---|---|---|
| 2/3/23 | $10,000 | $10,000 |
| 2/28/23 | $9,650 | $9,514 |
| 3/31/23 | $9,950 | $9,864 |
| 4/30/23 | $10,020 | $10,018 |
| 5/31/23 | $9,930 | $10,061 |
| 6/30/23 | $10,470 | $10,726 |
| 7/31/23 | $10,660 | $11,071 |
| 8/31/23 | $10,430 | $10,894 |
| 9/30/23 | $9,840 | $10,375 |
| 10/31/23 | $9,640 | $10,157 |
| 11/30/23 | $10,470 | $11,084 |
| 12/31/23 | $11,022 | $11,588 |
| 1/31/24 | $11,092 | $11,783 |
| 2/29/24 | $11,595 | $12,412 |
| 3/31/24 | $11,886 | $12,811 |
| 4/30/24 | $11,414 | $12,288 |
| 5/31/24 | $11,906 | $12,897 |
| 6/30/24 | $12,358 | $13,360 |
| 7/31/24 | $12,399 | $13,522 |
| 8/31/24 | $12,690 | $13,850 |
| 9/30/24 | $12,851 | $14,146 |
| 10/31/24 | $12,559 | $14,018 |
| 11/30/24 | $13,042 | $14,841 |
| 12/31/24 | $12,657 | $14,487 |
| AATR | 1 YEAR | SINCE INCEPTION 2/3/23 |
|---|---|---|
| Class R6 | 14.84 | 13.13 |
| S&P 500 Total Return Index | 24.99 | 21.42 |
The Fund's past performance is not a good predictor of the Fund's future performance.
The graph and table do not reflect the deduction of taxes that a shareholder would pay on fund distributions or redemption of fund shares. Principal value and investment return of an investment will fluctuate so that your shares, when redeemed, may be worth more or less than their original cost. Average annual total return measures net investment income and capital gain or loss from portfolio investments as an annualized average. All performance shown assumes reinvestment of dividends and capital gains distributions. Visit https://www.calamos.com/funds/mutual/ for the most recent performance information.
| Total Net Assets | # of Portfolio Holdings | Portfolio Turnover Rate | Total Advisory Fees Paid |
|---|---|---|---|
| $4,580,414 | 51 | 20% | $34,032 |
Class R6: SRORX
Annual Shareholder Report - December 31, 2024
The multi-cap equity Fund employs an integrated, fundamental, and sustainable process to invest in high-quality, primarily US companies that have strong financial metrics and address nonfinancial risks related to governance, ecological impact, and human development.
Sector weightings and top 10 holdings exclude, if any, cash or cash equivalents.
| SECTOR WEIGHTINGS | % OF NET ASSETS |
|---|---|
| Information Technology | 33.7 |
| Industrials | 12.8 |
| Financials | 11.9 |
| Health Care | 10.9 |
| Communication Services | 8.9 |
| Consumer Discretionary | 7.8 |
| Consumer Staples | 4.7 |
| Materials | 4.3 |
| Utilities | 2.6 |
| Real Estate | 2.4 |
| TOP 10 HOLDINGS | % OF NET ASSETS |
|---|---|
| Microsoft Corp. | 7.6 |
| Alphabet, Inc. - Class A | 7.4 |
| Apple, Inc. | 6.2 |
| NVIDIA Corp. | 5.3 |
| TJX Cos., Inc. | 3.0 |
| Broadcom, Inc. | 2.9 |
| Taiwan Semiconductor Manufacturing Co. Ltd. | 2.4 |
| Costco Wholesale Corp. | 2.4 |
| SAP SE | 2.2 |
| Visa, Inc. - Class A | 2.1 |
For additional information about the Fund, including its prospectus, financial information, holdings and proxy information, please visit www.calamos.com/resources. You can also request information by contacting us at 800-582-6959.
Calamos Investments LLC | 2020 Calamos Court | Naperville, IL 60563 | 800-582-6959 | www.calamos.com | SEQTSRA-R6 24
Item 2: Code of Ethics.
(a) As of the end of the period covered by this report, the registrant has adopted a code of ethics (the “Code of Ethics”) that applies to its principal executive officer, principal financial officer, principal accounting officer or controller, or person performing similar functions.
(b) No response required.
(c) The registrant has not amended its Code of Ethics as it relates to any element of the code of ethics definition enumerated in paragraph(b) of this Item 2 during the period covered by this report.
(d) The registrant has not granted a waiver or an implicit waiver from its Code of Ethics during the period covered by this report.
(e) Not applicable.
(f) (1) The registrant’s Code of Ethics is attached as an Exhibit hereto.
Item 3: Audit Committee Financial Expert.
The registrant’s Board of Trustees has determined that, for the period covered by the shareholder report presented in Item 1 hereto, it has five audit committee financial experts serving on its audit committee, each of whom is an independent Trustee for purpose of this N-CSR item: John E. Neal, William R. Rybak, Virginia G. Breen, Karen L. Stuckey and Christopher M. Toub. Under applicable securities laws, a person who is determined to be an audit committee financial expert will not be deemed an “expert” for any purpose, including without limitation for the purposes of Section 11 of the Securities Act of 1933, as a result of being designated or identified as an audit committee financial expert pursuant to this Item. The designation or identification of a person as an audit committee financial expert does not impose on such person any duties, obligations, or liabilities that are greater than the duties, obligations and liabilities imposed on such person as a member of audit committee and board of directors in the absence of such designation or identification. The designation or identification of a person as an audit committee financial expert pursuant to this Item does not affect the duties, obligations, or liabilities of any other member of the audit committee or board of directors.
Item 4: Principal Accountant Fees and Services.
| Fiscal Years Ended | 12/31/2023 | 12/31/2024 | ||||||
| Audit Fees (a) | $ | 31,000 | $ | 31,900 | ||||
| Audit-Related Fees(b) | $ | 12,240 | $ | 17,160 | ||||
| Tax Fees(c) | $ | - | $ | - | ||||
| All Other Fees(d) | $ | - | $ | - | ||||
| Total | $ | 43,240 | $ | 49,060 | ||||
(a) Audit fees are the aggregate fees billed in each of the last two fiscal years for professional services rendered by the principal accountant to the registrant for the audit of the registrant’s annual financial statements or services that are normally provided by the accountant in connection with statutory and regulatory filings or engagements for those fiscal years.
(b) Audit-related fees are the aggregate fees billed in each of the last two fiscal years for assurance and related services rendered by the principal accountant to the registrant that are reasonably related to the performance of the audit of the registrant’s financial statements and are not reported under paragraph (a) of this Item 4.
(c) Tax fees are the aggregate fees billed in each of the last two fiscal years for professional services rendered by the principal accountant to the registrant for tax compliance, tax advice and tax planning.
(d) All other fees are the aggregate fees billed in each of the last two fiscal years for products and services provided by the principal accountant to the registrant, other than the services reported in paragraph (a)-(c) of this Item 4.
(e) (1) Registrant’s audit committee meets with the principal accountants and management to review and pre-approve all audit services to be provided by the principal accountants.
The audit committee shall pre-approve all non-audit services to be provided by the principal accountants to the registrant, including the fees and other compensation to be paid to the principal accountants; provided that the pre-approval of non-audit services is waived if (i) the services were not recognized by management at the time of the engagement as non-audit services, (ii) the aggregate fees for all non-audit services provided to the registrant are less than 5% of the total fees paid by the registrant to its principal accountants during the fiscal year in which the non-audit services are provided, and (iii) such services are promptly brought to the attention of the audit committee by management and the audit committee approves them prior to the completion of the audit.
The audit committee shall pre-approve all non-audit services to be provided by the principal accountants to the investment adviser or any entity controlling, controlled by or under common control with the adviser that provides ongoing services to the registrant if the engagement relates directly to the operations or financial reporting of the registrant, including the fees and other compensation to be paid to the principal accountants; provided that pre-approval of non-audit services to the adviser or an affiliate of the adviser is not required if (i) the services were not recognized by management at the time of the engagement as non-audit services, (ii) the aggregate fees for all non-audit services provided to the adviser and all entities controlling, controlled by or under common control with the adviser are less than 5% of the total fees for non-audit services requiring pre-approval under paragraph (e)(1) of this Item 4 paid by the registrant, the adviser or its affiliates to the registrant’s principal accountants during the fiscal year in which the non-audit services are provided, and (iii) such services are promptly brought to the attention of the audit committee by management and the audit committee approves them prior to the completion of the audit.
(e) (2) No percentage of the principal accountant’s fees or services described in each of paragraphs (b)–(d) of this Item were approved pursuant to the waiver provision paragraph (c)(7)(i)(C) of Rule 2-01 of Regulation S-X.
(f) No disclosures are required by this Item 4(f).
(g) The following table presents the aggregate non-audit fees billed in each of the last two fiscal years for services rendered by the principal accountant to the registrant and the aggregate non-audit fees billed in each of the last two fiscal years for services rendered by the principal accountant to the investment advisor or any entity controlling, controlled by or under common control of the adviser.
| Fiscal Years Ended | 12/31/2023 | 12/31/2024 | ||||||
| Registrant | $ | - | $ | - | ||||
| Investment Adviser | $ | - | $ | - |
(h) No disclosures are required by this Item 4(h).
(i) Not applicable.
(j) Not applicable.
Item 5: Audit Committee of Listed Registrants.
Not applicable.
Item 6: Investments.
Not applicable. The complete schedule of investments is included in the financial statements filed under Item 7 of this Form.
Item 7: Financial Statements and Financial Highlights for Open-End Management Investment Companies.

TIMELY INFORMATION INSIDE


Calamos Antetokounmpo Sustainable Equities Fund
ANNUAL FINANCIAL STATEMENTS AND OTHER INFORMATION DECEMBER 31, 2024

Visit www.calamos.com/paperless to enroll. You can view shareholder communications, including fund prospectuses, annual reports and other shareholder materials online long before the printed publications arrive by traditional mail.

TABLE OF CONTENTS
1 | |||||||
2 | |||||||
3 | |||||||
4 | |||||||
8 | |||||||
9 | |||||||
15 | |||||||
16 | |||||||
ASSETS | |||||||
Investments in securities, at value (cost $3,783,435) | $ | 4,580,829 | |||||
Cash with custodian | 22,184 | ||||||
Receivables: | |||||||
Accrued dividends | 3,664 | ||||||
Due from Investment advisor | 6,204 | ||||||
Prepaid expenses | 866 | ||||||
Total assets | 4,613,747 | ||||||
LIABILITIES | |||||||
Payables: | |||||||
Affiliates: | |||||||
Investment advisory fees | 3,392 | ||||||
Distribution fees | 10 | ||||||
Trustees' fees and officer compensation | 135 | ||||||
Other accounts payable and accrued liabilities | 29,796 | ||||||
Total liabilities | 33,333 | ||||||
NET ASSETS | $ | 4,580,414 | |||||
COMPOSITION OF NET ASSETS | |||||||
Paid in capital | $ | 3,792,865 | |||||
Accumulated distributable earnings (loss) | 787,549 | ||||||
NET ASSETS | $ | 4,580,414 | |||||
CLASS A SHARES† | |||||||
Net assets applicable to shares outstanding | $ | 183,733 | |||||
Shares outstanding | 14,651 | ||||||
Net asset value and redemption price per share | $ | 12.54 | |||||
Maximum offering price per share (Net asset value, plus 4.75% of offering price) | $ | 13.17 | |||||
CLASS C SHARES†** | |||||||
Net assets applicable to shares outstanding | $ | 124,152 | |||||
Shares outstanding | 10,000 | ||||||
Net asset value and redemption price per share | $ | 12.42 | |||||
CLASS I SHARES† | |||||||
Net assets applicable to shares outstanding | $ | 4,145,947 | |||||
Shares outstanding | 330,353 | ||||||
Net asset value and redemption price per share | $ | 12.55 | |||||
CLASS R6 SHARES† | |||||||
Net assets applicable to shares outstanding | $ | 126,582 | |||||
Shares outstanding | 10,086 | ||||||
Net asset value and redemption price per share | $ | 12.55 | |||||
† No par value; unlimited number of shares authorized.
** Redemption price may be reduced by contingent deferred sales charge.
See accompanying Notes to Financial Statements
www.calamos.com
1
INVESTMENT INCOME | |||||||
Interest | $ | 6,908 | |||||
Dividends | 53,605 | ||||||
Dividend taxes withheld | (1,085 | ) | |||||
Total investment income | 59,428 | ||||||
EXPENSES | |||||||
Investment advisory fees | 34,032 | ||||||
Distribution fees | |||||||
Class A | 432 | ||||||
Class C | 1,199 | ||||||
Registration fees | 76,707 | ||||||
Audit fees | 48,160 | ||||||
Printing and mailing fees | 31,170 | ||||||
Trustees' fees and officer compensation | 12,628 | ||||||
Transfer agent fees | 8,581 | ||||||
Accounting fees | 7,915 | ||||||
Legal fees | 2,911 | ||||||
Custodian fees | 764 | ||||||
Tax fees | 735 | ||||||
Fund administration fees | 161 | ||||||
Other | 10,755 | ||||||
Total expenses | 236,150 | ||||||
Less expense reductions | (190,510 | ) | |||||
Net expenses | 45,640 | ||||||
NET INVESTMENT INCOME (LOSS) | 13,788 | ||||||
REALIZED AND UNREALIZED GAIN (LOSS) | |||||||
Net realized gain (loss) from: | |||||||
Investments | 21,542 | ||||||
Foreign currency transactions | (5 | ) | |||||
Change in net unrealized appreciation/(depreciation) on: | |||||||
Investments | 468,850 | ||||||
NET GAIN (LOSS) | 490,387 | ||||||
NET INCREASE (DECREASE) IN NET ASSETS RESULTING FROM OPERATIONS | $ | 504,175 | |||||
See accompanying Notes to Financial Statements
CALAMOS ANTETOKOUNMPO SUSTAINABLE EQUITIES TRUST ANNUAL REPORT
2
| FOR THE YEAR ENDED DECEMBER 31, 2024 | FEBRUARY 3, 2023(a) THROUGH DECEMBER 31, 2023 | ||||||||||
OPERATIONS | |||||||||||
Net investment income (loss) | $ | 13,788 | $ | 15,149 | |||||||
Net realized gain (loss) | 21,537 | (31,505 | ) | ||||||||
Change in unrealized appreciation/(depreciation) | 468,850 | 328,544 | |||||||||
Net increase (decrease) in net assets resulting from operations | 504,175 | 312,188 | |||||||||
DISTRIBUTIONS TO SHAREHOLDERS | |||||||||||
Class A | (230 | ) | (452 | ) | |||||||
Class I | (14,852 | ) | (14,595 | ) | |||||||
Class R6 | (486 | ) | (517 | ) | |||||||
Total distributions | (15,568 | ) | (15,564 | ) | |||||||
CAPITAL SHARE TRANSACTIONS | 567,653 | 3,127,530 | |||||||||
TOTAL INCREASE (DECREASE) IN NET ASSETS | 1,056,260 | 3,424,154 | |||||||||
NET ASSETS | |||||||||||
Beginning of year | $ | 3,524,154 | $ | 100,000 | |||||||
End of year | $ | 4,580,414 | $ | 3,524,154 | |||||||
(a) Commencement of operations.
See accompanying Notes to Financial Statements
www.calamos.com
3
Selected data for a share outstanding throughout each year were as follows:
Class A | |||||||||||
Year Ended December 31, 2024 | February 3, 2023• through December 31, 2023 | ||||||||||
Net asset value, beginning of year | $ | 10.97 | $ | 10.00 | |||||||
Income from investment operations: | |||||||||||
Net investment income (loss)(a) | 0.02 | 0.03 | |||||||||
Net realized and unrealized gain (loss) | 1.57 | 0.97 | |||||||||
Total from investment operations | 1.59 | 1.00 | |||||||||
Distributions: | |||||||||||
Dividends from net investment income | (0.02 | ) | (0.03 | ) | |||||||
Dividends from net realized gains | — | — | |||||||||
Total distributions** | (0.02 | ) | (0.03 | ) | |||||||
Net asset value, end of year | $ | 12.54 | $ | 10.97 | |||||||
Ratios and supplemental data: | |||||||||||
Total return(b) | 14.45 | % | 10.03 | % | |||||||
Net assets, end of year (000) | $ | 184 | $ | 157 | |||||||
Ratio of net expenses to average net assets | 1.35 | % | 1.35 | %(c) | |||||||
Ratio of gross expenses to average net assets prior to expense reductions | 6.11 | % | 10.24 | %(c) | |||||||
Ratio of net investment income (loss) to average net assets | 0.15 | % | 0.37 | %(c) | |||||||
Year Ended December 31, 2024 | February 3, 2023• through December 31, 2023 | ||||||||||
Portfolio turnover rate | 20 | % | 11 | %(d) | |||||||
• Commencement of operations.
** Distribution, if any, for annual periods determined in accordance with federal income tax regulations.
(a) Net investment income (loss) allocated based on average shares method.
(b) Total return measures net investment income (loss) and capital gain or loss from portfolio investments assuming reinvestment of dividends and capital gains distributions. Total return is not annualized for periods that are less than a full year, does not reflect the effect of sales charge for Class A shares nor the contingent deferred sales charge for Class C shares and does not reflect the deduction of taxes that a shareholder would pay on fund distributions or the redemption of fund shares.
(c) Annualized.
(d) Not annualized.
CALAMOS ANTETOKOUNMPO SUSTAINABLE EQUITIES TRUST ANNUAL REPORT
4
Financial Highlights
Selected data for a share outstanding throughout each year were as follows:
Class C | |||||||||||
Year Ended December 31, 2024 | February 3, 2023• through December 31, 2023 | ||||||||||
Net asset value, beginning of year | $ | 10.93 | $ | 10.00 | |||||||
Income from investment operations: | |||||||||||
Net investment income (loss)(a) | (0.07 | )(b) | (0.03 | )(b) | |||||||
Net realized and unrealized gain (loss) | 1.56 | 0.96 | |||||||||
Total from investment operations | 1.49 | 0.93 | |||||||||
Distributions: | |||||||||||
Dividends from net investment income | — | — | |||||||||
Dividends from net realized gains | — | — | |||||||||
Total distributions** | — | — | |||||||||
Net asset value, end of year | $ | 12.42 | $ | 10.93 | |||||||
Ratios and supplemental data: | |||||||||||
Total return(c) | 13.54 | % | 9.30 | % | |||||||
Net assets, end of year (000) | $ | 124 | $ | 109 | |||||||
Ratio of net expenses to average net assets | 2.10 | % | 2.10 | %(d) | |||||||
Ratio of gross expenses to average net assets prior to expense reductions | 6.86 | % | 10.99 | %(d) | |||||||
Ratio of net investment income (loss) to average net assets | (0.60 | %) | (0.38 | %)(d) | |||||||
• Commencement of operations.
** Distribution, if any, for annual periods determined in accordance with federal income tax regulations.
(a) Net investment income (loss) allocated based on average shares method.
(b) The amount shown for a share outstanding throughout the period may not correlate with the net investment income on the Statement of Operations for the period due to class specific expenses.
(c) Total return measures net investment income (loss) and capital gain or loss from portfolio investments assuming reinvestment of dividends and capital gains distributions. Total return is not annualized for periods that are less than a full year, does not reflect the effect of sales charge for Class A shares nor the contingent deferred sales charge for Class C shares and does not reflect the deduction of taxes that a shareholder would pay on fund distributions or the redemption of fund shares.
(d) Annualized.
www.calamos.com
5
Financial Highlights
Selected data for a share outstanding throughout each year were as follows:
Class I | |||||||||||
Year Ended December 31, 2024 | February 3, 2023• through December 31, 2023 | ||||||||||
Net asset value, beginning of year | $ | 10.97 | $ | 10.00 | |||||||
Income from investment operations: | |||||||||||
Net investment income (loss)(a) | 0.05 | 0.06 | |||||||||
Net realized and unrealized gain (loss) | 1.58 | 0.96 | |||||||||
Total from investment operations | 1.63 | 1.02 | |||||||||
Distributions: | |||||||||||
Dividends from net investment income | (0.05 | ) | (0.05 | ) | |||||||
Dividends from net realized gains | — | — | |||||||||
Total distributions** | (0.05 | ) | (0.05 | ) | |||||||
Net asset value, end of year | $ | 12.55 | $ | 10.97 | |||||||
Ratios and supplemental data: | |||||||||||
Total return(b) | 14.81 | % | 10.21 | % | |||||||
Net assets, end of year (000) | $ | 4,146 | $ | 3,148 | |||||||
Ratio of net expenses to average net assets | 1.10 | % | 1.10 | %(c) | |||||||
Ratio of gross expenses to average net assets prior to expense reductions | 5.86 | % | 9.99 | %(c) | |||||||
Ratio of net investment income (loss) to average net assets | 0.38 | % | 0.63 | %(c) | |||||||
• Commencement of operations.
** Distribution, if any, for annual periods determined in accordance with federal income tax regulations.
(a) Net investment income (loss) allocated based on average shares method.
(b) Total return measures net investment income (loss) and capital gain or loss from portfolio investments assuming reinvestment of dividends and capital gains distributions. Total return is not annualized for periods that are less than a full year, does not reflect the effect of sales charge for Class A shares nor the contingent deferred sales charge for Class C shares and does not reflect the deduction of taxes that a shareholder would pay on fund distributions or the redemption of fund shares.
(c) Annualized.
CALAMOS ANTETOKOUNMPO SUSTAINABLE EQUITIES TRUST ANNUAL REPORT
6
Financial Highlights
Selected data for a share outstanding throughout each year were as follows:
Class R6 | |||||||||||
Year Ended December 31, 2024 | February 3, 2023• through December 31, 2023 | ||||||||||
Net asset value, beginning of year | $ | 10.97 | $ | 10.00 | |||||||
Income from investment operations: | |||||||||||
Net investment income (loss)(a) | 0.05 | 0.06 | |||||||||
Net realized and unrealized gain (loss) | 1.58 | 0.96 | |||||||||
Total from investment operations | 1.63 | 1.02 | |||||||||
Distributions: | |||||||||||
Dividends from net investment income | (0.05 | ) | (0.05 | ) | |||||||
Dividends from net realized gains | — | — | |||||||||
Total distributions** | (0.05 | ) | (0.05 | ) | |||||||
Net asset value, end of year | $ | 12.55 | $ | 10.97 | |||||||
Ratios and supplemental data: | |||||||||||
Total return(b) | 14.84 | % | 10.22 | % | |||||||
Net assets, end of year (000) | $ | 127 | $ | 110 | |||||||
Ratio of net expenses to average net assets | 1.07 | % | 1.09 | %(c) | |||||||
Ratio of gross expenses to average net assets prior to expense reductions | 5.86 | % | 9.98 | %(c) | |||||||
Ratio of net investment income (loss) to average net assets | 0.42 | % | 0.63 | %(c) | |||||||
• Commencement of operations.
** Distribution, if any, for annual periods determined in accordance with federal income tax regulations.
(a) Net investment income (loss) allocated based on average shares method.
(b) Total return measures net investment income (loss) and capital gain or loss from portfolio investments assuming reinvestment of dividends and capital gains distributions. Total return is not annualized for periods that are less than a full year, does not reflect the effect of sales charge for Class A shares nor the contingent deferred sales charge for Class C shares and does not reflect the deduction of taxes that a shareholder would pay on fund distributions or the redemption of fund shares.
(c) Annualized.
www.calamos.com
7
| NUMBER OF SHARES | VALUE | ||||||||||
COMMON STOCKS (100.0%) | |||||||||||
Communication Services (8.9%) | |||||||||||
| 1,793 | Alphabet, Inc. - Class A | $ | 339,415 | ||||||||
| 1,723 | Verizon Communications, Inc. | 68,903 | |||||||||
408,318 | |||||||||||
Consumer Discretionary (7.8%) | |||||||||||
| 222 | Home Depot, Inc. | 86,356 | |||||||||
| 3,845 | Sony Group Corp. (ADR) | 81,360 | |||||||||
| 1,122 | TJX Companies, Inc. | 135,549 | |||||||||
| 1,015 | Tractor Supply Company | 53,856 | |||||||||
357,121 | |||||||||||
Consumer Staples (4.7%) | |||||||||||
| 732 | Colgate-Palmolive Company | 66,546 | |||||||||
| 118 | Costco Wholesale Corp. | 108,120 | |||||||||
| 1,151 | Darling Ingredients, Inc.# | 38,777 | |||||||||
213,443 | |||||||||||
Financials (11.9%) | |||||||||||
| 362 | Fiserv, Inc.# | 74,362 | |||||||||
| 930 | HDFC Bank, Ltd. (ADR) | 59,390 | |||||||||
| 556 | Intercontinental Exchange, Inc. | 82,850 | |||||||||
| 364 | Jack Henry & Associates, Inc. | 63,809 | |||||||||
| 155 | S&P Global, Inc. | 77,195 | |||||||||
| 368 | Travelers Companies, Inc. | 88,647 | |||||||||
| 308 | Visa, Inc. - Class A | 97,340 | |||||||||
543,593 | |||||||||||
Health Care (10.9%) | |||||||||||
| 751 | Edwards Lifesciences Corp.# | 55,597 | |||||||||
| 859 | Gilead Sciences, Inc. | 79,346 | |||||||||
| 763 | Merck & Company, Inc. | 75,903 | |||||||||
| 842 | Novo Nordisk, A/S (ADR) | 72,429 | |||||||||
| 164 | Thermo Fisher Scientific, Inc. | 85,318 | |||||||||
| 156 | UnitedHealth Group, Inc. | 78,914 | |||||||||
| 324 | Zoetis, Inc. | 52,789 | |||||||||
500,296 | |||||||||||
Industrials (12.8%) | |||||||||||
| 703 | Canadian Pacific Kansas City, Ltd. | 50,876 | |||||||||
| 117 | Deere & Company | 49,573 | |||||||||
| 248 | Ferguson Enterprises, Inc. | 43,045 | |||||||||
| 910 | nVent Electric, PLC | 62,026 | |||||||||
| 669 | Otis Worldwide Corp. | 61,956 | |||||||||
| 247 | Quanta Services, Inc. | 78,064 | |||||||||
| 199 | Rockwell Automation, Inc. | 56,872 | |||||||||
| 201 | Trane Technologies, PLC | 74,239 | |||||||||
| 194 | Verisk Analytics, Inc. | 53,434 | |||||||||
| 283 | Waste Management, Inc. | 57,107 | |||||||||
587,192 | |||||||||||
| NUMBER OF SHARES | VALUE | ||||||||||
Information Technology (33.7%) | |||||||||||
| 198 | Accenture, PLC - Class A | $ | 69,654 | ||||||||
| 99 | Adobe, Inc.# | 44,023 | |||||||||
| 1,130 | Apple, Inc. | 282,975 | |||||||||
| 378 | Applied Materials, Inc. | 61,474 | |||||||||
| 571 | Broadcom, Inc. | 132,381 | |||||||||
| 830 | Microsoft Corp. | 349,845 | |||||||||
| 1,806 | NVIDIA Corp. | 242,528 | |||||||||
| 405 | SAP, SE (ADR) | 99,715 | |||||||||
| 568 | Taiwan Semiconductor Manufacturing Company, Ltd. (ADR) | 112,174 | |||||||||
| 534 | TE Connectivity, PLC | 76,346 | |||||||||
| 393 | Texas Instruments, Inc. | 73,692 | |||||||||
1,544,807 | |||||||||||
Materials (4.3%) | |||||||||||
| 1,035 | Ball Corp. | 57,059 | |||||||||
| 276 | Ecolab, Inc. | 64,672 | |||||||||
| 183 | Linde, PLC | 76,617 | |||||||||
198,348 | |||||||||||
Real Estate (2.4%) | |||||||||||
| 376 | American Tower Corp. | 68,962 | |||||||||
| 400 | Prologis, Inc. | 42,280 | |||||||||
111,242 | |||||||||||
Utilities (2.6%) | |||||||||||
| 971 | National Grid, PLC (ADR) | 57,697 | |||||||||
| 670 | Sempra | 58,772 | |||||||||
116,469 | |||||||||||
| TOTAL COMMON STOCKS (Cost $3,783,435) | 4,580,829 | ||||||||||
| TOTAL INVESTMENTS (100.0%) (Cost $3,783,435) | 4,580,829 | ||||||||||
LIABILITIES, LESS OTHER ASSETS (0.0%) | (415 | ) | |||||||||
NET ASSETS (100.0%) | $ | 4,580,414 | |||||||||
NOTES TO SCHEDULE OF INVESTMENTS
# Non-income producing security.
ABBREVIATION
ADR American Depositary Receipt
See accompanying Notes to Schedule of Investments
CALAMOS ANTETOKOUNMPO SUSTAINABLE EQUITIES TRUST ANNUAL REPORT
8
Note 1 – Organization and Significant Accounting Policies
Organization. Calamos Antetokounmpo Sustainable Equities Trust (the "Trust"), a Delaware statutory trust organized on August 15, 2022, consists of a single series, Calamos Antetokounmpo Sustainable Equities Fund (the "Fund"), which commenced operations on February 3, 2023. Prior to commencement of operations, the Fund had issued 10,000 shares of beneficial interest at an aggregate purchase price of $100,000 to Calamos Investments, LLC, the parent of Calamos Advisors, LLC. The Trust currently offers Class A, Class C, Class I, and Class R6 shares. The Fund's investment objective is long-term capital appreciation.
Calamos Antetokounmpo Asset Management LLC ("CGAM", or the "Adviser"), serves as the Fund's adviser. CGAM is jointly owned by Calamos Advisors LLC ("Calamos Advisors") and Original C Fund, LLC, an entity whose voting rights are wholly owned by Original PE, LLC which, in turn, is wholly owned by Giannis Sina Ugo Antetokounmpo. Calamos Advisors LLC serves as the Fund's subadviser ("Subadviser").
Mr. Antetokounmpo serves on the Adviser's Board of Directors and has indirect control of half of the Adviser's Board of Directors. Mr. Antetokounmpo is not a portfolio manager of the Fund and will not be involved in the day-to-day management of the Fund's investments, and neither Original C nor Mr. Antetokounmpo shall provide any "investment advice" to the Fund. Mr. Antetokounmpo provided input in selecting the initial strategy for the Fund. Mr. Antetokounmpo will be involved with marketing efforts on behalf of the Adviser. If Mr. Antetokounmpo is no longer involved with the Fund or the Adviser then "Antetokounmpo" will be removed from the name of the Fund and the Adviser. Further, shareholders would be notified of any change in the name of the Fund or its strategy. The Adviser is jointly owned and controlled by Calamos Advisors LLC and, indirectly, by Mr. Antetokounmpo, a well-known professional athlete. Unanticipated events, including, without limitation, death, adverse reputational events or business disputes, could result in Mr. Antetokounmpo no longer being associated or involved with the Adviser. Any such event could adversely impact the Fund and result in shareholders experiencing substantial losses.
The Fund will, under normal circumstances, invest at least 80% of its net assets (plus borrowings for investment purposes, if any) in equity securities of issuers domiciled in the U.S. that, in the view of the Subadviser, have above average growth potential and meet certain environmental, social and governance ("ESG") criteria. The Fund may invest up to 20% of its net assets in American Depositary Receipts ("ADRs"), which are securities representing equity ownership in foreign issuers. The Fund may invest in companies of any size and seeks diversification by economic sector.
Significant Accounting Policies. The financial statements have been prepared in conformity with accounting principles generally accepted in the United States of America (U.S. GAAP), and the Fund is considered an investment company under U.S. GAAP and follows the accounting and reporting guidance applicable to investment companies. Under U.S. GAAP, management is required to make certain estimates and assumptions at the date of the financial statements and actual results may differ from those estimates. Subsequent events, if any, through the date that the financial statements were issued, have been evaluated in the preparation of the financial statements. The following summarizes the significant accounting policies of the Fund.
In November 2023, the Financial Accounting Standards Board ("FASB") issued Accounting Standards Update ("ASU") No. 2023-07, Segment Reporting (Topic 280). The ASU applies to all public entities that are required to report segment information in accordance with Accounting Standards Codification Topic 280 (ASC 280). ASU 2023-07 improves reportable segment disclosure requirements, primarily through enhanced disclosures about significant segment expenses. An operating segment is defined as a component of a public entity that engages in business activities from which it may recognize revenues and incur expense, has operating results that are regularly reviewed by the chief operating decision maker, and for which discrete financial information is available. The Fund has adopted ASU 2023-07 as of December 31, 2024, with no material impact on the Fund's financial statements.
Fund Valuation. The Fund's Board of Trustees ("Board" or "Trustees"), including a majority of the Trustees who are not "interested persons" of the Fund, have designated the Adviser to perform fair valuation determinations related to all Fund investments under the oversight of the Board. As "valuation designee" the Adviser has adopted procedures to guide the determination of the net asset value ("NAV") on any day on which the Fund's NAVs are determined. The valuation of the Fund's investments is in accordance with these procedures.
Fund securities that are traded on U.S. securities exchanges, except option securities, are valued at the official closing price, which is the last current reported sales price on its principal exchange at the time the Fund determines its NAV. Securities traded in the over-the-counter market and quoted on The NASDAQ Stock Market are valued at the NASDAQ Official Closing Price, as determined by NASDAQ, or lacking a NASDAQ Official Closing Price, the last current reported sale price on NASDAQ
www.calamos.com
9
Notes to Financial Statements
at the time a Fund determines its NAV. When a last sale or closing price is not available, equity securities, other than option securities, that are traded on a U.S. securities exchange and other equity securities traded in the over-the-counter market are valued at the mean between the most recent bid and asked quotations on its principal exchange in accordance with guidelines adopted by the Board. Each option security traded on a U.S. securities exchange is valued at the mid-point of the consolidated bid/ask quote for the option security, also in accordance with guidelines adopted by the Board. Each over-the-counter option that is not traded through the Options Clearing Corporation is valued either by an independent pricing agent approved by the Board or based on a quotation provided by the counterparty to such option under the ultimate supervision of the Board.
Securities that are principally traded in other foreign markets are valued as of the last reported sale price at the time the Fund determines its NAV, or when reliable market prices or quotations are not readily available, at the mean between the most recent bid and asked quotations as of the close of the appropriate exchange or other designated time. Trading of foreign securities may not take place on every New York Stock Exchange ("NYSE") business day. In addition, trading may take place in various foreign markets on Saturdays or on other days when the NYSE is not open and on which the Fund's NAV is not calculated.
If the valuation designee determines that the valuation of a security in accordance with the methods described above is not reflective of a fair value for such security, the security is valued at a fair value by the valuation designee.
The Fund also may use fair value pricing, pursuant to guidelines adopted by the Adviser, if trading in the security is halted or if the value of a security it holds is materially affected by events occurring before the Fund's pricing time but after the close of the primary market or exchange on which the security is listed. Those procedures may utilize valuations furnished by pricing services approved by the Adviser, which may be based on market transactions for comparable securities and various relationships between securities that are generally recognized by institutional traders, a computerized matrix system, or appraisals derived from information concerning the securities or similar securities received from recognized dealers in those securities.
When fair value pricing of securities is employed, the prices of securities used by the Fund to calculate its NAV may differ from market quotations or official closing prices. There can be no assurance that the Fund could purchase or sell a portfolio security at the price used to calculate the Fund's NAV.
Investment Transactions. Investment transactions are recorded on a trade date basis as of December 31, 2024. Net realized gains and losses from investment transactions are reported on an identified cost basis. Interest income is recognized using the accrual method and includes accretion of original issue and market discount and amortization of premium. Dividend income is recognized on the ex-dividend date, except that certain dividends from foreign securities are recorded as soon as the information becomes available after the ex-dividend date.
Foreign Currency Translation. Values of investments and other assets and liabilities denominated in foreign currencies are translated into U.S. dollars using a rate quoted by a major bank or dealer in the particular currency market, as reported by a recognized quotation dissemination service.
The Fund does not isolate that portion of the results of operations resulting from changes in foreign exchange rates on investments from the fluctuations arising from changes in market prices of securities held. Such fluctuations are included with the net realized and unrealized gain or loss from investments.
Reported net realized foreign currency gains or losses arise from disposition of foreign currency, the difference in the foreign exchange rates between the trade and settlement dates on securities transactions, and the difference between the amounts of dividends, interest and foreign withholding taxes recorded on the ex-date or accrual date and the U.S. dollar equivalent of the amounts actually received or paid. Net unrealized foreign exchange gains and losses arise from changes (due to the changes in the exchange rate) in the value of foreign currency and other assets and liabilities denominated in foreign currencies held at year end.
Allocation of Expenses. Expenses directly attributable to the Fund are charged to the Fund; certain other common expenses of Calamos Advisors Trust, Calamos Investment Trust, Calamos Convertible Opportunities and Income Fund, Calamos Convertible and High Income Fund, Calamos Strategic Total Return Fund, Calamos Global Total Return Fund, Calamos Global Dynamic Income Fund, Calamos Dynamic Convertible and Income Fund, Calamos Long/Short Equity & Dynamic Income Trust, Calamos Antetokounmpo Sustainable Equities Trust, and Calamos ETF Trust are allocated proportionately among each fund to which the expenses relate in relation to the net assets of each fund or on another reasonable basis.
CALAMOS ANTETOKOUNMPO SUSTAINABLE EQUITIES TRUST ANNUAL REPORT
10
Notes to Financial Statements
As defined under ASU No. 2023-07 the chief operating decision maker ("CODM") consists of the members of Calamos Advisors' Investment Committee and Senior Executive Team. The Fund operates as a single reportable segment, which reflects how the CODM monitors and manages the operating results of the Fund. The financial information used by the CODM to assess the segment's performance and to allocate resources, including total return, expense ratios, changes in net assets from operations and portfolio composition, is consistent with that presented within the Fund's financial statements and financial highlights.
Organization and Offering Costs. Organizational and offering costs are paid by CGAM.
Income Taxes. No provision has been made for U.S. income taxes because the Trust's policy is to continue to qualify as a regulated investment company under the Internal Revenue Code of 1986, as amended, and distribute to shareholders substantially all of the Fund's taxable income and net realized gains.
Dividends and distributions paid to shareholders are recorded on the ex-dividend date. The amount of dividends and distributions from net investment income and net realized capital gains is determined in accordance with federal income tax regulations, which may differ from U.S. generally accepted accounting principles. To the extent these "book/tax" differences are permanent in nature, such amounts are reclassified within the capital accounts based on their federal tax-basis treatment. These differences are primarily due to differing treatments for foreign currency transactions and investments in passive foreign investment companies. The financial statements are not adjusted for temporary differences.
The Fund recognized no liability for uncertain tax positions. A reconciliation is not provided as the beginning and ending amounts of unrecognized benefits are zero, with no interim additions, reductions or settlements. Tax years 2023-2024 remain subject to examination by the U.S. and the State of Illinois tax jurisdictions.
Indemnifications. Under the Trust's organizational documents, the Trust is obligated to indemnify its officers and trustees against certain liabilities incurred by them by reason of having been an officer or trustee of the Trust. In addition, in the normal course of business, the Trust may enter into contracts that provide general indemnifications to other parties. The Fund's maximum exposure under these arrangements is unknown as this would involve future claims that may be made against the Fund that have not yet occurred. Currently, the Fund's management expects the risk of material loss in connection to a potential claim to be remote.
Note 2 – Investment Adviser and Transactions With Affiliates Or Certain Other Parties
Pursuant to an investment advisory agreement with CGAM, the Fund pays a monthly investment advisory fee based on the average daily net assets of the Fund at the annual rate of 0.85%.
CGAM has contractually agreed to limit the annual ordinary operating expenses of the Fund as a percentage of the average net assets of each class of shares to 1.35% for Class A shares, 2.10% for Class C shares, and 1.10% for Class I shares. CGAM has contractually agreed to limit the Fund's annual ordinary operating expenses for Class R6 shares (as a percentage of average net assets) to 1.10% less the Fund's annual sub-transfer agency ratio (the aggregate sub-transfer agency fees of the Fund's other share classes divided by the aggregate average annual net assets of the Fund's other share classes). This expense limitation agreement is binding on CGAM through April 30, 2026.
For the year ended December 31, 2024, CGAM waived or absorbed $190,510 of expenses. This amount is included in the Statements of Operations under the caption "Expense reductions".
The Fund reimburses Calamos Advisors for a portion of compensation paid to the Trust's Chief Compliance Officer. This compensation is reported as part of the "Trustees' fees and officer compensation" expense on the Statement of Operations.
A Trustee and certain officers of the Trust are also officers and directors of CGAM. A Trustee and certain officers of the Fund are also officers and/or directors of Calamos Advisors. Such Trustee and officers serve without direct compensation from the Trust. The Trust's Statement of Additional Information contains additional information about the Trust's Trustees and Officers and is available without charge, upon request, at www.calamos.com or by calling 800.582.6959.
www.calamos.com
11
Notes to Financial Statements
Note 3 – Investments
The cost of purchases and proceeds from sales of long-term investments for the year ended December 31, 2024 are shown in the table below.
| U.S. GOVERNMENT SECURITIES | OTHER | ||||||||||
Cost of purchases | $ | — | $ | 1,428,053 | |||||||
Proceeds from sales | — | 774,451 | |||||||||
Note 4 – Income Taxes
The cost basis of investments for federal income tax purposes at December 31, 2024 was as follows:
| Cost basis of investments | $ | 3,783,994 | |||||
| Gross unrealized appreciation | 905,032 | ||||||
| Gross unrealized depreciation | (108,197 | ) | |||||
Net unrealized appreciation (depreciation) | $ | 796,835 | |||||
For the fiscal year ended December 31, 2024, the Fund recorded the following permanent reclassifications to reflect tax character. The results of operations and net assets were not affected by these reclassifications.
| Paid-in capital | $ | (1,901 | ) | ||||
| Undistributed net investment income/(loss) | 1,780 | ||||||
| Accumulated net realized gain/(loss) on investments | 121 | ||||||
Distributions for the year ended December 31, 2024 were characterized for federal income tax purposes as follows:
| YEAR ENDED DECEMBER 31, 2024 | PERIOD ENDED DECEMBER 31, 2023 | ||||||||||
Distributions paid from: | |||||||||||
Ordinary income | $ | 15,568 | $ | 15,564 | |||||||
Long-term capital gains | — | — | |||||||||
Return of capital | — | — | |||||||||
As of December 31, 2024, the components of accumulated earnings/(loss) on a tax basis were as follows:
Undistributed ordinary income | $ | — | |||||
Undistributed capital gains | — | ||||||
Total undistributed earnings | — | ||||||
| Accumulated capital and other losses | (9,286 | ) | |||||
Net unrealized gains/(losses) | 796,835 | ||||||
Total accumulated earnings/(losses) | 787,549 | ||||||
Other | — | ||||||
Paid-in-capital | 3,792,865 | ||||||
Net assets applicable to common shareholders | $ | 4,580,414 | |||||
The Fund had capital loss carryforwards for the year ended December 31, 2024 of $9,286, with no expiration date, available to offset future realized capital gains.
Note 5 – Derivative Instruments
Foreign Currency Risk. The Fund may engage in portfolio hedging with respect to changes in currency exchange rates by entering into forward foreign currency contracts to purchase or sell currencies. A forward foreign currency contract is a commitment to purchase or sell a foreign currency at a future date at a negotiated forward rate. Risks associated with such contracts include, among other things, movement in the value of the foreign currency relative to the U.S. dollar and the ability of the counterparty to perform.
CALAMOS ANTETOKOUNMPO SUSTAINABLE EQUITIES TRUST ANNUAL REPORT
12
Notes to Financial Statements
To mitigate the counterparty risk, the Fund may enter into an International Swaps and Derivatives Association, Inc. Master Agreement ("ISDA Master Agreement") or similar agreement with its derivative contract counterparties. An ISDA Master Agreement is a bilateral agreement between the Fund and a counterparty that governs Over-The-Counter derivatives and foreign exchange contracts and typically contains, among other things, collateral posting terms and netting provisions in the event of a default and/or termination event. Under an ISDA Master Agreement, the Fund may, under certain circumstances, offset with the counterparty certain derivative financial instrument's payables and/or receivables with collateral held and/or posted and create one single net payment. The provisions of the ISDA Master Agreement typically permit a single net payment in the event of default (close-out netting) including the bankruptcy or insolvency of the counterparty. Generally, collateral is exchanged between the Fund and the counterparty and the amount of collateral due from the Fund or to a counterparty has to exceed a minimum transfer amount threshold before a transfer has to be made. To the extent amounts due to the Fund from its counterparties are not fully collateralized, contractually or otherwise, the Fund bears the risk of loss from counterparty nonperformance. When the Fund is required to post collateral under the terms of a derivatives transaction and master netting agreement, the Fund's custodian holds the collateral in a segregated account, subject to the terms of a tri-party agreement among the Fund, the custodian and the counterparty. The master netting agreement and tri-party agreement provide, in relevant part, that the counterparty may have rights to the amounts in the segregated account in the event that the Fund defaults in its obligation with respect to the derivative instrument that is subject to the collateral requirement. When a counterparty is required to post collateral under the terms of a derivatives transaction and master netting agreement, the counterparty delivers such amount to the Fund's custodian. The master netting agreement provides, in relevant part, that the Fund may have rights to such collateral in the event that the counterparty defaults in its obligation with respect to the derivative instrument that is subject to the collateral requirement.
For financial reporting purposes, the Fund does not offset derivative assets and derivative liabilities that are subject to netting arrangements in the Statement of Assets and Liabilities. The net unrealized gain, if any, represents the credit risk to the Fund on a forward foreign currency contract. The contracts are valued daily at forward foreign exchange rates. The Fund realizes a gain or loss when a position is closed or upon settlement of the contracts. Please see the disclosure regarding ISDA Master Agreements under Foreign Currency Risk within this note.
As of December 31, 2024, the Fund had no outstanding forward foreign currency contracts.
Equity Risk. The Fund may engage in option transactions and in doing so achieves similar objectives to what it would achieve through the sale or purchase of individual securities. A call option, upon payment of a premium, gives the purchaser of the option the right to buy, and the seller of the option the obligation to sell, the underlying security, index or other instrument at the exercise price. A put option gives the purchaser of the option, upon payment of a premium, the right to sell, and the seller the obligation to buy, the underlying security, index, or other instrument at the exercise price.
To seek to offset some of the risk of a potential decline in value of certain long positions, the Fund may also purchase put options on individual securities, broad-based securities indexes or certain exchange-traded funds ("ETFs"). The Fund may also seek to generate income from option premiums by writing (selling) options on a portion of the equity securities (including securities that are convertible into equity securities) in a Fund's portfolio, on broad-based securities indexes, or certain ETFs.
When the Fund purchases an option, it pays a premium and an amount equal to that premium is recorded as an asset. When the Fund writes an option, it receives a premium and an amount equal to that premium is recorded as a liability. The asset or liability is adjusted daily to reflect the current market value of the option. If an option expires unexercised, a Fund realizes a gain or loss to the extent of the premium received or paid. If an option is exercised, the premium received or paid is recorded as an adjustment to the proceeds from the sale or the cost basis of the purchase. The difference between the premium and the amount received or paid on a closing purchase or sale transaction is also treated as a realized gain or loss. The cost of securities acquired through the exercise of call options is increased by premiums paid. The proceeds from securities sold through the exercise of put options are decreased by the premiums paid. Gain or loss on written options and purchased options is presented separately on the Statements of Operations as net realized gain or loss on written options and net realized gain or loss on purchased options, respectively.
Options written by the Fund do not typically give rise to counterparty credit risk since options written obligate the Fund and not the counterparty to perform. Exchange traded purchased options have minimal counterparty credit risk to the Fund since the exchange's clearinghouse, as counterparty to such instruments, guarantees against a possible default.
As of December 31, 2024, the Fund had no outstanding purchased options and/or written options.
www.calamos.com
13
Notes to Financial Statements
Note 6 – Fair Value Measurement
Various inputs are used to determine the value of the Fund's investments. These inputs are categorized into three broad levels as follows:
• Level 1 – Prices are determined using inputs from unadjusted quoted prices from active markets (including securities actively traded on a securities exchange) for identical assets.
• Level 2 – Prices are determined using significant observable market inputs other than unadjusted quoted prices, including quoted prices of similar securities, fair value adjustments to quoted foreign securities, interest rates, credit risk, prepayment speeds, and other relevant data.
• Level 3 – Prices reflect unobservable market inputs (including the Fund's own judgments about assumptions market participants would use in determining fair value) when observable inputs are unavailable.
The following is a summary of the inputs used in valuing the Fund's holdings at fair value:
LEVEL 1 | LEVEL 2 | LEVEL 3 | TOTAL | ||||||||||||||||
Assets: | |||||||||||||||||||
Common Stocks | $ | 4,580,829 | $ | — | $ | — | $ | 4,580,829 | |||||||||||
Total | $ | 4,580,829 | $ | — | $ | — | $ | 4,580,829 | |||||||||||
Note 7 – Capital Share Transactions
The following table summarizes the activity in capital shares of the Fund for the periods ended:
| FOR THE YEAR ENDED DECEMBER 31, 2024 | FEBRUARY 3, 2023(a) THROUGH DECEMBER 31, 2023 | ||||||||||||||||||
Class A | Shares | Dollars | Shares | Dollars | |||||||||||||||
Shares sold | 1,774 | $ | 20,896 | 16,706 | $ | 167,960 | |||||||||||||
Shares issued as reinvestment of distributions | 18 | 230 | 41 | 452 | |||||||||||||||
Less shares redeemed | (1,456 | ) | (16,657 | ) | (2,432 | ) | (25,521 | ) | |||||||||||
Net increase (decrease) | 336 | $ | 4,469 | 14,315 | $ | 142,891 | |||||||||||||
Class C | Shares | Dollars | Shares | Dollars | |||||||||||||||
Shares sold | — | $ | — | 10,000 | $ | 100,000 | |||||||||||||
Shares issued as reinvestment of distributions | — | — | — | — | |||||||||||||||
Less shares redeemed | — | — | — | — | |||||||||||||||
Net increase (decrease) | — | $ | — | 10,000 | $ | 100,000 | |||||||||||||
Class I | Shares | Dollars | Shares | Dollars | |||||||||||||||
Shares sold | 60,988 | $ | 776,002 | 276,871 | $ | 2,783,641 | |||||||||||||
Shares issued as reinvestment of distributions | 1,165 | 14,852 | 1,340 | 14,595 | |||||||||||||||
Less shares redeemed | (18,638 | ) | (228,156 | ) | (1,373 | ) | (14,114 | ) | |||||||||||
Net increase (decrease) | 43,515 | $ | 562,698 | 276,838 | $ | 2,784,122 | |||||||||||||
Class R6 | Shares | Dollars | Shares | Dollars | |||||||||||||||
Shares sold | — | $ | — | 10,000 | $ | 100,000 | |||||||||||||
Shares issued as reinvestment of distributions | 39 | 486 | 47 | 517 | |||||||||||||||
Less shares redeemed | — | — | — | — | |||||||||||||||
Net increase (decrease) | 39 | $ | 486 | 10,047 | $ | 100,517 | |||||||||||||
(a) Commencement of operations.
CALAMOS ANTETOKOUNMPO SUSTAINABLE EQUITIES TRUST ANNUAL REPORT
14
To the Shareholders and the Board of Trustees of Calamos Antetokounmpo Sustainable Equities Trust
Opinion on the Financial Statements and Financial Highlights
We have audited the accompanying statement of assets and liabilities of Calamos Antetokounmpo Sustainable Equities Fund (the "Fund"), a series of the Calamos Antetokounmpo Sustainable Equities Trust (the "Trust"), including the schedule of investments, as of December 31, 2024, the related statement of operations for the year then ended, the statements of changes in net assets and the financial highlights for the year ended December 31, 2024 and the period from February 3, 2023 (commencement of operations) through December 31, 2023, and the related notes. In our opinion, the financial statements and financial highlights present fairly, in all material respects, the financial position of the Fund as of December 31, 2024, and the results of its operations for the year then ended and the changes in its net assets and the financial highlights for the year ended December 31, 2024 and the period from February 3, 2023 (commencement of operations) through December 31, 2023 in conformity with accounting principles generally accepted in the United States of America.
Basis for Opinion
These financial statements and financial highlights are the responsibility of the Fund's management. Our responsibility is to express an opinion on the Fund's financial statements and financial highlights based on our audits. We are a public accounting firm registered with the Public Company Accounting Oversight Board (United States) (PCAOB) and are required to be independent with respect to the Fund in accordance with the U.S. federal securities laws and the applicable rules and regulations of the Securities and Exchange Commission and the PCAOB.
We conducted our audits in accordance with the standards of the PCAOB. Those standards require that we plan and perform the audit to obtain reasonable assurance about whether the financial statements and financial highlights are free of material misstatement, whether due to error or fraud. The Fund is not required to have, nor were we engaged to perform, an audit of its internal control over financial reporting. As part of our audits we are required to obtain an understanding of internal control over financial reporting but not for the purpose of expressing an opinion on the effectiveness of the Fund's internal control over financial reporting. Accordingly, we express no such opinion.
Our audits included performing procedures to assess the risks of material misstatement of the financial statements and financial highlights, whether due to error or fraud, and performing procedures that respond to those risks. Such procedures included examining, on a test basis, evidence regarding the amounts and disclosures in the financial statements and financial highlights. Our audits also included evaluating the accounting principles used and significant estimates made by management, as well as evaluating the overall presentation of the financial statements and financial highlights. Our procedures included confirmation of securities owned as of December 31, 2024, by correspondence with the custodian. We believe that our audits provide a reasonable basis for our opinion.
Chicago, Illinois
February 10, 2025
We have served as the auditor of one or more Calamos investment companies since 2003.
www.calamos.com
15
We are providing this information as required by the Internal Revenue Code (Code). The amounts shown may differ from those elsewhere in this report due to differences between tax and financial reporting requirements. In February 2025, shareholders will receive Form 1099-DIV which will include their share of qualified dividends and capital gains distributed during the calendar year 2024. Shareholders are advised to check with their tax advisors for information on the treatment of these amounts on their individual income tax returns.
Under Section 852(b)(3)(C) of the Code, the Fund had no capital gain dividends for the fiscal year ended December 31, 2024.
Under Section 854(b)(2) of the Code, the Fund hereby designates $15,568, or the maximum amount allowable under the Code, as qualified dividends for the fiscal year ended December 31, 2024.
Under Section 854(b)(2) of the Code, the Fund hereby designates 100.00% of the ordinary income dividends as income qualifying for the dividends received deduction for the fiscal year ended December 31, 2024.
CALAMOS ANTETOKOUNMPO SUSTAINABLE EQUITIES TRUST ANNUAL REPORT
16
Item 8: Changes in and Disagreements with Accountants for Open-End Management Investment Companies.
Not applicable.
Item 9: Proxy Disclosures for Open-End Management Investment Companies.
Not applicable.
Item 10: Remuneration Paid to Directors, Officers, and Others of Open-End Management Investment Companies.
1. Aggregate remuneration paid to all trustees by Calamos Antetokounmpo Sustainable Equities Trust for the period covered by the report is shown in the Statement of Operation included as part of the financial statements filed under item 7 of the N-CSR. Such remuneration only is paid to independent (“non-interested”) trustees. John P. Calamos, Sr., the trustee who is an “interested person” of the Calamos Antetokounmpo Sustainable Equities Trust, does not receive remuneration for services provided to the Calamos Antetokounmpo Sustainable Equities Trust.
2. Not applicable.
3. Mark J. Mickey, Chief Compliance Officer of the Calamos Antetokounmpo Sustainable Equities Trust, is the only officer who receives compensation from the Calamos Antetokounmpo Sustainable Equities Trust. Aggregate remuneration paid to Mr. Mickey by Calamos Antetokounmpo Sustainable Equities Trust for the period covered by the report is shown in the Statement of Operation included as part of the financial statements filed under item 7 of the N-CSR.
4. Not applicable.
Item 11: Statement Regarding Basis for Approval of Investment Advisory Contracts.
Not applicable.
Item 12: Disclosure of Proxy Voting Policies and Procedures for Closed-End Management Investment Companies.
Not applicable.
Item 13: Portfolio Managers of Closed-End Management Investment Companies.
Not applicable.
Item 14: Purchase of Equity Securities by Closed-End Management Investment Company and Affiliated Purchasers.
Not applicable.
Item 15: Submission of Matters to a Vote of Security Holders.
There have been no material changes to the procedures by which the shareholders may recommend nominees to the registrant’s Board of Trustees.
Item 16: Controls and Procedures.
(a) The registrant’s principal executive officer and principal financial officer have evaluated the registrant’s disclosure controls and procedures within 90 days of this filing and have concluded that the registrant’s disclosure controls and procedures were effective, as of that date, in ensuring that information required to be disclosed by the registrant in this Form N-CSR was recorded, processed, summarized, and timely reported.
(b) There were no changes in the registrant’s internal controls over financial reporting (as defined in Rule 30a-3(d) under the Investment Company Act of 1940) that occurred during the period covered by this report that has materially affected, or is reasonably likely to materially affect, the registrant’s internal control over financial reporting.
Item 17: Disclosure of Securities Lending Activities for Closed-End Management Investment Companies.
Not applicable.
Item 18: Recovery of Erroneously Awarded Compensation.
Not applicable.
Item 19: Exhibits.
(a)(2) Not applicable
Pursuant to the requirements of the Securities Exchange Act of 1934 and the Investment Company Act of 1940, the registrant has duly caused this report to be signed on its behalf by the undersigned, thereunto duly authorized.
(a)(4) Not applicable
(a)(5) Not applicable
SIGNATURES
Pursuant to the requirements of the Securities Exchange Act of 1934 and the Investment Company Act of 1940, the registrant has duly caused this report to be signed on its behalf by the undersigned, thereunto duly authorized.
Calamos Antetokounmpo Sustainable Equities Trust
| By: | /s/ John P. Calamos, Sr. | |
| Name: | John P. Calamos, Sr. | |
| Title: | Principal Executive Officer | |
| Date: | February 14, 2025 |
| By: | /s/ Thomas E. Herman | |
| Name: | Thomas E. Herman | |
| Title: | Principal Financial Officer | |
| Date: | February 14, 2025 |
Pursuant to the requirements of the Securities Exchange Act of 1934 and the Investment Company Act of 1940, this report has been signed by the following persons on behalf of the registrant and in the capacities and on the dates indicated.
| By: | /s/ John P. Calamos, Sr. | |
| Name: | John P. Calamos, Sr. | |
| Title: | Principal Executive Officer | |
| Date: | February 14, 2025 |
| By: | /s/ Thomas E. Herman | |
| Name: | Thomas E. Herman | |
| Title: | Principal Financial Officer | |
| Date: | February 14, 2025 |