Exhibit 99.3
FELDMAN FINANCIAL ADVISORS, INC.
8804 MIRADOR PLACE
MCLEAN, VA 22102
202-467-6862
First Seacoast Bancorp
Dover, New Hampshire
Conversion Valuation Appraisal Report
Valued as of August 26, 2022
Prepared By
Feldman Financial Advisors, Inc.
McLean, Virginia
FELDMAN FINANCIAL ADVISORS, INC.
8804 MIRADOR PLACE
MCLEAN, VA 22102
202-467-6862
August 26, 2022
Boards of Directors
First Seacoast Bancorp, MHC
First Seacoast Bancorp
First Seacoast Bancorp, Inc.
First Seacoast Bank
633 Central Avenue
Dover, New Hampshire 03820
Members of the Boards of Directors:
At your request, we have completed and hereby provide an independent appraisal (the “Appraisal”) of the estimated pro forma market value of First Seacoast Bancorp (“FSB” or the “Company”) on a fully converted basis as of August 26, 2022 in conjunction with the Company’s conversion (the “Conversion”) from the two-tier mutual holding company structure to the fully stock holding company form of ownership and simultaneous offering for sale (the “Stock Offering”) of the shares of common stock currently held by First Seacoast Bancorp, MHC (the “MHC”). The Company is a federally-chartered mid-tier stock holding company that owns all of the outstanding shares of common stock of First Seacoast Bank (the “Bank”). The MHC currently owns approximately 55.2% of the outstanding shares of common stock of FSB. The Appraisal is furnished pursuant to the filing by the MHC and the Company of an application (the “Application”) concerning the Conversion and Stock Offering with the Board of Governors of the Federal Reserve System.
Pursuant to the Plan of Conversion and Reorganization (“Plan of Conversion”), the MHC will be merged into FSB and, as a result, the MHC will cease to exist. FSB, which owns 100% of the outstanding common stock of the Bank, will merge into a new Maryland-chartered corporation named First Seacoast Bancorp, Inc. (“New FSB”) and, as a result, FSB will cease to exist. As part of the Conversion, the 55.2% ownership interest of the MHC in FSB will be offered for sale in the Stock Offering. When the Conversion is completed, New FSB will own all of the outstanding common stock of the Bank and public stockholders will own all of the outstanding common stock of New FSB.
In conjunction with the Conversion, the shares of common stock are first being offered for sale in a subscription offering to eligible depositors and borrowers of the Bank and to tax-qualified employee benefit plans of the Bank. Shares not purchased in the subscription offering may be offered for sale to the general public in a community offering, with a preference given first to residents of specific counties served by the Bank and secondly to existing public stockholders of FSB. Any shares of common stock not purchased in the subscription or community offerings may be offered for sale to the public in a syndicated community offering.
FELDMAN FINANCIAL ADVISORS, INC.
Boards of Directors
August 26, 2022
Page Two
In addition to the shares being sold in the Stock Offering, the shares of common stock of FSB currently owned by public stockholders will be exchanged for shares of common stock of New FSB based on an exchange ratio, subject to any necessary adjustment, that will result in existing public stockholders owning approximately the same percentage of common stock as they owned of the common stock of FSB immediately before the completion of the Conversion.
Feldman Financial Advisors, Inc. (“Feldman Financial”) is a financial consulting and economic research firm that specializes in financial valuations and analyses of business enterprises and securities in the thrift, banking, and mortgage industries. The background of Feldman Financial is presented in Exhibit I. In preparing the Appraisal, we conducted an analysis of the Company that included discussions with the Company’s management, the Company’s legal counsel, Luse Gorman, PC, and the Company’s independent registered public accounting firm, Baker Newman & Noyes LLC. In addition, where appropriate, we considered information based on other available published sources that we believe are reliable; however, we cannot guarantee the accuracy and completeness of such information.
We also reviewed, among other factors, the economy in the Company’s primary market area and compared the Company’s financial condition and operating performance with that of selected publicly traded thrift institutions. We reviewed conditions in the securities markets in general and in the market for thrift institution common stocks in particular.
The Appraisal is based on the Company’s representation that the information contained in the Application and additional evidence furnished to us by the Company and its independent auditor are truthful, accurate, and complete. We did not independently verify the financial statements and other information provided by the Company and its independent auditor, nor did we independently value the assets or liabilities of the Company. The Appraisal considers the Company only as a going concern and should not be considered as an indication of the liquidation value of the Company.
It is our opinion that, as of August 26, 2022, the estimated pro forma market value of the Company on a fully converted basis – including (1) newly-issued shares representing the MHC’s current ownership interest in the Company and (2) exchange shares issued to existing public stockholders of the Company – was within a range (the “Valuation Range”) of $50,774,920 to $68,695,480 with a midpoint of $59,735,200. The Valuation Range was based upon a 15% decrease from the midpoint to determine the minimum and a 15% increase from the midpoint to establish the maximum. Based on an offering price of $10.00 per share, the Valuation Range reflects total pro forma outstanding shares ranging from 5,077,492 at the minimum to 6,869,548 at the maximum.
FELDMAN FINANCIAL ADVISORS, INC.
Boards of Directors
August 26, 2022
Page Three
In preparing the pro forma valuation analysis, we have taken into account the pro forma impact of the MHC’s unconsolidated net assets that will be consolidated with the Company and thus will slightly increase pro forma equity. After accounting for the impact of the MHC’s net assets of $100,000 as of June 30, 2022, the public stockholders’ aggregate ownership interest in FSB was reduced by 0.2%, or a difference of 0.0750 percentage points. Accordingly, for purposes of the Company’s pro forma valuation, the public stockholders’ pro forma ownership interest was reduced from 44.8312% to 44.7562% and the MHC’s pro forma ownership interest was increased from 55.1688% to 55.2438%.
Based on the Valuation Range and taking into account the pro forma ownership interest represented by the shares owned by the MHC, the midpoint of the offering range is $33,000,000 or equal to 3,300,000 shares at the offering price of $10.00 per share. The resulting offering range and offering shares, all based on the offering price of $10.00 per share, are as follows: $28,050,000 or 2,805,000 shares at the minimum and $37,950,000 or 3,795,000 shares at the maximum.
The federal conversion regulations provide that in a conversion of a mutual holding company, the minority stockholders are entitled to exchange the public shares for newly issued shares in the fully converted company. The Boards of Directors of the MHC, the Company, and the Bank have independently determined the exchange ratio, which has been designed to preserve the current aggregate percentage ownership in the Company (adjusted for the dilution caused by the consolidation of the MHC’s unconsolidated net assets into the Company and the resulting capital contribution).
The exchange ratio to be received by the existing minority stockholders of the Company will be determined at the end of the Stock Offering, based on the total number of shares sold in the subscription and community offerings and the final appraisal. Based on the valuation conclusion herein, the resulting offering value, and the $10.00 per share offering price, the indicated exchange ratio at the midpoint is 0.9833 shares of New FSB common stock for every one share of FSB common stock held by public stockholders. Furthermore, based on the offering range of value, the indicated exchange ratio is 0.8358 at the minimum and 1.1308 at the maximum. Feldman Financial expresses no opinion on the proposed exchange of newly issued shares of New FSB common stock for the shares of FSB common stock held by the public stockholders or on the proposed exchange ratio.
Our Appraisal is not intended, and must not be construed, to be a recommendation of any kind as to the advisability of purchasing shares of common stock in the Stock Offering. Moreover, because the Appraisal is necessarily based upon estimates and projections of a number of matters, all of which are subject to change from time to time, no assurance can be given that persons who purchase shares of stock in the Stock Offering will thereafter be able to sell such shares at prices related to the foregoing estimate of the Company’s pro forma market value.
FELDMAN FINANCIAL ADVISORS, INC.
Boards of Directors
August 26, 2022
Page Four
Feldman Financial is not a seller of securities within the meaning of any federal or state securities laws, and any report prepared by Feldman Financial shall not be used as an offer or solicitation with respect to the purchase or sale of any securities.
The Valuation Range reported herein will be updated as appropriate. These updates will consider, among other factors, any developments or changes in the Company’s operating performance, financial condition, or management policies, and current conditions in the securities markets for thrift institution common stocks. Should any such new developments or changes be material, in our opinion, to the valuation of the Company, appropriate adjustments to the estimated pro forma market value will be made. The reasons for any such adjustments will be explained in detail at that time.
| Respectfully submitted, |
| Feldman Financial Advisors, Inc. |
 |
| Trent R. Feldman |
| President |
 |
| Peter W. L. Williams |
| Principal |
FELDMAN FINANCIAL ADVISORS, INC.
TABLE OF CONTENTS
TAB | PAGE | |||||||
| INTRODUCTION | 1 | |||||||
| I. | CHAPTER ONE – BUSINESS OF FIRST SEACOAST BANCORP | |||||||
| General Overview | 4 | |||||||
| Financial Condition | 11 | |||||||
| Income and Expense Trends | 24 | |||||||
| Interest Rate Risk Management | 32 | |||||||
| Asset Quality | 36 | |||||||
| Office Facilities | 39 | |||||||
| Market Area | 41 | |||||||
| Summary Outlook | 55 | |||||||
| II. | CHAPTER TWO – COMPARISONS WITH PUBLICLY TRADED THRIFTS | |||||||
| General Overview | 57 | |||||||
| Selection Criteria | 58 | |||||||
| Recent Financial Comparisons | 62 | |||||||
| III. | CHAPTER THREE – MARKET VALUE ADJUSTMENTS | |||||||
| General Overview | 75 | |||||||
| Earnings Prospects | 76 | |||||||
| Financial Condition | 77 | |||||||
| Market Area | 78 | |||||||
| Management | 79 | |||||||
| Dividend Payments | 80 | |||||||
| Liquidity of the Issue | 81 | |||||||
| Subscription Interest | 82 | |||||||
| Recent Acquisition Activity | 83 | |||||||
| Effect of Banking Regulations and Regulatory Reform | 85 | |||||||
| Stock Market Conditions | 85 | |||||||
| Adjustments Conclusion | 92 | |||||||
| Valuation Approach | 93 | |||||||
| Valuation Conclusion | 96 | |||||||
| IV. | APPENDIX – EXHIBITS | |||||||
| I | Background of Feldman Financial Advisors, Inc. | I-1 | ||||||
| II-1 | Consolidated Balance Sheets | II-1 | ||||||
| II-2 | Consolidated Income Statements | II-2 | ||||||
| II-3 | Loan Portfolio Composition | II-3 | ||||||
| II-4 | Cash and Investments Composition | II-4 | ||||||
| II-5 | Deposit Account Composition | II-5 | ||||||
| II-6 | Borrowed Funds Activity | II-6 | ||||||
| II-7 | Office Properties | II-7 | ||||||
| III | Financial and Market Data for All Public Thrifts | III-1 | ||||||
| IV-1 | Effect of the MHC’s Assets on Minority Stock Ownership | IV-1 | ||||||
| IV-2 | Pro Forma Assumptions for the Stock Offering | IV-2 | ||||||
| IV-3 | Pro Forma Fully Converted Valuation Range | IV-3 | ||||||
| IV-4 | Pro Forma Fully Converted Analysis at the Midpoint Valuation | IV-5 | ||||||
| IV-5 | Comparative Valuation Ratio Differential | IV-6 | ||||||
i
FELDMAN FINANCIAL ADVISORS, INC.
LIST OF TABLES
TAB | PAGE | |||||||
| I. | CHAPTER ONE – BUSINESS OF FIRST SEACOAST BANCORP | |||||||
| Table 1 | Selected Financial Condition Data | 11 | ||||||
| Table 2 | Relative Balance Sheet Concentrations | 12 | ||||||
| Table 3 | Income Statement Summary | 25 | ||||||
| Table 4 | Income Statement Ratios | 26 | ||||||
| Table 5 | Yield and Cost Summary | 28 | ||||||
| Table 6 | Net Portfolio Value of Equity | 35 | ||||||
| Table 7 | Non-performing Asset Summary | 37 | ||||||
| Table 8 | Allowance for Loan Losses | 38 | ||||||
| Table 9 | Selected Demographic Data | 42 | ||||||
| Table 10 | Branch Office Deposit Data | 46 | ||||||
| Table 11 | Map of Branch Office Locations | 47 | ||||||
| Table 12 | Deposit Market Share in Strafford County, New Hampshire | 49 | ||||||
| Table 13 | Deposit Market Share in Rockingham County, New Hampshire | 50 | ||||||
| Table 14 | Residential Lending Share in Strafford County, New Hampshire | 52 | ||||||
| Table 15 | Residential Lending Share in Rockingham County, New Hampshire | 53 | ||||||
| Table 16 | Residential Lending Share in York County, Maine | 54 | ||||||
| II. | CHAPTER TWO – COMPARISONS WITH PUBLICLY TRADED THRIFTS | |||||||
| Table 17 | Comparative Group Operating Summary | 61 | ||||||
| Table 18 | Key Financial Comparisons | 63 | ||||||
| Table 19 | General Operating Characteristics | 70 | ||||||
| Table 20 | Summary Financial Performance Ratios | 71 | ||||||
| Table 21 | Income and Expense Analysis | 72 | ||||||
| Table 22 | Balance Sheet Composition | 73 | ||||||
| Table 23 | Growth Rates, Credit Risk, and Loan Composition | 74 | ||||||
| III. | CHAPTER THREE – MARKET VALUE ADJUSTMENTS | |||||||
| Table 24 | Comparative Market Area Data | 79 | ||||||
| Table 25 | Summary of Recent Northeast Acquisition Activity | 84 | ||||||
| Table 26 | Comparative Three-Year Stock Index Performance | 88 | ||||||
| Table 27 | Comparative One-Year Stock Index Performance | 89 | ||||||
| Table 28 | Summary of Recent Thrift Conversion Stock Offerings | 90 | ||||||
| Table 29 | Comparative Pro Forma Fully Converted Valuation Analysis | 98 | ||||||
ii
FELDMAN FINANCIAL ADVISORS, INC.
INTRODUCTION
At your request, we have completed and hereby provide an independent appraisal (the “Appraisal”) of the estimated pro forma market value of First Seacoast Bancorp (“FSB” or the “Company”) on a fully converted basis as of August 26, 2022 in conjunction with the Company’s conversion (the “Conversion”) from the two-tier mutual holding company structure to the fully stock holding company form of ownership and simultaneous offering (the “Stock Offering”) for sale the shares of common stock currently held by First Seacoast Bancorp, MHC (the “MHC”). The Company is a federally-chartered mid-tier stock holding company that owns all of the outstanding shares of common stock of First Seacoast Bank (the “Bank”). The MHC currently owns approximately 55.2% of the outstanding shares of common stock of FSB. The Appraisal is furnished pursuant to the filing by the MHC and the Company of an application (the “Application”) concerning the Conversion and Stock Offering with the Board of Governors of the Federal Reserve System (“Federal Reserve Board”).
Pursuant to the Plan of Conversion and Reorganization (“Plan of Conversion”), the MHC will be merged into FSB and, as a result, the MHC will cease to exist. FSB, which owns 100% of the outstanding common stock of the Bank, will merge into a new Maryland-chartered corporation named First Seacoast Bancorp, Inc. (“New FSB”) and, as a result, FSB will cease to exist. As part of the Conversion, the 55.2% ownership interest of the MHC in FSB will be offered for sale in the Stock Offering. When the Conversion is completed, New FSB will own all of the outstanding common stock of the Bank and public stockholders will own all of the outstanding common stock of New FSB.
In addition to the shares being sold in the Stock Offering, the shares of common stock of FSB currently owned by public stockholders will be exchanged for shares of common stock of New FSB based on an exchange ratio, subject to any necessary adjustment, that will result in existing public stockholders owning approximately the same percentage of common stock as they owned of the common stock of FSB immediately before the completion of the Conversion.
1
FELDMAN FINANCIAL ADVISORS, INC.
Feldman Financial Advisors, Inc. (“Feldman Financial”) is a financial consulting and economic research firm that specializes in financial valuations and analyses of business enterprises and securities in the thrift, banking, and mortgage industries. The background of Feldman Financial is presented in Exhibit I. In preparing the Appraisal, we conducted an analysis of the Company that included discussions with the Company’s management, the Company’s legal counsel, Luse Gorman, PC, and the Company’s independent registered public accounting firm, Baker Newman & Noyes LLC. In addition, where appropriate, we considered information based on other available published sources that we believe are reliable; however, we cannot guarantee the accuracy and completeness of such information.
We also reviewed, among other factors, the economy in the Company’s primary market area and compared the Company’s financial condition and operating performance with that of selected publicly traded thrift institutions. We reviewed conditions in the securities markets in general and in the market for thrift institution common stocks in particular.
The Appraisal is based on the Company’s representation that the information contained in the Application and additional evidence furnished to us by the Company and its independent auditor are truthful, accurate, and complete. We did not independently verify the financial statements and other information provided by the Company and its independent auditor, nor did we independently value the assets or liabilities of the Company. The Appraisal considers the Company only as a going concern and should not be considered as an indication of the liquidation value of the Company.
2
FELDMAN FINANCIAL ADVISORS, INC.
Our Appraisal is not intended, and must not be construed, to be a recommendation of any kind as to the advisability of purchasing shares of common stock in the Stock Offering. Moreover, because the Appraisal is necessarily based upon estimates and projections of a number of matters, all of which are subject to change from time to time, no assurance can be given that persons who purchase shares of stock in the Stock Offering will thereafter be able to sell such shares at prices related to the foregoing estimate of the Company’s pro forma market value. Feldman Financial is not a seller of securities within the meaning of any federal or state securities laws, and any report prepared by Feldman Financial shall not be used as an offer or solicitation with respect to the purchase or sale of any securities.
The Valuation Range reported herein will be updated as appropriate. These updates will consider, among other factors, any developments or changes in the Company’s operating performance, financial condition, or management policies, and current conditions in the securities markets for thrift institution common stocks. Should any such new developments or changes be material, in our opinion, to the valuation of the Company, appropriate adjustments to the estimated pro forma market value will be made. The reasons for any such adjustments will be explained in detail at that time.
3
FELDMAN FINANCIAL ADVISORS, INC.
I. BUSINESS OF FIRST SEACOAST BANCORP
General Overview
First Seacoast Bancorp is the publicly traded stock holding company of First Seacoast Bank. The Company was established in conjunction with the reorganization to the mutual holding company structure in July 2019. The Company raised gross proceeds of $26.8 million in the initial capital offering and became part of a two-tier mutual holding company structure. Established in 1890, the Bank is a federally-chartered stock savings bank headquartered in Dover, New Hampshire. In 2019, the Bank also completed a name change from Federal Savings Bank. The name change was intended to enhance brand and marketing visibility and associate the Bank by name with the New Hampshire and southern Maine Seacoast Region, which the Bank serves and considers to be its primary market area. Unless described otherwise herein, the operations of the Company refer to the consolidated operations of FSB with the Bank.
The Company’s business consists primarily of taking deposits from the general public and investing those deposits, together with funds generated from operations and borrowings from the Federal Home Loan Bank (“FHLB”), in one- to four-family residential real estate loans, commercial real estate and multi-family loans, commercial business loans, construction and land development loans, home equity loans and lines of credit, and consumer loans. In recent years, the Company has increased its focus on originating higher-yielding commercial real estate and commercial business loans, and intends to continue expanding its portfolio of non-residential loans.
FSB conducts its operations from four full-service banking offices in Strafford County, New Hampshire and one full-service banking office in Rockingham County, New Hampshire. The Company considers its primary lending market area to be Strafford and Rockingham counties in New Hampshire and York County in southern Maine. At June 30, 2022, the
4
FELDMAN FINANCIAL ADVISORS, INC.
Company had total assets of $510.2 million, total deposits of $387.9 million, and total equity of $51.9 million (10.17% of assets). The Company reported net income of $2.6 million for the year ended December 31, 2021 and net income of $572,000 for the six months ended June 30, 2022. The Bank’s deposits are insured up to applicable limits by the Federal Deposit Insurance Corporation (“FDIC”). The Bank is subject to regulation and examination by the Office of the Comptroller of the Currency, its primary federal regulator, and the FDIC, its deposit insurer. The Bank is also a member of the FHLB of Boston. The Company is subject to regulation by the Federal Reserve Board.
The Bank has served residents of the Seacoast Region of New Hampshire since 1890. Originally established as Dover Co-Operative Savings Fund and Loan Association, the Bank was subsequently known as Dover Co-Operative Bank and later became Dover Federal Savings and Loan Association. The Bank’s present main office at 633 Central Avenue in Dover was constructed in 1972. The Bank’s name was changed to Federal Savings Bank in 1983 to reflect a growing customer base in areas outside of Dover.
Historically, the Bank has operated as a conservative residential lender with a focus on managing growth and increasing its capital. The Bank’s assets expanded at a compound annual growth rate (“CAGR”) of 4.8% and increased from $165.3 million at December 31, 2000 to $387.1 million at December 31, 2018. While the Bank’s primary lending thrust has centered on the origination of residential mortgage loans, FSB has steadily expanded its balances of commercial real estate loans and commercial business loans. Following the initial offering in 2019, the Company has grown at a more accelerated pace in an attempt to redeploy and leverage the additional capital. Total assets have expanded at a CAGR of 8.2% or an increase of $123.1 million from $387.1 million at December 31, 2018 to $510.2 million at June 30, 2022.
5
FELDMAN FINANCIAL ADVISORS, INC.
The Company has continued its track record of maintaining excellent asset quality. The Company’s ratio of non-performing assets to total assets measured 0.12% at June 30, 2022. While the Company has enjoyed steady asset growth, improved capital ratios, and outstanding asset quality, its profitability has been rather undistinguished. From 2010 to 2018, the Bank reported consecutive years of positive earnings with an average return on assets (“ROA”) of 0.35%. Excluding non-recurring items, the Company reported a core ROA of 0.12%, 0.17%, and 0.46% for 2019, 2020, and 2021, respectively.
The Company’s earnings generally have been hampered by relatively high levels of non-interest expense and low levels of non-interest income. The recent increases in operating expenses have mostly reflected FSB’s investment in staffing, systems, and infrastructure to facilitate the implementation and management of its organic growth strategies. The Company believes that these expenditures and enhancements help position it to take advantage of growth opportunities given the attractive demographics of its primary market area. In addition, the Company also faces intensified competition from other financial institutions, including new entrants, because of the favorable market attributes and must also seek to defend its market share penetration from further encroachment.
The Seacoast Region benefits from an economy with high employment, rising home values, and a migration of individuals from out-of-state. The Company is optimistic about the growth of business and residential real estate activity in the current environment. Rising operating costs for employees, healthcare, technology, compliance, and other expenses, combined with a relatively low interest rate environment, remain as financial challenges for the Company.
6
FELDMAN FINANCIAL ADVISORS, INC.
The Company has continued to pursue a business strategy that is intended to improve long-term profitability and optimize its capital position. Among other initiatives, the business strategy emphasizes: (1) maintaining a conservative balance sheet; (2) investing in personnel, technology, and marketing; (3) enhancing asset quality; and (4) maintaining an effective risk management system. The Company’s long-term strategic objectives focus on (1) earnings growth, (2) capital planning, (3) asset growth, and (4) cost control and efficiency. The earnings growth objective is aimed primarily at achieving commercial real estate and residential mortgage loan growth along with wealth management and deposit fee income growth. The capital planning objective will be furthered through the completion of the planned Conversion and Stock Offering and emphasizes leveraging the capital base and enhancing long-term shareholder returns. The asset growth objective will be facilitated by realizing growth in commercial real estate, residential mortgage, commercial business, and consumer loan originations and expanding business development initiatives. The cost control and efficiency objective will be achieved partially by leveraging the operating infrastructure to generate increased revenue and asset growth to improve the efficiency ratio and also by expanding digital banking offerings.
The Company believes that its community orientation is attractive to customers and distinguishes it from the larger banks that operate in the local market area. The Company continues to stress high quality, personal customer service through an honest, straightforward, and upfront marketing approach and has developed a loyal customer base. The Company relies on its experienced and committed staff to meet the needs of customers and effectively deliver banking products and services.
7
FELDMAN FINANCIAL ADVISORS, INC.
The core elements of the Company’s business strategy are outlined in more detail below:
| • | Grow the balance sheet, leverage existing infrastructure, and improve profitability and operating efficiency. Given the Company’s existing infrastructure and capabilities, FSB believes it is well-positioned to grow without a proportional increase in overhead expense or operating risk. In recent years, it has assembled an experienced management team and selectively hired lending, business development, and support staff. The Company’s operations also benefit from established marketing, sales, information technology, cybersecurity, and audit and compliance departments. Additionally, FSB continues to invest in digital banking technologies. |
| • | Grow the loan portfolio and increase commercial real estate and commercial business lending. The Company’s principal loan origination activity remains primarily one- to four-family residential mortgage loans. The Company continues to supplement these originations by focusing on originating higher-yielding commercial real estate loans (including owner-occupied and non-owner-occupied commercial real estate and multi-family loans), construction loans, commercial business loans, and home equity loans and lines of credit. The Company intends to remain a residential mortgage lender in its market area while maintaining its focus on the origination of commercial real estate loans and commercial business loans. The additional capital that FSB is raising in the Stock Offering will increase the Bank’s legal lending limit, which will enable it to originate larger loans for portfolio retention to new and existing customers and reduce the need to participate with other lenders to originate larger loans. |
| • | Maintain strong asset quality and manage credit risk. Strong asset quality is a key to the long-term financial success of any financial institution. FSB has been successful in maintaining strong asset quality in recent years. The Company’s ratio of non-performing assets to total assets was 0.20%, 0.17%, and 0.12% at December 31, 2020, December 31, 2021, and June 30, 2022, respectively. FSB attributes this historical credit quality to a conservative credit culture and an effective credit risk management environment. The Company believes that it has an experienced team of credit professionals, well-defined and implemented credit monitoring policies and procedures, and conservative loan underwriting criteria. |
| • | Increase core deposits and reduce reliance on higher cost borrowings. Deposits are the Company’s primary source of funds for lending and investment. Core deposits (which are defined as all deposits except for certificates of deposit), particularly non-interest-bearing demand deposits, represent a low-cost, stable source of funds. Core deposits amounted to 85.9% of the Company’s total deposits at June 30, 2022, which level has increased from 77.2% at December 31, 2018. The Company also relies on higher cost FHLB borrowings as a supplemental funding source. At June 30, 2022, the Company’s ratio of net loans to deposits was 98.5% and FHLB borrowings totaled $64.3 million. The Company intends to continue to focus on expanding core deposits by leveraging its business development activities and commercial lending and retail relationships. |
8
FELDMAN FINANCIAL ADVISORS, INC.
| • | Grow organically and through opportunistic expansion. The Company’s primary intention is to grow its balance sheet organically and utilize its capital to increase its lending and investment capacity. As a local independent financial institution, FSB believes that it will have opportunities to gain market share from customer fallout resulting from the recent consolidation of competing financial institutions in its market area into larger, out-of-market acquirers. In addition to organic growth, the Company may also consider expansion opportunities in its market area or in contiguous markets that it believes would enhance both its franchise value and stockholder returns. These opportunities chiefly include establishing loan production offices, establishing new, or de novo, branch offices and/or acquiring branch offices. However, the Company has no current plans or pending transactions regarding any expansion opportunities. |
While its equity level is solid at $51.9 million or 10.17% of total assets at June 30, 2022, FSB believes it must raise additional capital in order to facilitate its long-term growth objectives and loan generation activity, and provide a greater cushion in response to the risk profile associated with continued expansion and future economic conditions. Although the Company recorded positive earnings of $572,000 for the six months ended June 30, 2022, its equity capital declined by 14.2% or $8.6 million from $60.5 million at December 31, 2021, mainly due to unrealized holding losses on available-for-sale securities arising during the first half of the year.
The Company’s primary reasons for undertaking the Conversion and Stock Offering are to:
| • | Support the planned growth and strengthen the regulatory capital positions of the Company and the Bank with the additional capital raised in the Stock Offering. |
| • | Transition the organization to a fully stock holding company structure, which provides greater flexibility to access the capital markets as compared to the current mutual holding company structure. |
| • | Improve the liquidity of the Company’s shares of common stock by increasing the number of shares available for trading. |
| • | Facilitate the stock holding company’s ability to pay dividends to public stockholders by eliminating the mutual holding company structure, which entails a majority ownership stake that is held by a single entity. |
9
FELDMAN FINANCIAL ADVISORS, INC.
| • | Facilitate future mergers and acquisitions by increasing the Company’s flexibility to structure and finance the expansion of its operations as opportunities arise. |
The remainder of Chapter I examines in more detail the trends addressed in this section, including the impact of changes in the Company’s economic and competitive environment, and recent strategic initiatives. The discussion is supplemented by the exhibits in the Appendix. Exhibit II-1 summarizes the Company’s consolidated balance sheets as December 31, 2020 and 2021 and June 30, 2022. Exhibit II-2 presents the Company’s consolidated income statements for the years ended December 31, 2020 and 2021 and the six months ended June 30, 2021 and 2022.
10
FELDMAN FINANCIAL ADVISORS, INC.
Financial Condition
Table 1 presents selected data concerning the Company’s financial position as of December 31, 2020 and 2021 and June 30, 2022. Table 2 displays relative balance sheet concentrations for the Company as of similar year-end dates.
Table 1
Selected Financial Condition Data
As of December 31, 2020 and 2021 and June 30, 2022
(Dollars in Thousands)
| June 30, | December 31, | |||||||||||
| 2022 | 2021 | 2020 | ||||||||||
Total assets | $ | 510,246 | $ | 487,074 | $ | 443,062 | ||||||
Cash and cash equivalents (1) | 5,053 | 7,883 | 8,484 | |||||||||
Securities available-for-sale | 103,387 | 91,365 | 55,470 | |||||||||
Federal Home Loan Bank Stock | 2,684 | 1,688 | 1,796 | |||||||||
Total loans, net | 381,957 | 373,051 | 364,800 | |||||||||
Premises and equipment, net | 4,401 | 4,566 | 5,078 | |||||||||
Bank-owned life insurance | 4,502 | 4,461 | 4,356 | |||||||||
Total deposits | 387,868 | 393,243 | 327,381 | |||||||||
Borrowed funds | 64,250 | 29,462 | 52,322 | |||||||||
Total equity | 51,872 | 60,468 | 58,861 | |||||||||
| (1) | Includes interest-bearing time deposits with other banks. |
Source: First Seacoast Bancorp, financial statements.
Asset Composition
The Company’s total assets amounted to $510.2 million at June 30, 2022, reflecting an increase of 4.8% or $23.2 million during the six-month period from total assets of $487.1 million at December 31, 2021. In the prior year, the Company’s total assets increased by 9.9% or $44.0 million from $443.1 million at December 31, 2020 to $487.1 million at December 31, 2021. The recent increases in total assets were primarily attributable to increases in the holdings of loans
11
FELDMAN FINANCIAL ADVISORS, INC.
and investment securities funded by increases in total deposits and borrowings. Total loans increased by $17.5 million from $368.1 million at December 31, 2020 to $385.6 million at June 30, 2022, spurred by growth mainly in residential mortgage and commercial real estate loans and offset by a decline in commercial business loans due to the guaranteed forgiveness of Paycheck Protection Program (“PPP”) loans. Securities available-for-sale increased by $47.9 million from $55.5 million at December 31, 2020 to $103.4 million at June 30, 2022. Largely as a result of the increase in cash and investments, the ratio of net total loans to total assets declined from 82.3% at December 31, 2020 to 74.9% at June 30, 2022. Conversely, the aggregate balance of cash and investments increased from 14.8% at December 31, 2020 to 21.8% at June 30, 2022. Total deposits increased by $60.5 million from $327.4 million at December 31, 2020 to $387.9 million at June 30, 2020.
Table 2
Relative Balance Sheet Concentrations
As of December 31, 2020 and 2021 and June 30, 2022
(Percent of Total Assets)
| June 30, | December 31, | |||||||||||
| 2022 | 2021 | 2020 | ||||||||||
Cash and investments (1) | 21.78 | % | 20.72 | % | 14.84 | % | ||||||
Total loans, net | 74.86 | 76.59 | 82.34 | |||||||||
Premises and equipment, net | 0.86 | 0.94 | 1.15 | |||||||||
Bank-owned life insurance | 0.88 | 0.92 | 0.98 | |||||||||
Other assets | 1.62 | 0.83 | 0.69 | |||||||||
|
|
|
|
|
| |||||||
Total assets | 100.00 | % | 100.00 | % | 100.00 | % | ||||||
|
|
|
|
|
| |||||||
Total deposits | 76.02 | % | 80.74 | % | 73.89 | % | ||||||
Borrowed funds | 12.59 | 6.05 | 11.81 | |||||||||
Other liabilities | 1.23 | 0.80 | 1.02 | |||||||||
|
|
|
|
|
| |||||||
Total liabilities | 89.83 | 87.59 | 86.71 | |||||||||
Total equity | 10.17 | 12.41 | 13.29 | |||||||||
|
|
|
|
|
| |||||||
Total liabilities and equity | 100.00 | % | 100.00 | % | 100.00 | % | ||||||
|
|
|
|
|
| |||||||
| (1) | Includes cash equivalents, securities available-for-sale, and FHLB stock. |
Source: First Seacoast Bancorp, financial statements.
12
FELDMAN FINANCIAL ADVISORS, INC.
Lending is the Company’s principal business activity, and its loan portfolio constitutes the largest portion of its assets and is the predominant source of its income. The largest segment of the Company’s loan portfolio comprises real estate mortgage loans, consisting primarily of residential mortgage loans, commercial real estate and multi-family mortgage loans, and acquisition, development and land loans. Substantially all of the Company’s collateralized real estate loans are secured by properties located in the Company’s primary lending area.
As presented in Exhibit II-3, the Company’s current loan portfolio is composed substantially of real estate loans. At June 30, 2022, real estate loans comprised $352.6 million or 91.9% of the gross loan portfolio and included residential loans (including one- to four-family mortgages and home equity loans and lines of credit) and non-residential real estate loans (generally consisting of loans secured by commercial and multi-family real estate and acquisition, development, and land loans). Non-real estate loans chiefly comprised commercial business loans and a limited amount of consumer loans. The Company intends to continue to emphasize residential and commercial real estate lending with a focus on full-service relationship banking in its primary market area.
During the six months ended June 30, 2022, FSB originated $50.7 million of loans. For the year ended December 31, 2021, the Company originated $130.4 million of loans, including $13.1 million of PPP loans. During the year ended December 31, 2020, the Company originated $150.8 million of loans, including $33.0 million of PPP loans. In recent years, the Company has also periodically purchased one- to four-family residential mortgage loans and consumer loans secured by manufactured housing properties. As of June 30, 2022, the portfolio of purchased loans had an outstanding principal balance of $31.5 million and was performing in accordance with original repayment terms.
13
FELDMAN FINANCIAL ADVISORS, INC.
At June 30, 2022, FSB had $240.2 million in one- to four-family residential loans, which represented 62.6% of its total loan portfolio. One- to four-family residential loans outstanding increased by 9.6% in 2021 and by 2.6% for the first half of 2022. The Company’s one- to four-family residential real estate loans have terms of up to 30 years and are generally underwritten according to Freddie Mac guidelines. At June 30, 2022, approximately 97.1% of the Company’s one- to four-family residential real estate loans were fixed-rate loans. The Company sells a portion of fixed-rate conforming loans that it originates on a servicing-retained basis. Secondary market investors that purchase the Company’s loans include Freddie Mac and the New Hampshire Housing Finance Authority. For the year ended December 31, 2020 and 2021, the Company sold $12.0 million and $6.2 million, respectively, of one- to four-family residential mortgage loans. Loan sales of one- to four-family residential loans amounted to $495,000 for the first half of 2022. The Company’s portfolio of loans serviced for others amounted to $37.7 million at June 30, 2022.
At June 30, 2022, approximately 2.9% of the Company’s residential mortgage loans were adjustable-rate loans. The Company’s adjustable-rate mortgage loans have initial re-pricing terms of one, three, or five years. Following the initial re-pricing term, such loans adjust annually for the balance of the loan term. Adjustable-rate mortgage loans are indexed to the one-year U.S. Treasury constant maturity rate, plus a margin. The Company typically retains its adjustable-rate residential mortgage loans in portfolio. The Company does not offer “interest only” mortgage loans on permanent residential mortgage loans, and also does not offer residential mortgage loans that provide for negative amortization or principal or contain any other subprime loan characteristics.
14
FELDMAN FINANCIAL ADVISORS, INC.
In past years, the Company has purchased one- to four-family jumbo residential mortgage loans to supplement its own origination efforts. The Company did not purchase any such loans during the six months ended June 30, 2022. During the years ended December 31, 2020 and 2021, the Company purchased $9.9 million and $14.1 million and $9.9 million, respectively, of one- to four-family jumbo residential mortgage loans secured by properties located in the greater Boston market. As of June 30, 2022, the portfolio of purchased residential real estate loans had an outstanding principal balance of $26.5 million and these loans were performing in accordance with their original repayment terms.
As of June 30, 2022, the Company had $86.0 million in commercial real estate and multi-family real estate loans, which represented 22.4% of its total loan portfolio. The Company’s commercial real estate lending activity is consistent with its strategy to diversify the loan portfolio and increase the overall portfolio yield. The Company’s commercial real estate loans are secured by a variety of properties in FSB’s primary market area, including retail spaces, distribution centers, office buildings, manufacturing and warehouse properties, convenience stores, and other local businesses. The Company’s multi-family real estate loans, which amounted to $8.7 million at June 30, 2022, are secured by properties consisting of five or more rental units in the Company’s market area, including apartment buildings and student housing.
The Company’s commercial real estate and multi-family loans are generally originated as 10-year balloon loans, which reprice after five years and are amortized over 20 years. Interest rates on such loans are generally indexed to the FHLB of Boston five-year regular advance rate, plus a margin. The maximum loan-to-value ratio of the Company’s commercial real estate loans is generally 80% of the lower of purchase price or appraised value of the properties securing the loan and generally requires a minimum debt-service coverage ratio of 1.2x. On a limited basis, the Company also purchases and participates in commercial real estate loans from other financial institutions. Such loans are subject to the same underwriting criteria and loan approval requirements applied to loans originated by the Company. At June 30, 2022, the Company had outstanding participation interests totaling $20.6 million.
15
FELDMAN FINANCIAL ADVISORS, INC.
At June 30, 2022, the Company had $17.1 million in acquisition, development and land loans, which represented 4.5% of its total loan portfolio. Acquisition, development and loan loans decreased from $23.1 million at year-end 2020 and $21.4 million at year-end 2021. These loans consist of residential construction loans, commercial real estate construction loans, and land loans. The Company originates loans to finance the construction or rehabilitation of owner-occupied one- to four-family residential properties to prospective homeowners primarily located in its market area. Upon completion of construction, such loans convert to permanent mortgage loans. At June 30, 2022, residential construction loan balances amounted to $8.1 million or 2.1% of the total loan portfolio, with an additional $16.7 million available for advance to borrowers. Residential construction loans are generally structured as interest-only for nine months, with a loan-to-value ratio generally not exceeding 80% of the appraised value on a completed basis or the cost of completion, whichever is less.
The Company also originates loans to finance the construction of commercial properties, primarily owner-occupied properties located in its market area. Upon completion of construction, such loans convert to permanent commercial mortgage loans. At June 30, 2022, commercial construction loan balances totaled $8.1 million or 2.1% of the total loan portfolio, with an additional $4.7 million available for advance to borrowers. Commercial real estate construction loans are generally structured as interest-only for up to 18 months, with a loan-to-value ratio of up to 80% of the appraised value on a completed basis or a loan-to-cost of completion ratio of up to 85%. The Company also originated loans to finance the acquisition and development of land. Land development loans are generally secured by vacant land in the process of improvement. At June 30, 2022, land development loan balances amounted to $888,000 or 0.2% of the total loan portfolio.
16
FELDMAN FINANCIAL ADVISORS, INC.
At June 30, 2022, the Company had $24.6 million in commercial business loans, which represented 6.4% of its total loan portfolio. Commercial business loans outstanding increased from $24.7 million at year-end 2019 to $45.3 million at year-end 2020, largely due to the origination of PPP loans. Subsequently, as a result of the PPP loan forgiveness program, the Company’s commercial business loans outstanding returned to a more normalized level in 2021 and the first half of 2022. During the year ended December 31, 2020 and 2021, the Company originated 286 and 134 PPP loans, respectively, with aggregate principal balances of $33.0 million and $13.1 million, respectively. The Company’s remaining PPP loans outstanding amounted to $139,000 as of June 30, 2022.
The Company’s commercial business loans include equipment loans, business acquisition loans, and lines of credit to businesses operating in the local market area. The Company’s commercial business loans are generally used by the borrowers for working capital purposes or for acquiring equipment, inventory, or furniture. These loans are generally secured by non-real estate business and personal assets, including equipment, inventory, accounts receivable, and marketable securities, although the Company may support this collateral with liens on real property such as buildings and other equipment. FSB generally requires its commercial business borrowers to maintain their primary deposit accounts with the Company, which help to improve the Company’s overall interest rate spread and profitability. The Company’s commercial business loans include term loans and revolving lines of credit and are made with either variable or fixed rates of interest. Variable interest rates are indexed to the prime rate as published in The Wall Street Journal, plus a margin. The Company also originates commercial business loans through specific loan programs overseen and partially guaranteed by the Small Business Administration (“SBA”). The aggregate SBA loans amounted to $1.4 million at June 30, 2022.
17
FELDMAN FINANCIAL ADVISORS, INC.
The Company had $9.2 million of home equity loans and lines of credit as of June 30, 2022, representing 2.4% of total loans. FSB offers home equity loans and lines of credit, which are multi-purpose loans used to finance various home or personal needs, where a one- to four-family primary or secondary residence serves as collateral. At June 30, 2022, the Company’s home equity lines of credit had an additional $21.1 million available to draw. Home equity loans are originated by the Company as fixed-rate term loans. Home equity lines of credit are tied to the prime rate as published in The Wall Street Journal and are offered for terms of up to 25 years, with a 10-year draw period and 15-year repayment period. Generally, the Company’s home equity loans and lines of credit are originated with loan-to-value ratios of up to 80%, inclusive of existing liens on the property.
At June 30, 2022, the Company’s consumer loans amounted to $6.2 million, representing 1.6% of total loans. The Company offers consumer loans to individuals who reside or work in its primary market area. Consumer lending has been a minor area of lending diversification for the Company. Consumer loans generally consist of installment loans extended directly to the borrower. Management believes that offering consumer loan products helps to expand and create stronger ties to its existing customer base by increasing the number of customer relationships and cross-marketing opportunities. FSB expects that growth of this segment of the consumer loan portfolio will be limited, with such loans extended primarily to existing customers of the Company. The Company also purchases consumer loans secured by manufactured housing properties. The Company purchased $1.5 million, $2.0 million, and $1.2 million of these loans during 2020, 2021, and the first half of 2022, respectively, which are secured by properties located in the greater Seacoast region. The Company expects that growth in this segment of its consumer loan portfolio will continue to increase in the future.
18
FELDMAN FINANCIAL ADVISORS, INC.
Exhibit II-4 presents a summary of the Company’s portfolio of cash, liquidity, and investments as of December 31, 2020 and 2021 and June 30, 2022. The Company’s primary investment objectives include the following: (1) provide and maintain liquidity to meet deposit withdrawal and loan funding needs; (2) help mitigate interest rate and market risk; (3) diversify the Company’s assets; and (4) generate a reasonable rate of return on funds within the context of the Company’s interest rate and credit risk objectives. FSB’s Board of Directors is responsible for annually adopting and reviewing the investment policy of the Company. FSB’s Asset/ Liability Management Committee (“ALCO”) is responsible for implementing the Company’s investment policy. Authority to make investments under the approved investment policy guidelines is delegated to the President and Chief Executive Officer, Chief Financial Officer, and Finance Officer. All of the Company’s investment securities are classified as available-for-sale.
At June 30, 2022, the Company’s cash and investments amounted to $111.1 million or 21.8% of total assets. Cash and cash equivalents along with certificates of deposit in other financial institutions amounted to $5.1 million or 4.6% of the Company’s total cash and investments as of June 30, 2022. The Company’s available-for-sale securities portfolio totaled $103.8 million at June 30, 2022 and was composed of municipal bonds, U.S. Government-sponsored enterprises (“GSEs”) obligations, residential mortgage-backed securities, U.S. Government agency pools guaranteed by the SBA, and corporate subordinated debt. Municipal bonds, which amounted to $53.3 million, represented the largest segment of the investment
19
FELDMAN FINANCIAL ADVISORS, INC.
portfolio at June 30, 2022. For the quarter ended June 30, 2022, the Company’s taxable and non-taxable debt securities had yields of 1.86% and 2.49%, respectively. The Company also owned $2.7 million of stock in the FHLB of Boston as of June 30, 2022. Due to a rise in interest rates during the first half of 2022, the Company’s securities available-for-sale changed from a position of $788,000 in net unrealized holding gains as of December 31, 2021 to $11.8 million in net unrealized holding losses as of June 30, 2022. Management has indicated that it has no current plans for sales of securities in the portfolio that would result in realizing the magnitude of losses currently reflected by the fair values of the portfolio, nor does it believe that the declines in fair values were related to changes in the underlying credit quality of the securities.
Liability Composition
Deposits are the Company’s primary external source of funds for lending and other investment purposes. The Company has also utilized used borrowings actively to supplement deposits as a funding source. Exhibit II-5 presents a summary of the Company’s deposit composition as of December 31, 2020 and 2021 and June 30, 2022. Total deposits amounted to $274.4 million or 76.0% of total assets and 84.6% of total liabilities at June 30, 2022. Total deposits decreased by 1.4% or $5.3 million from $393.2 million at December 31, 2021 to $387.9 million at June 30, 2022, after increasing by 20.1% or $65.8 million from $327.4 million at December 31, 2020 to $393.2 million at December 31, 2021. Recent deposit growth has largely been concentrated in the Company’s checking accounts and savings deposits, which increased by $43.9 million and $16.0 million from December 31, 2020 to June 30, 2022.
20
FELDMAN FINANCIAL ADVISORS, INC.
FSB relies on personalized customer service, longstanding relationships with customers, and the favorable image of the Company in its primary market area to attract and retain deposits. Deposit account terms vary according to the minimum balance required, the time period that funds must remain on deposit, and the interest rate, among other factors. In determining the terms of its deposit accounts, the Company considers the rates offered by its competition, its liquidity needs, profitability, and customer preferences and concerns. FSB generally reviews its deposit pricing on a monthly basis and continually reviews its deposit mix. The Company’s deposit pricing strategy has generally been to offer competitive rates, while generally not providing the highest rates in the market. The Company finds it more profitable to concentrate on specific special rate and term accounts, which allows it to increase certain deposits without impacting the Company’s overall liability costs for existing accounts. FSB also relies on customer service, convenience of its branch office locations, advertising, and existing customers to gather and develop deposit relationships.
The Company has placed a concerted emphasis on attracting core (non-certificate) deposit accounts, which tend to represent low cost and more stable funding sources. Core deposits composed 85.9% or $333.1 million of total deposits at June 30, 2022, which reflected increases from 76.8% of total deposits or $188.4 million at December 31, 2016. For the quarter ended, the Company’s weighted average cost of core deposits was 0.06%, the cost of certificate deposits was 0.50%, and the overall cost of total deposits was 0.12% (inclusive of non-interest bearing accounts).
Developing comprehensive banking relationships has been a key priority for FSB and is a focus of its commercial lending and business development officers. In recent years, the Company has introduced new business deposit products to appeal to its commercial borrowers. At June 30, 2022, the ratio of commercial deposits to commercial loans (including commercial real estate loans, commercial business loans, and acquisition, development, and land loans) was 89.8%.
21
FELDMAN FINANCIAL ADVISORS, INC.
As a member of the FHLB of Boston, the Company may obtain FHLB borrowings based upon the security of FHLB capital stock owned and certain of the Company’s real estate mortgage loans. Such advances may be made pursuant to several different credit programs, each of which has its own interest rate terms and range of maturities. The Company uses FHLB advances to provide short-term funding as a supplement to its deposits. As of June 30, 2022, the Company had $64.3 million in FHLB advances outstanding and $58.0 million in additional borrowing capacity from the FHLB of Boston. The Company could access additional FHLB advances if it purchased additional FHLB of Boston capital stock.
Equity Capital
The Company has historically maintained solid capital levels. As the Company has steadily expanded its asset base, the ratio of total equity to total assets has declined. The total equity to total assets ratio decreased from 13.94% at December 31, 2019 to 10.17% at June 30, 2022. Because of the Company’s consistently below-average level of profitability, its incremental equity accumulation has been slow. Furthermore, the increase in net unrealized holding losses resulted in a sharp decline in equity capital during the first half of 2022.
The Company’s equity capital declined from $60.5 million or 12.41% of total assets at December 31, 2021 to $51.9 million or 10.17% of total assets at June 30, 2022. The reduction in equity during the first half of 2022 was due primarily to a reduction in accumulated other comprehensive income (“AOCI”) of $8.8 million related mainly to net changes in unrealized holding losses in the available-for-sale securities portfolio as a result of an increase in market interest rates during the period and common stock repurchases of $623,000, partially offset by the recognition of net income of $572,000 for the six months ended June 30, 2022.
22
FELDMAN FINANCIAL ADVISORS, INC.
The Bank’s capital level remains solid in comparison to minimum regulatory requirements. The Bank’s regulatory capital ratios of tier 1 leverage capital, common equity tier 1 risk-based capital, tier 1 risk-based capital, and total risk-based capital were 10.01%, 15.56%, 15.56%, and 16.70%, respectively, as of June 30, 2022. In comparison, the minimum regulatory requirements under federal banking agency guidelines were 4.00%, 4.50%, 6.00%, and 8.00%, and the threshold requirements for regulatory “well capitalized” levels were 5.00%, 6.50%, 8.00%, and 10.00%, respectively. Based on these regulatory capital ratios and requirements, the Bank was considered well capitalized for regulatory purposes as of June 30, 2022.
The Bank’s tier 1 capital amounted to $50.4 million as of June 30, 2022, as compared to the Bank’s equity capital of $42.7 million. The difference was primarily attributed to the net unrealized holding losses being excluded from tier 1 capital for regulatory purposes. Consistent with regulatory capital rules in effect, the Bank previously elected to opt out of the requirement to include most components of AOCI in regulatory capital. Therefore, the Bank’s AOCI in the amount of negative $8.1 million as of June 30, 2022 was added back to compute tier 1 capital for regulatory capital purposes.
The Company assesses its securities available-for-sale each quarter, or more often if a potential loss triggering event occurs, and considers the extent and duration of any unrealized losses and the financial condition and near-term prospects of the issuers. As of June 30, 2022, the Company did not intend to sell its investment securities available-for-sale and indicated it was unlikely that it would have had to sell them before recovery of their amortized cost, which may be at maturity. Furthermore, the Company believed that the unrealized holding losses at June 30, 2022 were primarily due to market interest rate fluctuations and not changes in credit quality.
23
FELDMAN FINANCIAL ADVISORS, INC.
Income and Expense Trends
Table 3 displays the main components of the Company’s earnings performance for the years ended December 31, 2020 and 2021 and the six months ended June 30, 2021 and 2022. Table 4 displays the Company’s principal income and expense ratios as a percent of average assets for the corresponding periods. Table 5 displays the Company’s weighted average yields on interest-earning assets and weighted average costs of interest-bearing liabilities for the years ended December 31, 2020 and 2021 and the six months ended June 30, 2021 and 2022.
General Overview
Over recent years, the Company has exhibited a record of low to moderate profitability. The Company’s average core ROA (excluding non-recurring items) for the past five years ended December 31, 2021 was approximately 0.27%, and reflected core ROA results of 0.30%, 0.29%, 0.12%, 0.17%, and 0.46% for 2017, 2018, 2019, 2020, and 2021, respectively. The Company reported an annualized core ROA of 0.21% for the six months ended June 30, 2022. Compared to its FDIC-insured institution peer group, the Company’s profitability trends can be characterized by above-average net interest margins, offset by relatively low levels of non-interest income and comparatively high operating expense ratios.
The Company’s earnings performance reflected a net loss of $79,000 in 2019 that resulted chiefly from a charitable foundation contribution expense of $758,000. The Company reported improved earnings of $1.1 million for 2020 and $2.6 million in 2021 as balance sheet growth drove increases in net interest income and securities gains augmented non-interest income. The Company’s net income amounted to $572,000 for the first half of 2022, representing an annualized ROA of 0.23% and an annualized return on average equity (“ROE”) of 2.02%.
24
FELDMAN FINANCIAL ADVISORS, INC.
Table 3
Income Statement Summary
For the Years Ended December 31, 2020 and 2021
And the Six Months Ended June 30, 2021 and 2022
(Dollars in Thousands)
| Six Months Ended | Year Ended | |||||||||||||||
| June 30, | December 31, | |||||||||||||||
| 2022 | 2021 | 2021 | 2020 | |||||||||||||
Interest income | $ | 7,922 | $ | 7,813 | $ | 15,495 | $ | 15,850 | ||||||||
Interest expense | 391 | 512 | 1,235 | 3,174 | ||||||||||||
|
|
|
|
|
|
|
| |||||||||
Net interest income | 7,531 | 7,301 | 14,260 | 12,676 | ||||||||||||
Provision for loan losses | 60 | 85 | 205 | 480 | ||||||||||||
|
|
|
|
|
|
|
| |||||||||
Net interest income after provision | 7,471 | 7,216 | 14,055 | 12,196 | ||||||||||||
Non-interest operating income | 788 | 844 | 1,714 | 1,636 | ||||||||||||
Securities gains, net | 52 | 535 | 535 | 410 | ||||||||||||
|
|
|
|
|
|
|
| |||||||||
Non-interest income | 840 | 1,379 | 2,249 | 2,046 | ||||||||||||
Non-interest expense | 7,615 | 6,425 | 13,082 | 13,187 | ||||||||||||
|
|
|
|
|
|
|
| |||||||||
Income before income tax expense | 696 | 2,170 | 3,222 | 1,055 | ||||||||||||
Income tax expense (benefit) | 124 | 429 | 601 | (24 | ) | |||||||||||
|
|
|
|
|
|
|
| |||||||||
Net income | $ | 572 | $ | 1,741 | $ | 2,621 | $ | 1,079 | ||||||||
|
|
|
|
|
|
|
| |||||||||
Source: First Seacoast Bancorp, financial statements.
Six Months Ended June 30, 2021 and 2022
Net income was $572,000 for the six months ended June 30, 2022, compared to $1.7 million for the six months ended June 30, 2021, a decrease of $1.2 million, or 67.1%. The decrease was due primarily to an increase in non-interest expense of $1.2 million and a decrease in non-interest income of $539,000 (including a decrease of $483,000 in net securities gains), offset by an increase in net interest income of $230,000. The Company’s annualized ROA decreased from 0.75% for the first half of 2021 to 0.23% for the first half of 2022.
25
FELDMAN FINANCIAL ADVISORS, INC.
Table 4
Income Statement Ratios
For the Years Ended December 31, 2020 and 2021
And the Six Months Ended June 30, 2021 and 2022
(Percent of Average Assets)
| Six Months Ended | Year Ended | |||||||||||||||
| June 30, | December 31, | |||||||||||||||
| 2022 | 2021 | 2021 | 2020 | |||||||||||||
Interest income | 3.17 | % | 3.35 | % | 3.23 | % | 3.50 | % | ||||||||
Interest expense | 0.16 | 0.21 | 0.26 | 0.70 | ||||||||||||
|
|
|
|
|
|
|
| |||||||||
Net interest income | 3.02 | 3.13 | 2.97 | 2.80 | ||||||||||||
Provision for loan losses | 0.02 | 0.04 | 0.04 | 0.11 | ||||||||||||
|
|
|
|
|
|
|
| |||||||||
Net interest income after provision | 2.99 | 3.10 | 2.93 | 2.70 | ||||||||||||
Non-interest operating income | 0.32 | 0.36 | 0.36 | 0.36 | ||||||||||||
Securities gains, net | 0.02 | 0.23 | 0.11 | 0.09 | ||||||||||||
|
|
|
|
|
|
|
| |||||||||
Non-interest income | 0.34 | 0.59 | 0.47 | 0.45 | ||||||||||||
Non-interest expense | 3.05 | 2.76 | 2.73 | 2.91 | ||||||||||||
|
|
|
|
|
|
|
| |||||||||
Income before income tax expense | 0.28 | 0.92 | 0.67 | 0.23 | ||||||||||||
Income tax expense | 0.05 | 0.18 | 0.13 | (0.01 | ) | |||||||||||
|
|
|
|
|
|
|
| |||||||||
Net income | 0.23 | 0.75 | 0.55 | 0.24 | ||||||||||||
|
|
|
|
|
|
|
| |||||||||
Source: First Seacoast Bancorp, financial statements and offering prospectus.
Net interest income increased by $230,000 or 3.2% to $7.5 million for the six months ended June 30, 2022 from $7.3 million for the six months ended June 30, 2021. This increase was primarily due to a $31.2 million or 6.9% increase in the average balance of interest-earning assets, consisting primarily of increases in the average balances of loans and debt securities, offset by an increase of $8.8 million or 2.6%, in the average balance of interest-bearing liabilities (consisting primarily of an increase in the average balance of borrowings) during the six months ended June 30, 2022. The Company’s annualized net interest margin decreased to 3.10% for the
26
FELDMAN FINANCIAL ADVISORS, INC.
six months ended June 30, 2022 from 3.22% for the six months ended June 30, 2021 due primarily to a decrease in the average yield on loans (3.89% to 3.64%) offset by an increase in the average yield on debt securities (1.89% to 2.02%) and a decrease in the average cost of funds (0.25% to 0.18%). Based on management’s analysis of the allowance for loan losses, a $60,000 provision for loan losses was recorded for the six months ended June 30, 2022, compared to $85,000 for the six months ended June 30, 2021.
Non-interest income decreased $539,000 or 39.1% to $840,000 for the six months ended June 30, 2022, compared to $1.4 million for the six months ended June 30, 2021. The decrease in non-interest income during the first half of 2022 was due primarily to a $483,000 decrease in net securities gains, an $86,000 decrease in gain on sale of loans, and a $27,000 decrease in customer service fees, offset by a $58,000 increase in investment services fees. The annualized ratio of non-interest income to average assets declined from 0.59% for the first half of 2021 to 0.34% for the first half of 2022. Excluding net securities gains, the ratio of non-interest operating income to average assets declined from 0.36% to 0.32% over the corresponding six-month periods.
Investment services fees increased from $118,000 for the first half of 2021 to $176,000 for the first half of 2022. The Company offers investment management services through FSB Wealth Management, which operates as a division of the Bank. FSB Wealth Management provides customers with access to investment products that include retirement planning, portfolio management, investment and insurance strategies, business retirement plans, and college planning. These investments and services are offered through a third-party registered broker-dealer and investment advisor. FSB Wealth Management receives fees from advisory services and commissions on individual investment and insurance products purchased by clients.
27
FELDMAN FINANCIAL ADVISORS, INC.
Table 5
Yield and Cost Summary
For the Years Ended December 31, 2020 and 2021
And the Six Months Ended June 30, 2021 and 2022
| Six Months Ended | Year Ended | |||||||||||||||
| June 30, | December 31, | |||||||||||||||
| 2022 | 2021 | 2021 | 2020 | |||||||||||||
Weighted Average Yields | ||||||||||||||||
Loans | 3.64 | 3.89 | % | 3.79 | % | 3.95 | % | |||||||||
Taxable debt securities | 1.70 | 1.01 | 1.27 | 1.60 | ||||||||||||
Non-taxable debt securities | 2.37 | 2.39 | 2.31 | 2.52 | ||||||||||||
Interest-bearing deposits | 0.66 | 0.33 | 0.28 | 0.43 | ||||||||||||
Federal Home Loan Bank stock | 2.06 | 0.21 | 1.17 | 4.18 | ||||||||||||
Total interest-earning assets | 3.26 | 3.44 | 3.31 | 3.60 | ||||||||||||
Weighted Average Costs | ||||||||||||||||
NOW and demand deposits | 0.09 | 0.13 | 0.12 | 0.23 | ||||||||||||
Money market deposits | 0.11 | 0.15 | 0.14 | 0.59 | ||||||||||||
Savings deposits | 0.04 | 0.06 | 0.06 | 0.10 | ||||||||||||
Certificates of deposit | 0.52 | 0.64 | 0.56 | 1.49 | ||||||||||||
Total interest-bearing deposits | 0.17 | 0.23 | 0.20 | 0.58 | ||||||||||||
Borrowings | 0.61 | 0.84 | 1.57 | 2.33 | ||||||||||||
Total interest-bearing liabilities | 0.23 | 0.31 | 0.37 | 0.95 | ||||||||||||
Net interest rate spread (1) | 3.03 | 3.13 | 2.94 | 2.65 | ||||||||||||
Net interest margin (2) | 3.10 | 3.22 | 3.04 | 2.88 | ||||||||||||
| (1) | Weighted average yield on interest-earning assets less the weighted average cost of interest-bearing liabilities. |
| (2) | Net interest income divided by average total interest-earning assets. |
Source: First Seacoast Bancorp, offering prospectus.
In August 2021, the Company entered into a definitive agreement with an investment advisory and wealth management firm to purchase certain of its client accounts and client relationships for a purchase price of $347,000. As of June 30, 2022, approximately $23.4 million of purchased client accounts are included in the Company’s total assets under management. The Company’s assets under management totaled $85.6 million, $88.0 million, and $58.4 million at June 30, 2022, December 31, 2021, and December 31, 2020, respectively. The client accounts purchased are recorded as a customer list intangible asset. The Company is amortizing the customer list intangible on a straight-line basis over a 10-year period. As of June 30, 2022, the unamortized balance of the customer list intangible was $316,000.
28
FELDMAN FINANCIAL ADVISORS, INC.
Non-interest expense increased by $1.2 million or 18.5% to $7.6 million for the six months ended June 30, 2022, compared to $6.4 million for the six months ended June 30, 2021. The increase in non-interest expense was due primarily to a $926,000 or 24.7% increase in salaries and employee benefits expense. The increase in salaries and benefits expense during the six months ended June 30, 2022 was due to filling certain open positions and associated recruitment fees, normal salary increases, and the recognition of compensation expense associated with the restricted stock awards granted in 2021. The annualized ratio of non-interest expense to average assets declined from 2.76% for the six months ended June 30, 2021 to 3.05% for the six months ended June 30, 2022.
The Company participates in the Pentegra Defined Benefit Plan for Financial Institutions, a multiple-employer pension plan. Total pension plan expense for the six months ended June 30, 2022 and the year ended December 31, 2021 was $100,000 and $200,000, respectively. The Company has provided notice of its intent to withdraw as a participant from the pension plan as of September 30, 2022. Based on an estimate provided in August 2022 by the plan administrator, the estimated total cost (pre-tax) to withdraw is $2.5 million. The Company intends to accrue for this amount during the quarter ending September 30, 2022. Because the cost of withdrawal will primarily depend on the value of the plan’s assets and applicable interest rates at the time of withdrawal, the actual withdrawal cost will not be known until the ultimate withdrawal date, which the Company anticipates would occur during the first quarter of 2022. The actual withdrawal cost may differ materially from the estimated cost provided by the plan administrator.
29
FELDMAN FINANCIAL ADVISORS, INC.
Years Ended December 31, 2020 and 2021
Net income was $2.6 million for the year ended December 31, 2021, compared to net income of $1.1 million for the year ended December 31, 2020, an increase of $1.5 million or 142.9%. The increase was related primarily to a $1.6 million or 12.5% increase in net interest income, a $275,000 or 57.3% decrease in the provision for loan losses, a $203,000 or 9.9% increase in non-interest income, and a $105,000 or 0.8% decrease in non-interest expense. The Company’s ROA improved from 0.24% in 2020 to 0.55% for 2021.
Net interest income increased $1.6 million or 12.5% to $14.3 million for the year ended December 31, 2021 from $12.7 million for the year ended December 31, 2020. This increase was due to a $27.8 million or 6.3% increase in the balance of average interest-earning assets and a 58 basis point or 61.2% decrease in the weighted average rate of average interest-bearing liabilities during the year ended December 31, 2021. The Company’s net interest margin increased to 3.04% for the year ended December 31, 2021 from 2.88% for the year ended December 31, 2020.
The Company decreased its provision for loan losses from $480,000 for the year ended December 31, 2020 to $205,000 for the year ended December 31, 2021. The decrease in the provision for loan losses for the year ended December 31, 2021 was primarily due to adjustments to qualitative factors reflecting improved economic conditions compared to economic uncertainties as a result of the coronavirus pandemic during 2020.
Non-interest income increased $203,000 or 9.9% to $2.2 million in the year ended December 31, 2021, compared to $2.0 million for the year ended December 31, 2020. The increase in non-interest income during the year ended December 31, 2021 was due primarily to a $125,000 or 30.5% increase in net securities gains, a $166,000 increase in loan servicing fee
30
FELDMAN FINANCIAL ADVISORS, INC.
income, a $49,000 or 24.7% increase in investment services fees, and a $28,000 or 2.9% increase in customer service fees, offset by a decrease of $193,000 or 59.8% in gain on sale of loans. The ratio of non-interest income to average assets increased from 0.45% in 2020 to 0.47% for 2021. Excluding net securities gains, the ratio of non-interest operating income to average assets was unchanged at 0.36% for both yearly periods.
Non-interest expense decreased by $105,000 or 0.8% to $13.1 million for the year ended December 31, 2021 from $13.2 million for the year ended December 31, 2020. The decrease in non-interest expense was due primarily to a $236,000 or 2.9% decrease in salaries and employee benefits, a $57,000 or 6.4% decrease in professional fees and assessments, a $34,000 or 5.1% decrease in occupancy expense, and a $28,000 or 4.9% decrease in equipment expense, offset by a $241,000 or 20.7% increase in data processing during the year ended December 31, 2021.
The decrease in salaries and employee benefits was due to the elimination of certain positions and early retirements during 2020, offset by normal salary increases. The increase in data processing was due primarily to continued investment in cybersecurity initiatives and enhancements to the Company’s customer-based technologies. The overall ratio of non-interest expense to average assets declined from 2.91% for the year ended December 31, 2020 to 2.73% for the year ended December 31, 2021. The Company’s efficiency ratio improved from 92.1% in 2020 to 81.9% in 2021. (The efficiency ratio represents non-interest operating expense divided by the sum of net interest income and non-interest income exclusive of securities gains.)
31
FELDMAN FINANCIAL ADVISORS, INC.
Interest Rate Risk Management
The Company seeks to reduce its earnings vulnerability and capital risk to changes in market interest rates by managing the mismatch between asset and liability maturities and interest rates. The primary objective of the Company’s asset/liability management program is to optimize earnings and return on capital within acceptable levels of risk. The Company’s ALCO focuses on ensuring a stable and steadily increasing flow of net interest income through managing the size and mix of the balance sheet. The ALCO is expected to integrate the Company’s asset/liability management process into its operational decision making, including portfolio structure, investments, business planning, funding decisions, and pricing. The ALCO is responsible for evaluating the interest rate risk inherent in the Company’s assets and liabilities, for determining the level of risk that is appropriate given the Company’s business strategy, operating environment, capital, liquidity and performance objectives, and for managing this risk consistent with the policy and guidelines approved by the Board of Directors.
The asset/liability management policy of the Company falls under the authority of the Board of Directors, which in turn assigns authority for its formulation, revision and administration to the ALCO. Ultimate responsibility for effective asset/liability management rests with the Board of Directors. The responsibilities conveyed to the ALCO include:
| • | Developing an asset/liability management process and related procedures. |
| • | Establishing a monitoring and reporting system. |
| • | Developing asset/liability strategies and tactics. |
| • | Submitting a written report to the Board of Directors at least quarterly. |
| • | Overseeing the maintenance of a management information system that supplies, on a timely basis, the information and data necessary for the ALCO to fulfill its role as asset/liability manager. |
32
FELDMAN FINANCIAL ADVISORS, INC.
FSB attempts to manage its interest rate risk to minimize the exposure of the Company’s earnings and capital to changes in market interest rates. The ALCO meets on at least a quarterly basis and reviews asset/liability strategies, liquidity positions, alternative funding sources, interest rate risk measurement reports, capital levels, and economic trends at both national and local levels. The Company has implemented various strategies to manage its interest rate risk. By enacting these strategies, the Company believes that it is better positioned to react to changes in market interest rates. These strategies include:
| • | Originating loans with adjustable interest rates. |
| • | Promoting core deposit products. |
| • | Selling a portion of fixed-rate one- to four-family residential mortgage loans. |
| • | Maintaining investments as available-for-sale securities. |
| • | Diversifying the loan portfolio. |
| • | Strengthening the capital position, so as to increase the ratio of interest-earning assets relative to interest-rate sensitive funding sources. |
The Company analyzes its sensitivity to changes in interest rates through a net portfolio value of equity (“NPV”) model. NPV represents the present value of the expected cash flows from the Company’s assets less the present value of the expected cash flows arising from the Company’s liabilities adjusted for the value of off-balance sheet contracts. The NPV ratio represents the dollar amount of NPV divided by the present value of total assets for a given interest rate scenario. NPV attempts to quantify the Company’s economic value using a discounted cash flow methodology while the NPV ratio reflects that value as a form of capital ratio. The Company estimates its NPV at a specific date, and then calculates the NPV at the same date throughout a series of interest rate scenarios representing immediate and permanent, parallel shifts in the yield curve. The Company currently calculates NPV under the assumptions that interest rates increase 100, 200, 300 and 400 basis points from current market rates and that interest rates decrease 100 and 200 basis points from current market rates.
33
FELDMAN FINANCIAL ADVISORS, INC.
Table 6 represents an analysis of the Company’s interest rate risk as measured by the estimated changes in its NPV, resulting from an instantaneous and sustained parallel shift in the yield curve at June 30, 2022, with no effect given to any steps that the Company might take to counter the effect of such interest rate movement. As shown in Table 6, the Company’s NPV would be negatively impacted by an increase in interest rates and positively impacted from a moderate decrease in interest rates from current levels.
In a rising interest rate environment, the Company would expect that the rates on its deposits and borrowings would reprice upwards faster than the rates on its long-term loans and investments, which would be expected to compress FSB’s interest rate spread and have a negative effect on its profitability. Conversely, decreases in interest rates can result in increased prepayments of loans and mortgage-related securities, as borrowers refinance to reduce their borrowing costs. Under these circumstances, the Company is subject to reinvestment risk as it may have to redeploy such loan or securities proceeds into lower-yielding assets, which might also negatively impact earnings.
Table 6 indicates that the Company’s NPV was $62.5 million or 12.8% of the fair value of portfolio assets as of June 30, 2022. Based upon the assumptions utilized, an immediate 200 basis point increase in market interest rates would result in a $9.1 million decrease in the Company’s NPV and would result in a decrease of 92 basis points in the NPV ratio to 11.8%. An immediate increase of 100 basis points in market interest rates would result in a $4.0 million decrease in the Company’s NPV and a decrease of 32 basis points in the NPV ratio to 12.4%. Conversely, an immediate decrease of 100 basis points in market interest rates would result in a $9.6 million increase in the Company’s NPV and a decrease in the NPV ratio to 12.4%. As of June 30, 2022, the simulated changes in NPV were within the limits established in the Company’s asset/liability management policy.
34
FELDMAN FINANCIAL ADVISORS, INC.
Table 6
Net Portfolio Value of Equity
As of June 30, 2022
(Dollars in Thousands)
Basis Point Change in Interest | Estimated NPV(2) | Amount Change from Base (000s) | Percent Change from Base | NPV Ratio(3) | Basis Point Change in NPV Ratio | |||||||||||||||
+ 400 b.p. | $ | 43,530 | $ | (18,965 | ) | (30.3 | )% | 10.5 | % | (229 | ) b.p. | |||||||||
+ 300 b.p. | 48,399 | (14,096 | ) | (22.6 | )% | 11.2 | % | (157 | ) b.p. | |||||||||||
+ 200 b.p. | 53,393 | (9,102 | ) | (14.6 | )% | 11.8 | % | (92 | ) b.p. | |||||||||||
+ 100 b.p. | 58,482 | (4,013 | ) | (6.4 | )% | 12.4 | % | (32 | ) b.p. | |||||||||||
Base | 62,495 | — | — | 12.8 | % | — | ||||||||||||||
- 100 b.p. | 63,018 | 9,625 | 0.8 | % | 12.4 | % | (39 | ) b.p. | ||||||||||||
- 200 b.p. | 60,479 | (2,016 | ) | (3.2 | )% | 11.4 | % | (132 | ) b.p. | |||||||||||
| (1) | Assumes an immediate uniform change in interest rates at all maturities. |
| (2) | NPV is the fair value of expected cash flows from assets, less the fair value of the expected cash flows arising from liabilities adjusted for the value of off-balance sheet contracts. |
| (3) | NPV ratio represents NPV divided by the fair value of assets. |
Source: First Seacoast Bancorp, offering prospectus.
35
FELDMAN FINANCIAL ADVISORS, INC.
Asset Quality
Table 8 summarizes the Company’s total non-performing assets as of December 31, 2020 and 2021 and June 30, 2022. The Company has a favorable record of reporting solid asset quality. Total non-performing assets decreased from $884,000 at December 31, 2020 to $837,000 at December 31, 2021, and then decreased to $602,000 at June 30, 2022.In relation to total assets, non-performing assets declined from 0.20% at December 31, 2020 to 0.17% at December 31, 2021 and subsequently declined to 0.12% at June 30, 2022. Non-performing assets at June 30, 2022 consisted primarily of a residential mortgage loan and home equity line of credit to deceased borrowers with aggregate outstanding loan balances of $602,000. The collateralizing property had an estimated market value of approximately $1.2 million. The Company’s one troubled debt restructuring as of June 30, 2022 had an outstanding balance of $192,000 and was on accrual status.
Table 8 summarizes the Company’s allowance for loan losses as of and for the year ended December 31, 2020 and 2021 and the six months ended June 30, 2022. In response to the economic uncertainty related to the coronavirus pandemic, the Company previously increased its allowance during 2020 from $2.9 million or 0.83% of total loans to $3.3 million or 0.91% of total loans at December 31, 2020. The Company recorded a provision for loan losses of $480,000 for the year ended December 31, 2020. Since then, the provision for loan losses has been reduced to $205,000 for the year ended December 31, 2021 and $60,000 for the six months ended June 30, 2022 as net loan charge-offs have been negligible. As of June 30, 2022, the allowance for loan losses amounted to $3.6 million or 0.95% of total loans. The Company realized net recoveries of $43,000 for the year ended December 31, 2021 and net charge-offs of $6,000 for the six months ended June 30, 2022.
36
FELDMAN FINANCIAL ADVISORS, INC.
Table 7
Non-performing Asset Summary
As of December 31, 2020 and 2021 and June 30, 2022
(Dollars in Thousands)
| June 30, | December 31, | |||||||||||
| 2022 | 2021 | 2020 | ||||||||||
Non-accrual Loans | ||||||||||||
One- to four-family residential loans | $ | 487 | $ | 722 | $ | 62 | ||||||
Commercial and multi-family real estate | — | — | — | |||||||||
Acquisition, development, and land loans | — | — | — | |||||||||
Commercial business loans | — | — | 822 | |||||||||
Home equity loans and lines of credit | 115 | 115 | — | |||||||||
Consumer loans | — | — | — | |||||||||
|
|
|
|
|
| |||||||
Total non-accrual loans | 602 | 837 | 884 | |||||||||
|
|
|
|
|
| |||||||
Accruing loans past due 90 days or more | — | — | — | |||||||||
|
|
|
|
|
| |||||||
Total non-performing loans | 602 | 837 | 884 | |||||||||
|
|
|
|
|
| |||||||
Real estate owned | — | — | — | |||||||||
|
|
|
|
|
| |||||||
Total non-performing assets | $ | 602 | $ | 837 | $ | 884 | ||||||
|
|
|
|
|
| |||||||
Total non-performing loans to total loans | 0.16 | % | 0.22 | % | 0.24 | % | ||||||
Total non-performing assets to total assets | 0.12 | % | 0.17 | % | 0.20 | % | ||||||
Source: First Seacoast Bancorp, offering prospectus.
37
FELDMAN FINANCIAL ADVISORS, INC.
Table 8
Allowance for Loan Losses
As of or For the Years Ended December 31, 2020 and 2021
And the Six Months Ended June 30, 2021 and 2022
(Dollars in Thousands)
| Six Months Ended | Year Ended | |||||||||||||||
| June 30, | December 31, | |||||||||||||||
| 2022 | 2021 | 2021 | 2020 | |||||||||||||
Allowance at beginning of the period | $ | 3,590 | $ | 3,342 | $ | 3,342 | $ | 2,875 | ||||||||
Provision for loan losses | 60 | 85 | 205 | 480 | ||||||||||||
Charge-offs: | ||||||||||||||||
One- to four-family residential | — | — | — | — | ||||||||||||
Commercial and multi-family real estate | — | — | — | — | ||||||||||||
Acquisition, development, and land | — | — | — | — | ||||||||||||
Commercial business | — | — | — | — | ||||||||||||
Home equity loans and lines of credit | — | — | — | — | ||||||||||||
Consumer | (9 | ) | — | — | (35 | ) | ||||||||||
|
|
|
|
|
|
|
| |||||||||
Total charge-offs | (9 | ) | — | — | (35 | ) | ||||||||||
Recoveries: | ||||||||||||||||
One- to four-family residential | — | — | 1 | 19 | ||||||||||||
Commercial and multi-family real estate | — | — | — | — | ||||||||||||
Acquisition, development, and land | — | — | — | — | ||||||||||||
Commercial business | 1 | 37 | 39 | 2 | ||||||||||||
Home equity loans and lines of credit | — | — | — | — | ||||||||||||
Consumer | 2 | 2 | 3 | 1 | ||||||||||||
|
|
|
|
|
|
|
| |||||||||
Total recoveries | 3 | 39 | 43 | 22 | ||||||||||||
Net (charge-offs) recoveries | (6 | ) | 39 | 43 | (13 | ) | ||||||||||
|
|
|
|
|
|
|
| |||||||||
Allowance at end of the period | $ | 3,644 | $ | 3,466 | $ | 3,590 | $ | 3,342 | ||||||||
|
|
|
|
|
|
|
| |||||||||
Allowance to total loans at period end | 0.95 | % | 0.92 | % | 0.95 | % | 0.91 | % | ||||||||
Allowance to non-performing loans at period end | 605.32 | % | NM | 428.91 | % | 378.05 | % | |||||||||
Net (charge-offs) recoveries to average loans during the period | 0.00 | % | 0.01 | % | 0.01 | % | 0.00 | % | ||||||||
Source: First Seacoast Bancorp, offering prospectus.
38
FELDMAN FINANCIAL ADVISORS, INC.
Office Facilities
The Company currently conducts business from its main office in Dover, New Hampshire and four additional full-service branch offices located in the New Hampshire towns of Barrington, Durham, Portsmouth, and Rochester. The Company owns its main office building in Dover and three branch offices in Barrington, Portsmouth, and Rochester. The Company leases the branch office location in Durham. As of June 30, 2022, the net book value of the Company’s land, buildings, and equipment was $4.4 million, measuring 0.9% of total assets. The Company believes that its current facilities are adequate to meet its present and foreseeable needs, subject to possible future expansion.
Exhibit II-7 provides summary information about the Company’s office properties. The main office and headquarters location are situated at 633 Central Avenue in Dover (Strafford County), Hampshire. The main office is owned by the Company and had a net book value of $1.4 million at June 30, 2022. The facility also includes a drive-up lane and an automated teller machine (“ATM”). The main office was originally opened in 1890. FSB Wealth Management operates from an office location at 629 Central Avenue in Dover. This location is adjacent to the main office and is owned by the Company.
The Barrington branch is located at 6 Eastern Avenue in Barrington (Strafford County), New Hampshire. This branch office is owned by the Company and had a net book value of $1.0 million at June 30, 2022. The facility also has a drive-thru lane and an ATM. The Barrington branch has been open since 1974.
39
FELDMAN FINANCIAL ADVISORS, INC.
The Durham branch is located at 7A Mill Road in Durham (Strafford County), New Hampshire. This branch office is leased by the Company and had a net book value of $27,000 at June 30, 2022. The facility has an ATM but does not have a drive-thru lane. The Durham branch was opened in 1979.
The Portsmouth branch is located at 1650 Woodbury Avenue in Portsmouth (Rockingham County), New Hampshire. This branch office is owned by the Company and had a net book value of $929,000 million at June 30, 2022. The facility also has a drive-up lane and an ATM. The Portsmouth branch has been open since 1987. FSB also operates a stand-alone ATM located at 1 Market Square in Portsmouth.
The Rochester branch is located at 17 Wakefield Street in Rochester (Strafford County), New Hampshire. This branch office is owned by the Company and had a net book value of $1.1 million at June 30, 2022. The facility has a drive-up lane and an ATM. The Rochester branch was opened in 2009.
40
FELDMAN FINANCIAL ADVISORS, INC.
Market Area
Overview of Market Area
The Company conduct its operations from four full-service banking offices in Strafford County, New Hampshire and one full-service banking office in Rockingham County, New Hampshire, located in the southeastern part of the state along the New Hampshire Seacoast. The Company considers its primary lending market area to encompass Strafford and Rockingham counties in New Hampshire and York County in southern Maine. The Strafford County branches are located in the cities of Dover, Durham, Barrington, and Rochester, New Hampshire. The Rockingham County branch is located in the city of Portsmouth, New Hampshire.
The New Hampshire and southern Maine Seacoast Region’s economy is fairly diversified, with employment in education, healthcare, government, services, retail and manufacturing sectors. Top employment sectors in Strafford County include healthcare, government, education, insurance, retail, and textile manufacturing. Top employment sectors in Rockingham County are healthcare, government, insurance, pharmaceuticals, and biotechnology. Additionally, although it does not have a branch office in York County, Maine, many of the Company’s customers work and reside in York County, which is contiguous to Strafford County.
Rockingham and Strafford counties are part of the Boston-Cambridge-Newton, MA-NH Metropolitan Statistical Area (the “Boston MSA”). These two counties compose the Rockingham-Strafford County, NH Metropolitan Division (the “Rockingham-Strafford Metropolitan Division) within the Boston MSA. Dover is located approximately 65 miles from Boston, Massachusetts and less than 50 miles from Manchester, New Hampshire and Portland, Maine. Table 9 presents comparative demographic data for the United States, the state of New Hampshire, the Boston MSA, Strafford County, and Rockingham County.
41
FELDMAN FINANCIAL ADVISORS, INC.
Table 9
Selected Demographic Data
| United | Boston | New | Strafford | Rockingham | ||||||||||||||||
| States | MSA | Hampshire | County | County | ||||||||||||||||
Total Population | ||||||||||||||||||||
2010 - Base | 308,745,538 | 4,552,402 | 1,316,470 | 123,143 | 295,223 | |||||||||||||||
2022 - Current | 334,279,739 | 5,011,582 | 1,386,515 | 133,182 | 316,810 | |||||||||||||||
2027 - Projected | 344,999,336 | 5,238,768 | 1,426,804 | 137,996 | 327,644 | |||||||||||||||
% Change 2010-2022 | 8.27 | % | 10.09 | % | 5.32 | % | 8.15 | % | 7.31 | % | ||||||||||
% Change 2022-2027 | 3.21 | % | 4.53 | % | 2.91 | % | 3.61 | % | 3.42 | % | ||||||||||
Age Distribution, 2022 | ||||||||||||||||||||
0 - 14 Age Group | 18.15 | % | 16.00 | % | 14.81 | % | 14.55 | % | 14.81 | % | ||||||||||
15 - 34 Age Group | 26.61 | % | 27.19 | % | 24.95 | % | 31.65 | % | 23.03 | % | ||||||||||
35 - 54 Age Group | 25.00 | % | 25.92 | % | 24.43 | % | 23.37 | % | 25.24 | % | ||||||||||
55 - 69 Age Group | 18.49 | % | 19.25 | % | 22.76 | % | 19.51 | % | 24.05 | % | ||||||||||
70+ Age Group | 11.74 | % | 11.64 | % | 13.05 | % | 10.93 | % | 12.87 | % | ||||||||||
Median Age (years) | 39.1 | 40.2 | 43.6 | 38.3 | 45.3 | |||||||||||||||
Total Households | ||||||||||||||||||||
2010 - Base | 116,716,292 | 1,760,584 | 518,973 | 47,100 | 115,033 | |||||||||||||||
2022 - Current | 127,073,679 | 1,961,816 | 557,283 | 52,168 | 126,021 | |||||||||||||||
2027 - Projected | 131,388,249 | 2,059,115 | 576,619 | 54,426 | 131,029 | |||||||||||||||
% Change 2010-2022 | 8.87 | % | 11.43 | % | 7.38 | % | 10.76 | % | 9.55 | % | ||||||||||
% Change 2022-2027 | 3.40 | % | 4.96 | % | 3.47 | % | 4.33 | % | 3.97 | % | ||||||||||
Household Income, 2022 | ||||||||||||||||||||
< $25,000 | 16.38 | % | 12.94 | % | 12.21 | % | 12.91 | % | 9.38 | % | ||||||||||
$25,000 - $49,999 | 19.06 | % | 12.39 | % | 16.24 | % | 16.61 | % | 12.46 | % | ||||||||||
$50,000 - $99,999 | 28.81 | % | 23.16 | % | 29.27 | % | 30.72 | % | 27.26 | % | ||||||||||
$100,000 - $199,999 | 24.79 | % | 29.92 | % | 29.51 | % | 29.88 | % | 32.54 | % | ||||||||||
$200,000+ | 10.97 | % | 21.59 | % | 12.76 | % | 9.89 | % | 18.36 | % | ||||||||||
Average Household Income | ||||||||||||||||||||
2022 - Current | $ | 103,625 | $ | 146,337 | $ | 114,442 | $ | 103,741 | $ | 137,404 | ||||||||||
2027 - Projected | $ | 116,275 | $ | 163,404 | $ | 126,931 | $ | 116,973 | $ | 152,447 | ||||||||||
% Change 2022-2027 | 12.21 | % | 11.66 | % | 10.91 | % | 12.75 | % | 10.95 | % | ||||||||||
Median Household Income | ||||||||||||||||||||
2022 - Current | $ | 72,465 | $ | 103,847 | $ | 85,417 | $ | 80,876 | $ | 102,139 | ||||||||||
2027 - Projected | $ | 81,230 | $ | 116,543 | $ | 93,818 | $ | 90,536 | $ | 113,440 | ||||||||||
% Change 2022-2027 | 12.10 | % | 12.23 | % | 9.84 | % | 11.94 | % | 11.06 | % | ||||||||||
Unemployment Rate | ||||||||||||||||||||
June 2020 | 11.2 | % | 13.9 | % | 9.5 | % | 9.1 | % | 10.0 | % | ||||||||||
June 2021 | 6.1 | % | 5.7 | % | 3.7 | % | 3.6 | % | 3.6 | % | ||||||||||
June 2022 | 3.8 | % | 3.2 | % | 2.0 | % | 2.0 | % | 2.0 | % | ||||||||||
42
FELDMAN FINANCIAL ADVISORS, INC.
Table 9 (continued)
Selected Demographic Data
| United | Boston | New | Strafford | Rockingham | ||||||||||||||||
| States | MSA | Hampshire | County | County | ||||||||||||||||
Total Housing Units, 2022 | 143,093,897 | 2,087,184 | 654,975 | 56,825 | 137,903 | |||||||||||||||
Owner Occupied | 82,867,360 | 1,201,049 | 396,514 | 34,634 | 97,021 | |||||||||||||||
Renter Occupied | 44,206,319 | 760,767 | 160,769 | 17,534 | 29,000 | |||||||||||||||
Vacant | 16,020,218 | 125,368 | 97,692 | 4,657 | 11,882 | |||||||||||||||
Owner Occupied | 57.91 | % | 57.54 | % | 60.54 | % | 60.95 | % | 70.35 | % | ||||||||||
Renter Occupied | 30.89 | % | 36.45 | % | 24.55 | % | 30.86 | % | 21.03 | % | ||||||||||
Vacant | 11.20 | % | 6.01 | % | 14.92 | % | 8.20 | % | 8.62 | % | ||||||||||
Owner Occupied Units | ||||||||||||||||||||
2022 - Current | 82,867,360 | 1,201,049 | 396,514 | 34,634 | 97,021 | |||||||||||||||
2027 - Projected | 85,688,240 | 1,259,896 | 410,630 | 36,145 | 100,960 | |||||||||||||||
% Change 2010-2022 | 9.06 | % | 10.93 | % | 7.66 | % | 10.86 | % | 9.80 | % | ||||||||||
% Change 2022-2027 | 3.40 | % | 4.90 | % | 3.56 | % | 4.36 | % | 4.06 | % | ||||||||||
Source: Claritas; S&P Global Market Intelligence; U.S. Department of Labor.
Dover is the county seat of and largest city in Strafford County. With an estimated 2022 population of 32,977, Dover is also the largest city in the New Hampshire Seacoast Region. The Seacoast Region is the southeast area of New Hampshire that includes the eastern portion of Rockingham County and the southern portion of Strafford County. The region stretches along the Atlantic Ocean from New Hampshire’s border with Salisbury, Massachusetts, to the Piscataqua River and New Hampshire’s border with Kittery, Maine. The shoreline alternates between rocky and rough headlands and areas with sandy beaches. The Seacoast Region has become known for its historical, tourist, and vacation attractions. In addition, the Seacoast Region is home to a thriving professional sector, particularly in the financial services and high-tech sectors and leveraging its proximity to the greater Boston and Portland metropolitan areas.
43
FELDMAN FINANCIAL ADVISORS, INC.
Strafford County is located in southeastern New Hampshire, separated from York County in the state of Maine by the Salmon Falls River. Strafford County has an estimated 2022 population of 133,182. Since 2010, Strafford County’s population increased by 8.2%, which exceeded the state of New Hampshire’s population growth rate of 5.3%. Over the next five years, Strafford County’s population is projected to increase by 3.6% as compared to the state’s growth projection of 2.9%.
Strafford County includes three cities (Dover, Rochester, and Somersworth) and 10 towns within its geographical boundaries. Though the state’s smallest county in land area at 369 square miles, Strafford County ranks as the state’s third highest based on population density. The median age in Strafford County was 38.3 years, as compared to the state’s median age of 43.6 years. Strafford County is the home to the University of New Hampshire (“UNH”), which is located in Durham. UNH is the state’s largest university and the largest employer in Strafford County.
Other major employers in Strafford County include Liberty Mutual Insurance Company, Frisbie Memorial Hospital, Wentworth-Douglass Hospital, City of Rochester Schools, City of Dover, Strafford County, ContiTech Thermopol (automotive components manufacturing), Albany Engineered Composites (materials processing), and Aclara Meters (power plant equipment manufacturing). Strafford County’s economic base constitutes a diverse cross-section of employment sectors, led by education and health services, retail trade, manufacturing, local government, and professional, business, and financial services.
Covering the southeast corner of the state, Rockingham County contains all of the state’s 18 miles of Atlantic Ocean coastline. Rockingham County includes one city (Portsmouth) and 36 towns within its geographical boundaries. Rockingham County had an estimated population in 2022 of 316,810, which had increased by 7.3% between 2010 and 2022, and is projected to increase by 3.4% from 2022 to 2027. Portsmouth is the largest city in Rockingham County with an estimated 2022 population of 21,715. Portsmouth also serves as the cultural and commercial hub of the Seacoast Region due to its numerous historical landmarks and tourist attractions.
44
FELDMAN FINANCIAL ADVISORS, INC.
The largest employers in Rockingham County include Lindt & Sprüngli USA Inc. (chocolate manufacturing), Portsmouth Consular Center (U.S. Department of State), Timberlane Regional School District, Londonderry School District, HCA Portsmouth Regional Hospital, Exeter Hospital, NextEra Energy (electric utility), Timberland International LLC (retail clothing), and Lonza Biologics (pharmaceuticals and biotechnology). The employment base in Rockingham County is centered on education and health services, retail trade, leisure and hospitality, federal government, manufacturing, and professional, business, and financial services.
The estimated median household income in 2022 was $80,876 for Strafford County and $102,139 for Rockingham County. The state’s median household income of $85,417 was higher than the national median of $72,465, but below the Boston MSA median of $103,847. The median home value in 2020 was $243,500 for Strafford County and $344,500 for Rockingham County, as compared to the state median of $272,300 and the nationwide median of $229,800. The owner-occupied housing unit rates in Strafford and Rockingham counties were 61.0% and 70.4%, respectively, as compared to the state and national rates of 60.5% and 57.9%, respectively.
The state’s unemployment rate has historically compared favorably to the national unemployment rate. In June 2022, the New Hampshire unemployment rate was 2.0% versus the U.S. unemployment rate of 3.8%. The corresponding unemployment rates in Rockingham and Strafford counties for June 2022 were equal to 2.0%, similar to the state unemployment rate.
45
FELDMAN FINANCIAL ADVISORS, INC.
Overview of Branch Network
The Bank’s branch network consists of five full-service banking offices, including the main office in Dover and additional offices in Barrington, Durham, Portsmouth, and Rochester. Table 10 provides deposit data for the Bank’s branch offices from June 30, 2016 to June 30, 2021. Table 11 includes a map of the office locations. The Bank’s deposits increased by a compound annual growth rate of 9.0% over this five-year period. The Bank’s largest office based on deposits is the main office in Dover, which had total deposits of $167.0 million or 43.7% of the Bank’s total deposits at June 30, 2021. Approximately 85.8% ($327.9 million) of the Bank’s deposits were held in the four banking offices in Strafford County and approximately 14.2% ($54.1 million) were held in the one banking office located in Rockingham County.
Table 10
Branch Office Deposit Data
Data as of June 30, 2016, 2020, and 2021
| Branch Deposits at June 30, | 1-Year | 5-Year | ||||||||||||||||||||||||||
| 2021 | 2020 | 2016 | Growth | CAGR | ||||||||||||||||||||||||
Address | City | St. | ($000) | ($000) | ($000) | (%) | (%) | |||||||||||||||||||||
Strafford County | ||||||||||||||||||||||||||||
633 Central Avenue | Dover | NH | 167,032 | 145,060 | 106,626 | 15.15 | 9.39 | |||||||||||||||||||||
7 Mill Road | Durham | NH | 58,688 | 51,714 | 42,630 | 13.49 | 6.60 | |||||||||||||||||||||
6 Eastern Avenue | Barrington | NH | 60,433 | 56,092 | 30,235 | 7.74 | 14.86 | |||||||||||||||||||||
17 Wakefield Street | Rochester | NH | 41,795 | 38,519 | 30,443 | 8.50 | 6.54 | |||||||||||||||||||||
Rockingham County | ||||||||||||||||||||||||||||
1650 Woodbury Avenue | Portsmouth | NH | 54,113 | 51,768 | 38,695 | 4.53 | 6.94 | |||||||||||||||||||||
Bank Total | 382,061 | 343,153 | 248,629 | 11.34 | 8.97 | |||||||||||||||||||||||
Source: S&P Global Market Intelligence.
46
FELDMAN FINANCIAL ADVISORS, INC.
Table 11
Map of Branch Office Locations

Market Share Analysis
Table 12 displays branch deposit data for financial institutions (commercial banks and savings institutions) in Strafford County as of June 30, 2021 (with deposit data adjusted for subsequently completed mergers). The Bank ranked third in Strafford County out of 11 financial institutions with total deposits of $327.9 million in four offices as of June 30, 2021 for a market share of 13.8%. The deposit market share leaders in Strafford County included large out-of-state banks such as TD Bank, Citizens Bank, M&T Bank, and Bank of America. TD Bank and Citizens Bank had deposit market share concentrations of 27.2% and 24.2%, respectively, as of June 30, 2021. Collectively, the top five financial institutions held 84.3% of the total deposits in Strafford County as of June 30, 2021. The aggregate deposit total in Strafford County increased by 13.4% from $2.1 billion at June 30, 2020 to $2.4 billion at June 30, 2021.
47
FELDMAN FINANCIAL ADVISORS, INC.
Table 13 provides branch deposit data for financial institutions in Rockingham County as of June 30, 2021. The Bank ranked 17th in Rockingham County out of 25 financial institutions with total deposits of $54.1 million in its Portsmouth office as of June 30, 2021 for a market share of 0.5%. The deposit market share leaders in Rockingham County also included large out-of-state banks such as TD Bank, Citizens Bank, Bank of America, M&T Bank, and Santander Bank. TD Bank and Citizens Bank had deposit market share concentrations of 27.3% and 17.5%, respectively. The top five financial institutions held an aggregate of 69.1% of the total deposits in Rockingham County. The overall deposit market in Rockingham County increased by 16.3% from $9.5 billion at June 30, 2020 to $11.1 billion at June 30, 2021.
Based on combined deposit data for Strafford and Rockingham counties, the Bank had total deposits of $382.1 million for a deposit market share of 2.7% as of June 30, 2021. TD Bank and Citizens Bank were the deposit leaders in the combined counties with market shares of 27.2% and 18.7%, respectively, as of June 30, 2021, followed by Bank of America at 11.2% and M&T Bank at 7.1%.
48
FELDMAN FINANCIAL ADVISORS, INC.
Table 12
Deposit Market Share in Strafford County, New Hampshire
Data as of June 30, 2021
(Adjusted for Subsequently Completed Mergers)
| No. of | Market | Market | Market | Market | 1-Year | 5-Year | ||||||||||||||||||||||||||
| Market | Branch | Deposits | Share | Deposits | Share | Deposit | Deposit | |||||||||||||||||||||||||
| Rank | Financial | Offices | 2021 | 2021 | 2020 | 2020 | Growth | CAGR | ||||||||||||||||||||||||
2021 | Institution | 2021 | ($000) | (%) | ($000) | (%) | (%) | (%) | ||||||||||||||||||||||||
Strafford County, NH | ||||||||||||||||||||||||||||||||
| 1 | TD Bank NA (DE) | 3 | 646,173 | 27.22 | 544,699 | 26.02 | 18.63 | 5.53 | ||||||||||||||||||||||||
| 2 | Citizens Bank NA (RI) | 6 | 574,961 | 24.22 | 545,536 | 26.06 | 5.39 | 1.89 | ||||||||||||||||||||||||
|
|
|
|
|
|
|
|
|
|
|
|
|
| |||||||||||||||||||
| 3 | First Seacoast Bank (NH) | 4 | 327,948 | 13.82 | 291,385 | 13.92 | 12.55 | 9.33 | ||||||||||||||||||||||||
|
|
|
|
|
|
|
|
|
|
|
|
|
| |||||||||||||||||||
| 4 | M&T Bank (NY) | 3 | 257,362 | 10.84 | 227,155 | 10.85 | 13.30 | 5.99 | ||||||||||||||||||||||||
| 5 | Bank of America NA (NC) | 2 | 193,934 | 8.17 | 168,008 | 8.03 | 15.43 | 10.12 | ||||||||||||||||||||||||
| 6 | Profile Bank (NH) | 2 | 154,709 | 6.52 | 134,775 | 6.44 | 14.79 | 6.22 | ||||||||||||||||||||||||
| 7 | Bank of New Hampshire (NH) | 2 | 109,064 | 4.59 | 80,545 | 3.85 | 35.41 | 29.48 | ||||||||||||||||||||||||
| 8 | Kennebunk Savings Bank (ME) | 1 | 43,314 | 1.82 | 37,805 | 1.81 | 14.57 | 23.14 | ||||||||||||||||||||||||
| 9 | Eastern Bank (MA) | 1 | 29,304 | 1.23 | 34,472 | 1.65 | (14.99 | ) | 7.59 | |||||||||||||||||||||||
| 10 | Cambridge Trust Company (MA) | 1 | 18,491 | 0.78 | 12,244 | 0.58 | 51.02 | — | ||||||||||||||||||||||||
| 11 | Newburyport Five Cts. Svgs. Bk. (MA) | 1 | 18,427 | 0.78 | 16,708 | 0.80 | 10.29 | — | ||||||||||||||||||||||||
Market Total | 26 | 2,373,687 | 100.00 | 2,093,332 | 100.00 | 13.39 | 6.66 | |||||||||||||||||||||||||
Source: S&P Global Market Intelligence.
49
FELDMAN FINANCIAL ADVISORS, INC.
Table 13
Deposit Market Share in Rockingham County, New Hampshire
Data as of June 30, 2021
(Adjusted for Subsequently Completed Mergers)
| No. of | Market | Market | Market | Market | 1-Year | 5-Year | ||||||||||||||||||||||||||
| Market | Branch | Deposits | Share | Deposits | Share | Deposit | Deposit | |||||||||||||||||||||||||
| Rank | Financial | Offices | 2021 | 2021 | 2020 | 2020 | Growth | CAGR | ||||||||||||||||||||||||
2021 | Institution | 2021 | ($000) | (%) | ($000) | (%) | (%) | (%) | ||||||||||||||||||||||||
Rockingham County, NH | ||||||||||||||||||||||||||||||||
| 1 | TD Bank NA (DE) | 15 | 3,019,615 | 27.25 | 2,479,580 | 26.01 | 21.78 | 10.92 | ||||||||||||||||||||||||
| 2 | Citizens Bank NA (RI) | 11 | 1,940,244 | 17.51 | 1,595,860 | 16.74 | 21.58 | 9.02 | ||||||||||||||||||||||||
| 3 | Bank of America NA (NC) | 5 | 1,313,496 | 11.85 | 1,195,093 | 12.54 | 9.91 | 8.77 | ||||||||||||||||||||||||
| 4 | M&T Bank (NY) | 11 | 694,096 | 6.26 | 602,112 | 6.32 | 15.28 | 6.98 | ||||||||||||||||||||||||
| 5 | Bank of New England (NH) | 3 | 689,780 | 6.22 | 581,355 | 6.10 | 18.65 | 12.52 | ||||||||||||||||||||||||
| 6 | Santander Bank NA (MA) | 6 | 617,348 | 5.57 | 590,063 | 6.19 | 4.62 | 6.37 | ||||||||||||||||||||||||
| 7 | Enterprise Bank and Trust Co. (MA) | 4 | 520,578 | 4.70 | 478,291 | 5.02 | 8.84 | 17.98 | ||||||||||||||||||||||||
| 8 | Cambridge Trust Company (MA) | 4 | 383,146 | 3.46 | 343,635 | 3.60 | 11.50 | 4.23 | ||||||||||||||||||||||||
| 9 | The Provident Bank (MA) | 3 | 365,579 | 3.30 | 310,774 | 3.26 | 17.64 | 12.73 | ||||||||||||||||||||||||
| 10 | Piscataqua Savings Bank (NH) | 1 | 284,651 | 2.57 | 258,318 | 2.71 | 10.19 | 6.95 | ||||||||||||||||||||||||
| 11 | Salem Co-operative Bank (NH) | 1 | 278,028 | 2.51 | 256,981 | 2.70 | 8.19 | 5.55 | ||||||||||||||||||||||||
| 12 | Pentucket Bank (MA) | 2 | 226,127 | 2.04 | 196,223 | 2.06 | 15.24 | 11.99 | ||||||||||||||||||||||||
| 13 | Kennebunk Savings Bank (ME) | 5 | 167,397 | 1.51 | 121,964 | 1.28 | 37.25 | 35.07 | ||||||||||||||||||||||||
| 14 | Newburyport Five Cts. Svgs. Bk. (MA) | 4 | 118,088 | 1.07 | 113,337 | 1.19 | 4.19 | 20.08 | ||||||||||||||||||||||||
| 15 | Eastern Bank (MA) | 2 | 82,485 | 0.74 | 85,627 | 0.90 | (3.67 | ) | 2.75 | |||||||||||||||||||||||
| 16 | Bangor Savings Bank (ME) | 2 | 62,203 | 0.56 | 50,291 | 0.53 | 23.69 | 7.02 | ||||||||||||||||||||||||
|
|
|
|
|
|
|
|
|
|
|
|
|
| |||||||||||||||||||
| 17 | First Seacoast Bank (NH) | 1 | 54,113 | 0.49 | 51,768 | 0.54 | 4.53 | 6.94 | ||||||||||||||||||||||||
|
|
|
|
|
|
|
|
|
|
|
|
|
| |||||||||||||||||||
| 18 | North Shore Bank, a Co-op Bank (MA) | 1 | 52,335 | 0.47 | 45,369 | 0.48 | 15.35 | 16.78 | ||||||||||||||||||||||||
| 19 | Partners Bank of New England (ME) | 3 | 44,853 | 0.40 | 28,902 | 0.30 | 55.19 | 29.75 | ||||||||||||||||||||||||
| 20 | Camden National Bank (ME) | 1 | 44,656 | 0.40 | 41,570 | 0.44 | 7.42 | — | ||||||||||||||||||||||||
| 21 | Primary Bank (NH) | 1 | 37,530 | 0.34 | 10,702 | 0.11 | 250.68 | — | ||||||||||||||||||||||||
| 22 | Haverhill Bank (MA) | 1 | 31,027 | 0.28 | 23,774 | 0.25 | 30.51 | 30.20 | ||||||||||||||||||||||||
| 23 | Meredith Village Savings Bank (NH) | 1 | 28,397 | 0.26 | 22,275 | �� | 0.23 | 27.48 | — | |||||||||||||||||||||||
| 24 | JP Morgan Chase Bank NA (NY) | 2 | 14,495 | 0.13 | — | — | — | — | ||||||||||||||||||||||||
| 25 | Northway Bank (NH) | 1 | 12,194 | 0.11 | 12,738 | 0.13 | (4.27 | ) | (3.19 | ) | ||||||||||||||||||||||
Market Total | 91 | 11,082,461 | 100.00 | 9,532,269 | 100.00 | 16.26 | 10.07 | |||||||||||||||||||||||||
Source: S&P Global Market Intelligence.
50
FELDMAN FINANCIAL ADVISORS, INC.
Tables 14 to 16 provide residential mortgage market share data for the top 20 lenders in Strafford County, Rockingham County, and York County (Maine) during 2020 and 2021, the most recent periods available for comparable data. Not all companies in the respective markets report the sourced data. The Bank ranked 22nd in Strafford County with 2021 residential mortgage originations of $22.0 million, 62nd in Rockingham County with residential mortgage originations of $25.9 million, and 57th in York County with residential mortgage originations of $14.9 million. The averages for residential mortgage loan funded by reporting lenders in Strafford, Rockingham, and York counties were approximately $266,500, $325,800, and $281,800, respectively, in 2021.
Competition for residential mortgage lending in these market areas is high. In addition to local and regional participants, many nationwide lenders are present in the Bank’s lending market. Out-of-state mortgage banking companies were prevalent among the top 10 residential lenders in Strafford and Rockingham counties, while local commercial banks and savings banks were positioned among the top residential lenders in York County. The most active nationwide lenders operating in these local markets included Rocket Mortgage, United Wholesale Mortgage, CMG Mortgage, Citizens Bank, Residential Mortgage Services, and loanDepot.com. CMG Mortgage and Rocket Mortgage ranked first and second, respectively in Strafford County for 2021, while Rocket Mortgage and United Wholesale Mortgage placed first and second, respectively, in Rockingham County for 2021. Rocket Mortgage and Camden National Bank ranked first and second in York County based on reported residential mortgage loan originations for 2021.
51
FELDMAN FINANCIAL ADVISORS, INC.
Table 14
Residential Mortgage Lending Market Share
Strafford County, New Hampshire
Data for 2020 and 2021
2021 | 2020 Rank | Company (State) | Type | 2021 Funded Loans ($000) | 2021 Market Share (%) | 2020 Funded Loans ($000) | 2020 Market Share (%) | |||||||||||||||||||
| 1 | 1 | CMG Mortgage Inc. (CA) | Mortgage Bank | 151,500 | 8.87 | 145,055 | 8.69 | |||||||||||||||||||
| 2 | 2 | Rocket Mortgage LLC (MI) | Mortgage Bank | 127,370 | 7.46 | 117,570 | 7.04 | |||||||||||||||||||
| 3 | 10 | United Wholesale Mortgage (MI) | Specialty Lender | 88,095 | 5.16 | 43,115 | 2.58 | |||||||||||||||||||
| 4 | 3 | Envoy Mortgage Ltd. (TX) | Mortgage Bank | 70,610 | 4.13 | 71,955 | 4.31 | |||||||||||||||||||
| 5 | 7 | Citizens Bank NA (RI) | Comm’l Bank | 57,740 | 3.38 | 45,800 | 2.74 | |||||||||||||||||||
| 6 | 9 | loanDepot.com LLC (CA) | Mortgage Bank | 55,150 | 3.23 | 45,215 | 2.71 | |||||||||||||||||||
| 7 | 5 | Northeast CU (NH) | Credit Union | 44,965 | 2.63 | 54,180 | 3.24 | |||||||||||||||||||
| 8 | 12 | LeaderOne Financial Corp. (KS) | Mortgage Bank | 42,040 | 2.46 | 36,215 | 2.17 | |||||||||||||||||||
| 9 | 11 | Freedom Mortgage Corp. (FL) | Mortgage Bank | 37,355 | 2.19 | 41,610 | 2.49 | |||||||||||||||||||
| 10 | 35 | Bangor SB (ME) | Savings Bank | 35,840 | 2.10 | 12,560 | 0.75 | |||||||||||||||||||
| 11 | 4 | Service Federal Credit Union (NH) | Credit Union | 35,770 | 2.09 | 67,760 | 4.06 | |||||||||||||||||||
| 12 | 25 | TD Bank NA (DE) | Comm’l Bank | 35,575 | 2.08 | 20,855 | 1.25 | |||||||||||||||||||
| 13 | 17 | NewRez LLC (PA) | Mortgage Bank | 34,860 | 2.04 | 27,955 | 1.67 | |||||||||||||||||||
| 14 | 30 | Kennebunk Savings Bank (ME) | Savings Bank | 34,105 | 2.00 | 16,180 | 0.97 | |||||||||||||||||||
| 15 | 6 | Residential Mortgage Svcs. Inc. (ME) | Mortgage Bank | 30,365 | 1.78 | 49,420 | 2.96 | |||||||||||||||||||
| 16 | 13 | HarborOne Mortgage LLC (NH) | Mortgage Bank | 30,325 | 1.78 | 35,310 | 2.11 | |||||||||||||||||||
| 17 | 19 | Nationstar Mortgage LLC (TX) | Mortgage Bank | 29,260 | 1.71 | 26,570 | 1.59 | |||||||||||||||||||
| 18 | — | Greystone Servicing Co. LLC (VA) | Specialty Lender | 27,450 | 1.61 | — | — | |||||||||||||||||||
| 19 | 33 | AmeriSave Mortgage Corp. (GA) | Mortgage Bank | 22,730 | 1.33 | 13,870 | 0.83 | |||||||||||||||||||
| 20 | 24 | Bank of New Hampshire (NH) | Comm’l Bank | 22,575 | 1.32 | 21,110 | 1.26 | |||||||||||||||||||
|
|
|
|
|
|
|
| |||||||||||||||||||
| 22 | 14 | First Seacoast Bank (NH) | Savings Bank | 22,010 | 1.29 | 33,345 | 2.00 | |||||||||||||||||||
|
|
|
|
|
|
|
| |||||||||||||||||||
Total for Lenders in Market | 1,707,865 | 1,670,115 | ||||||||||||||||||||||||
Source: S&P Global Market Intelligence.
52
FELDMAN FINANCIAL ADVISORS, INC.
Table 15
Residential Mortgage Lending Market Share
Rockingham County, New Hampshire
Data for 2020 and 2021
2021 | 2020 Rank | Company (State) | Type | 2021 Funded Loans ($000) | 2021 Market Share (%) | 2020 Funded Loans ($000) | 2020 Market Share (%) | |||||||||||||||||||
| 1 | 1 | Rocket Mortgage LLC (MI) | Mortgage Bank | 486,770 | 7.11 | 493,430 | 7.32 | |||||||||||||||||||
| 2 | 4 | United Wholesale Mortgage (MI) | Specialty Lender | 468,950 | 6.85 | 292,895 | 4.34 | |||||||||||||||||||
| 3 | 5 | Citizens Bank NA (RI) | Comm’l Bank | 301,955 | 4.41 | 254,175 | 3.77 | |||||||||||||||||||
| 4 | 2 | CMG Mortgage Inc. (CA) | Mortgage Bank | 275,960 | 4.03 | 356,065 | 5.28 | |||||||||||||||||||
| 5 | 6 | loanDepot.com LLC (CA) | Mortgage Bank | 249,500 | 3.65 | 220,395 | 3.27 | |||||||||||||||||||
| 6 | 3 | Residential Mortgage Svcs. Inc. (ME) | Mortgage Bank | 203,450 | 2.97 | 295,300 | 4.38 | |||||||||||||||||||
| 7 | 9 | Guaranteed Rate Inc. (IL) | Mortgage Bank | 173,310 | 2.53 | 152,415 | 2.26 | |||||||||||||||||||
| 8 | 8 | CrossCountry Mortgage LLC (OH) | Mortgage Bank | 164,420 | 2.40 | 172,165 | 2.55 | |||||||||||||||||||
| 9 | 7 | HarborOne Mortgage LLC (NH) | Mortgage Bank | 148,565 | 2.17 | 190,955 | 2.83 | |||||||||||||||||||
| 10 | 13 | NewRez LLC (PA) | Mortgage Bank | 146,350 | 2.14 | 116,325 | 1.72 | |||||||||||||||||||
| 11 | 22 | AmeriSave Mortgage Corp. (GA) | Mortgage Bank | 121,755 | 1.78 | 73,670 | 1.09 | |||||||||||||||||||
| 12 | 15 | Fairway Independent Mortgage (WI) | Mortgage Bank | 118,250 | 1.73 | 112,185 | 1.66 | |||||||||||||||||||
| 13 | 12 | Freedom Mortgage Corp. (FL) | Mortgage Bank | 117,405 | 1.72 | 120,310 | 1.78 | |||||||||||||||||||
| 14 | 17 | St. Mary’s Bank CU (NH) | Credit Union | 113,580 | 1.66 | 98,960 | 1.47 | |||||||||||||||||||
| 15 | 11 | Mortgage Network Inc. (MA) | Mortgage Bank | 111,720 | 1.63 | 126,280 | 1.87 | |||||||||||||||||||
| 16 | 19 | Nationstar Mortgage LLC (TX) | Mortgage Bank | 107,205 | 1.57 | 89,415 | 1.33 | |||||||||||||||||||
| 17 | 27 | Wells Fargo Bank NA (SD) | Comm’l Bank | 99,865 | 1.46 | 64,505 | 0.96 | |||||||||||||||||||
| 18 | 33 | PennyMac Loan Services LLC (CA) | Mortgage Bank | 95,645 | 1.40 | 51,055 | 0.76 | |||||||||||||||||||
| 19 | 16 | Bank of America NA (NC) | Comm’l Bank | 94,205 | 1.38 | 99,235 | 1.47 | |||||||||||||||||||
| 20 | 18 | TD Bank NA (DE) | Comm’l Bank | 92,890 | 1.36 | 98,680 | 1.46 | |||||||||||||||||||
|
|
|
|
|
|
|
| |||||||||||||||||||
| 62 | 59 | First Seacoast Bank (NH) | Savings Bank | 25,890 | 0.38 | 26,375 | 0.39 | |||||||||||||||||||
|
|
|
|
|
|
|
| |||||||||||||||||||
Total for Lenders in Market | 6,842,235 | 6,744,405 | ||||||||||||||||||||||||
Source: S&P Global Market Intelligence.
53
FELDMAN FINANCIAL ADVISORS, INC.
Table 16
Residential Mortgage Lending Market Share
York County, Maine
Data for 2020 and 2021
2021 | 2020 Rank | Company (State) | Type | 2021 Funded Loans ($000) | 2021 Market Share (%) | 2020 Funded Loans ($000) | 2020 Market Share (%) | |||||||||||||||||||
| 1 | 1 | Rocket Mortgage LLC (MI) | Mortgage Bank | 219,280 | 5.74 | 210,970 | 5.88 | |||||||||||||||||||
| 2 | 3 | Camden National Bank (ME) | Comm’l Bank | 216,670 | 5.67 | 187,600 | 5.23 | |||||||||||||||||||
| 3 | 6 | United Wholesale Mortgage (MI) | Specialty Lender | 206,570 | 5.41 | 135,135 | 3.77 | |||||||||||||||||||
| 4 | 2 | CMG Mortgage Inc. (CA) | Mortgage Bank | 202,430 | 5.30 | 205,615 | 5.73 | |||||||||||||||||||
| 5 | 5 | Bangor SB (ME) | Savings Bank | 146,630 | 3.84 | 157,965 | 4.40 | |||||||||||||||||||
| 6 | 8 | Kennebunk Savings Bank (ME) | Savings Bank | 134,610 | 3.52 | 96,615 | 2.69 | |||||||||||||||||||
| 7 | 4 | Residential Mortgage Svcs. Inc. (ME) | Mortgage Bank | 127,760 | 3.34 | 163,870 | 4.57 | |||||||||||||||||||
| 8 | 11 | loanDepot.com LLC (CA) | Mortgage Bank | 107,820 | 2.82 | 73,120 | 2.04 | |||||||||||||||||||
| 9 | 9 | Atlantic Regional FCU (ME) | Credit Union | 81,165 | 2.12 | 82,065 | 2.29 | |||||||||||||||||||
| 10 | 16 | Citizens Bank NA (RI) | Comm’l Bank | 76,980 | 2.01 | 59,650 | 1.66 | |||||||||||||||||||
| 11 | 7 | Norwich Commercial Group Inc. (CT) | Mortgage Bank | 70,450 | 1.84 | 101,810 | 2.84 | |||||||||||||||||||
| 12 | 10 | Saco & Biddeford Savings Inst. (ME) | Savings Bank | 69,290 | 1.81 | 73,630 | 2.05 | |||||||||||||||||||
| 13 | 12 | Freedom Mortgage Corp. (FL) | Mortgage Bank | 69,170 | 1.81 | 69,345 | 1.93 | |||||||||||||||||||
| 14 | 15 | Partners Bank of New England (ME) | Savings Bank | 65,765 | 1.72 | 60,075 | 1.67 | |||||||||||||||||||
| 15 | 13 | Mortgage Network Inc. (MA) | Mortgage Bank | 61,900 | 1.62 | 65,705 | 1.83 | |||||||||||||||||||
| 16 | 20 | KeyBank NA (OH) | Comm’l Bank | 57,865 | 1.51 | 49,805 | 1.39 | |||||||||||||||||||
| 17 | 18 | TD Bank NA (DE) | Comm’l Bank | 55,715 | 1.46 | 54,005 | 1.51 | |||||||||||||||||||
| 18 | 14 | Maine Community Bank (ME) | Savings Bank | 53,235 | 1.39 | 63,785 | 1.78 | |||||||||||||||||||
| 19 | 19 | HarborOne Mortgage LLC (NH) | Mortgage Bank | 52,620 | 1.38 | 50,595 | 1.41 | |||||||||||||||||||
| 20 | 17 | Northeast CU (NH) | Credit Union | 51,355 | 1.34 | 56,370 | 1.57 | |||||||||||||||||||
|
|
|
|
|
|
|
| |||||||||||||||||||
| 57 | 65 | First Seacoast Bank (NH) | Savings Bank | 14,920 | 0.39 | 11,655 | 0.32 | |||||||||||||||||||
|
|
|
|
|
|
|
| |||||||||||||||||||
Total for Lenders in Market | 3,821,465 | 3,587,470 | ||||||||||||||||||||||||
Source: S&P Global Market Intelligence.
54
FELDMAN FINANCIAL ADVISORS, INC.
Summary Outlook
The Company has reported low to moderate levels of profitability over the past five years with an average core ROA of approximately 0.27% from 2017 to 2021. For the six months ended June 30, 2022, the Company’s annualized core ROA was 0.21%. Since the initial offering in 2019, the Company has progressed steadily in growing its balance sheet and maintaining sound asset quality. However, its net interest margin has remained under pressure, especially as borrowings have increased to partially support the asset expansion. The relatively flat interest rate environment proved challenging for most financial institutions during this period, but especially for a predominantly fixed-rate residential loan, portfolio lender such as FSB. In addition, the Company’s profitability has been tasked with absorbing the infrastructure, systems, and staffing investments while FSB positions itself to take advantage of future growth opportunities in a market that exhibits favorable demographics.
The Company’s current business strategy places emphasis on improving the net interest margin through a combination of managing funding costs and increasing asset yields via increased diversification into higher-yielding types of loans and emphasizing growth of lower costing core deposits. The Company believes that it can successfully leverage its operating expense base to generate increased levels of net interest and non-interest income by increasing its product and service penetration with existing customers and enhancing its market perception as a viable banking organization capable of serving the retail and commercial banking needs of new customers.
55
FELDMAN FINANCIAL ADVISORS, INC.
FSB plans to continue its emphasis on residential and commercial real estate lending. The residential lending operations will continue to sell a portion of fixed-rate residential mortgage loan originations, providing the Company with recurring sources of revenue from loan servicing income and gains on the sale of such loans. The commercial real estate lending operations provide the Company with sources of higher-yielding loans and banking relationships that also generate low-cost deposit balances and ancillary non-interest income.
A key element of the Company’s operating strategy is to continue to aggressively manage credit risk, so as to continue to maintain the Company’s favorable measures for credit quality. The Company estimates that it can achieve higher profitability over future years in part through added efficiencies gained through growth in the earning asset base without adding additional infrastructure, which has already been put in place to facilitate and manage such growth. However, as noted earlier, the Company will face intensified competition as the attractive demographics in the Company’s market area are also precipitating ramped-up expansion goals by existing competitors as well as new entrants.
56
FELDMAN FINANCIAL ADVISORS, INC.
II. COMPARISONS WITH PUBLICLY TRADED THRIFTS
General Overview
The comparative market approach provides a sound basis for determining estimates of going-concern valuations where a regular and active market exists for the stocks of peer institutions. The comparative market approach was utilized in determining the estimated pro forma market value of the Company because: (1) reliable market and financial data are readily available for comparable institutions; (2) the comparative market method is required by the applicable regulatory guidelines; and (3) other alternative valuation methods (such as income capitalization, liquidation analysis, or discounted cash flow) are unlikely to produce a valuation relevant to the future trading patterns of the related equity interest. The generally employed valuation method in initial public offerings, where possible, is the comparative market approach, which also can be relied upon to determine pro forma market value in a thrift stock conversion.
The comparative market approach derives valuation benchmarks from the trading patterns of selected peer institutions which, due to certain factors such as financial performance and operating strategies, enable the appraiser to estimate the potential value of the subject institution in a stock conversion offering. The pricing and trading history of recent initial public offerings of thrifts are also examined to provide evidence of the “new issue discount” that must be considered. In Chapter II, our valuation analysis focuses on the selection and comparison of the Company with a comparable group of publicly traded thrift institutions (the “Comparative Group”). Chapter III will detail any additional discounts or premiums that we believe are appropriate to the Company’s pro forma market value.
57
FELDMAN FINANCIAL ADVISORS, INC.
Selection Criteria
Selected market price and financial performance data for all public thrifts listed on major stock exchanges are shown in Exhibit III. The list excludes companies that are subject to being acquired under a pending transaction and companies that have a majority ownership interest controlled by a mutual holding company. Several criteria, which are discussed below, were used to select the individual members of the Comparative Group from the overall universe of publicly traded thrifts.
| • | Operating characteristics – An institution’s operating characteristics are the most important factors because they affect investors’ expected rates of return on a company’s stock under various business/economic scenarios, and they influence the market’s general perception of the quality and attractiveness of a given company. Operating characteristics, which may vary in importance during the business cycle, include financial variables such as profitability, balance sheet growth, capitalization, asset quality, and other factors such as lines of business and management strategies. |
| • | Degree of marketability and liquidity – Marketability of a stock reflects the relative ease and promptness with which a security may be sold when desired, at a representative current price, without material concession in price merely because of the necessity of sale. Marketability also connotes the existence of buying interest as well as selling interest and is usually indicated by trading volumes and the spread between the bid and asked price for a security. Liquidity of the stock issue refers to the organized market exchange process whereby the security can be converted into cash. We attempted to limit our selection to companies that have access to a regular trading market or price quotations and, therefore, only considered companies listed on major stock exchanges. We eliminated from the Comparative Group companies with market prices that were materially influenced by announced acquisitions or other unusual circumstances. However, the expectation of continued industry consolidation is currently embedded in thrift equity valuations. |
| • | Geographic Location – The region of the country where a company operates is also of importance in selecting the comparative group. The operating environment for thrift institutions varies from region to region with respect to business and economic environments, real estate market conditions, speculative takeover activity, and investment climates. Economic and investor climates can also vary greatly within a region, particularly due to takeover activity. |
58
FELDMAN FINANCIAL ADVISORS, INC.
The operations of the Company fit the general profile of a small-to-medium sized thrift institution, concentrating primarily on real estate lending in its local market and relying on retail deposits as a funding source. Residential mortgage loans remain the core product in the Company loan portfolio, drawing upon its roots as a traditional home lender. However, the Company has diversified its loan mix through the steady origination of commercial real estate, commercial business, and construction and development loans.
In determining the Comparative Group composition, we focused on the Company’s asset size, capitalization, geographic location, asset quality, and earnings fundamentals. Attempting to concentrate on the Company’s performance characteristics and to develop a meaningful number of comparables for valuation purposes, we expanded the criteria to include a statistically significant number of companies. In addition, because of the scarcity of candidates meeting the criteria precisely, we increased the asset size constraint to generate a meaningful number of comparables while maintaining non-size related characteristics. As with any composition of a group of comparable companies, the selection criteria were broadened sufficiently to assemble a meaningful number of members. We performed an initial screening of publicly traded thrifts headquartered in the Northeast and Mid-Atlantic regions of the United States with total assets less than $1 billion. We then expanded the selection criteria to other adjacent geographic regions and applied the following overall selection criteria:
| • | Publicly traded thrift – stock-form thrift whose shares are traded on the New York, NYSE American, or NASDAQ stock exchanges. |
| • | Excludes mutual holding companies – company’s corporate structure is organized in fully converted stock form and excludes companies whose majority ownership interest is held by a mutual holding company. |
| • | Seasoned trading issue – company has been publicly traded for at least one year. |
| • | Geographic location – based in the Northeast, Mid-Atlantic, Southeast, or Midwest region of the country. |
59
FELDMAN FINANCIAL ADVISORS, INC.
| • | Non-acquisition target – company is not subject to a pending acquisition. |
| • | Asset size – total assets greater than $200 million and less than $1 billion. |
| • | Capital level – ratio of tangible common equity to tangible assets greater than 7.00%. |
| • | Profitability – ROA greater than 0.00% and less than 1.00%. |
| • | Credit quality – non-performing assets to total assets ratio less than 2.50%. |
As a result of applying the stated criteria, the screening process produced a reliable representation of public thrifts. A general operating summary of the 10 companies included in the Comparative Group is presented in Table 17. All of the selected companies are traded on the NASDAQ market. The Comparative Group ranged in asset size from $266.5 million at Mid-Southern Bancorp to $880.0 million at William Penn Bancorporation. The median and average asset sizes of the Comparative Group were $477.3 million and $542.7 million, respectively, reasonably comparable to the Company’s total assets of $510.2 million as of June 30, 2022.
Besides FSB, there are seven other public thrifts located in the Northeast region of the United States. However, they were all excluded from the Comparative Group due to not meeting the selection criteria for asset size, non-mutual holding company, and non-acquisition target. Four of the Comparative Group members are located in the Mid-Atlantic states of New York (Generations Bancorp), New Jersey (Magyar Bancorp), and Pennsylvania (HV Bancorp and William Penn Bancorporation). Four of the Comparative Group members are based in the Midwest states of Illinois (IF Bancorp), Indiana (Mid-Southern Bancorp), Ohio (Cincinnati Bancorp), and Wisconsin (FFBW). Two of the Comparative Group members are located in the Southeast states of Georgia (Affinity Bancshares) and Alabama (Cullman Bancorp).
Five members of the Comparative Group (Affinity Bancshares, Cullman Bancorp, Generations Bancorp, Magyar Bancorp, and William Penn Bancorporation) completed second-step conversions in 2021. FFBW completed a second-step conversion in 2020. While some differences inevitably may exist between the Company and the individual Comparative Group members, we believe that the chosen Comparative Group on the whole provides a meaningful basis of financial comparison for valuation purposes.
60
FELDMAN FINANCIAL ADVISORS, INC.
Table 17
Comparative Group Operating Summary
As of June 30, 2022
Company | City | St. | No. of Offices | Initial Public Offering Date | Total Assets ($Mil.) | Tang. Equity/ Assets (%) | ||||||||||||||
First Seacoast Bancorp | Dover | NH | 5 | 07/16/19 | $ | 510.2 | 10.11 | |||||||||||||
Comparative Group | ||||||||||||||||||||
Affinity Bancshares, Inc. | Covington | GA | 3 | 04/27/17 | 766.7 | 12.93 | ||||||||||||||
Cincinnati Bancorp, Inc. | Cincinnati | OH | 6 | 10/14/15 | 282.1 | 14.10 | ||||||||||||||
Cullman Bancorp, Inc. | Cullman | AL | 4 | 10/08/09 | 384.0 | 25.70 | ||||||||||||||
FFBW, Inc. | Brookfield | WI | 7 | 10/10/17 | 330.4 | 25.32 | ||||||||||||||
Generations Bancorp NY, Inc. | Seneca Falls | NY | 10 | 07/10/06 | 369.7 | 10.18 | ||||||||||||||
HV Bancorp, Inc. | Doylestown | PA | 7 | 01/11/17 | 570.6 | 7.22 | ||||||||||||||
IF Bancorp, Inc. | Watseka | IL | 8 | 07/07/11 | 857.6 | 8.36 | ||||||||||||||
Magyar Bancorp, Inc. | New Brunswick | NJ | 7 | 01/23/06 | 790.7 | 12.77 | ||||||||||||||
Mid-Southern Bancorp, Inc. | Salem | IN | 3 | 04/08/98 | 266.5 | 12.90 | ||||||||||||||
William Penn Bancorporation | Bristol | PA | 14 | 04/15/08 | 880.0 | 21.36 | ||||||||||||||
Source: First Seacoast Bancorp; S&P Global Market Intelligence.
61
FELDMAN FINANCIAL ADVISORS, INC.
Recent Financial Comparisons
Table 18 summarizes certain key financial comparisons between the Company and the Comparative Group. Tables 19 through 23 contain the detailed financial comparisons of the Company with the individual Comparative Group companies based on measures of profitability, income and expense components, capital levels, balance sheet composition, asset quality, and growth rates. Financial data for the Company, the Comparative Group, and All Public Thrift aggregate were utilized for the latest available period as of or for the last twelve months (“LTM”) ended June 30, 2022.
The Company’s LTM ROA was 0.29%, reflecting profitability below the Comparative Group median of 0.63% and the All Public Thrift median of 0.86%. The Company’s lower ROA was attributable mainly to a lower level of non-interest income and a higher level of non-interest expense. The Company’s LTM ROE was 2.48% and lagged the Comparative Group median of 3.77%. Among the Comparative Group companies, only one member reported ROA results below that of the Company. Cincinnati Bancorp generated an LTM ROA ratio of 0.26%, while the remaining Comparative Group companies exhibited LTM ROA ratios between 0.38% and 0.89%.
Based on pre-tax core earnings as adjusted to exclude income taxes, intangibles amortization expense, securities gains, and other non-recurring items, the Company’s core profitability was also lower than the Comparative Group’s levels. The Company’s LTM pre-tax core earnings ratio was 0.34% of average assets and positioned below the corresponding Comparative Group median of 0.80% and the All Public Thrift median of 1.23%. The Company’s core profitability performance was disadvantaged by comparatively lower levels of net interest income and non-interest income and a higher level of non-interest expense.
62
FELDMAN FINANCIAL ADVISORS, INC.
Table 18
Key Financial Comparisons
First Seacoast Bancorp and the Comparative Group
As of or For the Last Twelve Months Ended June 30, 2022
| First Seacoast Bancorp | Comp. Group Median | All Public Thrift Median | ||||||||||
Profitability Ratios | ||||||||||||
LTM Return on Average Assets (ROA) | 0.29 | % | 0.63 | % | 0.86 | % | ||||||
LTM Return on Average Equity (ROE) | 2.48 | 3.77 | 7.03 | |||||||||
Core Return on Avg. Assets (Core ROA) | 0.29 | 0.66 | 0.91 | |||||||||
Core Return on Avg. Equity (Core ROE) | 2.41 | 4.12 | 7.30 | |||||||||
Net Interest Margin | 3.01 | 3.18 | 3.09 | |||||||||
Efficiency Ratio | 88.38 | 76.76 | 68.00 | |||||||||
Income and Expense (% of avg. assets) | ||||||||||||
Total Interest Income | 3.15 | 3.32 | 3.20 | |||||||||
Total Interest Expense | 0.22 | 0.32 | 0.29 | |||||||||
Net Interest Income | 2.93 | 2.97 | 2.91 | |||||||||
Provision for Loan Losses | 0.04 | 0.06 | 0.01 | |||||||||
Other Operating Income | 0.33 | 0.45 | 0.47 | |||||||||
Net Secs. Gains and Non-rec. Income | 0.01 | 0.00 | 0.00 | |||||||||
General and Administrative Expense | 2.88 | 2.63 | 2.48 | |||||||||
Intangibles Amortization Expense | 0.00 | 0.00 | 0.00 | |||||||||
Non-recurring Expense | 0.00 | 0.00 | 0.00 | |||||||||
Pre-tax Core Earnings | 0.34 | 0.80 | 1.23 | |||||||||
Equity Capital Ratios | ||||||||||||
Total Equity / Total Assets | 10.17 | 13.52 | 11.66 | |||||||||
Tangible Equity / Tangible Assets | 10.11 | 12.92 | 10.85 | |||||||||
Growth Rates | ||||||||||||
Total Assets | 6.69 | 3.05 | 4.22 | |||||||||
Net Total Loans | 2.40 | 4.28 | 8.10 | |||||||||
Total Deposits | 4.72 | 5.39 | 5.15 | |||||||||
63
FELDMAN FINANCIAL ADVISORS, INC.
Table 18 (continued)
Key Financial Comparisons
First Seacoast Bancorp and the Comparative Group
As of or For the Last Twelve Months Ended June 30, 2022
| First Seacoast Bancorp | Comp. Group Median | All Public Thrift Median | ||||||||||
Balance Sheet Composition (% of total assets) |
| |||||||||||
Cash and Securities | 21.78 | % | 20.02 | % | 19.62 | % | ||||||
Loans Receivable, net | 74.86 | 73.68 | 72.28 | |||||||||
Real Estate Owned | 0.00 | 0.01 | 0.00 | |||||||||
Intangible Assets | 0.06 | 0.02 | 0.06 | |||||||||
Other Assets | 3.30 | 5.31 | 4.76 | |||||||||
Total Deposits | 76.02 | 80.36 | 79.62 | |||||||||
Borrowed Funds | 12.64 | 3.84 | 5.44 | |||||||||
Other Liabilities | 1.18 | 1.14 | 3.28 | |||||||||
Total Liabilities | 89.83 | 86.48 | 88.34 | |||||||||
Total Equity | 10.17 | 13.52 | 11.66 | |||||||||
Loan Portfolio Composition (% of total loans) |
| |||||||||||
Residential Real Estate Loans (1) | 65.05 | 38.07 | 25.26 | |||||||||
Other Real Estate Loans | 26.89 | 45.90 | 57.13 | |||||||||
Non-Real Estate Loans | 8.06 | 16.67 | 17.61 | |||||||||
Credit Risk Ratios | ||||||||||||
Non-performing Loans / Total Loans | 0.16 | 1.03 | 0.39 | |||||||||
Non-performing Assets / Total Assets | 0.12 | 0.68 | 0.29 | |||||||||
Reserves / Non-performing Loans | 605.32 | 108.48 | 215.07 | |||||||||
Reserves / Total Loans | 0.95 | 0.97 | 0.99 | |||||||||
| (1) | Includes home equity loans and lines of credit. |
Source: First Seacoast Bancorp; S&P Global Market Intelligence; Feldman Financial.
64
FELDMAN FINANCIAL ADVISORS, INC.
As shown in Table 21, the Company’s level of net interest income at 2.93% of average assets trailed the Comparative Group median of 2.97%, owing to the Company’s relatively restrained yields on the predominantly residential concentration of its loan portfolio versus the broader loan portfolio diversifications exhibited by the Comparative Group overall. The Company’s total interest income measured 3.15% of average assets for the LTM period, lagging the Comparative Group median of 3.32%. The Company’s interest expense amounted to 0.22% of average assets and was lower than the corresponding Comparative Group median of 0.31%. The Company’s weighted average yield for the loan portfolio decreased by 15 basis points from 3.79% for the year ended December 31, 2021 to 3.64% for the six months ended June 30, 2022. The Company’s weighted average yield for the investment securities portfolio increased from 1.86% for the year ended December 31, 2021 to 2.02% for the six months ended June 30, 2022.
The Company’s non-interest operating income totaled 0.33% of average assets, measuring below the Comparative Group median of 0.45%. The Company’s primary sources of non-interest income include service charges on deposit accounts, wealth management revenue, loan servicing fees, and debit card and credit card interchange fees. Most of the Comparative Group companies reported higher levels of non-interest income, particularly generating additional revenue from gains on sale of loans. For example, Cincinnati Bancorp and HV Bancorp reported non-interest income levels measuring 2.64% and 1.89% of average assets, respectively, reflecting significant income contributions from mortgage banking activities.
65
FELDMAN FINANCIAL ADVISORS, INC.
The Company’s loan loss provision amounted to 0.04% of average assets for the recent LTM period and was slightly less than the Comparative Group median of 0.06%. As noted previously, based on management’s analysis of the allowance for loan losses, the Company recorded a provision for loan losses of $480,000 for the year ended December 31, 2020, $205,000 for the year ended December 31, 2021 and $60,000 for the six months ended June 30, 2022. The decrease in the loan loss provision for 2021 and the first half of 2022 was primarily due to the decrease in non-accrual loans from $1.1 million at December 31, 2019 to $602,000 at June 30, 2022. The Company’s total non-performing assets measured 0.12% at June 30, 2022, comparing favorably to the Comparative Group median of 0.68% and reflecting a level below the non-performing asset ratios for each of the Comparative Group companies except for FFBW at 0.09% and IF Bancorp at 0.15%. The Company’s ratio of non-performing assets to total assets has improved from 0.26%, 0.20%, and 0.17% at December 31, 2019, 2020, and 2021, respectively. The Company’s 0.95% ratio of reserves to total loans closely approximated the Comparative Group median of 0.97%.
The Company’ operating expense ratio at 2.88% of average assets for the LTM period was higher than the Comparative Group median of 2.63%. The members of the Comparative Group reporting above-average ratios of operating expense also exhibited above-average levels of non-interest income as the added expense infrastructure partially supports the non-interest income production. However, the Company’s higher operating expense ratio is not accompanied by comparably high levels of operating revenue. The Company’s LTM efficiency ratio (non-interest expense less intangibles amortization expense as a percent of net interest income before provision plus non-interest operating income) was relatively high at 88.4% and surpassed the Comparative Group median of 76.8%. None of the members of the Comparative Group exhibited efficiency ratios as high as the Company’s level. Three of the Comparative Group companies exhibited efficiency ratios above 80% with Generation Bancorp at 81.7%, HV Bancorp at 84.6%, and Cincinnati Bancorp at 86.7%. All three of these companies also reported subpar earnings levels that measured the lowest among the Comparative Group with Generations Bancorp reporting an LTM ROA of 0.38%, HV Bancorp at 0.49%, and Cincinnati Bancorp at 0.26%
66
FELDMAN FINANCIAL ADVISORS, INC.
As reflected in Table 22, the overall balance sheet composition of the Company reflected a slightly higher concentration of loans to assets versus that of the overall Comparative Group. The Company’s net total loans amounted to 74.86% of total assets as of June 30, 2022, eclipsing the median of 73.68% for the Comparative Group. The Company’s ratio of cash and securities to total assets was 21.78% and slightly higher than the median of 20.02% of the Comparative Group. The Company had intangible assets on its balance sheet as of June 30, 2022 in the form of customer list intangible assets, which measured 0.06% of total assets. The Company had no real estate owned at such date. The Company’s ratio of other assets measured 3.36% and was lower than the Comparative Group median of 5.31%.
The Company has actively utilized borrowings as a supplemental source of funds to support its loan origination activity. The Company’s ratio of borrowed funds to total assets amounted to 12.64% at June 30, 2022 and surpassed the Comparative Group median of 3.34%. The Company’s borrowings comprised $64.3 million of FHLB advances as of June 30, 2022. The Company’s deposit level at 76.01% of total assets was below the Comparative Group median of 80.36% of total assets. The Company’s equity level of 10.17% relative to total assets was below the Comparative Group median of 13.52%, which reflected the equity structure of fully converted companies.
The Company’s level of residential real estate loans (including home equity and second mortgage loans) measured 65.05% of total loans based on regulatory financial data as of June 30, 2022, above the Comparative Group median of 38.07%. The Comparative Group includes a number of companies that have diversified their lending platforms to include significant concentrations of commercial real estate, commercial business, and consumer loans in their respective loan portfolios.
67
FELDMAN FINANCIAL ADVISORS, INC.
The Company’s concentration of non-residential real estate loans (commercial real estate, multi-family real estate, and construction and land development loans) represented 26.89% of total loans and was below the Comparative Group median of 45.90% of total loans. The Company exhibited a lower level of non-real estate loans, which accounted for only 8.06% of total loans versus the Comparative Group median of 16.67% of total loans. The Company has a limited amount of consumer loans, while its commercial business loan portfolio has begun to gain growth momentum in recent years. The Company’s commercial business loan portfolio increased from $24.7 million at December 31, 2019 to $54.7 million at September 30, 2020, driven by the originations of PPP loans. More recently, the Company’s commercial business loan portfolio amounted to $24.6 million at June 30, 2022 with the decline primarily related to the forgiveness of PPP loans and several payoffs of large loans by certain corporate borrowers.
The Company’s recent emphasis on balance sheet growth is reflected in the comparative growth rates. The Company’s asset growth rate measured 6.69% over the recent LTM period versus the Comparative Group median asset growth rate of 3.05%. The Company exhibited a deposit growth rate of 4.72% versus the Comparative Group median of 5.20%. The Company’s loan growth rate of 2.40% lagged the Comparative Group median loan growth rate of 4.28%. The Company registered solid growth in its residential mortgage loan and commercial real estate loan portfolios over the recent LTM period, but experienced declines in its outstanding balances of commercial business loans and construction and development loans.
68
FELDMAN FINANCIAL ADVISORS, INC.
In summary, the Company’s recent earnings performance was below the results exhibited by the Comparative Group, while its asset quality was superior and its capital position as a majority-held mutual holding company institution was below the overall equity levels displayed by the fully stock-form companies within the Comparative Group. The Company’s profitability continues to be characterized by below-average levels of net interest income and non-interest income while experiencing above-average levels of non-interest expense. Similar to most financial institutions its size, the Company is faced with the ongoing challenge of improving its efficiency ratio either through bolstering its net interest margin, enhancing non-interest income generation, or improving the efficiency and productivity of its operating infrastructure. The Company’s earnings growth outlook will depend largely on its ability to maintain satisfactory loan quality as its grows the portfolio, to improve the net interest margin across movements in the interest rate environment, and to control non-interest expense as it seeks to expand its operations.
69
FELDMAN FINANCIAL ADVISORS, INC.
Table 19
General Operating Characteristics
As of June 30, 2022
City/State | Ticker | Exchange | No. of Offices | IPO Date | Total Assets ($000s) | Total Deposits ($000s) | Total Equity ($000s) | Tang. Common Equity ($000s) | ||||||||||||||||||||||
First Seacoast Bancorp | Dover, NH | FSEA | NASDAQ | 5 | 07/16/19 | 510,246 | 387,868 | 51,872 | 51,556 | |||||||||||||||||||||
Comparative Group Average | 549,809 | 438,906 | 81,740 | 79,123 | ||||||||||||||||||||||||||
Comparative Group Median | 477,324 | 396,532 | 77,757 | 77,623 | ||||||||||||||||||||||||||
Comparative Group | ||||||||||||||||||||||||||||||
Affinity Bancshares, Inc. | Covington, GA | AFBI | NASDAQ | 3 | 04/27/17 | 766,679 | 626,175 | 115,371 | 96,718 | |||||||||||||||||||||
Cincinnati Bancorp, Inc. | Cincinnati, OH | CNNB | NASDAQ | 5 | 10/14/15 | 282,050 | 222,929 | 39,885 | 39,748 | |||||||||||||||||||||
Cullman Bancorp, Inc. | Cullman, AL | CULL | NASDAQ | 4 | 10/08/09 | 384,000 | 280,229 | 98,696 | 98,696 | |||||||||||||||||||||
FFBW, Inc. | Brookfield, WI | FFBW | NASDAQ | 7 | 10/10/17 | 330,426 | 243,159 | 83,856 | 83,588 | |||||||||||||||||||||
Generations Bancorp NY, Inc. | Seneca Falls, NY | GBNY | NASDAQ | 10 | 07/10/06 | 369,672 | 311,554 | 39,028 | 37,485 | |||||||||||||||||||||
HV Bancorp, Inc. | Doylestown, PA | HVBC | NASDAQ | 8 | 01/11/17 | 570,647 | 481,510 | 41,218 | 41,218 | |||||||||||||||||||||
IF Bancorp, Inc. | Watseka, IL | IROQ | NASDAQ | 8 | 07/07/11 | 857,558 | 752,020 | 71,658 | 71,658 | |||||||||||||||||||||
Magyar Bancorp, Inc. | New Brunswick, NJ | MGYR | NASDAQ | 7 | 01/23/06 | 790,652 | 659,821 | 100,980 | 100,980 | |||||||||||||||||||||
Mid-Southern Bancorp, Inc. | Salem, IN | MSVB | NASDAQ | 3 | 04/08/98 | 266,454 | 205,047 | 34,382 | 34,382 | |||||||||||||||||||||
William Penn Bancorporation | Bristol, PA | WMPN | NASDAQ | 14 | 04/15/08 | 879,952 | 606,617 | 192,326 | 186,756 | |||||||||||||||||||||
Source: First Seacoast Bancorp; S&P Global Market Intelligence; Feldman Financial.
70
FELDMAN FINANCIAL ADVISORS, INC.
Table 20
General Financial Performance Ratios
As of or For the Last Twelve Months Ended June 30, 2022
| Total Assets ($000s) | Total Deposits ($000s) | Total Equity/ Assets (%) | Tang. Equity/ Assets (%) | Net Interest Margin (%) | Effcy. Ratio (%) | LTM ROA (%) | LTM ROE (%) | Core ROA (%) | Core ROE (%) | |||||||||||||||||||||||||||||||
First Seacoast Bancorp | 510,246 | 387,868 | 10.17 | 10.11 | 3.01 | 88.38 | 0.29 | 2.48 | 0.29 | 2.41 | ||||||||||||||||||||||||||||||
Comparative Group Average | 549,809 | 438,906 | 15.39 | 15.08 | 3.30 | 75.15 | 0.61 | 4.29 | 0.69 | 4.70 | ||||||||||||||||||||||||||||||
Comparative Group Median | 477,324 | 396,532 | 13.52 | 12.92 | 3.18 | 76.76 | 0.63 | 3.77 | 0.66 | 4.12 | ||||||||||||||||||||||||||||||
All Public Thrift Average | 4,739,559 | 3,532,294 | 13.74 | 12.82 | 3.27 | 69.34 | 0.80 | 6.62 | 0.87 | 7.15 | ||||||||||||||||||||||||||||||
All Public Thrift Median | 1,867,092 | 1,334,000 | 11.66 | 10.85 | 3.09 | 68.00 | 0.86 | 7.03 | 0.91 | 7.30 | ||||||||||||||||||||||||||||||
Comparative Group | ||||||||||||||||||||||||||||||||||||||||
Affinity Bancshares, Inc. | 766,679 | 626,175 | 15.05 | 12.93 | 3.99 | 66.32 | 0.87 | 5.60 | 0.96 | 6.16 | ||||||||||||||||||||||||||||||
Cincinnati Bancorp, Inc. | 282,050 | 222,929 | 14.14 | 14.10 | 3.13 | 86.73 | 0.26 | 1.74 | 0.50 | 3.38 | ||||||||||||||||||||||||||||||
Cullman Bancorp, Inc. | 384,000 | 280,229 | 25.70 | 25.70 | 3.76 | 67.82 | 0.67 | 2.47 | 1.01 | 3.73 | ||||||||||||||||||||||||||||||
FFBW, Inc. | 330,426 | 243,159 | 25.38 | 25.32 | 3.22 | 75.35 | 0.59 | 2.41 | 0.61 | 2.51 | ||||||||||||||||||||||||||||||
Generations Bancorp NY, Inc. | 369,672 | 311,554 | 10.56 | 10.18 | 3.50 | 81.68 | 0.38 | 3.37 | 0.46 | 4.08 | ||||||||||||||||||||||||||||||
HV Bancorp, Inc. | 570,647 | 481,510 | 7.22 | 7.22 | 3.00 | 84.63 | 0.49 | 6.55 | 0.45 | 5.94 | ||||||||||||||||||||||||||||||
IF Bancorp, Inc. | 857,558 | 752,020 | 8.36 | 8.36 | 2.93 | 68.18 | 0.74 | 7.07 | 0.77 | 7.34 | ||||||||||||||||||||||||||||||
Magyar Bancorp, Inc. | 790,652 | 659,821 | 12.77 | 12.77 | 3.51 | 62.66 | 0.89 | 7.58 | 0.89 | 7.58 | ||||||||||||||||||||||||||||||
Mid-Southern Bancorp, Inc. | 266,454 | 205,047 | 12.90 | 12.90 | 2.90 | 78.17 | 0.71 | 4.16 | 0.71 | 4.16 | ||||||||||||||||||||||||||||||
William Penn Bancorporation | 879,952 | 606,617 | 21.86 | 21.36 | 3.02 | 79.93 | 0.51 | 2.00 | 0.53 | 2.11 | ||||||||||||||||||||||||||||||
Source: First Seacoast Bancorp; S&P Global Market Intelligence; Feldman Financial.
71
FELDMAN FINANCIAL ADVISORS, INC.
Table 21
Income and Expense Analysis
For the Last Twelve Months Ended June 30, 2022
| As a Percent of Average Assets | ||||||||||||||||||||||||||||||||||||||||
| Interest Income | Interest Expense | Net Interest Income | Other Oper. Income | Gains & Non-rec. Income | Loan Loss Prov. | Gen. & Admin. Expense | Intang. Amort. Expense | Non-rec. Expense | Pre-tax Core Earnings | |||||||||||||||||||||||||||||||
First Seacoast Bancorp | 3.15 | 0.22 | 2.93 | 0.33 | 0.01 | 0.04 | 2.88 | 0.00 | 0.00 | 0.34 | ||||||||||||||||||||||||||||||
Comparative Group Average | 3.41 | 0.31 | 3.10 | 0.81 | (0.00 | ) | 0.06 | 2.97 | 0.01 | 0.09 | 0.88 | |||||||||||||||||||||||||||||
Comparative Group Median | 3.32 | 0.31 | 2.97 | 0.45 | 0.00 | 0.06 | 2.63 | 0.00 | 0.00 | 0.80 | ||||||||||||||||||||||||||||||
All Public Thrift Average | 3.40 | 0.31 | 3.08 | 0.76 | 0.00 | 0.03 | 2.66 | 0.02 | 0.08 | 1.15 | ||||||||||||||||||||||||||||||
All Public Thrift Median | 3.20 | 0.29 | 2.91 | 0.47 | 0.00 | 0.01 | 2.48 | 0.00 | 0.00 | 1.23 | ||||||||||||||||||||||||||||||
Comparative Group | ||||||||||||||||||||||||||||||||||||||||
Affinity Bancshares, Inc. | 3.88 | 0.20 | 3.69 | 0.34 | 0.00 | 0.10 | 2.67 | 0.02 | 0.08 | 1.25 | ||||||||||||||||||||||||||||||
Cincinnati Bancorp, Inc. | 3.39 | 0.40 | 2.99 | 2.64 | 0.00 | 0.05 | 4.93 | 0.01 | 0.30 | 0.65 | ||||||||||||||||||||||||||||||
Cullman Bancorp, Inc. | 3.93 | 0.35 | 3.59 | 0.41 | 0.00 | 0.05 | 2.70 | 0.00 | 0.43 | 1.25 | ||||||||||||||||||||||||||||||
FFBW, Inc. | 3.21 | 0.24 | 2.96 | 0.32 | 0.00 | 0.00 | 2.45 | 0.03 | 0.00 | 0.84 | ||||||||||||||||||||||||||||||
Generations Bancorp NY, Inc. | 3.54 | 0.39 | 3.15 | 0.69 | (0.00 | ) | 0.15 | 3.13 | 0.02 | 0.08 | 0.55 | |||||||||||||||||||||||||||||
HV Bancorp, Inc. | 3.24 | 0.40 | 2.85 | 1.89 | 0.06 | 0.16 | 4.01 | 0.00 | 0.00 | 0.57 | ||||||||||||||||||||||||||||||
IF Bancorp, Inc. | 3.17 | 0.32 | 2.85 | 0.74 | (0.04 | ) | 0.06 | 2.49 | 0.00 | 0.00 | 1.04 | |||||||||||||||||||||||||||||
Magyar Bancorp, Inc. | 3.60 | 0.28 | 3.33 | 0.30 | 0.00 | 0.08 | 2.28 | 0.00 | 0.00 | 1.26 | ||||||||||||||||||||||||||||||
Mid-Southern Bancorp, Inc. | 3.07 | 0.25 | 2.82 | 0.50 | 0.00 | (0.03 | ) | 2.59 | 0.00 | 0.00 | 0.75 | |||||||||||||||||||||||||||||
William Penn Bancorporation | 3.04 | 0.30 | 2.74 | 0.27 | (0.02 | ) | (0.00 | ) | 2.40 | 0.03 | (0.01 | ) | 0.61 | |||||||||||||||||||||||||||
Source: First Seacoast Bancorp; S&P Global Market Intelligence; Feldman Financial.
72
FELDMAN FINANCIAL ADVISORS, INC.
Table 22
Balance Sheet Composition
As of June 30, 2022
| As a Percent of Total Assets | ||||||||||||||||||||||||||||||||||||||||
| Cash and Securities | Net Loans | Real Estate | Intang. Assets | Other Assets | Total Deposits | Borrowed Funds | Other Liabs. | Total Liabs. | Total Equity | |||||||||||||||||||||||||||||||
First Seacoast Bancorp | 21.78 | 74.86 | 0.00 | 0.06 | 3.30 | 76.02 | 12.64 | 1.18 | 89.83 | 10.17 | ||||||||||||||||||||||||||||||
Comparative Group Average | 23.52 | 70.30 | 0.06 | 0.36 | 5.77 | 79.30 | 4.30 | 1.01 | 84.61 | 15.39 | ||||||||||||||||||||||||||||||
Comparative Group Median | 20.02 | 73.68 | 0.01 | 0.02 | 5.31 | 80.36 | 3.34 | 1.14 | 86.48 | 13.52 | ||||||||||||||||||||||||||||||
All Public Thrift Average | 22.96 | 71.11 | 0.05 | 0.77 | 4.81 | 77.95 | 6.96 | 1.35 | 86.26 | 13.74 | ||||||||||||||||||||||||||||||
All Public Thrift Median | 19.62 | 72.28 | 0.00 | 0.06 | 4.76 | 79.62 | 5.44 | 3.28 | 88.34 | 11.66 | ||||||||||||||||||||||||||||||
Comparative Group | ||||||||||||||||||||||||||||||||||||||||
Affinity Bancshares, Inc. | 13.22 | 80.13 | 0.46 | 2.43 | 3.75 | 81.67 | 2.61 | 0.67 | 84.95 | 15.05 | ||||||||||||||||||||||||||||||
Cincinnati Bancorp, Inc. | 9.82 | 85.16 | 0.00 | 0.05 | 4.97 | 79.04 | 5.67 | 1.15 | 85.86 | 14.14 | ||||||||||||||||||||||||||||||
Cullman Bancorp, Inc. | 13.95 | 80.15 | 0.02 | 0.00 | 5.88 | 72.98 | 0.00 | 1.32 | 74.30 | 25.70 | ||||||||||||||||||||||||||||||
FFBW, Inc. | 28.46 | 65.80 | 0.00 | 0.08 | 5.67 | 73.59 | 0.45 | 0.58 | 74.62 | 25.38 | ||||||||||||||||||||||||||||||
Generations Bancorp NY, Inc. | 13.27 | 76.00 | 0.02 | 0.42 | 10.30 | 84.28 | 3.85 | 1.32 | 89.44 | 10.56 | ||||||||||||||||||||||||||||||
HV Bancorp, Inc. | 23.71 | 71.36 | 0.00 | 0.00 | 4.93 | 84.38 | 7.91 | 0.49 | 92.78 | 7.22 | ||||||||||||||||||||||||||||||
IF Bancorp, Inc. | 35.23 | 60.51 | 0.01 | 0.00 | 4.24 | 87.69 | 2.83 | 1.12 | 91.64 | 8.36 | ||||||||||||||||||||||||||||||
Magyar Bancorp, Inc. | 16.32 | 77.99 | 0.04 | 0.00 | 5.65 | 83.45 | 2.41 | 1.37 | 87.23 | 12.77 | ||||||||||||||||||||||||||||||
Mid-Southern Bancorp, Inc. | 43.94 | 51.84 | 0.00 | 0.00 | 4.22 | 76.95 | 9.86 | 0.28 | 87.10 | 12.90 | ||||||||||||||||||||||||||||||
William Penn Bancorporation | 37.24 | 54.04 | 0.00 | 0.63 | 8.09 | 68.94 | 7.39 | 1.82 | 78.14 | 21.86 | ||||||||||||||||||||||||||||||
Source: First Seacoast Bancorp; S&P Global Market Intelligence; Feldman Financial.
73
FELDMAN FINANCIAL ADVISORS, INC.
Table 23
Growth Rates, Credit Risk, and Loan Composition
As of or For the Last Twelve Months Ended June 30, 2022
| Asset Growth Rate | Loan Growth Rate | Deposit Growth Rate | NPLs/ Loans | NPAs/ Assets | Resrvs./ NPLs | Resrvs./ Loans | Resid. Real Est. Loans(1)/ Loans | Other Real Est. Loans/ Loans | Non- Real Est. Loans/ Loans | |||||||||||||||||||||||||||||||
First Seacoast Bancorp | 6.69 | 2.40 | 4.72 | 0.16 | 0.12 | 605.32 | 0.95 | 65.05 | 26.89 | 8.06 | ||||||||||||||||||||||||||||||
Comparative Group Average | 2.28 | 8.78 | 7.40 | 0.94 | 0.73 | 222.80 | 1.02 | 36.61 | 42.94 | 20.44 | ||||||||||||||||||||||||||||||
Comparative Group Median | 3.05 | 4.28 | 5.39 | 1.03 | 0.68 | 108.48 | 0.97 | 38.07 | 45.90 | 16.67 | ||||||||||||||||||||||||||||||
All Public Thrift Average | 6.70 | 10.15 | 6.12 | 0.70 | 0.50 | 227.29 | 1.01 | 30.15 | 46.01 | 23.84 | ||||||||||||||||||||||||||||||
All Public Thrift Median | 4.22 | 8.10 | 5.15 | 0.39 | 0.29 | 215.07 | 0.99 | 25.26 | 57.13 | 17.61 | ||||||||||||||||||||||||||||||
Comparative Group | ||||||||||||||||||||||||||||||||||||||||
Affinity Bancshares, Inc. | (2.56 | ) | 5.45 | 2.33 | 1.21 | 1.45 | 119.39 | 1.44 | 8.82 | 51.70 | 39.48 | |||||||||||||||||||||||||||||
Cincinnati Bancorp, Inc. | 12.92 | 17.07 | 41.73 | 0.34 | 0.29 | 221.45 | 0.75 | 45.90 | 46.61 | 7.50 | ||||||||||||||||||||||||||||||
Cullman Bancorp, Inc. | 2.07 | 26.51 | (0.06 | ) | 0.93 | 0.78 | 89.12 | 0.83 | 49.23 | 30.45 | 20.32 | |||||||||||||||||||||||||||||
FFBW, Inc. | (6.29 | ) | 9.80 | (0.82 | ) | 0.14 | 0.09 | 795.10 | 1.11 | 21.45 | 62.25 | 16.30 | ||||||||||||||||||||||||||||
Generations Bancorp NY, Inc. | (2.74 | ) | (2.24 | ) | 0.35 | 2.05 | 1.59 | 37.33 | 0.77 | 41.84 | 6.46 | 51.71 | ||||||||||||||||||||||||||||
HV Bancorp, Inc. | 4.03 | 0.57 | 10.08 | 0.68 | 0.49 | 107.75 | 0.73 | 34.31 | 36.72 | 28.97 | ||||||||||||||||||||||||||||||
IF Bancorp, Inc. | 7.55 | 1.16 | 12.64 | 0.22 | 0.15 | 600.68 | 1.34 | 26.57 | 56.40 | 17.03 | ||||||||||||||||||||||||||||||
Magyar Bancorp, Inc. | (6.14 | ) | 1.83 | (10.34 | ) | 1.25 | 1.02 | 109.22 | 1.36 | 33.27 | 53.65 | 13.08 | ||||||||||||||||||||||||||||
Mid-Southern Bancorp, Inc. | 6.94 | 24.56 | 8.45 | 1.12 | 0.59 | 100.00 | 1.12 | 47.03 | 45.19 | 7.78 | ||||||||||||||||||||||||||||||
William Penn Bancorporation | 7.00 | 3.10 | 9.68 | 1.48 | 0.81 | 47.99 | 0.71 | 57.72 | 40.00 | 2.28 | ||||||||||||||||||||||||||||||
| (1) | Includes home equity loans and lines of credit. |
Source: First Seacoast Bancorp; S&P Global Market Intelligence; Feldman Financial.
74
FELDMAN FINANCIAL ADVISORS, INC.
III. MARKET VALUE ADJUSTMENTS
General Overview
This concluding chapter of the Appraisal identifies certain additional adjustments to the Company’s estimated pro forma market value on a fully converted basis relative to the Comparative Group selected in Chapter II. The adjustments discussed in this chapter are made from the viewpoints of potential investors, which would include depositors holding subscription rights and unrelated parties who may purchase stock in a community offering. It is assumed that these potential investors are aware of all relevant and necessary facts as they would pertain to the value of the Company relative to other publicly traded thrift institutions and relative to alternative investments.
Our appraised value is predicated on a continuation of the current operating environment for the Company and thrift institutions in general. Changes in the Company’s operating performance along with changes in the local and national economy, the stock market, interest rates, the regulatory environment, and other external factors may occur from time to time, often with great unpredictability, which could impact materially the pro forma market value of the Company or thrift stocks in general. Therefore, the Valuation Range provided herein is subject to a more current re-evaluation prior to the actual completion of the Conversion and Stock Offering.
In addition to the comparative operating fundamentals discussed in Chapter II, it is important to address additional market value adjustments based on certain financial and other criteria, which include, among other factors:
| (1) | Earnings Prospects |
| (2) | Financial Condition |
| (3) | Market Area |
| (4) | Management |
75
FELDMAN FINANCIAL ADVISORS, INC.
| (5) | Dividend Payments |
| (6) | Liquidity of the Issue |
| (7) | Subscription Interest |
| (8) | Recent Acquisition Activity |
| (9) | Effect of Banking Regulations and Regulatory Reform |
| (10) | Stock Market Conditions |
Earnings Prospects
Earnings prospects are dependent upon the sensitivity of asset yields and liability costs to changes in market rates, the credit quality of assets, the stability of non-interest components of income and expense, and the ability to leverage the balance sheet. Each of the foregoing is an important factor for investors in assessing earnings prospects. The Company’s profitability in recent years generally has been restrained due to a combination of earnings fundamentals reflecting an above-average operating expense level and below-average non-interest income production. These disadvantages are offset somewhat by the Company’s relatively solid net interest margin and its very low level of credit-related losses.
The Company’s earnings compared unfavorably to the Comparative Group for the recent LTM period. The Company’s LTM ROA measured 0.29% versus the Comparative Group median of 0.63% and All Public Thrift median of 0.86%. From 2016 to 2020, the Company’s net interest income did not cover its non-interest expense, which represents a formidable hurdle toward achieving competitive levels of profitability. In 2021, the Company’s net interest income did exceed total non-interest expense and net income advanced to $2.6 million (or ROA of 0.55%) with profitability augmented by the recognition of net securities gains of $535,000. The Company’s increased capital position after the initial offering has helped to stabilize and improve its net interest margin and provide additional leverage capacity to grow the balance sheet. In the near term, the Company’s profitability will continue to be challenged by net interest margin pressure due to its concentration of investments and fixed-rate residential mortgage
76
FELDMAN FINANCIAL ADVISORS, INC.
loans, increased operating expenses associated with managing a public company, and regular loan loss provisions to ensure that the Company’s reserve level increases commensurately with the risk profile of the growing loan portfolio. Based on the Company’s earnings fundamentals and recent operating results, we believe that a downward adjustment is warranted to the Company’s pro forma market value for earnings prospects relative to the Comparative Group.
Financial Condition
As discussed and summarized in Chapter I, the Company’s balance sheet composition reflects a large concentration of real estate loans, an expanding portfolio of investment securities, and liquidity holdings comprising cash and cash equivalents along with certificates of deposit in other financial institutions. The Company relies mainly on its deposit base as a funding source, but also actively utilizes borrowings to supplement deposits. In contrast to the Comparative Group, the Company exhibited a lower level of equity capital, higher level of borrowings, and more favorable measures of credit quality.
Before the infusion of net capital proceeds from the Stock Offering, the Company’s total equity ratio at 10.17% of total assets trailed the Comparative Group median of 13.52% and its tangible equity ratio at 10.11% of tangible assets was below the Comparative Group median of 12.92%. However, assuming completion of the Conversion and Stock Offering, the Company should achieve a capital level on a consolidated basis approaching or exceeding the Comparative Group median. The selection criteria for the Comparative Group ensured a collection of companies with solid capital positions and satisfactory asset quality, similar to the Company’s financial profile. Therefore, on the whole, we believe that no adjustment is warranted for the Company’s financial condition relative to the Comparative Group.
77
FELDMAN FINANCIAL ADVISORS, INC.
Market Area
The members of the Comparative Group are located in the Mid-Atlantic, Midwest, and Southeast regions of the country. The market areas encompassing the Comparative Group companies include metropolitan areas such as Philadelphia, Cincinnati, Louisville, Atlanta, and Milwaukee, along with smaller metropolitan areas. The Comparative Group companies are characterized by a cross-section of market areas that constitute smaller to larger metropolitan areas with relatively stable economies and moderate population growth prospects. However, the Company’s primary market area, as represented by its two-county presence in the Seacoast Region of New Hampshire, exemplifies more favorable demographics than the Comparative Group as a whole.
As shown in Table 24, the weighted average household income of the Company’s market area (as computed based on pro rata branch deposit concentrations) was $83,888 and above the Comparative Group median of $73,061 and the U.S. nationwide median of $72,465. Among the Comparative Group members, only one company exhibited median household incomes in their market areas above that of the Company. HV Bancorp, which operates mainly in Montgomery and Bucks counties outside of Philadelphia, reflected a median household income of $104,402 for its primary market area. Five members of the Comparative Group displayed median household incomes below that of the national median. In addition, the New Hampshire unemployment rate of 2.0% for the month of June 2022 ranked as the lowest among the country’s 50 states and below the national unemployment rate of 3.8%. The corresponding unemployment rates in Strafford and Rockingham counties were both equal to 2.0%, similar to the state unemployment rate. In recognition of these favorable demographic factors altogether, we believe that an upward adjustment is warranted for market area.
78
FELDMAN FINANCIAL ADVISORS, INC.
Table 24
Comparative Market Area Data
First Seacoast Bancorp and the Comparative Group
Company | Headquarters Location | Wtd. Avg. Median Household Income 2022 (1) ($) | Wtd. Avg. Estimated Population Growth 2022-27 (1) (%) | Unemployment Rate June 2022 (2) (%) | ||||||||||
First Seacoast Bancorp | Dover, NH | 83,888 | 3.59 | 2.0 | ||||||||||
Comparative Group Average | 73,132 | 3.34 | 3.8 | |||||||||||
Comparative Group Median | 73,061 | 3.53 | 3.7 | |||||||||||
Comparative Group | ||||||||||||||
Affinity Bancshares, Inc. | Covington, GA | 79,388 | 5.38 | 3.2 | ||||||||||
Cincinnati Bancorp, Inc. | Cincinnati, OH | 73,911 | 2.58 | 3.9 | ||||||||||
Cullman Bancorp, Inc. | Cullman, AL | 55,379 | 5.41 | 2.6 | ||||||||||
FFBW, Inc. | Brookfield, WI | 72,210 | 1.95 | 4.0 | ||||||||||
Generations Bancorp NY, Inc. | Seneca Falls, NY | 65,393 | 4.43 | 2.9 | ||||||||||
HV Bancorp, Inc. | Doylestown, PA | 81,746 | 3.53 | 4.4 | ||||||||||
IF Bancorp, Inc. | Watseka, IL | 51,024 | (0.87 | ) | 5.5 | |||||||||
Magyar Bancorp, Inc. | New Brunswick, NJ | 104,402 | 5.31 | 3.2 | ||||||||||
Mid-Southern Bancorp, Inc. | Salem, IN | 66,119 | 2.10 | 3.4 | ||||||||||
William Penn Bancorporation | Bristol, PA | 81,746 | 3.53 | 4.4 | ||||||||||
| (1) | Weighted average based on pro rata branch deposit totals of each company in its primary MSA (or county) markets. |
| (2) | Based on unemployment rate in company’s primary MSA (or county) market as ranked by deposits. |
Source: Claritas; S&P Global Market Intelligence; U.S. Bureau of Labor Statistics.
Management
Management’s principal challenges are to generate profitable results, monitor credit risks, and control operating costs while the Company competes in an increasingly challenging financial services environment. The normal challenges facing the Company in attempting to deliver earnings growth and enhance its competitiveness remain paramount as it attempts to leverage the net capital proceeds from the Stock Offering. The Company is led by its President and Chief Executive Officer, James Brannen, who assumed the top administrative position in 2018. The Company also hired a new Chief Financial Officer, Richard Donovan, in 2018. Each of these executive officers has extensive years of banking experience. Nevertheless, the management
79
FELDMAN FINANCIAL ADVISORS, INC.
team has significant challenges ahead in improving earnings results. Investors will likely rely upon actual financial results as the means of evaluating the future performance of management as the Company continues to implement its asset growth and earnings improvement strategies. Based on these considerations, we believe that no adjustment is warranted relative to the Comparative Group for this factor.
Dividend Payments
Following completion of the Conversion and Offering, the Board of Directors of New FSB will have the authority to declare cash dividends on the shares of common stock, subject to statutory and regulatory requirements. FSB does not currently pay a cash dividend on its common stock. New FSB does not currently intend to pay dividends on its common stock following the completion of the Stock Offering. If it does determine to pay dividends in the future, the payment and amount of any dividends will depend upon a number of factors, including the following: (1) the Company’s financial performance; (2) regulatory capital requirements and limitations on dividends; (3) other uses of funds for the long-term value of stockholders; (4) tax considerations; and (5) general economic conditions. There is no assurance that New FSB will actually pay cash dividends or that, if paid, such dividends will not be reduced or eliminated in the future.
Payment of cash dividends has become commonplace among publicly traded thrifts with solid capital levels. Of the 10 members of the Comparative Group, five currently pay regular cash dividends. The median dividend yield of the Comparative Group was 0.49% as of August 26, 2022. The median dividend yield of the All Public Thrift aggregate was 1.14% as of August 26, 2022. Based on the anticipated strong capital levels of the Bank and New FSB after the Conversion and Stock Offering, along with the elimination of the mutual holding structure that
80
FELDMAN FINANCIAL ADVISORS, INC.
limits the flexibility to waive dividends to the MHC as majority stockholder, investors are likely to realize and consider that New FSB has sufficient capital cushion to commence paying regular dividends in the future as a means of enhancing shareholder returns. Therefore, we have concluded that no adjustment is warranted for purposes of dividend policy.
Liquidity of the Issue
With the increased number of market makers and institutional investors following thrift stocks, the majority of initial public offerings by thrifts are able to develop a public market for their new stock issues. Most publicly traded thrift stocks continue to be traded on the NASDAQ market. All 10 members of the Comparative Group are listed on the NASDAQ market. Shares of FSB common stock are currently traded on NASDAQ under the symbol “FSEA.” Upon competition of the Conversion and Stock Offering, it is expected that shares of New FSB common stock will also be listed on NASDAQ under the symbol “FSEA.”
The development and maintenance of a public market, having the desirable characteristics of depth, liquidity, and orderliness, depend on the existence of willing buyers and sellers. The average and median market capitalization of the Comparative Group companies was $72.4 million and $65.3 million, respectively, as of August 26, 2022. The All Public Thrift median market capitalization was much higher at $190.9 million. Of the 10 companies in the Comparative Group, all are traded on NASDAQ and indicated an overall average daily trading volume of approximately 5,800 shares over the LTM period. In comparison, FSB exhibited an average daily volume of approximately 4,700 shares over the LTM period. Following the Conversion and Stock Offering, the public float of New FSB shares available for trading will be increased by the addition of publicly owned shares that were previously held by the MHC. Because of the approximate similarity in the Company’s pro forma market capitalization and relatively analogous trading volume versus that of the Comparative Group, we have concluded that no adjustment to the Company’s estimated pro forma market value is necessary for liquidity of the issue.
81
FELDMAN FINANCIAL ADVISORS, INC.
Subscription Interest
The Company has retained the services of Keefe, Bruyette & Woods, Inc., a Stifel Company, to assist in the marketing and sale of the Stock Offering. The Company’s ESOP plans to purchase 8.0% of the total amount of shares to be sold in the Stock Offering. The Company expects its directors, executive officers, and their associates, to purchase 42,500 shares of common stock in the offering for an aggregate amount of approximately $425,000 million based on a $10.00 offering price per share. (These intended share purchases exclude shares currently held by directors, executive officers, and their associates.)
The minimum number of shares of common stock that may be purchased in the Stock Offering is 25 shares ($250). Excluding the ESOP, no individual, or individuals acting through a single qualifying account held jointly, may purchase more than 40,000 shares ($400,000) of common stock, and no person or entity, together with associates or persons acting in concert with such person or entity, may purchase more than 40,000 shares ($400,000) of common stock in all categories of the Stock Offering.
Investor interest in thrift stock issues has been supported by the overall favorable performance results of the banking industry, stable housing market conditions, after-market pricing trends, and the expectation of continued merger and acquisition activity. We are not currently aware of any additional market evidence or characteristics that may help predict the likely level of interest in the Company’s subscription offering. Accordingly, absent actual results of the subscription offering, we believe that subscription interest is currently a neutral factor and, at the present time, requires no further adjustment.
82
FELDMAN FINANCIAL ADVISORS, INC.
Recent Acquisition Activity
Table 25 summarizes recent acquisition activity involving banks and thrifts based in the Northeast from January 1, 2019 to August 26, 2022. There were 22 announced acquisition transactions in the Northeast that are pending or were subsequently completed, with 16 transactions involving Massachusetts sellers, four involving Connecticut sellers, and two sellers from Maine. The largest transaction was the acquisition of People’s United Financial by M&T Bank Corporation. The offer value was approximately $7.6 billion for the $63.1 billion-asset People’s United Financial, which operated over 400 branch locations in Connecticut, New York, Massachusetts, New Hampshire, Vermont, and Maine. The acquisition of People’s United Financial was completed on April 1, 2022.
The acquisition valuation ratios paid in the Northeast transactions generally have followed the nationwide valuation trends for bank and thrift acquisitions. Given that there will be significant regulatory restrictions on the ability to acquire control of New FSB for a period of three years following the Conversion, we do not believe that acquisition premiums are a significant factor to consider in analyzing the Company’s pro forma market value. Moreover, the standard of value applied herein does not require an acquisition value determination.
83
FELDMAN FINANCIAL ADVISORS, INC.
Table 25
Summary of Recent Northeast Acquisition Activity
Pending or Completed Transactions Announced Since January 1, 2019
| Seller’s Prior Financial Data | Offer Value to | |||||||||||||||||||||||||||||||||||||||||||||||||||||
Buyer | St. | Seller | St. | B/T (1) | Total Assets ($Mil.) | Equity/ Assets (%) | LTM ROA (%) | LTM ROE (%) | Date Announced | Status (2) | Offer Value ($Mil.) | Book Value (%) | Tang. Book (%) | LTM EPS (x) | Total Assets (%) | |||||||||||||||||||||||||||||||||||||||
Average | 4,624.1 | 10.63 | 0.65 | 6.36 | NA | NA | 851.0 | 145.8 | 153.9 | 25.3 | 14.61 | |||||||||||||||||||||||||||||||||||||||||||
Median | 482.8 | 10.60 | 0.67 | 6.25 | NA | NA | 134.7 | 143.6 | 154.0 | 18.9 | 14.58 | |||||||||||||||||||||||||||||||||||||||||||
|
|
|
|
|
|
|
|
|
|
|
|
|
|
|
|
|
|
|
|
|
| |||||||||||||||||||||||||||||||||
1889 Bancorp MHC | MA | Foxboro Federal Savings (3) | MA | T | 205.1 | 12.43 | 0.55 | 3.86 | 07/28/22 | P | NA | NA | NA | NA | NA | |||||||||||||||||||||||||||||||||||||||
Cambridge Bancorp | MA | Northmark Bank | MA | B | 442.5 | 12.12 | 0.78 | 6.73 | 05/23/22 | P | 63.0 | 117.5 | 117.5 | 17.9 | 14.24 | |||||||||||||||||||||||||||||||||||||||
Hometown Fin’l Group MHC | MA | Randolph Bancorp, Inc. | MA | T | 803.3 | 12.56 | 1.29 | 9.31 | 03/28/22 | P | 148.3 | 136.8 | 136.9 | 14.4 | 18.46 | |||||||||||||||||||||||||||||||||||||||
1854 Bancorp | MA | Patriot Community Bank | MA | B | 207.6 | 14.86 | 1.13 | 7.81 | 02/23/22 | C | NA | NA | NA | NA | NA | |||||||||||||||||||||||||||||||||||||||
Independent Bank Corp. | MA | Meridian Bancorp, Inc. | MA | T | 6,503.9 | 12.13 | 1.17 | 10.12 | 04/22/21 | C | 1,150.6 | 145.4 | 149.6 | 14.5 | 17.69 | |||||||||||||||||||||||||||||||||||||||
Eastern Bankshares, Inc. | MA | Century Bancorp, Inc. | MA | B | 7,289.3 | 5.23 | 0.68 | 11.97 | 04/07/21 | C | 641.9 | 168.3 | 169.5 | 14.8 | 8.81 | |||||||||||||||||||||||||||||||||||||||
M&T Bank Corporation | NY | People’s United Financial | CT | B | 63,091.8 | 12.05 | 0.36 | 2.81 | 02/22/21 | C | 7,599.0 | 102.1 | 166.5 | 36.1 | 12.04 | |||||||||||||||||||||||||||||||||||||||
SVB Financial Group | CA | Boston Private Fin’l Hldgs. | MA | B | 10,048.7 | 8.64 | 0.49 | 5.34 | 01/04/21 | C | 942.6 | 103.8 | 112.3 | 19.9 | 9.38 | |||||||||||||||||||||||||||||||||||||||
Kennebec Savings, MHC | ME | Kennebec Federal S&LA (3) | ME | T | 94.5 | 9.07 | 0.38 | 4.29 | 06/18/20 | C | NA | NA | NA | NA | NA | |||||||||||||||||||||||||||||||||||||||
LendingClub Corporation | CA | Radius Bancorp, Inc. | MA | T | 1,390.3 | 8.82 | 0.38 | 4.12 | 02/18/20 | C | 188.3 | 176.4 | 179.5 | 35.4 | 13.54 | |||||||||||||||||||||||||||||||||||||||
Beacon Bancorp | MA | Freedom National Bank | MA | B | 123.0 | 10.03 | 0.30 | 3.03 | 01/14/20 | C | 20.0 | 162.2 | 162.2 | 55.1 | 16.26 | |||||||||||||||||||||||||||||||||||||||
Cambridge Financial Group | MA | Melrose Bancorp, Inc. | MA | T | 340.8 | 11.93 | 0.38 | 2.93 | 12/18/19 | C | 57.6 | 141.8 | 141.8 | 44.6 | 16.91 | |||||||||||||||||||||||||||||||||||||||
Bangor Bancorp, MHC | ME | Damariscotta Bankshares Inc. | ME | B | 193.3 | 9.72 | 0.65 | 6.81 | 12/17/19 | C | 35.2 | 187.5 | 187.5 | 27.9 | 18.23 | |||||||||||||||||||||||||||||||||||||||
Cambridge Bancorp | MA | Wellesley Bancorp, Inc. | MA | T | 985.9 | 7.28 | 0.70 | 9.48 | 12/05/19 | C | 121.0 | 158.5 | 158.5 | 17.4 | 12.28 | |||||||||||||||||||||||||||||||||||||||
Bridgewater Financial, MHC | MA | Mansfield Co-op. Bank (3) | MA | B | 527.2 | 10.66 | 0.60 | 5.77 | 12/04/19 | C | NA | NA | NA | NA | NA | |||||||||||||||||||||||||||||||||||||||
Centreville Bank | RI | PB Bancorp, Inc. | CT | T | 538.0 | 15.81 | 0.82 | 5.09 | 10/22/19 | C | 115.5 | 133.5 | 145.3 | 25.4 | 21.47 | |||||||||||||||||||||||||||||||||||||||
People’s United Financial | CT | United Financial Bancorp | CT | T | 7,339.9 | 9.87 | 0.79 | 8.07 | 07/15/19 | C | 759.0 | 104.8 | 126.1 | 13.4 | 10.34 | |||||||||||||||||||||||||||||||||||||||
Fidelity Mutual Holding Co. | MA | Family Federal Savings (3) | MA | T | 97.9 | 11.76 | 0.05 | 0.47 | 06/18/19 | C | NA | NA | NA | NA | NA | |||||||||||||||||||||||||||||||||||||||
North Shore Bancorp | MA | Beverly Financial, MHC (3) | MA | T | 486.8 | 8.53 | 0.72 | 8.40 | 04/09/19 | C | NA | NA | NA | NA | NA | |||||||||||||||||||||||||||||||||||||||
Liberty Bank | CT | SBT Bancorp, Inc. | CT | B | 478.7 | 7.34 | 0.81 | 12.42 | 03/21/19 | C | 71.4 | 202.0 | 202.0 | 17.3 | 14.91 | |||||||||||||||||||||||||||||||||||||||
Hometown Fin’l Group MHC | MA | Millbury Savings Bank (3) | MA | T | 228.1 | 12.46 | 0.81 | 6.72 | 02/27/19 | C | NA | NA | NA | NA | NA | |||||||||||||||||||||||||||||||||||||||
Hometown Fin’l Group MHC | MA | Abington Bank (3) | MA | B | 314.1 | 10.55 | 0.47 | 4.45 | 02/06/19 | C | NA | NA | NA | NA | NA | |||||||||||||||||||||||||||||||||||||||
| (1) | B = bank; T = thrift. |
| (2) | P = pending; C = completed. |
| (3) | Mutual-form seller with no offer value consideration. |
Source: S&P Global Market Intelligence.
84
FELDMAN FINANCIAL ADVISORS, INC.
Effect of Banking Regulations and Regulatory Reform
In response to the financial crisis of 2008 and 2009, Congress took actions intended to strengthen confidence and encourage liquidity in financial institutions. The Dodd-Frank Wall Street Reform and Consumer Protection Act (“Dodd-Frank”) was enacted in 2010, and provided for new restrictions and an expanded framework of regulatory oversight for financial institutions. The legislation also created the Consumer Financial Protection Bureau, which has broad authority to issue regulations governing the services and products provided by financial institutions. Community bankers believe that the Dodd-Frank legislation has led to increased compliance costs. Legislation was enacted in 2018 that preserves the fundamental elements of the post-Dodd-Frank regulatory framework, but includes modifications that will result in some meaningful regulatory relief for smaller and certain larger banking organizations.
As a stock savings bank insured by the FDIC and supervised by its primary regulators, the Bank and its parent holding company will continue to operate in the same regulatory environment that is substantially similar to that faced by the Comparative Group companies. As of June 30, 2022, the Bank was considered well capitalized, similar to all the members of the Comparative Group. Therefore, given these factors, we believe that no specific adjustment is necessary for the effect of banking regulations and regulatory reform.
Stock Market Conditions
Financial stocks performed well in the economic recovery following the financial crisis, and bank and thrift stocks participated fully in the sustained market rally from 2009 to 2019. Robust corporate earnings growth, sustained economic expansion, and generally low interest rates were significant factors influencing equity market returns over this period, the second longest market rally in U.S. history. However, beginning in February 2020, market volatility
85
FELDMAN FINANCIAL ADVISORS, INC.
was spurred by the outbreak of the coronavirus and concerns about its impact on the U.S. economy, supply chains, and consumer spending. The coronavirus evolved into a global pandemic, disrupting major economies worldwide and abruptly ending the bull market run. U.S. equities fell sharply, then rebounded off their lows from March 2020 and performed strongly for the remainder of 2020.
U.S. equity markets continued to appreciate during 2021, extending the gains that began in the aftermath of March 2020, and many market indexes reached all-time highs in successive months through August 2021. The successful rollout of coronavirus vaccines, unprecedented fiscal and monetary stimulus, healthy consumer balance sheets, and tightening labor markets created optimism about U.S. economic growth and helped propel stock market returns.
U.S. equity markets were volatile and declined in the first half of 2022, reversing their exceptional performance in 2021, when the S&P 500 rose by 27%. Every sector of the S&P 500 posted negative returns in the first half, except for energy stocks, amid geopolitical tensions, higher inflation, and a shift toward less accommodative monetary policy in the United States. Russia’s invasion of Ukraine and the fallout from related sanctions exacerbated commodity price pressures and amplified geopolitical risks. Supply chain bottlenecks and labor market shortages have further constrained supply and propelled prices higher. U.S. inflation soared to 9.1% for the year ended June 30, 2022 (as measured by the Consumer Price Index), the largest increase in 40 years. In response, the Federal Reserve Board has aggressively increased interest rates and tapered its balance sheets. Investors have begun to raise concerns that the actions by the Federal Reserve Board to slow the economy and temper inflation would lead to a recession. Overall, the decline in U.S equity markets largely reflected valuation ratio compression and the S&P 500 was down by 14.9% on a year-to-date basis through August 26, 2022.
86
FELDMAN FINANCIAL ADVISORS, INC.
Table 26 displays the three-year performance of an array of market indexes maintained or reported by S&P Global Market Intelligence. The market performance in Table 26 highlights the volatility in the U.S. equity markets. The S&P $250M-$1B Bank Index (all publicly traded banks and thrifts with assets between $250 million and $1 billion) increased by 35.5% over the past three years, while the S&P 500 and NASDAQ Bank Index increased by 38.7% and 25.4%, respectively. After the pandemic-related fallout in early 2020, the recovery in financial stocks lagged the overall market throughout much of 2020 before catching up with the market rebound by March 2021. Table 27 presents the comparative market indexes over the one-year period ended August 26, 2022. The U.S. equity markets turned weaker in April 2022 and have remained sluggish through August 2022. The S&P $250M-$1B Bank Index was up marginally by 0.2% over the one-year period ending August 26, 2022, while the S&P 500 and NASDAQ Bank Index were down by 10.0% and 5.4%, respectively.
A “new issue” discount that reflects investor concerns and investment risks inherent in all initial public offerings is a factor to be considered for purposes of valuing converting thrifts. The magnitude of the new issue discount typically expands during periods of declining or volatile thrift stock prices as investors require larger inducements, and narrows during strong market conditions. Table 28 presents a summary of second-step offerings since January 1, 2019 involving mutual holding companies along with standard full conversion offerings during the period. The pricing of these offerings confirms the presence of the new issue discount in the pro forma market valuations of converting thrifts versus existing public thrifts. The distinction of the new issue discount is most apparent with the price-to-book value ratio because the pro forma equity calculation involves combining the net new capital proceeds with the historical equity of the converting company.
87
FELDMAN FINANCIAL ADVISORS, INC.
Table 26
Comparative Three-Year Stock Index Performance
For the Three-Year Period Through August 26, 2022
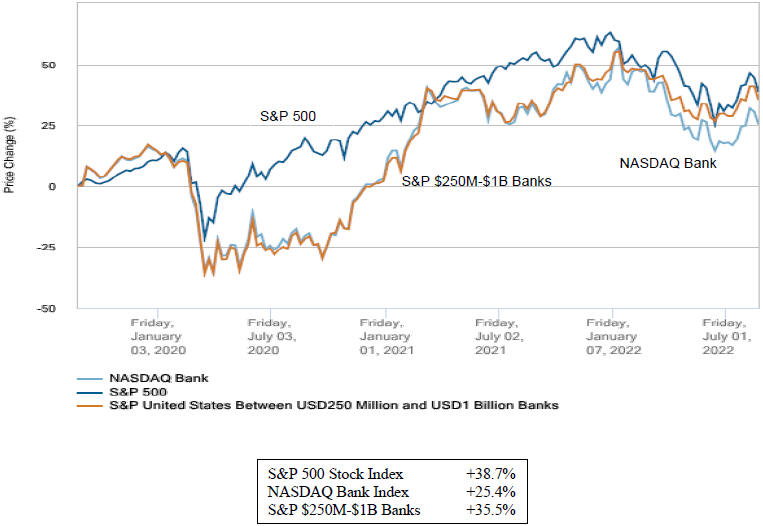
88
FELDMAN FINANCIAL ADVISORS, INC.
Table 27
Comparative One-Year Stock Index Performance
For the One-Year Period Through August 26, 2022
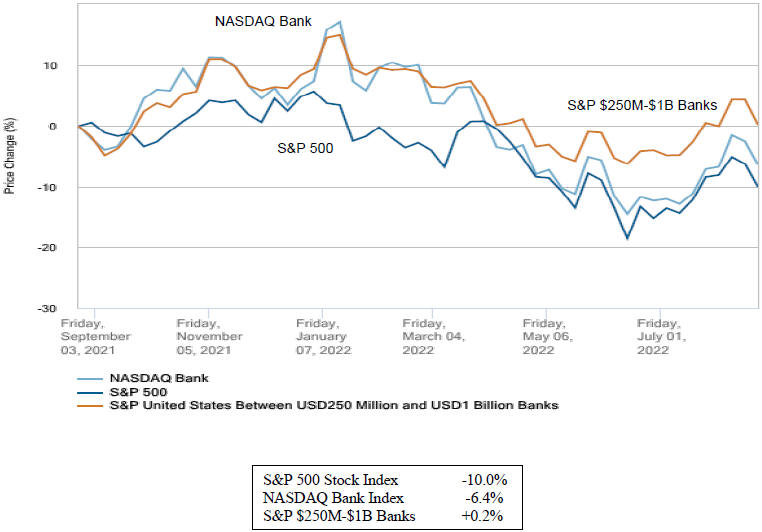
89
FELDMAN FINANCIAL ADVISORS, INC.
Table 28
Recent Thrift Conversion Stock Offerings
Second-Step and Standard Offerings Completed Since January 1, 2020
| Pro Forma Valuation Ratios | After-Market Trading | |||||||||||||||||||||||||||||||||||||||||||||||||
| Gross Offering Proceeds ($Mil.) | Price/ Book Value (%) | Price/ Tang. Book (%) | Price/ LTM EPS (x) | Tang. Eqty./ Assets (%) | 8/26/22 Closing Price ($) | Price Change | Change Through 8/26/22 (%) | |||||||||||||||||||||||||||||||||||||||||||
Company | St. | Stock Exchange | Conversion Offering Date | Total Assets ($Mil.) | Initial Price ($) | One Day (%) | One Week (%) | One Month (%) | ||||||||||||||||||||||||||||||||||||||||||
Second-Step Offerings — Average | 661.8 | 58.6 | 73.7 | 75.6 | 28.3 | 18.76 | NA | NA | 8.7 | 7.3 | 6.5 | 21.2 | ||||||||||||||||||||||||||||||||||||||
Second-Step Offerings — Median | 631.8 | 40.9 | 74.6 | 76.9 | 18.3 | 16.86 | NA | NA | 8.9 | 7.1 | 7.0 | 19.1 | ||||||||||||||||||||||||||||||||||||||
Standard Offerings — Average | 1,955.2 | 256.7 | 58.1 | 59.3 | 74.4 | 23.47 | NA | NA | 30.5 | 33.1 | 36.7 | 42.0 | ||||||||||||||||||||||||||||||||||||||
Standard Offerings — Median | 281.1 | 49.0 | 58.7 | 59.7 | 74.4 | 23.10 | NA | NA | 29.0 | 29.7 | 35.2 | 36.5 | ||||||||||||||||||||||||||||||||||||||
Second-Step Offerings | ||||||||||||||||||||||||||||||||||||||||||||||||||
Ponce Financial Group, Inc. | NY | NASDAQ | 01/27/22 | 1,560.6 | 133.2 | 86.2 | 86.2 | 15.4 | 17.15 | 10.00 | 9.55 | 9.3 | 6.3 | 5.7 | (4.5 | ) | ||||||||||||||||||||||||||||||||||
Cullman Bancorp, Inc. | AL | NASDAQ | 07/14/21 | 334.1 | 42.8 | 76.9 | 76.9 | 21.1 | 25.85 | 10.00 | 11.35 | 11.4 | 11.9 | 11.5 | 13.5 | |||||||||||||||||||||||||||||||||||
Magyar Bancorp, Inc. | NJ | NASDAQ | 07/14/21 | 758.8 | 39.1 | 77.9 | 77.9 | 13.9 | 11.76 | 10.00 | 12.25 | 9.4 | 7.0 | 3.9 | 22.5 | |||||||||||||||||||||||||||||||||||
1895 Bancorp of Wisconsin, Inc. | WI | NASDAQ | 07/14/21 | 517.1 | 35.4 | 71.5 | 71.5 | 66.7 | 16.38 | 10.00 | 9.91 | 11.5 | 10.7 | 7.6 | (0.9 | ) | ||||||||||||||||||||||||||||||||||
Northeast Community Bancorp | NY | NASDAQ | 07/12/21 | 965.1 | 97.8 | 68.8 | 69.0 | 14.4 | 22.57 | 10.00 | 12.86 | 6.1 | 5.9 | 0.7 | 28.6 | |||||||||||||||||||||||||||||||||||
William Penn Bancorporation | PA | NASDAQ | 03/24/21 | 746.5 | 126.4 | 72.3 | 74.4 | NM | 24.25 | 10.00 | 11.57 | 14.1 | 13.6 | 13.9 | 15.7 | |||||||||||||||||||||||||||||||||||
Affinity Bancshares, Inc. | GA | NASDAQ | 01/20/21 | 888.2 | 37.0 | 63.4 | 76.9 | NM | 9.73 | 10.00 | 14.84 | 8.5 | 7.5 | 13.0 | 48.4 | |||||||||||||||||||||||||||||||||||
Generations Bancorp NY, Inc. | NY | NASDAQ | 01/12/21 | 367.7 | 14.8 | 59.8 | 62.4 | 38.0 | 10.26 | 10.00 | 11.11 | 0.9 | -4.4 | -5.2 | 11.1 | |||||||||||||||||||||||||||||||||||
Cincinnati Bancorp, Inc. | OH | NASDAQ | 01/22/20 | 221.5 | 16.5 | 81.2 | 81.7 | NM | 16.57 | 10.00 | 15.25 | 8.3 | 7.2 | 7.4 | 52.5 | |||||||||||||||||||||||||||||||||||
FFBW, Inc. | WI | NASDAQ | 01/16/20 | 258.1 | 42.7 | 79.2 | 79.2 | NM | 33.06 | 10.00 | 12.47 | 7.5 | 7.0 | 6.6 | 24.7 | |||||||||||||||||||||||||||||||||||
Standard Offerings | ||||||||||||||||||||||||||||||||||||||||||||||||||
VWF Bancorp, Inc. | OH | OTC | 07/13/22 | 137.0 | 19.2 | 50.2 | 50.2 | NM | 24.84 | 10.00 | 14.27 | 29.0 | 45.0 | 49.0 | 42.7 | |||||||||||||||||||||||||||||||||||
NSTS Bancorp, Inc. | IL | NASDAQ | 01/18/22 | 259.9 | 52.9 | 59.7 | 59.7 | NM | 31.81 | 10.00 | 11.02 | 25.9 | 23.0 | 25.0 | 10.2 | |||||||||||||||||||||||||||||||||||
Catalyst Bancorp, Inc. | LA | NASDAQ | 10/12/21 | 238.3 | 52.9 | 55.5 | 55.5 | NM | 33.84 | 10.00 | 13.24 | 35.6 | 38.5 | 37.6 | 32.4 | |||||||||||||||||||||||||||||||||||
TC Bancshares, Inc. | GA | NASDAQ | 07/20/21 | 363.6 | 49.0 | 59.9 | 59.9 | NM | 20.84 | 10.00 | 14.05 | 21.1 | 20.7 | 28.9 | 40.5 | |||||||||||||||||||||||||||||||||||
Blue Foundry Bancorp | NJ | NASDAQ | 07/15/21 | 1,963.6 | 277.7 | 66.1 | 66.1 | NM | 19.90 | 10.00 | 11.54 | 29.0 | 27.0 | 34.1 | 15.4 | |||||||||||||||||||||||||||||||||||
PB Bankshares, Inc. | PA | NASDAQ | 07/14/21 | 281.1 | 27.8 | 61.7 | 61.7 | NM | 15.10 | 10.00 | 13.20 | 30.8 | 32.4 | 29.0 | 32.0 | |||||||||||||||||||||||||||||||||||
Texas Community Bancshares | TX | NASDAQ | 07/14/21 | 316.5 | 32.1 | 53.2 | 56.0 | 86.3 | 17.83 | 10.00 | 16.20 | 50.8 | 53.5 | 54.0 | 62.0 | |||||||||||||||||||||||||||||||||||
Eastern Bankshares, Inc. | MA | NASDAQ | 10/14/20 | 13,996.5 | 1,792.9 | 58.2 | 65.9 | NM | 23.10 | 10.00 | 20.08 | 21.5 | 24.8 | 36.2 | 100.8 | |||||||||||||||||||||||||||||||||||
Systematic Savings Bank | MO | OTC | 10/13/20 | 40.0 | 6.0 | 58.7 | 58.7 | 62.5 | 24.01 | 10.00 | NA | NA | NA | NA | NA | |||||||||||||||||||||||||||||||||||
Source: S&P Global Market Intelligence.
90
FELDMAN FINANCIAL ADVISORS, INC.
As shown in Table 28, the median pro forma price-to-book value ratio for the 10 second-step conversion offerings from 2020 to 2022 was 74.6%, and the median pro forma price-to-tangible book ratio was 76.9%. The median pro forma price-to-earnings ratio was 18.3x for second-step conversion offerings during the 2020 to 2022 period. Because the full complement of pro forma shares outstanding is being sold in standard conversions, the price-to-book calculation generally results in lower pro forma ratios than those observed in second-step conversion offerings. The median pro forma price-to-book value ratio for the nine standard conversion offerings was 58.7% for the 2020 to 2022 period, and the median pro forma price-to-tangible book ratio was 59.7%.
Historically, newly converted thrifts have gradually traded upward in the after-market to a range near existing thrift stock valuation levels, but found resistance approaching book value until a discernible trend in earnings improvement was evident. Pricing a new offering at a relatively high ratio in relation to pro forma book value, because of the mathematics of the calculation, would require very large increases in valuations resulting in unsustainable price-to-earnings ratios and very marginal returns on equity.
The 4,796 FDIC-insured commercial banks and savings institutions reported quarterly net income of $59.7 billion in first quarter 2022, a decrease of $17.0 billion (22.2%) from the year-ago quarter. Provision expense increased from negative $14.5 billion to positive $5.2 billion. The decline in net income and an increase in average assets reduced the industry aggregate ROA to 1.00% in first quarter 2022 from 1.38% in first quarter 2021 and from 1.09% for fourth quarter 2021. Capital ratios remained well above pre-pandemic averages despite a decline between fourth quarter 2021 and first quarter 2022. During the quarter, the total risk-based capital ratio was down 42 basis points to 15.04%, the tier 1 risk-based capital ratio was down 40 basis points to 13.74%, and the tier 1 leverage capital ratio was down 7 basis points to 8.67%. A decline in aggregate AOCI balances of $139.1 billion resulting from the effect of rising market interest rates on the value of available-for-sale securities drove a reduction in equity capital of $99.6 billion (4.2% percent) from fourth quarter 2021.
91
FELDMAN FINANCIAL ADVISORS, INC.
Bank and thrift industry earnings results have recently been squeezed by net interest margin pressures and the return to loss provision expensing following a trend of provision credits in the aftermath of significant pandemic-related charges. Industry operating expenses generally continue to rise in the face of sluggish growth in non-interest operating income or securities gains. While bank and thrift industry regulatory capital levels remain strong and asset quality has improved, there continue to be volatile swings in the market for bank and thrift stocks. Therefore, against the backdrop of unsettled and inconsistent stock market conditions, the new issue discount continues to be relevant because of the risks and uncertainties associated with a new stock offering.
Adjustments Conclusion
It is our opinion that the Company’s pro forma market valuation should be discounted relative to the Comparative Group. Our conclusion is based on downward adjustments for earnings prospects and the new issue discount underlying stock market conditions. These downward adjustments were offset partially by an upward adjustment for market area. As discussed earlier, the downward adjustment for earnings prospects took into consideration the Company’s lower profitability versus the Comparative Group and uncertainty as to future earnings growth. The downward adjustment for marketing of the issue was based on the risk and uncertainty related to a new offering in the current environment of market volatility. The upward adjustment for market area reflected the favorable demographic measures of the Company’s
92
FELDMAN FINANCIAL ADVISORS, INC.
primary market area regarding unemployment rates, population growth, and household income levels compared to the primary market areas of the Comparative Group. Currently, converting thrifts are often valued at meaningful discounts to peer institutions relative to price-to-book and price-to-tangible book ratios. Due to initially low post-conversion earnings from the re-investment of net offering proceeds at relatively low rates, resulting price-to-earnings ratios may reflect premiums to established trading companies. It is the judgment of the appraiser to balance the relative dynamics of price-to-book and price-to-earnings discounts or premiums.
Valuation Approach
In determining the estimated pro forma market value of the Company on a fully converted basis, we have employed the comparative company approach and considered the following pricing ratios: price-to-book value per share (“P/B”), price-to-tangible book value per share (“P/TB”), price-to-earnings per share (“P/E”), and price-to-assets (“P/A”). Table 29 presents the trading market valuation ratios of the Comparative Group and All Public Thrift averages and medians as of August 26, 2022. As shown in Table 29, the median P/B ratio for the Comparative Group was 87.7%. Only three members of the Comparative Group were valued at levels above book value (P/B ratio greater than 100.0%). The median P/TB ratio for the Comparative Group was 90.9%. The median P/E ratio based on LTM earnings for the Comparative Group was 19.5x. On a core earnings basis, the median core P/E ratio of the Comparative Group was also 19.5x. Some companies within the Comparative Group reported P/E ratios that were distortedly high due to lower levels of profitability.
93
FELDMAN FINANCIAL ADVISORS, INC.
Investors continue to make decisions to purchase thrift conversion stocks and more seasoned thrift issues based upon consideration of core earnings profitability and P/B comparisons. The P/E ratio remains an important valuation ratio in the current thrift stock market. However, as noted above, the P/E ratio is not useful for companies reporting negative or low earnings. The Company’s LTM earnings for the period ended June 30, 2022 amounted to $1.5 million and its LTM core earnings amounted to $1.4 after excluding $52,000 in net securities gains. On a fully converted pro forma basis, after making adjustments for re-investment of net offering proceeds and expensing charges related to the implementation of various stock benefit plans, including the ESOP, restricted stock plan (“RSP”), and stock option plan, the Company’s pro forma core earnings are equal to approximately $1.5 million. This level of pro forma earnings remains comparatively low and results in highly inflated P/E ratios. Consequently, additional reliance is placed on the P/B and P/TB ratios to determine trading valuation benchmarks.
Based on our comparative financial and valuation analyses, we concluded that the Company should be discounted relative to the trading valuation ratios of the overall Comparative Group. In consideration of the foregoing factors along with the additional adjustments discussed in this chapter, we have determined a pro forma P/B ratio of 77.2% and P/TB ratio of 77.5% for the Company, which reflects an aggregate midpoint of $59.7 million on a fully converted basis for the Valuation Range based on the assumptions summarized in Exhibit IV. Employing a range of 15% above and below the midpoint, the resulting minimum value of $50.8 million reflects a P/B ratio of 69.4% and the resulting maximum value of $68.7 million reflects a P/B ratio of 84.0%. Based on FSB’s intangible assets of $316,000 at June 30, 2022, the Company’s pro forma P/TB ratios are equal to 69.8%, 77.5%, and 84.4% at the minimum, midpoint, and maximum of the Valuation Range, respectively. The Company’s pro forma P/TB ratio of 77.2% at the midpoint is comparable to the median pro forma P/B ratio of 76.9% reported for the 10 second-step conversion offerings completed from 2020 to 2022 as shown in Table 28.
94
FELDMAN FINANCIAL ADVISORS, INC.
As previously discussed, the Company has provided notice of its intent to withdraw as a participant from its defined benefit pension plan as of September 30, 2022. Based on an estimate provided by the plan administrator, the estimated total cost (pre-tax) to withdraw is $2.5 million. The Company intends to accrue for this amount during the quarter ending September 30, 2022. The actual cost could differ significantly from the estimated cost provided by the plan administrator. In performing our valuation analysis, we have taken into account this estimated charge of approximately $2.0 million on an after-tax basis as an adjustment to pro forma equity
The Company’s pro forma midpoint P/B ratio of 77.2% reflects a discount of 12.0% to the Comparative Group median P/B ratio of 87.7%. The Company’s pro forma minimum and maximum P/B ratios of 69.4% and 84.0%, respectively, reflect discounts of 20.9% and 4.2% to the Comparative Group median P/B ratio of 87.7%. The Company’s pro forma midpoint P/TB ratio of 77.5% reflects a discount of 14.7% to the Comparative Group median P/TB ratio of 90.9%. The Company’s pro forma minimum and maximum P/TB ratios of 69.8% and 84.4% reflect discounts of 23.2% and 7.2%, respectively, to the Comparative Group median P/TB ratio of 90.9%.
Based on the Valuation Range as indicated above, the Company’s pro forma LTM P/E ratios measured 31.3x, 35.7x, and 40.0x at the minimum, midpoint, and maximum, respectively, of the Valuation Range. The Company’s pro forma core P/E ratios were 31.3x, 37.0x, and 41.7x at the minimum, midpoint, and maximum, respectively, of the Valuation Range. As discussed earlier, the Company’s pro forma P/E ratios are skewed upward due to its comparatively lower earnings base. The Company’s pro forma LTM P/E ratios represent premiums of 60.5%, 83.1%, and 105.1% at the minimum, midpoint, and maximum, respectively, of the Valuation Range as compared to the Comparative Group median LTM P/E ratio of 19.5x. The Company’s pro forma core P/E ratios represent premiums of 60.5%, 89.7%, and 113.8% at the minimum, midpoint, and maximum, respectively, of the Valuation Range as compared to the Comparative Group median core P/E ratio of 19.5x.
95
FELDMAN FINANCIAL ADVISORS, INC.
Based on the price-to-assets valuation metric, the Company’s pro forma midpoint of the Valuation Range at $59.7 million reflects a corresponding P/A ratio of 11.15%, ranging from 9.55% at the minimum to 12.72% at the maximum. In comparison, the Comparative Group median P/A ratio was 13.68%. The Company’s solid capitalization level is reflected by pro forma ratios of total equity to total assets of 13.75%, 14.45%, and 15.13%, respectively at the minimum, midpoint, and maximum, respectively. The Company’s pro forma ratios of tangible equity to tangible assets were 13.70%, 14.40%, and 15.08%, respectively at the minimum, midpoint, and maximum, respectively.
Valuation Conclusion
It is our opinion that, as of August 26, 2022, the estimated pro forma market value of the Company on a fully converted basis – including (1) newly-issued shares representing the MHC’s current ownership interest in the Company and (2) exchange shares issued to existing public stockholders of the Company – was within a Valuation Range of $50,774,920 to $68,695,480 with a midpoint of $59,735,200. The Valuation Range was based upon a 15% decrease from the midpoint to determine the minimum and a 15% increase from the midpoint to establish the maximum. Based on an offering price of $10.00 per share, the Valuation Range reflects total pro forma outstanding shares ranging from 5,077,492 at the minimum to 6,869,548 at the maximum.
96
FELDMAN FINANCIAL ADVISORS, INC.
In preparing the pro forma valuation analysis, we have taken into account the pro forma impact of the MHC’s unconsolidated net assets that will be consolidated with the Company and thus will slightly increase pro forma equity. After accounting for the impact of the MHC’s net assets of $100,000 in cash as of June 30, 2022, the public stockholders’ aggregate ownership interest in FSB was reduced by 0.2%, or a difference of 0.0750 percentage points. Accordingly, for purposes of the Company’s pro forma valuation as shown in Exhibit IV-1, the public stockholders’ pro forma ownership interest was reduced from 44.8312% to 44.7562% and the MHC’s pro forma ownership interest was increased from 55.1688% to 55.2438%.
Based on the Valuation Range and taking into account the pro forma ownership interest held by MHC, the midpoint of the offering range is $33,000,000 or equal to 3,300,000 shares at the offering price of $10.00 per share. The resulting offering range and offering shares, all based on the offering price of $10.00 per share, are as follows: $28,050,000 or 2,805,000 shares at the minimum and $37,950,000 or 3,795,000 shares at the maximum.
The exchange ratio to be received by the existing minority stockholders of the Company will be determined at the end of the Stock Offering, based on the total number of shares sold in the subscription and community offerings and the final appraisal. Based on the valuation conclusion herein, the resulting offering value, and the $10.00 per share offering price, the indicated exchange ratio at the midpoint is 0.9833 shares of New FSB common stock for every one share of FSB common stock held by public stockholders. Furthermore, based on the offering range of value, the indicated exchange ratio is 0.8358 at the minimum and 1.1308 at the maximum.
Exhibit IV-2 displays the assumptions utilized in calculating the pro forma financial consequences on a fully converted basis. Exhibit IV-3 displays the pro forma financial data of the Company at the minimum, midpoint, and maximum levels of the Valuation Range. Exhibit IV-4 provides more detailed data and calculations at the midpoint level of the Valuation Range. Exhibit IV-5 compares the Company’s pro forma fully converted valuation ratios with the averages and medians reported by the Comparative Group and All Public Thrifts.
97
FELDMAN FINANCIAL ADVISORS, INC.
Table 29
Comparative Pro Forma Fully Converted Valuation Analysis
Based on Market Price Data as of August 26, 2022
Company | Current Stock Price ($) | Total Market Value ($Mil.) | Price/ LTM EPS (x) | Price/ Core EPS (x) | Price/ Book Value (%) | Price/ Tang. Book (%) | Price/ Total Assets (%) | Total Equity/ Assets (%) | Tang. Equity/ Assets (%) | Current Dividend Yield (%) | ||||||||||||||||||||||||||||||
First Seacoast Bancorp (1) | ||||||||||||||||||||||||||||||||||||||||
Pro Forma Minimum | 10.00 | 50.8 | 30.3 | 31.3 | 69.4 | 69.8 | 9.55 | 13.75 | 13.70 | 0.00 | ||||||||||||||||||||||||||||||
Pro Forma Midpoint | 10.00 | 59.7 | 35.7 | 35.7 | 77.2 | 77.5 | 11.15 | 14.45 | 14.40 | 0.00 | ||||||||||||||||||||||||||||||
Pro Forma Maximum | 10.00 | 68.7 | 40.0 | 41.7 | 84.0 | 84.4 | 12.72 | 15.13 | 15.08 | 0.00 | ||||||||||||||||||||||||||||||
Comparative Group Average | NA | 72.4 | 26.8 | 21.8 | 92.7 | 94.9 | 14.22 | 15.39 | 15.08 | 0.61 | ||||||||||||||||||||||||||||||
Comparative Group Median | NA | 65.3 | 19.5 | 19.5 | 87.7 | 90.9 | 13.68 | 13.52 | 12.92 | 0.49 | ||||||||||||||||||||||||||||||
All Public Thrift Average (2) | NA | 546.2 | 18.7 | 16.0 | 100.6 | 111.2 | 12.88 | 13.74 | 12.82 | 1.71 | ||||||||||||||||||||||||||||||
All Public Thrift Median (2) | NA | 190.9 | 14.2 | 12.0 | 93.4 | 102.5 | 12.05 | 11.66 | 10.85 | 1.14 | ||||||||||||||||||||||||||||||
Comparative Group | ||||||||||||||||||||||||||||||||||||||||
Affinity Bancshares, Inc. | 14.84 | 99.1 | 15.0 | 13.7 | 84.8 | 101.1 | 12.76 | 15.05 | 12.93 | 0.00 | ||||||||||||||||||||||||||||||
Cincinnati Bancorp, Inc. | 15.25 | 45.2 | 66.3 | 35.1 | 113.4 | 113.7 | 16.03 | 14.14 | 14.10 | 0.00 | ||||||||||||||||||||||||||||||
Cullman Bancorp, Inc. | 11.35 | 84.1 | 33.4 | 21.7 | 85.2 | 85.2 | 21.89 | 25.70 | 25.70 | 1.06 | ||||||||||||||||||||||||||||||
FFBW, Inc. | 12.47 | 72.2 | 36.7 | 34.6 | 89.3 | 89.6 | 22.67 | 25.38 | 25.32 | 0.00 | ||||||||||||||||||||||||||||||
Generations Bancorp NY, Inc. | 11.11 | 27.0 | 18.2 | 15.2 | 69.2 | 72.1 | 7.31 | 10.56 | 10.18 | 0.00 | ||||||||||||||||||||||||||||||
HV Bancorp, Inc. | 21.49 | 48.2 | 16.4 | 18.1 | 116.9 | 116.9 | 8.44 | 7.22 | 7.22 | 0.00 | ||||||||||||||||||||||||||||||
IF Bancorp, Inc. | 19.00 | 58.5 | 10.3 | 10.3 | 78.9 | 78.9 | 7.87 | 8.36 | 8.36 | 1.84 | ||||||||||||||||||||||||||||||
Magyar Bancorp, Inc. | 12.25 | 86.9 | 11.8 | 11.8 | 86.1 | 86.1 | 11.00 | 12.77 | 12.77 | 0.98 | ||||||||||||||||||||||||||||||
Mid-Southern Bancorp, Inc. | 13.56 | 38.9 | 20.9 | 20.9 | 113.2 | 113.2 | 14.61 | 12.90 | 12.90 | 1.18 | ||||||||||||||||||||||||||||||
William Penn Bancorporation | 11.57 | 163.5 | 38.6 | 36.6 | 89.6 | 92.3 | 19.59 | 21.86 | 21.36 | 1.04 | ||||||||||||||||||||||||||||||
| (1) | Pro forma ratios assume an estimated pro forma fully converted value of $50.8 million at the minimum, $59.7 million at the midpoint, and $68.7 million at the maximum, and that the Stock Offering is equal to $28.1 million at the minimum, $33.0 million at the midpoint, and $38.0 million at the maximum. |
| (2) | All public thrifts traded on a major exchange, excluding mutual holding companies and companies being acquired in announced merger transactions. |
Source: First Seacoast Bancorp; S&P Global Market Intelligence; Feldman Financial.
98
FELDMAN FINANCIAL ADVISORS, INC.
Exhibit I
Background of Feldman Financial Advisors, Inc.
Overview of Firm
Feldman Financial Advisors provides consulting and advisory services to financial institutions and mortgage companies in the areas of corporate valuations, mergers and acquisitions, strategic planning, branch sales and purchases, developing and implementing regulatory business and capital plans, and expert witness testimony and analysis. Our senior staff members have been involved in the stock conversion process since 1982 and have valued more than 350 converting institutions.
Feldman Financial Advisors was incorporated in February 1996 by a group of consultants who were previously associated with Credit Suisse First Boston and Kaplan Associates. Each of the principals at Feldman Financial Advisors has more than 35 years of experience in consulting and all were officers of their prior firm. Our senior staff collectively has worked with more than 1,000 commercial banks, savings institutions, credit unions, insurance companies, and mortgage companies nationwide. The firm’s office is located outside of Washington, D.C. in McLean, Virginia.
Background of Senior Professional Staff
Trent Feldman – President. Trent is a nationally recognized expert in providing strategic advice to and valuing service companies, and advising on mergers and acquisitions. Trent was with Kaplan Associates for 14 years and was one of three founding principals at that firm. He also has worked at the Federal Home Loan Bank Board and with the California legislature. Trent holds Bachelor’s and Master’s Degrees from the University of California, Los Angeles.
Peter Williams – Principal. Peter specializes in merger and acquisition analysis, mutual-to-stock conversion valuations, corporate valuations, strategic business plans, and fair value accounting analysis. Peter previously was with Kaplan Associates for 13 years. He also served as a Corporate Planning Analyst with the Wilmington Trust Company in Delaware. Peter holds a BA in Economics from Yale University and an MBA in Finance and Investments from George Washington University.
I-1
FELDMAN FINANCIAL ADVISORS, INC.
Exhibit II-1
Consolidated Balance Sheets
First Seacoast Bancorp
As of December 31, 2020 and 2021 and June 30, 2022
(Dollars in Thousands)
| June 30, | December 31, | |||||||||||
| 2022 | 2021 | 2020 | ||||||||||
Assets | ||||||||||||
Cash and due from banks | $ | 4,057 | $ | 6,638 | $ | 5,996 | ||||||
Interest-bearing time deposits with other banks | 996 | 1,245 | 2,488 | |||||||||
Securities available-for-sale, at fair value | 103,387 | 91,365 | 55,470 | |||||||||
Federal Home Loan Bank stock | 2,684 | 1,688 | 1,796 | |||||||||
Total loans | 385,601 | 376,641 | 368,142 | |||||||||
Less: Allowance for loan losses | (3,644 | ) | (3,590 | ) | (3,342 | ) | ||||||
|
|
|
|
|
| |||||||
Net loans | 381,957 | 373,051 | 364,800 | |||||||||
Premises and equipment, net | 4,401 | 4,566 | 5,078 | |||||||||
Bank-owned life insurance | 4,502 | 4,461 | 4,356 | |||||||||
Accrued interest receivable | 1,646 | 1,499 | 1,412 | |||||||||
Other assets | 6,616 | 2,561 | 1,666 | |||||||||
|
|
|
|
|
| |||||||
Total Assets | $ | 510,246 | $ | 487,074 | $ | 443,062 | ||||||
|
|
|
|
|
| |||||||
Liabilities and Equity Capital | ||||||||||||
Deposits: | ||||||||||||
Non-interest bearing deposits | $ | 91,700 | $ | 98,624 | $ | 64,571 | ||||||
Interest-bearing deposits | 296,168 | 294,619 | 262,810 | |||||||||
|
|
|
|
|
| |||||||
Total Deposits | 387,868 | 393,243 | 327,381 | |||||||||
Federal Home Loan Bank advances | 64,250 | 29,462 | 34,127 | |||||||||
Federal Reserve Bank advances | — | — | 18,195 | |||||||||
Mortgagors’ tax escrow | 725 | 652 | 1,420 | |||||||||
Deferred compensation liability | 1,650 | 1,729 | 1,667 | |||||||||
Other liabilities | 3,881 | 1,520 | 1,411 | |||||||||
|
|
|
|
|
| |||||||
Total Liabilities | 458,374 | 426,606 | 384,201 | |||||||||
|
|
|
|
|
| |||||||
Common stock | 62 | 62 | 61 | |||||||||
Additional paid-in capital | 26,785 | 26,783 | 25,606 | |||||||||
Retained earnings | 37,385 | 36,813 | 34,192 | |||||||||
Accumulated other comprehensive income (loss) | (8,083 | ) | 721 | 1,381 | ||||||||
Treasury stock, at cost | (1,371 | ) | (748 | ) | (233 | ) | ||||||
Unearned stock compensation | (2,906 | ) | (3,163 | ) | (2,146 | ) | ||||||
|
|
|
|
|
| |||||||
Total Stockholders’ Equity | 51,872 | 60,468 | 58,861 | |||||||||
|
|
|
|
|
| |||||||
Total Liabilities and Stockholders’ Equity | $ | 510,246 | $ | 487,074 | $ | 443,062 | ||||||
|
|
|
|
|
| |||||||
Source: First Seacoast Bancorp, financial statements.
II-1
FELDMAN FINANCIAL ADVISORS, INC.
Exhibit II-2
Consolidated Income Statements
First Seacoast Bancorp
For the Years Ended December 31, 2020 and 2021
And the Six Months Ended June 30, 2021 and 2022
(Dollars in Thousands)
| Six Months Ended June 30, | Year Ended December 31, | |||||||||||||||
| 2022 | 2021 | 2021 | 2020 | |||||||||||||
Total interest and dividend income | $ | 7,922 | $ | 7,813 | $ | 15,495 | $ | 15,850 | ||||||||
Total interest expense | 391 | 512 | 1,235 | 3,174 | ||||||||||||
|
|
|
|
|
|
|
| |||||||||
Net interest and dividend income | 7,531 | 7,301 | 14,260 | 12,676 | ||||||||||||
Provision for loan losses | 60 | 85 | 205 | 480 | ||||||||||||
|
|
|
|
|
|
|
| |||||||||
Net interest income after provision | 7,471 | 7,216 | 14,055 | 12,196 | ||||||||||||
Non-interest income | ||||||||||||||||
Customer service fees | 462 | 489 | 1,007 | 979 | ||||||||||||
Gain on sale of loans | 2 | 88 | 130 | 323 | ||||||||||||
Securities gains, net | 52 | 535 | 535 | 410 | ||||||||||||
Income from bank-owned life insurance | 40 | 40 | 105 | 89 | ||||||||||||
Loan servicing fee income (loss) | 89 | 84 | 163 | (3 | ) | |||||||||||
Investment services fees | 176 | 118 | 247 | 198 | ||||||||||||
Other income | 19 | 25 | 62 | 50 | ||||||||||||
|
|
|
|
|
|
|
| |||||||||
Total non-interest income | 840 | 1,379 | 2,249 | 2,046 | ||||||||||||
Non-interest expense | ||||||||||||||||
Salaries and employee benefits | 4,677 | 3,751 | 7,833 | 8,069 | ||||||||||||
Director compensation | 137 | 128 | 259 | 269 | ||||||||||||
Occupancy and equipment expense | 629 | 618 | 1,185 | 1,247 | ||||||||||||
Marketing | 149 | 201 | 361 | 364 | ||||||||||||
Data processing | 724 | 671 | 1,407 | 1,166 | ||||||||||||
Professional fees and assessments | 515 | 481 | 834 | 891 | ||||||||||||
Debit card fees | 86 | 91 | 196 | 218 | ||||||||||||
Other expenses | 698 | 484 | 1,007 | 963 | ||||||||||||
|
|
|
|
|
|
|
| |||||||||
Total non-interest expense | 7,615 | 6,425 | 13,082 | 13,187 | ||||||||||||
Income before income tax expense | 696 | 2,170 | 3,222 | 1,055 | ||||||||||||
Income tax expense (benefit) | 124 | 429 | 601 | (24 | ) | |||||||||||
|
|
|
|
|
|
|
| |||||||||
Net income | $ | 572 | $ | 1,741 | $ | 2,621 | $ | 1,079 | ||||||||
|
|
|
|
|
|
|
| |||||||||
Source: First Seacoast Bancorp, financial statements.
II-2
FELDMAN FINANCIAL ADVISORS, INC.
Exhibit II-3
Loan Portfolio Composition
First Seacoast Bancorp
As of December 31, 2020 and 2021 and June 30, 2022
(Dollars in Thousands)
| June 30, | December 31, | |||||||||||||||||||||||
| 2022 | 2021 | 2020 | ||||||||||||||||||||||
| Amount | Percent | Amount | Percent | Amount | Percent | |||||||||||||||||||
Loan Types | (000s) | (%) | (000s) | (%) | (000s) | (%) | ||||||||||||||||||
One- to four-family residential | $ | 240,242 | 62.65 | $ | 234,199 | 62.45 | $ | 213,718 | 58.16 | |||||||||||||||
Commercial real estate | 77,349 | 20.60 | 72,057 | 20.60 | 66,166 | 20.60 | ||||||||||||||||||
Multi-family real estate | 8,683 | 1.85 | 8,998 | 1.85 | 6,619 | 1.85 | ||||||||||||||||||
Acquisition, development, and land | 17,078 | 6.57 | 21,365 | 6.57 | 23,145 | 6.57 | ||||||||||||||||||
Commercial business | 24,641 | 5.91 | 26,851 | 5.91 | 45,262 | 5.91 | ||||||||||||||||||
Home equity loans and lines | 9,201 | 5.04 | 6,947 | 5.04 | 9,583 | 5.04 | ||||||||||||||||||
Consumer | 6,246 | 0.42 | 4,574 | 0.42 | 2,944 | 0.42 | ||||||||||||||||||
|
|
|
|
|
|
|
|
|
|
|
| |||||||||||||
Total loans | 383,440 | 100.00 | 374,991 | 100.00 | 367,437 | 100.00 | ||||||||||||||||||
|
|
|
|
|
|
|
|
|
|
|
| |||||||||||||
Net deferred loan costs | 2,161 | (0.56 | ) | 1,650 | (0.44 | ) | 705 | (0.19 | ) | |||||||||||||||
Allowance for loan losses | (3,644 | ) | (0.95 | ) | (3,590 | ) | (0.96 | ) | (3,342 | ) | (0.91 | ) | ||||||||||||
|
|
|
|
|
| |||||||||||||||||||
Net loans | $ | 381,957 | $ | 373,051 | $ | 364,800 | ||||||||||||||||||
|
|
|
|
|
| |||||||||||||||||||
Source: First Seacoast Bancorp, offering prospectus.
II-3
FELDMAN FINANCIAL ADVISORS, INC.
Exhibit II-4
Cash and Investments Composition
First Seacoast Bancorp
As of December 31, 2020 and 2021 and June 30, 2022
(Dollars in Thousands)
| June 30, | December 31, | |||||||||||||||||||||||
| 2022 | 2021 | 2020 | ||||||||||||||||||||||
| Amount | Percent | Amount | Percent | Amount | Percent | |||||||||||||||||||
Cash and Investments | (000s) | (%) | (000s) | (%) | (000s) | (%) | ||||||||||||||||||
Cash and due from banks | $ | 4,057 | 3.65 | $ | 6,638 | 6.58 | $ | 5,996 | 9.12 | |||||||||||||||
Interest-bearing time deposits | 996 | 0.90 | 1,245 | 1.23 | 2,488 | 3.78 | ||||||||||||||||||
|
|
|
|
|
|
|
|
|
|
|
| |||||||||||||
Total cash and liquidity | 5,053 | 4.55 | 7,883 | 7.81 | 8,484 | 12.90 | ||||||||||||||||||
Secs. available-for-sale, at fair value: |
| |||||||||||||||||||||||
U.S. Government-sponsored enterprises obligations | 5,841 | 5.26 | 5,971 | 5.92 | 973 | 1.48 | ||||||||||||||||||
U.S. Government agency pools guaranteed by SBA | 9,428 | 8.48 | 5,045 | 5.00 | 2,470 | 3.76 | ||||||||||||||||||
Collateralized mortgage obligations issued by GSEs | 5,893 | 5.30 | 3,332 | 3.30 | 949 | 1.44 | ||||||||||||||||||
Residential mortgage-backed securities | 24,284 | 21.85 | 23,332 | 23.12 | 5,136 | 7.81 | ||||||||||||||||||
Municipal bonds | 53,299 | 47.96 | 50,613 | 50.14 | 45,942 | 69.87 | ||||||||||||||||||
Corporate subordinated debt | 4,642 | 4.18 | 3,072 | 3.04 | — | — | ||||||||||||||||||
|
|
|
|
|
|
|
|
|
|
|
| |||||||||||||
Total secs. available-for-sale | 103,387 | 93.04 | 91,365 | 90.52 | 55,470 | 84.37 | ||||||||||||||||||
Other investments: | ||||||||||||||||||||||||
Federal Home Loan Bank stock | 2,684 | 2.42 | 1,688 | 1.67 | 1,796 | 2.73 | ||||||||||||||||||
|
|
|
|
|
|
|
|
|
|
|
| |||||||||||||
Total cash and investments | $ | 111,124 | 100.00 | $ | 100,936 | 100.00 | $ | 65,750 | 100.00 | |||||||||||||||
|
|
|
|
|
|
|
|
|
|
|
| |||||||||||||
Source: First Seacoast Bancorp, offering prospectus.
II-4
FELDMAN FINANCIAL ADVISORS, INC.
Exhibit II-5
Deposit Account Composition
First Seacoast Bancorp
As of December 31, 2020 and 2021 and June 30, 2022
(Dollars in Thousands)
| June 30, | December 31, | |||||||||||||||||||||||
| 2022 | 2021 | 2020 | ||||||||||||||||||||||
| Amount | Percent | Amount | Percent | Amount | Percent | |||||||||||||||||||
Deposit Types | (000s) | (%) | (000s) | (%) | (000s) | (%) | ||||||||||||||||||
Non-interest bearing deposits | $ | 91,700 | 23.64 | $ | 98,624 | 25.08 | $ | 64,571 | 19.72 | |||||||||||||||
NOW and demand deposits | 113,541 | 29.27 | 107,611 | 27.37 | 96,765 | 29.56 | ||||||||||||||||||
Money market deposits | 63,736 | 16.43 | 71,317 | 18.14 | 69,320 | 21.17 | ||||||||||||||||||
Savings deposits | 64,075 | 16.52 | 57,365 | 14.59 | 48,057 | 14.68 | ||||||||||||||||||
Certificates of deposit | 54,816 | 14.13 | 58,326 | 14.83 | 48,668 | 14.87 | ||||||||||||||||||
|
|
|
|
|
|
|
|
|
|
|
| |||||||||||||
Total Deposits | $ | 387,868 | 100.00 | $ | 393,243 | 100.00 | $ | 327,381 | 100.00 | |||||||||||||||
|
|
|
|
|
|
|
|
|
|
|
| |||||||||||||
Source: First Seacoast Bancorp, offering prospectus.
II-5
FELDMAN FINANCIAL ADVISORS, INC.
Exhibit II-6
Borrowed Funds Activity
First Seacoast Bancorp
As of or for the Year Ended December 31, 2020 and 2021
And the Six Months Ended June 30, 2021 and 2022
(Dollars in Thousands)
| Six Months Ended | Year Ended | |||||||||||||||
| June 30, | December 31, | |||||||||||||||
| 2022 | 2022 | 2021 | 2020 | |||||||||||||
Borrowings outstanding at end of period | $ | 64,250 | $ | 43,271 | $ | 29,462 | $ | 52,322 | ||||||||
Average borrowings outstanding during the period | 46,928 | 43,758 | 41,220 | 71,076 | ||||||||||||
Weighted average interest rate during the period | 0.61 | % | 0.84 | % | 1.57 | % | 2.33 | % | ||||||||
Source: First Seacoast Bancorp, offering prospectus.
II-6
FELDMAN FINANCIAL ADVISORS, INC.
Exhibit II-7
Office Properties
First Seacoast Bancorp
As of June 30, 2022
(Dollars in Thousands)
Location | Leased or Owned | Year Acquired or Leased | Net Book Value (000s) | |||||||||
Main Office | ||||||||||||
633 Central Avenue Dover, NH 03820 | Owned | 1890 | $ | 1,353 | ||||||||
Branch Offices | ||||||||||||
6 Eastern Avenue Barrington, NH 03825 | Owned | 1974 | 952 | |||||||||
7A Mill Road Durham, NH 03824 | Leased | 1979 | 27 | |||||||||
1650 Woodbury Avenue Portsmouth, NH 03801 | Owned | 1987 | 929 | |||||||||
17 Wakefield Street Rochester, NH 03867 | Owned | 2009 | 1,139 | |||||||||
Source: First Seacoast Bancorp, offering prospectus.
II-7
FELDMAN FINANCIAL ADVISORS, INC.
Exhibit III
Financial and Market Data for All Public Thrifts
| Total | Tang. | Closing | Total | Price/ | Price/ | Price/ | Price/ | Price/ | ||||||||||||||||||||||||||||||||||||||||||||||||||||
| Total | Equity/ | Equity/ | LTM | LTM | Price | Market | LTM | Core | Book | Tang. | Total | Div. | ||||||||||||||||||||||||||||||||||||||||||||||||
| Assets | Assets | Assets | ROA | ROE | 8/26/22 | Value | EPS | EPS | Value | Book | Assets | Yield | ||||||||||||||||||||||||||||||||||||||||||||||||
Company | State | Ticker | ($Mil.) | (%) | (%) | (%) | (%) | ($) | ($Mil.) | (x) | (x) | (%) | (%) | (%) | (%) | |||||||||||||||||||||||||||||||||||||||||||||
All Public Thrifts (1) | ||||||||||||||||||||||||||||||||||||||||||||||||||||||||||||
1895 Bancorp of Wisconsin, Inc. | WI | BCOW | 536 | 15.12 | 15.12 | (0.13 | ) | (0.86 | ) | 9.91 | 63.2 | NA | NA | 78.0 | 78.0 | 11.79 | 0.00 | |||||||||||||||||||||||||||||||||||||||||||
Affinity Bancshares, Inc. | GA | AFBI | 767 | 15.05 | 12.93 | 0.87 | 5.60 | 14.84 | 99.1 | 15.0 | 13.7 | 84.8 | 101.1 | 12.76 | 0.00 | |||||||||||||||||||||||||||||||||||||||||||||
Axos Financial, Inc. | NV | AX | 17,456 | 9.41 | 8.59 | 1.57 | 15.61 | 43.49 | 2,594.8 | 11.0 | 10.2 | 158.2 | 174.9 | 14.89 | 0.00 | |||||||||||||||||||||||||||||||||||||||||||||
Blue Foundry Bancorp | NJ | BLFY | 1,964 | 20.99 | 20.97 | (1.70 | ) | (8.01 | ) | 11.54 | 303.9 | NM | NM | 79.8 | 80.0 | 16.76 | 0.00 | |||||||||||||||||||||||||||||||||||||||||||
Broadway Financial Corporation | CA | BYFC | 1,224 | 23.26 | 21.43 | 0.15 | 1.03 | 1.13 | 53.7 | 56.5 | 19.9 | 61.7 | 78.3 | 7.73 | 0.00 | |||||||||||||||||||||||||||||||||||||||||||||
Capitol Federal Financial, Inc. | KS | CFFN | 9,476 | 11.94 | 11.83 | 0.79 | 6.88 | 9.41 | 1,274.8 | 15.2 | 15.0 | 115.5 | 116.7 | 13.79 | 3.61 | |||||||||||||||||||||||||||||||||||||||||||||
Carver Bancorp, Inc. | NY | CARV | 691 | 7.33 | 7.33 | 0.15 | 1.92 | 5.38 | 22.7 | 59.8 | 59.8 | 91.3 | 91.3 | 3.47 | 0.00 | |||||||||||||||||||||||||||||||||||||||||||||
Cincinnati Bancorp, Inc. | OH | CNNB | 282 | 14.14 | 14.10 | 0.26 | 1.74 | 15.25 | 45.2 | 66.3 | 35.1 | 113.4 | 113.7 | 16.03 | 0.00 | |||||||||||||||||||||||||||||||||||||||||||||
Cullman Bancorp, Inc. | AL | CULL | 384 | 25.70 | 25.70 | 0.67 | 2.47 | 11.35 | 84.1 | 33.4 | 21.7 | 85.2 | 85.2 | 21.89 | 1.06 | |||||||||||||||||||||||||||||||||||||||||||||
ESSA Bancorp, Inc. | PA | ESSA | 1,846 | 11.55 | 10.87 | 0.98 | 8.73 | 19.35 | 189.3 | 10.5 | 10.3 | 95.0 | 101.7 | 10.97 | 3.10 | |||||||||||||||||||||||||||||||||||||||||||||
FFBW, Inc. | WI | FFBW | 330 | 25.38 | NA | 0.59 | 2.41 | 12.47 | 72.2 | 36.7 | 34.6 | 89.3 | 89.6 | 22.67 | 0.00 | |||||||||||||||||||||||||||||||||||||||||||||
First Northwest Bancorp | WA | FNWB | 2,032 | 8.13 | 8.08 | 0.69 | 7.02 | 16.37 | 146.9 | 10.4 | 10.3 | 97.6 | 98.3 | 8.01 | 1.71 | |||||||||||||||||||||||||||||||||||||||||||||
FS Bancorp, Inc. | WA | FSBW | 2,399 | 9.28 | 9.05 | 1.35 | 12.41 | 30.38 | 231.0 | 8.3 | 8.3 | 105.4 | 108.4 | 9.78 | 2.63 | |||||||||||||||||||||||||||||||||||||||||||||
Generations Bancorp NY, Inc. | NY | GBNY | 370 | 10.56 | 10.18 | 0.38 | 3.37 | 11.11 | 27.0 | 18.2 | 15.2 | 69.2 | 72.1 | 7.31 | 0.00 | |||||||||||||||||||||||||||||||||||||||||||||
HarborOne Bancorp, Inc. | MA | HONE | 4,704 | 13.28 | 11.92 | 1.03 | 7.03 | 13.92 | 653.1 | 14.7 | 14.2 | 111.4 | 126.1 | 14.79 | 2.01 | |||||||||||||||||||||||||||||||||||||||||||||
Hingham Institution for Savings | MA | HIFS | 3,996 | 9.19 | 9.19 | 1.36 | 12.88 | 296.70 | 636.5 | 14.3 | 11.0 | 173.3 | 173.3 | 15.93 | 0.80 | |||||||||||||||||||||||||||||||||||||||||||||
HMN Financial, Inc. | MN | HMNF | 1,082 | 8.86 | 8.79 | 0.91 | 8.41 | 22.62 | 98.5 | 10.7 | 10.6 | 106.5 | 107.4 | 9.43 | 1.06 | |||||||||||||||||||||||||||||||||||||||||||||
Home Federal Bancorp, Inc. | LA | HFBL | 590 | 8.87 | 8.87 | 0.85 | 9.25 | 20.14 | 68.2 | 14.3 | 14.3 | 130.3 | 130.3 | 11.55 | 2.38 | |||||||||||||||||||||||||||||||||||||||||||||
HV Bancorp, Inc. | PA | HVBC | 571 | 7.22 | 7.22 | 0.49 | 6.55 | 21.49 | 48.2 | 16.4 | 18.1 | 116.9 | 116.9 | 8.44 | 0.00 | |||||||||||||||||||||||||||||||||||||||||||||
IF Bancorp, Inc. | IL | IROQ | 858 | 8.36 | 8.36 | 0.74 | 7.07 | 19.00 | 58.5 | 10.3 | 10.3 | 78.9 | 78.9 | 7.87 | 1.84 | |||||||||||||||||||||||||||||||||||||||||||||
Kearny Financial Corp. | NJ | KRNY | 7,720 | 11.58 | NA | 0.93 | 6.86 | 11.76 | 760.9 | 12.4 | 11.9 | 90.3 | 113.4 | 10.46 | 3.74 | |||||||||||||||||||||||||||||||||||||||||||||
Magyar Bancorp, Inc. | NJ | MGYR | 791 | 12.77 | 12.77 | 0.89 | 7.58 | 12.25 | 86.9 | 11.8 | 11.8 | 86.1 | 86.1 | 11.00 | 0.98 | |||||||||||||||||||||||||||||||||||||||||||||
Mid-Southern Bancorp, Inc. | IN | MSVB | 266 | 12.90 | 12.90 | 0.71 | 4.16 | 13.56 | 38.9 | 20.9 | 20.9 | 113.2 | 113.2 | 14.61 | 1.18 | |||||||||||||||||||||||||||||||||||||||||||||
New York Community Bancorp, Inc. | NY | NYCB | 63,093 | 10.82 | 7.25 | 1.05 | 8.95 | 10.08 | 4,698.8 | 8.1 | 7.8 | 74.4 | 120.7 | 7.51 | 6.75 | |||||||||||||||||||||||||||||||||||||||||||||
Northeast Community Bancorp, Inc. | NY | NECB | 1,222 | 20.98 | 20.94 | 1.18 | 5.69 | 12.86 | 192.4 | 14.3 | 13.2 | 82.1 | 82.4 | 17.23 | 1.87 | |||||||||||||||||||||||||||||||||||||||||||||
Northfield Bancorp, Inc. | NJ | NFBK | 5,647 | 12.67 | 12.02 | 1.14 | 8.47 | 15.03 | 727.6 | 11.5 | 11.6 | 102.3 | 108.6 | 12.96 | 3.46 | |||||||||||||||||||||||||||||||||||||||||||||
NSTS Bancorp, Inc. | IL | NSTS | 274 | 30.45 | 30.45 | (0.06 | ) | (0.26 | ) | 11.02 | 59.5 | NA | NA | 71.2 | 71.2 | 21.69 | 0.00 | |||||||||||||||||||||||||||||||||||||||||||
Ponce Financial Group, Inc. | NY | PDLB | 2,042 | 25.37 | 25.37 | 0.66 | 4.64 | 9.55 | 220.6 | 21.5 | NA | 80.6 | 80.6 | 12.99 | 0.00 | |||||||||||||||||||||||||||||||||||||||||||||
Provident Bancorp, Inc. | MA | PVBC | 1,788 | 13.42 | 13.42 | 1.16 | 8.41 | 14.52 | 253.0 | 12.5 | 12.2 | 107.2 | 107.2 | 14.39 | 1.10 | |||||||||||||||||||||||||||||||||||||||||||||
Provident Financial Holdings, Inc. | CA | PROV | 1,187 | 10.84 | 10.84 | 0.76 | 7.14 | 14.28 | 104.0 | 11.7 | 13.1 | 80.9 | 80.9 | 8.76 | 3.92 | |||||||||||||||||||||||||||||||||||||||||||||
Provident Financial Services, Inc. | NJ | PFS | 13,716 | 11.56 | 8.48 | 1.16 | 9.45 | 23.96 | 1,782.1 | 11.5 | 11.3 | 113.6 | 160.3 | 13.13 | 4.01 | |||||||||||||||||||||||||||||||||||||||||||||
III-1
FELDMAN FINANCIAL ADVISORS, INC.
Exhibit III (continued)
Financial and Market Data for All Public Thrifts
| Total | Tang. | Closing | Total | Price/ | Price/ | Price/ | Price/ | Price/ | ||||||||||||||||||||||||||||||||||||||||||||||||||||
| Total | Equity/ | Equity/ | LTM | LTM | Price | Market | LTM | Core | Book | Tang. | Total | Div. | ||||||||||||||||||||||||||||||||||||||||||||||||
| Assets | Assets | Assets | ROA | ROE | 8/26/22 | Value | EPS | EPS | Value | Book | Assets | Yield | ||||||||||||||||||||||||||||||||||||||||||||||||
Company | State | Ticker | ($Mil.) | (%) | (%) | (%) | (%) | ($) | ($Mil.) | (x) | (x) | (%) | (%) | (%) | (%) | |||||||||||||||||||||||||||||||||||||||||||||
Riverview Bancorp, Inc. | WA | RVSB | 1,698 | 9.10 | 7.60 | 1.21 | 12.90 | 7.10 | 162.9 | 7.6 | 7.8 | 100.9 | 122.8 | 9.18 | 3.38 | |||||||||||||||||||||||||||||||||||||||||||||
Sterling Bancorp, Inc. | MI | SBT | 2,504 | 13.39 | 13.39 | 0.70 | 6.08 | 6.06 | 307.9 | 14.8 | 24.5 | 91.8 | 91.8 | 12.30 | 0.00 | |||||||||||||||||||||||||||||||||||||||||||||
Territorial Bancorp Inc. | HI | TBNK | 2,180 | 11.74 | 11.74 | 0.81 | 6.72 | 21.34 | 187.7 | 11.2 | 12.0 | 76.1 | 76.1 | 8.93 | 4.31 | |||||||||||||||||||||||||||||||||||||||||||||
Third Coast Bancshares, Inc. | TX | TCBX | 3,358 | 8.99 | 8.47 | 0.28 | 2.74 | 19.35 | 257.9 | 31.2 | NA | 86.3 | 92.2 | 7.76 | 0.00 | |||||||||||||||||||||||||||||||||||||||||||||
Timberland Bancorp, Inc. | WA | TSBK | 1,888 | 11.35 | 10.59 | 1.24 | 10.80 | 26.75 | 220.7 | 10.0 | 9.9 | 103.0 | 111.4 | 11.69 | 3.29 | |||||||||||||||||||||||||||||||||||||||||||||
Triumph Bancorp, Inc. | TX | TBK | 5,956 | 14.68 | 10.62 | 2.02 | 13.93 | 65.59 | 1,588.5 | 14.2 | 14.1 | 193.4 | 287.2 | 27.14 | 0.00 | |||||||||||||||||||||||||||||||||||||||||||||
TrustCo Bank Corp NY | NY | TRST | 6,227 | 9.55 | 9.54 | 1.10 | 11.50 | 34.33 | 656.6 | 9.7 | 9.7 | 110.4 | 110.5 | 10.55 | 4.08 | |||||||||||||||||||||||||||||||||||||||||||||
Waterstone Financial, Inc. | WI | WSBF | 1,941 | 19.91 | 19.88 | 2.08 | 10.44 | 17.51 | 388.0 | 9.2 | 9.2 | 103.0 | 103.2 | 20.51 | 4.57 | |||||||||||||||||||||||||||||||||||||||||||||
Western New England Bancorp, Inc. | MA | WNEB | 2,577 | 8.35 | 7.82 | 0.91 | 10.49 | 8.69 | 193.9 | 8.4 | 8.4 | 90.7 | 97.4 | 7.57 | 2.76 | |||||||||||||||||||||||||||||||||||||||||||||
William Penn Bancorporation | PA | WMPN | 880 | 21.86 | 21.36 | 0.51 | 2.00 | 11.57 | 163.5 | 38.6 | 36.6 | 89.6 | 92.3 | 19.59 | 1.04 | |||||||||||||||||||||||||||||||||||||||||||||
WSFS Financial Corporation | DE | WSFS | 20,550 | 11.25 | 6.65 | 0.97 | 7.86 | 49.08 | 3,117.2 | 14.8 | 11.9 | 134.8 | 239.7 | 15.18 | 1.22 | |||||||||||||||||||||||||||||||||||||||||||||
Average | 4,740 | 13.74 | 12.82 | 0.80 | 6.62 | NA | 546.2 | 18.7 | 16.0 | 100.6 | 111.2 | 12.88 | 1.71 | |||||||||||||||||||||||||||||||||||||||||||||||
Median | 1,867 | 11.66 | 10.85 | 0.86 | 7.03 | NA | 190.9 | 14.2 | 12.0 | 93.4 | 102.5 | 12.05 | 1.14 | |||||||||||||||||||||||||||||||||||||||||||||||
| (1) | Public thrifts traded on NYSE, NYSE American, and NASDAQ stock markets; excludes companies subject to pending acquisitions or mutual holding company ownership. |
Source: S&P Global Market Intelligence; Feldman Financial.
III-2
FELDMAN FINANCIAL ADVISORS, INC.
Exhibit IV-1
Effect of MHC’s Assets on Minority Stock Ownership
Based on Financial Data as of June 30, 2022
(Dollars in Thousands)
Key Input Assumptions | ||||||||||||
Mid-Tier Holding Company Stockholders’ Equity | $ | 51,872 | Book | |||||||||
Aggregate Dividends Waived by MHC | $ | 0 | Waived Dividends | |||||||||
Pro Forma Market Value | $ | 59,735 | Value | |||||||||
Market Value of MHC Assets (other than stock in Mid-Tier) |
| $ | 100 | MHC Assets | ||||||||
Minority Ownership Interest | 44.8312 | % | Pct | |||||||||
Adjustment Factors | ||||||||||||
Step 1: To Account for Waiver of Dividends | = | (Book - Waived Dividends) x Pct | ||||||||||
| Book | ||||||||||||
| = | 44.8312 | % | ||||||||||
Step 2: To Account for MHC Assets | = | (Value - MHC Assets) x Step 1 | ||||||||||
| Value | ||||||||||||
| = | 44.7562 | % | ||||||||||
Current Ownership | ||||||||||||
Majority MHC Shares | = | 55.1688 | % | 3,345,925 | ||||||||
Minority Public Shares | = | 44.8312 | % | 2,718,966 | ||||||||
|
|
|
| |||||||||
| 100.0000 | % | 6,064,891 | ||||||||||
|
|
|
| |||||||||
Adjusted Ownership | ||||||||||||
Majority MHC Shares | = | 55.2438 | % | |||||||||
Minority Public Shares | = | 44.7562 | % | |||||||||
|
| |||||||||||
| 100.0000 | % | |||||||||||
|
| |||||||||||
IV-1
FELDMAN FINANCIAL ADVISORS, INC.
Exhibit IV-2
Pro Forma Assumptions for the Stock Offering
| 1. | The total amount of the net offering proceeds was fully invested at the beginning of the applicable period. |
| 2. | The net offering proceeds are invested to yield a return of 3.01%, which represented the yield on five-year U.S. Treasury securities at June 30, 2022. The effective combined federal and state income tax rate was assumed to be 20.0%, resulting in a net after-tax yield of 2.41%. |
| 3. | The Company has provided notice of its intent to withdraw as a participant from its defined benefit pension plan as of September 30, 2022. Based on an estimate provided by the plan administrator, the estimated total cost (pre-tax) to withdraw is $2.5 million. The Company intends to accrue for this amount during the quarter ending September 30, 2022. The actual cost could differ significantly from the estimated cost provided by the plan administrator. In performing our valuation analysis, we have taken into account this estimated charge of approximately $2.0 million on an after-tax basis as an adjustment to pro forma equity |
| 4. | It is assumed that 8.0% of the total shares of common stock to be sold in the Stock Offering will be acquired by the Company’s employee stock ownership plan (“ESOP”). Pro forma adjustments have been made to earnings and equity to reflect the impact of the ESOP. The annual expense is estimated based on a 25-year loan to the ESOP from the Company. No re-investment is assumed on proceeds used to fund the ESOP. |
| 5. | It is assumed that the Company’s restricted stock plan (“RSP”) will purchase in the open market a number of shares equal to 4.0% of the total shares sold in the Stock Offering. Also, it is assumed that these shares are acquired at the initial public offering price of $10.00 per share. Pro forma adjustments have been made to earnings and equity to reflect the impact of the RSP. The annual expense is estimated based on a five-year vesting period. No re-investment is assumed on proceeds used to fund the RSP. Stockholder approval of the RSP and purchases by the RSP may not occur earlier than six months after the completion of the Conversion and Stock Offering |
| 6. | It is assumed that an additional 10.0% of the total shares sold in the Stock Offering will be reserved for issuance by the Company’s stock option plan. Pro forma net income has been adjusted to reflect the expense associated with the granting of options at an assumed options value of $3.99 per share. It is further assumed that options for all shares reserved under the plan were granted at the beginning of the period and 25% were non-qualified options for income tax purposes, the options would vest at a rate of 20% per year, and compensation expense will be recognized on a straight-line basis over the five-year vesting period. Stockholder approval of the stock option plan may not occur earlier than six months after the completion of the Conversion and Stock Offering |
| 7. | The fair value of stock options has been estimated at $3.99 per option using the Black-Scholes option pricing model with the following assumptions: a grant-date share price and option exercise price of $10.00; dividend yield of 0.00%; an expected option life of 10 years; a risk-free interest rate of 2.98%; and a volatility rate of 23.33% based on a select index of publicly traded thrift institutions. |
| 8. | Fixed offering expenses are estimated at $1.3 million. As a variable component of offering expenses, sales commission expenses paid to the marketing agent equal 1.0% of the aggregate amount of stock sold in the Stock Offering with a minimum commission total of $300,000. |
| 9. | No effect has been given to withdrawals from deposit accounts for the purpose of purchasing common stock in the offering. |
| 10. | No effect has been given in the pro forma equity calculation for the assumed earnings on the net offering proceeds. |
IV-2
FELDMAN FINANCIAL ADVISORS, INC.
Exhibit IV-3
First Seacoast Bancorp
Pro Forma Fully Converted Valuation Range
Historical Financial Data as of June 30, 2022
(Dollars in Thousands, Except Per Share Data)
| MINIMUM | MIDPOINT | MAXIMUM | ||||||||||||||
Total shares outstanding | 100.0000 | % | 5,077,492 | 5,973,520 | 6,869,548 | |||||||||||
Shares sold in the offering | 55.2438 | % | 2,805,000 | 3,300,000 | 3,795,000 | |||||||||||
Shares issued in the exchange | 44.7562 | % | 2,272,492 | 2,673,520 | 3,074,548 | |||||||||||
Offering price | $ | 10.00 | $ | 10.00 | $ | 10.00 | ||||||||||
|
|
|
|
|
| |||||||||||
Exchange ratio | 0.8358 | 0.9833 | 1.1308 | |||||||||||||
|
|
|
|
|
| |||||||||||
Pro forma market value | $ | 50,775 | $ | 59,735 | $ | 68,695 | ||||||||||
|
|
|
|
|
| |||||||||||
Gross offering proceeds | $ | 28,050 | $ | 33,000 | $ | 37,950 | ||||||||||
Less: estimated offering expenses |
| (1,597 | ) | (1,627 | ) | (1,677 | ) | |||||||||
|
|
|
|
|
| |||||||||||
Net offering proceeds | 26,453 | 31,373 | 36,273 | |||||||||||||
Less: ESOP purchase | (2,244 | ) | (2,640 | ) | (3,036 | ) | ||||||||||
Less: RSP purchase | (1,122 | ) | (1,320 | ) | (1,518 | ) | ||||||||||
|
|
|
|
|
| |||||||||||
Net investable proceeds | $ | 23,087 | $ | 27,413 | $ | 31,719 | ||||||||||
|
|
|
|
|
| |||||||||||
Net Income - LTM ended 6/30/22 |
| $ | 1,452 | $ | 1,452 | $ | 1,452 | |||||||||
Pro forma income on net proceeds, after-tax |
| 556 | 660 | 764 | ||||||||||||
Pro forma income on MHC asset contribution |
| 2 | 2 | 2 | ||||||||||||
Pro forma ESOP adjustment | (72 | ) | (84 | ) | (97 | ) | ||||||||||
Pro forma RSP adjustment | (180 | ) | (211 | ) | (243 | ) | ||||||||||
Pro forma option adjustment | (213 | ) | (250 | ) | (288 | ) | ||||||||||
|
|
|
|
|
| |||||||||||
Pro forma net income | $ | 1,545 | $ | 1,569 | $ | 1,590 | ||||||||||
|
|
|
|
|
| |||||||||||
Pro forma earnings per share |
| $ | 0.33 | $ | 0.28 | $ | 0.25 | |||||||||
|
|
|
|
|
| |||||||||||
Core Earnings - LTM ended 6/30/22 |
| $ | 1,410 | $ | 1,410 | $ | 1,410 | |||||||||
Pro forma income on net proceeds, after-tax |
| 556 | 660 | 764 | ||||||||||||
Pro forma income on MHC asset contribution |
| 2 | 2 | 2 | ||||||||||||
Pro forma ESOP adjustment | (72 | ) | (84 | ) | (97 | ) | ||||||||||
Pro forma RSP adjustment | (180 | ) | (211 | ) | (243 | ) | ||||||||||
Pro forma option adjustment | (213 | ) | (250 | ) | (288 | ) | ||||||||||
|
|
|
|
|
| |||||||||||
Pro forma core earnings | $ | 1,503 | $ | 1,527 | $ | 1,548 | ||||||||||
|
|
|
|
|
| |||||||||||
Pro forma core earnings per share | $ | 0.32 | $ | 0.28 | $ | 0.24 | ||||||||||
|
|
|
|
|
| |||||||||||
Total Equity - 6/30/22 | $ | 51,872 | $ | 51,872 | $ | 51,872 | ||||||||||
Net offering proceeds | 26,453 | 31,373 | 36,273 | |||||||||||||
Plus: MHC asset contribution | 100 | 100 | 100 | |||||||||||||
Less: Pension plan withdrawal cost, after-tax |
| (1,961 | ) | (1,961 | ) | (1,961 | ) | |||||||||
Less: ESOP purchase | (2,244 | ) | (2,640 | ) | (3,036 | ) | ||||||||||
Less: RSP purchase | (1,122 | ) | (1,320 | ) | (1,518 | ) | ||||||||||
|
|
|
|
|
| |||||||||||
Pro forma total equity | $ | 73,098 | $ | 77,424 | $ | 81,730 | ||||||||||
|
|
|
|
|
| |||||||||||
Pro forma book value | $ | 14.40 | $ | 12.96 | $ | 11.90 | ||||||||||
|
|
|
|
|
| |||||||||||
Tangible Equity - 6/30/22 | $ | 51,556 | $ | 51,556 | $ | 51,556 | ||||||||||
Net offering proceeds | 26,453 | 31,373 | 36,273 | |||||||||||||
Plus: MHC asset contribution | 100 | 100 | 100 | |||||||||||||
Less: Pension plan withdrawal charge, after-tax |
| (1,961 | ) | (1,961 | ) | (1,961 | ) | |||||||||
Less: ESOP purchase | (2,244 | ) | (2,640 | ) | (3,036 | ) | ||||||||||
Less: RSP purchase | (1,122 | ) | (1,320 | ) | (1,518 | ) | ||||||||||
|
|
|
|
|
| |||||||||||
Pro forma tangible equity | $ | 72,782 | $ | 77,108 | $ | 81,414 | ||||||||||
|
|
|
|
|
| |||||||||||
Pro forma tangible book value |
| $ | 14.33 | $ | 12.91 | $ | 11.85 | |||||||||
|
|
|
|
|
| |||||||||||
IV-3
FELDMAN FINANCIAL ADVISORS, INC.
Exhibit IV-3 (continued)
First Seacoast Bancorp
Pro Forma Fully Converted Valuation Range
Historical Financial Data as of June 30, 2022
(Dollars in Thousands, Except Per Share Data)
| MINIMUM | MIDPOINT | MAXIMUM | ||||||||||||||
Total shares outstanding | 100.0000 | % | 5,077,492 | 5,973,520 | 6,869,548 | |||||||||||
Shares sold in the offering | 55.2438 | % | 2,805,000 | 3,300,000 | 3,795,000 | |||||||||||
Shares issued in the exchange | 44.7562 | % | 2,272,492 | 2,673,520 | 3,074,548 | |||||||||||
Offering price | $ | 10.00 | $ | 10.00 | $ | 10.00 | ||||||||||
|
|
|
|
|
| |||||||||||
Exchange ratio | 0.8358 | 0.9833 | 1.1308 | |||||||||||||
|
|
|
|
|
| |||||||||||
Pro forma market value | $ | 50,775 | $ | 59,735 | $ | 68,695 | ||||||||||
|
|
|
|
|
| |||||||||||
Gross offering proceeds | $ | 28,050 | $ | 33,000 | $ | 37,950 | ||||||||||
Less: estimated offering expenses |
| (1,597 | ) | (1,627 | ) | (1,677 | ) | |||||||||
|
|
|
|
|
| |||||||||||
Net offering proceeds | 26,453 | 31,373 | 36,273 | |||||||||||||
Less: ESOP purchase | (2,244 | ) | (2,640 | ) | (3,036 | ) | ||||||||||
Less: RSP purchase | (1,122 | ) | (1,320 | ) | (1,518 | ) | ||||||||||
|
|
|
|
|
| |||||||||||
Net investable proceeds | $ | 23,087 | $ | 27,413 | $ | 31,719 | ||||||||||
|
|
|
|
|
| |||||||||||
Total Assets - 6/30/22 | $ | 510,276 | $ | 510,276 | $ | 510,276 | ||||||||||
Net offering proceeds | 26,453 | 31,373 | 36,273 | |||||||||||||
Plus: MHC asset contribution | 100 | 100 | 100 | |||||||||||||
Less: Pension plan withdrawal charge, after-tax |
| (1,961 | ) | (1,961 | ) | (1,961 | ) | |||||||||
Less: ESOP purchase | (2,244 | ) | (2,640 | ) | (3,036 | ) | ||||||||||
Less: RSP purchase | (1,122 | ) | (1,320 | ) | (1,518 | ) | ||||||||||
|
|
|
|
|
| |||||||||||
Pro forma total assets | $ | 531,502 | $ | 535,828 | $ | 540,134 | ||||||||||
|
|
|
|
|
| |||||||||||
Pro Forma Ratios: | ||||||||||||||||
Price / LTM EPS | 30.30 | x | 35.71 | x | 40.00 | x | ||||||||||
Price / Core EPS | 31.25 | x | 35.71 | x | 41.67 | x | ||||||||||
Price / Book Value | 69.44 | % | 77.16 | % | 84.03 | % | ||||||||||
Price / Tangible Book Value | 69.78 | % | 77.46 | % | 84.39 | % | ||||||||||
Price / Total Assets | 9.55 | % | 11.15 | % | 12.72 | % | ||||||||||
Total Equity / Assets | 13.75 | % | 14.45 | % | 15.13 | % | ||||||||||
Tangible Equity / Assets | 13.70 | % | 14.40 | % | 15.08 | % | ||||||||||
IV-4
FELDMAN FINANCIAL ADVISORS, INC.
Exhibit IV-4
Pro Forma Fully Converted Analysis at the Midpoint Valuation
First Seacoast Bancorp
Historical Financial Data as of June 30, 2022
Valuation Parameters | Symbol | Data | ||||
Net income — LTM | Y | $ | 1,452,000 | |||
Core earnings — LTM | Y | 1,410,000 | ||||
Net worth | B | 51,872,000 | ||||
Tangible net worth | B | 51,556,000 | ||||
Total assets | A | 510,276,000 | ||||
MHC capital contribution | C | 100,000 | ||||
Defined benefit pension plan charge | D | 1,961,000 | ||||
Expenses in conversion | X | 1,627,000 | ||||
Other proceeds not reinvested | O | 3,860,000 | ||||
Percent of shares sold in offering | PCT | 55.2438 | % | |||
ESOP purchase | E | 2,640,000 | ||||
ESOP expense (pre-tax) | F | 105,000 | ||||
RSP purchase | G | 1,320,000 | ||||
RSP expense (pre-tax) | H | 264,000 | ||||
Stock option expense (pre-tax) | J | 263,000 | ||||
Option expense tax-deductible | K | 25.00 | % | |||
Re-investment rate (after-tax) | R | 2.41 | % | |||
Tax rate | T | 20.00 | % | |||
Shares for EPS | S | 92.55 | % | |||
Pro Forma Valuation Ratios at Midpoint Value | ||||||
Price / LTM EPS | P/E | 35.71 | x | |||
Price / Core EPS | P/E | 35.71 | x | |||
Price / Book Value | P/B | 77.16 | % | |||
Price / Tangible Book | P/TB | 77.46 | % | |||
Price / Assets | P/A | 11.15 | % | |||
Pro Forma Calculation at Midpoint Value | Based on | |||||||||||
V | = | (P/E / S)*((Y-R*(O+X)-(F+H)*(1-T)-(J-J*K*T))) | = | $ | 59,735,200 | [LTM earnings] | ||||||
| 1 - (P/E / S) * PCT * R | ||||||||||||
V | = | (P/E / S)*((Y-R*(O+X)-(F+H)*(1-T)-(J-J*K*T))) | = | $ | 59,735,200 | [Core earnings] | ||||||
| 1 - (P/E / S) * R | ||||||||||||
V | = | P/B * (B + C - D - E - G) | = | $ | 59,735,200 | [Book value] | ||||||
| 1 - (P/B * PCT) | ||||||||||||
V | = | P/TB * (B + C - D - E - G) | = | $ | 59,735,200 | [Tangible book] | ||||||
| 1 - (P/TB * PCT) | ||||||||||||
V | = | P/A * (B + C - D - E - G) | = | $ | 59,735,200 | [Total assets] | ||||||
| 1 - (P/A * PCT) | ||||||||||||
Pro Forma Valuation Range | ||||||||||||||||||||||
Minimum | = | $ | 59,735,200 | x | 0.85 | = | $ | 50,774,920 | ||||||||||||||
Midpoint | = | $ | 59,735,200 | x | 1.00 | = | $ | 59,735,200 | ||||||||||||||
Maximum | = | $ | 59,735,200 | x | 1.15 | = | $ | 68,695,480 | ||||||||||||||
IV-5
FELDMAN FINANCIAL ADVISORS, INC.
Exhibit IV-5
Comparative Valuation Ratio Differential
Pro Forma Fully Converted Valuation
Based on Market Price Data as of August 26, 2022
| First | Comparative | All Public | ||||||||||||||||||||||
| Valuation | Seacoast | Group | Thrifts (1) | |||||||||||||||||||||
Ratio | Symbol | Bancorp | Average | Median | Average | Median | ||||||||||||||||||
Price / LTM EPS | P/E | 26.8 | 19.5 | 18.7 | 14.2 | |||||||||||||||||||
Minimum | (x) | 32.3 | 20.5 | % | 65.6 | % | 72.7 | % | 1.3 | |||||||||||||||
Midpoint | 37.0 | 38.1 | % | 89.7 | % | 97.9 | % | 1.6 | ||||||||||||||||
Maximum | 41.7 | 55.6 | % | 113.8 | % | 123.0 | % | 1.9 | ||||||||||||||||
Price / Core EPS | P/E | 21.8 | 19.5 | 16.0 | 12.0 | |||||||||||||||||||
Minimum | (x) | 32.3 | 48.2 | % | 65.6 | % | 101.9 | % | 169.2 | % | ||||||||||||||
Midpoint | 38.5 | 76.6 | % | 97.4 | % | 140.6 | % | 220.8 | % | |||||||||||||||
Maximum | 43.5 | 99.5 | % | 123.1 | % | 171.9 | % | 262.5 | % | |||||||||||||||
Price / Book Value | P/B | 92.7 | 87.7 | 100.6 | 93.4 | |||||||||||||||||||
Minimum | (%) | 69.4 | -25.1 | % | -20.9 | % | -31.0 | % | -25.7 | % | ||||||||||||||
Midpoint | 77.2 | -16.7 | % | -12.0 | % | -23.3 | % | -17.3 | % | |||||||||||||||
Maximum | 84.0 | -9.4 | % | -4.2 | % | -16.5 | % | -10.1 | % | |||||||||||||||
Price / Tangible Book | P/TB | 94.9 | 90.9 | 111.2 | 102.5 | |||||||||||||||||||
Minimum | (%) | 69.8 | -26.4 | % | -23.2 | % | -37.2 | % | -31.9 | % | ||||||||||||||
Midpoint | 77.5 | -18.3 | % | -14.7 | % | -30.3 | % | -24.4 | % | |||||||||||||||
Maximum | 84.4 | -11.1 | % | -7.2 | % | -24.1 | % | -17.7 | % | |||||||||||||||
Price / Total Assets | P/A | 14.22 | 13.68 | 12.88 | 12.05 | |||||||||||||||||||
Minimum | (%) | 9.55 | -32.4 | % | -29.9 | % | -25.6 | % | -20.0 | % | ||||||||||||||
Midpoint | 11.15 | -21.8 | % | -19.0 | % | -14.0 | % | -7.5 | % | |||||||||||||||
Maximum | 12.72 | -10.6 | % | -7.3 | % | -1.6 | % | 5.8 | % | |||||||||||||||
| (1) | Excludes companies subject to mutual holding company ownership or pending acquisition. |
IV-6