Willow Tree Capital Fund, LLC (A DELAWARE LIMITED LIABILITY COMPANY) CONSOLIDATED FINANCIAL STATEMENTS FOR THE PERIOD FROM JANUARY 25, 2024 (COMMENCEMENT OF OPERATIONS) TO JUNE 30, 2024
Willow Tree Capital Fund, LLC TABLE OF CONTENTS Report of the Independent Auditors Consolidated Financial Statements Consolidated Statement of Assets, Liabilities and Members’ Equity 3 Consolidated Schedule of Investments 4 Consolidated Statement of Operations 7 Consolidated Statement of Changes in Members’ Equity 8 Consolidated Statement of Cash Flows 9 Notes to Consolidated Financial Statements 10 1
PricewaterhouseCoopers LLP, 300 Madison Avenue, New York, NY 10017-6204 T: (646) 471 3000, www.pwc.com/us Report of Independent Auditors To the Managing Member of Willow Tree Capital Fund, LLC Opinion We have audited the accompanying consolidated financial statements of Willow Tree Capital Fund, LLC and its subsidiary (the “Fund”), which comprise the consolidated statement of assets, liabilities and members’ equity, including the consolidated schedule of investments, as of June 30, 2024 and the related consolidated statements of operations, of changes in members’ equity and of cash flows, including the related notes for the period from January 25, 2024 (commencement of operations) to June 30, 2024 (collectively referred to as the "consolidated financial statements"). In our opinion, the accompanying consolidated financial statements present fairly, in all material respects, the financial position of the Fund as of June 30, 2024, and the results of its operations, changes in its members’ equity, and its cash flows for the period from January 25, 2024 (commencement of operations) to June 30, 2024 in accordance with accounting principles generally accepted in the United States of America. Basis for Opinion We conducted our audit in accordance with auditing standards generally accepted in the United States of America (US GAAS). Our responsibilities under those standards are further described in the Auditors’ Responsibilities for the Audit of the Consolidated Financial Statements section of our report. We are required to be independent of the Fund and to meet our other ethical responsibilities, in accordance with the relevant ethical requirements relating to our audit. We believe that the audit evidence we have obtained is sufficient and appropriate to provide a basis for our audit opinion. Responsibilities of Management for the Consolidated Financial Statements Management is responsible for the preparation and fair presentation of the consolidated financial statements in accordance with accounting principles generally accepted in the United States of America, and for the design, implementation, and maintenance of internal control relevant to the preparation and fair presentation of consolidated financial statements that are free from material misstatement, whether due to fraud or error. In preparing the consolidated financial statements, management is required to evaluate whether there are conditions or events, considered in the aggregate, that raise substantial doubt about the Fund’s ability to continue as a going concern for one year after the date the consolidated financial statements are available to be issued. Auditors’ Responsibilities for the Audit of the Consolidated Financial Statements Our objectives are to obtain reasonable assurance about whether the consolidated financial statements as a whole are free from material misstatement, whether due to fraud or error, and to issue an auditors’ report that includes our opinion. Reasonable assurance is a high level of assurance but is not absolute assurance and therefore is not a guarantee that an audit conducted in accordance with US GAAS will always detect a material misstatement when it exists. The risk of not detecting a material misstatement resulting from fraud is higher than for one resulting from error, as fraud may involve collusion, forgery, intentional omissions, misrepresentations, or the override of internal control. Misstatements are

2 considered material if there is a substantial likelihood that, individually or in the aggregate, they would influence the judgment made by a reasonable user based on the consolidated financial statements. In performing an audit in accordance with US GAAS, we: ● Exercise professional judgment and maintain professional skepticism throughout the audit. ● Identify and assess the risks of material misstatement of the consolidated financial statements, whether due to fraud or error, and design and perform audit procedures responsive to those risks. Such procedures include examining, on a test basis, evidence regarding the amounts and disclosures in the consolidated financial statements. ● Obtain an understanding of internal control relevant to the audit in order to design audit procedures that are appropriate in the circumstances, but not for the purpose of expressing an opinion on the effectiveness of the Fund’s internal control. Accordingly, no such opinion is expressed. ● Evaluate the appropriateness of accounting policies used and the reasonableness of significant accounting estimates made by management, as well as evaluate the overall presentation of the consolidated financial statements. ● Conclude whether, in our judgment, there are conditions or events, considered in the aggregate, that raise substantial doubt about the Fund’s ability to continue as a going concern for a reasonable period of time. We are required to communicate with those charged with governance regarding, among other matters, the planned scope and timing of the audit, significant audit findings, and certain internal control-related matters that we identified during the audit. November 8, 2024

See accompanying notes to consolidated financial statements. 3 Willow Tree Capital Fund, LLC Consolidated Statement of Assets, Liabilities and Members’ Equity June 30, 2024 ASSETS Investments, at fair value (cost $112,331,411) $ 113,294,480 Cash 2,827,633 Deferred debt issuance costs 1,454,789 Receivable for investments 20,484 Interest receivable 778,891 Other assets 30,548 Total Assets $ 118,406,825 LIABILITIES Subscription and credit facility payable $ 49,479,117 Loans sold under agreement to repurchase 16,253,189 Interest payable 1,178,494 Due to affiliates 501,085 Incentive fees payable 273,725 Management fees payable 109,233 Total Liabilities 67,794,843 Members’ Equity Managing member — Members (3,221,603 units issued and outstanding as of June 30, 2024) 50,611,982 Total Members’ Equity 50,611,982 Total Liabilities and Members’ Equity $ 118,406,825
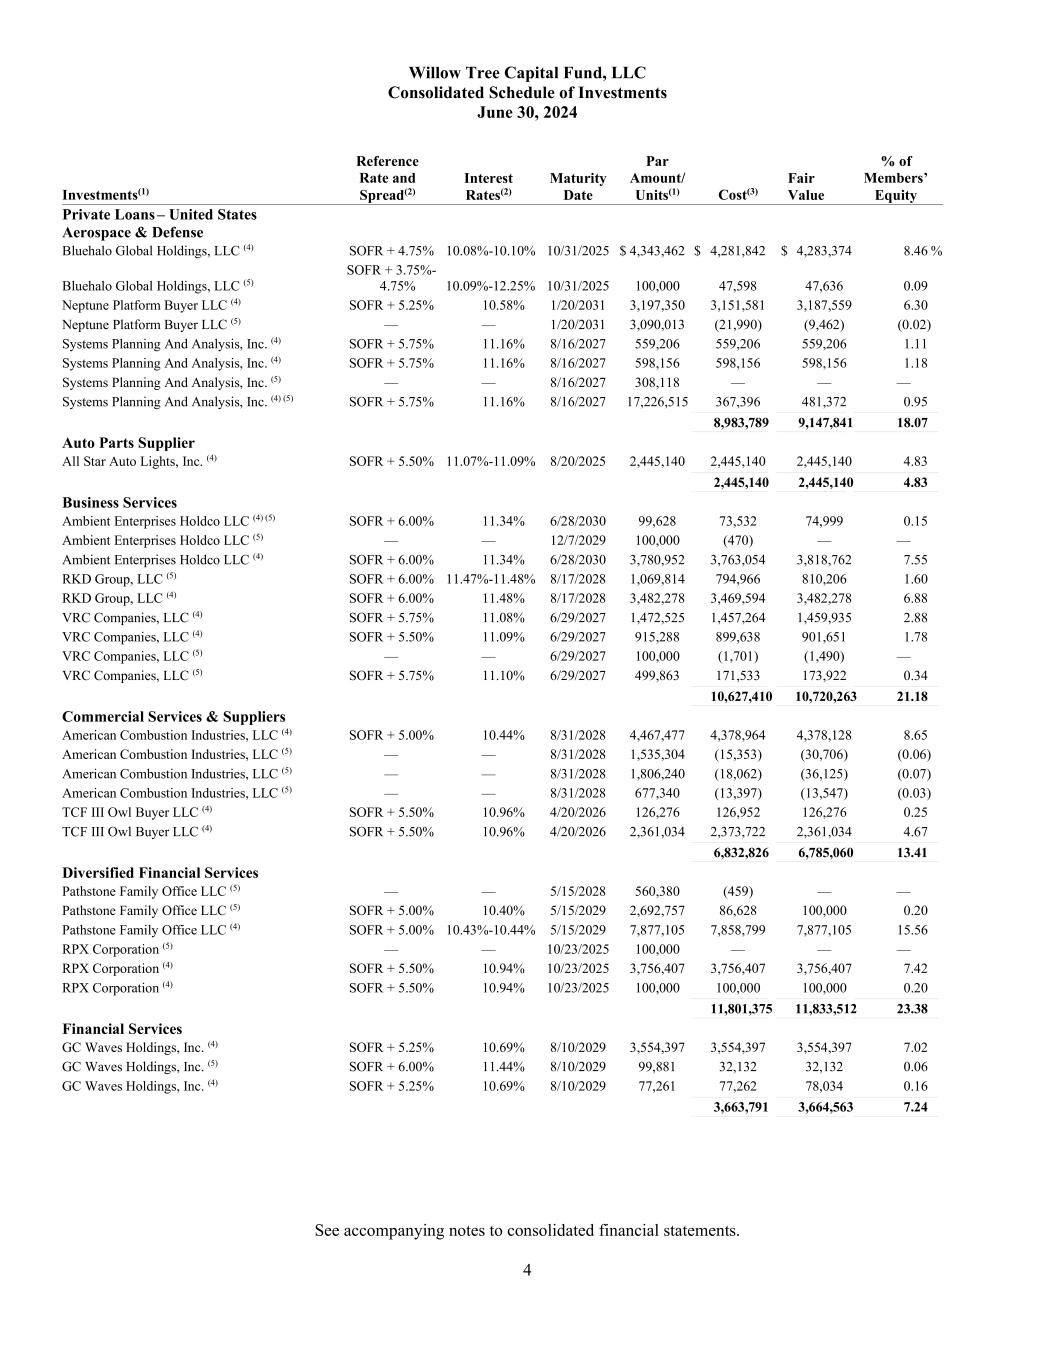
Willow Tree Capital Fund, LLC Consolidated Schedule of Investments June 30, 2024 See accompanying notes to consolidated financial statements. 4 Investments(1) Reference Rate and Spread(2) Interest Rates(2) Maturity Date Par Amount/ Units(1) Cost(3) Fair Value % of Members’ Equity Private Loans – United States Aerospace & Defense Bluehalo Global Holdings, LLC (4) SOFR + 4.75% 10.08%-10.10% 10/31/2025 $ 4,343,462 $ 4,281,842 $ 4,283,374 8.46 % Bluehalo Global Holdings, LLC (5) SOFR + 3.75%- 4.75% 10.09%-12.25% 10/31/2025 100,000 47,598 47,636 0.09 Neptune Platform Buyer LLC (4) SOFR + 5.25% 10.58% 1/20/2031 3,197,350 3,151,581 3,187,559 6.30 Neptune Platform Buyer LLC (5) — — 1/20/2031 3,090,013 (21,990) (9,462) (0.02) Systems Planning And Analysis, Inc. (4) SOFR + 5.75% 11.16% 8/16/2027 559,206 559,206 559,206 1.11 Systems Planning And Analysis, Inc. (4) SOFR + 5.75% 11.16% 8/16/2027 598,156 598,156 598,156 1.18 Systems Planning And Analysis, Inc. (5) — — 8/16/2027 308,118 — — — Systems Planning And Analysis, Inc. (4) (5) SOFR + 5.75% 11.16% 8/16/2027 17,226,515 367,396 481,372 0.95 _____________________________________________________________________________________________ ____________________________________________________________________________________ ______________________________________________________________________________________________________ 8,983,789 9,147,841 18.07 _____________________________________________________________________________________________ ____________________________________________________________________________________ ______________________________________________________________________________________________________ Auto Parts Supplier All Star Auto Lights, Inc. (4) SOFR + 5.50% 11.07%-11.09% 8/20/2025 2,445,140 2,445,140 2,445,140 4.83 _____________________________________________________________________________________________ ____________________________________________________________________________________ ______________________________________________________________________________________________________ 2,445,140 2,445,140 4.83 _____________________________________________________________________________________________ ____________________________________________________________________________________ ______________________________________________________________________________________________________ Business Services Ambient Enterprises Holdco LLC (4) (5) SOFR + 6.00% 11.34% 6/28/2030 99,628 73,532 74,999 0.15 Ambient Enterprises Holdco LLC (5) — — 12/7/2029 100,000 (470) — — Ambient Enterprises Holdco LLC (4) SOFR + 6.00% 11.34% 6/28/2030 3,780,952 3,763,054 3,818,762 7.55 RKD Group, LLC (5) SOFR + 6.00% 11.47%-11.48% 8/17/2028 1,069,814 794,966 810,206 1.60 RKD Group, LLC (4) SOFR + 6.00% 11.48% 8/17/2028 3,482,278 3,469,594 3,482,278 6.88 VRC Companies, LLC (4) SOFR + 5.75% 11.08% 6/29/2027 1,472,525 1,457,264 1,459,935 2.88 VRC Companies, LLC (4) SOFR + 5.50% 11.09% 6/29/2027 915,288 899,638 901,651 1.78 VRC Companies, LLC (5) — — 6/29/2027 100,000 (1,701) (1,490) — VRC Companies, LLC (5) SOFR + 5.75% 11.10% 6/29/2027 499,863 171,533 173,922 0.34 _____________________________________________________________________________________________ ____________________________________________________________________________________ ______________________________________________________________________________________________________ 10,627,410 10,720,263 21.18 _____________________________________________________________________________________________ ____________________________________________________________________________________ ______________________________________________________________________________________________________ Commercial Services & Suppliers American Combustion Industries, LLC (4) SOFR + 5.00% 10.44% 8/31/2028 4,467,477 4,378,964 4,378,128 8.65 American Combustion Industries, LLC (5) — — 8/31/2028 1,535,304 (15,353) (30,706) (0.06) American Combustion Industries, LLC (5) — — 8/31/2028 1,806,240 (18,062) (36,125) (0.07) American Combustion Industries, LLC (5) — — 8/31/2028 677,340 (13,397) (13,547) (0.03) TCF III Owl Buyer LLC (4) SOFR + 5.50% 10.96% 4/20/2026 126,276 126,952 126,276 0.25 TCF III Owl Buyer LLC (4) SOFR + 5.50% 10.96% 4/20/2026 2,361,034 2,373,722 2,361,034 4.67 _____________________________________________________________________________________________ ____________________________________________________________________________________ ______________________________________________________________________________________________________ 6,832,826 6,785,060 13.41 _____________________________________________________________________________________________ ____________________________________________________________________________________ ______________________________________________________________________________________________________ Diversified Financial Services Pathstone Family Office LLC (5) — — 5/15/2028 560,380 (459) — — Pathstone Family Office LLC (5) SOFR + 5.00% 10.40% 5/15/2029 2,692,757 86,628 100,000 0.20 Pathstone Family Office LLC (4) SOFR + 5.00% 10.43%-10.44% 5/15/2029 7,877,105 7,858,799 7,877,105 15.56 RPX Corporation (5) — — 10/23/2025 100,000 — — — RPX Corporation (4) SOFR + 5.50% 10.94% 10/23/2025 3,756,407 3,756,407 3,756,407 7.42 RPX Corporation (4) SOFR + 5.50% 10.94% 10/23/2025 100,000 100,000 100,000 0.20 _____________________________________________________________________________________________ ____________________________________________________________________________________ ______________________________________________________________________________________________________ 11,801,375 11,833,512 23.38 _____________________________________________________________________________________________ ____________________________________________________________________________________ ______________________________________________________________________________________________________ Financial Services GC Waves Holdings, Inc. (4) SOFR + 5.25% 10.69% 8/10/2029 3,554,397 3,554,397 3,554,397 7.02 GC Waves Holdings, Inc. (5) SOFR + 6.00% 11.44% 8/10/2029 99,881 32,132 32,132 0.06 GC Waves Holdings, Inc. (4) SOFR + 5.25% 10.69% 8/10/2029 77,261 77,262 78,034 0.16 _____________________________________________________________________________________________ ____________________________________________________________________________________ ______________________________________________________________________________________________________ 3,663,791 3,664,563 7.24 _____________________________________________________________________________________________ ____________________________________________________________________________________ ______________________________________________________________________________________________________

Willow Tree Capital Fund, LLC Consolidated Schedule of Investments (continued) June 30, 2024 See accompanying notes to consolidated financial statements. 5 Investments(1) Reference Rate and Spread(2) Interest Rates(2) Maturity Date Par Amount/ Units(1) Cost(3) Fair Value % of Members’ Equity Private Loans – United States (continued) Health Care Equipment & Supplies HLSG Intermediate, LLC (4) SOFR + 6.25% 11.71% 3/31/2028 $ 1,996,609 $ 1,996,609 $ 1,996,609 3.95 % HLSG Intermediate, LLC (4) SOFR + 6.25% 11.71% 3/31/2028 1,286,675 1,286,675 1,286,675 2.54 HLSG Intermediate, LLC (4) SOFR + 6.25% 11.71% 3/31/2028 64,887 64,887 64,887 0.13 % HLSG Intermediate, LLC (4) SOFR + 6.25% 11.71% 3/31/2028 34,696 34,696 34,696 0.07 HLSG Intermediate, LLC (5) SOFR + 6.25% 11.71% 3/31/2028 100,000 73,333 73,333 0.14 _____________________________________________________________________________________________ ____________________________________________________________________________________ ______________________________________________________________________________________________________ 3,456,200 3,456,200 6.83 _____________________________________________________________________________________________ ____________________________________________________________________________________ ______________________________________________________________________________________________________ Health Care Providers & Services Beacon Oral Specialists (5) — — 12/14/2026 5,000,000 (66,551) (48,513) (0.10) Dentive Capital, LLC (4) SOFR + 6.75% 12.08% 12/22/2028 225,797 221,749 223,430 0.44 Dentive Capital, LLC (4) SOFR + 6.75% 12.08% 12/22/2028 1,913,382 1,880,395 1,893,329 3.74 Dentive Capital, LLC (5) — — 12/22/2028 100,000 (1,720) (1,048) — Dentive Capital, LLC (5) SOFR + 6.75% 12.10% 12/23/2028 2,130,707 213,891 234,175 0.46 Dermcare Holdings, LLC SOFR + 6.75% 12.08% 10/16/2029 238,022 231,193 234,119 0.46 Dermcare Management, LLC (5) SOFR + 5.75% 11.18% 4/21/2028 6,525,951 1,507,754 1,634,098 3.23 LCM SDC Holdings, LLC SOFR + 13.25% 18.69% 2/15/2029 1,500,031 1,456,850 1,477,720 2.92 LCM SDC Holdings, LLC SOFR + 14.00% 18.69% 2/15/2029 1,215,140 1,182,710 1,197,066 2.37 LCM SDC Holdings, LLC SOFR + 13.25% 18.69% 2/15/2029 526,419 512,264 518,590 1.03 OPCO Borrower, LLC (4) SOFR + 6.00% 11.32% 8/19/2027 11,775,377 11,552,073 11,618,319 22.96 Salt Dental Collective, LLC (5) SOFR + 6.75% 12.19% 2/15/2028 3,630,436 1,988,180 2,011,382 3.97 Salt Dental Collective, LLC SOFR + 6.75% 12.19% 2/15/2028 6,418,843 6,294,081 6,396,208 12.64 Salt Dental Collective, LLC SOFR + 6.75% 12.19% 2/15/2028 3,712,500 3,640,449 3,699,408 7.31 Salt Dental Collective, LLC SOFR + 6.75% 12.19% 2/15/2029 422,854 414,647 421,362 0.83 Salt Dental Collective, LLC (4) SOFR + 6.75% 12.19% 2/15/2028 1,299,935 1,294,836 1,295,351 2.56 Salt Dental Collective, LLC SOFR + 6.75% 12.19% 2/15/2028 7,537,226 7,390,726 7,510,647 14.84 Salt Dental Collective, LLC (5) SOFR + 6.75% 12.19% 2/15/2028 933,333 310,719 307,820 0.61 Salt Dental Collective, LLC (4) SOFR + 6.75% 12.19% 2/15/2028 2,331,753 2,322,608 2,323,530 4.59 _____________________________________________________________________________________________ ____________________________________________________________________________________ ______________________________________________________________________________________________________ 42,346,854 42,946,993 84.86 _____________________________________________________________________________________________ ____________________________________________________________________________________ ______________________________________________________________________________________________________ Industrials Rogers Mechanical Contractors, LLC (5) — — 9/28/2028 977,250 (9,220) (4,691) (0.01) Rogers Mechanical Contractors, LLC (5) — — 9/28/2028 139,607 (2,635) (670) — Rogers Mechanical Contractors, LLC (4) SOFR + 6.25% 11.81% 9/28/2028 484,927 475,660 482,600 0.95 _____________________________________________________________________________________________ ____________________________________________________________________________________ ______________________________________________________________________________________________________ 463,805 477,239 0.94 _____________________________________________________________________________________________ ____________________________________________________________________________________ ______________________________________________________________________________________________________ Insurance Accession Risk Management Group, Inc. (5) — — 11/1/2029 100,000 (469) — — Accession Risk Management Group, Inc. (4) SOFR + 5.50% 10.98%-11.00% 11/1/2029 3,099,785 3,085,241 3,099,785 6.12 Accession Risk Management Group, Inc. (4) SOFR + 5.50% 10.98%-11.00% 11/1/2029 780,419 776,754 780,419 1.54 Higginbotham Insurance Agency, Inc. (4) SOFR + 5.50% 10.94% 11/24/2028 1,048,143 1,044,971 1,048,143 2.07 Higginbotham Insurance Agency, Inc. (4) SOFR + 5.50% 10.94% 11/24/2028 175,241 174,710 175,241 0.35 Higginbotham Insurance Agency, Inc. (4) SOFR + 5.50% 10.94% 11/24/2028 1,264,027 1,260,199 1,264,027 2.50 Peter C. Foy & Associates Insurance Services, LLC (4) SOFR + 5.50% 10.84% 11/1/2028 1,266,007 1,260,618 1,257,444 2.48 Peter C. Foy & Associates Insurance Services, LLC (4) SOFR + 5.50% 10.84% 11/1/2028 369,744 368,173 367,243 0.73
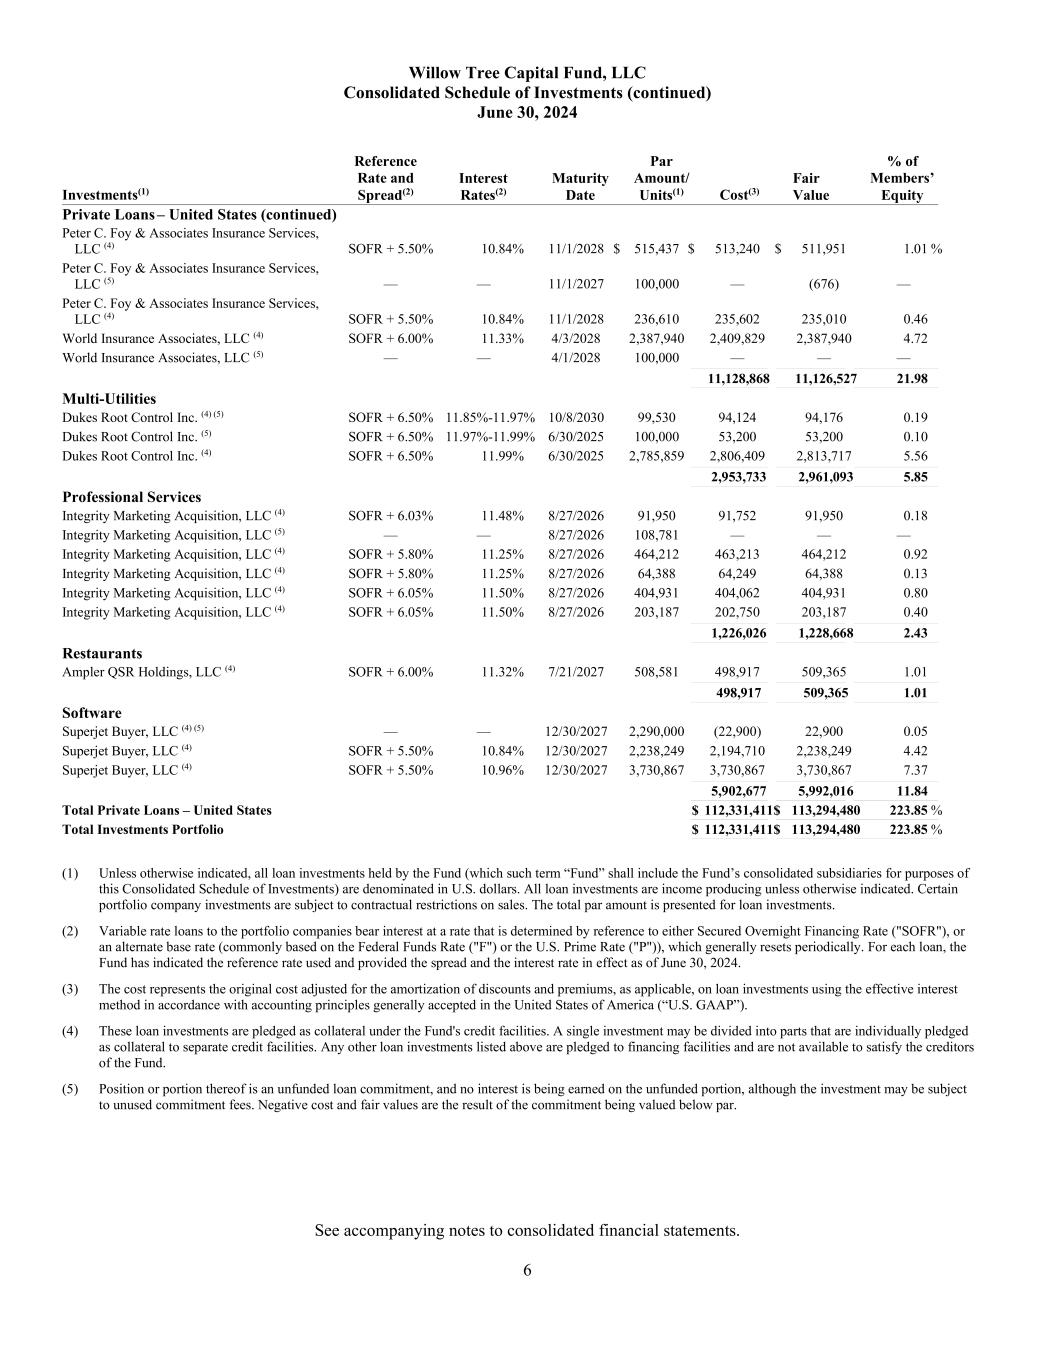
Willow Tree Capital Fund, LLC Consolidated Schedule of Investments (continued) June 30, 2024 See accompanying notes to consolidated financial statements. 6 Investments(1) Reference Rate and Spread(2) Interest Rates(2) Maturity Date Par Amount/ Units(1) Cost(3) Fair Value % of Members’ Equity Private Loans – United States (continued) Peter C. Foy & Associates Insurance Services, LLC (4) SOFR + 5.50% 10.84% 11/1/2028 $ 515,437 $ 513,240 $ 511,951 1.01 % Peter C. Foy & Associates Insurance Services, LLC (5) — — 11/1/2027 100,000 — (676) — Peter C. Foy & Associates Insurance Services, LLC (4) SOFR + 5.50% 10.84% 11/1/2028 236,610 235,602 235,010 0.46 World Insurance Associates, LLC (4) SOFR + 6.00% 11.33% 4/3/2028 2,387,940 2,409,829 2,387,940 4.72 World Insurance Associates, LLC (5) — — 4/1/2028 100,000 — — — _____________________________________________________________________________________________ ____________________________________________________________________________________ ______________________________________________________________________________________________________ 11,128,868 11,126,527 21.98 _____________________________________________________________________________________________ ____________________________________________________________________________________ ______________________________________________________________________________________________________ Multi-Utilities Dukes Root Control Inc. (4) (5) SOFR + 6.50% 11.85%-11.97% 10/8/2030 99,530 94,124 94,176 0.19 Dukes Root Control Inc. (5) SOFR + 6.50% 11.97%-11.99% 6/30/2025 100,000 53,200 53,200 0.10 Dukes Root Control Inc. (4) SOFR + 6.50% 11.99% 6/30/2025 2,785,859 2,806,409 2,813,717 5.56 _____________________________________________________________________________________________ ____________________________________________________________________________________ ______________________________________________________________________________________________________ 2,953,733 2,961,093 5.85 _____________________________________________________________________________________________ ____________________________________________________________________________________ ______________________________________________________________________________________________________ Professional Services Integrity Marketing Acquisition, LLC (4) SOFR + 6.03% 11.48% 8/27/2026 91,950 91,752 91,950 0.18 Integrity Marketing Acquisition, LLC (5) — — 8/27/2026 108,781 — — — Integrity Marketing Acquisition, LLC (4) SOFR + 5.80% 11.25% 8/27/2026 464,212 463,213 464,212 0.92 Integrity Marketing Acquisition, LLC (4) SOFR + 5.80% 11.25% 8/27/2026 64,388 64,249 64,388 0.13 Integrity Marketing Acquisition, LLC (4) SOFR + 6.05% 11.50% 8/27/2026 404,931 404,062 404,931 0.80 Integrity Marketing Acquisition, LLC (4) SOFR + 6.05% 11.50% 8/27/2026 203,187 202,750 203,187 0.40 _____________________________________________________________________________________________ ____________________________________________________________________________________ ______________________________________________________________________________________________________ 1,226,026 1,228,668 2.43 _____________________________________________________________________________________________ ____________________________________________________________________________________ ______________________________________________________________________________________________________ Restaurants Ampler QSR Holdings, LLC (4) SOFR + 6.00% 11.32% 7/21/2027 508,581 498,917 509,365 1.01 _____________________________________________________________________________________________ ____________________________________________________________________________________ ______________________________________________________________________________________________________ 498,917 509,365 1.01 _____________________________________________________________________________________________ ____________________________________________________________________________________ ______________________________________________________________________________________________________ Software Superjet Buyer, LLC (4) (5) — — 12/30/2027 2,290,000 (22,900) 22,900 0.05 Superjet Buyer, LLC (4) SOFR + 5.50% 10.84% 12/30/2027 2,238,249 2,194,710 2,238,249 4.42 Superjet Buyer, LLC (4) SOFR + 5.50% 10.96% 12/30/2027 3,730,867 3,730,867 3,730,867 7.37 _____________________________________________________________________________________________ ____________________________________________________________________________________ ______________________________________________________________________________________________________ 5,902,677 5,992,016 11.84 _____________________________________________________________________________________________ ____________________________________________________________________________________ ______________________________________________________________________________________________________ Total Private Loans – United States $ 112,331,411 $ 113,294,480 223.85 % _____________________________________________________________________________________________ ____________________________________________________________________________________ ______________________________________________________________________________________________________ Total Investments Portfolio $ 112,331,411 $ 113,294,480 223.85 % _____________________________________________________________________________________________ ____________________________________________________________________________________ ______________________________________________________________________________________________________ (1) Unless otherwise indicated, all loan investments held by the Fund (which such term “Fund” shall include the Fund’s consolidated subsidiaries for purposes of this Consolidated Schedule of Investments) are denominated in U.S. dollars. All loan investments are income producing unless otherwise indicated. Certain portfolio company investments are subject to contractual restrictions on sales. The total par amount is presented for loan investments. (2) Variable rate loans to the portfolio companies bear interest at a rate that is determined by reference to either Secured Overnight Financing Rate ("SOFR"), or an alternate base rate (commonly based on the Federal Funds Rate ("F") or the U.S. Prime Rate ("P")), which generally resets periodically. For each loan, the Fund has indicated the reference rate used and provided the spread and the interest rate in effect as of June 30, 2024. (3) The cost represents the original cost adjusted for the amortization of discounts and premiums, as applicable, on loan investments using the effective interest method in accordance with accounting principles generally accepted in the United States of America (“U.S. GAAP”). (4) These loan investments are pledged as collateral under the Fund's credit facilities. A single investment may be divided into parts that are individually pledged as collateral to separate credit facilities. Any other loan investments listed above are pledged to financing facilities and are not available to satisfy the creditors of the Fund. (5) Position or portion thereof is an unfunded loan commitment, and no interest is being earned on the unfunded portion, although the investment may be subject to unused commitment fees. Negative cost and fair values are the result of the commitment being valued below par.
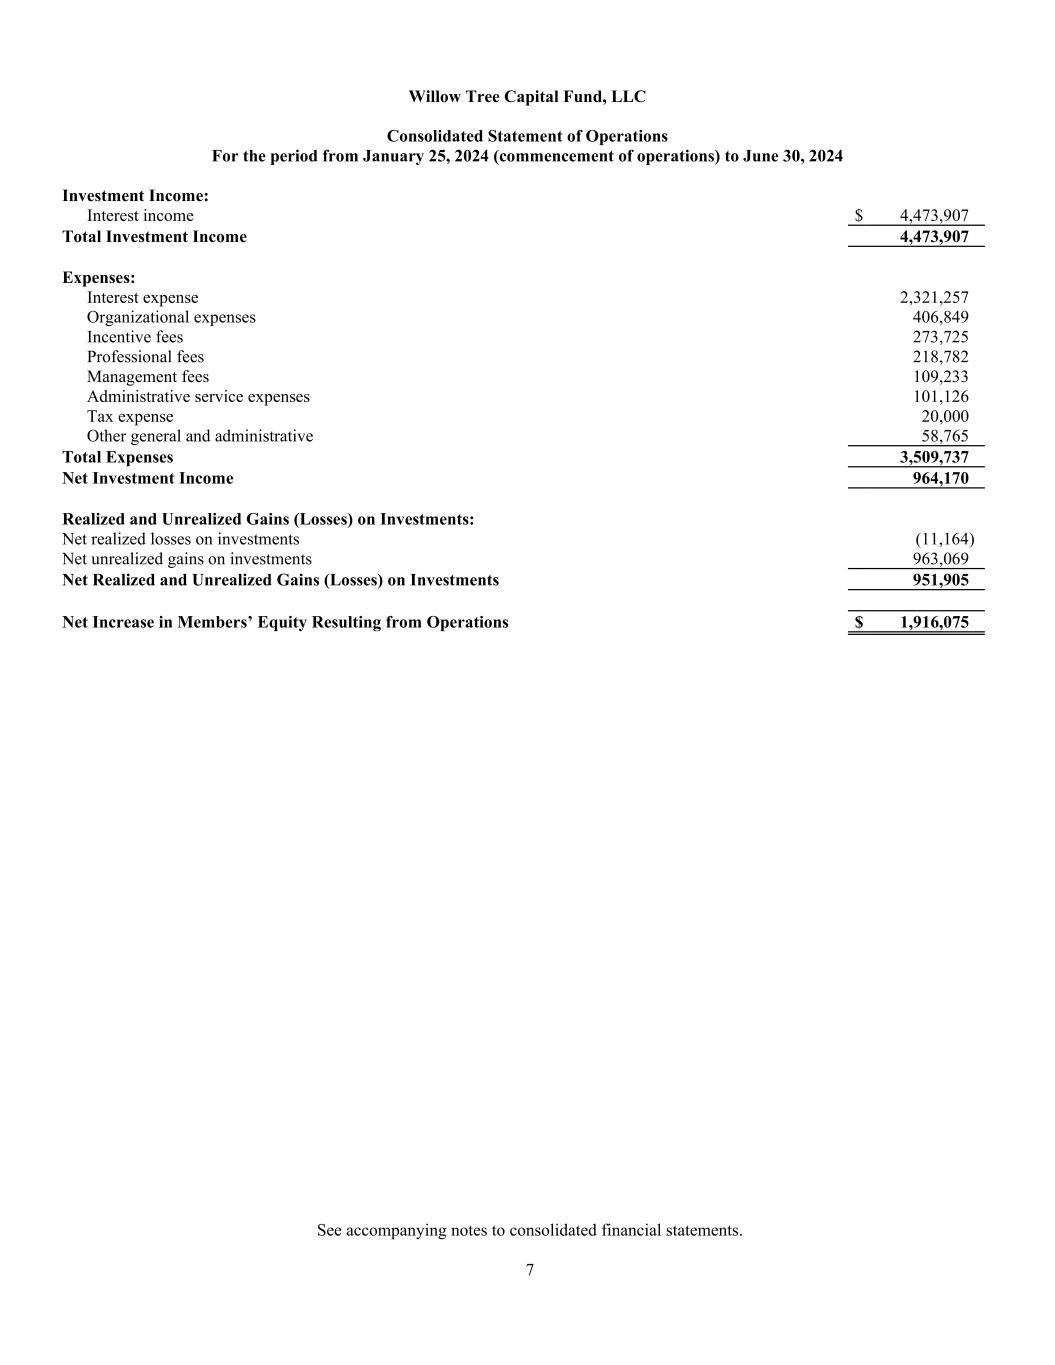
See accompanying notes to consolidated financial statements. 7 Willow Tree Capital Fund, LLC Consolidated Statement of Operations For the period from January 25, 2024 (commencement of operations) to June 30, 2024 Investment Income: Interest income $ 4,473,907 Total Investment Income 4,473,907 Expenses: Interest expense 2,321,257 Organizational expenses 406,849 Incentive fees 273,725 Professional fees 218,782 Management fees 109,233 Administrative service expenses 101,126 Tax expense 20,000 Other general and administrative 58,765 Total Expenses 3,509,737 Net Investment Income 964,170 Realized and Unrealized Gains (Losses) on Investments: Net realized losses on investments (11,164) Net unrealized gains on investments 963,069 Net Realized and Unrealized Gains (Losses) on Investments 951,905 Net Increase in Members’ Equity Resulting from Operations $ 1,916,075
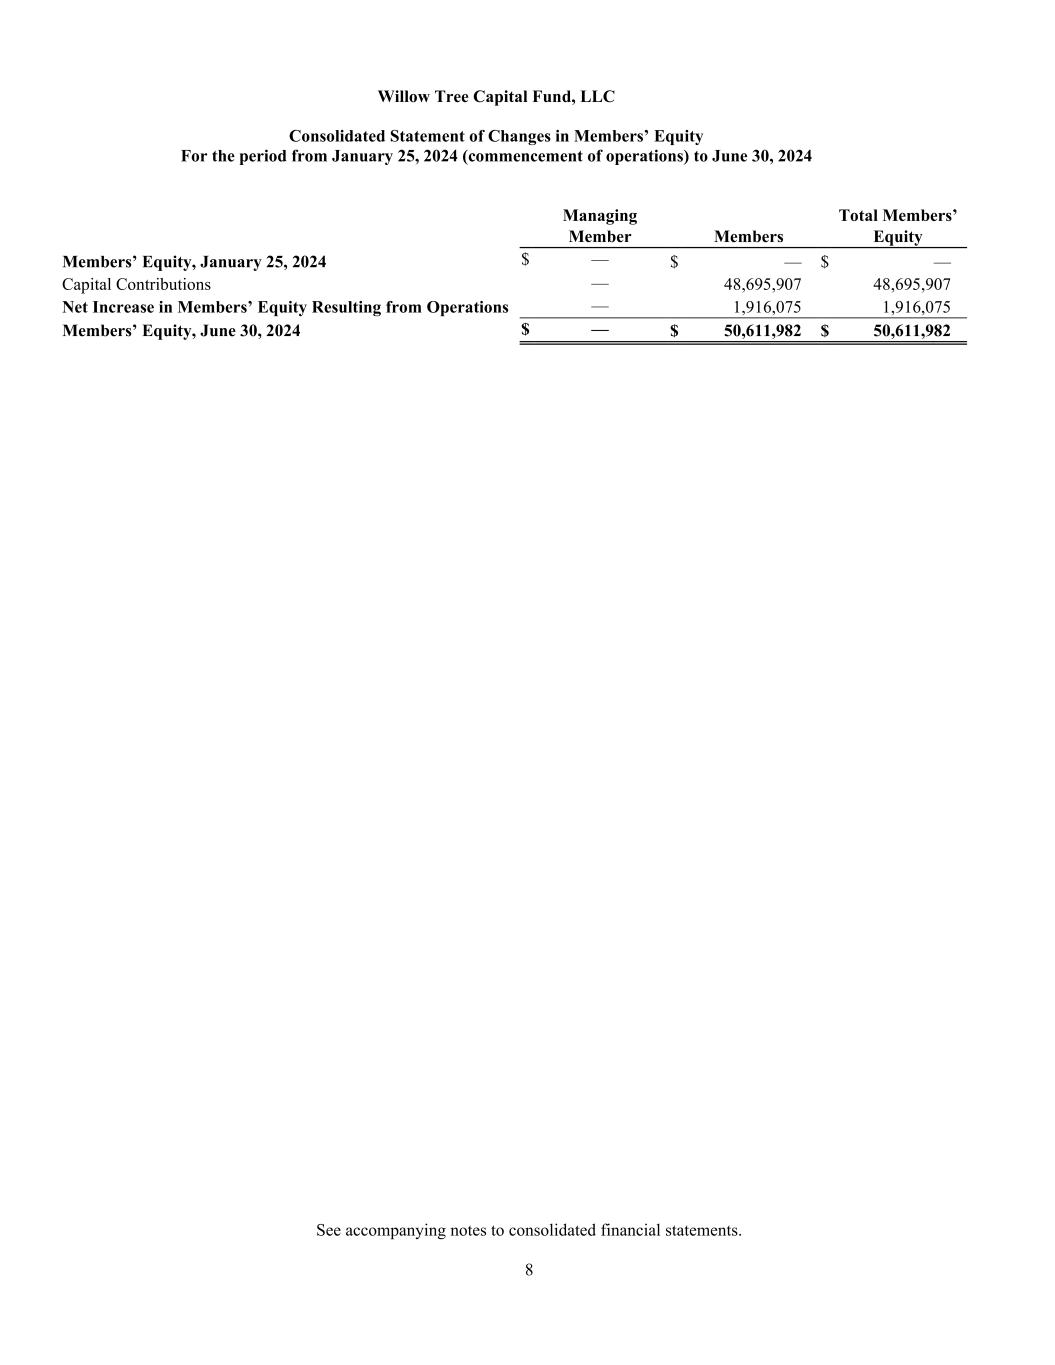
See accompanying notes to consolidated financial statements. 8 Willow Tree Capital Fund, LLC Consolidated Statement of Changes in Members’ Equity For the period from January 25, 2024 (commencement of operations) to June 30, 2024 Managing Member Members Total Members’ Equity Members’ Equity, January 25, 2024 $ — $ — $ — Capital Contributions — 48,695,907 48,695,907 Net Increase in Members’ Equity Resulting from Operations — 1,916,075 1,916,075 Members’ Equity, June 30, 2024 $ — $ 50,611,982 $ 50,611,982
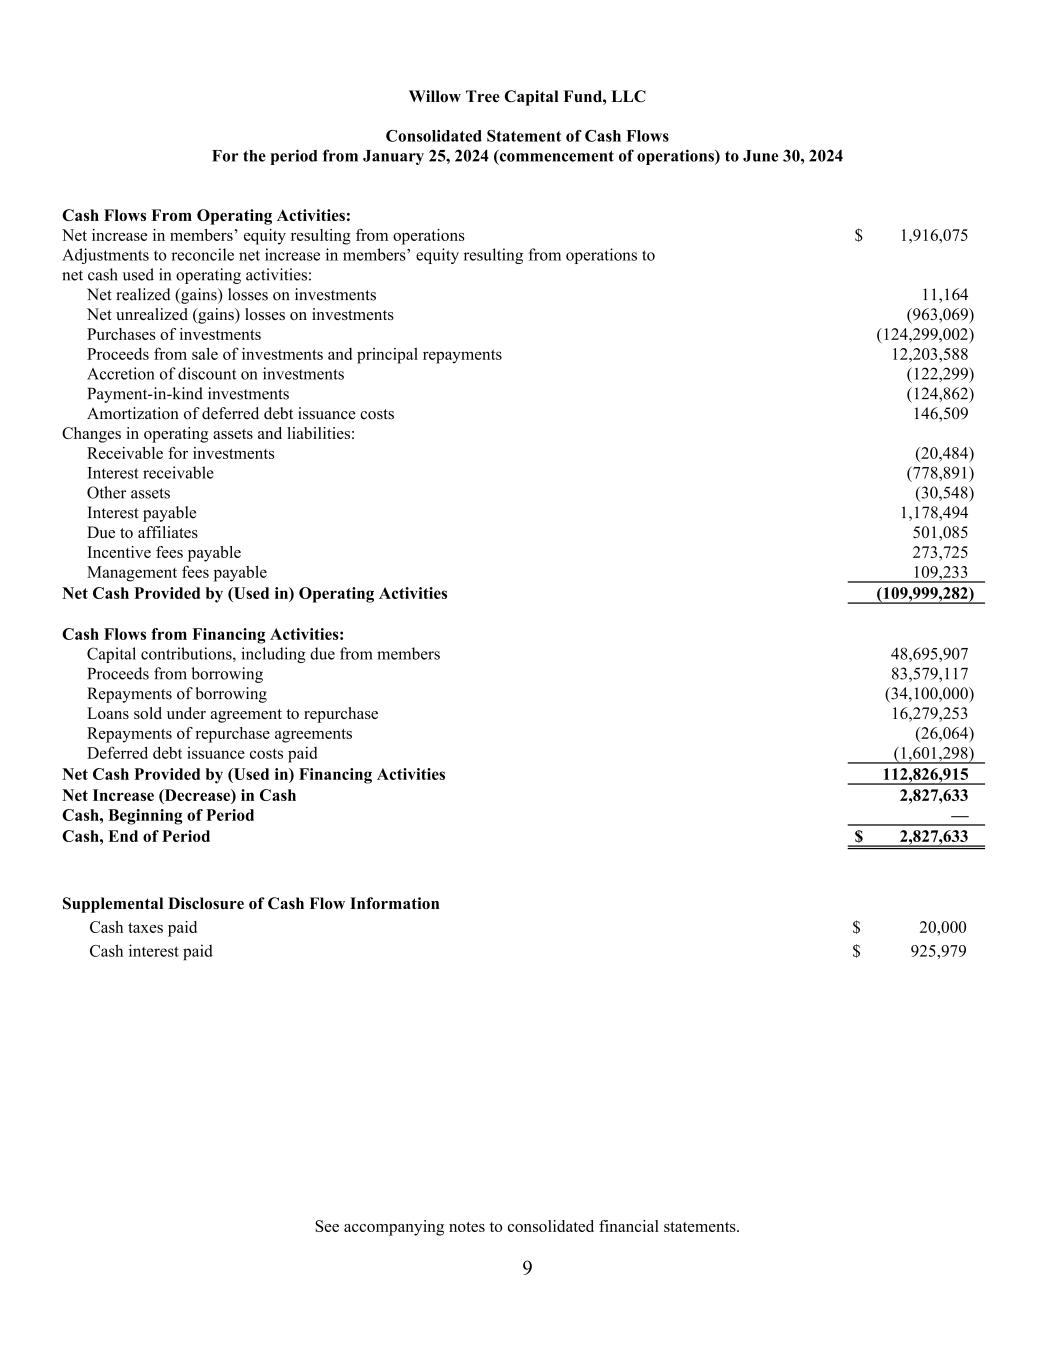
See accompanying notes to consolidated financial statements. 9 Willow Tree Capital Fund, LLC Consolidated Statement of Cash Flows For the period from January 25, 2024 (commencement of operations) to June 30, 2024 Cash Flows From Operating Activities: Net increase in members’ equity resulting from operations $ 1,916,075 Adjustments to reconcile net increase in members’ equity resulting from operations to net cash used in operating activities: Net realized (gains) losses on investments 11,164 Net unrealized (gains) losses on investments (963,069) Purchases of investments (124,299,002) Proceeds from sale of investments and principal repayments 12,203,588 Accretion of discount on investments (122,299) Payment-in-kind investments (124,862) Amortization of deferred debt issuance costs 146,509 Changes in operating assets and liabilities: Receivable for investments (20,484) Interest receivable (778,891) Other assets (30,548) Interest payable 1,178,494 Due to affiliates 501,085 Incentive fees payable 273,725 Management fees payable 109,233 Net Cash Provided by (Used in) Operating Activities (109,999,282) Cash Flows from Financing Activities: Capital contributions, including due from members 48,695,907 Proceeds from borrowing 83,579,117 Repayments of borrowing (34,100,000) Loans sold under agreement to repurchase 16,279,253 Repayments of repurchase agreements (26,064) Deferred debt issuance costs paid (1,601,298) Net Cash Provided by (Used in) Financing Activities 112,826,915 Net Increase (Decrease) in Cash 2,827,633 Cash, Beginning of Period — Cash, End of Period $ 2,827,633 Supplemental Disclosure of Cash Flow Information Cash taxes paid $ 20,000 Cash interest paid $ 925,979
Notes to Consolidated Financial Statements 10 Note 1. Organization Willow Tree Capital Fund, LLC, (the “Fund”), is a limited liability company under the Amended and Restated Limited Liability Company Agreement (as amended from time to time, the “Company Agreement”) dated as of January 25, 2024. The Fund was formed on August 30, 2022. The Fund’s managing member is Willow Tree Managing Member, LLC (the “Managing Member”) and the Fund’s investment manager is Willow Tree Capital Corp Advisors LLC (the “Investment Manager”). Per the terms of the Investment Management Agreement, the Managing Member delegates the management, operation, and control of the Fund to the Investment Manager. The Investment Manager is registered with the U.S. Securities and Exchange Commission under the Investment Advisers Act of 1940 and manages the Fund’s investments pursuant to an investment management agreement with the Fund. References below to the Investment Manager’s actions on behalf of the Managing Member are in all cases pursuant to the investment management agreement. The Fund was organized with the investment objective of achieving attractive risk-adjusted returns primarily through investing in floating rate senior secured loans to middle market companies. On October 31, 2023, Willow Tree Capital Fund - SPV1, LLC, a wholly owned subsidiary (the “SPV Subsidiary”) of the Fund was formed. The SPV Subsidiary is consolidated for generally accepted accounting principles in the United States of America (“US GAAP”) reporting purposes, and the portfolio investments held by it are included in the consolidated financial statements. The Fund and the SPV subsidiary will be referred to as the Fund throughout the remaining notes to the consolidated financial statements. On January 25, 2024, the Fund held its initial closing (“Initial Closing”). The Fund shall continue for an indefinite period until the Fund commences winding up in accordance with the Company Agreement. The Fund’s investment period commenced on the date of the Initial Closing and ends on the earlier of the third anniversary of April 1, 2024, provided, that the Managing Member may extend the investment period for one year in its sole discretion and the date on which the Investment Period is terminated pursuant to terms in the Company Agreement. The Fund will offer Units representing membership interests in a private offering. The Fund issued Units on January 29, 2024 at $15 per Unit. Subsequent issuances are issued at a price per unit equal to the net asset value per Unit as of the close of the last quarter preceding the drawdown date, subject to adjustments determined by the Managing Member. Note 2. Significant Accounting Policies Basis of Presentation The Fund’s financial statements have been prepared in accordance with U.S. GAAP. The Fund is an investment company and accordingly will follow the investment company accounting and reporting guidance of the Financial Accounting Standards Board (FASB) Accounting Standards Codification (“ASC”) Topic 946, Financial Services – Investment Companies. The Fund commenced operations on January 25, 2024, and its fiscal year ends on December 31. The Fund owns 100% of the equity of the SPV Subsidiary. Because of the common control, ownership interests and operational relationship of the Fund and SPV Subsidiary the financial statements of the Fund and SPV Subsidiary have been presented on a consolidated basis. Transactions between the Fund and SPV Subsidiary have been eliminated in the consolidation. Use of Estimates The preparation of the financial statements in conformity with U.S. GAAP requires management to make estimates and assumptions that affect the reported amounts of assets and liabilities, the disclosure of contingent assets
Notes to Consolidated Financial Statements 11 Note 2. Significant Accounting Policies (continued) and liabilities at the date of the financial statements, and the reported amounts of revenue and expenses during the reporting period. Actual results could differ from those estimates. Cash and Cash Equivalents Cash represents cash on hand and demand deposits held at financial institutions. Cash equivalents include short- term highly liquid investments of sufficient credit quality that are readily convertible to known amounts of cash and have original maturities of three months or less. Cash equivalents are carried at cost, plus accrued interest, which approximates fair value. Cash equivalents are held to meet short-term liquidity requirements, rather than for investment purposes. Cash and cash equivalents are held at major financial institutions and are subject to credit risk to the extent those balances exceed applicable Federal Deposit Insurance Corporation (FDIC) or Securities Investor Protection Corporation (SIPC) limits. As of June 30, 2024, the Fund held $2,827,633 in cash. Investment Related Transactions, Revenue Recognition and Expenses Investment transactions and the related revenue and expenses are recorded on a trade-date basis. Realized gains or losses resulting from investment transactions are recorded using the specific identification method. Interest income is recorded on an accrual basis and includes the accretion of discounts and amortizations of premiums. Discounts from and premiums to par value on debt investments purchased are accreted/amortized into interest income over the life of the respective security using the effective interest method. Upon prepayment of a loan or debt security, any prepayment premiums, unamortized fees and unamortized discounts are recorded as interest income. Interest Income on the Consolidated Statement of Operations for the period from January 25, 2024 (commencement of operations) to June 30, 2024 consists of $4,226,746 of accrued interest on investments and $122,299 of accretion of loan discount. An allowance for doubtful accounts is established when there is reasonable doubt that interest will not be collected. No such allowance for doubtful accounts has been established. Unrealized appreciation or depreciation reflects the difference between the fair value of the investments and the cost basis of the investments. Certain investments may have contractual payment-in-kind (“PIK”) interest. PIK represents accrued interest that is added to the principal amount of the investment on the interest payment date rather than being paid in cash and generally becomes due at maturity or upon the investment being called by the issuer. PIK is recorded as interest income. Interest Income on the Consolidated Statement of Operations for the period from January 25, 2024 (commencement of operations) to June 30, 2024 consists of $124,862 payment-in-kind (“PIK”) interest. Expenses are recorded on an accrual basis. Deferred debt issuance costs represent fees and other direct incremental costs incurred in connection with the Fund’s subscription and credit facilities. These amounts are amortized using the straight-line method into earnings as interest expense over the contractual term of the subscription and credit facilities. For the period from January 25, 2024 (commencement of operations) to June 30, 2024, $146,509 of debt issuance costs have been amortized and included in interest expense on the Consolidated Statement of Operations, and $1,601,298 in debt issuance costs have been paid during the year-ended June 30, 2024. Valuation of Portfolio Investments The Fund values its investments in accordance with ASC 820, Fair Value Measurement (“ASC 820”), “Fair Value Measurement and Disclosures”, which defines fair value, establishes a framework for measuring fair value, and requires disclosures about fair value measurements. In accordance with such accounting guidance, investments are reflected on the Consolidated Statement of Assets, Liabilities, and Members’ Equity at fair value, with changes in unrealized gain/(loss) resulting from changes in fair value reflected on the Consolidated Statement of Operations as net change in unrealized gain/(loss) on investments. Fair value is the amount that would be received to sell an asset or paid to transfer a liability in an orderly transaction between market participants at the measurement date (i.e. the exit price). Investments with a directly observable public market price will be marked-to-market based upon such public market price.
Notes to Consolidated Financial Statements 12 Note 2. Significant Accounting Policies (continued) Investments for which observable market prices in active markets do not exist are reported at fair value as determined by the Investment Manager, on behalf of the Managing Member, using the best information available. The amount determined to be fair value may incorporate the Investment Manager’s own assumptions, on behalf of the Managing Member (including appropriate risk adjustments for nonperformance and lack of marketability). To determine the current valuation of its debt and equity investments, the Investment Manager, on behalf of the Managing Member, relies on asset valuation, comparable transactions, and market quotes, or a blend of the aforementioned. Under this methodology, the future distributable cash to debt and equity holders that is expected to be generated by the investment either through coupon interest or debt repayment is estimated and then discounted back to the valuation date at a determined discount rate. The discount rate is generally determined with reference to yields of comparable securities with similar characteristics such as industry, location, size, and leverage of the issuer. Equity securities held by the Fund are valued primarily using the following valuation methods: liquidation valuation analysis, public market comparables, precedent transactions, and trading multiples and comparable company analysis. In the absence of a public comparable, the distributable cash to equity that is expected to be generated is estimated and discounted back to the valuation date at a determined equity discount rate. The fair values assigned to the Fund’s investments are based upon available information, and do not necessarily represent amounts which ultimately might be realized. Due to the absence of readily determinable fair values and the inherent uncertainty of valuations, the estimated fair values for private investments may differ significantly from values that would have been used had a ready market for the investments existed, and the differences could be material. Investment transactions are recorded upon closing of the transaction. The cost of an investment includes all costs incurred by the Fund as part of the purchase of such investment, increased by accretion of note discount and accrued paid-in-kind interest (as applicable). The difference between cost and the subsequent fair value measurement of an investment is reflected as net change in unrealized gains (losses) on investments on the Consolidated Statement of Operations. All investment valuation decisions are made by an investment valuation committee. The Fund accounts for its investments in accordance with the authoritative guidance on fair value measurements and disclosures under US GAAP. The guidance defines fair value, establishes a framework for measuring fair value, and requires enhanced disclosures about fair value measurements. Such accounting guidance establishes a fair value hierarchy which prioritizes and ranks the level of market price observability used in measuring investments at fair value. Market price observability is impacted by a number of factors, including the type of investment, the characteristics specific to the investment, and the state of the marketplace (including the existence and transparency of transactions between market participants). Investments with readily available actively quoted prices or for which fair value can be measured from actively quoted prices in an orderly market will generally have a higher degree of market price observability, and a lesser degree of judgment used in measuring fair value. Investments measured and reported at fair value are classified and disclosed in one of the following categories based on inputs: • Level 1 — Pricing inputs are unadjusted quoted prices that are available in active markets for identical investments as of the reporting date. The types of investments which would generally be included in Level 1 include listed equity securities and listed derivatives. As required by accounting guidance, the Fund, to the extent that it holds such investments, does not adjust the quoted price for these investments, even in situations where the Fund holds a large position, and a sale could reasonably impact the quoted price. • Level 2 — Pricing inputs are observable for the investments, either directly or indirectly, as of the reporting date, other than quoted prices included within Level 1. The types of investments would generally be included in this category include investments valued at quoted prices. Observable inputs other than quoted prices that are observable for the asset or liability, either directly or indirectly, may include quoted prices for similar instruments, interest rates, prepayment speeds, credit risk, yield curves, default rates and similar data.

Notes to Consolidated Financial Statements 13 Note 2. Significant Accounting Policies (continued) • Level 3 — Pricing inputs are unobservable for the investments and include situations where there is little, if any, market activity for the investments. The inputs into the determination of fair value require significant judgment or estimation by the Investment Manager, on behalf of the Managing Member. The types of investments which would generally be included in this category include debt and equity securities issued by private companies. A financial instrument’s level within the hierarchy is based on the lowest level of any input that is significant to the fair value measurement. Valuations of Level 2 investments are generally based on quotations received from pricing services, dealers or brokers where there is sufficient quote depth. Consideration is given to the source and nature of the quotations and the relationship of recent market activity to the quotations provided. Transfers between levels, if any, are recognized at the beginning of the reporting period in which the transfers occur. The Fund evaluates the source of inputs used in the determination of fair value, including any markets in which the investments, or similar investments, are trading. When the fair value of an investment is determined using inputs from a pricing service (or principal market makers), the Fund considers various criteria in determining whether the investment should be classified as a Level 2 or Level 3 investment. Criteria considered includes the pricing methodologies of the pricing services (or principal market makers) to determine if the inputs to the valuation are observable or unobservable, as well as the number of prices obtained and an assessment of the quality of the prices obtained. The level of an investment within the fair value hierarchy is based on the lowest level of any input that is significant to the fair value measurement. However, the determination of what constitutes “observable” requires significant judgment. The fair value assigned to these investments is based upon available information and may fluctuate from period to period. In addition, it does not necessarily represent the amount that might ultimately be realized upon sale. Due to inherent uncertainty of valuation, the estimated fair value of investments may differ from the value that would have been used had a ready market for the security existed, and the difference could be material. See Note 5, Investments and Fair Value for further discussion relating to the Fund’s investments. Organization Expenses Organization expenses, primarily for legal expenses associated with the establishment of the Fund, are expensed as incurred. For the period from January 25, 2024 (commencement of operations) to June 30, 2024, the Fund incurred organization expenses of $406,849 which are included on the Consolidated Statement of Operations. Income Taxes The Fund itself is not subject to U.S. federal income taxes; each member is individually liable for income taxes, if any, on its share of the Fund’s net taxable income. Interest, dividends, and other income realized by the Fund from both U.S. and non-U.S. sources and capital gains realized on the sale of securities of U.S. and non-U.S. issuers may be subject to withholding and other taxes levied by the jurisdiction in which the income is sourced. The SPV Subsidiary is treated as a disregarded entity for U.S. federal income tax purposes and no election has been filed to be treated as a corporation for U.S. federal income tax purposes. The Fund files tax returns as prescribed by the tax laws of the jurisdictions in which it operates or invests. In the normal course of business, the Fund remain subject to examination by U.S. federal, state, local and various non-U.S. jurisdictions for certain open tax periods from the year 2024 forward, under the applicable statute of limitations. The open tax years subject to examination vary by jurisdiction. The Fund does not expect that the total amount of unrecognized tax benefits will materially change over the next twelve months. The Fund recognizes a tax benefit or liability from an uncertain position only if it is more likely than not that the position is sustainable, based solely on its technical merits and consideration of the relevant taxing authority’s widely understood administrative practices and precedents. As of June 30, 2024, no tax accrual has been recorded for uncertain tax positions.
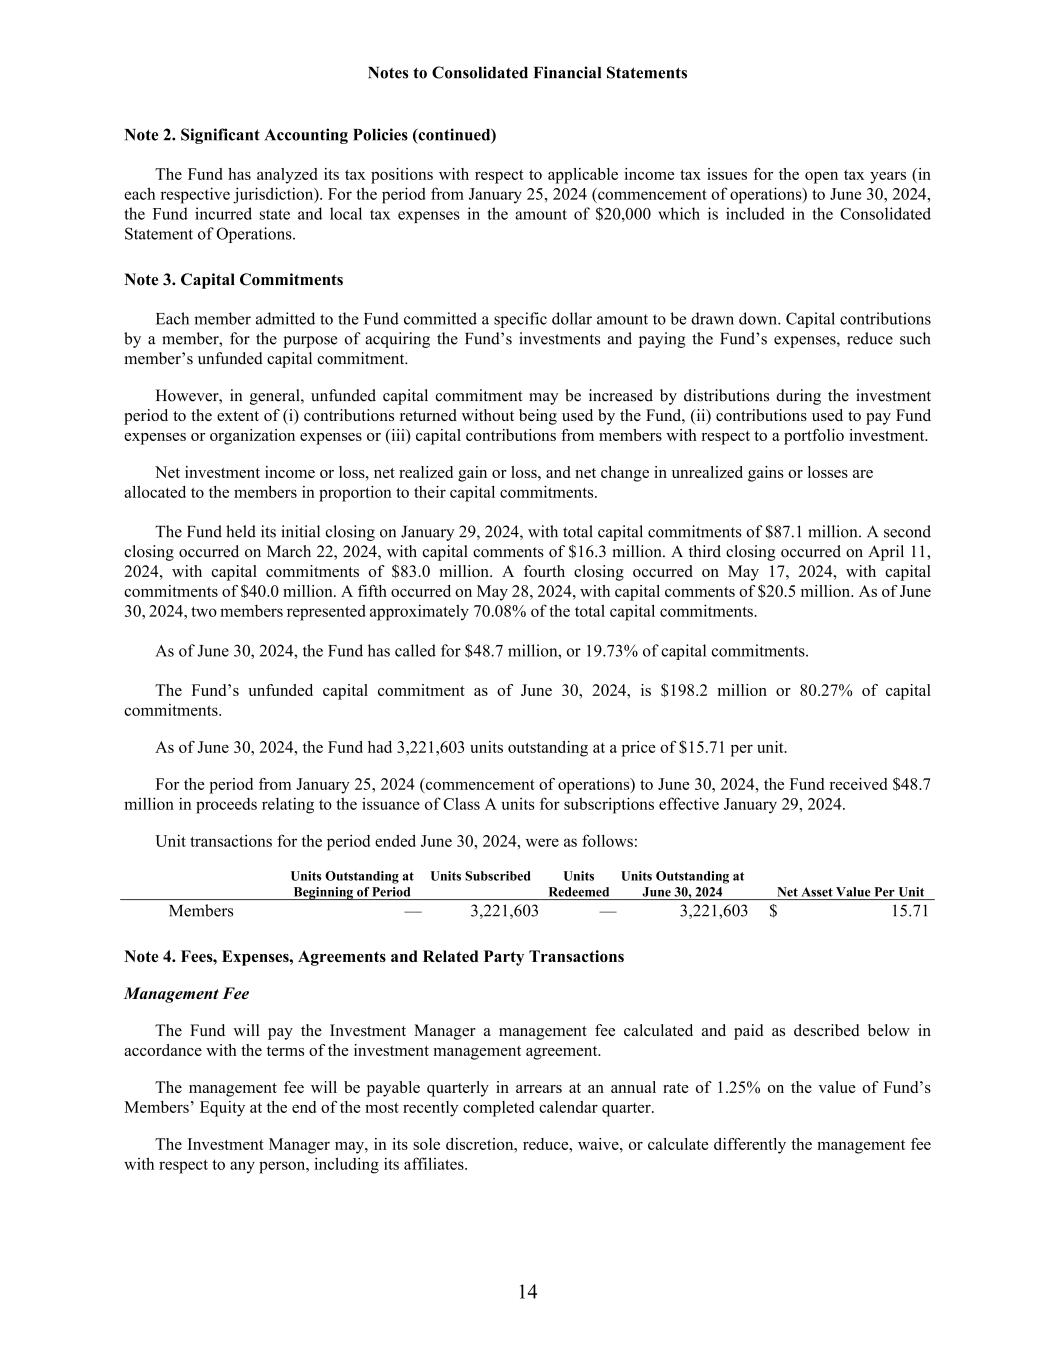
Notes to Consolidated Financial Statements 14 Note 2. Significant Accounting Policies (continued) The Fund has analyzed its tax positions with respect to applicable income tax issues for the open tax years (in each respective jurisdiction). For the period from January 25, 2024 (commencement of operations) to June 30, 2024, the Fund incurred state and local tax expenses in the amount of $20,000 which is included in the Consolidated Statement of Operations. Note 3. Capital Commitments Each member admitted to the Fund committed a specific dollar amount to be drawn down. Capital contributions by a member, for the purpose of acquiring the Fund’s investments and paying the Fund’s expenses, reduce such member’s unfunded capital commitment. However, in general, unfunded capital commitment may be increased by distributions during the investment period to the extent of (i) contributions returned without being used by the Fund, (ii) contributions used to pay Fund expenses or organization expenses or (iii) capital contributions from members with respect to a portfolio investment. Net investment income or loss, net realized gain or loss, and net change in unrealized gains or losses are allocated to the members in proportion to their capital commitments. The Fund held its initial closing on January 29, 2024, with total capital commitments of $87.1 million. A second closing occurred on March 22, 2024, with capital comments of $16.3 million. A third closing occurred on April 11, 2024, with capital commitments of $83.0 million. A fourth closing occurred on May 17, 2024, with capital commitments of $40.0 million. A fifth occurred on May 28, 2024, with capital comments of $20.5 million. As of June 30, 2024, two members represented approximately 70.08% of the total capital commitments. As of June 30, 2024, the Fund has called for $48.7 million, or 19.73% of capital commitments. The Fund’s unfunded capital commitment as of June 30, 2024, is $198.2 million or 80.27% of capital commitments. As of June 30, 2024, the Fund had 3,221,603 units outstanding at a price of $15.71 per unit. For the period from January 25, 2024 (commencement of operations) to June 30, 2024, the Fund received $48.7 million in proceeds relating to the issuance of Class A units for subscriptions effective January 29, 2024. Unit transactions for the period ended June 30, 2024, were as follows: Units Outstanding at Beginning of Period Units Subscribed Units Redeemed Units Outstanding at June 30, 2024 Net Asset Value Per Unit Members — 3,221,603 — 3,221,603 $ 15.71 Note 4. Fees, Expenses, Agreements and Related Party Transactions Management Fee The Fund will pay the Investment Manager a management fee calculated and paid as described below in accordance with the terms of the investment management agreement. The management fee will be payable quarterly in arrears at an annual rate of 1.25% on the value of Fund’s Members’ Equity at the end of the most recently completed calendar quarter. The Investment Manager may, in its sole discretion, reduce, waive, or calculate differently the management fee with respect to any person, including its affiliates.

Notes to Consolidated Financial Statements 15 Note 4. Fees, Expenses, Agreements and Related Party Transactions (continued) Incentive Fee The Incentive Fee will be calculated in accordance with terms set forth in the Company Agreement. Set forth below is a general summary of the calculation of the Incentive Fee. (i) In order to calculate the Incentive Fee with respect to a Unitholder, the amount of proceeds received by the Fund upon disposition, net of certain items such as expenses (the “Disposition Proceeds”) allocated to such Unitholder shall first be increased by an amount equal to such Unitholder’s pro rata share of any taxes on gross or net income incurred due with respect to investments (the “Tax Adjustment”) and then reduced up (but not below zero) by the sum of the following: (A) First, 100% to such Unitholder until such Unitholder has received pursuant to this clause an amount equal to such Unitholder’s unreturned contributed capital by such Unitholder to the Fund as of such date; (B) Second, 100% to such Unitholder until such Unitholder has received distributions equal to 6% per annum (the "priority return") on the aggregate amount of capital contributions for the period commencing on the due date of capital contribution and ending on the date such capital contribution is returned. (ii) If the amount of the disposition proceeds allocated to a Unitholder after taking into account the reduction in section (i) above is greater than zero (such positive amount referred to as the “Excess Available Funds”), the Incentive Fee with respect to the Unitholder as to the investment giving rise to the Available Funds shall equal the sum of following: (A) the lesser of (i) the Excess Available Funds, or (ii) the total of all amounts taken into account under section (i)(d) above the Priority Return divided by 87.5% less the Priority Return; and (B) if the Excess Available Funds exceed the amount determined under (ii)(a) above (such excess amount referred to as the “Remaining Excess Available Funds”), an amount equal to 12.5% of such Remaining Excess Available Funds. (iii) The Net Available Funds with respect to the Unitholder shall equal the amount of such Disposition Proceeds allocated to the Unitholder reduced by the Incentive Fee determined under section (ii) above. (iv) For purposes of the calculation of the Incentive Fee, all amounts paid to a Unitholder as distributions that would otherwise constitute Disposition Proceeds shall be taken into account in the calculations above prior to reducing the Disposition Proceeds. The Managing Member may, in their sole discretion, agree with any investor to waive, alter or reduce the Management Fee and/or Incentive Fee payable by such Unitholder. Note 5. Investments and Fair Value The following table sets forth a summary of purchases for the period from January 25, 2023 (commencement of operations) to June 30, 2024, as required by ASC 820: June 30, 2024 Purchase of Investments Capitalized PIK Total Private Loans $ 124,299,002 $ 124,862 $ 124,423,864 Total investments $ 124,299,002 $ 124,862 $ 124,423,864
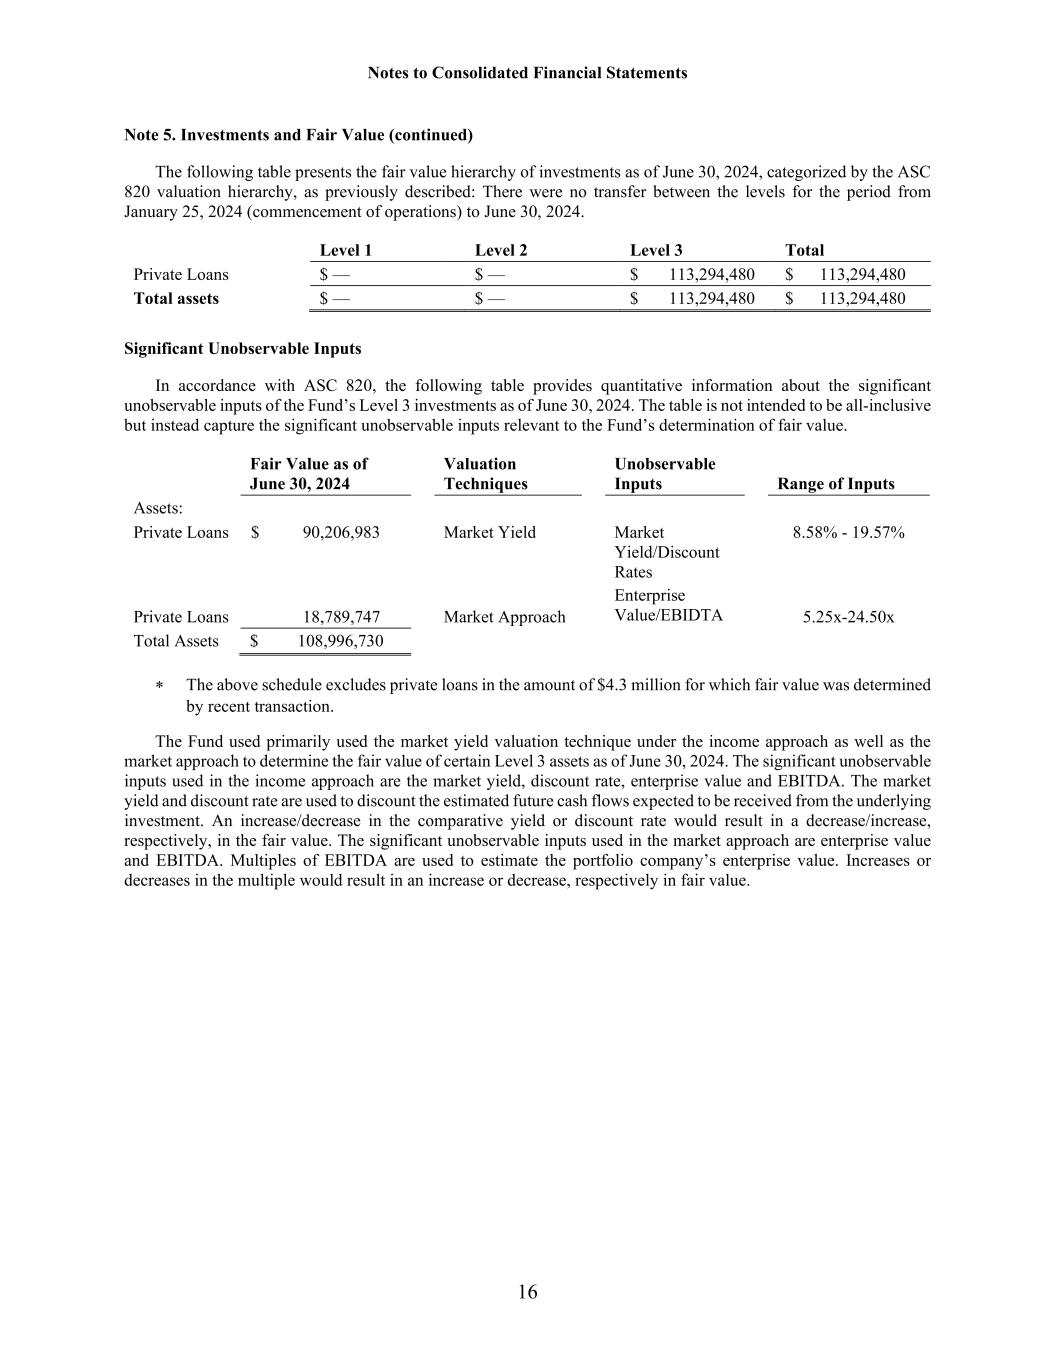
Notes to Consolidated Financial Statements 16 Note 5. Investments and Fair Value (continued) The following table presents the fair value hierarchy of investments as of June 30, 2024, categorized by the ASC 820 valuation hierarchy, as previously described: There were no transfer between the levels for the period from January 25, 2024 (commencement of operations) to June 30, 2024. Level 1 Level 2 Level 3 Total Private Loans $ — $ — $ 113,294,480 $ 113,294,480 Total assets $ — $ — $ 113,294,480 $ 113,294,480 Significant Unobservable Inputs In accordance with ASC 820, the following table provides quantitative information about the significant unobservable inputs of the Fund’s Level 3 investments as of June 30, 2024. The table is not intended to be all-inclusive but instead capture the significant unobservable inputs relevant to the Fund’s determination of fair value. Fair Value as of June 30, 2024 Valuation Techniques Unobservable Inputs Range of Inputs Assets: Private Loans $ 90,206,983 Market Yield Market Yield/Discount Rates 8.58% - 19.57% Private Loans 18,789,747 Market Approach Enterprise Value/EBIDTA 5.25x-24.50x Total Assets $ 108,996,730 ∗ The above schedule excludes private loans in the amount of $4.3 million for which fair value was determined by recent transaction. The Fund used primarily used the market yield valuation technique under the income approach as well as the market approach to determine the fair value of certain Level 3 assets as of June 30, 2024. The significant unobservable inputs used in the income approach are the market yield, discount rate, enterprise value and EBITDA. The market yield and discount rate are used to discount the estimated future cash flows expected to be received from the underlying investment. An increase/decrease in the comparative yield or discount rate would result in a decrease/increase, respectively, in the fair value. The significant unobservable inputs used in the market approach are enterprise value and EBITDA. Multiples of EBITDA are used to estimate the portfolio company’s enterprise value. Increases or decreases in the multiple would result in an increase or decrease, respectively in fair value.
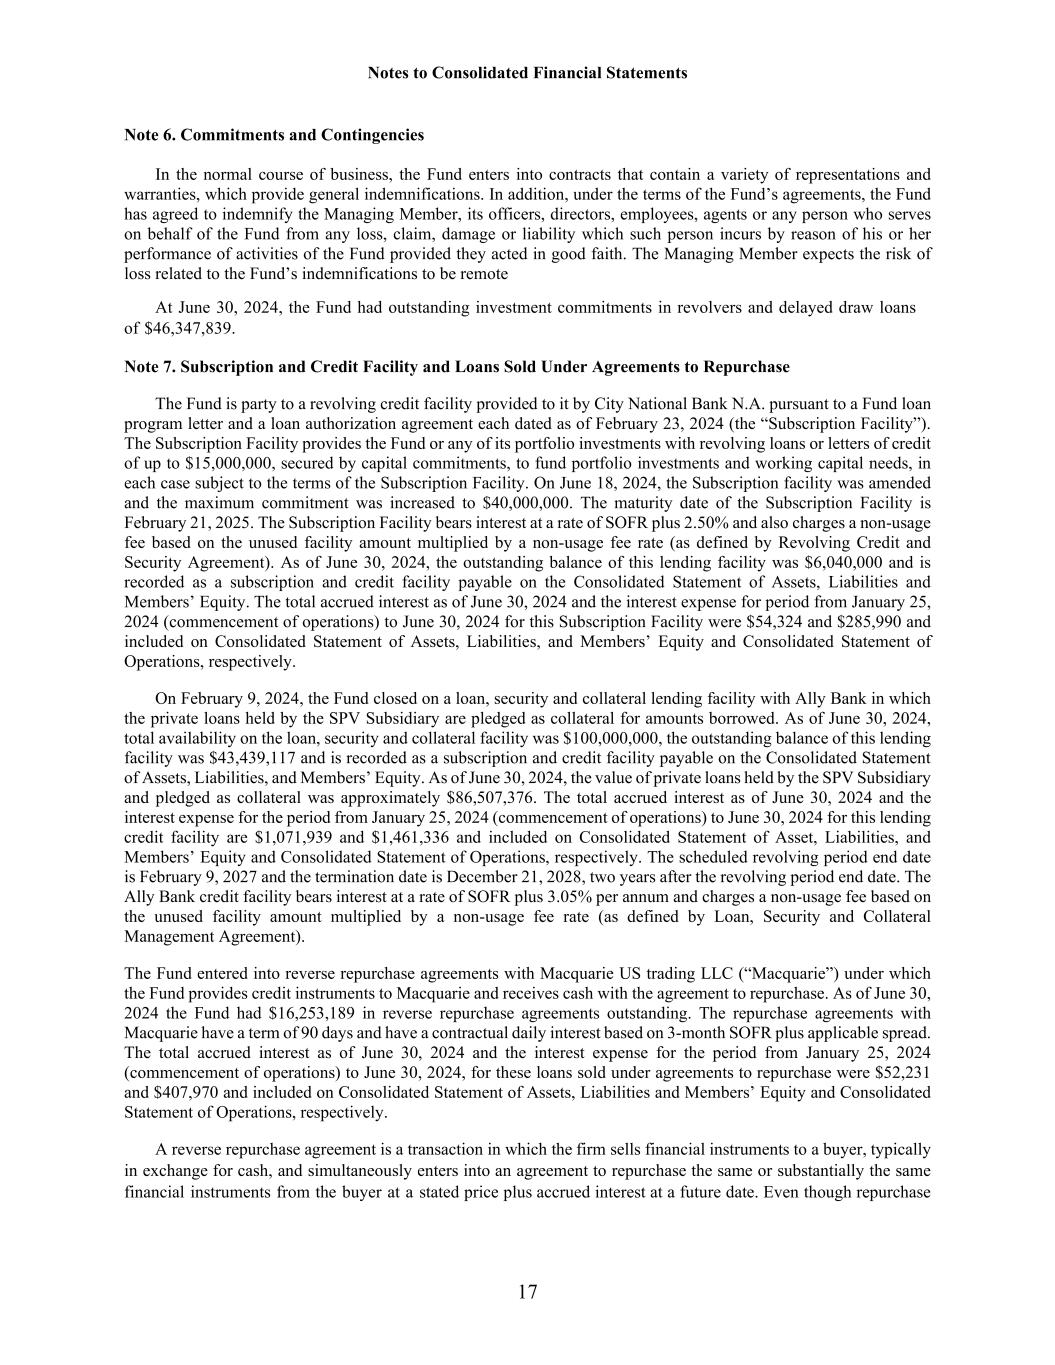
Notes to Consolidated Financial Statements 17 Note 6. Commitments and Contingencies In the normal course of business, the Fund enters into contracts that contain a variety of representations and warranties, which provide general indemnifications. In addition, under the terms of the Fund’s agreements, the Fund has agreed to indemnify the Managing Member, its officers, directors, employees, agents or any person who serves on behalf of the Fund from any loss, claim, damage or liability which such person incurs by reason of his or her performance of activities of the Fund provided they acted in good faith. The Managing Member expects the risk of loss related to the Fund’s indemnifications to be remote At June 30, 2024, the Fund had outstanding investment commitments in revolvers and delayed draw loans of $46,347,839. Note 7. Subscription and Credit Facility and Loans Sold Under Agreements to Repurchase The Fund is party to a revolving credit facility provided to it by City National Bank N.A. pursuant to a Fund loan program letter and a loan authorization agreement each dated as of February 23, 2024 (the “Subscription Facility”). The Subscription Facility provides the Fund or any of its portfolio investments with revolving loans or letters of credit of up to $15,000,000, secured by capital commitments, to fund portfolio investments and working capital needs, in each case subject to the terms of the Subscription Facility. On June 18, 2024, the Subscription facility was amended and the maximum commitment was increased to $40,000,000. The maturity date of the Subscription Facility is February 21, 2025. The Subscription Facility bears interest at a rate of SOFR plus 2.50% and also charges a non-usage fee based on the unused facility amount multiplied by a non-usage fee rate (as defined by Revolving Credit and Security Agreement). As of June 30, 2024, the outstanding balance of this lending facility was $6,040,000 and is recorded as a subscription and credit facility payable on the Consolidated Statement of Assets, Liabilities and Members’ Equity. The total accrued interest as of June 30, 2024 and the interest expense for period from January 25, 2024 (commencement of operations) to June 30, 2024 for this Subscription Facility were $54,324 and $285,990 and included on Consolidated Statement of Assets, Liabilities, and Members’ Equity and Consolidated Statement of Operations, respectively. On February 9, 2024, the Fund closed on a loan, security and collateral lending facility with Ally Bank in which the private loans held by the SPV Subsidiary are pledged as collateral for amounts borrowed. As of June 30, 2024, total availability on the loan, security and collateral facility was $100,000,000, the outstanding balance of this lending facility was $43,439,117 and is recorded as a subscription and credit facility payable on the Consolidated Statement of Assets, Liabilities, and Members’ Equity. As of June 30, 2024, the value of private loans held by the SPV Subsidiary and pledged as collateral was approximately $86,507,376. The total accrued interest as of June 30, 2024 and the interest expense for the period from January 25, 2024 (commencement of operations) to June 30, 2024 for this lending credit facility are $1,071,939 and $1,461,336 and included on Consolidated Statement of Asset, Liabilities, and Members’ Equity and Consolidated Statement of Operations, respectively. The scheduled revolving period end date is February 9, 2027 and the termination date is December 21, 2028, two years after the revolving period end date. The Ally Bank credit facility bears interest at a rate of SOFR plus 3.05% per annum and charges a non-usage fee based on the unused facility amount multiplied by a non-usage fee rate (as defined by Loan, Security and Collateral Management Agreement). The Fund entered into reverse repurchase agreements with Macquarie US trading LLC (“Macquarie”) under which the Fund provides credit instruments to Macquarie and receives cash with the agreement to repurchase. As of June 30, 2024 the Fund had $16,253,189 in reverse repurchase agreements outstanding. The repurchase agreements with Macquarie have a term of 90 days and have a contractual daily interest based on 3-month SOFR plus applicable spread. The total accrued interest as of June 30, 2024 and the interest expense for the period from January 25, 2024 (commencement of operations) to June 30, 2024, for these loans sold under agreements to repurchase were $52,231 and $407,970 and included on Consolidated Statement of Assets, Liabilities and Members’ Equity and Consolidated Statement of Operations, respectively. A reverse repurchase agreement is a transaction in which the firm sells financial instruments to a buyer, typically in exchange for cash, and simultaneously enters into an agreement to repurchase the same or substantially the same financial instruments from the buyer at a stated price plus accrued interest at a future date. Even though repurchase

Notes to Consolidated Financial Statements 18 agreements involve the legal transfer of ownership of financial instruments, they are accounted for as financing arrangements because they require the financial instruments to be repurchased at the maturity of the agreement. The risk of default depends on the creditworthiness of the counterparty as well as the issuer of the instrument. Refer to Note 8 for further discussion of risk factors. The following table represents reverse repurchase agreements held as of June 30, 2024. The below investments serve as collateral to the Loans sold under agreement to repurchase on the Consolidated Statement of Assets, Liabilities and Members’ Equity.
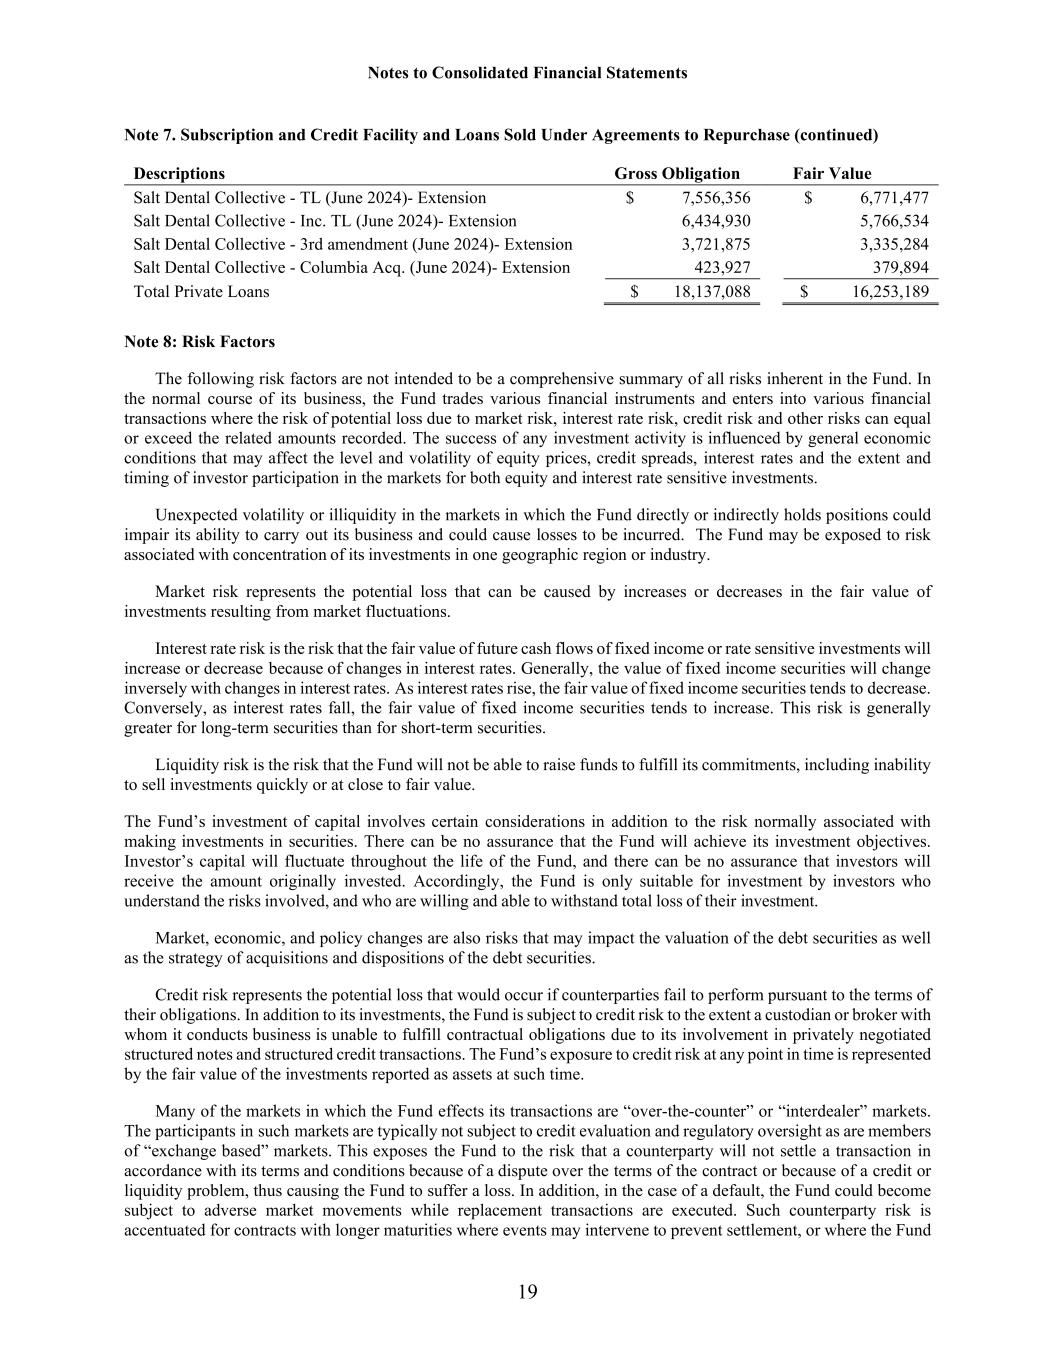
Notes to Consolidated Financial Statements 19 Note 7. Subscription and Credit Facility and Loans Sold Under Agreements to Repurchase (continued) Descriptions Gross Obligation Fair Value Salt Dental Collective - TL (June 2024)- Extension $ 7,556,356 $ 6,771,477 Salt Dental Collective - Inc. TL (June 2024)- Extension 6,434,930 5,766,534 Salt Dental Collective - 3rd amendment (June 2024)- Extension 3,721,875 3,335,284 Salt Dental Collective - Columbia Acq. (June 2024)- Extension 423,927 379,894 Total Private Loans $ 18,137,088 $ 16,253,189 Note 8: Risk Factors The following risk factors are not intended to be a comprehensive summary of all risks inherent in the Fund. In the normal course of its business, the Fund trades various financial instruments and enters into various financial transactions where the risk of potential loss due to market risk, interest rate risk, credit risk and other risks can equal or exceed the related amounts recorded. The success of any investment activity is influenced by general economic conditions that may affect the level and volatility of equity prices, credit spreads, interest rates and the extent and timing of investor participation in the markets for both equity and interest rate sensitive investments. Unexpected volatility or illiquidity in the markets in which the Fund directly or indirectly holds positions could impair its ability to carry out its business and could cause losses to be incurred. The Fund may be exposed to risk associated with concentration of its investments in one geographic region or industry. Market risk represents the potential loss that can be caused by increases or decreases in the fair value of investments resulting from market fluctuations. Interest rate risk is the risk that the fair value of future cash flows of fixed income or rate sensitive investments will increase or decrease because of changes in interest rates. Generally, the value of fixed income securities will change inversely with changes in interest rates. As interest rates rise, the fair value of fixed income securities tends to decrease. Conversely, as interest rates fall, the fair value of fixed income securities tends to increase. This risk is generally greater for long-term securities than for short-term securities. Liquidity risk is the risk that the Fund will not be able to raise funds to fulfill its commitments, including inability to sell investments quickly or at close to fair value. The Fund’s investment of capital involves certain considerations in addition to the risk normally associated with making investments in securities. There can be no assurance that the Fund will achieve its investment objectives. Investor’s capital will fluctuate throughout the life of the Fund, and there can be no assurance that investors will receive the amount originally invested. Accordingly, the Fund is only suitable for investment by investors who understand the risks involved, and who are willing and able to withstand total loss of their investment. Market, economic, and policy changes are also risks that may impact the valuation of the debt securities as well as the strategy of acquisitions and dispositions of the debt securities. Credit risk represents the potential loss that would occur if counterparties fail to perform pursuant to the terms of their obligations. In addition to its investments, the Fund is subject to credit risk to the extent a custodian or broker with whom it conducts business is unable to fulfill contractual obligations due to its involvement in privately negotiated structured notes and structured credit transactions. The Fund’s exposure to credit risk at any point in time is represented by the fair value of the investments reported as assets at such time. Many of the markets in which the Fund effects its transactions are “over-the-counter” or “interdealer” markets. The participants in such markets are typically not subject to credit evaluation and regulatory oversight as are members of “exchange based” markets. This exposes the Fund to the risk that a counterparty will not settle a transaction in accordance with its terms and conditions because of a dispute over the terms of the contract or because of a credit or liquidity problem, thus causing the Fund to suffer a loss. In addition, in the case of a default, the Fund could become subject to adverse market movements while replacement transactions are executed. Such counterparty risk is accentuated for contracts with longer maturities where events may intervene to prevent settlement, or where the Fund
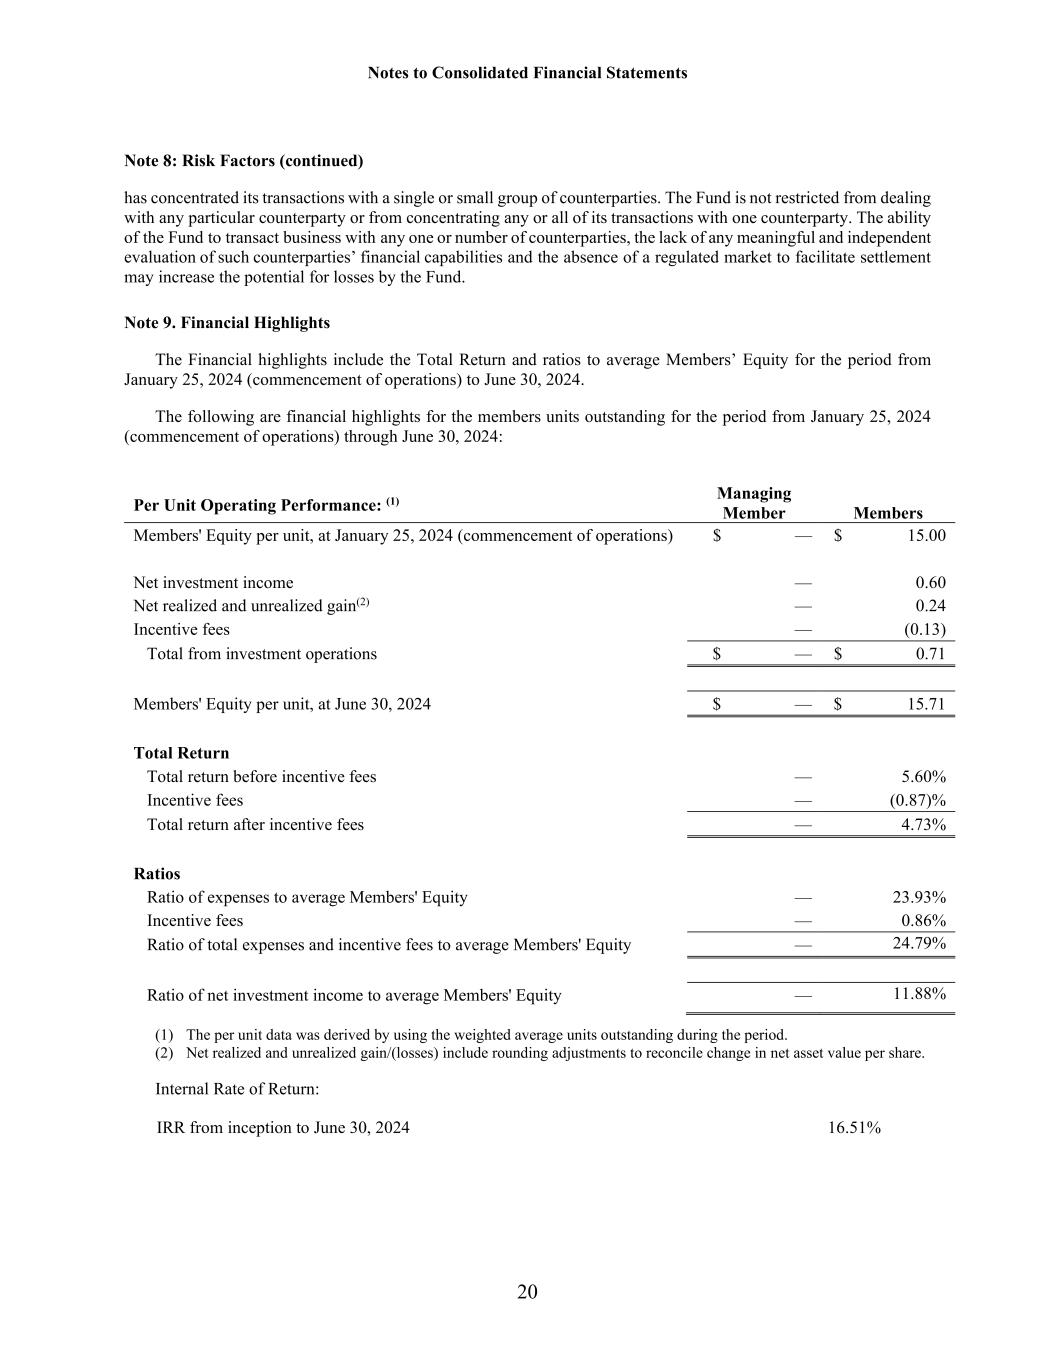
Notes to Consolidated Financial Statements 20 Note 8: Risk Factors (continued) has concentrated its transactions with a single or small group of counterparties. The Fund is not restricted from dealing with any particular counterparty or from concentrating any or all of its transactions with one counterparty. The ability of the Fund to transact business with any one or number of counterparties, the lack of any meaningful and independent evaluation of such counterparties’ financial capabilities and the absence of a regulated market to facilitate settlement may increase the potential for losses by the Fund. Note 9. Financial Highlights The Financial highlights include the Total Return and ratios to average Members’ Equity for the period from January 25, 2024 (commencement of operations) to June 30, 2024. The following are financial highlights for the members units outstanding for the period from January 25, 2024 (commencement of operations) through June 30, 2024: Managing Member Members Per Unit Operating Performance: (1) Members' Equity per unit, at January 25, 2024 (commencement of operations) $ — $ 15.00 Net investment income — 0.60 Net realized and unrealized gain(2) — 0.24 Incentive fees — (0.13) Total from investment operations $ — $ 0.71 Members' Equity per unit, at June 30, 2024 $ — $ 15.71 Total Return Total return before incentive fees — 5.60% Incentive fees — (0.87)% Total return after incentive fees — 4.73% Ratios Ratio of expenses to average Members' Equity — 23.93% Incentive fees — 0.86% Ratio of total expenses and incentive fees to average Members' Equity — 24.79% Ratio of net investment income to average Members' Equity — 11.88% (1) The per unit data was derived by using the weighted average units outstanding during the period. (2) Net realized and unrealized gain/(losses) include rounding adjustments to reconcile change in net asset value per share. Internal Rate of Return: IRR from inception to June 30, 2024 16.51%
Notes to Consolidated Financial Statements 21 Note 9. Financial Highlights (continued) The IRR of the members’ equity since inception of the Fund is calculated on actual dates of capital contributions and distributions and the ending aggregate members’ equity net asset value (residual value). Financial highlights are calculated for the members taken as a whole and the above ratios have been annualized, where applicable. Ratios are calculated by dividing the members’ share of net investment income and total expenses by the weighted average units outstanding during the period. Management fees and non-recurring organizational expenses are included in these ratios. Net investment income ratio excludes the impact of incentive fees. The calculation of these highlights on an individual member basis may yield results that vary from those stated herein. Note 10. Subsequent Events The Managing Member and the Investment Manager have evaluated subsequent events through November 8, 2024, the date that these financial statements were available to be issued, and have determined that there were no subsequent events requiring recognition or disclosure in the financial statements other than as noted below. On November 8, 2024, the Fund entered into an agreement and plan of merger (the “Onshore Merger Agreement”) with Willow Tree Capital Corporation, a Maryland corporation managed by the Investment Manager, under which the Fund would merge with and into Willow Tree Capital Corporation, with the Willow Tree Capital Corporation surviving the merger (the “Onshore Merger”). The Investment Manager serves as investment adviser to the Willow Tree Capital Corporation. Under the Onshore Merger Agreement, the members of the Fund would receive shares of Willow Tree Capital Corporation’s common stock, par value $0.01 per share (the “Common Stock”) at a fixed exchange rate for each unit of membership interest held by such members.


