Exhibit 99.1
MANAGEMENT’S DISCUSSION AND ANALYSIS OF
FINANCIAL CONDITION AND RESULTS OF OPERATIONS
The following discussion and analysis of our financial condition and results of operations should be read in conjunction with our consolidated financial statements and related notes thereto. In addition to historical consolidated financial information, the following discussion contains forward-looking statements that reflect our plans, estimates, and beliefs that involve risks and uncertainties. As a result of many important factors, our actual results and the timing of events may differ materially from those anticipated in these forward-looking statements. All amounts included herein with respect to the six months ended June 30, 2024 and 2023 are derived from our unaudited condensed consolidated financial statements in this filing. Our financial statements have been prepared in accordance with U.S. Generally Accepted Accounting Principles, or U.S. GAAP.
Overview
We are a holding company incorporated in the Cayman Islands, it is a holding company with no business operations. Wuxi Mingteng Mould Technology Co., Ltd. (“Wuxi Mingteng Mould”) is our PRC subsidiary, incorporated in the PRC. We are an automotive mold developer and supplier in China. Wuxi Mingteng Mould was established in December 2015, focusing on molds used in auto parts. We are committed to providing customers with comprehensive and personalized mold services, covering mold design and development, mold production, assembly, testing, repair and after-sales service.
We provide a wide variety of products. Our main products are casting molds for turbocharger systems, braking systems, steering and differential system, and other automotive system parts.
We also produce molds for new energy electric vehicle motor drive systems, battery pack systems, and engineering hydraulic components, which are widely used in automobile, construction machinery and other manufacturing industries.
Our production plant is located in Wuxi, China. We use technologically advanced procedures and equipment to produce molds. We use a mold manufacturing processing center, which allocates different machines to manufacture according to the size of the mold and the shape of the accessories. Our mold development and production process are supported by our research and development (“R&D”) team (including experts such as foundry technologists and mold designers), using advanced Computer Aided Design (“CAD”), Computer Aided Manufacturing (“CAM”) and software technologies to analyze feasibility and validity of mold designs and specifications. Our quality and capability have obtained the 2019 Jiangsu High-tech Enterprise Certification and ISO9001:2015 certification.
In order to improve our technical level and service quality, we are committed to developing and producing molds through technological innovation. We believe that the design and quality of our molds are extremely important to the accuracy and efficiency of our customers’ manufacturing processes. Our existing technical team consists of 21people, all with professional knowledge in casting, machining, and automation. They analyze customers’ casting and processing technology, propose solutions and improvement suggestions to customers to enhance the efficiency and safety of their products. In addition, we believe our research and patents in the field of automotive casting molds have earned us recognition from our customers, and we have registered 13 authorized utility model and invention patents in China.
We are a supplier to a number of Chinese listed companies and have established long-term business relationships with leading major customers in the automobile parts manufacturing industry, most of whom have more than 5 years of business relationship with us. Our customers include Kehua Holding Co., Ltd. (ticker: 603161), Wuxi Lihu Booster Technology Co., Ltd. (ticker: 300580), and Wuxi Best Precision Machinery Co., Ltd. (ticker: 300694). Our close relationships with these major customers demonstrate our strengths in technical capabilities, service reputation and product quality.
Our revenue mainly comes from customized mold production, mold repair and machining services. The revenue derived from customized mold production accounted for 71.3% and 84.3% of our total revenue for the six months ended June 30, 2024 and 2023, respectively. The revenue derived from mold repair accounted for 11.1% and 13.4% of our total revenue for the six months ended June 30, 2024 and 2023, respectively. The revenue derived from machining services accounted for 17.6% and 2.3% of our total revenue for the six months ended June 30, 2024 and 2023, respectively.
Our organization
The following chart shows our current corporate structure:
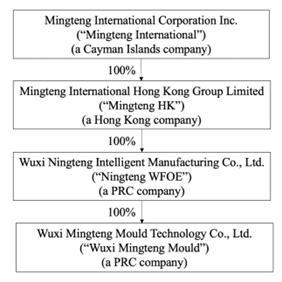
Mingteng International was incorporated under the laws of the Cayman Islands on September 20, 2021, as an exempted company with limited liability.
Mingteng International owns a 100% equity interest in Mingteng HK, an entity incorporated on November 4, 2021, in accordance with the laws and regulations in Hong Kong. Mingteng HK is a holding company and is not actively engaged in any business.
Ningteng WFOE was incorporated on September 6, 2022, under the laws of the PRC. Ningteng WOFE is a wholly owned subsidiary of Mingteng HK and is not actively engaged in any business.
Wuxi Mingteng Mould is a limited liability company incorporated on December 15, 2015, under the laws of the PRC. Wuxi Mingteng Mould is a wholly owned subsidiary of Ningteng WFOE and is our operating entity. Wuxi Mingteng Mould is primarily engaged in providing clients with comprehensive and personalized mold services and solutions in the PRC, including mold design and development; mold production, repair, testing and adjustment.
Factors Affecting Our Results of Operations
Impact of COVID-19 Outbreak
The outbreak of a novel strain of coronavirus (“COVID-19”) has resulted in quarantines, travel restrictions, and the temporary closure of stores and business facilities globally for the past two years. In March 2020, the World Health Organization declared COVID-19 as a pandemic. Given the rapidly expanding nature of the COVID-19 pandemic, and because substantially all of our business operations and our workforce are concentrated in China, we believe there is a risk that our business, results of operations, and financial condition will be adversely affected. Potential impact on our results of operations will also depend on future developments and new information that may emerge regarding the duration and severity of COVID-19 and the actions taken by government authorities and other entities to contain COVID-19 or mitigate its impact, almost all of which are beyond our control.
COVID-19 has had a certain degree of influence on the Company’s operations during the years ended December 31, 2021 and 2022. However, with the effective operation of epidemic prevention measures, the epidemic did not seriously affect the Company’s order volume and production capacity.
In December 2022, China released a set of 10 optimized COVID-19 rules and eliminated most containment measures. In late December, the number of infections in the Company increased and production activity slowed down. With the recovery of employees, the production and operations of the Company gradually returned to normal in 2023. The continuing impact of COVID-19 remains unpredictable. In coping with the ongoing COVID-19 pandemic, the Company will reasonably dispatch employees and arrange working hours in the future to ensure the steady progress of production activities.
Changes in the availability, quality and cost of key raw materials, transportation and other necessary supplies or services
Our raw materials consist primarily of steel plates and casting. The cost of raw materials represents a significant portion of our total cost of revenues.
Raw material costs represent 30.03% and 39.38% of our total cost of revenues for the six months ended June 30, 2024 and 2023, respectively.
We are exposed to fluctuations in the prices of raw materials, transportation, and other necessary supplies or services due to factors beyond our control, such as policies, inflation, and changes in the supply and demand for such relevant raw materials. We may not be able to offset the price increases by increasing our product prices, in which case our margins would decline and our financial condition and results of operations could be materially and adversely affected. In addition, if we significantly increase the prices of our products, we may lose our competitive advantage. This in turn could result in a loss of sales and customers. In either case, our business, financial condition, and results of operations could be materially and adversely affected.
Our business is dependent on certain major customers and changes or difficulties in our relationships with our major customers may harm our business and financial results.
For the six months ended June 30, 2024 and 2023, ten major customers accounted for approximately 77.8% and 89.0% of the Company’s total sales, respectively. Any decrease in sales to these major customers may negatively impact the Company’s operations and cash flows if the Company fails to increase its sales to other customers.
As of June 30, 2024 and December 31, 2023, ten major customers accounted for approximately 82.6% and 85.7% of the Company’s accounts receivable balance, separately.
If we cannot maintain long-term relationships with our major customers or replace major customers from period to period with equivalent customers, the loss may negatively impact our business, financial condition, and results of operations. If our customer base decreases, we may not be able to generate sufficient revenue to cover our increased costs and expenses. As a result, our business and results of operations may be materially and adversely affected.
Our business is related to the development of upstream and downstream industries.
Mold production is closely related to the development of upstream and downstream industries. With the gradual saturation of the Chinese automotive market, the production of molds related to auto parts may be affected.
Results of Operations
Comparison of Results of Operations for the Six Months Ended June 30, 2024 and 2023
The following table summarizes our results of unaudited operations for the six months ended June 30, 2024 and 2023, respectively, and provides information regarding the dollar and percentage increase or (decrease) during such periods.
(UNAUDITED)
| | | For the Six Months Ended June 30, | |
| | | 2024 | | | 2023 | | | Variance | |
| | | Amount | | | % of revenue | | | Amount | | | % of revenue | | | Amount | | | % | |
| | | | | | | | | | | | | | | | | | | |
| Revenues | | $ | 4,646,389 | | | | 100.0 | % | | $ | 3,667,888 | | | | 100.0 | % | | $ | 978,501 | | | | 26.7 | % |
| Cost of revenues | | | (2,994,601 | ) | | | (64.5 | )% | | | (2,104,452 | ) | | | (57.4 | )% | | | (890,149 | ) | | | 42.3 | % |
| Gross profit | | | 1,651,788 | | | | 35.5 | % | | | 1,563,436 | | | | 42.6 | % | | | 88,352 | | | | 5.7 | % |
| | | | | | | | | | | | | | | | | | | | | | | | | |
| Operating expenses: | | | | | | | | | | | | | | | | | | | | | | | | |
| Selling expenses | | | 125,535 | | | | 2.7 | % | | | 72,735 | | | | 2.0 | % | | | 52,800 | | | | 72.6 | % |
| General and administrative expenses | | | 1,512,909 | | | | 32.6 | % | | | 582,702 | | | | 15.9 | % | | | 930,207 | | | | 159.6 | % |
| Research and development expenses | | | 288,182 | | | | 6.2 | % | | | 224,756 | | | | 6.1 | % | | | 63,426 | | | | 28.2 | % |
| Total operating expenses | | | 1,926,626 | | | | 41.5 | % | | | 880,193 | | | | 24.0 | % | | | 1,046,433 | | | | 118.9 | % |
| | | | | | | | | | | | | | | | | | | | | | | | | |
| (Loss)income from operations | | | (274,838 | ) | | | (5.9 | )% | | | 683,243 | | | | 18.6 | % | | | (958,081 | ) | | | (140.2 | )% |
| | | | | | | | | | | | | | | | | | | | | | | | | |
| Other income (expenses): | | | | | | | | | | | | | | | | | | | | | | | | |
| Government subsidies | | | - | | | | - | % | | | 2,886 | | | | 0.1 | % | | | (2,886 | ) | | | (100 | )% |
| Interest income | | | 579 | | | | 0.0 | % | | | 3,289 | | | | 0.1 | % | | | (2,710 | ) | | | (82.4 | )% |
| Interest expense | | | (15,749 | ) | | | (0.3 | )% | | | (27,474 | ) | | | (0.8 | )% | | | 11,725 | | | | (42.7 | )% |
| Other income, net | | | 16,618 | | | | 0.4 | % | | | 6,570 | | | | 0.2 | % | | | 10,048 | | | | 152.9 | % |
| Total other income(expenses), net | | | 1,448 | | | | (0.0 | )% | | | (14,729 | ) | | | (0.4 | )% | | | 16,177 | | | | (109.8 | )% |
| | | | | | | | | | | | | | | | | | | | | | | | | |
| (Loss)income before income taxes | | | (273,390 | ) | | | (5.9 | )% | | | 668,514 | | | | 18.2 | % | | | (941,904 | ) | | | (140.9 | )% |
| | | | | | | | | | | | | | | | | | | | | | | | | |
| Benefit from(provision for) income taxes | | | 7,548 | | | | 0.2 | % | | | (106,187 | ) | | | (2.9 | )% | | | 113,735 | | | | (107.1 | )% |
| | | | | | | | | | | | | | | | | | | | | | | | | |
| Net (loss) income | | $ | (265,842 | ) | | $ | (5.7 | )% | | $ | 562,327 | | | $ | 15.3 | % | | $ | (828,169 | ) | | | (147.3 | )% |
Revenue
Currently, we have three revenue streams: mold production, mold repair and machining services.
Total revenue for the six months ended June 30, 2024 increased by $978,501, or 26.7%, to $4,646,389 from $3,667,888 for the same period in 2023. After consideration of the impact of rising exchange rates, total revenue increased by 29.9% or 7.6 million in RMB base currency.
The following table sets forth the breakdown of our unaudited revenue for the six months ended June 30, 2024 and 2023, respectively:
(UNAUDITED)
| | | For the Six Months Ended June 30, | |
| | | 2024 | | | 2023 | | | Variance | |
| | | Amount | | | % | | | Amount | | | % | | | Amount | | | % | |
| | | | | | | | | | | | | | | | | | | |
| Mold production | | $ | 3,312,007 | | | | 71.3 | % | | $ | 3,093,511 | | | | 84.3 | % | | $ | 218,496 | | | | 7.1 | % |
| Mold repair | | | 518,300 | | | | 11.1 | % | | | 489,465 | | | | 13.4 | % | | | 28,835 | | | | 5.9 | % |
| Machining services | | | 816,082 | | | | 17.6 | % | | | 84,912 | | | | 2.3 | % | | | 731,170 | | | | 861.1 | % |
| Total | | $ | 4,646,389 | | | | 100.0 | % | | $ | 3,667,888 | | | | 100.0 | % | | $ | 978,501 | | | | 26.7 | % |
Revenues from mold production. Revenues from mold production accounted for 71.3% and 84.3% of our total revenues for the six months ended June 30, 2024 and 2023, respectively. Revenue from mold production increased by $218,496, or 7.1% from $3,093,511 for the six months ended June 30, 2023 to $3,312,007 for the same period in 2024. After consideration of the impact of rising exchange rates, revenue from mold production in the first half of 2024 has actually increased by 9.8% compared to the same period in 2023 measured in CNY base currency. This indicates that Wuxi Mingteng Mould maintains long-term relationships with major customers and continues to open up the mold market in the fiscal year 2024.
Revenues from mold repair. Revenues from mold repair accounted for 11.1% and 13.4% of our total revenues for the six months ended June 30, 2024 and 2023, respectively. The declined in proportion mainly due to the total revenue had increased. Revenues from mold repair only increased by $28,835, or 5.9% from $489,465 for the six months ended June 30, 2023 to $518,300 for the same period in 2024.
Revenues from machining services. Revenues from machining services accounted for 17.6% and 2.3% of our total revenues for the six months ended June 30, 2024 and 2023, respectively. Revenues from machining services has significantly increased by $731,170, or 861.1% from $84,912 for the six months ended June 30, 2023 to $816,082 for the same period in 2024. The revenue derived from machining services has experienced rapid growth in fiscal year 2023 and the first half of year 2024, its mainly attributed to the company continuing investment in improving our production capacity in the second half of year 2023 and the first half of year 2024. Revenues from machining services gradually serve as a main source of revenue for the Company in the first half of year 2024. Currently, Kehua Holding Co., Ltd. and Suzhou Green Control Transmission Technology Co., Ltd are our major customers in machine services.
Cost of Revenues
The following table sets forth the breakdown of our unaudited cost of revenue for the six months ended June 30, 2024 and 2023, respectively:
(UNAUDITED)
| | | For the Six Months Ended June 30, | |
| | | 2024 | | | 2023 | | | Variance | |
| | | Amount | | | % | | | Amount | | | % | | | Amount | | | % | |
| | | | | | | | | | | | | | | | | | | |
| Mold production | | $ | 2,170,068 | | | | 72.5 | % | | $ | 1,849,083 | | | | 87.9 | % | | $ | 320,985 | | | | 17.4 | % |
| Mold repair | | | 204,433 | | | | 6.8 | % | | | 188,117 | | | | 8.9 | % | | | 16,316 | | | | 8.7 | % |
| Machining services | | | 590,050 | | | | 19.7 | % | | | 35,988 | | | | 1.7 | % | | | 554,062 | | | | 1539.6 | % |
| Sales tax | | | 30,050 | | | | 1.0 | % | | | 31,264 | | | | 1.5 | % | | | (1,214 | ) | | | (3.9 | )% |
| Total | | $ | 2,994,601 | | | | 100.0 | % | | $ | 2,104,452 | | | | 100.0 | % | | $ | 890,149 | | | | 42.3 | % |
The cost of revenues increased by $890,149, or 42.3%, to $2,994,601 for the six months ended June 30, 2024, from $2,104,452 for the same period in 2023. After considered of the impact of rising exchange rates, cost of revenue in the first half of 2024 had actually increased by 45.9 compared to the same period in 2023 measured in CNY base currency, which was mainly due to the increase in outside processing services, labor cost and manufacturing costs.
The total revenue has increased by 26.7%, but the total cost of revenue has increased by 42.3, the reasons for the cost increase much more than revenue are as follows:
First is the increase in the investment in machinery and equipment in fiscal year 2023 and the first half of year 2024. In order to pursue the future development of the aluminum alloy pressure casting mold business and machining service business and expand production capacity, the total investment of production machinery and equipment for the six months ended 2024 and the second half of year 2023 was $615,935 and $650,982, respectively, resulting in an increase in depreciation & maintenance expense which allocated to production costs of $43,844. The current depreciation expense has increased to $220,010 for the six months ended 2024 compared with $176,166 for the same period in 2023. Due to the expansion of production scale in the first half of year 2024, the total manufacturing costs had increased by $350,821, or 56.39%, amount to $972,995 for the six months ended in June 30, 2024 from $622,174 as compared with the same period in 2023, such as the low-value consumption materials, charges for water and electricity and outside processing services costs also increase accordingly as the scale of production orders increased.
Second, in order to promote the future development of the aluminum alloy pressure casting mold business and machining service and expand our production capacity, Wuxi Mingteng Mould hired more production workers in the second half of year 2023 and 2024, which lead to an increase in labor cost by approximately $475,230 compared with the same period in year 2023.This is the main incremental for the cost of revenue.
Last, due to the expansion of sales, our production orders had increased, which means the materials assumptions also increased accordingly, the assumption of materials had increased by $174,495, amount to $915,032 for the six months ended 2024 from $740,537 for the same period in 2023.
Gross Profit
Total gross profit was $1,651,788 for the six months ended June 30, 2024, an increase of $88,352 from $1,563,436 for the same period in 2023. Gross profit margin declined by 16.6%, to 35.5% or the six months ended June 30, 2024, from 42.6% for the same period in 2023.
Our gross profit and gross profit margin by product types were as follows:
(UNAUDITED)
| | | For the Six Months Ended June 30, | |
| | | 2024 | | | 2023 | | | Variance | |
| | | Gross profit | | | Margin % | | | Gross profit | | | Margin % | | | Gross profit | | | Margin % | |
| | | | | | | | | | | | | | | | | | | |
| Mold production | | $ | 1,141,939 | | | | 34.5 | % | | $ | 1,244,428 | | | | 40.2 | % | | $ | (102,489 | ) | | | (8.2 | )% |
| Mold repair | | | 313,867 | | | | 60.6 | % | | | 301,348 | | | | 61.6 | % | | | 12,519 | | | | 4.2 | % |
| Machining services | | | 226,032 | | | | 27.7 | % | | | 48,924 | | | | 57.6 | % | | | 177,108 | | | | 362.0 | % |
| Sales tax | | | (30,050 | ) | | | - | | | | (31,264 | ) | | | - | | | | 1,214 | | | | (3.9 | )% |
| Total | | $ | 1,651,788 | | | | 35.5 | % | | $ | 1,563,436 | | | | 42.6 | % | | $ | 88,352 | | | | 5.7 | % |
Gross profit for mold production decreased by $102,489 to $1,141,939 for the six months ended June 30, 2024, as compared to $1,244,428 for the same period in 2023. The manufacturing costs, labor costs and the depreciation expense collocated to cost of sales all increased due to expanded production scale, which resulted in increase in total cost of sales. Costs increased at a greater rate than the increase in revenue for the six months ended June 30, 2024 compared with the same period in 2023, which led to the decrease in gross profit and gross profit margin. Mold production is the main source of revenue of the Company, Due to a significant increase in order volume in the first half of 2024 compared to the first half of 2023, the total cost of sales increased by 17.4% which adversely affected the profit margin of mold production business. Due to the fact that mold production remains the main source of revenue for the Company, the increase in manufacturing costs and labor costs absorption was the largest. As the mold production industry market competition intensifies, we may lose our competitive advantage if we significantly increase the prices of our products, in order to maintain the Company’s competitive advantage, while product costs had increased, we had not increased the selling price of our products, which resulted in declined gross profit.
Gross profit for mold repair had a slightly increase in gross profit by $12,519 to $313,867 for the six months ended June 30, 2024, as compared to $301,348 for the same period in 2023. The gross profit margin decreased by 1.6% for the six months ended June 30, 2024 to 60.6% from 61.6% for the same period in 2023, that was due to unfavorable exchange rate fluctuations. Since the mold repair business seldom needs complicated design and processing it was less affected by the increase in the labor costs and depreciation expenses.
Gross profit for machining services had a rapid growth in gross profit by $177,108 to $226,032 for the six months ended June 30, 2024, as compared to $48,924 for the same in 2023, it was attributed to the Company’s continuous promotion of machining services business and improvement of production capacity. Despite the gross profit had increased, the gross profit margin had decreased sharply from 57.6% for the six months ended June 30, 2023 to 27.7% for the same period in 2024, it’s mainly due to the company continuing investment in production equipment for promoting the machining services business, and the increase in manufacturing costs due to the sales volume increased, and the increase in labor costs as mentioned above. The machining services business had formed scale production in the first half of 2024, due to the high competition pressure in the mold production industry, the Company has limited bargaining power, it is difficult to increase the order price, in order to avoid wasting productivity resources, we can only adopt a marketing policy of low profit and high sales volume, so the gross profit margin declined greatly.
Operating Expenses
(UNAUDITED)
| | | For the Six Months Ended June 30, | |
| | | 2024 | | | 2023 | | | Variance | |
| | | Amount | | | % | | | Amount | | | % | | | Amount | | | % | |
| | | | | | | | | | | | | | | | | | | |
| Selling expenses | | $ | 125,535 | | | | 6.5 | % | | $ | 72,735 | | | | 8.3 | % | | $ | 52,800 | | | | 72.6 | % |
| General and administrative expenses | | | 1,512,909 | | | | 78.5 | % | | | 582,702 | | | | 66.2 | % | | | 930,207 | | | | 159.6 | % |
| Research and development expenses | | | 288,182 | | | | 15.0 | % | | | 224,756 | | | | 25.5 | % | | | 63,426 | | | | 28.2 | % |
| Total operating expenses | | $ | 1,926,626 | | | | 100.0 | % | | $ | 880,193 | | | | 100.0 | % | | $ | 1,046,433 | | | | 118.9 | % |
Selling Expenses
Selling expenses were $125,353 for the six months ended June 30, 2024, an increase of $52,800, or 72.6%, from $72,735 for the same period in 2023. The increase in selling expenses was mainly due to a promotion and publicity expenses amount to $30,964 in the year 2024, and due to the expansion of sales volume, the transportation expenses increased by $15,936, and the increase in visiting customers has led to an increase in business entertainment expenses amount to $9,574.
General and Administrative Expenses
Our general and administrative expenses were $1,512,909 for the six months ended June 30, 2024, an increase of $930,207 or 159.6%, from $582,702 for the same period in 2023. The increase was mainly due to a) the validity period for the accrual of social security and housing provident funds under the laws of the PRC for the six months ended 2022 has expired on June 30,2024, which should be written off, led to the decrease of $40,558 for the period ended June 30, 2024 compared to 2023; and b) the increase of consulting fee for the six months ended June 30, 2024 by $819,715 compared with the same period in 2023, the company had paid large amount of consulting and professional fees for the Initial Public Offering(“IPO”) in April 2024; and c) due to the number of employees increased, the employee welfare expenses had increased by $15,646; and d) in order to increase sales volume and develop new customers, the business travel expenses increased by $18,548 for the six months ended June 30, 2024 as compared to the same period in 2023; e) due to the increase in the number of employees and the expansion of production scale, office expenses have increased by $35,990 for the six months ended June 30, 2024 as compared to the same period in 2023;f) after the successful listing of the Company, three independent directors were hired, resulting in an increase in salaries of $22,500.
Research and Development Expenses
Research and development expenses increased by $63,426, or 28.2%, to $288,182 for the six months ended June 30, 2024, from $224,756 for the same period in 2023. This increase is mainly attributable to the a) increase in labor expenses by $57,068 for the six months ended 2024 due to the increased number of employees involved in R&D work and the increase in average salary; b) increase in the material assumption by $12,348 for the six months ended June 30, 2024 compared with the same period in 2023, c) decrease in patents application expenses by $5,459 for the six months ended June 30, 2024.
Other income
Government subsidies
We receive various government subsidies from time to time, such as the “The High-Tech Enterprise Cultivation Award”, we cannot predict the likelihood or amount of any future subsidies.
For the six months ended June 30, 2024, no government subsidies were received yet. For the same period in 2023, government subsidies were $2,886.
Interest income
For the six months ended June 30, 2024, interest income was $579, decreased by $2,710 as compared with the same period in 2023, interest income was $3,289 for the same period in 2023. This mainly due to the decrease in average bank deposits during the six months ended June 30, 2024 compared to the same period in 2023, and the interest rate of bank deposit had declined during the second half of 2023 and the first half of 2024.
Interest expense
For the six months ended June 30, 2024, interest expense was $15,749. For the same period in 2023, interest expense was $27,474, the decrease of $11,725 mainly due to the decline of average bank loans for the six months ended June 30, 2024 compared with the same period in 2023, in addition, the reduction in bank loan interest rates was another reason for the decrease in interest expenses.
Other income, net
For the six months ended June 30, 2024 and 2023, other income, net mainly includes a) sales of waste material of $4,781 and $3,722 in the first half of 2024 and 2023, respectively, b) VAT tax refund of $18,924 and 2,848 for the six months ended June 30, 2024 and the same period in 2023, respectively, c) loss on disposal of assets of $7,087 for the six months ended June 30, 2024.
Benefit from/Provision for Income Taxes
Our benefit from income taxes was $7,548 for the six months ended June 30, 2024, for the same period in 2023, there was a tax provision of $106,187, the decrease of $113,735, or 107.1% was mainly due to the a)the decrease in pre-tax profit for the PRC subsidiary, the current income tax expense has decreased by $101,801, and b) the current deferred income tax decreased by $10,293, c) deductible R&D expenditure which led to a decrease of $13,265, its partially offset by d) the reversal of allowance for credit losses and inventory impairment loss which led to a total increase of $3,426, e) the increase of $1,332 from adjustment of entertainment expense, f) the current income tax expenses increased by $6,867 which arisen from the adjustment of depreciation of one-time tax deductible properties and equipment purchased in fiscal year 2023.
Under the Enterprise Income Tax (“EIT”) Law of the PRC, domestic enterprises are usually subject to a unified 25% EIT rate while preferential tax rates, tax holidays, and even tax exemptions may be granted on a case-by-case basis. The PRC tax authorities grant preferential tax treatment to High and New Technology Enterprises (“HNTEs”). Under this preferential tax treatment, HNTEs are entitled to an income tax rate of 15%, subject to a requirement that they re-apply for HNTE status every three years. Since Wuxi Mingteng Mould was approved as an HNTE in December 2019, Wuxi Mingteng Mould is entitled to a reduced income tax rate of 15% beginning December 2019 and is able to enjoy the reduced income tax rate through December 2022. In November 2022, Wuxi Mingteng Mould reapplied to obtain the recognition of HNTE and the preferential rate of 15% was extended to November 2025.
Net Loss and Income
As a result of the foregoing, our net loss for the six months ended June 30, 2024 was $265,842, and for the same period in 2023, the net income was $562,327.
Liquidity and Capital Resources
As of June 30, 2024 and 2023, we had cash and cash equivalents of $1,381,406 and $1,590,204, respectively.
Our main sources of operating funds are from net income and external borrowings and we are confident they are sufficient to sustain our operations after the offering.
Working Capital
Total working capital as of June 30, 2024 amounted to $3,505,610 compared to $3,063,694 as of June 30, 2023. The current assets increase mainly due to the increase in accounts receivable and other receivables-bank acceptance notes totally of $1,108,145, and inventories of $41,847, its partially offset by the decreases in advance to supplier of $24,713 and the decreases in cash and cash equivalents of $208,798. Current liabilities amounted to $4,152,383 as of June 30, 2024 as compared to $3,669,385 as of June 30, 2023. This increase of liabilities was attributable mainly to the increases in short-term loan of $19,224, and accounts payable of $469,220, and advance from customers of $201,539, partially offset by the decrease in other liabilities totally by of $52,238, and decrease in current portion of lease liabilities of $43,025, and the decrease by $32,471 due to the repayment of long-term payable.
Capital Needs
To date, we have financed our operations primarily through cash flows from operations, short-term loans from bank and proceeds from public offering. With the increasing market competition in the mold production industry, our management believes it is necessary to enhance the collection of outstanding accounts receivable and other receivables and to be cautious on operational decisions and project selection. The Company reviews the accounts receivable on a periodic basis and makes general and specific allowances when there is doubt as to the recoverability of individual balances. Our management is confident in the collection of account receivables and other receivables.
Cash Flows Analysis
Six Months Ended June 30, 2024 Compared to Six Months Ended June 30, 2023
The following table sets forth a summary of our unaudited cash flows for the periods indicated:
(UNAUDITED)
| | | For the Six Months Ended
June 30, | |
| | | 2024 | | | 2023 | |
| Net cash used in operating activities | | $ | (663,198 | ) | | $ | (65,621 | ) |
| Net cash used in investing activities | | | (3,159,280 | ) | | | (21,765 | ) |
| Net cash provided by (used in) financing activities | | | 4,154,100 | | | | (56,830 | ) |
| Effect of foreign exchange rate on cash and cash equivalents | | | (6,452 | ) | | | (58,903 | ) |
| Net increase (decrease) in cash and cash equivalents | | | 325,170 | | | | (203,119 | ) |
| Cash and cash equivalents at the beginning of the period | | | 1,056,236 | | | | 1,793,323 | |
| Cash and cash equivalents at the end of the period | | $ | 1,381,406 | | | $ | 1,590,204 | |
Operating Activities
Net cash used in operating activities amounted to $663,198 for the six months ended June 30, 2024. It was primarily due to a) a net loss of $265,842, adjusted by depreciation of $250,604, b) loss on disposal of property and equipment of $7,087, c) deferred income tax of $20,846, and d) recovery of bad debt provision by $8,463, e) increase in account receivable of $248,980 and other receivables-bank acceptance notes of 448,281 due to the increased sales scale, f) decrease in advances to suppliers of $122,765, g) increase in inventories of $122,625 due to the expansion of order volume, h) increase in accounts payable of $229,881 due to the increased purchase volume, i) decrease in advance from customers of $110,497, j) decrease in taxes payable of $115,684 due to the payments of last year’s income tax and additional taxes, and the decreased taxable profit for the six months ended June 30, 2024, k) increase in payroll payable of $39,160 due to the social security and public housing funding, and the salary for independent directors.
Net cash used in operating activities amounted to $65,621 for the six months ended June 30, 2023. It was primarily due to a) a net income of $562,327, adjusted by depreciation of $195,321, deferred income tax of $163,464; b) increase in account receivable of $426,906 and other receivables-bank acceptance notes of $60,322 due to the increased sales scale; c) increase in inventories of $278,448 due to the expansion of order volume; d) decrease in taxes payable of $393,478 due to the payments of last year’s income tax and additional taxes ; e) increase in advance to supplier of $58,638; and partially offset by a) increase in accounts payable of $106,258; b) increase in payroll payable of $75,478.
Investing Activities
Net cash used in investing activities amounted to $3,159,280 for the six months ended June 30, 2024. It was primarily due to purchase of property and equipment amount of $625,053, and the deposit made for potential equity-method investment amount of $2,478,000 in current period, and the prepayment for non-current assets of $56,227.
Net cash used in investing activities amounted to $21,765 for the six months ended June 30, 2023. It was primarily due to purchase of property and equipment.
Financing Activities
Net cash provided by financing activities was $4,154,100 for the six months ended June 30, 2024. During the first half of 2024, the Company received proceeds from short-term loans of $1,407,441 and repaid short-term loans of $281,488. Net proceeds from IPO amount to $3,293,096 for the six months ended June 30, 2024, and the deferred offering costs paid by cash amount to $264,949.
Net cash used in financing activities was $56,830 for the six months ended June 30, 2023. During the first half of 2023, the Company received proceeds from short-term loans of $1,443,184 and repaid short-term loans of $1,371,025.
Loan Facilities
On March 23, 2022, Wuxi Mingteng Mould entered into an additional short-term loan agreement with Jiangsu Wuxi Rural Commercial Bank with amount of RMB 4.5 million (approximately $0.67 million), with an annual interest rate of 4.45%. The maturity date of the loan is March 22, 2023. No collateral was required for the loan. The loan was repaid upon maturity.
On March 4, 2022, Wuxi Mingteng Mould entered into a secured short-term loan agreement with Bank of Jiangsu with amount of RMB 5 million (approximately $0.75 million), with an annual interest rate of 4%. The maturity date of the loan is March 3, 2023. Wuxi Mingteng Mould pledged two of their patent rights as collateral. The loan was repaid upon maturity.
On January 31, 2023, Wuxi Mingteng Mould entered into a short-term loan agreement with Wuxi Branch of Bank of China with amount of RMB 5 million (approximately $0.72 million), with an annual interest rate of 3.4%. The maturity date of the loan is January 30, 2024. Mr. Yingkai Xu and Ms. Jingzhu Ding provided joint personal guarantees for the loan. Wuxi Mingteng Mould had fully repaid the loan in advance on October 7, 2023.
On February 28, 2023, Wuxi Mingteng Mould entered into an additional unsecured short-term loan agreement with Bank of Jiangsu with amount of RMB 5 million (approximately $0.72 million), with an annual interest rate of 3.7%. The maturity date of the loan is February 27, 2024. Wuxi Mingteng Mould made a repayment of RMB 3 million (approximately $0.42 million) in advance on October 7, 2023, Wuxi Mingteng Mould had fully repaid the rest of the balance of RMB 2 million (approximately $0.28 million) on February 21, 2024.
On February 21, 2024, Wuxi Mingteng Mould entered into an additional unsecured short-term loan agreement with Bank of Jiangsu with principal amount of RMB 10 million (approximately $1.4 million), with an annual interest rate of 2.95%. The maturity date of the loan is February 20, 2025.
Contingencies
From time to time, the Company may be subject to certain legal proceedings, claims and disputes that arise in the ordinary course of business. Amounts accrued, as well as the total amount of possible losses with respect to such matters, individually and in the aggregate, are not deemed to be material to the consolidated financial statements.
Off-Balance Sheet Arrangements
We have not entered into any financial guarantees or other commitments to guarantee the payment obligations of any third parties. In addition, we have not entered into any derivative contracts that are indexed to our own shares and classified as shareholders’ equity, or that are not reflected in our financial statements. Furthermore, we do not have any retained or contingent interest in assets transferred to an unconsolidated entity that serves as credit, liquidity or market risk support to such entity. Moreover, we do not have any variable interest in an unconsolidated entity that provides financing, liquidity, market risk or credit support to us or engages in leasing, hedging or research and development services with us.
Inflation
Inflationary factors, such as increases in the cost of raw materials, personnel and overhead costs, could impair our operating results. Although we do not believe that inflation has had a material impact on our financial position or results of operations to date, a high rate of inflation in the future may have an adverse effect on our ability to maintain current levels of gross margin and operating expenses if the revenues from our products do not increase with such increased costs. The global economy, including the U.S. economy, has experienced rising inflation in recent months. We source key materials from third parties located in China. Although China has not experienced significant inflation and thus inflation has not had a material impact on our results of operations, we cannot provide any assurances that we will not be affected in the future by higher rates of inflation in mainland China. Sustained or rising inflation may result in increased costs to us in obtaining supplies of key materials to produce our products. If we explore the international market in the future, inflation may affect us by increasing our cost of labor and freight costs for our exported products. As a result, our results of operations may be adversely impacted.
Our plan to mitigate inflationary pressures are as follows: 1) control the growth of external costs by locking in prices and buying in bulk; 2) consider user experience and profitability, strengthen communication with customers, and adjust our pricing strategy to meet cost increases; and 3) strengthen internal management and technology research, to improve production efficiency and reducing the waste of production resources.
Supply Chain Analysis
For the six months ended June 30, 2024, there were four suppliers accounted for approximately 13.9%, 13.6%, 13.5% and 11.0%of the total purchases, none for the same period in 2023 accounted for more than 10%.
The raw materials used in production are mainly universal, such as steel and castings, which are highly replaceable and have a wide range of procurement sources. Therefore, we do not have a major dependence on suppliers, and the loss of some suppliers will not have a significant impact on our production.
Seasonality
The nature of our business does not appear to be affected by seasonal variations.
Critical Accounting Policies.
We prepare our consolidated financial statements in accordance with U.S. GAAP. These accounting principles require us to make judgments, estimates and assumptions on the reported amounts of assets and liabilities at the end of each fiscal period, and the reported amounts of revenues and expenses during each fiscal period. We continually evaluate these judgments and estimates based on our own historical experience, knowledge and assessment of current business and other conditions, our expectations regarding the future based on available information and assumptions that we believe to be reasonable.
The selection of critical accounting policies, the judgments and other uncertainties affecting the application of those policies and the sensitivity of reported results to changes in conditions and assumptions are factors that should be considered when reviewing our financial statements. We believe the following accounting policies involve the most significant judgments and estimates used in the preparation of our consolidated financial statements.
Use of estimates
In preparing the consolidated financial statements in conformity with U.S. GAAP, management makes estimates and assumptions that affect the reported amounts of assets and liabilities and disclosures of contingent assets and liabilities at the dates of the consolidated financial statements, as well as the reported amounts of revenue and expenses during the reporting periods. Significant items subject to such estimates and assumptions include, but are not limited to, the assessment of the allowance for doubtful accounts, the allowance for inventory obsolescence, useful lives of property and equipment, the recoverability of long-lived assets, provision necessary for contingent liabilities. Actual results could differ from those estimates.
Fair value of financial instruments
Accounting Standards Codification (“ASC”) 825-10 requires certain disclosures regarding the fair value of financial instruments. Fair value is defined as the price that would be received to sell an asset or paid to transfer a liability in an orderly transaction between market participants at the measurement date. A three-level fair value hierarchy prioritizes the inputs used to measure fair value. The hierarchy requires entities to maximize the use of observable inputs and minimize the use of unobservable inputs. The three levels of inputs used to measure fair value are as follows:
| | ● | Level 1 - inputs to the valuation methodology are quoted prices (unadjusted) for identical assets or liabilities in active markets. |
| | ● | Level 2 - inputs to the valuation methodology include quoted prices for similar assets and liabilities in active markets, quoted market prices for identical or similar assets in markets that are not active, inputs other than quoted prices that are observable and inputs derived from or corroborated by observable market data. |
| | ● | Level 3 - inputs to the valuation methodology are unobservable. |
Unless otherwise disclosed, the fair value of the Company’s financial instruments including cash, accounts receivable, other receivables-bank acceptance notes, advances to suppliers, prepaid expenses and other receivables, short-term bank loans, accounts payable, advance from customers, due to related parties, taxes payable, and other current liabilities approximate their recorded values due to their short-term maturities. The fair value of longer-term leases approximates their recorded values as their stated interest rates approximate the rates currently available.
The Company’s non-financial assets, such as property and equipment would be measured at fair value only if they were determined to be impaired.
Revenue recognition
The Company accounts for revenue recognition under FASB ASC 606, Revenue from Contracts with Customers (“ASC 606”). In accordance with FASB ASC 606, Revenue from Contracts with Customers, the Company recognizes revenue to represent the transfer of products or services to customers in an amount that reflects the consideration to which the Company expects to be entitled in such exchange. This will require the Company to identify contractual performance obligations and determine whether revenue should be recognized at a point in time or over time, based on when control of the product or the benefit of the services transfers to the customer. Under the guidance of FASB ASC 606, the Company is required to (a) identify the contract with a customer, (b) identify the performance obligations in the contract, (c) determine the transaction price, (d) allocate the transaction price to the performance obligations in the contract and (e) recognize revenue when (or as) the Company satisfies its performance obligations.
The Company’s main business income is divided into three categories, one is mold production, that is, contracts are signed to sell molds widely used in automobile, valve, water pump and other industries according to the customer’s needs. Second is mold repair, which provides customers with mold repair service, or provides sales of mold components. Last is providing customers with machining services, using the Company’s remaining capacity to provide customers with external processing services. Revenues represent the amount of consideration that the Company is entitled to in exchange for the transfer of promised goods or services in the ordinary course of the Company’s activities and is recorded net of value-added tax (“VAT”). Consistent with the criteria of FASB ASC 606, the Group recognizes revenue when the performance obligation in a contract is satisfied by transferring the control of promised goods or services to the customer.
Mold Production:
The Company signs contracts with customers and provides products according to the sales contract or sales list. The clients check the quantity and quality of products received, and then issue a confirmation as the proof of payment. Certain clients may also test the finished products as part of the confirmation process. Revenue is recognized when the Company receives the confirmation of product acceptance.
The Company provides design and production services according to the sales contract or lists. The Company then transports and installs the finished products when clients give their order.
The design services are inseparable from project sales. A mold production contract may include two or more machine components, but all components are customized according to customer requirements. These components need to be combined under the guidance of design plans to produce qualified products to meet the needs of clients. Therefore, these services are highly interdependent and are never transferred to the customer on their own. Customers do not have the option to purchase these services separately principally due to the customization of each project. Accordingly, these services are not considered separate performance obligations and no revenue is associated with these services under FASB ASC 606 until the point in time when the project is complete and client confirmation is received.
The Company provides maintenance services and according to the contracts and the clients do not have the option to purchase these services separately. The promised warranty does not provide the clients with a service in addition to the assurance that the product complies with agreed-upon contract specifications and is considered an assurance warranty. The maintenance services and the warranty are not considered separate performance obligations and no revenue is associated with these services under FASB ASC 606. Historically, the Company has not experienced material costs for quality assurance and, therefore, does not believe an accrual for these costs are necessary.
Mold Repair:
The Company signs contracts with customers and provides repair services according to the contract or list and charges a certain fee. Revenue is recognized only after the repair service has passed the customer’s inspection.
Machining Services:
Machining services is a new revenue stream that occurred in the fiscal year 2021. The Company signs contracts with customers and provides machining services and charges a certain fee. The Company identifies the fulfillment of its obligation when transferring the product and issuing the VAT invoice to customers at which time revenue is recognized.
Cost of revenues
Cost of revenues consists primarily of the cost of raw materials, direct labor and manufacturing costs. We expect that our cost of revenues will increase in absolute amounts in the foreseeable future as we continue to expand our business.
Income taxes
Mingteng International’s subsidiaries in the PRC and Hong Kong are subject to the income tax laws of the PRC and Hong Kong. No taxable income was generated outside the PRC for the fiscal years ended December 31, 2023 and 2022. The Company accounts for income taxes in accordance with ASC 740, Income Taxes. ASC 740 requires an asset and liability approach for financial accounting and reporting for income taxes and allows recognition and measurement of deferred tax assets based upon the likelihood of realization of tax benefits in future years. Under the asset and liability approach, deferred taxes are provided for the net tax effects of temporary differences between the carrying amounts of assets and liabilities for financial reporting purposes and the amounts used for income tax purposes. A valuation allowance is provided for deferred tax assets if it is more likely than not that these items will either expire before the Company is able to realize their benefits or future deductibility is uncertain.
The provisions of ASC 740-10-25, “Accounting for Uncertainty in Income Taxes,” prescribes a more-likely-than-not threshold for financial statement recognition and measurement of a tax position taken (or expected to be taken) in a tax return. It also provides guidance on the recognition of income tax assets and liabilities, classification accounting for interest and penalties associated with tax positions, years open for tax examination, accounting for income taxes in interim periods and income tax disclosures.
There were no material uncertain tax positions as of June 30,2024 and 2023.
Foreign currency translation
The functional currency of the Company’s operations in the PRC is RMB. The consolidated financial statements are translated to U.S. dollars using the period end rates of exchange for assets and liabilities, equity is translated at historical exchange rates, and average rates of exchange (for the period) are used for revenues and expenses and cash flows. As a result, amounts relating to assets and liabilities reported on the statements of cash flows may not necessarily agree with the changes in the corresponding balances on the balance sheets. Translation adjustments resulting from the process of translating the local currency financial statements into U.S. dollars are included in determining comprehensive income/loss. Transactions denominated in foreign currencies are translated into the functional currency at the exchange rates prevailing on the transaction dates. Assets and liabilities denominated in foreign currencies are translated into the functional currency at the exchange rates prevailing at the balance sheet date with any transaction gains and losses that arise from exchange rate fluctuations on transactions denominated in a currency other than the functional currency are included in the results of operations as incurred.
All of the Company’s revenue transactions are transacted in its functional currency. The Company does not enter into any material transaction in foreign currencies. Transaction gains or losses have not had, and are not expected to have, a material effect on the results of operations of the Company.
The following table outlines the currency exchange rates that were used in preparing the consolidated financial statements, representing exchange rate of the People’s Bank of China (PBOC):
| | | June 30, | | | December 31, | | | Six months ended
June 30, | |
| | | 2024 | | | 2023 | | | 2024 | | | 2023 | |
| Foreign currency | | | | | | | | | | | | |
| RMB:1USD | | | 7.1268 | | | | 7.0827 | | | | 7.1051 | | | | 6.9291 | |
Source: The State Administration of Foreign Exchange (http://www.safe.gov.cn/safe/rmbhlzjj/index.html)
Reclassification
Certain prior period amounts have been reclassified to conform to current period presentation. These reclassifications had no impact on net loss or and financial position.
Recent accounting pronouncements
The Company is an “emerging growth company” (“EGC”) as defined in the Jumpstart Our Business Startups Act of 2012 (the “JOBS Act”). Under the JOBS Act, EGC can delay adopting new or revised accounting standards issued subsequent to the enactment of the JOBS Act until such time as those standards apply to private companies. The financial statements may therefore not be comparable to those of companies that comply with such new or revised accounting standards.
In November 2023, the FASB issued ASU 2023-07, Improvements to Reportable Segment Disclosures (Topic 280). This ASU updates reportable segment disclosure requirements by requiring disclosures of significant reportable segment expenses that are regularly provided to the Chief Operating Decision Maker (“CODM”) and included within each reported measure of a segment’s profit or loss. This ASU also requires disclosure of the title and position of the individual identified as the CODM and an explanation of how the CODM uses the reported measures of a segment’s profit or loss in assessing segment performance and deciding how to allocate resources. The ASU is effective for annual periods beginning after December 15, 2023, and interim periods within fiscal years beginning after December 15, 2024. Adoption of the ASU should be applied retrospectively to all prior periods presented in the financial statements. Early adoption is also permitted. This ASU will likely result in us including the additional required disclosures when adopted. We are currently evaluating the potential effect that the updated standard will have on our financial statement disclosures.
In December 2023, the FASB issued ASU 2023-09 “Income Taxes (Topics 740): Improvements to Income Tax Disclosures” to expand the disclosure requirements for income taxes, specifically related to the rate reconciliation and income taxes paid. The ASU is effective for annual periods beginning after December 15, 2024, with early adoption permitted. We are currently evaluating the potential effect that the updated standard will have on our financial statement disclosures.
The Company does not believe other recently issued but not yet effective accounting standards, if currently adopted, would have a material effect on the Company’s consolidated financial position, statements of operations and comprehensive income (loss) and cash flows.
15