Exhibit 99.5
Item 1. Business
Unless the context otherwise requires, references in this annual report on Form 10-K (the “Annual Report”) to “Brigham Minerals,” the “Company,” “we,” “our,” “us” or like terms refer to Brigham Minerals, Inc. and its subsidiaries. References to the “Brigham LLC” refer to Brigham Minerals Holdings, LLC. Brigham Minerals owns an interest in, and acts as the sole managing member of, Brigham LLC. Brigham LLC wholly owns Brigham Resources, LLC (“Brigham Resources”), which wholly owns Brigham Minerals, LLC and Rearden Minerals, LLC (collectively, the “Minerals Subsidiaries”), which are Brigham Resources’ sole material assets.
On April 17, 2019, the Company completed its initial public offering (the “IPO”) of shares of its Class A common stock, par value $0.01 per share (the “Class A common stock”). Unless indicated otherwise or the context otherwise requires, references in this Annual Report to the Company (i) for periods prior to completion of the IPO, refer to the assets and operations (including reserves, production and acreage) of Brigham Resources, excluding the historical results and operations of Brigham Resources Operating, LLC (“Brigham Operating”), which was spun out in connection with the IPO, and (ii) for periods after completion of the IPO, refer to the assets and operations of Brigham Minerals and its subsidiaries, including Brigham LLC, Brigham Resources and the Minerals Subsidiaries.
Overview
We formed our company in 2012 to acquire and actively manage a portfolio of mineral and royalty interests in the core of what we view as the most active, highly economic, liquids-rich resource plays across the continental United States. Our primary business objective is to maximize risk-adjusted total return to our stockholders by both capturing growth in free cash flow from the continued organic development of our existing horizontal well inventory of 850 gross drilled but uncompleted horizontal wells (“DUCs”), 873 gross permits and 12,220 gross undeveloped locations, all of which are unburdened by development capital expenditures or lease operating expenses, as well as leveraging our highly experienced technical evaluation team to continue to execute upon our scalable business model of sourcing, methodically evaluating and integrating accretive minerals acquisitions in the core of top-tier, liquids-rich resource plays.
Our portfolio is comprised of mineral and royalty interests across six of the most highly economic, liquids-rich resource plays in the continental United States, including the Delaware and Midland Basins in West Texas and New Mexico, the SCOOP and STACK plays in the Anadarko Basin in Oklahoma, the Denver-Julesburg (“DJ”) Basin in Colorado and Wyoming and the Williston Basin in North Dakota. Our highly technical approach towards mineral acquisitions in the geologic core of top-tier resource plays has purposefully led to a concentrated portfolio covering 36 of the most highly active counties for horizontal drilling in the continental United States.
Since inception, we have executed on our technically driven, financially disciplined acquisition approach and have closed nearly 1,700 transactions with third-party mineral and royalty interest owners as of December 31, 2021. We have increased our mineral and royalty interests from approximately 10,200 net royalty acres as of December 31, 2013, to approximately 92,375 net royalty acres as of December 31, 2021, which represents a 32% compound annual growth rate in our mineral and royalty interests over that period. See “-Our Mineral and Royalty Interests” for a discussion of how we calculate net royalty acres.
The following table summarizes certain information regarding our net royalty acreage acquisitions during each year of our operations.
| 2012 | 2013 | 2014 | 2015 | 2016 | 2017 | 2018 | 2019 | 2020 | 2021 | |||||||||||||||||||||||||||||||||||
Net Royalty Acres (NRAs) Acquired | 500 | 9,700 | 17,300 | 7,200 | 9,800 | 9,400 | 14,900 | 13,400 | 4,085 | 6,090 | 92,375 | |||||||||||||||||||||||||||||||||
Number of Acquisitions | 15 | 313 | 380 | 152 | 121 | 153 | 201 | 216 | 81 | 62 | 1,694 | |||||||||||||||||||||||||||||||||
Average NRAs per Acquisition | 33 | 31 | 46 | 47 | 81 | 61 | 74 | 62 | 50 | 98 | 55 | |||||||||||||||||||||||||||||||||
|
|
|
|
|
|
|
|
|
|
|
|
|
|
|
|
|
|
|
|
|
| |||||||||||||||||||||||
NRAs at Period End | 500 | 10,200 | 27,500 | 34,700 | 44,500 | 53,900 | 68,800 | 82,200 | 86,285 | 92,375 | 92,375 | |||||||||||||||||||||||||||||||||
YoY% Change | — | 1,940 | % | 170 | % | 26 | % | 28 | % | 21 | % | 28 | % | 19 | % | 5 | % | 7 | % | |||||||||||||||||||||||||
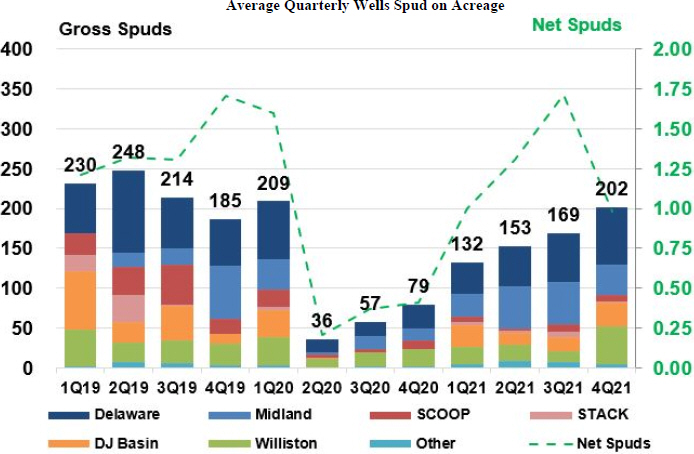
During 2021, our producing well count grew by 2,610 gross horizontal wells largely through acquisitions and the conversions of our DUC and permitted locations, representing an increase of 44% from December 31, 2020. In addition to this activity, 656 gross horizontal wells were spud on our mineral and royalty interests. The Company experienced mild production decline in 2021 with our production volumes declining approximately 5% for the year ended December 31, 2021 as compared to the year ended December 31, 2020. Further, our production volumes are comprised of high-value liquids with 70% of our volumes for the year ended December 31, 2021 composed of crude oil and NGLs, which represents 83% of our mineral and royalty revenues for the period. We expect to see near term organic conversion of our asset from 850 gross DUCs across our interests and 873 gross horizontal drilling permits as of December 31, 2021, all of which are unburdened by additional capital expenditure outlays. Quarterly gross and net wells spud on our minerals have rebounded since the second quarter of 2020, which was our historic low point due to the dramatic curtailment in operator activity as a result of COVID-19 and the actions of OPEC, Russia, and other oil and gas producing countries (“OPEC+”) during March 2020, both of which contributed to a dramatic decline in commodity prices during the first half of 2020. The chart below depicts historical gross and net wells spud on our acreage:
In addition to existing near-term development through the completion of our DUCs, we have a further 12,220 gross undeveloped locations providing us with substantial long-term organic drilling inventory on our acreage.
Our Mineral and Royalty Interests
Mineral interests are real-property interests that are typically perpetual and grant both ownership of the oil, natural gas and NGLs under a tract of land and the ability to lease development rights to a third party. When those rights are leased, usually for a three-year primary term, we typically receive an upfront cash payment, known as lease bonus, and we retain a mineral royalty, which entitles us to a percentage of production or revenue. In addition to mineral interests, which represented approximately 93% of our net royalty acres as of December 31, 2021, we also own other similar types of interests, including nonparticipating royalty interests and overriding royalty interests (“ORRIs”). ORRIs are a contractual arrangement burdening the working interest ownership of a lease and represent the right to receive a fixed percentage of production or revenue from production from a lease. ORRIs remain in effect until the associated lease expires and are therefore not perpetual in nature.
As a mineral and royalty interest owner, we incur the initial cost to acquire our interests, but thereafter do not incur any development capital expenditures or lease operating expenses, which are entirely borne by the operator. Mineral and royalty owners only incur their proportionate share of severance and ad valorem taxes, as well as in some instances, gathering, transportation and marketing costs. As a result, operating margins and therefore free cash flow for a mineral and royalty interest owner are higher as a percentage of revenue than for a traditional exploration and production operating company.
As of December 31, 2021, our mineral and royalty interests consisted of approximately 66,875 net mineral acres, which have been leased to operators to explore for and develop our oil and natural gas rights at a weighted average royalty of 17.3%. Typically, mineral owners standardize ownership to a 12.5% royalty, or 1/8th interest, which is referred to as a “net royalty acre.” Our net mineral acres standardized to a 1/8th interest equate to approximately
92,375 net royalty acres. Our net mineral acres standardized to a 100% royalty, or 8/8th basis, equate to approximately 11,540 “100% royalty acres.” Our approximately 92,375 net royalty acres are located within 1,825 drilling spacing units (“DSUs”), which are the areas designated in a spacing order or unit designation as a drilling unit and within which operators drill wellbores to develop our oil and natural gas rights. Our DSUs, in aggregate, consist of a total of approximately 1,836,585 gross acres, which we refer to as our “gross DSU acreage.” Within our gross DSU acreage, we expect to have an interest in wells currently producing or that will be drilled in the future. The following table summarizes our mineral and royalty interest position and the conversion of our interests between net mineral acres, net royalty acres and 100% royalty acres as of December 31, 2021.
Net Mineral | Weighted Average Royalty | Net Royalty Acres(1) | 100% Royalty Acres(2) | Gross DSU Acres | Implied Average Net Revenue Interest per Well(3) | |||||||||
| 66,875 | 17.3 | % | 92,375 | 11,540 | 1,836,585 | 0.6 | % | |||||||
| (1) | Standardized to a 1/8th interest (i.e., 66,875 net mineral acres * 17.3% / 12.5%). |
| (2) | Standardized to a 100% interest (i.e., 92,375 net royalty acres * 12.5%). |
| (3) | Calculated as number of 100% royalty acres per gross DSU acre (i.e., 11,540 100% royalty acres /1,836,585 gross DSU acres). |
Our Properties
Focus Areas
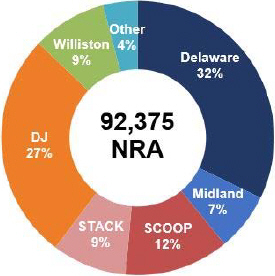
Our mineral and royalty interests are primarily located in six resource plays, which we refer to as our focus areas. These include the Delaware and Midland Basins in the Permian Basin, the SCOOP and STACK plays in the Anadarko Basin, the DJ Basin and the Williston Basin. The following chart shows our overall exposure to each of our primary focus areas based on our net royalty acres in each focus area as of December 31, 2021
In addition, the following table summarizes certain information regarding our primary focus areas. Our average daily net production for the year ended December 31, 2021 was comprised 51% of oil production, 30% of natural gas production and 19% of NGL production.
| Acreage as of December 31, 2021 | Gross Horizontal Producing Well Count as of December 31, 2021(4) | Average Daily Net Production for the Year Ended December 31, 2021(5) (Boe/d) | Average Daily Net Production for the Quarter Ended December 31, 2021(5) (Boe/d) | |||||||||||||||||||||||||||||||||
Resource Play/Basin | Net Mineral Acres | Weighted Average Royalty | Net Royalty Acres(1) | 100% Royalty Acres(2) | Gross DSU Acres | Implied Average Net Revenue Interest per Well(3) | ||||||||||||||||||||||||||||||
Delaware | 19,450 | 19.1 | % | 29,735 | 3,720 | 377,145 | 1.0 | % | 1,562 | 4,475 | 4,329 | |||||||||||||||||||||||||
Midland | 5,000 | 15.8 | % | 6,335 | 790 | 141,040 | 0.6 | % | 756 | 1,056 | 1,235 | |||||||||||||||||||||||||
SCOOP | 7,725 | 18.5 | % | 11,435 | 1,430 | 217,360 | 0.7 | % | 637 | 1,086 | 1,008 | |||||||||||||||||||||||||
STACK | 5,900 | 17.4 | % | 8,195 | 1,020 | 145,975 | 0.7 | % | 383 | 650 | 574 | |||||||||||||||||||||||||
DJ | 19,750 | 15.7 | % | 24,740 | 3,090 | 353,490 | 0.9 | % | 3,112 | 1,142 | 1,450 | |||||||||||||||||||||||||
Williston | 6,350 | 16.1 | % | 8,155 | 1,020 | 527,340 | 0.2 | % | 1,983 | 597 | 574 | |||||||||||||||||||||||||
Other | 2,700 | 17.5 | % | 3,780 | 470 | 74,235 | 0.6 | % | 162 | 34 | — | |||||||||||||||||||||||||
|
|
|
|
|
|
|
|
|
|
|
|
|
|
|
|
|
| |||||||||||||||||||
Total | 66,875 | 17.3 | % | 92,375 | 11,540 | 1,836,585 | 0.6 | % | 8,595 | 9,040 | 9,170 | |||||||||||||||||||||||||
|
|
|
|
|
|
|
|
|
|
|
|
|
|
|
|
|
| |||||||||||||||||||
Note: Individual amounts may not add up to totals due to rounding.
| (1) | Standardized to a 1/8th interest. |
| (2) | Standardized to a 100% interest. |
| (3) | Calculated as number of 100% royalty acres per gross DSU acre. |
| (4) | Represents number of horizontal producing wells across all DSUs in which we participate. |
| (5) | Represents actual production plus allocated accrued volumes attributable to the period presented. |
Permian Basin-Delaware and Midland Basins
The Permian Basin ranges from West Texas into southeastern New Mexico and is currently the most active area for horizontal drilling in the United States. The Permian Basin is further subdivided into the Delaware Basin in the west and the Midland Basin in the east. Based on our geologic and engineering data as well as current delineation efforts by operators, we believe our mineral and royalty interests in the Delaware Basin are prospective for seven or more producing zones of economic horizontal development including the Wolfcamp A, B, C and XY; First, Second and Third Bone Spring; and the Avalon. Our Delaware Basin mineral and royalty interests are located in Reeves, Loving, Ward, Pecos, Culberson and Winkler Counties, Texas with our remaining interests located in Lea and Eddy Counties, New Mexico. Based on our geologic and engineering interpretations as well as current delineation efforts by operators, we believe our mineral and royalty interests in the Midland Basin are prospective for five or more producing zones of economic horizontal development including the Middle Spraberry; Lower Spraberry; and Wolfcamp A, B, C, and D / Cline. Our Midland Basin mineral and royalty interests are located in Martin, Midland, Upton, Howard, Glasscock and Reagan Counties, Texas.
Anadarko Basin-SCOOP and STACK Plays
The SCOOP play (South Central Oklahoma Oil Province) is located in central Oklahoma in Grady, Garvin, Stephens and McClain Counties. Based on our geologic and engineering interpretations as well as current delineation efforts by operators, we believe our mineral and royalty interests in the SCOOP play are prospective for two or more producing zones of economic horizontal development including multiple Woodford benches and the Springer Shale. In addition, operators are also currently testing other formations in the area including the Sycamore, Caney and Osage, which is also referred to as SCORE (Sycamore Caney Osage Resource Expansion). The STACK play (derived from Sooner Trend Anadarko Basin Canadian and Kingfisher Counties) is located in central Oklahoma in Kingfisher, Canadian, Caddo and Blaine Counties. Based on our geologic and engineering data as well as current delineation efforts by operators, we believe our mineral and royalty interests in the STACK play are prospective for two or more producing zones of economic horizontal development including multiple benches within both the Meramec and Woodford formations.
DJ Basin
The DJ Basin is located in Northeast Colorado and Southeast Wyoming, with the majority of operator horizontal drilling activity located in Weld and Broomfield Counties, Colorado, and Laramie County, Wyoming. Based on our
geologic and engineering interpretations as well as current delineation efforts by operators, we believe our mineral and royalty interests in the DJ Basin are prospective for four or more producing zones of economic horizontal development including the Niobrara A, B and C and Codell formations.
Williston Basin
The Williston Basin stretches from western North Dakota into eastern Montana with the majority of operator horizontal drilling activity located in Mountrail, Williams, and McKenzie Counties, North Dakota. Based on our geologic and engineering interpretations as well as current operator delineation efforts, we believe our mineral and royalty interests are prospective for two or more producing zones of economic horizontal development including the Bakken and multiple Three Forks benches. The majority of our interests are located in Mountrail, Williams and McKenzie Counties with additional interests owned in Divide, Burke, Dunn, Billings and Stark Counties, North Dakota and Richland County, Montana.
Prospective Undeveloped Horizontal Drilling Locations
As of December 31, 2021, we have identified 13,093 undeveloped gross proved, probable and possible drilling locations across our gross DSU acreage as identified in our December 31, 2021 reserve report audited by Cawley, Gillespie & Associates, Inc. (“CG&A”), our independent petroleum engineering firm. Furthermore, we believe additional optionality is possible through the delineation of additional formations as well as incremental wells in existing formations. Approximately 58% of our total net horizontal undeveloped locations are located in the Delaware and Midland Basins, with another 20% located in the DJ Basin in Colorado, as shown in the following table.
| Gross Horizontal Undeveloped Locations | Percentage of Total Portfolio | Net Horizontal Undeveloped Locations | Percentage of Total Portfolio | |||||||||||||
Delaware Basin | 5,304 | 41 | % | 53.7 | 49 | % | ||||||||||
Midland Basin | 1,618 | 12 | % | 9.5 | 9 | % | ||||||||||
SCOOP | 1,026 | 8 | % | 8.1 | 7 | % | ||||||||||
STACK | 1,216 | 9 | % | 9.9 | 9 | % | ||||||||||
DJ Basin | 1,984 | 15 | % | 22.4 | 20 | % | ||||||||||
Williston | 1,563 | 12 | % | 2.9 | 3 | % | ||||||||||
Other | 382 | 3 | % | 2.9 | 3 | % | ||||||||||
|
|
|
|
|
|
|
| |||||||||
Total | 13,093 | 100 | % | 109.4 | 100 | % | ||||||||||
Note: Individual amounts may not total due to rounding.
Additionally, the following table provides a detailed summary of our inventory of horizontal drilling locations as of December 31, 2021.
Productive Horizons | Gross Horizontal Undeveloped Locations(1) | Total Gross Horizontal Locations(2) | DSUs(3)(4) | Gross Horizontal Undeveloped Locations Per DSU(4) | Total Gross Horizontal Locations Per DSU(4) | Net Horizontal Undeveloped Locations(5) | ||||||||||||||||||
Delaware Basin | ||||||||||||||||||||||||
Wolfcamp A | 2,041 | 2,950 | 478 | 4.3 | 6.2 | 22.3 | ||||||||||||||||||
Wolfcamp B | 1,166 | 1,400 | 417 | 2.8 | 3.4 | 12.6 | ||||||||||||||||||
3rd BS/WC XY | 751 | 1,160 | 361 | 2.1 | 3.2 | 6.7 | ||||||||||||||||||
2nd Bone Spring | 638 | 759 | 237 | 2.7 | 3.2 | 4.8 | ||||||||||||||||||
Avalon | 179 | 213 | 71 | 2.5 | 3.0 | 1.2 | ||||||||||||||||||
Other | 529 | 605 | 209 | 2.5 | 2.9 | 6.1 | ||||||||||||||||||
|
|
|
|
|
|
|
|
|
|
|
| |||||||||||||
Total | 5,304 | 7,087 | 481 | 11.0 | 14.7 | 53.7 | ||||||||||||||||||
Midland Basin | ||||||||||||||||||||||||
Wolfcamp A | 442 | 739 | 159 | 2.8 | 4.6 | 2.7 | ||||||||||||||||||
Wolfcamp B | 410 | 741 | 159 | 2.6 | 4.7 | 2.5 | ||||||||||||||||||
Lower Spraberry | 516 | 765 | 158 | 3.3 | 4.8 | 2.8 | ||||||||||||||||||
Other | 250 | 347 | 110 | 2.3 | 3.2 | 1.5 | ||||||||||||||||||
|
|
|
|
|
|
|
|
|
|
|
| |||||||||||||
Total | 1,618 | 2,592 | 160 | 10.1 | 16.2 | 9.5 | ||||||||||||||||||
SCOOP | ||||||||||||||||||||||||
Woodford | 738 | 1,279 | 188 | 3.9 | 6.8 | 5.9 | ||||||||||||||||||
Springer | 288 | 403 | 101 | 2.9 | 4.0 | 2.2 | ||||||||||||||||||
|
|
|
|
|
|
|
|
|
|
|
| |||||||||||||
Total | 1,026 | 1,682 | 188 | 5.5 | 8.9 | 8.1 | ||||||||||||||||||
STACK | ||||||||||||||||||||||||
Woodford | 668 | 775 | 142 | 4.7 | 5.5 | 5.4 | ||||||||||||||||||
Meramec | 548 | 835 | 158 | 3.5 | 5.3 | 4.5 | ||||||||||||||||||
|
|
|
|
|
|
|
|
|
|
|
| |||||||||||||
Total | 1,216 | 1,610 | 158 | 7.7 | 10.2 | 9.9 | ||||||||||||||||||
DJ Basin | ||||||||||||||||||||||||
Niobrara | 1,552 | 4,201 | 377 | 4.1 | 11.1 | 17.0 | ||||||||||||||||||
Codell | 432 | 1,116 | 274 | 1.6 | 4.1 | 5.4 | ||||||||||||||||||
|
|
|
|
|
|
|
|
|
|
|
| |||||||||||||
Total | 1,984 | 5,317 | 379 | 5.2 | 14.0 | 22.4 | ||||||||||||||||||
Williston Basin | ||||||||||||||||||||||||
Bakken | 694 | 1,922 | 378 | 1.8 | 5.1 | 1.2 | ||||||||||||||||||
Three Forks | 869 | 1,763 | 378 | 2.3 | 4.7 | 1.7 | ||||||||||||||||||
|
|
|
|
|
|
|
|
|
|
|
| |||||||||||||
Total | 1,563 | 3,685 | 381 | 4.1 | 9.7 | 2.9 | ||||||||||||||||||
|
|
|
|
|
|
|
|
|
|
|
| |||||||||||||
Other | 382 | 565 | 78 | 4.9 | 7.2 | 2.9 | ||||||||||||||||||
Grand Total | 13,093 | 22,538 | 1,825 | 7.2 | 12.3 | 109.4 | ||||||||||||||||||
|
|
|
|
|
|
|
|
|
|
|
| |||||||||||||
| (1) | Represents gross undeveloped horizontal drilling locations across our gross DSU acreage |
| (2) | Includes all wells in each horizon, including PDP, DUC, permitted and unpermitted locations. |
| (3) | Represents the aggregate number of DSUs covering any of the applicable productive horizons as identified in the reserve report. |
| (4) | The number of DSUs in each horizon and locations per DSU in each horizon do not total due to differing prospectivity of each horizon across each DSU (i.e., not all horizons are booked in all DSUs). |
| (5) | A net well represents 100% net revenue interest in a single gross well. |
Third-Party Operators
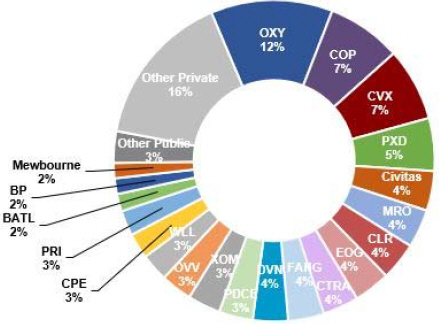
Beyond our technical analysis to identify core, highly economic geologic areas, an additional critical aspect of our evaluation process is to acquire mineral and royalty interests that will be drilled and completed by operators we believe will outperform their peers through the application of the latest drilling and completion technologies in each of our focus areas. The following chart summarizes our exposure to these operators based on the percentage of our net interests in the wells to be drilled by each operator. Net interests per gross location are normalized to 7,500 ft. laterals.
In addition, the following table shows our exposure to each of these operators broken down by our primary focus areas based on the percentage of our net interests in the wells to be drilled by each operator as of December 31, 2021.
| Percentage as of December 31, 2021 | ||||||||||||||||||||||||||||||||
Operator | Total Portfolio | Delaware | Midland | SCOOP | STACK | DJ Basin | Williston | Other | ||||||||||||||||||||||||
Occidental Petroleum | 12 | % | 19 | % | 1 | % | — | % | — | % | 16 | % | — | % | — | % | ||||||||||||||||
ConocoPhillips | 7 | % | 14 | % | 7 | % | — | % | — | % | — | % | 12 | % | — | % | ||||||||||||||||
Chevron Inc. | 7 | % | 9 | % | 4 | % | — | % | — | % | 12 | % | — | % | — | % | ||||||||||||||||
Pioneer Natural Resources | 5 | % | 1 | % | 47 | % | — | % | — | % | — | % | — | % | — | % | ||||||||||||||||
Civitas | 4 | % | — | % | — | % | — | % | — | % | 19 | % | — | % | — | % | ||||||||||||||||
Marathon | 4 | % | 1 | % | — | % | 19 | % | 22 | % | — | % | 1 | % | 8 | % | ||||||||||||||||
Continental | 4 | % | — | % | — | % | 37 | % | 3 | % | — | % | 13 | % | 1 | % | ||||||||||||||||
EOG Resources | 4 | % | 3 | % | — | % | — | % | — | % | 10 | % | 4 | % | — | % | ||||||||||||||||
Cotera Energy Inc. | 4 | % | 6 | % | — | % | — | % | 12 | % | — | % | — | % | 6 | % | ||||||||||||||||
Diamondback | 4 | % | 5 | % | 10 | % | — | % | — | % | — | % | — | % | — | % | ||||||||||||||||
Devon Energy | 4 | % | 3 | % | — | % | — | % | 28 | % | — | % | — | % | — | % | ||||||||||||||||
PDC Energy | 3 | % | 1 | % | — | % | — | % | — | % | 13 | % | — | % | — | % | ||||||||||||||||
ExxonMobil Inc. | 3 | % | 5 | % | 6 | % | — | % | — | % | — | % | 7 | % | — | % | ||||||||||||||||
Ovintiv Inc. | 3 | % | — | % | 3 | % | 24 | % | 9 | % | — | % | 3 | % | — | % | ||||||||||||||||
Whiting Petroleum | 3 | % | — | % | — | % | — | % | — | % | 13 | % | 3 | % | — | % | ||||||||||||||||
Callon Petroleum | 3 | % | 5 | % | — | % | — | % | — | % | — | % | — | % | — | % | ||||||||||||||||
PRI Operating | 3 | % | 5 | % | — | % | — | % | — | % | — | % | — | % | — | % | ||||||||||||||||
Battalion Oil | 2 | % | 4 | % | — | % | — | % | — | % | — | % | — | % | — | % | ||||||||||||||||
BP Plc | 2 | % | 3 | % | 1 | % | — | % | — | % | — | % | — | % | — | % | ||||||||||||||||
Mewbourne | 2 | % | 3 | % | — | % | — | % | — | % | — | % | — | % | — | % | ||||||||||||||||
|
|
|
|
|
|
|
|
|
|
|
|
|
|
|
| |||||||||||||||||
Subtotal | 81 | % | 88 | % | 79 | % | 81 | % | 74 | % | 83 | % | 44 | % | 14 | % | ||||||||||||||||
Other Operators | 19 | % | 12 | % | 21 | % | 19 | % | 26 | % | 17 | % | 56 | % | 86 | % | ||||||||||||||||
|
|
|
|
|
|
|
|
|
|
|
|
|
|
|
| |||||||||||||||||
Total | 100 | % | 100 | % | 100 | % | 100 | % | 100 | % | 100 | % | 100 | % | 100 | % | ||||||||||||||||
|
|
|
|
|
|
|
|
|
|
|
|
|
|
|
| |||||||||||||||||
Note: Individual amounts may not add up to totals due to rounding.
Business Objectives
Our primary business objective is to deliver an attractive risk-adjusted total return to our stockholders through (i) the organic growth of our free cash flow generated from our existing portfolio of approximately 92,375 net royalty acres, and (ii) the continued sourcing and execution of accretive ground game mineral acquisitions in the core of highly economic, liquids-rich resource plays, and (iii) large scale acquisitions and corporate consolidations..
Our Corporate Structure
Brigham Minerals, Inc. was incorporated as a Delaware corporation in June 2018 for the purpose of completing the IPO and related transactions. On April 23, 2019, in connection with the IPO, Brigham Minerals became a holding company whose sole material asset consists of units in Brigham LLC (the “Brigham LLC Units”). Brigham LLC wholly owns Brigham Resources, which wholly owns the Minerals Subsidiaries, which own all of our operating assets. The remainder of the Brigham LLC Units are held by affiliates of Pine Brook Road Advisors, LP (“Pine Brook”) and certain of our management members and other prior investors (together with Pine Brook, the “Original Owners”).
As the sole managing member of Brigham LLC, Brigham Minerals operates and controls all of the business and affairs of Brigham LLC, and through Brigham LLC and its subsidiaries, conducts its business. As a result, we consolidate the financial results of Brigham LLC and its subsidiaries and report non-controlling interest related to the portion of Brigham LLC Units not owned by us, which will reduce net income (loss) attributable to the holders of our Class A common stock. As of February 18, 2022, Brigham Minerals owned 81.0% of Brigham LLC.
Each of the Original Owners holds one share of our Class B common stock, par value $0.01 per share (the “Class B common stock”), for each Brigham LLC Unit such person holds. Each share of Class B common stock has no economic rights but entitles its holder to one vote on all matters to be voted on by stockholders generally. Holders of Class A common stock and Class B common stock vote together as a single class on all matters presented to our stockholders for their vote or approval, except as otherwise required by applicable law or by our amended and restated certificate of incorporation. We do not intend to list our Class B common stock on any exchange.
Under the First Amended and Restated Limited Liability Company Agreement of Brigham LLC (the “Brigham LLC Agreement”), each holder of a Brigham LLC Unit (a “Brigham Unit Holder”) has, subject to certain limitations, the right (the “Redemption Right”) to cause Brigham LLC to acquire all or a portion of its Brigham LLC Units for, at Brigham LLC’s election, (i) shares of our Class A common stock at a redemption ratio of one share of Class A common stock for each Brigham LLC Unit redeemed, subject to conversion rate adjustments for stock splits, stock dividends and reclassification and other similar transactions or (ii) an equivalent amount of cash. Our decision to make a cash payment upon a Brigham Unit Holder’s redemption election must be made by our independent directors (within the meaning of the New York Stock Exchange and Section 10A-3 of the Securities Act) who do not own Brigham LLC units that are subject to such redemption. We will determine whether to issue shares of Class A common stock or cash based on facts in existence at the time of the decision, which we expect would include the relative value of the Class A common stock (including trading prices for the Class A common stock at the time), the cash purchase price, the availability of other sources of liquidity (such as an issuance of preferred stock) to acquire the Brigham LLC Units and alternative uses for such cash. Alternatively, upon the exercise of the Redemption Right, Brigham Minerals (instead of Brigham LLC) will have the right (the “Call Right”) to, for administrative convenience, acquire each tendered Brigham LLC Unit directly from the redeeming Brigham Unit Holder for, at its election, (x) one share of Class A common stock or (y) an equivalent amount of cash. In connection with any redemption of Brigham LLC Units pursuant to the Redemption Right or acquisition pursuant to our Call Right, the corresponding number of shares of Class B common stock will be cancelled. Under the Registration Rights Agreement we entered into with certain of the Original Owners in connection with the IPO, such Original Owners have the right, under certain circumstances, to cause us to register the offer and resale of their shares of Class A common stock.
The following diagram indicates our simplified ownership structure as of February 18, 2022. This chart is provided for illustrative purposes only and does not represent all legal entities affiliated with us.
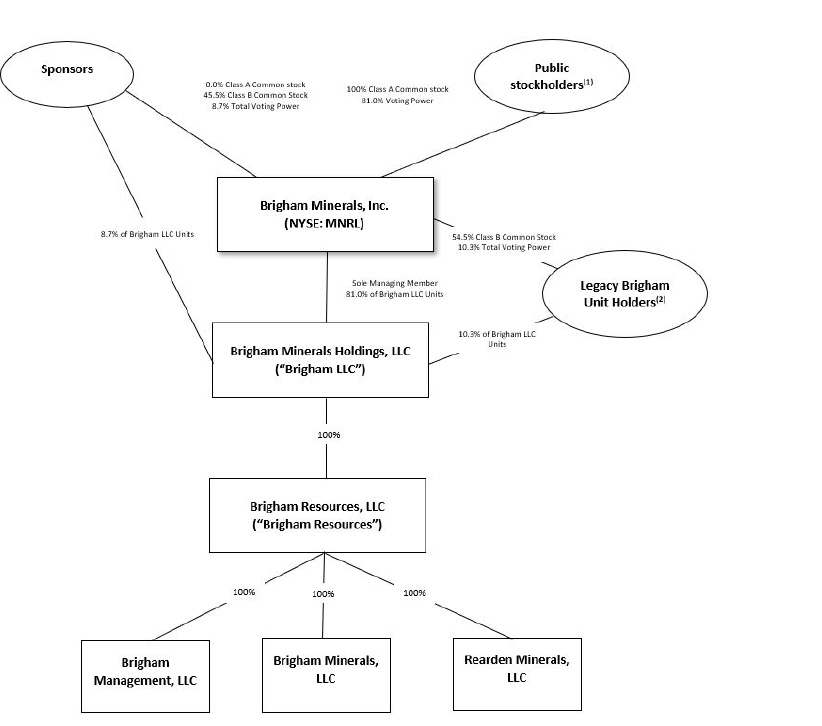
| (1) | Public stockholders include holders of shares of Class A common stock sold to the public, issued pursuant to awards granted under our 2019 Long Term Incentive Plan (“LTIP”) or issued to Brigham Unit Holders in connection with their exercise of the Redemption Right. |
| (2) | Legacy Brigham Unit Holders include members of our management team and investors in our Company prior to our IPO (other than our Sponsors) who continue to hold Brigham LLC Units. Certain of the interests of our management in Brigham LLC are held indirectly through Brigham Equity Holdings, LLC. Brigham Equity Holdings, LLC directly owns 70,909 Brigham LLC Units, representing an approximate 0.1% interest in Brigham LLC. Total voting power does not include any shares of Class A common stock held by such legacy Brigham Unit Holders. |
Our Principal Stockholders
We have a valuable relationship with Pine Brook, a private investment firm focused on investments in the energy sector. As of February 18, 2022, affiliates of Pine Brook (collectively, our “Sponsors”) owned no shares of Class A common stock and 5,175,559 shares of Class B common stock representing approximately 8.7% of the voting power of Brigham Minerals and 5,175,559 Brigham LLC Units.
Principal Executive Offices
Our principal executive offices are located at 5914 W. Courtyard Drive, Suite 200, Austin, Texas 78730, and our telephone number at that address is (512) 220-6350.
Our website address is www.brighamminerals.com. We make our periodic reports and other information filed with or furnished to the SEC available free of charge through our website as soon as reasonably practicable after those reports and other information are electronically filed with or furnished to the SEC. Information on our website or any other website is not incorporated by reference into, and does not constitute a part of, this Annual Report.
Oil, Natural Gas and NGLs Data
Proved, Probable and Possible Reserves
Evaluation and Audit of Proved, Probable and Possible Reserves. Our proved, probable and possible reserve estimates as of December 31, 2021, 2020 and 2019 were audited by CG&A, our independent petroleum engineers. Within CG&A, the technical person primarily responsible for auditing the reserve estimates set forth in the reserve reports incorporated herein is Todd Brooker. Prior to joining CG&A, Mr. Brooker worked in Gulf of Mexico drilling and production engineering at Chevron USA. Mr. Brooker has been an employee of CG&A since 1992. His responsibilities include reserve and economic evaluations, fair market valuations, field studies, pipeline resource studies and acquisition/divestiture analysis. His reserve reports are routinely used for public company SEC disclosures. His experience includes significant projects in both conventional and unconventional resources in every major U.S. producing basin and abroad, including oil and gas shale plays, coalbed methane fields, waterfloods and complex, faulted structures. Mr. Brooker graduated with honors from the University of Texas at Austin in 1989 with a Bachelor of Science degree in Petroleum Engineering and is a registered Professional Engineer in the State of Texas. He is also a member of the Society of Petroleum Engineers and the Society of Petroleum Evaluation Engineers (SPEE).
Mr. Brooker meets or exceeds the requirements with regard to qualifications, independence, objectivity and confidentiality set forth in the Standards Pertaining to the Estimating and Auditing of Oil and Gas Reserves Information promulgated by the Society of Petroleum Engineers. CG&A does not own an interest in any of our properties, nor is it employed by us on a contingent basis. A summary of CG&A’s report with respect to our proved, probable and possible reserve estimates as of December 31, 2021 is included as an exhibit to this Annual Report.
We maintain an internal staff of petroleum engineers and geoscience professionals who worked closely with our independent reserve engineers to ensure the integrity, accuracy and timeliness of the data used to calculate our proved, probable and possible reserves relating to our properties. Our internal technical team members meet with our independent reserve engineers periodically during the period covered by the proved, probable and possible reserve report to discuss the assumptions and methods used in the proved, probable and possible reserve estimation process. We provide historical information to CG&A for our properties, such as ownership interest, oil and natural gas production, well test data, commodity prices and our estimates of our operators’ operating and development costs. Hamilton Hogsett is primarily responsible for overseeing the preparation of our reserve estimates. Mr. Hogsett has substantial reservoir and operations experience having worked as a petroleum engineer since 2009 and is supported by our engineering and geoscience staff. Prior to joining our Company in 2017, Mr. Hogsett worked at Apache Corporation and Antero Resources Corporation.
The preparation of our proved, probable and possible reserve estimates was completed in accordance with our internal control procedures. These procedures, which are intended to ensure reliability of reserve estimations, include the following:
| • | review and verification of historical production data, which data is based on actual production as reported by our operators; |
| • | review by Mr. Hogsett, our Vice President of Reservoir Engineering, of all of our reported proved, probable and possible reserves, including the review of all significant reserve changes and all PUD additions or reductions; |
| • | verification of property ownership by our land department; |
| • | review of reserve estimates by Mr. Hogsett or under his direct supervision; and |
| • | direct reporting responsibilities by Mr. Hogsett to our Chief Executive Officer. |
Estimation of Proved Reserves. In accordance with rules and regulations of the SEC applicable to companies involved in oil and natural gas producing activities, proved reserves are those quantities of oil and natural gas, which, by analysis of geoscience and engineering data, can be estimated with reasonable certainty to be economically producible from a given date forward, from known reservoirs, and under existing economic conditions, operating methods, and government regulations. The term “reasonable certainty” means deterministically, the quantities of oil and/or natural gas are much more likely to be achieved than not, and probabilistically, there should be at least a 90% probability of recovering volumes equal to or exceeding the estimate. All of our proved reserves as of December 31, 2021, 2020 and 2019 were estimated using a deterministic method. The estimation of reserves involves two distinct determinations. The first determination results in the estimation of the quantities of recoverable oil and natural gas and the second determination results in the estimation of the uncertainty associated with those estimated quantities in accordance with the definitions established under SEC rules. The process of estimating the quantities of recoverable reserves relies on the use of certain generally accepted analytical procedures. These analytical procedures fall into four broad categories or methods: (i) production performance-based methods; (ii) material balance-based methods; (iii) volumetric-based methods; and (iv) analogy. These methods may be used singularly or in combination by the reserve evaluator in the process of estimating the quantities of reserves. Reserves for proved developed producing wells were estimated using production performance methods for the vast majority of properties. Certain new producing properties with very little production history were forecast using a combination of production performance and analogy to similar production, both of which are considered to provide a reasonably high degree of accuracy. Non-producing reserve estimates, for developed and undeveloped properties, were forecast using analogy methods. This method provides a reasonably high degree of accuracy for predicting proved developed non-producing and PUDs for our properties, due to the abundance of analog data.
To estimate economically recoverable proved reserves and related future net cash flows, we considered many factors and assumptions, including the use of reservoir parameters derived from geological and engineering data that cannot be measured directly, economic criteria based on current costs and the SEC pricing requirements and forecasts of future production rates.
Under SEC rules, reasonable certainty can be established using techniques that have been proven effective by actual production from projects in the same reservoir or an analogous reservoir or by other evidence using reliable technology that establishes reasonable certainty. Reliable technology is a grouping of one or more technologies (including computational methods) that have been field tested and have been demonstrated to provide reasonably certain results with consistency and repeatability in the formation being evaluated or in an analogous formation. To establish reasonable certainty with respect to our estimated proved reserves, the technologies and economic data used in the estimation of our proved reserves have been demonstrated to yield results with consistency and repeatability, and include production and well test data, downhole completion information, geologic data, electrical logs, radioactivity logs, core data, and historical well cost and operating expense data.
Estimation of Probable Reserves. Estimates of probable reserves are inherently imprecise. When producing an estimate of the amount of oil, natural gas and NGLs that is recoverable from a particular reservoir, an estimated quantity of probable reserves is an estimate of those additional reserves that are less certain to be recovered than proved reserves but which, together with proved reserves, are as likely as not to be recovered. Estimates of probable reserves are also continually subject to revisions based on production history, results of additional exploration and development, price changes and other factors.
When deterministic methods are used, it is as likely as not that actual remaining quantities recovered will exceed the sum of estimated proved plus probable reserves. When probabilistic methods are used, there should be at least a 50% probability that the actual quantities recovered will equal or exceed the proved plus probable reserves estimates. All of our probable reserves as of December 31, 2021, 2020 and 2019 were estimated using a deterministic method, which involves two distinct determinations: an estimation of the quantities of recoverable oil and natural gas and an estimation of the uncertainty associated with those estimated quantities in accordance with the definitions established under SEC rules. The process of estimating the quantities of recoverable oil and natural gas reserves uses the same generally accepted analytical procedures as are used in estimating proved reserves, namely production performance-based methods, material balance-based methods, volumetric-based methods and analogy. In the case of probable reserves, the recoverable reserves cannot be said to have a “high degree of confidence that the quantities will be recovered” but are “as likely as not to be recovered.” The lower degree of certainty can come from several factors including: (1) direct offset production that does not meet an economic threshold, despite localized averages that do
meet that threshold, (2) an increased distance from offset production to the probable location of over one mile but under three miles, (3) a perceived risk of communication or depletion from nearby producers, (4) a perceived risk of attempting new drilling or completion technologies that have not been used in direct offset production or (5) an uncertainty regarding geologic positioning that could affect recoverable reserves. When considering the factors referenced above, the lower degree of certainty of our probable reserves came from a combination of these factors depending upon the applicable basin. Many of the probable locations assigned in our reserve reports had few uncertainties and resemble proved undeveloped locations except for their distance from commercial production. Other probable locations had uncertainties related to not only distance from commercial production, but also related to well spacing and development timing. In general, we did not book probable locations if there was geologic uncertainty or if there was not commercial production to support such locations.
Estimation of Possible Reserves. Estimates of possible reserves are also inherently imprecise. When producing an estimate of the amount of oil, natural gas and NGLs that is recoverable from a particular reservoir, an estimated quantity of possible reserves is an estimate that might be achieved, but only under more favorable circumstances than are likely. Estimates of possible reserves are also continually subject to revisions based on production history, results of additional exploration and development, price changes and other factors.
When deterministic methods are used, the total quantities ultimately recovered from a project have a low probability of exceeding proved plus probable plus possible reserves. When probabilistic methods are used, there should be at least a 10% probability that the total quantities ultimately recovered will equal or exceed the proved plus probable plus possible reserves estimates. All of our possible reserves as of December 31, 2021, 2020 and 2019 were estimated using a deterministic method, which involves two distinct determinations: an estimation of the quantities of recoverable oil and natural gas and an estimation of the uncertainty associated with those estimated quantities in accordance with the definitions established under SEC rules. The process of estimating the quantities of recoverable oil and natural gas reserves uses the same generally accepted analytical procedures as are used in estimating proved reserves, namely production performance-based methods, material balance-based methods, volumetric-based methods and analogy. In the case of possible reserves, the recoverable reserves cannot be said to be “as likely as not to be recovered”, but “might be achieved, but only under more favorable circumstances than are likely.” The lower degree of certainty can come from several factors including: (1) direct offset production that does not meet an economic threshold, despite localized averages that do meet that threshold, (2) an increased distance from offset production to the possible location of over one mile but under five miles, (3) a perceived risk of communication or depletion from nearby producers, (4) a perceived risk of attempting new drilling or completion technologies that have not been used in direct offset production or (5) an uncertainty regarding geologic positioning that could affect recoverable reserves. When considering the factors referenced above, the lower degree of certainty of our possible reserves came from a combination of these factors depending upon the applicable basin. Many of the possible locations assigned in our reserve reports had few uncertainties and resemble proved undeveloped locations except for their distance from commercial production. Other possible locations had uncertainties related to not only distance from commercial production, but also related to well spacing and development timing. In general, we did not book possible locations if there was geologic uncertainty or if there was not commercial production to support such location.
Summary of Reserves. The following table presents our estimated net proved, probable and possible reserves as of December 31, 2021, 2020 and 2019, based on our proved, probable and possible reserve estimates as of such dates, which have been audited by CG&A, our independent petroleum engineering firm, in accordance with the rules and regulations of the SEC. All of our proved, probable and possible reserves are located in the United States.
| Years Ended December 31, | ||||||||||||
| 2021 | 2020 | 2019 | ||||||||||
Estimated proved developed reserves: | ||||||||||||
Oil (MBbls) | 13,148 | 9,403 | 9,924 | |||||||||
Natural gas (MMcf) | 56,372 | 31,873 | 33,232 | |||||||||
NGLs (MBbls) | 6,367 | 3,426 | 2,494 | |||||||||
|
|
|
|
|
| |||||||
Total (MBoe) | 28,911 | 18,141 | 17,957 | |||||||||
Estimated proved undeveloped reserves: | ||||||||||||
Oil (MBbls) | 3,762 | 3,797 | 7,037 | |||||||||
Natural gas (MMcf) | 9,800 | 11,771 | 28,498 | |||||||||
NGLs (MBbls) | 1,499 | 1,164 | 3,344 | |||||||||
|
|
|
|
|
| |||||||
Total (MBoe) | 6,894 | 6,922 | 15,131 | |||||||||
Estimated total proved reserves: | ||||||||||||
Oil (MBbls) | 16,910 | 13,200 | 16,961 | |||||||||
Natural gas (MMcf) | 66,172 | 43,644 | 61,730 | |||||||||
NGLs (MBbls) | 7,866 | 4,590 | 5,838 | |||||||||
|
|
|
|
|
| |||||||
Total (MBoe) | 35,805 | 25,063 | 33,088 | |||||||||
Estimated probable reserves: | ||||||||||||
Oil (MBbls) | 22,013 | 20,096 | 16,948 | |||||||||
Natural gas (MMcf) | 94,100 | 85,477 | 70,627 | |||||||||
NGLs (MBbls) | 10,698 | 9,417 | 8,274 | |||||||||
|
|
|
|
|
| |||||||
Total (MBoe) | 48,394 | 43,759 | 36,993 | |||||||||
Estimated possible reserves: | ||||||||||||
Oil (MBbls) | 13,653 | 12,356 | 11,986 | |||||||||
Natural gas (MMcf) | 39,254 | 32,638 | 33,063 | |||||||||
NGLs (MBbls) | 5,800 | 4,475 | 5,024 | |||||||||
|
|
|
|
|
| |||||||
Total (MBoe) | 25,996 | 22,271 | 22,521 | |||||||||
Our estimated net proved, probable and possible reserves were determined using average first-day-of-the month prices for the prior 12 months in accordance with SEC guidance, as presented in the table below. These prices do not give effect to derivative transactions and are held constant throughout the lives of the properties. For oil volumes, the average West Texas Intermediate (“WTI”) posted prices were adjusted for quality, transportation fees and a regional price differentials (“SEC oil price”). For NGL volumes, the average WTI posted prices were adjusted for quality, transportation fees and a regional price differentials. For gas volumes, the average Henry Hub spot prices were adjusted for energy content, transportation fees and a regional price differentials (“SEC gas price”). The table below represents also the average adjusted product prices weighted by production over the remaining lives of the properties as of December 31, 2021, 2020 and 2019.
| Years Ended December 31, | ||||||||||||
| 2021 | 2020 | 2019 | ||||||||||
SEC oil price | $ | 66.56 | $ | 39.57 | $ | 55.65 | ||||||
SEC gas price | $ | 3.64 | $ | 2.00 | $ | 2.60 | ||||||
NGL prices as a percent of the WTI posted prices, by basin | 29% - 41% | 10% - 25% | 13% - 30% | |||||||||
Average adjusted product prices weighted by production over the remaining lives of the properties: | ||||||||||||
Oil price | $ | 64.46 | $ | 36.35 | $ | 51.01 | ||||||
NGL price | $ | 26.65 | $ | 8.19 | $ | 14.39 | ||||||
Gas Price | $ | 3.22 | $ | 1.03 | $ | 1.51 | ||||||
Reserve engineering is a subjective process of estimating volumes of economically recoverable oil and natural gas that cannot be measured in an exact manner. The accuracy of any reserve estimate is a function of the quality of available data and of engineering and geological interpretation. As a result, the estimates of different engineers often vary. In addition, the results of drilling, testing and production may justify revisions of such estimates. Accordingly, reserve estimates often differ from the quantities of oil and natural gas that are ultimately recovered. Estimates of economically recoverable oil and natural gas and of future net revenues are based on a number of variables and assumptions, all of which may vary from actual results, including geologic interpretation, prices and future production rates and costs. Please read “Item 1A-Risk Factors.”
Additional information regarding our proved, probable and possible reserves can be found in the notes to our consolidated financial statements included elsewhere in this Annual Report and the proved, probable and possible reserve reports as of December 31, 2021 and December 31, 2020 and 2019, which are included as exhibits to this Annual Report.
PUDs
As of December 31, 2021, we estimated our PUD reserves to be 3,762 MBbls of oil, 9,800 MMcf of natural gas and 1,499 MBbls of NGLs, for a total of 6,894 MBoe. PUDs will be converted from undeveloped to developed as the applicable wells begin production.
The following tables summarize our changes in PUDs during the year ended December 31, 2021 (in MBoe):
| Proved Undeveloped Reserves | ||||
Balance, Dec 31, 2020 | 6,922 | |||
Acquisition of reserves | 520 | |||
Extensions and discoveries | 875 | |||
Revisions of previous estimates | (669 | ) | ||
Transfer to estimated proved developed | (754 | ) | ||
|
| |||
Balance, Dec 31, 2021 | 6,894 | |||
|
| |||
Changes in PUDs that occurred during 2021 were primarily due to:
| • | the acquisition of additional mineral and royalty interests located in the Permian, Williston and DJ Basins in multiple transactions, which included 520 MBoe of additional PUD reserves; |
| • | well additions, extensions and discoveries of approximately 875 MBoe, as 67 horizontal well locations were converted from probable, possible and contingent resource to PUDs due to continuous activity and delineation of additional zones on our mineral and royalty interests; |
| • | total revisions of 669 MBoe driven by positive revisions of 805 MBoe attributable to an increase in SEC pricing offset by a negative revision of 159 MBoe attributable to estimated ultimate recovery (“EUR”) adjustments, refined gas and NGL processing assumptions, and unit configuration changes; as well as a reclassification of 1,315 MBoe to non-proved, as a result of operator activity in the Anadarko Basin; and |
| • | the conversion of approximately 754 MBoe in PUD reserves into proved developed reserves as 183 horizontal locations were drilled. |
As a mineral and royalty interests owner, we do not incur any capital expenditures or lease operating expenses in connection with the development of our PUDs, which costs are borne entirely by the operator. As a result, during the year ended December 31, 2021, we did not have any expenditures to convert PUDs to proved developed reserves.
We identify drilling locations based on our assessment of current geologic, engineering and land data. This includes DSU formation and current well spacing information derived from state agencies and the operations of the exploration and production companies drilling our mineral and royalty interests. We generally do not have evidence of approval of our operators’ development plans, however, we use a deterministic approach to define and allocate locations to proved reserves. While many of our locations qualify as geologic PUDs, we limit our PUDs to the quantities of oil and gas that are reasonably certain to be recovered in the next five years. As of December 31, 2021 and 2020, approximately 19% and 28%, respectively, of our total proved reserves were classified as PUDs.
Oil, Natural Gas and NGL Production Prices and Costs
Production and Price History
The following table sets forth information regarding net production of oil, natural gas and NGLs, and certain price and cost information for each of the periods indicated:
| Years Ended December 31, | ||||||||||||
| 2021 | 2020 | 2019 | ||||||||||
Production Data: | ||||||||||||
Oil (MBbls) | 1,677 | 1,823 | 1,515 | |||||||||
Natural gas (MMcf) | 5,886 | 5,809 | 4,707 | |||||||||
NGLs (MBbls) | 642 | 680 | 407 | |||||||||
|
|
|
|
|
| |||||||
Total (MBoe)(1)(2) | 3,300 | 3,471 | 2,706 | |||||||||
Average realized prices: | ||||||||||||
Oil ($/Bbl) | $ | 66.08 | $ | 37.26 | $ | 54.16 | ||||||
Natural gas ($/Mcf) | 4.60 | 1.80 | 2.07 | |||||||||
NGLs ($/Bbl) | 29.35 | 11.61 | 15.03 | |||||||||
|
|
|
|
|
| |||||||
Total ($/Boe)(2) | $ | 47.49 | $ | 24.85 | $ | 36.17 | ||||||
Average costs (per Boe); | ||||||||||||
Gathering, transportation and marketing | $ | 2.07 | $ | 2.01 | $ | 1.84 | ||||||
Severance and ad valorem taxes | 2.82 | 1.62 | 2.37 | |||||||||
Depreciation, depletion, and amortization | 11.12 | 13.90 | 11.43 | |||||||||
General and administrative(3) | 3.87 | 4.06 | 4.40 | |||||||||
Interest expense, net | 0.52 | 0.26 | 2.07 | |||||||||
Loss (gain) on derivative instruments, net | — | — | 0.21 | |||||||||
|
|
|
|
|
| |||||||
Total | $ | 20.40 | $ | 21.85 | $ | 22.32 | ||||||
|
|
|
|
|
| |||||||
| (1) | May not sum or recalculate due to rounding. |
| (2) | “Btu-equivalent” production volumes are presented on an oil-equivalent basis using a conversion factor of six Mcf of natural gas per barrel of “oil equivalent,” which is based on approximate energy equivalency and does not reflect the price or value relationship between oil and natural gas. |
| (3) | General and administrative expenses exclude share-based compensation expenses. |
Productive Wells
Productive wells consist of producing horizontal wells, wells capable of production and exploratory, development or extension wells that are not dry wells. As of December 31, 2021, we owned mineral and royalty interests in 8,595 gross productive horizontal wells, which consisted of 7,909 oil wells and 688 natural gas wells.
We do not own any working interests in any wells. Accordingly, we do not own any net wells as such term is defined by Item 1208(c)(2) of Regulation S-K.
Acreage
The following table sets forth information relating to our acreage for our mineral and royalty interests as of December 31, 2021:
Basin | Gross DSU Acreage | Net Royalty Acreage | 100% Royalty Acreage | |||||||||
Delaware | 377,145 | 29,735 | 3,720 | |||||||||
Midland | 141,040 | 6,335 | 790 | |||||||||
SCOOP | 217,360 | 11,435 | 1,430 | |||||||||
STACK | 145,975 | 8,195 | 1,020 | |||||||||
DJ | 353,490 | 24,740 | 3,090 | |||||||||
Williston | 527,340 | 8,155 | 1,020 | |||||||||
Other | 74,235 | 3,780 | 470 | |||||||||
|
|
|
|
|
| |||||||
Total | 1,836,585 | 92,375 | 11,540 | |||||||||
|
|
|
|
|
| |||||||
The vast majority of our mineral and royalty interests are leased to our operators with greater than 90% of our approximately 88,145 leased net royalty acres being held by production as of December 31, 2021. In addition, we had approximately 4,230 net royalty acres that were not leased as of December 31, 2021.
Drilling Results
The following table sets forth information with respect to the number of wells turned to production on our properties during the periods indicated. The information should not be considered indicative of future performance, nor should it be assumed that there is necessarily any correlation among the number of productive wells drilled, the quantities of reserves found and the economic value. Productive wells are those that produce commercial quantities of hydrocarbons, whether or not they produce a reasonable rate of return. As a mineral and royalty interest owner, we generally are not provided information as to whether any wells drilled on the properties underlying our acreage are classified as exploratory.
| Years Ended December 31, | ||||||||||||
| 2021 | 2020 | 2019 | ||||||||||
Development wells: | ||||||||||||
Productive | 688 | 719 | 906 | |||||||||
Dry(1) | — | — | — | |||||||||
|
|
|
|
|
| |||||||
Total | 688 | 719 | 906 | |||||||||
|
|
|
|
|
| |||||||
| (1) | We are not aware of any dry holes drilled on the acreage underlying our mineral and royalty interests during the relevant periods. |
Regulation of Environmental and Occupational Safety and Health Matters
Oil, natural gas and NGL exploration, development and production operations are subject to stringent laws and regulations governing the discharge of materials into the environment or otherwise relating to protection of the environment or occupational health and safety. These laws and regulations have the potential to impact production on our properties, including requirements to:
| • | obtain permits to conduct regulated activities; |
| • | limit or prohibit drilling activities on certain lands lying within wilderness, wetlands and other protected areas; |
| • | restrict the types, quantities and concentration of materials that can be released into the environment in the performance of drilling and production activities; |
| • | initiate investigatory and remedial measures to mitigate pollution from former or current operations, such as restoration of drilling pits and plugging of abandoned wells; |
| • | apply specific health and safety criteria addressing worker protection; and |
| • | impose substantial liabilities for pollution resulting from operations. |
Failure to comply with environmental laws and regulations may result in the assessment of administrative, civil and criminal sanctions, including monetary penalties, the imposition of strict, joint and several liability, investigatory and remedial obligations and the issuance of injunctions limiting or prohibiting some or all of the operations on our properties. Moreover, these laws, rules and regulations may restrict the rate of oil, natural gas and NGL production below the rate that would otherwise be possible. The regulatory burden on the oil and natural gas industry increases the cost of doing business in the industry and consequently affects profitability. The trend in environmental regulation has been to place more restrictions and limitations on activities that may affect the environment, and thus, any changes in environmental laws and regulations or re-interpretation of enforcement policies that result in more stringent and costly construction, drilling, water management, completion, emission or discharge limits or waste handling, disposal or remediation obligations could increase the cost to our operators of developing our properties. Moreover, accidental releases or spills may occur in the course of operations on our properties, causing our operators to incur significant costs and liabilities as a result of such releases or spills, including any third-party claims for damage to property, natural resources or persons.
Increased costs or operating restrictions on our properties as a result of compliance with environmental laws could result in reduced exploratory and production activities on our properties and, as a result, our revenues and results of operations. The following is a summary of certain existing environmental, health and safety laws and regulations, each as amended from time to time, to which operations on our properties are subject.
Hazardous Substances and Waste Handling
The Comprehensive Environmental Response, Compensation and Liability Act, or “CERCLA,” also known as the Superfund law, and comparable state laws impose liability without regard to fault or the legality of the original conduct on certain classes of persons who are considered to be responsible for the release of a “hazardous substance” into the environment. Under CERCLA, these “responsible persons” may include the owner or operator of the site where the release occurred, and entities that transport, dispose of or arrange for the transport or disposal of hazardous substances released at the site. These responsible persons may be subject to joint and several strict liability for the costs of cleaning up the hazardous substances that have been released into the environment, for damages to natural resources and for the costs of certain health studies. CERCLA also authorizes the U.S. Environmental Protection Agency (“EPA”) and, in some instances, third parties to act in response to threats to the public health or the environment and to seek to recover from the responsible classes of persons the costs they incur. It is not uncommon for neighboring landowners and other third-parties to file claims for personal injury and property damage allegedly caused by the hazardous substances released into the environment.
The Resource Conservation and Recovery Act (“RCRA”) and comparable state laws control the management and disposal of hazardous and non-hazardous waste. These laws and regulations govern the generation, storage, treatment, transfer and disposal of wastes generated. Drilling fluids, produced waters and most of the other wastes associated with the exploration, development and production of oil, natural gas and NGLs, if properly handled, are currently exempt from regulation as hazardous waste under RCRA and, instead, are regulated under RCRA’s less stringent non-hazardous waste provisions, state laws or other federal laws. However, it is possible that certain oil, natural gas and NGL drilling and production wastes now classified as non-hazardous could be classified as hazardous wastes in the future. Any such change could result in an increase in the costs to manage and dispose of wastes, which could increase the costs of our operators’ operations.
Certain of our properties have been used for oil and natural gas exploration and production for many years. Although the operators may have utilized operating and disposal practices that were standard in the industry at the time, petroleum hydrocarbons and wastes may have been disposed of or released on or under our properties, or on or under other offsite locations where these petroleum hydrocarbons and wastes have been taken for recycling or disposal. Our properties and the petroleum hydrocarbons and wastes disposed or released thereon may be subject to CERCLA,
RCRA and analogous state laws. Under such laws, the owner or operator could be required to remove or remediate previously disposed wastes, to clean up contaminated property and to perform remedial operations such as restoration of pits and plugging of abandoned wells to prevent future contamination or to pay some or all of the costs of any such action.
Water Discharges and NORM
The Federal Water Pollution Control Act, also known as the “Clean Water Act,” and analogous state laws impose restrictions and strict controls with respect to the discharge of pollutants, including spills and leaks of oil, into federal and state waters. The discharge of pollutants into regulated waters is prohibited, except in accordance with the terms of a permit issued by the EPA or an analogous state agency. The scope of federal jurisdictional reach over waters of the United States (“WOTUS”) has been subject to substantial revision in recent years. In January 2020, the EPA and the U.S. Army Corps of Engineers (the “Corps”) replaced a prior 2015 rule with the narrower Navigable Waters Protection Rule; challenges are pending against these rulemakings, and the Biden Administration has announced plans to establish its own definition of WOTUS. Most recently, the EPA and the Corps published a proposed rulemaking to revoke the 2020 rule in favor of a pre-2015 definition until a new definition is proposed, which the Biden Administration has announced is underway. Additionally, in January 2022, the Supreme Court agreed to hear a case on the scope and authority of the Clean Water Act and the definition of WOTUS. Therefore, the scope of jurisdiction under the Clean Water Act is uncertain at this time, and any increase in scope could result in increased costs or delays with respect to obtaining permits for certain activities for our operators. In addition, federal and state regulatory agencies can impose administrative, civil and criminal penalties for non-compliance with discharge permits or other requirements of the Clean Water Act and analogous state laws and regulations. Spill prevention, control and countermeasure plan requirements imposed under the Clean Water Act require appropriate containment berms and similar structures to help prevent the contamination of navigable waters in the event of a hydrocarbon tank spill, rupture or leak. In addition, the Clean Water Act and analogous state laws require individual permits or coverage under general permits for discharges of storm water runoff from certain types of facilities. The Oil Pollution Act of 1990, as amended, or “OPA,” amends the Clean Water Act and establishes strict liability and natural resource damages liability for unauthorized discharges of oil into waters of the United States. OPA requires owners or operators of certain onshore facilities to prepare Facility Response Plans for responding to a worst case discharge of oil into waters of the United States.
In addition, naturally occurring radioactive material (“NORM”) is brought to the surface in connection with oil and gas production. Concerns have arisen over traditional NORM disposal practices (including discharge through publicly owned treatment works into surface waters), which may increase the costs associated with management of NORM.
Air Emissions
The Clean Air Act of 1963 (“CAA”) and comparable state laws restrict the emission of air pollutants from many sources through air emissions permitting programs and also impose various monitoring and reporting requirements. These laws and regulations may require our operators to obtain pre-approval for the construction or modification of certain projects or facilities expected to produce or significantly increase air emissions, obtain and strictly comply with stringent air permit requirements or incur development expenses to install and utilize specific equipment or technologies to control emissions. For example, in December 2019, the EPA reclassified Colorado’s ozone nonattainment areas under the National Ambient Air Quality Standards (“NAAQS”) from moderate to serious nonattainment. At times, the EPA may consider revising these NAAQS. For example, the Biden Administration has announced plans to formally review a prior EPA decision to retain, without revision, the 2015 NAAQS for ozone. Also, the Colorado Air Quality Control Commission has approved new rules to reduce emissions from oil and gas operations in the state, including requirements for more extensive emissions monitoring and reporting. These revisions could increase the costs of development and production on our properties, potentially impairing the economic development of our properties. Obtaining permits has the potential to delay the development of oil and natural gas projects. Federal and state regulatory agencies may impose administrative, civil and criminal penalties for non-compliance with air permits or other requirements of the CAA and associated state laws and regulations.
Climate Change
The threat of climate change continues to attract considerable attention in the United States and in foreign countries, numerous proposals have been made and could continue to be made at the international, national, regional, and state levels of government to monitor and limit existing emissions of greenhouse gasses (“GHGs”) as well as to restrict or eliminate such future emissions.
In the United States, no comprehensive climate change legislation has been implemented at the federal level. However, President Biden has highlighted addressing climate change as a priority of his administration and has issued several executive orders addressing climate change. Moreover, following the U.S. Supreme Court finding that GHG emissions constitute a pollutant under the CAA, the EPA has adopted regulations that, among other things, establish construction and operating permit reviews for GHG emissions from certain large stationary sources, require the monitoring and annual reporting of GHG emissions from certain petroleum and natural gas system sources in the United States, and together with the U.S. Department of Transportation (the “DOT”), implementing GHG emissions limits on vehicles manufactured for operation in the United States. The regulation of methane from oil and gas facilities has been subject to uncertainty in recent years. For more information, see our regulatory disclosure titled “Hydraulic Fracturing Activities.”
Additionally, various states and groups of states have adopted or are considering adopting legislation, regulation or other regulatory initiatives that are focused on such areas GHG cap and trade programs, carbon taxes, reporting and tracking programs, and restriction of emissions. At the international level, the United Nations sponsored “Paris Agreement” requires member states to submit non-binding, individually-determined reduction goals known as Nationally Determined Contributions (“NDCs”) every five years after 2020. Although the United States had withdrawn from the Paris Agreement, President Biden recommitted the United States to the agreement by executive order and, in April 2021, established a goal of reducing economy-wide net GHG emissions 50-52% below 2005 levels by 2030. Additionally, at the 26th conference of parties (“COP26”) in Glasgow in November 2021, the United States and the European Union jointly announced the launch of a Global Methane Pledge; an initiative committing to a collective goal of reducing global methane emissions by at least 30% from 2020 levels by 2030, including “all feasible reductions” in the energy sector. However, the impacts of these actions remain unclear at this time.
Governmental, scientific, and public concern over the threat of climate change arising from GHG emissions has resulted in increasing political risks in the United States, including action taken by President Biden with respect to his climate change related pledges. On January 27, 2021, President Biden issued an executive order that calls for substantial action on climate change, including, among other things, the increased use of zero-emission vehicles by the federal government, the elimination of subsidies provided to the fossil fuel industry, and increased emphasis on climate-related risks across government agencies and economic sectors. The Biden Administration has also called for restrictions on leasing on federal land, including the Department of Interior’s publication of a report recommending various changes to the federal leasing program, though many such changes would require Congressional action. Substantially all of our mineral interests are located on private lands, but we cannot predict the full impact of these developments or whether the Biden Administration may pursue further restrictions. Other actions that could be pursued by the Biden Administration may include the imposition of more restrictive requirements for the establishment of pipeline infrastructure or the permitting of liquified natural gas (“LNG”) export facilities, as well as more restrictive GHG emissions limitations for oil and gas facilities. Litigation risks are also increasing as a number of cities and other local governments have sought to bring suit against certain oil and natural gas companies in state or federal court, alleging among other things, that such companies created public nuisances by producing fuels that contributed to climate change or alleging that the companies have been aware of the adverse effects of climate change for some time but defrauded their investors or customers by failing to adequately disclose those impacts.
There are also increasing financial risks for fossil fuel producers as stockholders currently invested in fossil-fuel energy companies concerned about the potential effects of climate change may elect in the future to shift some or all of their investments into non-energy related sectors. Institutional lenders who provide financing to fossil-fuel energy companies also have become more attentive to sustainable lending practices and some of them may elect not to provide funding for fossil fuel energy companies. For example, at COP26, the Glasgow Financial Alliance for Net Zero (“GFANZ”) announced that commitments from over 450 firms across 45 countries had resulting in over $130 trillion in capital committed to net zero goals. The various sub-alliances of GFANZ generally require participants to set short-term, sector-specific targets to transition their financing, investing and/or underwriting activities to net zero emissions by 2050. There is also a risk that financial institutions will be required to adopt policies that have the effect of reducing the funding provided to the fossil fuel sector. In late 2020, the Federal Reserve joined the Network for Greening the Financial System (“NGFS”), a consortium of financial regulators focused on addressing climate-related risks in the financial sector. Subsequently, in November 2021, the Federal Reserve issued a statement in support of
the efforts of the NGFS to identify key issues and potential solutions for the climate-related challenges most relevant to central banks and supervisory authorities. Limitation of investments in and financing for fossil fuel energy companies could result in the restriction, delay or cancellation of drilling programs or development or production activities. Additionally, the SEC announced its intention to promulgate rules requiring climate disclosures. Although the form and substance of these requirements is not yet known, this may result in additional costs to comply with any such disclosure requirements.
The adoption and implementation of new or more stringent international, federal or state legislation, regulations or other regulatory initiatives that impose more stringent standards for GHG emissions from the oil and natural gas sector or otherwise restrict the areas in which this sector may produce oil and natural gas or generate the GHG emissions could result in increased costs of compliance or costs of consuming, and thereby reduce demand for oil and natural gas, which could reduce the profitability of our interests. Additionally, political, litigation and financial risks may result in our oil and natural gas operators restricting or cancelling production activities, incurring liability for infrastructure damages as a result of climatic changes, or impairing their ability to continue to operate in an economic manner, which also could reduce the profitability of our interests. One or more of these developments could have a material adverse effect on our business, financial condition and results of operation.
Climate change may also result in various physical risks, such as the increased frequency or intensity of extreme weather events or changes in meteorological and hydrological patterns, that could adversely impact our operations, as well as those of our operators. Such physical risks may result in damage to operators’ facilities or otherwise adversely impact their operations, such as if they become subject to water use curtailments in response to drought, or demand for their products, such as to the extent warmer winters reduce the demand for energy for heating purposes, which may adversely impact the production or attractiveness of our assets.
Hydraulic Fracturing Activities
A substantial portion of the production on our properties involved the use of hydraulic fracturing techniques. Hydraulic fracturing is an important and common practice that is used to stimulate production of oil, natural gas and NGLs from dense subsurface rock formations. The hydraulic fracturing process involves the injection of water, sand and chemical additives under pressure into the formation to fracture the surrounding rock and stimulate production.
Hydraulic fracturing typically is regulated by state oil and natural gas commissions or similar agencies, but the EPA has asserted federal regulatory authority pursuant to the U.S. Safe Drinking Water Act (“SDWA”) over certain hydraulic fracturing activities involving the use of diesel fuel in fracturing fluids and issued permitting guidance that applies to such activities. Additionally, the EPA issued final CAA regulations in 2012 and in June 2016 governing performance standards, including standards for the capture of emissions of methane and volatile organic compounds released during hydraulic fracturing. In September 2020, the Trump Administration revised these regulations to remove the transmission and storage segments from the oil and natural gas source category and rescind the methane-specific requirements applicable to sources in the production and processing segments. In November 2021, the EPA issued a proposed rule that, if finalized, would establish OOOO(b) new source and OOOO(c) first-time existing source standards of performance for methane and volatile organic compound emissions for oil and gas facilities. Operators of affected facilities will have to comply with specific standards of performance to include leak detection using optical gas imaging and subsequent repair requirements, and reduction of emissions by 95% through capture and control systems. The EPA plans to issue a supplemental proposal in 2022 containing additional requirements not included in the November 2021 proposed rule and anticipates the issuance of a final rule by the end of the year.
Also, in December 2016, the EPA released its final report on the potential impacts of hydraulic fracturing on drinking water resources. The final report concluded that “water cycle” activities associated with hydraulic fracturing may impact drinking water resources under certain limited circumstances.
In addition, various state and local governments have implemented, or are considering, increased regulatory oversight of hydraulic fracturing through additional permit requirements, operational restrictions, disclosure requirements, well construction and temporary or permanent bans on hydraulic fracturing in certain areas. For example, Texas, Colorado and North Dakota, among others, have adopted regulations that impose new or more stringent permitting, disclosure, disposal and well construction requirements on hydraulic fracturing operations. States could also elect to prohibit high volume hydraulic fracturing altogether. Separately, in Texas, there has been increased pressure on the Railroad Commission (“RRC”) to impose more stringent limitations on the flaring of gas from oil wells to prevent waste and because of increased concerns related to the environmental effects of flaring. The RRC continues to approve flaring permits, but at least one lawsuit has been filed by a pipeline operator challenging the
RRC’s flaring approval practices. Additionally, the RRC has approved a new flaring request form, which may result in reducing approvals for flaring. Any future requirements limiting flaring could adversely affect exploration and production activities on our properties and result in increased costs to connect wells to pipelines. In addition to state laws, local land use restrictions, such as city ordinances, may restrict drilling in general and/or hydraulic fracturing in particular. For more information on such restrictions in Colorado, see “Item 1A-Risk Factors-Federal and state legislative and regulatory initiatives relating to hydraulic fracturing could result in our operators incurring increased costs, additional operating restrictions or delays and fewer potential drilling locations.” If new federal, state or local laws or regulations that significantly restrict hydraulic fracturing are adopted, such legal requirements could result in delays, eliminate certain drilling and injection activities and make it more difficult or costly to perform hydraulic fracturing. Any such regulations limiting or prohibiting hydraulic fracturing could result in decreased oil, natural gas and NGL exploration and production activities and, therefore, adversely affect the development of our properties.
Endangered Species Act
The Endangered Species Act (the “ESA”) restricts activities that may affect endangered and threatened species or their habitats. The designation of previously unidentified endangered or threatened species could cause our operators to incur additional costs or become subject to operating delays, restrictions or bans in the affected areas. Recently, there have been renewed calls to review protections currently in place for the Dunes Sagebrush Lizard, whose habitat includes the Permian Basin, and Greater Sage Grouse, which can be found across a large swath of the northwestern United States in oil and gas producing states, and to reconsider listing the species under the ESA. In July 2020, the US Fish and Wildlife Service (“FWS”) determined that sufficient information had been presented to warrant a 12-month review for listing of the Dunes Sagebrush Lizard, which review is ongoing; the agency is also reviewing a candidate conservation agreement with assurances for the species. In June 2021, the FWS proposed to list two distinct population segments of the Lesser Prairie Chicken, whose range extends to areas where we may hold mineral interests, under the ESA. To the extent species are listed under the ESA or similar state laws, or previously unprotected species are designated as threatened or endangered in areas where our properties are located, operations on those properties could incur increased costs arising from species protection measures and face delays or limitations with respect to production activities thereon.
Employee Health and Safety
Operations on our properties are subject to a number of federal and state laws and regulations, including the federal Occupational Safety and Health Act, or “OSHA,” and comparable state statutes, whose purpose is to protect the health and safety of workers. In addition, the OSHA hazard communication standard, the EPA community right-to-know regulations under Title III of the federal Superfund Amendment and Reauthorization Act and comparable state statutes require that information be maintained concerning hazardous materials used or produced in operations and that this information be provided to employees, state and local government authorities and citizens.
Judicial and Legislative Matters
Muscogee (Creek) Nation Reservation
On July 9, 2020, the U.S. Supreme Court ruled in McGirt v. Oklahoma that the Muscogee (Creek) Nation reservation in Eastern Oklahoma has not been disestablished. Although the Court’s ruling indicates that it is limited to criminal law as applied within the Muscogee (Creek) Nation reservation, the ruling has significant potential implications for civil law within the Muscogee (Creek) Nation reservation, as well as other reservations in Oklahoma that may similarly be found to not have been disestablished. State district courts in Oklahoma, applying the analysis in the U.S. Supreme Court’s ruling regarding the Muscogee (Creek) Nation, have ruled that the Cherokee, Chickasaw, Seminole, Quapaw and Choctaw reservations likewise have not been disestablished. Other nations, such as the Osage Nation, have also sought to have findings of disestablishment overturned. While we cannot predict the full extent to which civil jurisdiction may be affected, the ruling could adversely affect title to our mineral interests, to the extent they are found to be located within reservation areas, and significantly impact laws and regulations to which we and our operators and interests are subject in Oklahoma, such as taxation, environmental regulation, and the permitting and siting of energy assets.
On October 1, 2020, the EPA granted approval to the State of Oklahoma under Section 10211(a) of the Safe, Accountable, Flexible, Efficient Transportation Equity Act of 2005 (the “SAFETE Act”) to administer all of the State’s existing EPA-approved regulatory programs to many areas of Indian Country within Oklahoma, effectively
extending Oklahoma’s authority for existing EPA-approved regulatory programs to lands within Oklahoma previously under the jurisdiction of the State before the U.S. Supreme Court’s ruling in McGirt. However, several Tribes have expressed dissatisfaction with the consultation process performed in relation to this approval, and, in December 2021, the EPA proposed to withdraw and reconsider the October 2020 decision. Additionally, the SAFETE Act provides that any Tribe in Oklahoma may seek “Treatment as a State” by the EPA, and it is possible that one or more of the Tribes in Oklahoma may seek such an approval from the EPA.
Separately, in 2021, the U.S. Department of the Interior subsequently used the ruling in McGirt to find that Oklahoma could not keep jurisdiction over surface coal mining on the Muscogee (Creek) Nation’s lands. The State of Oklahoma has petitioned the U.S. Supreme Court to overturn this determination and find that McGirt either is limited to federal criminal matters or was incorrectly decided. Several other suits have been filed in state and federal courts regarding the appropriate scope of McGirt, including a stayed proceeding before the Oklahoma Supreme Court regarding the Oklahoma Corporation Commission’s authority to issue drilling permits on the Muscogee (Creek) reservation. At this time, we cannot predict how these jurisdictional issues may ultimately be resolved. We will continue to monitor developments concerning these matters.
Dakota Access Pipeline (“DAPL”)
On July 6, 2020, the U.S. District Court for the District of Columbia ordered vacatur of DAPL’s easement from the “Corps” and further ordered the shutdown of the pipeline by August 5, 2020 while the Corps completes a full environmental impact statement for the project. On January 26, 2021, the Court of Appeals for the District of Columbia affirmed the vacatur of the easement, but declined to require the pipeline to shut down while an Environmental Impact Statement is prepared. Following the denial of a rehearing en banc, on September 20, 2021, Dakota Access filed a petition with the U.S. Supreme Court to hear the case. Oppositions were filed by the Solicitor General and Plaintiffs and Dakota Access has filed its reply. On May 21, 2021, the District Court denied the Plaintiff’s request for an injunction and, on June 22, 2021, terminated the consolidated lawsuits and dismissed all remaining outstanding counts without prejudice. The pipeline continues to operate pending completion of the Environmental Impact Statement which the Corps now estimates will be complete by the end of 2022. We cannot determine when or how future lawsuits will be resolved or the impact they may have on the DAPL. If future legal challenges to DAPL are successful, transportation costs for crude oil will likely increase in the Williston Basin, and the operators of our properties in the Williston Basin may choose to shut in wells if they are unable to connect those wells to other pipelines or obtain sufficient capacity on other pipelines at an effective cost, both of which may adversely impact our revenues and future production from our properties in the Williston Basin.
Implementation of Colorado SB 19-181 (“SB 181”)
In November 2020, the Colorado Oil and Gas Conservation Committee (“COGCC”), as part of SB 181’s mandate for the COGCC to prioritize public health and environmental concerns in its decisions, adopted revisions to several regulations to increase protections for public health, safety, welfare, wildlife, and environmental resources. Most significantly, these revisions establish more stringent setbacks (2,000 feet, instead of the prior 500-foot) on new oil and gas development and eliminate routine flaring and venting of natural gas at new or existing wells across the state, each subject to only limited exceptions. Some local communities have adopted, or are considering adopting, further restrictions for oil and gas activities, such as requiring greater setbacks. The Colorado Department of Public Health and the Environment also recently finalized rules related to the control of emissions from certain pre-production activities. These and other developments related to the implementation of SB 181 could adversely impact our revenues and future production from our properties.
Title to Properties
Prior to completing an acquisition of mineral and royalty interests, we perform a title review on each tract to be acquired. Our title review is meant to confirm the quantum of mineral and royalty interest owned by a prospective seller, the property’s lease status and royalty amount as well as encumbrances or other related burdens. For our Texas properties, we obtain a limited title memorandum rendered by an oil and gas law firm. As a result, title examinations have been obtained on a significant portion of our properties.
In addition to our initial title work, operators often will conduct a thorough title examination prior to leasing and/or drilling a well. Should an operator’s title work uncover any further title defects, either we or the operator will
perform curative work with respect to such defects. An operator generally will not commence drilling operations on a property until any material title defects on such property have been cured. We believe that the title to our assets is satisfactory in all material respects. Although title to these properties is in some cases subject to encumbrances, such as customary interests generally retained in connection with the acquisition of oil and gas interests, non-participating royalty interests and other burdens, easements, restrictions or minor encumbrances customary in the oil and natural gas industry, we believe that none of these encumbrances will materially detract from the value of these properties or from our interest in these properties.
Competition
The oil and natural gas business is highly competitive in the exploration for and acquisition of reserves, the acquisition of minerals and oil and natural gas leases and personnel required to find and produce reserves. Many of our competitors not only own and acquire mineral and royalty interests but also explore for and produce oil and natural gas and, in some cases, carry on midstream and refining operations and market petroleum and other products on a regional, national or worldwide basis. By engaging in such other activities, our competitors may be able to develop or obtain information that is superior to the information that is available to us. In addition, certain of our competitors may possess financial or other resources substantially larger than we possess. Our ability to acquire additional minerals and properties and to discover reserves in the future will be dependent upon our ability to evaluate and select suitable properties and to consummate transactions in a highly competitive environment.
In addition, oil and natural gas products compete with other forms of energy available to customers, primarily based on price. These alternate forms of energy include electricity, coal, and fuel oils. Changes in the availability or price of oil and natural gas or other forms of energy, as well as business conditions, conservation, legislation, regulations, and the ability to convert to alternate fuels and other forms of energy may affect the demand for oil and natural gas.
Seasonality of Business
Weather conditions affect the demand for, and prices of, natural gas and can also delay drilling activities, disrupting our overall business plans. Additionally, some of the areas in which our properties are located are adversely affected by seasonal weather conditions, primarily in the winter and spring. During periods of heavy snow, ice or rain, our operators may be unable to move their equipment between locations, thereby reducing their ability to operate our wells, reducing the amount of oil and natural gas produced from the wells on our properties during such times. For example, the prior winter storms in February 2021 adversely affected operator activity and production volumes in the southern United States, including in the Permian Basin. Additionally, extended drought conditions in the areas in which our properties are located could impact our operators’ ability to source sufficient water or increase the cost for such water. Furthermore, demand for natural gas is typically higher during the winter, resulting in higher natural gas prices for our natural gas production during our first and fourth quarters. Certain natural gas users utilize natural gas storage facilities and purchase some of their anticipated winter requirements during the summer, which can lessen seasonal demand fluctuations. Seasonal weather conditions can limit drilling and producing activities and other oil and natural gas operations in a portion of our operating areas. Due to these seasonal fluctuations, our results of operations for individual quarterly periods may not be indicative of the results that we may realize on an annual basis.
Human Capital Resources
Culture
Our employees are one of our most valuable assets. Our small size and organizational structure promote a highly collaborative working environment and shared sense of purpose that differentiates us from our competitors. In addition, we rely on the strength of our technical expertise, particularly those individuals engaged in our engineering and geology departments, to inform our investment decisions and portfolio construction and management. Given our team’s understanding of oil and gas operations, we are able to better assess risk inherent in the mineral and royalty assets we acquire.
Headcount and Demographics
As of December 31, 2021, we had 44 full-time employees and six temporary employees. All of our employees are located in our Austin, Texas office. In addition to our two founders, we currently have approximately 12 full-time employees in our engineering and geology departments, seven full-time employees dedicated to our ground game
acquisition and business development departments, eight full-time employees in our land department, and 14 full-time employees in our finance, accounting, information technology and legal departments. The vast majority of our temporary employees are part-time employees that assist the ground game acquisition and business development departments. Approximately 46% of our employees are female and approximately 34% of our employees identify as minorities. We have no collective bargaining agreements with our employees. We believe that our employee relationships are satisfactory. We hire independent contractors on an as needed basis.
Competitive Compensation and Benefits
Our compensation programs are designed to align the compensation of our employees with our performance and to provide the proper incentives to attract, retain and motivate our employees to achieve top-quality results. Specifically:
| • | We engage a nationally recognized outside compensation and benefits consulting firm to provide benchmarking against our peers within the industry for executive compensation. |
| • | Our executive compensation program is designed to attract, motivate and retain high-quality leadership and incentivize our executive officers to achieve performance goals over the short- and long-term, which also aligns the interests of our executive officers with those of our stockholders. As such, our compensation program for our executive officers is heavily weighted toward equity-based compensation and does not include an annual cash bonus. Equity-based compensation generally includes both restricted stock units subject to time-based vesting and restricted stock units subject to performance-based vesting. |
| • | All full-time employees are eligible for health insurance paid for 100% by us, paid and unpaid leaves, including parental leave, a retirement plan and disability/accident coverage. |
| • | We have a corporate philanthropy program that provides matching gifts by us for both monetary gifts by employees and time volunteered by employees during their personal time, along with group opportunities for employees to volunteer together once a quarter during company time. |
| • | We have an education reimbursement program to assist our employees in developing knowledge, skills and job effectiveness through higher education. |
| • | We provide onsite fitness classes four days a week, providing our employees with the opportunity to be active, boost their mental health and interact with others from different departments. |
Training and Development
In light of our small size and collaborative working environment, we currently do not have a need to implement a formal in-house training and development program. Instead, we emphasize on-the-job training, informal mentoring and encourage our employees to participate in external training and development courses, programs and professional organizations. Our employees are encouraged to take responsibility for their development, and we are committed to ensuring that they have the resources they need to succeed.
Retention and Tenure
The combination of our culture, competitive compensation, career growth and development opportunities foster employee tenure and reduce voluntary turnover rates. The average tenure of our employees is approximately four years.
Workplace Safety
We care about the safety of our colleagues and all visitors to our workplace. During 2021, our continued focus on workplace safety from 2020 enabled us to keep our offices open in spite of the ongoing COVID-19 pandemic. Once COVID-19 vaccines were available, we provided vaccination encouragement payments to those employees that chose to get vaccinated and boosted. As a result, approximately 85% of our employees have received at least two doses of the COVID-19 vaccine.