
Exhibit 99.1 Investor Presentation March 7, 2023

Disclaimer FORWARD-LOOKING STATEMENTS This presentation relates to Sitio Royalties Corp. (the “Company” or “Sitio”) and contains statements that may constitute “forward-looking statements” for purposes of federal securities laws. Forward-looking statements include, but are not limited to, statements that refer to projections, forecasts, or other characterizations of future events or circumstances, including any underlying assumptions. The words “anticipate,” “believe,” “continue,” “could,” “estimate,” “expect,” “intends,” “may,” “might,” “plan,” “seeks,” “possible,” “potential,” “predict,” “project,” “prospects,” “guidance,” “outlook,” “should,” “would,” “will,” and similar expressions may identify forward-looking statements, but the absence of these words does not mean that a statement is not forward-looking. These statements include, but are not limited to, statements about the Company’s expected results of operations, cash flows, financial position and future dividends; as well as future plans, expectations, and objectives for the Company’s operations, including statements about strategy, synergies, future operations, financial position, prospects, and plans. While forward-looking statements are based on assumptions and analyses made by us that we believe to be reasonable under the circumstances, whether actual results and developments will meet our expectations and predictions depend on a number of risks and uncertainties that could cause our actual results, performance, and financial condition to differ materially from our expectations and predictions. See the Company’s filings with the U.S. Securities and Exchange Commission (the “SEC”), including the Company’s Annual Report on Form 10-K for the fiscal year ended December 31, 2021, Part II, Item 1A “Risk Factors” in previous Quarterly Reports on Form 10-Q and Current Reports on Form 8-K, each filed with the SEC for a discussion of risk factors that affect the Company’s business. Any forward-looking statement made in this presentation speaks only as of the date on which it is made. Factors or events that could cause actual results to differ may emerge from time to time, and it is not possible to predict all of them. Sitio undertakes no obligation to publicly update any forward-looking statement, whether as a result of new information, future development, or otherwise, except as may be required by law. INDUSTRY AND MARKET DATA The information, data and statistics contained herein are derived from various internal (including data that Sitio has internally collected) and external third-party sources. While Sitio believes such third-party information is reliable, there can be no assurance as to the accuracy or completeness of the indicated information. Sitio has not independently verified the accuracy or completeness of the information provided by third party sources. No representation is made by Sitio’s management as to the reasonableness of the assumptions made within or the accuracy or completeness of any projections or modeling or any other information contained herein. Any information, data or statistics on past performance or modeling contained herein is not an indication as to the future performance. Sitio assumes no obligation to update the information in this presentation. BASIS OF PRESENTATION Unless otherwise noted, all net royalty acre “NRA” counts are as 12/26/22 and gross and net well counts are as of 9/30/22. All NRA metrics shown on an 1/8ths royalty equivalent basis. On December 29, 2022, the Company completed the merger with Brigham Minerals, Inc. (“MNRL,” “Brigham” or the “Brigham Merger). Certain metrics in this presentation give effect to the Brigham Merger as further described herein. NON-GAAP MEASURES This presentation includes financial measures that are not presented in accordance with U.S. generally accepted accounting principles (“GAAP”). While Sitio believes such non-GAAP measures are useful for investors, they are not measures of financial performance under GAAP and should not be considered in isolation or as an alternative to any measure of such performance derived in accordance with GAAP. These non-GAAP measures have limitations as analytical tools and you should not consider them in isolation or as substitutes for analysis of results as reported under GAAP. These non-GAAP measures may not be comparable to similarly titled measures used by other companies in our industry or across different industries. 2

Sitio investment thesis Mineral and royalty interest ownership provides unique, cost advantaged oil and gas exposure and the highest free cash flow margins in the oil & gas value chain Well-positioned as a natural aggregator in a highly fragmented space, with a proven strategy for meaningful, returns-focused consolidation Premier asset base focused at the front end of operators’ cost curves, supported by a core Permian Basin footprint and exposure to major U.S. oil & gas plays Disciplined capital allocation focused on value creation and returns with target long-term leverage <1.0x and prudent hedging strategy for cash acquisitions Best-in-class governance model led by experienced Board and management 3
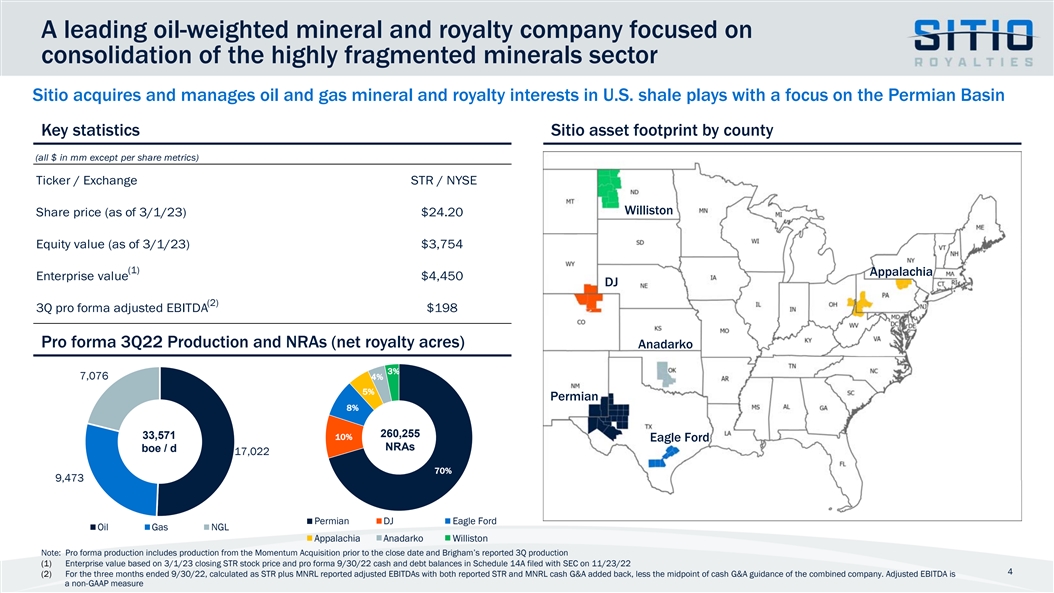
A leading oil-weighted mineral and royalty company focused on consolidation of the highly fragmented minerals sector Sitio acquires and manages oil and gas mineral and royalty interests in U.S. shale plays with a focus on the Permian Basin Key statistics Sitio asset footprint by county (all $ in mm except per share metrics) Ticker / Exchange STR / NYSE Williston Share price (as of 3/1/23) $24.20 Equity value (as of 3/1/23) $3,754 (1) Appalachia Enterprise value $4,450 DJ (2) 3Q pro forma adjusted EBITDA $198 Pro forma 3Q22 Production and NRAs (net royalty acres) Anadarko 3% 7,076 4% 5% Permian 8% 260,255 33,571 10% Eagle Ford NRAs boe / d 17,022 70% 9,473 Permian DJ Eagle Ford Oil Gas NGL Appalachia Anadarko Williston Note: Pro forma production includes production from the Momentum Acquisition prior to the close date and Brigham’s reported 3Q production (1) Enterprise value based on 3/1/23 closing STR stock price and pro forma 9/30/22 cash and debt balances in Schedule 14A filed with SEC on 11/23/22 4 (2) For the three months ended 9/30/22, calculated as STR plus MNRL reported adjusted EBITDAs with both reported STR and MNRL cash G&A added back, less the midpoint of cash G&A guidance of the combined company. Adjusted EBITDA is a non-GAAP measure

Mineral and Royalty Highlights 5
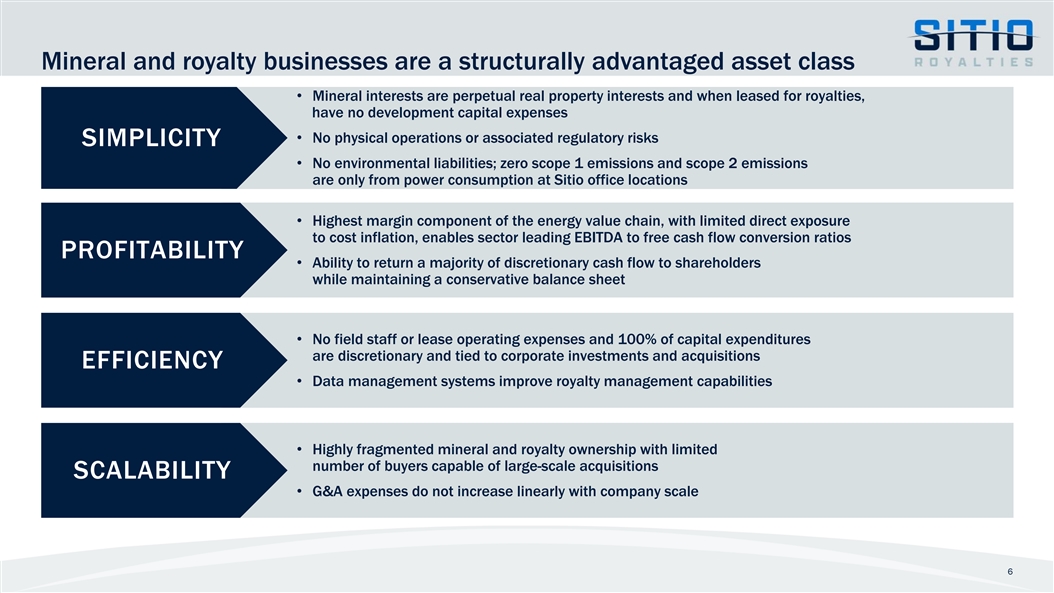
Mineral and royalty businesses are a structurally advantaged asset class • Mineral interests are perpetual real property interests and when leased for royalties, have no development capital expenses • No physical operations or associated regulatory risks SIMPLICITY • No environmental liabilities; zero scope 1 emissions and scope 2 emissions are only from power consumption at Sitio office locations • Highest margin component of the energy value chain, with limited direct exposure to cost inflation, enables sector leading EBITDA to free cash flow conversion ratios PROFITABILITY • Ability to return a majority of discretionary cash flow to shareholders while maintaining a conservative balance sheet • No field staff or lease operating expenses and 100% of capital expenditures are discretionary and tied to corporate investments and acquisitions EFFICIENCY • Data management systems improve royalty management capabilities • Highly fragmented mineral and royalty ownership with limited number of buyers capable of large-scale acquisitions SCALABILITY • G&A expenses do not increase linearly with company scale 6
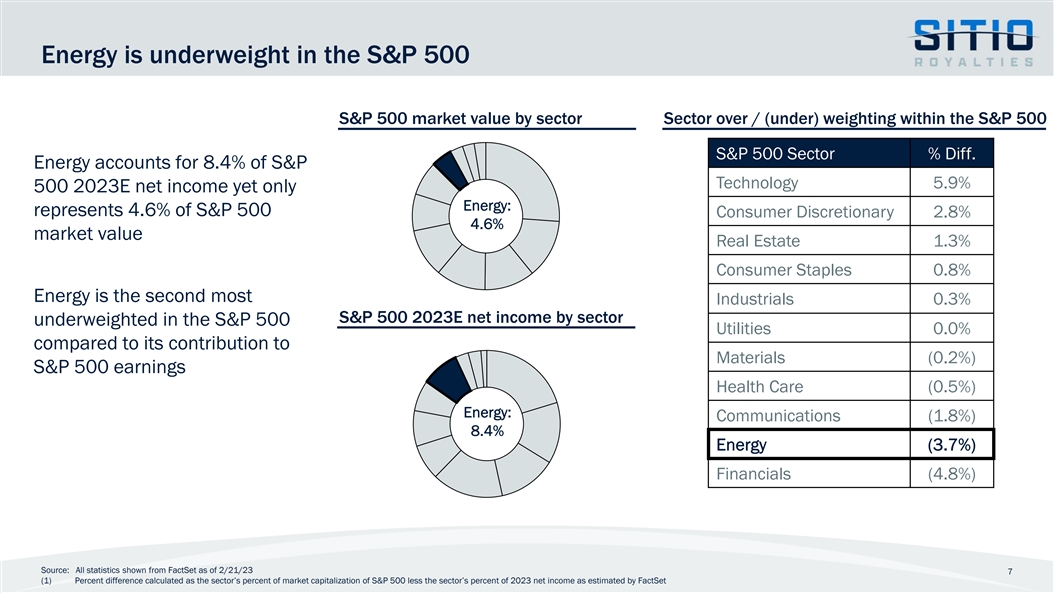
Energy is underweight in the S&P 500 S&P 500 market value by sector Sector over / (under) weighting within the S&P 500 S&P 500 Sector % Diff. Energy accounts for 8.4% of S&P Technology 5.9% 500 2023E net income yet only Energy: represents 4.6% of S&P 500 Consumer Discretionary 2.8% 4.6% market value Real Estate 1.3% Consumer Staples 0.8% Energy is the second most Industrials 0.3% S&P 500 2023E net income by sector underweighted in the S&P 500 Utilities 0.0% compared to its contribution to Materials (0.2%) S&P 500 earnings Health Care (0.5%) Energy: Communications (1.8%) 8.4% Energy (3.7%) Financials (4.8%) Source: All statistics shown from FactSet as of 2/21/23 7 (1) Percent difference calculated as the sector’s percent of market capitalization of S&P 500 less the sector’s percent of 2023 net income as estimated by FactSet

Commodities act as a real hedge against inflation Change in WTI price vs. change in inflation rate (WTI % change) (Inflation % change) Oil prices have a strong 80% 4% Correlation coefficient: 0.78 positive correlation with 60% 3% inflation 40% 2% Minerals companies provide 20% 1% exposure to commodity pricing, benefit from operator - - drilling activity, and do not (20%) (1%) have direct exposure to (40%) (2%) capital or operating expense inflation (60%) (3%) (80%) (4%) WTI Inflation 8 Note: WTI pricing from FactSet. Change in inflation rate calculated using CPI from the Bureau of Labor Statistics as of 1/25/23
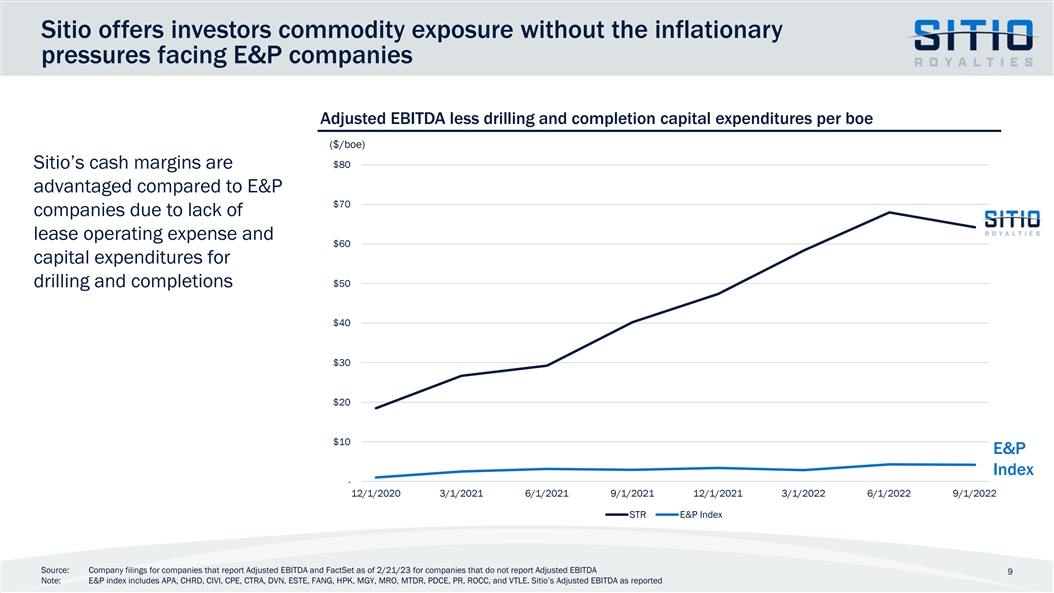
Sitio offers investors commodity exposure without the inflationary pressures facing E&P companies Adjusted EBITDA less drilling and completion capital expenditures per boe ($/boe) Sitio’s cash margins are $80 advantaged compared to E&P $70 companies due to lack of lease operating expense and $60 capital expenditures for drilling and completions $50 $40 $30 $20 $10 E&P Index - 12/1/2020 3/1/2021 6/1/2021 9/1/2021 12/1/2021 3/1/2022 6/1/2022 9/1/2022 STR E&P Index Source: Company filings for companies that report Adjusted EBITDA and FactSet as of 2/21/23 for companies that do not report Adjusted EBITDA 9 Note: E&P index includes APA, CHRD, CIVI, CPE, CTRA, DVN, ESTE, FANG, HPK, MGY, MRO, MTDR, PDCE, PR, ROCC, and VTLE. Sitio’s Adjusted EBITDA as reported
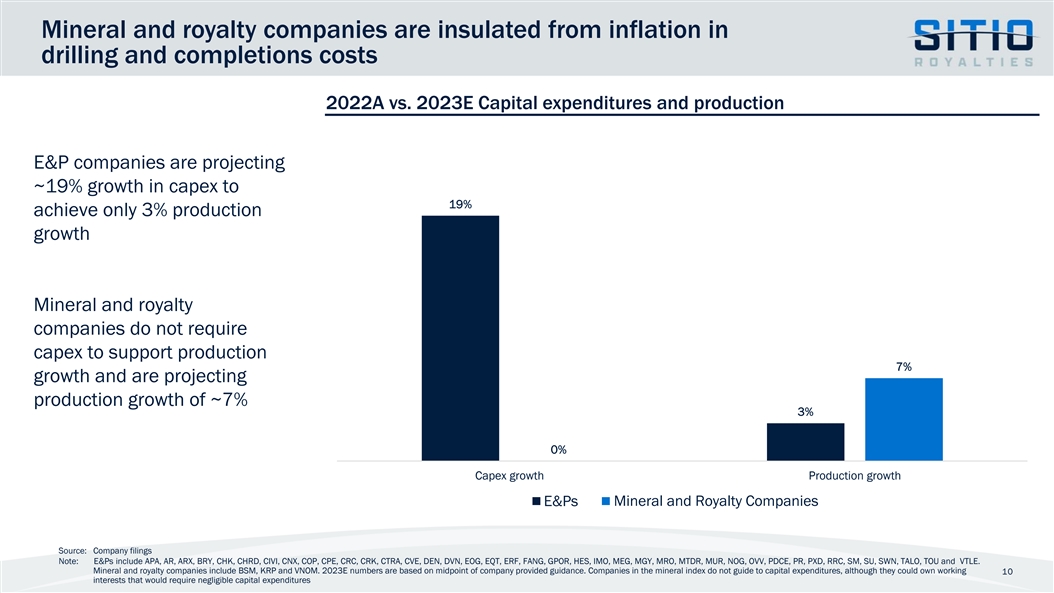
Mineral and royalty companies are insulated from inflation in drilling and completions costs 2022A vs. 2023E Capital expenditures and production E&P companies are projecting ~19% growth in capex to 19% achieve only 3% production growth Mineral and royalty companies do not require capex to support production 7% growth and are projecting production growth of ~7% 3% 0% Capex growth Production growth E&Ps Mine Mineral and rals andRoyalty Royalties Companies Companies Source: Company filings Note: E&Ps include APA, AR, ARX, BRY, CHK, CHRD, CIVI, CNX, COP, CPE, CRC, CRK, CTRA, CVE, DEN, DVN, EOG, EQT, ERF, FANG, GPOR, HES, IMO, MEG, MGY, MRO, MTDR, MUR, NOG, OVV, PDCE, PR, PXD, RRC, SM, SU, SWN, TALO, TOU and VTLE. Mineral and royalty companies include BSM, KRP and VNOM. 2023E numbers are based on midpoint of company provided guidance. Companies in the mineral index do not guide to capital expenditures, although they could own working 10 interests that would require negligible capital expenditures

Sitio has a highly scalable business model 3Q22 Adjusted EBITDA per employee $4.5 Sitio has an efficient $4.0 business model, with more than double the $3.5 pro forma Adjusted $3.0 EBITDA / employee of $2.5 other mineral and $2.0 royalty companies, and multiples of large tech $1.5 and manufacturing $1.0 companies $0.5 - ($0.5) STR M Miin ne er rals al E&P AAPL GOOGL META MSFT NFLX PG FM TSLA F AMZN RIVN Index Index Index (1) Sitio Minerals Index E&P Index Other Note: Employee count as of the latest 10-K filing for each company. Adjusted EBITDA as of the quarter ended 9/30/22 for each company. Adjusted EBITDA sourced from public company filings for companies that reported Adjusted EBITDA and FactSet as of 2/21/23 for companies that do not report Adjusted EBITDA. Mineral index includes BSM, KRP, and TPL. VNOM excluded due to shared personnel between VNOM and FANG. E&P index includes CHRD, CIVI, CRGY, MGY, PDCE, PR, RRC, SM, and SWN (1) Sitio’s pro forma Adjusted EBITDA is calculated as STR plus MNRL 3Q22 reported Adjusted EBITDAs with both reported STR and MNRL cash G&A added back, less the midpoint of cash G&A guidance of the combined company. Adjusted 11 EBITDA is a non-GAAP measure 3Q22 Adjusted EBITDA per employee ($mm)
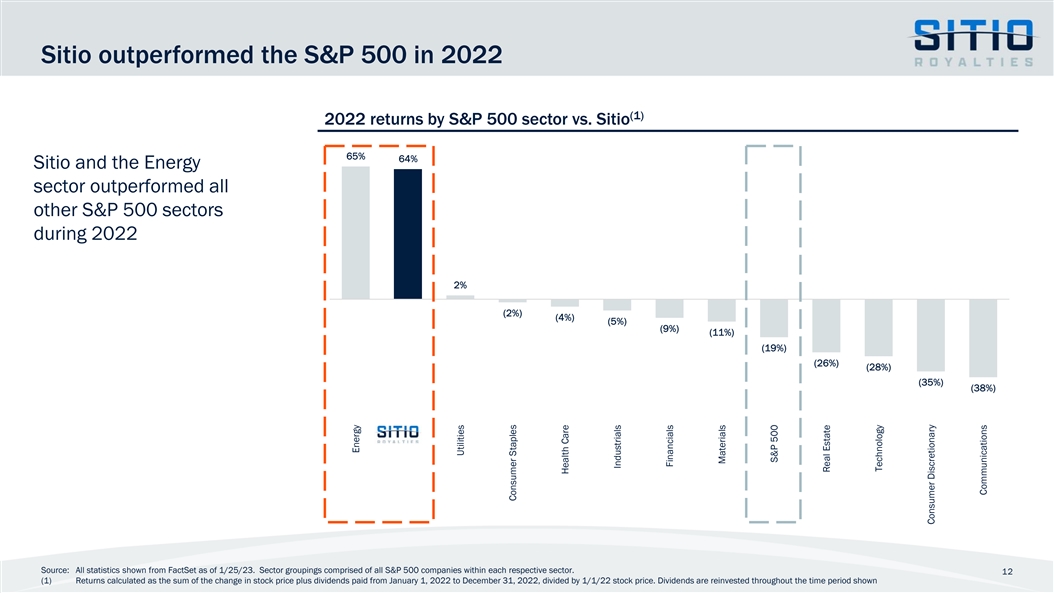
Sitio outperformed the S&P 500 in 2022 (1) 2022 returns by S&P 500 sector vs. Sitio 65% 64% Sitio and the Energy sector outperformed all other S&P 500 sectors during 2022 2% (2%) (4%) (5%) (9%) (11%) (19%) (26%) (28%) (35%) (38%) Source: All statistics shown from FactSet as of 1/25/23. Sector groupings comprised of all S&P 500 companies within each respective sector. 12 (1) Returns calculated as the sum of the change in stock price plus dividends paid from January 1, 2022 to December 31, 2022, divided by 1/1/22 stock price. Dividends are reinvested throughout the time period shown Energy STR Utilities Consumer Staples Health Care Industrials Financials Materials S&P 500 Real Estate Technology Consumer Discretionary Communications
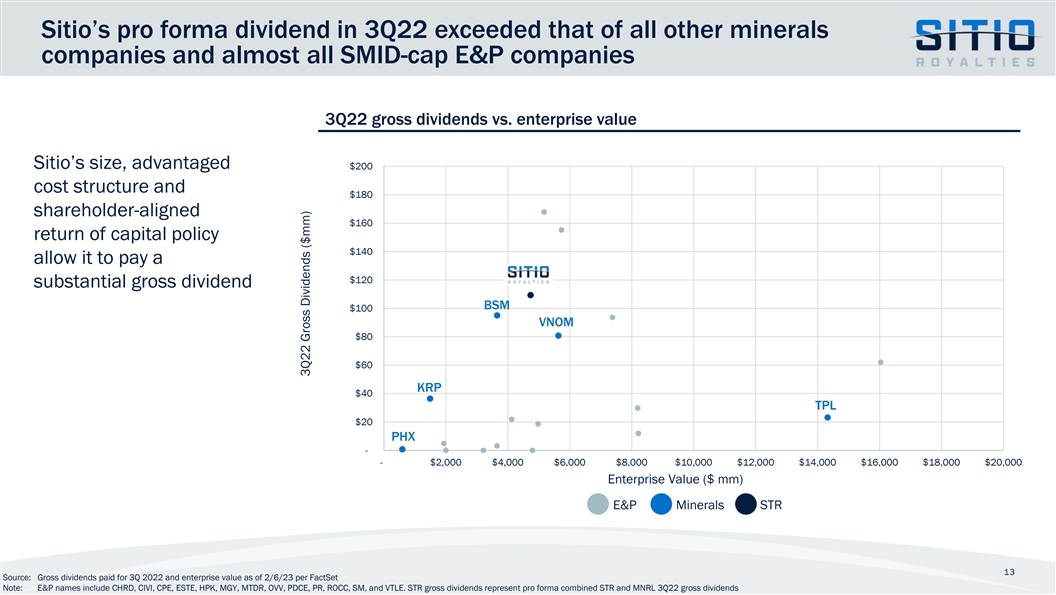
Sitio’s pro forma dividend in 3Q22 exceeded that of all other minerals companies and almost all SMID-cap E&P companies 3Q22 gross dividends vs. enterprise value Sitio’s size, advantaged $200 cost structure and $180 shareholder-aligned $160 return of capital policy $140 allow it to pay a $120 substantial gross dividend BSM $100 VNOM $80 $60 KRP $40 TPL $20 PHX - - $2,000 $4,000 $6,000 $8,000 $10,000 $12,000 $14,000 $16,000 $18,000 $20,000 Enterprise Value ($ mm) E&P Minerals STR 13 Source: Gross dividends paid for 3Q 2022 and enterprise value as of 2/6/23 per FactSet Note: E&P names include CHRD, CIVI, CPE, ESTE, HPK, MGY, MTDR, OVV, PDCE, PR, ROCC, SM, and VTLE. STR gross dividends represent pro forma combined STR and MNRL 3Q22 gross dividends 3Q22 Gross Dividends ($mm)

Sitio has traded at an elevated yield compared to peers (1) 3Q22 dividend yield Sitio provides investors 12.2% with a compelling relative value proposition within the Energy complex 7.8% 4.6% STR Minerals Index E&P Index Source: FactSet (1) 3Q22 dividend yield calculated as 3Q22 declared dividends per share divided by the closing share price on 2/21/23. Minerals companies include BSM, KRP, PHX, STR, TPL, and VNOM. E&P companies 14 include APA, CHRD, CIVI, COP, CTRA, EOG, FANG, HES, HPK, MGY, MRO, MTDR, OVV, OXY, PDCE, PR, PXD, ROCC, and SM

Sitio Overview 15

Sitio has closed 6 large acquisitions since 6/30/21 for a total of more than 195,000 NRAs Strategy focused on large-scale consolidation to drive profitability and leverage proprietary data management systems across a larger asset base Closed: 6/30/21 Closed: 6/7/22 Closed: 7/26/22 Closed: 12/29/22 NRAs: 18,700 NRAs: 33,700 NRAs: 12,200 NRAs: 86,075 Consideration: Equity Consideration: Equity Consideration: Cash Consideration: Equity Region: Permian Regions: Eagle Ford, Appalachia Region: Permian Regions: Diversified 12/29/22 6/30/21 Closed: 8/31/21 Closed: 6/27/22 NRAs: 25,250 NRAs: 19,700 Consideration: Equity Consideration: Cash Region: Permian Region: Permian 16
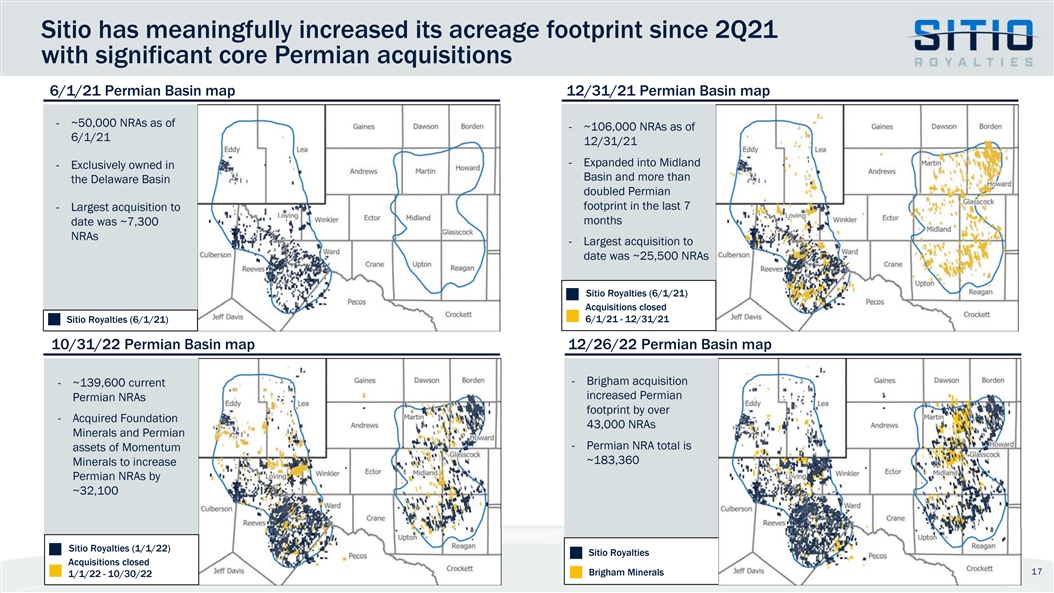
Sitio has meaningfully increased its acreage footprint since 2Q21 with significant core Permian acquisitions 6/1/21 Permian Basin map 12/31/21 Permian Basin map - ~50,000 NRAs as of - ~106,000 NRAs as of 6/1/21 12/31/21 - Expanded into Midland - Exclusively owned in Basin and more than the Delaware Basin doubled Permian footprint in the last 7 - Largest acquisition to months date was ~7,300 NRAs - Largest acquisition to date was ~25,500 NRAs Sitio Royalties (6/1/21) Acquisitions closed Sitio Royalties (6/1/21) 6/1/21 - 12/31/21 10/31/22 Permian Basin map 12/26/22 Permian Basin map - Brigham acquisition - ~139,600 current increased Permian Permian NRAs footprint by over - Acquired Foundation 43,000 NRAs Minerals and Permian - Permian NRA total is assets of Momentum ~183,360 Minerals to increase g Permian NRAs by ~32,100 Sitio Royalties (1/1/22) Sitio Royalties Acquisitions closed 17 Brigham Minerals 1/1/22 - 10/30/22
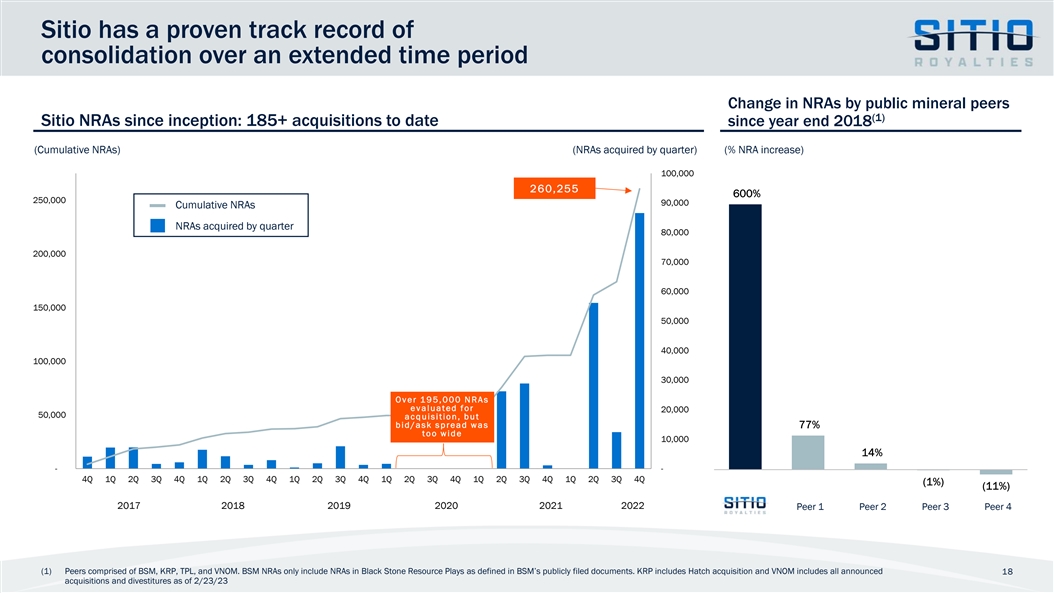
Sitio has a proven track record of consolidation over an extended time period Change in NRAs by public mineral peers (1) Sitio NRAs since inception: 185+ acquisitions to date since year end 2018 (Cumulative NRAs) (NRAs acquired by quarter) (% NRA increase) 100,000 260 260,,2 25 55 5 600% 250,000 90,000 Cumulative NRAs NRAs acquired by quarter 80,000 200,000 70,000 60,000 150,000 50,000 40,000 100,000 30,000 Ov Ove err 1 19 95,000 NR 5,000 NRAs As ev eva allua uatte ed fo d forr 20,000 50,000 a ac cq qu uisi isittion ion,, b bu utt b biid d/ /ask s ask sp pread read w wa as s 77% too too wide wide 10,000 14% - - 4Q 1Q 2Q 3Q 4Q 1Q 2Q 3Q 4Q 1Q 2Q 3Q 4Q 1Q 2Q 3Q 4Q 1Q 2Q 3Q 4Q 1Q 2Q 3Q 4Q (1%) (11%) 2017 2018 2019 2020 2021 2022 Peer 1 Peer 2 Peer 3 Peer 4 (1) Peers comprised of BSM, KRP, TPL, and VNOM. BSM NRAs only include NRAs in Black Stone Resource Plays as defined in BSM’s publicly filed documents. KRP includes Hatch acquisition and VNOM includes all announced 18 acquisitions and divestitures as of 2/23/23

Sitio’s disciplined underwriting approach results in strong returns Sitio’s recent large acquisitions are all outperforming (1) Key underwriting criteria underwriting assumptions Cumulative first 9-month production (boe/d) • Target greater than mid-teens unlevered returns (boe/d) 2,500 • Prioritize Permian-focused assets to leverage extensive in- basin experience 2,000 ~2 ~20 0% % avera averag ge e • Thoroughly diligence land, geology, and engineering data outp outpe errffo orm rma an nc ce e 1,500 • Understand depth of line-of-sight inventory 1,000 • Avoid single-operator and/or high-NRI concentration risk • Strong preference for relationship-driven, privately 500 negotiated acquisitions vs. broad auction processes - Acquisition 1 Acquisition 2 Acquisition 3 (2) Underwriting Actuals (1) Does not include MNRL, FLMN, Foundation, or Momentum transactions 19 (2) Actuals based on internal company information and IHS reported actuals as of 9/30/22

Consolidation of the minerals sector is still in a very early stage (1) (2) Aggregate public market capitalization Estimated U.S. royalty revenue ($ in Bn) Only a Only a fraction fraction of of U.S. U.S. oil oil and and gas gas royalty royalty paymen payments ts go to go to curren currentt public public Less than 10 Less than 10 publ publiic c oil oil $574 ~3% royalty compan royalty companies ies and gas and gas royalty royalty com comp pa an niie es vs. 45 s vs. 45+ + public E& public E&P P o op perators erators ~$66 Bn in 2021 $28 ~97% Mineral and Royalty E&P Public mineral Royalties paid to company revenue private mineral owners Source: Company filings, FactSet, and the EIA as of 2/21/23 (1) Minerals include BSM, DMLP, KRP, PHX, STR, TPL, and VNOM. E&P includes AMPY, APA, AR, BATL, BRY, CHK, CHRD, CIVI, CNX, COP, CPE, CRC, CRGY, CRK, CTRA, DEN, DVN, EOG, EPM, EQT, ERF, ESTE, FANG, GPOR, HES, HPK, KOS, LPI, MGY, MRO, MTDR, MUR, OVV, OXY, PDCE, PR, PXD, REI, REPX, RRC, SBOW, SD, SM, SWN, TALO, and WTI 20 (2) Total U.S. oil and gas revenues are calculated taking EIA monthly oil and gas production data, multiplying by average monthly WTI and HHUB spot prices according to the EIA. Royalty payments calculated assuming an average lease royalty of 18.75% and that 20% of oil and gas production occurs on federal acreage where all royalties go to the government

Permian minerals market, Sitio’s primary target area, remains highly fragmented Permian Basin NRAs Permian Basin addressable market ~20,000 ~20,000 and and ~45,000 ~45,000 unique unique m mineral ineral o ow wn ne er rs s Delaware Midland across across the the Dela Delaw wa ar re e a and Midland, nd Midland, r respec espectiv tive ely ly 9% 32% ~7.5mm ~5.6mm total total ~5.1mm ~5.1mm acquirable acquirable 68% 91% Non-acquirable acreage Acquirable acreage — Non-acquirable acreage is comprised of federal and state-owned minerals and royalties where the government does not sell minerals or NPRIs and minerals owned by CVX, TPL, and VNOM Sitio Acquirable NRAs — Acquirable acreage is defined as any acreage in which combined company can purchase mineral rights or NPRIs that is not owned by Non-acquirable NRAs CVX, TPL, or VNOM Delaware and Midland Basins Source: Latest publicly reported data as of 1/4/22. Unique mineral owners based on public tax roll data Note: CVX mineral ownership based on calculating the surface acreage of CVX minerals ownership in Culberson, Loving, and Reeves counties and applying a 12.5% royalty interest. Assumes maximum royalty 21 interest of 25% on all gross acres, adjusted to 1/8th royalty equivalent basis. Includes all STR and MNRL acquisitions closed to date in 2022 as well as the announced MNRL acquisition of Avant

Sitio is able to drive down cash G&A / boe with each large acquisition Significant Cash G&A ($/boe) reduction while well count grows ~10.8x (NRAs) (Cash G&A $/boe) 300,000 $5.00 $4.45 260,255 $4.50 250,000 $4.00 $3.50 200,000 173,800 $3.00 161,500 150,000 $2.50 $2.37 $2.00 $2.13 100,000 $1.82 $1.50 49,500 $1.00 50,000 $0.50 0 - (2) (3) (1) 2020 STR 1H22 pro forma STR 2Q pro forma 3Q STR + MNRL pro forma (3) Gross Wells 2,438 13,046 14,229 26,328 Employees 24 32 34 50 (1) Does not give effect to Momentum acquisition which closed in 3Q22 22 (2) STR 2Q pro forma for FLMN, Foundation, and Momentum acquisitions (3) Production, NRAs, and well counts include all acquisitions and divestitures in 2022 and MNRL’s announced Avant acquisition. G&A uses midpoint of guidance and current employee count as of 2/6/23
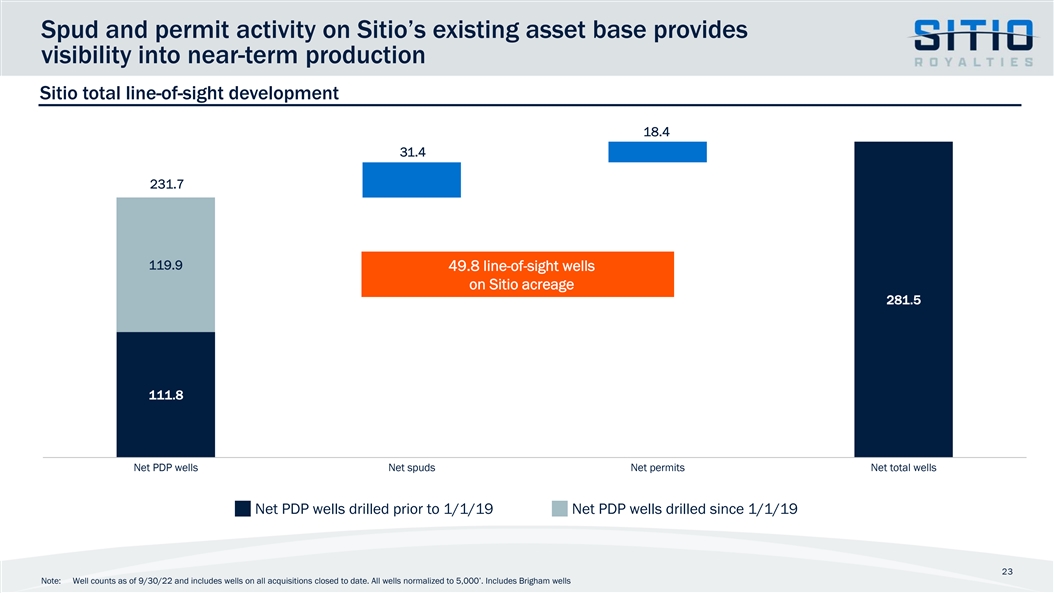
Spud and permit activity on Sitio’s existing asset base provides visibility into near-term production Sitio total line-of-sight development 18.4 31.4 231.7 119.9 49.8 line 49.8 line- -o of- f-s siight we ght well lls s on Sitio on Sitio acre acrea ag ge e 281.5 111.8 Net PDP wells Net spuds Net permits Net total wells Net PDP wells drilled prior to 1/1/19 Net PDP wells drilled since 1/1/19 23 Note: Well counts as of 9/30/22 and includes wells on all acquisitions closed to date. All wells normalized to 5,000’. Includes Brigham wells

Sitio has exposure to a broad and diverse group of active, high-quality public and private E&P companies Other Other 31.4 18.4 Net Spuds Net Permits 24 Note: Well counts as of 9/30/22 and includes wells on all acquisitions closed to date. All wells normalized to 5,000’. Includes Brigham wells

E&P companies have significant remaining drilling inventory on Sitio’s acreage Gross 5k’ normalized remaining inventory – 46,931 total Net 5k’ normalized remaining inventory – 387.9 total Avalon / Fi Fir rst Bo st Bone ne Sp Spri ring ng Avalon / Fi Fir rst Bo st Bone ne Sp Spri ring ng Second Bone Spring Second Bone Spring Third Bone Spring Third Bone Spring Wolfcamp XY Wolfcamp XY Wolfcamp A Wolfcamp A Wolfcamp B Wolfcamp B Wolfcamp C Wolfcamp C Wolfcamp D Wolfcamp D Middle Spraberry Middle Spraberry Lower Spraberry Lower Spraberry Wolfcamp A Wolfcamp A Wolfcamp B Wolfcamp B DJ DJ Eagle Ford Eagle Ford Williston Williston Delaware Basin Delaware Basin Appalachia Appalachia Midland Basin Midland Basin Anadarko Anadarko Non-Permian Non-Permian - 1,000 2,000 3,000 4,000 5,000 6,000 - 10 20 30 40 50 60 25 Note: Remaining inventory as of 10/21/22, including Brigham assets

Sitio has exposure to approximately 33% of the acreage in the Midland and Delaware Basins Sitio’s remaining Permian Basin inventory by drilling spacing unit (DSU) Estimated remaining future wells per DSU <=5 5-10 10-15 15-20 20+ 26 Note: The map is normalized remaining locations on a 1-mile wide DSU basis as of 10/21/22. Includes Brigham assets
Sitio’s financial philosophy Focused on maximizing value and maintaining balance sheet strength Financial philosophy • Generate robust free cash flow ü (1) ü• Retain up to 35% of Discretionary Cash Flow to protect balance sheet and maintain liquidity • Target leverage <1x; expect to hedge cash acquisitions made in a commodity price environment above mid-cycle pricing ü ü• Maintain underwriting discipline for accretive acquisitions funded with a prudent mix of equity, retained cash flow, and debt ü• Maintain conservative and financially flexible capital structure 27 (1) Discretionary Cash Flow defined as Adjusted EBITDA less cash interest and cash taxes

Sitio’s risk management strategy is designed to protect returns on cash acquisitions made in commodity price environments above mid-cycle pricing Hedging methodology Hedging summary as of 9/30/22 Oil (NYMEX WTI) • Utilization of hedging as a risk management 4Q22 2023 2024 1H25 strategy to support returns on cash acquisitions Swaps that have been underwritten when pricing Bbl per day 2,200 3,050 3,300 1,100 exceeds mid-cycle pricing Average Price ($/Bbl) $106.31 $93.71 $82.66 $74.65 Collars • Another element of our capital allocation Bbl per day - - - 2,000 Average Call ($/bbl) - - - $93.20 framework designed to balance the return of Average Put ($/bbl) - - - $60.00 capital to shareholders while preserving the Gas (NYMEX Henry Hub) ability to drive down leverage over time 4Q22 2023 2024 1H25 Swaps • Entered into oil and gas hedging contracts for MMBtu per day 500 500 500 - four recent cash acquisitions, including the Average price ($/MMBtu) $4.63 $3.83 $3.41 - Foundation Acquisition and Momentum Collars MMBtu per day 6,000 8,500 11,400 11,600 Acquisition Average Call ($/MMBtu) $9.69 $7.93 $7.24 $10.34 Average Put ($/MMBtu) $6.00 $4.82 $4.00 $3.31 • No hedges added for all-stock Brigham Merger • In November 2022, entered into $225mm 3m Term SOFR swap at 4.652% which is effective from 11/15/22 to 12/29/23 28
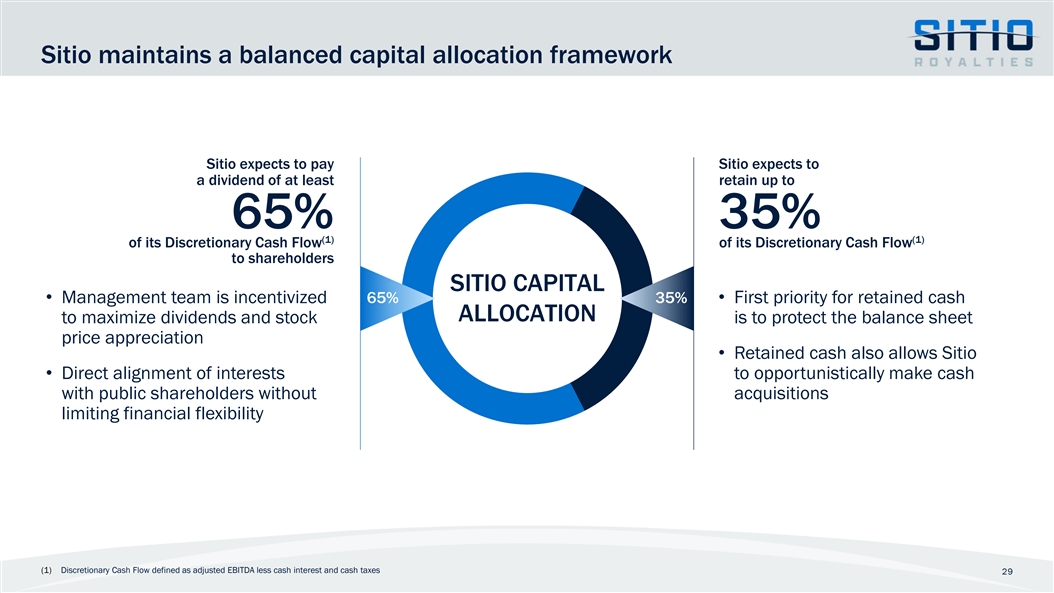
Sitio maintains a balanced capital allocation framework Sitio expects to pay Sitio expects to a dividend of at least retain up to 65% 35% (1) (1) of its Discretionary Cash Flow of its Discretionary Cash Flow to shareholders SITIO CAPITAL • Management team is incentivized 65% 35%• First priority for retained cash ALLOCATION to maximize dividends and stock is to protect the balance sheet price appreciation • Retained cash also allows Sitio • Direct alignment of interests to opportunistically make cash with public shareholders without acquisitions limiting financial flexibility (1) Discretionary Cash Flow defined as adjusted EBITDA less cash interest and cash taxes 29
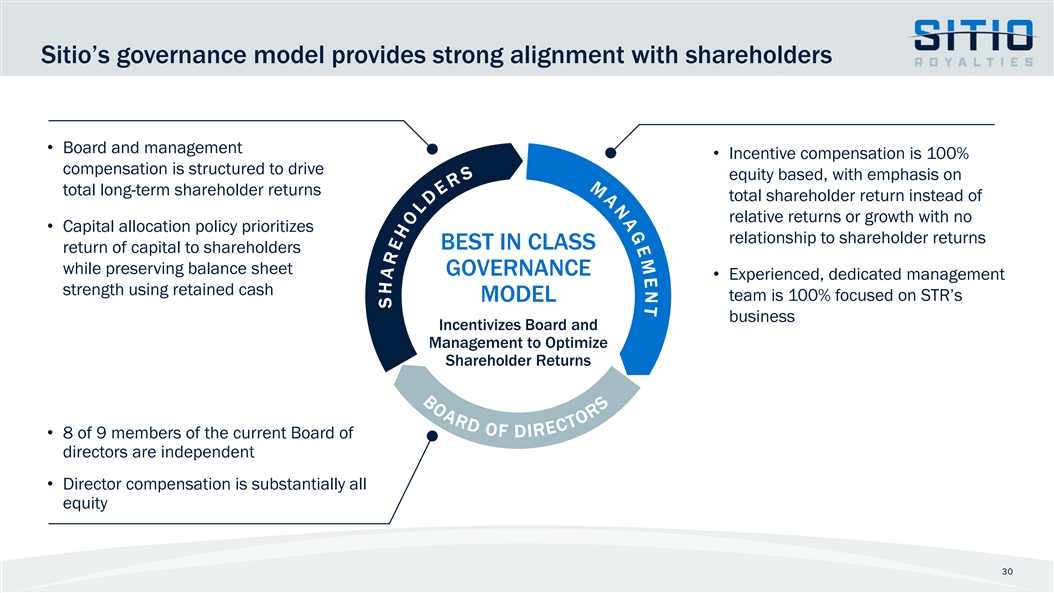
Sitio’s governance model provides strong alignment with shareholders • Board and management • Incentive compensation is 100% compensation is structured to drive equity based, with emphasis on total long-term shareholder returns total shareholder return instead of relative returns or growth with no • Capital allocation policy prioritizes relationship to shareholder returns BEST IN CLASS return of capital to shareholders while preserving balance sheet GOVERNANCE • Experienced, dedicated management strength using retained cash MODEL team is 100% focused on STR’s business Incentivizes Board and Management to Optimize Shareholder Returns • 8 of 9 members of the current Board of directors are independent • Director compensation is substantially all equity 30

Leading example of environmental and social responsibility ENVIRONMENTAL SOCIAL • Zero environmental liabilities• Employee base and Board reflective of a culture that values diversity • No scope 1 emissions; scope 2 emissions are only from power consumption at Sitio office locations• ~50% of Sitio’s current employees are women • Sitio’s lease form provides an economic disincentive • 5 out of 9 current board members are diverse for flaring gas • Management team and employees have experience • Target leasing minerals to operators with strong across the oil and gas value chain to provide unique environmental track records perspectives on minerals 31

Sitio has no scope 1 and minimal scope 2 emissions (1) • Sitio’s differentiated nature of operations results in lower scope 1 and scope 2 emissions than E&P operators • E&P operators bear 100% of the environmental liabilities of operations Sitio’s 2021 GHG emissions (2) (2) 2021 emissions intensity (MT CO e / Mboe) intensity equivalencies 2 Sitio’s 2021 scope 1 and scope 2 (3) emissions of 82 MT CO2e is equal to… 33.1 33.0 Sitio’s 2021 GHG emissions intensity of 0.0197 MT CO e/ MBOE 2 23.1 22.4 20.9 10.3 homes’ energy use for one year 19.2 18.9 18.6 16.8 16.2 E&P Average: 15.2 15.5 15.1 OR 13.0 12.3 11.4 9.9 5.8 4.7 4.6 4.0 1.4 0.0 0.453 railcars’ worth of coal burned E&P Operator Sitio Note: Sitio is making no representation to relative emissions intensity per barrel of oil equivalent associated with its interests compared to E&P operators. Sitio’s Scope 1 and Scope 2 measured emissions do not give effect to emissions associated with its net production. (1) Emissions estimated in accordance with The Greenhouse Gas Protocol: A Corporate Accounting and Reporting Standard; Revised Edition, (March 2004) per the World Business Council for Sustainable Development and World Resources Institute. Scope 1 and Scope 2 emissions estimated include power consumption at Sitio office locations but not production in accordance with protocol. Does not give pro forma effect to emissions associated with Austin office lease assumed in December 2022 (2) Data from Greenhouse Gas Equivalencies Calculator on www.epa.gov 32 (3) Represents Scope 1 and Scope 2 emissions intensity, which is based on gross production for E&P operators. E&P operators include AR, CHK, CIVI, CPE, CPG, CRGY, CTRA, DECPF, DVN, EOG, ERF, FANG, GPOR, HES, MRO, MUR, OVV, PR, SM, SWN and VTLE. Sitio metrics represent MT CO e per net MBOE of reported net production for Desert Peak Minerals and Falcon Minerals for 2021. Sitio metrics exclude electricity usage and production from assets acquired from Brigham Minerals. 2

Sitio investment thesis Mineral and royalty interest ownership provides unique, cost advantaged oil and gas exposure and the highest free cash flow margins in the oil & gas value chain Well-positioned as a natural aggregator in a highly fragmented space, with a proven strategy for meaningful, returns-focused consolidation Premier asset base focused at the front end of operators’ cost curves, supported by a core Permian Basin footprint and exposure to major U.S. oil & gas plays Disciplined capital allocation focused on value creation and returns with target long-term leverage <1.0x and prudent hedging strategy for cash acquisitions Best-in-class governance model led by experienced Board and management 33

Appendix 34

STR Executive Management Team Jarret Marcoux Dax McDavid Brett Riesenfeld Chris Conoscenti Carrie Osicka Britton James EVP of Engineering & EVP of Corporate EVP, General Counsel CEO CFO EVP of Land Acquisitions Development & Secretary — With Sitio/predecessor — With Sitio/predecessor — With Sitio/predecessor — With Sitio/predecessor — With Brigham Minerals for — With Sitio/predecessor since 2019 since 2019 since 2018 since 2015 10 years before joining Sitio since 2019 — 18 years of investment at the close of the merger — 10 years at Resolute Energy — 15 years of industry — 2 years at Baker Hughes— 9 years of experience with banking experience, Corporation, most recently experience— 10 years of experience as a Vinson & Elkins LLP where — 8 years of engineering including Managing Director as Senior Director of Petroleum Geologist with he focused on capital — Previously with Arris experience working for IBM, of Oil & Gas at both JP Stalker Energy focused on Finance markets and M&A in the Petroleum and Whiting Samsung, and AMD Morgan and Credit Suisse onshore exploration and — B.S. in Accounting from Petroleum Corporation upstream space — Master of Engineering from where he led numerous development Metropolitan State — B.A. from University of Texas — Served as a Non- Texas A&M University in strategic advisory and University and MBA from — B.A. in Geology and M.A. in and J.D. from University of Commissioned Officer in Petroleum Engineering and financing transactions for the Kellogg School of Petroleum Geology from Texas School of Law the Colorado Army National B.S. in Chemical E&P and minerals Management at University of Texas Guard for 6 years Engineering and double companies Northwestern University — B.S. in Business from the major in Economics from — B.A. from the University of University of Montana the University of Notre Dame and JD/MBA Massachusetts Amherst 35 from Tulane University

Sitio’s Board of Directors Noam Lockshin Morris Clark Chris Conoscenti Alice Gould Claire Harvey Chairman Chair of Audit Committee Chair of Compensation Committee Director & CEO Director John R. “J.R.” Sult Gayle Burleson Richard K. Stoneburner Jon-Al Duplantier Director Chair of Nom/Gov Committee Director Director 36
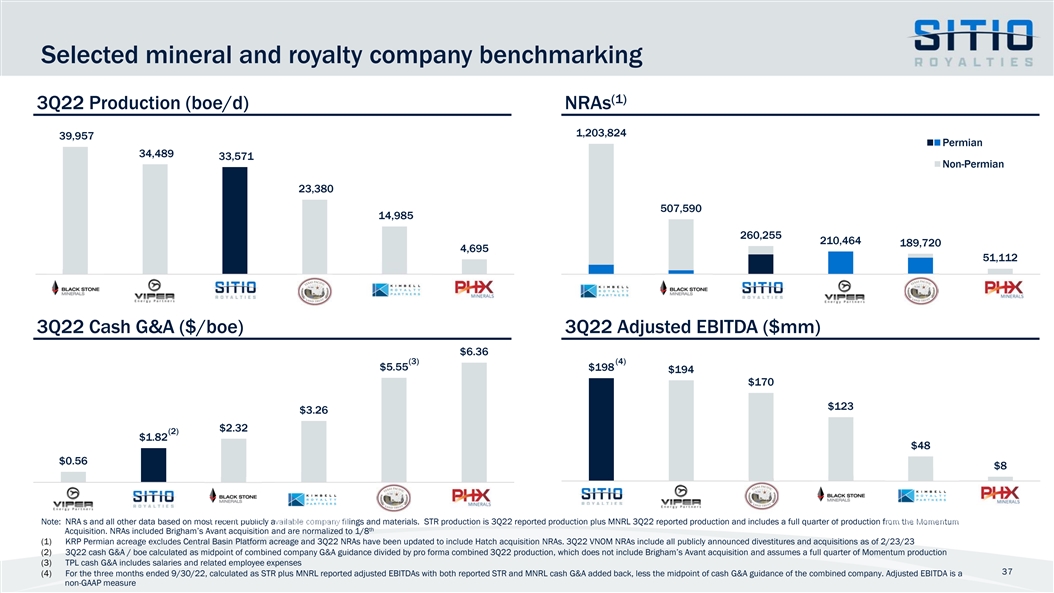
Selected mineral and royalty company benchmarking (1) 3Q22 Production (boe/d) NRAs 1,203,824 39,957 Permian 34,489 33,571 Non-Permian 23,380 507,590 14,985 260,255 210,464 189,720 4,695 51,112 BSM VNOM STR TPL KRP PHX KRP BSM STR VNOM TPL PHX 3Q22 Cash G&A ($/boe) 3Q22 Adjusted EBITDA ($mm) $6.36 (3) (4) $5.55 $198 $194 $170 $123 $3.26 $2.32 (2) $1.82 $48 $0.56 $8 STR VNOM TPL BSM KRP PHX VNOM STR BSM KRP TPL PHX Note: NRA s and all other data based on most recent publicly available company filings and materials. STR production is 3Q22 reported production plus MNRL 3Q22 reported production and includes a full quarter of production from the Momentum th Acquisition. NRAs included Brigham’s Avant acquisition and are normalized to 1/8 (1) KRP Permian acreage excludes Central Basin Platform acreage and 3Q22 NRAs have been updated to include Hatch acquisition NRAs. 3Q22 VNOM NRAs include all publicly announced divestitures and acquisitions as of 2/23/23 (2) 3Q22 cash G&A / boe calculated as midpoint of combined company G&A guidance divided by pro forma combined 3Q22 production, which does not include Brigham’s Avant acquisition and assumes a full quarter of Momentum production (3) TPL cash G&A includes salaries and related employee expenses 37 (4) For the three months ended 9/30/22, calculated as STR plus MNRL reported adjusted EBITDAs with both reported STR and MNRL cash G&A added back, less the midpoint of cash G&A guidance of the combined company. Adjusted EBITDA is a non-GAAP measure

Delaware Basin overview (1) Acreage footprint by drilling spacing unit Asset summary Delaware NRAs 140,560 Average Horizontal NRI 1.1% Normalized net wells spud since 1/1/19 54.8 Normalized net spuds and permits 22.6 (2) Top operators (1) Metrics pro forma for all acquisitions announced to date. Normalized net spuds and permits as of 9/30/22 38 (2) Top operators based on publicly reported production data for the quarter ending 9/30/22

Midland Basin overview (1) Acreage footprint by drilling spacing unit Asset summary Midland NRAs 42,800 Average Horizontal NRI 0.4% Normalized net wells spud since 1/1/19 32.8 Normalized net spuds and permits 18.1 (2) Top operators (1) Metrics pro forma for all acquisitions announced to date. Normalized net spuds and permits as of 9/30/22 39 (2) Top operators based on publicly reported production data for the quarter ending 9/30/22

DJ Basin overview (1) Acreage footprint by drilling spacing unit Asset summary DJ NRAs 24,755 Average Horizontal NRI 0.7% Normalized net wells spud since 1/1/19 15.3 Normalized net spuds and permits 5.0 (2) Top operators (1) Metrics pro forma for all acquisitions announced to date. Normalized net spuds and permits as of 9/30/22 40 (2) Top operators based on publicly reported production data for the quarter ending 9/30/22

Eagle Ford Shale overview (1) Acreage footprint by drilling spacing unit Asset summary Eagle Ford NRAs 21,585 Average Horizontal NRI 1.2% Normalized net wells spud since 1/1/19 7.6 Normalized net spuds and permits 2.4 (2) Top operators (1) Metrics pro forma for all acquisitions announced to date. Normalized net spuds and permits as of 9/30/22 41 (2) Top operators based on publicly reported production data for the quarter ending 9/30/22
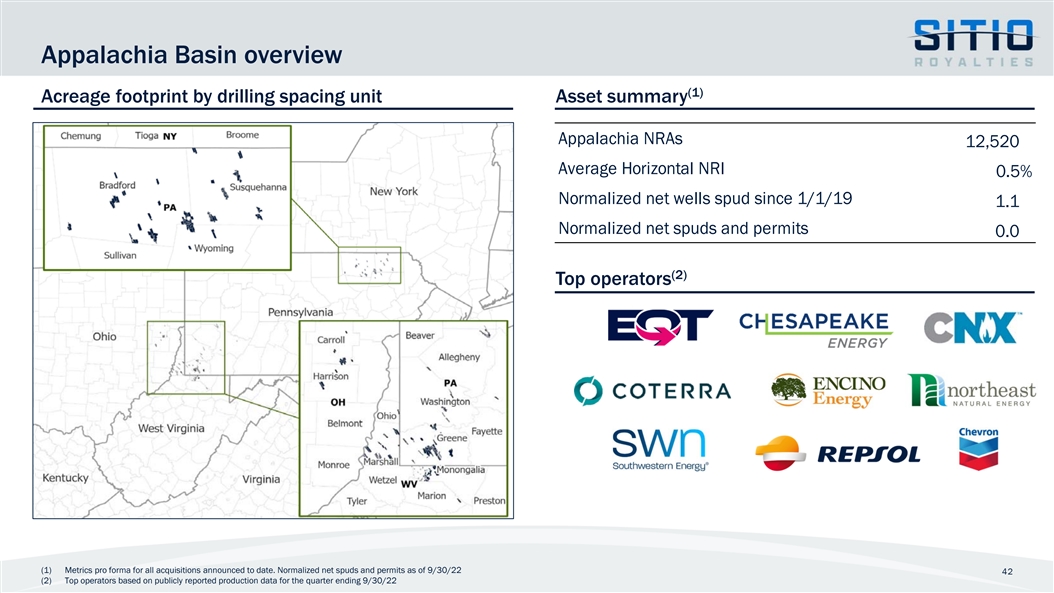
Appalachia Basin overview (1) Acreage footprint by drilling spacing unit Asset summary Appalachia NRAs 12,520 Average Horizontal NRI 0.5% Normalized net wells spud since 1/1/19 1.1 Normalized net spuds and permits 0.0 (2) Top operators (1) Metrics pro forma for all acquisitions announced to date. Normalized net spuds and permits as of 9/30/22 42 (2) Top operators based on publicly reported production data for the quarter ending 9/30/22
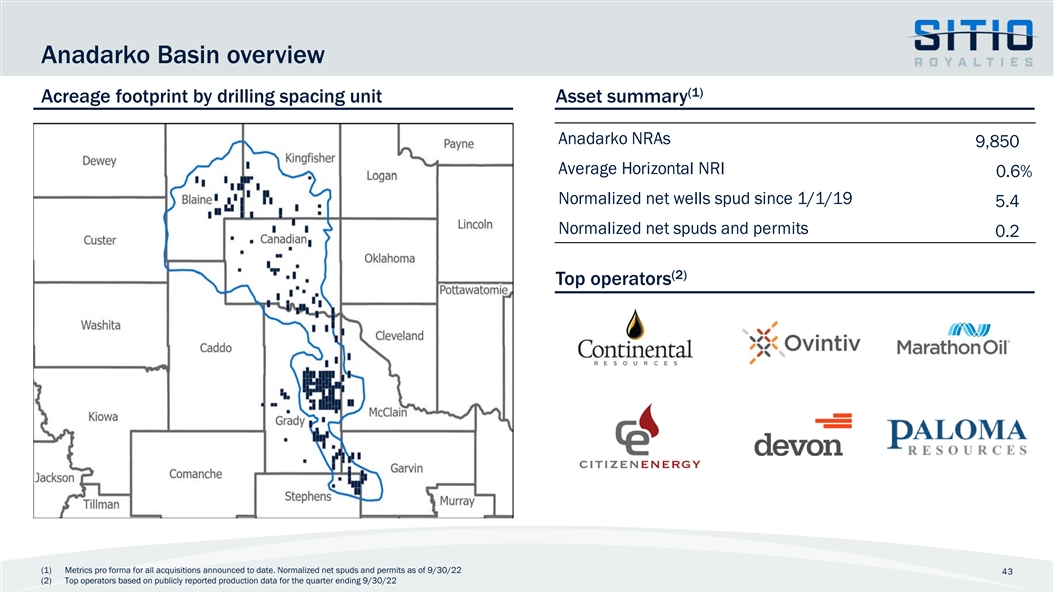
Anadarko Basin overview (1) Acreage footprint by drilling spacing unit Asset summary Anadarko NRAs 9,850 Average Horizontal NRI 0.6% Normalized net wells spud since 1/1/19 5.4 Normalized net spuds and permits 0.2 (2) Top operators (1) Metrics pro forma for all acquisitions announced to date. Normalized net spuds and permits as of 9/30/22 43 (2) Top operators based on publicly reported production data for the quarter ending 9/30/22

Williston Basin overview (1) Acreage footprint by drilling spacing unit Asset summary Williston NRAs 8,185 Average Horizontal NRI 0.2% Normalized net wells spud since 1/1/19 2.9 Normalized net spuds and permits 1.5 (2) Top operators (1) Metrics pro forma for all acquisitions announced to date. Normalized net spuds and permits as of 9/30/22 44 (2) Top operators based on publicly reported production data for the quarter ending 9/30/22

Non-GAAP definitions and reconciliations Adjusted EBITDA and Pro forma Adjusted EBITDA ($ 000) Discretionary Cash Flow ($ 000) Three Months Ended Three Months Ended September 30, September 30, 2022 2022 Net income $ 69,011 Cash flow from operations $ 82, 644 Interest expense, net 14,986 Interest expense, net 14, 986 Income tax expense 2,561 Income tax expense 2,561 Depreciation, depletion and amortization 32,005 Deferred tax expense (2,512) EBITDA $ 118,563 Changes in operating assets and liabilities 8,692 Non-cash share -based compensation expense 3,969 Amortization of deferred financing costs and long-term debt discount Gains on unsettled derivative instruments (31,954) (3,662) Change in fair value of warrant liability (536) One-time transaction costs 3,599 Loss on debt extinguishment 11,487 Adjusted EBITDA $ 106,308 One-time transaction costs 3,599 Less: Write off of financing costs 1,180 Cash interest expense 11, 516 Adjusted EBITDA $ 106,308 Cash taxes (1) 1,389 Brigham Minerals Adjusted EBITDA for Three Months Ended September 30, 2022 92,049 Discretionary Cash Flow $ 93, 403 Pro forma Adjusted EBITDA $ 198,357 • Sitio defines Adjusted EBITDA as net income (loss) plus (a) interest expense, (b) provisions for • Sitio defines Discretionary Cash Flow as Adjusted EBITDA less cash interest expense and cash taxes, (c) depreciation, depletion and amortization, (d) non-cash share-based compensation taxes expense, (e) impairment of oil and natural gas properties, (f) gains or losses on unsettled derivative instruments, (g) change in fair value of the warrant liability, (h) write off of deferred offering costs, (i) management fee to affiliates, (j) loss on debt extinguishment (k) one-time transaction costs and (l) write off of financing costs • Brigham Minerals defines as Adjusted Net Income before depreciation, depletion and amortization, share-based compensation expense, interest expense, and income tax expense, less other income (1) Brigham Minerals Adjusted EBITDA represents reported 3Q 2022 Adjusted EBITDA of $82.127 million plus 3Q 2022 Sitio Cash G&A of $4.633 million plus 3Q 2022 Brigham Minerals cash general and administrative expenses (before share-based compensation) of $10.914 million less $5.625 million, the midpoint of Sitio’s cash G&A guidance issued on November 8, 2022 for the combined Sitio and Brigham entity for the twelve months ending June 30, 2023 45

Non-GAAP definitions and reconciliations (cont’d) Cash G&A ($ 000) Three Months Ended September 30, 2022 General and administrative expense $ 13,381 Less: Non-cash share-based compensation expense 3,969 One-time transaction costs 3,599 Write off of financing costs 1,180 Cash G&A $ 4,633 • Sitio defines Cash G&A as general and administrative expense less (a) non-cash share-based compensation expense (b) one-time transaction costs and (c) write off of financing costs 46

Contact Information Corporate Headquarters: Ross Wong 1401 Lawrence Street, Suite 1750 VP of Finance and Investor Relations Denver, CO 80202 Phone: Houston Office: (720) 640-7647 609 Main Street, Suite 3950 Houston, TX 77002 Email: IR@sitio.com Austin Office: 5914 W. Courtyard Drive, Suite 150 Austin, TX 78730 47
