Exhibit 99.1 September 2024 Investor Presentation

Disclaimer FORWARD-LOOKING STATEMENTS This presentation relates to Sitio Royalties Corp. (the “Company”, “Sitio” or “STR”) and contains statements that may constitute “forward-looking statements” for purposes of federal securities laws. Forward-looking statements include, but are not limited to, statements that refer to projections, forecasts, or other characterizations of future events or circumstances, including any underlying assumptions. The words “anticipate,” “believe,” “continue,” “could,” “estimate,” “expect,” “intends,” “may,” “might,” “plan,” “seeks,” “possible,” “potential,” “predict,” “project,” “prospects,” “guidance,” “outlook,” “should,” “would,” “will,” and similar expressions may identify forward-looking statements, but the absence of these words does not mean that a statement is not forward-looking. These statements include, but are not limited to, statements about the Company’s expected results of operations, cash flows, financial position and future dividends; as well as certain future plans, expectations and objectives for the Company’s operations, including statements about our return of capital framework, our share repurchase program, the implementation thereof and the intended benefits, financial and operational guidance, strategy, synergies, certain levels of production, future operations, financial position, prospects, and plans. While forward-looking statements are based on assumptions and analyses made by us that we believe to be reasonable under the circumstances, whether actual results and developments will meet our expectations and predictions depend on a number of risks and uncertainties that could cause our actual results, performance, and financial condition to differ materially from our expectations and predictions. Factors that could materially impact such forward-looking statements include, but are not limited to: commodity price volatility, the global economic uncertainty and market volatility related to slowing growth, the large-scale invasion of Ukraine by Russia, the conflict in the Israel-Gaza region and continued hostilities in the Middle East including tensions with Iran, announcements of voluntary production cuts by OPEC+ and others, including OPEC’s recent extensions of its voluntary production cuts, and those other factors discussed or referenced in the “Risk Factors” section of the Annual Report on Form 10-K for the year ended December 31, 2023 and other publicly filed documents with the U.S. Securities and Exchange Commission. Any forward-looking statement made in this presentation speaks only as of the date on which it is made. Factors or events that could cause actual results to differ may emerge from time to time, and it is not possible to predict all of them. Sitio undertakes no obligation to publicly update any forward-looking statement, whether as a result of new information, future development, or otherwise, except as may be required by law. INDUSTRY AND MARKET DATA The information, data and statistics contained herein are derived from various internal (including data that Sitio has internally collected) and external third-party sources. While Sitio believes such third-party information is reliable, there can be no assurance as to the accuracy or completeness of the indicated information. Sitio has not independently verified the accuracy or completeness of the information provided by third party sources. No representation is made by Sitio’s management as to the reasonableness of the assumptions made within or the accuracy or completeness of any projections or modeling or any other information contained herein. Any information, data or statistics on past performance or modeling contained herein are not an indication as to the future performance. Sitio assumes no obligation to update the information in this presentation. BASIS OF PRESENTATION Unless otherwise noted, all net royalty acre (“NRA”), gross and net well counts are as of 6/30/2024. All NRA metrics are shown on a 1/8ths royalty equivalent basis. Gross and net wells are presented on a 5,000’ basis unless noted otherwise. NON-GAAP MEASURES This presentation includes financial measures that are not presented in accordance with U.S. generally accepted accounting principles (“GAAP”). While Sitio believes such non-GAAP measures are useful for investors, they are not measures of financial performance under GAAP and should not be considered in isolation or as an alternative to any measure of such performance derived in accordance with GAAP. These non-GAAP measures have limitations as analytical tools and you should not consider them in isolation or as substitutes for analysis of results as reported under GAAP. These non-GAAP measures may not be comparable to similarly titled measures used by other companies in our industry or across different industries. See Appendix for definitions of the non-GAAP measures used in this presentation and reconciliations to the most comparable GAAP measures.

Introduction to Sitio 3

The premier royalties enterprise Williston ~$4.4bn ~$3.4bn ~90% (1) Enterprise Value Equity Value Adjusted EBITDA Margin Midland Basin DJ 39.2 Mboe/d 267,351 $13.26/boe Permian (2) 2Q24 production Total NRAs Total cash costs Delaware Basin Eagle Ford • Exposure to approximately 36% of the Permian 4,883 / 25.0 3,671 / 19.1 45,898 / 409.5 Basin Gross / net Gross / net Gross / net remaining • Diversified across more than 140 operators and spuds permits inventory 4 of the highest margin onshore basins • ~68% of all US Onshore rigs in these 4 basins Sitio makes accretive acquisitions of royalty-generating • ~16% of all US Onshore rigs were operating on assets and actively manages them to maximize cash STR acreage in 2Q24 collections Note: Total NRAs, net spuds, net permits, and net remaining inventory are as of 6/30/2024. Adjusted EBITDA and cash G&A are non-GAAP measures. See Appendix for definitions of non-GAAP measures used and non-GAAP 4 reconciliations. (1) Share price as of 8/27/2024 (2) 2Q24 Cash costs comprised of production taxes, G&T, cash G&A, cash interest, and cash income taxes
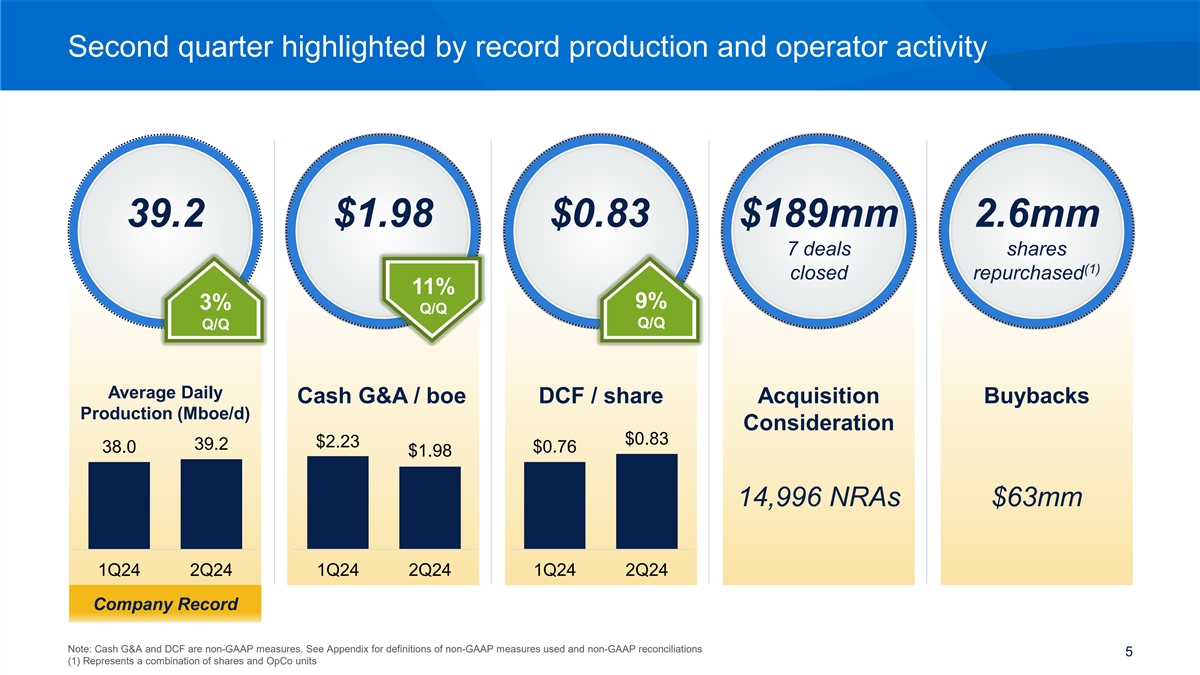
Second quarter highlighted by record production and operator activity 39.2 $1.98 $0.83 $189mm 2.6mm 7 deals shares (1) closed repurchased 11% 9% 3% Q/Q Q/Q Q/Q Average Daily Cash G&A / boe DCF / share Acquisition Buybacks Production (Mboe/d) Consideration $0.83 $2.23 39.2 38.0 $0.76 $1.98 14,996 NRAs $63mm 1Q24 2Q24 1Q24 2Q24 1Q24 2Q24 Company Record Note: Cash G&A and DCF are non-GAAP measures. See Appendix for definitions of non-GAAP measures used and non-GAAP reconciliations 5 (1) Represents a combination of shares and OpCo units

Large-scale, diverse asset base with active operator development and 10+ years of remaining inventory Gross wells TIL on STR’s current assets Net wells TIL on STR’s current assets 2,000 15 1,500 10 1,000 5 500 0 0 1Q23 2Q23 3Q23 4Q23 1Q24 2Q24 1Q23 2Q23 3Q23 4Q23 1Q24 2Q24 LOS wells as of 6/30/2024 Inventory as of 6/30/2024 Other Other 8,554 44.1 409.5 45,898 Gross LOS wells Net LOS wells Net remaining Gross remaining inventory inventory (1) Delaware Basin Midland Basin DJ Basin Other Note: Well counts normalized to 5,000’ basis, are as of 6/30/24 and represent the wells on production based on publicly reported data on all assets owned by Sitio on 6/30/24. CVX pro forma for HES, FANG pro forma for Endeavor, and 6 COP pro forma for MRO. Gross and net wells pro forma for all acquisitions as of 6/30/2024; (1) Other consists of Williston and Eagle Ford Basins
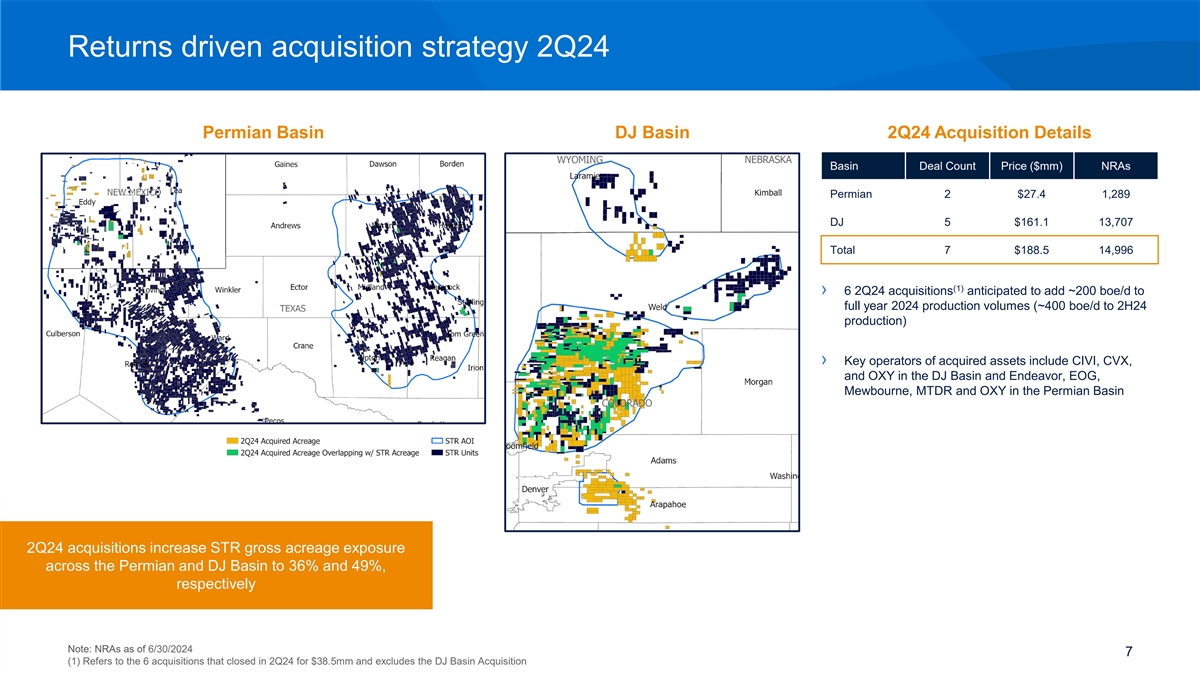
Returns driven acquisition strategy 2Q24 Permian Basin DJ Basin 2Q24 Acquisition Details Basin Deal Count Price ($mm) NRAs Permian 2 $27.4 1,289 DJ 5 $161.1 13,707 Total 7 $188.5 14,996 (1) › 6 2Q24 acquisitions anticipated to add ~200 boe/d to full year 2024 production volumes (~400 boe/d to 2H24 production) › Key operators of acquired assets include CIVI, CVX, and OXY in the DJ Basin and Endeavor, EOG, Mewbourne, MTDR and OXY in the Permian Basin 2Q24 acquisitions increase STR gross acreage exposure across the Permian and DJ Basin to 36% and 49%, respectively Note: NRAs as of 6/30/2024 7 (1) Refers to the 6 acquisitions that closed in 2Q24 for $38.5mm and excludes the DJ Basin Acquisition
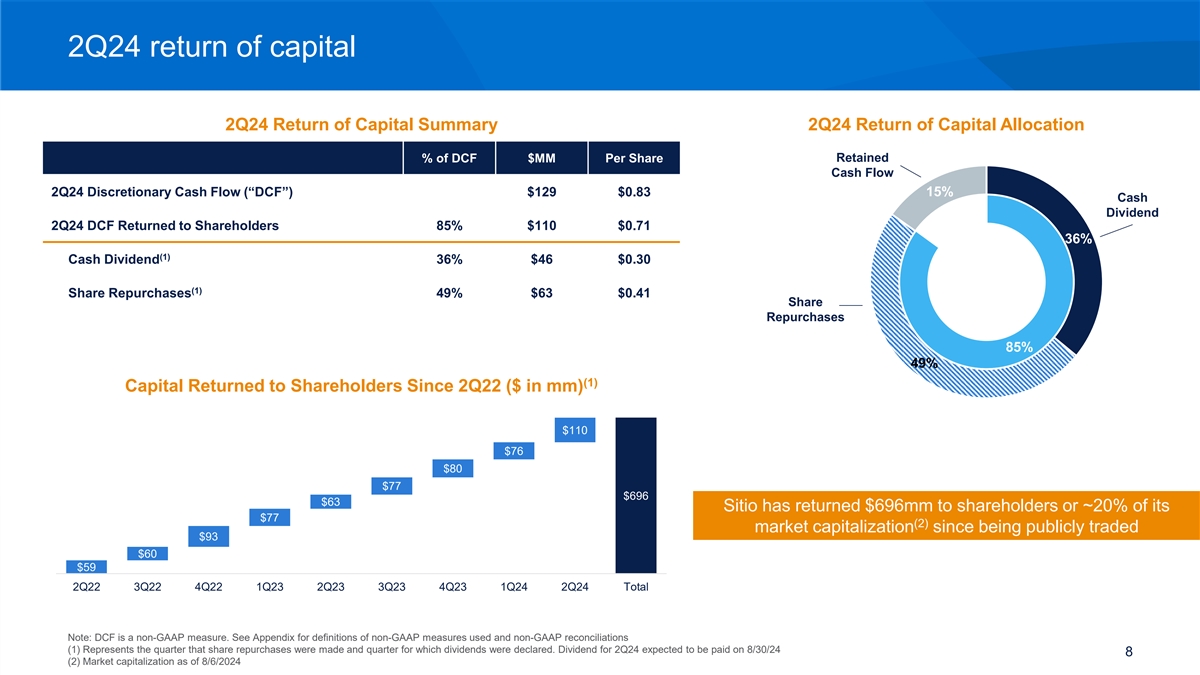
2Q24 return of capital 2Q24 Return of Capital Summary 2Q24 Return of Capital Allocation % of DCF $MM Per Share Retained Cash Flow 2Q24 Discretionary Cash Flow (“DCF”) $129 $0.83 15% Cash Dividend 2Q24 DCF Returned to Shareholders 85% $110 $0.71 36% (1) Cash Dividend 36% $46 $0.30 (1) Share Repurchases 49% $63 $0.41 Share Repurchases 85% 49% (1) Capital Returned to Shareholders Since 2Q22 ($ in mm) $110 $76 $80 $77 $696 $63 Sitio has returned $696mm to shareholders or ~20% of its $77 (2) market capitalization since being publicly traded $93 $60 $59 2Q22 3Q22 4Q22 1Q23 2Q23 3Q23 4Q23 1Q24 2Q24 Total Note: DCF is a non-GAAP measure. See Appendix for definitions of non-GAAP measures used and non-GAAP reconciliations (1) Represents the quarter that share repurchases were made and quarter for which dividends were declared. Dividend for 2Q24 expected to be paid on 8/30/24 8 (2) Market capitalization as of 8/6/2024

STR value proposition in context (1) LTM 6/30/2024 total return of capital yield 25% 20% 15% STR: 10.1% 10% S&P 500 Avg.: 3.4% 5% 0% S&P 500 Constituents + STR (2) 2Q24 EBITDA margin 100% STR: 89.9% 80% 60% S&P 500 Avg.: 30.7% 40% 20% 0% S&P 500 Constituents + STR Source: FactSet as of 8/28/24 (1) Total return of capital yield calculated as dividends paid and share repurchases executed during quarter from 9/30/23 to 6/30/24 per FactSet (2) EBITDA margin calculated as 2Q24 EBITDA divided by 2Q24 revenue per FactSet. STR EBITDA represents Adjusted EBITDA for 2Q24. Data set excludes S&P 500 constituents that do not have estimates for EBITDA or margins 9 calculated less than zero percent. Note: Adjusted EBITDA is a non-GAAP measure. See Appendix for definitions of non-GAAP measures used and non-GAAP reconciliations.
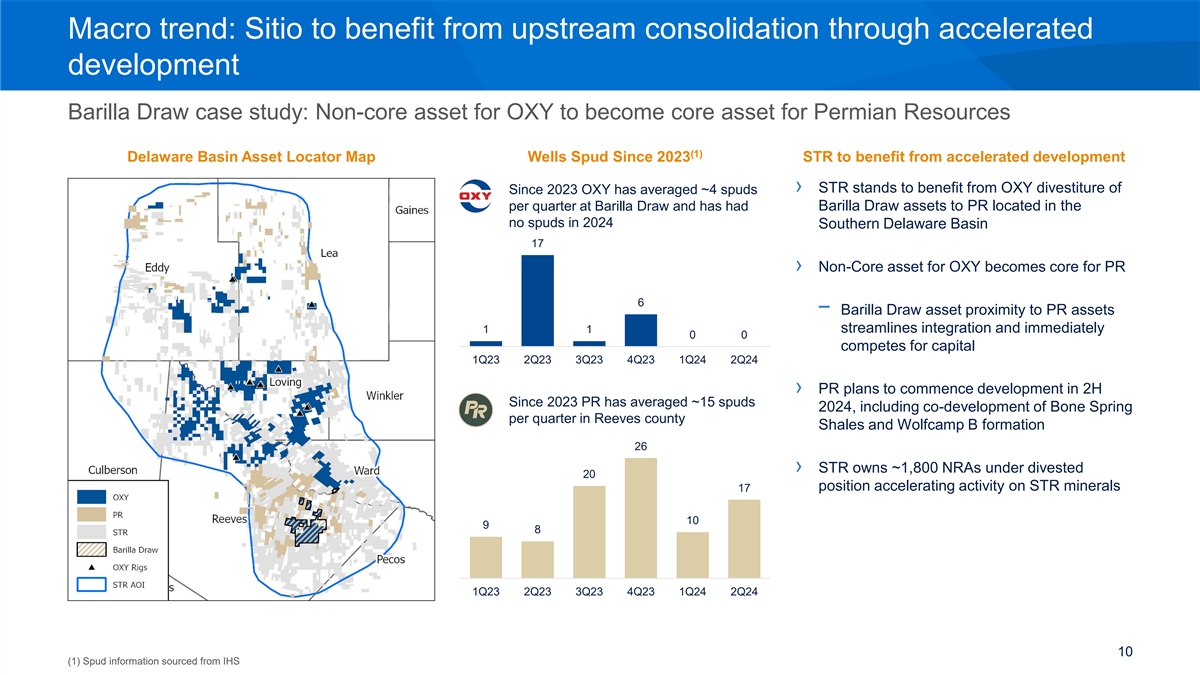
Macro trend: Sitio to benefit from upstream consolidation through accelerated development Barilla Draw case study: Non-core asset for OXY to become core asset for Permian Resources (1) Delaware Basin Asset Locator Map Wells Spud Since 2023 STR to benefit from accelerated development › STR stands to benefit from OXY divestiture of Since 2023 OXY has averaged ~4 spuds per quarter at Barilla Draw and has had Barilla Draw assets to PR located in the no spuds in 2024 Southern Delaware Basin 17 › Non-Core asset for OXY becomes core for PR 6 − Barilla Draw asset proximity to PR assets streamlines integration and immediately 1 1 0 0 competes for capital 1Q23 2Q23 3Q23 4Q23 1Q24 2Q24 › PR plans to commence development in 2H Since 2023 PR has averaged ~15 spuds 2024, including co-development of Bone Spring per quarter in Reeves county Shales and Wolfcamp B formation 26 › STR owns ~1,800 NRAs under divested 20 position accelerating activity on STR minerals 17 10 9 8 1Q23 2Q23 3Q23 4Q23 1Q24 2Q24 10 (1) Spud information sourced from IHS
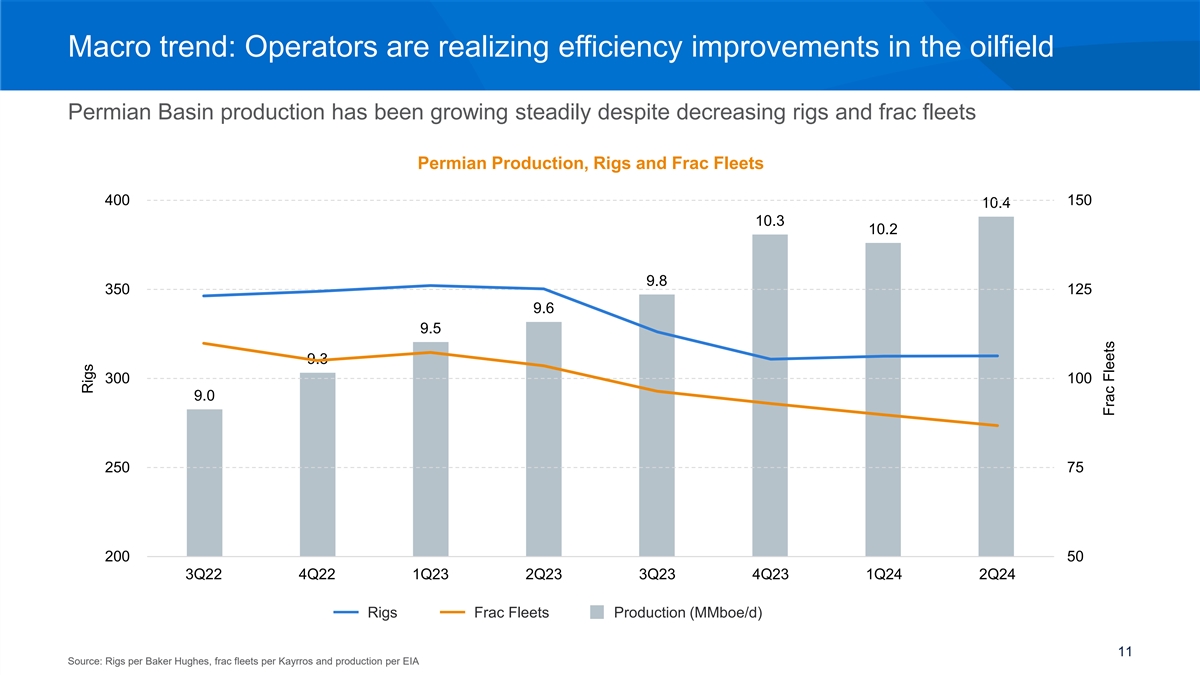
Macro trend: Operators are realizing efficiency improvements in the oilfield Permian Basin production has been growing steadily despite decreasing rigs and frac fleets Permian Production, Rigs and Frac Fleets 400 150 10.4 10.3 10.2 9.8 350 125 9.6 9.5 9.3 300 100 9.0 250 75 200 50 3Q 3Q22 22 4Q 4Q22 22 1Q 1Q23 23 2Q 2Q23 23 3Q 3Q23 23 4Q 4Q23 23 1Q 1Q24 24 2Q 2Q24 24 Rigs Frac Fleets Production (MMboe/d) 11 Source: Rigs per Baker Hughes, frac fleets per Kayrros and production per EIA Rigs Frac Fleets
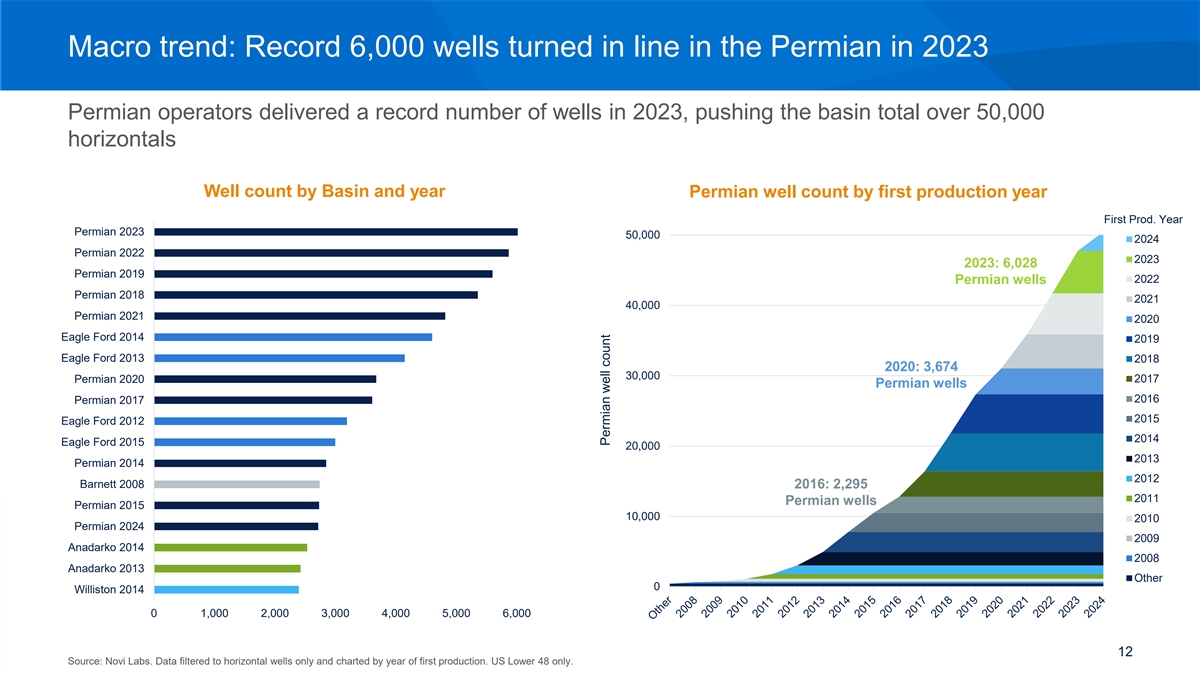
Macro trend: Record 6,000 wells turned in line in the Permian in 2023 Permian operators delivered a record number of wells in 2023, pushing the basin total over 50,000 horizontals Well count by Basin and year Permian well count by first production year First Prod. Year Permian 2023 50,000 2024 Permian 2022 2023 2023: 6,028 Permian 2019 2022 Permian wells Permian 2018 2021 40,000 Permian 2021 2020 Eagle Ford 2014 2019 Eagle Ford 2013 2018 2020: 3,674 30,000 Permian 2020 2017 Permian wells 2016 Permian 2017 2015 Eagle Ford 2012 2014 Eagle Ford 2015 20,000 2013 Permian 2014 2012 Barnett 2008 2016: 2,295 2011 Permian wells Permian 2015 10,000 2010 Permian 2024 2009 Anadarko 2014 2008 Anadarko 2013 Other 0 Williston 2014 0 1,000 2,000 3,000 4,000 5,000 6,000 12 Source: Novi Labs. Data filtered to horizontal wells only and charted by year of first production. US Lower 48 only. Permian well count

Sitio Acquisitions 13

Disciplined acquisition approach through the cycles NRAs over time Cumulative NRAs NRAs 175,000 280,000 › Proactive, relationship-driven NRAs acquired with cash consideration: 43% strategy 267,351 NRAs acquired with equity consideration: 57% 150,000 240,000 NRAs Cumulative NRAs 125,000 200,000 › IRR-driven underwriting 100,000 160,000 75,000 120,000 50,000 › Balanced acquisition funding 80,000 25,000 40,000 - › Lookbacks and new data inform future assumptions (25,000) - 2016 - 2019 2020 2021 2022 2023 2023 1H24 Acquisitions Divestitures 14
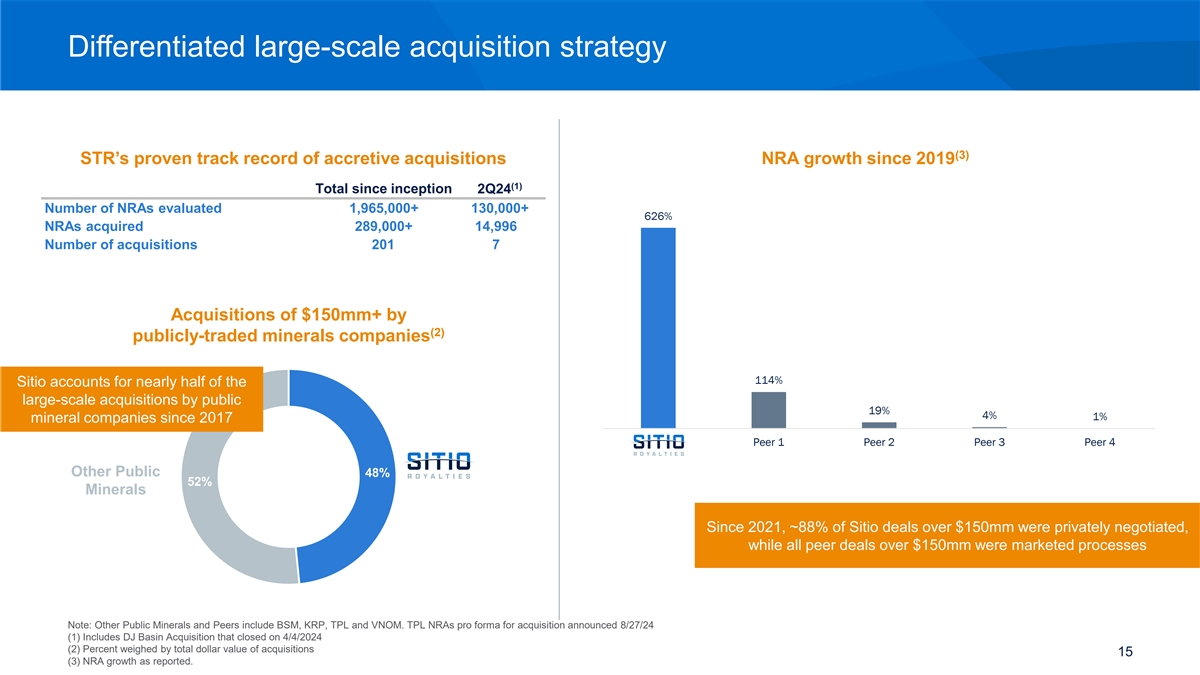
Differentiated large-scale acquisition strategy (3) STR’s proven track record of accretive acquisitions NRA growth since 2019 (1) Total since inception 2Q24 Number of NRAs evaluated 1,965,000+ 130,000+ 626% NRAs acquired 289,000+ 14,996 Number of acquisitions 201 7 Acquisitions of $150mm+ by (2) publicly-traded minerals companies 114% Sitio accounts for nearly half of the large-scale acquisitions by public 19% 4% 1% mineral companies since 2017 Sitio Peer 1 Peer 2 Peer 3 Peer 4 Other Public 48% 52% Minerals Since 2021, ~88% of Sitio deals over $150mm were privately negotiated, while all peer deals over $150mm were marketed processes Note: Other Public Minerals and Peers include BSM, KRP, TPL and VNOM. TPL NRAs pro forma for acquisition announced 8/27/24 (1) Includes DJ Basin Acquisition that closed on 4/4/2024 (2) Percent weighed by total dollar value of acquisitions 15 (3) NRA growth as reported.

Disciplined underwriting results in outperformance Cumulative production outperformance Acquisition evaluation process from acquisitions made since 2021 Cumulative volumes outperform underwriting for the first 6 Full GIS & geologic analysis of asset months of Sitio ownership by 6% location, key operators, inventory potential 6% and overall quality 0% (0%) Engineering forecast for all producing wells and all remaining inventory 6 Months 12 Months 18 Months Cumulative asset-level cash flow outperformance from cash acquisitions since 2021 11% Data driven development timing estimates 4% Cumulative asset-level cash flow outperforms underwriting for the first 6 months of Sitio ownership by 11% IRR analysis sensitizes commodity prices, 0% development timing and remaining locations 6 Months 12 Months 18 Months Note: All actuals based on publicly reported production data. Acquisitions included in each grouping differed based on original effective date. Equity deals excluded from asset-level cash flow graphs. Gains / losses from hedges 16 implemented in conjunction with acquisitions included in cumulative cash flows
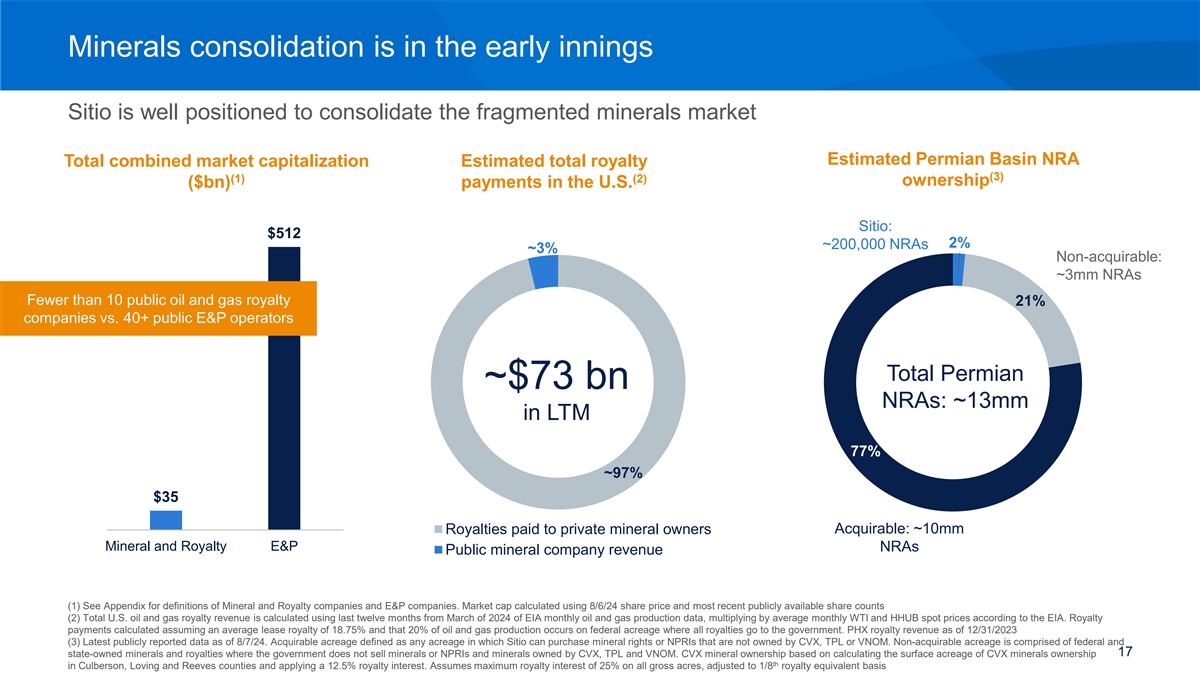
Minerals consolidation is in the early innings Sitio is well positioned to consolidate the fragmented minerals market Estimated Permian Basin NRA Total combined market capitalization Estimated total royalty (3) (1) (2) ownership ($bn) payments in the U.S. Sitio: $512 2% ~200,000 NRAs ~3% Non-acquirable: ~3mm NRAs Fewer than 10 public oil and gas royalty 21% companies vs. 40+ public E&P operators Total Permian ~$73 bn NRAs: ~13mm in LTM 77% ~97% $35 Royalties paid to private mineral owners Acquirable: ~10mm Mineral and Royalty E&P NRAs Public mineral company revenue (1) See Appendix for definitions of Mineral and Royalty companies and E&P companies. Market cap calculated using 8/6/24 share price and most recent publicly available share counts (2) Total U.S. oil and gas royalty revenue is calculated using last twelve months from March of 2024 of EIA monthly oil and gas production data, multiplying by average monthly WTI and HHUB spot prices according to the EIA. Royalty payments calculated assuming an average lease royalty of 18.75% and that 20% of oil and gas production occurs on federal acreage where all royalties go to the government. PHX royalty revenue as of 12/31/2023 (3) Latest publicly reported data as of 8/7/24. Acquirable acreage defined as any acreage in which Sitio can purchase mineral rights or NPRIs that are not owned by CVX, TPL or VNOM. Non-acquirable acreage is comprised of federal and 17 state-owned minerals and royalties where the government does not sell minerals or NPRIs and minerals owned by CVX, TPL and VNOM. CVX mineral ownership based on calculating the surface acreage of CVX minerals ownership th in Culberson, Loving and Reeves counties and applying a 12.5% royalty interest. Assumes maximum royalty interest of 25% on all gross acres, adjusted to 1/8 royalty equivalent basis

Margins increase with scale Unique cost structure enables scale without linear increase in cash expenses (2) (1) Change in Cash Costs per boe STR Costs per boe A leader in Adjusted EBITDA per employee ($mm) 2Q24 vs 2Q23 ($/boe) ($/boe) $2.5 $16.93 % Change (22%) Sitio’s efficient business model results in high $2.0 (22%) $13.26 Adjusted EBITDA per employee relative to Peer 1 1% companies across multiple industries 21% $1.5 Peer 2 2% 6% Peer 3 3% (91%) $1.0 Peer 4 10% (21%) Peer 5 12% $0.5 Peer 6 14% (7%) - (3) 2Q23 2Q24 STR Minerals XOP DJIA Since 2019, STR has decreased cash Index Cash G&A Cash Interest Cash Taxes G&A / boe by 67% while increasing its Prod. Taxes G&T acreage footprint by >450% Note: Adjusted EBITDA and Cash G&A are non-GAAP measures. See Appendix for definitions of non-GAAP measures used and non-GAAP reconciliations. FRU and PSK cash costs converted to USD. (1) Minerals peers include BSM, FRU, KRP, PSK, TPL and VNOM (2) Source: Company filings and FactSet as of 8/7/24. XOP and DJIA Index latest reported quarterly Adjusted EBITDA per employee weighted by market capitalization as of 8/6/24; STR employee headcount as of 6/30/24 18 (3) See Appendix for Minerals Index definition

Sitio Minerals Management 19
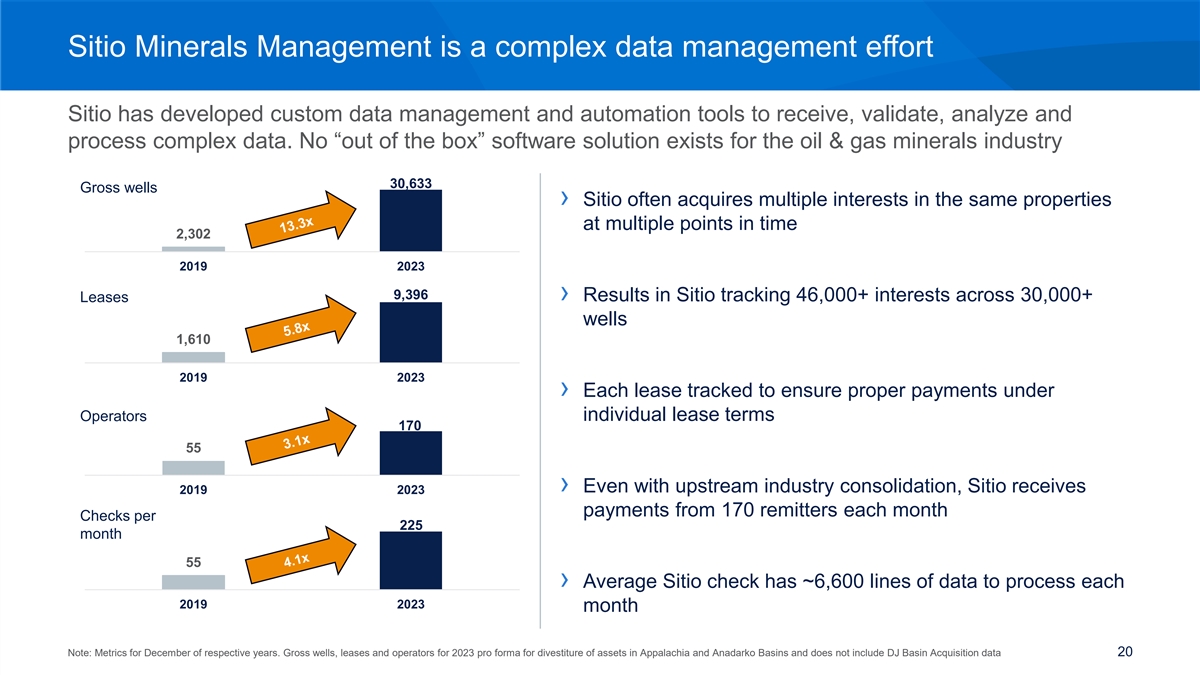
Sitio Minerals Management is a complex data management effort Sitio has developed custom data management and automation tools to receive, validate, analyze and process complex data. No “out of the box” software solution exists for the oil & gas minerals industry 30,633 Gross wells › Sitio often acquires multiple interests in the same properties at multiple points in time 2,302 2019 2023 9,396 › Results in Sitio tracking 46,000+ interests across 30,000+ Leases wells 1,610 2019 2023 › Each lease tracked to ensure proper payments under Operators individual lease terms 170 55 › Even with upstream industry consolidation, Sitio receives 2019 2023 payments from 170 remitters each month Checks per 225 month 55 › Average Sitio check has ~6,600 lines of data to process each 2019 2023 month Note: Metrics for December of respective years. Gross wells, leases and operators for 2023 pro forma for divestiture of assets in Appalachia and Anadarko Basins and does not include DJ Basin Acquisition data 20

Sitio Minerals Management creates additional value Sitio acts as the permanent owner of the minerals it acquires, leading to greater revenue realizations › Proactive, outbound leasing efforts › Data analytics and engagement with operators to ensure timely and accurate payments − Sitio does not underwrite any lease bonus revenue when acquiring minerals − Granular tracking of missing payments by operator, by well, by production month, by commodity − Accordingly, lease bonus amounts received post-acquisitions increase returns 6/30/24 LTM Cash G&A versus Lease bonus as % of Cash G&A collected missing payments ($mm) Lease Bonus Cash G&A $31.5 $28.7 Sitio collected ~1.1x of 6/30/24 LTM Cash 77% G&A in missing payments 71% 89% (1) 2022 2023 Two-Year Total 6/30/24 LTM 6/30/24 LTM Missing Cash G&A Payments Collected Note: Cash G&A is a non-GAAP measure. See Appendix for definitions of non-GAAP measures used and non-GAAP reconciliations 21 (1) July 2023 through June 2024
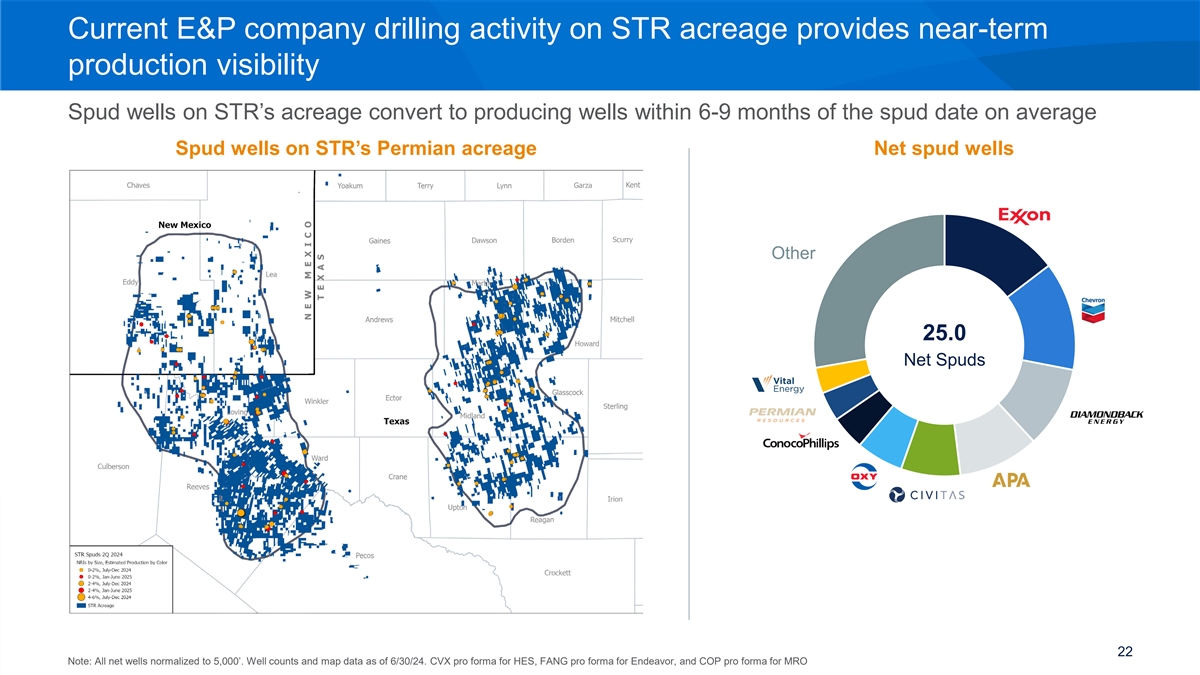
Current E&P company drilling activity on STR acreage provides near-term production visibility Spud wells on STR’s acreage convert to producing wells within 6-9 months of the spud date on average Spud wells on STR’s Permian acreage Net spud wells Other 25.0 Net Spuds 22 Note: All net wells normalized to 5,000’. Well counts and map data as of 6/30/24. CVX pro forma for HES, FANG pro forma for Endeavor, and COP pro forma for MRO
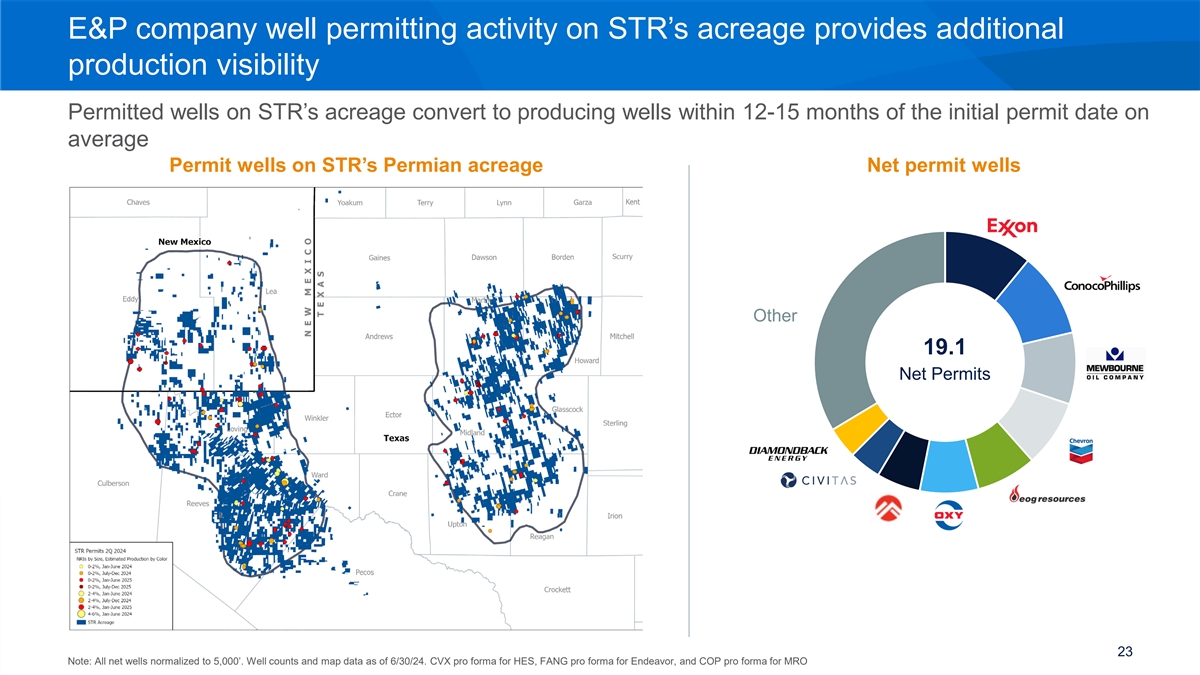
E&P company well permitting activity on STR’s acreage provides additional production visibility Permitted wells on STR’s acreage convert to producing wells within 12-15 months of the initial permit date on average Permit wells on STR’s Permian acreage Net permit wells Other 19.1 Net Permits 23 Note: All net wells normalized to 5,000’. Well counts and map data as of 6/30/24. CVX pro forma for HES, FANG pro forma for Endeavor, and COP pro forma for MRO

E&P companies have significant remaining drilling inventory on Sitio’s acreage Operators have drilled ~5,100 – 6,100 5k’ normalized wells per year on Sitio’s acreage of the past 3 years Gross normalized remaining inventory Net normalized remaining inventory 45,898 total 409.5 total - 1,000 2,000 3,000 4,000 5,000 6,000 - 10 20 30 40 50 60 70 80 Avalon / First Bone Spring Avalon / First Bone Spring Second Bone Spring Second Bone Spring Third Bone Spring Third Bone Spring Wolfcamp XY Wolfcamp XY Wolfcamp A Wolfcamp A Wolfcamp B Wolfcamp B Wolfcamp C Wolfcamp C Wolfcamp D Wolfcamp D Wolfcamp C / Wolfcamp D Wolfcamp C / Wolfcamp D Middle Spraberry Middle Spraberry Lower Spraberry Lower Spraberry Wolfcamp A Wolfcamp A Wolfcamp B Wolfcamp B Delaware Basin Delaware Basin DJ DJ Midland Basin Midland Basin Eagle Ford Eagle Ford Non-Permian Non-Permian Williston Williston Note: inventory numbers as of 6/30/24, excludes the spuds and permits on Sitio acreage 24

Sitio’s organic reserves growth has outpaced production Sitio’s organic reserves replacement ratio over the past three years has been greater than 100%, indicating base assets are still growing, even without taking into account acquisitions or incremental capex spend STR’s Organic Reserves Replacement Ratio 137% 131% 111% 2021 2022 2023 25 Note: Organic Reserves Replacement Ratio is equal to revisions and extensions divided by production for each respective year

Financial Strategy 26

Balanced capital allocation framework maximizes shareholder returns Flexible mix of dividends & Retained cash flow Framework returns at least 65% of share repurchases Discretionary Cash Flow to shareholders 30% Target minimum quarterly cash dividend as % of 35% Discretionary Cash Flow 35% Sitio capital Allocate opportunistically between share 30% allocation (1) repurchases and additional cash dividends as % of DCF Minimum Discretionary Cash Flow returned to 65% Minimum cash shareholders quarterly dividend 65% 35% Discretionary Cash Flow retained for debt 35% paydown and growth investments Note: DCF is a non-GAAP measure. See Appendix for definitions of non-GAAP measures used and non-GAAP reconciliations 27 (1) Share repurchases to be executed at the discretion of the Company and through a variety of methods. The Company is not obligated to purchase any dollar amount or number of shares under the repurchase program
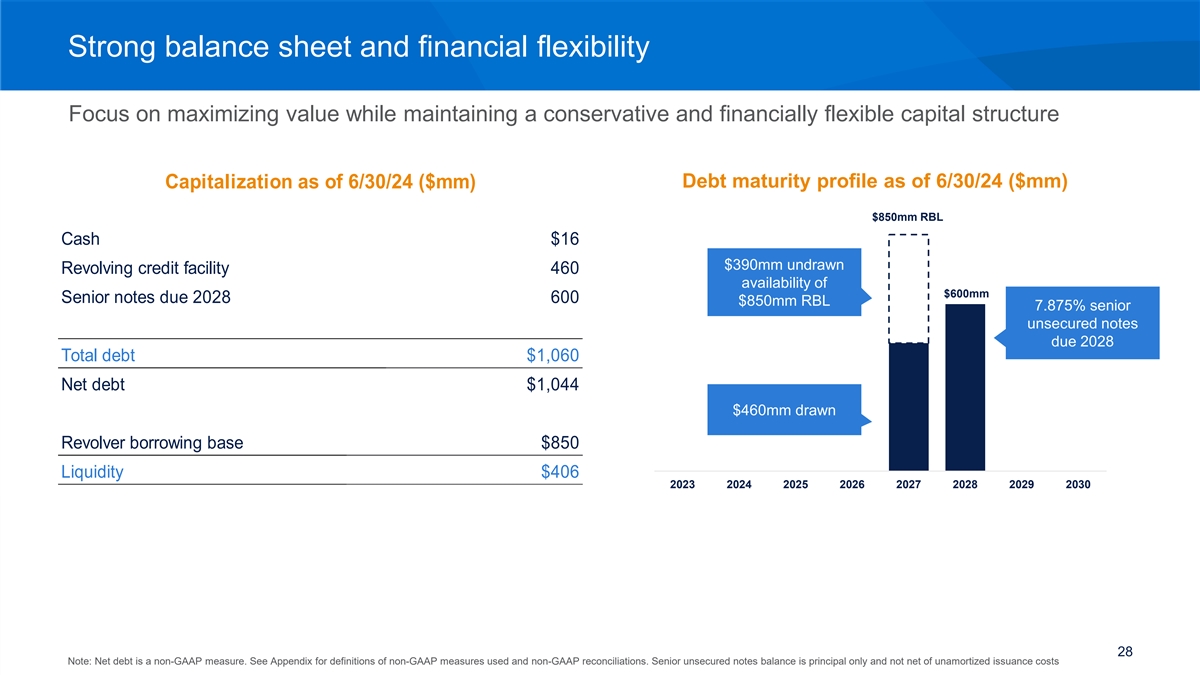
Strong balance sheet and financial flexibility Focus on maximizing value while maintaining a conservative and financially flexible capital structure Debt maturity profile as of 6/30/24 ($mm) Capitalization as of 6/30/24 ($mm) $850mm RBL 900 Cash $16 800 $390mm undrawn Revolving credit facility 460 700 availability of $600mm Senior notes due 2028 600 $850mm RBL 600 7.875% senior unsecured notes 500 due 2028 Total debt $1,060 400 Net debt $1,044 300 $460mm drawn 200 100 Revolver borrowing base $850 0 Liquidity $406 2023 2024 2025 2026 2027 2028 2029 2030 28 Note: Net debt is a non-GAAP measure. See Appendix for definitions of non-GAAP measures used and non-GAAP reconciliations. Senior unsecured notes balance is principal only and not net of unamortized issuance costs
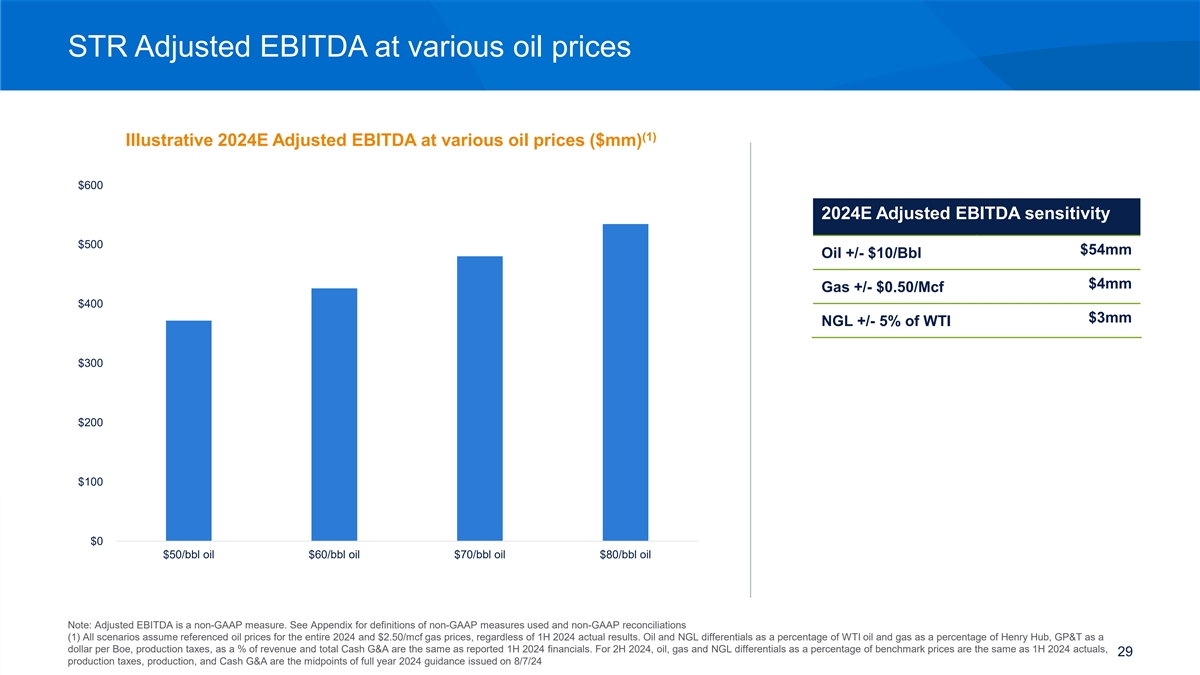
STR Adjusted EBITDA at various oil prices (1) Illustrative 2024E Adjusted EBITDA at various oil prices ($mm) $600 2024E Adjusted EBITDA sensitivity $500 $54mm Oil +/- $10/Bbl $4mm Gas +/- $0.50/Mcf $400 $3mm NGL +/- 5% of WTI $300 $200 $100 $0 $50/bbl oil $60/bbl oil $70/bbl oil $80/bbl oil Note: Adjusted EBITDA is a non-GAAP measure. See Appendix for definitions of non-GAAP measures used and non-GAAP reconciliations (1) All scenarios assume referenced oil prices for the entire 2024 and $2.50/mcf gas prices, regardless of 1H 2024 actual results. Oil and NGL differentials as a percentage of WTI oil and gas as a percentage of Henry Hub, GP&T as a dollar per Boe, production taxes, as a % of revenue and total Cash G&A are the same as reported 1H 2024 financials. For 2H 2024, oil, gas and NGL differentials as a percentage of benchmark prices are the same as 1H 2024 actuals, 29 production taxes, production, and Cash G&A are the midpoints of full year 2024 guidance issued on 8/7/24

Appendix 30
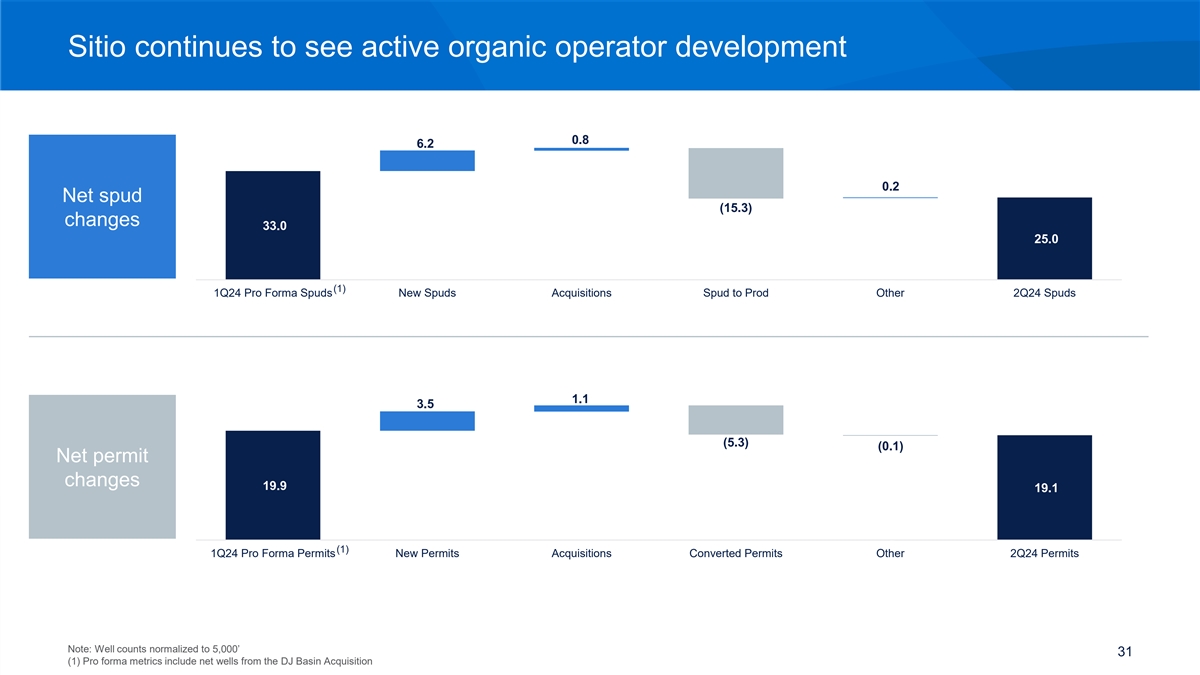
Sitio continues to see active organic operator development 0.8 6.2 0.2 Net spud (15.3) changes 33.0 25.0 - (1) 1Q24 Pro Forma Spuds New Spuds Acquisitions Spud to Prod Other 2Q24 Spuds 1.1 3.5 (5.3) (0.1) Net permit changes 19.9 19.1 - (1) 1Q24 Pro Forma Permits New Permits Acquisitions Converted Permits Other 2Q24 Permits Note: Well counts normalized to 5,000’ 31 (1) Pro forma metrics include net wells from the DJ Basin Acquisition

Production forecasting considerations Well metrics and remaining inventory Diverse operator mix and blue-chip top operators › Monitor and analyze development trends of top operators (1) LOS Wells Remaining Inventory › Diverse operator mix helps smooth idiosyncratic events over longer time periods 6/30/24 (3) Pro forma gross horizontal wells by operator Operator type 25.0 19.1 45,898 409.5 Metrics CVX 13% XOM Net Permits Gross Locations Net Locations Large-cap 13% Net Spuds OXY 11% Pro forma Mid-cap COP 8% production from Typical 12 – 18 month timeframe > Operators have drilled ~5,100 – Small private FANG 7% 140+ operators from permit to TIL for a well 6,100 5k’ normalized gross (2) CIVI 6% in 2Q24 Major wells per year on Sitio’s DVN > 6-9 mos. permit to spud 6% acreage over the past 3 years Small-cap EOG 3% > 6-9 mos. spud to TIL CLR 3% Large private APA 3% Other considerations › Net Revenue Interest (NRI): Sitio has an average NRI of 0.8%, however the NRIs of individual wells TIL can vary. Sitio’s net production can differ significantly depending on the NRI of wells TIL for a period, even if the gross wells TIL is constant. This makes forecasting individual quarters more challenging than taking a longer-term perspective › Rig Count vs. Completion Activity: While it is a common industry practice to use rig count as a proxy for activity, production growth is driven by spuds / DUCs being completed and TIL, which are not necessarily in-line with rig activity. Additionally, incremental efficiency measures by operators further complicate the relationship between rig count and production trends › Reported Financial Production: Sitio's quarterly financial production is comprised of both estimates of volumes produced during the applicable quarter and prior period adjustments to previously accrued production volumes due to the multi-month lag in well production data from operators Note: CVX pro forma for HES, FANG pro forma for Endeavor, COP pro forma for MRO, and DVN pro forma for Grayson Mill. Inventory numbers exclude the Spuds and Permits on Sitio acreage (1) Sitio discloses LOS wells using public data definitions; there is typically an approximate 4-month data lag, so a portion of wells listed as spuds and permits are actually online; All wells normalized to 5,000’ basis (2) Pro forma production for 2Q24 includes production for all acquisitions closed in 2Q24 32 (3) Pro forma gross horizontal wells by operator include wells from all announced acquisitions and are normalized to 5,000’ as of 6/30/24

Selected mineral and royalty company benchmarking (1) 2Q24 Production (Mboe/d) NRAs Permian Non-Permian Oil Gas NGL 47.5 1,259,832 40.4 39.2 24.9 24.1 594,111 267,351 254,096 193,826 KRP BSM STR VNOM TPL VNOM BSM STR TPL KRP (4) (3) 2Q24 Cash G&A ($/boe) 2Q24 Adjusted EBITDA ($mm) $6.05 $199 $153 $152 $3.04 $100 $2.34 $1.98 $66 $0.84 VNOM TPL STR BSM KRP VNOM STR KRP BSM TPL Note: Cash G&A and Adjusted EBITDA are non-GAAP measures. See Appendix for definitions of non-GAAP measures used and non-GAAP reconciliations. Peer data from most recent company filings as of 8/27/24 (1) BSM NGLs are included in gas production th (2) TPL Permian NRAs pro forma for acquisition announced 8/27/24 and calculated as sum of Midland and Delaware Basin NRAs normalized to 1/8 royalty interest. KRP Permian NRAs calculated as sum of Midland and Delaware Basin NRAs (3) TPL Cash G&A is calculated as general and administrative expenses plus salaries and related employee expenses minus share-based compensation 33 (4) Adjusted EBITDA for peers as reported

Commodity derivatives as of 6/30/24 FY2024 1H2025 FY2024 1H2025 Oil swaps Natural Gas swaps Bbl per day 3,300 1,100 MMBtu per day 500 - Average price ($/bbl) $82.66 $74.65 Average price ($/mmbtu) $3.41 - Oil collars Natural Gas collars Bbl per day - 2,000 MMBtu per day 11,400 11,600 Average call ($/bbl) - $93.20 Average call ($/mmbtu) $7.24 $10.34 Average put ($/bbl) - $60.00 Average put ($/mmbtu) $4.00 $3.31 34
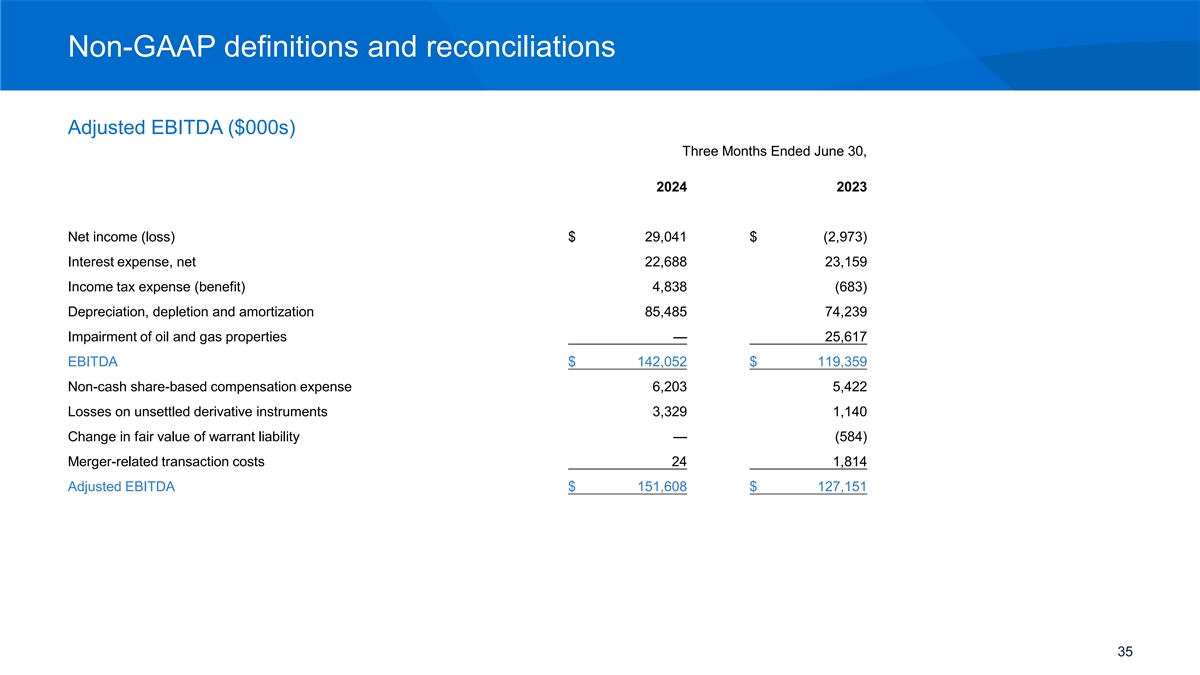
Non-GAAP definitions and reconciliations Adjusted EBITDA ($000s) Three Months Ended June 30, 2024 2023 Net income (loss) $ 29,041 $ (2,973) Interest expense, net 22,688 23,159 Income tax expense (benefit) 4,838 (683) Depreciation, depletion and amortization 85,485 74,239 Impairment of oil and gas properties — 25,617 EBITDA $ 142,052 $ 119,359 Non-cash share-based compensation expense 6,203 5,422 Losses on unsettled derivative instruments 3,329 1,140 Change in fair value of warrant liability — (584) Merger-related transaction costs 24 1,814 Adjusted EBITDA $ 151,608 $ 127,151 35

Non-GAAP definitions and reconciliations Discretionary Cash Flow ($000s) Three Months Ended June 30, 2024 2023 Cash flow from operations $ 97,312 $ 103,852 Interest expense, net 22,688 23,159 Income tax expense (benefit) 4,838 (683) Deferred tax benefit 3,256 10,172 Changes in operating assets and liabilities 24,799 (9,715) Amortization of deferred financing costs and long-term debt discount (1,309) (1,448) Merger-related transaction costs 24 1,814 Adjusted EBITDA $ 151,608 $ 127,151 Less: Cash and accrued interest expense 21,385 24,040 Estimated cash taxes 875 8,261 Discretionary Cash Flow $ 129,348 $ 94,850 36
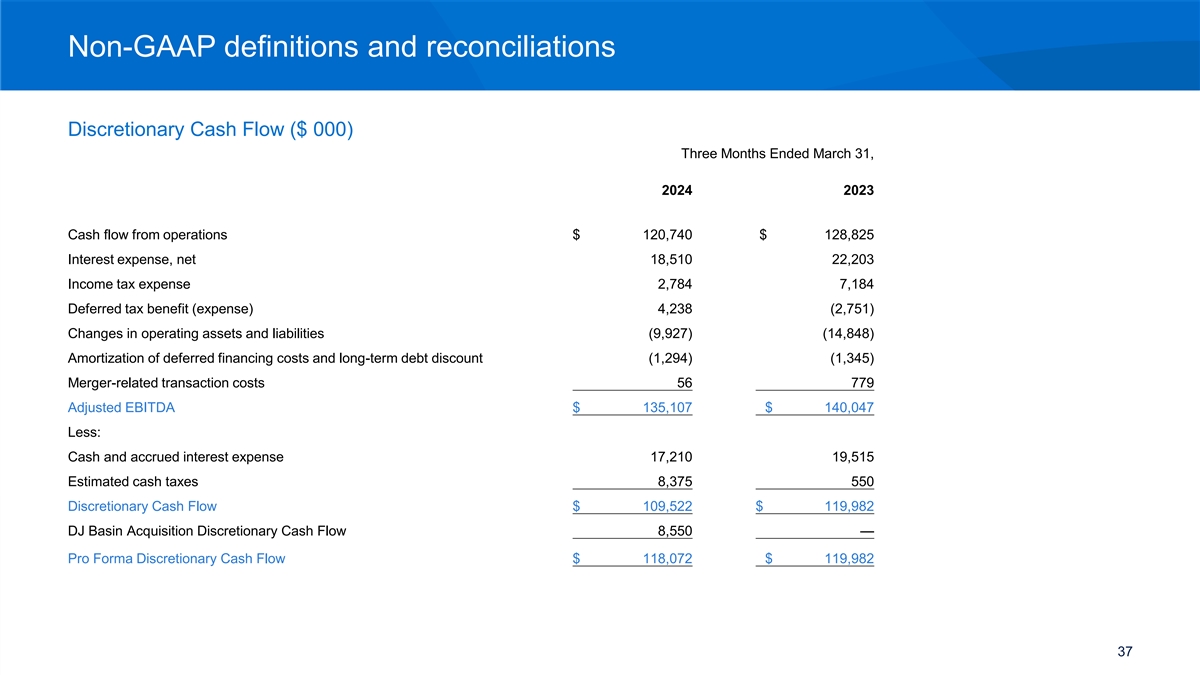
Non-GAAP definitions and reconciliations Discretionary Cash Flow ($ 000) Three Months Ended March 31, 2024 2023 Cash flow from operations $ 120,740 $ 128,825 Interest expense, net 18,510 22,203 Income tax expense 2,784 7,184 Deferred tax benefit (expense) 4,238 (2,751) Changes in operating assets and liabilities (9,927) (14,848) Amortization of deferred financing costs and long-term debt discount (1,294) (1,345) Merger-related transaction costs 56 779 Adjusted EBITDA $ 135,107 $ 140,047 Less: Cash and accrued interest expense 17,210 19,515 Estimated cash taxes 8,375 550 Discretionary Cash Flow $ 109,522 $ 119,982 DJ Basin Acquisition Discretionary Cash Flow 8,550 — Pro Forma Discretionary Cash Flow $ 118,072 $ 119,982 37

Non-GAAP definitions and reconciliations Cash G&A ($000s) Three Months Ended June 30, 2024 2023 General and administrative expense $ 13,456 $ $14,066 Less: Non-cash share-based compensation expense 6,203 5,422 Merger-related transaction costs 24 1,814 Rental income 171 135 Cash G&A $ 7,058 $ 6,695 38

Non-GAAP definitions and reconciliations Cash G&A ($ 000) Three Months Ended March 31, 2024 2023 General and administrative expense $13,011 $11,676 Less: Non-cash share-based compensation expense 5,104 4,684 Merger-related transaction costs 56 779 Rental income 141 106 Cash G&A $7,710 $6,107 39

Non-GAAP definitions and reconciliations Adjusted EBITDA, Discretionary Cash Flow, Cash G&A and Net Debt are non-GAAP supplemental financial measures used by our management and by external users of our financial statements such as investors, research analysts and others to assess the financial performance of our assets and their ability to sustain dividends over the long term without regard to financing methods, capital structure or historical cost basis. Sitio believes that these non-GAAP financial measures provide useful information to Sitio's management and external users because they allow for a comparison of operating performance on a consistent basis across periods. We define Adjusted EBITDA as net income plus (a) interest expense, (b) provisions for taxes, (c) depreciation, depletion and amortization, (d) non-cash share-based compensation expense, (e) impairment of oil and natural gas properties, (f) gains or losses on unsettled derivative instruments, (g) change in fair value of the warrant liability, (h) loss on debt extinguishment, (i) merger-related transaction costs and (j) write off of financing costs. This presentation does not include a reconciliation for 2024E Adjusted EBITDA because certain elements of the comparable GAAP financial measures are not predictable in this situation, making it impractical for the Company to forecast. We define Discretionary Cash Flow or (“DCF”) as Adjusted EBITDA, less cash and accrued interest expense and estimated cash taxes for the three months ended June 30, 2024. We define Cash G&A as general and administrative expense less (a) non-cash share-based compensation expense, (b) merger-related transaction costs and (c) rental income. We define Net Debt as total debt less cash. These non-GAAP financial measures do not represent and should not be considered an alternative to, or more meaningful than, their most directly comparable GAAP financial measures or any other measure of financial performance presented in accordance with GAAP as measures of our financial performance. Non-GAAP financial measures have important limitations as analytical tools because they exclude some but not all items that affect the most directly comparable GAAP financial measure. Our computations of Adjusted EBITDA, Discretionary Cash Flow, and Cash G&A may differ from computations of similarly titled measures of other companies. 40
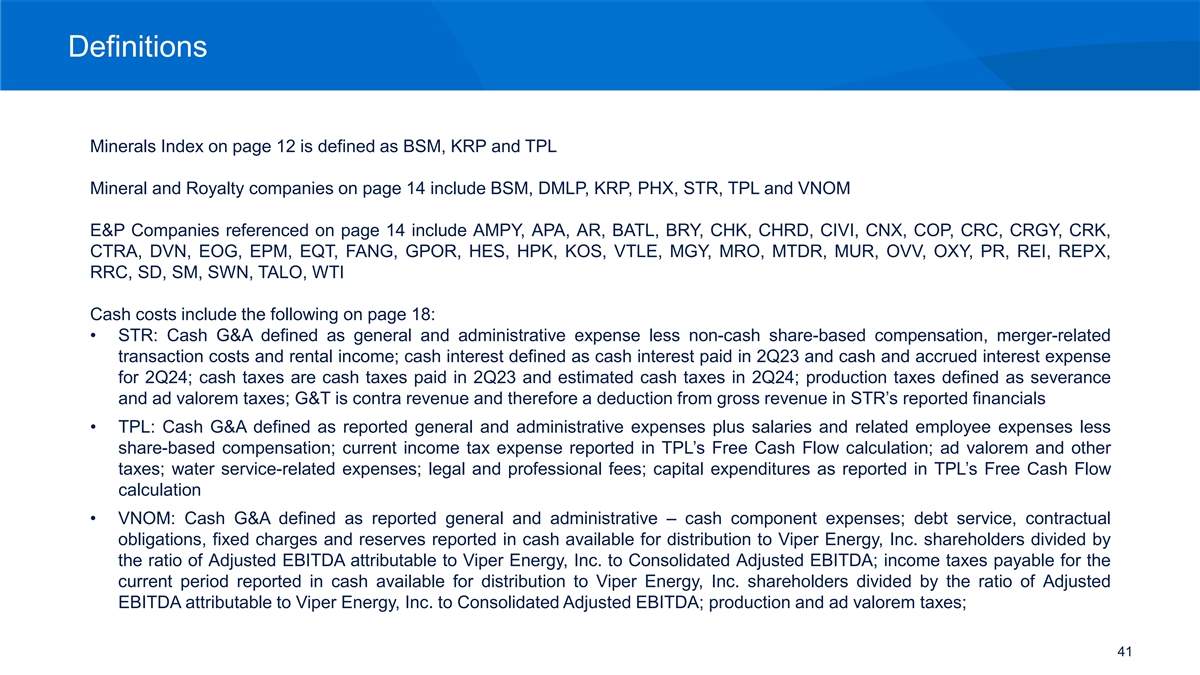
Definitions Minerals Index on page 12 is defined as BSM, KRP and TPL Mineral and Royalty companies on page 14 include BSM, DMLP, KRP, PHX, STR, TPL and VNOM E&P Companies referenced on page 14 include AMPY, APA, AR, BATL, BRY, CHK, CHRD, CIVI, CNX, COP, CRC, CRGY, CRK, CTRA, DVN, EOG, EPM, EQT, FANG, GPOR, HES, HPK, KOS, VTLE, MGY, MRO, MTDR, MUR, OVV, OXY, PR, REI, REPX, RRC, SD, SM, SWN, TALO, WTI Cash costs include the following on page 18: • STR: Cash G&A defined as general and administrative expense less non-cash share-based compensation, merger-related transaction costs and rental income; cash interest defined as cash interest paid in 2Q23 and cash and accrued interest expense for 2Q24; cash taxes are cash taxes paid in 2Q23 and estimated cash taxes in 2Q24; production taxes defined as severance and ad valorem taxes; G&T is contra revenue and therefore a deduction from gross revenue in STR’s reported financials • TPL: Cash G&A defined as reported general and administrative expenses plus salaries and related employee expenses less share-based compensation; current income tax expense reported in TPL’s Free Cash Flow calculation; ad valorem and other taxes; water service-related expenses; legal and professional fees; capital expenditures as reported in TPL’s Free Cash Flow calculation • VNOM: Cash G&A defined as reported general and administrative – cash component expenses; debt service, contractual obligations, fixed charges and reserves reported in cash available for distribution to Viper Energy, Inc. shareholders divided by the ratio of Adjusted EBITDA attributable to Viper Energy, Inc. to Consolidated Adjusted EBITDA; income taxes payable for the current period reported in cash available for distribution to Viper Energy, Inc. shareholders divided by the ratio of Adjusted EBITDA attributable to Viper Energy, Inc. to Consolidated Adjusted EBITDA; production and ad valorem taxes; 41

Definitions continued Cash costs include the following on page 18: • KRP: Cash G&A expense as reported in quarterly earnings press releases; cash interest expense as reported in the calculation of cash available for distribution to common units divided by the ratio of Adjusted EBITDA attributable to Kimbell Royalty Partners, LP to Consolidated Adjusted EBITDA; cash distributions on Series A preferred units; cash income tax expense as reported in the calculation of cash available for distribution to common units divided by the ratio of Adjusted EBITDA attributable to Kimbell Royalty Partners, LP to Consolidated Adjusted EBITDA; production and ad valorem taxes; marketing and other deductions • BSM: Cash G&A defined as general and administrative expense less equity-based compensation; cash interest expense; preferred unit distributions; production costs and ad valorem taxes; lease operating expenses • FRU: General and administrative expenses; cash payout on share based compensation; management fee – cash settled; interest on long-term debt and financing fees; income taxes paid, excluding tax deposits; production and ad valorem taxes; operating expense related to working interest assets • PSK: Cash administrative expenses; finance expense; current tax expense; production and mineral taxes; 42

Contact Information Ross Wong VP of Finance and Investor Relations Phone: (720) 640-7647 Email: IR@sitio.com 43


