UNITED STATES
SECURITIES AND EXCHANGE COMMISSION
Washington, D.C. 20549
FORM N-CSR
CERTIFIED SHAREHOLDER REPORT OF REGISTERED
MANAGEMENT INVESTMENT COMPANIES
Investment Company Act file number 811-23831
Fidelity Multi-Strategy Credit Fund
(Exact name of registrant as specified in charter)
245 Summer St., Boston, Massachusetts 02210
(Address of principal executive offices) (Zip code)
Margaret Carey, Secretary
245 Summer St.
Boston, Massachusetts 02210
(Name and address of agent for service)
Registrant's telephone number, including area code:
617-563-7000
Date of fiscal year end: | June 30 |
Date of reporting period: | June 30, 2024 |
Item 1.
Reports to Stockholders
Fidelity® Multi-Strategy Credit Fund
Annual Report
June 30, 2024


Contents
A fund's proxy voting guidelines and proxy voting record for the most recent 12-month period ended June 30 is available (1) without charge, upon request, by calling toll free 1-800-544-8544 if you are an individual investing directly with Fidelity; 1-800-835-5092 if you are a plan sponsor or participant with Fidelity as your recordkeeper; or 1-877-208-0098 on institutional accounts or if you are an advisor or invest through one; and (2) on or through our website at http://www.fidelity.com/proxyvotingresults or the Securities and Exchange Commission's (SEC) web site at http://www.sec.gov.
Standard & Poor's, S&P and S&P 500 are registered service marks of The McGraw-Hill Companies, Inc. and have been licensed for use by Fidelity Distributors Corporation.
Other third-party marks appearing herein are the property of their respective owners.
All other marks appearing herein are registered or unregistered trademarks or service marks of FMR LLC or an affiliated company. © 2024 FMR LLC. All rights reserved.
This report and the financial statements contained herein are submitted for the general information of the shareholders of the Fund. This report is not authorized for distribution to prospective investors in the Fund unless preceded or accompanied by an effective prospectus.
A fund files its complete schedule of portfolio holdings with the SEC for the first and third quarters of each fiscal year on Form N-PORT. Forms N-PORT are available on the SEC's web site at http://www.sec.gov. A fund's Forms N-PORT may be reviewed and copied at the SEC's Public Reference Room in Washington, DC. Information regarding the operation of the SEC's Public Reference Room may be obtained by calling 1-800-SEC-0330.
For a complete list of a fund's portfolio holdings, view the most recent holdings listing, semiannual report, or annual report on Fidelity's web site at http://www.fidelity.com, http://www.institutional.fidelity.com, or http://www.401k.com, as applicable.
NOT FDIC INSURED •MAY LOSE VALUE •NO BANK GUARANTEE
Neither the Fund nor Fidelity Distributors Corporation is a bank.
Performance: The Bottom Line
Average annual total return reflects the change in the value of an investment, assuming reinvestment of distributions from dividend income and capital gains (the profits earned upon the sale of securities that have grown in value, if any) and assuming a constant rate of performance each year. The hypothetical investment and the average annual total returns do not reflect the deduction of taxes that a shareholder would pay on fund distributions or the redemption of fund shares. During periods of reimbursement by Fidelity, a fund's total return will be greater than it would be had the reimbursement not occurred. How a fund did yesterday is no guarantee of how it will do tomorrow.
| Average Annual Total Returns | |||
Periods ended June 30, 2024 | Past 1 year | Life of Fund A |
Class A (incl. 5.75% sales charge) | 2.17% | 2.69% |
Class C (incl. contingent deferred sales charge) | 6.60% | 7.47% |
| Class I | 8.68% | 8.54% |
Class L (incl. 4.25% sales charge) | 3.54% | 3.89% |
A From May 19, 2023
Class C shares' contingent deferred sales charges included in the past one year and life of fund total return figures are 1% and 0%, respectively.
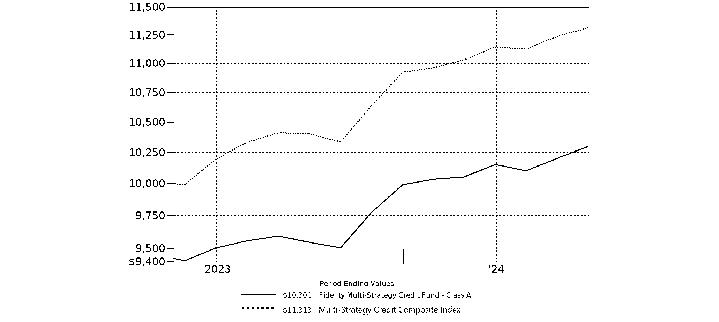
| $10,000 Over Life of Fund |
Let's say hypothetically that $10,000 was invested in Fidelity Multi-Strategy Credit Fund - Class A, a class of the fund, on May 19, 2023, when the fund started, and the current 5.75% sales charge was paid. The chart shows how the value of your investment would have changed, and also shows how the performed over the same period. |
 |
Management's Discussion of Fund Performance
Market Recap:
For the 12 months ending June 30, 2024, an expanding global economy, as well as moves toward monetary easing and a slowing in the pace of inflation in some markets, contributed to a favorable backdrop for risk assets, despite geopolitical uncertainty. Easing inflation in the U.S. enabled the Federal Reserve and other key central banks to keep further increases in short-term interest rates on hold or initiate rate cuts, a stance that stoked investor sentiment. Against this backdrop, higher-risk assets saw particularly strong performance, with leveraged loans and U.S. high-yield bonds standing out along the credit spectrum. Broadly syndicated loan issuance recovered strongly through the first half of 2024, putting pressure on direct lending pricing and loan structures amid tightening spreads. Commercial mortgage-backed securities and emerging-markets debt also saw solid returns for the year. U.S. taxable investment-grade bonds gained only modestly amid a holding pattern by the Fed on policy interest rates, with weakness among government-backed securities moderating gains from corporate bonds and other credit-related assets.
Fidelity Multi-Strategy Credit Fund investment team:
For the annual reporting period, returns for the fund's share classes ranged from 7.60% to 8.68%, versus 10.99% for the Multi-Strategy Credit Composite Index, a customized 50/50 blend of the Morningstar LSTA US Performing Loans Index and the ICE BofA US High Yield Master II Index. On a gross basis, primary investments underperformed by 0.74%. The biggest contributor to relative performance were our holdings in direct lending via Fidelity Private Credit Fund, which anchors the fund's foundational credit allocation based on its attractive risk-reward characteristics through the credit cycle. Conversely, positions in U.S. Treasuries and individual holdings Oracle and Penn Entertainment were the fund's largest relative detractors. We continue to use our ability to invest across the credit spectrum to find and own ideas in preferred equity and convertible securities to supplement the fund's high-yield and leveraged loan positions.
The views expressed above reflect those of the portfolio manager(s) only through the end of the period as stated on the cover of this report and do not necessarily represent the views of Fidelity or any other person in the Fidelity organization. Any such views are subject to change at any time based upon market or other conditions and Fidelity disclaims any responsibility to update such views. These views may not be relied on as investment advice and, because investment decisions for a Fidelity fund are based on numerous factors, may not be relied on as an indication of trading intent on behalf of any Fidelity fund.
Investment Summary June 30, 2024 (Unaudited)
| Top Bond Issuers (% of Fund's net assets) | ||
(with maturities greater than one year) | ||
| US Treasury Notes | 8.9 | |
| JPMorgan Chase & Co | 2.2 | |
| Energy Transfer LP | 2.2 | |
| TransDigm Inc | 1.9 | |
| Uber Technologies Inc | 1.3 | |
| UKG Inc | 1.2 | |
| Northern Oil & Gas Inc | 1.2 | |
| Bank of America Corp | 0.9 | |
| SCE Trust VII 6.95% | 0.8 | |
| DISH Network Corp. | 0.8 | |
| 21.4 | ||
| Market Sectors (% of Fund's net assets) | ||
| Diversified Financial Services | 31.7 | |
| Technology | 9.6 | |
| Energy | 8.2 | |
| Services | 4.6 | |
| Banks & Thrifts | 3.8 | |
Quality Diversification (% of Fund's net assets) |
 |
| We have used ratings from Moody's Investors Service, Inc. Where Moody's® ratings are not available, we have used S&P® ratings. All ratings are as of the date indicated and do not reflect subsequent changes. |
Asset Allocation (% of Fund's net assets) |
 |
Schedule of Investments June 30, 2024
Showing Percentage of Net Assets
| Bank Loan Obligations - 14.9% | |||
Principal Amount (a) | Value ($) | ||
| Automotive & Auto Parts - 0.5% | |||
| Power Stop LLC 1LN, term loan CME Term SOFR 1 Month Index + 4.750% 10.1973% 1/26/29 (b)(c)(d) | 70,000 | 68,192 | |
| RVR Dealership Holdings LLC Tranche B 1LN, term loan 1 month U.S. LIBOR + 4.000% 9.1749% 2/8/28 (b)(c)(d) | 119,693 | 110,617 | |
TOTAL AUTOMOTIVE & AUTO PARTS | 178,809 | ||
| Building Materials - 0.3% | |||
| Hunter Douglas, Inc. Tranche B 1LN, term loan CME Term SOFR 3 Month Index + 3.500% 8.8359% 2/25/29 (b)(c)(d) | 109,442 | 108,387 | |
| Cable/Satellite TV - 0.1% | |||
| CSC Holdings LLC Tranche B6 LN, term loan CME Term SOFR 1 Month Index + 4.500% 9.8288% 1/18/28 (b)(c)(d) | 49,748 | 47,723 | |
| Consumer Products - 0.0% | |||
| Kronos Acquisition Holdings, Inc. Tranche B 1LN, term loan CME Term SOFR 1 Month Index + 4.000% 6/27/31 (c)(d)(e) | 5,000 | 4,963 | |
| Diversified Financial Services - 0.4% | |||
| Fleet U.S. Bidco, Inc. Tranche B 1LN, term loan CME Term SOFR 1 Month Index + 3.250% 8.5939% 2/3/31 (b)(c)(d) | 75,000 | 75,281 | |
| Nexus Buyer LLC Tranche B 1LN, term loan CME Term SOFR 1 Month Index + 4.500% 9.8439% 12/13/28 (b)(c)(d) | 74,813 | 74,794 | |
TOTAL DIVERSIFIED FINANCIAL SERVICES | 150,075 | ||
| Energy - 0.5% | |||
| Apro LLC Tranche B 1LN, term loan CME Term SOFR 1 Month Index + 3.750% 6/26/31 (c)(d)(e) | 5,000 | 4,994 | |
| EG America LLC Tranche BC 1LN, term loan CME Term SOFR 1 Month Index + 5.500% 11.0716% 2/7/28 (b)(c)(d) | 189,624 | 186,859 | |
TOTAL ENERGY | 191,853 | ||
| Food/Beverage/Tobacco - 0.2% | |||
| Triton Water Holdings, Inc. Tranche B 1LN, term loan CME Term SOFR 1 Month Index + 3.250% 8.8135% 3/31/28 (b)(c)(d) | 79,795 | 79,795 | |
| Gaming - 1.0% | |||
| Caesars Entertainment, Inc. Tranche B1 1LN, term loan CME Term SOFR 1 Month Index + 2.750% 8.0973% 2/6/31 (b)(c)(d) | 19,950 | 19,931 | |
| Fertitta Entertainment LLC NV Tranche B 1LN, term loan CME Term SOFR 1 Month Index + 4.000% 9.0808% 1/27/29 (b)(c)(d) | 103,674 | 103,740 | |
| Ontario Gaming GTA LP Tranche B 1LN, term loan CME Term SOFR 1 Month Index + 4.250% 9.5846% 8/1/30 (b)(c)(d) | 114,425 | 114,836 | |
| Scientific Games Holdings LP Tranche B 1LN, term loan CME Term SOFR 1 Month Index + 3.000% 8.3063% 4/4/29 (b)(c)(d) | 129,671 | 129,347 | |
TOTAL GAMING | 367,854 | ||
| Healthcare - 1.1% | |||
| Gainwell Acquisition Corp. Tranche B 1LN, term loan CME Term SOFR 3 Month Index + 4.000% 9.4346% 10/1/27 (b)(c)(d) | 79,588 | 76,968 | |
| Medline Borrower LP Tranche B 1LN, term loan CME Term SOFR 1 Month Index + 2.750% 8.0939% 10/23/28 (b)(c)(d) | 135,944 | 136,126 | |
| Packaging Coordinators Midco, Inc. 1LN, term loan CME Term SOFR 1 Month Index + 3.250% 8.5846% 11/30/27 (b)(c)(d) | 74,807 | 74,994 | |
| Phoenix Newco, Inc. Tranche B 1LN, term loan CME Term SOFR 1 Month Index + 3.250% 8.7084% 11/15/28 (b)(c)(d) | 128,359 | 128,559 | |
TOTAL HEALTHCARE | 416,647 | ||
| Hotels - 0.5% | |||
| Four Seasons Hotels Ltd. Tranche B 1LN, term loan CME Term SOFR 1 Month Index + 2.000% 7.3439% 11/30/29 (b)(c)(d) | 197,494 | 198,124 | |
| Insurance - 0.0% | |||
| Truist Insurance Holdings LLC Tranche B 1LN, term loan CME Term SOFR 1 Month Index + 3.250% 8.5846% 5/6/31 (b)(c)(d) | 10,000 | 10,009 | |
| Leisure - 0.4% | |||
| Carnival Corp. Tranche B 1LN, term loan CME Term SOFR 1 Month Index + 2.750% 8.0939% 10/18/28 (b)(c)(d) | 23,269 | 23,298 | |
| City Football Group Ltd. Tranche B 1LN, term loan CME Term SOFR 1 Month Index + 3.000% 8.5861% 7/21/28 (b)(c)(d) | 129,352 | 128,827 | |
TOTAL LEISURE | 152,125 | ||
| Paper - 0.6% | |||
| Clydesdale Acquisition Holdings, Inc. 1LN, term loan CME Term SOFR 1 Month Index + 3.670% 9.1189% 4/13/29 (b)(c)(d) | 208,145 | 208,469 | |
| Services - 2.4% | |||
| Allied Universal Holdco LLC Tranche B 1LN, term loan CME Term SOFR 1 Month Index + 3.750% 9.1939% 5/14/28 (b)(c)(d) | 198,977 | 198,125 | |
| Artera Services LLC Tranche B 1LN, term loan CME Term SOFR 1 Month Index + 4.500% 9.8346% 2/10/31 (b)(c)(d) | 74,813 | 75,080 | |
| Ascend Learning LLC Tranche B 1LN, term loan CME Term SOFR 1 Month Index + 3.500% 8.9439% 12/10/28 (b)(c)(d) | 138,228 | 138,030 | |
| Brand Industrial Services, Inc. Tranche B 1LN, term loan CME Term SOFR 1 Month Index + 4.500% 9.8268% 8/1/30 (b)(c)(d) | 5,000 | 5,014 | |
| CoreLogic, Inc. Tranche B 1LN, term loan CME Term SOFR 1 Month Index + 3.500% 8.9584% 6/2/28 (b)(c)(d) | 119,386 | 117,425 | |
| Ion Trading Finance Ltd. 1LN, term loan CME Term SOFR 1 Month Index + 4.000% 9.3461% 4/3/28 (b)(c)(d) | 55,678 | 55,585 | |
| Planet U.S. Buyer LLC Tranche B 1LN, term loan CME Term SOFR 1 Month Index + 3.500% 8.8232% 2/10/31 (b)(c)(d) | 75,000 | 75,450 | |
| STS Operating, Inc. 1LN, term loan CME Term SOFR 1 Month Index + 4.000% 9.4439% 3/25/31 (b)(c)(d) | 74,813 | 74,929 | |
| The GEO Group, Inc. Tranche B 1LN, term loan CME Term SOFR 1 Month Index + 5.250% 10.5939% 4/14/29 (b)(c)(d) | 9,875 | 10,060 | |
| Uber Technologies, Inc. Tranche B 1LN, term loan CME Term SOFR 3 Month Index + 3.000% 8.0892% 3/3/30 (b)(c)(d) | 157,569 | 158,196 | |
TOTAL SERVICES | 907,894 | ||
| Super Retail - 1.2% | |||
| Great Outdoors Group LLC Tranche B 1LN, term loan CME Term SOFR 1 Month Index + 3.750% 9.2084% 3/5/28 (b)(c)(d) | 207,549 | 207,225 | |
| LBM Acquisition LLC Tranche B 1LN, term loan CME Term SOFR 1 Month Index + 3.750% 9.1775% 6/6/31 (b)(c)(d) | 233,625 | 229,471 | |
TOTAL SUPER RETAIL | 436,696 | ||
| Technology - 5.4% | |||
| Applied Systems, Inc.: | |||
| Tranche 2LN, term loan CME Term SOFR 1 Month Index + 5.250% 10.5594% 2/23/32 (b)(c)(d) | 5,000 | 5,163 | |
| Tranche B 1LN, term loan CME Term SOFR 1 Month Index + 3.500% 8.8346% 2/24/31 (b)(c)(d) | 200,000 | 201,352 | |
| Athenahealth Group, Inc. Tranche B 1LN, term loan CME Term SOFR 1 Month Index + 3.500% 8.5939% 2/15/29 (b)(c)(d) | 178,411 | 177,632 | |
| Camelot U.S. Acquisition LLC Tranche B 1LN, term loan CME Term SOFR 1 Month Index + 2.750% 8.0939% 1/31/31 (b)(c)(d) | 74,813 | 74,906 | |
| Cloud Software Group, Inc. Tranche B 1LN, term loan CME Term SOFR 1 Month Index + 4.000% 9.3222% 3/29/29 (b)(c)(d) | 59,848 | 59,758 | |
| ECL Entertainment LLC Tranche B 1LN, term loan CME Term SOFR 1 Month Index + 4.000% 9.3439% 8/7/30 (b)(c)(d) | 5,000 | 5,013 | |
| Ellucian, Inc. Tranche B 1LN, term loan CME Term SOFR 1 Month Index + 3.500% 8.9439% 10/7/29 (b)(c)(d) | 133,136 | 133,635 | |
| Gen Digital, Inc. Tranche B 1LN, term loan CME Term SOFR 1 Month Index + 2.000% 7.0779% 9/12/29 (b)(c)(d) | 172,202 | 171,494 | |
| Helios Software Holdings, Inc. Tranche B 1LN, term loan CME Term SOFR 1 Month Index + 3.750% 9.0846% 7/15/30 (b)(c)(d) | 74,625 | 74,732 | |
| McAfee Corp. Tranche B 1LN, term loan CME Term SOFR 1 Month Index + 3.250% 8.5792% 3/1/29 (b)(c)(d) | 99,746 | 99,513 | |
| Modena Buyer LLC 1LN, term loan CME Term SOFR 1 Month Index + 4.500% 4/21/31 (c)(d)(e) | 100,000 | 97,469 | |
| Peraton Corp. Tranche B 1LN, term loan CME Term SOFR 1 Month Index + 3.750% 9.1939% 2/1/28 (b)(c)(d) | 99,475 | 99,433 | |
| Polaris Newco LLC Tranche B 1LN, term loan CME Term SOFR 1 Month Index + 4.000% 9.5911% 6/2/28 (b)(c)(d) | 129,335 | 129,210 | |
| Project Alpha Intermediate Holding, Inc. Tranche B 1LN, term loan CME Term SOFR 1 Month Index + 3.750% 9.072% 10/28/30 (b)(c)(d) | 50,000 | 50,115 | |
| Proofpoint, Inc. Tranche B 1LN, term loan CME Term SOFR 1 Month Index + 3.000% 8.3439% 8/31/28 (b)(c)(d) | 149,364 | 149,421 | |
| RealPage, Inc. Tranche B 1LN, term loan CME Term SOFR 1 Month Index + 3.000% 8.4584% 4/22/28 (b)(c)(d) | 34,733 | 33,720 | |
| UKG, Inc. Tranche B 1LN, term loan CME Term SOFR 1 Month Index + 3.500% 8.5763% 2/10/31 (b)(c)(d) | 354,013 | 355,163 | |
| VS Buyer LLC Tranche B 1LN, term loan CME Term SOFR 1 Month Index + 3.250% 8.5808% 4/14/31 (b)(c)(d) | 24,819 | 24,850 | |
| Webpros Investments Sarl Tranche B 1LN, term loan CME Term SOFR 1 Month Index + 4.000% 9.3439% 3/19/31 (b)(c)(d) | 75,000 | 75,563 | |
TOTAL TECHNOLOGY | 2,018,142 | ||
| Utilities - 0.3% | |||
| Brookfield WEC Holdings, Inc. Tranche B 1LN, term loan CME Term SOFR 1 Month Index + 2.750% 8.0939% 1/20/31 (b)(c)(d) | 100,000 | 100,022 | |
| TOTAL BANK LOAN OBLIGATIONS (Cost $5,521,336) | 5,577,587 | ||
| Corporate Bonds - 34.6% | |||
Principal Amount (a) | Value ($) | ||
| Convertible Bonds - 3.2% | |||
| Aerospace - 0.2% | |||
| Parsons Corp. 2.625% 3/1/29 (f) | 22,000 | 23,485 | |
| Spirit Aerosystems, Inc. 3.25% 11/1/28 (f) | 30,000 | 38,937 | |
| 62,422 | |||
| Air Transportation - 0.1% | |||
| JetBlue Airways Corp. 0.5% 4/1/26 | 40,000 | 35,086 | |
| Automotive & Auto Parts - 0.1% | |||
| Rivian Automotive, Inc. 3.625% 10/15/30 (f) | 30,000 | 25,848 | |
| Broadcasting - 0.4% | |||
| DISH Network Corp.: | |||
| 0% 12/15/25 | 59,000 | 43,371 | |
| 3.375% 8/15/26 | 175,000 | 108,528 | |
| 151,899 | |||
| Energy - 0.5% | |||
| NextEra Energy Partners LP 0% 11/15/25 (f) | 92,000 | 83,076 | |
| Northern Oil & Gas, Inc. 3.625% 4/15/29 | 60,000 | 69,060 | |
| Sunnova Energy International, Inc. 2.625% 2/15/28 | 48,000 | 16,655 | |
| 168,791 | |||
| Gaming - 0.1% | |||
| Penn Entertainment, Inc. 2.75% 5/15/26 | 18,000 | 19,732 | |
| Healthcare - 0.2% | |||
| Guardant Health, Inc. 0% 11/15/27 | 52,000 | 40,083 | |
| Insulet Corp. 0.375% 9/1/26 | 37,000 | 40,349 | |
| 80,432 | |||
| Homebuilders/Real Estate - 0.2% | |||
| Meritage Homes Corp. 1.75% 5/15/28 (f) | 20,000 | 19,860 | |
| Realogy Group LLC/Realogy Co-Issuer Corp. 0.25% 6/15/26 | 30,000 | 24,075 | |
| Redfin Corp. 0.5% 4/1/27 | 63,000 | 34,425 | |
| 78,360 | |||
| Leisure - 0.0% | |||
| Peloton Interactive, Inc. 0% 2/15/26 | 11,000 | 9,680 | |
| Services - 0.1% | |||
| Uber Technologies, Inc. 0.875% 12/1/28 (f) | 25,000 | 29,725 | |
| Technology - 0.7% | |||
| BlackLine, Inc. 1% 6/1/29 (f) | 39,000 | 37,791 | |
| Five9, Inc. 1% 3/15/29 (f) | 34,000 | 30,284 | |
| Global Payments, Inc. 1.5% 3/1/31 (f) | 23,000 | 21,057 | |
| Microchip Technology, Inc. 0.75% 6/1/30 (f) | 25,000 | 25,211 | |
| MicroStrategy, Inc. 0.75% 12/15/25 | 23,000 | 79,557 | |
| Progress Software Corp. 3.5% 3/1/30 (f) | 10,000 | 10,191 | |
| Stem, Inc. 4.25% 4/1/30 (f) | 27,000 | 11,162 | |
| Wolfspeed, Inc. 1.875% 12/1/29 | 113,000 | 62,263 | |
| 277,516 | |||
| Utilities - 0.6% | |||
| PG&E Corp. 4.25% 12/1/27 (f) | 45,000 | 45,383 | |
| Southern Co. 4.5% 6/15/27 (f) | 185,000 | 187,498 | |
| 232,881 | |||
TOTAL CONVERTIBLE BONDS | 1,172,372 | ||
| Nonconvertible Bonds - 31.4% | |||
| Aerospace - 2.3% | |||
| ATI, Inc. 5.875% 12/1/27 | 155,000 | 152,951 | |
| TransDigm, Inc.: | |||
| 4.625% 1/15/29 | 210,000 | 195,938 | |
| 6.75% 8/15/28 (f) | 480,000 | 484,800 | |
| 7.125% 12/1/31 (f) | 15,000 | 15,456 | |
| 849,145 | |||
| Air Transportation - 0.4% | |||
| American Airlines, Inc. 8.5% 5/15/29 (f) | 30,000 | 31,169 | |
| Rand Parent LLC 8.5% 2/15/30 (f) | 110,000 | 111,365 | |
| 142,534 | |||
| Automotive & Auto Parts - 1.0% | |||
| Hudson Automotive Group 8% 5/15/32 (f) | 15,000 | 15,511 | |
| LCM Investments Holdings 8.25% 8/1/31 (f) | 25,000 | 26,087 | |
| Macquarie AirFinance Holdings: | |||
| 6.4% 3/26/29 (f) | 200,000 | 203,383 | |
| 6.5% 3/26/31 (f) | 30,000 | 30,849 | |
| 8.375% 5/1/28 (f) | 25,000 | 26,349 | |
| McLaren Finance PLC 7.5% 8/1/26 (f) | 40,000 | 34,770 | |
| Wand NewCo 3, Inc. 7.625% 1/30/32 (f) | 25,000 | 25,820 | |
| 362,769 | |||
| Broadcasting - 1.7% | |||
| Clear Channel Outdoor Holdings, Inc.: | |||
| 7.875% 4/1/30 (f) | 50,000 | 50,327 | |
| 9% 9/15/28 (f) | 35,000 | 36,643 | |
| DISH Network Corp. 11.75% 11/15/27 (f) | 155,000 | 151,977 | |
| Univision Communications, Inc.: | |||
| 4.5% 5/1/29 (f) | 50,000 | 42,024 | |
| 7.375% 6/30/30 (f) | 200,000 | 186,034 | |
| Warnermedia Holdings, Inc.: | |||
| 5.141% 3/15/52 | 110,000 | 85,647 | |
| 5.391% 3/15/62 | 110,000 | 85,852 | |
| 638,504 | |||
| Building Materials - 0.1% | |||
| MasterBrand, Inc. 7% 7/15/32 (f) | 20,000 | 20,226 | |
| Cable/Satellite TV - 0.5% | |||
| Charter Communications Operating LLC/Charter Communications Operating Capital Corp. 3.7% 4/1/51 | 193,000 | 117,362 | |
| CSC Holdings LLC: | |||
| 5% 11/15/31 (f) | 60,000 | 21,751 | |
| 6.5% 2/1/29 (f) | 50,000 | 36,488 | |
| 175,601 | |||
| Capital Goods - 0.3% | |||
| Chart Industries, Inc. 7.5% 1/1/30 (f) | 25,000 | 25,834 | |
| ESAB Corp. 6.25% 4/15/29 (f) | 100,000 | 100,600 | |
| 126,434 | |||
| Chemicals - 1.0% | |||
| LSB Industries, Inc. 6.25% 10/15/28 (f) | 140,000 | 135,017 | |
| SCIH Salt Holdings, Inc. 4.875% 5/1/28 (f) | 30,000 | 27,877 | |
| The Chemours Co. LLC 5.75% 11/15/28 (f) | 140,000 | 129,255 | |
| W.R. Grace Holding LLC 5.625% 8/15/29 (f) | 75,000 | 69,127 | |
| 361,276 | |||
| Consumer Products - 0.8% | |||
| Kronos Acquisition Holdings, Inc. 8.25% 6/30/31 (f)(g) | 100,000 | 100,100 | |
| PetSmart, Inc. / PetSmart Finance Corp. 4.75% 2/15/28 (f) | 135,000 | 125,398 | |
| TKC Holdings, Inc. 6.875% 5/15/28 (f) | 75,000 | 72,717 | |
| 298,215 | |||
| Containers - 1.0% | |||
| Ball Corp. 6% 6/15/29 | 185,000 | 186,067 | |
| Graphic Packaging International, Inc. 3.75% 2/1/30 (f) | 140,000 | 124,980 | |
| LABL, Inc. 9.5% 11/1/28 (f) | 60,000 | 60,473 | |
| 371,520 | |||
| Diversified Financial Services - 0.8% | |||
| Aercap Global Aviation Trust 6.5% 6/15/45 (b)(f) | 90,000 | 89,792 | |
| Coinbase Global, Inc. 3.375% 10/1/28 (f) | 55,000 | 47,155 | |
| GGAM Finance Ltd.: | |||
| 6.875% 4/15/29 (f) | 30,000 | 30,525 | |
| 8% 6/15/28 (f) | 25,000 | 26,331 | |
| OneMain Finance Corp. 4% 9/15/30 | 85,000 | 72,951 | |
| Scientific Games Holdings LP/Scientific Games U.S. Finco, Inc. 6.625% 3/1/30 (f) | 50,000 | 48,741 | |
| 315,495 | |||
| Energy - 5.1% | |||
| Calumet Specialty Products Partners LP/Calumet Finance Corp. 11% 4/15/25 (f) | 38,000 | 38,111 | |
| CPI CG, Inc. 10% 7/15/29 (f)(g) | 15,000 | 15,563 | |
| CVR Energy, Inc. 8.5% 1/15/29 (f) | 100,000 | 100,412 | |
| Delek Logistics Partners LP/Delek Logistics Finance Corp. 7.125% 6/1/28 (f) | 140,000 | 138,250 | |
| Diamond Foreign Asset Co. / Diamond Finance, LLC 8.5% 10/1/30 (f) | 50,000 | 52,483 | |
| Enbridge, Inc. 8.5% 1/15/84 (b) | 30,000 | 32,341 | |
| Energy Transfer LP: | |||
| 6% 2/1/29 (f) | 205,000 | 206,408 | |
| 8% 5/15/54 (b) | 20,000 | 20,920 | |
| Harvest Midstream I LP 7.5% 5/15/32 (f) | 100,000 | 101,535 | |
| Hess Midstream Operations LP 5.125% 6/15/28 (f) | 130,000 | 125,873 | |
| Northern Oil & Gas, Inc. 8.75% 6/15/31 (f) | 350,000 | 367,249 | |
| Oceaneering International, Inc. 6% 2/1/28 | 50,000 | 49,428 | |
| PBF Holding Co. LLC/PBF Finance Corp.: | |||
| 6% 2/15/28 | 85,000 | 82,875 | |
| 7.875% 9/15/30 (f) | 35,000 | 35,830 | |
| Petroleos Mexicanos 6.95% 1/28/60 | 195,000 | 128,066 | |
| Seadrill Finance Ltd. 8.375% 8/1/30 (f) | 50,000 | 52,259 | |
| Sitio Royalties OP / Sitio Finance Corp. 7.875% 11/1/28 (f) | 155,000 | 160,266 | |
| Sunoco Logistics Partners, LP 7.25% 5/1/32 (f) | 25,000 | 25,859 | |
| Transocean, Inc.: | |||
| 8% 2/1/27 (f) | 18,000 | 17,938 | |
| 8.5% 5/15/31 (f) | 100,000 | 100,043 | |
| 8.75% 2/15/30 (f) | 58,500 | 61,418 | |
| 1,913,127 | |||
| Environmental - 0.1% | |||
| Covanta Holding Corp. 4.875% 12/1/29 (f) | 51,000 | 46,549 | |
| Food & Drug Retail - 0.7% | |||
| Albertsons Companies LLC/Safeway, Inc./New Albertson's, Inc./Albertson's LLC 4.875% 2/15/30 (f) | 270,000 | 255,150 | |
| Food/Beverage/Tobacco - 0.6% | |||
| KeHE Distributor / Nextwave 9% 2/15/29 (f) | 75,000 | 76,867 | |
| Post Holdings, Inc. 5.5% 12/15/29 (f) | 135,000 | 130,263 | |
| 207,130 | |||
| Gaming - 1.9% | |||
| Affinity Interactive 6.875% 12/15/27 (f) | 80,000 | 70,541 | |
| Boyd Gaming Corp. 4.75% 6/15/31 (f) | 185,000 | 167,666 | |
| Caesars Entertainment, Inc. 7% 2/15/30 (f) | 60,000 | 61,301 | |
| Churchill Downs, Inc.: | |||
| 5.5% 4/1/27 (f) | 150,000 | 147,586 | |
| 6.75% 5/1/31 (f) | 60,000 | 60,325 | |
| Fertitta Entertainment LLC / Fertitta Entertainment Finance Co., Inc. 4.625% 1/15/29 (f) | 145,000 | 132,046 | |
| Light & Wonder International, Inc. 7.5% 9/1/31 (f) | 40,000 | 41,329 | |
| Ontario Gaming GTA LP / OTG Co. issuer, Inc. 8% 8/1/30 (f) | 40,000 | 41,050 | |
| 721,844 | |||
| Healthcare - 1.2% | |||
| CHS/Community Health Systems, Inc. 5.25% 5/15/30 (f) | 165,000 | 136,041 | |
| Organon & Co. / Organon Foreign Debt Co-Issuer BV 4.125% 4/30/28 (f) | 140,000 | 130,017 | |
| Tenet Healthcare Corp. 4.25% 6/1/29 | 210,000 | 195,565 | |
| 461,623 | |||
| Homebuilders/Real Estate - 0.8% | |||
| MPT Operating Partnership LP/MPT Finance Corp. 5% 10/15/27 | 155,000 | 128,016 | |
| Panther Escrow Issuer LLC 7.125% 6/1/31 (f) | 110,000 | 111,258 | |
| Uniti Group LP/Uniti Group Finance, Inc./CSL Capital LLC 10.5% 2/15/28 (f) | 65,000 | 63,653 | |
| 302,927 | |||
| Insurance - 0.5% | |||
| HUB International Ltd. 5.625% 12/1/29 (f) | 210,000 | 198,597 | |
| Leisure - 0.2% | |||
| Carnival Corp. 4% 8/1/28 (f) | 65,000 | 61,043 | |
| Metals/Mining - 1.3% | |||
| Cleveland-Cliffs, Inc. 4.625% 3/1/29 (f) | 140,000 | 132,483 | |
| ERO Copper Corp. 6.5% 2/15/30 (f) | 140,000 | 135,090 | |
| First Quantum Minerals Ltd. 8.625% 6/1/31 (f) | 75,000 | 74,550 | |
| Mineral Resources Ltd.: | |||
| 8% 11/1/27 (f) | 125,000 | 127,883 | |
| 9.25% 10/1/28 (f) | 10,000 | 10,495 | |
| 480,501 | |||
| Paper - 0.4% | |||
| Ardagh Metal Packaging Finance U.S.A. LLC/Ardagh Metal Packaging Finance PLC 4% 9/1/29 (f) | 80,000 | 67,700 | |
| Clydesdale Acquisition Holdings, Inc. 8.75% 4/15/30 (f) | 70,000 | 68,506 | |
| 136,206 | |||
| Restaurants - 0.3% | |||
| 1011778 BC Unlimited Liability Co./New Red Finance, Inc. 3.5% 2/15/29 (f) | 105,000 | 95,329 | |
| Dave & Buster's, Inc. 7.625% 11/1/25 (f) | 30,000 | 30,149 | |
| 125,478 | |||
| Services - 2.1% | |||
| Artera Services LLC 8.5% 2/15/31 (f) | 75,000 | 77,212 | |
| Brand Industrial Services, Inc. 10.375% 8/1/30 (f) | 50,000 | 54,035 | |
| Hertz Corp. 4.625% 12/1/26 (f) | 40,000 | 29,018 | |
| Neptune BidCo U.S., Inc. 9.29% 4/15/29 (f) | 100,000 | 96,000 | |
| The Brink's Co. 6.5% 6/15/29 (f) | 120,000 | 121,258 | |
| The GEO Group, Inc.: | |||
| 8.625% 4/15/29 (f) | 50,000 | 51,210 | |
| 10.25% 4/15/31 (f) | 45,000 | 47,083 | |
| Uber Technologies, Inc.: | |||
| 4.5% 8/15/29 (f) | 70,000 | 66,695 | |
| 7.5% 9/15/27 (f) | 230,000 | 234,512 | |
| 777,023 | |||
| Steel - 0.3% | |||
| ATI, Inc. 7.25% 8/15/30 | 35,000 | 36,129 | |
| Carpenter Technology Corp.: | |||
| 6.375% 7/15/28 | 55,000 | 54,988 | |
| 7.625% 3/15/30 | 40,000 | 41,181 | |
| 132,298 | |||
| Super Retail - 0.9% | |||
| Bath & Body Works, Inc. 6.875% 11/1/35 | 215,000 | 216,833 | |
| Carvana Co. 5.625% 10/1/25 (f) | 80,000 | 77,999 | |
| Wolverine World Wide, Inc. 4% 8/15/29 (f) | 45,000 | 37,671 | |
| 332,503 | |||
| Technology - 3.5% | |||
| Ahead DB Holdings LLC 6.625% 5/1/28 (f) | 50,000 | 47,323 | |
| Block, Inc. 3.5% 6/1/31 | 155,000 | 133,712 | |
| Cloud Software Group, Inc. 6.5% 3/31/29 (f) | 145,000 | 139,246 | |
| CommScope, Inc. 4.75% 9/1/29 (f) | 50,000 | 34,616 | |
| Elastic NV 4.125% 7/15/29 (f) | 145,000 | 132,394 | |
| Go Daddy Operating Co. LLC / GD Finance Co., Inc. 3.5% 3/1/29 (f) | 145,000 | 130,943 | |
| Helios Software Holdings, Inc. / ION Corporate Solutions Finance Sarl 8.75% 5/1/29 (f) | 100,000 | 101,821 | |
| Insight Enterprises, Inc. 6.625% 5/15/32 (f) | 20,000 | 20,309 | |
| ION Trading Technologies Ltd. 5.75% 5/15/28 (f) | 60,000 | 54,826 | |
| McAfee Corp. 7.375% 2/15/30 (f) | 70,000 | 64,670 | |
| MicroStrategy, Inc. 6.125% 6/15/28 (f) | 120,000 | 116,311 | |
| NCR Voyix Corp. 5.125% 4/15/29 (f) | 140,000 | 131,846 | |
| Open Text Corp. 6.9% 12/1/27 (f) | 60,000 | 62,271 | |
| Seagate HDD Cayman 8.25% 12/15/29 | 40,000 | 42,900 | |
| UKG, Inc. 6.875% 2/1/31 (f) | 100,000 | 101,253 | |
| 1,314,441 | |||
| Telecommunications - 1.1% | |||
| Altice France SA: | |||
| 5.125% 7/15/29 (f) | 60,000 | 39,456 | |
| 5.5% 1/15/28 (f) | 5,000 | 3,424 | |
| 5.5% 10/15/29 (f) | 75,000 | 49,432 | |
| 8.125% 2/1/27 (f) | 200,000 | 149,987 | |
| Frontier Communications Holdings LLC 8.75% 5/15/30 (f) | 65,000 | 66,979 | |
| Level 3 Financing, Inc.: | |||
| 10.5% 5/15/30 (f) | 65,000 | 64,377 | |
| 11% 11/15/29 (f) | 15,448 | 15,808 | |
| Zayo Group Holdings, Inc. 4% 3/1/27 (f) | 50,000 | 39,988 | |
| 429,451 | |||
| Utilities - 0.5% | |||
| Sempra 4.125% 4/1/52 (b) | 65,000 | 59,829 | |
| Southern Co. 4% 1/15/51 (b) | 65,000 | 63,020 | |
| Vistra Operations Co. LLC 7.75% 10/15/31 (f) | 50,000 | 52,070 | |
| 174,919 | |||
TOTAL NONCONVERTIBLE BONDS | 11,732,529 | ||
| TOTAL CORPORATE BONDS (Cost $12,697,975) | 12,904,901 | ||
| U.S. Treasury Obligations - 8.9% | |||
Principal Amount (a) | Value ($) | ||
| U.S. Treasury Notes: | |||
| 3.5% 4/30/30 | 1,500,000 | 1,434,141 | |
| 4% 6/30/28 | 540,000 | 531,795 | |
| 4.125% 7/31/28 | 1,375,000 | 1,360,444 | |
| TOTAL U.S. TREASURY OBLIGATIONS (Cost $3,340,887) | 3,326,380 | ||
| Asset-Backed Securities - 1.3% | |||
Principal Amount (a) | Value ($) | ||
| Goldentree Loan Management U.S. CLO 21, Ltd. Series 2024-21A Class E, CME Term SOFR 3 Month Index + 5.700% 11.0251% 7/20/37 (b)(c)(f) | 250,000 | 250,644 | |
| Golub Capital Partners Clo 37B Series 2024-60A Class ER, CME Term SOFR 3 Month Index + 6.000% 11.3306% 10/25/34 (b)(c)(f) | 250,000 | 249,986 | |
| TOTAL ASSET-BACKED SECURITIES (Cost $500,000) | 500,630 | ||
| Commercial Mortgage Securities - 0.7% | |||
Principal Amount (a) | Value ($) | ||
| BX Trust floater Series 2021-MFM1 Class E, CME Term SOFR 1 Month Index + 2.360% 7.6935% 1/15/34 (b)(c)(f) | 76,626 | 75,144 | |
| Hilton U.S.A. Trust Series 2016-HHV Class E, 4.3333% 11/5/38 (b)(f) | 100,000 | 93,424 | |
| MHC Commercial Mortgage Trust floater Series 2021-MHC Class F, CME Term SOFR 1 Month Index + 2.710% 8.0444% 4/15/38 (b)(c)(f) | 83,888 | 82,997 | |
| TOTAL COMMERCIAL MORTGAGE SECURITIES (Cost $246,635) | 251,565 | ||
| Common Stocks - 0.0% | |||
| Shares | Value ($) | ||
| Services - 0.0% | |||
The GEO Group, Inc. (h) (Cost $4,492) | 354 | 5,083 | |
| Preferred Stocks - 1.0% | |||
| Shares | Value ($) | ||
| Convertible Preferred Stocks - 0.2% | |||
| Diversified Financial Services - 0.1% | |||
| Apollo Global Management, Inc. Series A, 6.75% | 400 | 26,252 | |
| Utilities - 0.1% | |||
| NextEra Energy, Inc. 6.296% | 650 | 26,982 | |
TOTAL CONVERTIBLE PREFERRED STOCKS | 53,234 | ||
| Nonconvertible Preferred Stocks - 0.8% | |||
| Utilities - 0.8% | |||
| SCE Trust VII 6.95% | 12,000 | 308,880 | |
| TOTAL PREFERRED STOCKS (Cost $348,366) | 362,114 | ||
| Preferred Securities - 6.6% | |||
Principal Amount (a) | Value ($) | ||
| Banks & Thrifts - 3.8% | |||
| Bank of America Corp.: | |||
| 6.25% (b)(i) | 175,000 | 177,781 | |
| 6.5% (b)(i) | 145,000 | 146,464 | |
| Bank of New York Mellon Corp. 4.625% (b)(i) | 30,000 | 29,322 | |
| Goldman Sachs Group, Inc. 7.5% (b)(i) | 175,000 | 182,428 | |
| JPMorgan Chase & Co.: | |||
| 4% (b)(i) | 170,000 | 166,942 | |
| 4.6% (b)(i) | 110,000 | 110,566 | |
| 5% (b)(i) | 230,000 | 234,092 | |
| 6.875% (b)(i) | 300,000 | 311,667 | |
| PNC Financial Services Group, Inc. CME Term SOFR 3 Month Index + 3.300% 8.6477% (b)(c)(i) | 40,000 | 40,475 | |
| Wells Fargo & Co. 7.625% (b)(i) | 40,000 | 42,729 | |
TOTAL BANKS & THRIFTS | 1,442,466 | ||
| Diversified Financial Services - 0.5% | |||
| Aircastle Ltd. 5.25% (b)(f)(i) | 100,000 | 97,955 | |
| Charles Schwab Corp. 5.375% (b)(i) | 100,000 | 99,286 | |
TOTAL DIVERSIFIED FINANCIAL SERVICES | 197,241 | ||
| Energy - 2.1% | |||
| BP Capital Markets PLC 6.45% (b)(i) | 100,000 | 104,862 | |
| Energy Transfer LP: | |||
| 6.625% (b)(i) | 135,000 | 134,374 | |
| 6.75% (b)(i) | 160,000 | 160,570 | |
| 7.125% (b)(i) | 275,000 | 274,901 | |
| Plains All American Pipeline LP CME Term SOFR 3 Month Index + 4.110% 9.694% (b)(c)(i) | 100,000 | 100,826 | |
TOTAL ENERGY | 775,533 | ||
| Utilities - 0.2% | |||
| Duke Energy Corp. 4.875% (b)(i) | 65,000 | 65,342 | |
| TOTAL PREFERRED SECURITIES (Cost $2,402,836) | 2,480,582 | ||
| Other - 29.9% | |||
| Shares | Value ($) | ||
| Business Development Companies - 29.9% | |||
Fidelity Private Credit Fund Class I (j) (Cost $10,955,090) | 432,339 | 11,177,033 | |
| Money Market Funds - 2.0% | |||
| Shares | Value ($) | ||
| Fidelity Cash Central Fund 5.38% (k) | 743,676 | 743,825 | |
| State Street Institutional Treasury Plus Money Market Fund Investor Class 5.17% (l) | 286 | 286 | |
| TOTAL MONEY MARKET FUNDS (Cost $744,111) | 744,111 | ||
| TOTAL INVESTMENT IN SECURITIES - 99.9% (Cost $36,761,728) | 37,329,986 |
NET OTHER ASSETS (LIABILITIES) - 0.1% | 27,792 |
| NET ASSETS - 100.0% | 37,357,778 |
Legend
| (a) | Amount is stated in United States dollars unless otherwise noted. |
| (b) | Coupon rates for floating and adjustable rate securities reflect the rates in effect at period end. |
| (c) | Coupon is indexed to a floating interest rate which may be multiplied by a specified factor and/or subject to caps or floors. |
| (d) | Remaining maturities of bank loan obligations may be less than the stated maturities shown as a result of contractual or optional prepayments by the borrower. Such prepayments cannot be predicted with certainty. |
| (e) | The coupon rate will be determined upon settlement of the loan after period end. |
| (f) | Security exempt from registration under Rule 144A of the Securities Act of 1933. These securities may be resold in transactions exempt from registration, normally to qualified institutional buyers. At the end of the period, the value of these securities amounted to $10,989,616 or 29.4% of net assets. |
| (g) | Security or a portion of the security purchased on a delayed delivery or when-issued basis. |
| (h) | Non-income producing |
| (i) | Security is perpetual in nature with no stated maturity date. |
| (j) | Affiliated Fund |
| (k) | Affiliated fund that is generally available only to investment companies and other accounts managed by Fidelity Investments. The rate quoted is the annualized seven-day yield of the fund at period end. A complete unaudited listing of the fund's holdings as of its most recent quarter end is available upon request. In addition, each Fidelity Central Fund's financial statements, which are not covered by the Fund's Report of Independent Registered Public Accounting Firm, are available on the SEC's website or upon request. |
| (l) | The rate quoted is the annualized seven-day yield of the fund at period end. |
Affiliated Central Funds
Fiscal year to date information regarding the Fund's investments in Fidelity Central Funds, including the ownership percentage, is presented below.
| Affiliate | Value, beginning of period ($) | Purchases ($) | Sales Proceeds ($) | Dividend Income ($) | Realized Gain (loss) ($) | Change in Unrealized appreciation (depreciation) ($) | Value, end of period ($) | % ownership, end of period |
| Fidelity Cash Central Fund 5.38% | 1,665,523 | 25,070,842 | 25,992,554 | 94,828 | 14 | - | 743,825 | 0.0% |
| Total | 1,665,523 | 25,070,842 | 25,992,554 | 94,828 | 14 | - | 743,825 | |
Amounts in the dividend income column in the above table include any capital gain distributions from underlying funds, which are presented in the corresponding line item in the Statement of Operations, if applicable.
Amounts included in the purchases and sales proceeds columns may include in-kind transactions, if applicable.
Affiliated Underlying Funds
Fiscal year to date information regarding the Fund's investments in affiliated Underlying Funds is presented below. Exchanges between classes of the same affiliated Underlying Funds may occur. If an Underlying Funds changes its name, the name presented below is the name in effect at period end.
| Affiliate | Value, beginning of period ($) | Purchases ($) | Sales Proceeds ($) | Dividend Income ($) | Realized Gain (loss) ($) | Change in Unrealized appreciation (depreciation) ($) | Value, end of period ($) |
| Fidelity Investments Money Market Government Portfolio Class I 5.21% | 3,581 | - | 3,581 | - | - | - | - |
| Fidelity Private Credit Fund Class I | 8,778,672 | 2,205,093 | - | 1,027,665 | - | 193,268 | 11,177,033 |
| 8,782,253 | 2,205,093 | 3,581 | 1,027,665 | - | 193,268 | 11,177,033 |
Amounts in the dividend income column in the above table include any capital gain distributions from underlying funds, which are presented in the corresponding line item in the Statement of Operations, if applicable.
Amounts included in the purchases and sales proceeds columns may include in-kind transactions, if applicable.
Investment Valuation
The following is a summary of the inputs used, as of June 30, 2024, involving the Fund's assets and liabilities carried at fair value. The inputs or methodology used for valuing securities may not be an indication of the risk associated with investing in those securities. For more information on valuation inputs, and their aggregation into the levels used below, please refer to the Investment Valuation section in the accompanying Notes to Financial Statements.
| Valuation Inputs at Reporting Date: | ||||
| Description | Total ($) | Level 1 ($) | Level 2 ($) | Level 3 ($) |
Investments in Securities: | ||||
| Equities: | ||||
Financials | 26,252 | - | 26,252 | - |
Industrials | 5,083 | 5,083 | - | - |
Utilities | 335,862 | 308,880 | 26,982 | - |
| Bank Loan Obligations | 5,577,587 | - | 5,577,587 | - |
| Corporate Bonds | 12,904,901 | - | 12,904,901 | - |
| U.S. Government and Government Agency Obligations | 3,326,380 | - | 3,326,380 | - |
| Asset-Backed Securities | 500,630 | - | 500,630 | - |
| Commercial Mortgage Securities | 251,565 | - | 251,565 | - |
| Preferred Securities | 2,480,582 | - | 2,480,582 | - |
| Other | 11,177,033 | - | 11,177,033 | - |
| Money Market Funds | 744,111 | 744,111 | - | - |
| Total Investments in Securities: | 37,329,986 | 1,058,074 | 36,271,912 | - |
Financial Statements
| Statement of Assets and Liabilities | ||||
| June 30, 2024 | ||||
| Assets | ||||
| Investment in securities, at value - See accompanying schedule: | ||||
Unaffiliated issuers (cost $25,062,813) | $ | 25,409,128 | ||
Fidelity Central Funds (cost $743,825) | 743,825 | |||
Other affiliated issuers (cost $10,955,090) | 11,177,033 | |||
| Total Investment in Securities (cost $36,761,728) | $ | 37,329,986 | ||
| Cash | 55,639 | |||
| Receivable for investments sold | 9,765 | |||
| Receivable for fund shares sold | 181,591 | |||
| Dividends receivable | 94,034 | |||
| Interest receivable | 307,865 | |||
| Distributions receivable from Fidelity Central Funds | 5,113 | |||
| Prepaid expenses | 1,495 | |||
| Receivable from investment adviser for expense reductions | 8,371 | |||
| Other receivables | 261 | |||
Total assets | 37,994,120 | |||
| Liabilities | ||||
| Payable for investments purchased | ||||
Regular delivery | $ | 147,651 | ||
Delayed delivery | 115,000 | |||
| Payable for fund shares redeemed | 80 | |||
| Distributions payable | 184,666 | |||
| Accrued management fee | 27,090 | |||
| Distribution and service plan fees payable | 158 | |||
| Other affiliated payables | 4,588 | |||
| Audit fee payable | 153,618 | |||
| Other payables and accrued expenses | 3,491 | |||
| Total liabilities | 636,342 | |||
| Net Assets | $ | 37,357,778 | ||
| Net Assets consist of: | ||||
| Paid in capital | $ | 36,605,955 | ||
| Total accumulated earnings (loss) | 751,823 | |||
| Net Assets | $ | 37,357,778 | ||
| Net Asset Value and Maximum Offering Price | ||||
| Class A : | ||||
Net Asset Value and redemption price per share ($109,243 ÷ 10,642 shares)(a) | $ | 10.27 | ||
| Maximum offering price per share (100/94.25 of $10.27) | $ | 10.90 | ||
| Class C : | ||||
Net Asset Value and offering price per share ($108,337 ÷ 10,554 shares)(a) | $ | 10.27 | ||
| Class I : | ||||
Net Asset Value, offering price and redemption price per share ($37,031,257 ÷ 3,607,324 shares) | $ | 10.27 | ||
| Class L : | ||||
Net Asset Value and redemption price per share ($108,941 ÷ 10,612 shares) | $ | 10.27 | ||
| Maximum offering price per share (100/95.75 of $10.27) | $ | 10.73 | ||
(a)Redemption price per share is equal to net asset value less any applicable contingent deferred sales charge. | ||||
| Statement of Operations | ||||
Year ended June 30, 2024 | ||||
| Investment Income | ||||
| Dividends (including $1,027,665 earned from affiliated issuers) | $ | 1,140,817 | ||
| Interest | 1,285,553 | |||
| Income from Fidelity Central Funds | 94,828 | |||
| Total income | 2,521,198 | |||
| Expenses | ||||
| Management fee | $ | 373,632 | ||
| Transfer agent fees | 28,337 | |||
| Distribution and service plan fees | 1,823 | |||
| Accounting fees and expenses | 14,109 | |||
| Custodian fees and expenses | 4,341 | |||
| Independent trustees' fees and expenses | 14,804 | |||
| Registration fees | 116,479 | |||
| Audit | 190,918 | |||
| Legal | 2,905 | |||
| Offering | 168,664 | |||
| Miscellaneous | 3,136 | |||
| Total expenses before interest expense | 919,148 | |||
| Total expenses before reductions | 919,148 | |||
| Expense reductions | (457,251) | |||
| Total expenses after reductions | 461,897 | |||
| Net Investment income (loss) | 2,059,301 | |||
| Realized and Unrealized Gain (Loss) | ||||
| Net realized gain (loss) on: | ||||
| Investment Securities: | ||||
| Unaffiliated issuers | (22,529) | |||
| Fidelity Central Funds | 14 | |||
| Total net realized gain (loss) | (22,515) | |||
| Change in net unrealized appreciation (depreciation) on: | ||||
| Investment Securities: | ||||
| Unaffiliated issuers | 245,404 | |||
| Affiliated issuers | 193,268 | |||
| Total change in net unrealized appreciation (depreciation) | 438,672 | |||
| Net gain (loss) | 416,157 | |||
| Net increase (decrease) in net assets resulting from operations | $ | 2,475,458 | ||
| Statement of Changes in Net Assets | ||||
Year ended June 30, 2024 | For the period May 19, 2023 (commencement of operations) through June 30, 2023 | |||
| Increase (Decrease) in Net Assets | ||||
| Operations | ||||
| Net investment income (loss) | $ | 2,059,301 | $ | 86,234 |
| Net realized gain (loss) | (22,515) | (9,786) | ||
| Change in net unrealized appreciation (depreciation) | 438,672 | 129,586 | ||
| Net increase (decrease) in net assets resulting from operations | 2,475,458 | 206,034 | ||
| Distributions to shareholders | (1,869,261) | (60,409) | ||
| Share transactions - net increase (decrease) | 11,295,187 | 25,310,769 | ||
| Total increase (decrease) in net assets | 11,901,384 | 25,456,394 | ||
| Net Assets | ||||
| Beginning of period | 25,456,394 | - | ||
| End of period | $ | 37,357,778 | $ | 25,456,394 |
Financial Highlights
Fidelity Multi-Strategy Credit Fund Class A |
| Years ended June 30, | 2024 | 2023 A | ||
Selected Per-Share Data | ||||
| Net asset value, beginning of period | $ | 10.06 | $ | 10.00 |
| Income from Investment Operations | ||||
Net investment income (loss) B,C | .680 | .031 | ||
| Net realized and unrealized gain (loss) | .140 | .050 | ||
| Total from investment operations | .820 | .081 | ||
| Distributions from net investment income | (.610) | (.021) | ||
| Total distributions | (.610) | (.021) | ||
| Net asset value, end of period | $ | 10.27 | $ | 10.06 |
Total Return D,E,F | 8.41 % | .81% | ||
Ratios to Average Net Assets C,G,H | ||||
| Expenses before reductions | 3.32% | 3.70% I,J | ||
| Expenses net of fee waivers, if any | 1.75 % | 1.84% I | ||
| Expenses net of all reductions | 1.74% | 1.84% I | ||
| Net investment income (loss) | 6.70% | 2.67% I | ||
| Supplemental Data | ||||
| Net assets, end of period (000 omitted) | $ | 109 | $ | 101 |
Portfolio turnover rate K | 36 % | 3% L |
AFor the period May 19, 2023 (commencement of operations) through June 30, 2023.
BCalculated based on average shares outstanding during the period.
CNet investment income (loss) is affected by the timing of the declaration of dividends by any underlying mutual funds or exchange-traded funds (ETFs). Net investment income (loss) of any mutual funds or ETFs is not included in the Fund's net investment income (loss) ratio.
DTotal returns for periods of less than one year are not annualized.
ETotal returns would have been lower if certain expenses had not been reduced during the applicable periods shown.
FTotal returns do not include the effect of the sales charges.
GFees and expenses of any underlying mutual funds or exchange-traded funds (ETFs) are not included in the Fund's expense ratio. The Fund indirectly bears its proportionate share of these expenses. For additional expense information related to investments in Fidelity Central Funds, please refer to the "Investments in Fidelity Central Funds" note found in the Notes to Financial Statements section of the most recent Annual or Semi-Annual report.
HExpense ratios reflect operating expenses of the class. Expenses before reductions do not reflect amounts reimbursed, waived, or reduced through arrangements with the investment adviser, brokerage services, or other offset arrangements, if applicable, and do not represent the amount paid by the class during periods when reimbursements, waivers or reductions occur.
IAnnualized.
JAudit fees are not annualized.
KAmount does not include the portfolio activity of any underlying mutual funds or exchange-traded funds (ETFs).
LAmount not annualized.
Fidelity Multi-Strategy Credit Fund Class C |
| Years ended June 30, | 2024 | 2023 A | ||
Selected Per-Share Data | ||||
| Net asset value, beginning of period | $ | 10.06 | $ | 10.00 |
| Income from Investment Operations | ||||
Net investment income (loss) B,C | .603 | .023 | ||
| Net realized and unrealized gain (loss) | .141 | .050 | ||
| Total from investment operations | .744 | .073 | ||
| Distributions from net investment income | (.534) | (.013) | ||
| Total distributions | (.534) | (.013) | ||
| Net asset value, end of period | $ | 10.27 | $ | 10.06 |
Total Return D,E,F | 7.60 % | .73% | ||
Ratios to Average Net Assets B,G,H | ||||
| Expenses before reductions | 4.07% | 4.42% I,J | ||
| Expenses net of fee waivers, if any | 2.50 % | 2.56% I | ||
| Expenses net of all reductions | 2.49% | 2.56% I | ||
| Net investment income (loss) | 5.95% | 1.95% I | ||
| Supplemental Data | ||||
| Net assets, end of period (000 omitted) | $ | 108 | $ | 101 |
Portfolio turnover rate K | 36 % | 3% L |
AFor the period May 19, 2023 (commencement of operations) through June 30, 2023.
BNet investment income (loss) is affected by the timing of the declaration of dividends by any underlying mutual funds or exchange-traded funds (ETFs). Net investment income (loss) of any mutual funds or ETFs is not included in the Fund's net investment income (loss) ratio.
CCalculated based on average shares outstanding during the period.
DTotal returns for periods of less than one year are not annualized.
ETotal returns would have been lower if certain expenses had not been reduced during the applicable periods shown.
FTotal returns do not include the effect of the contingent deferred sales charge.
GExpense ratios reflect operating expenses of the class. Expenses before reductions do not reflect amounts reimbursed, waived, or reduced through arrangements with the investment adviser, brokerage services, or other offset arrangements, if applicable, and do not represent the amount paid by the class during periods when reimbursements, waivers or reductions occur.
HFees and expenses of any underlying mutual funds or exchange-traded funds (ETFs) are not included in the Fund's expense ratio. The Fund indirectly bears its proportionate share of these expenses. For additional expense information related to investments in Fidelity Central Funds, please refer to the "Investments in Fidelity Central Funds" note found in the Notes to Financial Statements section of the most recent Annual or Semi-Annual report.
IAnnualized.
JAudit fees are not annualized.
KAmount does not include the portfolio activity of any underlying mutual funds or exchange-traded funds (ETFs).
LAmount not annualized.
Fidelity Multi-Strategy Credit Fund Class I |
| Years ended June 30, | 2024 | 2023 A | ||
Selected Per-Share Data | ||||
| Net asset value, beginning of period | $ | 10.06 | $ | 10.00 |
| Income from Investment Operations | ||||
Net investment income (loss) B,C | .700 | .034 | ||
| Net realized and unrealized gain (loss) | .146 | .050 | ||
| Total from investment operations | .846 | .084 | ||
| Distributions from net investment income | (.636) | (.024) | ||
| Total distributions | (.636) | (.024) | ||
| Net asset value, end of period | $ | 10.27 | $ | 10.06 |
Total Return D,E | 8.68 % | .84% | ||
Ratios to Average Net Assets C,F,G | ||||
| Expenses before reductions | 3.07% | 3.66% H,I | ||
| Expenses net of fee waivers, if any | 1.55 % | 1.60% H | ||
| Expenses net of all reductions | 1.54% | 1.60% H | ||
| Net investment income (loss) | 6.90% | 2.91% H | ||
| Supplemental Data | ||||
| Net assets, end of period (000 omitted) | $ | 37,031 | $ | 25,154 |
Portfolio turnover rate J | 36 % | 3% K |
AFor the period May 19, 2023 (commencement of operations) through June 30, 2023.
BCalculated based on average shares outstanding during the period.
CNet investment income (loss) is affected by the timing of the declaration of dividends by any underlying mutual funds or exchange-traded funds (ETFs). Net investment income (loss) of any mutual funds or ETFs is not included in the Fund's net investment income (loss) ratio.
DTotal returns for periods of less than one year are not annualized.
ETotal returns would have been lower if certain expenses had not been reduced during the applicable periods shown.
FFees and expenses of any underlying mutual funds or exchange-traded funds (ETFs) are not included in the Fund's expense ratio. The Fund indirectly bears its proportionate share of these expenses. For additional expense information related to investments in Fidelity Central Funds, please refer to the "Investments in Fidelity Central Funds" note found in the Notes to Financial Statements section of the most recent Annual or Semi-Annual report.
GExpense ratios reflect operating expenses of the class. Expenses before reductions do not reflect amounts reimbursed, waived, or reduced through arrangements with the investment adviser, brokerage services, or other offset arrangements, if applicable, and do not represent the amount paid by the class during periods when reimbursements, waivers or reductions occur.
HAnnualized.
IAudit fees are not annualized.
JAmount does not include the portfolio activity of any underlying mutual funds or exchange-traded funds (ETFs).
KAmount not annualized.
Fidelity Multi-Strategy Credit Fund Class L |
| Years ended June 30, | 2024 | 2023 A | ||
Selected Per-Share Data | ||||
| Net asset value, beginning of period | $ | 10.06 | $ | 10.00 |
| Income from Investment Operations | ||||
Net investment income (loss) B,C | .654 | .029 | ||
| Net realized and unrealized gain (loss) | .141 | .049 | ||
| Total from investment operations | .795 | .078 | ||
| Distributions from net investment income | (.585) | (.018) | ||
| Total distributions | (.585) | (.018) | ||
| Net asset value, end of period | $ | 10.27 | $ | 10.06 |
Total Return D,E,F | 8.14 % | .78% | ||
Ratios to Average Net Assets C,G,H | ||||
| Expenses before reductions | 3.57% | 3.94% I,J | ||
| Expenses net of fee waivers, if any | 2.00 % | 2.09% I | ||
| Expenses net of all reductions | 1.99% | 2.09% I | ||
| Net investment income (loss) | 6.45% | 2.42% I | ||
| Supplemental Data | ||||
| Net assets, end of period (000 omitted) | $ | 109 | $ | 101 |
Portfolio turnover rate K | 36 % | 3% L |
AFor the period May 19, 2023 (commencement of operations) through June 30, 2023.
BCalculated based on average shares outstanding during the period.
CNet investment income (loss) is affected by the timing of the declaration of dividends by any underlying mutual funds or exchange-traded funds (ETFs). Net investment income (loss) of any mutual funds or ETFs is not included in the Fund's net investment income (loss) ratio.
DTotal returns for periods of less than one year are not annualized.
ETotal returns would have been lower if certain expenses had not been reduced during the applicable periods shown.
FTotal returns do not include the effect of the sales charges.
GFees and expenses of any underlying mutual funds or exchange-traded funds (ETFs) are not included in the Fund's expense ratio. The Fund indirectly bears its proportionate share of these expenses. For additional expense information related to investments in Fidelity Central Funds, please refer to the "Investments in Fidelity Central Funds" note found in the Notes to Financial Statements section of the most recent Annual or Semi-Annual report.
HExpense ratios reflect operating expenses of the class. Expenses before reductions do not reflect amounts reimbursed, waived, or reduced through arrangements with the investment adviser, brokerage services, or other offset arrangements, if applicable, and do not represent the amount paid by the class during periods when reimbursements, waivers or reductions occur.
IAnnualized.
JAudit fees are not annualized.
KAmount does not include the portfolio activity of any underlying mutual funds or exchange-traded funds (ETFs).
LAmount not annualized.
Notes to Financial Statements
For the period ended June 30, 2024
1. Organization.
Fidelity Multi-Strategy Credit Fund (the Fund) is registered under the Investment Company Act of 1940, as amended (the 1940 Act), as a non-diversified, closed-end management investment company organized as a Delaware statutory trust on October 4, 2022. The Fund has elected to operate as an interval fund, and has the authority to issue an unlimited number of common shares at $.001 per share par value. The Fund engages in a continuous offering of shares, and will offer to make quarterly repurchases of shares at net asset value, reduced by any applicable repurchase fee. The Fund does not currently intend to list its Shares for trading on any national securities exchange.
The Fund offers Class A, Class C, Class I and Class L common shares, each of which has equal rights as to assets and voting privileges. Each class has exclusive voting rights with respect to matters that affect that class. Class C shares will automatically convert to Class A shares after a holding period of eight years from the initial date of purchase.
The Fund's investment objective is to provide a high level of current income and capital appreciation through investments across a variety of high income-oriented asset classes including both liquid and illiquid securities. The Fund employs a multi-credit strategy that seeks to opportunistically rotate across the entire credit spectrum throughout the market cycle. The Fund will specifically seek to allocate investments based on the current and expected macro environment among (i) foundational credit, which includes direct lending and liquid credit (leveraged loans and high yield bonds), and (ii) opportunistic credit, which include stressed and distressed investments (distressed debt, special situations and rescue financing) and opportunistic investments (convertible bonds, preferred stock, real estate debt, commercial mortgage-backed securities, investment grade bonds, collateralized loan obligations (CLOs) and emerging markets debt) (together, (Credit Instruments)). Under normal circumstances, the Fund will invest at least 80% of its assets in Credit Instruments. The Fund may invest in additional types of Credit Instruments and strategies in the future.
2. Investments in Fidelity Central Funds.
Funds may invest in Fidelity Central Funds, which are open-end investment companies generally available only to other investment companies and accounts managed by the investment adviser and its affiliates. The Schedule of Investments lists any Fidelity Central Funds held as an investment as of period end, but does not include the underlying holdings of each Fidelity Central Fund. An investing fund indirectly bears its proportionate share of the expenses of the underlying Fidelity Central Funds.
Based on its investment objective, each Fidelity Central Fund may invest or participate in various investment vehicles or strategies that are similar to those of the investing fund. These strategies are consistent with the investment objectives of the investing fund and may involve certain economic risks which may cause a decline in value of each of the Fidelity Central Funds and thus a decline in the value of the investing fund.
| Fidelity Central Fund | Investment Manager | Investment Objective | Investment Practices | Expense RatioA |
| Fidelity Money Market Central Funds | Fidelity Management & Research Company LLC (FMR) | Each fund seeks to obtain a high level of current income consistent with the preservation of capital and liquidity. | Short-term Investments | Less than .005% |
A Expenses expressed as a percentage of average net assets and are as of each underlying Central Fund's most recent annual or semi-annual shareholder report.
A complete unaudited list of holdings for each Fidelity Central Fund is available upon request or at the Securities and Exchange Commission website at www.sec.gov. In addition, the financial statements of the Fidelity Central Funds which contain the significant accounting policies (including investment valuation policies) of those funds, and are not covered by the Report of Independent Registered Public Accounting Firm, are available on the Securities and Exchange Commission website or upon request.
3. Investment in Fidelity Private Credit Fund.
The Fund invests in Class I of Fidelity Private Credit Fund (FPCF), which is a non-diversified, closed-end management investment company which has elected to be regulated as a business development company (BDC) under the 1940 Act. FPCF is managed by the Fund's investment adviser.
Based on its investment objective, FPCF may invest or participate in various investments or strategies that are similar to those in which the Fund may invest or participate. These strategies are consistent with the investment objectives of the Fund and may involve certain economic risks which may cause a decline in value of FPCF and thus a decline in the value of the Fund. FPCF's investment objective is to generate current income and, to a lesser extent, long-term capital appreciation. FPCF seeks to achieve its investment objective by investing primarily in directly originated loans to private companies but also in liquid credit investments, like broadly syndicated loans, and other select private credit investments. FPCF will generally seek to invest in loans that carry variable (i.e., floating) interest rates. Under normal circumstances, FPCF will invest at least 80% of its total assets in private credit investments. Specific private investments may include: (a) directly originated first lien loans, senior secured revolving lines of credit, term loans and delayed draw term loans, (b) directly originated second lien, last out senior, secured or unsecured mezzanine term loans and delayed draw term loans, (c) club deals (investments generally comprised from a small group of lenders), and broadly syndicated leveraged loans (investments generally arranged or underwritten by investment banks or other intermediaries), and (d) other debt (collectively referred to as Private Credit).
The Schedule of Investments lists FPCF as an investment as of period end, but does not include the underlying holdings of FPCF. The Fund indirectly bears its proportionate share of the expenses of FPCF. The annualized expense ratio for Class I of FPCF for the six month period ended June 30, 2024 was 6.67%.
4. Significant Accounting Policies.
The Fund is an investment company and applies the accounting and reporting guidance of the Financial Accounting Standards Board (FASB) Accounting Standards Codification Topic 946 Financial Services - Investment Companies. The financial statements have been prepared in conformity with accounting principles generally accepted in the United States of America (GAAP), which require management to make certain estimates and assumptions at the date of the financial statements. Actual results could differ from those estimates. Subsequent events, if any, through the date that the financial statements were issued have been evaluated in the preparation of the financial statements. The Fund's Schedule of Investments lists any underlying funds but does not include the underlying holdings of these funds. The following summarizes the significant accounting policies of the Fund:
Investment Valuation. Investments are valued as of 4:00 p.m. Eastern time on the last calendar day of the period. The Board of Trustees (the Board) has designated the Fund's investment adviser as the valuation designee responsible for the fair valuation function and performing fair value determinations as needed. The investment adviser has established a Fair Value Committee (the Committee) to carry out the day-to-day fair valuation responsibilities and has adopted policies and procedures to govern the fair valuation process and the activities of the Committee. In accordance with these fair valuation policies and procedures, which have been approved by the Board, the Fund attempts to obtain prices from one or more third party pricing services or brokers to value its investments. When current market prices, quotations or currency exchange rates are not readily available or reliable, investments will be fair valued in good faith by the Committee, in accordance with the policies and procedures. Factors used in determining fair value vary by investment type and may include market or investment specific events, transaction data, estimated cash flows, and market observations of comparable investments. The frequency that the fair valuation procedures are used cannot be predicted and they may be utilized to a significant extent. The Committee manages the Fund's fair valuation practices and maintains the fair valuation policies and procedures. The Fund's investment adviser reports to the Board information regarding the fair valuation process and related material matters.
The Fund categorizes the inputs to valuation techniques used to value its investments into a disclosure hierarchy consisting of three levels as shown below:
Level 1 - unadjusted quoted prices in active markets for identical investments
Level 2 - other significant observable inputs (including quoted prices for similar investments, interest rates, prepayment speeds, etc.)
Level 3 - unobservable inputs (including the Fund's own assumptions based on the best information available)
Valuation techniques used to value the Fund's investments by major category are as follows:
Debt securities, including restricted securities, are valued based on evaluated prices received from third party pricing services or from brokers who make markets in such securities. Corporate bonds, bank loan obligations, preferred securities and U.S. government and government agency obligations are valued by pricing services who utilize matrix pricing which considers yield or price of bonds of comparable quality, coupon, maturity and type or by broker-supplied prices. Commercial mortgage securities are valued by pricing services who utilize matrix pricing which considers prepayment speed assumptions, attributes of the collateral, yield or price of bonds of comparable quality, coupon, maturity and type or by broker-supplied prices. When independent prices are unavailable or unreliable, debt securities may be valued utilizing pricing methodologies which consider similar factors that would be used by third party pricing services. Debt securities are generally categorized as Level 2 in the hierarchy but may be Level 3 depending on the circumstances. The Fund invests a significant portion of its assets in below investment grade securities. The value of these securities can be more volatile due to changes in the credit quality of the issuer and is sensitive to changes in economic, market and regulatory conditions.
Equity securities, including restricted securities, for which market quotations are readily available, are valued at the last reported sale price or official closing price as reported by a third party pricing service on the primary market or exchange on which they are traded and are categorized as Level 1 in the hierarchy. In the event there were no sales during the day or closing prices are not available, securities are valued at the last quoted bid price or may be valued using the last available price and are generally categorized as Level 2 in the hierarchy. For equity securities, including restricted securities, where observable inputs are limited, assumptions about market activity and risk are used and these securities may be categorized as Level 3 in the hierarchy.
Investments in underlying funds, including the Fidelity Central Funds, are valued at their closing net asset value (NAV) each business day and are categorized as Level 1 in the hierarchy.
Fidelity Private Credit Fund is valued at its net asset value (NAV) each month end and is categorized as Level 2 in the hierarchy.
Changes in valuation techniques may result in transfers in or out of an assigned level within the disclosure hierarchy. The aggregate value of investments by input level as of June 30, 2024 is included at the end of the Fund's Schedule of Investments.
Investment Transactions and Income. For financial reporting purposes, the Fund's investment holdings and NAV include trades executed through the end of the last business day of the period. The NAV per share for processing shareholder transactions is calculated as of the close of business of the New York Stock Exchange (NYSE), normally 4:00 p.m. Eastern time and includes trades executed through the end of the prior business day. Gains and losses on securities sold are determined on the basis of identified cost. Dividend income is recorded on the ex-dividend date, except for certain dividends from foreign securities where the ex-dividend date may have passed, which are recorded as soon as the Fund is informed of the ex-dividend date. Non-cash dividends included in dividend income, if any, are recorded at the fair market value of the securities received. Income and capital gain distributions from Fidelity Central Funds, if any, are recorded on the ex-dividend date. Interest income is accrued as earned and includes coupon interest and amortization of premium and accretion of discount on debt securities as applicable. Debt obligations may be placed on non-accrual status and related interest income may be reduced by ceasing current accruals and writing off interest receivables when the collection of all or a portion of interest has become doubtful based on consistently applied procedures. A debt obligation is removed from non-accrual status when the issuer resumes interest payments or when collectability of interest is reasonably assured. The Fund earns certain fees in connection with its floating rate loan purchasing activities. These fees are in addition to interest payments earned and may include amendment fees, consent fees and prepayment fees. These fees are recorded as Interest in the accompanying financial statements.
Class Allocations and Expenses. Investment income, realized and unrealized capital gains and losses, common expenses of a fund, and certain fund-level expense reductions, if any, are allocated daily on a pro-rata basis to each class based on the relative net assets of each class to the total net assets of a fund. Each class differs with respect to transfer agent and distribution and service plan fees incurred, as applicable. Certain expense reductions may also differ by class, if applicable. For the reporting period, the allocated portion of income and expenses to each class as a percent of its average net assets may vary due to the timing of recording these transactions in relation to fluctuating net assets of the classes. Expenses directly attributable to a fund are charged to that fund. Expenses attributable to more than one fund are allocated among the respective funds on the basis of relative net assets or other appropriate methods. Expenses included in the accompanying financial statements reflect the expenses of that fund and do not include any expenses associated with any underlying funds. Although not included in a fund's expenses, a fund indirectly bears its proportionate share of these expenses through the net asset value of each underlying fund. Expense estimates are accrued in the period to which they relate and adjustments are made when actual amounts are known.
Organization and Offering Expenses. Organizational costs include, among other things, the cost of organizing as a Delaware statutory trust, including the cost of legal services and other fees pertaining to the Fund's organization. These costs were expensed as incurred by the Fund and were paid by Fidelity Diversifying Solutions LLC (the investment adviser) on behalf of the Fund as presented in the Statement of Operations. The Fund's initial offering costs include, among other things, legal, printing and other expenses pertaining to this offering. These initial offering costs are amortized over twelve months on a straight-line basis starting with the commencement of operations. Ongoing offering costs are expensed as incurred. All organizational and offering costs of the Fund paid by the investment adviser shall be subject to reimbursement pursuant to the Expense Limitation Agreement as described in the Expense Reductions note.
Income Tax Information and Distributions to Shareholders. Each year, the Fund intends to qualify as a regulated investment company under Subchapter M of the Internal Revenue Code, including distributing substantially all of its taxable income and realized gains. As a result, no provision for U.S. Federal income taxes is required. As of June 30, 2024, the Fund did not have any unrecognized tax benefits in the financial statements; nor is the Fund aware of any tax positions for which it is reasonably possible that the total amounts of unrecognized tax benefits will significantly change in the next twelve months. The Fund files a U.S. federal tax return, in addition to state and local tax returns as required. The Fund's federal income tax returns are subject to examination by the Internal Revenue Service (IRS) for a period of three fiscal years after they are filed. State and local tax returns may be subject to examination for an additional fiscal year depending on the jurisdiction.
Distributions are declared and recorded on the ex-dividend date. Income and capital gain distributions are declared separately for each class. Income and capital gain distributions are determined in accordance with income tax regulations, which may differ from GAAP.
Capital accounts within the financial statements are adjusted for permanent book-tax differences. These adjustments have no impact on net assets or the results of operations. Capital accounts are not adjusted for temporary book-tax differences which will reverse in a subsequent period.
Book-tax differences are primarily due to passive foreign investment companies (PFIC), market discount, contingent interest, equity-debt classifications, certain conversion ratio adjustments, partnerships, capital loss carryforwards and losses deferred due to wash sales.
As of period end, the cost and unrealized appreciation (depreciation) in securities, and derivatives if applicable, for federal income tax purposes were as follows:
| Gross unrealized appreciation | $878,087 |
| Gross unrealized depreciation | (129,592) |
| Net unrealized appreciation (depreciation) | $748,495 |
| Tax Cost | $36,581,491 |
The tax-based components of distributable earnings as of period end were as follows:
| Undistributed ordinary income | $18,277 |
| Capital loss carryforward | $(14,764) |
| Net unrealized appreciation (depreciation) on securities and other investments | $748,495 |
Capital loss carryforwards are only available to offset future capital gains of the Fund to the extent provided by regulations and may be limited. The capital loss carryforward information presented below, including any applicable limitation, is estimated as of fiscal period end and is subject to adjustment.
Short-term | $(14,764) |
Long-term | (-) |
| Total capital loss carryforward | $(14,764) |
The tax character of distributions paid was as follows:
| June 30, 2024 | June 30, 2023A | |
| Ordinary Income | $1,869,261 | $ 60,409 |
| Total | $1,869,261 | $ 60,409 |
A For the period May 19, 2023 (commencement of operations) through June 30, 2023.
Delayed Delivery Transactions and When-Issued Securities. During the period, certain Funds transacted in securities on a delayed delivery or when-issued basis. Payment and delivery may take place after the customary settlement period for that security. The price of the underlying securities and the date when the securities will be delivered and paid for are fixed at the time the transaction is negotiated. Securities purchased on a delayed delivery or when-issued basis are identified as such in the Schedule of Investments. Compensation for interest forgone in the purchase of a delayed delivery or when-issued debt security may be received. With respect to purchase commitments, each applicable Fund identifies securities as segregated in its records with a value at least equal to the amount of the commitment. Payables and receivables associated with the purchases and sales of delayed delivery securities having the same coupon, settlement date and broker are offset. Delayed delivery or when-issued securities that have been purchased from and sold to different brokers are reflected as both payables and receivables in the Statement of Assets and Liabilities under the caption "Delayed delivery", as applicable. Losses may arise due to changes in the value of the underlying securities or if the counterparty does not perform under the contract's terms, or if the issuer does not issue the securities due to political, economic, or other factors.
Restricted Securities (including Private Placements). Funds may invest in securities that are subject to legal or contractual restrictions on resale. These securities generally may be resold in transactions exempt from registration or to the public if the securities are registered. Disposal of these securities may involve time-consuming negotiations and expense, and prompt sale at an acceptable price may be difficult. Information regarding restricted securities held at period end is included at the end of the Schedule of Investments, if applicable.
Loans and Other Direct Debt Instruments. Direct debt instruments are interests in amounts owed to lenders by corporate or other borrowers. These instruments may be in the form of loans, trade claims or other receivables and may include standby financing commitments such as revolving credit facilities that obligate a fund to supply additional cash to the borrower on demand. Loans may be acquired through assignment, participation, or may be made directly to a borrower. Such instruments are presented in the Bank Loan Obligations section in the Schedule of Investments. Certain funds may also invest in unfunded loan commitments, which are contractual obligations for future funding. Information regarding unfunded commitments is included at the end of the Schedule of Investments, if applicable.
5. Purchases and Sales of Investments.
Purchases and sales of securities, other than short-term securities, U.S. government securities and in-kind transactions, as applicable, are noted in the table below.
| Purchases ($) | Sales ($) | |
| Fidelity Multi-Strategy Credit Fund | 18,001,083 | 8,231,475 |
6. Fees and Other Transactions with Affiliates.
Management Fee. The investment adviser and its affiliates provide the Fund with investment management related services for which the Fund pays a monthly management fee of 1.25% of average managed assets. Managed assets are defined as the total assets of the Fund (including any assets attributable to money borrowed for investment purposes) minus the sum of the Fund's accrued liabilities (other than money borrowed for investment purposes). The investment adviser waives a portion of its management fee as described in the Expense Reductions note.
Distribution and Service Plan Fees. In accordance with Rule 12b-1 of the 1940 Act, the Fund has adopted separate Distribution and Service Plans for each class of shares. Certain classes pay Fidelity Distributors Company LLC (FDC), an affiliate of the investment adviser, separate Distribution and Service Fees, each of which is based on an annual percentage of each class' average net assets. In addition, FDC may pay financial intermediaries for selling shares of the Fund and providing shareholder support services. For the period, the Distribution and Service Fee rates, total fees and amounts retained by FDC were as follows:
| Distribution Fee | Service Fee | Total Fees ($) | Retained by FDC ($) | |
| Class A | - % | .25% | 261 | 261 |
| Class C | .75% | .25% | 1,040 | 1,040 |
| Class L | .25% | .25% | 522 | 254 |
| 1,823 | 1,555 |
Sales Load. FDC may receive a front-end sales charge of up to 5.75% and 4.25% for selling Class A shares and Class L shares, respectively, some of which is paid to financial intermediaries for selling shares of the Fund. Depending on the holding period, FDC may receive contingent deferred sales charges of up to 1.00% on Class C redemptions. For the period, there were no sales charge amounts retained by FDC.
Transfer Agent Fees. Fidelity Investments Institutional Operations Company, Inc., (FIIOC), an affiliate of the investment adviser, is the transfer, dividend disbursing and shareholder servicing agent for each class of the Fund. FIIOC receives an asset-based fee of each class's average net assets. Each class does not pay transfer agent fees with respect to the portion of its assets invested in other Fidelity-managed products. FIIOC pays for typesetting, printing and mailing of shareholder reports, except proxy statements. For the period, transfer agent fees for each class were as follows:
| Amount ($) | % of Class-Level Average Net Assets | |
| Class A | 98 | .09 |
| Class C | 98 | .09 |
| Class I | 28,043 | .09 |
| Class L | 98 | .09 |
28,337 |
Accounting Fees. Fidelity Service Company, Inc. (FSC), an affiliate of the investment adviser, maintains the Fund's accounting records. The accounting fee is based on the level of average net assets for each month. For the period, the fees were equivalent to the following annual rates:
| % of Average Net Assets | |
| Fidelity Multi-Strategy Credit Fund | .05 |
Brokerage Commissions. A portion of portfolio transactions were placed with brokerage firms which are affiliates of the investment adviser. Brokerage commissions are included in net realized gain (loss) and change in net unrealized appreciation (depreciation) in the Statement of Operations. The commissions paid to these affiliated firms were as follows:
| Amount ($) | |
| Fidelity Multi-Strategy Credit Fund | 6 |
Interfund Trades. Funds may purchase from or sell securities to other Fidelity Funds under procedures adopted by the Board. The procedures have been designed to ensure these interfund trades are executed in accordance with Rule 17a-7 of the 1940 Act. Any interfund trades are included within the respective purchases and sales amounts shown in the Purchases and Sales of Investments note. During the period, there were no interfund trades.
7. Expense Reductions.
The investment adviser has contractually agreed to waive the Fund's management fee with respect to the portion of the Fund's assets invested in Fidelity Private Credit Fund until October 31, 2025. During the period, this waiver reduced the Fund's management fee by $120,328.
The investment adviser and the Fund have entered into an Expense Limitation Agreement, whereby the investment adviser has contractually agreed to reimburse expenses of each class to the extent annual operating expenses exceed certain levels of class-level average net assets as presented in the table below. Ordinary operating expenses for each class include pricing and bookkeeping fees, transfer agent fees, organization and offering expenses, fees and expenses of the independent Trustees, legal fees related to the organization and offering of the Fund (whether incurred by counsel to the Fund or the investment adviser), and related costs associated with legal, regulatory compliance and investor relations. Ordinary operating expenses for each class exclude the following: (1) management fee; (2) portfolio transaction and other investment-related costs (including brokerage commissions, dealer and underwriter spreads, prime broker fees and expenses, fees and expenses associated with the Fund's securities lending program, and dividend expenses related to short sales); (3) interest, financing and structuring costs and expenses for borrowings and line(s) of credit; (4) taxes; (5) the Fund's proportional share of expenses related to co investments; (6) acquired fund fees and expenses (including fees and expenses associated with a wholly owned subsidiary); (7) distribution and service plan fees, if any; (8) expenses of printing and mailing proxy materials to shareholders of the Fund; (9) all other expenses incidental to holding meetings of the Fund's shareholders, including proxy solicitations therefor; and (10) such non-recurring and/or extraordinary as may arise, including actions, suits or proceedings to which the Fund is or is threatened to be a party and the legal obligation that the Fund may have to indemnify the Fund's Trustees and officers with respect thereto.
The following classes were in reimbursement during the period:
| Expense Limitations | Reimbursement ($) | |
| Class A | .70% | 1,214 |
| Class C | .70% | 1,209 |
| Class I | .70% | 331,008 |
| Class L | .70% | 1,214 |
334,645 |
In consideration of the investment adviser's agreement to waive its management fee and/or reimburse ordinary operating expenses, the Fund has agreed to repay the investment adviser in the amount of any waived management fees and reimbursed operating expenses for each class subject to the limitation that a reimbursement will be made only if and to the extent that: (i) it is payable not more than three years from the date on which the applicable waiver or expense payment was made by the investment adviser; and (ii) the investment adviser recoupment does not cause total annual operating expenses (on an annualized basis and net of any reimbursements received during such fiscal year) during the applicable quarter to exceed the expense limitation for each class; provided that the investment adviser may waive its right to receive all or a portion of any recoupment in any particular calendar month. The Fund's obligation to make investment adviser recoupment shall automatically become a liability of the Fund on the last business day of the applicable calendar month, except to the extent the investment adviser has waived its right to receive such payment for the applicable month. The investment adviser recoupment for each class will not cause operating expenses for that class to exceed the expense limitation either (i) at the time of the waiver or (ii) at the time of recoupment. During the period, there was no investment adviser recoupment.
This Expense Limitation Agreement will remain in place through October 31, 2025.
Through arrangements with the Fund's custodian, credits realized as a result of certain uninvested cash balances were used to reduce the Fund's expenses. During the period, custodian credits reduced the Fund's expenses by $2,278.
8. Distributions to Shareholders.
Distributions to shareholders of each class were as follows:
Year ended June 30, 2024 | Year ended June 30, 2023A | |
| Fidelity Multi-Strategy Credit Fund | ||
| Distributions to shareholders | ||
| Class A | $6,283 | $214 |
| Class C | 5,475 | 128 |
| Class I | 1,851,488 | 59,882 |
| Class L | 6,015 | 185 |
Total | $1,869,261 | $60,409 |
A For the period May 19, 2023 (commencement of operations) through June 30, 2023.
9. Share Transactions.
Share transactions for each class were as follows and may contain automatic conversions between classes:
| Shares | Shares | Dollars | Dollars | |
Year ended June 30, 2024 | Year ended June 30, 2023 A | Year ended June 30, 2024 | Year ended June 30, 2023 A | |
| Fidelity Multi-Strategy Credit Fund | ||||
| Class A | ||||
| Shares sold | 621 | 10,019 | $6,285 | $100,194 |
| Reinvestment of distributions | - | 2 | - | 20 |
| Net increase (decrease) | 621 | 10,021 | $6,285 | $100,214 |
| Class C | ||||
| Shares sold | 541 | 10,013 | $5,476 | $100,128 |
| Net increase (decrease) | 541 | 10,013 | $5,476 | $100,128 |
| Class I | ||||
| Shares sold | 1,133,247 | 2,500,449 | $11,555,007 | $25,003,864 |
| Reinvestment of distributions | - | 639 | - | 6,379 |
Shares redeemed in repurchase offers | (27,011) | - | (277,597) | - |
| Net increase (decrease) | 1,106,236 | 2,501,088 | $11,277,410 | $25,010,243 |
| Class L | ||||
| Shares sold | 594 | 10,017 | $6,016 | $100,172 |
| Reinvestment of distributions | - | 1 | - | 12 |
| Net increase (decrease) | 594 | 10,018 | $6,016 | $100,184 |
A For the period May 19, 2023 (commencement of operations) through June 30, 2023.
As an interval fund, subject to applicable law, the Fund will conduct quarterly repurchase offers for between 5% and 25% of the Fund's outstanding shares at net asset value. Quarterly repurchases will occur in the months of March, June, September and December. The Fund's first repurchase offer commenced on August 28, 2023. Repurchase offer results for each class during the period were as follows:
| Commencement date of repurchase offer period | Repurchase pricing date | Number of shares tendered | Tendered shares as a % of outstanding shares | Number of tendered shares repurchased | Tendered shares repurchased as a % of outstanding shares | Repurchase price ($) | Total amount of repurchases ($) | |
| Fidelity Multi-Strategy Credit Fund | ||||||||
| Class A | 8/28/23 | 9/25/23 | None | N/A | N/A | N/A | N/A | N/A |
| Class A | 11/28/23 | 12/26/23 | None | N/A | N/A | N/A | N/A | N/A |
| Class A | 2/27/24 | 3/26/24 | None | N/A | N/A | N/A | N/A | N/A |
| Class A | 5/29/24 | 6/26/24 | None | N/A | N/A | N/A | N/A | N/A |
| Class C | 8/28/23 | 9/25/23 | None | N/A | N/A | N/A | N/A | N/A |
| Class C | 11/28/23 | 12/26/23 | None | N/A | N/A | N/A | N/A | N/A |
| Class C | 2/27/24 | 3/26/24 | None | N/A | N/A | N/A | N/A | N/A |
| Class C | 5/29/24 | 6/26/24 | None | N/A | N/A | N/A | N/A | N/A |
| Class I | 8/28/23 | 9/25/23 | None | N/A | N/A | N/A | N/A | N/A |
| Class I | 11/28/23 | 12/26/23 | None | N/A | N/A | N/A | N/A | N/A |
| Class I | 2/27/24 | 3/26/24 | 9,718 | .30% | 9,718 | .30% | $10.29 | $100,000 |
| Class I | 5/29/24 | 6/26/24 | 17,293 | .48% | 17,293 | .48% | $10.27 | $177,597 |
| Class L | 8/28/23 | 9/25/23 | None | N/A | N/A | N/A | N/A | N/A |
| Class L | 11/28/23 | 12/26/23 | None | N/A | N/A | N/A | N/A | N/A |
| Class L | 2/27/24 | 3/26/24 | None | N/A | N/A | N/A | N/A | N/A |
| Class L | 5/29/24 | 6/26/24 | None | N/A | N/A | N/A | N/A | N/A |
10. Other.
A fund's organizational documents provide former and current trustees and officers with a limited indemnification against liabilities arising in connection with the performance of their duties to the fund. In the normal course of business, a fund may also enter into contracts that provide general indemnifications. A fund's maximum exposure under these arrangements is unknown as this would be dependent on future claims that may be made against a fund. The risk of material loss from such claims is considered remote.
At the end of the period, the investment adviser or its affiliates were owners of record of more than 10% of the outstanding shares as follows:
| Fund | Affiliated % |
| Fidelity Multi-Strategy Credit Fund | 73% |
11. Risk and Uncertainties.
Many factors affect a fund's performance. Developments that disrupt global economies and financial markets, such as pandemics, epidemics, outbreaks of infectious diseases, war, terrorism, and environmental disasters, may significantly affect a fund's investment performance. The effects of these developments to a fund will be impacted by the types of securities in which a fund invests, the financial condition, industry, economic sector, and geographic location of an issuer, and a fund's level of investment in the securities of that issuer. Significant concentrations in security types, issuers, industries, sectors, and geographic locations may magnify the factors that affect a fund's performance.
Report of Independent Registered Public Accounting Firm
To the Board of Trustees and the Shareholders of Fidelity Multi-Strategy Credit Fund:
Opinion on the Financial Statements and Financial Highlights
We have audited the accompanying statement of assets and liabilities of Fidelity Multi-Strategy Credit Fund (the "Fund"), including the schedule of investments, as of June 30, 2024, the related statement of operations for the year then ended and the statement of changes in net assets and the financial highlights for the year then ended and for the period from May 19, 2023 (commencement of operations) through June 30, 2023, and the related notes. In our opinion, the financial statements and financial highlights present fairly, in all material respects, the financial position of the Fund as of June 30, 2024, and the results of its operations for the year then ended and the changes in its net assets and the financial highlights for the year then ended and for the period from May 19, 2023 (commencement of operations) through June 30, 2023, in conformity with accounting principles generally accepted in the United States of America.
Basis for Opinion
These financial statements and financial highlights are the responsibility of the Fund's management. Our responsibility is to express an opinion on the Fund's financial statements and financial highlights based on our audits. We are a public accounting firm registered with the Public Company Accounting Oversight Board (United States) (PCAOB) and are required to be independent with respect to the Fund in accordance with the U.S. federal securities laws and the applicable rules and regulations of the Securities and Exchange Commission and the PCAOB.
We conducted our audits in accordance with the standards of the PCAOB. Those standards require that we plan and perform the audit to obtain reasonable assurance about whether the financial statements and financial highlights are free of material misstatement, whether due to error or fraud. The Fund is not required to have, nor were we engaged to perform, an audit of its internal control over financial reporting. As part of our audits, we are required to obtain an understanding of internal control over financial reporting but not for the purpose of expressing an opinion on the effectiveness of the Fund's internal control over financial reporting. Accordingly, we express no such opinion.
Our audits included performing procedures to assess the risks of material misstatement of the financial statements and financial highlights, whether due to error or fraud, and performing procedures that respond to those risks. Such procedures included examining, on a test basis, evidence regarding the amounts and disclosures in the financial statements and financial highlights. Our audits also included evaluating the accounting principles used and significant estimates made by management, as well as evaluating the overall presentation of the financial statements and financial highlights. Our procedures included confirmation of securities owned as of June 30, 2024, by correspondence with the custodian, brokers, and agent banks; when replies were not received from brokers or agent banks, we performed other auditing procedures. We believe that our audits provide a reasonable basis for our opinion.
/s/ Deloitte & Touche LLP
Boston, Massachusetts
August 14, 2024
We have served as the auditor of one or more of the Fidelity investment companies since 1999.
Trustees and Officers
TRUSTEES AND OFFICERS
The Trustees, Members of the Advisory Board (if any), and officers of the trust and fund, as applicable, are listed below. The Board of Trustees governs the fund and is responsible for protecting the interests of shareholders. The Trustees are experienced executives who meet periodically throughout the year to oversee the fund's activities, review contractual arrangements with companies that provide services to the fund, oversee management of the risks associated with such activities and contractual arrangements, and review the fund's performance. If the interests of the fund and an underlying Fidelity® fund were to diverge, a conflict of interest could arise and affect how the Trustees and Members of the Advisory Board fulfill their fiduciary duties to the affected funds. Fidelity Diversifying Solutions LLC (FDS) has structured the fund to avoid these potential conflicts, although there may be situations where a conflict of interest is unavoidable. In such instances, FDS, the Trustees, and Members of the Advisory Board would take reasonable steps to minimize and, if possible, eliminate the conflict. Each of the Trustees oversees 13 funds.
The Trustees hold office without limit in time except that (a) any Trustee may resign; (b) any Trustee may be removed by written instrument, signed by at least two-thirds of the number of Trustees prior to such removal; (c) any Trustee who requests to be retired or who has become incapacitated by illness or injury may be retired by written instrument signed by a majority of the other Trustees; and (d) any Trustee may be removed at any special meeting of shareholders by a two-thirds vote of the outstanding voting securities of the trust. Each Trustee who is not an interested person (as defined in the 1940 Act) of the trust and the fund is referred to herein as an Independent Trustee. Each Independent Trustee shall retire not later than the last day of the calendar year in which his or her 75th birthday occurs. The Independent Trustees may waive this mandatory retirement age policy with respect to individual Trustees. Officers and Advisory Board Members hold office without limit in time, except that any officer or Advisory Board Member may resign or may be removed by a vote of a majority of the Trustees at any regular meeting or any special meeting of the Trustees. Except as indicated, each individual has held the office shown or other offices in the same company for the past five years.
The fund's Statement of Additional Information (SAI) includes more information about the Trustees. To request a free copy, call Fidelity at 1-800-544-8544 if you're an individual investing directly with Fidelity, call 1-800-835-5092 if you're a plan sponsor or participant with Fidelity as your recordkeeper or call 1-877-208-0098 on institutional accounts or if you're an advisor or invest through one.
Experience, Skills, Attributes, and Qualifications of the Trustees. The Board of Trustees has adopted a statement of policy that describes the experience, qualifications, attributes, and skills that are necessary and desirable for potential Independent Trustee candidates (Statement of Policy). The Board believes that each Trustee satisfied at the time he or she was initially elected or appointed a Trustee, and continues to satisfy, the standards contemplated by the Statement of Policy. The Board of Trustees also engages professional search firms to help identify potential Independent Trustee candidates who have the experience, qualifications, attributes, and skills consistent with the Statement of Policy. From time to time, additional criteria based on the composition and skills of the current Independent Trustees, as well as experience or skills that may be appropriate in light of future changes to board composition, business conditions, and regulatory or other developments, have also been considered by the professional search firms and the Board of Trustees. In addition, the Board takes into account the Trustees' commitment and participation in Board and committee meetings, as well as their leadership of standing and ad hoc committees throughout their tenure.
In determining that a particular Trustee was and continues to be qualified to serve as a Trustee, the Board has considered a variety of criteria, none of which, in isolation, was controlling. The Board believes that, collectively, the Trustees have balanced and diverse experience, qualifications, attributes, and skills, which allow the Board to operate effectively in governing the fund and protecting the interests of shareholders. Information about the specific experience, skills, attributes, and qualifications of each Trustee, which in each case led to the Board's conclusion that the Trustee should serve (or continue to serve) as a trustee of the fund, is provided below.
Board Structure and Oversight Function. David B. Jones is an interested person and currently serves as Chair. The Trustees have determined that an interested Chair is appropriate and benefits shareholders because an interested Chair has a personal and professional stake in the quality and continuity of services provided to the fund. Independent Trustees exercise their informed business judgment to appoint an individual of their choosing to serve as Chair, regardless of whether the Trustee happens to be independent or a member of management. The Independent Trustees have determined that they can act independently and effectively without having an Independent Trustee serve as Chair and that a key structural component for assuring that they are in a position to do so is for the Independent Trustees to constitute a substantial majority for the Board. The Independent Trustees also regularly meet in executive session.
Fidelity® funds are overseen by different Boards of Trustees. The fund's Board oversees Fidelity's alternative investment funds, and other Boards oversee Fidelity's investment-grade bond, money market, asset allocation, high income, and equity funds. The asset allocation funds may invest in Fidelity® funds overseen by the fund's Board. The use of separate Boards, each with its own committee structure, allows the Trustees of each group of Fidelity® funds to focus on the unique issues of the funds they oversee, including common research, investment, and operational issues. On occasion, the separate Boards establish joint committees to address issues of overlapping consequences for the Fidelity® funds overseen by each Board.
The Trustees primarily operate as a full Board, but have also established one standing committee, the Audit Committee, to facilitate the timely and efficient consideration of all matters of importance to the Trustees, the fund, and fund shareholders and to facilitate compliance with legal and regulatory requirements and oversight of the fund's activities and associated risks. The Board has charged FDS and its affiliates with (i) identifying events or circumstances the occurrence of which could have demonstrably adverse effects on the fund's business and/or reputation; (ii) implementing processes and controls to lessen the possibility that such events or circumstances occur or to mitigate the effects of such events or circumstances if they do occur; and (iii) creating and maintaining a system designed to evaluate continuously business and market conditions in order to facilitate the identification and implementation processes described in (i) and (ii) above. Because the day-to-day operations and activities of the fund are carried out by or through FDS, its affiliates, and other service providers, the fund's exposure to risks is mitigated but not eliminated by the processes overseen by the Trustees. Board oversight of different aspects of the fund's activities is exercised primarily through the full Board, but also through the Audit Committee. Appropriate personnel, including but not limited to the fund's Chief Compliance Officer (CCO), FDS's internal auditor, the independent accountants, the fund's Treasurer and portfolio management personnel, make periodic reports to the Board and Audit Committee, as appropriate, including an annual review of Fidelity's risk management program for the Fidelity® funds. The responsibilities of the Audit Committee, including its oversight responsibilities, are described further under "Standing Committees of the Trustees."
Interested Trustees*:
Correspondence intended for a Trustee who is an interested person may be sent to Fidelity Investments, 245 Summer Street, Boston, Massachusetts 02210.
Name, Year of Birth; Principal Occupations and Other Relevant Experience+
David B. Jones (1962)
Year of Election or Appointment: 2021
Trustee
Chair of the Board of Trustees
Mr. Jones also serves as Trustee of other Fidelity® funds. Prior to his retirement, Mr. Jones served in a variety of positions at Fidelity Investments (1982-2008), retiring as a Senior Vice President. His duties included new product development, serving as a liaison to the board of trustees of various Fidelity® funds, and development of policies and procedures for fund investments in derivatives and complex securities. He also served on the FMR Fair Value Committee, which is responsible for day-to-day valuation activities for various Fidelity® funds
* Determined to be an "Interested Trustee" by virtue of, among other things, his or her affiliation with the trust or various entities under common control with FDS.
+ The information includes the Trustee's principal occupation during the last five years and other information relating to the experience, attributes, and skills relevant to the Trustee's qualifications to serve as a Trustee, which led to the conclusion that the Trustee should serve as a Trustee for the fund.
Independent Trustees:
Correspondence intended for an Independent Trustee may be sent to Fidelity Investments, P.O. Box 55235, Boston, Massachusetts 02205-5235.
Name, Year of Birth; Principal Occupations and Other Relevant Experience+
Jennifer M. Birmingham (1971)
Year of Election or Appointment: 2021
Trustee
Ms. Birmingham also serves as Trustee of other Fidelity® funds. Ms. Birmingham serves as Managing Director of Princeton University Investment Company (PRINCO) (2010-present). Previously, Ms. Birmingham served in a variety of positions at Deutsche Bank Asset Management (2002-2010), including Managing Director, Global CFO of DB Advisors and Deutsche Insurance Asset Management, Americas CFO of DWS Americas and various legal entities (2005-2010). Prior to Deutsche Bank, Ms. Birmingham was an employee of Investors Bank and Trust Company (1997-2002) and Deloitte & Touche LLP (1993-1997).
Matthew J. Conti (1966)
Year of Election or Appointment: 2021
Trustee
Mr. Conti also serves as Trustee of other Fidelity® funds. Prior to his retirement, Mr. Conti served in a variety of positions at Fidelity Investments, including as a portfolio manager to certain Fidelity® funds (2000-2018) and research analyst (1995-2003). Mr. Conti serves as a member of the Board of Directors of the Rose Kennedy Greenway Conservancy (2021-present).
Tara C. Kenney (1960)
Year of Election or Appointment: 2021
Trustee
Ms. Kenney also serves as Trustee of other Fidelity® funds. Prior to her retirement, Ms. Kenney served as Senior Vice President of Boston Common Asset Management (2017-2020). Previously, Ms. Kenney served as Managing Director in a variety of roles for Deutsche Asset Management (2003-2016) as well as Scudder Investments where she was a Portfolio Manager (1995-2003). Currently, Ms. Kenney serves as a Board member for a number of non-profit organizations and academic institutions, including Catholic Charities USA (2017-present) and the Kellogg Institute for International Studies at the University of Notre Dame (2002-present). Ms. Kenney is also an adjunct professor of finance at the University of Notre Dame.
+ The information includes the Trustee's principal occupation during the last five years and other information relating to the experience, attributes, and skills relevant to the Trustee's qualifications to serve as a Trustee, which led to the conclusion that the Trustee should serve as a Trustee for the fund.
Advisory Board Members and Officers:
Correspondence intended for a Member of the Advisory Board (if any) may be sent to Fidelity Investments, P.O. Box 55235, Boston, Massachusetts 02205-5235. Correspondence intended for an officer may be sent to Fidelity Investments, 245 Summer Street, Boston, Massachusetts 02210.
Name, Year of Birth; Principal Occupations+
Joseph Benedetti (1965)
Year of Election or Appointment: 2021
Assistant Secretary
Mr. Benedetti also serves as Assistant Secretary of other funds. Mr. Benedetti is a Senior Vice President, Deputy General Counsel (2020-present) and is an employee of Fidelity Investments (2020-present). Mr. Benedetti serves as Assistant Secretary of Fidelity Diversifying Solutions LLC (investment adviser firm, 2022-present) and Secretary of certain other Fidelity entities. Previously, Mr. Benedetti was Secretary of Fidelity Diversifying Solutions LLC (2021-2022). Prior to joining Fidelity, Mr. Benedetti was Assistant General Counsel at Invesco (investment adviser firm, 2019-2020) and Senior Vice President and Managing Counsel at OppenheimerFunds Inc. (investment adviser firm, 2017-2019).
Heather Bonner (1977)
Year of Election or Appointment: 2023
President and Treasurer
Ms. Bonner also serves as an officer of other funds. Ms. Bonner is a Senior Vice President (2022-present) and is an employee of Fidelity Investments (2022-present). Ms. Bonner serves as Senior Vice President, Vice President, Treasurer, or Director of certain Fidelity entities. Prior to joining Fidelity, Ms. Bonner was Managing Director at AQR Capital Management (2013-2022) and Treasurer and Principal Financial Officer of the AQR Funds (2013-2022).
Craig S. Brown (1977)
Year of Election or Appointment: 2021
Assistant Treasurer
Mr. Brown also serves as an officer of other funds. Mr. Brown is a Vice President (2015-present) and is an employee of Fidelity Investments. Mr. Brown serves as Assistant Treasurer of FIMM, LLC (2021-present). Previously, Mr. Brown was Assistant Treasurer of certain Fidelity® funds (2019-2022).
John J. Burke III (1964)
Year of Election or Appointment: 2021
Chief Financial Officer
Mr. Burke also serves as Chief Financial Officer of other funds. Mr. Burke is Head of Fidelity Fund and Investment Operations (2018-present) and is an employee of Fidelity Investments. Mr. Burke serves as President, Executive Vice President, or Director of certain Fidelity entities. Previously Mr. Burke was Head of Asset Management Investment Operations (2012-2018).
Margaret Carey (1973)
Year of Election or Appointment: 2023
Secretary and Chief Legal Officer (CLO)
Ms. Carey also serves as an officer of other funds and as CLO of certain Fidelity entities. Ms. Carey is a Senior Vice President, Deputy General Counsel (2019-present) and is an employee of Fidelity Investments.
Nati Davidi (1971)
Year of Election or Appointment: 2021
Assistant Secretary
Ms. Davidi also serves as Assistant Secretary of other funds. Ms. Davidi is a Vice President, Associate General Counsel (2013-present) and is an employee of Fidelity Investments. Previously, Ms. Davidi was Assistant Secretary of the North Carolina Capital Management Trust (2016-2022).
Jonathan Davis (1968)
Year of Election or Appointment: 2021
Assistant Treasurer
Mr. Davis also serves as an officer of other funds. Mr. Davis is a Vice President (2006-present) and is an employee of Fidelity Investments. Mr. Davis serves as Assistant Treasurer or Director of certain Fidelity entities.
Laura M. Del Prato (1964)
Year of Election or Appointment: 2021
Assistant Treasurer
Ms. Del Prato also serves as an officer of other funds. Ms. Del Prato is a Senior Vice President (2017-present) and is an employee of Fidelity Investments. Ms. Del Prato serves as Senior Vice President, Vice President, Assistant Treasurer, or Director of certain Fidelity entities. Previously, Ms. Del Prato was President and Treasurer of The North Carolina Capital Management Trust: Cash Portfolio and Term Portfolio (2018-2020).
Colm A. Hogan (1973)
Year of Election or Appointment: 2021
Assistant Treasurer
Mr. Hogan also serves as an officer of other funds. Mr. Hogan is a Vice President (2016-present) and is an employee of Fidelity Investments. Mr. Hogan serves as Assistant Treasurer of certain Fidelity entities. Previously, Mr. Hogan was Deputy Treasurer of certain Fidelity® funds (2016-2020) and Assistant Treasurer of certain Fidelity® funds (2016-2018).
William Irving (1964)
Year of Election or Appointment: 2023
Vice President
Mr. Irving also serves as Vice President of other funds. Mr. Irving is Head of Fidelity Asset Management Solutions (2022-present) and is an employee of Fidelity Investments. Mr. Irving serves as President and Director of Fidelity Diversifying Solutions LLC (investment adviser firm, 2023-present) and President or Director of certain other Fidelity entities. Previously, Mr. Irving was Chief Investment Officer (CIO) in the Global Asset Allocation division (2020-2022). Prior to that, he was Managing Director of Research in the Global Asset Allocation division (2018-2020) and portfolio manager of certain Fidelity® funds (2004-2018).
Chris Maher (1972)
Year of Election or Appointment: 2021
Assistant Treasurer
Mr. Maher also serves as an officer of other funds. Mr. Maher is a Vice President (2008-present) and is an employee of Fidelity Investments. Mr. Maher serves as Assistant Treasurer of certain Fidelity entities. Previously, Mr. Maher was Assistant Treasurer of certain funds (2013-2020).
Ksenia Portnoy (1980)
Year of Election or Appointment: 2021
Chief Compliance Officer
Ms. Portnoy also serves as Chief Compliance Officer of other funds. Ms. Portnoy is a Senior Vice President of Asset Management Compliance (2021-present) and is an employee of Fidelity Investments (2021-present). Prior to joining Fidelity, Ms. Portnoy worked in the asset management divisions of Morgan Stanley Investment Management (investment adviser firm, 2020-2021) and Mizuho (investment adviser firm, 2015-2020).
Brett Segaloff (1972)
Year of Election or Appointment: 2021
Anti-Money Laundering (AML) Officer
Mr. Segaloff also serves as AML Officer of other funds. Mr. Segaloff is a Vice President (2022-present) and is an employee of Fidelity Investments. Mr. Segaloff serves as Anti Money Laundering Compliance Officer or Anti Money Laundering/Bank Secrecy Act Compliance Officer of certain Fidelity entities.
Stacie M. Smith (1974)
Year of Election or Appointment: 2021
Assistant Treasurer
Ms. Smith also serves as an officer of other funds. Ms. Smith is a Senior Vice President (2016-present) and is an employee of Fidelity Investments. Ms. Smith serves as Assistant Treasurer of certain Fidelity entities and has served in other fund officer roles.
Jim Wegmann (1979)
Year of Election or Appointment: 2021
Assistant Treasurer
Mr. Wegmann also serves as an officer of other funds. Mr. Wegmann is a Vice President (2016-present) and is an employee of Fidelity Investments. Mr. Wegmann serves as Assistant Treasurer of FIMM, LLC (2021-present). Previously, Mr. Wegmann was Assistant Treasurer of certain Fidelity® funds (2019-2021).
+ The information includes principal occupation during the last five years.
As a shareholder, you incur two types of costs: (1) transaction costs, which may include sales charges (loads) on purchase payments or redemption proceeds, as applicable and (2) ongoing costs, which generally include management fees, distribution and/or service (12b-1) fees and other Fund expenses. This Example is intended to help you understand your ongoing costs (in dollars) of investing in a fund and to compare these costs with the ongoing costs of investing in other mutual funds.
| The Example is based on an investment of $1,000 invested at the beginning of the period and held for the entire period (January 1, 2024 to June 30, 2024). |
Actual Expenses
The first line of the accompanying table provides information about actual account values and actual expenses. You may use the information in this line, together with the amount you invested, to estimate the expenses that you paid over the period. Simply divide your account value by $1,000.00 (for example, an $8,600 account value divided by $1,000.00 = 8.6), then multiply the result by the number in the first line for a class/Fund under the heading entitled "Expenses Paid During Period" to estimate the expenses you paid on your account during this period. If any fund is a shareholder of any underlying mutual funds or exchange-traded funds (ETFs) (the Underlying Funds), such fund indirectly bears its proportional share of the expenses of the Underlying Funds in addition to the direct expenses incurred presented in the table. These fees and expenses are not included in the annualized expense ratio used to calculate the expense estimate in the table below.
Hypothetical Example for Comparison Purposes
The second line of the accompanying table provides information about hypothetical account values and hypothetical expenses based on the actual expense ratio and an assumed rate of return of 5% per year before expenses, which is not the actual return. The hypothetical account values and expenses may not be used to estimate the actual ending account balance or expenses you paid for the period. You may use this information to compare the ongoing costs of investing in the Fund and other funds. To do so, compare this 5% hypothetical example with the 5% hypothetical examples that appear in the shareholder reports of the other funds. If any fund is a shareholder of any Underlying Funds, such fund indirectly bears its proportional share of the expenses of the Underlying Funds in addition to the direct expenses as presented in the table. These fees and expenses are not included in the annualized expense ratio used to calculate the expense estimate in the table below.
Please note that the expenses shown in the table are meant to highlight your ongoing costs only and do not reflect any transaction costs. Therefore, the second line of the table is useful in comparing ongoing costs only, and will not help you determine the relative total costs of owning different funds. In addition, if these transactional costs were included, your costs would have been higher.
Annualized Expense Ratio- A(including interest expense) | Annualized Expense Ratio- A (excluding interest expense) | Beginning Account Value January 1, 2024 | Ending Account Value June 30, 2024 | Expenses Paid During Period- C January 1, 2024 to June 30, 2024 | |||||||
| Fidelity® Multi-Strategy Credit Fund | |||||||||||
| Class A | 1.75% | 1.75% | |||||||||
| Actual (including interest expense) | $ 1,000 | $ 1,031.10 | $ 8.84 | ||||||||
| Actual (excluding interest expense) | $ 1,000 | $ 1,028.10 | $ 8.82 | ||||||||
Hypothetical-B (including interest expense) | $ 1,000 | $ 1,016.16 | $ 8.77 | ||||||||
Hypothetical-B (excluding interest expense) | $ 1,000 | $ 1,016.16 | $ 8.77 | ||||||||
| Class C | 2.50% | 2.50% | |||||||||
| Actual (including interest expense) | $ 1,000 | $ 1,027.30 | $ 12.60 | ||||||||
| Actual (excluding interest expense) | $ 1,000 | $ 1,024.30 | $ 12.58 | ||||||||
Hypothetical-B (including interest expense) | $ 1,000 | $ 1,012.43 | $ 12.51 | ||||||||
Hypothetical-B (excluding interest expense) | $ 1,000 | $ 1,012.43 | $ 12.51 | ||||||||
| Class I | 1.58% | 1.58% | |||||||||
| Actual (including interest expense) | $ 1,000 | $ 1,032.40 | $ 7.98 | ||||||||
| Actual (excluding interest expense) | $ 1,000 | $ 1,029.40 | $ 7.97 | ||||||||
Hypothetical-B (including interest expense) | $ 1,000 | $ 1,017.01 | $ 7.92 | ||||||||
Hypothetical-B (excluding interest expense) | $ 1,000 | $ 1,017.01 | $ 7.92 | ||||||||
| Class L | 2.00% | 2.00% | |||||||||
| Actual (including interest expense) | $ 1,000 | $ 1,029.80 | $ 10.09 | ||||||||
| Actual (excluding interest expense) | $ 1,000 | $ 1,026.80 | $ 10.08 | ||||||||
Hypothetical-B (including interest expense) | $ 1,000 | $ 1,014.92 | $ 10.02 | ||||||||
Hypothetical-B (excluding interest expense) | $ 1,000 | $ 1,014.92 | $ 10.02 | ||||||||
A Annualized expense ratio reflects expenses net of applicable fee waivers.
B 5% return per year before expenses
C Expenses are equal to the annualized expense ratio, multiplied by the average account value over the period, multiplied by 182/ 366 (to reflect the one-half year period). The fees and expenses of any Underlying Funds are not included in each annualized expense ratio.
Distribution Reinvestment Plan
The Fund has adopted an amended and restated distribution reinvestment plan, pursuant to which the Fund will reinvest all cash dividends declared by the Board on behalf of Shareholders who do not elect to receive their dividends in cash as provided below. As a result, if the Board authorizes, and the Fund declares, a cash dividend or other distribution, then Shareholders who have not opted out of the Dividend Reinvestment Plan (DRP) will have their cash distributions automatically reinvested in additional Shares as described below, rather than receiving the cash dividend or other distribution. Distributions on fractional Shares will be credited to each participating Shareholder's account to three decimal places.
No action is required on the part of a registered Shareholder to have his, her or its cash dividend or other distribution reinvested in Shares. Shareholders can elect to "opt out" of the DRP.
If any Shareholder initially elects not to participate, they may later become a participant by contacting Fidelity Investments Institutional Operations Company LLC, including any delegate (the "Plan Administrator"), at alternatives@fmr.com. Participation in the DRP will begin with the next distribution payable after acceptance of a participant's subscription. Shares will be purchased under the DRP as of the first calendar day of the month following the record date of the distribution.
If a Shareholder seeks to terminate its participation in the DRP, notice of termination must be received by the Plan Administrator five business days in advance of the first calendar day of the next month in order for a Shareholder's termination to be effective for such month. Any transfer of Shares by a participant to a non-participant will terminate participation in the DRP with respect to the transferred Shares. If a participating Shareholder elects to tender its Shares in full pursuant to a repurchase offer and such full tender is accepted by the Fund, any Shares issued to it under the Plan subsequent to the expiration of the repurchase offer will be considered part of its prior tender, and the Shareholder's participation in the Plan will be terminated as of the expiration date of the applicable repurchase offer. Any distributions to be paid to such Shareholder on or after such date will be paid in cash on the scheduled distribution payment date.
If a Shareholder elects to opt out of the DRP, the Shareholder will receive any distributions the Fund declares in cash. There will be no sales load charged for Shareholders to participate in the DRP. If Shares are held by a broker or other financial intermediary, a Shareholder may change his, her or its election by notifying the broker or other financial intermediary of the election.
The purchase price for Shares purchased under the DRP will be equal to the most recent available NAV per Share for such Shares at the time the distribution is payable. Shares issued pursuant to the DRP will have the same voting rights as the Shares offered pursuant to this prospectus. Shareholders will not pay transaction related charges when purchasing Shares under the DRP, but all outstanding Class A, Class C, and Class L Shares, including those purchased under the DRP, will be subject to ongoing distribution and/or shareholder servicing fees. Shares acquired through the Fund's DRP, reinvestment of dividends or capital gain distributions are not subject to a contingent deferred sales charge.
All correspondence concerning the DRP should be directed to the Plan Administrator at alternatives@fmr.com. Certain transactions can be performed by calling the number 817-474-1001.
Distributions
(Unaudited)The dividend and capital gains distributions for the fund(s) are available on Fidelity.com or Institutional.Fidelity.com.
A total of 5.30% of the dividends distributed during the fiscal year was derived from interest on U.S. Government securities which is generally exempt from state income tax.
The fund designates $398,280 of distributions paid in the calendar year 2023 as qualifying to be taxed as interest-related dividends for nonresident alien shareholders.
The fund designates $920,306 of distributions paid during the fiscal year ended 2024 as qualifying to be taxed as section 163(j) interest dividends.
The fund will notify shareholders in January 2025 of amounts for use in preparing 2024 income tax returns.
 |
1.9910148.101
MSC-ANN-0824