UNITED STATES
SECURITIES AND EXCHANGE COMMISSION
Washington, D.C. 20549
FORM N-CSR
CERTIFIED SHAREHOLDER REPORT OF REGISTERED
MANAGEMENT INVESTMENT COMPANIES
Investment Company Act file number 811-23840
Fidelity Cherry Street Trust
(Exact name of registrant as specified in charter)
245 Summer St., Boston, MA 02210
(Address of principal executive offices) (Zip code)
Margaret Carey, Secretary
245 Summer St.
Boston, Massachusetts 02210
(Name and address of agent for service)
Registrant's telephone number, including area code:
617-563-7000
Date of fiscal year end: | January 31 |
Date of reporting period: | July 31, 2023 |
Item 1.
Reports to Stockholders
Fidelity® Hedged Equity Central Fund
Semi-Annual Report
July 31, 2023


Contents
To view a fund's proxy voting guidelines and proxy voting record for the 12-month period ended June 30, visit http://www.fidelity.com/proxyvotingresults or visit the Securities and Exchange Commission's (SEC) web site at http://www.sec.gov.
You may also call 1-800-544-8544 to request a free copy of the proxy voting guidelines.
Standard & Poor's, S&P and S&P 500 are registered service marks of The McGraw-Hill Companies, Inc. and have been licensed for use by Fidelity Distributors Corporation.
Other third-party marks appearing herein are the property of their respective owners.
All other marks appearing herein are registered or unregistered trademarks or service marks of FMR LLC or an affiliated company. © 2023 FMR LLC. All rights reserved.
A fund files its complete schedule of portfolio holdings with the SEC for the first and third quarters of each fiscal year on Form N-PORT. Forms N-PORT are available on the SEC's web site at http://www.sec.gov. A fund's Forms N-PORT may be reviewed and copied at the SEC's Public Reference Room in Washington, DC. Information regarding the operation of the SEC's Public Reference Room may be obtained by calling 1-800-SEC-0330.
Top Holdings (% of Fund's net assets) | ||
| Apple, Inc. | 7.5 | |
| Microsoft Corp. | 6.5 | |
| Alphabet, Inc. Class A | 3.7 | |
| Amazon.com, Inc. | 3.1 | |
| NVIDIA Corp. | 3.1 | |
| Tesla, Inc. | 2.0 | |
| Meta Platforms, Inc. Class A | 1.9 | |
| Berkshire Hathaway, Inc. Class B | 1.9 | |
| UnitedHealth Group, Inc. | 1.5 | |
| JPMorgan Chase & Co. | 1.5 | |
| 32.7 | ||
| Market Sectors (% of Fund's net assets) | ||
| Information Technology | 28.0 | |
| Health Care | 12.5 | |
| Financials | 12.5 | |
| Consumer Discretionary | 10.5 | |
| Communication Services | 8.3 | |
| Industrials | 7.9 | |
| Consumer Staples | 6.4 | |
| Energy | 4.1 | |
| Utilities | 2.6 | |
| Real Estate | 2.3 | |
| Materials | 2.2 | |
Asset Allocation (% of Fund's net assets) |
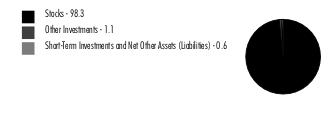 |
Showing Percentage of Net Assets
| Common Stocks - 97.3% | |||
| Shares | Value ($) | ||
| COMMUNICATION SERVICES - 8.3% | |||
| Diversified Telecommunication Services - 0.6% | |||
| Frontier Communications Parent, Inc. (a) | 6,201 | 112,920 | |
| Iridium Communications, Inc. | 1,833 | 96,324 | |
| Verizon Communications, Inc. | 73,128 | 2,492,202 | |
| 2,701,446 | |||
| Entertainment - 1.4% | |||
| Activision Blizzard, Inc. | 13,949 | 1,293,909 | |
| Madison Square Garden Sports Corp. | 589 | 125,310 | |
| Netflix, Inc. (a) | 5,717 | 2,509,591 | |
| Roku, Inc. Class A (a) | 1,323 | 127,365 | |
| Spotify Technology SA (a) | 560 | 83,670 | |
| The Walt Disney Co. (a) | 23,729 | 2,109,271 | |
| World Wrestling Entertainment, Inc. Class A | 1,293 | 135,765 | |
| 6,384,881 | |||
| Interactive Media & Services - 5.6% | |||
| Alphabet, Inc. Class A (a) | 128,618 | 17,070,181 | |
| IAC, Inc. (a) | 1,342 | 93,403 | |
| Meta Platforms, Inc. Class A (a) | 26,501 | 8,443,219 | |
| Pinterest, Inc. Class A (a) | 3,368 | 97,638 | |
| 25,704,441 | |||
| Media - 0.7% | |||
| Cable One, Inc. | 126 | 91,216 | |
| Comcast Corp. Class A | 55,558 | 2,514,555 | |
| Liberty Media Corp. Liberty SiriusXM Series A (a) | 4,856 | 153,935 | |
| Nexstar Broadcasting Group, Inc. Class A | 793 | 148,069 | |
| Sirius XM Holdings, Inc. (b) | 26,255 | 133,901 | |
| The Trade Desk, Inc. (a) | 1,080 | 98,561 | |
| 3,140,237 | |||
TOTAL COMMUNICATION SERVICES | 37,931,005 | ||
| CONSUMER DISCRETIONARY - 10.5% | |||
| Automobile Components - 0.1% | |||
| Autoliv, Inc. | 1,350 | 136,256 | |
| Gentex Corp. | 3,901 | 130,996 | |
| Lear Corp. | 1,519 | 235,080 | |
| Visteon Corp. (a) | 595 | 91,684 | |
| 594,016 | |||
| Automobiles - 2.2% | |||
| Ford Motor Co. | 72,622 | 959,337 | |
| Rivian Automotive, Inc. (a) | 2,484 | 68,658 | |
| Tesla, Inc. (a) | 33,840 | 9,049,831 | |
| 10,077,826 | |||
| Broadline Retail - 3.2% | |||
| Amazon.com, Inc. (a) | 106,440 | 14,228,899 | |
| Kohl's Corp. | 4,766 | 135,593 | |
| Macy's, Inc. | 6,732 | 111,684 | |
| 14,476,176 | |||
| Distributors - 0.1% | |||
| LKQ Corp. | 11,182 | 612,662 | |
| Diversified Consumer Services - 0.1% | |||
| H&R Block, Inc. | 2,667 | 89,638 | |
| Service Corp. International | 1,755 | 116,971 | |
| 206,609 | |||
| Hotels, Restaurants & Leisure - 1.9% | |||
| Airbnb, Inc. Class A (a) | 1,361 | 207,131 | |
| ARAMARK Holdings Corp. | 3,590 | 144,928 | |
| Booking Holdings, Inc. (a) | 549 | 1,630,969 | |
| Boyd Gaming Corp. | 2,893 | 197,650 | |
| Choice Hotels International, Inc. | 841 | 109,961 | |
| Churchill Downs, Inc. | 858 | 99,399 | |
| Hyatt Hotels Corp. Class A | 1,321 | 166,908 | |
| Light & Wonder, Inc. Class A (a) | 1,251 | 87,945 | |
| Marriott Vacations Worldwide Corp. | 1,128 | 144,959 | |
| McDonald's Corp. | 11,777 | 3,453,016 | |
| Penn Entertainment, Inc. (a) | 3,566 | 93,750 | |
| Planet Fitness, Inc. (a) | 1,276 | 86,181 | |
| Starbucks Corp. | 15,770 | 1,601,759 | |
| Texas Roadhouse, Inc. Class A | 2,122 | 236,709 | |
| Vail Resorts, Inc. | 680 | 160,133 | |
| Wendy's Co. | 4,710 | 101,218 | |
| Wyndham Hotels & Resorts, Inc. | 2,357 | 183,657 | |
| 8,706,273 | |||
| Household Durables - 0.4% | |||
| KB Home | 1,642 | 88,619 | |
| Leggett & Platt, Inc. | 4,097 | 119,878 | |
| NVR, Inc. (a) | 144 | 908,127 | |
| Taylor Morrison Home Corp. (a) | 1,770 | 85,703 | |
| Tempur Sealy International, Inc. | 4,369 | 194,988 | |
| Toll Brothers, Inc. | 3,349 | 269,025 | |
| TopBuild Corp. (a) | 356 | 97,519 | |
| 1,763,859 | |||
| Specialty Retail - 2.0% | |||
| AutoNation, Inc. (a) | 1,044 | 168,063 | |
| Best Buy Co., Inc. | 5,861 | 486,756 | |
| Burlington Stores, Inc. (a) | 946 | 168,029 | |
| Five Below, Inc. (a) | 428 | 89,170 | |
| Floor & Decor Holdings, Inc. Class A (a) | 1,404 | 161,249 | |
| Gap, Inc. (b) | 12,015 | 123,755 | |
| Lithia Motors, Inc. Class A (sub. vtg.) | 486 | 150,918 | |
| Murphy U.S.A., Inc. | 636 | 195,271 | |
| Penske Automotive Group, Inc. (b) | 1,420 | 229,216 | |
| RH (a) | 612 | 237,560 | |
| Ross Stores, Inc. | 10,765 | 1,234,100 | |
| The Home Depot, Inc. | 14,735 | 4,919,132 | |
| Ulta Beauty, Inc. (a) | 1,518 | 675,206 | |
| Valvoline, Inc. | 2,913 | 110,607 | |
| Williams-Sonoma, Inc. | 1,220 | 169,141 | |
| 9,118,173 | |||
| Textiles, Apparel & Luxury Goods - 0.5% | |||
| NIKE, Inc. Class B | 16,756 | 1,849,695 | |
| Ralph Lauren Corp. | 2,669 | 350,520 | |
| 2,200,215 | |||
TOTAL CONSUMER DISCRETIONARY | 47,755,809 | ||
| CONSUMER STAPLES - 6.4% | |||
| Beverages - 2.1% | |||
| Brown-Forman Corp. Class B (non-vtg.) | 12,499 | 882,429 | |
| Keurig Dr. Pepper, Inc. | 38,125 | 1,296,631 | |
| PepsiCo, Inc. | 20,326 | 3,810,312 | |
| The Coca-Cola Co. | 60,229 | 3,729,982 | |
| 9,719,354 | |||
| Consumer Staples Distribution & Retail - 1.8% | |||
| Albertsons Companies, Inc. | 5,775 | 125,491 | |
| BJ's Wholesale Club Holdings, Inc. (a) | 2,838 | 188,188 | |
| Casey's General Stores, Inc. | 801 | 202,381 | |
| Costco Wholesale Corp. | 5,708 | 3,200,304 | |
| Performance Food Group Co. (a) | 2,018 | 120,596 | |
| Target Corp. | 9,045 | 1,234,371 | |
| U.S. Foods Holding Corp. (a) | 3,917 | 167,373 | |
| Walmart, Inc. | 17,511 | 2,799,308 | |
| 8,038,012 | |||
| Food Products - 1.0% | |||
| Campbell Soup Co. | 18,256 | 836,490 | |
| Darling Ingredients, Inc. (a) | 1,404 | 97,227 | |
| Flowers Foods, Inc. | 8,142 | 201,189 | |
| Ingredion, Inc. | 924 | 102,804 | |
| Kellogg Co. | 20,781 | 1,390,041 | |
| Post Holdings, Inc. (a) | 2,579 | 219,989 | |
| The Hershey Co. | 6,610 | 1,528,959 | |
| 4,376,699 | |||
| Household Products - 1.5% | |||
| Colgate-Palmolive Co. | 25,342 | 1,932,581 | |
| Procter & Gamble Co. | 31,367 | 4,902,662 | |
| 6,835,243 | |||
TOTAL CONSUMER STAPLES | 28,969,308 | ||
| ENERGY - 4.1% | |||
| Energy Equipment & Services - 0.5% | |||
| Halliburton Co. | 23,098 | 902,670 | |
| Schlumberger Ltd. | 21,930 | 1,279,396 | |
| 2,182,066 | |||
| Oil, Gas & Consumable Fuels - 3.6% | |||
| Cheniere Energy, Inc. | 1,525 | 246,837 | |
| Chesapeake Energy Corp. | 1,434 | 120,944 | |
| Chevron Corp. | 28,414 | 4,650,235 | |
| Chord Energy Corp. | 563 | 88,301 | |
| CNX Resources Corp. (a) | 5,215 | 106,386 | |
| Diamondback Energy, Inc. | 7,594 | 1,118,748 | |
| Exxon Mobil Corp. | 58,399 | 6,262,709 | |
| Kinder Morgan, Inc. | 68,502 | 1,213,170 | |
| Marathon Oil Corp. | 41,540 | 1,091,256 | |
| Matador Resources Co. | 1,675 | 93,180 | |
| Murphy Oil Corp. | 3,818 | 165,205 | |
| Occidental Petroleum Corp. | 13,118 | 828,139 | |
| Ovintiv, Inc. | 4,950 | 228,146 | |
| PDC Energy, Inc. | 1,221 | 92,662 | |
| Range Resources Corp. | 3,796 | 119,308 | |
| Southwestern Energy Co. (a) | 14,756 | 95,619 | |
| 16,520,845 | |||
TOTAL ENERGY | 18,702,911 | ||
| FINANCIALS - 12.5% | |||
| Banks - 3.0% | |||
| Bank of America Corp. | 123,592 | 3,954,944 | |
| Bank OZK | 2,435 | 106,483 | |
| Columbia Banking Systems, Inc. | 5,601 | 125,182 | |
| Commerce Bancshares, Inc. | 2,382 | 126,675 | |
| Cullen/Frost Bankers, Inc. | 1,194 | 129,645 | |
| First Citizens Bancshares, Inc. | 70 | 100,191 | |
| First Horizon National Corp. | 9,490 | 129,349 | |
| JPMorgan Chase & Co. | 41,549 | 6,563,080 | |
| New York Community Bancorp, Inc. | 10,011 | 138,853 | |
| Pinnacle Financial Partners, Inc. | 2,746 | 208,421 | |
| Prosperity Bancshares, Inc. | 2,366 | 149,815 | |
| Synovus Financial Corp. | 3,040 | 103,056 | |
| U.S. Bancorp | 38,762 | 1,538,076 | |
| Webster Financial Corp. | 3,023 | 143,048 | |
| Wintrust Financial Corp. | 1,937 | 163,405 | |
| 13,680,223 | |||
| Capital Markets - 1.7% | |||
| Affiliated Managers Group, Inc. | 632 | 87,620 | |
| Ameriprise Financial, Inc. | 3,018 | 1,051,622 | |
| Ares Management Corp. | 2,124 | 210,743 | |
| Blackstone, Inc. | 2,599 | 272,349 | |
| Carlyle Group LP | 6,750 | 240,638 | |
| Charles Schwab Corp. | 21,338 | 1,410,442 | |
| Evercore, Inc. Class A | 1,544 | 208,533 | |
| Franklin Resources, Inc. | 15,240 | 445,618 | |
| Houlihan Lokey | 881 | 87,968 | |
| Interactive Brokers Group, Inc. | 2,172 | 189,681 | |
| Jefferies Financial Group, Inc. | 7,237 | 266,249 | |
| KKR & Co. LP | 4,294 | 254,978 | |
| Lazard Ltd. Class A | 2,746 | 96,385 | |
| LPL Financial | 621 | 142,433 | |
| Morgan Stanley | 25,973 | 2,378,088 | |
| SEI Investments Co. | 3,474 | 218,827 | |
| Stifel Financial Corp. | 2,622 | 166,602 | |
| Tradeweb Markets, Inc. Class A | 2,256 | 184,518 | |
| 7,913,294 | |||
| Consumer Finance - 0.5% | |||
| Ally Financial, Inc. | 7,279 | 222,301 | |
| American Express Co. | 10,264 | 1,733,384 | |
| SLM Corp. | 5,661 | 91,595 | |
| 2,047,280 | |||
| Financial Services - 5.0% | |||
| Apollo Global Management, Inc. | 2,914 | 238,103 | |
| Berkshire Hathaway, Inc. Class B (a) | 23,933 | 8,423,459 | |
| Block, Inc. Class A (a) | 2,586 | 208,251 | |
| Equitable Holdings, Inc. | 8,228 | 236,061 | |
| Fidelity National Information Services, Inc. | 12,692 | 766,343 | |
| FleetCor Technologies, Inc. (a) | 2,539 | 631,982 | |
| MasterCard, Inc. Class A | 12,030 | 4,743,188 | |
| PayPal Holdings, Inc. (a) | 17,042 | 1,292,124 | |
| The Western Union Co. | 10,021 | 122,056 | |
| Visa, Inc. Class A | 23,660 | 5,624,692 | |
| Voya Financial, Inc. | 2,854 | 211,938 | |
| 22,498,197 | |||
| Insurance - 2.1% | |||
| AFLAC, Inc. | 19,155 | 1,385,673 | |
| American Financial Group, Inc. | 2,253 | 273,987 | |
| Arch Capital Group Ltd. (a) | 10,078 | 782,960 | |
| Arthur J. Gallagher & Co. | 7,399 | 1,589,305 | |
| Axis Capital Holdings Ltd. | 1,909 | 105,224 | |
| Fidelity National Financial, Inc. | 8,046 | 315,162 | |
| Loews Corp. | 12,748 | 798,662 | |
| Markel Group, Inc. (a) | 261 | 378,374 | |
| Old Republic International Corp. | 6,741 | 185,849 | |
| Prudential Financial, Inc. | 18,601 | 1,794,810 | |
| Reinsurance Group of America, Inc. | 700 | 98,245 | |
| RenaissanceRe Holdings Ltd. | 525 | 98,049 | |
| Selective Insurance Group, Inc. | 1,045 | 107,834 | |
| Unum Group | 2,390 | 116,178 | |
| W.R. Berkley Corp. | 14,488 | 893,765 | |
| Willis Towers Watson PLC | 3,507 | 741,134 | |
| 9,665,211 | |||
| Mortgage Real Estate Investment Trusts - 0.2% | |||
| AGNC Investment Corp. | 13,132 | 133,815 | |
| Annaly Capital Management, Inc. | 9,228 | 185,391 | |
| Rithm Capital Corp. | 18,735 | 188,849 | |
| Starwood Property Trust, Inc. (b) | 21,443 | 444,728 | |
| 952,783 | |||
TOTAL FINANCIALS | 56,756,988 | ||
| HEALTH CARE - 12.5% | |||
| Biotechnology - 2.0% | |||
| AbbVie, Inc. | 24,667 | 3,689,690 | |
| Alnylam Pharmaceuticals, Inc. (a) | 651 | 127,205 | |
| BioMarin Pharmaceutical, Inc. (a) | 1,201 | 105,604 | |
| Gilead Sciences, Inc. | 21,941 | 1,670,588 | |
| Horizon Therapeutics PLC (a) | 1,131 | 113,405 | |
| Moderna, Inc. (a) | 4,143 | 487,465 | |
| Neurocrine Biosciences, Inc. (a) | 1,214 | 123,694 | |
| Regeneron Pharmaceuticals, Inc. (a) | 1,627 | 1,207,088 | |
| Seagen, Inc. (a) | 597 | 114,493 | |
| Vertex Pharmaceuticals, Inc. (a) | 4,350 | 1,532,679 | |
| 9,171,911 | |||
| Health Care Equipment & Supplies - 2.5% | |||
| Abbott Laboratories | 28,136 | 3,132,381 | |
| Align Technology, Inc. (a) | 1,406 | 531,313 | |
| Boston Scientific Corp. (a) | 38,730 | 2,008,151 | |
| DexCom, Inc. (a) | 6,876 | 856,475 | |
| Envista Holdings Corp. (a) | 2,896 | 99,651 | |
| GE Healthcare Holding LLC | 9,467 | 738,426 | |
| Globus Medical, Inc. (a) | 2,569 | 154,834 | |
| ICU Medical, Inc. (a) | 626 | 111,541 | |
| Inspire Medical Systems, Inc. (a) | 268 | 77,133 | |
| Intuitive Surgical, Inc. (a) | 5,476 | 1,776,414 | |
| Masimo Corp. (a) | 641 | 78,394 | |
| Penumbra, Inc. (a) | 365 | 110,726 | |
| ResMed, Inc. | 4,539 | 1,009,247 | |
| The Cooper Companies, Inc. | 2,049 | 801,692 | |
| 11,486,378 | |||
| Health Care Providers & Services - 2.9% | |||
| Acadia Healthcare Co., Inc. (a) | 1,795 | 141,859 | |
| Centene Corp. (a) | 12,311 | 838,256 | |
| Chemed Corp. | 315 | 164,143 | |
| CVS Health Corp. | 24,505 | 1,830,278 | |
| DaVita HealthCare Partners, Inc. (a) | 2,962 | 302,094 | |
| Encompass Health Corp. | 1,731 | 114,298 | |
| HCA Holdings, Inc. | 4,332 | 1,181,813 | |
| Humana, Inc. | 2,708 | 1,237,096 | |
| Tenet Healthcare Corp. (a) | 1,283 | 95,879 | |
| UnitedHealth Group, Inc. | 13,247 | 6,707,883 | |
| Universal Health Services, Inc. Class B | 2,024 | 281,255 | |
| 12,894,854 | |||
| Health Care Technology - 0.1% | |||
| Teladoc Health, Inc. (a)(b) | 3,563 | 106,071 | |
| Veeva Systems, Inc. Class A (a) | 1,033 | 210,959 | |
| 317,030 | |||
| Life Sciences Tools & Services - 1.3% | |||
| Avantor, Inc. (a) | 6,807 | 140,020 | |
| Bruker Corp. | 1,172 | 80,540 | |
| Danaher Corp. | 9,863 | 2,515,657 | |
| ICON PLC (a) | 357 | 89,753 | |
| QIAGEN NV (a) | 3,412 | 159,750 | |
| Thermo Fisher Scientific, Inc. | 5,531 | 3,034,638 | |
| 6,020,358 | |||
| Pharmaceuticals - 3.7% | |||
| Elanco Animal Health, Inc. (a) | 8,480 | 102,354 | |
| Eli Lilly & Co. | 10,232 | 4,650,956 | |
| Jazz Pharmaceuticals PLC (a) | 880 | 114,770 | |
| Johnson & Johnson | 35,174 | 5,892,700 | |
| Merck & Co., Inc. | 31,931 | 3,405,441 | |
| Pfizer, Inc. | 74,148 | 2,673,777 | |
| Royalty Pharma PLC | 3,467 | 108,794 | |
| 16,948,792 | |||
TOTAL HEALTH CARE | 56,839,323 | ||
| INDUSTRIALS - 7.9% | |||
| Aerospace & Defense - 1.6% | |||
| BWX Technologies, Inc. | 1,695 | 116,955 | |
| HEICO Corp. | 1,842 | 324,155 | |
| Howmet Aerospace, Inc. | 18,794 | 961,125 | |
| Lockheed Martin Corp. | 4,496 | 2,006,880 | |
| Raytheon Technologies Corp. | 22,847 | 2,008,937 | |
| The Boeing Co. (a) | 7,714 | 1,842,489 | |
| Woodward, Inc. | 950 | 114,361 | |
| 7,374,902 | |||
| Air Freight & Logistics - 0.6% | |||
| GXO Logistics, Inc. (a) | 1,556 | 104,361 | |
| United Parcel Service, Inc. Class B | 13,751 | 2,573,225 | |
| 2,677,586 | |||
| Building Products - 0.5% | |||
| Advanced Drain Systems, Inc. | 757 | 92,346 | |
| Allegion PLC | 5,914 | 691,110 | |
| Builders FirstSource, Inc. (a) | 728 | 105,145 | |
| Carlisle Companies, Inc. | 1,205 | 334,026 | |
| Fortune Brands Home & Security, Inc. | 3,351 | 238,156 | |
| Lennox International, Inc. | 901 | 331,063 | |
| Owens Corning | 1,857 | 259,961 | |
| Trex Co., Inc. (a) | 2,030 | 140,354 | |
| 2,192,161 | |||
| Commercial Services & Supplies - 0.8% | |||
| Cintas Corp. | 3,587 | 1,800,817 | |
| Clean Harbors, Inc. (a) | 644 | 107,071 | |
| Driven Brands Holdings, Inc. (a) | 3,610 | 93,391 | |
| RB Global, Inc. | 1,863 | 120,126 | |
| Republic Services, Inc. | 9,793 | 1,479,820 | |
| Tetra Tech, Inc. | 651 | 110,156 | |
| 3,711,381 | |||
| Construction & Engineering - 0.1% | |||
| AECOM | 2,532 | 220,284 | |
| Willscot Mobile Mini Holdings (a) | 2,049 | 98,250 | |
| 318,534 | |||
| Electrical Equipment - 0.4% | |||
| AMETEK, Inc. | 6,403 | 1,015,516 | |
| Hubbell, Inc. Class B | 659 | 205,608 | |
| nVent Electric PLC | 2,515 | 132,993 | |
| Regal Rexnord Corp. | 1,129 | 176,327 | |
| Sensata Technologies, Inc. PLC | 3,936 | 166,296 | |
| 1,696,740 | |||
| Ground Transportation - 0.8% | |||
| J.B. Hunt Transport Services, Inc. | 3,613 | 736,835 | |
| Knight-Swift Transportation Holdings, Inc. Class A | 3,024 | 183,708 | |
| Landstar System, Inc. | 997 | 202,979 | |
| Saia, Inc. (a) | 251 | 106,208 | |
| Uber Technologies, Inc. (a) | 4,830 | 238,892 | |
| Union Pacific Corp. | 9,096 | 2,110,454 | |
| XPO, Inc. (a) | 2,088 | 144,573 | |
| 3,723,649 | |||
| Industrial Conglomerates - 0.6% | |||
| Honeywell International, Inc. | 13,674 | 2,654,534 | |
| Machinery - 1.7% | |||
| AGCO Corp. | 720 | 95,832 | |
| Caterpillar, Inc. | 7,487 | 1,985,328 | |
| CNH Industrial NV | 6,009 | 86,289 | |
| Donaldson Co., Inc. | 1,368 | 85,951 | |
| Dover Corp. | 10,192 | 1,487,726 | |
| Graco, Inc. | 4,383 | 347,703 | |
| IDEX Corp. | 3,405 | 768,883 | |
| ITT, Inc. | 2,074 | 206,570 | |
| Lincoln Electric Holdings, Inc. | 1,556 | 312,305 | |
| Middleby Corp. (a) | 1,935 | 293,830 | |
| Oshkosh Corp. | 1,061 | 97,686 | |
| PACCAR, Inc. | 14,173 | 1,220,720 | |
| Timken Co. | 1,543 | 143,283 | |
| Toro Co. | 857 | 87,114 | |
| Westinghouse Air Brake Tech Co. | 6,907 | 818,065 | |
| 8,037,285 | |||
| Passenger Airlines - 0.2% | |||
| American Airlines Group, Inc. (a) | 39,985 | 669,749 | |
| JetBlue Airways Corp. (a) | 28,706 | 223,046 | |
| 892,795 | |||
| Professional Services - 0.4% | |||
| Booz Allen Hamilton Holding Corp. Class A | 2,486 | 301,005 | |
| CACI International, Inc. Class A (a) | 513 | 179,776 | |
| Clarivate Analytics PLC (a)(b) | 9,138 | 86,902 | |
| Genpact Ltd. | 3,217 | 116,102 | |
| KBR, Inc. | 3,176 | 195,292 | |
| Paylocity Holding Corp. (a) | 580 | 131,573 | |
| Science Applications International Corp. | 1,555 | 188,684 | |
| SS&C Technologies Holdings, Inc. | 7,101 | 413,633 | |
| TransUnion Holding Co., Inc. | 2,566 | 204,485 | |
| 1,817,452 | |||
| Trading Companies & Distributors - 0.2% | |||
| Air Lease Corp. Class A | 2,050 | 86,797 | |
| Ferguson PLC | 1,815 | 293,340 | |
| MSC Industrial Direct Co., Inc. Class A | 885 | 89,314 | |
| SiteOne Landscape Supply, Inc. (a) | 504 | 85,680 | |
| Watsco, Inc. | 554 | 209,517 | |
| WESCO International, Inc. | 729 | 127,991 | |
| 892,639 | |||
TOTAL INDUSTRIALS | 35,989,658 | ||
| INFORMATION TECHNOLOGY - 28.0% | |||
| Communications Equipment - 0.8% | |||
| Ciena Corp. (a) | 2,410 | 101,702 | |
| Cisco Systems, Inc. | 62,205 | 3,237,148 | |
| Ubiquiti, Inc. (b) | 489 | 86,871 | |
| 3,425,721 | |||
| Electronic Equipment, Instruments & Components - 0.5% | |||
| Amphenol Corp. Class A | 21,818 | 1,926,748 | |
| Arrow Electronics, Inc. (a) | 1,489 | 212,242 | |
| Jabil, Inc. | 1,489 | 164,788 | |
| TD SYNNEX Corp. | 1,630 | 160,897 | |
| 2,464,675 | |||
| IT Services - 1.5% | |||
| Accenture PLC Class A | 8,882 | 2,809,821 | |
| Amdocs Ltd. | 2,239 | 209,660 | |
| Cloudflare, Inc. (a) | 1,922 | 132,176 | |
| Cognizant Technology Solutions Corp. Class A | 14,214 | 938,550 | |
| GoDaddy, Inc. (a) | 2,739 | 211,150 | |
| IBM Corp. | 14,982 | 2,160,105 | |
| MongoDB, Inc. Class A (a) | 242 | 102,463 | |
| Okta, Inc. (a) | 1,887 | 145,035 | |
| Snowflake, Inc. (a) | 557 | 98,984 | |
| Twilio, Inc. Class A (a) | 1,913 | 126,315 | |
| 6,934,259 | |||
| Semiconductors & Semiconductor Equipment - 7.7% | |||
| Advanced Micro Devices, Inc. (a) | 22,023 | 2,519,431 | |
| Broadcom, Inc. | 5,598 | 5,030,643 | |
| Enphase Energy, Inc. (a) | 2,322 | 352,549 | |
| Entegris, Inc. | 3,030 | 332,421 | |
| GlobalFoundries, Inc. (a) | 1,342 | 85,472 | |
| Intel Corp. | 57,127 | 2,043,433 | |
| Lam Research Corp. | 3,557 | 2,555,669 | |
| Lattice Semiconductor Corp. (a) | 1,582 | 143,867 | |
| Micron Technology, Inc. | 18,534 | 1,323,142 | |
| MKS Instruments, Inc. | 1,757 | 191,812 | |
| NVIDIA Corp. | 29,759 | 13,906,083 | |
| Qualcomm, Inc. | 16,065 | 2,123,311 | |
| Skyworks Solutions, Inc. | 6,583 | 752,898 | |
| Synaptics, Inc. (a) | 1,009 | 91,123 | |
| Teradyne, Inc. | 6,665 | 752,745 | |
| Texas Instruments, Inc. | 14,832 | 2,669,760 | |
| Universal Display Corp. | 856 | 124,873 | |
| Wolfspeed, Inc. (a)(b) | 1,028 | 67,745 | |
| 35,066,977 | |||
| Software - 10.0% | |||
| Adobe, Inc. (a) | 5,940 | 3,244,250 | |
| Atlassian Corp. PLC (a) | 620 | 112,803 | |
| Bentley Systems, Inc. Class B | 1,603 | 86,370 | |
| Black Knight, Inc. (a) | 1,918 | 134,874 | |
| Crowdstrike Holdings, Inc. (a) | 1,173 | 189,627 | |
| Datadog, Inc. Class A (a) | 1,034 | 120,688 | |
| DocuSign, Inc. (a) | 2,306 | 124,109 | |
| Dolby Laboratories, Inc. Class A | 2,554 | 226,310 | |
| Dropbox, Inc. Class A (a) | 8,625 | 232,444 | |
| Dynatrace, Inc. (a) | 2,359 | 129,014 | |
| Elastic NV (a) | 1,781 | 118,347 | |
| Five9, Inc. (a) | 1,080 | 94,770 | |
| Guidewire Software, Inc. (a) | 1,271 | 107,806 | |
| HubSpot, Inc. (a) | 222 | 128,882 | |
| Intuit, Inc. | 4,043 | 2,068,803 | |
| Manhattan Associates, Inc. (a) | 626 | 119,328 | |
| Microsoft Corp. | 88,325 | 29,670,134 | |
| NCR Corp. (a) | 3,458 | 92,951 | |
| Oracle Corp. | 21,932 | 2,571,088 | |
| Palantir Technologies, Inc. (a) | 5,647 | 112,036 | |
| Palo Alto Networks, Inc. (a) | 5,114 | 1,278,295 | |
| Qualys, Inc. (a) | 858 | 119,090 | |
| RingCentral, Inc. (a) | 2,554 | 105,633 | |
| Salesforce, Inc. (a) | 12,987 | 2,922,205 | |
| Splunk, Inc. (a) | 1,673 | 181,236 | |
| Unity Software, Inc. (a) | 1,941 | 88,975 | |
| VMware, Inc. Class A (a) | 1,855 | 292,404 | |
| Workday, Inc. Class A (a) | 1,725 | 409,049 | |
| Zoom Video Communications, Inc. Class A (a) | 2,155 | 158,069 | |
| Zscaler, Inc. (a) | 867 | 139,049 | |
| 45,378,639 | |||
| Technology Hardware, Storage & Peripherals - 7.5% | |||
| Apple, Inc. | 174,350 | 34,251,059 | |
TOTAL INFORMATION TECHNOLOGY | 127,521,330 | ||
| MATERIALS - 2.2% | |||
| Chemicals - 1.6% | |||
| Ashland, Inc. | 1,469 | 134,208 | |
| Axalta Coating Systems Ltd. (a) | 9,926 | 317,632 | |
| Celanese Corp. Class A | 6,075 | 761,744 | |
| Dow, Inc. | 24,829 | 1,402,094 | |
| Eastman Chemical Co. | 6,760 | 578,521 | |
| Element Solutions, Inc. | 4,709 | 98,701 | |
| Huntsman Corp. | 5,748 | 171,118 | |
| Linde PLC | 8,229 | 3,214,823 | |
| Olin Corp. | 2,503 | 144,373 | |
| RPM International, Inc. | 3,848 | 397,537 | |
| Westlake Corp. | 912 | 125,400 | |
| 7,346,151 | |||
| Construction Materials - 0.1% | |||
| Eagle Materials, Inc. | 773 | 142,518 | |
| Knife River Holding Co. | 2,906 | 126,324 | |
| 268,842 | |||
| Containers & Packaging - 0.2% | |||
| Aptargroup, Inc. | 1,468 | 178,303 | |
| Berry Global Group, Inc. | 2,977 | 195,202 | |
| Crown Holdings, Inc. | 2,863 | 265,572 | |
| Graphic Packaging Holding Co. | 6,899 | 166,956 | |
| Silgan Holdings, Inc. | 2,151 | 94,321 | |
| Sonoco Products Co. (b) | 2,449 | 143,609 | |
| 1,043,963 | |||
| Metals & Mining - 0.3% | |||
| Alcoa Corp. | 3,218 | 116,459 | |
| Cleveland-Cliffs, Inc. (a) | 5,689 | 100,411 | |
| Newmont Corp. | 19,588 | 840,717 | |
| Reliance Steel & Aluminum Co. | 475 | 139,109 | |
| Royal Gold, Inc. | 524 | 62,953 | |
| Southern Copper Corp. | 1,095 | 95,747 | |
| United States Steel Corp. | 3,761 | 95,906 | |
| 1,451,302 | |||
TOTAL MATERIALS | 10,110,258 | ||
| REAL ESTATE - 2.3% | |||
| Equity Real Estate Investment Trusts (REITs) - 2.3% | |||
| Agree Realty Corp. | 2,084 | 135,002 | |
| American Homes 4 Rent Class A | 10,557 | 395,676 | |
| American Tower Corp. | 8,706 | 1,656,839 | |
| Americold Realty Trust | 3,299 | 106,954 | |
| Apartment Income (REIT) Corp. | 2,780 | 96,021 | |
| Brixmor Property Group, Inc. | 7,347 | 167,071 | |
| CubeSmart | 3,458 | 149,939 | |
| EastGroup Properties, Inc. | 936 | 165,840 | |
| Equity Lifestyle Properties, Inc. | 4,671 | 332,482 | |
| Extra Space Storage, Inc. | 1,118 | 156,039 | |
| First Industrial Realty Trust, Inc. | 2,979 | 154,014 | |
| Gaming & Leisure Properties | 6,282 | 298,144 | |
| Healthcare Trust of America, Inc. | 6,441 | 125,793 | |
| Healthpeak Properties, Inc. | 40,517 | 884,486 | |
| Kilroy Realty Corp. | 2,819 | 100,638 | |
| Kite Realty Group Trust | 4,843 | 110,808 | |
| Lamar Advertising Co. Class A | 2,122 | 209,441 | |
| Medical Properties Trust, Inc. (b) | 9,847 | 99,356 | |
| Mid-America Apartment Communities, Inc. | 9,588 | 1,434,940 | |
| NNN (REIT), Inc. | 3,361 | 143,447 | |
| Omega Healthcare Investors, Inc. | 4,621 | 147,410 | |
| Prologis (REIT), Inc. | 17,920 | 2,235,520 | |
| Rexford Industrial Realty, Inc. | 3,358 | 184,992 | |
| Spirit Realty Capital, Inc. | 2,638 | 106,391 | |
| Stag Industrial, Inc. | 3,458 | 125,525 | |
| Sun Communities, Inc. | 2,575 | 335,523 | |
| Vornado Realty Trust | 5,350 | 120,268 | |
| WP Carey, Inc. | 4,971 | 335,692 | |
| 10,514,251 | |||
| Real Estate Management & Development - 0.0% | |||
| Jones Lang LaSalle, Inc. (a) | 174 | 28,980 | |
TOTAL REAL ESTATE | 10,543,231 | ||
| UTILITIES - 2.6% | |||
| Electric Utilities - 1.3% | |||
| Exelon Corp. | 38,329 | 1,604,452 | |
| NextEra Energy, Inc. | 34,850 | 2,554,505 | |
| OGE Energy Corp. | 3,742 | 135,273 | |
| Xcel Energy, Inc. | 26,489 | 1,661,655 | |
| 5,955,885 | |||
| Multi-Utilities - 1.2% | |||
| Ameren Corp. | 18,349 | 1,571,959 | |
| Black Hills Corp. | 1,923 | 116,015 | |
| CMS Energy Corp. | 24,513 | 1,497,009 | |
| DTE Energy Co. | 13,755 | 1,572,197 | |
| NiSource, Inc. | 27,984 | 779,075 | |
| 5,536,255 | |||
| Water Utilities - 0.1% | |||
| Essential Utilities, Inc. | 5,980 | 252,894 | |
TOTAL UTILITIES | 11,745,034 | ||
| TOTAL COMMON STOCKS (Cost $411,277,054) | 442,864,855 | ||
| Money Market Funds - 0.8% | |||
| Shares | Value ($) | ||
| Fidelity Cash Central Fund 5.32% (c) | 2,111,397 | 2,111,820 | |
| Fidelity Securities Lending Cash Central Fund 5.32% (c)(d) | 1,221,878 | 1,222,000 | |
| TOTAL MONEY MARKET FUNDS (Cost $3,333,820) | 3,333,820 | ||
| Equity Funds - 1.0% | |||
| Shares | Value ($) | ||
| Domestic Equity Funds - 1.0% | |||
iShares S&P 500 Index ETF (Cost $4,498,809) | 10,158 | 4,674,508 | |
| Purchased Options - 1.1% | ||||||
| Counterparty | Number of Contracts | Notional Amount($) | Exercise Price ($) | Expiration Date | Value ($) | |
| Put Options | ||||||
| S&P 500 Index | Chicago Board Options Exchange | 120 | 55,067,520 | 2,650 | 05/17/24 | 153,600 |
| S&P 500 Index | Chicago Board Options Exchange | 344 | 157,860,224 | 3,050 | 05/17/24 | 724,120 |
| S&P 500 Index | Chicago Board Options Exchange | 94 | 43,136,224 | 3,940 | 08/18/23 | 9,870 |
| S&P 500 Index | Chicago Board Options Exchange | 90 | 41,300,640 | 4,150 | 09/15/23 | 76,950 |
| S&P 500 Index | Chicago Board Options Exchange | 279 | 128,031,984 | 4,220 | 09/15/23 | 302,715 |
| S&P 500 Index | Chicago Board Options Exchange | 360 | 165,202,560 | 3,000 | 06/21/24 | 828,000 |
| S&P 500 Index | Chicago Board Options Exchange | 120 | 55,067,520 | 2,900 | 06/21/24 | 243,600 |
| S&P 500 Index | Chicago Board Options Exchange | 246 | 112,888,416 | 4,250 | 08/18/23 | 58,425 |
| S&P 500 Index | Chicago Board Options Exchange | 406 | 186,311,776 | 4,350 | 10/20/23 | 1,520,470 |
| S&P 500 Index | Chicago Board Options Exchange | 426 | 195,489,696 | 3,100 | 07/19/24 | 1,224,750 |
| 5,142,500 | ||||||
TOTAL PURCHASED OPTIONS (Cost 9,342,613) | 5,142,500 | |||||
For the period, the average monthly notional amount at value for purchased options in the aggregate was $608,320,568.
| TOTAL INVESTMENT IN SECURITIES - 100.2% (Cost $428,452,296) | 456,015,683 |
NET OTHER ASSETS (LIABILITIES) - (0.2)% | (882,929) |
| NET ASSETS - 100.0% | 455,132,754 |
Security Type Abbreviations
| ETF | - | EXCHANGE-TRADED FUND |
Legend
| (a) | Non-income producing |
| (b) | Security or a portion of the security is on loan at period end. |
| (c) | Affiliated fund that is generally available only to investment companies and other accounts managed by Fidelity Investments. The rate quoted is the annualized seven-day yield of the fund at period end. A complete unaudited listing of the fund's holdings as of its most recent quarter end is available upon request. In addition, each Fidelity Central Fund's financial statements are available on the SEC's website or upon request. |
| (d) | Investment made with cash collateral received from securities on loan. |
Affiliated Central Funds
Fiscal year to date information regarding the Fund's investments in Fidelity Central Funds, including the ownership percentage, is presented below.
| Affiliate | Value, beginning of period ($) | Purchases ($) | Sales Proceeds ($) | Dividend Income ($) | Realized Gain (loss) ($) | Change in Unrealized appreciation (depreciation) ($) | Value, end of period ($) | % ownership, end of period |
| Fidelity Cash Central Fund 5.32% | 328,083 | 336,719,888 | 334,936,151 | 63,196 | - | - | 2,111,820 | 0.0% |
| Fidelity Securities Lending Cash Central Fund 5.32% | - | 7,235,270 | 6,013,270 | 3,621 | - | - | 1,222,000 | 0.0% |
| Total | 328,083 | 343,955,158 | 340,949,421 | 66,817 | - | - | 3,333,820 | |
Amounts in the dividend income column in the above table include any capital gain distributions from underlying funds, which are presented in the corresponding line item in the Statement of Operations, if applicable.
Amounts in the dividend income column for Fidelity Securities Lending Cash Central Fund represents the income earned on investing cash collateral, less rebates paid to borrowers and any lending agent fees associated with the loan, plus any premium payments received for lending certain types of securities.
Amounts included in the purchases and sales proceeds columns may include in-kind transactions, if applicable.
Investment Valuation
The following is a summary of the inputs used, as of July 31, 2023, involving the Fund's assets and liabilities carried at fair value. The inputs or methodology used for valuing securities may not be an indication of the risk associated with investing in those securities. For more information on valuation inputs, and their aggregation into the levels used below, please refer to the Investment Valuation section in the accompanying Notes to Financial Statements.
| Valuation Inputs at Reporting Date: | ||||
| Description | Total ($) | Level 1 ($) | Level 2 ($) | Level 3 ($) |
Investments in Securities: | ||||
| Equities: | ||||
Communication Services | 37,931,005 | 37,931,005 | - | - |
Consumer Discretionary | 47,755,809 | 47,755,809 | - | - |
Consumer Staples | 28,969,308 | 28,969,308 | - | - |
Energy | 18,702,911 | 18,702,911 | - | - |
Financials | 56,756,988 | 56,756,988 | - | - |
Health Care | 56,839,323 | 56,839,323 | - | - |
Industrials | 35,989,658 | 35,989,658 | - | - |
Information Technology | 127,521,330 | 127,521,330 | - | - |
Materials | 10,110,258 | 10,110,258 | - | - |
Real Estate | 10,543,231 | 10,543,231 | - | - |
Utilities | 11,745,034 | 11,745,034 | - | - |
| Money Market Funds | 3,333,820 | 3,333,820 | - | - |
| Equity Funds | 4,674,508 | 4,674,508 | - | - |
| Purchased Options | 5,142,500 | 5,142,500 | - | - |
| Total Investments in Securities: | 456,015,683 | 456,015,683 | - | - |
Value of Derivative Instruments
The following table is a summary of the Fund's value of derivative instruments by primary risk exposure as of July 31, 2023. For additional information on derivative instruments, please refer to the Derivative Instruments section in the accompanying Notes to Financial Statements.
Primary Risk Exposure / Derivative Type | Value | |
| Asset ($) | Liability ($) | |
| Equity Risk | ||
Purchased Options (a) | 5,142,500 | 0 |
| Total Equity Risk | 5,142,500 | 0 |
| Total Value of Derivatives | 5,142,500 | 0 |
(a)Gross value is presented in the Statement of Assets and Liabilities in the Investments in Securities at value line-item.
Financial Statements (Unaudited)
| Statement of Assets and Liabilities | ||||
July 31, 2023 (Unaudited) | ||||
| Assets | ||||
| Investment in securities, at value (including securities loaned of $1,195,709) - See accompanying schedule: | ||||
Unaffiliated issuers (cost $425,118,476) | $ | 452,681,863 | ||
Fidelity Central Funds (cost $3,333,820) | 3,333,820 | |||
| Total Investment in Securities (cost $428,452,296) | $ | 456,015,683 | ||
| Dividends receivable | 333,365 | |||
| Distributions receivable from Fidelity Central Funds | 12,462 | |||
| Receivable from investment adviser for expense reductions | 18,090 | |||
Total assets | 456,379,600 | |||
| Liabilities | ||||
| Payable for investments purchased | $ | 9,675 | ||
| Other affiliated payables | 12,374 | |||
| Other payables and accrued expenses | 2,797 | |||
| Collateral on securities loaned | 1,222,000 | |||
| Total Liabilities | 1,246,846 | |||
| Net Assets | $ | 455,132,754 | ||
| Net Assets consist of: | ||||
| Paid in capital | $ | 431,753,425 | ||
| Total accumulated earnings (loss) | 23,379,329 | |||
| Net Assets | $ | 455,132,754 | ||
Net Asset Value, offering price and redemption price per share ($455,132,754 ÷ 4,154,006 shares) | $ | 109.56 | ||
| Statement of Operations | ||||
Six months ended July 31, 2023 (Unaudited) | ||||
| Investment Income | ||||
| Dividends | $ | 1,281,692 | ||
| Income from Fidelity Central Funds (including $3,621 from security lending) | 66,817 | |||
| Total Income | 1,348,509 | |||
| Expenses | ||||
| Custodian fees and expenses | $ | 4,868 | ||
| Independent trustees' fees and expenses | 127,414 | |||
| Total expenses before reductions | 132,282 | |||
| Expense reductions | (127,822) | |||
| Total expenses after reductions | 4,460 | |||
| Net Investment income (loss) | 1,344,049 | |||
| Realized and Unrealized Gain (Loss) | ||||
| Net realized gain (loss) on: | ||||
| Investment Securities: | ||||
| Unaffiliated issuers | (5,525,213) | |||
| Total net realized gain (loss) | (5,525,213) | |||
| Change in net unrealized appreciation (depreciation) on investment securities | 26,288,618 | |||
| Net gain (loss) | 20,763,405 | |||
| Net increase (decrease) in net assets resulting from operations | $ | 22,107,454 | ||
| Statement of Changes in Net Assets | ||||
Six months ended July 31, 2023 (Unaudited) | For the period January 17, 2023 (commencement of operations) through January 31, 2023 | |||
| Increase (Decrease) in Net Assets | ||||
| Operations | ||||
| Net investment income (loss) | $ | 1,344,049 | $ | 54,857 |
| Net realized gain (loss) | (5,525,213) | - | ||
| Change in net unrealized appreciation (depreciation) | 26,288,618 | 1,274,769 | ||
| Net increase (decrease) in net assets resulting from operations | 22,107,454 | 1,329,626 | ||
| Distributions to shareholders | (57,750) | - | ||
| Affiliated share transactions | ||||
| Proceeds from sales of shares | 326,695,674 | 105,000,000 | ||
| Reinvestment of distributions | 57,750 | - | ||
Net increase (decrease) in net assets resulting from share transactions | 326,753,424 | 105,000,000 | ||
| Total increase (decrease) in net assets | 348,803,128 | 106,329,626 | ||
| Net Assets | ||||
| Beginning of period | 106,329,626 | - | ||
| End of period | $ | 455,132,754 | $ | 106,329,626 |
| Other Information | ||||
| Shares | ||||
| Sold | 3,103,414 | 1,050,000 | ||
| Issued in reinvestment of distributions | 592 | - | ||
| Net increase (decrease) | 3,104,006 | 1,050,000 | ||
| Fidelity® Hedged Equity Central Fund |
Six months ended (Unaudited) July 31, 2023 | Years ended January 31, 2023 A | |||
Selected Per-Share Data | ||||
| Net asset value, beginning of period | $ | 101.27 | $ | 100.00 |
| Income from Investment Operations | ||||
Net investment income (loss) B,C | .83 | .05 | ||
| Net realized and unrealized gain (loss) | 7.52 | 1.22 | ||
| Total from investment operations | 8.35 | 1.27 | ||
| Distributions from net investment income | (.06) | - | ||
| Total distributions | (.06) | - | ||
| Net asset value, end of period | $ | 109.56 | $ | 101.27 |
Total Return D,E | 8.25% | 1.27% | ||
Ratios to Average Net Assets C,F,G | ||||
| Expenses before reductions | .16% H | .01% H | ||
| Expenses net of fee waivers, if any | .01% H | .01% H | ||
| Expenses net of all reductions | .01% H | .01% H | ||
| Net investment income (loss) | 1.61% H | 1.25% H | ||
| Supplemental Data | ||||
| Net assets, end of period (000 omitted) | $ | 455,133 | $ | 106,330 |
Portfolio turnover rate I | 37% H | -% J |
AFor the period January 17, 2023 (commencement of operations) through January 31, 2023.
BCalculated based on average shares outstanding during the period.
CNet investment income (loss) is affected by the timing of the declaration of dividends by any underlying mutual funds or exchange-traded funds (ETFs). Net investment income (loss) of any mutual funds or ETFs is not included in the Fund's net investment income (loss) ratio.
DTotal returns for periods of less than one year are not annualized.
ETotal returns would have been lower if certain expenses had not been reduced during the applicable periods shown.
FFees and expenses of any underlying mutual funds or exchange-traded funds (ETFs) are not included in the Fund's expense ratio. The Fund indirectly bears its proportionate share of these expenses. For additional expense information related to investments in Fidelity Central Funds, please refer to the "Investments in Fidelity Central Funds" note found in the Notes to Financial Statements section of the most recent Annual or Semi-Annual report.
GExpense ratios reflect operating expenses of the class. Expenses before reductions do not reflect amounts reimbursed, waived, or reduced through arrangements with the investment adviser, brokerage services, or other offset arrangements, if applicable, and do not represent the amount paid by the class during periods when reimbursements, waivers or reductions occur.
HAnnualized.
IAmount does not include the portfolio activity of any underlying mutual funds or exchange-traded funds (ETFs).
JAmount not annualized.
Notes to Financial Statements (Unaudited)
For the period ended July 31, 2023
1. Organization.
Fidelity Hedged Equity Central Fund (the Fund) is a fund of Fidelity Cherry Street Trust (the Trust) and is authorized to issue an unlimited number of shares. Shares of the Fund are only offered to other investment companies and accounts managed by Fidelity Management & Research Company LLC (FMR), or its affiliates (the Investing Funds). The Trust is registered under the Investment Company Act of 1940, as amended (the 1940 Act), as an open-end management investment company organized as a Delaware statutory trust.
2. Investments in Fidelity Central Funds.
Funds may invest in Fidelity Central Funds, which are open-end investment companies generally available only to other investment companies and accounts managed by the investment adviser and its affiliates. The Schedule of Investments lists any Fidelity Central Funds held as an investment as of period end, but does not include the underlying holdings of each Fidelity Central Fund. An investing fund indirectly bears its proportionate share of the expenses of the underlying Fidelity Central Funds.
Based on its investment objective, each Fidelity Central Fund may invest or participate in various investment vehicles or strategies that are similar to those of the investing fund. These strategies are consistent with the investment objectives of the investing fund and may involve certain economic risks which may cause a decline in value of each of the Fidelity Central Funds and thus a decline in the value of the investing fund.
| Fidelity Central Fund | Investment Manager | Investment Objective | Investment Practices | Expense RatioA |
| Fidelity Money Market Central Funds | Fidelity Management & Research Company LLC (FMR) | Each fund seeks to obtain a high level of current income consistent with the preservation of capital and liquidity. | Short-term Investments | Less than .005% |
A Expenses expressed as a percentage of average net assets and are as of each underlying Central Fund's most recent annual or semi-annual shareholder report.
A complete unaudited list of holdings for each Fidelity Central Fund is available upon request or at the Securities and Exchange Commission website at www.sec.gov. In addition, the financial statements of the Fidelity Central Funds which contain the significant accounting policies (including investment valuation policies) of those funds, and are not covered by the Report of Independent Registered Public Accounting Firm, are available on the Securities and Exchange Commission website or upon request.
3. Significant Accounting Policies.
The Fund is an investment company and applies the accounting and reporting guidance of the Financial Accounting Standards Board (FASB) Accounting Standards Codification Topic 946 Financial Services - Investment Companies. The financial statements have been prepared in conformity with accounting principles generally accepted in the United States of America (GAAP), which require management to make certain estimates and assumptions at the date of the financial statements. Actual results could differ from those estimates. Subsequent events, if any, through the date that the financial statements were issued have been evaluated in the preparation of the financial statements. The Fund's Schedule of Investments lists any underlying mutual funds or exchange-traded funds (ETFs) but does not include the underlying holdings of these funds. The following summarizes the significant accounting policies of the Fund:
Investment Valuation. Investments are valued as of 4:00 p.m. Eastern time on the last calendar day of the period. The Board of Trustees (the Board) has designated the Fund's investment adviser as the valuation designee responsible for the fair valuation function and performing fair value determinations as needed. The investment adviser has established a Fair Value Committee (the Committee) to carry out the day-to-day fair valuation responsibilities and has adopted policies and procedures to govern the fair valuation process and the activities of the Committee. In accordance with these fair valuation policies and procedures, which have been approved by the Board, the Fund attempts to obtain prices from one or more third party pricing services or brokers to value its investments. When current market prices, quotations or currency exchange rates are not readily available or reliable, investments will be fair valued in good faith by the Committee, in accordance with the policies and procedures. Factors used in determining fair value vary by investment type and may include market or investment specific events, transaction data, estimated cash flows, and market observations of comparable investments. The frequency that the fair valuation procedures are used cannot be predicted and they may be utilized to a significant extent. The Committee manages the Fund's fair valuation practices and maintains the fair valuation policies and procedures. The Fund's investment adviser reports to the Board information regarding the fair valuation process and related material matters.
The Fund categorizes the inputs to valuation techniques used to value its investments into a disclosure hierarchy consisting of three levels as shown below:
Level 1 - unadjusted quoted prices in active markets for identical investments
Level 2 - other significant observable inputs (including quoted prices for similar investments, interest rates, prepayment speeds, etc.)
Level 3 - unobservable inputs (including the Fund's own assumptions based on the best information available)
Valuation techniques used to value the Fund's investments by major category are as follows:
Equity securities, including restricted securities, for which market quotations are readily available, are valued at the last reported sale price or official closing price as reported by a third party pricing service on the primary market or exchange on which they are traded and are categorized as Level 1 in the hierarchy. In the event there were no sales during the day or closing prices are not available, securities are valued at the last quoted bid price or may be valued using the last available price and are generally categorized as Level 2 in the hierarchy. For foreign equity securities, when market or security specific events arise, comparisons to the valuation of American Depositary Receipts (ADRs), futures contracts, ETFs and certain indexes as well as quoted prices for similar securities may be used and would be categorized as Level 2 in the hierarchy. For equity securities, including restricted securities, where observable inputs are limited, assumptions about market activity and risk are used and these securities may be categorized as Level 3 in the hierarchy.
ETFs are valued at their last sale price or official closing price as reported by a third party pricing service on the primary market or exchange on which they are traded and are categorized as Level 1 in the hierarchy. In the event there were no sales during the day but the exchange reports a closing bid level, ETFs are valued at the closing bid and would be categorized as Level 1 in the hierarchy. In the event there was no closing bid, ETFs may be valued by another method that the Board believes reflects fair value in accordance with the Board's fair value pricing policies and may be categorized as Level 2 in the hierarchy.
Exchange-traded options are valued using the last sale price or, in the absence of a sale, the last offering price and are categorized as Level 1 in the hierarchy. Investments in open-end mutual funds, including the Fidelity Central Funds, are valued at their closing net asset value (NAV) each business day and are categorized as Level 1 in the hierarchy.
Changes in valuation techniques may result in transfers in or out of an assigned level within the disclosure hierarchy. The aggregate value of investments by input level as of July 31, 2023 is included at the end of the Fund's Schedule of Investments.
Investment Transactions and Income. For financial reporting purposes, the Fund's investment holdings and NAV include trades executed through the end of the last business day of the period. The NAV per share for processing shareholder transactions is calculated as of the close of business of the New York Stock Exchange (NYSE), normally 4:00 p.m. Eastern time and includes trades executed through the end of the prior business day. Gains and losses on securities sold are determined on the basis of identified cost. Commissions paid to certain brokers with whom the investment adviser, or its affiliates, places trades on behalf of a fund include an amount in addition to trade execution, which may be rebated back to a fund. Any such rebates are included in net realized gain (loss) on investments in the Statement of Operations. Dividend income is recorded on the ex-dividend date, except for certain dividends from foreign securities where the ex-dividend date may have passed, which are recorded as soon as the Fund is informed of the ex-dividend date. Non-cash dividends included in dividend income, if any, are recorded at the fair market value of the securities received. Income and capital gain distributions from Fidelity Central Funds, if any, are recorded on the ex-dividend date. Certain distributions received by the Fund represent a return of capital or capital gain. The Fund determines the components of these distributions subsequent to the ex-dividend date, based upon receipt of tax filings or other correspondence relating to the underlying investment. These distributions are recorded as a reduction of cost of investments and/or as a realized gain.
Expenses. Expenses directly attributable to a fund are charged to that fund. Expenses attributable to more than one fund are allocated among the respective funds on the basis of relative net assets or other appropriate methods. Expenses included in the accompanying financial statements reflect the expenses of that fund and do not include any expenses associated with any underlying mutual funds or exchange-traded funds. Although not included in a fund's expenses, a fund indirectly bears its proportionate share of these expenses through the net asset value of each underlying mutual fund or exchange-traded fund. Expense estimates are accrued in the period to which they relate and adjustments are made when actual amounts are known.
Income Tax Information and Distributions to Shareholders. Each year, the Fund intends to qualify as a regulated investment company under Subchapter M of the Internal Revenue Code, including distributing substantially all of its taxable income and realized gains. As a result, no provision for U.S. Federal income taxes is required. The Fund files a U.S. federal tax return, in addition to state and local tax returns as required. The Fund's federal income tax returns are subject to examination by the Internal Revenue Service (IRS) for a period of three fiscal years after they are filed. State and local tax returns may be subject to examination for an additional fiscal year depending on the jurisdiction.
Distributions are declared and recorded on the ex-dividend date. Income and capital gain distributions are determined in accordance with income tax regulations, which may differ from GAAP.
Capital accounts within the financial statements are adjusted for permanent book-tax differences. These adjustments have no impact on net assets or the results of operations. Capital accounts are not adjusted for temporary book-tax differences which will reverse in a subsequent period.
Book-tax differences are primarily due to options, capital loss carryforwards and losses deferred due to options transactions.
As of period end, the cost and unrealized appreciation (depreciation) in securities, and derivatives if applicable, for federal income tax purposes were as follows:
| Gross unrealized appreciation | $35,123,795 |
| Gross unrealized depreciation | (8,040,735) |
| Net unrealized appreciation (depreciation) | $27,083,060 |
| Tax cost | $428,932,623 |
Capital loss carryforwards are only available to offset future capital gains of the Fund to the extent provided by regulations and may be limited. The capital loss carryforward information presented below, including any applicable limitation, is estimated as of prior fiscal period end and is subject to adjustment.
Short-term | $(354,347) |
Long-term | (531,520) |
| Total capital loss carryforward | $(885,867) |
4. Derivative Instruments.
Risk Exposures and the Use of Derivative Instruments. The Fund's investment objectives allow for various types of derivative instruments, including options. Derivatives are investments whose value is primarily derived from underlying assets, indices or reference rates and may be transacted on an exchange or over-the-counter (OTC). Derivatives may involve a future commitment to buy or sell a specified asset based on specified terms, to exchange future cash flows at periodic intervals based on a notional principal amount, or for one party to make one or more payments upon the occurrence of specified events in exchange for periodic payments from the other party.
Derivatives were used to increase returns and to manage exposure to certain risks as defined below. The success of any strategy involving derivatives depends on analysis of numerous economic factors, and if the strategies for investment do not work as intended, the objectives may not be achieved.
Derivatives were used to increase or decrease exposure to the following risk(s):
| Equity Risk | Equity risk relates to the fluctuations in the value of financial instruments as a result of changes in market prices (other than those arising from interest rate risk or foreign exchange risk), whether caused by factors specific to an individual investment, its issuer, or all factors affecting all instruments traded in a market or market segment. |
Funds are also exposed to additional risks from investing in derivatives, such as liquidity risk and counterparty credit risk. Liquidity risk is the risk that a fund will be unable to close out the derivative in the open market in a timely manner. Counterparty credit risk is the risk that the counterparty will not be able to fulfill its obligation to a fund. Counterparty credit risk related to exchange-traded contracts may be mitigated by the protection provided by the exchange on which they trade.
Investing in derivatives may involve greater risks than investing in the underlying assets directly and, to varying degrees, may involve risk of loss in excess of any initial investment and collateral received and amounts recognized in the Statement of Assets and Liabilities. In addition, there may be the risk that the change in value of the derivative contract does not correspond to the change in value of the underlying instrument.
Options. Options give the purchaser the right, but not the obligation, to buy (call) or sell (put) an underlying security or financial instrument at an agreed exercise or strike price between or on certain dates. Options obligate the seller (writer) to buy (put) or sell (call) an underlying instrument at the exercise or strike price or cash settle an underlying derivative instrument if the holder exercises the option on or before the expiration date. Exchange-traded options were used to manage exposure to the market.
Upon entering into an options contract, a fund will pay or receive a premium. Premiums paid on purchased options are reflected as cost of investments and premiums received on written options are reflected as a liability on the Statement of Assets and Liabilities. Certain options may be purchased or written with premiums to be paid or received on a future date. Options are valued daily and any unrealized appreciation (depreciation) is reflected in total accumulated earnings (loss) in the Statement of Assets and Liabilities. When an option is exercised, the cost or proceeds of the underlying instrument purchased or sold is adjusted by the amount of the premium. When an option is closed, a gain or loss is realized depending on whether the proceeds or amount paid for the closing sale transaction is greater or less than the premium received or paid. When an option expires, gains and losses are realized to the extent of premiums received and paid, respectively. The net realized and unrealized gains (losses) on purchased options are included in the Statement of Operations in net realized gain (loss) and change in net unrealized appreciation (depreciation) on investment securities. The net realized gain (loss) and change in net unrealized appreciation (depreciation) on written options are presented in the Statement of Operations.
Any open options at period end are presented in the Schedule of Investments under the captions "Purchased Options," "Purchased Swaptions," "Written Options" and "Written Swaptions," as applicable, and are representative of volume of activity during the period unless an average notional amount is presented.
Writing puts and buying calls tend to increase exposure to the underlying instrument while buying puts and writing calls tend to decrease exposure to the underlying instrument. For purchased options, risk of loss is limited to the premium paid, and for written options, risk of loss is the change in value in excess of the premium received.
5. Purchases and Sales of Investments.
Purchases and sales of securities, other than short-term securities and in-kind transactions, as applicable, are noted in the table below.
| Purchases ($) | Sales ($) | |
| Fidelity Hedged Equity Central Fund | 351,515,571 | 36,760,776 |
6. Fees and Other Transactions with Affiliates.
Management Fee. Fidelity Diversifying Solutions LLC (the investment adviser) provides the Fund with investment management related services. The Fund does not pay any fees for these services. Pursuant to the Fund's management contract, the investment adviser receives a monthly management fee that represents a portion of the management fees it receives from the Investing Funds. In addition, the investment adviser also pays all other expenses of the Fund, excluding custody fees, the compensation of the independent Trustees, and certain miscellaneous expenses such as proxy and shareholder meeting expenses.
Brokerage Commissions. A portion of portfolio transactions were placed with brokerage firms which are affiliates of the investment adviser. Brokerage commissions are included in net realized gain (loss) and change in net unrealized appreciation (depreciation) in the Statement of Operations. The commissions paid to these affiliated firms were as follows:
| Amount | |
| Fidelity Hedged Equity Central Fund | $3,036 |
Interfund Trades. Funds may purchase from or sell securities to other Fidelity Funds under procedures adopted by the Board. The procedures have been designed to ensure these interfund trades are executed in accordance with Rule 17a-7 of the 1940 Act. Any interfund trades are included within the respective purchases and sales amounts shown in the Purchases and Sales of Investments note. Interfund trades during the period are noted in the table below.
| Purchases ($) | Sales ($) | Realized Gain (Loss) ($) | |
| Fidelity Hedged Equity Central Fund | 3,204,738 | 599,906 | 54,618 |
7. Security Lending.
Funds lend portfolio securities from time to time in order to earn additional income. Lending agents are used, including National Financial Services (NFS), an affiliate of the investment adviser. Pursuant to a securities lending agreement, NFS will receive a fee, which is capped at 9.9% of a fund's daily lending revenue, for its services as lending agent. A fund may lend securities to certain qualified borrowers, including NFS. On the settlement date of the loan, a fund receives collateral (in the form of U.S. Treasury obligations, letters of credit and/or cash) against the loaned securities and maintains collateral in an amount not less than 100% of the market value of the loaned securities during the period of the loan. The market value of the loaned securities is determined at the close of business of a fund and any additional required collateral is delivered to a fund on the next business day. A fund or borrower may terminate the loan at any time, and if the borrower defaults on its obligation to return the securities loaned because of insolvency or other reasons, a fund may apply collateral received from the borrower against the obligation. A fund may experience delays and costs in recovering the securities loaned. Any cash collateral received is invested in the Fidelity Securities Lending Cash Central Fund. Any loaned securities are identified as such in the Schedule of Investments, and the value of loaned securities and cash collateral at period end, as applicable, are presented in the Statement of Assets and Liabilities. Security lending income represents the income earned on investing cash collateral, less rebates paid to borrowers and any lending agent fees associated with the loan, plus any premium payments received for lending certain types of securities. Security lending income is presented in the Statement of Operations as a component of income from Fidelity Central Funds. Affiliated security lending activity, if any, was as follows:
| Total Security Lending Fees Paid to NFS | Security Lending Income From Securities Loaned to NFS | Value of Securities Loaned to NFS at Period End | |
| Fidelity Hedged Equity Central Fund | $410 | $- | $- |
8. Expense Reductions.
The investment adviser contractually agreed to reimburse the Fund to the extent annual operating expenses exceeded .00% of average net assets. Some expenses, for example custodian fees and expenses, and certain miscellaneous expenses such as proxy and shareholder meeting expenses, are excluded from this reimbursement. During the period this reimbursement reduced the Fund's expenses by $127,414.
Through arrangements with the Fund's custodian, credits realized as a result of certain uninvested cash balances were used to reduce the Fund's expenses by $408.
9. Other.
A fund's organizational documents provide former and current trustees and officers with a limited indemnification against liabilities arising in connection with the performance of their duties to the fund. In the normal course of business, a fund may also enter into contracts that provide general indemnifications. A fund's maximum exposure under these arrangements is unknown as this would be dependent on future claims that may be made against a fund. The risk of material loss from such claims is considered remote.
At the end of the period, mutual funds managed by the investment adviser or its affiliates were the owners of record of all of the outstanding shares of the Fund.
10. Risk and Uncertainties.
Many factors affect a fund's performance. Developments that disrupt global economies and financial markets, such as pandemics, epidemics, outbreaks of infectious diseases, war, terrorism, and environmental disasters, may significantly affect a fund's investment performance. The effects of these developments to a fund will be impacted by the types of securities in which a fund invests, the financial condition, industry, economic sector, and geographic location of an issuer, and a fund's level of investment in the securities of that issuer. Significant concentrations in security types, issuers, industries, sectors, and geographic locations may magnify the factors that affect a fund's performance.
As a shareholder, you incur two types of costs: (1) transaction costs, which may include sales charges (loads) on purchase payments or redemption proceeds, as applicable and (2) ongoing costs, which generally include management fees, distribution and/or service (12b-1) fees and other Fund expenses. This Example is intended to help you understand your ongoing costs (in dollars) of investing in a fund and to compare these costs with the ongoing costs of investing in other mutual funds.
| The Example is based on an investment of $1,000 invested at the beginning of the period and held for the entire period (February 1, 2023 to July 31, 2023). |
Actual Expenses
The first line of the accompanying table provides information about actual account values and actual expenses. You may use the information in this line, together with the amount you invested, to estimate the expenses that you paid over the period. Simply divide your account value by $1,000.00 (for example, an $8,600 account value divided by $1,000.00 = 8.6), then multiply the result by the number in the first line for a class/Fund under the heading entitled "Expenses Paid During Period" to estimate the expenses you paid on your account during this period. If any fund is a shareholder of any underlying mutual funds or exchange-traded funds (ETFs) (the Underlying Funds), such fund indirectly bears its proportional share of the expenses of the Underlying Funds in addition to the direct expenses incurred presented in the table. These fees and expenses are not included in the annualized expense ratio used to calculate the expense estimate in the table below.
Hypothetical Example for Comparison Purposes
The second line of the accompanying table provides information about hypothetical account values and hypothetical expenses based on the actual expense ratio and an assumed rate of return of 5% per year before expenses, which is not the actual return. The hypothetical account values and expenses may not be used to estimate the actual ending account balance or expenses you paid for the period. You may use this information to compare the ongoing costs of investing in the Fund and other funds. To do so, compare this 5% hypothetical example with the 5% hypothetical examples that appear in the shareholder reports of the other funds. If any fund is a shareholder of any Underlying Funds, such fund indirectly bears its proportional share of the expenses of the Underlying Funds in addition to the direct expenses as presented in the table. These fees and expenses are not included in the annualized expense ratio used to calculate the expense estimate in the table below.
Please note that the expenses shown in the table are meant to highlight your ongoing costs only and do not reflect any transaction costs. Therefore, the second line of the table is useful in comparing ongoing costs only, and will not help you determine the relative total costs of owning different funds. In addition, if these transactional costs were included, your costs would have been higher.
Annualized Expense Ratio- A | Beginning Account Value February 1, 2023 | Ending Account Value July 31, 2023 | Expenses Paid During Period- C February 1, 2023 to July 31, 2023 | |||||||
| Fidelity® Hedged Equity Central Fund | .0058% | |||||||||
| Actual | $ 1,000 | $ 1,082.50 | $ .03 | |||||||
Hypothetical-B | $ 1,000 | $ 1,024.77 | $ .03 | |||||||
A Annualized expense ratio reflects expenses net of applicable fee waivers.
B 5% return per year before expenses
C Expenses are equal to the annualized expense ratio, multiplied by the average account value over the period, multiplied by 181/ 365 (to reflect the one-half year period). The fees and expenses of any Underlying Funds are not included in each annualized expense ratio.
 |
1.9907613.100
HEC-SANN-0923
Item 2.
Code of Ethics
Not applicable.
Item 3.
Audit Committee Financial Expert
Not applicable.
Item 4.
Principal Accountant Fees and Services
Not applicable.
Item 5.
Audit Committee of Listed Registrants
Not applicable.
Item 6.
Investments
(a)
Not applicable.
(b)
Not applicable
Item 7.
Disclosure of Proxy Voting Policies and Procedures for Closed-End Management Investment Companies
Not applicable.
Item 8.
Portfolio Managers of Closed-End Management Investment Companies
Not applicable.
Item 9.
Purchase of Equity Securities by Closed-End Management Investment Company and Affiliated Purchasers
Not applicable.
Item 10.
Submission of Matters to a Vote of Security Holders
There were no material changes to the procedures by which shareholders may recommend nominees to the Fidelity Cherry Street Trust’s Board of Trustees.
Item 11.
Controls and Procedures
(a)(i) The President and Treasurer and the Chief Financial Officer have concluded that the Fidelity Cherry Street Trust’s (the “Trust”) disclosure controls and procedures (as
defined in Rule 30a-3(c) under the Investment Company Act) provide reasonable assurances that material information relating to the Trust is made known to them by the appropriate persons, based on their evaluation of these controls and procedures as of a date within 90 days of the filing date of this report.
(a)(ii) There was no change in the Trust’s internal control over financial reporting (as defined in Rule 30a-3(d) under the Investment Company Act) that occurred during the period covered by this report that has materially affected, or is reasonably likely to materially affect, the Trust’s internal control over financial reporting.
Item 12.
Disclosure of Securities Lending Activities for Closed-End Management
Investment Companies
Not applicable.
Item 13.
Exhibits
(a) | (1) | Not applicable. |
(a) | (2) | |
(a) | (3) | Not applicable. |
(b) |
SIGNATURES
Pursuant to the requirements of the Securities Exchange Act of 1934 and the Investment Company Act of 1940, the registrant has duly caused this report to be signed on its behalf by the undersigned, thereunto duly authorized.
Fidelity Cherry Street Trust
By: | /s/Heather Bonner |
Heather Bonner | |
President and Treasurer | |
Date: | September 21, 2023 |
Pursuant to the requirements of the Securities Exchange Act of 1934 and the Investment Company Act of 1940, this report has been signed below by the following persons on behalf of the registrant and in the capacities and on the dates indicated.
By: | /s/Heather Bonner |
Heather Bonner | |
President and Treasurer | |
Date: | September 21, 2023 |
By: | /s/John J. Burke III |
John J. Burke III | |
Chief Financial Officer | |
Date: | September 21, 2023 |