Exhibit 99.1
Net Lease Office Properties
Supplemental Financial Information
Fourth Quarter 2024

Terms and Definitions
As used in this supplemental package, the terms “Net Lease Office Properties,” “NLOP,” “we,” “us” and “our” include Net Lease Office Properties, its consolidated subsidiaries and its predecessors, unless otherwise indicated. Other terms and definitions are as follows:
| REIT | Real estate investment trust | ||||
| WPC | W. P. Carey Inc., a net-lease REIT (also our “Advisor”) | ||||
| U.S. | United States | ||||
| ABR | Contractual minimum annualized base rent | ||||
| NAREIT | National Association of Real Estate Investment Trusts (an industry trade group) | ||||
| WALT | Weighted-average lease term | ||||
| NLOP Mortgage Loan | Our $335.0 million senior secured mortgage loan, which was fully repaid during the year ended December 31, 2024 | ||||
| NLOP Mezzanine Loan | Our $120.0 million mezzanine loan facility, which is collateralized by the assignment of certain of our previously unencumbered real estate properties | ||||
| NLOP Financing Arrangements | The NLOP Mortgage Loan and NLOP Mezzanine Loan | ||||
Important Note Regarding Non-GAAP Financial Measures
This supplemental package includes certain “non-GAAP” supplemental measures that are not defined by generally accepted accounting principles (“GAAP”), including funds from operations (“FFO”); adjusted funds from operations (“AFFO”); pro rata cash net operating income (“pro rata cash NOI”); and normalized pro rata cash NOI. FFO is a non-GAAP measure defined by NAREIT. Reconciliations of these non-GAAP financial measures to their most directly comparable GAAP measures are provided within this supplemental package. In addition, refer to the Disclosures Regarding Non-GAAP and Other Metrics section in the Appendix for a description of these non-GAAP financial measures and other metrics.
Amounts may not sum to totals due to rounding.
Net Lease Office Properties
Supplemental Information – Fourth Quarter 2024
| Table of Contents | |||||
| Appendix | |||||
Net Lease Office Properties
Fourth Quarter 2024
| Summary Metrics | |||||
As of or for the three months ended December 31, 2024.
| Financial Results | |||||||||||||||||||||||
| Revenues, including reimbursable costs – consolidated ($000s) | $ | 27,730 | |||||||||||||||||||||
| Net loss attributable to NLOP ($000s) | (35,785) | ||||||||||||||||||||||
| Net loss attributable to NLOP per diluted share | (2.42) | ||||||||||||||||||||||
Normalized pro rata cash NOI ($000s) (a) (b) | 17,114 | ||||||||||||||||||||||
AFFO attributable to NLOP ($000s) (a) (b) | 11,526 | ||||||||||||||||||||||
AFFO attributable to NLOP per diluted share (a) (b) | 0.78 | ||||||||||||||||||||||
| Balance Sheet and Capitalization | |||||||||||||||||||||||
| Equity market capitalization – based on quarter end share price of $31.21 ($000s) | $ | 462,347 | |||||||||||||||||||||
| Total consolidated debt ($000s) | 169,216 | ||||||||||||||||||||||
Gross assets ($000s) (c) | 957,136 | ||||||||||||||||||||||
| Total consolidated debt to gross assets | 17.7 | % | |||||||||||||||||||||
NLOP Mortgage Loan principal outstanding ($000s) (d) | $ | — | |||||||||||||||||||||
NLOP Mezzanine Loan principal outstanding ($000s) (d) | 61,141 | ||||||||||||||||||||||
| Advisory Fees and Reimbursements Paid to WPC | |||||||||||||||||||||||
Asset management fees (e) | $ | 1,375 | |||||||||||||||||||||
Administrative reimbursements (f) | 1,000 | ||||||||||||||||||||||
Portfolio (Pro Rata) (b) | |||||||||||||||||||||||
ABR (in thousands) (g) | $ | 88,124 | |||||||||||||||||||||
| Number of properties | 39 | ||||||||||||||||||||||
| Number of tenants | 43 | ||||||||||||||||||||||
| Occupancy | 85.2 | % | |||||||||||||||||||||
| Weighted-average lease term (in years) | 4.3 | ||||||||||||||||||||||
Leasable square footage (in thousands) (h) | 5,613 | ||||||||||||||||||||||
ABR from investment grade tenants as a % of total ABR (i) | 44.4 | % | |||||||||||||||||||||
| Dispositions – number of properties sold | 6 | ||||||||||||||||||||||
| Dispositions – gross proceeds (in thousands) | $ | 47,174 | |||||||||||||||||||||
| Subsequent to Quarter End | |||||||||||||||||||||||
NLOP Mezzanine Loan principal outstanding as of the date of this report ($000s) (j) | $ | 57,874 | |||||||||||||||||||||
________
(a)Normalized pro rata cash NOI and AFFO are non-GAAP measures. See the Disclosures Regarding Non-GAAP and Other Metrics section in the Appendix for a description of our non-GAAP measures and for details on how certain non-GAAP measures are calculated.
(b)Presented on a pro rata basis. See the Disclosures Regarding Non-GAAP and Other Metrics section in the Appendix for a description of pro rata.
(c)Gross assets represent consolidated total assets before accumulated depreciation on buildings and improvements. Gross assets are net of accumulated amortization on in-place lease intangible assets of $123.0 million and above-market rent intangible assets of $17.6 million.
(d)Original principal outstanding for the NLOP Mortgage Loan was $335.0 million. The NLOP Mortgage Loan was fully repaid during the year ended December 31, 2024. Original principal outstanding for the NLOP Mezzanine Loan was $120.0 million. NLOP Mezzanine Loan principal outstanding (as a % of original principal) was 51.0% as of December 31, 2024.
(e)Pursuant to certain advisory agreements, our Advisor provides us with strategic management services, including asset management, property disposition support, and various related services. We pay our Advisor an asset management fee that was initially set at an annual amount of $7.5 million and is being proportionately reduced each month following the disposition of each portfolio property.
(f)Pursuant to certain advisory agreements, we will reimburse our Advisor a base administrative amount of approximately $4.0 million annually, for certain administrative services, including day-to-day management services, investor relations, accounting, tax, legal, and other administrative matters.
(g)See the Disclosures Regarding Non-GAAP and Other Metrics section in the Appendix for a description of ABR.
(h)Excludes 570,999 of operating square footage for a parking garage at a domestic property.
(i)Percentage of portfolio is based on ABR, as of December 31, 2024. Includes tenants or guarantors with investment grade ratings (24.8%) and subsidiaries of non-guarantor parent companies with investment grade ratings (19.6%). Investment grade refers to an entity with a rating of BBB- or higher from Standard & Poor’s Ratings Services or Baa3 or higher from Moody’s Investors Service. See the Disclosures Regarding Non-GAAP and Other Metrics section in the Appendix for a description of ABR.
(j)NLOP Mezzanine Loan principal outstanding (as a % of original principal) was 48.2% as of the date of this report.
| Net Lease Office Properties | 1 | ||||||||
Net Lease Office Properties
Fourth Quarter 2024
| Components of Net Asset Value | |||||
In thousands.
| Three Months Ended December 31, 2024 | |||||
Normalized Pro Rata Cash NOI (a) (b) | $ | 17,114 | |||
| Balance Sheet – Selected Information | As of December 31, 2024 | ||||
| Assets | |||||
Book value of select real estate (c) | $ | 30,633 | |||
| Cash and cash equivalents | 25,121 | ||||
Restricted cash, including escrow (d) | 43,305 | ||||
| Other assets, net: | |||||
| Straight-line rent adjustments | $ | 20,489 | |||
| Accounts receivable | 2,216 | ||||
| Prepaid expenses | 2,213 | ||||
| Deferred charges | 2,123 | ||||
| Taxes receivable | 228 | ||||
| Other | 1,931 | ||||
| Total other assets, net | $ | 29,200 | |||
| Liabilities | |||||
Non-recourse mortgages, net (e) | $ | 110,841 | |||
NLOP Mezzanine Loan (f) | 61,141 | ||||
NLOP Mortgage Loan (g) | — | ||||
| Accounts payable, accrued expenses and other liabilities: | |||||
| Accounts payable and accrued expenses | $ | 12,713 | |||
| Prepaid and deferred rents | 11,064 | ||||
| Accrued taxes payable | 1,199 | ||||
| Tenant security deposits | 821 | ||||
| Operating lease liabilities | 259 | ||||
| Other | 18,089 | ||||
| Total accounts payable, accrued expenses and other liabilities | $ | 44,145 | |||
________
(a)Normalized pro rata cash NOI is a non-GAAP measure. See the Disclosures Regarding Non-GAAP and Other Metrics section in the Appendix for a description of our non-GAAP measures and for details on how they are calculated.
(b)Presented on a pro rata basis. See the Disclosures Regarding Non-GAAP and Other Metrics section in the Appendix for a description of pro rata.
(c)Represents the value of real estate not appropriately captured in normalized pro rata cash NOI, such as vacant assets.
(d)Comprised of approximately $41.7 million related to certain reserve requirements for debt service, capital improvements, and real estate taxes pursuant to the NLOP Financing Arrangements. Approximately $1.6 million is related to certain reserve requirements for other loan agreements.
(e)Excludes unamortized premium, net totaling $0.4 million as of December 31, 2024.
(f)Excludes unamortized discount, net totaling $2.2 million and unamortized deferred financing costs totaling $1.0 million as of December 31, 2024.
(g)The NLOP Mortgage Loan was fully repaid during the year ended December 31, 2024.
| Net Lease Office Properties | 2 | ||||||||
Net Lease Office Properties
Fourth Quarter 2024
| Consolidated Statement of Operations | |||||
In thousands, except share and per share amounts.
| Three Months Ended December 31, 2024 | |||||
| Revenues | |||||
| Lease revenues | $ | 25,419 | |||
| Other lease-related income | 2,311 | ||||
| 27,730 | |||||
| Operating Expenses | |||||
| Impairment charges — real estate | 31,786 | ||||
| Depreciation and amortization | 11,229 | ||||
| Reimbursable tenant costs | 6,716 | ||||
| Property expenses, excluding reimbursable tenant costs | 2,963 | ||||
General and administrative (a) | 1,898 | ||||
Asset management fees (b) | 1,375 | ||||
| 55,967 | |||||
| Other Income and Expenses | |||||
Interest expense (c) | (7,620) | ||||
| Other gains and (losses) | (2,060) | ||||
| Loss on sale of real estate, net | (1,087) | ||||
| (10,767) | |||||
| Loss before income taxes | (39,004) | ||||
| Benefit from income taxes | 3,240 | ||||
| Net Loss | (35,764) | ||||
| Net income attributable to noncontrolling interests | (21) | ||||
| Net Loss Attributable to NLOP | $ | (35,785) | |||
| Basic and Diluted Loss Per Share | $ | (2.42) | |||
| Weighted-Average Shares Outstanding | |||||
| Basic and Diluted | 14,802,703 | ||||
________
(a)Includes $1.0 million of administrative reimbursements to our Advisor.
(b)Amount is comprised of fees paid to Advisor for strategic management services, including asset management, property disposition support, and various related services.
(c)Includes $2.6 million of non-cash amortization of deferred financing costs.
| Net Lease Office Properties | 3 | ||||||||
Net Lease Office Properties
Fourth Quarter 2024
| FFO and AFFO, Consolidated | |||||
In thousands, except share and per share amounts.
| Three Months Ended December 31, 2024 | |||||
| Net loss attributable to NLOP | $ | (35,785) | |||
| Adjustments: | |||||
| Impairment charges — real estate | 31,786 | ||||
| Depreciation and amortization of real property | 11,229 | ||||
| Loss on sale of real estate, net | 1,087 | ||||
Proportionate share of adjustments for noncontrolling interests (a) | (52) | ||||
| Total adjustments | 44,050 | ||||
FFO (as defined by NAREIT) Attributable to NLOP (b) | 8,265 | ||||
| Adjustments: | |||||
| Tax benefit — deferred and other | (2,900) | ||||
Other (gains) and losses (c) | 2,635 | ||||
| Amortization of deferred financing costs | 2,622 | ||||
| Above- and below-market rent intangible lease amortization, net | 476 | ||||
| Straight-line and other leasing and financing adjustments | 309 | ||||
| Other amortization and non-cash items | 108 | ||||
| Stock-based compensation | 25 | ||||
Proportionate share of adjustments for noncontrolling interests (a) | (14) | ||||
| Total adjustments | 3,261 | ||||
AFFO Attributable to NLOP (b) | $ | 11,526 | |||
| Summary | |||||
FFO (as defined by NAREIT) attributable to NLOP (b) | $ | 8,265 | |||
FFO (as defined by NAREIT) attributable to NLOP per diluted share (b) | $ | 0.56 | |||
AFFO attributable to NLOP (b) | $ | 11,526 | |||
AFFO attributable to NLOP per diluted share (b) | $ | 0.78 | |||
| Diluted weighted-average shares outstanding | 14,802,703 | ||||
________
(a)Adjustments disclosed elsewhere in this reconciliation are on a consolidated basis. This adjustment reflects our FFO or AFFO on a pro rata basis.
(b)FFO and AFFO are non-GAAP measures. See the Disclosures Regarding Non-GAAP and Other Metrics section in the Appendix for a description of our non-GAAP measures.
(c)Includes a loss of $3.2 million related to damages at a property.
| Net Lease Office Properties | 4 | ||||||||
Net Lease Office Properties
Fourth Quarter 2024
| Consolidated Balance Sheets | |||||
In thousands, except share and per share amounts.
| December 31, | |||||||||||
| 2024 | 2023 | ||||||||||
| Assets | |||||||||||
| Investments in real estate: | |||||||||||
| Land, buildings and improvements | $ | 730,345 | $ | 1,203,991 | |||||||
| Net investments in finance leases | — | 10,522 | |||||||||
| In-place lease intangible assets and other | 209,968 | 357,788 | |||||||||
| Above-market rent intangible assets | 30,512 | 57,954 | |||||||||
| Investments in real estate | 970,825 | 1,630,255 | |||||||||
| Accumulated depreciation and amortization | (292,679) | (458,430) | |||||||||
| Assets held for sale, net | 29,297 | — | |||||||||
| Net investments in real estate | 707,443 | 1,171,825 | |||||||||
| Restricted cash | 43,305 | 51,560 | |||||||||
| Cash and cash equivalents | 25,121 | 16,269 | |||||||||
| Other assets, net | 29,200 | 65,435 | |||||||||
| Total assets | $ | 805,069 | $ | 1,305,089 | |||||||
| Liabilities and Equity | |||||||||||
| Debt: | |||||||||||
| Non-recourse mortgages, net | $ | 111,259 | $ | 168,836 | |||||||
| NLOP Mezzanine Loan, net | 57,957 | 106,299 | |||||||||
| NLOP Mortgage Loan, net | — | 266,844 | |||||||||
| Debt, net | 169,216 | 541,979 | |||||||||
| Accounts payable, accrued expenses and other liabilities | 44,145 | 59,527 | |||||||||
| Below-market rent intangible liabilities, net | 6,305 | 10,643 | |||||||||
| Deferred income taxes | — | 10,450 | |||||||||
| Dividends payable | — | 1,060 | |||||||||
| Total liabilities | 219,666 | 623,659 | |||||||||
| Preferred stock, $0.001 par value, 5,000,000 shares authorized; none issued | — | — | |||||||||
| Common stock, $0.001 par value, 45,000,000 shares authorized; 14,814,075 and 14,620,919 shares, respectively, issued and outstanding | 15 | 15 | |||||||||
| Additional paid-in capital | 855,813 | 855,554 | |||||||||
| Distributions in excess of accumulated earnings | (234,443) | (142,960) | |||||||||
| Accumulated other comprehensive loss | (40,157) | (35,600) | |||||||||
| Total shareholders' equity | 581,228 | 677,009 | |||||||||
| Noncontrolling interests | 4,175 | 4,421 | |||||||||
| Total equity | 585,403 | 681,430 | |||||||||
| Total liabilities and equity | $ | 805,069 | $ | 1,305,089 | |||||||
| Net Lease Office Properties | 5 | ||||||||
Net Lease Office Properties
Fourth Quarter 2024
| Capitalization | |||||
In thousands, except share and per share amounts. As of December 31, 2024.
| Total Enterprise Value | Shares | Share Price | Market Value | |||||||||||||||||||||||
| Equity | ||||||||||||||||||||||||||
| Common equity | 14,814,075 | $ | 31.21 | $ | 462,347 | |||||||||||||||||||||
| Total Equity Market Capitalization | 462,347 | |||||||||||||||||||||||||
Outstanding Balance (a) | ||||||||||||||||||||||||||
| Debt | ||||||||||||||||||||||||||
| Non-recourse mortgages | 110,841 | |||||||||||||||||||||||||
| NLOP Mezzanine Loan | 61,141 | |||||||||||||||||||||||||
| Total Debt | 171,982 | |||||||||||||||||||||||||
| Less: Cash and cash equivalents | (25,121) | |||||||||||||||||||||||||
| Net Debt | 146,861 | |||||||||||||||||||||||||
| Total Enterprise Value | $ | 609,208 | ||||||||||||||||||||||||
________
(a)Excludes unamortized discount, net totaling $1.8 million and unamortized deferred financing costs totaling $1.0 million as of December 31, 2024.
| Net Lease Office Properties | 6 | ||||||||
Net Lease Office Properties
Fourth Quarter 2024
| Debt Overview | |||||
Dollars in thousands. Pro rata. As of December 31, 2024.
| Maturity Date | Fixed / Floating | Interest Rate | Total Outstanding Balance (a) | % of Total | ||||||||||||||||||||||||||||
| NLOP Mezzanine Loan | ||||||||||||||||||||||||||||||||
NLOP Mezzanine Loan (b) | 11/9/2028 | Fixed | 14.5 | % | $ | 61,141 | 35.6 | % | ||||||||||||||||||||||||
| Other Mortgages (Tenant Listed) | ||||||||||||||||||||||||||||||||
Northrop Grumman Systems Corporation (c) | 1/6/2025 | Fixed | 4.2 | % | 25,220 | 14.7 | % | |||||||||||||||||||||||||
| Midcontinent Independent Stm Op Inc | 5/6/2025 | Fixed | 4.0 | % | 8,933 | 5.2 | % | |||||||||||||||||||||||||
| Intuit Inc. | 5/6/2025 | Fixed | 4.0 | % | 21,900 | 12.7 | % | |||||||||||||||||||||||||
| Acosta, Inc. | 8/6/2025 | Fixed | 4.4 | % | 9,869 | 5.7 | % | |||||||||||||||||||||||||
| Siemens AS | 12/15/2025 | Floating | 4.9 | % | 38,867 | 22.6 | % | |||||||||||||||||||||||||
| North American Lighting, Inc. | 5/6/2026 | Fixed | 6.3 | % | 6,052 | 3.5 | % | |||||||||||||||||||||||||
| Total Debt Outstanding | 8.1 | % | $ | 171,982 | 100.0 | % | ||||||||||||||||||||||||||
________
(a)Excludes unamortized discount, net totaling $1.8 million and unamortized deferred financing costs totaling $1.0 million as of December 31, 2024.
(b)The NLOP Mezzanine Loan bears interest at an annual rate of 14.5% (10.0% of which is required to be paid current on a monthly basis, and 4.5% of which is a payment-in-kind accrual, on a quarterly basis). In February 2025, we repaid $3.3 million of outstanding principal on the NLOP Mezzanine Loan using excess cash. See the Summary Metrics section for the NLOP Mezzanine Loan principal outstanding following these repayments..
(c)This non-recourse mortgage loan has not been repaid as of the date of this report.
| Net Lease Office Properties | 7 | ||||||||
Net Lease Office Properties
Fourth Quarter 2024
| Dispositions | |||||
Dollars in thousands. Pro rata.
| Tenant / Lease Guarantor | Property Location(s) | Gross Sale Price | ABR (a) | Closing Date | Gross Square Footage | |||||||||||||||||||||||||||
| 4Q23 | ||||||||||||||||||||||||||||||||
| Raytheon Company | Tucson, AZ | $ | 24,575 | $ | 1,978 | Dec-23 | 143,650 | |||||||||||||||||||||||||
| Carhartt, Inc. | Dearborn, MI | 9,806 | 748 | Dec-23 | 58,722 | |||||||||||||||||||||||||||
| BCBSM, Inc. | Eagan, MN | 2,500 | 298 | Dec-23 | 29,916 | |||||||||||||||||||||||||||
| AVL Michigan Holding Corporation | Plymouth, MI | 6,200 | 575 | Dec-23 | 70,000 | |||||||||||||||||||||||||||
| 4Q23 Total | 43,081 | 3,599 | 302,288 | |||||||||||||||||||||||||||||
| 1Q24 | ||||||||||||||||||||||||||||||||
Undisclosed – UK insurance company (b) | Newport, United Kingdom | 10,497 | 1,761 | Jan-24 | 80,664 | |||||||||||||||||||||||||||
Total E&P Norge AS (b) | Stavanger, Norway | 33,072 | 5,185 | Mar-24 | 275,725 | |||||||||||||||||||||||||||
| 1Q24 Total | 43,569 | 6,946 | 356,389 | |||||||||||||||||||||||||||||
| 2Q24 | ||||||||||||||||||||||||||||||||
Exelon Generation Company, LLC (c) | Warrenville, IL | 19,830 | 2,935 | Apr-24 | 146,745 | |||||||||||||||||||||||||||
Vacant (formerly AVT Technology Solutions LLC) (c) | Tempe, AZ | 13,160 | — | Apr-24 | 132,070 | |||||||||||||||||||||||||||
| FedEx Corporation | Collierville, TN | 62,500 | 5,491 | Apr-24 | 390,380 | |||||||||||||||||||||||||||
| DMG MORI SEIKI U.S.A., INC. | Hoffman Estates, IL | 35,984 | 2,458 | Apr-24 | 104,598 | |||||||||||||||||||||||||||
| BCBSM, Inc. (2 properties) | Eagan, MN | 60,700 | 4,663 | Jun-24 | 347,472 | |||||||||||||||||||||||||||
| 2Q24 Total | 192,174 | 15,547 | 1,121,265 | |||||||||||||||||||||||||||||
| 3Q24 | ||||||||||||||||||||||||||||||||
| CVS Health Corporation | Scottsdale, AZ | 71,500 | 4,252 | Aug-24 | 354,888 | |||||||||||||||||||||||||||
| Xileh Holding Inc. | Auburn Hills, MI | 9,000 | 711 | Sep-24 | 55,490 | |||||||||||||||||||||||||||
| 3Q24 Total | 80,500 | 4,963 | 410,378 | |||||||||||||||||||||||||||||
| 4Q24 | ||||||||||||||||||||||||||||||||
E.On UK PLC (b) | Houghton le Spring, United Kingdom | 3,924 | 3,819 | Oct-24 | 217,339 | |||||||||||||||||||||||||||
| Vacant (formerly BCBSM, Inc.) | Eagan, MN | 11,650 | — | Nov-24 | 227,666 | |||||||||||||||||||||||||||
| Merative L.P. | Hartland, WI | 6,750 | 669 | Dec-24 | 81,082 | |||||||||||||||||||||||||||
| Charter Communications Operating, LLC | Bridgeton, MO | 7,350 | 820 | Dec-24 | 78,080 | |||||||||||||||||||||||||||
| Caremark RX, L.L.C. | Chandler, AZ | 15,000 | 1,645 | Dec-24 | 183,000 | |||||||||||||||||||||||||||
| Cofinity, Inc./ Aetna Life Insurance Co. | Southfield, MI | 2,500 | 1,833 | Dec-24 | 94,453 | |||||||||||||||||||||||||||
| 4Q24 Total | 47,174 | 8,786 | 881,620 | |||||||||||||||||||||||||||||
Total Dispositions (d) | $ | 406,498 | $ | 39,841 | 3,071,940 | |||||||||||||||||||||||||||
________
(a)ABR is pro forma for any agreed to and signed future rent restructurings.
(b)Amount reflects the applicable exchange rate on the date of the transaction.
(c)We transferred ownership of these properties and the related non-recourse mortgage loans to the respective mortgage lenders. Gross proceeds from these dispositions represent the mortgage principal outstanding on the respective dates of transfer.
| Net Lease Office Properties | 8 | ||||||||
Net Lease Office Properties
Fourth Quarter 2024
| Capital Expenditures and Leasing Activity | |||||
Capital Expenditures
In thousands. For the three months ended December 31, 2024.
| Tenant Improvements and Leasing Costs | |||||
| Tenant Improvements (Tenant Listed) | |||||
| Merative L.P. | $ | 767 | |||
| S&ME, Inc. | 447 | ||||
| Nokia Corporation | 245 | ||||
| 1,459 | |||||
| Leasing Costs | |||||
| CVS Health Corporation | $ | 480 | |||
| Caremark RX, L.L.C. | 415 | ||||
| 895 | |||||
| Tenant Improvements and Leasing Costs | 2,354 | ||||
| Maintenance Capital Expenditures (Tenant Listed) | |||||
| KBR, Inc. | 415 | ||||
| Pharmaceutical Product Development, LLC | 397 | ||||
| ICU MEDICAL, INC. | 258 | ||||
| Charter Communications Operating, LLC | 69 | ||||
| Other | 18 | ||||
| 1,157 | |||||
| Total: Tenant Improvements and Leasing Costs, and Maintenance Capital Expenditures | $ | 3,511 | |||
Leasing Activity
Dollars in thousands. For the three months ended December 31, 2024, except ABR. Pro rata.
Lease Renewals and Extensions (a) | Expected Tenant Improvements ($000s) | Leasing Commissions ($000s) | ||||||||||||||||||||||||||||||||||||||||||||||||
| ABR | ||||||||||||||||||||||||||||||||||||||||||||||||||
| Tenant | Location | Square Feet | Prior Lease ($000s) | New Lease ($000s) (b) | Rent Recapture | Incremental Lease Term | ||||||||||||||||||||||||||||||||||||||||||||
Google, LLC (c) | Venice, CA | 67,681 | $ | 3,018 | $ | 3,108 | 103.0 | % | $ | — | $ | 357 | 5.0 years | |||||||||||||||||||||||||||||||||||||
Total / Weighted Average (d) | 67,681 | $ | 3,018 | $ | 3,108 | 103.0 | % | $ | — | $ | 357 | 5.0 years | ||||||||||||||||||||||||||||||||||||||
| New Leases | Expected Tenant Improvements ($000s) | Leasing Commissions ($000s) | ||||||||||||||||||||||||||||||||||||||||||
| ABR | ||||||||||||||||||||||||||||||||||||||||||||
| Tenant | Location | Square Feet | Number of Leases | New Lease ($000s) (b) | New Lease Term | |||||||||||||||||||||||||||||||||||||||
Phoenix Data Systems (e) | Southfield, MI | 6,431 | 1 | $ | 72 | $ | — | $ | — | 5.0 years | ||||||||||||||||||||||||||||||||||
CT Logic (e) | Southfield, MI | 1,668 | 1 | 24 | — | — | 3.0 years | |||||||||||||||||||||||||||||||||||||
Total / Weighted Average (f) | 8,099 | 2 | $ | 96 | $ | — | $ | — | 4.5 years | |||||||||||||||||||||||||||||||||||
_______
(a)Excludes lease extensions for a period of one year or less.
(b)New lease amounts are based on in-place rents at time of lease commencement and exclude any free rent periods.
(c)Lease renewal period commences on November 1, 2025.
(d)Weighted average refers to the incremental lease term.
(e)Phoenix Data Systems and CT Logic were tenants at our multi-tenant property in Southfield, Michigan, prior to that property’s disposition in December 2024.
(f)Weighted average refers to the new lease term.
| Net Lease Office Properties | 9 | ||||||||
Net Lease Office Properties
Fourth Quarter 2024
| Top Ten Tenants | |||||
Dollars in thousands. Pro rata. As of December 31, 2024.
| Tenant / Lease Guarantor | State / Country | ABR | ABR % | Square Footage | Number of Properties | Weighted-Average Lease Term (Years) | ||||||||||||||||||||||||||||||||
KBR, Inc. (a) | Texas | $ | 20,156 | 22.9 | % | 913,713 | 1 | 5.5 | ||||||||||||||||||||||||||||||
| JPMorgan Chase Bank, N.A. | Florida, Texas | 9,069 | 10.3 | % | 666,869 | 3 | 4.4 | |||||||||||||||||||||||||||||||
Siemens AS (b) | Norway | 4,198 | 4.8 | % | 165,905 | 1 | 1.0 | |||||||||||||||||||||||||||||||
| Pharmaceutical Product Development, LLC | North Carolina | 4,063 | 4.6 | % | 219,812 | 1 | 8.9 | |||||||||||||||||||||||||||||||
| Omnicom Group, Inc. | California | 3,961 | 4.5 | % | 120,000 | 1 | 3.7 | |||||||||||||||||||||||||||||||
| R.R. Donnelley & Sons Company | Illinois | 3,393 | 3.9 | % | 167,215 | 1 | 2.7 | |||||||||||||||||||||||||||||||
| Board of Regents, State of Iowa | Iowa | 3,254 | 3.7 | % | 191,700 | 1 | 5.8 | |||||||||||||||||||||||||||||||
| Bankers Financial Corporation | Florida | 3,228 | 3.6 | % | 111,357 | 1 | 0.6 | |||||||||||||||||||||||||||||||
| Google, LLC | California | 2,930 | 3.3 | % | 67,681 | 1 | 5.8 | |||||||||||||||||||||||||||||||
| Northrop Grumman Systems Corporation | Minnesota | 2,679 | 3.0 | % | 191,336 | 1 | 4.9 | |||||||||||||||||||||||||||||||
Total (c) | $ | 56,931 | 64.6 | % | 2,815,588 | 12 | 4.7 | |||||||||||||||||||||||||||||||
________
(a)Excludes 570,999 of operating square footage for a parking garage associated with the KBR, Inc. property in Houston, Texas.
(b)ABR amounts are subject to fluctuations in foreign currency exchange rates.
(c)See the Disclosures Regarding Non-GAAP and Other Metrics section in the Appendix for a description of pro rata.
| Net Lease Office Properties | 10 | ||||||||
Net Lease Office Properties
Fourth Quarter 2024
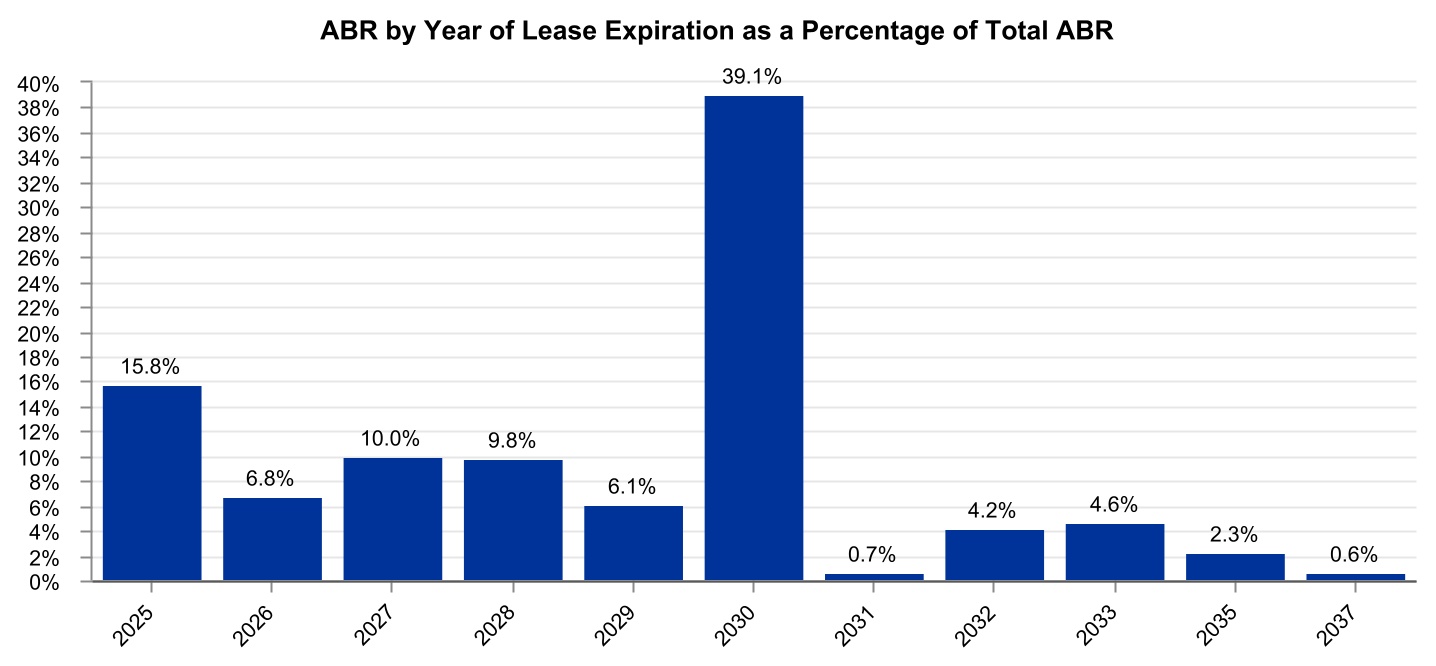
| Lease Expirations | |||||
Dollars in thousands. Pro rata. As of December 31, 2024.
Year of Lease Expiration (a) | Number of Leases Expiring | Number of Tenants with Leases Expiring | ABR | ABR % | Square Footage (b) | Square Footage % | ||||||||||||||||||||||||||||||||
| 2025 | 13 | 12 | $ | 13,890 | 15.8 | % | 730,062 | 13.0 | % | |||||||||||||||||||||||||||||
| 2026 | 7 | 7 | 6,014 | 6.8 | % | 369,460 | 6.6 | % | ||||||||||||||||||||||||||||||
| 2027 | 7 | 6 | 8,834 | 10.0 | % | 499,571 | 8.9 | % | ||||||||||||||||||||||||||||||
| 2028 | 5 | 4 | 8,628 | 9.8 | % | 371,447 | 6.6 | % | ||||||||||||||||||||||||||||||
| 2029 | 5 | 4 | 5,349 | 6.1 | % | 358,013 | 6.4 | % | ||||||||||||||||||||||||||||||
| 2030 | 7 | 6 | 34,484 | 39.1 | % | 1,772,623 | 31.6 | % | ||||||||||||||||||||||||||||||
| 2031 | 1 | 1 | 615 | 0.7 | % | 50,600 | 0.9 | % | ||||||||||||||||||||||||||||||
| 2032 | 2 | 2 | 3,692 | 4.2 | % | 257,008 | 4.6 | % | ||||||||||||||||||||||||||||||
| 2033 | 1 | 1 | 4,063 | 4.6 | % | 219,812 | 3.9 | % | ||||||||||||||||||||||||||||||
| 2035 | 1 | 1 | 2,010 | 2.3 | % | 120,147 | 2.1 | % | ||||||||||||||||||||||||||||||
| 2037 | 1 | 1 | 545 | 0.6 | % | 31,120 | 0.6 | % | ||||||||||||||||||||||||||||||
| Vacant | — | — | — | — | % | 833,297 | 14.8 | % | ||||||||||||||||||||||||||||||
Total (c) | 50 | $ | 88,124 | 100.0 | % | 5,613,160 | 100.0 | % | ||||||||||||||||||||||||||||||
________
(a)Assumes tenants do not exercise any renewal options or purchase options.
(b)Excludes 570,999 of operating square footage for a garage at a domestic property.
(c)See the Disclosures Regarding Non-GAAP and Other Metrics section in the Appendix for a description of pro rata.
| Net Lease Office Properties | 11 | ||||||||
Net Lease Office Properties
Fourth Quarter 2024
| Property List | |||||
Dollars in thousands. Pro rata. As of December 31, 2024.
U.S. Assets:
| Encumbered Status | ||||||||||||||||||||||||||||||||||||||
| # | Primary Tenant | Industry | Credit (a) | City | State | Square Footage (b) | ABR | Rent Increase Type | Date of Next Increase | WALT (c) | NLOP Mezzanine Loan | Other Mortgages | ||||||||||||||||||||||||||
| 1 | KBR, Inc. (d) (e) | Construction & Engineering | Non-IG | Houston | Texas | 1,064,788 | $21,306 | Fixed: One-time 7.78% | Jan-27 | 5.4 | ✓ | $— | ||||||||||||||||||||||||||
| 2 | JPMorgan Chase Bank, N.A. | Diversified Banks | IG | Fort Worth | Texas | 386,154 | $4,755 | CPI: 0.0% Floor / 2.0% Cap | Mar-25 | 5.2 | ✓ | $— | ||||||||||||||||||||||||||
| 3 | Pharmaceutical Product Development, LLC | Pharmaceuticals | IG | Morrisville | North Carolina | 219,812 | $4,063 | Fixed: 2.00% annually | Oct-25 | 8.9 | ✓ | $— | ||||||||||||||||||||||||||
| 4 | Omnicom Group, Inc. | Advertising | IG | Playa Vista | California | 120,000 | $3,961 | None | N/A | 3.7 | ✓ | $— | ||||||||||||||||||||||||||
| 5 | R.R. Donnelley & Sons Company | Commercial Printing | Non-IG | Warrenville | Illinois | 167,215 | $3,393 | Fixed: 2.00% annually | Sep-25 | 2.7 | ✓ | $— | ||||||||||||||||||||||||||
| 6 | Board of Regents, State of Iowa (f) | Government Related Services | IG | Coralville | Iowa | 191,700 | $3,254 | CPI: 0.0% Floor / No Cap | Nov-25 | 5.8 | $— | |||||||||||||||||||||||||||
| 7 | Bankers Financial Corporation (d) (e) | Property & Casualty Insurance | Non-IG | St. Petersburg | Florida | 167,581 | $3,228 | Fixed: 2.50% annually | N/A | 0.6 | ✓ | $— | ||||||||||||||||||||||||||
| 8 | JPMorgan Chase Bank, N.A. | Diversified Banks | IG | Tampa | Florida | 176,150 | $2,993 | CPI: 0.0% Floor / 2.0% Cap | Mar-25 | 5.2 | ✓ | $— | ||||||||||||||||||||||||||
| 9 | Google, LLC (g) | Internet Software & Services | IG | Venice | California | 67,681 | $2,930 | Fixed: 3.00% annually | Jan-25 | 5.8 | $— | |||||||||||||||||||||||||||
| 10 | ICU MEDICAL, INC. (d) | Health Care Supplies | Non-IG | Plymouth | Minnesota | 182,250 | $2,840 | Fixed: 3.25% annually | Feb-25 | 0.8 | ✓ | $— | ||||||||||||||||||||||||||
| 11 | Northrop Grumman Systems Corporation | Aerospace & Defense | IG | Plymouth | Minnesota | 191,336 | $2,679 | Fixed: 2.00% annually | Dec-25 | 4.9 | $25,220 | |||||||||||||||||||||||||||
| 12 | Intuit Inc. | Internet Software & Services | IG | Plano | Texas | 166,033 | $2,577 | Fixed: One-time $2.00/SF in '21 | N/A | 1.5 | $21,900 | |||||||||||||||||||||||||||
| 13 | Veritas Bermuda, LTD | Systems Software | Non-IG | Roseville | Minnesota | 136,125 | $2,255 | Fixed: 2.00% annually | Dec-25 | 7.9 | ✓ | $— | ||||||||||||||||||||||||||
| 14 | Cenlar FSB | Regional Banks | Non-IG | Yardley | Pennsylvania | 105,584 | $2,052 | Fixed: 2.70% annually | Jan-25 | 3.5 | ✓ | $— | ||||||||||||||||||||||||||
| 15 | iHeartCommunications, Inc. | Broadcasting | Non-IG | San Antonio | Texas | 120,147 | $2,010 | Fixed: 2.00% annually | Feb-25 | 10.1 | ✓ | $— | ||||||||||||||||||||||||||
| 16 | Arbella Service Company, Inc. | Property & Casualty Insurance | IG | Quincy | Massachusetts | 132,160 | $1,850 | Fixed: One-time $1.00/SF in '22 | N/A | 2.4 | ✓ | $— | ||||||||||||||||||||||||||
| 17 | ICF Consulting Group, Inc. | IT Consulting & Other Services | Non-IG | Martinsville | Virginia | 93,333 | $1,785 | CPI: 0.0% Floor / No Cap | Jan-25 | 2.1 | ✓ | $— | ||||||||||||||||||||||||||
| 18 | Acosta, Inc. | Advertising | Non-IG | Jacksonville | Florida | 88,062 | $1,541 | Fixed: $0.50/SF annually | Jul-25 | 2.6 | $9,869 | |||||||||||||||||||||||||||
| 19 | Safelite Group, Inc. | Specialized Consumer Services | Non-IG | Rio Rancho | New Mexico | 94,649 | $1,500 | Fixed: 2.00% annually | Jan-25 | 4.4 | ✓ | $— | ||||||||||||||||||||||||||
| 20 | Master Lock Company, LLC | Building Products | Non-IG | Oak Creek | Wisconsin | 120,883 | $1,437 | Fixed: 2.00% annually | Jun-25 | 7.4 | ✓ | $— | ||||||||||||||||||||||||||
| 21 | JPMorgan Chase Bank, N.A. (d) (e) | Diversified Banks | IG | Tampa | Florida | 135,733 | $1,389 | CPI: 0.0% Floor / 2.0% Cap | N/A | 0.2 | ✓ | $— | ||||||||||||||||||||||||||
| 22 | Midcontinent Independent Stm Op Inc. | Electric Utilities | IG | Eagan | Minnesota | 60,463 | $1,133 | Fixed: $0.25/SF annually | Mar-25 | 1.2 | $8,933 | |||||||||||||||||||||||||||
| Net Lease Office Properties | 12 | ||||||||
| 23 | Emerson Electric Co. | Industrial Machinery | IG | Houston | Texas | 52,144 | $1,108 | Fixed: $0.50/SF annually | N/A | 0.8 | ✓ | $— | ||||||||||||||||||||||||||
| 24 | Radiate Holdings, L.P. | Cable & Satellite | Non-IG | San Marcos | Texas | 47,000 | $1,074 | CPI: 0.0% Floor / 3.0% Cap | Aug-25 | 3.7 | $— | |||||||||||||||||||||||||||
| 25 | North American Lighting, Inc. | Auto Parts & Equipment | Non-IG | Farmington Hills | Michigan | 75,286 | $1,058 | Fixed: 2.50% annually | Apr-25 | 1.2 | $6,052 | |||||||||||||||||||||||||||
| 26 | Arcfield Acquisition Corporation | Aerospace & Defense | Non-IG | King of Prussia | Pennsylvania | 88,578 | $1,000 | Fixed: One-time 17.50% in '23 | N/A | 0.9 | ✓ | $— | ||||||||||||||||||||||||||
| 27 | Pioneer Credit Recovery, Inc. (d) | Diversified Support Services | Non-IG | Moorestown | New Jersey | 65,567 | $924 | Fixed: 2.50% annually | Jan-25 | 3.1 | ✓ | $— | ||||||||||||||||||||||||||
| 28 | Undisclosed – multi-national provider of industrial gases | Industrial Gases | IG | Houston | Texas | 49,821 | $617 | Fixed: 2.00% annually | Jan-25 | 1.0 | ✓ | $— | ||||||||||||||||||||||||||
| 29 | APCO Holdings, Inc. | Property & Casualty Insurance | Non-IG | Norcross | Georgia | 50,600 | $615 | Fixed: 2.50% annually | Mar-25 | 6.2 | ✓ | $— | ||||||||||||||||||||||||||
| 30 | S&ME, Inc. | Environmental & Facilities Services | Non-IG | Raleigh | North Carolina | 31,120 | $545 | Fixed: 2.75% annually | Mar-25 | 12.2 | ✓ | $— | ||||||||||||||||||||||||||
| 31 | Radiate Holdings, L.P. | Cable & Satellite | Non-IG | Waco | Texas | 30,699 | $473 | CPI: 0.0% Floor / 3.0% Cap | Aug-25 | 3.7 | $— | |||||||||||||||||||||||||||
| 32 | Radiate Holdings, L.P. | Cable & Satellite | Non-IG | Corpus Christi | Texas | 20,717 | $354 | CPI: 0.0% Floor / 3.0% Cap | Aug-25 | 3.7 | $— | |||||||||||||||||||||||||||
| 33 | Radiate Holdings, L.P. | Cable & Satellite | Non-IG | Odessa | Texas | 21,193 | $236 | CPI: 0.0% Floor / 3.0% Cap | Aug-25 | 3.7 | $— | |||||||||||||||||||||||||||
| 34 | Radiate Holdings, L.P. | Cable & Satellite | Non-IG | San Marcos | Texas | 14,400 | $212 | CPI: 0.0% Floor / 3.0% Cap | Aug-25 | 3.7 | ✓ | $— | ||||||||||||||||||||||||||
| 35 | Vacant (formerly BCBSM, Inc.) (h) | N/A | N/A | Eagan | Minnesota | 442,542 | $0 | N/A | N/A | 0.0 | ✓ | $— | ||||||||||||||||||||||||||
| 36 | Vacant (formerly McKesson Corporation) (h) | N/A | N/A | The Woodlands | Texas | 204,063 | $0 | N/A | N/A | 0.0 | ✓ | $— | ||||||||||||||||||||||||||
| 37 | Vacant (formerly BCBSM, Inc.) (h) | N/A | N/A | Eagan | Minnesota | 12,286 | $0 | N/A | N/A | 0.0 | ✓ | $— | ||||||||||||||||||||||||||
U.S. Total (i) | 5,393,855 | $83,147 | 4.5 | $71,974 | ||||||||||||||||||||||||||||||||||
European Assets:
| Encumbered Status | ||||||||||||||||||||||||||||||||||||||
| # | Primary Tenant | Industry | Credit (a) | City | Country | Square Footage | ABR | Rent Increase Type | Date of Next Increase | WALT (c) | NLOP Mezzanine Loan | Other Mortgages | ||||||||||||||||||||||||||
| 1 | Siemens AS | Industrial Conglomerates | IG | Oslo | Norway | 165,905 | $4,198 | CPI: 0.0% Floor / No Cap | Jan-25 | 1.0 | $38,867 | |||||||||||||||||||||||||||
| 2 | Nokia Corporation | Communications Equipment | IG | Krakow | Poland | 53,400 | $779 | CPI: 0.0% Floor / No Cap | Sep-25 | 4.7 | $— | |||||||||||||||||||||||||||
European Total (i) | 219,305 | $4,977 | 1.5 | $38,867 | ||||||||||||||||||||||||||||||||||
________
✓ Indicates an asset that is in the NLOP Mezzanine Loan collateral pool.
(a)“IG” refers to investment grade rated tenants.
(b)Excludes 570,999 of operating square footage for a parking garage associated with the KBR, Inc. property in Houston, Texas.
(c)Assumes parties do not exercise any renewal or purchase options pursuant to their applicable leases.
(d)Denotes multi-tenant property. Primary tenant generating largest percentage of ABR shown. Industry, credit, rent increase type and next rent increase are for primary tenant.
(e)Denotes leased property that is not 100% occupied.
(f)We own a 90% controlling interest in this consolidated property.
(g)In October 2024, the tenant exercised its renewal option, which begins November 1, 2025. Renewal rent resets to $3.1 million, with 3.00% annual rent increases beginning November 1, 2026.
(h)Denotes property that is vacant as of the date of this report.
(i)See the Disclosures Regarding Non-GAAP and Other Metrics section in the Appendix for a description of pro rata.
| Net Lease Office Properties | 13 | ||||||||
Net Lease Office Properties
Appendix
Fourth Quarter 2024

| Net Lease Office Properties | 14 | ||||||||
Net Lease Office Properties
Fourth Quarter 2024
| Normalized Pro Rata Cash NOI | |||||
In thousands.
| Three Months Ended December 31, 2024 | |||||
| Consolidated Lease Revenues and Other | |||||
| Total lease revenues – as reported | $ | 25,419 | |||
Parking garage revenues (a) | 545 | ||||
| Less: Consolidated Reimbursable and Non-Reimbursable Property Expenses | |||||
| Reimbursable property expenses – as reported | 6,716 | ||||
| Non-reimbursable property expenses – as reported | 2,963 | ||||
| 16,285 | |||||
| Adjustments for Pro Rata Ownership of Real Estate Joint Ventures: | |||||
| Less: Pro rata share of NOI attributable to noncontrolling interests | (90) | ||||
| (90) | |||||
| 16,195 | |||||
| Adjustments for Pro Rata Non-Cash Items: | |||||
| Add: Above- and below-market rent intangible lease amortization | 476 | ||||
| Less: Straight-line and other leasing and financing adjustments | 309 | ||||
| Add: Other non-cash items | 107 | ||||
| 892 | |||||
Pro Rata Cash NOI (b) | 17,087 | ||||
Adjustment to normalize for intra-period dispositions (c) | 27 | ||||
Normalized Pro Rata Cash NOI (b) | $ | 17,114 | |||
| Net Lease Office Properties | 15 | ||||||||
Net Lease Office Properties
Fourth Quarter 2024
The following table presents a reconciliation from Net loss attributable to NLOP to Normalized pro rata cash NOI:
| Three Months Ended December 31, 2024 | |||||
| Net Loss Attributable to NLOP | |||||
| Net loss attributable to NLOP – as reported | $ | (35,785) | |||
| Adjustments for Consolidated Operating Expenses | |||||
| Add: Operating expenses – as reported | 55,967 | ||||
| Less: Property expenses, excluding reimbursable tenant costs – as reported | (2,963) | ||||
| 53,004 | |||||
| Adjustments for Other Consolidated Revenues and Expenses: | |||||
| Less: Other lease-related income (excluding parking garage revenues) | (1,766) | ||||
| Less: Reimbursable property expenses – as reported | (6,716) | ||||
| Add: Other income and (expenses) – as reported | 10,767 | ||||
| Add: Benefit from income taxes – as reported | (3,240) | ||||
| (955) | |||||
| Other Adjustments: | |||||
| Add: Above- and below-market rent intangible lease amortization | 476 | ||||
| Less: Straight-line and other leasing and financing adjustments | 309 | ||||
| Add: Property expenses, excluding reimbursable tenant costs, non-cash | 107 | ||||
| Add: Adjustments for pro rata ownership | (69) | ||||
Adjustment to normalize for intra-period dispositions (c) | 27 | ||||
| 850 | |||||
Normalized Pro Rata Cash NOI (b) | $ | 17,114 | |||
________
(a)Amount is comprised of revenues from a parking garage at a domestic property and is included in Other lease-related income on our consolidated income statements.
(b)Pro rata cash NOI and normalized pro rata cash NOI are non-GAAP measures. See the Disclosures Regarding Non-GAAP and Other Metrics section that follows for a description of our non-GAAP measures and for details on how pro rata cash NOI and normalized pro rata cash NOI are calculated.
(c)For properties disposed of during the period, the adjustment eliminates our pro rata share of cash NOI for the period.
| Net Lease Office Properties | 16 | ||||||||
Net Lease Office Properties
Fourth Quarter 2024
| Disclosures Regarding Non-GAAP and Other Metrics | |||||
Non-GAAP Financial Disclosures
FFO and AFFO
Due to certain unique operating characteristics of real estate companies, as discussed below, NAREIT, an industry trade group, has promulgated a non-GAAP measure known as FFO, which we believe to be an appropriate supplemental measure, when used in addition to and in conjunction with results presented in accordance with GAAP, to reflect the operating performance of a REIT. The use of FFO is recommended by the REIT industry as a supplemental non-GAAP measure. FFO is not equivalent to, nor a substitute for, net income or loss as determined under GAAP.
We define FFO, a non-GAAP measure, consistent with the standards established by the White Paper on FFO approved by the Board of Governors of NAREIT, as restated in December 2018. The White Paper defines FFO as net income or loss computed in accordance with GAAP, excluding gains or losses from the sale of certain real estate, impairment charges on real estate or other assets incidental to the company’s main business, gains or losses on changes in control of interests in real estate and depreciation and amortization from real estate assets; and after adjustments for unconsolidated partnerships and jointly owned investments. Adjustments for unconsolidated partnerships and jointly owned investments are calculated to reflect FFO on the same basis.
We also modify the NAREIT computation of FFO to adjust GAAP net income for certain non-cash charges, such as amortization of real estate-related intangibles, deferred income tax benefits and expenses, straight-line rent and related reserves, other non-cash rent adjustments, non-cash allowance for credit losses on finance leases, stock-based compensation, non-cash environmental accretion expense, amortization of discounts and premiums on debt and amortization of deferred financing costs. Our assessment of our operations is focused on long-term sustainability and not on such non-cash items, which may cause short-term fluctuations in net income but have no impact on cash flows. Additionally, we exclude non-core income and expenses, such as gains or losses from extinguishment of debt, merger and acquisition expenses, and spin-off expenses. We also exclude realized and unrealized gains/losses on foreign currency exchange rate movements (other than those realized on the settlement of foreign currency derivatives), which are not considered fundamental attributes of our business plan and do not affect our overall long-term operating performance. We refer to our modified definition of FFO as AFFO. We exclude these items from GAAP net income to arrive at AFFO as they are not the primary drivers in our decision-making process and excluding these items provides investors a view of our portfolio performance over time and makes it more comparable to other REITs. AFFO also reflects adjustments for jointly owned investments. We use AFFO as one measure of our operating performance when we formulate corporate goals, evaluate the effectiveness of our strategies and determine executive compensation.
We believe that AFFO is a useful supplemental measure for investors to consider as we believe it will help them to better assess the sustainability of our operating performance without the potentially distorting impact of these short-term fluctuations. However, there are limits on the usefulness of AFFO to investors. For example, impairment charges and unrealized foreign currency exchange rate losses that we exclude may become actual realized losses upon the ultimate disposition of the properties in the form of lower cash proceeds or other considerations. We use our FFO and AFFO measures as supplemental financial measures of operating performance. We do not use our FFO and AFFO measures as, nor should they be considered to be, alternatives to net income computed under GAAP, or as alternatives to net cash provided by operating activities computed under GAAP, or as indicators of our ability to fund our cash needs.
Pro Rata Cash NOI
Cash net operating income (“cash NOI”) is a non-GAAP financial measure that is intended to reflect the performance of our properties. We define cash NOI as cash rents from our properties less non-reimbursable property expenses. Cash NOI excludes amortization of intangibles and straight-line rent adjustments that are included in GAAP lease revenues. We present cash NOI on a pro rata basis (“pro rata cash NOI”) to account for our share of income related to noncontrolling interests. We believe that pro rata cash NOI is a helpful measure that both investors and management can use to evaluate the financial performance of our properties and it allows for comparison of our operating performance between periods and to other REITs. Pro rata cash NOI should not be considered as an alternative to net income as an indication of our financial performance or to cash flows as a measure of liquidity or our ability to fund all needs. The method by which we calculate and present cash NOI and/or pro rata cash NOI may not be directly comparable to the way other REITs present such metrics.
Normalized Pro Rata Cash NOI
Normalized pro rata cash NOI is pro rata cash NOI as defined above adjusted primarily to exclude our pro rata share of cash NOI from properties disposed of during the most recent quarter. We believe this measure provides a helpful representation of our net operating income from our in-place leased properties.
| Net Lease Office Properties | 17 | ||||||||
Net Lease Office Properties
Fourth Quarter 2024
Other Metrics
Pro Rata Metrics
This supplemental package contains certain metrics prepared on a pro rata basis. We refer to these metrics as pro rata metrics. We have one investment in which our economic ownership is less than 100%. On a full consolidation basis, we report 100% of the assets, liabilities, revenues and expenses of this investment that is deemed to be under our control, even though our ownership is less than 100%. On a pro rata basis, we generally present our proportionate share, based on our economic ownership of this jointly owned investment, of the assets, liabilities, revenues and expenses of this investment. Multiplying our jointly owned investment’s financial statement line items by our percentage ownership and adding or subtracting those amounts from our totals, as applicable, may not accurately depict the legal and economic implications of holding an ownership interest of less than 100% in our jointly owned investment.
ABR
ABR represents contractual minimum annualized base rent for our properties and reflects exchange rates as of December 31, 2024. If there is a rent abatement, we annualize the first monthly contractual base rent following the free rent period. ABR is presented on a pro rata basis.
| Net Lease Office Properties | 18 | ||||||||