Exhibit 99.1
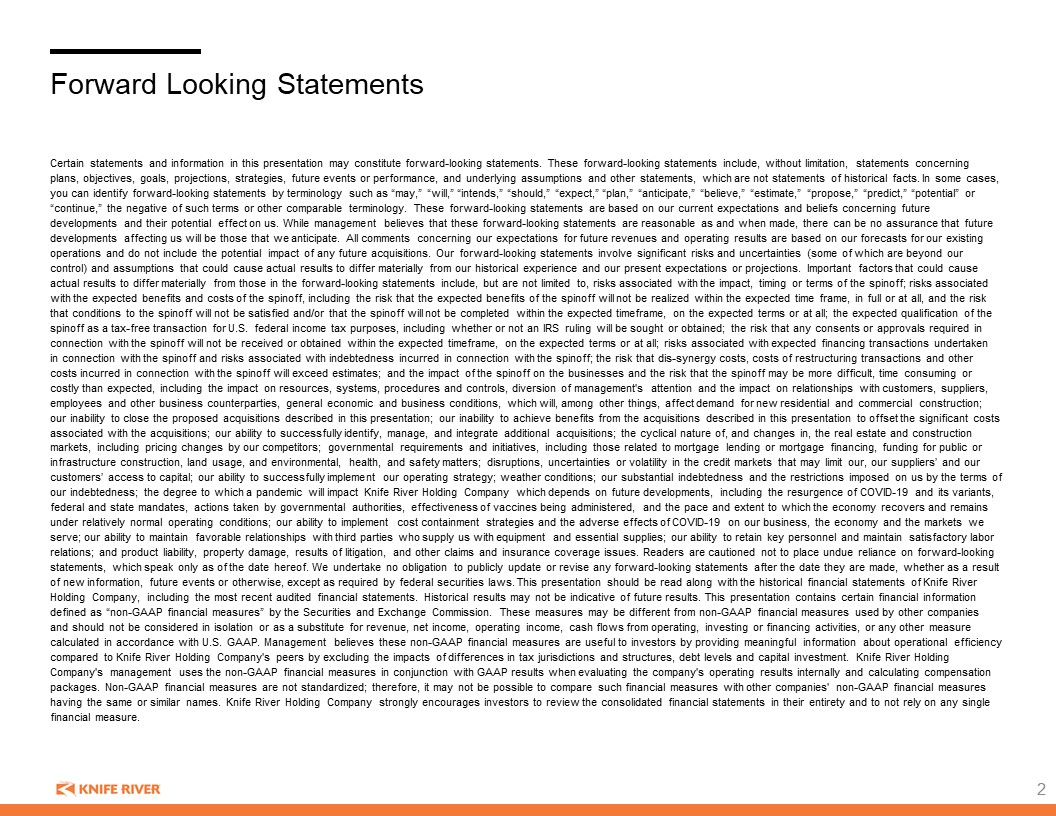
Forward Looking Statements Certain statements and information in this presentation may constitute forward-looking statements. These forward-looking statements include, without limitation, statements concerning plans, objectives, goals, projections, strategies, future events or performance, and underlying assumptions and other statements, which are not statements of historical facts. In some cases, you can identify forward-looking statements by terminology such as “may,” “will,” “intends,” “should,” “expect,” “plan,” “anticipate,” “believe,” “estimate,” “propose,” “predict,” “potential” or “continue,” the negative of such terms or other comparable terminology. These forward-looking statements are based on our current expectations and beliefs concerning future developments and their potential effect on us. While management believes that these forward-looking statements are reasonable as and when made, there can be no assurance that future developments affecting us will be those that we anticipate. All comments concerning our expectations for future revenues and operating results are based on our forecasts for our existing operations and do not include the potential impact of any future acquisitions. Our forward-looking statements involve significant risks and uncertainties (some of which are beyond our control) and assumptions that could cause actual results to differ materially from our historical experience and our present expectations or projections. Important factors that could cause actual results to differ materially from those in the forward-looking statements include, but are not limited to, risks associated with the impact, timing or terms of the spinoff; risks associated with the expected benefits and costs of the spinoff, including the risk that the expected benefits of the spinoff will not be realized within the expected time frame, in full or at all, and the risk that conditions to the spinoff will not be satisfied and/or that the spinoff will not be completed within the expected timeframe, on the expected terms or at all; the expected qualification of the spinoff as a tax-free transaction for U.S. federal income tax purposes, including whether or not an IRS ruling will be sought or obtained; the risk that any consents or approvals required in connection with the spinoff will not be received or obtained within the expected timeframe, on the expected terms or at all; risks associated with expected financing transactions undertaken in connection with the spinoff and risks associated with indebtedness incurred in connection with the spinoff; the risk that dis-synergy costs, costs of restructuring transactions and other costs incurred in connection with the spinoff will exceed estimates; and the impact of the spinoff on the businesses and the risk that the spinoff may be more difficult, time consuming or costly than expected, including the impact on resources, systems, procedures and controls, diversion of management's attention and the impact on relationships with customers, suppliers, employees and other business counterparties, general economic and business conditions, which will, among other things, affect demand for new residential and commercial construction; our inability to close the proposed acquisitions described in this presentation; our inability to achieve benefits from the acquisitions described in this presentation to offset the significant costs associated with the acquisitions; our ability to successfully identify, manage, and integrate additional acquisitions; the cyclical nature of, and changes in, the real estate and construction markets, including pricing changes by our competitors; governmental requirements and initiatives, including those related to mortgage lending or mortgage financing, funding for public or infrastructure construction, land usage, and environmental, health, and safety matters; disruptions, uncertainties or volatility in the credit markets that may limit our, our suppliers’ and our customers’ access to capital; our ability to successfully implement our operating strategy; weather conditions; our substantial indebtedness and the restrictions imposed on us by the terms of our indebtedness; the degree to which a pandemic will impact Knife River Holding Company which depends on future developments, including the resurgence of COVID-19 and its variants, federal and state mandates, actions taken by governmental authorities, effectiveness of vaccines being administered, and the pace and extent to which the economy recovers and remains under relatively normal operating conditions; our ability to implement cost containment strategies and the adverse effects of COVID-19 on our business, the economy and the markets we serve; our ability to maintain favorable relationships with third parties who supply us with equipment and essential supplies; our ability to retain key personnel and maintain satisfactory labor relations; and product liability, property damage, results of litigation, and other claims and insurance coverage issues. Readers are cautioned not to place undue reliance on forward-looking statements, which speak only as of the date hereof. We undertake no obligation to publicly update or revise any forward-looking statements after the date they are made, whether as a result of new information, future events or otherwise, except as required by federal securities laws. This presentation should be read along with the historical financial statements of Knife River Holding Company, including the most recent audited financial statements. Historical results may not be indicative of future results. This presentation contains certain financial information defined as “non-GAAP financial measures” by the Securities and Exchange Commission. These measures may be different from non-GAAP financial measures used by other companies and should not be considered in isolation or as a substitute for revenue, net income, operating income, cash flows from operating, investing or financing activities, or any other measure calculated in accordance with U.S. GAAP. Management believes these non-GAAP financial measures are useful to investors by providing meaningful information about operational efficiency compared to Knife River Holding Company's peers by excluding the impacts of differences in tax jurisdictions and structures, debt levels and capital investment. Knife River Holding Company's management uses the non-GAAP financial measures in conjunction with GAAP results when evaluating the company's operating results internally and calculating compensation packages. Non-GAAP financial measures are not standardized; therefore, it may not be possible to compare such financial measures with other companies' non-GAAP financial measures having the same or similar names. Knife River Holding Company strongly encourages investors to review the consolidated financial statements in their entirety and to not rely on any single financial measure.
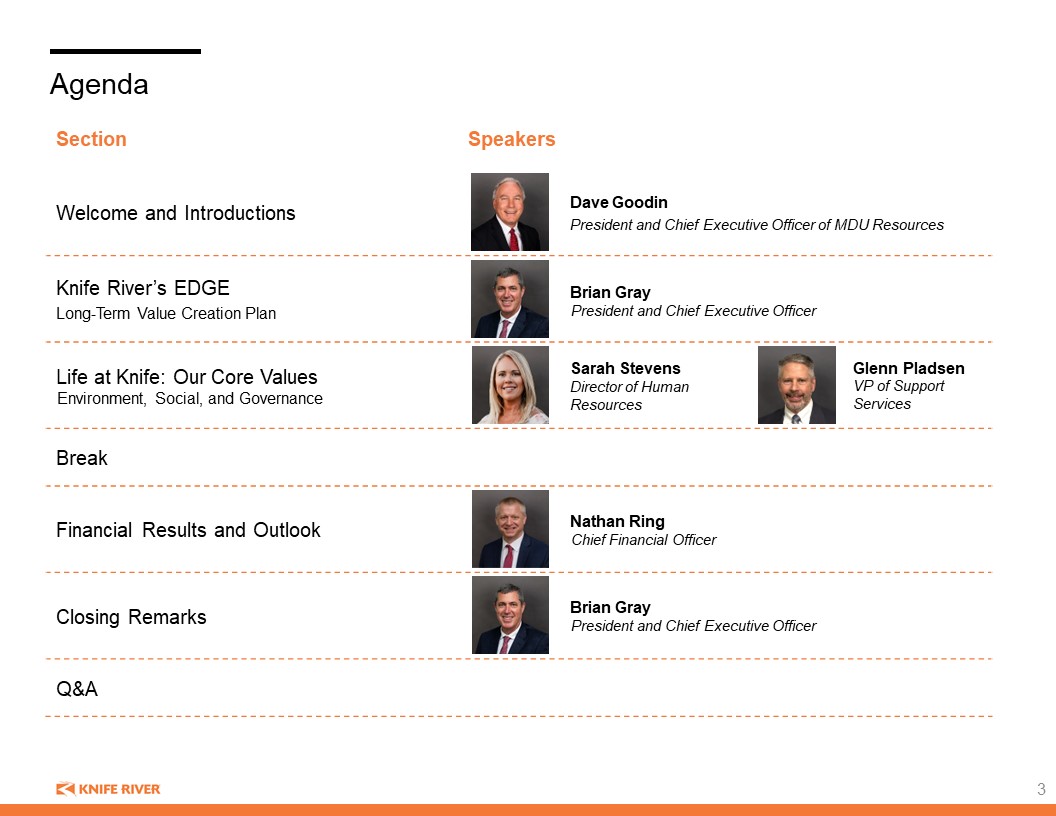
Section Speakers Welcome and Introductions Dave Goodin President and Chief Executive Officer of MDU Resources Knife River’s EDGE Long-Term Value Creation Plan Brian GrayPresident and Chief Executive Officer Life at Knife: Our Core ValuesEnvironment, Social, and Governance Sarah Stevens Director of Human Resources Break Financial Results and Outlook Nathan RingChief Financial Officer Closing Remarks Brian GrayPresident and Chief Executive Officer Q&A Agenda Glenn Pladsen VP of Support Services 3

Welcome and introductions 10
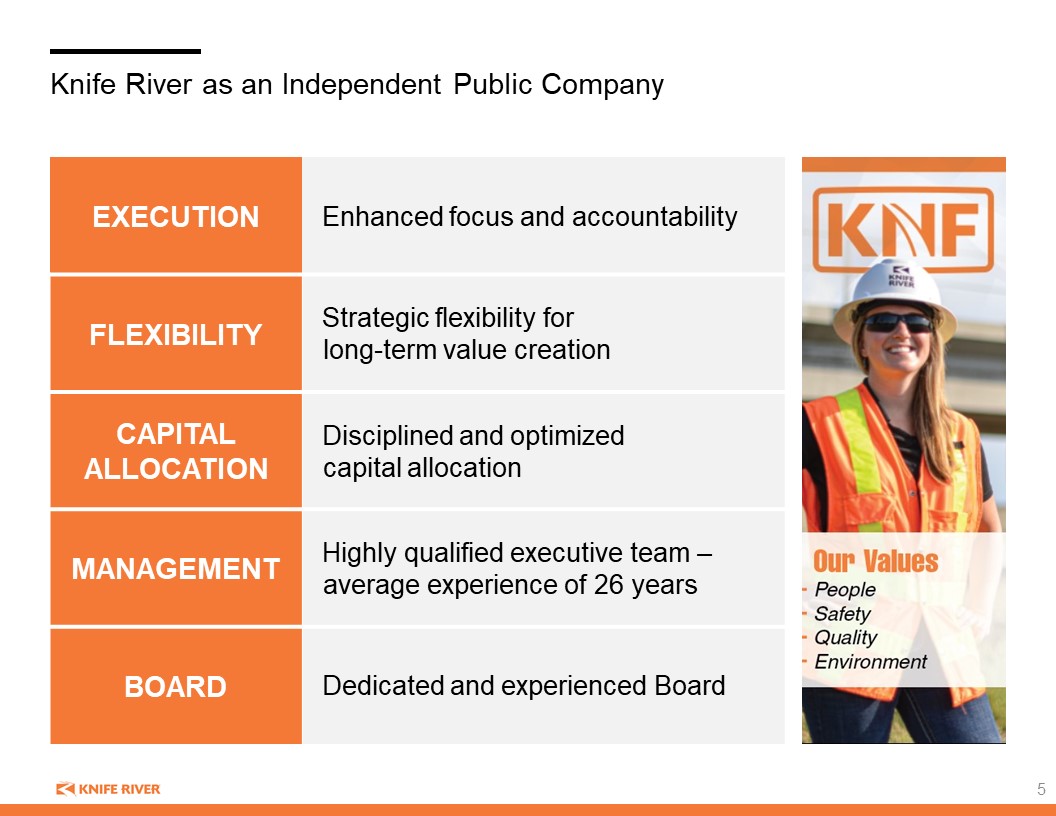
Knife River as an Independent Public Company EXECUTION Enhanced focus and accountability FLEXIBILITY Strategic flexibility forlong-term value creation CAPITAL ALLOCATION Disciplined and optimizedcapital allocation MANAGEMENT Highly qualified executive team – average experience of 26 years BOARD Dedicated and experienced Board 5

Highly Qualified Board of Directors experienced and diverse board Brian Gray President and CEO of Knife River German Carmona Alvarez Global President of Applied Intelligence at Wood PLC Karen Fagg (Chair) Former Vice President of DOWL HKM; Former Chair, CEO, and majority owner of HKM Engineering Inc. Thomas Everist Chair and President of The Everist Company Patricia Moss Former Vice Chair, President, and CEO of Cascade Bancorp and Bank of the Cascades William Sandbrook Chairman and Co-CEO of Andretti Acquisition Corp.; Former Chair, President, and CEO of U.S. Concrete 6
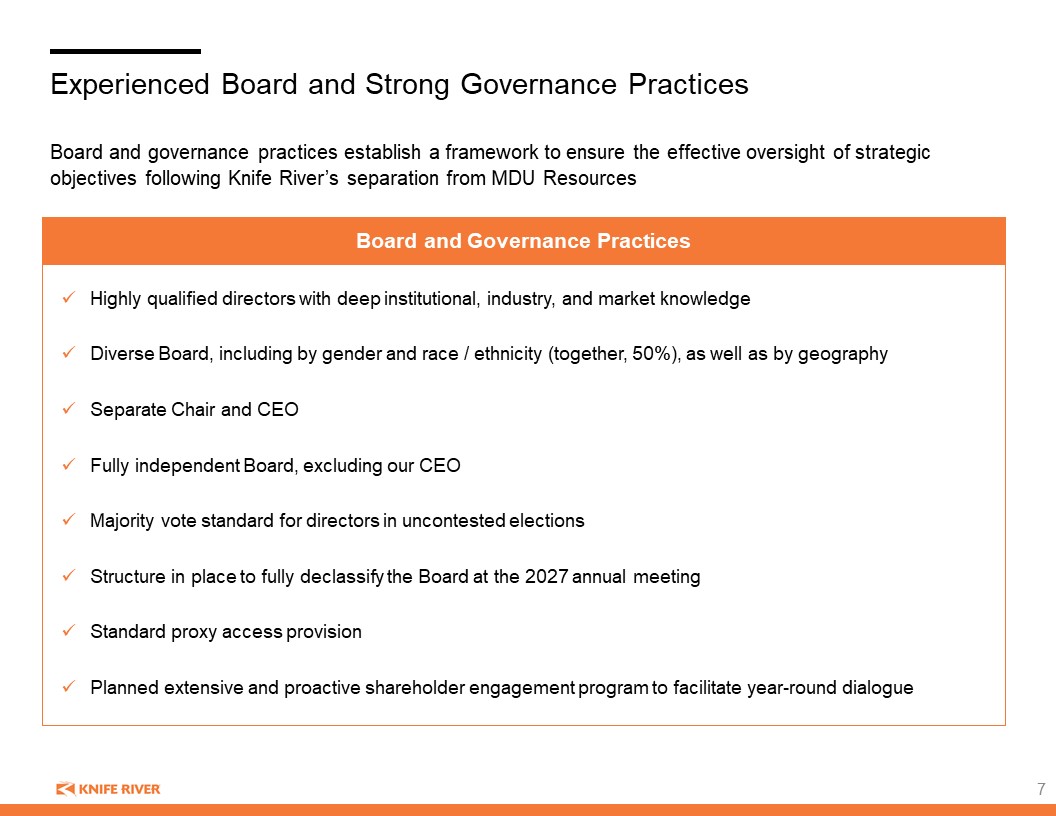
Experienced Board and Strong Governance Practices Board and governance practices establish a framework to ensure the effective oversight of strategic objectives following Knife River’s separation from MDU Resources Highly qualified directors with deep institutional, industry, and market knowledge Diverse Board, including by gender and race / ethnicity (together, 50%), as well as by geography Separate Chair and CEO Fully independent Board, excluding our CEO Majority vote standard for directors in uncontested elections Structure in place to fully declassify the Board at the 2027 annual meeting Standard proxy access provision Planned extensive and proactive shareholder engagement program to facilitate year-round dialogue Board and Governance Practices

Long-Tenured Leadership Team With Exceptional Industry Knowledge 8 Nathan RingVice President and Chief Financial Officer 20+ years at Knife River and MDU Resources Former Vice President of Business Development from 2017-2022 Brian GrayPresident and Chief Executive Officer 30 years at Knife River Former President of Knife River’s Northwest segment from 2012-2022 Strong, Experienced MANAGEMENT TEAM Trevor HastingsVice President and Chief Operating Officer 27+ years at Knife River and MDU Resources Former President and CEO of WBI Energy, an MDU Resources subsidiary, since 2017 Karl Liepitz Vice President, Chief Legal Officer, and Secretary 19+ years at MDU Resources Former Vice President, General Counsel, and Secretary of MDU Resources Nancy K. Christenson Vice President of Administration 45+ years at Knife River and MDU Resources Former Vice President of Administration, since 2009, and Vice President / Chief Accounting Officer from 2003-2009, amongst other accounting roles at the company Glenn PladsenVice President of Support Services 16+ years at Knife River and MDU Resources Former Director of Information Technology at Knife River, and led capital budgeting process and national account programs, amongst multiple other roles at the company John QuadeVice President of Business Development 28+ years at Knife River and MDU Resources Former President of Knife River's North Central segment from 2012-2023 Marney KadrmasChief Accounting Officer 23+ years at Knife River Former controller for the Northwest Segment and former Director of Accounting

Knife river’s edge: long-term value creation plan 4

Our History of Execution and Growth EDGE 2023 + Sustainable Growth 2018 – 2022 Operational Excellence 2008 – 2017 Build to Scale 1992 – 2007 Expanded from 1 to 13 additional states with an emphasis on high-growth regional markets across western and central U.S. 1992: Acquired first aggregate site 2008: Introduced Knife River branding 2023: Future of Independent Knife River 2022: Announced spin off from MDU Resources Achieved operational efficiencies by leveraging corporate scale, know-how and a vertically integrated business model Revitalized M&A with greater emphasis on people, environment and sustainability Competitive EDGE designed to create substantial value for shareholders Number of Acquisitions 65 ROIC Expansion1 ~1,140 bps 5-Year AverageAdj. EBITDA Margin2 11.6% Adj. EBITDA Margin ~15% by 2025 20%+ Long-term Note: EBITDA, Adj. EBITDA and Cash Flow are non-GAAP measures, see Appendix for reconciliation. 1 ROIC calculated as Operating Income / (Average Equity + Average Debt); 2 Reflects average of 2018-2022 Pro Forma Adjusted EBITDA. 10
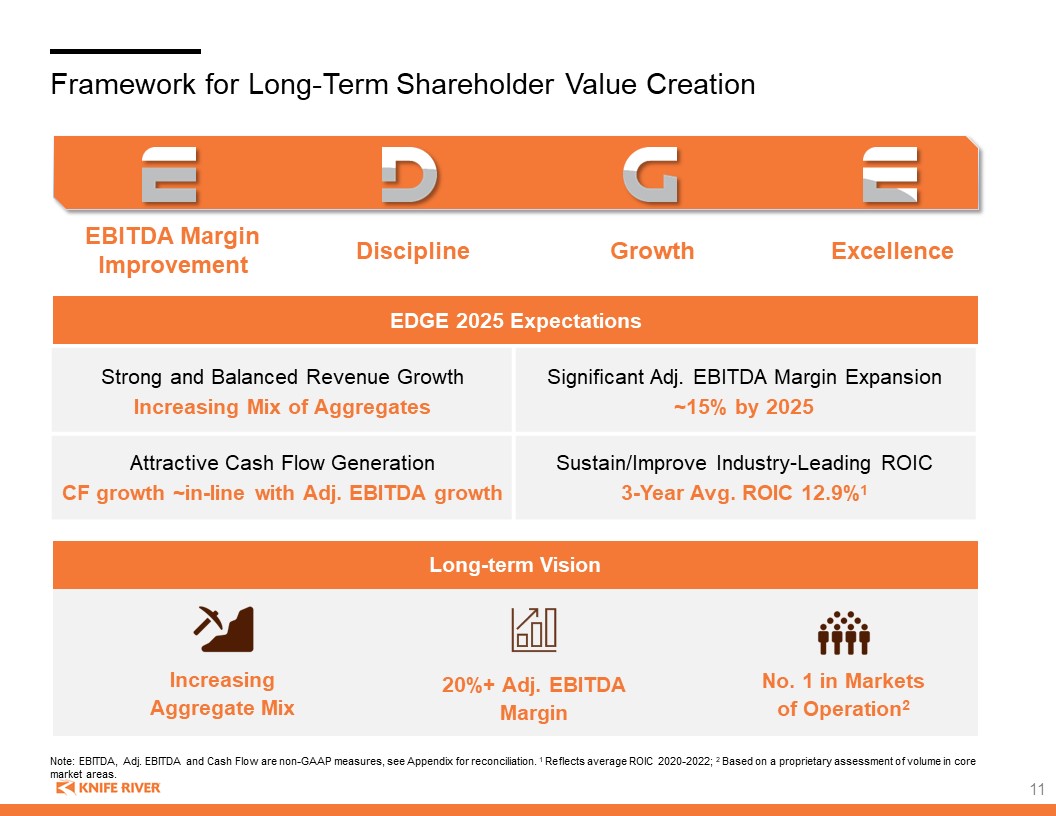
Framework for Long-Term Shareholder Value Creation EBITDA Margin Improvement Discipline Growth Excellence No. 1 in Markets of Operation2 Increasing Aggregate Mix 20%+ Adj. EBITDA Margin EDGE 2025 Expectations Long-term Vision Strong and Balanced Revenue Growth Increasing Mix of Aggregates Significant Adj. EBITDA Margin Expansion ~15% by 2025 Attractive Cash Flow Generation CF growth ~in-line with Adj. EBITDA growth Sustain/Improve Industry-Leading ROIC 3-Year Avg. ROIC 12.9%1 11 Note: EBITDA, Adj. EBITDA and Cash Flow are non-GAAP measures, see Appendix for reconciliation. 1 Reflects average ROIC 2020-2022; 2 Based on a proprietary assessment of volume in core market areas.
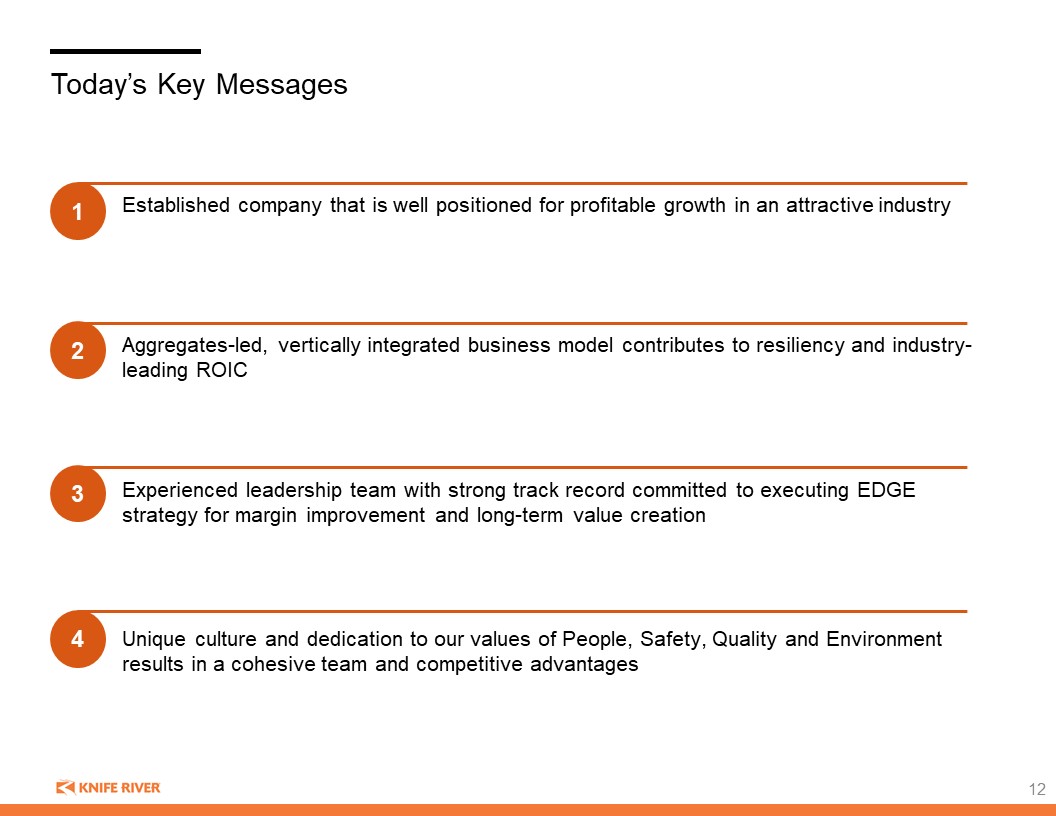
Today’s Key Messages Established company that is well positioned for profitable growth in an attractive industry 1 Aggregates-led, vertically integrated business model contributes to resiliency and industry-leading ROIC 2 Experienced leadership team with strong track record committed to executing EDGE strategy for margin improvement and long-term value creation 3 Unique culture and dedication to our values of People, Safety, Quality and Environment results in a cohesive team and competitive advantages 4 12
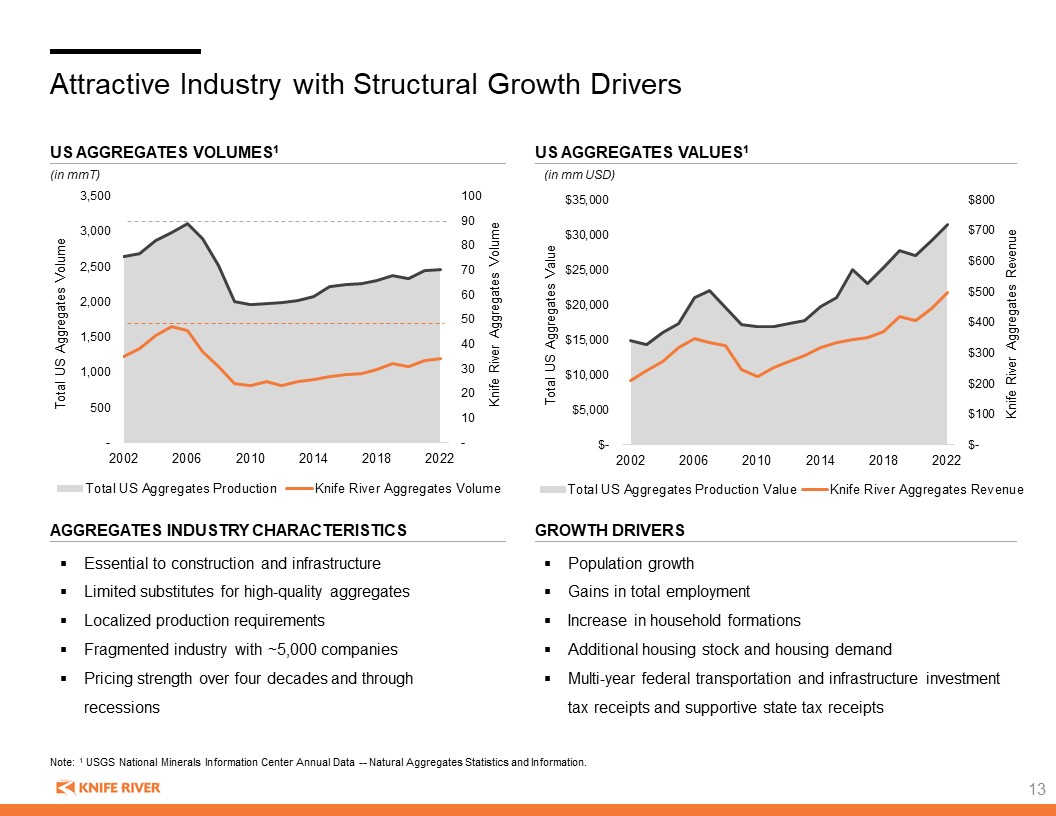
Attractive Industry with Structural Growth Drivers Essential to construction and infrastructure Limited substitutes for high-quality aggregates Localized production requirements Fragmented industry with ~5,000 companies Pricing strength over four decades and through recessions Population growth Gains in total employment Increase in household formations Additional housing stock and housing demand Multi-year federal transportation and infrastructure investment tax receipts and supportive state tax receipts Note: 1 USGS National Minerals Information Center Annual Data -- Natural Aggregates Statistics and Information. US AGGREGATES VALUES1 US AGGREGATES VOLUMES1 AGGREGATES INDUSTRY CHARACTERISTICS GROWTH DRIVERS (in mmT) (in mm USD) 13
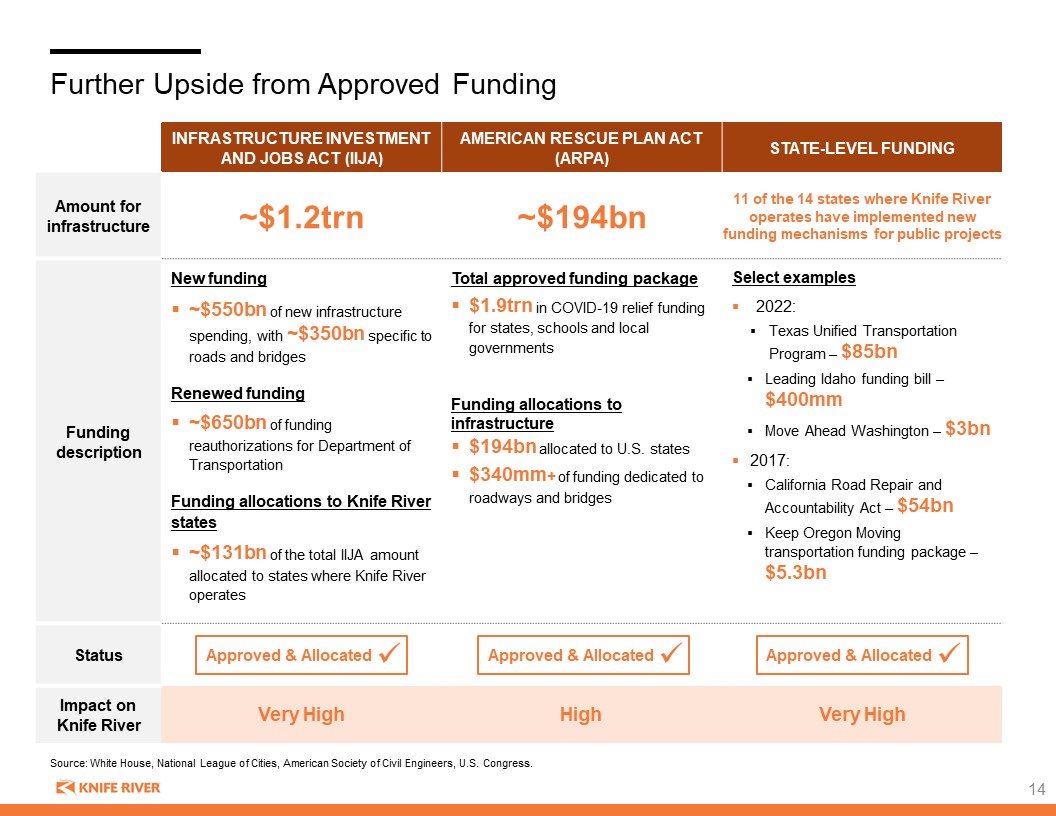
Further Upside from Approved Funding Source: White House, National League of Cities, American Society of Civil Engineers, U.S. Congress. Infrastructure Investment and Jobs Act (IIJA) American Rescue Plan Act (ARPA) State-level funding Amount for infrastructure ~$1.2trn ~$194bn 11 of the 14 states where Knife River operates have implemented new funding mechanisms for public projects Funding description New funding ~$550bn of new infrastructure spending, with ~$350bn specific to roads and bridges Renewed funding ~$650bn of funding reauthorizations for Department of Transportation Funding allocations to Knife River states ~$131bn of the total IIJA amount allocated to states where Knife River operates Total approved funding package $1.9trn in COVID-19 relief funding for states, schools and local governments Funding allocations to infrastructure $194bn allocated to U.S. states $340mm+ of funding dedicated to roadways and bridges Select examples 2022: Texas Unified Transportation Program – $85bn Leading Idaho funding bill – $400mm Move Ahead Washington – $3bn 2017: California Road Repair and Accountability Act – $54bn Keep Oregon Moving transportation funding package – $5.3bn Status Impact on Knife River Very High High Very High Approved & Allocated Approved & Allocated Approved & Allocated 14

Leading Integrated Materials and Services Provider Strong Competitive Position in Attractive High Growth Mid-sized Markets Top 101 US aggregates producer 70% of revenue from states growing faster than national average revenue mix by product3,4 Aggregates 16% Ready-Mix Concrete 19% Asphalt 14% Other 13% Contracting Services 38% 75%+ of Aggregate Revenues 50%+ of Downstream Materials Revenues Majority of Revenue from our No. 1 markets2,3 Note: 1 Source: USGS; 2 Based on a proprietary assessment of volume in core market areas; 3 As of 12/31/2022; 4 % of 2022 Gross Revenue. 15 3 3 3
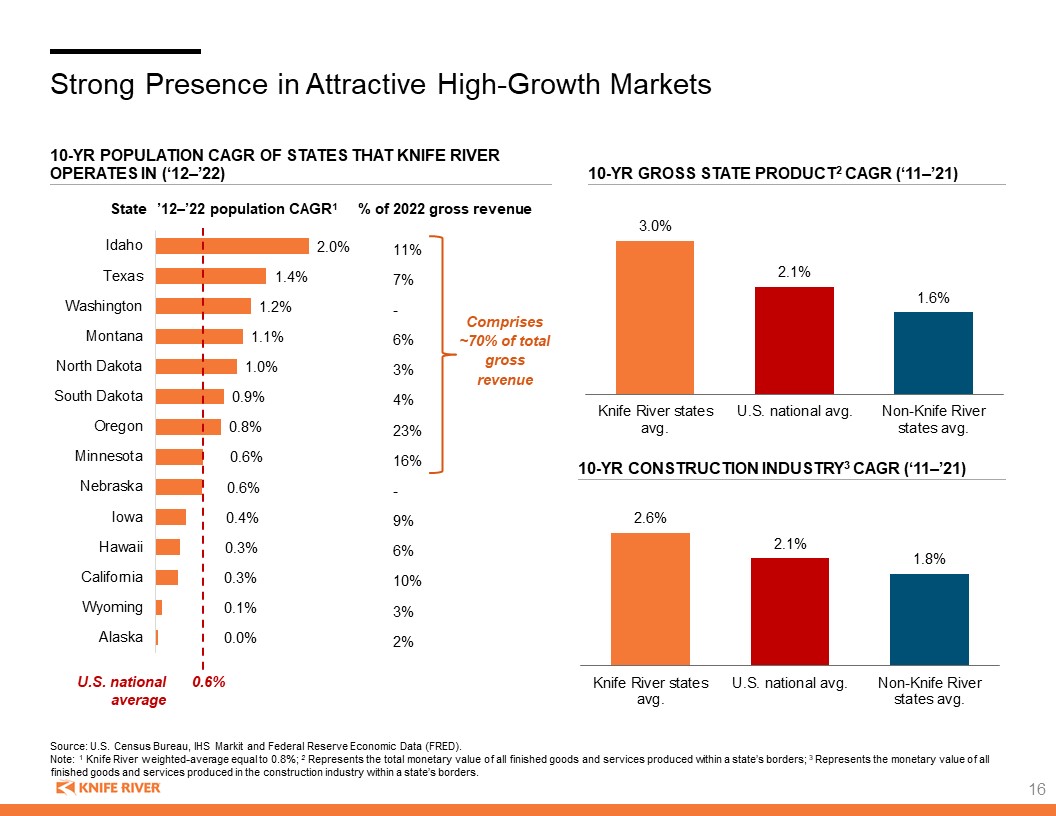
11% 7% - 6% 3% 4% 23% 16% - 9% 6% 10% 3% 2% Strong Presence in Attractive High-Growth Markets U.S. national average 10-yr population cagr of states that Knife River operates in (‘12–’22) Source: U.S. Census Bureau, IHS Markit and Federal Reserve Economic Data (FRED). Note: 1 Knife River weighted-average equal to 0.8%; 2 Represents the total monetary value of all finished goods and services produced within a state’s borders; 3 Represents the monetary value of all finished goods and services produced in the construction industry within a state’s borders. 10-yr Gross state product2 cagr (‘11–’21) 10-yr Construction industry3 cagr (‘11–’21) Comprises ~70% of total gross revenue 0.6% State ’12–’22 population CAGR1 % of 2022 gross revenue 16

2022 Revenue $469 MM $600 MM $542 MM $608 MM $353 MM $2,535 MM Business Mix 2022 EBITDA Margin 11.9% 17.3% 13.4% 10.7% 2.7% 11.7%2 3-yr Avg. EBITDA Margin 15.0% 17.4% 12.9% 12.1% 4.6% 12.4%2 Regional Overview Pacific Northwest Mountain North Central All Other1 Contracting Services Materials Note: EBITDA, Adj. EBITDA and Cash Flow are non-GAAP measures, see Appendix for reconciliation. Revenue represents 2022 revenue and business mix represents 2022 revenue mix before intersegment eliminations. Pie chart numbers are rounded and may not sum to 100%. 1 All Other segment consists of Energy Services, Texas and corporate services; 2 Pro Forma Adjusted EBITDA. Company 17

Differentiated Strategy for Attractive Returns and Profitable Growth BUSINESS STRATEGY CHOICE OF MARKETS Mid-sized, high-growth markets Targeted investment in adjacencies to create and strengthen market-leading position Increasing scale and vertical integration strengthens competitive positioning VERTICAL INTEGRATION We are a ‘vendor of choice’ because of our ability to deliver end-to-end Integration ensures high reliability in our supply chain, making us a highly dependable partner for complex projects RESERVES High quality reserves in key fast-growing markets Well-placed to benefit from expected structural growth, with additional upside from allocated funding dollars RESILIENCE ACROSS CYCLES HIGH FLEXIBILITY AND VISIBILITY INDUSTRY-LEADING ROIC1 STRONG BALANCE SHEET FINANCIAL OUTCOMES AND LONG-TERM VALUE CREATION EXECUTION UNIQUE CROSS-SECTIONAL COMPETENCIES IMPACTFUL CULTURE WELL-DEFINED PATH TO DELIVERING ON THE EDGE PLAN 18 Note: 1 Peers used for comparison: Construction Partners, Granite Construction, Martin Marietta Materials, Summit Materials, Tutor Perini, Vulcan Materials.

Creating Value Through Vertical Integration Upstream Materials (13%) Strategic storage and distribution capacity in select markets Strong, reliable relationships with suppliers Leading market positions with internal proprietary expertise that ensure reliable quality and sourcing Downstream Materials (33%) No. 1 positioning in 21 ready-mix concrete and asphalt key markets1 Operational and logistics capabilities with internal transportation network Flexible operations with access to a broad network of roads through portable equipment Contracting Services (38%) Resilient with majority exposure to public customers Reliable internal supply chain of high-quality materials Unique ability to flexibly shift between public/private customers, job size and complexity Aggregates (16%) Strategic high-quality reserves in key markets with above average population growth 75%+ of revenues from markets where we have No. 1 share1 Leading operational and logistics capabilities with internal transportation network Note: % of 2022 Revenue. 1 Based on a proprietary assessment of volume in core market areas. Reliable demand pull-through for our materials, a key element of resilience Reliable supply of high-quality materials and services, a key competitive advantage 19
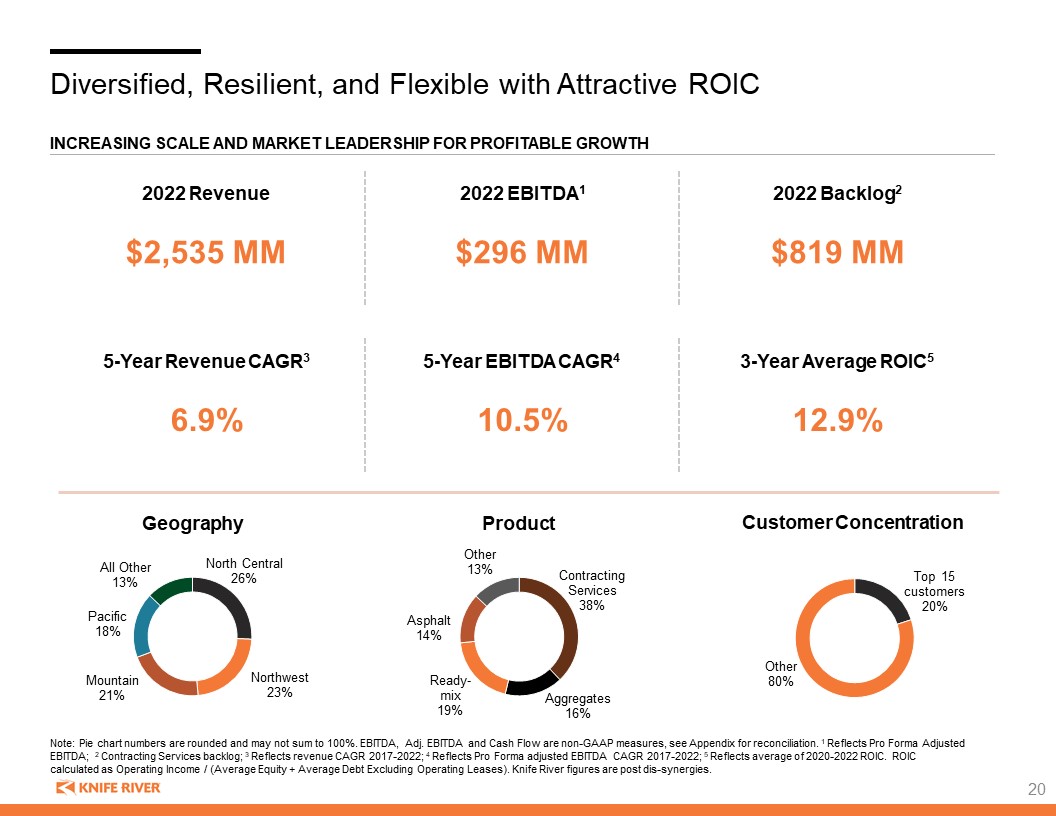
Diversified, Resilient, and Flexible with Attractive ROIC Increasing Scale and Market Leadership for Profitable Growth 2022 EBITDA1 2022 Backlog2 2022 Revenue $2,535 MM $296 MM $819 MM 5-Year Revenue CAGR3 5-Year EBITDA CAGR4 3-Year Average ROIC5 6.9% 10.5% 12.9% Geography Product Customer Concentration Note: Pie chart numbers are rounded and may not sum to 100%. EBITDA, Adj. EBITDA and Cash Flow are non-GAAP measures, see Appendix for reconciliation. 1 Reflects Pro Forma Adjusted EBITDA; 2 Contracting Services backlog; 3 Reflects revenue CAGR 2017-2022; 4 Reflects Pro Forma adjusted EBITDA CAGR 2017-2022; 5 Reflects average of 2020-2022 ROIC. ROIC calculated as Operating Income / (Average Equity + Average Debt Excluding Operating Leases). Knife River figures are post dis-synergies. 20
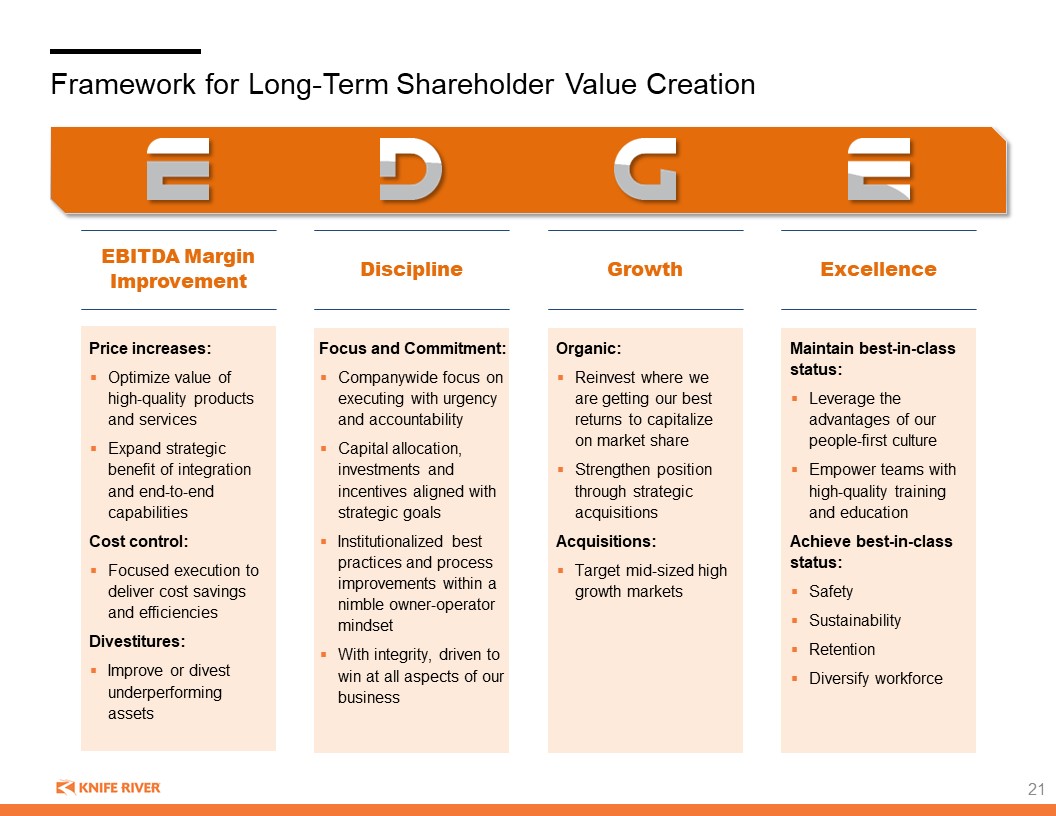
Framework for Long-Term Shareholder Value Creation EBITDA Margin Improvement Discipline Growth Excellence Price increases: Optimize value of high-quality products and services Expand strategic benefit of integration and end-to-end capabilities Cost control: Focused execution to deliver cost savings and efficiencies Divestitures: Improve or divest underperforming assets Focus and Commitment: Companywide focus on executing with urgency and accountability Capital allocation, investments and incentives aligned with strategic goals Institutionalized best practices and process improvements within a nimble owner-operator mindset With integrity, driven to win at all aspects of our business Organic: Reinvest where we are getting our best returns to capitalize on market share Strengthen position through strategic acquisitions Acquisitions: Target mid-sized high growth markets Maintain best-in-class status: Leverage the advantages of our people-first culture Empower teams with high-quality training and education Achieve best-in-class status: Safety Sustainability Retention Diversify workforce 21
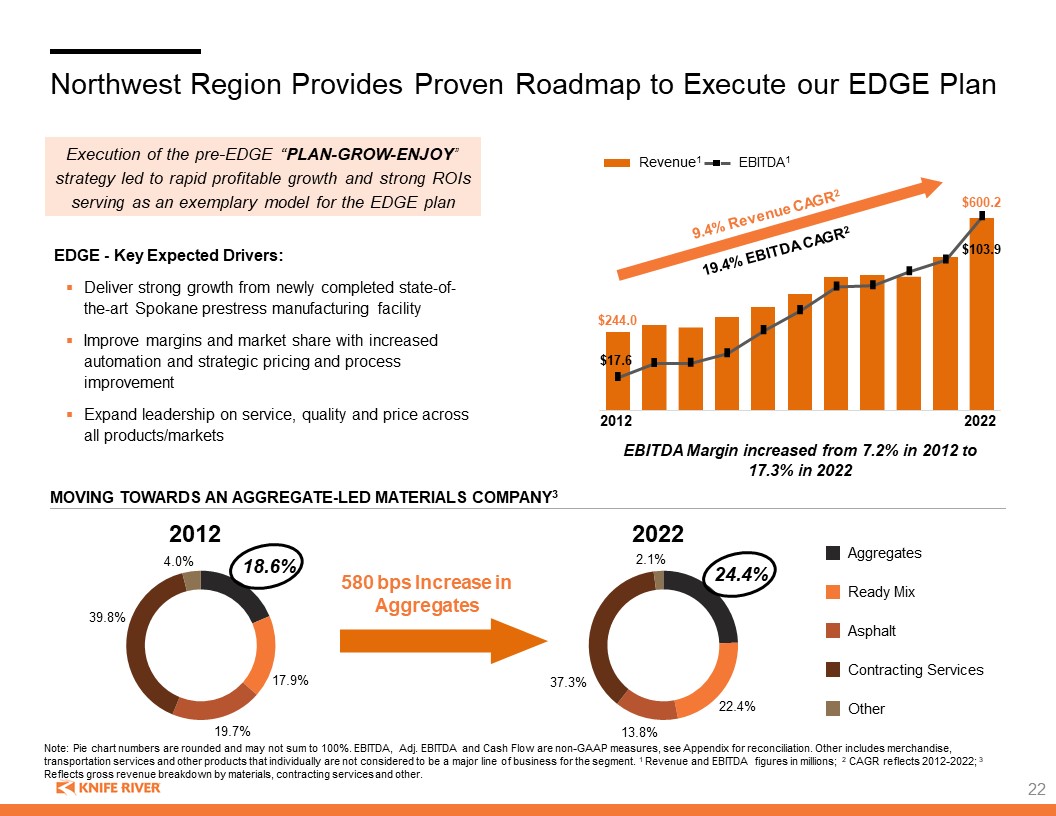
Northwest Region Provides Proven Roadmap to Execute our EDGE Plan EDGE - Key Expected Drivers: Deliver strong growth from newly completed state-of-the-art Spokane prestress manufacturing facility Improve margins and market share with increased automation and strategic pricing and process improvement Expand leadership on service, quality and price across all products/markets 580 bps Increase in Aggregates 2022 2012 Revenue1 EBITDA1 $244.0 $600.2 $17.6 $103.9 9.4% Revenue CAGR2 19.4% EBITDA CAGR2 2012 2022 EBITDA Margin increased from 7.2% in 2012 to 17.3% in 2022 Ready Mix Asphalt Contracting Services Other Aggregates Moving towards an aggregate-led materials company3 Note: Pie chart numbers are rounded and may not sum to 100%. EBITDA, Adj. EBITDA and Cash Flow are non-GAAP measures, see Appendix for reconciliation. Other includes merchandise, transportation services and other products that individually are not considered to be a major line of business for the segment. 1 Revenue and EBITDA figures in millions; 2 CAGR reflects 2012-2022; 3 Reflects gross revenue breakdown by materials, contracting services and other. Execution of the pre-EDGE “PLAN-GROW-ENJOY” strategy led to rapid profitable growth and strong ROIs serving as an exemplary model for the EDGE plan 22
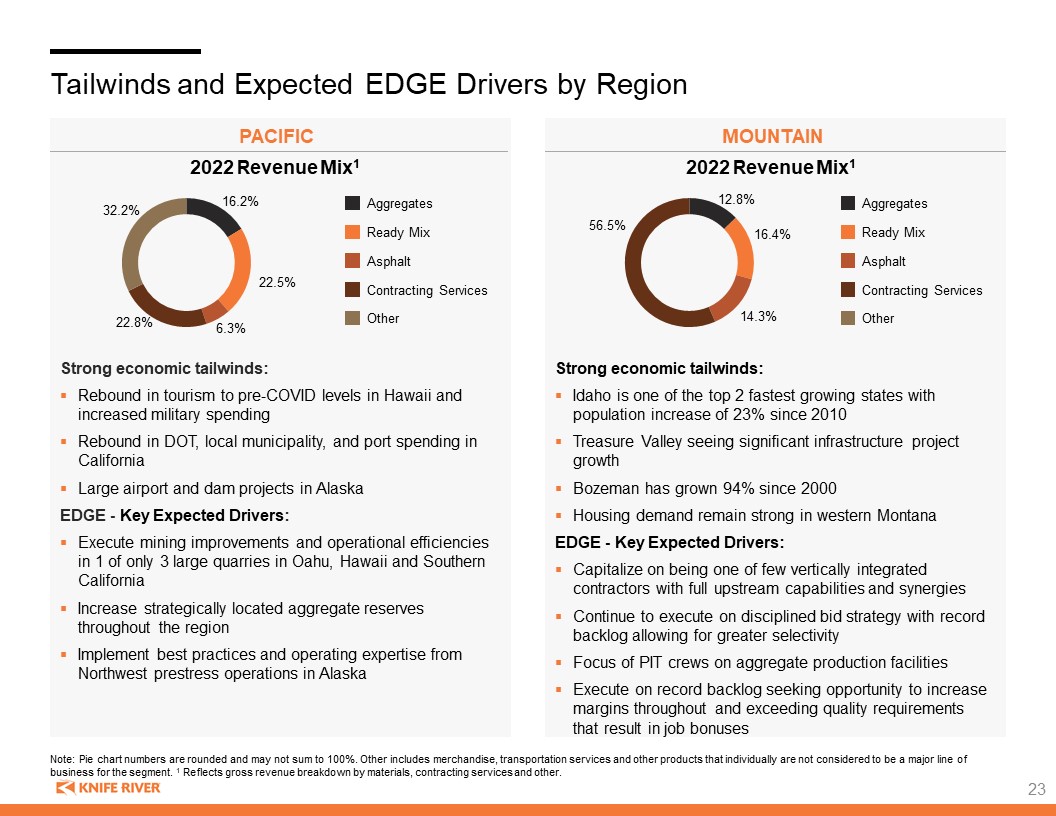
Tailwinds and Expected EDGE Drivers by Region Strong economic tailwinds: Rebound in tourism to pre-COVID levels in Hawaii and increased military spending Rebound in DOT, local municipality, and port spending in California Large airport and dam projects in Alaska EDGE - Key Expected Drivers: Execute mining improvements and operational efficiencies in 1 of only 3 large quarries in Oahu, Hawaii and Southern California Increase strategically located aggregate reserves throughout the region Implement best practices and operating expertise from Northwest prestress operations in Alaska Note: Pie chart numbers are rounded and may not sum to 100%. Other includes merchandise, transportation services and other products that individually are not considered to be a major line of business for the segment. 1 Reflects gross revenue breakdown by materials, contracting services and other. pacific 2022 Revenue Mix1 mountain Strong economic tailwinds: Idaho is one of the top 2 fastest growing states with population increase of 23% since 2010 Treasure Valley seeing significant infrastructure project growth Bozeman has grown 94% since 2000 Housing demand remain strong in western Montana EDGE - Key Expected Drivers: Capitalize on being one of few vertically integrated contractors with full upstream capabilities and synergies Continue to execute on disciplined bid strategy with record backlog allowing for greater selectivity Focus of PIT crews on aggregate production facilities Execute on record backlog seeking opportunity to increase margins throughout and exceeding quality requirements that result in job bonuses 2022 Revenue Mix1 Ready Mix Asphalt Contracting Services Other Aggregates Ready Mix Asphalt Contracting Services Other Aggregates 23
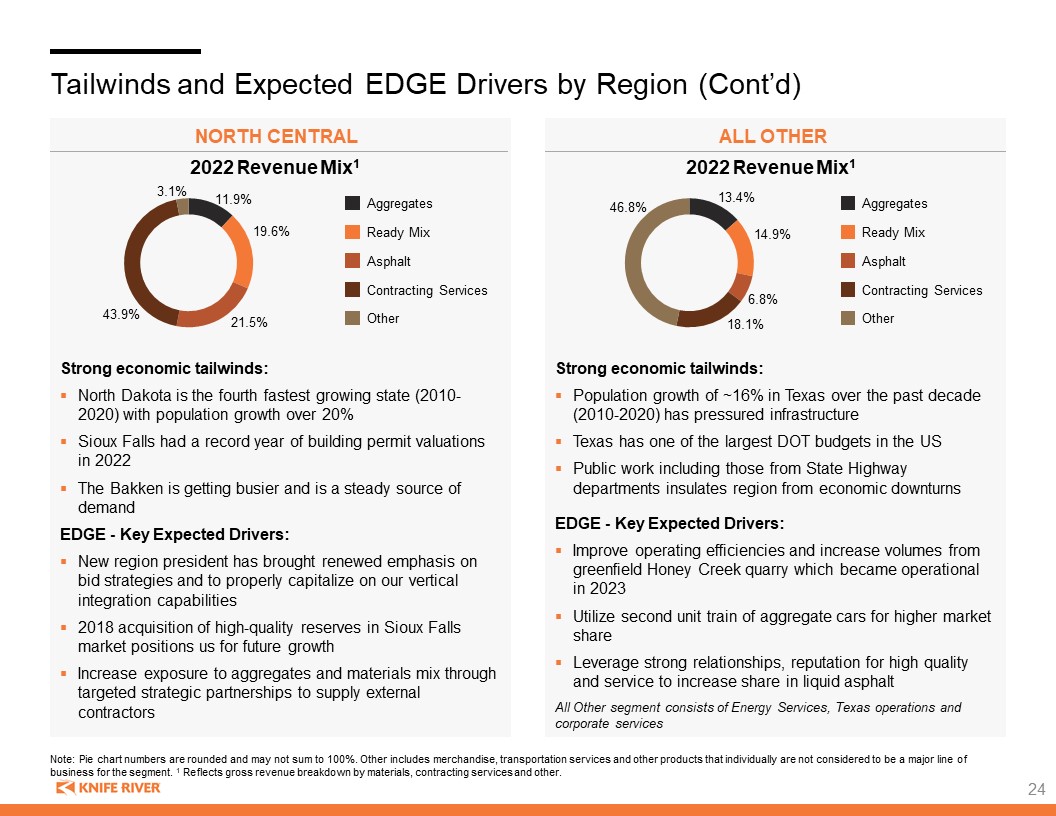
Tailwinds and Expected EDGE Drivers by Region (Cont’d) Strong economic tailwinds: North Dakota is the fourth fastest growing state (2010-2020) with population growth over 20% Sioux Falls had a record year of building permit valuations in 2022 The Bakken is getting busier and is a steady source of demand EDGE - Key Expected Drivers: New region president has brought renewed emphasis on bid strategies and to properly capitalize on our vertical integration capabilities 2018 acquisition of high-quality reserves in Sioux Falls market positions us for future growth Increase exposure to aggregates and materials mix through targeted strategic partnerships to supply external contractors North central All other Strong economic tailwinds: Population growth of ~16% in Texas over the past decade (2010-2020) has pressured infrastructure Texas has one of the largest DOT budgets in the US Public work including those from State Highway departments insulates region from economic downturns EDGE - Key Expected Drivers: Improve operating efficiencies and increase volumes from greenfield Honey Creek quarry which became operational in 2023 Utilize second unit train of aggregate cars for higher market share Leverage strong relationships, reputation for high quality and service to increase share in liquid asphalt All Other segment consists of Energy Services, Texas operations and corporate services 2022 Revenue Mix1 2022 Revenue Mix1 Ready Mix Asphalt Contracting Services Other Aggregates Ready Mix Asphalt Contracting Services Other Aggregates Note: Pie chart numbers are rounded and may not sum to 100%. Other includes merchandise, transportation services and other products that individually are not considered to be a major line of business for the segment. 1 Reflects gross revenue breakdown by materials, contracting services and other. 24
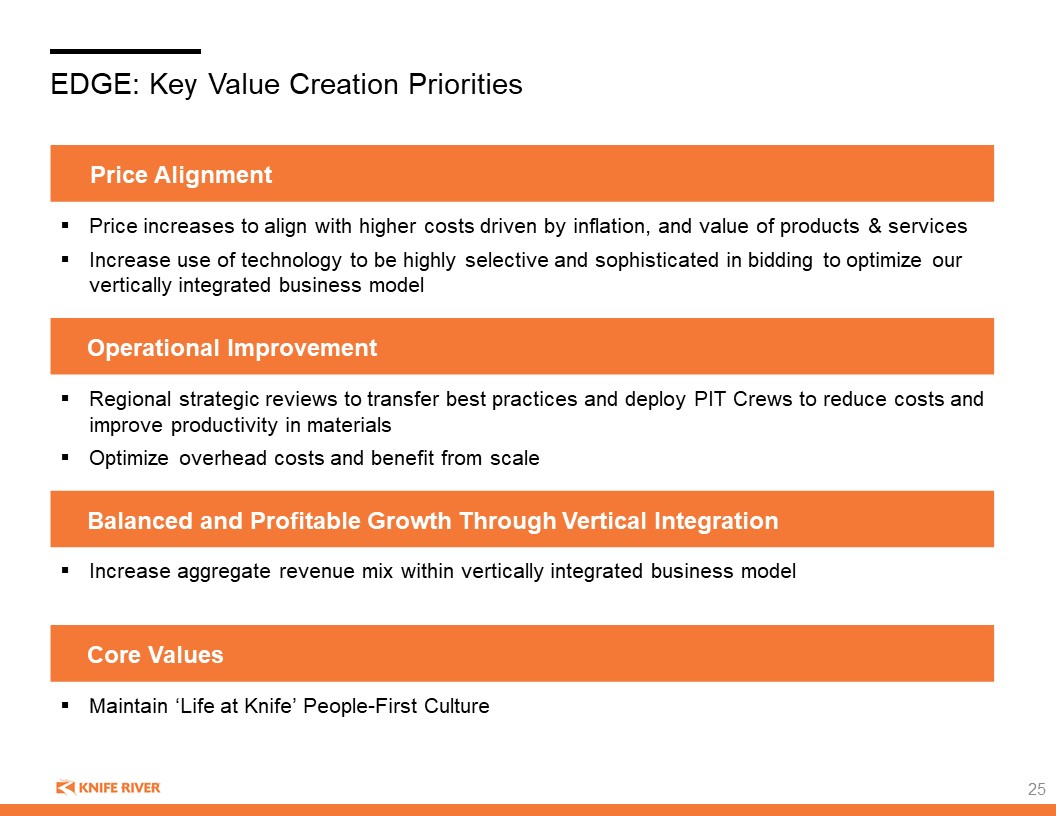
EDGE: Key Value Creation Priorities Price Alignment Price increases to align with higher costs driven by inflation, and value of products & services Increase use of technology to be highly selective and sophisticated in bidding to optimize our vertically integrated business model Operational Improvement Regional strategic reviews to transfer best practices and deploy PIT Crews to reduce costs and improve productivity in materials Optimize overhead costs and benefit from scale Balanced and Profitable Growth Through Vertical Integration Increase aggregate revenue mix within vertically integrated business model Core Values Maintain ‘Life at Knife’ People-First Culture 25
Life at knife: our core values Environment, Social, and Governance 38 26
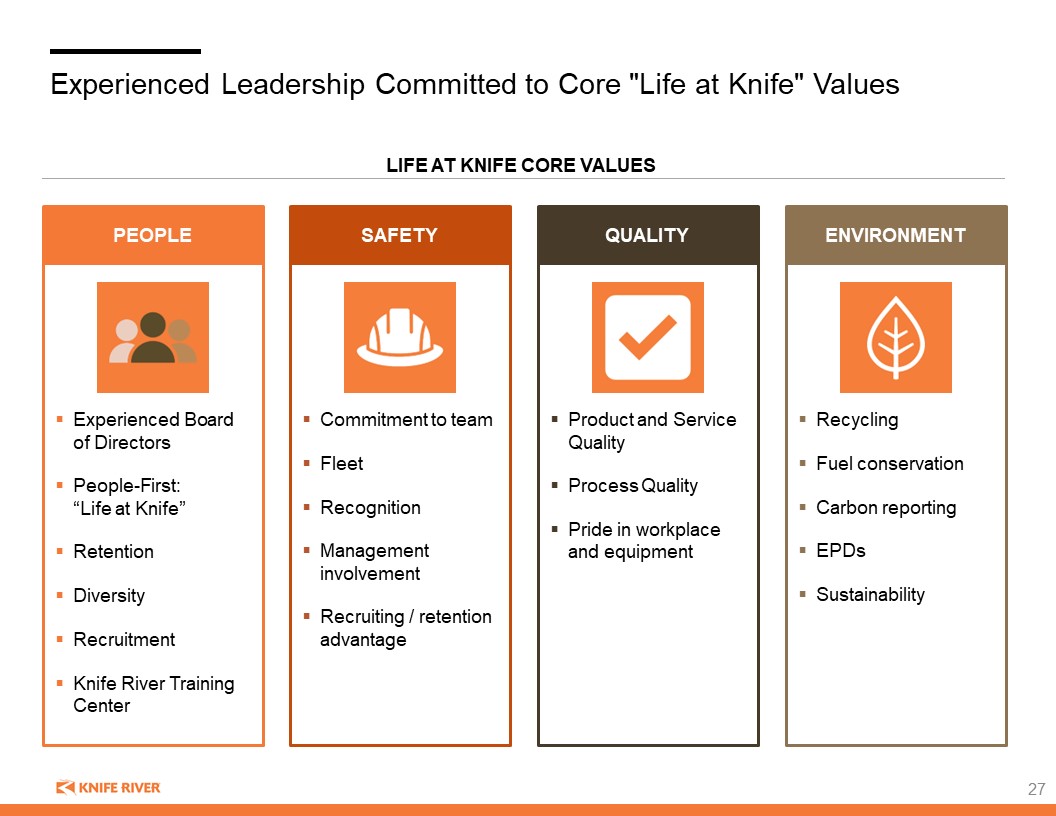
Recycling Fuel conservation Carbon reporting EPDs Sustainability Product and Service Quality Process Quality Pride in workplace and equipment Commitment to team Fleet Recognition Management involvement Recruiting / retention advantage Experienced Leadership Committed to Core "Life at Knife" Values LIFE AT KNIFE CORE VALUES Experienced Board of Directors People-First:“Life at Knife” Retention Diversity Recruitment Knife River Training Center SAFETY PEOPLE ENVIRONMENT QUALITY 27

People-First Company Life at knife "Life at Knife" is our common language and how we live our values People-first means success depends on each other Coaching philosophy Communicating “My Life at Knife” discussions Life at Knife app Employee Survey Category 2017 (Pre “Life at Knife”) 2021 Communications 68% 78% Engagement 77% 93% Culture 88% 92% Care Challenge Communication Commitment Consistency Culture 28

Retention: Competitive Advantage Annualized Turnover by Year Annualized Turnover by Year Lower Turnover leads to higher productivity Longer tenure supports safety and quality Lower turnover rates than industry and US average Knife River median tenure 5.7 years, compared to 4.1 years for US labor force Median Tenure by Industry Source: BLS statistics. Median Tenure by Occupation Annualized Turnover by Year Knife River US Total Private Mining/Logging Construction 2017 31% 43% 48% 48% 62% 2018 31% 44% 49% 55% 58% 2019 30% 45% 50% 48% 65% 2020 28% 57% 63% 55% 69% 2021 33% 47% 52% 37% 56% 2022 32% 48% 52% 38% 53% 29
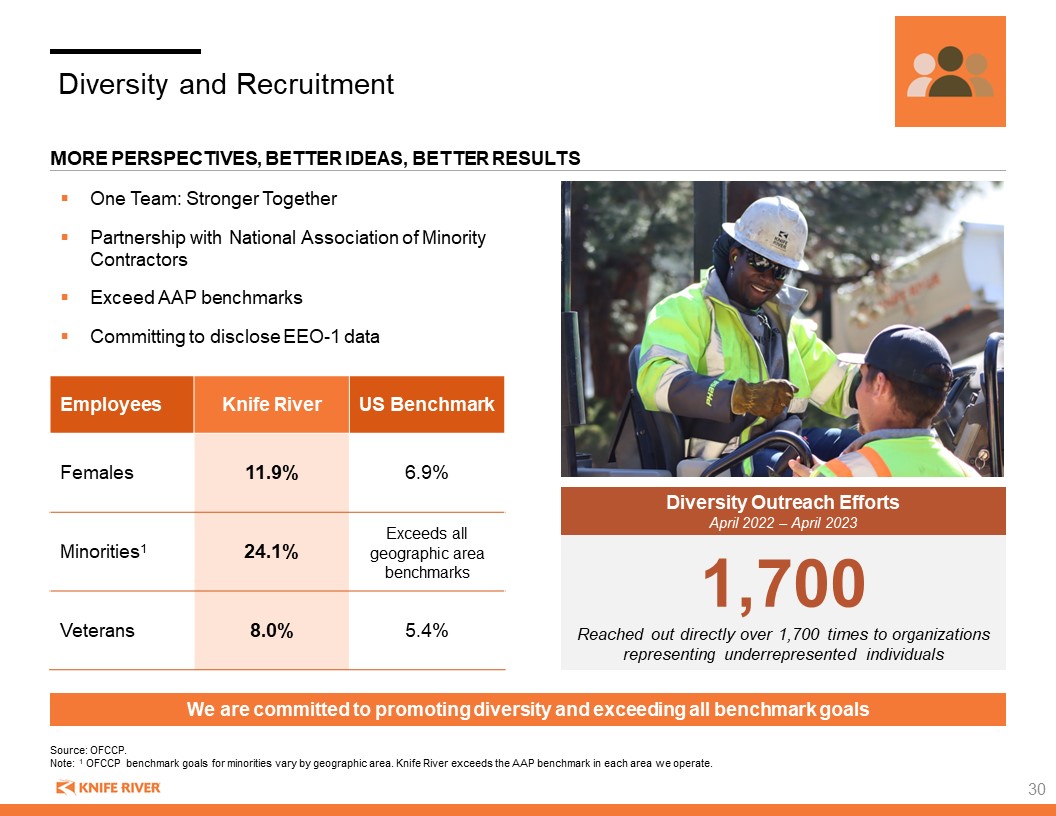
Employees Knife River US Benchmark Females 11.9% 6.9% Minorities1 24.1% Exceeds all geographic area benchmarks Veterans 8.0% 5.4% Diversity and Recruitment More perspectives, better ideas, better results One Team: Stronger Together Partnership with National Association of Minority Contractors Exceed AAP benchmarks Committing to disclose EEO-1 data Source: OFCCP. Note: 1 OFCCP benchmark goals for minorities vary by geographic area. Knife River exceeds the AAP benchmark in each area we operate. We are committed to promoting diversity and exceeding all benchmark goals 1,700 Reached out directly over 1,700 times to organizations representing underrepresented individuals Diversity Outreach EffortsApril 2022 – April 2023 30

Diversity and Recruitment (Cont’d) Recruitment Able to assemble best team possible hiring from strong applicant pool Hired 1,669 people in 2022; 420 in Q1 2023 Life at Knife brand & social media promotion Employee referral program Internships & Externships Training Center Career Expos High school and trades promotion 31
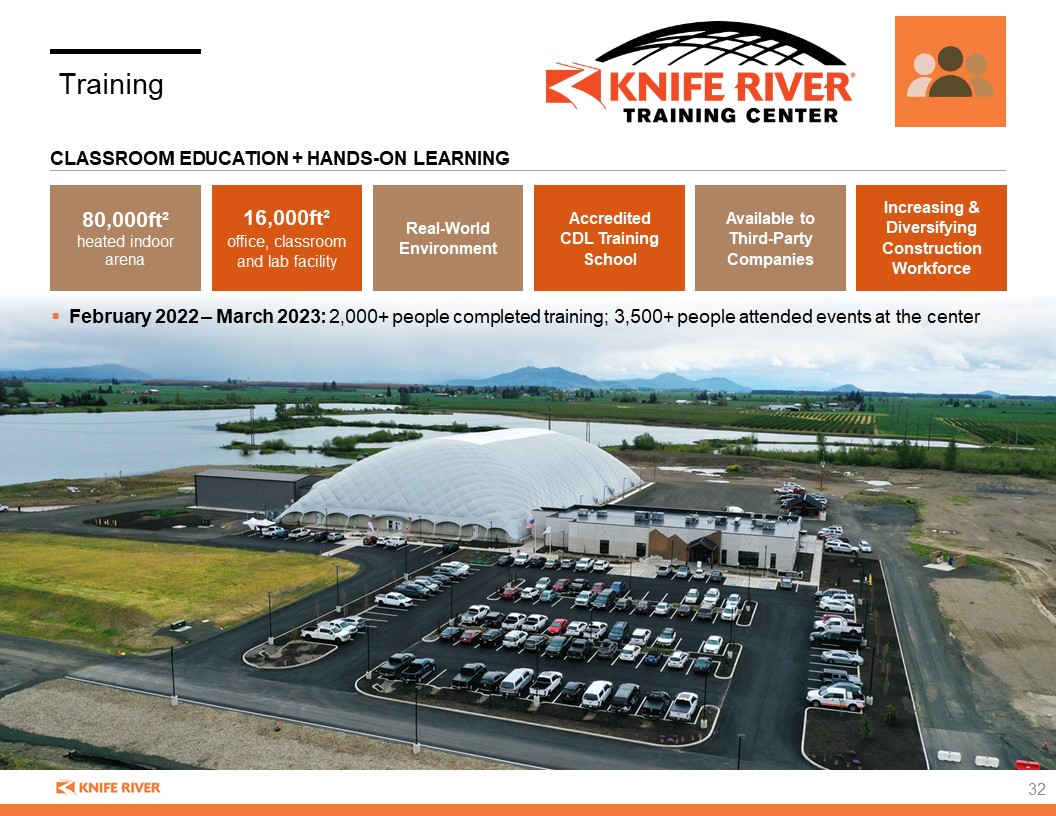
Classroom education + hands-on learning February 2022 – March 2023: 2,000+ people completed training; 3,500+ people attended events at the center 80,000ft² heated indoor arena Available to Third-Party Companies Accredited CDL Training School Real-World Environment 16,000ft² office, classroom and lab facility Increasing & Diversifying Construction Workforce Classroom education + hands-on learning Training 32
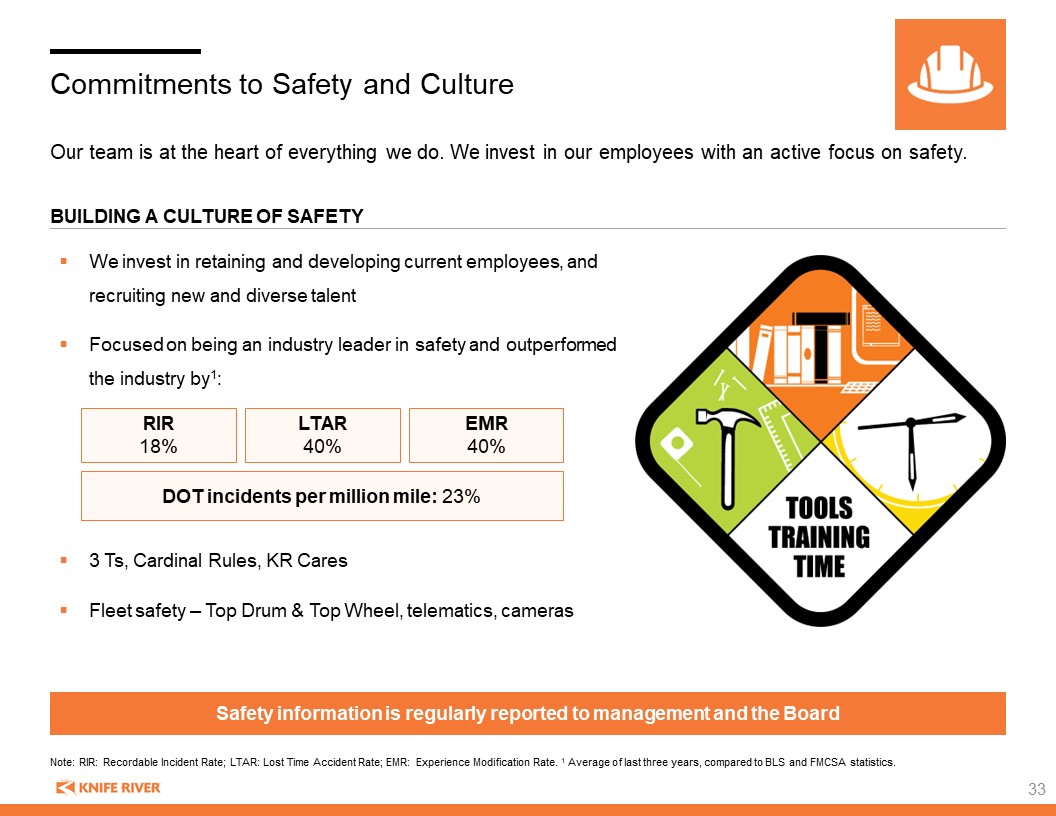
We invest in retaining and developing current employees, and recruiting new and diverse talent Focused on being an industry leader in safety and outperformed the industry by1: 3 Ts, Cardinal Rules, KR Cares Fleet safety – Top Drum & Top Wheel, telematics, cameras Commitments to Safety and Culture Our team is at the heart of everything we do. We invest in our employees with an active focus on safety. Building a culture of safety Safety information is regularly reported to management and the Board Note: RIR: Recordable Incident Rate; LTAR: Lost Time Accident Rate; EMR: Experience Modification Rate. 1 Average of last three years, compared to BLS and FMCSA statistics. RIR 18% LTAR 40% EMR 40% DOT incidents per million mile: 23% 33
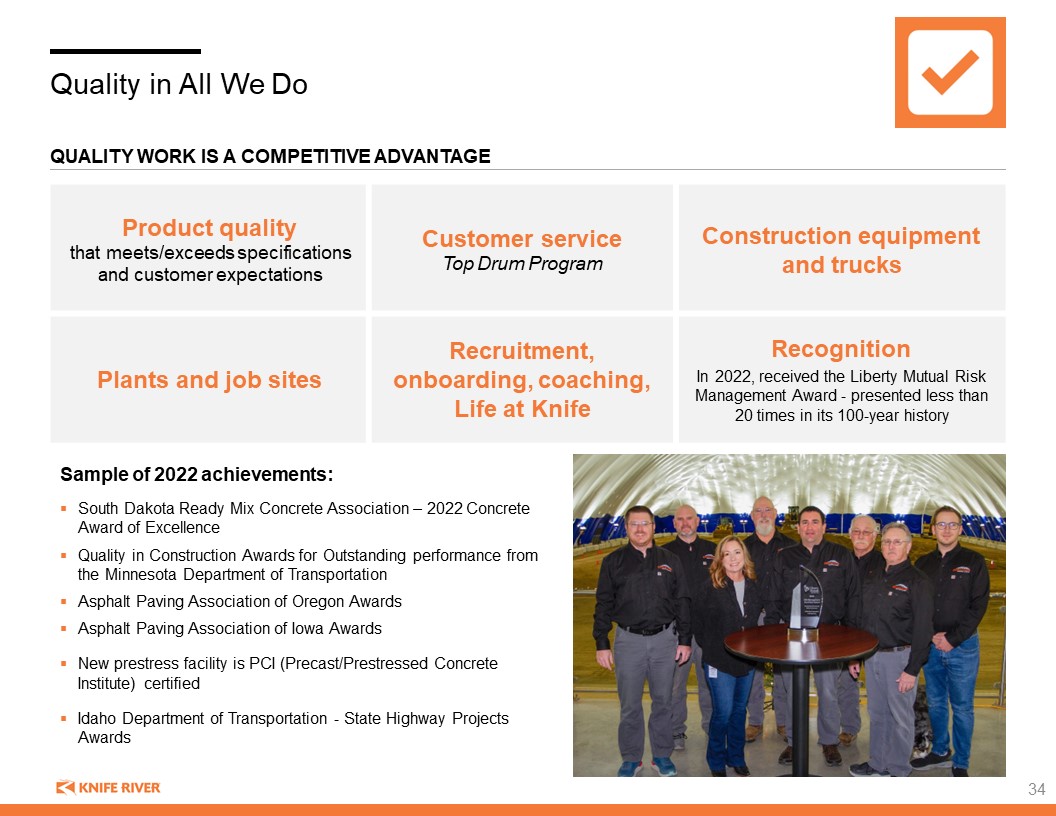
Quality in All We Do Sample of 2022 achievements: South Dakota Ready Mix Concrete Association – 2022 Concrete Award of Excellence Quality in Construction Awards for Outstanding performance from the Minnesota Department of Transportation Asphalt Paving Association of Oregon Awards Asphalt Paving Association of Iowa Awards New prestress facility is PCI (Precast/Prestressed Concrete Institute) certified Idaho Department of Transportation - State Highway Projects Awards Quality work is a competitive advantage Product quality that meets/exceeds specifications and customer expectations Customer service Top Drum Program Construction equipment and trucks Plants and job sites Recruitment, onboarding, coaching, Life at Knife Recognition In 2022, received the Liberty Mutual Risk Management Award - presented less than 20 times in its 100-year history 34
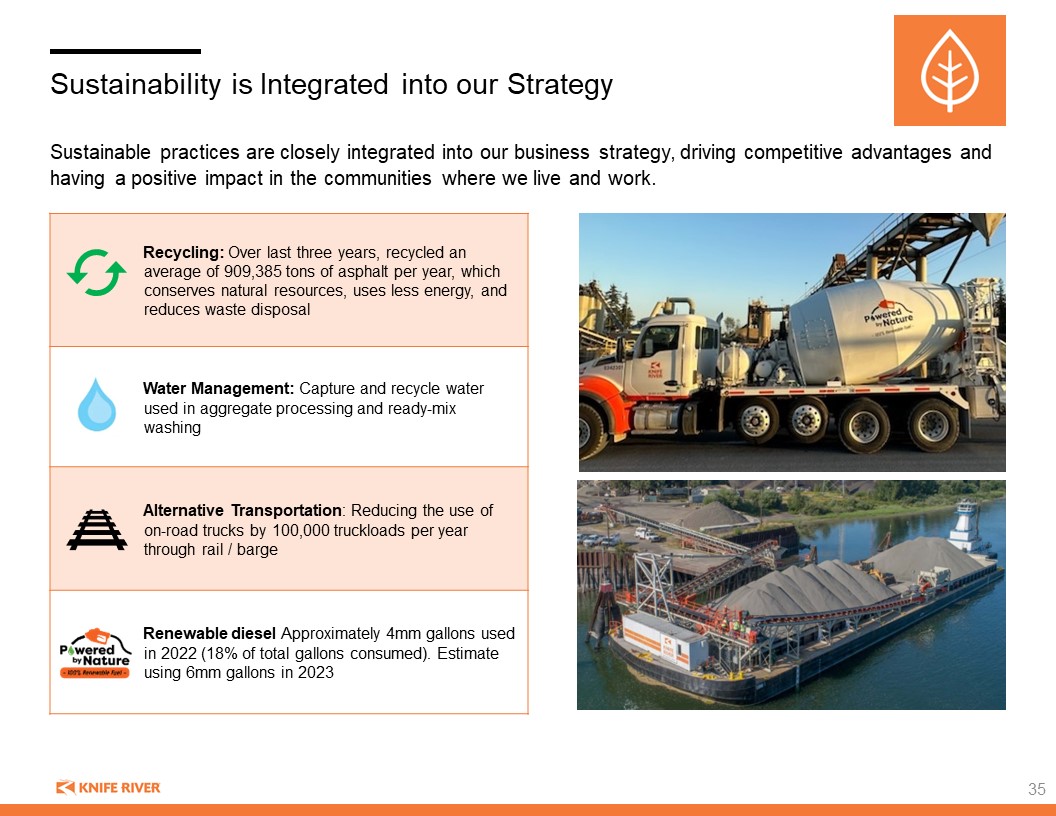
Recycling: Over last three years, recycled an average of 909,385 tons of asphalt per year, which conserves natural resources, uses less energy, and reduces waste disposal Water Management: Capture and recycle water used in aggregate processing and ready-mix washing Alternative Transportation: Reducing the use of on-road trucks by 100,000 truckloads per year through rail / barge Renewable diesel Approximately 4mm gallons used in 2022 (18% of total gallons consumed). Estimate using 6mm gallons in 2023 Sustainability is Integrated into our Strategy Sustainable practices are closely integrated into our business strategy, driving competitive advantages and having a positive impact in the communities where we live and work. 35
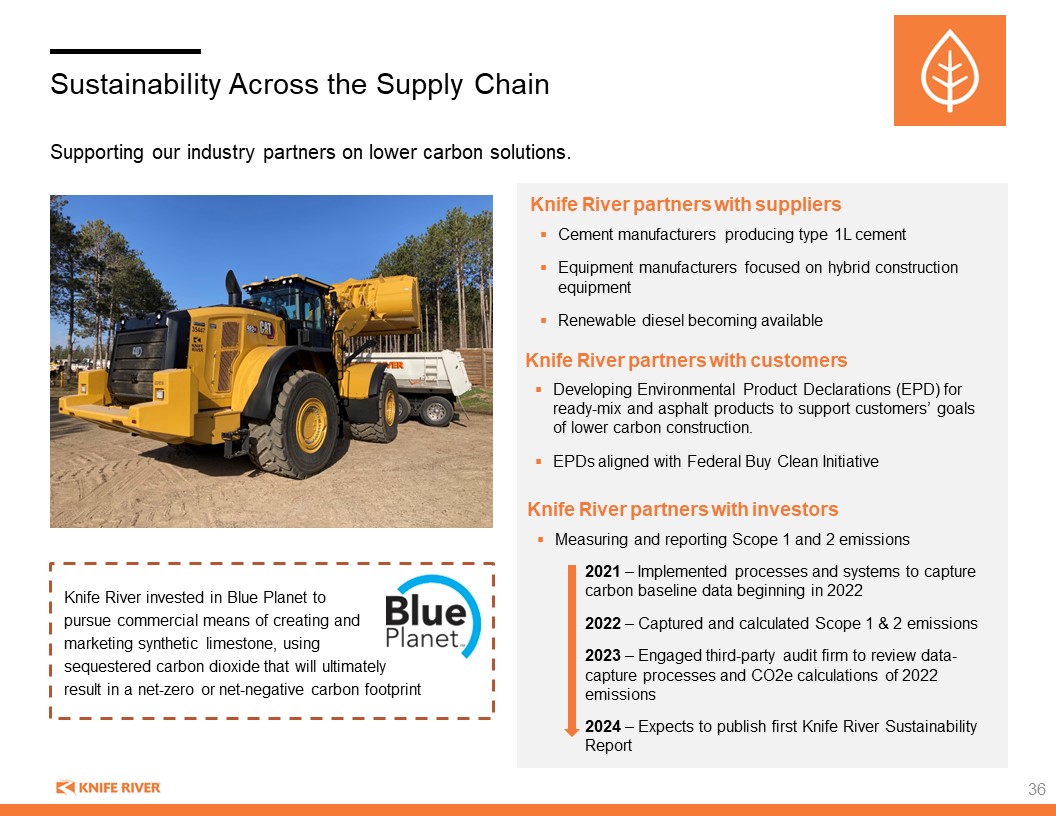
Sustainability Across the Supply Chain Knife River invested in Blue Planet to pursue commercial means of creating and marketing synthetic limestone, using sequestered carbon dioxide that will ultimately result in a net-zero or net-negative carbon footprint Supporting our industry partners on lower carbon solutions. Knife River partners with suppliers Cement manufacturers producing type 1L cement Equipment manufacturers focused on hybrid construction equipment Renewable diesel becoming available Knife River partners with customers Developing Environmental Product Declarations (EPD) for ready-mix and asphalt products to support customers’ goals of lower carbon construction. EPDs aligned with Federal Buy Clean Initiative Knife River partners with investors Measuring and reporting Scope 1 and 2 emissions 2021 – Implemented processes and systems to capture carbon baseline data beginning in 2022 2022 – Captured and calculated Scope 1 & 2 emissions 2023 – Engaged third-party audit firm to review data- capture processes and CO2e calculations of 2022 emissions 2024 – Expects to publish first Knife River Sustainability Report 36
FINANCIAL Results and Outlook 47
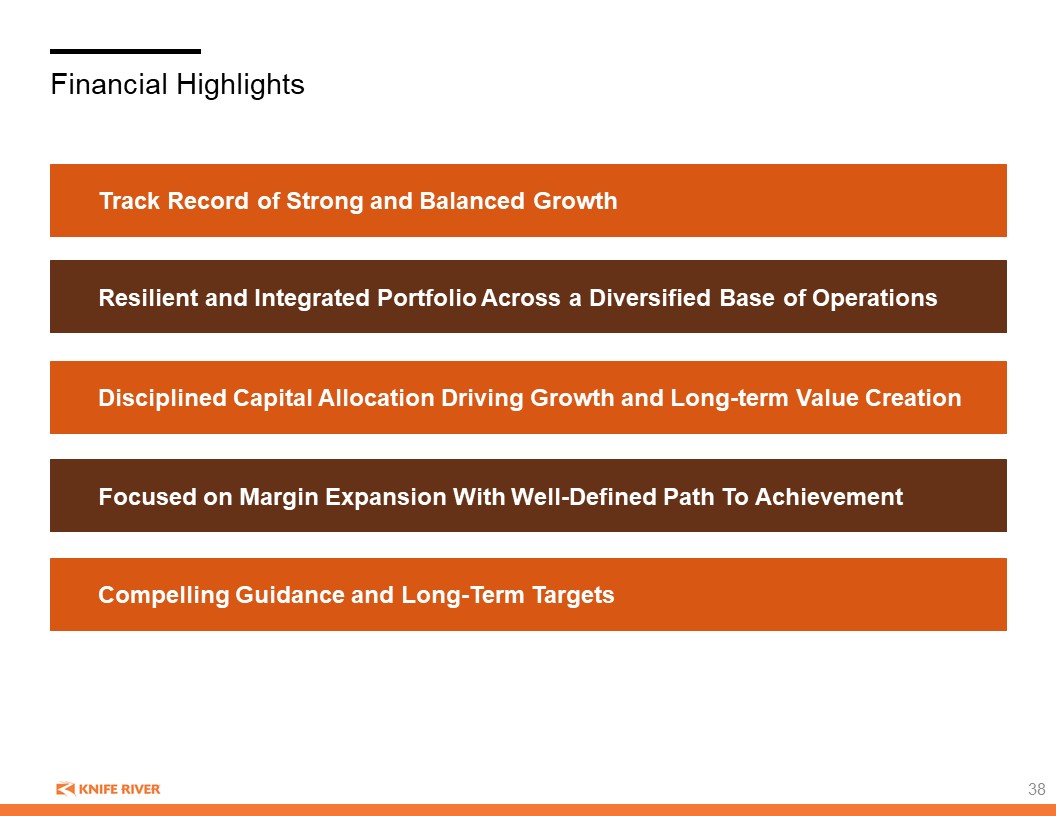
Financial Highlights Track Record of Strong and Balanced Growth Resilient and Integrated Portfolio Across a Diversified Base of Operations Disciplined Capital Allocation Driving Growth and Long-term Value Creation Focused on Margin Expansion With Well-Defined Path To Achievement Compelling Guidance and Long-Term Targets 38
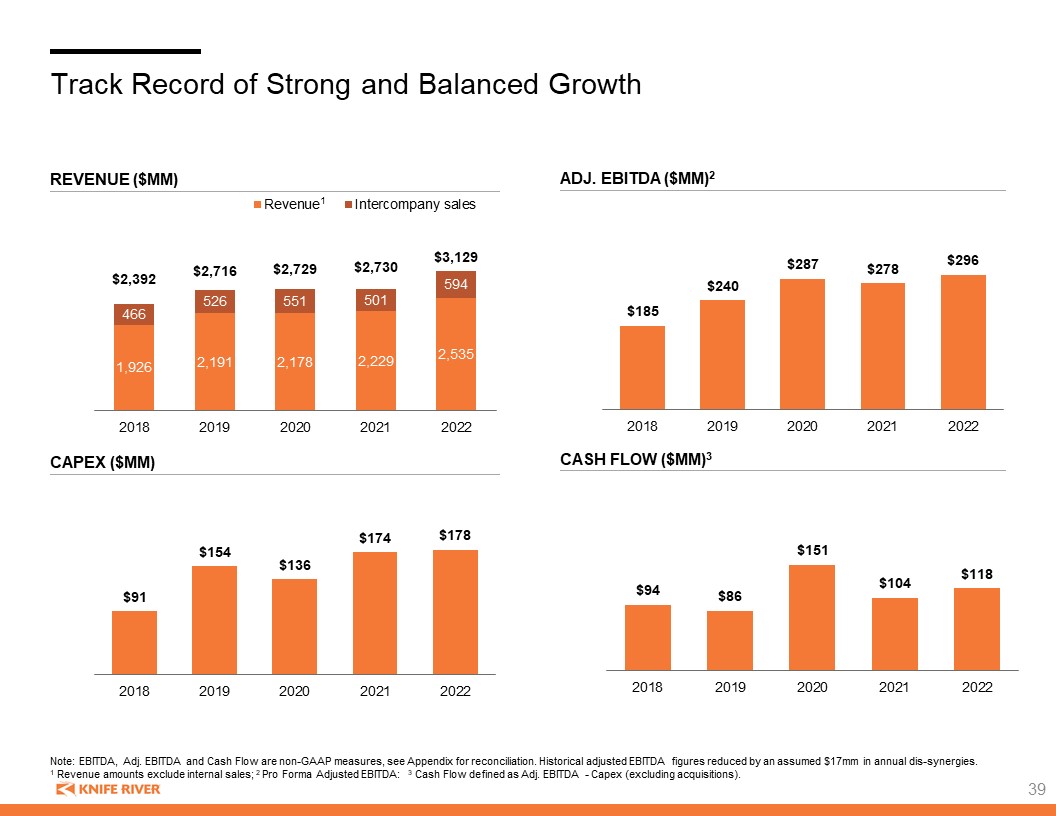
Track Record of Strong and Balanced Growth Adj. EBITDA ($mm)2 Revenue ($mm) Capex ($mm) Note: EBITDA, Adj. EBITDA and Cash Flow are non-GAAP measures, see Appendix for reconciliation. Historical adjusted EBITDA figures reduced by an assumed $17mm in annual dis-synergies. 1 Revenue amounts exclude internal sales; 2 Pro Forma Adjusted EBITDA: 3 Cash Flow defined as Adj. EBITDA - Capex (excluding acquisitions). cash flow ($mm)3 39 1
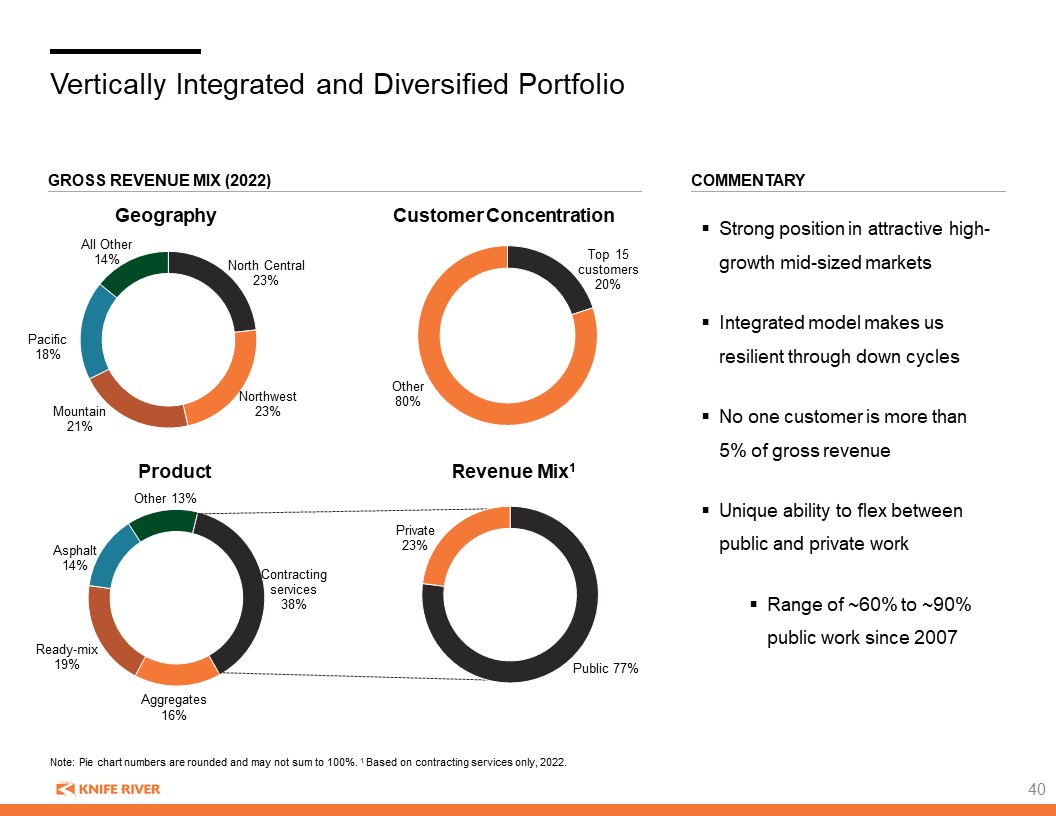
Strong position in attractive high-growth mid-sized markets Integrated model makes us resilient through down cycles No one customer is more than 5% of gross revenue Unique ability to flex between public and private work Range of ~60% to ~90% public work since 2007 Vertically Integrated and Diversified Portfolio Gross Revenue mix (2022) Note: Pie chart numbers are rounded and may not sum to 100%. 1 Based on contracting services only, 2022. Revenue Mix1 Product Geography Customer Concentration Aggregates 16% Commentary 40
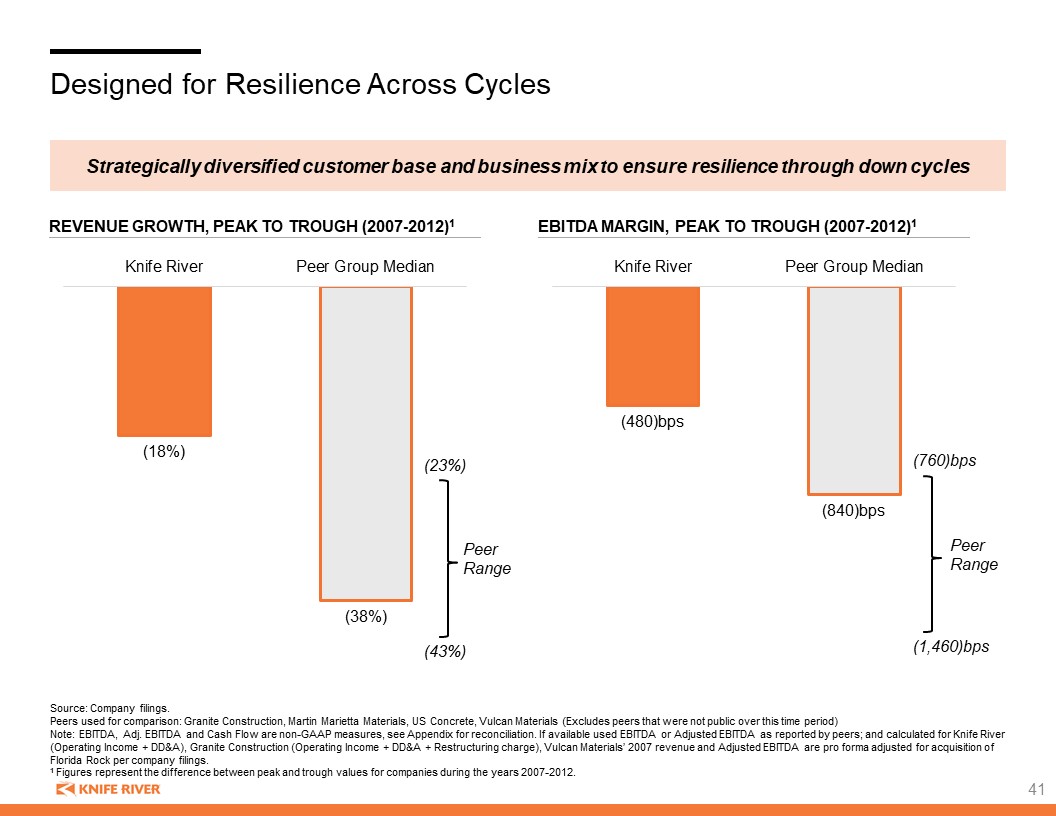
Designed for Resilience Across Cycles Revenue Growth, PEAK TO TROUGH (2007-2012)1 EBITDA Margin, PEAK TO TROUGH (2007-2012)1 Source: Company filings. Peers used for comparison: Granite Construction, Martin Marietta Materials, US Concrete, Vulcan Materials (Excludes peers that were not public over this time period) Note: EBITDA, Adj. EBITDA and Cash Flow are non-GAAP measures, see Appendix for reconciliation. If available used EBITDA or Adjusted EBITDA as reported by peers; and calculated for Knife River (Operating Income + DD&A), Granite Construction (Operating Income + DD&A + Restructuring charge), Vulcan Materials’ 2007 revenue and Adjusted EBITDA are pro forma adjusted for acquisition of Florida Rock per company filings. 1 Figures represent the difference between peak and trough values for companies during the years 2007-2012. Strategically diversified customer base and business mix to ensure resilience through down cycles (23%) (43%) Peer Range (760)bps (1,460)bps Peer Range 41

Disciplined and Balanced Capital Allocation to Maximize Long-Term Value Creation Organic Growth Inorganic Growth Portfolio Optimization Invest for growth to create or strengthen our leadership position in select markets Invest in supplementing and growing high quality aggregate reserves (1.1bn tons currently) Maintenance & Growth Capex 5-7% of revenue Focused on growing Aggregates in overall revenue mix Highly selective acquisitions in target markets Expand footprint in Western and Central USA Target mid-sized high growth markets Focused on growing Aggregates in overall revenue mix Divest or swap assets to strengthen market position, build scale Optimize/invest in assets to serve key adjacencies Continuously evaluate assets on a ‘best-fit’, ‘best-owner’ basis Leverage & Liquidity Target average net leverage of 2.5x Conservative balance sheet to support growth strategy and maintain financial flexibility through cycles Strong liquidity and prudent cash management $350mm revolver capacity to support business through seasonal needs Disciplined Investment for Sustainable Growth
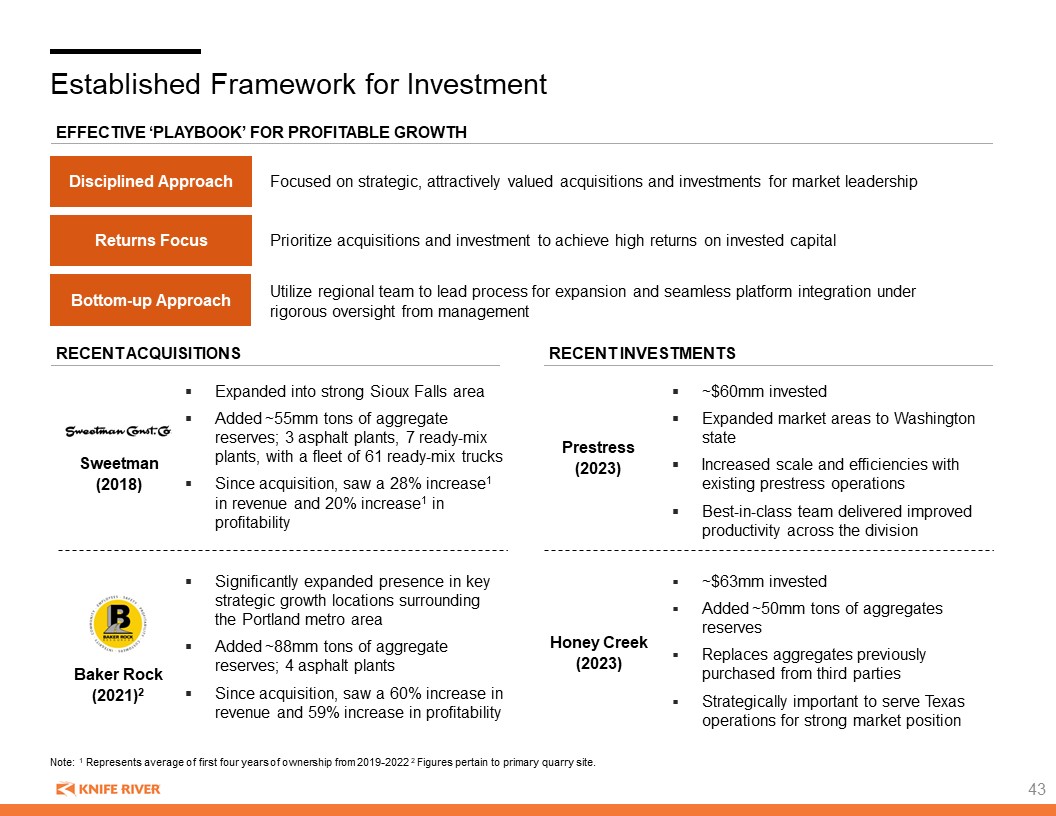
Established Framework for Investment Focused on strategic, attractively valued acquisitions and investments for market leadership Disciplined Approach Returns Focus Prioritize acquisitions and investment to achieve high returns on invested capital Bottom-up Approach Utilize regional team to lead process for expansion and seamless platform integration under rigorous oversight from management effective ‘playbook’ for profitable growth Note: 1 Represents average of first four years of ownership from 2019-2022 2 Figures pertain to primary quarry site. Recent ACQUISITIONs Significantly expanded presence in key strategic growth locations surrounding the Portland metro area Added ~88mm tons of aggregate reserves; 4 asphalt plants Since acquisition, saw a 60% increase in revenue and 59% increase in profitability Expanded into strong Sioux Falls area Added ~55mm tons of aggregate reserves; 3 asphalt plants, 7 ready-mix plants, with a fleet of 61 ready-mix trucks Since acquisition, saw a 28% increase1 in revenue and 20% increase1 in profitability Baker Rock (2021)2 Sweetman (2018) Recent Investments Prestress (2023) ~$60mm invested Expanded market areas to Washington state Increased scale and efficiencies with existing prestress operations Best-in-class team delivered improved productivity across the division Honey Creek (2023) ~$63mm invested Added ~50mm tons of aggregates reserves Replaces aggregates previously purchased from third parties Strategically important to serve Texas operations for strong market position 43
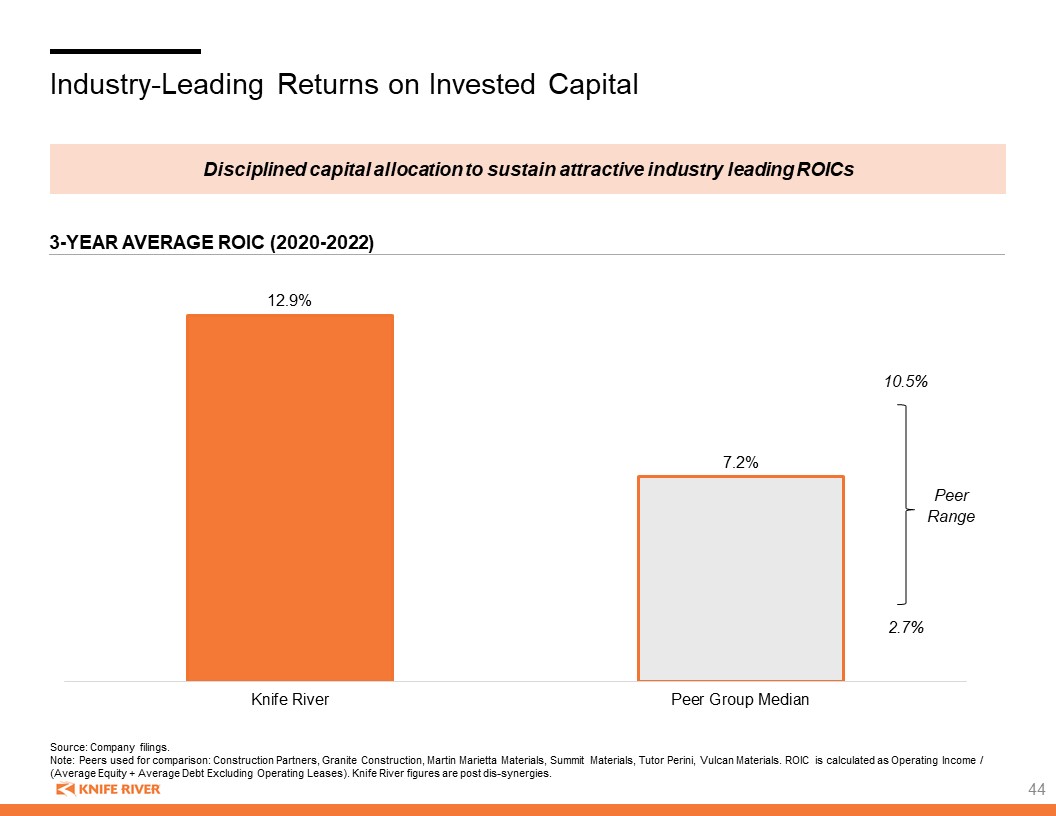
Industry-Leading Returns on Invested Capital Source: Company filings. Note: Peers used for comparison: Construction Partners, Granite Construction, Martin Marietta Materials, Summit Materials, Tutor Perini, Vulcan Materials. ROIC is calculated as Operating Income / (Average Equity + Average Debt Excluding Operating Leases). Knife River figures are post dis-synergies. Disciplined capital allocation to sustain attractive industry leading ROICs 3-Year Average ROIC (2020-2022) 10.5% 2.7% Peer Range 44
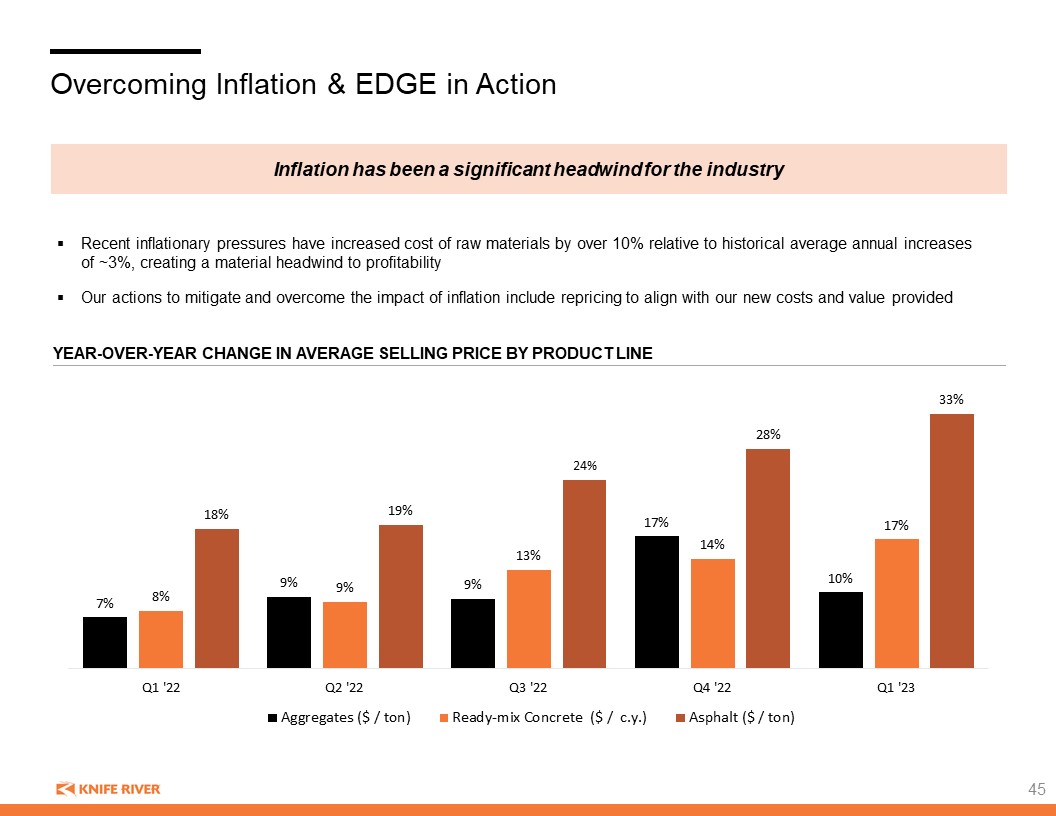
Overcoming Inflation & EDGE in Action Recent inflationary pressures have increased cost of raw materials by over 10% relative to historical average annual increases of ~3%, creating a material headwind to profitability Our actions to mitigate and overcome the impact of inflation include repricing to align with our new costs and value provided Year-over-Year Change in Average Selling Price by Product Line Inflation has been a significant headwind for the industry 45
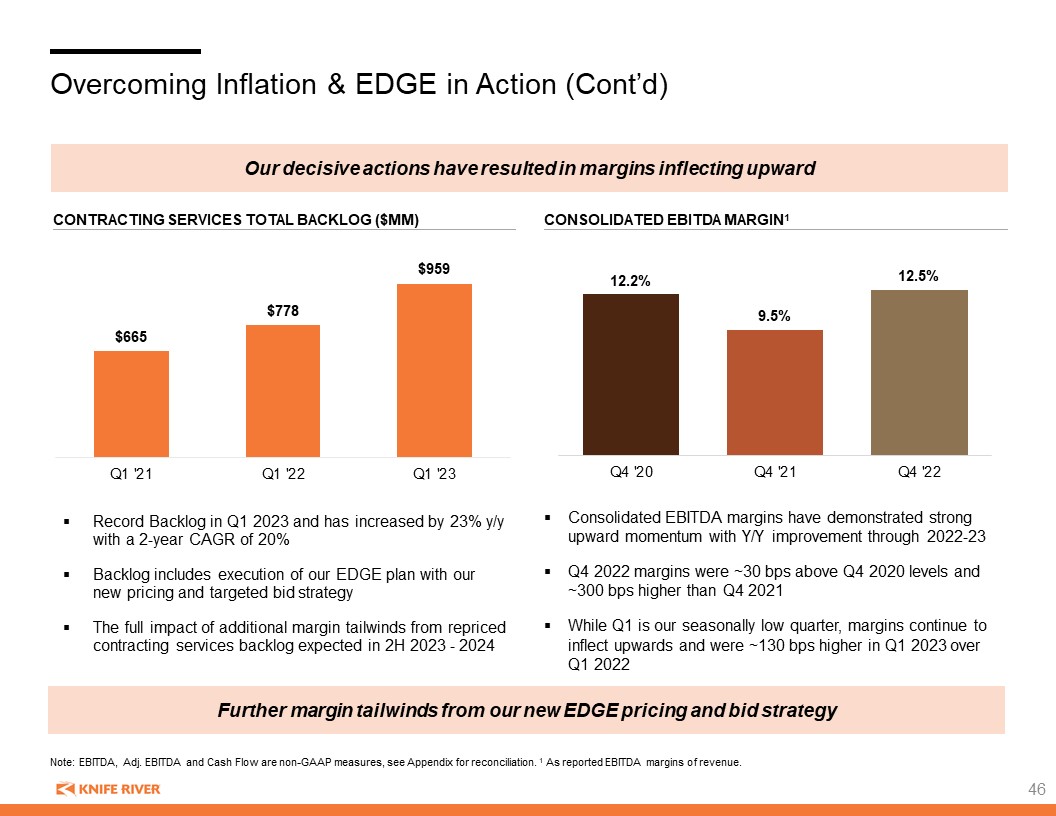
contracting services total backlog ($mm) Overcoming Inflation & EDGE in Action (Cont’d) Note: EBITDA, Adj. EBITDA and Cash Flow are non-GAAP measures, see Appendix for reconciliation. 1 As reported EBITDA margins of revenue. Consolidated EBITDA margins have demonstrated strong upward momentum with Y/Y improvement through 2022-23 Q4 2022 margins were ~30 bps above Q4 2020 levels and ~300 bps higher than Q4 2021 While Q1 is our seasonally low quarter, margins continue to inflect upwards and were ~130 bps higher in Q1 2023 over Q1 2022 Our decisive actions have resulted in margins inflecting upward Consolidated EBITDa margin1 Record Backlog in Q1 2023 and has increased by 23% y/y with a 2-year CAGR of 20% Backlog includes execution of our EDGE plan with our new pricing and targeted bid strategy The full impact of additional margin tailwinds from repriced contracting services backlog expected in 2H 2023 - 2024 Further margin tailwinds from our new EDGE pricing and bid strategy 46
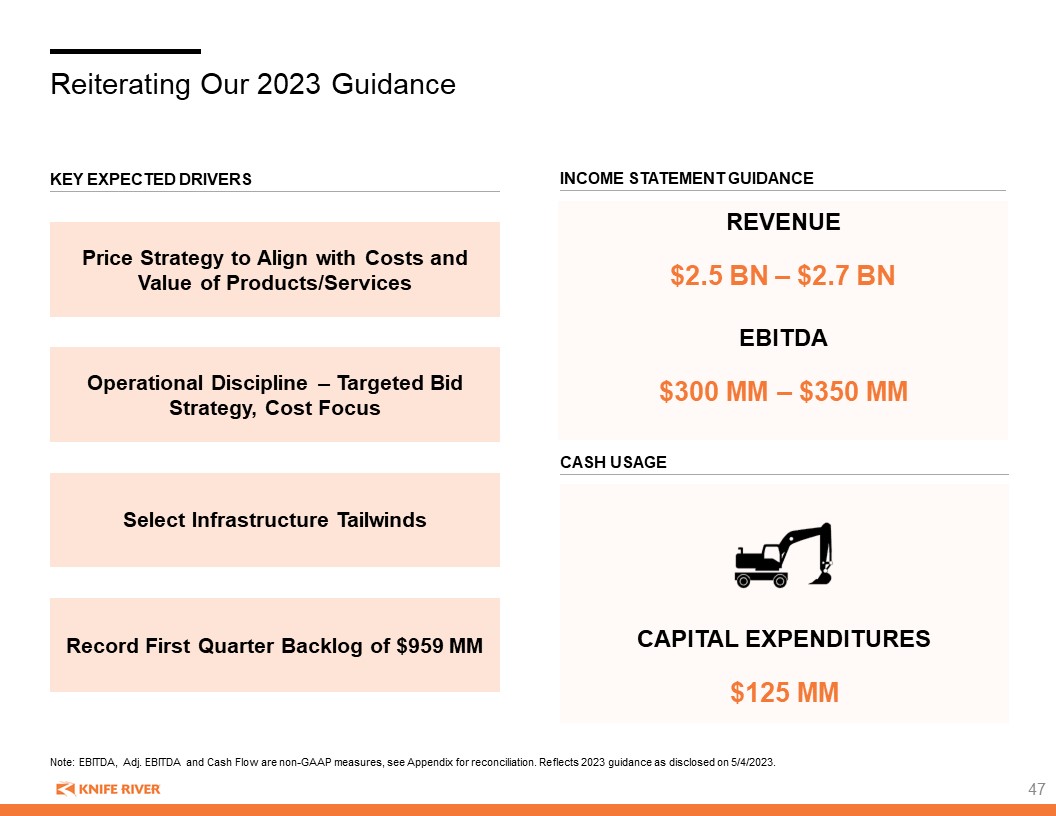
Reiterating Our 2023 Guidance Income statement guidance Key expected Drivers CASH USAGE REVENUE $2.5 BN – $2.7 BN EBITDA $300 MM – $350 MM CAPITAL EXPENDITURES $125 MM Price Strategy to Align with Costs and Value of Products/Services Operational Discipline – Targeted Bid Strategy, Cost Focus Select Infrastructure Tailwinds Record First Quarter Backlog of $959 MM Note: EBITDA, Adj. EBITDA and Cash Flow are non-GAAP measures, see Appendix for reconciliation. Reflects 2023 guidance as disclosed on 5/4/2023.
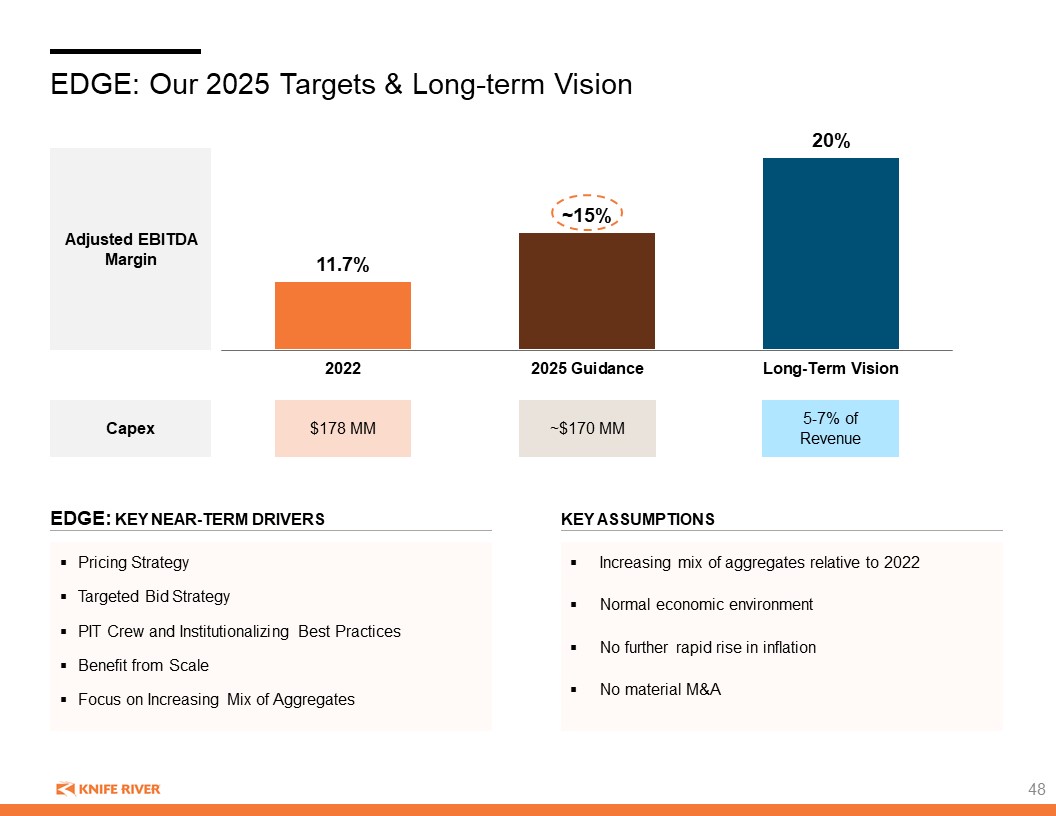
EDGE: Our 2025 Targets & Long-term Vision EDGE: Key Near-term Drivers Key assumptions Adjusted EBITDA Margin Capex $178 MM ~$170 MM 5-7% of Revenue Increasing mix of aggregates relative to 2022 Normal economic environment No further rapid rise in inflation No material M&A Pricing Strategy Targeted Bid Strategy PIT Crew and Institutionalizing Best Practices Benefit from Scale Focus on Increasing Mix of Aggregates
CLOSING REMARKS 4

Today’s Key Messages Established company that is well positioned for profitable growth in an attractive industry 1 Aggregates-led, vertically integrated business model contributes to resiliency and industry-leading ROIC 2 Experienced leadership team with strong track record committed to executing EDGE strategy for margin improvement and long-term value creation 3 Unique culture and dedication to our values of People, Safety, Quality and Environment results in a cohesive team and competitive advantages 4 50
Q & A 10
Appendix 10

Today’s Speakers Brian Gray President and Chief Executive Officer Nathan Ring Chief Financial Officer Dave Goodin President and Chief Executive Officer of MDU Resources Glenn Pladsen VP of Support Services Sarah Stevens Director of Human Resources 53
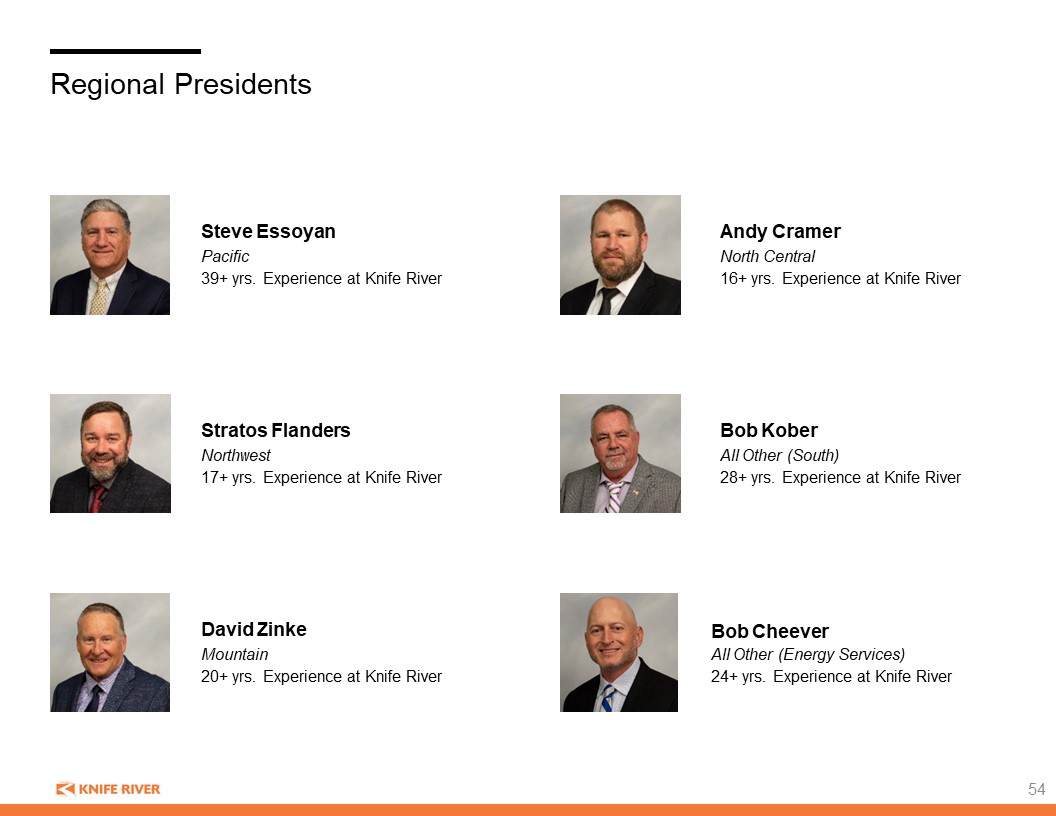
Regional Presidents Bob Cheever All Other (Energy Services) 24+ yrs. Experience at Knife River Steve Essoyan Pacific 39+ yrs. Experience at Knife River Stratos Flanders Northwest 17+ yrs. Experience at Knife River David Zinke Mountain 20+ yrs. Experience at Knife River Andy Cramer North Central 16+ yrs. Experience at Knife River Bob Kober All Other (South) 28+ yrs. Experience at Knife River 54
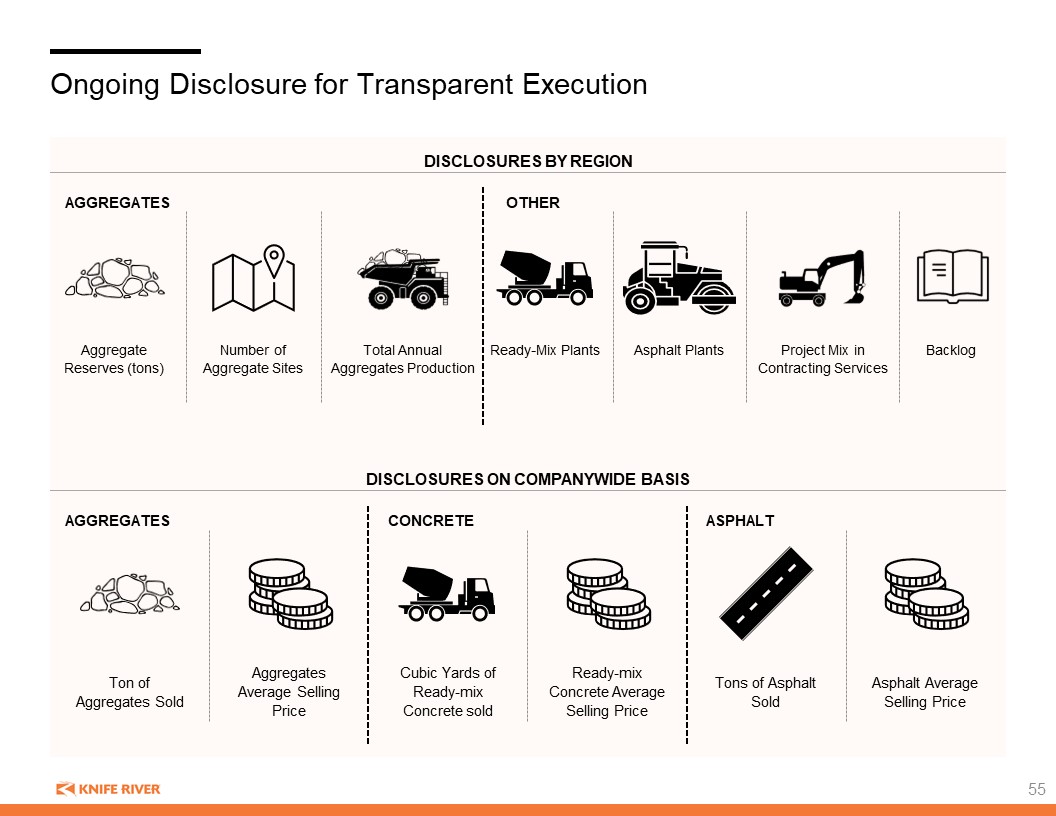
Ongoing Disclosure for Transparent Execution Disclosures by region Disclosures on companywide basis AGGREGATES OTHER Ton of Aggregates Sold Cubic Yards of Ready-mix Concrete sold Aggregates Average Selling Price Ready-mix Concrete Average Selling Price Tons of Asphalt Sold AGGREGATES Asphalt Average Selling Price Ready-Mix Plants Project Mix in Contracting Services Asphalt Plants Aggregate Reserves (tons) Number of Aggregate Sites Total Annual Aggregates Production CONCRETE ASPHALT Backlog 55

Regional Details REVENUE MIX (2022)1 Ready Mix Asphalt Contracting Services Other Aggregates 2022 2020-2022 Revenue $469mm 1.6% CAGR Gross Margin 14.5% 17.2% AVG. EBITDA Margin 11.9% 15.0% AVG. Note: Pie chart numbers are rounded and may not sum to 100%. EBITDA, Adj. EBITDA and Cash Flow are non-GAAP measures, see Appendix for reconciliation. Other includes merchandise, transportation services and other products that individually are not considered to be a major line of business for the segment. 1 Reflects gross revenue breakdown by materials, contracting services and other. Financial performance REVENUE MIX (2022)1 Ready Mix Asphalt Contracting Services Other Aggregates 2022 2020-2022 Revenue $600mm 20.1% CAGR Gross Margin 17.7% 18.4% AVG. EBITDA Margin 17.3% 17.3% AVG. Financial performance PACIFIC REGION NORTHWEST REGION 56

Regional Details (Cont’d) REVENUE MIX (2022)1 Ready Mix Asphalt Contracting Services Other Aggregates 2022 2020-2022 Revenue $542mm 9.6% CAGR Gross Margin 14.3% 14.3% AVG. EBITDA Margin 13.4% 12.9% AVG. Note: Pie chart numbers are rounded and may not sum to 100%. EBITDA, Adj. EBITDA and Cash Flow are non-GAAP measures, see Appendix for reconciliation. Other includes merchandise, transportation services and other products that individually are not considered to be a major line of business for the segment. 1 Reflects gross revenue breakdown by materials, contracting services and other. Financial performance REVENUE MIX (2022)1 Ready Mix Asphalt Contracting Services Other Aggregates 2022 2020-2022 Revenue $608mm 3.2% CAGR Gross Margin 11.8% 13.4% AVG. EBITDA Margin 10.7% 12.0% AVG. Financial performance MOUNTAIN REGION North Central Region 57
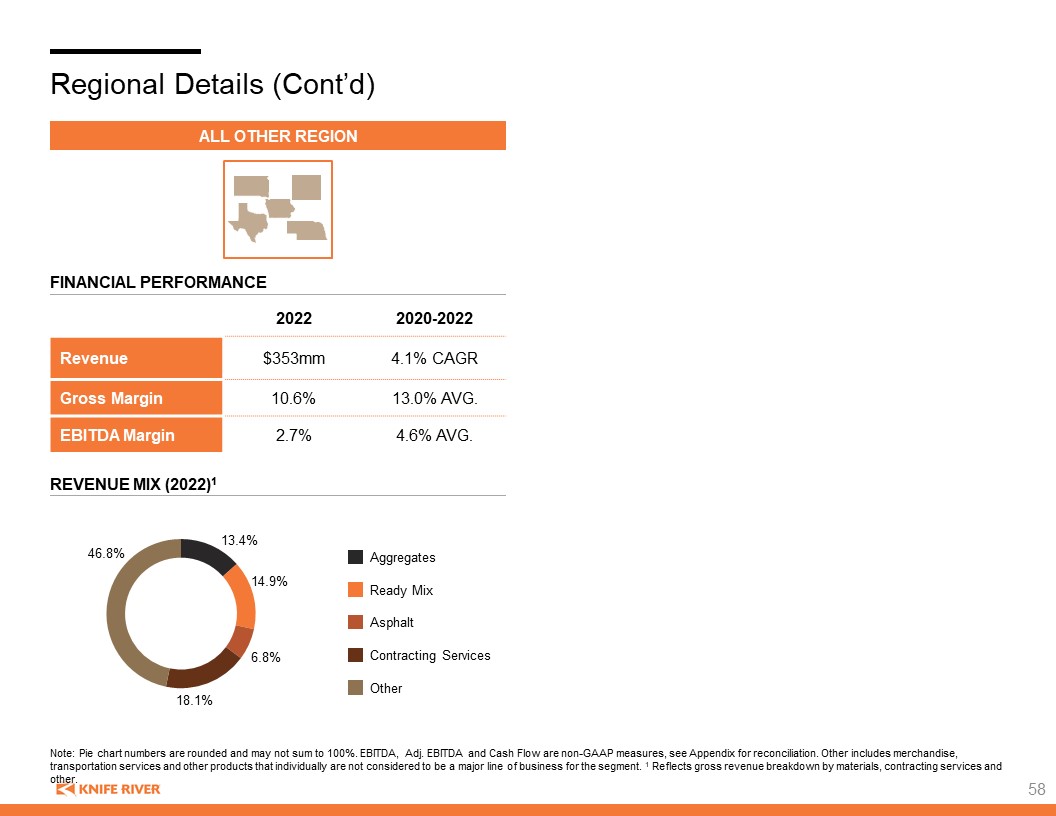
Regional Details (Cont’d) REVENUE MIX (2022)1 Ready Mix Asphalt Contracting Services Other Aggregates 2022 2020-2022 Revenue $353mm 4.1% CAGR Gross Margin 10.6% 13.0% AVG. EBITDA Margin 2.7% 4.6% AVG. Note: Pie chart numbers are rounded and may not sum to 100%. EBITDA, Adj. EBITDA and Cash Flow are non-GAAP measures, see Appendix for reconciliation. Other includes merchandise, transportation services and other products that individually are not considered to be a major line of business for the segment. 1 Reflects gross revenue breakdown by materials, contracting services and other. Financial performance All Other Region 58
Non-GAAP Financial Guidance 59 Our forward-looking guidance for EBITDA and Adjusted EBITDA Margin are non-GAAP financial measures that exclude or otherwise have been adjusted for special items from our U.S. GAAP financial statements. We are unable to reconcile forward-looking non-GAAP guidance measures to their nearest U.S. GAAP measure because we are unable to predict the timing of these adjustments with a reasonable degree of certainty. By their very nature, special and other non-core items are difficult to anticipate with precision because they are generally associated with unexpected and unplanned events that impact our company and its financial results. Therefore, we are unable to provide a reconciliation of the 2023 EBITDA and 2025 and long term Adjusted EBITDA Margin guidance.

Non-GAAP EBITDA Reconciliation 60 Note: Totals may not sum due to rounding.1 One-time spin related costs are borne by Knife River and are not inclusive of the total MDU Resources spin related costs. (in thousands, except for margin values) Pro Forma Historical Twelve Months Ended Dec 31, 2022 2022 2021 2020 2019 2018 Net income $72,916 $116,220 $129,755 $147,325 $120,371 $92,647 Adjustments: Income taxes 26,503 42,601 43,459 47,431 37,389 28,357 Depreciation, depletion and amortization 117,798 117,798 100,974 89,626 77,450 61,158 Interest 61,061 30,121 19,218 20,577 23,792 17,290 Consolidated EBITDA $278,278 $306,740 $293,406 $304,959 $259,002 $199,453 Revenues $2,534,729 $2,534,729 $2,228,930 $2,178,002 $2,190,717 $1,925,854 Net income margin 2.9% 4.6% 5.8% 6.8% 5.5% 4.8% EBITDA margin 11.0% 12.1% 13.2% 14.0% 11.8% 10.4% Consolidated EBITDA 278,278 306,740 293,406 304,959 259,002 199,453 Stock-based Compensation Expense 4,098 2,644 3,637 3,357 1,857 1,266 Unrealized (gains)losses on Benefit Plan Investments 4,029 4,029 (2,294) (4,026) (3,639) 1,249 Dis-synergy costs -- (16,991) (16,991) (16,991) (16,991) (16,991) One-time spin related costs1 10,018 -- -- -- -- -- Adjusted EBITDA $296,423 $296,423 $277,759 $287,300 $240,229 $184,976 Net income margin 2.9% 4.6% 5.8% 6.8% 5.5% 4.8% Adjusted EBITDA margin 11.7% 11.7% 12.5% 13.2% 11.0% 9.6%
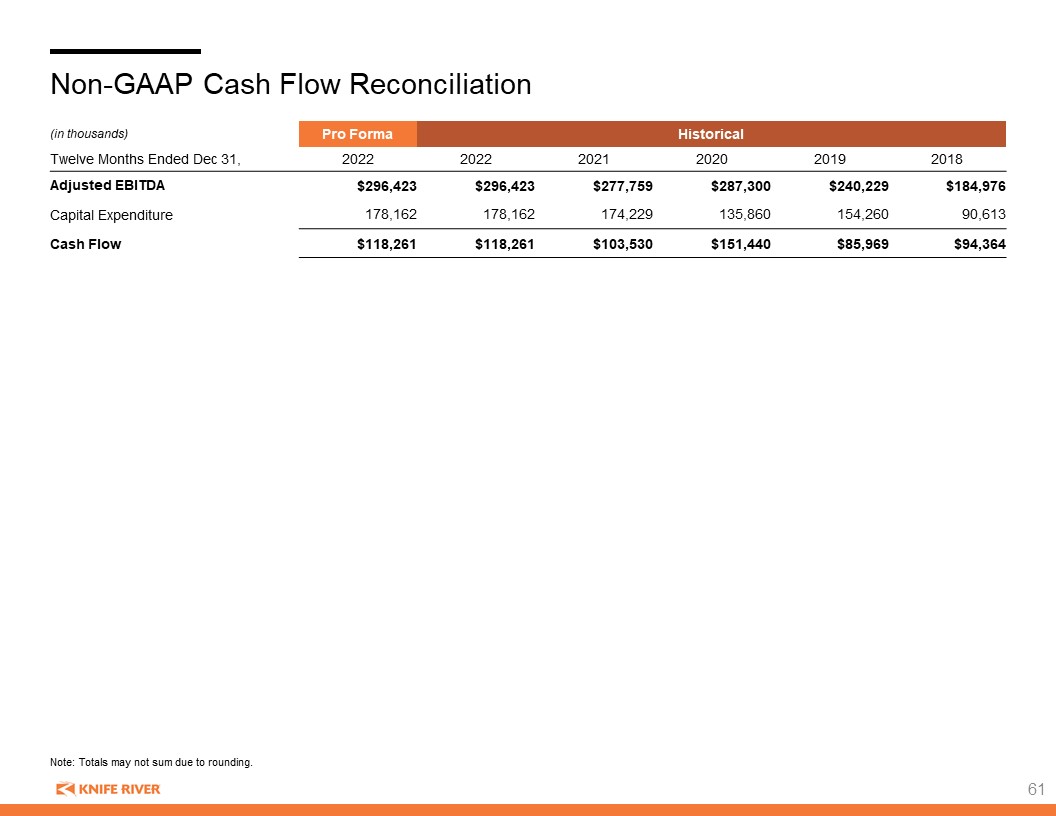
Non-GAAP Cash Flow Reconciliation 61 (in thousands) Pro Forma Historical Twelve Months Ended Dec 31, 2022 2022 2021 2020 2019 2018 Adjusted EBITDA $296,423 $296,423 $277,759 $287,300 $240,229 $184,976 Capital Expenditure 178,162 178,162 174,229 135,860 154,260 90,613 Cash Flow $118,261 $118,261 $103,530 $151,440 $85,969 $94,364 Note: Totals may not sum due to rounding.
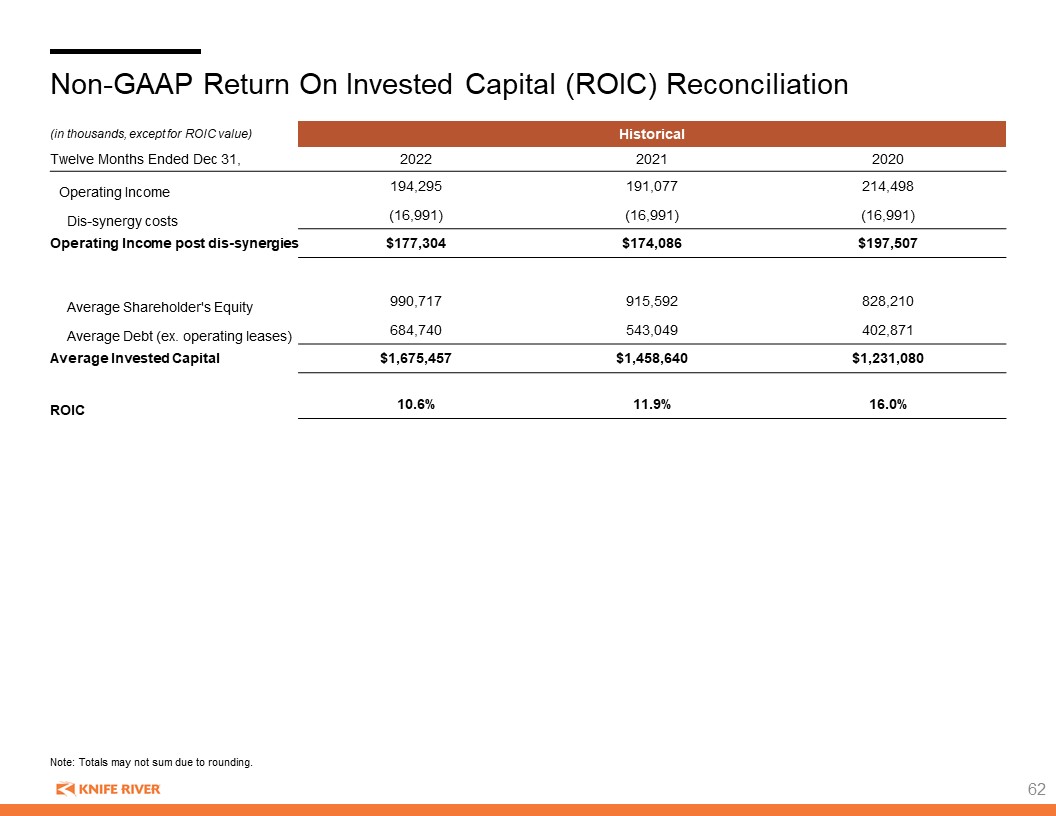
Non-GAAP Return On Invested Capital (ROIC) Reconciliation 62 (in thousands, except for ROIC value) Historical Twelve Months Ended Dec 31, 2022 2021 2020 Operating Income 194,295 191,077 214,498 Dis-synergy costs (16,991) (16,991) (16,991) Operating Income post dis-synergies $177,304 $174,086 $197,507 Average Shareholder's Equity 990,717 915,592 828,210 Average Debt (ex. operating leases) 684,740 543,049 402,871 Average Invested Capital $1,675,457 $1,458,640 $1,231,080 ROIC 10.6% 11.9% 16.0% Note: Totals may not sum due to rounding.