UNITED STATES
SECURITIES AND EXCHANGE COMMISSION
Washington, D.C. 20549
FORM 10-K
| |
(Mark One) |
☒ | ANNUAL REPORT PURSUANT TO SECTION 13 OR 15(d) OF THE SECURITIES EXCHANGE ACT OF 1934 |
| For the fiscal year ended December 31, 2024 |
| OR |
☐ | TRANSITION REPORT PURSUANT TO SECTION 13 OR 15(d) OF THE SECURITIES EXCHANGE ACT OF 1934 |
| For the transition period from ________________ to _______________ |
Commission File Number 001-41695
CORE LABORATORIES INC.
(Exact name of registrant as specified in its charter)
| | |
Delaware | | 98-1164194 |
(State or other jurisdiction of incorporation or organization) | | (I.R.S. Employer Identification No.) |
6316 Windfern Road | | |
Houston, TX | | 77040 |
(Address of principal executive offices) | | (Zip Code) |
Registrant’s telephone number, including area code: (713) 328-2673
Securities registered pursuant to Section 12(b) of the Act:
| | | | |
Title of each class | | Trading Symbol(s) | | Name of each exchange on which registered |
Common Stock (par value $0.01) | | CLB | | New York Stock Exchange |
Securities registered pursuant to Section 12(g) of the Act: None
Indicate by check mark if the registrant is a well-known seasoned issuer, as defined in Rule 405 of the Securities Act. Yes☒ No ☐
Indicate by check mark if the registrant is not required to file reports pursuant to Section 13 or Section 15(d) of the Exchange Act. Yes ☐ No ☒
Indicate by check mark whether the registrant (1) has filed all reports required to be filed by Section 13 or 15(d) of the Securities Exchange Act of 1934 during the preceding 12 months (or for such shorter period that the registrant was required to file such reports), and (2) has been subject to such filing requirements for the past 90 days. Yes☒ No ☐
Indicate by check mark whether the registrant has submitted electronically every Interactive Data File required to be submitted pursuant to Rule 405 of Regulation S-T (§232.405 of this chapter) during the preceding 12 months (or for such shorter period that the registrant was required to submit such files). Yes☒ No ☐
Indicate by check mark whether the registrant is a large accelerated filer, an accelerated filer, a non-accelerated filer, or a smaller reporting company, or emerging growth company. See definition of "large accelerated filer," "accelerated filer" and "smaller reporting company" and "emerging growth company" in Rule 12b-2 of the Exchange Act.
| | | | | | | | | | | | | |
Large accelerated filer | ☒ | | Accelerated filer | ☐ | | Non-accelerated filer | ☐ | | Smaller reporting company | ☐ | | Emerging growth company | ☐ |
If an emerging growth company, indicate by check mark if the registrant has elected not to use the extended transition period for complying with any new or revised financial accounting standards provided pursuant to Section 13(a) of the Exchange Act. ☐
Indicate by check mark whether the registrant has filed a report on and attestation to its management’s assessment of the effectiveness of its internal control over financial reporting under Section 404(b) of the Sarbanes-Oxley Act (15 U.S.C. 7262(b)) by the registered public accounting firm that prepared or issued its audit report. ☒
If securities are registered pursuant to Section 12(b) of the Act, indicate by check mark whether the financial statements of the registrant included in the filing reflect the correction of an error to previously issued financial statements. ☐
Indicate by check mark whether any of those error corrections are restatements that required a recovery analysis of incentive-based compensation received by any of the registrant’s executive officers during the relevant recovery period pursuant to §240.10D-1(b). ☐
Indicate by check mark whether the registrant is a shell company (as defined in Rule 12b-2 of the Act). Yes☐ No ☒
As of June 30, 2024, the aggregate market value of common stock held by non-affiliates of the registrant was approximately $938,376,082.
As of January 31, 2025, the number of shares of common stock of the registrant outstanding was 46,826,820.
DOCUMENTS INCORPORATED BY REFERENCE
The information required by Part III of this Report, to the extent not set forth herein, is incorporated herein by reference from the registrant’s definitive proxy statement relating to the Annual Meeting of Shareholders to be held in 2025, which definitive proxy statement shall be filed with the Securities and Exchange Commission within 120 days after the end of the fiscal year to which this Report relates.
CORE LABORATORIES INC.
FORM 10-K FOR THE FISCAL YEAR ENDED DECEMBER 31, 2024
TABLE OF CONTENTS
PART I
ITEM 1. BUSINESS
General
Core Laboratories Inc. is a Delaware corporation. We were established in 1936 and are one of the world’s leading providers of proprietary and patented reservoir description and production enhancement services and products to the oil and gas industry, primarily through client relationships with many of the world’s major, national and independent oil companies. These services and products can enable our clients to evaluate and improve reservoir performance and increase oil and gas recovery from their new and existing fields. We make measurements on reservoir rocks, reservoir fluids (crude oil, natural gas and water) and their derived products. In addition, we assist clients in evaluating subsurface targets associated with Carbon Capture and Sequestration (“CCS”) projects or initiatives. We have over 70 offices in more than 50 countries and have approximately 3,500 employees.
On May 1, 2023, Core Laboratories N.V. completed its previously announced redomestication transaction (the “Redomestication Transaction”), which through a series of steps, resulted in the merger of Core Laboratories N.V., a holding company in the Netherlands, with and into Core Laboratories Luxembourg S.A., a public limited liability company incorporated under the laws of Luxembourg, with Core Laboratories Luxembourg S.A. surviving, and subsequently the migration of Core Laboratories Luxembourg S.A. out of Luxembourg and its domestication as Core Laboratories Inc., a Delaware corporation. As a result of the Redomestication Transaction, all common shares in Core Laboratories N.V. were canceled and exchanged for common stock in Core Laboratories Luxembourg S.A. on a one-for-one basis. Former holders of Core Laboratories N.V. common shares now hold one share of common stock of Core Laboratories Inc. (formerly Core Laboratories Luxembourg S.A.) for each Core Laboratories N.V. common share owned immediately prior to the consummation of the Redomestication Transaction, and the business, assets, liabilities, directors and officers of Core Laboratories Inc. became the same as the business, assets, liabilities, directors and officers of Core Laboratories N.V. immediately prior to the Redomestication Transaction.
References to “Core Lab”, “the Company”, “we”, “our”, and similar phrases are used throughout this Annual Report on Form 10-K (this “Form 10-K”) and relate collectively to Core Laboratories Inc. and its consolidated affiliates.
Business Strategy
Our business strategy is to provide advanced technologies that improve reservoir performance by (i) continuing the development of proprietary technologies through client-driven research and development, (ii) expanding the services and products offered throughout our global network of offices and (iii) acquiring complementary technologies that add key technologies or market presence and enhance existing services and products.
Development of New Technologies, Services and Products
We conduct research and development to meet the needs of our clients who are continually seeking new services and technologies to lower their costs of finding, developing and producing oil and gas. While the aggregate number of wells being drilled per year fluctuates in response to market conditions, oil and gas producers have, on a proportional basis, increased expenditures on technology services to improve their understanding of the reservoir, increased production of oil and gas from their producing fields, and more recently, CCS projects. We intend to continue concentrating our efforts on services and technologies that help our clients reduce risk by evaluating geologic and engineering aspects of subsurface stratigraphic targets to improve reservoir performance and increase oil and gas recovery, as well as CCS projects and other projects directed at the global objective to reduce carbon emissions.
International Expansion of Services and Products
Another component of our business strategy is to broaden the spectrum of services and products offered to our clients on a global basis. We intend to continue using our worldwide network of offices to offer our services and products that have been developed internally or obtained through acquisitions. This global emphasis allows us to increase our revenue and enhance our profit through efficient utilization of our worldwide network.
Acquisitions
We continually review potential acquisitions to add key services and technologies, enhance market presence or complement existing business.
More information relating to any significant acquisitions is included in Note 3 - Acquisitions and Divestures of the Notes to the Consolidated Financial Statements.
Operations
We derive our revenue from services and product sales to clients primarily in the oil and gas and associated industries.
We operate our business in two segments. These complementary operating segments provide different services and products and utilize different technologies for evaluating and improving reservoir performance and increasing oil and gas recovery from new and existing fields. Disclosure relating to the operations and financial information of these operating segments is included in Note 21 - Segment Reporting and Other Disaggregated Information of the Notes to the Consolidated Financial Statements.
•Reservoir Description: Encompasses the characterization of petroleum reservoir rock, and reservoir fluids samples to increase production and improve recovery of crude oil and natural gas from our clients’ reservoirs. We provide laboratory-based analytical and field services to characterize properties of crude oil and crude oil-derived products to the oil and gas industry. Services associated with these fluids include determining the quality and measuring the quantity of the reservoir fluids and their derived products, such as gasoline, diesel and biofuels. We also provide proprietary and joint industry studies based on these types of analyses and manufacture associated laboratory equipment. In addition, we provide reservoir description capabilities that support various activities associated with energy transition projects, including services that support carbon capture, utilization and storage, geothermal projects, and the evaluation and appraisal of mining activities around lithium and other elements necessary for energy storage.
•Production Enhancement: Includes services and manufactured products associated with reservoir well completions, perforations, stimulation, production and well abandonment. We provide integrated diagnostic services to evaluate and monitor the effectiveness of well completions and to develop solutions aimed at increasing the effectiveness of enhanced oil recovery projects.
We offer our services worldwide through a global network of offices. Services accounted for 74%, 73% and 71% of our revenue for the years ended December 31, 2024, 2023 and 2022, respectively.
We manufacture products primarily in five facilities for distribution on a global basis. Product sales accounted for 26%, 27% and 29% of our revenue for the years ended December 31, 2024, 2023 and 2022, respectively.
Reservoir Description
Commercial oil and gas fields consist of porous and permeable reservoir rocks that contain crude oil, natural gas and formation water. Due to the density differences of the fluids, natural gas typically caps the field and overlies an oil layer, which overlies the water. We provide services that characterize the porous reservoir rock, all three reservoir fluids and their derived products. Services associated with these fluids include determining the quality and measuring the compositional, physical and volumetric properties of the complex reservoir hydrocarbons and their derived products, such as various fuels. Fluid analyses account for approximately two-thirds of Reservoir Description revenue. We also provide more advanced laboratory analyses which measure reservoir hydrocarbons at reservoir conditions to determine the changes in the hydrocarbon’s physical properties with changing pressure and temperature.
We analyze samples of reservoir rocks to determine lithologic, geochemical, and pore system properties. We measure rock properties, such as porosity, which determines reservoir storage capacity, and permeability, which defines the ability of the fluids to flow through the rock. These measurements are used to determine how much oil and gas are present in a reservoir and the rates at which the oil and gas can be produced. Conversely, the properties must also be known for injection projects such as CCS and water disposal. We also use our proprietary services and technologies to correlate the reservoir description data to wireline logs and other subsurface data.
The combined use of both the reservoir rock and fluid data are invaluable inputs for clients in determining the economic viability of hydrocarbon deposits and in identifying the most efficient methods to optimize the recovery, processing and refinement of these hydrocarbons. Early evaluations and key decisions about well performance and viability are important for optimizing a reservoir. This is accomplished by using proprietary and patented laboratory methods, including both traditional physical measurements and more recently introduced new technologies, such as Core Lab’s Non-Invasive Technologies for Reservoir OptimizationSM (“NITROSM”) services. NITROSM services include: Dual Energy Computed Tomography (“DECT”), Micro Computed Tomography, high and low frequency nuclear magnetic resonance, high-resolution gamma logging and continuous high energy x-ray fluorescence, along with pressure-volume-temperature (“PVT”), compositional analysis, and other Core Lab proprietary technologies.
Core Lab conducts a wide variety of physical laboratory tests to measure and evaluate fluid flow through the rock, often at in-situ reservoir temperatures and pressures. These are most commonly applied to conventional reservoirs. We have also developed unique analytical processes to understand the flow characteristics and saturation profiles of unconventional reservoir systems.
Core Lab has been at the forefront of digital transformation technologies for more than two decades. Core Lab’s extensive, proprietary databases and analog technologies, coupled with artificial intelligence (“AI”) and machine learning, help our clients improve efficiencies and lower operating costs throughout the upstream value chain. The analysis and integration of these critical datasets is enhanced because of Core Lab’s proprietary RAPIDTM database. Core Lab’s Digital Innovation Group works collaboratively with multiple international and national oil companies on projects that utilize Core Lab’s proprietary digital technologies and services. Core Lab’s proprietary Advanced Rock Typing technology combines Core Lab’s vast, comprehensive database of physical measurements and World Wide Rock CatalogTM with its proprietary image acquisition technology and innovative AI image recognition. Core Lab’s proprietary World Wide Rock CatalogTM provides a database and analog reference set for predicting properties when physical measurements are unavailable. These technologies provide clients with analog data sets in situations where the acquisition of new conventional core may not be possible or where only wellbore drill cuttings are available. High-resolution images of wellbore cuttings and sidewall cores are quickly and efficiently matched with analogs from Core Lab’s proprietary database of samples from around the world. Physically measured data sets from the matching analogs are delivered to our clients in time to make appraisal and development decisions.
Core Lab’s proprietary legacy portfolio of geological studies and rock and fluid property datasets on conventional reservoirs and seals, accessible through Core Lab’s database platform, RAPIDTM, are being leveraged in energy transition projects as well, and are proving invaluable to operators evaluating potential CCS sites.
Core Lab holds various patents, trade secrets, and proprietary designs for laboratory equipment required to analyze reservoir rocks as well as the properties and phase behavior of reservoir fluids and derived products. We manufacture a wide range of ambient and reservoir condition rock and fluid analysis laboratory equipment for our own use throughout our international laboratory network. Among these devices are complex, high-pressure, high-temperature, reservoir condition, multi-phase flow systems and full visualization Pressure-Volume-Temperature cells, along with the ancillary equipment required to support these laboratory programs. We also sell equipment of this type to universities, government institutes, and client company research labs.
While recognizing the need to optimize the full value chain of our clients, from producing well to retail sales of hydrocarbon products, a state-of-the-art IT platform, CONNECT: was launched to efficiently acquire and optimize workflows of field data, laboratory results, and other observations relevant to our client base. The system is designed for single data entry, and that data can be used for further analysis and, more importantly, be shared with our clients by process flow dashboards with key performance indicators. The system can also share real-time data on mobile devices, enabling our clients to make quick decisions.
We continue to add new modules to our suite of data management platforms that enhance customer experience and improve access to project results.
We conduct numerous large-scale, multi-company reservoir description projects, applying proprietary and state-of-the-art techniques from the earliest phases of a field development program until the last economic barrel of oil is recovered. We initiate and deliver a group of international and U.S. based consortium studies to evaluate both conventional and unconventional reservoirs. These projects, which often run more than a year, are of increasing importance to oil companies as the incremental barrel is often the lowest cost and most profitable barrel in the reservoir. Producing incremental barrels increases our clients’ cash flows which we believe will result in additional capital expenditures by our clients, and ultimately further opportunities for us. Core Lab retains rights of ownership to complete joint industry project studies, which can be resold at a later date.
Our databases, technology and analytical methods also allow us to assist our clients in other ways. Many of our clients have begun investing in and developing other sources of energy, including renewables. Some of these initiatives include deployment of technologies associated with the assessment of strata to establish strategies tied to subsurface gas storage and mining of elements such as lithium, which are critical components of batteries for energy storage. Measurement and analytical techniques are also used to assist our clients with reporting requirements associated with carbon sequestration.
Production Enhancement
Core Lab's Production Enhancement group provides products and diagnostic services to help optimize well completions, reservoir operations and field development strategies, in order to increase recoverable reserves in the most efficient way. These product offerings include perforating technologies to establish communication between the wellbore and the reservoir.
Diagnostic services are used to assess well completions and field floods. Two commonly used production enhancement methods are (i) hydraulic fracturing of the reservoir rock to improve flow and (ii) flooding a reservoir with water, carbon dioxide, nitrogen or hydrocarbon gases to drive more oil and gas to the producing wellbores. Many oilfields today are hydraulically fractured and/or flooded to maximize oil and gas recovery. Although Core Lab is not a hydraulic fracturing company, Core Lab does provide services that are used by operators to develop and optimize hydraulic fracturing and field flood projects and to evaluate the success of those projects. These services, products and expertise play a key role in the success of stimulation and enhanced oil recovery programs.
The hydraulic fracturing of a producing formation is achieved by pumping a fluid slurry containing a proppant material into the reservoir zone at extremely high pressures. This fractures the rock and the proppant material “props” or holds the fracture open after the pressure pumping is complete, so that reservoir fluids can flow through a highly conductive fracture network into the production wellbore. Data on rock type and strength generated in the Reservoir Description operating segment are critical for determining the proper design of the hydraulic fracturing treatment. In addition, further testing indicates whether the fluid slurry is compatible with the reservoir rock so that damage does not occur that would otherwise restrict production. Core Lab also provides testing of various propping agents and software to help select the best propping agent based on net present value calculations of client investments. Clients leverage our diagnostic services and the associated proprietary and patented technologies in the Permian, Eagle Ford, Wolfcamp, Bakken, Haynesville and other plays to assist them in the following areas;
•Chemical frac water tracing services are used to aid operators in determining the efficiency of the fracturing fluids used to optimize hydraulic fracture stimulation of long, multi-stage horizontal wells in oil- and gas-shale plays in unconventional reservoirs. This technology also enables clients to evaluate load recovery, gas breakthrough, fluid leak-off and breaker efficiency, all of which are important factors for optimizing oil and/or natural gas production after the formation is hydraulically fractured.
•Well diagnostic data sets are used to determine if and how effectively each frac stage is flowing and cleanup efficiency of the stimulation fluid, to determine whether horizontal wells are unobstructed and flowing through the entire length of a horizontal well. Clients use this data to confirm optimum cluster efficiency, stage spacing, stimulated reservoir volume, and to increase ultimate recovery. By applying this technology, clients can identify and remediate well obstructions that can negatively impact well performance, reserve calculations and reserve-based lending. Additionally, hydrocarbon production can be quantified from discrete segments in multi-stage horizontal well completions in unconventional tight-oil or gas plays. Frac stages with ineffective flows may warrant further stimulation or remedial actions, while guiding improvements in future frac designs and flowback procedures.
•The diagnostic services are also used as a completion monitoring system, to determine flow rates from reservoir zones after they have been hydraulically fractured. This provides clients with a baseline of early production information that can be compared to subsequent data later in the life of the well to see how hydrocarbon production from different reservoir layers or different quality rock varies over time.
•To help optimize the placement of unconventional horizontal wells, our diagnostic services are used to monitor offset well interference by sampling offset well oil, gas and water production. The amount of tracer detected in offset wells is used to help clients optimize both horizontal and vertical well spacing and the optimum amount of fracturing fluids for each stage.
•Dynamic flow tests of the reservoir fluids through reservoir rock are conducted, at actual reservoir pressure and temperature, to realistically simulate the flooding of a producing zone and assist in designing the enhanced hydrocarbon recovery projects. After a field flood is initiated, Core Lab is often involved in monitoring the progress of the flood to ensure the sweep efficiency during field flood is optimized and maximum incremental production is achieved.
•Our tracer technologies and proprietary logging tools are also used in the evaluation of gravel pack effectiveness in unconsolidated reservoirs. Patented technologies are used to measure density changes in the gravel pack annulus to verify the competency of the gravel pack.
In addition to Core Lab’s many patented reservoir diagnostic technologies, Production Enhancement has established itself as a global leader in the manufacturing and distribution of high-performance perforating products. Core Lab’s manufacturing operations in the United States and Canada continue to meet the global demand for our perforating systems while gaining in efficiency and productivity. Core Lab’s unique understanding of complex reservoirs supports our ability to supply perforating systems engineered to maximize well productivity by reducing, eliminating and overcoming formation damage caused during the drilling and completion of oil and gas wells. This “systems” approach to the perforation of an oil or gas well has resulted in numerous patented products which are aimed at assisting clients with the following:
•Perforating charges which provide a deeper and cleaner perforating tunnel into the oil and gas reservoir. This allows greater flow of hydrocarbons to the wellbore and helps to maximize hydrocarbon recovery from the reservoir.
•Perforating charges designed specifically for optimizing fracture stimulation well completions by providing low standard deviation perforation hole size, which minimizes tortuosity effects. This not only results in better well stimulations and improved, cleaner perforation tunnels, but also less surface horsepower and less time to stimulate the well, which translates into lower costs.
•Perforating technology which creates a uniform hole size through two strings of casing, utilized in mechanically isolated re-stimulation programs where the internal string is used to isolate older, depleted stages in previously under-stimulated wells.
•Oriented perforating systems which deliver consistent-hole-size charges that can be aligned in a specific orientation in order to achieve uniform breakdown across each stage. These systems offer: 1) extreme limited entry perforating capability, 2) precisely aligned perforations, and 3) minimized connections and completion string length.
•Proprietary plug and abandonment perforating systems, used in partial or full well abandonment projects, that allow for reduced rig time and efficient recovery of the interior casing, while eliminating risks and creating opportunities for production from untapped and still producing reservoir sections.
•The patented X-SPAN® and GTX-SPAN® casing patches which have temperature ratings to as much as 600°F. These systems are capable of performing in high temperature as well as high pressure oil and gas environments and are used to seal non-productive reservoir zones from the producing wellbore.
Additionally, Core Lab’s Production Enhancement operating segment offers services to assist clients in determining the best energetic solutions for a specific rock type, to maximize productivity of an operator’s reservoir through our Reservoir Optimized Completions Lab (“ROC LabTM”). The ROC LabTM features an industry-leading, Ultra High Pressure/High Temperature perforation test vessel. The test vessel is paired with a proprietary flow system that uses highly specialized, internally developed and manufactured pumps and flow controllers. Combined, these technologies create a proprietary flow loop capable of dynamically displacing oil, brine and gas through rock samples that have been perforated with preselected energetics. Core Lab leverages its multi-decade expertise in conducting multi-phase fluid flow tests through porous medium to optimize this technological investment.
Core Lab’s proprietary downhole energetic solutions and instrumentation are designed to systemize, simplify, automate, and de-risk the deployment of perforating systems, which are utilized by international oil and gas operators for well completions. These technologies provide a unique range of perforating tools and equipment, which have been developed to provide a number of advantages over existing technology. Core Lab’s Production Enhancement team has experienced technical services personnel to support clients through our global network of offices for the everyday use of our perforating systems and the rapid introduction of new products. Our personnel are capable of providing client training and on-site services in the completion of oil and gas wells.
Marketing and Sales
We market and sell our services and products through a combination of sales representatives, technical seminars, trade shows and print advertising. Direct sales and marketing are carried out by our sales force, technical experts and operating managers, as well as by sales representatives and distributors in various markets where we do not have offices. Our Business Development group manages a Large Account Management Program to better serve our largest and most active clients by meeting with key personnel within their organizations to ensure the quality of our services and products are meeting their expectations and address any issues or needs in a timely manner.
Research and Development
The market for our services and products is characterized by changing technology and frequent product introduction. As a result, our success is dependent upon our ability to develop or acquire new services and products on a cost-effective basis and to introduce them into the marketplace in a timely manner. Many of our acquisitions have allowed us to obtain the benefits of the acquired company’s research and development projects without incurring significant costs if we had attempted to develop the services and products ourselves. We incur costs as part of internal research and development, and these costs are charged to expense as incurred and reflected in the operational results of the associated operating segment. We intend to continue committing financial resources and effort to the development and acquisition of new services and products. Over the years, we have made a number of technological advances, including the development of key technologies utilized in our operations.
Substantially all of our new technologies are the result of requests and guidance from our clients, particularly major oil companies.
Patents and Trademarks
We believe our trade secrets, patents, technology, trademarks and other intellectual property rights are an important factor in maintaining our technological advantage, although no single one of these is considered essential to our success. Typically, we will seek to protect our intellectual property in all jurisdictions where we believe the cost of such protection is warranted. While we have patented some of our key technologies, we do not patent all of our proprietary technology even where regarded as patentable. We protect our intellectual property, including through the use of appropriate confidentiality agreements, legal enforcement proceedings and by other means.
International Operations
We operate facilities in more than 50 countries. Our non-U.S. operations accounted for 66%, 65% and 66% of our revenue during the years ended December 31, 2024, 2023 and 2022, respectively. We attribute service revenue to the country in which the service was performed rather than where the reservoir or project is located, while we attribute product sales revenue to the country where the product was shipped as we feel this gives a clearer view of our operations. We do, however, have significant levels of service revenue performed and recorded in the U.S. that are sourced from projects on non-U.S. oilfields.
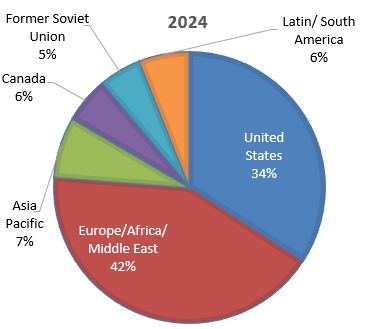
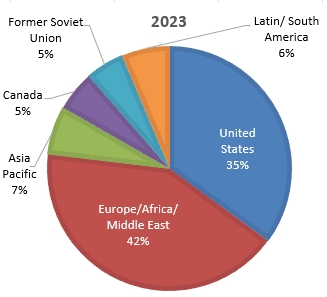
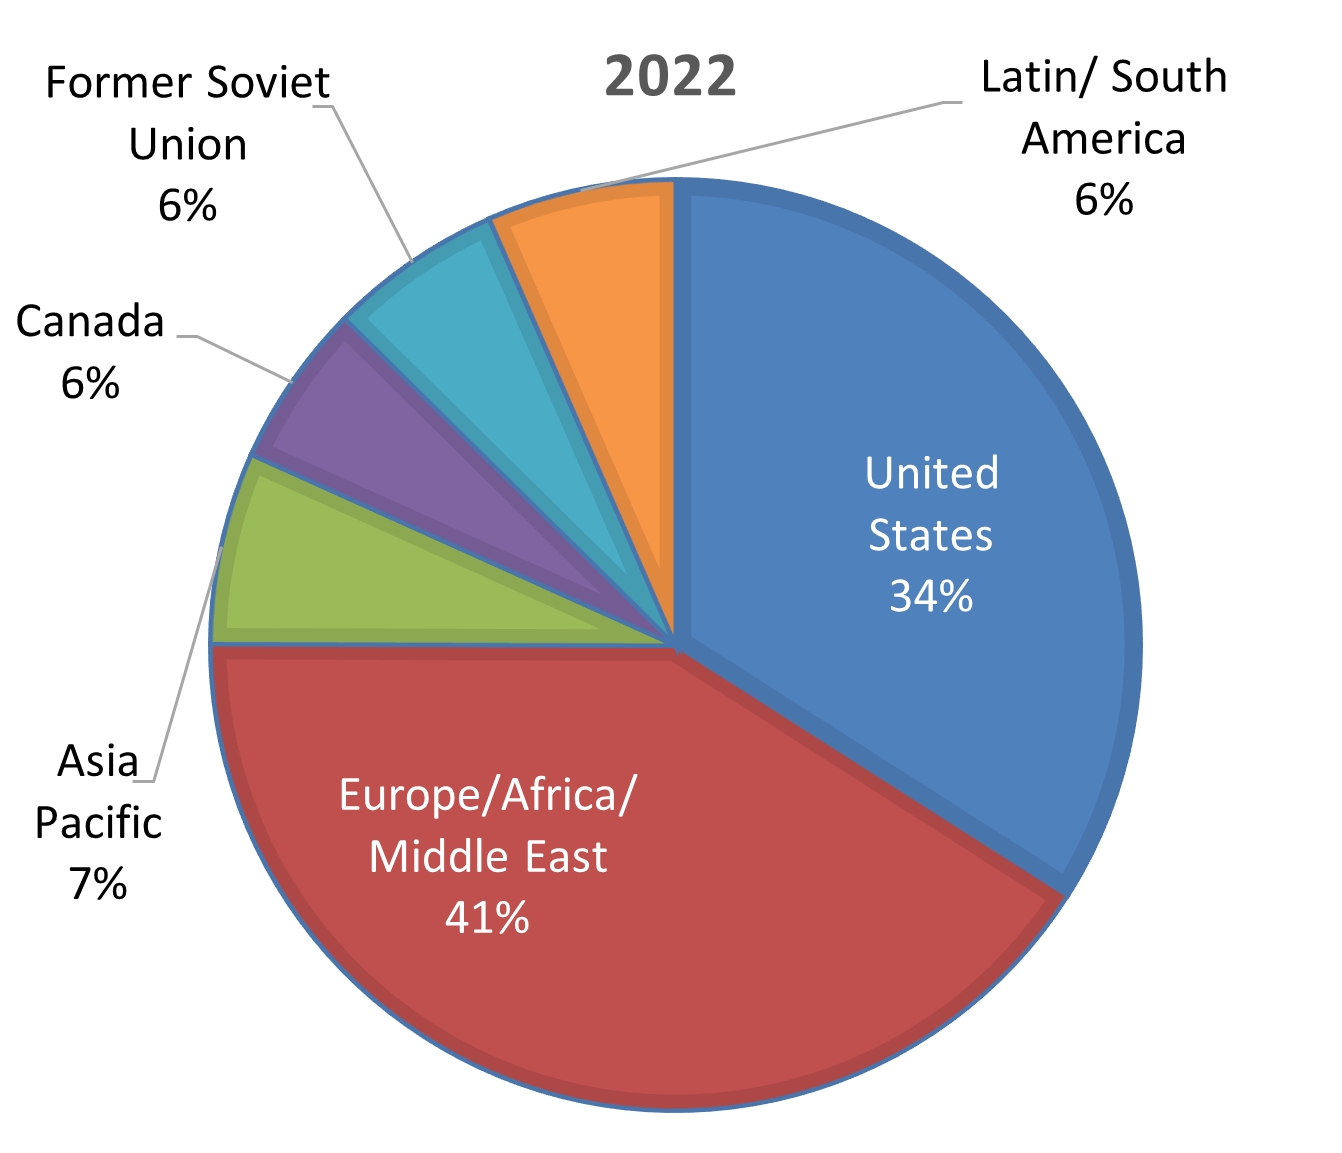
The following graphs and table summarize our reported revenue by geographic region for the years ended December 31, 2024, 2023 and 2022 (in thousands):
| | | | | | | | | | | | | | | | | | | | | |
| United States | | Europe/Africa/
Middle East | | Asia Pacific | | Canada | | Former Soviet
Union | | Latin/ South America | | Consolidated | |
2024 | $ | 178,895 | | $ | 220,360 | | $ | 37,796 | | $ | 28,637 | | $ | 26,723 | | $ | 31,437 | | $ | 523,848 | |
2023 | $ | 178,549 | | $ | 213,339 | | $ | 32,770 | | $ | 26,898 | | $ | 26,118 | | $ | 32,116 | | $ | 509,790 | |
2022 | $ | 166,701 | | $ | 200,863 | | $ | 32,688 | | $ | 27,797 | | $ | 29,514 | | $ | 32,172 | | $ | 489,735 | |
While we are subject to fluctuations and changes in currency exchange rates relating to our international operations, we attempt to limit our exposure to foreign currency fluctuations by limiting the amount in which our foreign contracts are denominated in a currency other than the U.S. dollar. However, the ultimate decision as to the proportion of the foreign currency component within a contract usually resides with our clients. Consequently, we are not always able to eliminate our foreign currency exposure. We have not historically engaged in and are not currently engaged in any significant currency hedging or trading transactions designed to compensate for adverse currency fluctuations.
Environment and Climate
Governmental Laws and Regulations
We are subject to stringent governmental laws and regulations, both in the United States and other countries, pertaining to protection of the environment.
We have developed policies and procedures associated with the management, handling, recycling or disposal of chemicals and gases and other materials and wastes resulting from our operations. In areas where environmental regulations do not exist, we have established other policies and procedures in efforts to preserve the environment.
Additionally, our analytical and manufacturing processes involve the handling and use of numerous chemicals and gases as well as the generation of wastes. Spills or other unauthorized releases of these chemicals, gases, and wastes at our facilities, whether by us or prior owners or operators, or at offsite locations where we transport them for recycling or disposal, could subject us to environmental liability, either from the applicable government agency or private landowners or other third parties. This could also include costs of cleaning up chemicals and wastes released into the environment and for damages to persons, properties or natural resources. As a result of such actions, we could be required to remove previously disposed wastes (including wastes disposed of or released by prior owners or operators), remediate environmental contamination (including contaminated groundwater), and undertake measures to prevent future contamination. Other countries where we operate have similar legal regimes. We may also be subject to claims alleging personal injury or property damage as a result of alleged exposure to hazardous substances as well as damage to natural resources. We may not be able to recover some or any of these remedial or corrective costs from insurance.
Environmental laws and regulations, and their interpretation, frequently change, and have tended to become more stringent over time. Our costs for compliance may not be fully recoverable from our clients and, thus, could reduce net income. New, modified or stricter enforcement of environmental laws and regulations could be adopted or implemented that significantly increase our compliance costs, pollution mitigation costs, or the cost of any remediation of environmental contamination that may become necessary, and these costs could have a material adverse effect on our business, financial condition, results of operation, or cash flows.
Historically, our environmental compliance costs have not had a material adverse effect on our results of operations; however, there can be no assurance that such costs will not be material in the future or that such future compliance will not have a material adverse effect on our business or results of operations.
In addition, we depend on the demand for our products and services from the oil and gas industry and, therefore, are affected by changing taxes (including subsidies), price controls, tariffs, and trade restrictions, and other laws and regulations relating to the oil and gas industry in general, including those specifically directed to hydraulic fracturing, onshore production, air pollution, and climate change.
Likewise, governmental, scientific, and public concern over the threat of climate change arising from greenhouse gas (“GHG”) emissions, including public and private incentive programs for alternative and renewable energy sources, may result in a change in consumer preferences for energy sources and therefore a decreased demand for our customers’ products. Sustained deviations from normal weather patterns, such as cooler or warmer summers and winters, can have a significant impact on demand as consumption of energy, particularly natural gas, is seasonal.
See Item 1A. Risk Factors, “Risk factors associated with health, safety and the environment” for further discussion on environmental matters.
Climate Related Initiatives
We are committed to reducing our physical risks and environmental footprint associated with climate change while improving our performance and sustainability in line with the global transition toward lower carbon sources of energy. Core Lab has disclosed its environmental impact through the Carbon Disclosure Project (a non-profit that runs the world’s leading environmental disclosure platform, “CDP”) annual survey since 2014.
Core Lab’s eighty-plus years of expertise evaluating both subsurface geology and fluid flow through natural, porous media and our reputation for reliable and efficient reservoir optimization services provides us with opportunities to play a positive role in supporting emerging energy transition initiatives.
Core Lab offers technologically advanced services that provide scientific data important to the design of client projects that involve injecting carbon dioxide (“CO2”) into geologic formations for permanent storage or to improve recovery of hydrocarbons. Within Core Lab’s CCS Consortium and through our laboratories, we study how CO2 interacts with fluids in the reservoir as well as how CO2 mobilizes residual oil in collaboration with the reservoir.
Physical Risk Analysis
In 2020, Core Lab conducted a physical risk assessment with the aid of a third-party sustainability data company for 100 of our locations to understand the exposure of our facilities and capital assets to climate change physical impacts under future
climate change scenarios. Physical risks evaluated were water stress, flooding, heatwave, cold wave, hurricane, wildfire, and sea level rise using three climate scenarios over time periods of 2020 (baseline), 2030 and 2050. Overall, the assessment indicated that we face moderate physical risk with our greatest exposure to water stress and cold wave. Our overall exposure has remained consistent throughout the scenarios, although exposure to a cold wave shows a decline through the scenarios. These physical risks could result in loss of revenue, increase in our costs, including insurance premiums, or affect the availability of insurance against such risks.
We do not have locations in a natural, rural environment. Before opening a new location, potential impacts to the environment and community are considered by executive management. In the event we close a particular location, we try to ensure that the land and building are properly returned to a suitable condition. We also take steps designed to ensure that any potential environmental conditions have been remediated as required by local regulation and standards.
GHG Emissions
Core Laboratories maintains a sustainability management system that tracks our consumption of non-renewable resources. We have also engaged a third-party sustainability data company to quantify the impact of emissions categorized as:
•Scope 1 (direct GHG emissions that occur from sources that we control or own),
•Scope 2 (indirect GHG emissions associated with the purchase of electricity, steam, heat, or cooling) or
•Scope 3 (indirect emissions that occur upstream or downstream in our value chain)
This system assists us in setting science-based targets for our Scope 1 and Scope 2 emissions. Science-based targets aim to help companies work towards limiting the increase in global average temperatures to below 2°C, a limit agreed upon by leading climate scientists and governments to ensure long-term sustainability and profitability. These tools focus our efforts on reducing our environmental footprint and provide the data needed to create other climate targets and goals.
Our operational footprint is primarily from our office buildings and laboratories and their related electricity consumption (Scope 2 emission) and use of natural gas and diesel for heating, backup generation and refrigeration processes (Scope 1 emission). In our efforts to reduce GHG emissions, we choose alternative sources of electricity, such as renewable sources or low-carbon emission natural gas when there are options available and feasible. We also consume fuel to operate field vehicles (Scope 1 emission), however, this is primarily limited to our staff working in the field and is not a significant emission component of our total operations. Most of the value chain emissions (Scope 3 emissions) occur upstream from our operations and are associated with employee commuting, purchased goods and services, activities associated with fuel and energy, and upstream transportation and distribution. Downstream emissions are primarily associated with transportation and distribution.
See Item 1A. Risk Factors, “Risk factors associated with health, safety and the environment” for further discussion on environmental matters.
Occupational Safety and Health Regulations
Our operations in the United States and foreign countries are subject to stringent occupational safety and health laws and regulations, which are intended to protect worker health and safety, including the federal Occupational Safety and Health Act, which establishes requirements to protect the health and safety of workers. The U.S. Occupational Safety and Health Administration (“OSHA”) hazard communication standard, the Environmental Protection Agency (“EPA”) community right-to-know regulations under Title III of the federal Superfund Amendment and Reauthorization Act and comparable state statutes require maintenance of information about hazardous materials used or produced in operations and provision of this information to employees, state and local government authorities and citizens. The federal Bureau of Alcohol, Tobacco, Firearms and Explosives (“ATF”) establishes requirements for the safe use and storage of explosives. Substantial fines and penalties can be imposed and orders or injunctions limiting or prohibiting certain operations may be issued in connection with any failure to comply with these laws and regulations. Foreign countries in which we conduct operations may also have analogous controls that regulate our worker safety-related activities, which controls may impose additional, or more stringent requirements.
As discussed above, our processes involve the handling and use of numerous chemicals and gases as well as the generation of waste which could cause harm to our employees. Such work is performed in an industrial or laboratory setting, or at our clients’ worksite which would also require travel. These types of conditions are susceptible to workplace accidents.
See Item 1A. Risk Factors, “Risk factors associated with health, safety and the environment” for further discussion on environmental matters.
Competition
The business in which we engage is competitive. Some of our competitors are divisions or subsidiaries of companies that are larger and have greater financial and other resources than we have. While no one company competes with us in all of our service and product lines, we face competition in these lines, primarily from independent regional companies and internal divisions of major integrated oil and gas companies. We compete in different service and product lines to various degrees on the basis of price, technical performance, availability, quality and technical support. Our ability to compete successfully depends on elements both within and outside of our control, including successful and timely development of new services and products, performance and quality, client service, pricing, industry trends and general economic trends.
Reliance on the Oil and Gas Industry
Our business and operations are substantially dependent upon the condition of the global oil and gas industry. Future downturns in the oil and gas industry, or in the oilfield services business as well as the adoption and implementation of legislation, executive orders, and other regulatory initiatives that seek to combat climate change by restricting fossil fuel activities, limiting GHG emissions, certain methods of extraction of oil and gas, or the locations in which such activities may be conducted, may have a material adverse effect on our financial position, results of operations or cash flows. This risk factor is perhaps amplified given recent pronouncements and actions taken by the executive and/or legislative branches of the U.S. government in an uncertain and shifting political environment.
The oil and gas industry is highly cyclical and has been subject to significant economic downturns at various times as a result of numerous factors affecting the supply of and demand for oil and natural gas, including the level of capital expenditures of the oil and gas industry, the level of drilling activity, the level of production activity, market prices of oil and gas, economic conditions existing in the world, interest rates and the cost of capital, environmental regulations, tax policies, the impact of certain geopolitical conflicts, political requirements of national governments, coordination by the Organization of Petroleum Exporting Countries and other oil producing nations (“OPEC+”), cost of producing oil and natural gas, and technological advances.
The success of our business has been underpinned by developing industry leading technologies used in evaluating and improving reservoir performance, increasing oil and gas recovery from new and existing fields, as well as evaluating potential CCS sites in the subsurface both onshore and offshore. Many of these technologies have been developed to meet the needs of our clients, which continue to evolve with demands in both traditional energy sources and with energy transition. As energy transition continues to evolve, our business may become more dependent on the continued innovation and adoption of our industry leading technologies.
Human Capital
We are primarily a service provider in the oilfield services industry, so our workforce includes employees who are highly skilled professionals, including engineers and geologists, and other technical personnel, in addition to our administrative employees. As of December 31, 2024, we had approximately 3,500 employees. We do not have any material collective bargaining agreements and consider relations with our employees to be good.
Our Core Values: (1) Safety Awareness, (2) Honesty & Integrity, (3) Customer Focus, (4) Building Trust and (5) Employee Development, define us as a company and are the framework that unite us on the path toward achieving our goals and propelling Core Lab forward. These values represent and establish the foundation by which we treat each other, conduct our business and simply define “how we do things around here.” By embedding our Core Values into our operating strategies, we ensure that our company culture and mission also drive our Environmental, Social and Governance (“ESG”) sustainability efforts. We keep our employees informed of major business developments through CoreConnect, a communication initiative to drive connection and engagement between employees and executive leadership, and through contact by extended leadership teams, periodic emails, quarterly newsletters, quarterly reports, and annual events.
Core Lab values its employees and is committed to providing resources that engage employees, enhance their work experience, and develop them for the future. To assist in this pledge, Core Lab has created its talent management strategy based on the employee life cycle. Our total rewards approach is aligned to our business strategy and country-specific market influences. We offer competitive compensation and benefit programs in each country where we operate. Our approach not only encompasses competitive compensation and benefits, but also personal and professional growth opportunities within a global performance culture.
We develop our employees through performance management and talent assessment processes, competency-based development plans and training both in leadership and functional areas while also offering educational assistance programs.
Our annual performance management cycle is an ongoing process that enables managers and employees to collaborate throughout the year to set performance goals and development objectives that align to business objectives. These processes are designed to help employees understand where they add value to the organization, provide focus on and discussion around career aspirations, and reward employees for high performance.
We aspire to create an inclusive work culture where differences are valued. We recognize the unique perspectives and thoughts that our employees bring to our environment which stimulates innovation and generates out-of-the-box solutions that benefit our Company, clients and industry. We promote a culture-centric focus on the health and safety of our employees and the environment with a proactive approach towards identifying and managing risks through recognition, evaluation, and education. We empower our employees by fostering a sense of responsibility for managing their own work environment through open communication, and a management-supported “zero accident” culture.
Web Site Access to Our Periodic SEC Reports
Our primary internet address is https://www.corelab.com. We file or furnish Quarterly Reports on Form 10-Q, Annual Reports on Form 10-K, Current Reports on Form 8-K, and any amendments to those reports with the U.S. Securities and Exchange Commission (“SEC”). These reports are available free of charge through our web site as soon as reasonably practicable after they are filed or furnished electronically with the SEC. We may from time to time provide important disclosures to investors by posting them in the investor relations section of our web site, as allowed by SEC rules.
The SEC maintains an internet website at https://www.sec.gov that contains reports, proxy and information statements, and other information regarding our company that we file electronically with the SEC. References to the Company’s website in this Form 10-K are provided as a convenience and do not constitute, and should not be deemed, an incorporation by reference of the information contained on, or available through, the website, and such information should not be considered part of this Form 10-K.
ITEM 1A. RISK FACTORS
Our forward-looking statements are based on assumptions that we believe to be reasonable but that may not prove to be accurate. All of our forward-looking information is, therefore, subject to risks and uncertainties that could cause actual results to differ materially from the results expected. All known, material risks and uncertainties are discussed below.
Risk factors associated with the industry in which we operate
Any cost reduction initiatives that Core Lab undertakes may not deliver the results it expects, and these actions may adversely affect its business.
As business conditions change, the Company may need to implement cost-cutting measures that may adversely affect its business. These cost-cutting measures may include reductions in the quarterly dividend, base salaries of senior executives and employees, annual capital expenditures, implementation of temporary employee furloughs, and workforce reductions, among other reductions of corporate and operating costs.
In addition, these initiatives could result in disruptions to Core Lab’s operations. Any cost-cutting measures could also negatively impact Core Lab’s business by delaying the introduction of new products or technologies, interrupting service of additional products, or impacting employee retention. There can be no assurance that additional costs will not offset any such reductions of its operations. If Core Lab’s operating costs are higher than expected, or if it does not maintain adequate control of its costs and expenses, Core Lab’s results of operations will suffer. If Core Lab is unable to mitigate these or other potential risks related to its cost cutting initiatives, it may disrupt Core Lab’s business or could have a material adverse effect on its financial condition and results of operations.
Downturns in the oil and gas industry, or in the oilfield services business, may have a material adverse effect on our financial condition or results of operations.
The oil and gas industry is highly cyclical and demand for the majority of our oilfield services and products is substantially dependent on the level of expenditures by the oil and gas industry for the exploration, development and production of crude oil and natural gas reserves, which are sensitive to oil and natural gas prices and generally dependent on the industry's view of future oil and gas prices. There are numerous factors affecting the supply of and demand for our services and products, which are summarized as:
▪general and economic business conditions, including market prices of oil and gas and expectations about future prices;
▪global or domestic health crises;
▪the adoption of legal requirements or taxation;
▪changes in existing laws, regulations or other governmental actions;
▪cost of producing and the ability to deliver oil and natural gas;
▪the level of drilling and production activity;
▪financial condition of our client base and their ability to fund capital expenditures;
▪coordination by the OPEC+;
▪civil unrest or political uncertainty in oil producing or consuming countries and other geopolitical conflict, including the ongoing conflict in the Middle East and between Russia and Ukraine;
▪level of consumption of oil, gas and petrochemicals by consumers;
▪availability of services and materials for our clients to grow their capital expenditures and to deliver product to market; and
▪availability of materials and equipment from key suppliers.
The oil and gas industry has historically experienced periodic downturns, which have been characterized by diminished demand for our oilfield services and products and downward pressure on the prices we charge. A significant downturn in the oil and gas industry could result in a reduction in demand for oilfield services and could adversely affect our operating results.
Changes in macro-economic factors impacting the oil and gas industry may negatively affect our ability to accurately predict client demand, which could cause us to hold excess or obsolete inventory and experience a reduction in gross margins and financial results.
We cannot accurately predict which or what level of our services and products our clients will need in the future. Orders are placed with our suppliers based on forecasts of client demand and, in some instances, we may establish buffer inventories to accommodate anticipated demand. Our forecasts of client demand are based on multiple assumptions, each of which may introduce errors into the estimates. In addition, many of our suppliers require a longer lead time to provide products than our clients’ demand for delivery of our finished products. If we overestimate client demand, we may allocate resources to the purchase of materials or manufactured products that we may not be able to sell when we expect to, if at all. As a result, we could hold excess or obsolete inventory, which would reduce gross margin and adversely affect financial results. Conversely, if we underestimate client demand or if insufficient manufacturing capacity is available, we could miss revenue opportunities and potentially lose market share and damage our client relationships. In addition, any future significant cancellations or deferrals of service contracts or product orders could materially and adversely affect profit margins, increase product obsolescence and restrict our ability to fund our operations.
Risk factors associated with our international presence
We depend on the results of our international operations, which expose us to risks inherent in doing business abroad.
We conduct our business in over 50 countries. Our operations, and those of our clients, are subject to the various laws, regulations and other legal requirements of those respective countries as well as various risks peculiar to each country, which may include, but are not limited to:
▪global economic conditions;
▪political actions and requirements of national governments including trade restrictions, embargoes, seizure, detention, nationalization and expropriation of assets;
▪interpretation of tax statutes and requirements of taxing authorities worldwide, including the United States, routine examination by taxing authorities and assessment of additional taxes, penalties and/or interest;
▪trade and economic sanctions, tariffs or other restrictions imposed by the European Union, the United Kingdom, the United States or other countries;
▪fluctuations and changes in currency exchange rates (see section below);
▪the impact of inflation;
▪difficulty in repatriating foreign currency received in excess of the local currency requirements;
▪current conditions in oil producing countries such as Venezuela, Nigeria, Libya, Iran and Iraq considering their potential impact on the world markets; and
▪geopolitical conflicts in the countries or regions we operate in, including the Russia-Ukraine and Middle East conflicts.
Historically, economic downturns and political events have resulted in lower demand for our services and products in certain markets. The continuing instability in the Middle East, North Africa, South America and Ukraine, and the potential for activity from terrorist groups that the U.S. government has cautioned against have further heightened our exposure to international risks. The global economy is highly influenced by public confidence in the geopolitical environment, and the situations in the affected countries and regions, as mentioned above, continue to be highly fluid; therefore, we expect to experience heightened international risks.
From time to time, certain geopolitical conflicts may lead to imposition of economic sanctions and associated export controls applicable to our operations. These sanctions may be imposed against certain countries, companies and individuals that may restrict or prohibit transactions involving the countries, companies and individuals identified, which may also further restrict or prohibit us in conducting sales and maintaining operations in any of these jurisdictions.
Our operations may be adversely affected by sanctions, export controls, and similar measures targeting Russia and other countries and territories as well as other responses to Russia’s military conflict in Ukraine.
The geopolitical conflict between Russia and Ukraine has resulted in the U.S. government, European Union, the United Kingdom and other countries imposing broad-ranging and coordinated economic sanctions and export control measures against Russia, Belarus, the Crimea Region of Ukraine, the so-called Donetsk People’s Republic and the so-called Luhansk People’s Republic, including, among others:
•a prohibition on doing business with certain Russian companies, large financial institutions, officials and oligarchs;
•a prohibition on commercial activities in the so-called Donetsk People’s Republic and the so-called Luhansk People’s Republic;
•a commitment by certain countries and the European Union to remove selected Russian banks from the Society for Worldwide Interbank Financial Telecommunications (“SWIFT”), the electronic banking network that connects banks globally;
•a ban on imports of Russian crude oil, certain refined petroleum products, and liquefied propane gas originating in or exported from Russia to the European Union, subject to limited exceptions;
•a ban on imports of Russian crude oil, liquefied natural gas and coal to the United States;
•a ban on new investment in the Russian energy sector;
•a prohibition by the U.S. on exporting, selling, or supplying certain categories of services, including engineering services and petroleum services, to persons located in Russia; and
•enhanced export controls and trade sanctions targeting Russia’s importation of certain goods and technology, including restrictive measures on the export and re-export of dual-use goods, stricter licensing policy with respect to issuing export licenses, and increased use of “end-use” controls to block or impose licensing requirements on exports.
Due to the international scope of our operations, the Company is subject to various laws and regulations, including regulations issued by the U.S. Department of Treasury, the U.S. Department of State, the Bureau of Industry and Security and Office of Foreign Asset Control, as well as the counterparts of these agencies in foreign countries. The Company actively monitors changes in these regulations as they pertain to the goods and services we provide and their impact on our business, including our business partners and customers.
As the conflict in Ukraine continues, these sanctions may change and be expanded, which could further hinder the Company’s ability to do business in Russia or with certain Russian entities, which could have an adverse impact on the Company’s financial condition and results of operations. Furthermore, in retaliation against new international sanctions and as part of measures to stabilize and support the volatile Russian financial and currency markets, Russian authorities imposed
significant currency control measures aimed at restricting the outflow of foreign currency and capital from Russia, imposed various restrictions on transacting with non-Russian parties, banned exports of various products and other economic and financial restrictions.
The Company routinely screens existing business partners globally against Specially Designated National / Restricted Persons lists. All new engagements with business partners are screened prior to the beginning of any business relationship. Individuals or entities that become subject to applicable sanctions are immediately blocked from further commercial activity with the Company until confirmed by the Company’s legal counsel whether permissible to proceed pursuant to a general or special license or other exemption, or a change in facts.
Furthermore, while we have policies, procedures and internal controls in place designed to ensure compliance with applicable sanctions and trade restrictions, and though the current effects from the Russia-Ukraine conflict have, thus far, not resulted in a material adverse impact to the Company’s financial condition or results of operations, our employees, contractors, and agents may take actions in violation of such policies and applicable law and we could be held ultimately responsible. We rely on our employees to adhere to the policies, procedures and internal controls we have established to maintain compliance with evolving sanctions and export controls. To that end, we have implemented training programs, both in person and online, to educate our employees on applicable sanctions and export controls laws. If we are held responsible for a violation of U.S. or other countries’ sanctions laws, we may be subject to various penalties, any of which could have a material adverse effect on our business, financial condition or results of operations.
Should future sanctions require us to cease or wind down our Russian operations, our assets located there may be impacted and could become subject to impairment. As of December 31, 2024, the Company’s fixed assets and total assets in Russia were $4.5 million and $11.7 million, respectively. Total assets located in Russia represent approximately 2% of the Company’s total assets. Additionally, the Company leases its operating facilities in Russia, and as of December 31, 2024, the contractual obligation to exit these leased facilities is approximately $0.4 million. For the year ended December 31, 2024, revenue attributable to our operations in Russia was $23.0 million, representing approximately 4% of the Company’s total revenue. If we discontinue our operations in Russia as a result of expanded sanctions, we could incur employee severance and other associated exit costs of approximately $2.5 million, as required under local laws.
During the year ended December 31, 2024, revenue attributable to the Company’s Ukraine operations and assets located in Ukraine, were immaterial to the Company’s total revenue and total assets.
We are actively monitoring the situation in Ukraine and assessing its impact on our operations in the region, including our business partners and customers. We have not experienced any material interruptions in our infrastructure, supplies or networks needed to support our operations. However, the situation is continuously evolving and the United States, the European Union, the United Kingdom and other countries may implement additional sanctions, export controls or other measures against Russia, Belarus and other countries, regions, officials, individuals or industries in the respective territories. We have no way to predict the progress or outcome of the conflict in Ukraine or its impacts in Ukraine, Russia or Belarus as the conflict, and any resulting government responses, are fluid and beyond our control. Our operations, financial results and cash flows, including our ability to repatriate cash, may be adversely affected due to the conflict and will depend on various factors, including the extent and duration of the conflict, its effects on regional and global economic and geopolitical conditions, and the effect of more expansive or stringent laws, sanctions or trade control restrictions, whether adopted by Western nations or the Russian Federation, on our business, the global economy and global supply chains.
The Russia-Ukraine conflict may also heighten many other risks, any of which could materially and adversely affect our business and results of operations. Such risks include, but are not limited to, adverse effects on global macroeconomic conditions, including increased inflation; increased volatility in the price and demand of oil and natural gas; increased exposure to cyber-attacks; limitations in our ability to implement and execute our business strategy; risks to employees and contractors that we have in the region; disruptions in global supply chains; exposure to foreign currency fluctuations; potential nationalizations and assets seizures in Russia; constraints or disruption in the capital markets and our sources of liquidity; our potential inability to service our remaining performance obligations; and potential contractual breaches and litigation.
Our results of operations may be significantly affected by foreign currency exchange rate risk.
We are exposed to risks due to fluctuations in currency exchange rates. By the nature of our business, we derive a substantial amount of our revenue from our international operations, where certain of our customer contracts are in foreign currencies that subject us to risks relating to fluctuations in currency exchange rates.
Our results of operations may be adversely affected because our efforts to comply with applicable anti-corruption laws such as the United States’ Foreign Corrupt Practices Act (the “FCPA”) and the United Kingdom’s Anti-Bribery Act (the
“ABA”) could restrict our ability to do business in foreign markets relative to our competitors who are not subject to these laws.
We operate in many parts of the world that have experienced governmental corruption to some degree and, in certain circumstances, strict compliance with anti-bribery laws may conflict with local customs and practices. We may be subject to competitive disadvantages to the extent that our competitors are able to secure business, licenses or other preferential treatment by making payments to government officials and others in positions of influence or through other methods that we are prohibited from using.
We are subject to the regulations imposed by the FCPA and the ABA, which generally prohibits us and our intermediaries from making improper payments to foreign officials for the purpose of obtaining or keeping business. In particular, we may be held liable for actions taken by our strategic or local partners even though our partners are not subject to these laws. Any such violations could result in substantial civil and/or criminal penalties and might adversely affect our business, results of operations or financial condition. In addition, our ability to continue to work in these parts of the world discussed above could be adversely affected if we were found to have violated certain laws, including the FCPA and the ABA.
Risk factors associated with technology advancement
If we are not able to develop or acquire new services or products or our services and products become technologically obsolete, our results of operations may be adversely affected.
The market for our services and products is characterized by changing technology and product introduction. As a result, our success is dependent upon our ability to develop or acquire new services and products on a cost-effective basis and to introduce them into the marketplace in a timely manner. While we intend to continue committing substantial financial resources and effort to the development or acquisition of new services and products, we may not be able to successfully differentiate our services and products from those of our competitors. Our clients may not consider our proposed services and products to be of value to them; or if the proposed services and products are of a competitive nature, our clients may not view them as superior to our competitors’ services and products. In addition, we may not be able to adapt to evolving markets and technologies, develop or acquire new services or products, or achieve and maintain technological advantages.
If we are unable to continue developing or acquiring competitive services and products in a timely manner in response to changes in technology, our business and operating results may be materially and adversely affected. In addition, continuing development or acquisition of new products inherently carries the risk of inventory obsolescence with respect to our older products.
If we are unable to obtain patents, licenses and other intellectual property rights covering our services and products, our operating results may be adversely affected.
Our success depends, in part, on our ability to obtain patents, licenses and other intellectual property rights covering our services and products. To that end, we have obtained certain patents and intend to continue to seek patents on some of our inventions, services and products. While we have patented some of our key technologies, we do not patent all of our proprietary technology, even when regarded as patentable. The process of seeking patent protection can be long and expensive. There can be no assurance that patents will be issued from currently pending or future applications or that, if patents are issued, they will be of sufficient scope or strength to provide meaningful protection or any commercial advantage to us. In addition, effective copyright and trade secret protection may be unavailable or limited in certain countries. Litigation, which could demand significant financial and management resources, may be necessary to enforce our patents or other intellectual property rights. Also, there can be no assurance that we can obtain licenses or other rights to necessary intellectual property on acceptable terms.
We are subject to cyber security risks. A cyber incident could occur and result in information theft, data corruption, operational disruption and/or financial loss.
The frequency and magnitude of cybersecurity attacks is increasing and threat actors have become more sophisticated. Cybersecurity attacks are similarly evolving and include without limitation use of malicious software, surveillance, credential stuffing, spear phishing, social engineering, use of deepfakes (i.e., highly realistic synthetic media generated by artificial intelligence), attempts to gain unauthorized access to data, and other electronic security breaches that could lead to disruptions in critical systems, unauthorized release of confidential or otherwise protected information and corruption of data. We may be unable to anticipate, detect or prevent future attacks, particularly as the vectors used by threat actors change frequently or are not readily identifiable until deployed. We may also be unable to investigate or remediate cybersecurity incidents as threat
actors are increasingly using techniques designed to circumvent controls, avoid detection, and delete or obfuscate forensic evidence.
Our technologies, systems and networks, and those of our vendors, suppliers and other business partners, may become the target of cyberattacks or information security breaches that could result in the unauthorized release, gathering, monitoring, misuse, loss or destruction of proprietary information, personal information and other data, or other disruption of our business operations. In addition, certain cyber incidents, such as unauthorized surveillance, may remain undetected for an extended period. Our systems and insurance coverage (if any) for protecting against cyber security risks, including cyberattacks, may not be sufficient and may not protect against or cover all of the losses (including potential reputational loss) we may experience. As cyber incidents continue to evolve, particularly with the advent of artificial intelligence, we may be required to expend additional resources to modify or enhance our cybersecurity measures or to investigate and remediate the effects of cyber incidents.
We utilize technologies, controls and procedures, as well as internal staff and external service providers to protect our systems and data, to identify and remediate vulnerabilities and to monitor and respond to threats. However, there can be no assurance that such measures will be sufficient to prevent security breaches from occurring. No security measure is infallible. If we or the third parties with whom we interact were to experience a successful attack, the potential consequences to our business, workforce and the communities in which we operate could be significant, including financial losses, regulatory fines, loss of business, an inability to settle transactions or maintain operations, litigation costs, remediation costs, disruptions related to investigation, and significant damage to our reputation. If our systems for protecting against cyber-attacks prove not to be sufficient, we could be adversely affected by loss or damage of intellectual property, proprietary information, client data, employee data, financial data, our reputation, interruption of business operations, or additional costs to prevent, respond to, or mitigate cyber-attacks. These risks could have a material adverse effect on our business, reputation, results of operations, and financial condition.
Risk factors associated with our supply chain, resources, liquidity and capital management
We are subject to the risk of supplier concentration.
Certain of our product lines depend on a limited number of third party suppliers and vendors available in the marketplace. As a result of this concentration in some of our supply chains, our business and operations could be negatively affected if our key suppliers were to experience significant disruptions affecting the price, quality, availability or timely delivery of their products. For example, we have a limited number of vendors for our manufactured product lines. The partial or complete loss of any one of our key suppliers, or a significant adverse change in the relationship with any of these suppliers, through consolidation or otherwise, would limit our ability to manufacture and sell certain of our products.
There are risks relating to our acquisition strategy. If we are unable to successfully integrate and manage businesses that we have acquired and any businesses acquired in the future, our results of operations and financial condition could be adversely affected.
One of our key business strategies is to acquire technologies, operations and assets that are complementary to our existing business. There are financial, operational and legal risks inherent in any acquisition strategy, including:
▪increased financial leverage;
▪ability to obtain additional financing;
▪increased interest expense; and
▪difficulties involved in combining disparate company cultures and facilities.
The success of any completed acquisition will depend on our ability to effectively integrate the acquired business into our existing operations. The process of integrating acquired businesses may involve unforeseen difficulties and may require a disproportionate amount of our managerial and financial resources. In addition, possible future acquisitions may be larger and for purchase prices significantly higher than those paid for earlier acquisitions. No assurance can be given that we will be able to continue to identify additional suitable acquisition opportunities, negotiate acceptable terms, obtain financing for acquisitions on acceptable terms or successfully acquire identified targets. Our failure to achieve consolidation savings, to incorporate the acquired businesses and assets into our existing operations successfully or to minimize any unforeseen operational difficulties could have a material adverse effect on our financial condition and results of operation.
We may be unable to attract and retain skilled and technically knowledgeable employees, which could adversely affect our business.
Our success depends upon attracting and retaining highly skilled professionals and other technical personnel. A number of our employees are highly skilled engineers, geologists and highly trained technicians, and our failure to continue to attract and retain such individuals could adversely affect our ability to compete in the oilfield services industry. In periods of high utilization, there may be a shortage of skilled and technical personnel available in the market, potentially compounding the difficulty of attracting and retaining these employees. As a result, our business, results of operations and financial condition may be materially adversely affected.
We require a significant amount of cash to service our indebtedness, make capital expenditures, fund our working capital requirements and pay our dividend, and our ability to generate cash may depend on factors beyond our control.
Our ability to make payments on and to refinance our indebtedness, to fund planned capital expenditures, and pay our dividend depends, in part, on our ability to generate cash in the future. This ability is, to a certain extent, subject to general economic, financial, competitive, legislative, regulatory and other factors that are beyond our control.
No assurance can be given that we will generate sufficient cash flows from operations or that future borrowings will be available to us in an amount sufficient to enable us to service and repay our indebtedness or to fund our other liquidity needs. If we are unable to satisfy our debt obligations, we may have to undertake alternative financing plans, such as refinancing or restructuring our indebtedness, selling assets, reducing or delaying capital investments or seeking to raise additional capital. We cannot assure that any refinancing or debt restructuring would be possible or, if possible, would be completed on favorable or acceptable terms, that any assets could be sold or that, if sold, the timing of the sales and the amount of proceeds realized from those sales would be favorable to us or that additional financing could be obtained on acceptable terms.
Disruptions in the capital and credit markets could adversely affect our ability to refinance our indebtedness, including our ability to borrow under our existing revolving credit facility. Banks that are party to our existing revolving credit facility may not be able to meet their funding commitments to us if they experience shortages of capital and liquidity or if they experience excessive volumes of borrowing requests from us and other borrowers within a short period of time.
We may have greater difficulty accessing capital in the future due to the adoption of more stringent climate change policies as shareholders, bondholders and institutional lenders who currently invest in fossil-fuel energy companies or service companies such as ours express increased concern about the potential adverse effects of climate change and therefore elect to shift some or all of their investable or loanable funds into alternative energy investments.
Risk factors associated with health, safety and the environment
We are subject to a variety of environmental and occupational safety and health laws and regulations, which may result in increased costs and significant liability to our business.
We are subject to a variety of stringent governmental laws and regulations, both in the United States and foreign countries, pertaining to protection of the environment, and occupational health and safety.
Compliance with environmental legal requirements in the United States at the federal, state or local levels may require acquiring permits to conduct regulated activities, incurring capital expenditures to limit or prevent emissions, discharges and any unauthorized releases, and complying with stringent practices to handle, recycle and dispose of certain wastes. Failure to comply with these laws and regulations may result in the assessment of administrative, civil and criminal penalties, the imposition of remedial or corrective obligations, the occurrence of delays or cancellations in the permitting, performance or expansion of projects and the issuance of injunctive relief in affected areas. Certain of these laws and regulations may impose joint and several, strict liability for environmental liabilities, such as the remediation of historical contamination or recent spills, and failure to comply with such laws and regulations could result in the assessment of damages, fines and penalties, the imposition of remedial or corrective action obligations, the occurrence of delays or cancellations in permitting or development of projects, or the suspension or cessation of some or all of our operations. These stringent laws and regulations could require us to acquire permits or other authorizations to conduct regulated activities, install and maintain costly equipment and pollution control technologies, impose specific safety and health standards addressing work protection, or to incur costs or liabilities to mitigate or remediate pollution conditions caused by our operations or attributable to former owners or operators.
Environmental laws and regulations, and their interpretation, frequently change, and have tended to become more stringent over time. Our costs for compliance may not be fully recoverable from our clients and, thus, could reduce net income. New, modified or stricter enforcement of environmental laws and regulations could be adopted or implemented that significantly
increase our compliance costs, pollution mitigation costs, or the cost of any remediation of environmental contamination that may become necessary, and these costs could have a material adverse effect on our business, financial condition, results of operation, or cash flows. Additionally, our clients are also subject to many of the same laws and regulations relating to environmental protection and occupational safety and health in the United States and in foreign countries where we operate. To the extent existing environmental laws and regulations or any new or more stringently enforced environmental legal requirements significantly increase our clients’ compliance costs, pollution mitigation costs or remedial costs, our clients could elect to delay, restrict or cancel drilling, exploration or production programs, which could reduce demand for our products and services and have a material adverse effect on our business, financial condition, results of operations, or cash flows.
Historically, our worker safety compliance costs have not had a material adverse effect on our results of operations; however, there can be no assurance that such costs will not be material in the future or that such future compliance will not have a material adverse effect on our business or results of operations.
Legislative and regulatory initiatives relating to oil and gas development and the potential for related litigation could result in increased costs and additional operating restrictions or delays for our clients, which could reduce demand for our products or services.
Environmental laws and regulations could limit our clients’ exploration and production activities. For example, hydraulic fracturing continues to attract considerable public and governmental attention, both in the United States and in foreign countries, resulting in various controls applied to fracturing activities or locations where such activities may be performed. Although we do not directly engage in drilling or hydraulic fracturing activities, we provide products and services to operators in the oil and gas industry.
Hydraulic fracturing is a process used by oil and gas exploration and production operators in the completion of certain oil and gas wells whereby water, sand or other proppants and chemical additives are injected under pressure into subsurface formations to stimulate gas and, to a lesser extent, oil production. Some countries outside the United States, such as Bulgaria, the Czech Republic and France, currently have imposed moratoria on hydraulic fracturing while other countries, such as Canada, allow fracturing activities but those activities are not as widely pursued as they are in the United States. In the United States, the fracturing process is typically regulated by state oil and gas commissions, but several federal agencies have asserted regulatory authority over certain aspects of the process.
Certain states have adopted or are considering adopting, legal requirements that could impose more stringent disclosure, permitting and/or well construction requirements on hydraulic fracturing operations, and local governments may also seek to adopt ordinances within their jurisdictions regulating the time, place and manner of hydraulic fracturing activities.
U.S., foreign federal, regional, state or local governmental actions aimed at species conservation, preventing hydraulic fracturing activities, or otherwise limiting oil and gas production in certain locations, could indirectly cause us to incur additional costs, cause our or our oil and natural gas exploration and production customers’ operations to become subject to operating restrictions or bans, result in new difficulties obtaining permits or other authorizations, and limit future development activity in affected areas. To the extent any such existing or future legal requirements result in increased costs or restrictions or cancellation in the operation of our clients, such developments could reduce demand for our products and services and have an indirect material adverse effect on our business.
See Part I, Item 1. Business, “Environment and Climate” and “Occupational Safety and Health Regulations” for further discussion on environmental and worker safety and health matters.
We are subject to compliance with governmental regulations associated with climate change, energy conservation measures, or initiatives that stimulate demand for alternative forms of energy that could result in increased costs, limit the areas in which our clients’ oil and natural gas production may occur and reduce demand for our services, which may adversely affect our business and results of operations.
Our clients in the oil and gas industry are also subject to many laws and regulations relating to environmental and natural resource protection in the United States and in foreign countries where we operate, and many are required to obtain permits and other authorizations for their operations. In particular, we, our third-party vendors that supply us with goods and services in support of our business, and our clients are subject to an increased governmental, and public, political and scientific attention focus on risks associated with the threat of climate change arising from the emission of greenhouse gases (“GHG”). Various governments have adopted or are considering adopting legislation, regulations or other regulatory initiatives, including the Paris Agreement, the Europe Climate Law, that are focused on such areas as GHG cap and trade programs, carbon taxes, reporting and tracking programs, and restriction of emissions at national or local levels in jurisdictions where we operate. Our and our clients’ compliance with such existing, or any new or amended legal requirements that are placed into effect and applicable in
areas where we or our clients conduct operations, could result in our or our clients’ incurring significant additional expense and operating restrictions.
New or amended legislation, executive actions, regulations or other regulatory initiatives that impose more stringent oil and gas sector requirements or fees on GHG emissions or restrict the areas in which this sector may produce oil and natural gas or generate GHG emissions could result in increased compliance costs or costs of producing fossil fuels. For example, in November 2024, the EPA finalized the methane emissions charge rule, implementing the Inflation Reduction Act of 2022 “IRA 2022,” which applies to oil and gas facilities emitting more than 25,000 metric tons of CO2 equivalent per year. If the methane emissions charge rule is implemented, it could increase our U.S. customers’ operating costs, and the fees and other requirements of the regulation could accelerate the transition away from fossil fuels, which may in turn reduce demand for our products and services and adversely affect our business and results of operations.
As another example, in December 2023, the U.S. Environmental Protection Agency (“EPA”) finalized more stringent methane emissions rules for new, modified, and reconstructed facilities in the oil and gas sector, known as OOOOb, as well as standards for existing sources for the first time ever, known as OOOOc which may increase operating costs for some of our clients. Similarly, governments have and may continue to take actions to restrict where or how our clients are permitted to operate. The requirements of the EPA’s final methane rules and similar regulations for the oil and gas industry have the potential to increase our clients’ operating costs and thus may adversely affect our financial results and cash flows.
To the extent that climate change alters weather patterns, it can impact the demand for our customers’ products. Our operations and the operations of our customers are also susceptible to the physical effects of climate change, such as increased frequency or severity of storm systems, hurricanes, droughts, floods, extreme winter weather, or geologic/geophysical conditions. Such events can impact our operations directly and indirectly, and could also result in increased insurance costs.
Additionally, political, financial and litigation risks, as well as stakeholder pressures may result in our clients restricting, delaying or canceling operational or production activities, incurring liability for infrastructure damages as a result of climatic changes, restricting access to capital, or impairing the ability to continue to operate in an economic manner, which could reduce demand for our products and services. Fuel conservation measures, alternative fuel requirements and increasing consumer demand for, or legislative incentives supporting, alternative energy sources (such as wind, solar, geothermal and tidal) could also reduce demand for oil and natural gas. The occurrence of one or more of these developments could have a material adverse effect on our business, financial condition and results of operation.
Our customers may also face litigation risks based on allocations of their contribution to climate change. Consequently, to the extent one or more of these climate-related events are incurred by us, our third party vendors, or our clients, any of us could incur increased costs, we could incur disruptions to our operations as a result of our vendor’s inability to supply us with goods and services, and our clients in particular could elect to delay, restrict or cancel drilling, exploration or production programs, which could reduce demand for our products and services, any of which developments could have a material adverse effect on our business, financial condition, results of operations, or cash flows.
Increasing attention to environmental, social and governance (“ESG”) matters may impact our business.
Regulations associated with ESG and sustainability have been, and are, being implemented and we anticipate that these regulatory requirements will continue to expand in the European Union (“EU”), the United States and globally, at all levels of government and from private institutions and stakeholders. As a result, numerous regulatory initiatives have been made, and are likely to continue to be made, to monitor and limit existing emissions of GHGs or implement laws, policies or regulatory initiatives that may contribute to energy conservation measures, stimulate demand for alternative forms of energy or limit areas where fossil fuel production may occur, which may translate into reduced demand for our services.
The United States Securities and Exchange Commission released its final rule on climate-related disclosures on March 6, 2024, requiring the disclosure of certain climate-related risks and financial impacts, as well as GHG emissions. Under the rule, large accelerated filers would be required to incorporate the applicable climate-related disclosures into their filings beginning in fiscal year 2025, with additional requirements relating to the disclosure of Scope 1 and 2 greenhouse gas emissions, if material, and attestation reports for certain large accelerated filers subsequently phasing in. However, the future of the SEC climate rule is uncertain at this time given that its implementation has been stayed pending the outcome of legal challenges; moreover, the Commission may seek to repeal the rule though we cannot predict whether such action will occur or its timing.
Business operations may also subject us or our customers to state-mandated climate disclosures. For instance, the Climate-Related Financial Risk Act (“CRFRA”) in California requires the disclosure of a climate-related financial risk report (in line with the Task Force on the Climate-related Financial Disclosures (“TCFD”) recommendations or equivalent disclosure requirements under the International Sustainability Standards Board’s (“ISSB”) climate-relate disclosure standards) every other
year for public and private companies that are “doing business in California” and have total annual revenue of $500 million. Reporting under this law would begin in 2026 and the ultimate impact of the law on our business is uncertain—the Governor of California has directed further consideration of the implementation deadlines for each of the laws, and there is potential for legal challenges to be filed with respect to the scope of the law—but, absent clarification or revisions to the law, alongside the SEC disclosure rule, finalization and implementation may result in increased compliance costs and increased costs of and restrictions on access to capital.
Investor and societal expectations regarding voluntary ESG disclosures, and consumer demand for alternative forms of energy may result in increased costs, reduced demand for our services, reduced profits, increased risks of governmental investigations and private party litigation, and negative impacts on our stock price and access to capital markets. These pressures could have similar impacts on our customers, and therefore, indirectly impact our operations by decreasing demand for our services. Our managerial ESG Steering Team is the primary group for overseeing and managing our ESG initiatives. Team members review the implementation and effectiveness of our ESG programs and policies and report on these matters to the Board of Directors. While we have sought voluntary aspirational goals for GHG emission reductions from base year 2018, we note that even with our governance oversight in place, we may not be able to adequately identify or manage ESG-related risks and opportunities, which may include failing to achieve ESG-related aspirational goals. We have published voluntary disclosures regarding ESG matters under an annual Sustainability Report and the Global Reporting Initiative, an international independent standards organization. From time to time, statements in those voluntary disclosures may be based on aspirational expectations and assumptions that may or may not be representative of current or actual risks or events or forecasts of expected risks or events, including the costs associated therewith. Such expectations and assumptions may be prone to error or subject to misinterpretation given the lack of an established single approach to identifying, measuring and reporting on many ESG matters.
We are subject to the physical effects of climate change, which may adversely affect our business and results of operations.
We operate from locations around the globe and provide services in coastal regions and coastal cities and services related to marine shipping activities of our clients. These locations and activities are susceptible to the physical effects of climate change, such as increased frequency or severity of tropical storm systems, hurricanes, droughts, floods, extreme winter weather, or geologic/geophysical conditions that may result in:
▪decreased or lost production capacity;
▪loss of or reduced supply chain availability;
▪temporary closure of locations due to electricity outages, damages or disruptions caused by extreme weather events;
▪displacement of employees; and
▪increase in premium for or reduced ability to obtain insurance for property, business interruption and liability.
See Item 1A. Risk Factors, “Risk factors associated with health, safety and the environment” for further discussion on environmental matters.
Risk factors associated with our common stock
Provisions in our certificate of incorporation, bylaws and Delaware law may discourage a takeover attempt even if a takeover might be beneficial to our stockholders.
Provisions contained in our Certificate of Incorporation and our Bylaws, which we refer to herein as our “certificate of incorporation” and “bylaws,” respectively, could make it more difficult for a third party to acquire us. Provisions of our certificate of incorporation and bylaws impose various procedural and other requirements, which could make it more difficult for stockholders to effect certain corporate actions. For example, our certificate of incorporation authorizes our board of directors to determine the rights, preferences, privileges and restrictions of unissued series of preferred stock without any vote or action by our stockholders. Thus, our board of directors can authorize and issue shares of preferred stock with voting or conversion rights that could adversely affect the voting or other rights of holders of our capital stock. These rights may have the effect of delaying or deterring a change of control of our company. Additionally, our bylaws establish limitations on the removal of directors and on the ability of our stockholders to call special meetings and include advance notice requirements for nominations for election to our board of directors and for proposing matters that can be acted upon at stockholder meetings. These provisions could limit the price that certain investors might be willing to pay in the future for shares of our common stock.
Our certificate of incorporation designates the Court of Chancery of the State of Delaware as the sole and exclusive forum for certain types of actions and proceedings that may be initiated by our stockholders, which could limit our stockholders’ ability to obtain a favorable judicial forum for disputes with us or our directors, officers, employees or agents.
Our certificate of incorporation provides that, unless we consent in writing to the selection of an alternative forum, the Court of Chancery of the State of Delaware will, to the fullest extent permitted by applicable law, be the sole and exclusive forum for (i) any derivative action or proceeding brought on our behalf, (ii) any action asserting a claim of breach of a fiduciary duty owed by any of our directors, officers, employees or agents to us or our stockholders, (iii) any action asserting a claim against us or any director or officer or other employee or agent of ours arising pursuant to any provision of the Delaware General Corporation Law, our certificate of incorporation or our bylaws, or (iv) any action asserting a claim against us or any director or officer or other employee or agent of ours that is governed by the internal affairs doctrine, in each such case subject to such Court of Chancery having personal jurisdiction over the indispensable parties named as defendants therein.
The exclusive forum provision would not apply to suits brought to enforce any liability or duty created by the Securities Act or the Exchange Act or any other claim for which the federal courts have exclusive jurisdiction. To the extent that any such claims may be based upon federal law claims, Section 27 of the Exchange Act creates exclusive federal jurisdiction over all suits brought to enforce any duty or liability created by the Exchange Act or the rules and regulations thereunder. Furthermore, Section 22 of the Securities Act creates concurrent jurisdiction for federal and state courts over all suits brought to enforce any duty or liability created by the Securities Act or the rules and regulations thereunder.
The enforceability of similar choice of forum provisions in other companies’ certificates of incorporation or similar governing documents has been challenged in legal proceedings, and it is possible that a court could find the choice of forum provisions contained in our certificate of incorporation to be inapplicable or unenforceable, including with respect to claims arising under the U.S. federal securities laws.
Risk factors associated with the Redomestication Transaction
The expected benefits of the Redomestication Transaction may not be realized.
There can be no assurance that all of the anticipated benefits of the Redomestication Transaction will be achieved. Achieving the anticipated benefits of the Redomestication Transaction is subject to a number of risks and uncertainties, including factors that we do not and cannot control. In addition, if the expected benefits of the Redomestication Transaction do not meet expectations of investors or securities analysts, the price of our common stock may decline.
If the Redomestication Transaction does not qualify as a “reorganization” under Section 368(a) of the U.S. Internal Revenue Code of 1986, as amended, Core Lab Shareholders may be required to pay U.S. federal income taxes.
It is intended that the steps in the Redomestication Transaction qualify as a form of “reorganization” within the meaning of Section 368(a) of the U.S. Internal Revenue Code of 1986, as amended (the “Code”). Although Vinson & Elkins L.L.P., Core Lab’s U.S. tax counsel, provided an opinion that the Redomestication Transaction should qualify as a form of reorganization within the meaning of Section 368(a) of the Code, and Core Laboratories N.V., Core Laboratories Luxembourg S.A. and Core Laboratories Inc. may have or intend to file tax returns consistent with this intended tax treatment, this tax treatment is not free from doubt. Your tax advisor may not agree with our intended tax treatment and the IRS may assert, or a court may sustain, a contrary position.
If the Redomestication Transaction did not qualify as a form of reorganization within the meaning of Section 368(a) of the Code, Core Lab Shareholders would generally recognize taxable gain or loss upon their exchange of stock pursuant to the Redomestication Transaction, as applicable.
None.
ITEM 1C. CYBERSECURITY
The Company maintains information systems which contain personal data, financial reports and proprietary data. As a result, we are exposed to cybersecurity threats which could result in loss of or damage to our intellectual property, proprietary information, client data and reputation, or interruption of our business operations, or additional costs to prevent, respond to, or mitigate cyber-attacks.
Our Board of Directors is responsible for oversight of the risks that the Company faces, including cybersecurity threats. Our operating divisions and management teams help identify risks that are relevant to the Company during our periodic business planning and review cycle and rank these risks in relation to the achievement of business objectives. We understand cybersecurity threats to be dynamic and to intersect with various other enterprise risks within the organization. We have therefore integrated cybersecurity risk into our overall risk management program.
As a result, in addition to our information technology policies and procedures, we have implemented cybersecurity processes that aim to address, among other things, information security, password security, third party vetting, security incident response and vulnerability management. Our cybersecurity procedures include requiring multiple authentication factors prior to granting access to our assets, launching endpoint security software to guard against malware, viruses, and other cyber-attacks, use of third-party software to automate IT system monitoring for unusual or suspicious activity, conducting annual cybersecurity training for all employees, and providing cybersecurity information to employees through newsletters and fliers. We utilize third-party consultants to assist us with endpoint detection and response and routinely conduct penetration testing of our network infrastructure. Our consultants also provide digital forensics analysis of our systems, as needed. Additionally, we have sought to align our cybersecurity risk management in accordance with the National Institute of Standards and Technology Cybersecurity Framework.
We recognize that third-party service providers may introduce cybersecurity risks. In an effort to mitigate these risks, we assess third party cybersecurity controls through a cybersecurity questionnaire and include security and privacy addendums to our contracts where applicable.
We have established a permanent management position of Director of Cybersecurity and IT Governance that reports directly to the Chief Financial Officer. Our current Director of Cybersecurity and IT Governance, has an undergraduate degree in computer science and is a Certified Information Systems Security Professional. He possesses over 20 years of IT experience with more than 10 years in managerial positions and has been actively involved in IT security related projects, initiatives, audits and associated program management in the last seven years. As part of our cybersecurity incident response plan, we have established a dedicated incident response team to assess and manage risks arising from cybersecurity threats, consisting of our Director of Cybersecurity and IT Governance and various members of senior management, including our Chief Financial Officer and General Counsel.
The Company also maintains an IT Steering Committee as part of its control environment, which meets regularly to address matters pertaining to the Company’s information technology systems. The IT Steering Committee is led by the Company’s three IT directors, one of which is the Director of Cybersecurity and IT Governance, and is represented by leaders from corporate departments and operations. In each meeting, the Director of Cybersecurity and IT Governance provides an overview of cybersecurity matters, including status update on threat reduction initiatives undertaken by the Company and future initiatives under consideration.
The Audit Committee is responsible for overseeing our cybersecurity threat risks and receives updates during its quarterly meetings from our Director of Cybersecurity and IT Governance. At each meeting, the Audit Committee is briefed on matters pertaining to our exposure to material privacy and cybersecurity risks, as well as risks that are deemed to have a moderate or higher business impact, even if immaterial. The Director of Cybersecurity and IT Governance also routinely briefs senior management on such matters as they arise.
In addition, we have established a Data Privacy Committee coordinated by our Data Privacy Officer and represented by seven other committee members from various corporate functional departments. The objective of the Committee is to ensure that personal data is protected and handled in accordance with applicable law and Core Lab policies.
As of the date of this Annual Report on Form 10-K, we are not aware of any cybersecurity incident or cybersecurity threat that has materially affected, or is reasonably likely to materially affect, our business strategy, results of operations or financial condition. However, we understand that cybersecurity threats are continually evolving, and the possibility of future discovery of cybersecurity incidents remains. Please see “Item 1A. Risk Factors” for additional information about cybersecurity risks.
ITEM 2. PROPERTIES
Currently, we have over 70 offices (totaling approximately 3.1 million square feet of space) in more than 50 countries. In these locations, we lease approximately 1.4 million square feet and own approximately 1.7 million square feet. We serve our worldwide clients through five Advanced Technology Centers (“ATCs”) that are located in Aberdeen, Scotland; Abu Dhabi, United Arab Emirates; Houston, Texas; Kuala Lumpur, Malaysia; and Rotterdam, The Netherlands. The ATCs provide support for our more than 50 regional specialty centers located throughout the global energy producing provinces. In addition, our more significant manufacturing facilities are located in Frépillon, France, Godley, Texas, Red Deer, Alberta, Canada, and Pyle,
Wales which are included in our Production Enhancement operating segment. Our facilities are adequate for our current operations; however, expansion into new facilities or the replacement or modification of existing facilities may be required to accommodate future growth.
ITEM 3. LEGAL PROCEEDINGS
See Note 13 - Commitments and Contingencies of the Notes to the Consolidated Financial Statements.
ITEM 4. MINE SAFETY DISCLOSURES
Not applicable.
PART II
ITEM 5. MARKET FOR REGISTRANT’S COMMON EQUITY, RELATED STOCKHOLDER MATTERS AND ISSUER PURCHASES OF EQUITY SECURITIES
Price Range of Common Stock
Our common stock trades on the New York Stock Exchange (“NYSE”) under the symbol “CLB”.
On January 31, 2025, the closing price, as quoted by the NYSE, was $16.97 per share and there were 46,826,820 shares of common stock issued and outstanding held by approximately 176 record holders. These amounts exclude shares held by us as treasury stock.
See Part III, “Item 12. Security Ownership of Certain Beneficial Owners and Management and Related Stockholder Matters” for discussion of equity compensation plans.
Performance Graph
The following performance graph compares the performance of our common stock to the Standard & Poor’s 500 Index and the Philadelphia Oil Service Index (“OSX”) for the period beginning December 31, 2019 and ending December 31, 2024. Core Lab is now an established member of the OSX which includes a greater concentration of our most direct peers.
The graph assumes that the value of the investment in our common shares and each index was $100 at December 31, 2019 and that all dividends were reinvested. The stockholder return set forth below is not necessarily indicative of future performance. The following graph and related information is “furnished” and shall not be deemed “soliciting material” or to be “filed” with the SEC, nor shall such information be incorporated by reference into any future filing under the Securities Act of 1933 or the Securities Exchange Act of 1934, as amended (the “Exchange Act”) except to the extent that Core Laboratories specifically incorporates it by reference into such filing.
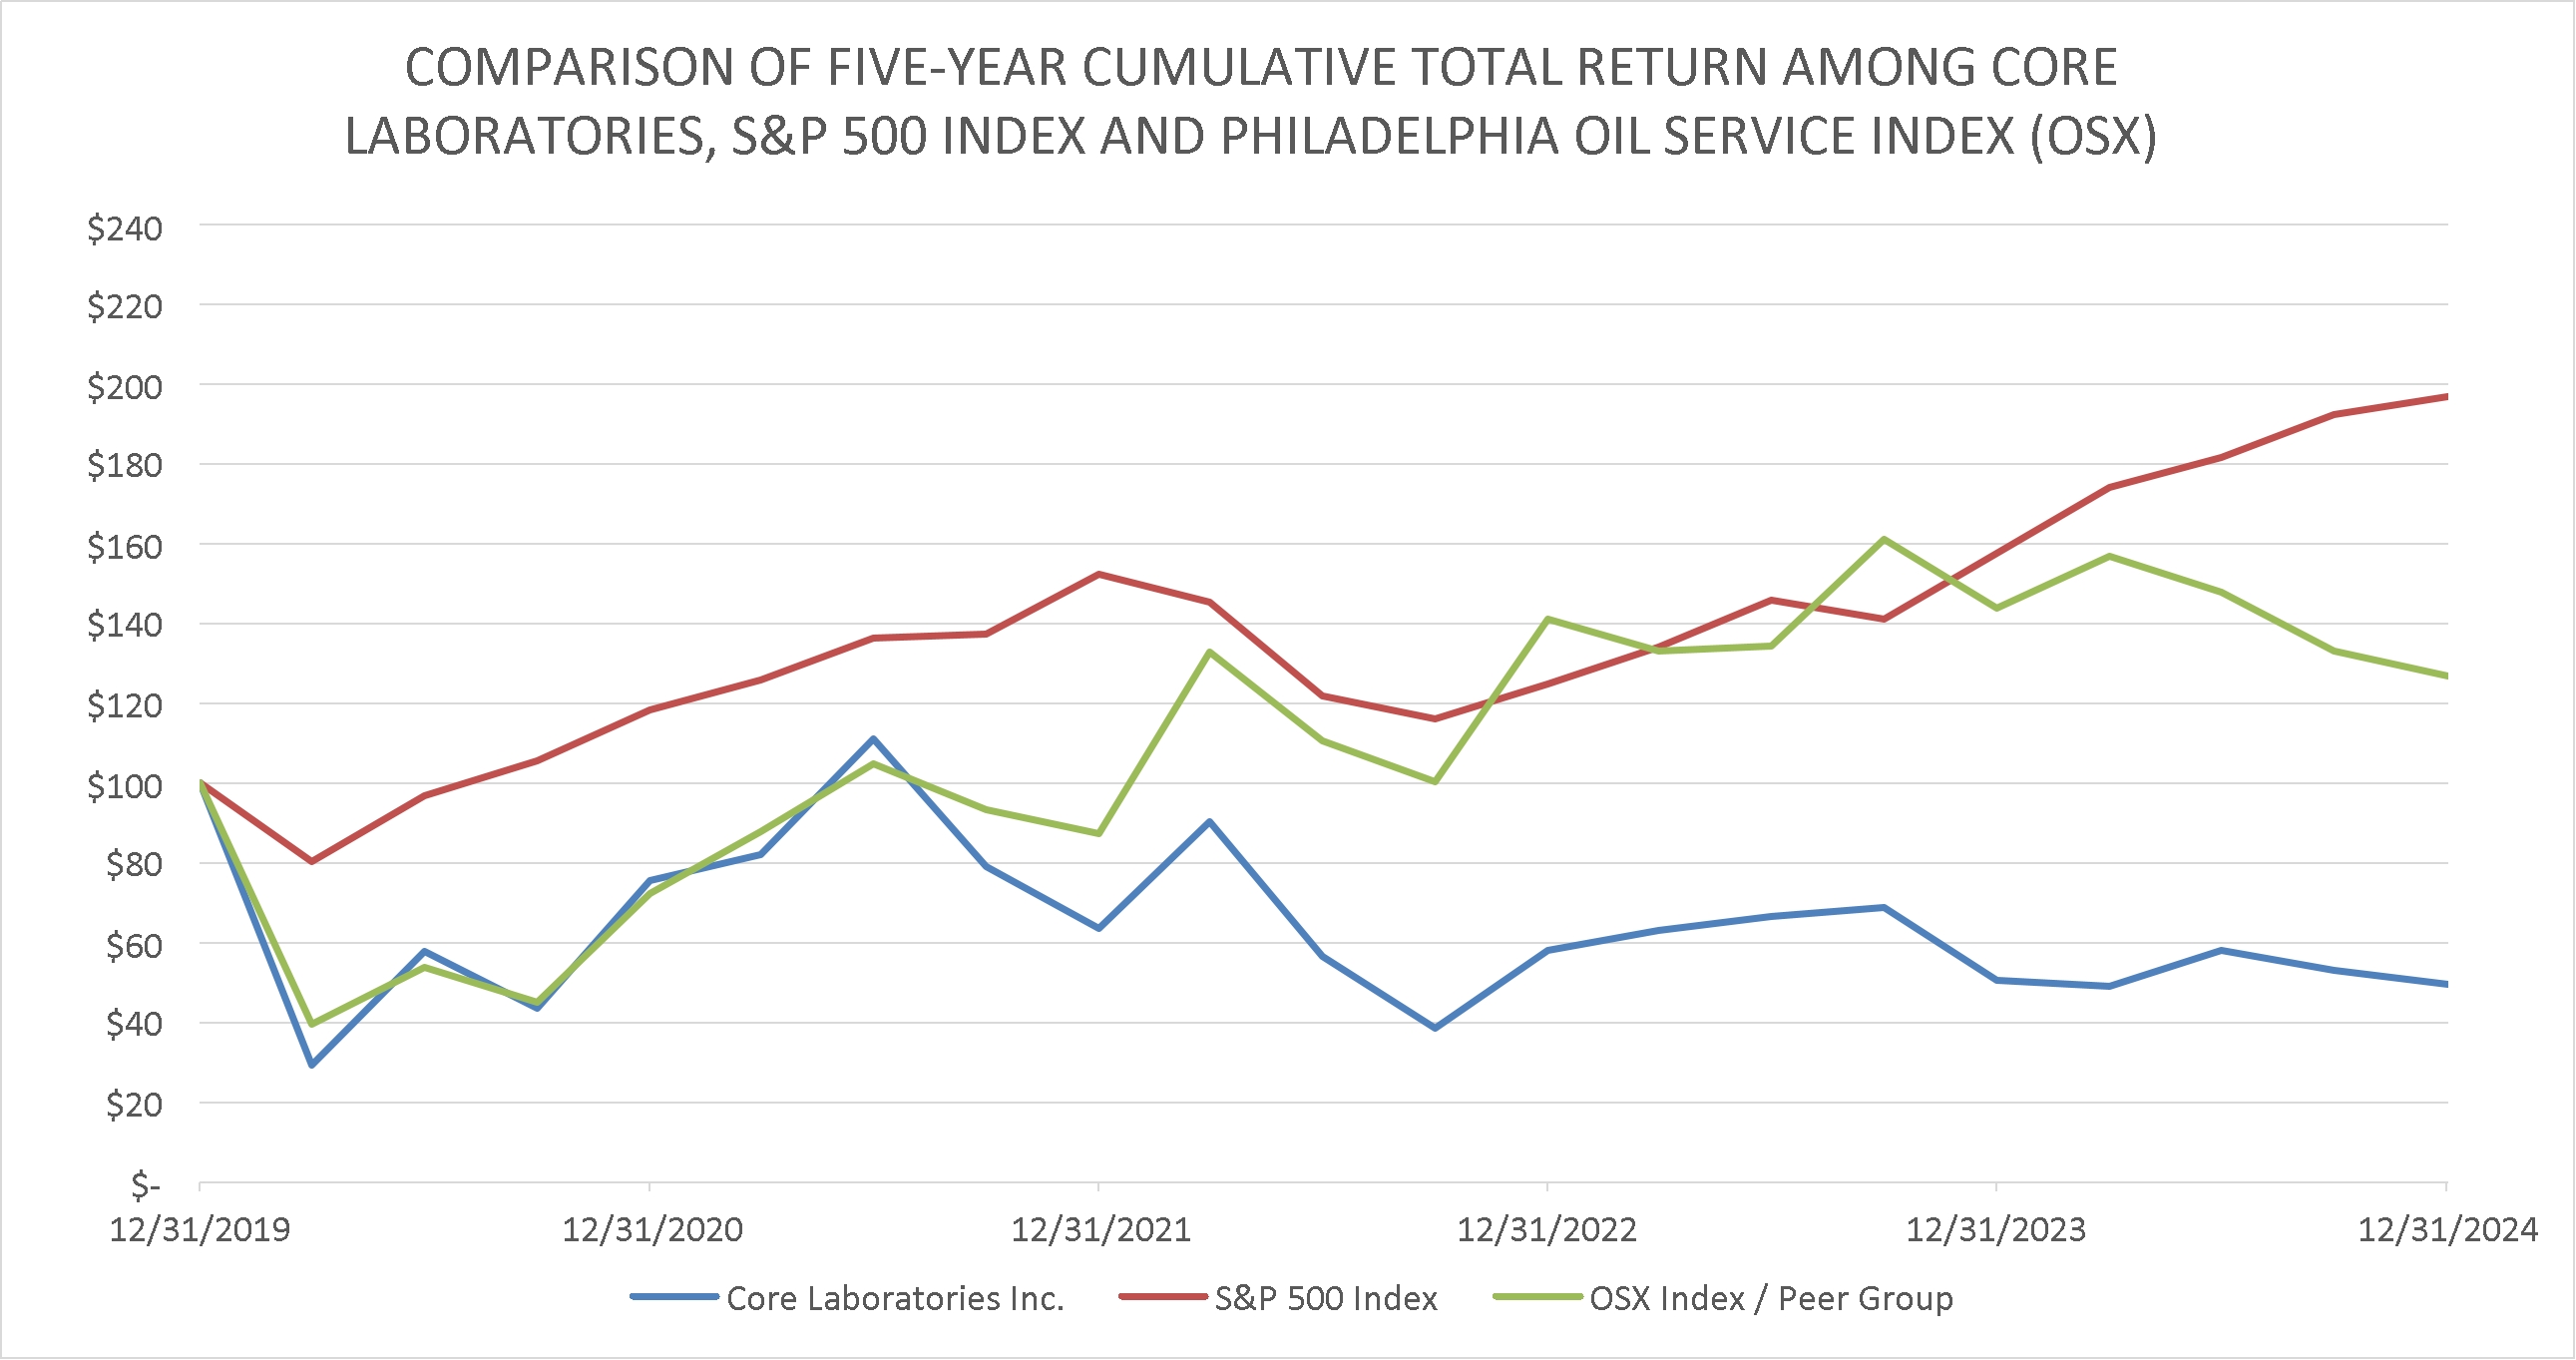
Share Repurchases in the Fourth Quarter of 2024
The following table provides information about our purchases of equity securities that are registered by us pursuant to Section 12 of the Exchange Act during the three months ended December 31, 2024:
| | | | | | | | | | | | | | | | |
Period | | Total Number
of Shares
Purchased | | | Average Price
Paid Per
Share | | | Total Number of Shares
Purchased as Part of a
Publicly Announced
Program | | | Maximum Number of
Shares that may yet be
Purchased Under the
Program | |
October 1 - 31, 2024 (1) | | | 21,829 | | | $ | 19.22 | | | | — | | | | — | |
November 1 - 30, 2024 (1) | | | 52,136 | | | $ | 19.64 | | | | — | | | | — | |
December 1 - 31, 2024 (1) | | | 191,017 | | | $ | 18.12 | | | | — | | | | — | |
Total | | | 264,982 | | | $ | 18.51 | | | | — | | | | |
(1) During the quarter, 87,766 shares were surrendered to us by participants in a stock-based compensation plan to settle any personal tax liabilities which may result from the award. Additionally, we purchased 177,216 shares in the open market during the quarter. | |
In connection with our initial public offering in September 1995, prior to the Redomestication Transaction and under Dutch law requirements, our shareholders authorized management to repurchase up to 10% of our issued share capital, for a period of 18 months. This authorization was renewed at subsequent annual or special shareholder meetings. Subsequent to the Redomestication Transaction in May 2023, shareholder approval is not required under U.S. or Delaware law and the repurchase of shares in the open market is at the discretion of our Board of Directors and management.
From the activation of the share repurchase program through December 31, 2024, we have repurchased 40,666,075 shares for an aggregate purchase price of approximately $1.7 billion, or an average price of $41.12 per share. At December 31, 2024, we held 140,048 shares in treasury.
ITEM 6. [RESERVED]
ITEM 7. MANAGEMENT’S DISCUSSION AND ANALYSIS OF FINANCIAL CONDITION AND RESULTS OF OPERATIONS
Core Laboratories Inc. is a Delaware corporation. We were established in 1936 and are one of the world’s leading providers of proprietary and patented reservoir description and production enhancement services and products to the oil and gas industry, primarily through client relationships with many of the world’s major, national and independent oil companies.
On May 1, 2023, Core Laboratories N.V. completed its previously announced redomestication transaction (the “Redomestication Transaction”), which through a series of steps, resulted in the merger of Core Laboratories N.V., a holding company in the Netherlands, with and into Core Laboratories Luxembourg S.A., a public limited liability company incorporated under the laws of Luxembourg, with Core Laboratories Luxembourg S.A. surviving, and subsequently the migration of Core Laboratories Luxembourg S.A. out of Luxembourg and its domestication as Core Laboratories Inc., a Delaware corporation. The Redomestication Transaction has been accounted for as a transaction between entities under common control. There is no difference between the combined separate entities prior to the Redomestication Transaction and the combined separate entities after the Redomestication Transaction with respect to the consolidated financial statements; therefore, comparative information reported in these financial statements do not differ from amounts previously reported under Core Laboratories N.V.’s consolidated financial statements. These financial statements should be read in conjunction with Core Laboratories N.V.’s Quarterly Report on Form 10-Q for the three months ended March 31, 2023 and Core Laboratories N.V.’s Annual Report on Form 10-K for the year ended December 31, 2022, including Note 2 - Summary of Significant Accounting Policies.
We operate our business in two segments. These complementary operating segments provide different services and products and utilize different technologies for evaluating and improving reservoir performance and increasing oil and gas recovery from new and existing fields:
•Reservoir Description: Encompasses the characterization of petroleum reservoir rock and reservoir fluids samples to increase production and improve recovery of crude oil and natural gas from our clients’ reservoirs. We provide laboratory-based analytical and field services to characterize properties of crude oil and crude oil-derived products to the oil and gas industry. Services associated with these fluids include determining the quality and measuring the quantity of the reservoir fluids and their derived products, such as gasoline, diesel and biofuels. We also provide proprietary and joint industry studies based on these types of analyses and manufacture associated laboratory equipment. In addition, we provide reservoir description capabilities that support various activities associated with energy transition projects, including services that support carbon capture, utilization and storage, geothermal projects, and the evaluation and appraisal of mining activities around lithium and other elements necessary for energy storage.
•Production Enhancement: Includes services and manufactured products associated with reservoir well completions, perforations, stimulation, production and well abandonment. We provide integrated diagnostic services to evaluate and monitor the effectiveness of well completions and to develop solutions aimed at increasing the effectiveness of enhanced oil recovery projects.
General Overview
We provide services as well as design and produce products which enable our clients to evaluate and improve reservoir performance and increase oil and gas recovery from new and existing fields. These services and products are generally in higher demand when our clients are investing capital in their field development programs that are designed to increase productivity from existing fields or when exploring for, appraising and developing new fields. Our clients’ investment in capital expenditure programs tends to correlate over the longer term to oil and natural gas commodity prices. During periods of higher, stable prices, our clients generally invest more in capital expenditures and, during periods of lower or volatile commodity prices, they tend to invest less. Consequently, the level of capital expenditures by our clients impacts the demand for our services and products.
The following table summarizes the annual average and year-end worldwide and U.S. rig counts for the years ended December 31, 2024, 2023 and 2022, as well as the annual average and year-end spot price of a barrel of WTI crude, Europe Brent crude and a MMBtu of natural gas:
| | | | | | | | | | | | |
| | 2024 | | | 2023 | | | 2022 | |
Baker Hughes Worldwide Average Rig Count (1) | | | 1,735 | | | | 1,814 | | | | 1,747 | |
Baker Hughes U.S. Average Rig Count (1) | | | 599 | | | | 689 | | | | 721 | |
Baker Hughes U.S. Land-based Average Rig Count (1) | | | 580 | | | | 670 | | | | 706 | |
Baker Hughes Worldwide Year-End Rig Count (2) | | | 1,660 | | | | 1,739 | | | | 1,835 | |
Baker Hughes U.S. Year-End Rig Count (2) | | | 589 | | | | 623 | | | | 780 | |
Baker Hughes U.S. Land-based Year-End Rig Count (2) | | | 575 | | | | 603 | | | | 763 | |
Average Crude Oil Price per Barrel WTI (3) | | $ | 76.63 | | | $ | 77.58 | | | $ | 94.90 | |
Average Crude Oil Price per Barrel Brent (4) | | $ | 80.52 | | | $ | 82.49 | | | $ | 100.93 | |
Average Natural Gas Price per MMBtu (5) | | $ | 2.19 | | | $ | 2.52 | | | $ | 6.45 | |
Year-end Crude Oil Price per Barrel WTI (3) | | $ | 72.44 | | | $ | 71.89 | | | $ | 80.16 | |
Year-end Crude Oil Price per Barrel Brent (4) | | $ | 74.58 | | | $ | 77.69 | | | $ | 82.82 | |
Year-end Natural Gas Price per MMBtu (5) | | $ | 3.40 | | | $ | 2.58 | | | $ | 3.52 | |
(1) Twelve month average rig count as reported by Baker Hughes - Worldwide Rig Count. | |
(2) Year-end rig count as reported by Baker Hughes - Worldwide Rig Count. | |
(3) Average daily and year-end West Texas Intermediate ("WTI") crude spot price as reported by the U.S. Energy Information Administration ("EIA"). | |
(4) Average daily and year-end Europe Brent crude spot price as reported by the EIA. | |
(5) Average daily and year-end Henry Hub natural gas spot price as reported by the EIA. | |
In general, activities associated with the exploration of oil and gas in the U.S. onshore market are more sensitive to changes in the crude-oil commodity prices, as opposed to larger international and offshore projects which take multiple years to plan and develop. These international and offshore projects once announced and started, will continue through completion, despite changes in the current price of crude oil. The geopolitical conflict between Russia and Ukraine that began in February 2022, caused disruptions to traditional maritime supply chains associated with the movement of crude oil, initially reducing the level of crude oil sourced from Russia and being imported into various European ports. The disruptions to traditional maritime supply chains of crude oil and derived products, such as diesel fuel, and associated sanctions imposed on maritime exports of these products out of Russia caused significant volatility in both the prices and trading patterns of these products during 2022 and into 2023. As a result, average crude-oil prices were elevated during 2022, but have since decreased, moderating in 2023 and stabilizing in 2024. The maritime supply chains associated with the movement of crude oil have continued to realign and stabilize in 2023 and 2024, which reduced some of the volatility in crude-oil prices, however, expanded sanctions were issued in January 2025, which have resulted in more recent elevated prices and uncertainty.
The conflict in the Middle East that began in October 2023 has resulted in additional disruptions in the movement and trading of crude oil which continued throughout 2024. The Company's volume of associated laboratory services is commensurate with the trading and movement of crude-oil into Europe, the Middle East, Asia and across the globe. However, the United States, the European Union, the United Kingdom and other countries may implement additional sanctions, export controls or other measures against Russia, Belarus and other countries, regions, officials, individuals or industries in the respective territories. We have no way to predict the progress or outcome of these events, and any resulting government responses are fluid and beyond our control. According to the latest International Energy Agency’s report, the current global demand for crude oil and natural gas remains at a moderate level though the growth momentum is expected to slow down in 2025 due to further weakening of the macroeconomic climate, as Gross Domestic Product (“GDP”) growth stays below trend in major economies, including China.
U.S. land drilling and completion activities improved in 2022, however, activity decreased during 2023 and continued to decrease throughout 2024. Since April 2023, the U.S. land-based rig count has continuously declined resulting in a 5% reduction as of December 31, 2024 compared to December 31, 2023.
Information published by the EIA, shows that the inventory of wells drilled but uncompleted (a “DUC” well) in the U.S., was 5,825 as of December 31, 2023, and declined to 5,238 at end of 2024. This data indicates that during the period of higher activity, operators were drilling wells but not completing them as the DUC inventory grew. As activity levels began to decline, operators began to drill fewer new wells and were completing some of the wells that had been previously drilled but not completed. As drilling and completion activity levels continued to decline from 2023 to 2024, the number of wells completed continued to outpace the number of new wells drilled during these periods.
In the U.S., the land-based average rig count decreased approximately 5% from 2022 to 2023 primarily due to a significant decline in natural gas prices. Additionally, efficiencies gains in drilling and completing wells allowed operators to complete their drilling programs ahead of their original schedule. Average natural gas prices continued to decline by approximately 13% in 2024 compared to 2023, and as a result the U.S. land-based average rig count decreased by a similar level in 2024. Demand
for product sales and associated services will typically change in tandem with the changes in the rig count and associated drilling and completion activity.
Outside of the U.S., international average rig count showed an increase of approximately 6% in 2023 from 2022, however, subsequently remained flat in 2024. Long-term international and offshore projects which are commonly announced through Final Investment Decisions and subsequently initiated are not as susceptible or at-risk to delay or suspension due to short-term volatility in crude-oil commodity prices. The Company has maintained its annual capital expenditures between $10.0 million and $13.0 million during the years 2022, 2023 and 2024, which is significantly reduced from average annual capital expenditures in years prior to the pandemic.
Results of Operations
Operating Results for the Year Ended December 31, 2024 Compared to the Years Ended December 31, 2023 and 2022
We evaluate our operating results by analyzing revenue, operating income and operating income margin (defined as operating income divided by total revenue). Since we have a relatively fixed cost structure, decreases in revenue generally translate into lower operating income results. Results for the years ended December 31, 2024, 2023 and 2022 are summarized in the following chart.
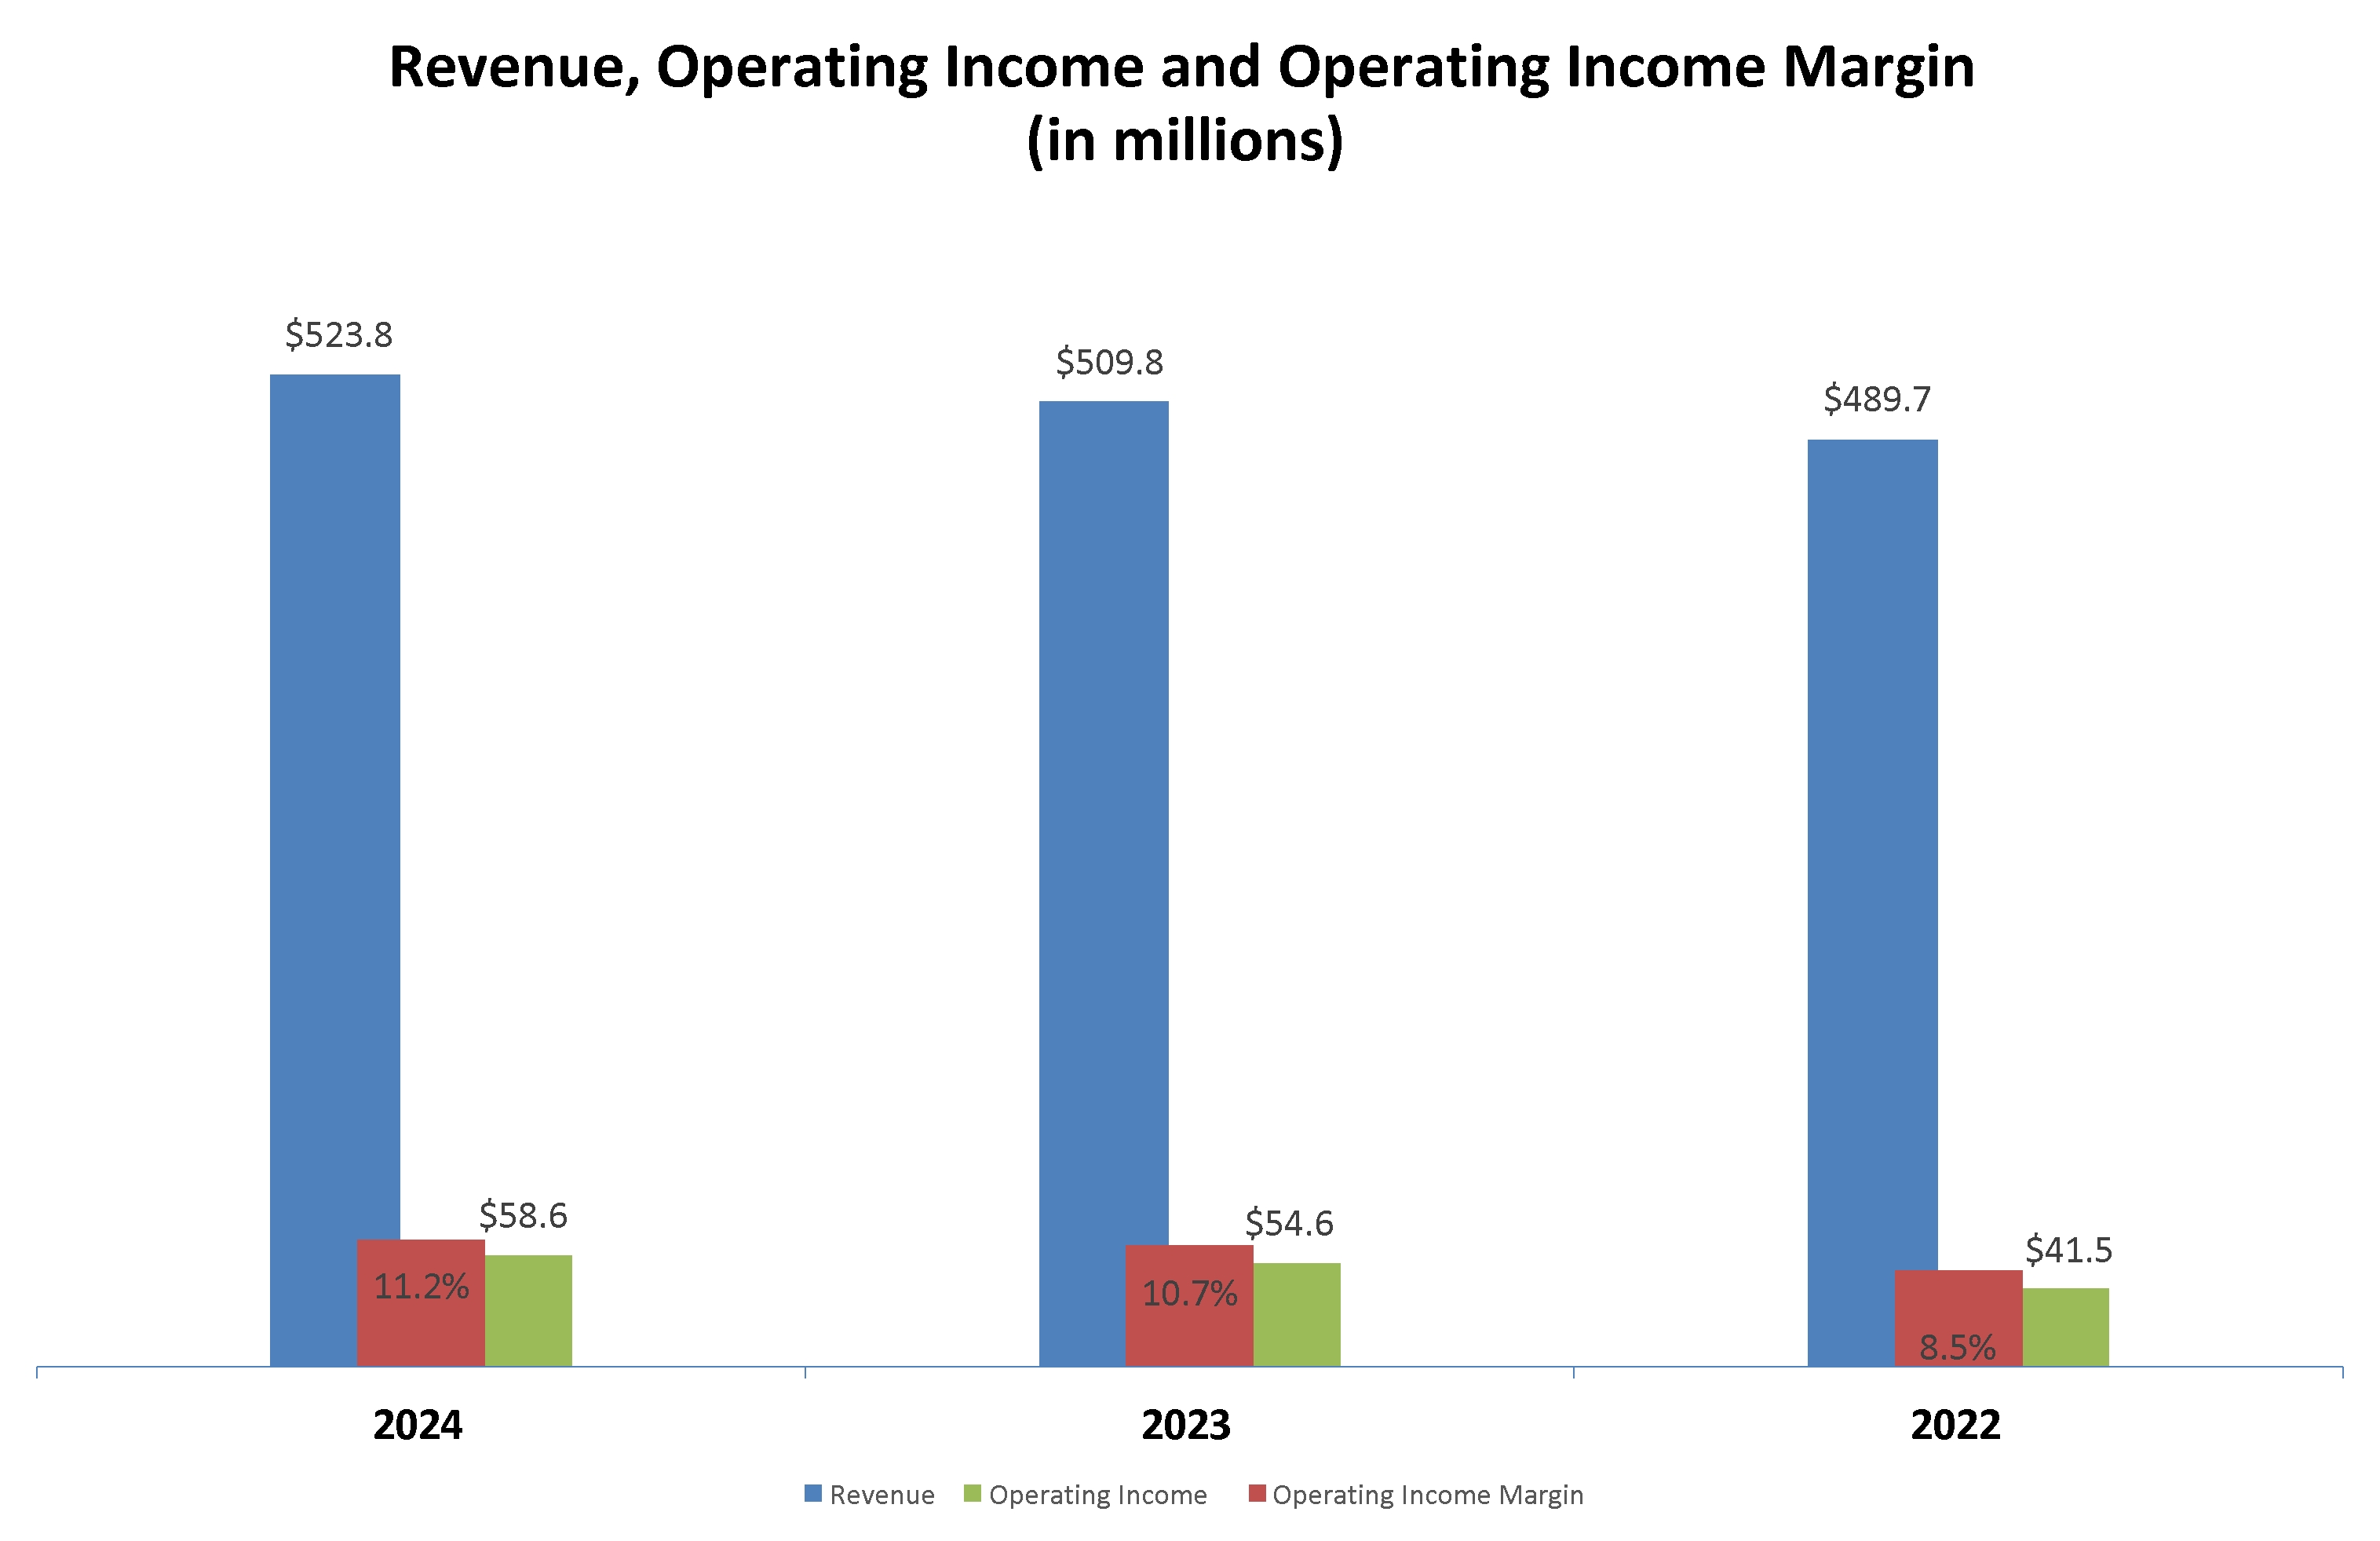
Results of operations as a percentage of applicable revenue for the years ended December 31, 2024, 2023 and 2022 are as follows (in thousands, except for per share information):
| | | | | | | | | | | | | | | | | | | | | | | | | | | | | |
| | | | | | | | | | | | | | | | | 2024 / 2023 | | | 2023 / 2022 | |
| | 2024 | | | 2023 | | | 2022 | | | % Change | |
REVENUE: | | | | | | | | | | | | | | | | | | | | | |
Services | | $ | 388,205 | | | 74.1 | % | | $ | 371,914 | | | 73.0 | % | | $ | 346,974 | | | 70.8 | % | | | 4.4 | % | | | 7.2 | % |
Product sales | | | 135,643 | | | 25.9 | % | | | 137,876 | | | 27.0 | % | | | 142,761 | | | 29.2 | % | | | (1.6 | )% | | | (3.4 | )% |
Total revenue | | | 523,848 | | | 100.0 | % | | | 509,790 | | | 100.0 | % | | | 489,735 | | | 100.0 | % | | | 2.8 | % | | | 4.1 | % |
OPERATING EXPENSES: | | | | | | | | | | | | | | | | | | | | | |
Cost of services* (1) | | | 297,324 | | | 76.6 | % | | | 282,135 | | | 75.9 | % | | | 274,297 | | | 79.1 | % | | | 5.4 | % | | | 2.9 | % |
Cost of product sales* (1) | | | 123,198 | | | 90.8 | % | | | 117,822 | | | 85.5 | % | | | 119,358 | | | 83.6 | % | | | 4.6 | % | | | (1.3 | )% |
Total cost of services and product
sales | | | 420,522 | | | 80.3 | % | | | 399,957 | | | 78.5 | % | | | 393,655 | | | 80.4 | % | | | 5.1 | % | | | 1.6 | % |
General and administrative expense (1) | | | 39,770 | | | 7.6 | % | | | 40,259 | | | 7.9 | % | | | 38,117 | | | 7.8 | % | | | (1.2 | )% | | | 5.6 | % |
Depreciation and amortization | | | 14,953 | | | 2.9 | % | | | 15,784 | | | 3.1 | % | | | 17,161 | | | 3.5 | % | | | (5.3 | )% | | | (8.0 | )% |
Other (income) expense, net | | | (9,953 | ) | | (1.9 | )% | | | (850 | ) | | (0.2 | )% | | | (722 | ) | | (0.1 | )% | | NM | | | NM | |
OPERATING INCOME | | | 58,556 | | | 11.2 | % | | | 54,640 | | | 10.7 | % | | | 41,524 | | | 8.5 | % | | | 7.2 | % | | | 31.6 | % |
Interest expense | | | 12,369 | | | 2.4 | % | | | 13,430 | | | 2.6 | % | | | 11,570 | | | 2.4 | % | | | (7.9 | )% | | | 16.1 | % |
Income before income taxes | | | 46,187 | | | 8.8 | % | | | 41,210 | | | 8.1 | % | | | 29,954 | | | 6.1 | % | | | 12.1 | % | | | 37.6 | % |
Income tax expense | | | 14,034 | | | 2.7 | % | | | 4,185 | | | 0.8 | % | | | 10,296 | | | 2.1 | % | | | 235.3 | % | | | (59.4 | )% |
Net income | | | 32,153 | | | 6.1 | % | | | 37,025 | | | 7.3 | % | | | 19,658 | | | 4.0 | % | | | (13.2 | )% | | | 88.3 | % |
Net income attributable to non-controlling interest | | | 753 | | | 0.1 | % | | | 350 | | | 0.1 | % | | | 205 | | | — | | | NM | | | NM | |
Net income attributable to Core Laboratories Inc. | | $ | 31,400 | | | 6.0 | % | | $ | 36,675 | | | 7.2 | % | | $ | 19,453 | | | 4.0 | % | | | (14.4 | )% | | | 88.5 | % |
| | | | | | | | | | | | | | | | | | | | | |
Diluted earnings per share | | $ | 0.67 | | | | | $ | 0.78 | | | | | $ | 0.42 | | | | | | (14.1 | )% | | | 85.7 | % |
| | | | | | | | | | | | | | | | | | | | | |
Diluted earnings per share attributable to Core Laboratories Inc. | | $ | 0.66 | | | | | $ | 0.77 | | | | | $ | 0.42 | | | | | | (14.3 | )% | | | 83.3 | % |
| | | | | | | | | | | | | | | | | | | | | |
Diluted weighted average common shares outstanding | | | 47,685 | | | | | | 47,523 | | | | | | 46,813 | | | | | | | | | |
Other Data: | | | | | | | | | | | | | | | | | | | | | |
Current ratio (2) | | 2.32:1 | | | | | 2.53:1 | | | | | 2.05:1 | | | | | | | | | |
Debt to EBITDA ratio (3) | | 1.37:1 | | | | | 2.11:1 | | | | | 2.68:1 | | | | | | | | | |
Debt to Adjusted EBITDA ratio (4) | | 1.31:1 | | | | | 1.76:1 | | | | | 2.29:1 | | | | | | | | | |
| | | | | | | | | | | | | | | | | | | | | |
* Percentage based on applicable revenue rather than total revenue. | |
"NM" means not meaningful. | |
(1) Excludes depreciation. | |
(2) Current ratio is calculated as follows: current assets divided by current liabilities. | |
(3) Debt to EBITDA ratio is calculated as follows: debt less cash divided by the sum of consolidated net income plus interest, taxes, depreciation, and amortization. | |
(4) Debt to Adjusted EBITDA ratio is calculated as follows: debt less cash divided by the sum of consolidated net income plus interest, taxes, depreciation, amortization, severance, and certain non-cash adjustments. | |
Service Revenue
Service revenue is primarily tied to activities associated with the exploration, production, movement and refinement of oil, gas and derived products outside the U.S. Service revenue for the year ended December 31, 2024, was $388.2 million, an increase of 4% compared to 2023. The increase was due to growth in activity levels in both U.S. and international markets. Approximately 70% of service revenue is generated from international markets, and in 2024, growth occurred in several international markets, primarily in Europe, Africa and Asia Pacific, despite the headwinds from the on-going geopolitical conflicts previously discussed. The increase in U.S. service revenue in 2024 compared to 2023, benefited from continued growing client activity from 2023 into 2024, for our reservoir core and reservoir fluids analysis services on projects from across the globe that are often conducted in our advanced technology center located in Houston, Texas, as well as a growing demand for CCS projects. Well completion diagnostic services in the U.S. market also showed strong growth in 2024 compared to 2023 although some well diagnostic projects in the Gulf of Mexico were delayed due to multiple hurricanes during 2024. Service revenue for the year ended December 31, 2023, was $371.9 million, increased by 7% compared to 2022. In 2023, the increase was due to growth in activity levels in both U.S. and international markets. The growth occurred in several international markets including the recovery of services in the European region. The increase in U.S. operations benefited from growing client activity year over year for our reservoir core and reservoir fluids analysis services on projects from across the globe, as well as a growing demand for CCS projects.
Product Sales Revenue
Product sales revenue, which is equally tied to the completion of onshore wells in the U.S. and international activities. Product sales to the U.S. onshore markets are generally delivered more frequently and in smaller quantities, versus product sales to international markets which are typically shipped and delivered in bulk and the timing of delivery can vary from one period to another. Product sales revenue for the year ended December 31, 2024, was $135.6 million, a decrease of 2% compared to 2023. The decline in our product sales revenue is primarily associated with the activity decline in the U.S. onshore market, where the U.S. land-based average rig count decreased 13% in 2024 compared to 2023. Product sales revenue for the year ended December 31, 2023, was $137.9 million, a decrease of 3% compared to 2022. The decrease in product sales, is primarily driven by the decline in the U.S. onshore market, where the U.S. land-based average rig count decreased by 5% in 2023 compared to 2022.
Cost of Services, excluding depreciation
Cost of services for the year ended December 31, 2024 was $297.3 million, an increase of 5% compared to 2023, which is slightly higher than the change in service revenue. Cost of services for the year ended December 31, 2023 was $282.1 million, an increase of 3% compared to 2022. Cost of services expressed as a percentage of service revenue increased to 77% in 2024 compared to 76% in 2023. The slight increase in cost of services as a percentage of service revenue in 2024, was primarily associated with higher employee compensation and higher operating costs as a result of additional costs incurred due to the fire incident at one of our U.K. facilities. The additional costs and loss of income from business interruption were substantially covered by insurance proceeds recorded in Other (income) expense, net. Cost of services expressed as a percentage of service revenue improved to 76% in 2023 from 79% in 2022. Improvement in cost of services as a percentage of service revenue in 2023, was primarily associated with improved utilization of our global laboratory network on higher revenue.
Cost of Product Sales, excluding depreciation
Cost of product sales for the year ended December 31, 2024 was $123.2 million, an increase of 5% compared to 2023 and cost of product sales as a percentage of sales revenue increased to 91% in 2024 from 86% in 2023. Both were driven primarily by certain inventory and other related asset write-downs of approximately $3.3 million in 2024. Cost of product sales for the year ended December 31, 2023 was $117.8 million, a decrease of 1% compared to 2022 and cost of product sales expressed as a percentage of product sales revenue increased to approximately 86% in 2023 from 84% in 2022. Both were primarily due to inflation in material costs throughout 2023 and higher absorption of fixed costs on a lower revenue base.
General and Administrative Expense, excluding depreciation
General and administrative (“G&A”) expense includes corporate management and centralized administrative services that benefit our operations. G&A expense was $39.8 million in 2024, a decrease of 1% or $0.5 million. The decrease is associated with lower employee compensation costs, which were substantially offset by increases in costs associated with the implementation of a global human capital management system and a third-party assessment of the Company’s IT cybersecurity environment. G&A expense was $40.3 million in 2023, an increase of 6% or $2.1 million compared to 2022. The increase is primarily due to changes in value of company owned life insurance and stock compensation expense during the period. See Note 17 - Stock-Based Compensation of the Notes to the Consolidated Financial Statements for further details.
Depreciation and Amortization
Depreciation and amortization expense for the year ended December 31, 2024 was $15.0 million, a decrease from $15.8 million and $17.2 million in 2023 and 2022, respectively. The decrease in 2024 and 2023 is associated with assets which became fully depreciated and lower levels of capital expenditures.
Other (Income) Expense, net
The components of other (income) expense, net are as follows (in thousands):
| | | | | | | | | | | | |
| | For the Years Ended December 31, | |
| | 2024 | | | 2023 | | | 2022 | |
Gain on sale of assets | | $ | (1,779 | ) | | $ | (200 | ) | | $ | (1,068 | ) |
Results of non-consolidated subsidiaries | | | (236 | ) | | | (394 | ) | | | (294 | ) |
Foreign exchange (gain) loss, net | | | 1,197 | | | | 176 | | | | 229 | |
Rents and royalties | | | (1,922 | ) | | | (698 | ) | | | (709 | ) |
Return on pension assets and other pension costs | | | (1,178 | ) | | | (1,365 | ) | | | (545 | ) |
Loss on lease abandonment and other exit costs | | | 699 | | | | 1,146 | | | | — | |
Assets write-down | | | 1,110 | | | | 1,143 | | | | — | |
Insurance and other settlements | | | (8,432 | ) | | | (604 | ) | | | (669 | ) |
Severance and other charges | | | 985 | | | | — | | | | 3,332 | |
ATM termination costs | | | — | | | | 455 | | | | — | |
Other, net | | | (397 | ) | | | (509 | ) | | | (998 | ) |
Total other (income) expense, net | | $ | (9,953 | ) | | $ | (850 | ) | | $ | (722 | ) |
In 2024 and 2022, we sold certain ownership interest in mineral rights of certain properties for a net gain of $1.4 million and $0.7 million, respectively, which is included in gain on sale of assets.
During the years ended December 31, 2024 and 2023, we abandoned certain leases in the U.S. and Canada and incurred lease abandonment and other exit costs of $0.7 million and $1.1 million, respectively. As a result of consolidating and exiting these facilities, the associated leasehold improvements, right of use assets and other assets of $1.1 million and $1.1 million were abandoned and expensed during the years ended December 31, 2024 and 2023, respectively.
In February 2024, we had a fire incident at one of our U.K. facilities and we have recorded partial settlements and certain net gains from insurance recovery of $8.4 million during the year ended December 31, 2024. Amounts associated with partial settlement for costs incurred and loss of income from business interruption are $4.0 million, and net gains associated with property, plant and equipment are $4.4 million.
During the year ended December 31, 2023, we wrote off previously deferred costs of $0.5 million upon termination of our 2022 at-the-market offering (“ATM Program”). See Note 14 - Equity for additional information.
During the year ended December 31, 2023, the State of Louisiana expropriated the access road to one of our facilities and paid us a settlement of $0.6 million. During the year ended December 31, 2022, we received insurance settlements of $0.7 million associated with business interruptions and property losses to certain facilities caused by the North America mid-continent winter storm in February 2021.
Foreign exchange (gain) loss, net is summarized in the following table (in thousands):
| | | | | | | | | | | | |
| | For the Years Ended December 31, | |
| | 2024 | | | 2023 | | | 2022 | |
Angolan Kwanza | | $ | (46 | ) | | $ | 188 | | | $ | (2 | ) |
Australian Dollar | | | (2 | ) | | | 81 | | | | 9 | |
British Pound | | | 117 | | | | (408 | ) | | | 212 | |
Canadian Dollar | | | 293 | | | | 156 | | | | 238 | |
Colombian Peso | | | 62 | | | | 92 | | | | (430 | ) |
Euro | | | 41 | | | | 438 | | | | (382 | ) |
Indonesian Rupiah | | | 315 | | | | 82 | | | | 379 | |
Nigerian Naira | | | 126 | | | | (74 | ) | | | (39 | ) |
Norwegian Krone | | | (20 | ) | | | 103 | | | | (31 | ) |
Russian Ruble | | | 36 | | | | (375 | ) | | | 35 | |
Turkish Lira | | | 53 | | | | (472 | ) | | | 114 | |
Other currencies, net | | | 222 | | | | 365 | | | | 126 | |
Foreign exchange (gain) loss, net | | $ | 1,197 | | | $ | 176 | | | $ | 229 | |
Interest Expense
Interest expense for the year ended December 31, 2024 was $12.4 million compared to $13.4 million and $11.6 million in 2023 and 2022, respectively. In 2024, the Company reduced its total outstanding debt by $38.0 million or 23% from end of 2023. The decrease in interest expense associated with lower outstanding debt was partially offset by a higher average blended interest rates in 2024 compared to 2023. In September 2023, the 2011 Senior Notes of $75 million with a fixed rate of 4.11% matured and were partially refinanced with the 2023 Senior Notes of $50 million with higher fixed rates of 7.25% and 7.50%. In 2023, the Company reduced its outstanding debt from end of 2022, however, the interest expense was higher in 2023 primarily due to: 1) rising interest rates on our variable rate debt during these periods, and 2) partial refinancing of the 2011 Senior Notes of $75 million with the 2023 Senior Notes of $50 million, as discussed above. See Note 11 - Long-term Debt, net of the Notes to the Consolidated Financial Statements for further detail. Interest expense was also affected by changes associated with our interest rate swap agreements, as described in Note 15 - Derivative Instruments and Hedging Activities of the Notes to the Consolidated Financial Statements.
Income Tax Expense
Income tax expense was $14.0 million in 2024 and resulted in an effective tax rate of 30.4%. The 2024 tax expense was primarily impacted by the geographic mix of earnings. Income tax expense was $4.2 million in 2023 and resulted in an effective tax rate of 10.2%. The 2023 tax expense was primarily impacted by the reversal of deferred tax liabilities of $11.6 million associated with the Redomestication Transaction, partially offset by the geographic mix of earnings.
See Note 9 - Income Taxes of the Notes to the Consolidated Financial Statements for further detail of income tax expense.
Segment Analysis
The following charts and tables summarize the annual revenue and operating results as a percentage of applicable revenue for our two complementary operating segments.
Segment Revenue
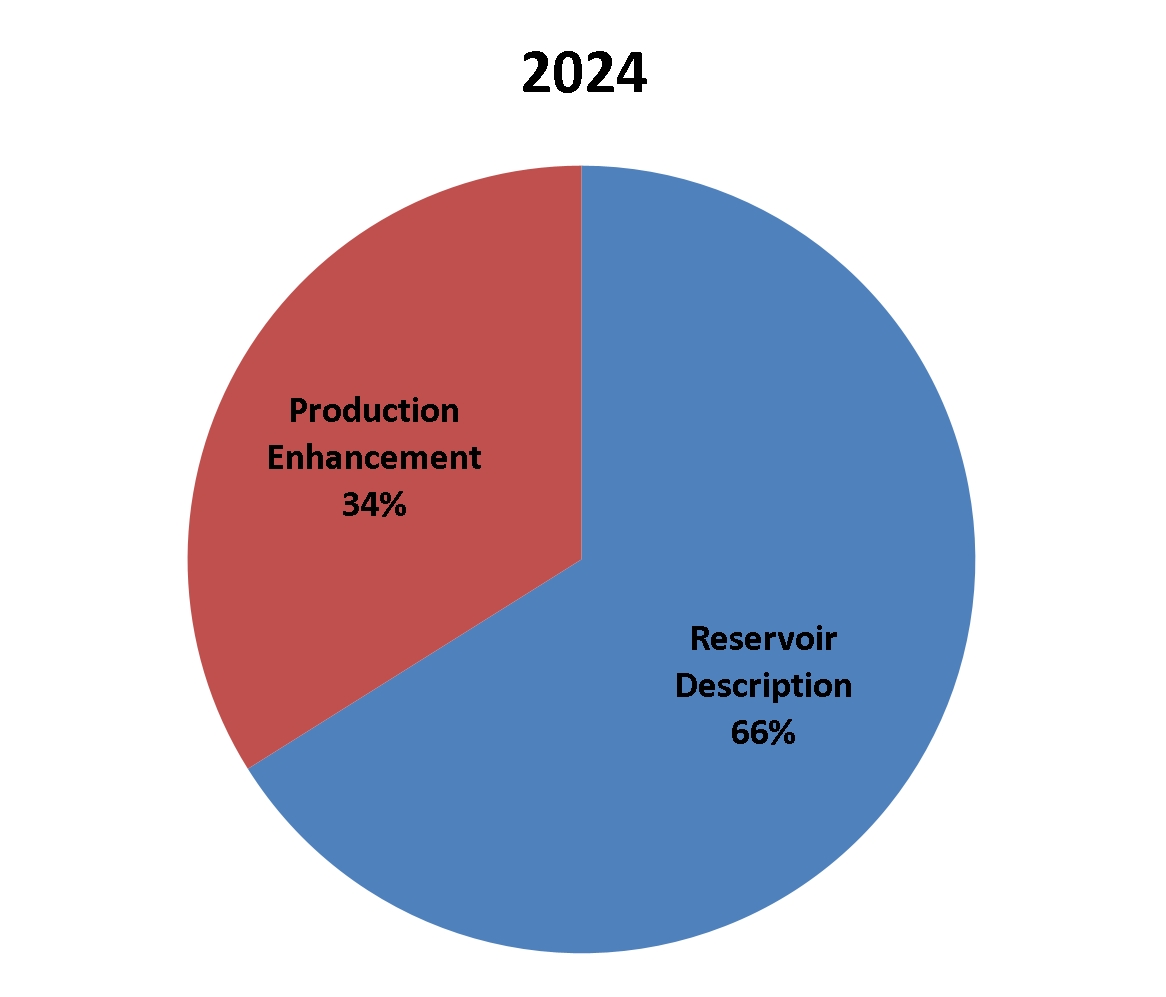
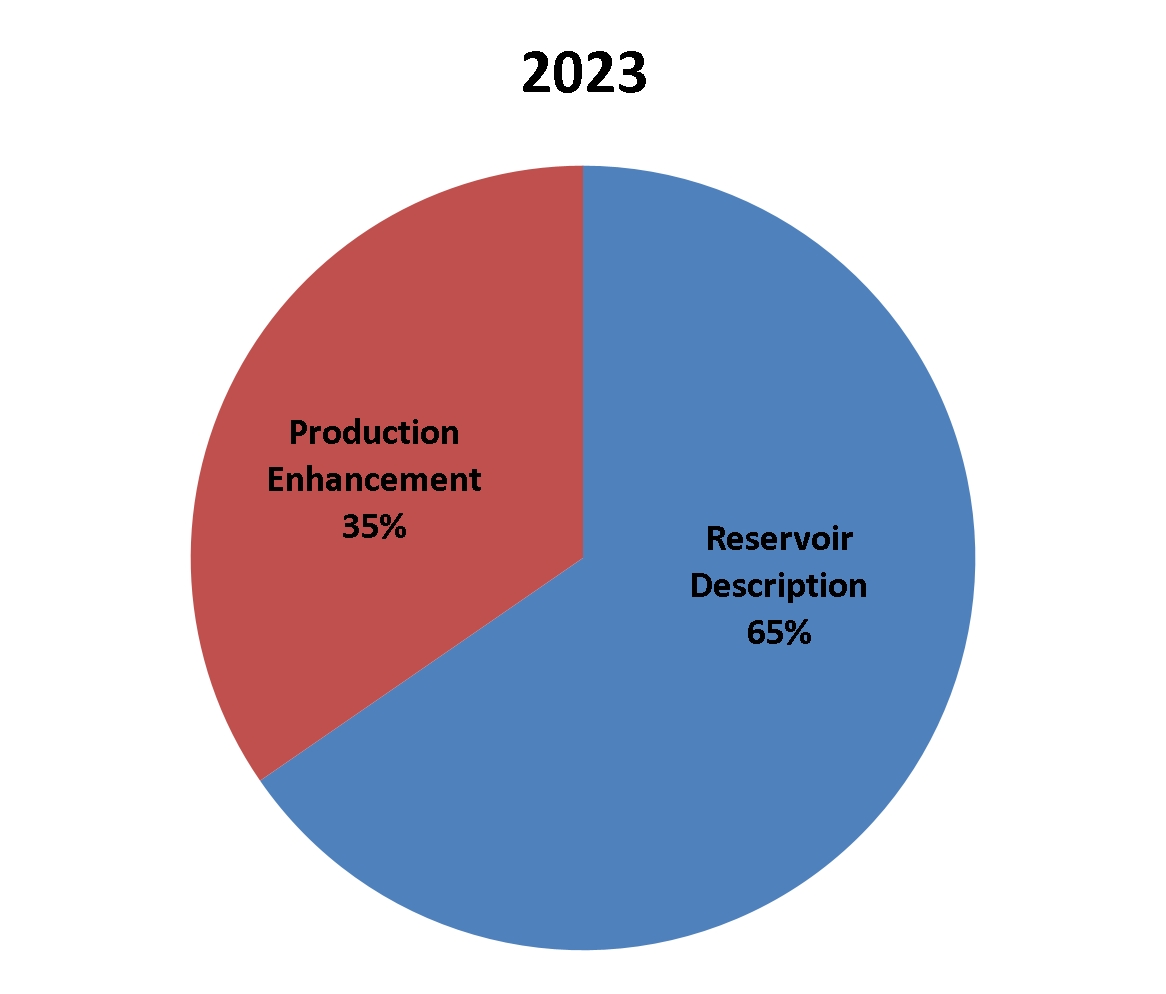
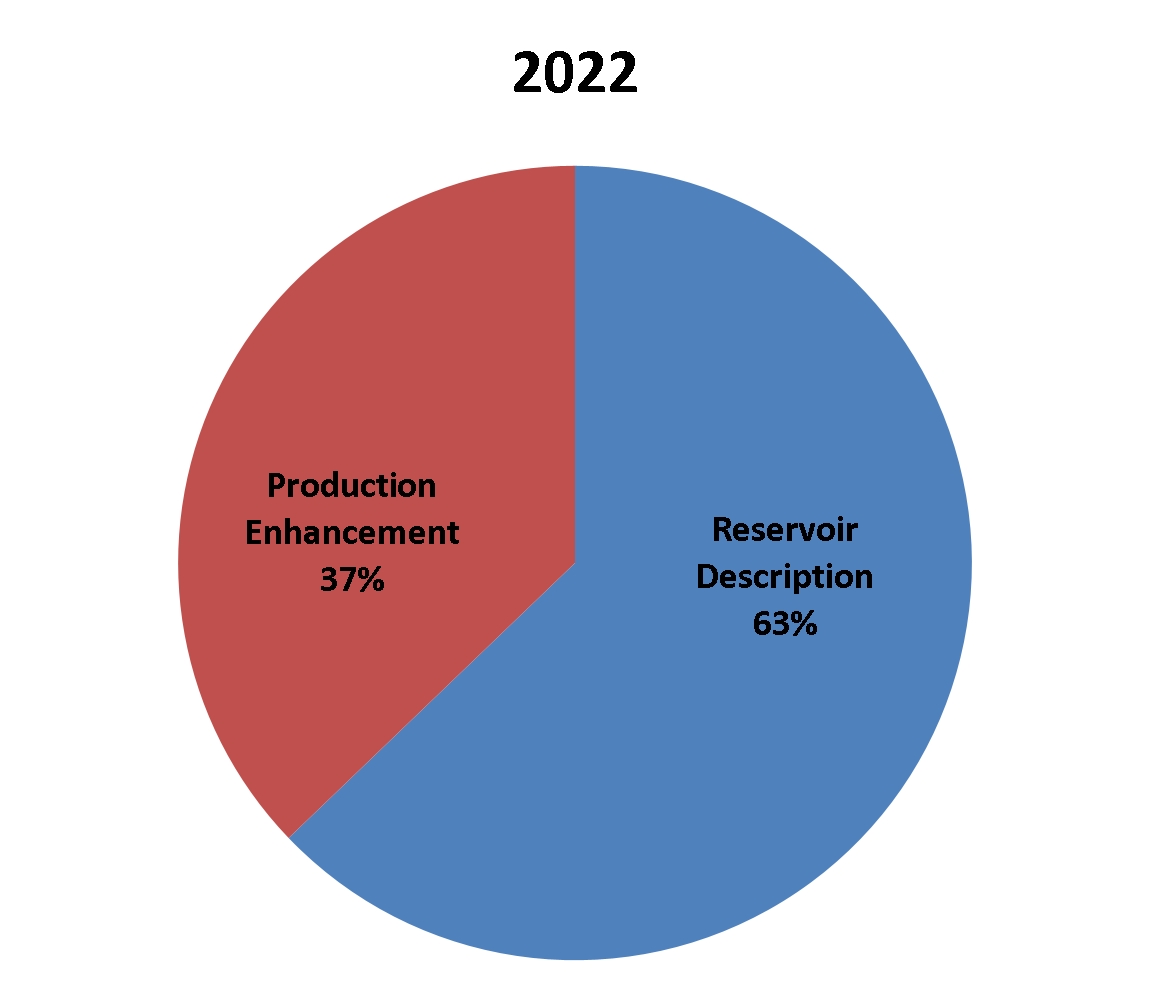
| | | | | | | | | | | | | | | | | | | | | | | | | | | | | |
| | | | | | | | | | | | | | | | | 2024 / 2023 | | | 2023 / 2022 | |
| | 2024 | | | 2023 | | | 2022 | | | % Change | |
REVENUE: | | | | | | | | | | | | | | | | | | | | | |
Reservoir Description | | $ | 346,146 | | | 66.1 | % | | $ | 333,345 | | | 65.4 | % | | $ | 307,691 | | | 62.8 | % | | | 3.8 | % | | | 8.3 | % |
Production Enhancement | | | 177,702 | | | 33.9 | % | | | 176,445 | | | 34.6 | % | | | 182,044 | | | 37.2 | % | | | 0.7 | % | | | (3.1 | )% |
Total revenue | | $ | 523,848 | | | 100.0 | % | | $ | 509,790 | | | 100.0 | % | | $ | 489,735 | | | 100.0 | % | | | 2.8 | % | | | 4.1 | % |
OPERATING INCOME: | | | | | | | | | | | | | | | | | | | | | |
Reservoir Description* | | $ | 51,466 | | | 14.9 | % | | $ | 41,039 | | | 12.3 | % | | $ | 22,902 | | | 7.4 | % | | | 25.4 | % | | | 79.2 | % |
Production Enhancement* | | | 6,612 | | | 3.7 | % | | | 12,519 | | | 7.1 | % | | | 16,351 | | | 9.0 | % | | | (47.2 | )% | | | (23.4 | )% |
Corporate and other (1) | | | 478 | | | 0.1 | % | | | 1,082 | | | 0.2 | % | | | 2,271 | | | 0.5 | % | | NM | | | NM | |
OPERATING INCOME | | $ | 58,556 | | | 11.2 | % | | $ | 54,640 | | | 10.7 | % | | $ | 41,524 | | | 8.5 | % | | | 7.2 | % | | | 31.6 | % |
* Percentage, which represents operating margin, is based on operating income divided by applicable revenue rather than total revenue.
“NM” means not meaningful.
(1) “Corporate and other” represents those items that are not directly relating to a particular operating segment.
Reservoir Description
Reservoir Description operations are closely correlated with trends in international and offshore activity levels, with approximately 80% of its revenue sourced from producing fields, development projects and movement of crude oil and derived products outside the U.S. The Company continues to see growth in international projects across several international regions and disruptions in the maritime movement and logistical trading patterns for crude oil and derived products, caused by the Russia-Ukraine and Middle East geopolitical conflicts have begun to stabilize.
Revenue from the Reservoir Description operating segment for the year ended December 31, 2024 was $346.1 million, an increase of 4% compared to 2023. The increased revenue in 2024 is primarily due to growing client activity for our reservoir core and reservoir fluids analysis services on projects in several regions across the globe, as well as continued momentum of growing demand for CCS projects in the last couple of years. Additionally, crude assay services associated with the maritime movement of crude oil and derived products which were impacted by the Russia-Ukraine conflict continued to improve in 2024. The growth in revenue was partially offset by delayed project revenue caused by the fire incident at one of our U.K. facilities. The Company holds insurance policies for both property damage and business interruption, which has minimized the loss to the Company associated with the fire. Revenue from the Reservoir Description operating segment was $333.3 million in 2023, an increase of 8% when compared to $307.7 million in 2022. The increased revenue in 2023 is primarily due to growing client activity for our reservoir core and reservoir fluids analysis services on projects in several regions across the globe, as well as growing demand for CCS projects. Additionally, crude assay services associated with the maritime movement of crude oil and derived products improved in 2023, which were negatively impacted by the Russia-Ukraine conflict that began in 2022.
Operating income for the year ended December 31, 2024 was $51.5 million, an increase of 25% compared to 2023. Operating margins increased to 14.9% in 2024 from 12.3% in 2023. The increase in operating income and operating margins in 2024 was primarily due to high operating margins associated with the incremental revenue of $12.8 million in 2024 and continued improvement in utilization of our global laboratory network. Operating income in 2023 was $41.0 million, an increase of 79% compared to 2022. Operating margins increased to 12.3% in 2023 compared to 7.4% in 2022. The increase in operating income and operating margin in 2023, correlates to the incremental revenue and the improved utilization of our global laboratory network, as well as the negative impact from the beginning of the Russia-Ukraine conflict in 2022.
Production Enhancement
Production Enhancement’s operations are largely focused on complex completions in unconventional, tight-oil reservoirs in the U.S. as well as conventional projects across the globe. U.S. onshore drilling and completion activities peaked in 2022, after the COVID-19 pandemic, but declined in 2023 and declined further in 2024. The decline in drilling and completion activity was primarily due to the weakening of both crude oil and natural gas commodity prices in 2023, and oil and gas producing companies remain focused on return of investment versus growing production, and were more disciplined with their annual production growth plans. As a result, average rig count in the U.S. onshore market declined by 13% in 2024 compared to 2023.
Revenue from the Production Enhancement operating segment for the year ended December 31, 2024 was $177.7 million, a slight increase of 1% compared to 2023, primarily due to a higher level of service revenue associated with strong growth in well completion diagnostic services in 2024. This increase was substantially offset by lower activity and product sales into the U.S. onshore market. Revenue from the Production Enhancement operating segment was $176.4 million in 2023, a decrease of 3% compared to 2022. In 2023, the decrease in drilling and completion activities in the U.S. land market is primarily due to operating companies reduced activity in 2023 as they were ahead of schedule in their annual drilling programs due to efficiencies gained in drilling and completing wells. Operators continue to remain focused on return of investment versus growing production, as discussed above.
Operating income for the year ended December 31, 2024 was $6.6 million, a decrease of 47%. Operating margins decreased to 3.7% in 2024 from 7.1% in 2023. The decrease in operating income and operating margin in 2024, was primarily due to 1) a charge of $3.3 million recorded in 2024 associated with inventory and other related asset write-downs, 2) a loss on sales of $0.6 million associated with the disposal of a building, and 3) severance and other charges of $0.5 million incurred in 2024, and no similar transactions in 2023. Operating income was $12.5 million in 2023 compared to $16.4 million in 2022. Operating margin of 7.1% in 2023 decreased from 9.0% in 2022. The decrease in operating income and operating margins in 2023, correlates to the decrease in revenue and higher absorption of fixed costs on a lower revenue base, as well as increased cost associated with inflation on materials and shipping costs.
Liquidity and Capital Resources
General
We have historically financed our activities through cash on hand, cash flows from operations, bank credit facilities, equity financing and the issuance of debt. Cash flows from operating activities provide the primary source of funds to finance our operating needs, capital expenditures, dividends and share repurchase program. Our ability to maintain and grow our operating income and cash flow depends, to a large extent, on continued investing activities. We believe our future cash flows from operations, supplemented by our borrowing capacity and the ability to issue additional equity and debt, should be sufficient to fund our debt requirements, working capital, capital expenditures, dividends, share repurchase program and future acquisitions. The Company will continue to monitor and evaluate the availability of debt and equity markets.
We were a holding company incorporated in the Netherlands, and after the Redomestication Transaction completed in May 2023, we are a holding company incorporated in Delaware. Therefore, we conduct substantially all of our operations through our subsidiaries. Our cash availability is largely dependent upon the ability of our subsidiaries to pay cash dividends or otherwise distribute or advance funds to us and on the terms and conditions of our existing and future credit arrangements. There are no restrictions preventing any of our subsidiaries from repatriating earnings, except for the unrepatriated earnings of our Russian subsidiary which are not expected to be distributed in the foreseeable future, and there are no restrictions or income taxes associated with distributing cash to the parent company through loans or advances. As of December 31, 2024, $18.4 million of our $19.2 million of cash balances was held by our foreign subsidiaries.
The Company continues to maintain a quarterly dividend of $0.01 per share.
Cash Flows
The following table summarizes cash flows (in thousands):
| | | | | | | | | | | | |
| | For the Years Ended December 31, | |
| | 2024 | | | 2023 | | | 2022 | |
Cash provided by (used in): | | | | | | | | | |
Operating activities | | $ | 56,388 | | | $ | 24,789 | | | $ | 24,956 | |
Investing activities | | | (6,394 | ) | | | (6,652 | ) | | | (3,856 | ) |
Financing activities | | | (45,957 | ) | | | (18,445 | ) | | | (23,375 | ) |
Net change in cash and cash equivalents | | $ | 4,037 | | | $ | (308 | ) | | $ | (2,275 | ) |
Comparing the year ended December 31, 2024, to the year ended December 31, 2023, net income decreased $4.9 million, however, cash provided by operating activities increased $31.6 million. In 2024, improvement in cash provided by operating activities was primarily driven by improved operational working capital of $34.7 million compared to 2023, partially offset by higher cash used in prepaid expenses and other assets in 2024 versus 2023. Comparing the year ended December 31, 2023 to the year ended December 31, 2022, net income increased $17.4 million, however, cash provided by operating activities was relatively flat between these periods. Net income for the year ended December 31, 2023 includes a non-cash tax benefit of approximately $11.6 million associated with the Company’s Redomestication Transaction, partially offset by a decrease of $3.3 million in net deferred tax assets, and non-cash investment gains of $5.0 million in 2023 compared to non-cash losses of $5.1 million in 2022.
Cash used in investing activities for the year ended December 31, 2024 of $6.4 million was driven primarily by funding capital expenditures of $13.0 million offset by: 1) $1.7 million of proceeds from sale of assets, 2) $2.1 million of insurance recovery proceeds on property, plant and equipment associated with the fire incident in one of our facilities in the U.K., and 3) $2.8 million received on company owned life insurance policies. Cash used in investing activities for the year ended December 31, 2023 of $6.7 million was driven primarily by funding capital expenditures of $10.6 million offset by $3.4 million of net proceeds received on company owned life insurance policies and $0.5 million of proceeds from sales of assets. Cash used by investing activities for the year ended December 31, 2022 of $3.9 million was primarily due to funding capital expenditures of $10.2 million, offset by $2.1 million of proceeds received from sale of assets and net proceeds of $4.2 million received from insurance and company-owned life insurance policies.
Cash used in financing activities in 2024 of $46.0 million was primarily due to: 1) a net reduction in debt of $38 million, 2) dividends paid of $1.9 million, and 3) repurchase of common stock of $5.3 million. Cash used in financing activities in 2023 of $18.4 million was primarily due to: 1) a net reduction in debt of $9.0 million, 2) debt issuance costs of $1.3 million primarily associated with the issuance of the 2023 Senior Notes, 3) cash paid for costs incurred in the Redomestication Transaction of $4.1 million, 4) dividends paid of $1.9 million, and 5) repurchase of common stock of $2.2 million. Cash used in financing activities in 2022 of $23.4 million was primarily due to: 1) a net reduction in debt of $15.0 million, 2) debt issuance costs
incurred of $2.2 million associated with renewing our credit facility in 2022, 3) dividends paid of $1.9 million, and 4) repurchase of common stock of $3.9 million.
During 2024, we repurchased 286,440 shares of our common stock for an aggregate amount of $5.3 million, or an average price of $18.52 per share. See Note 14 - Equity of the Notes to the Consolidated Financial Statements for additional information. We believe our share repurchase program has been beneficial to our shareholders over the longer term. Our share price has increased from $4.03 per share in 2002, when we began to repurchase shares, to $17.31 per share on December 31, 2024, an increase exceeding 300%. The 1% stock buyback excise tax may apply to the shares repurchased under our share purchase program. The amount subject to the excise tax generally is the fair market value of stock repurchased by us net of the fair market value of any stock issued by us during such taxable year.
We utilize the non-GAAP financial measure of free cash flow to evaluate our cash flows and results of operations. Free cash flow is defined as net cash provided by operating activities (which is the most directly comparable U.S. GAAP measure) less cash paid for capital expenditures. Management believes that free cash flow provides useful information to investors regarding the cash available in the period that was in excess of our needs to fund our capital expenditures and operating activities. Free cash flow is not a measure of operating performance under U.S. GAAP and should not be considered in isolation nor construed as an alternative to operating income, net income or cash flows from operating, investing or financing activities, each as determined in accordance with U.S. GAAP. Free cash flow does not represent residual cash available for distribution because we may have other non-discretionary expenditures that are not deducted from the measure. Moreover, since free cash flow is not a measure determined in accordance with U.S. GAAP and thus is susceptible to varying interpretations and calculations, free cash flow, as presented, may not be comparable to similarly titled measures presented by other companies. The following table reconciles this non-GAAP financial measure to the most directly comparable measure calculated and presented in accordance with U.S. GAAP (in thousands):
| | | | | | | | | | | | |
| | For the Years Ended December 31, | |
Free Cash Flow Calculation | | 2024 | | | 2023 | | | 2022 | |
Net cash provided by operating activities | | $ | 56,388 | | | $ | 24,789 | | | $ | 24,956 | |
Less: cash paid for capital expenditures | | | (13,028 | ) | | | (10,579 | ) | | | (10,216 | ) |
Free cash flow | | $ | 43,360 | | | $ | 14,210 | | | $ | 14,740 | |
Free cash flow increased significantly by $29.2 million for the year ended December 31, 2024, compared to the year ended December 31, 2023, primarily due to improvement in our operational working capital as discussed above, offset by a slightly higher level of capital spending associated with replacing equipment and restoring the facility that were damaged in the fire at one of our facilities in the U.K. that occurred in 2024.
Free cash flow decreased slightly by $0.5 million for the year ended December 31, 2023, compared to the year ended December 31, 2022, primarily due to a slightly higher level of capital spending in 2023.
Senior Notes, Credit Facility and Available Future Liquidity
We, along with our wholly owned subsidiary Core Laboratories (U.S.) Interests Holdings, Inc. (“CLIH”) as issuer, have senior notes that were issued through private placement transactions. Additionally, we, along with CLIH, have a secured credit facility, the Eighth Amended and Restated Credit Agreement (as amended, the “Credit Facility”) for an aggregate borrowing commitment of $135.0 million with a $50.0 million “accordion” feature. As of December 31, 2024, the Credit Facility has an available borrowing capacity of approximately $106.1 million.
Our debt instruments are summarized in the following table (in thousands):
| | | | | | | | | | | |
| | | | | December 31, | |
| Interest Rate | | Maturity Date | | 2024 | | | 2023 | |
2021 Senior Notes Series A(1) | 4.09% | | January 12, 2026 | | $ | 45,000 | | | $ | 45,000 | |
2021 Senior Notes Series B(1) | 4.38% | | January 12, 2028 | | | 15,000 | | | | 15,000 | |
2023 Senior Notes Series A(2) | 7.25% | | June 28, 2028 | | | 25,000 | | | | 25,000 | |
2023 Senior Notes Series B(2) | 7.50% | | June 28, 2030 | | | 25,000 | | | | 25,000 | |
Credit Facility | | | | | | 18,000 | | | | 56,000 | |
Total long-term debt | | | | | | 128,000 | | | | 166,000 | |
Less: Debt issuance costs | | | | | | (1,889 | ) | | | (2,866 | ) |
Long-term debt, net | | | | | $ | 126,111 | | | $ | 163,134 | |
As of December 31, 2024, we have two series of senior notes, the 2021 Senior Notes and the 2023 Senior Notes, outstanding with an aggregate principal amount of $110.0 million. The 2021 Senior Notes and the 2023 Senior Notes are collectively the “Senior Notes”.
In accordance with the terms of the Credit Facility, our leverage ratio is 1.31, and our interest coverage ratio is 6.74, each for the period ended December 31, 2024. We are in compliance with all covenants contained in our Credit Facility and Senior Notes. Certain of our material, wholly owned subsidiaries, are guarantors or co-borrowers under the Credit Facility and Senior Notes. See Note 11 - Long-Term Debt, net of the Notes to the Consolidated Financial Statements for additional information regarding the terms and financial covenants of the Senior Notes and the Credit Facility.
See Note 15 - Derivative Instruments and Hedging Activities of the Notes to the Consolidated Financial Statements for additional information regarding interest rate swap agreements we have entered to fix the underlying risk-free rate on our Credit Facility and the 2023 Senior Notes.
In addition to our repayment commitments under our Credit Facility and our Senior Notes, we have non-cancellable operating lease arrangements under which we lease office and lab space, machinery, equipment and vehicles. We also have employer contribution commitments related to our Dutch pension plan with amounts payable in the future based upon workforce factors that cannot be estimated beyond one year. These material future contractual obligations are discussed in Note 7 - Leases, Note 11 - Long-term Debt, net and Note 12 - Pension and Other Postretirement Benefit Plans of the Notes to the Consolidated Financial Statements. We have no significant purchase commitments or similar obligations outstanding at December 31, 2024.
We have uncertain tax positions of $3.3 million that we have accrued for at December 31, 2024; the amounts and timing of payment, if any, are uncertain. See Note 9 - Income Taxes of the Notes to the Consolidated Financial Statements for further detail of this amount.
At December 31, 2024, we had tax net operating loss carry-forwards in various jurisdictions of $28.8 million. Although we cannot be certain that these net operating loss carry-forwards will be utilized, we anticipate that we will have sufficient taxable income in future years to allow us to fully utilize the carry-forwards that are not subject to a valuation allowance as of December 31, 2024. If unused, those carry-forwards which are subject to expiration may expire during the years 2025 through 2038. During 2024, no material net operating loss carry-forwards, which carried a full valuation allowance, expired unused.
We expect our investment in capital expenditures to track with client demand for our services and products. Given the uncertain trend in industry activity levels, we have not determined, at this time, the level of investment that will be made in 2025. We will, however, continue to invest in the purchase or replacement of obsolete or worn-out instrumentation, tools and equipment, to consolidate certain facilities to gain operational efficiencies, and to increase our presence where requested by our clients.
Outlook
Currently, global oil inventories are low relative to historical levels, and with continued supply restrictions from the Organization of the Petroleum Exporting Countries and other oil producing nations (“OPEC+”) global supply is expected to be managed and maintained at a level to meet forecasted growth in oil demand for the next few years. During the last couple of years, OPEC+ and its key member, Saudi Arabia, announced several mandatory and voluntary reductions in production that continued in 2024. The current production cuts are scheduled to be phased out gradually starting from April 1, 2025, stretching to October 2026, but OPEC+ retains the discretion to pause or reverse the adjustments as necessary.
The current global demand for crude oil and natural gas remains at a modest level and according to the latest International Energy Agency’s report, global demand is expected to continue increasing in 2025 and beyond. As a result, it is anticipated that crude-oil commodity prices for the near-term will remain at current levels or increase if projections for demand remain accurate or disruptions to supply occur. In 2023, capital spending towards the exploration of crude oil and natural gas reached their highest level in over a decade with modest growth in 2024 and additional growth expected in 2025. Outside the U.S., international oil and gas projects continue to build and are expected to grow and accelerate into the next several years. U.S. onshore drilling and completion activities are expected to remain at levels comparable to activity levels in 2024, with some typical seasonal decrease towards the end of the year. Therefore, our clients’ activities associated with the appraisal, development and production of crude oil and natural gas are also expected to remain at current levels or increase in 2025.
The ongoing geopolitical conflicts between Russia and Ukraine and in the Middle East continue to cause disruptions to traditional maritime supply chains and the trading of crude oil and derived products, such as diesel fuel. The maritime supply chains associated with the movement of crude oil have continued to realign and stabilize throughout 2023 and in 2024, which
has reduced some of the volatility in crude-oil prices and disruptions to our operations. Core Lab expects crude-oil supply lines to remain reasonably stable in 2025, however, recently expanded sanctions have created additional uncertainty, and the Company's volume of associated laboratory services may be impacted but are expected to be commensurate with the trading and movement of crude-oil into Europe, the Middle East, Asia and across the globe. The United States, the European Union, the United Kingdom and other countries continue to expand sanctions, export controls and other measures against Russia, Belarus, Iran and other countries, officials, individuals or industries in the respective territories, which may have further impact on the trading and movement of crude oil and derived products. We have no way to predict the progress or outcome of these events, and any resulting government responses are fluid and beyond our control.
We continue to focus on large-scale core analyses and reservoir fluids characterization studies in most oil-producing regions across the globe, which include both newly developed fields and brownfield extensions in many offshore developments in both the U.S. and internationally. In the U.S. we are involved in projects in many of the onshore unconventional basins and offshore projects in the Gulf of Mexico. Outside the U.S. we continue to work on many smaller and large-scale projects analyzing crude oil and derived products in every major producing region of the world. Notable larger projects are in locations such as Guyana and Suriname located offshore South America, Australia, Southern Namibia and the Middle East. Analysis and measurement of crude oil derived products also occurs in every major producing region of the world. Additionally, some of our major clients have increased their investment in projects to capture and sequester CO2. The Company’s activities on these projects have expanded and are expected to continue expanding in 2025 and beyond.
Our major clients continue to focus on capital management, return on invested capital, free cash flow, and returning capital to their shareholders, as opposed to a focus on production growth. The companies adopting value versus volume metrics tend to be the more technologically sophisticated operators and form the foundation of Core Lab’s worldwide client base. As oil and gas commodity prices have stabilized or are expected to increase in the near to mid-term, the Company expects our clients’ activities associated with increasing oil and gas reserves and production levels will continue to increase in the coming years.
Critical Accounting Estimates
The preparation of financial statements in accordance with U.S. GAAP requires management to make certain estimates and assumptions that affect the reported amounts of assets and liabilities and disclosure of assets and liabilities at the date of the financial statements and the reported amounts of revenue and expenses during the reporting period. We evaluate our estimates on an ongoing basis and utilize our historical experience, as well as various other assumptions that we believe are reasonable in a given circumstance, in order to make these estimates. By nature, these judgments are subject to an inherent degree of uncertainty. We consider an accounting estimate to be critical if it is highly subjective and if changes in the estimate under different assumptions would result in a material impact on our financial condition and results of operations. The following transaction types require significant judgment and, therefore, are considered critical accounting policies as of December 31, 2024.
Income Taxes
Our income tax expense includes income taxes of the U.S. and other countries as well as local, state and provincial income taxes. We recognize deferred tax assets and liabilities for the expected future tax consequences of events that have been included in the consolidated financial statements or tax returns. Deferred tax assets and liabilities are determined based on the difference between the financial statement carrying value and the tax basis of assets and liabilities using enacted tax rates in effect for the years in which the asset is expected to be recovered or the liability is expected to be settled. We estimate the likelihood of the recoverability of our deferred tax assets (particularly, net operating loss carry-forwards). Any valuation allowance recorded is based on estimates and assumptions of taxable income into the future and a determination is made of the magnitude of deferred tax assets which are more likely than not to be realized. Valuation allowances of our net deferred tax assets aggregated to $8.8 million and $8.3 million at December 31, 2024 and 2023, respectively. If these estimates and related assumptions change in the future, we may be required to record additional valuation allowance against our deferred tax assets and our effective tax rate may increase which could result in a material adverse impact on our financial position, results of operations and cash flows. We record a liability for unrecognized tax benefits resulting from uncertain tax positions taken or expected to be taken in our tax return. We also recognize interest and penalties, if any, related to unrecognized tax benefits in income tax expense.
Long-Lived Assets, Intangibles and Goodwill
Property, plant and equipment are carried at cost less accumulated depreciation. Major renewals and improvements are capitalized while maintenance and repair costs are charged to expense as incurred. They are depreciated using the straight-line method based on their individual estimated useful lives, except for leasehold improvements, which are depreciated over the remaining lease term, if shorter. We estimate the useful lives and salvage values of our assets based on historical data of similar
assets. When long-lived assets are sold or retired, the remaining costs and related accumulated depreciation are removed from the accounts and any resulting gain or loss is recognized in income. These capitalized long-lived assets could become impaired if our operating plans or business environment changes.
Intangible assets, including patents, technology, and trademarks, are carried at cost less accumulated amortization and impairment for intangibles with a definite life. Intangibles with definite lives are amortized using the straight-line method based on the estimated useful life of the intangible. Intangibles with indefinite lives, which consist primarily of corporate trade names, are not amortized, but are tested for impairment annually or whenever events or changes in circumstances indicate that impairment is possible.
We review our long-lived assets (“LLA”), including definite-lived intangible and right-of-use assets, for impairment when events or changes in circumstances indicate that their net book value may not be recovered over their remaining service lives. Indicators of possible impairment may include significant declines in activity levels in regions where specific assets or groups of assets are located, extended periods of idle use, declining revenue or cash flow or overall changes in general market conditions.
Whenever possible impairment is indicated, we compare the carrying value of the assets or asset groups to the sum of the estimated undiscounted future cash flows expected from use, plus salvage value, less the costs of the subsequent disposition of the assets. If impairment is still indicated, we compare the fair value of the assets to the carrying value and recognize an impairment loss for the amount by which the carrying value exceeds the fair value.
We did not record any material impairment charges relating to our long-lived assets and intangible assets with definite lives during the years ended December 31, 2024, 2023 and 2022.
The geopolitical conflict between Russia and Ukraine, which began in February 2022 and has continued through December 31, 2024, has resulted in disruptions to our operations in Russia and Ukraine. The Company’s operation, assets and facilities in Ukraine are immaterial. As of December 31, 2024, all laboratory facilities, offices, and locations in Russia continued to operate with no significant impact to local business operations. The Company evaluated LLA in Russia and Ukraine as part of our assessment of our assets group. Based on our assessments, we did not identify any triggering events and determined there was no impairment for LLA in Russia and Ukraine as of December 31, 2024.
We record goodwill as the excess of the purchase price over the fair value of the net assets acquired in acquisitions accounted for under the purchase method of accounting. Goodwill is not subject to amortization and is tested for impairment annually or more frequently if events or changes in circumstances indicate goodwill is more likely than not impaired. Goodwill is tested at the reporting until level. Our reporting units are the same as our two operating segments.
We assess intangibles with indefinite lives and goodwill for impairment either by performing a qualitative assessment or a quantitative test. The qualitative assessment is to determine whether the existence of events or circumstances leads to a determination that it is more likely than not that the fair value is less than carrying value. If it is concluded that it is more-likely-than not that an impairment exists, a quantitative test is required which compares the estimated fair value to carrying value. If the estimated fair value is less than carrying value, then there is an impairment loss limited to the carrying value. Significant judgments and assumptions are inherent in our estimate of future cash flows used to determine the estimate of fair value which include assumptions regarding future revenue growth rates, discount rates and expected margins.
We completed our annual impairment assessment of intangibles with indefinite lives and goodwill as of December 31, 2024 and 2023, by performing a qualitative assessment, which indicated we did not meet the threshold of more likely than not that there was an impairment and therefore no quantitative test was required.
Any subsequent impairment loss could result in a material adverse effect upon our financial position and results of operations.
Off-Balance Sheet Arrangements
We do not have any off-balance sheet financing arrangements such as securitization agreements, liquidity trust vehicles or special purpose entities. As such, we are not materially exposed to any financing, liquidity, market or credit risk that could arise if we had engaged in such financing arrangements.
Forward-Looking Statements
This Form 10-K and the documents incorporated in this Form 10-K by reference contain forward-looking statements within the meaning of Section 27A of the Securities Act of 1933 and Section 21E of the Exchange Act. These “forward-looking
statements” are based on an analysis of currently available competitive, financial and economic data and our operating plans. They are inherently uncertain and investors should recognize that events and actual results could turn out to be significantly different from our expectations. By way of illustration, when used in this document, words such as “anticipate”, “believe”, “expect”, “intend”, “estimate”, “project”, “will”, “should”, “could”, “may”, “predict” and similar expressions are intended to identify forward-looking statements. You are cautioned that actual results could differ materially from those anticipated in forward-looking statements. Any forward-looking statements, including statements regarding the intent, belief or current expectations of us or our management, are not guarantees of future performance and involve risks, uncertainties and assumptions about us and the industry in which we operate, including, among other things:
•our ability to continue to develop or acquire new and useful technology;
•the realization of anticipated synergies from acquired businesses and future acquisitions;
•our dependence on one industry, oil and gas, and the impact of commodity prices on the expenditure levels of our clients;
•competition in the markets we serve;
•the risks and uncertainties attendant to adverse industry, political, economic and financial market conditions, including stock prices, government regulations, interest rates and credit availability;
•unsettled political conditions, war, civil unrest, currency controls and governmental actions in the numerous countries in which we operate;
•changes in the price of oil and natural gas;
•major outbreak of global pandemic and restricting mobilization of field personnel;
•weather and seasonal factors;
•integration of acquired businesses; and
•the effects of industry consolidation.
Our business depends, to a large degree, on the level of spending by oil and gas companies for exploration, development and production activities. Therefore, a sustained increase or decrease in the oil and natural gas commodity prices, which could have a material impact on exploration, development and production activities, could also materially affect our financial position, results of operations and cash flows.
The above description of risks and uncertainties is by no means all-inclusive, but is designed to highlight what we believe are important factors to consider. For a more detailed description of risk factors, please see “Item 1A. Risk Factors” in this Form 10-K and our reports and registration statements filed from time to time with the SEC.
All forward-looking statements in this Form 10-K are based on information available to us on the date of this Form 10-K. We do not intend to update or revise any forward-looking statements that we may make in this Form 10-K or other documents, reports, filings or press releases, whether as a result of new information, future events or otherwise, unless required by law.
Recent Accounting Pronouncements
See Note 2 – Summary of Significant Accounting Policies of the Notes to the Consolidated Financial Statements for further discussion of accounting standards adopted during the year and to be adopted in future periods.
ITEM 7A. QUANTITATIVE AND QUALITATIVE DISCLOSURES ABOUT MARKET RISK
Market Risk
We are exposed to market risk, which is the potential loss arising from adverse changes in market prices and rates. We do not believe that our exposure to market risks, which is primarily related to interest rate changes, is material.
Interest Rate Risk
We maintain certain debt instruments at a fixed rate whose fair value will fluctuate based on changes in interest rates and market perception of our credit risk. The fair value of our debt at December 31, 2024 and 2023 approximated the book value.
Under the Amended Credit Facility, the Secured Overnight Financing Rate (“SOFR”) plus 2.00% to SOFR plus 3.00% will be applied to outstanding borrowings. At December 31, 2024, we had an outstanding borrowings of $18 million. A 10% change in interest rates would not have a material impact on our results of operations or cash flows.
Foreign Currency Risk
We operate in a number of international areas which exposes us to foreign currency exchange rate risk. We do not currently hold or issue forward exchange contracts or other derivative instruments for hedging or speculative purposes. Foreign exchange gains and losses are the result of fluctuations in the U.S. dollar (“USD”) against foreign currencies and are included in other (income) expense, net in the consolidated statements of operations. We recognize foreign exchange losses in countries where the USD weakens against the local currency and we have net monetary liabilities denominated in the local currency, as well as in countries where the USD strengthens against the local currency and we have net monetary assets denominated in the local currency. We recognize foreign exchange gains in countries where the USD strengthens against the local currency and we have net monetary liabilities denominated in the local currency and in countries where the USD weakens against the local currency and we have net monetary assets denominated in the local currency.
Credit Risk
Our financial instruments that potentially subject us to concentrations of credit risk consist primarily of cash and cash equivalents and accounts receivable. Substantially all cash and cash equivalents are on deposit at commercial banks or investment firms. Our trade receivables are with a variety of domestic, international and national oil and gas companies. Management considers this credit risk to be limited due to the creditworthiness and financial resources of these financial institutions and companies.
ITEM 8. FINANCIAL STATEMENTS AND SUPPLEMENTARY DATA
For the financial statements and supplementary data required by this Item 8, see Part IV “Item 15. Exhibits and Financial Statement Schedules.”
ITEM 9. CHANGES IN AND DISAGREEMENTS WITH ACCOUNTANTS ON ACCOUNTING AND FINANCIAL DISCLOSURE
None.
ITEM 9A. CONTROLS AND PROCEDURES
Disclosure Controls and Procedures
Our management, under the supervision of and with the participation of our Chief Executive Officer and Chief Financial Officer, has evaluated the effectiveness of our disclosure controls and procedures, as such term is defined in Rules 13a-15(e) and 15d-15(e) under the Exchange Act, as of the end of the period covered by this report. Our disclosure controls and procedures are designed to provide reasonable assurance that the information required to be disclosed by us in our reports filed or submitted under the Exchange Act is accumulated and communicated to management, including our Chief Executive Officer and Chief Financial Officer, as appropriate, to allow timely decisions regarding required disclosure and is recorded, processed, summarized and reported within the time periods specified in the rules and forms of the SEC. Based on such evaluation, our Chief Executive Officer and Chief Financial Officer have concluded that our disclosure controls and procedures were effective as of December 31, 2024 at the reasonable assurance level.
Our management does not expect that our disclosure controls and procedures or our internal control over financial reporting will prevent all errors and all fraud. Further, the design of disclosure controls and internal control over financial reporting must reflect the fact that there are resource constraints, and the benefits of controls must be considered relative to their costs. Because of the inherent limitations in all control systems, no evaluation of controls can provide absolute assurance that all control issues and instances of fraud, if any, within a company have been detected.
Management’s Report on Internal Control over Financial Reporting
Our management is responsible for establishing and maintaining adequate internal control over financial reporting, as that term is defined in Rules 13a-15(f) and 15d-15(f) of the Exchange Act. Our internal control over financial reporting is a process designed to provide reasonable assurance regarding the reliability of financial reporting and the preparation of financial statements for external purposes in accordance with U.S. GAAP.
Because of its inherent limitations, internal control over financial reporting may not prevent or detect misstatements. Also, projections of any evaluation of effectiveness to future periods are subject to the risk that controls may become inadequate because of changes in conditions, or that the degree of compliance with the policies or procedures may deteriorate.
Our management, under the supervision of and with the participation of our Chief Executive Officer and Chief Financial Officer, conducted an evaluation of our internal control over financial reporting as of December 31, 2024. In making this assessment, management used the criteria set forth in Internal Control − Integrated Framework (2013) issued by the Committee of Sponsoring Organizations of the Treadway Commission. Based on this assessment using these criteria, our management determined that our internal control over financial reporting was effective as of December 31, 2024.
The effectiveness of our internal control over financial reporting as of December 31, 2024, has been audited by KPMG LLP, an independent registered public accounting firm, as stated in their report which appears herein.
Changes in Internal Control over Financial Reporting
There was no change in our system of internal control over financial reporting, as such term is defined in Rules 13a-15(f) and 15d-15(f) under the Exchange Act, during our fiscal quarter ended December 31, 2024 that has materially affected, or is reasonably likely to materially affect, our internal control over financial reporting.
ITEM 9B. OTHER INFORMATION
During our fiscal quarter ended December 31, 2024, no director or officer of the Company adopted, modified or terminated any “Rule 10b5-1 trading arrangement” or “non-Rule 10b5-1 trading arrangement” within the meaning of Item 408(a) of Regulation S-K.
ITEM 9C. DISCLOSURE REGARDING FOREIGN JURISDICTIONS THAT PREVENT INSPECTIONS
None.
PART III
The information required by Part III (Items 10 through 14) is incorporated by reference from our definitive proxy statement (the “2025 Proxy Statement”) to be filed in connection with our 2025 annual meeting of shareholders pursuant to Regulation 14A under the Exchange Act. We expect to file our definitive proxy statement with the SEC within 120 days after the close of the year ended December 31, 2024.
ITEM 10. DIRECTORS, EXECUTIVE OFFICERS AND CORPORATE GOVERNANCE
Incorporated by reference to the definitive Proxy Statement for the 2025 Annual Meeting of Shareholders.
Core Lab has a Code of Ethics and Corporate Responsibility that applies to all of its directors, officers and employees, including its principal executive, financial and accounting officers, or persons performing similar functions. Core Lab’s Code of Ethics and Corporate Responsibility is posted on its website at www.corelab.com/sustainability/governance/our-ethics-program.pdf.
Core Lab has adopted an Insider Trading Policy that governs the purchase, sale, and/or other disposition of our securities by our directors, officers, and employees designed to promote compliance with insider trading laws, rules, and regulations, and any listing standards applicable to us. A copy of our Insider Trading Policy, as amended to date, is filed as Exhibit 19.1 to this Annual Report.
ITEM 11. EXECUTIVE COMPENSATION
The information set forth under the captions “Compensation Discussion and Analysis” and “Information About our Named Executive Officers and Executive Compensation” in Core Lab’s 2025 Proxy Statement is incorporated herein by reference.
ITEM 12. SECURITY OWNERSHIP OF CERTAIN BENEFICIAL OWNERS AND MANAGEMENT AND RELATED STOCKHOLDER MATTERS
The information under the captions “Ownership of Securities—Security Ownership by Certain Beneficial Owners and Management” and “Compensation Discussion and Analysis—2024 Compensation Program Details” in Core Lab’s 2025 Proxy Statement is incorporated herein by reference.
ITEM 13. CERTAIN RELATIONSHIPS AND RELATED TRANSACTIONS AND DIRECTOR INDEPENDENCE
The information under the captions “Information About our Directors and Director Compensation—Director Independence” and “Information About our Directors and Director Compensation—Related Person Transactions” in Core Lab’s 2025 Proxy Statement is incorporated herein by reference.
ITEM 14. PRINCIPAL ACCOUNTANT FEES AND SERVICES
Our independent registered public accounting firm is KPMG LLP, Houston, TX, Auditor Firm ID: 185.
The information under the caption “Information About our Independent Registered Public Accounting Firm” in Core Lab’s 2025 Proxy Statement is incorporated herein by reference.
PART IV
ITEM 15. EXHIBITS AND FINANCIAL STATEMENT SCHEDULES
1. The following reports, financial statements and schedules are filed herewith on the pages indicated:
2. Financial Statement Schedule
Schedule II - Valuation and Qualifying Account
The exhibits listed in the accompanying “Index to Exhibits” are incorporated by reference to the filing indicated or are filed herewith.
ITEM 16. FORM 10-K SUMMARY
Not applicable.
INDEX TO EXHIBITS
| | | | |
Exhibit No. | | Exhibit Title | | Incorporated by Reference from the Following Documents |
3.1 | | Core Laboratories Inc. Certificate of Incorporation | | Form 8-K, May 1, 2023 (File No. 001-41695) |
| | | | |
3.2 | | Core Laboratories Inc. Bylaws | | Form 8-K, May 1, 2023 (File No. 001-41695) |
| | | | |
4.1 | | Description of Registrant’s Securities Registered Pursuant to Section 12 of the Securities Exchange Act of 1934 | | Filed Herewith |
| | | | |
10.1 | | Core Laboratories Inc. 2024 Long-Term Incentive Plan (1) | | Appendix A to Definitive Proxy Statement dated March 18, 2024 for Annual Meeting of Shareholders (File No. 001-41695) |
| | | | |
10.2 | | Core Laboratories Inc. 2023 Non-Employee Director Stock Incentive Plan (as amended and restated effective as of June 28, 2023) (1) | | Appendix A to Definitive Proxy Statement dated April 28, 2023 for Annual Meeting of Shareholders (File No. 001-14273) |
| | | | |
10.3 | | Core Laboratories Supplemental Executive Retirement Plan effective as of January 1, 1998 (1) | | Form 10-K, March 31, 1998 (File No. 000-26710) |
| | | | |
10.4 | | Amendment to Core Laboratories Supplemental Executive Retirement Plan, effective July 29, 1999 (1) | | Form 10-Q, August 16, 1999 (File No. 001-14273) |
| | | | |
10.5 | | Amendment to Core Laboratories Supplemental Executive Retirement Plan, effective February 28, 2003 (1) | | Form 10-Q, May 15, 2003 (File No. 001-14273) |
| | | | |
10.6 | | Amendment to Core Laboratories Supplemental Executive Retirement Plan dated as of March 5, 2008 (1) | | Form 10-Q, May 12, 2008 (File No. 001-14273) |
| | | | |
10.7 | | Form of Restricted Share Award Program Agreement (1) | | Form 10-K, February 20, 2007 (File No. 001-14273) |
| | | | |
10.8 | | Form of Core Laboratories 2023 Non-Employee Director Restricted Share Award Program Agreement (1) | | Form 10-K, February 15, 2024 (File No. 001-41695) |
| | | | |
10.9 | | Form of Core Laboratories 2020 Performance Share Award Program Agreement (ROIC Based) (1) | | Form 10-K, February 15, 2024 (File No. 001-41695) |
| | | | |
10.10 | | Eighth Amended and Restated Credit Agreement, dated as of July 25, 2022, among Core Laboratories N.V., and Core Laboratories (U.S.) Interests Holdings, Inc., and the lenders party thereto and Bank of America, N.A., as administrative agent and Wells Fargo Bank, N.A., as syndication agent and Comerica Bank, as documentation agent. | | Form 8-K, July 27, 2022 (File No. 001-14273) |
| | | | |
10.11 | | Amendment No. 1 to Eighth Amended and Restated Credit Agreement, dated as of April 28, 2023, among Core Laboratories N.V., and Core Laboratories (U.S.) Interests Holdings, Inc. and the lenders party thereto and Bank of America, N.A., as administrative agent | | Form 8-K, May 1, 2023 (File No. 001-41695) |
| | | | |
10.12 | | Assumption and Reaffirmation Agreement, dated May 1, 2023, by and between Core Laboratories Inc. and Bank of America, N.A. | | Form 8-K, May 1, 2023 (File No. 001-41695) |
| | | | |
10.13 | | Master Note Purchase Agreement, dated as of September 30, 2011 | | Form 8-K, September 30, 2011 (File No. 001-14273) |
| | | | |
10.14 | | Amendment No. 2 to Master Note Purchase Agreement and Assumption Agreement, dated as of May 1, 2023 | | Form 8-K, May 1, 2023 (File No. 001-41695) |
| | | | |
10.15 | | Amendment No. 2 to Note Purchase Agreement and Assumption Agreement, dated as of May 1, 2023 | | Form 8-K, May 1, 2023 (File No. 001-41695) |
| | | | |
| | | | |
10.16 | | Note Purchase Agreement, dated as of May 4, 2023 | | Form 8-K, May 4, 2023 (File No. 001-41695) |
| | | | |
10.17 | | Employment Agreement between Core Laboratories N.V. and Lawrence V. Bruno, dated March 1, 2019 (1) | | Form 8-K, March 6, 2019 (File No. 001-14273) |
| | | | |
10.18 | | Employment Agreement between Core Laboratories N.V. and Christopher S. Hill, dated March 1, 2019 (1) | | Form 8-K, March 6, 2019 (File No. 001-14273) |
| | | | |
10.19 | | Employment Agreement between Core Laboratories N.V. and Gwendolyn Y. Schreffler, dated March 1, 2019 (1) | | Form 10-K, February 8, 2021 (File No. 001-14273) |
| | | | |
10.20 | | Note Purchase Agreement, dated as of October 16, 2020. | | Form 8-K, October 16, 2020 (File No. 001-14273) |
| | | | |
10.21 | | Amendment to Employment Agreement, by and between Core Laboratories N.V. and Lawrence V. Bruno, dated March 1, 2020 (1). | | Form 8-K, March 5, 2020 (File No. 001-14273) |
| | | | |
10.22 | | Employment Agreement, by and between Core Laboratories N.V. and Mark D. Tattoli, dated October 18, 2021 (1) | | Form 8-K, October 19, 2021 (File No. 001-14273) |
| | | | |
10.23 | | Amended and Restated Employment Agreement, by and between Core Laboratories Inc. and Lawrence V. Bruno, dated February 1, 2024 (1) | | Form 10-K, February 15, 2024 (File No. 001-41695) |
| | | | |
10.24 | | Amended and Restated Employment Agreement, by and between Core Laboratories Inc. and Christopher S. Hill, dated February 1, 2024 (1) | | Form 10-K, February 15, 2024 (File No. 001-41695) |
| | | | |
10.25 | | Amended and Restated Employment Agreement, by and between Core Laboratories Inc. and Gwendolyn Y. Gresham, dated February 1, 2024 (1) | | Form 10-K, February 15, 2024 (File No. 001-41695) |
| | | | |
10.26 | | Amended and Restated Employment Agreement, by and between Core Laboratories Inc. and Mark D. Tattoli, dated February 1, 2024 (1) | | Form 10-K, February 15, 2024 (File No. 001-41695) |
| | | | |
19.1 | | Insider Trading Policy | | Filed Herewith |
| | | | |
21.1 | | Significant Subsidiaries of the Registrant | | Filed Herewith |
| | | | |
23.1 | | Consent of KPMG LLP | | Filed Herewith |
| | | | |
31.1 | | Certification of Chief Executive Officer Pursuant to Rule 13a-14 of the Securities Exchange Act of 1934, As Adopted Pursuant to Section 302 of the Sarbanes-Oxley Act of 2002 | | Filed Herewith |
| | | | |
31.2 | | Certification of Chief Financial Officer Pursuant to Rule 13a-14 of the Securities Exchange Act of 1934, As Adopted Pursuant to Section 302 of the Sarbanes-Oxley Act of 2002 | | Filed Herewith |
| | | | |
32.1 | | Certification of Chief Executive Officer Pursuant to 18 U.S.C. Section 1350, As Adopted Pursuant to Section 906 of the Sarbanes-Oxley Act of 2002 | | Filed Herewith |
| | | | |
32.2 | | Certification of Chief Financial Officer Pursuant to 18 U.S.C. Section 1350, As Adopted Pursuant to Section 906 of the Sarbanes-Oxley Act of 2002 | | Filed Herewith |
| | | | |
97.1 | | Core Laboratories Inc. Incentive Compensation Recoupment Policy | | Form 10-K, February 15, 2024 (File No. 001-41695) |
| | | | |
101.INS | | Inline XBRL Instance Document- the instance document does not appear in the Interactive Data File because its XBRL tags are embedded within the Inline XBRL document. | | Filed Herewith |
101.SCH | | Inline XBRL Taxonomy Extension Schema with Embedded Linkbases Document | | Filed Herewith |
104 | | Cover Page Interactive Data File (embedded within the Inline XBRL document). | | Filed Herewith |
| | | | |
(1) Management contracts or compensatory plans or arrangements.
SIGNATURES
Pursuant to the requirements of Section 13 or 15(d) of the Securities Exchange Act of 1934, the Registrant has duly caused this report to be signed on its behalf by the undersigned, thereunto duly authorized.
| | | |
| | | CORE LABORATORIES INC. |
| | | |
Date: | February 12, 2025 | By: | /s/ LAWRENCE BRUNO |
| | | Lawrence Bruno |
| | | Chief Executive Officer, Chairman, President and Director |
Pursuant to the requirements of the Securities Exchange Act of 1934, this report has been signed below by the following persons on behalf of the Registrant and in the capacities indicated, on the 12th day of February 2025.
| | |
| Signature | |
| | |
| | |
/s/ LAWRENCE BRUNO | | /s/ CHRISTOPHER S. HILL |
Lawrence Bruno | | Christopher S. Hill |
Chief Executive Officer, Chairman, | | Senior Vice President and |
President and Director | | Chief Financial Officer |
| | |
| | |
/s/ SOW HANG TEO | | /s/ CURTIS ANASTASIO |
Sow Hang Teo | | Curtis Anastasio |
Vice President, Treasurer and | | Director |
Chief Accounting Officer | | |
| | |
| | |
/s/ MARTHA Z. CARNES | | /s/ HARVEY KLINGENSMITH |
Martha Z. Carnes | | Harvey Klingensmith |
Director | | Director |
| | |
| | |
/s/ KATHERINE A. MURRAY | | /s/ MICHAEL STRAUGHEN |
Katherine A. Murray | | Michael Straughen |
Director | | Director |
| | |
| | |
/s/ KWAKU TEMENG | | |
Kwaku Temeng | | |
Director | | |
Report of Independent Registered Public Accounting Firm
To the Shareholders and Board of Directors
Core Laboratories Inc.:
Opinion on the Consolidated Financial Statements
We have audited the accompanying consolidated balance sheets of Core Laboratories Inc and subsidiaries (the Company) as of December 31, 2024 and 2023, the related consolidated statements of operations, comprehensive income, changes in equity, and cash flows for each of the years in the three-year period ended December 31, 2024, and the related notes and financial statement schedule II (collectively, the consolidated financial statements). In our opinion, the consolidated financial statements present fairly, in all material respects, the financial position of the Company as of December 31, 2024 and 2023, and the results of its operations and its cash flows for each of the years in the three-year period ended December 31, 2024, in conformity with U.S. generally accepted accounting principles.
We also have audited, in accordance with the standards of the Public Company Accounting Oversight Board (United States) (PCAOB), the Company’s internal control over financial reporting as of December 31, 2024, based on criteria established in Internal Control – Integrated Framework (2013) issued by the Committee of Sponsoring Organizations of the Treadway Commission, and our report dated February 12, 2025 expressed an unqualified opinion on the effectiveness of the Company’s internal control over financial reporting.
Basis for Opinion
These consolidated financial statements are the responsibility of the Company’s management. Our responsibility is to express an opinion on these consolidated financial statements based on our audits. We are a public accounting firm registered with the PCAOB and are required to be independent with respect to the Company in accordance with the U.S. federal securities laws and the applicable rules and regulations of the Securities and Exchange Commission and the PCAOB.
We conducted our audits in accordance with the standards of the PCAOB. Those standards require that we plan and perform the audit to obtain reasonable assurance about whether the consolidated financial statements are free of material misstatement, whether due to error or fraud. Our audits included performing procedures to assess the risks of material misstatement of the consolidated financial statements, whether due to error or fraud, and performing procedures that respond to those risks. Such procedures included examining, on a test basis, evidence regarding the amounts and disclosures in the consolidated financial statements. Our audits also included evaluating the accounting principles used and significant estimates made by management, as well as evaluating the overall presentation of the consolidated financial statements. We believe that our audits provide a reasonable basis for our opinion.
Critical Audit Matter
The critical audit matter communicated below is a matter arising from the current period audit of the consolidated financial statements that was communicated or required to be communicated to the audit committee and that: (1) relates to accounts or disclosures that are material to the consolidated financial statements and (2) involved our especially challenging, subjective, or complex judgments. The communication of a critical audit matter does not alter in any way our opinion on the consolidated financial statements, taken as a whole, and we are not, by communicating the critical audit matter below, providing a separate opinion on the critical audit matter or on the accounts or disclosures to which it relates.
Evaluation of income tax expense
As discussed in Note 9 to the consolidated financial statements, the Company recorded deferred tax assets, net of $69.6 million and deferred tax liabilities, net of $13.8 million as of December 31, 2024, and income tax expense of $14.0 million for the year then ended. The Company serves international markets and is subject to income taxes in the U.S. and foreign jurisdictions, which affect the Company’s income tax expense.
We identified the evaluation of income tax expense as a critical audit matter. Complex auditor judgment was required in evaluating the Company’s interpretation and application of U.S. tax laws and the related impacts to income tax expense. There was complexity in the evaluation of the U.S. tax on Subpart F income and global intangible low-taxed income (GILTI), and the Company’s calculations were based on interpretations of complex income tax regulations.
The following are the primary procedures we performed to address this critical audit matter. We evaluated the design and tested the operating effectiveness of certain internal controls over the Company’s income tax expense process, including controls over
the Company’s determination of Subpart F income and GILTI. We involved tax professionals with specialized skills and knowledge who assisted in:
• evaluating the Company’s application of U.S. tax laws to its legal entity structure and the effect on the Company’s income tax provision
• assessing the accuracy of the Company’s calculations of current period income tax expense and deductions associated with Subpart F income and GILTI.
/s/ KPMG LLP
We have served as the Company’s auditor since 2015.
Houston, Texas
February 12, 2025
Report of Independent Registered Public Accounting Firm
To the Shareholders and Board of Directors
Core Laboratories Inc.:
Opinion on Internal Control Over Financial Reporting
We have audited Core Laboratories Inc. and subsidiaries' (the Company) internal control over financial reporting as of December 31, 2024, based on criteria established in Internal Control – Integrated Framework (2013) issued by the Committee of Sponsoring Organizations of the Treadway Commission. In our opinion, the Company maintained, in all material respects, effective internal control over financial reporting as of December 31, 2024, based on criteria established in Internal Control – Integrated Framework (2013) issued by the Committee of Sponsoring Organizations of the Treadway Commission.
We also have audited, in accordance with the standards of the Public Company Accounting Oversight Board (United States) (PCAOB), the consolidated balance sheets of the Company as of December 31, 2024 and 2023, the related consolidated statements of operations, comprehensive income, changes in equity, and cash flows for each of the years in the three-year period ended December 31, 2024, and the related notes and financial statement schedule II (collectively, the consolidated financial statements), and our report dated February 12, 2025 expressed an unqualified opinion on those consolidated financial statements.
Basis for Opinion
The Company’s management is responsible for maintaining effective internal control over financial reporting and for its assessment of the effectiveness of internal control over financial reporting, included in the accompanying Management's Report on Internal Control over Financial Reporting. Our responsibility is to express an opinion on the Company’s internal control over financial reporting based on our audit. We are a public accounting firm registered with the PCAOB and are required to be independent with respect to the Company in accordance with the U.S. federal securities laws and the applicable rules and regulations of the Securities and Exchange Commission and the PCAOB.
We conducted our audit in accordance with the standards of the PCAOB. Those standards require that we plan and perform the audit to obtain reasonable assurance about whether effective internal control over financial reporting was maintained in all material respects. Our audit of internal control over financial reporting included obtaining an understanding of internal control over financial reporting, assessing the risk that a material weakness exists, and testing and evaluating the design and operating effectiveness of internal control based on the assessed risk. Our audit also included performing such other procedures as we considered necessary in the circumstances. We believe that our audit provides a reasonable basis for our opinion.
Definition and Limitations of Internal Control Over Financial Reporting
A company’s internal control over financial reporting is a process designed to provide reasonable assurance regarding the reliability of financial reporting and the preparation of financial statements for external purposes in accordance with generally accepted accounting principles. A company’s internal control over financial reporting includes those policies and procedures that (1) pertain to the maintenance of records that, in reasonable detail, accurately and fairly reflect the transactions and dispositions of the assets of the company; (2) provide reasonable assurance that transactions are recorded as necessary to permit preparation of financial statements in accordance with generally accepted accounting principles, and that receipts and expenditures of the company are being made only in accordance with authorizations of management and directors of the company; and (3) provide reasonable assurance regarding prevention or timely detection of unauthorized acquisition, use, or disposition of the company’s assets that could have a material effect on the financial statements.
Because of its inherent limitations, internal control over financial reporting may not prevent or detect misstatements. Also, projections of any evaluation of effectiveness to future periods are subject to the risk that controls may become inadequate because of changes in conditions, or that the degree of compliance with the policies or procedures may deteriorate.
/s/ KPMG LLP
Houston, Texas
February 12, 2025
CORE LABORATORIES INC.
CONSOLIDATED BALANCE SHEETS
December 31, 2024 and 2023
(In thousands, except share and per share data)
| | | | | | | | |
| | 2024 | | | 2023 | |
ASSETS | | | | | | |
CURRENT ASSETS: | | | | | | |
Cash and cash equivalents | | $ | 19,157 | | | $ | 15,120 | |
Accounts receivable, net of allowance for credit losses of
$3,192 and $2,280 at 2024 and 2023, respectively | | | 111,761 | | | | 109,352 | |
Inventories | | | 59,402 | | | | 71,702 | |
Prepaid expenses | | | 10,176 | | | | 8,153 | |
Income taxes receivable | | | 15,594 | | | | 13,716 | |
Other current assets | | | 10,516 | | | | 5,093 | |
TOTAL CURRENT ASSETS | | | 226,606 | | | | 223,136 | |
PROPERTY, PLANT AND EQUIPMENT, net of accumulated depreciation of
$314,317 and $315,796 at 2024 and 2023, respectively | | | 97,063 | | | | 99,626 | |
RIGHT OF USE ASSETS | | | 56,488 | | | | 53,842 | |
INTANGIBLES, net of accumulated amortization and impairment of
$19,326 and $18,825 at 2024 and 2023, respectively | | | 6,403 | | | | 6,926 | |
GOODWILL | | | 99,445 | | | | 99,445 | |
DEFERRED TAX ASSETS, net | | | 69,613 | | | | 69,201 | |
OTHER ASSETS | | | 34,788 | | | | 34,219 | |
TOTAL ASSETS | | $ | 590,406 | | | $ | 586,395 | |
LIABILITIES AND EQUITY | | | | | | |
CURRENT LIABILITIES: | | | | | | |
Accounts payable | | $ | 34,549 | | | $ | 33,506 | |
Accrued payroll and related costs | | | 22,901 | | | | 18,791 | |
Taxes other than payroll and income | | | 7,106 | | | | 5,939 | |
Unearned revenues | | | 9,332 | | | | 4,755 | |
Operating lease liabilities | | | 10,690 | | | | 10,175 | |
Income taxes payable | | | 4,851 | | | | 7,280 | |
Other current liabilities | | | 8,157 | | | | 7,651 | |
TOTAL CURRENT LIABILITIES | | | 97,586 | | | | 88,097 | |
LONG-TERM DEBT, net | | | 126,111 | | | | 163,134 | |
LONG-TERM OPERATING LEASE LIABILITIES | | | 43,343 | | | | 42,076 | |
DEFERRED COMPENSATION | | | 31,115 | | | | 30,544 | |
DEFERRED TAX LIABILITIES, net | | | 13,783 | | | | 12,697 | |
OTHER LONG-TERM LIABILITIES | | | 20,732 | | | | 20,040 | |
COMMITMENTS AND CONTINGENCIES | | | | | | |
EQUITY: | | | | | | |
Preference stock, 6,000,000 shares authorized, $0.01 par value;
none issued or outstanding | | | — | | | | — | |
Common stock, 200,000,000 shares authorized, $0.01 par value,
46,966,868 issued and 46,826,820 outstanding at 2024;
46,938,557 issued and 46,856,536 outstanding at 2023 | | | 470 | | | | 469 | |
Additional paid-in capital | | | 109,547 | | | | 110,011 | |
Retained earnings | | | 150,280 | | | | 120,756 | |
Accumulated other comprehensive income (loss) | | | (5,769 | ) | | | (4,972 | ) |
Treasury stock (at cost), 140,048 and 82,021 at 2024 and 2023, respectively | | | (2,537 | ) | | | (1,449 | ) |
Total Core Laboratories Inc. shareholders' equity | | | 251,991 | | | | 224,815 | |
Non-controlling interest | | | 5,745 | | | | 4,992 | |
TOTAL EQUITY | | | 257,736 | | | | 229,807 | |
TOTAL LIABILITIES AND EQUITY | | $ | 590,406 | | | $ | 586,395 | |
The accompanying notes are an integral part of these Consolidated Financial Statements.
CORE LABORATORIES INC.
CONSOLIDATED STATEMENTS OF OPERATIONS
For the Years Ended December 31, 2024, 2023 and 2022
(In thousands, except per share data)
| | | | | | | | | | | | |
| | 2024 | | | 2023 | | | 2022 | |
REVENUE: | | | | | | | | | |
Services | | $ | 388,205 | | | $ | 371,914 | | | $ | 346,974 | |
Product sales | | | 135,643 | | | | 137,876 | | | | 142,761 | |
Total revenue | | | 523,848 | | | | 509,790 | | | | 489,735 | |
OPERATING EXPENSES: | | | | | | | | | |
Cost of services, exclusive of depreciation expense shown below | | | 297,324 | | | | 282,135 | | | | 274,297 | |
Cost of product sales, exclusive of depreciation expense shown below | | | 123,198 | | | | 117,822 | | | | 119,358 | |
General and administrative expense, exclusive of depreciation
expense shown below | | | 39,770 | | | | 40,259 | | | | 38,117 | |
Depreciation | | | 14,449 | | | | 15,294 | | | | 16,476 | |
Amortization | | | 504 | | | | 490 | | | | 685 | |
Other (income) expense, net | | | (9,953 | ) | | | (850 | ) | | | (722 | ) |
OPERATING INCOME | | | 58,556 | | | | 54,640 | | | | 41,524 | |
Interest expense | | | 12,369 | | | | 13,430 | | | | 11,570 | |
Income before income taxes | | | 46,187 | | | | 41,210 | | | | 29,954 | |
Income tax expense | | | 14,034 | | | | 4,185 | | | | 10,296 | |
Net income | | | 32,153 | | | | 37,025 | | | | 19,658 | |
Net income attributable to non-controlling interest | | | 753 | | | | 350 | | | | 205 | |
Net income attributable to Core Laboratories Inc. | | $ | 31,400 | | | $ | 36,675 | | | $ | 19,453 | |
| | | | | | | | | |
EARNINGS PER SHARE INFORMATION: | | | | | | | | | |
Basic earnings per share | | $ | 0.69 | | | $ | 0.79 | | | $ | 0.42 | |
Basic earnings per share attributable to Core Laboratories Inc. | | $ | 0.67 | | | $ | 0.79 | | | $ | 0.42 | |
| | | | | | | | | |
Diluted earnings per share | | $ | 0.67 | | | $ | 0.78 | | | $ | 0.42 | |
Diluted earnings per share attributable to Core Laboratories Inc. | | $ | 0.66 | | | $ | 0.77 | | | $ | 0.42 | |
| | | | | | | | | |
WEIGHTED AVERAGE COMMON SHARES OUTSTANDING: | | | | | | | | | |
Basic | | | 46,897 | | | | 46,683 | | | | 46,334 | |
Diluted | | | 47,685 | | | | 47,523 | | | | 46,813 | |
The accompanying notes are an integral part of these Consolidated Financial Statements.
CORE LABORATORIES INC.
CONSOLIDATED STATEMENTS OF COMPREHENSIVE INCOME
For the Years Ended December 31, 2024, 2023 and 2022
(In thousands)
| | | | | | | | | | | | |
| | 2024 | | | 2023 | | | 2022 | |
Net income | | $ | 32,153 | | | $ | 37,025 | | | $ | 19,658 | |
Other comprehensive income (loss): | | | | | | | | | |
Interest rate swaps: | | | | | | | | | |
Gain on fair value of interest rate swaps | | | — | | | | — | | | | 6,015 | |
Interest rate swap amount reclassified to net income | | | (1,040 | ) | | | (492 | ) | | | 998 | |
Income tax (expense) benefit on interest rate swaps reclassified to net income | | | 219 | | | | 103 | | | | (1,144 | ) |
Total interest rate swaps | | | (821 | ) | | | (389 | ) | | | 5,869 | |
Pension and other postretirement benefit plans: | | | | | | | | | |
Amortization of actuarial gain (loss) reclassified to net income | | | 32 | | | | (1,130 | ) | | | 603 | |
Income tax (expense) benefit on pension and other postretirement benefit plans reclassified to net income | | | (8 | ) | | | 324 | | | | (116 | ) |
Total pension and other postretirement benefit plans | | | 24 | | | | (806 | ) | | | 487 | |
Total other comprehensive income (loss) | | | (797 | ) | | | (1,195 | ) | | | 6,356 | |
Comprehensive income | | | 31,356 | | | | 35,830 | | | | 26,014 | |
Comprehensive income attributable to non-controlling interests | | | 753 | | | | 350 | | | | 205 | |
Comprehensive income attributable to Core Laboratories Inc. | | $ | 30,603 | | | $ | 35,480 | | | $ | 25,809 | |
The accompanying notes are an integral part of these Consolidated Financial Statements.
CORE LABORATORIES INC.
CONSOLIDATED STATEMENTS OF CHANGES IN EQUITY
For the Years Ended December 31, 2024, 2023 and 2022
(In thousands, except share and per share data)
| | | | | | | | | | | | |
| | 2024 | | | 2023 | | | 2022 | |
Common Stock | | | | | | | | | |
Balance at Beginning of Period | | $ | 469 | | | $ | 1,194 | | | $ | 1,188 | |
New share issuance | | | 1 | | | | 2 | | | | 6 | |
Change in par value | | | — | | | | (727 | ) | | | — | |
Balance at End of Period | | $ | 470 | | | $ | 469 | | | $ | 1,194 | |
Additional Paid-In Capital | | | | | | | | | |
Balance at Beginning of Period | | $ | 110,011 | | | $ | 102,254 | | | $ | 101,120 | |
New share issuance | | | (1 | ) | | | (2 | ) | | | (6 | ) |
Change in par value and equity related transactions | | | — | | | | (4,097 | ) | | | — | |
Stock-based compensation | | | (463 | ) | | | 11,856 | | | | 1,140 | |
Balance at End of Period | | $ | 109,547 | | | $ | 110,011 | | | $ | 102,254 | |
Retained Earnings | | | | | | | | | |
Balance at Beginning of Period | | $ | 120,756 | | | $ | 85,949 | | | $ | 68,349 | |
Dividends paid | | | (1,876 | ) | | | (1,868 | ) | | | (1,853 | ) |
Net income attributable to Core Laboratories Inc. | | | 31,400 | | | | 36,675 | | | | 19,453 | |
Balance at End of Period | | $ | 150,280 | | | $ | 120,756 | | | $ | 85,949 | |
Accumulated Other Comprehensive Income (Loss) | | | | | | | | | |
Balance at Beginning of Period | | $ | (4,972 | ) | | $ | (3,777 | ) | | $ | (10,133 | ) |
Interest rate swaps, net of income taxes | | | (821 | ) | | | (389 | ) | | | 5,869 | |
Pension and other postretirement benefit plans, net of income taxes | | | 24 | | | | (806 | ) | | | 487 | |
Balance at End of Period | | $ | (5,769 | ) | | $ | (4,972 | ) | | $ | (3,777 | ) |
Treasury Stock | | | | | | | | | |
Balance at Beginning of Period | | $ | (1,449 | ) | | $ | (1,362 | ) | | $ | (4,075 | ) |
Stock-based compensation | | | 4,218 | | | | 2,115 | | | | 6,616 | |
Repurchase of common stock | | | (5,306 | ) | | | (2,202 | ) | | | (3,903 | ) |
Balance at End of Period | | $ | (2,537 | ) | | $ | (1,449 | ) | | $ | (1,362 | ) |
Non-Controlling Interest | | | | | | | | | |
Balance at Beginning of Period | | $ | 4,992 | | | $ | 4,696 | | | $ | 4,552 | |
Non-controlling interest dividends | | | — | | | | (54 | ) | | | (61 | ) |
Net income attributable to non-controlling interest | | | 753 | | | | 350 | | | | 205 | |
Balance at End of Period | | $ | 5,745 | | | $ | 4,992 | | | $ | 4,696 | |
Total Equity | | | | | | | | | |
Balance at Beginning of Period | | $ | 229,807 | | | $ | 188,954 | | | $ | 161,001 | |
New share issuance | | | — | | | | — | | | | — | |
Change in par value and equity related transactions | | | — | | | | (4,824 | ) | | | — | |
Stock-based compensation | | | 3,755 | | | | 13,971 | | | | 7,756 | |
Dividends paid | | | (1,876 | ) | | | (1,868 | ) | | | (1,853 | ) |
Non-controlling interest dividends | | | — | | | | (54 | ) | | | (61 | ) |
Net income | | | 32,153 | | | | 37,025 | | | | 19,658 | |
Interest rate swaps, net of income taxes | | | (821 | ) | | | (389 | ) | | | 5,869 | |
Pension and other postretirement benefit plans, net of income taxes | | | 24 | | | | (806 | ) | | | 487 | |
Repurchase of common stock | | | (5,306 | ) | | | (2,202 | ) | | | (3,903 | ) |
Balance at End of Period | | $ | 257,736 | | | $ | 229,807 | | | $ | 188,954 | |
| | | | | | | | | |
Cash Dividends per Share | | $ | 0.04 | | | $ | 0.04 | | | $ | 0.04 | |
The accompanying notes are an integral part of these Consolidated Financial Statements.
CORE LABORATORIES INC.
CONSOLIDATED STATEMENTS OF CHANGES IN EQUITY (Continued)
For the Years Ended December 31, 2024, 2023 and 2022
(In thousands, except share and per share data)
| | | | | | | | | | | | |
| | 2024 | | | 2023 | | | 2022 | |
Common Stock - Number of shares issued | | | | | | | | | |
Balance at Beginning of Period | | | 46,938,557 | | | | 46,699,102 | | | | 46,454,264 | |
New share issuance | | | 28,311 | | | | 239,455 | | | | 244,838 | |
Balance at End of Period | | | 46,966,868 | | | | 46,938,557 | | | | 46,699,102 | |
| | | | | | | | | |
Treasury Stock - Number of shares | | | | | | | | | |
Balance at Beginning of Period | | | (82,021 | ) | | | (67,168 | ) | | | (104,867 | ) |
Stock-based compensation | | | 228,413 | | | | 98,939 | | | | 212,047 | |
Repurchase of common stock | | | (286,440 | ) | | | (113,792 | ) | | | (174,348 | ) |
Balance at End of Period | | | (140,048 | ) | | | (82,021 | ) | | | (67,168 | ) |
| | | | | | | | | |
Common Stock - Number of shares outstanding | | | | | | | | | |
Balance at Beginning of Period | | | 46,856,536 | | | | 46,631,934 | | | | 46,349,397 | |
New share issuance | | | 28,311 | | | | 239,455 | | | | 244,838 | |
Stock-based compensation | | | 228,413 | | | | 98,939 | | | | 212,047 | |
Repurchase of common stock | | | (286,440 | ) | | | (113,792 | ) | | | (174,348 | ) |
Balance at End of Period | | | 46,826,820 | | | | 46,856,536 | | | | 46,631,934 | |
The accompanying notes are an integral part of these Consolidated Financial Statements.
CORE LABORATORIES INC.
CONSOLIDATED STATEMENTS OF CASH FLOWS
For the Years Ended December 31, 2024, 2023 and 2022
(In thousands)
| | | | | | | | | | | | |
| | 2024 | | | 2023 | | | 2022 | |
CASH FLOWS FROM OPERATING ACTIVITIES: | | | | | | | | | |
Net income | | $ | 32,153 | | | $ | 37,025 | | | $ | 19,658 | |
Adjustments to reconcile net income to net cash provided by operating activities: | | | | | | | | | |
Stock-based compensation | | | 3,755 | | | | 13,971 | | | | 7,756 | |
Depreciation and amortization | | | 14,953 | | | | 15,784 | | | | 17,161 | |
Assets write-down | | | 1,110 | | | | 1,143 | | | | — | |
Inventory write-off and obsolescence | | | 2,933 | | | | 1,719 | | | | (142 | ) |
Changes in value of life insurance policies | | | (2,821 | ) | | | (4,963 | ) | | | 5,069 | |
Deferred income taxes | | | 674 | | | | (10,811 | ) | | | 433 | |
Gain on insurance recovery on property, plant and equipment | | | (4,398 | ) | | | — | | | | — | |
Realization of pension obligation | | | (33 | ) | | | (892 | ) | | | 451 | |
Net provision for credit losses | | | 1,203 | | | | 179 | | | | (6 | ) |
Other non-cash items | | | (1,020 | ) | | | 406 | | | | (405 | ) |
Changes in assets and liabilities: | | | | | | | | | |
Accounts receivable | | | (3,612 | ) | | | (2,618 | ) | | | (10,078 | ) |
Inventories | | | 9,367 | | | | (12,976 | ) | | | (14,860 | ) |
Prepaid expenses and other current assets | | | (5,674 | ) | | | 1,952 | | | | (76 | ) |
Other assets | | | (289 | ) | | | 1,509 | | | | (1,369 | ) |
Accounts payable | | | 519 | | | | (12,878 | ) | | | 15,374 | |
Accrued expenses | | | 2,531 | | | | (375 | ) | | | (1,302 | ) |
Unearned revenues | | | 4,577 | | | | (1,187 | ) | | | (1,823 | ) |
Other liabilities | | | 460 | | | | (2,199 | ) | | | (10,885 | ) |
Net cash provided by operating activities | | | 56,388 | | | | 24,789 | | | | 24,956 | |
CASH FLOWS FROM INVESTING ACTIVITIES: | | | | | | | | | |
Capital expenditures | | | (13,028 | ) | | | (10,579 | ) | | | (10,216 | ) |
Patents and other intangibles | | | 20 | | | | 67 | | | | (29 | ) |
Proceeds from sale of assets | | | 1,736 | | | | 485 | | | | 1,889 | |
Proceeds from sale of business, net of cash sold | | | — | | | | — | | | | 240 | |
Proceeds from insurance recovery | | | 2,102 | | | | — | | | | 583 | |
Net proceeds on life insurance policies | | | 2,776 | | | | 3,375 | | | | 3,677 | |
Net cash used in investing activities | | | (6,394 | ) | | | (6,652 | ) | | | (3,856 | ) |
CASH FLOWS FROM FINANCING ACTIVITIES: | | | | | | | | | |
Repayment of long-term debt | | | (82,000 | ) | | | (211,000 | ) | | | (131,000 | ) |
Proceeds from long-term debt | | | 44,000 | | | | 202,000 | | | | 116,000 | |
Debt issuance costs | | | (19 | ) | | | (1,253 | ) | | | (2,206 | ) |
Equity related transaction costs | | | (756 | ) | | | (4,068 | ) | | | (411 | ) |
Dividends paid | | | (1,876 | ) | | | (1,868 | ) | | | (1,853 | ) |
Repurchase of common stock | | | (5,306 | ) | | | (2,202 | ) | | | (3,903 | ) |
Other financing activities | | | — | | | | (54 | ) | | | (2 | ) |
Net cash used in financing activities | | | (45,957 | ) | | | (18,445 | ) | | | (23,375 | ) |
NET CHANGE IN CASH AND CASH EQUIVALENTS | | | 4,037 | | | | (308 | ) | | | (2,275 | ) |
CASH AND CASH EQUIVALENTS, beginning of year | | | 15,120 | | | | 15,428 | | | | 17,703 | |
CASH AND CASH EQUIVALENTS, end of year | | $ | 19,157 | | | $ | 15,120 | | | $ | 15,428 | |
The accompanying notes are an integral part of these Consolidated Financial Statements.
CORE LABORATORIES INC.
CONSOLIDATED STATEMENTS OF CASH FLOWS (Continued)
For the Years Ended December 31, 2024, 2023 and 2022
(In thousands)
| | | | | | | | | | | | |
| | 2024 | | | 2023 | | | 2022 | |
Supplemental disclosures of cash flow information: | | | | | | | | | |
Cash payments for interest | | $ | 10,859 | | | $ | 11,198 | | | $ | 9,300 | |
Cash payments for income taxes | | $ | 17,583 | | | $ | 14,535 | | | $ | 14,078 | |
Non-cash investing and financing activities: | | | | | | | | | |
Capital expenditures incurred but not paid for as of the end of the year | | $ | 1,670 | | | $ | 963 | | | $ | 1,157 | |
Equity related transaction costs incurred but not paid for as of the end of the year | | $ | — | | | $ | 756 | | | $ | — | |
The accompanying notes are an integral part of these Consolidated Financial Statements.
CORE LABORATORIES INC.
NOTES TO THE CONSOLIDATED FINANCIAL STATEMENTS
DECEMBER 31, 2024
1. DESCRIPTION OF BUSINESS
Core Laboratories Inc. (“Core Laboratories”, “Core Lab”, “the Company”, “we”, “our” or “us”) is a Delaware corporation. We were established in 1936 and are one of the world’s leading providers of proprietary and patented reservoir description and production enhancement services and products to the oil and gas industry primarily through client relationships with many of the world’s major, national and independent oil companies. These services and products can enable our clients to evaluate and improve reservoir performance and increase oil and gas recovery from their new and existing fields. We make measurements on reservoir rocks, reservoir fluids (crude oil, natural gas and water) and their derived products. In addition, we assist clients in evaluating subsurface targets associated with carbon capture and sequestration projects or initiatives. We have over 70 offices in more than 50 countries and have approximately 3,500 employees.
On May 1, 2023, Core Laboratories N.V. completed its previously announced redomestication transaction (the “Redomestication Transaction”), which through a series of steps, resulted in the merger of Core Laboratories N.V., a holding company in the Netherlands, with and into Core Laboratories Luxembourg S.A., a public limited liability company incorporated under the laws of Luxembourg, with Core Laboratories Luxembourg S.A. surviving, and subsequently the migration of Core Laboratories Luxembourg S.A. out of Luxembourg and its domestication as Core Laboratories Inc., a Delaware corporation. As a result of the Redomestication Transaction, all common shares in Core Laboratories N.V. were canceled and exchanged for common stock in Core Laboratories Luxembourg S.A. on a one-for-one basis. Former holders of Core Laboratories N.V. common shares now hold one share of common stock of Core Laboratories Inc. (formerly Core Laboratories Luxembourg S.A.) for each Core Laboratories N.V. common share owned immediately prior to the consummation of the Redomestication Transaction, and the business, assets, liabilities, directors and officers of Core Laboratories Inc. became the same as the business, assets, liabilities, directors and officers of Core Laboratories N.V. immediately prior to the Redomestication Transaction.
We operate our business in two segments: (1) Reservoir Description and (2) Production Enhancement. These complementary operating segments provide different services and products and utilize different technologies for evaluating and improving reservoir performance and increasing oil and gas recovery from new and existing fields. For a description of the types of services and products offered by these operating segments, see Note 21 - Segment Reporting and Other Disaggregated Information.
2. SUMMARY OF SIGNIFICANT ACCOUNTING POLICIES
Basis of Presentation and Principles of Consolidation
The Redomestication Transaction has been accounted for as a transaction between entities under common control. Accordingly, Core Laboratories Inc. recorded the assets and liabilities transferred at their carrying values at the date of transfer. All common shares in Core Laboratories N.V., at par value EUR 0.02, were canceled and exchanged for common stock in Core Laboratories Inc., at par value $0.01, on a one-for-one basis. Core Laboratories Inc.’s common stock par value was decreased by $0.7 million for the difference between the total par value of common stock of Core Laboratories Inc. and the total par value of common shares of Core Laboratories N.V. at the date of transfer, with an offset to additional paid in capital. There is no difference between the combined separate entities prior to the Redomestication Transaction and the combined separate entities after the Redomestication Transaction, therefore, these financial statements, reported as though the exchange of equity interests had occurred at the beginning of the reporting period, and comparative information do not differ from amounts previously reported under Core Laboratories N.V.’s consolidated financial statements. These financial statements should be read in conjunction with Core Laboratories N.V.’s Quarterly Report on Form 10-Q for the three months ended March 31, 2023 and Core Laboratories N.V.’s Annual Report on Form 10-K for the year ended December 31, 2022, including Note 2 - Summary of Significant Accounting Policies. There have been no changes to the accounting policies of the combined entities during the years ended December 31, 2024 and 2023.
The accompanying consolidated financial statements include the accounts of Core Laboratories Inc. and its subsidiaries for which we have a controlling voting interest and/or a controlling financial interest. These financial statements have been prepared in accordance with United States generally accepted accounting principles (“U.S. GAAP”). We use the equity method of accounting for investments in which we have less than a majority interest and do not exercise control but do exert significant influence. Non-controlling interest has been recorded to reflect outside ownership attributable to consolidated subsidiaries that are less than 100% owned. All inter-company transactions and balances have been eliminated in consolidation.
Certain reclassifications were made to prior period amounts in order to conform to the current period presentation. These reclassifications had no impact on the reported net income or cash flows for the years ended December 31, 2023 and 2022.
Recent Accounting Pronouncements
Pronouncements Adopted in 2024
In November 2023, the Financial Accounting Standards Board (“FASB”) issued Accounting Standard Update (“ASU”) 2023-07 Segment Reporting (Topic 280): Improvements to Reportable Segment Disclosures to improve reportable segment disclosure requirements, primarily through enhanced disclosures about significant segment expenses on an annual and interim basis. The amendment is effective for fiscal years beginning after December 15, 2023, and interim periods within fiscal years beginning after December 15, 2024. We adopted the guidance for the year ended December 31, 2024 and applied it retrospectively to all prior periods presented in the financial statements. Upon adoption, our disclosures regarding segment reporting was expanded. See Note 21 - Segment Reporting and Other Disaggregated Information.
Pronouncements Not Yet Effective
In December 2023, FASB issued ASU 2023-09 Income Taxes (Topic 740): Improvements to Income Tax Disclosures to improve transparency of income tax disclosures, primarily by requiring consistent categories and greater disaggregation of information in the rate reconciliation and income taxes paid disaggregated by jurisdiction. The amendment is effective for annual periods beginning after December 15, 2024. Early adoption is permitted. The amendment should be applied prospectively; however, retrospective application is permitted. Upon adoption, our disclosures regarding income taxes will be expanded accordingly.
In November 2024, FASB issued ASU 2024-03 Income Statement – Reporting Comprehensive Income – Expense Disaggregation Disclosures (Subtopic 220-40) to improve disclosures about a public business entity’s expenses, by providing more detailed information about the types of expenses in commonly presented expense captions. As amended by ASU 2025-01 issued in January 2025, the amendment is effective for annual periods beginning after December 15, 2026, and interim periods within annual reporting periods beginning after December 15, 2027. Early adoption is permitted. The amendment may be applied prospectively or retrospectively. Upon adoption, our disclosures regarding expenses will be expanded.
Use of Estimates
The preparation of financial statements in accordance with U.S. GAAP requires management to make certain estimates and assumptions that affect the reported amounts of assets and liabilities and disclosure of assets and liabilities at the date of the financial statements and the reported amounts of revenue and expenses during the reporting period. We evaluate our estimates on an ongoing basis and utilize our historical experience, as well as various other assumptions that we believe are reasonable in a given circumstance, in order to make these estimates. Actual results could differ from our estimates, as assumptions and conditions change.
The following accounts, among others, require us to use estimates and assumptions:
▪allowance for credit losses;
▪depreciation and amortization;
▪long-lived assets, intangibles and goodwill;
▪pensions and other postretirement benefits;
▪stock-based compensation; and
Accounting policies relating to these accounts and the nature of these estimates are further discussed under the applicable caption. For each of these critical estimates it is at least reasonably possible that changes in these estimates will occur in the short term which may impact our financial position or results of operations.
Foreign Currencies
Our functional currency is the U.S. Dollar (“USD”). All inter-company financing, transactions and cash flows with our subsidiaries are transacted in USD. Revenue and expenses denominated in other currencies are measured at the applicable month-end exchange rate which approximates the average exchange rate. We remeasure monetary assets and liabilities denominated in other currencies to USD at year-end exchange rates. Non-monetary items, depreciation, amortization and certain components of cost of sales are measured at historical rates. Remeasurement and settlement difference are included in other (income) expense, net in the accompanying consolidated statements of operations. See Note 19 - Other (Income) Expense, net.
Concentration of Credit Risk
Our financial instruments that potentially subject us to concentrations of credit risk relate primarily to cash and cash equivalents and trade accounts receivable. All cash and cash equivalents are on deposit at commercial banks or investment firms with significant financial resources. Our trade receivables are with a variety of domestic, international and national oil and gas companies. We had no clients who provided more than 10% of our revenue for the years ended December 31, 2024, 2023 and 2022. We consider our credit risk related to trade accounts receivable to be limited due to the creditworthiness and financial resources of our clients. We apply the expected credit losses methodology for measurement of credit losses on financial assets measured at amortized cost basis. We evaluate our estimate for credit losses on an on-going basis throughout the year.
Concentration of Interest Rate Risk
We are exposed to interest rate risk on our revolving credit facility debt, which carries a variable interest rate. We are exposed to interest rate risk on our Senior Notes which carry a fixed interest rate, but whose fair value will fluctuate based on changes in interest rates and market perception of our credit risk. See Note 11 - Long-term Debt, net.
Cash and Cash Equivalents
Cash and cash equivalents include all short-term, highly liquid instruments purchased with an original maturity of three months or less. These items are carried at cost, which approximates fair value.
Accounts Receivable
Trade accounts receivable are recorded at their invoiced amounts and do not bear interest. We perform ongoing credit evaluations of our clients, monitor collections and payments, consider our historical collection experience and our current aging of client receivables outstanding, in addition to client’s representations and our understanding of the economic environment in which our clients operate. Based on our review we establish or adjust allowances for credit losses for specific clients and the accounts receivable, as a whole, and recognize expense. When an account is determined to be uncollectible, we charge the receivable to our allowance for credit losses. The net carrying value of accounts receivable approximates fair value.
Contract Assets and Liabilities
Contract assets and liabilities arise from differences in timing of revenue recognition, billings and cash collections.
Contract assets include our right to payment for goods and services already transferred to a customer when the right to payment is conditional on something other than the passage of time. For example, we have contracts where we recognize revenue over time but do not have a contractual right to payment until we complete the performance obligations.
Contract liabilities consist of advance payments received and billings in excess of revenue recognized. We generally receive up-front payments relating to our consortia studies. We recognize revenue over the life of the study as the testing and analysis results are made available to our consortia members. We classify contract liabilities for contracts with a duration greater than twelve months as current or non-current based on the timing of revenue recognition. The current portion of contract liabilities is included in unearned revenues and the non-current portion of contract liabilities is included in other long-term liabilities.
Inventories
Inventories consist of manufactured goods, materials and supplies used for sales or services to clients. Inventories are stated at the lower of cost or estimated net realizable value. Inventory costs are recorded at standard cost which approximates the first-in, first-out method.
Prepaid Expenses and Other Current Assets
Prepaid expenses and other current assets are comprised primarily of prepaid insurance, value added taxes and prepaid software licenses.
Property, Plant and Equipment
Property, plant and equipment are carried at cost less accumulated depreciation. Major renewals and improvements are capitalized while maintenance and repair costs are charged to expense as incurred. They are depreciated using the straight-line method based on their individual estimated useful lives, except for leasehold improvements, which are depreciated over the remaining lease term, if shorter. We estimate the useful lives and salvage values of our assets based on historical data as follows:
| | |
Buildings and leasehold improvements | | 3 - 40 years |
Machinery and equipment | | 3 - 10 years |
When long-lived assets are sold or retired, the remaining costs and related accumulated depreciation are removed from the accounts and any resulting gain or loss is recognized in income.
We review our long-lived assets for impairment when events or changes in circumstances indicate that their net book value may not be recovered over their remaining service lives. Indicators of possible impairment may include significant declines in activity levels in regions where specific assets or groups of assets are located, extended periods of idle use, declining revenue or cash flow or overall changes in general market conditions.
Whenever possible impairment is indicated, we compare the carrying value of the assets or asset groups to the sum of the estimated undiscounted future cash flows expected from use, plus salvage value, less the costs of the subsequent disposition of the assets. If impairment is still indicated, we compare the fair value of the assets to the carrying value and recognize an impairment loss for the amount by which the carrying value exceeds the fair value. We did not record any material impairment charges relating to our long-lived assets held for use during the years ended December 31, 2024, 2023 and 2022.
The geopolitical conflict between Russia and Ukraine, which began in February 2022 and has continued through December 31, 2024, has resulted in disruptions to our operations in Russia and Ukraine. The Company evaluated long-lived assets in Russia and Ukraine as part of our assessment of our assets group and did not identify triggering events as of December 31, 2024. Based on our assessments, we determined there was no impairment for long-lived assets in Russia and Ukraine as of December 31, 2024. See Note 18 - Impairments and Other Charges.
Leases
We have operating leases primarily consisting of offices and lab space, machinery and equipment and vehicles. We determine if an arrangement is an operating or finance lease at inception. Lease assets and lease liabilities are recognized based on the present value of the future minimum lease payments over the lease term at commencement date. Where our lease does not provide an implicit rate, we estimate the discount rate used to discount the future minimum lease payments using our incremental borrowing rate and other information available at the commencement date. Operating leased assets also include all initial direct costs incurred. The lease term may include options to extend or terminate the lease when it is reasonably certain that we will exercise that option.
Operating leased assets are included in right of use (“ROU”) assets and, along with current and long-term operating lease liabilities, are separately presented in our consolidated balance sheet. Financing leased assets are included in property, plant and equipment, net and the related liabilities are included in other current and other long- term liabilities in our consolidated balance sheet.
ROU assets are subsequently depreciated over the estimated useful life of the asset and lease liabilities are carried at amortized cost using the effective interest rate method.
The Company has elected to apply the short-term lease exemption to all classes of underlying ROU assets. Accordingly, no ROU asset or lease liability is recognized for leases with a term of twelve months or less.
The Company has elected to apply the practical expedient for combining lease and non-lease components for vehicle leases and elected not to apply the practical expedient for combining lease and non-lease components to all other classes of underlying ROU assets.
Intangibles and Goodwill
Intangible assets, which include trade secrets, patents, technology, agreements not to compete, trade names, and trademarks, are carried at cost less accumulated amortization, for intangibles with a definite life, and any accumulated impairment. Intangibles with definite lives are amortized using the straight-line method based on the estimated useful life of the intangible. We review our intangible assets with definite lives for impairment when events or changes in circumstances indicate that net book value may not be recovered over their remaining service lives.
We record goodwill as the excess of the purchase price over the fair value of the net assets acquired in acquisitions accounted for under the purchase method of accounting. Goodwill is not subject to amortization and is tested for impairment annually or more frequently if events or changes in circumstances indicate goodwill is more likely than not impaired.
We assess intangibles with indefinite lives and goodwill for impairment by performing a qualitative assessment or a quantitative test. The qualitative assessment is to determine whether the existence of events or circumstances leads to a determination that it is more likely than not that the fair value is less than carrying value. If it is concluded that it is more-likely-than not that an impairment exists, a quantitative test is required which compares the estimated fair value to carrying value. If the estimated fair value is less than carrying value, then there is an impairment loss limited to the carrying value.
Significant judgments and assumptions are inherent in our estimate of future cash flows used to determine the estimate of the reporting unit’s fair value which include assumptions regarding future revenue growth rates, discount rates and expected margins. See Note 18 - Impairments and Other Charges.
Accounts Payable
Trade accounts payable are recorded at their invoiced amounts and do not bear interest. The carrying value of accounts payable approximates fair value.
Income Taxes
We recognize deferred tax assets and liabilities for the expected future tax consequences of events that have been included in the consolidated financial statements or tax returns. Deferred tax assets and liabilities are determined based on the difference between the financial statement and the tax basis of assets and liabilities using enacted tax rates in effect for the year in which the asset is expected to be recovered or the liability is expected to be settled. We include interest and penalties from tax judgments in income tax expense.
We record a liability for unrecognized tax benefits resulting from uncertain tax positions taken or expected to be taken in our tax return. We also recognize interest and penalties, if any, related to unrecognized tax benefits in income tax expense. See Note 9 - Income Taxes.
The Company is subject to controlled foreign corporations Subpart F income (“Subpart F”) tax, which is a tax primarily on passive income from controlled foreign corporations. In addition, the 2017 Tax Cuts and Jobs Act imposed a global intangible low-taxed income (“GILTI”) tax that determines the amount of Subpart F income that must be recognized. The FASB Staff Q&A, Topic 740, No. 5, Accounting for Global Intangible Low-Taxed Income, states that an entity can make an accounting policy election to either recognize deferred taxes for temporary basis differences expected to reverse as GILTI in the future years or provide for tax expense related to GILTI in the year the tax is incurred. The Company has elected to recognize tax expense related to GILTI in the year the tax is incurred.
Pension and Other Postretirement Benefit Plans
We provide a non-contributory defined benefit pension plan covering substantially all of our Dutch employees (“Dutch Plan”) who were hired prior to 2000. We recognize net periodic pension costs associated with the Dutch Plan in income and recognize the unfunded status of the plan, if any, as another long-term liability. We recognize the actuarial gains or losses and prior service costs or credits that arise during the period as a component of other comprehensive income. The projection of benefit obligation and fair value of plan assets requires the use of assumptions and estimates. Actual results could differ from those estimates. See Note 12 - Pension and Other Postretirement Benefit Plans.
We maintain defined contribution plans for the benefit of eligible employees primarily in Canada, the Netherlands, the United Kingdom and the United States. We expense contributions in the period the contribution is made.
Derivative Instruments
We may enter into a variety of derivative instruments in connection with the management of our exposure to fluctuations in interest rates or currency exchange rates. See Note 15 - Derivative Instruments and Hedging Activities.
We do not enter into derivatives for speculative purposes.
Comprehensive Income
Comprehensive income is comprised of net income and other charges or credits to equity that are not the result of transactions with owners. Accumulated other comprehensive income (loss) consists of prior service costs and unrecognized net actuarial gain or loss from the Dutch pension plan and changes in the fair value of our interest rate swaps. See Note 12 - Pension and Other Postretirement Benefit Plans and Note 15 - Derivative Instruments and Hedging Activities.
Revenue Recognition
All of our revenue is derived from contracts with clients. Our contracts include standard commercial payment terms generally acceptable in each region, and do not include financing with extended payment terms. We have no significant obligations for refunds, warranties, or similar obligations. Our revenue does not include taxes collected from our clients. In certain circumstances we apply the guidance in Accounting Standards Codification Topic 606 - Revenue from Contracts with Customers (“Topic 606”) to a portfolio of contracts with similar characteristics. We use estimates and assumptions when accounting for a portfolio that reflect the size and composition of the portfolio of contracts.
We recognize revenue at an amount that reflects the consideration expected to be received in exchange for such services or goods as described below by applying the five-step method to: (1) identify the contract(s) with clients; (2) identify the performance obligation(s) in the contract; (3) determine the transaction price; (4) allocate the transaction price to the performance obligation(s) in the contract; and (5) recognize revenue when (or as) we satisfy the performance obligation(s). A performance obligation is a promise in a contract to transfer a distinct service or good to a client and is the unit of account under Topic 606. We have contracts with two general groups of performance obligations: those that require us to perform analysis and/or diagnostic tests in our laboratory or at the client’s wellsite and those from the sale of tools, diagnostic and equipment products and related services.
Service Revenue: We provide a variety of services to clients in the oil and gas industry. Where services are provided related to the testing and analysis of rock and fluids, we recognize revenue upon the provision of the test results or analysis to the client. For our design, field engineering and completion diagnostic services, we recognize revenue upon the delivery of those services at the well site or delivery of diagnostic data. In the case of our consortia studies, we have multiple performance obligations and revenue is recognized at the point in time when the testing and analysis results on each contributed core are made available to our consortia members. For arrangements that include multiple performance obligations, we allocate revenue to each performance obligation based on estimates of the price that we would charge the client for each promised service or product if it were sold on a standalone basis.
To a lesser extent, we enter into other types of contracts including service arrangements and non-subscription software and licensing agreements. We recognize revenue for these arrangements over time or at a point in time depending on our evaluation of when the client obtains control of the promised services or products.
Product Sales Revenue: We manufacture equipment that we sell to our clients in the oil and gas industry. We recognize revenue when control of the promised product is transferred to the client. Control of the product usually passes to the client at the time shipment is made or picked up by the client at our facilities, as defined within the contract.
Disaggregation of Revenue
We contract with clients for service revenue and/or product sales revenue. We present revenue disaggregated by services and product sales in our consolidated statements of operations. For revenue disaggregated by operating segment, see Note 21 - Segment Reporting and Other Disaggregated Information.
Stock-Based Compensation
For new awards issued and awards modified, repurchased or canceled, we record compensation expense in the consolidated statements of operations equal to the fair value of the award at the date of the grant, modification, repurchase or cancellation over the requisite service period of the award. The fair value is generally determined by the quoted market price of the Company’s common stock on the date of grant less the discounted value of the expected dividends to be paid over the vesting
period. Market vesting conditions, as applicable, are included in the estimation of the fair value of the award. Forfeitures are recognized as they occur.
Non-controlling Interests
We maintain non-controlling interests in several investment ventures. Non-controlling interest have been recorded to reflect outside ownership attributable to consolidated subsidiaries that are less than 100% owned and presented as a separate component of equity in the consolidated balance sheets and income in the consolidated statements of operations and other comprehensive income, respectively. In addition, when a subsidiary is deconsolidated, any retained non-controlling equity investment in the former subsidiary will be initially measured at fair value and recorded as a gain or loss.
3. ACQUISITIONS AND DIVESTURES
We had no significant acquisitions or divestitures during the years ended December 31, 2024, 2023 and 2022.
4. CONTRACT ASSETS AND LIABILITIES
The balance of contract assets and contract liabilities consist of the following (in thousands):
| | | | | | | | |
| | December 31, | |
| | 2024 | | | 2023 | |
Contract assets: | | | | | | |
Current | | $ | 370 | | | $ | 1,293 | |
| | $ | 370 | | | $ | 1,293 | |
Contract liabilities: | | | | | | |
Current | | $ | 560 | | | $ | 299 | |
| | $ | 560 | | | $ | 299 | |
| | | | |
| | December 31, 2024 | |
Estimate of when contract liabilities will be recognized as revenue: | | | |
Within 12 months | | $ | 560 | |
The current portion of contract assets is included in our accounts receivable as of December 31, 2024 and 2023.
The current portion of contract liabilities is included in unearned revenues as of December 31, 2024 and 2023 and, as applicable, the non-current portion of contract liabilities is included in other long-term liabilities.
We did not recognize any impairment losses on our contract assets for the years ended December 31, 2024, 2023 and 2022.
5. INVENTORIES
Inventories consist of the following (in thousands):
| | | | | | | | |
| | December 31, | |
| | 2024 | | | 2023 | |
Finished goods | | $ | 27,127 | | | $ | 30,508 | |
Parts and materials | | | 28,953 | | | | 37,670 | |
Work in progress | | | 3,322 | | | | 3,524 | |
Total inventories | | $ | 59,402 | | | $ | 71,702 | |
We include freight costs incurred for shipping inventory to our clients in the cost of product sales caption in the accompanying consolidated statements of operations.
6. PROPERTY, PLANT AND EQUIPMENT, NET
The components of property, plant and equipment, net are as follows (in thousands):
| | | | | | | | |
| | December 31, | |
| | 2024 | | | 2023 | |
Land | | $ | 10,402 | | | $ | 10,652 | |
Building and leasehold improvements | | | 117,682 | | | | 120,545 | |
Machinery and equipment | | | 283,296 | | | | 284,225 | |
Total property, plant and equipment | | | 411,380 | | | | 415,422 | |
Less: Accumulated depreciation | | | (314,317 | ) | | | (315,796 | ) |
Property, plant and equipment, net | | $ | 97,063 | | | $ | 99,626 | |
See Note 19 - Other (Income) Expense, net for additional information regarding the write-down of leasehold improvements.
7. LEASES
Our operating leases primarily consist of offices and lab space, machinery and equipment and vehicles.
We abandoned certain leases in the U.S. and Canada during the years ended December 31, 2024 and 2023. We entered into a sublease agreement that commenced on July 1, 2023, for a portion of the existing office and lab space in Calgary, Alberta, Canada. See Note 19 - Other (Income) Expense, net for additional information regarding the write-down of right of use assets.
The components of lease expense and other information are as follows (in thousands):
| | | | | | | | | | | | |
| | For the Years Ended December 31, | |
| | 2024 | | | 2023 | | | 2022 | |
Consolidated Statements of Operations: | | | | | | | | | |
Operating lease expense | | $ | 16,998 | | | $ | 17,454 | | | $ | 16,595 | |
Short-term lease expense | | | 1,720 | | | | 1,768 | | | | 1,784 | |
Variable lease expense | | | 1,719 | | | | 1,758 | | | | 1,414 | |
Sublease income | | | (227 | ) | | | (113 | ) | | | — | |
Total lease expense | | $ | 20,210 | | | $ | 20,867 | | | $ | 19,793 | |
Consolidated Statements of Cash Flows: | | | | | | | | | |
Operating cash flows - operating leases payments | | $ | 16,708 | | | $ | 16,541 | | | $ | 16,598 | |
Right of use assets obtained in exchange for operating lease liabilities | | $ | 14,237 | | | $ | 17,005 | | | $ | 5,520 | |
Other information: | | | | | | | | | |
Weighted-average remaining lease term - operating leases | | 8.70 years | | | 9.24 years | | | 6.88 years | |
Weighted-average discount rate - operating leases | | | 5.45 | % | | | 5.32 | % | | | 4.62 | % |
Scheduled undiscounted lease payments for non-cancellable operating leases consist of the following (in thousands):
| | | | | | | | |
| | December 31, 2024 | |
| | Operating Leases | | | Operating Sublease | |
2025 | | $ | 13,245 | | | $ | (231 | ) |
2026 | | | 10,417 | | | | (236 | ) |
2027 | | | 8,324 | | | | (241 | ) |
2028 | | | 6,586 | | | | (163 | ) |
2029 | | | 4,388 | | | | — | |
Thereafter | | | 25,505 | | | | — | |
Total undiscounted lease payments | | | 68,465 | | | $ | (871 | ) |
Less: Imputed interest | | | (14,432 | ) | | | |
Total operating lease liabilities | | $ | 54,033 | | | | |
8. INTANGIBLES AND GOODWILL
The components of intangibles, net are as follows (in thousands):
| | | | | | | | | | | | | | | | | | |
| | | | December 31, | |
| | | | 2024 | | | 2023 | |
| | | | Gross | | | Accumulated Amortization | | | Gross | | | Accumulated Amortization | |
| | Useful life in years | | Carrying Value | | | and Impairment | | | Carrying Value | | | and Impairment | |
Acquired trade secrets | | 2-20 | | $ | 4,278 | | | $ | 3,967 | | | $ | 4,278 | | | $ | 3,756 | |
Acquired patents and technology | | 4-15 | | | 15,722 | | | | 14,243 | | | | 15,744 | | | | 13,953 | |
Agreements not to compete | | 2-5 | | | 1,105 | | | | 1,105 | | | | 1,105 | | | | 1,105 | |
Acquired trade names and trademarks | | Indefinite | | | 4,624 | | | | 11 | | | | 4,624 | | | | 11 | |
Total intangibles, net | | | | $ | 25,729 | | | $ | 19,326 | | | $ | 25,751 | | | $ | 18,825 | |
Our estimated amortization expense relating to these intangibles for the next five years is summarized in the following table (in thousands):
| | | | |
| | December 31, 2024 | |
2025 | | $ | 359 | |
2026 | | $ | 231 | |
2027 | | $ | 193 | |
2028 | | $ | 98 | |
2029 | | $ | 35 | |
The carrying value of goodwill of $99.4 million as of December 31, 2024 and 2023 is associated with our Reservoir Description operating segment. There have been no changes in the carrying value during the years ended December 31, 2024, 2023 and 2022.
9. INCOME TAXES
The components of income before income taxes are as follows (in thousands):
| | | | | | | | | | | | |
| | For the Years Ended December 31, | |
| | 2024 | | | 2023 | | | 2022 | |
United States | | $ | (11,045 | ) | | $ | 3,907 | | | $ | (4,099 | ) |
Other countries | | | 57,232 | | | | 37,303 | | | | 34,053 | |
Income before income taxes | | $ | 46,187 | | | $ | 41,210 | | | $ | 29,954 | |
The components of income tax expense are as follows (in thousands):
| | | | | | | | | | | | |
| | For the Years Ended December 31, | |
| | 2024 | | | 2023 | | | 2022 | |
Current: | | | | | | | | | |
United States | | $ | 1,231 | | | $ | 1,204 | | | $ | 1,269 | |
Other countries | | | 12,205 | | | | 13,446 | | | | 9,784 | |
State and provincial | | | (22 | ) | | | 597 | | | | (100 | ) |
Total current | | | 13,414 | | | | 15,247 | | | | 10,953 | |
Deferred: | | | | | | | | | |
United States | | | (2,487 | ) | | | 1,555 | | | | (908 | ) |
Other countries | | | 2,842 | | | | (12,343 | ) | | | (162 | ) |
State and provincial | | | 265 | | | | (274 | ) | | | 413 | |
Total deferred | | | 620 | | | | (11,062 | ) | | | (657 | ) |
Income tax expense | | $ | 14,034 | | | $ | 4,185 | | | $ | 10,296 | |
The differences in income tax expense computed using the statutory income tax rate and our income tax expense as reported in the accompanying consolidated statements of operations are as follows (in thousands):
| | | | | | | | | | | | |
| | For the Years Ended December 31, | |
| | 2024 | | | 2023 | | | 2022 | |
Tax at the statutory income tax rate (1) | | $ | 9,553 | | | $ | 8,139 | | | $ | 7,368 | |
International earnings taxed at rates other than the statutory income tax rate (1) | | | 2,237 | | | | 5,749 | | | | 5,923 | |
Non-deductible expenses | | | 1,092 | | | | 2,168 | | | | 3,096 | |
Net operating loss | | | (190 | ) | | | 4,661 | | | | (3,627 | ) |
Foreign earnings currently taxed in the U.S. | | | 3,934 | | | | 3,077 | | | | — | |
Change in valuation allowance | | | 337 | | | | (1,107 | ) | | | 1,943 | |
State and provincial taxes | | | 136 | | | | 243 | | | | 662 | |
Tax credits | | | (5,823 | ) | | | (7,410 | ) | | | (6,872 | ) |
Unremitted earnings of subsidiaries | | | 891 | | | | (14,464 | ) | | | (27 | ) |
Adjustments of prior year taxes | | | (935 | ) | | | 701 | | | | (3,488 | ) |
Adjustments of income tax reserves | | | 208 | | | | 519 | | | | (184 | ) |
Foreign exchange | | | (964 | ) | | | (171 | ) | | | (576 | ) |
UK tax rate change | | | — | | | | — | | | | 676 | |
Accrued withholding taxes | | | 3,262 | | | | 1,639 | | | | 1,883 | |
Other | | | 296 | | | | 441 | | | | 3,519 | |
Income tax expense | | $ | 14,034 | | | $ | 4,185 | | | $ | 10,296 | |
(1)Based on the U.S. statutory corporate income tax rate of 21% for 2024 and 2023 and the Netherlands statutory income tax rate of 25% for 2022.
Deferred tax assets and liabilities result from various temporary differences between the financial statement carrying value and their tax basis. Deferred tax assets and liabilities are summarized as follows (in thousands):
| | | | | | | | |
| | December 31, | |
| | 2024 | | | 2023 | |
Deferred tax assets: | | | | | | |
Net operating loss carry-forwards | | $ | 6,279 | | | $ | 7,814 | |
Tax credit carry-forwards | | | 5,811 | | | | 2,144 | |
Accruals for compensation | | | 9,236 | | | | 8,985 | |
Accruals for inventory capitalization | | | 1,673 | | | | 1,621 | |
Unrealized benefit from corporate restructuring | | | 36,762 | | | | 40,963 | |
Intangibles | | | 1,886 | | | | 1,584 | |
Unrealized benefit plan loss | | | 962 | | | | 1,224 | |
Unrealized foreign exchange | | | 2,819 | | | | 2,875 | |
Unearned revenue | | | 2,632 | | | | 3,453 | |
Interest carry-forward | | | 11,367 | | | | 7,912 | |
Other | | | 1,074 | | | | 1,401 | |
Total deferred tax assets | | | 80,501 | | | | 79,976 | |
Valuation allowance | | | (8,812 | ) | | | (8,276 | ) |
Net deferred tax assets | | | 71,689 | | | | 71,700 | |
Deferred tax liabilities: | | | | | | |
Property, plant and equipment, net | | | (2,840 | ) | | | (3,566 | ) |
Accrued withholding taxes | | | (11,279 | ) | | | (10,466 | ) |
Unrealized foreign exchange | | | (1,542 | ) | | | (988 | ) |
Other | | | (198 | ) | | | (176 | ) |
Total deferred tax liabilities | | | (15,859 | ) | | | (15,196 | ) |
Net deferred income taxes | | $ | 55,830 | | | $ | 56,504 | |
The table below summarizes the net deferred tax assets and net deferred tax liabilities by legal jurisdiction (in thousands):
| | | | | | | | |
| | December 31, | |
| | 2024 | | | 2023 | |
Long-term deferred tax assets, net | | $ | 69,613 | | | $ | 69,201 | |
Long-term deferred tax liabilities, net | | | (13,783 | ) | | | (12,697 | ) |
Net deferred income taxes | | $ | 55,830 | | | $ | 56,504 | |
At December 31, 2024, we had tax net operating loss carry-forwards in various tax jurisdictions of $28.8 million. Although we cannot be certain that these operating loss carry-forwards will be utilized, we anticipate that we will have sufficient taxable income in future years to allow us to fully utilize the carry-forwards that are not subject to a valuation allowance. As of December 31, 2024, if unused, $0.8 million will expire between 2025 and 2026, $2.9 million will expire between 2027 and 2029, $3.2 million will expire between 2030 and 2033 and $1.4 million will expire beyond 2033. The remaining balance of $20.5 million is not subject to expiration. During 2024, no material net operating loss carry-forwards, which carried a full valuation allowance, expired unused.
We file income tax returns in the U.S. federal jurisdiction, various states and foreign jurisdictions. We are currently undergoing multiple examinations in various jurisdictions, and the years 2011 through 2023 remain open for examination in various tax jurisdictions in which we operate. The ultimate settlement and timing of these additional tax assessments is uncertain but the Company will continue to vigorously defend its return filing position and does not view the assessments as probable at this time.
The Company is subject to controlled foreign corporations Subpart F income (“Subpart F”) tax, which is a tax primarily on passive income from controlled foreign corporations. In addition, the 2017 Tax Cuts and Jobs Act imposed a global intangible low-taxed income (“GILTI”) tax that determines the amount of Subpart F income that must be recognized. The Company estimates approximately $10.0 million of GILTI income and $8.7 million of Subpart F income for the year ended December 31, 2024 with a U.S. tax effect of $2.1 million and $1.8 million, respectively. For the year ended December 31, 2023, the company estimated no GILTI income and Subpart F income of $14.7 million with a U.S. tax effect of $3.1 million.
During 2024, adjustments were made to estimates for uncertain tax positions in certain tax jurisdictions based upon changes in facts and circumstances, resulting in a reduction to the unrecognized tax benefits. A reconciliation of the beginning and ending amount of unrecognized tax benefits is as follows (in thousands):
| | | | | | | | | | | | |
| | For the Years Ended December 31, | |
| | 2024 | | | 2023 | | | 2022 | |
Unrecognized tax benefits at January 1, | | $ | 3,483 | | | $ | 3,509 | | | $ | 4,327 | |
Tax positions, current period | | | 138 | | | | 144 | | | | 230 | |
Tax positions, prior period | | | (165 | ) | | | 68 | | | | (867 | ) |
Settlements with taxing authorities | | | — | | | | — | | | | (19 | ) |
Lapse of applicable statute of limitations | | | (184 | ) | | | (238 | ) | | | (162 | ) |
Unrecognized tax benefits at December 31, | | $ | 3,272 | | | $ | 3,483 | | | $ | 3,509 | |
Our policy is to record accrued interest and penalties on uncertain tax positions, net of any tax effect, as part of total tax expense for the period. The corresponding liability is carried along with the tax exposure as a non-current payable in other long-term liabilities. For the years ended December 31, 2024, 2023 and 2022, we recognized $0.2 million, $0.6 million and $(0.2) million, respectively, in interest and penalties. As of December 31, 2024 and 2023, we had $5.1 million and $4.9 million, respectively, accrued for the payment of interest and penalties. Changes in our estimate of unrecognized tax benefits would affect our effective tax rate. As of December 31, 2024, there are $0.4 million of unrecognized tax benefits that could be resolved within the next twelve months which could have a positive effect on the annual effective tax rate.
10. OTHER ASSETS
Other assets consist of the following (in thousands):
| | | | | | | | |
| | December 31, | |
| | 2024 | | | 2023 | |
Cash surrender value of life insurance policies | | $ | 25,435 | | | $ | 25,397 | |
Investments in unconsolidated affiliates | | | 5,080 | | | | 4,844 | |
Other | | | 4,273 | | | | 3,978 | |
Total other assets | | $ | 34,788 | | | $ | 34,219 | |
Cash surrender value of life insurance policies relates to postretirement benefit plans. See Note 12 - Pension and Other Postretirement Benefit Plans. Investments include unconsolidated affiliates accounted for under the equity method where the operations of these entities are in-line with those of our core business. These entities are not considered special purpose entities, nor do we have special off-balance sheet arrangements through these entities.
11. LONG-TERM DEBT, NET
We have no finance lease obligations. Debt is summarized in the following table (in thousands):
| | | | | | | | | | | |
| | | | | December 31, | |
| Interest Rate | | Maturity Date | | 2024 | | | 2023 | |
2021 Senior Notes Series A(1) | 4.09% | | January 12, 2026 | | $ | 45,000 | | | $ | 45,000 | |
2021 Senior Notes Series B(1) | 4.38% | | January 12, 2028 | | | 15,000 | | | | 15,000 | |
2023 Senior Notes Series A(2) | 7.25% | | June 28, 2028 | | | 25,000 | | | | 25,000 | |
2023 Senior Notes Series B(2) | 7.50% | | June 28, 2030 | | | 25,000 | | | | 25,000 | |
Credit Facility | | | | | | 18,000 | | | | 56,000 | |
Total long-term debt | | | | | | 128,000 | | | | 166,000 | |
Less: Debt issuance costs | | | | | | (1,889 | ) | | | (2,866 | ) |
Long-term debt, net | | | | | $ | 126,111 | | | $ | 163,134 | |
(1)Interest is payable semi-annually on June 30 and December 30.
(2)Interest is payable semi-annually on March 28 and September 28.
We, along with our wholly owned subsidiary Core Laboratories (U.S.) Interests Holdings, Inc. (“CLIH”) as issuer, have senior notes outstanding that were issued through private placement transactions. As of December 31, 2024, we have two series of senior notes outstanding with an aggregate principal amount of $110.0 million: (1) Series A and Series B of the 2021 Senior Notes were issued in 2021 (the “2021 Senior Notes”), and (2) Series A and Series B of the 2023 Senior Notes were issued on June 28, 2023 (the “2023 Senior Notes”). The 2021 Senior Notes and the 2023 Senior Notes are collectively the “Senior Notes”.
We, along with CLIH, have a credit facility, the Eighth Amended and Restated Credit Agreement (as amended, the “Credit Facility”) for an aggregate borrowing commitment of $135.0 million with a $50.0 million “accordion” feature.
The Credit Facility is secured by first priority interests in (1) substantially all of the tangible and intangible personal property, and equity interest of CLIH and certain of the Company’s U.S. and foreign subsidiary companies; and (2) instruments evidencing intercompany indebtedness owing to the Company, CLIH and certain of the Company’s U.S. and foreign subsidiary companies. Under the Credit Facility, the Secured Overnight Financing Rate (“SOFR”) plus 2.00% to SOFR plus 3.00% will be applied to outstanding borrowings. Any outstanding balance under the Credit Facility is due at maturity on July 25, 2026, subject to springing maturity on July 12, 2025, if any portion of the Company’s 2021 Senior Notes Series A due January 12, 2026, in the aggregate principal amount of $45.0 million, remain outstanding on July 12, 2025, unless the Company’s liquidity equals or exceeds the principal amount of the 2021 Senior Notes Series A outstanding on such date. The available capacity at any point in time is reduced by outstanding borrowings and outstanding letters of credit which totaled approximately $10.8 million at December 31, 2024, resulting in an available borrowing capacity under the Credit Facility of approximately $106.1 million. In addition to indebtedness under the Credit Facility, we had approximately $7.6 million of outstanding letters of credit and performance guarantees and bonds from other sources as of December 31, 2024.
The Credit Facility and Senior Notes include a cross-default provision, whereby a default under one agreement may trigger a default in the other agreements.
The terms of the Credit Facility and Senior Notes require us to meet certain covenants, including, but not limited to, an interest coverage ratio (calculated as consolidated EBITDA divided by interest expense) and a leverage ratio (calculated as consolidated net indebtedness divided by consolidated EBITDA), where consolidated EBITDA (as defined in each agreement) and interest expense are calculated using the most recent four fiscal quarters. The Credit Facility has more restrictive covenants with a minimum interest coverage ratio of 3.00 to 1.00 and permits a maximum leverage ratio of 2.50 to 1.00. The Credit Facility allows non-cash charges such as impairment of assets, stock compensation and other non-cash charges to be added back in the calculation of consolidated EBITDA. The terms of our Credit Facility also allow us to negotiate in good faith to amend any ratio or requirement to preserve the original intent of the agreement if any change in accounting principles would affect the computation of any financial ratio or covenant of the Credit Facility. In accordance with the terms of the Credit Facility, our leverage ratio is 1.31, and our interest coverage ratio is 6.74, each for the period ended December 31, 2024. We are in compliance with all covenants contained in our Credit Facility and Senior Notes as of December 31, 2024.
Certain of our material, wholly owned subsidiaries are guarantors or co-borrowers under the Credit Facility and Senior Notes.
See Note 15 - Derivative Instruments and Hedging Activities for additional information regarding interest rate swap agreements we have entered to fix the underlying risk-free rate on our Credit Facility and Senior Notes.
The estimated fair value of total debt at December 31, 2024 and 2023 approximated the book value of total debt. The fair value was estimated using Level 2 inputs by calculating the sum of the discounted future interest and principal payments through the maturity date.
12. PENSION AND OTHER POSTRETIREMENT BENEFIT PLANS
Defined Benefit Plan
Prior to January 2020, one of our subsidiaries provided a noncontributory defined benefit pension plan covering substantially all of our Dutch employees who were hired prior to 2000. This pension benefit was based on years of service and final pay or career average pay depending on when the employee began participating. The Dutch Plan was curtailed prior to January 2020, and these employees have been moved into the Dutch defined contribution plan. However, the unconditional indexation for this group of participants continues for so long as they remain in active service with the Company.
The following table summarizes the change in the projected benefit obligation and the fair value of plan assets for the Dutch Plan (in thousands):
| | | | | | | | |
| | For the Years Ended | |
| | December 31, | |
| | 2024 | | | 2023 | |
Projected Benefit Obligation: | | | | | | |
Projected benefit obligation at beginning of year | | $ | 43,985 | | | $ | 40,059 | |
Interest cost | | | 1,403 | | | | 1,480 | |
Benefits paid and administrative expenses | | | (1,587 | ) | | | (1,505 | ) |
Actuarial (gain) loss, net | | | (1,114 | ) | | | 2,905 | |
Unrealized (gain) loss on foreign exchange | | | (2,018 | ) | | | 1,046 | |
Projected benefit obligation at end of year | | $ | 40,669 | | | $ | 43,985 | |
| | | | | | |
Fair Value of Plan Assets: | | | | | | |
Fair value of plan assets at beginning of year | | $ | 41,713 | | | $ | 37,376 | |
Increase (decrease) in plan asset value | | | 12 | | | | 3,137 | |
Employer contributions | | | 742 | | | | 1,719 | |
Benefits paid and administrative expenses | | | (1,587 | ) | | | (1,505 | ) |
Unrealized gain (loss) on foreign exchange | | | (1,931 | ) | | | 986 | |
Fair value of plan assets at end of year | | $ | 38,949 | | | $ | 41,713 | |
| | | | | | |
Under-funded status of the plan at end of the year | | $ | (1,720 | ) | | $ | (2,272 | ) |
| | | | | | |
Accumulated Benefit Obligation | | $ | 40,669 | | | $ | 41,727 | |
The following actuarial assumptions were used to determine the actuarial present value of our projected benefit obligation and the net periodic pension cost for the Dutch Plan:
| | | | | | | | |
| | For the Years Ended December 31, | |
| | 2024 | | | 2023 | |
Weighted average assumed discount rate | | | 3.48 | % | | | 3.27 | % |
Expected long-term rate of return on plan assets | | | 3.48 | % | | | 3.27 | % |
Weighted average rate of compensation increase | | | 2.00 | % | | | 2.10 | % |
The discount rate used to determine our projected benefit obligation at December 31, 2024 was increased from 3.27% to 3.48%, consistent with a general increase in interest rates in Europe for AAA-rated long-term Euro government bonds.
Amounts recognized for the Dutch Plan in the consolidated balance sheets consist of (in thousands):
| | | | | | | | |
| | December 31, | |
| | 2024 | | | 2023 | |
Deferred tax asset | | $ | 440 | | | $ | 582 | |
Other long-term liabilities | | | 1,720 | | | | 2,272 | |
Accumulated other comprehensive loss | | | (5,890 | ) | | | (5,914 | ) |
The components of net periodic pension cost for the Dutch Plan include (in thousands):
| | | | | | | | | | | | |
| | For the Years Ended December 31, | |
| | 2024 | | | 2023 | | | 2022 | |
Interest cost | | $ | 1,403 | | | $ | 1,480 | | | $ | 581 | |
Expected return on plan assets | | | (1,178 | ) | | | (1,365 | ) | | | (545 | ) |
Net periodic pension cost | | $ | 225 | | | $ | 115 | | | $ | 36 | |
We funded the future obligations of the Dutch Plan by purchasing an insurance contract from a large multi-national insurance company with a five-year maturity. Each year we made annual premium payments to the insurance company (1) to provide for the benefit obligation of the current year of service based on each employee’s age, gender and current salary, and (2) for the changes in the benefit obligation for prior years of service due to changes in participants’ salary. Plan assets returns equal the contractual rate, which are comparable with governmental debt securities. We determine the fair value of these plan assets with the assistance of an actuary using observable inputs (Level 2), which approximates the contract value of the investments. Our expected long-term rate of return assumptions are based on the weighted-average contractual rates for each contract. Dutch law dictates the minimum requirements for pension funding. Our goal is to meet these minimum funding requirements, while our insurance carrier invests to minimize risks associated with future benefit payments.
In 2025, our minimum funding requirements are expected to be $0.3 million. Our estimate of future annual contributions is based on current funding and the unconditional indexation requirements, and we believe these contributions will be sufficient to fund the plan.
Expected benefit payments to eligible participants under this plan for the next five years are as follows (in thousands):
| | | | |
| | December 31, 2024 | |
2025 | | $ | 1,580 | |
2026 | | $ | 1,752 | |
2027 | | $ | 1,941 | |
2028 | | $ | 2,065 | |
2029 | | $ | 2,224 | |
Succeeding five years | | $ | 11,833 | |
Defined Contribution Plans
We maintain defined contribution plans for the benefit of eligible employees primarily in Canada, the Netherlands, the United Kingdom, and the United States. In accordance with the terms of each plan, we and our participating employees contribute up to specified limits and under certain plans, we may make discretionary contributions in accordance with the defined contribution plans. Our primary obligation under these defined contribution plans is limited to paying the annual
contributions. For the years ended December 31, 2024, 2023 and 2022, we paid $4.7 million, $4.3 million and $3.5 million, respectively, for our contributions and our additional discretionary contributions to the defined contribution plans.
Vesting in all employer contributions is accelerated upon the death of the participant or a change in control. Employer contributions under the plans are forfeited upon a participant’s termination of employment to the extent they are not vested at that time.
Deferred Compensation Arrangements
We have entered into deferred compensation contracts for certain key employees to provide additional retirement income to the participants. The benefit is determined by the contract for either a fixed amount or by a calculation using years of service or age at retirement along with the average of their base salary for the five years prior to retirement. We are not required to fund this arrangement; however, we have purchased life insurance policies with cash surrender values to assist us in providing the benefits pursuant to these deferred compensation contracts with the actual benefit payments made by Core Laboratories. The charge to expense for these deferred compensation contracts for the years ended December 31, 2024, 2023 and 2022 was $0.9 million, $1.1 million and $1.4 million, respectively.
We provide severance compensation to certain key employees if employment is terminated under certain circumstances, such as following a change in control or for any reason other than upon their death or disability, for “cause” or upon a material breach of a material provision of their employment agreement, as defined in their employment agreements. In addition, there are certain countries where we are legally required to make severance payments to employees when they leave our service. We have accrued for all of these severance payments, but they are not funded.
We also have adopted a non-qualified deferred compensation plan (“Deferred Compensation Plan”) that allows certain highly compensated employees to defer a portion of their salary, commission and bonus, as well as the amount of any reductions in their deferrals under the Deferred Compensation Plan for employees in the United States, due to certain limitations imposed by the U.S. Internal Revenue Code of 1986, as amended (the “Code”). Contributions to the plan are invested in equity and other investment fund assets and carried on the balance sheet at fair value. The benefits under these contracts are fully vested. Our primary obligation for the Deferred Compensation Plan is limited to our annual contributions. Employer contributions to the Deferred Compensation Plan for the years ended December 31, 2024, 2023 and 2022 were $0.4 million, $0.4 million and $0.3 million, respectively. Vesting in all employer contributions is accelerated upon the death of the participant or a change in control. Employer contributions under the plans are forfeited upon a participant’s termination of employment to the extent they are not vested at that time.
13. COMMITMENTS AND CONTINGENCIES
We have been and may from time to time be named as a defendant in legal actions that arise in the ordinary course of business. These include, but are not limited to, employment-related claims and contractual disputes or claims for personal injury or property damage which occur in connection with the provision of our services and products. A liability is accrued when a loss is both probable and can be reasonably estimated.
We do not maintain any off-balance sheet debt or other similar financing arrangements, nor have we formed any special purpose entities for the purpose of maintaining off-balance sheet debt.
See Note 11 - Long-term Debt, net for amounts committed under letters of credit and performance guarantees and bonds.
14. EQUITY
Common Stock
In connection with the Redomestication Transaction in May 2023, all common shares in Core Laboratories N.V. at par value EUR 0.02, were canceled and exchanged for common stock in Core Laboratories Inc. at par value $0.01, on a one-for-one basis. Core Laboratories Inc.’s common stock par value was decreased by $0.7 million for the difference between the total par value of common stock of Core Laboratories Inc. and the total par value of common shares of Core Laboratories N.V. at the date of transfer, with an offset to additional paid in capital. Equity related transaction costs associated with the Redomestication Transaction of $4.8 million have been charged to additional paid in capital. In addition, Core Laboratories N.V. assigned to Core Laboratories Inc., and Core Laboratories Inc. assumed, all of Core Laboratories N.V.’s rights and obligations under stock incentive plans. Each outstanding Core Laboratories N.V. incentive award thereunder became a Core Laboratories Inc. incentive award that is subject to substantially the same terms and conditions as the former Core Laboratories N.V. incentive award, except, in the case of equity-based Core Laboratories N.V. incentive awards, the security issuable upon exercise or
settlement of the incentive award, as applicable, will be a share of Core Laboratories Inc. common stock rather than a Core Laboratories N.V. common share.
During the year ended December 31, 2024, we distributed 28,311 shares of common stock upon vesting of stock-based awards.
On June 9, 2022, we entered into an Equity Distribution Agreement with certain banks (the “2022 Equity Distribution Agreement”) allowing for the issuance and sale of up to $60.0 million shares of our common stock by any method deemed to be an “at-the-market offering” as defined in Rule 415 under the Securities Act of 1933 (the “2022 ATM Program”). On July 17, 2023, the Company terminated the 2022 Equity Distribution Agreement. As a result of the termination of the 2022 Equity Distribution Agreement, the Company suspended and terminated the 2022 ATM Program and therefore will not offer or sell any shares under the 2022 ATM Program or the 2022 Equity Distribution Agreement.
Treasury Stock
The repurchase of shares in the open market is at the discretion of our Board of Directors and management. Such common stock, unless canceled, may be reissued for a variety of purposes such as future acquisitions, non-employee director stock awards or employee stock awards. From the activation of the share repurchase program on October 29, 2002 through December 31, 2024, we have repurchased 40,666,075 shares for an aggregate purchase price of approximately $1.7 billion, or an average price of $41.12 per share and have canceled 33,475,406 shares with a historical cost of $1.2 billion. At December 31, 2024, we held 140,048 shares in treasury. During the year ended December 31, 2024, we distributed 228,413 shares of treasury stock upon vesting of stock-based awards. During the year ended December 31, 2024, we repurchased 286,440 shares of our common stock for $5.3 million, of which 109,224 shares valued at $2.0 million were surrendered to us pursuant to the terms of a stock-based compensation plan in consideration of the participants’ tax burdens resulting from the issuance of common stock under that plan. Subsequent to year-end, we have repurchased 228 shares of our common stock for approximately $4.0 thousand.
Dividend Policy
In 2008, Core Laboratories announced the initiation of a cash dividend program. In 2024, 2023 and 2022, cash dividends of $0.01 per share were paid in each quarter. The declaration and payment of future dividends will be at the discretion of the Board of Directors and will depend upon, among other things, future earnings, general financial condition, liquidity, capital requirements, and general business conditions. On January 29, 2025, the Company declared a quarterly cash dividend of $0.01 per share for shareholders of record on February 10, 2025 payable on March 3, 2025.
Accumulated Other Comprehensive Income (Loss)
Amounts recognized, net of income taxes, in accumulated other comprehensive income (loss) consist of the following (in thousands):
| | | | | | | | |
| | December 31, | |
| | 2024 | | | 2023 | |
Pension and other postretirement benefit plans - unrecognized prior service costs and net actuarial loss | | $ | (5,890 | ) | | $ | (5,914 | ) |
Interest rate swaps - net fair value gain | | | 121 | | | | 942 | |
Total accumulated other comprehensive income (loss) | | $ | (5,769 | ) | | $ | (4,972 | ) |
15. DERIVATIVE INSTRUMENTS AND HEDGING ACTIVITIES
We are exposed to market risks related to fluctuations in interest rates. To mitigate these risks, we utilize derivative instruments in the form of interest rate swaps. We do not enter into derivative transactions for speculative purposes.
Under the Company’s Credit Facility, the SOFR plus 2.00% to SOFR plus 3.00% will be applied to outstanding borrowings. See Note 11 - Long-term Debt, net for additional information. The Company has elected to apply the optional expedient for hedging relationships affected by reference rate reform. Accordingly, no outstanding balance on the Credit Facility with a SOFR rate will preclude cash flow hedging with existing London Inter-Bank Offer Rate (“LIBOR”) hedging instruments.
In August 2014, we entered into a swap agreement, that would have expired August 29, 2024, with a notional amount of $25 million (“2014 Variable-to-Fixed Swap”), and the LIBOR portion of the interest rate was fixed at 2.5%. In February 2020, we entered into a second swap agreement with a notional amount of $25 million (“2020 Variable-to-Fixed Swap”), and the LIBOR
portion of the interest rate was fixed at 1.3% through February 28, 2025. These interest rate swap agreements were terminated, dedesignated and settled in March 2021. The hedging relationship is highly effective; therefore, gains and losses on these swaps are reclassified into interest expense in accordance with the forecasted transactions or the scheduled interest payments on the Credit Facility. The 2014 Variable-to-Fixed Swap was fully amortized during the year ended December 31, 2024. The remaining net gain on the 2020 Variable-to-Fixed Swap included in accumulated other comprehensive income (loss) at December 31, 2024, is nominal, and will be reclassified into earnings as interest payments are made on the Company’s Credit Facility through February 2025.
In March 2021, we entered into a new forward interest rate swap agreement and carried the fair value of the terminated 2014 and 2020 Variable-to-Fixed Swaps into the new agreement in a “blend and extend” structured transaction. The purpose of this forward interest rate swap agreement is to fix the underlying risk-free rate, that would be associated with the anticipated issuance of new long-term debt by the Company in future periods. The forward interest rate swap would hedge the risk-free rate on forecasted long-term debt for a maximum of 11 years through March 2033. Risk associated with future changes in the 10-year LIBOR interest rates have been fixed up to a notional amount of $60 million with this instrument. The interest rate swap qualifies as a cash flow hedging instrument. The forward interest rate swap agreement was terminated and settled in April 2022. The hedging relationship is highly effective, therefore, the gain on the termination of the forward interest rate swap was included in accumulated other comprehensive income (loss). In June 2023, the Company issued the 2023 Senior Notes with an aggregate principal amount of $50 million at fixed interest rates of 7.25% and 7.50%. The Company has elected to apply the optional expedient for hedging relationships affected by reference rate reform. Accordingly, no outstanding balance on the 2023 Senior Notes will preclude cash flow hedging with the existing LIBOR hedging instrument. The Company recognized a gain of $0.4 million in earnings for the $10 million over hedged portion of the interest rate swap in 2023. A net gain of $0.1 million is included in accumulated other comprehensive income (loss) at December 31, 2024. The unamortized balance on this swap will be amortized into interest expense in accordance with the forecasted transactions or the scheduled interest payments on the 2023 Senior Notes and any future debt through March 2033.
As of December 31, 2024, the aggregated gains and losses on these interest swaps that are included in accumulated other comprehensive income (loss) are a net gain of $0.1 million.
As of December 31, 2024, we had fixed rate long-term debt aggregating $110 million and variable rate long-term debt aggregating $18 million.
The effect of the interest rate swaps on the consolidated statements of operations was as follows (in thousands):
| | | | | | | | | | | | | | |
| | For the Years Ended December 31, | | | |
| | 2024 | | | 2023 | | | 2022 | | | Income Statement Classification |
Derivatives designated as hedges: | | | | | | | | | | | |
5 year interest rate swap | | $ | 57 | | | $ | 260 | | | $ | 343 | | | Increase (decrease) to interest expense |
10 year interest rate swap | | | (1,097 | ) | | | (752 | ) | | | 655 | | | Increase (decrease) to interest expense |
| | $ | (1,040 | ) | | $ | (492 | ) | | $ | 998 | | | |
16. FINANCIAL INSTRUMENTS
The Company’s only financial assets and liabilities which are measured at fair value on a recurring basis relate to certain aspects of the Company’s benefit plans. We use the market approach to determine the fair value of these assets and liabilities using significant other observable inputs (Level 2) with the assistance of a third-party specialist. We do not have any assets or liabilities measured at fair value on a recurring basis using quoted prices in an active market (Level 1) or significant
unobservable inputs (Level 3). Gains and losses related to the fair value changes in the financial assets and liabilities are recorded in general and administrative expense in the consolidated statements of operations.
The following table summarizes the fair value balances (in thousands):
| | | | | | | | | | | | | | | | |
| | Fair Value Measurement at December 31, 2024 | |
| | Total | | | Level 1 | | | Level 2 | | | Level 3 | |
Assets: | | | | | | | | | | | | |
Company owned life insurance policies (1) | | $ | 25,435 | | | $ | — | | | $ | 25,435 | | | $ | — | |
| | $ | 25,435 | | | $ | — | | | $ | 25,435 | | | $ | — | |
| | | | | | | | | | | | |
Liabilities: | | | | | | | | | | | | |
Deferred compensation liabilities | | $ | 19,103 | | | $ | — | | | $ | 19,103 | | | $ | — | |
| | $ | 19,103 | | | $ | — | | | $ | 19,103 | | | $ | — | |
| | | | | | | | | | | | | | | | |
| | Fair Value Measurement at December 31, 2023 | |
| | Total | | | Level 1 | | | Level 2 | | | Level 3 | |
Assets: | | | | | | | | | | | | |
Company owned life insurance policies (1) | | $ | 25,397 | | | $ | — | | | $ | 25,397 | | | $ | — | |
| | $ | 25,397 | | | $ | — | | | $ | 25,397 | | | $ | — | |
| | | | | | | | | | | | |
Liabilities: | | | | | | | | | | | | |
Deferred compensation liabilities | | $ | 17,299 | | | $ | — | | | $ | 17,299 | | | $ | — | |
| | $ | 17,299 | | | $ | — | | | $ | 17,299 | | | $ | — | |
(1) Company owned life insurance policies have cash surrender value and are intended to assist in funding deferred compensation liabilities and other benefit plans.
17. STOCK-BASED COMPENSATION
See Note 14 – Equity regarding the assignment and assumption of the following plans by Core Laboratories N.V. to Core Laboratories Inc. as a result of the Redomestication Transaction.
We have two stock incentive plans: the 2024 Long-Term Incentive Plan (the “LTIP”) and the 2023 Non-Employee Director Stock Incentive Plan (the “Director Plan”). We issue shares from either treasury stock or authorized common stock for the following stock-based compensation plans. In 2024, we issued 228,413 shares out of treasury stock and 28,311 shares out of authorized common stock. We do not use cash to settle equity instruments issued under stock-based compensation awards.
2024 Long-Term Incentive Plan
Under the LTIP, awards may be granted to eligible employees until May 8, 2034, and the maximum number of shares available for award is 14,100,000 shares. At December 31, 2024, approximately 1,569,741 shares remained available for the grant of new awards.
We have granted restricted stock awards under two programs: (1) the Performance Share Award Program (“PSAP”); and (2) the Restricted Share Award Program (“RSAP”).
Performance Share Award Program
The PSAP allows us to compensate our executive and senior management teams as we meet or exceed our business objectives. The PSAP shares are unvested and may not be sold, assigned, pledged, hedged, margined or otherwise transferred by an award recipient until such time as, and then only to the extent that, the restricted performance shares have vested. In the event of a change in control (as defined in the LTIP) prior to the last day of the Performance Period, as defined, all of the award recipient’s restricted performance shares will vest as of the effective date of such change in control. Subject to continued employment with us, or upon death or disability, PSAP shares vest if we meet or exceed our business objectives.
Stock compensation expense includes $3.5 million, $6.5 million and $3.9 million of additional non-cash stock compensation expense in the years ended December 31, 2024, 2023 and 2022, respectively, for certain members of our executive management team who became retirement eligible during those years. The additional stock compensation expense has been recorded in accordance with FASB ASC Topic 718, “Compensation - Stock Compensation”, which states that the period over which stock
compensation expense is recognized should not extend beyond the eligible retirement age as defined in each executive’s PSAP award agreement. The PSAP awards remain unvested until the end of the performance period, and it can be determined whether the performance criteria have been achieved. The executive will not forfeit the right to vest in the awarded shares if they voluntarily retire from the Company after attaining the retirement age as defined in each agreement. These amounts are reflected in the totals below.
On February 17, 2022, certain members of our executive and senior management teams were awarded rights to receive an aggregate of up to 362,254 shares, which include shares that may be awarded if above target level. The target level is achieved if our calculated return on invested capital (“ROIC”), as defined in the PSAP agreement, achieves certain performance criteria as compared to the Bloomberg Peer Group, as defined in the PSAP agreement, at the end of the performance period, which ends on the last trading day of 2024. Shares may be awarded above the target level, subject to ROIC performance and certain total shareholder return (“TSR”) performance criteria, as defined in the PSAP agreement. This arrangement is recorded as an equity award that requires us to recognize compensation expense originally estimated at $9.3 million over the shorter of the 3-year performance period or requisite service period, as determined for each participant individually. In 2024, we reversed $4.6 million of previously recognized expense to revalue the awards to their grant date fair value, upon final determination of the performance criteria and certain forfeitures during the year. We have recognized expense of $1.2 million and $6.4 million in 2023 and 2022, respectively. We issued a total of 112,389 awards valued at $3.0 million. The participants surrendered 69,116 shares to settle any personal tax liabilities which may result from the award, as permitted by the agreement. We recorded these surrendered shares as treasury stock with an aggregate cost of $1.2 million at $17.31 per share.
On February 16, 2023, certain members of our executive and senior management teams were awarded rights to receive an aggregate of up to 507,410 shares, which include shares that may be awarded if above target level. The target level is achieved if our calculated ROIC, as defined in the PSAP agreement, achieves certain performance criteria as compared to the Bloomberg Peer Group, as defined in the PSAP agreement, at the end of the performance period, which ends on the last trading day of 2025. Shares may be awarded above the target level, subject to ROIC performance and certain TSR performance criteria, as defined in the PSAP agreement. This arrangement is recorded as an equity award that requires us to recognize compensation expense estimated at $12.3 million over the shorter of the 3-year performance period or requisite service period, as determined for each participant individually. We reduced the estimated expense by $1.2 million in 2024 based on current expected performance levels, and we have recognized expense of $0.4 million and $8.4 million in 2024 and 2023, respectively. The unrecognized compensation expense is expected to be recognized over an estimated amortization period of 12 months.
On February 15, 2024, certain members of our executive and senior management teams were awarded rights to receive an aggregate of up to 830,785 shares, which include shares that may be awarded if above target level. The target level is achieved if our calculated ROIC, as defined in the PSAP agreement, achieves certain performance criteria as compared to the Bloomberg Peer Group, as defined in the PSAP agreement, at the end of the performance period, which ends on the last trading day of 2026 and shares awarded above the target level, subject to ROIC performance and certain TSR performance criteria, as defined in the PSAP agreement. This arrangement is recorded as an equity award that requires us to recognize compensation expense estimated at $11.8 million over the shorter of the 3-year performance period or requisite service period, as determined for each participant individually. We have recognized expense of $4.4 million in 2024. The unrecognized compensation expense is expected to be recognized over an estimated amortization period of 24 months.
Restricted Share Award Program
In 2004, the Compensation Committee of our Board of Directors approved the RSAP to attract and retain key employees, and to better align employee interests with those of our shareholders. Under this arrangement we awarded grants totaling 14,220 shares, 180,450 shares and 25,500 shares in 2024, 2023 and 2022, respectively. Each of these grants has a vesting period of principally either five or six years, and vests ratably or as specified in the award agreements, on an annual basis. There are no performance accelerators for early vesting for these awards. Awards under the RSAP are classified as equity awards and recorded at the grant-date fair value with the compensation expense recognized over the expected life of the award. As of December 31, 2024, there was $4.6 million of unrecognized total stock-based compensation expense relating to non-vested RSAP awards. The unrecognized compensation expense is expected to be recognized over an estimated weighted-average amortization period of 46 months. The grant-date fair value of shares granted was $0.2 million, $3.6 million and $0.5 million in 2024, 2023 and 2022, respectively. We recognized compensation expense of $2.7 million, $3.9 million and $4.5 million in 2024, 2023 and 2022, respectively. The total grant-date fair value, which is the intrinsic value, of the shares vested was $3.4 million, $4.1 million and $5.3 million in 2024, 2023 and 2022, respectively.
2023 Non-Employee Director Stock Incentive Plan
Under the Director Plan, awards may be granted until June 28, 2033 and the maximum number of shares available for award under this plan is 1,400,000 shares. As of December 31, 2024, approximately 436,340 shares remained available for the grant of new awards.
We have granted restricted stock awards under the Restricted Share Award Program for Non-Employee Directors (the “Director Program”). The Compensation Committee of our Board of Directors approved the Program to compensate our non-employee Directors.
Under this arrangement we awarded grants totaling 55,902 shares, 38,514 shares and 32,910 shares in 2024, 2023 and 2022, respectively. All shares awarded have a vesting period of one year for each grant. There are no performance accelerators for early vesting for these awards. Awards under the Program are classified as equity awards and recorded at the grant-date fair value with compensation expense recognized over the expected life of the award. As of December 31, 2024, there was $0.2 million of unrecognized stock-based compensation relating to non-vested Director Program awards. The unrecognized compensation expense is expected to be recognized over an estimated weighted-average amortization period of 3 months. The grant-date fair value of shares granted was $1.0 million, $0.9 million and $1.0 million in 2024, 2023 and 2022, respectively, and we have recognized compensation expense of $0.8 million, $0.9 million and $1.0 million in 2024, 2023 and 2022, respectively.
Equity Compensation Plan Information
Non-vested restricted share awards outstanding as of December 31, 2023 and changes during the year under both the LTIP and the Director Plan are as follows:
| | | | | | | | |
| | For the Year Ended December 31, 2024 | |
| | Number of Shares | | | Weighted Average Grant Date Fair Value per Share | |
Non-vested at December 31, 2023 | | | 1,234,487 | | | $ | 24.71 | |
Granted | | | 900,907 | | | $ | 14.40 | |
Vested | | | (256,724 | ) | | $ | 28.19 | |
Forfeited | | | (308,955 | ) | | $ | 24.08 | |
Non-vested at December 31, 2024 | | | 1,569,715 | | | $ | 18.35 | |
Stock-based compensation expense under both the LTIP and the Director Plan recognized in the consolidated statement of operations is as follows (in thousands):
| | | | | | | | | | | | |
| | For the Years Ended December 31, | |
| | 2024 | | | 2023 | | | 2022 | |
Cost of services and product sales | | $ | 1,847 | | | $ | 4,625 | | | $ | 4,572 | |
General and administrative expense | | | 1,908 | | | | 9,346 | | | | 3,184 | |
Total stock-based compensation expense | | $ | 3,755 | | | $ | 13,971 | | | $ | 7,756 | |
18. IMPAIRMENTS AND OTHER CHARGES
The geopolitical conflict between Russia and Ukraine, which began in February 2022 and has continued through December 31, 2024, has resulted in disruptions to our operations in Russia and Ukraine. As of December 31, 2024, all laboratory facilities, offices, and locations in Russia and Ukraine continued to operate with no significant impact to local business operations. Therefore, we determined there was no triggering event for long-lived assets in Russia and Ukraine, and no impairment assessments have been performed as of December 31, 2024.
For the years ended December 31, 2024, 2023 and 2022, there were no triggering events during the year, and we determined there was no impairment for any of our long-lived assets or asset groups.
We completed our annual impairment assessment of indefinite lived intangible assets and goodwill of our reporting units for the years ended December 31, 2024, 2023 and 2022, by performing qualitative assessments, which indicated we did not meet the threshold of more likely than not that there was impairment and therefore no quantitative tests were required. No
impairments were recorded for our indefinite lived intangible assets or goodwill for the years ended December 31, 2024, 2023 and 2022.
19. OTHER (INCOME) EXPENSE, NET
The components of other (income) expense, net are as follows (in thousands):
| | | | | | | | | | | | |
| | For the Years Ended December 31, | |
| | 2024 | | | 2023 | | | 2022 | |
Gain on sale of assets | | $ | (1,779 | ) | | $ | (200 | ) | | $ | (1,068 | ) |
Results of non-consolidated subsidiaries | | | (236 | ) | | | (394 | ) | | | (294 | ) |
Foreign exchange (gain) loss, net | | | 1,197 | | | | 176 | | | | 229 | |
Rents and royalties | | | (1,922 | ) | | | (698 | ) | | | (709 | ) |
Return on pension assets and other pension costs | | | (1,178 | ) | | | (1,365 | ) | | | (545 | ) |
Loss on lease abandonment and other exit costs | | | 699 | | | | 1,146 | | | | — | |
Assets write-down | | | 1,110 | | | | 1,143 | | | | — | |
Insurance and other settlements | | | (8,432 | ) | | | (604 | ) | | | (669 | ) |
Severance and other charges | | | 985 | | | | — | | | | 3,332 | |
ATM termination costs | | | — | | | | 455 | | | | — | |
Other, net | | | (397 | ) | | | (509 | ) | | | (998 | ) |
Total other (income) expense, net | | $ | (9,953 | ) | | $ | (850 | ) | | $ | (722 | ) |
In 2024 and 2022, we sold certain ownership interest in mineral rights of certain properties for a net gain of $1.4 million and $0.7 million, respectively, which is included in gain on sale of assets.
During the years ended December 31, 2024 and 2023, we abandoned certain leases in the U.S. and Canada and incurred lease abandonment and other exit costs of $0.7 million and $1.1 million, respectively. As a result of consolidating and exiting these facilities, the associated leasehold improvements, right of use assets and other assets of $1.1 million and $1.1 million were abandoned and expensed during the years ended December 31, 2024 and 2023, respectively.
In February 2024, we had a fire incident at one of our U.K. facilities and we have recorded partial settlements and certain net gains from insurance recovery of $8.4 million during the year ended December 31, 2024. Amounts associated with partial settlement for costs incurred and loss of income from business interruption are $4.0 million, and net gains associated with property, plant and equipment are $4.4 million.
During the year ended December 31, 2023, the State of Louisiana expropriated the access road to one of our facilities and paid us a settlement of $0.6 million. The North America mid-continent winter storm in February 2021 caused business interruptions and property losses to certain facilities, and we received insurance settlements of $0.7 million in 2022.
During the year ended December 31, 2023, we wrote off previously deferred costs of $0.5 million upon termination of our 2022 ATM Program. See Note 14 - Equity for additional information.
Foreign Currency Risk
We operate in a number of international areas which exposes us to foreign currency exchange rate risk. We do not currently hold or issue forward exchange contracts or other derivative instruments for hedging or speculative purposes. Foreign exchange gains and losses result from fluctuations in the USD against foreign currencies and are included in other (income) expense, net in the consolidated statements of operations. We recognized foreign exchange losses in countries where the USD weakened against the local currency and we had net monetary liabilities denominated in the local currency; as well as countries where the USD strengthened against the local currency and we had net monetary assets denominated in the local currency. We recognized foreign exchange gains in countries where the USD strengthened against the local currency and we had net monetary liabilities
denominated in the local currency and in countries where the USD weakened against the local currency and we had net monetary assets denominated in the local currency.
Foreign exchange (gain) loss, net is summarized in the following table (in thousands):
| | | | | | | | | | | | |
| | For the Years Ended December 31, | |
| | 2024 | | | 2023 | | | 2022 | |
Angolan Kwanza | | $ | (46 | ) | | $ | 188 | | | $ | (2 | ) |
Australian Dollar | | | (2 | ) | | | 81 | | | | 9 | |
British Pound | | | 117 | | | | (408 | ) | | | 212 | |
Canadian Dollar | | | 293 | | | | 156 | | | | 238 | |
Colombian Peso | | | 62 | | | | 92 | | | | (430 | ) |
Euro | | | 41 | | | | 438 | | | | (382 | ) |
Indonesian Rupiah | | | 315 | | | | 82 | | | | 379 | |
Nigerian Naira | | | 126 | | | | (74 | ) | | | (39 | ) |
Norwegian Krone | | | (20 | ) | | | 103 | | | | (31 | ) |
Russian Ruble | | | 36 | | | | (375 | ) | | | 35 | |
Turkish Lira | | | 53 | | | | (472 | ) | | | 114 | |
Other currencies, net | | | 222 | | | | 365 | | | | 126 | |
Foreign exchange (gain) loss, net | | $ | 1,197 | | | $ | 176 | | | $ | 229 | |
20. EARNINGS PER SHARE
We compute basic earnings per share by dividing net income attributable to Core Laboratories Inc. by the number of weighted average common shares outstanding during the period. Diluted earnings per share includes the incremental effect of contingently issuable shares from performance and restricted stock awards, as determined using the treasury stock method. The Redomestication Transaction had no effect on earnings per share for the periods presented.
The following table summarizes the calculation of weighted average common shares outstanding used in the computation of basic and diluted earnings per share (in thousands):
| | | | | | | | | | | | |
| | For the Years Ended December 31, | |
| | 2024 | | | 2023 | | | 2022 | |
Weighted average common shares outstanding - basic | | | 46,897 | | | | 46,683 | | | | 46,334 | |
Effect of dilutive securities: | | | | | | | | | |
Restricted shares | | | 52 | | | | 97 | | | | 71 | |
Performance shares | | | 736 | | | | 743 | | | | 408 | |
Weighted average common shares outstanding - diluted | | | 47,685 | | | | 47,523 | | | | 46,813 | |
21. SEGMENT REPORTING AND OTHER DISAGGREGATED INFORMATION
Segment Reporting
We operate our business in two segments. These complementary operating segments provide different services and products and utilize different technologies for evaluating and improving reservoir performance and increasing oil and gas recovery from new and existing fields:
•Reservoir Description: Encompasses the characterization of petroleum reservoir rock and reservoir fluids samples to increase production and improve recovery of crude oil and natural gas from our clients’ reservoirs. We provide laboratory-based analytical and field services to characterize properties of crude oil and crude oil-derived products to the oil and gas industry. Services associated with these fluids include determining the quality and measuring the quantity of the reservoir fluids and their derived products, such as gasoline, diesel and biofuels. We also provide proprietary and joint industry studies based on these types of analyses and manufacture associated laboratory equipment. In addition, we provide reservoir description capabilities that support various activities associated with energy transition projects, including services that support carbon capture, utilization and storage, geothermal
projects, and the evaluation and appraisal of mining activities around lithium and other elements necessary for energy storage.
•Production Enhancement: Includes services and manufactured products associated with reservoir well completions, perforations, stimulation, production and well abandonment. We provide integrated diagnostic services to evaluate and monitor the effectiveness of well completions and to develop solutions aimed at increasing the effectiveness of enhanced oil recovery projects.
We use the same accounting policies to prepare our operating segment results as are used to prepare our consolidated financial statements. All interest and other non-operating income (expense) is attributable to Corporate & Other and is not allocated to specific operating segments.
Our chief operating decision maker (“CODM”) is our chief executive officer and Chairman of the Board of Directors. The CODM uses revenue from unaffiliated clients and segment operating income to allocate resources, primarily for working capital, staffing, and capital expenditures, during the annual budgeting process and monthly when comparing actual results to budgeted and forecasted results.
Summarized financial information of our operating segments is shown in the following table (in thousands):
| | | | | | | | | | | | | | | | |
As at and for the years ended: | | Reservoir Description | | | Production Enhancement | | | Corporate & Other (1) | | | Consolidated | |
December 31, 2024 | | | | | | | | | | | | |
CODM Measure - Revenue from unaffiliated clients | | $ | 346,146 | | | $ | 177,702 | | | $ | — | | | $ | 523,848 | |
Reconciliation of CODM measure - revenue from unaffiliated clients to segment operating income: | |
Inter-segment revenue | | | 123 | | | | 214 | | | | (337 | ) | | | — | |
Cost of services and product sales | | | 269,169 | | | | 151,916 | | | | (563 | ) | | | 420,522 | |
Depreciation and amortization | | | 10,660 | | | | 4,293 | | | | — | | | | 14,953 | |
General and administrative expense (2) | | | 25,531 | | | | 14,239 | | | | — | | | | 39,770 | |
Other operating (income) expense, net (3) | | | (11,542 | ) | | | 550 | | | | (158 | ) | | | (11,150 | ) |
Foreign exchange (gain) loss, net (3) | | | 985 | | | | 306 | | | | (94 | ) | | | 1,197 | |
CODM Measure - Segment operating income | | | 51,466 | | | | 6,612 | | | | 478 | | | | 58,556 | |
Supplemental Disclosures: | | | | | | | | | | | | |
Total assets | | | 322,764 | | | | 149,446 | | | | 118,196 | | | | 590,406 | |
Capital expenditures | | | 11,413 | | | | 1,318 | | | | 297 | | | | 13,028 | |
| | | | | | | | | | | | |
December 31, 2023 | | | | | | | | | | | | |
CODM Measure - Revenue from unaffiliated clients | | $ | 333,345 | | | $ | 176,445 | | | $ | — | | | $ | 509,790 | |
Reconciliation of CODM measure - revenue from unaffiliated clients to segment operating income: | |
Inter-segment revenue | | | 156 | | | | 249 | | | | (405 | ) | | | — | |
Cost of services and product sales | | | 256,480 | | | | 145,194 | | | | (1,717 | ) | | | 399,957 | |
Depreciation and amortization | | | 11,462 | | | | 4,322 | | | | — | | | | 15,784 | |
General and administrative expense (2) | | | 25,792 | | | | 14,467 | | | | — | | | | 40,259 | |
Other operating (income) expense, net (3) | | | (994 | ) | | | (5 | ) | | | (27 | ) | | | (1,026 | ) |
Foreign exchange (gain) loss, net (3) | | | (278 | ) | | | 197 | | | | 257 | | | | 176 | |
CODM Measure - Segment operating income | | | 41,039 | | | | 12,519 | | | | 1,082 | | | | 54,640 | |
Supplemental Disclosures: | | | | | | | | | | | | |
Total assets | | | 309,162 | | | | 161,359 | | | | 115,874 | | | | 586,395 | |
Capital expenditures | | | 8,312 | | | | 1,808 | |
| | 459 | | | | 10,579 | |
| | | | | | | | | | | | |
December 31, 2022 | | | | | | | | | | | | |
CODM Measure - Revenue from unaffiliated clients | | $ | 307,691 | | | $ | 182,044 | | | $ | — | | | $ | 489,735 | |
Reconciliation of CODM measure - revenue from unaffiliated clients to segment operating income: | |
Inter-segment revenue | | | 523 | | | | 315 | | | | (838 | ) | | | — | |
Cost of services and product sales | | | 250,182 | | | | 145,117 | | | | (1,644 | ) | | | 393,655 | |
Depreciation and amortization | | | 12,207 | | | | 4,954 | | | | — | | | | 17,161 | |
General and administrative expense (2) | | | 24,264 | | | | 13,853 | | | | — | | | | 38,117 | |
Other operating (income) expense, net (3) | | | (1,089 | ) | | | 1,414 | | | | (1,276 | ) | | | (951 | ) |
Foreign exchange (gain) loss, net (3) | | | (252 | ) | | | 670 | | | | (189 | ) | | | 229 | |
CODM Measure - Segment operating income | | | 22,902 | | | | 16,351 | | | | 2,271 | | | | 41,524 | |
Supplemental Disclosures: | | | | | | | | | | | | |
Total assets | | | 307,108 | | | | 159,628 | | | | 111,618 | | | | 578,354 | |
Capital expenditures | | | 7,458 | | | | 2,181 | | | | 577 | | | | 10,216 | |
(1) “Corporate and other” represents those items not directly related to a particular operating segment and eliminations.
(2) General and administrative expense is presented as a total amount to the CODM and consists primarily of employee benefits, professional fees and information technology costs.
(3) Other remaining balance is included in other (income) expense, net. See Note 19 - Other (income) expense, net for further detail.
Disaggregated Revenue
We derive our revenue from services and product sales contracts with clients primarily in the oil and gas industry. No single client accounted for 10% or more of revenue in any of the periods presented. Summarized financial information of our contracts is shown in the following table (in thousands):
| | | | | | | | | | | | |
| | For the Years Ended December 31, | |
| | 2024 | | | 2023 | | | 2022 | |
Reservoir Description Services | | $ | 334,325 | | | $ | 322,921 | | | $ | 296,201 | |
Production Enhancement Services | | | 53,880 | | | | 48,993 | | | | 50,773 | |
Total Revenue - Services | | $ | 388,205 | | | $ | 371,914 | | | $ | 346,974 | |
| | | | | | | | | |
Reservoir Description Product sales | | $ | 11,821 | | | $ | 10,424 | | | $ | 11,490 | |
Production Enhancement Product sales | | | 123,822 | | | | 127,452 | | | | 131,271 | |
Total Revenue - Product sales | | $ | 135,643 | | | $ | 137,876 | | | $ | 142,761 | |
| | | | | | | | | |
Total Revenue | | $ | 523,848 | | | $ | 509,790 | | | $ | 489,735 | |
We attribute service revenue to the country in which the service was performed rather than where the reservoir or project is located while we attribute product sales revenue to the country where the product was shipped as we feel this gives a clearer view of our operations. We do, however, have significant levels of service revenue performed and recorded in the U.S. that are sourced from projects on non-U.S. oilfields. Summarized financial information of our geographic regions is shown in the following table (in thousands):
| | | | | | | | | | | | |
| | | | | Other | | | | |
As at and for the years ended: | | United States | | | Countries (1) (2) | | | Consolidated | |
December 31, 2024 | | | | | | | | | |
Revenue | | $ | 178,895 | | | $ | 344,953 | | | $ | 523,848 | |
Property, plant and equipment, net | | | 46,666 | | | | 50,397 | | | | 97,063 | |
| | | | | | | | | |
December 31, 2023 | | | | | | | | | |
Revenue | | $ | 178,549 | | | $ | 331,241 | | | $ | 509,790 | |
Property, plant and equipment, net | | | 50,792 | | | | 48,834 | | | | 99,626 | |
| | | | | | | | | |
December 31, 2022 | | | | | | | | | |
Revenue | | $ | 166,701 | | | $ | 323,034 | | | $ | 489,735 | |
Property, plant and equipment, net | | | 54,384 | | | | 50,644 | | | | 105,028 | |
(1) Revenue earned in other countries, was not individually greater than 10% of our consolidated revenue in 2024, 2023 and 2022.
(2) Property, plant and equipment, net in other countries, was not individually greater than 10% of our consolidated property, plant and equipment, net in 2024, 2023 and 2022.
CORE LABORATORIES INC.
Schedule II - Valuation and Qualifying Account
(In thousands)
| | | | | | | | | | | | | | | | | | | | |
| | Balance at Beginning of Period | | | Additions Charged to/(Recovered from) Expense | | | Write-offs | | | Other (1) | | | Balance at End of Period | |
Year ended December 31, 2024 | | | | | | | | | | | | | | | |
Reserve for credit losses | | $ | 2,280 | | | $ | 1,203 | | | $ | (298 | ) | | $ | 7 | | | $ | 3,192 | |
Year ended December 31, 2023 | | | | | | | | | | | | | | | |
Reserve for credit losses | | $ | 2,214 | | | $ | 179 | | | $ | (113 | ) | | $ | — | | | $ | 2,280 | |
Year ended December 31, 2022 | | | | | | | | | | | | | | | |
Reserve for credit losses | | $ | 3,225 | | | $ | (6 | ) | | $ | (1,006 | ) | | $ | 1 | | | $ | 2,214 | |
(1) Comprised primarily of differences due to changes in exchange rate.