
December 4, 2012 Doug Braunstein, Chief Financial Officer Goldman Sachs U.S. Financial Services Conference
I. JPMorgan Chase overview Performance summary II. NIR, NII and NIM NIR NII and NIM drivers – Loans NII and NIM drivers – Deposits NII and NIM drivers – Investment portfolio and duration III. Consumer & Community Banking and Corporate & Investment Bank new disclosure IV. Outlook V. Appendix Agenda 1 G O L D M A N S A C H S U . S . F I N A N C I A L S E R V I C E S C O N F E R E N C E
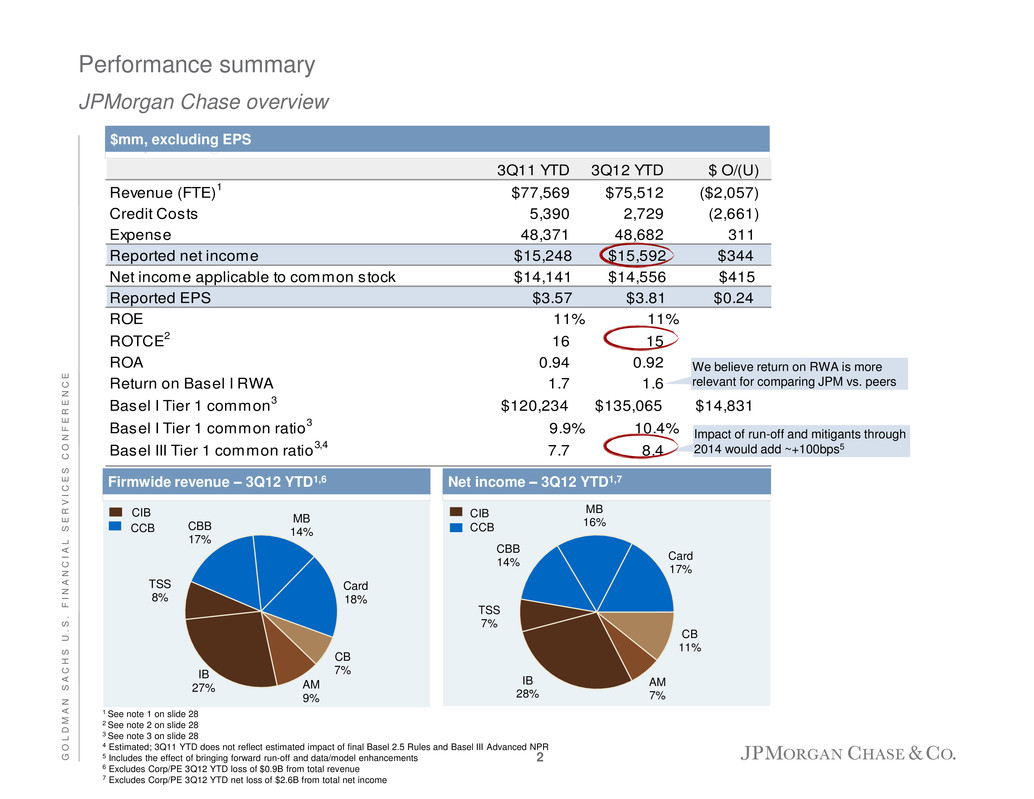
CB 11% TSS 7% AM 7% IB 28% CBB 14% Card 17% MB 16% CIB CCB CB 7% IB 27% AM 9% TSS 8% CBB 17% MB 14% Card 18% CCB 3Q11 YTD 3Q12 YTD $ O/(U) Revenue (FTE) 1 $77,569 $75,512 ($2,057) Credit Costs 5,390 2,729 (2,661) Expense 48,371 48,682 311 Reported net income $15,248 $15,592 $344 Net income applicable to common stock $14,141 $14,556 $415 Reported EPS $3.57 $3.81 $0.24 ROE 11% 11% ROTCE 2 16 15 ROA 0.94 0.92 Return on Basel I RWA 1.7 1.6 Basel I Tier 1 common 3 $120,234 $135,065 $14,831 Basel I Tier 1 common ratio 3 9.9% 10.4% Basel III Tier 1 common ratio 3,4 7.7 8.4 Performance summary JPMorgan Chase overview Impact of run-off and mitigants through 2014 would add ~+100bps5 We believe return on RWA is more relevant for comparing JPM vs. peers Firmwide revenue – 3Q12 YTD1,6 Net income – 3Q12 YTD1,7 $mm, excluding EPS CIB 1 See note 1 on slide 28 2 See note 2 on slide 28 3 See note 3 on slide 28 4 Estimated; 3Q11 YTD does not reflect estimated impact of final Basel 2.5 Rules and Basel III Advanced NPR 5 Includes the effect of bringing forward run-off and data/model enhancements 6 Excludes Corp/PE 3Q12 YTD loss of $0.9B from total revenue 7 Excludes Corp/PE 3Q12 YTD net loss of $2.6B from total net income 2 G O L D M A N S A C H S U . S . F I N A N C I A L S E R V I C E S C O N F E R E N C E
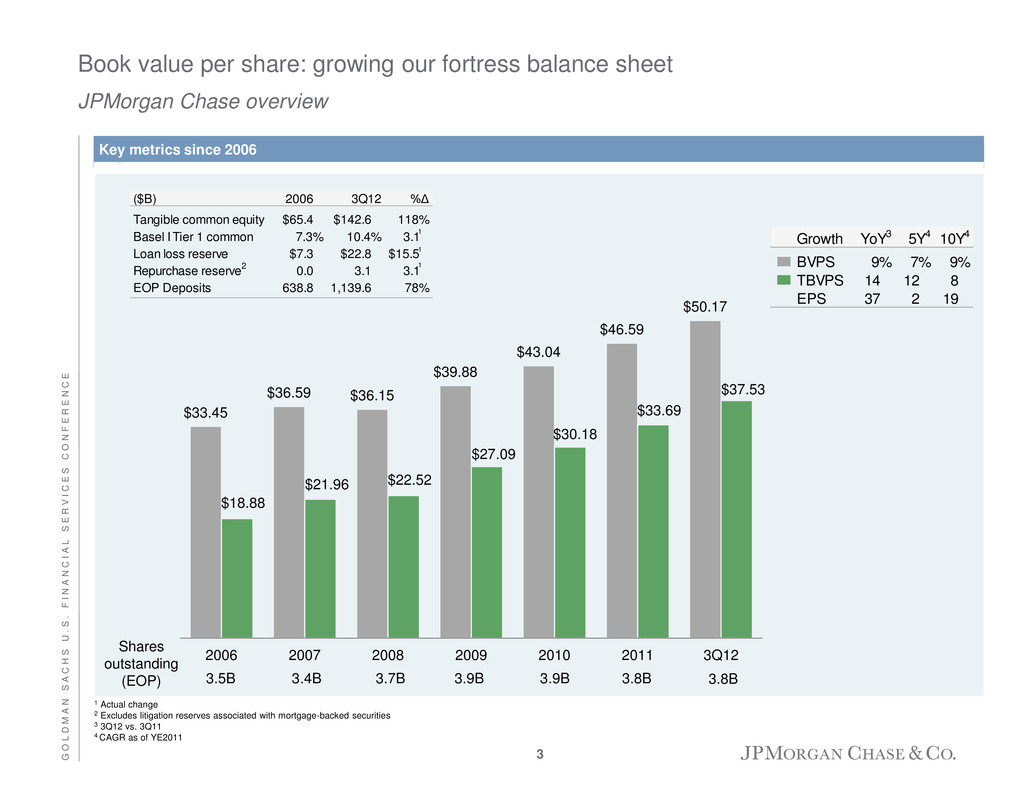
$33.45 $36.59 $36.15 $39.88 $43.04 $46.59 $50.17 $18.88 $21.96 $22.52 $27.09 $30.18 $33.69 $37.53 2006 2007 2008 2009 2010 2011 3Q12 Book value per share: growing our fortress balance sheet JPMorgan Chase overview Shares outstanding (EOP) 3.7B 3.9B 3.9B 3.8B 3.4B 3.5B 1 Actual change 2 Excludes litigation reserves associated with mortgage-backed securities 3 3Q12 vs. 3Q11 4 CAGR as of YE2011 Key metrics since 2006 1 1 ($B) 2006 3Q12 %Δ Tangible common equity $65.4 $142.6 118% Basel I Tier 1 common 7.3% 10.4% 3.1 Loan loss reserve $7.3 $22.8 $15.5 Repurchase reserve 2 0.0 3.1 3.1 EOP Deposits 638.8 1,139.6 78% 3.8B Growth YoY3 5Y4 10Y4 BVPS 9% 7% 9% TBVPS 14 12 8 EPS 37 2 19 1 3 G O L D M A N S A C H S U . S . F I N A N C I A L S E R V I C E S C O N F E R E N C E

Building market leading franchises JPMorgan Chase overview 1 Last twelve months 2 Averages in 3Q12 LTM column are 3Q12 YTD averages 3 Source: Inside Mortgage Finance, 4Q06 and 3Q12, respectively 4 Based on disclosures by peers and internal estimates as of 3Q12; GPCC stands for General Purpose Credit Card; excludes WaMu and Commercial Card 5 Source: Autocount as of 3Q12; share of all sales for new and recent used vehicles in franchised dealers 6 2006 IB data represents heritage JPM only 7 Customer deposits and other third party liabilities pertain to the Treasury Services and Securities Services businesses, and includes deposits, as well as deposits that are swept to on-balance sheet liabilities (i.e., commercial paper, federal funds purchased and securities loaned or sold under repurchase agreements) as part of customer cash management programs C C B 4 G O L D M A N S A C H S U . S . F I N A N C I A L S E R V I C E S C O N F E R E N C E Select key stats ($B, except where noted) 2006 3Q12 LTM1 2006-2012 CAGR Average total deposits2 $190.1 $388.0 12.6% Client investment assets (EOP) 80.6 154.6 11.5 Business Banking loans (EOP) 14.2 18.6 4.6 Number of branches 3,079 5,596 10.5 Mortgage loans originated $119.2 $168.2 5.9% Retail branch and direct to consumer originations 40.5 98.1 15.9 Number of branch salespeople 1,196 3,508 19.6 Mortgage loan origination market share3 5.8% 10.6% Card Services sales volume $256.8 $372.9 6.4% Card Services net revenue rate (% avg. loans) 10.4% 12.2% GPCC sales volume market share4 15.7 20.2 Auto originations market share5 3.1 4.5 IB fees ($mm)6 $5,537 $5,168 (1.1%) Securities Services ($mm)6 3,317 3,976 3.1 Fixed Income Markets ($mm)6 8,736 14,861 9.2 Equity Markets ($mm)6 3,458 4,317 3.8 Treasury Services ($mm)6 2,792 4,241 7.2 Average customer deposits & other third party liabilities2,7 189.5 352.1 10.9 Assets under custody ($T) 13.9 18.2 4.6 Average loan balances2 96.2 113.4 2.8 Average liability balances2 $73.6 $194.8 17.6% Average loans2 53.6 118.1 14.1 IB revenue, gross 0.7 1.5 13.5 Overhead ratio 52% 35% Assets under management $1,013 $1,381 5.3% Long-term flows 45.0 57.0 4.0 Number of Private Banking client advisors 1,506 2,826 11.0 Card AM CBB CB MB CIB
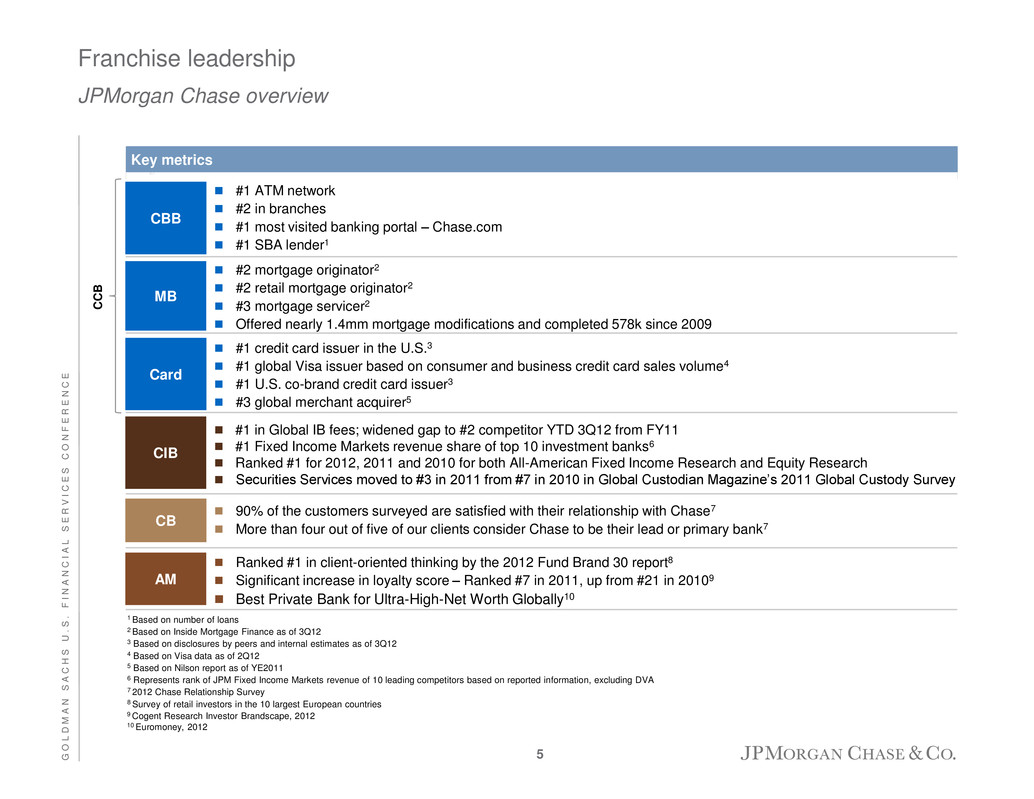
90% of the customers surveyed are satisfied with their relationship with Chase7 More than four out of five of our clients consider Chase to be their lead or primary bank7 Key metrics Franchise leadership JPMorgan Chase overview 1 Based on number of loans 2 Based on Inside Mortgage Finance as of 3Q12 3 Based on disclosures by peers and internal estimates as of 3Q12 4 Based on Visa data as of 2Q12 5 Based on Nilson report as of YE2011 6 Represents rank of JPM Fixed Income Markets revenue of 10 leading competitors based on reported information, excluding DVA 7 2012 Chase Relationship Survey 8 Survey of retail investors in the 10 largest European countries 9 Cogent Research Investor Brandscape, 2012 10 Euromoney, 2012 AM MB Card #1 credit card issuer in the U.S.3 #1 global Visa issuer based on consumer and business credit card sales volume4 #1 U.S. co-brand credit card issuer3 #3 global merchant acquirer5 CB CBB #1 ATM network #2 in branches #1 most visited banking portal – Chase.com #1 SBA lender1 Ranked #1 in client-oriented thinking by the 2012 Fund Brand 30 report8 Significant increase in loyalty score – Ranked #7 in 2011, up from #21 in 20109 Best Private Bank for Ultra-High-Net Worth Globally10 CIB #1 in Global IB fees; widened gap to #2 competitor YTD 3Q12 from FY11 #1 Fixed Income Markets revenue share of top 10 investment banks6 Ranked #1 for 2012, 2011 and 2010 for both All-American Fixed Income Research and Equity Research Securities Services moved to #3 in 2011 from #7 in 2010 in Global Custodian Magazine’s 2011 Global Custody Survey C C B #2 mortgage originator2 #2 retail mortgage originator2 #3 mortgage servicer2 Offered nearly 1.4mm mortgage modifications and completed 578k since 2009 5 G O L D M A N S A C H S U . S . F I N A N C I A L S E R V I C E S C O N F E R E N C E
Agenda Page 6 NIR, NII and NIM 6 CCB and CIB new disclosure 17 Outlook 24 Appendix 26 G O L D M A N S A C H S U . S . F I N A N C I A L S E R V I C E S C O N F E R E N C E JPMorgan Chase overview 2
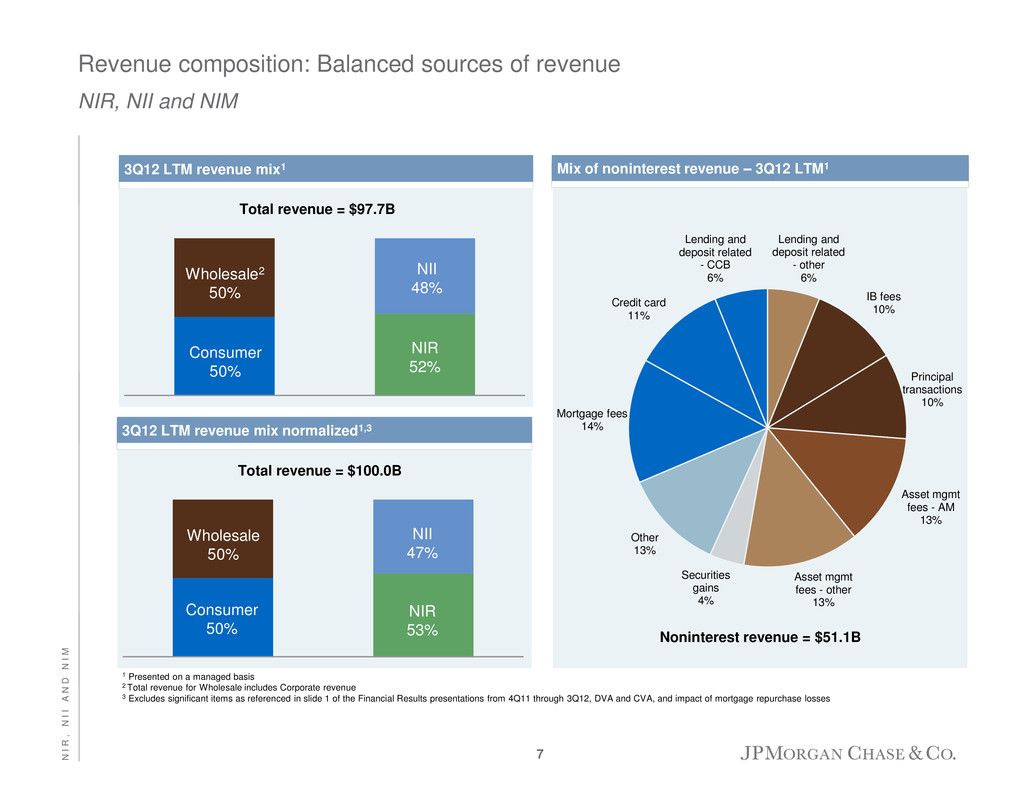
Lending and deposit related - other 6% IB fees 10% Principal transactions 10% Asset mgmt fees - AM 13% Asset mgmt fees - other 13% Securities gains 4% Other 13% Mortgage fees 14% Credit card 11% Lending and deposit related - CCB 6% Revenue composition: Balanced sources of revenue NIR, NII and NIM Noninterest revenue = $51.1B Mix of noninterest revenue – 3Q12 LTM1 3Q12 LTM revenue mix1 1 Presented on a managed basis 2 Total revenue for Wholesale includes Corporate revenue 3 Excludes significant items as referenced in slide 1 of the Financial Results presentations from 4Q11 through 3Q12, DVA and CVA, and impact of mortgage repurchase losses Wholesale2 50% Consumer 50% NIR 52% NII 48% Total revenue = $97.7B Wholesale 50% Consumer 50% NIR 53% NII 47% Total revenue = $100.0B 3Q12 LTM revenue mix normalized1,3 7 N I R , N I I A N D N I M
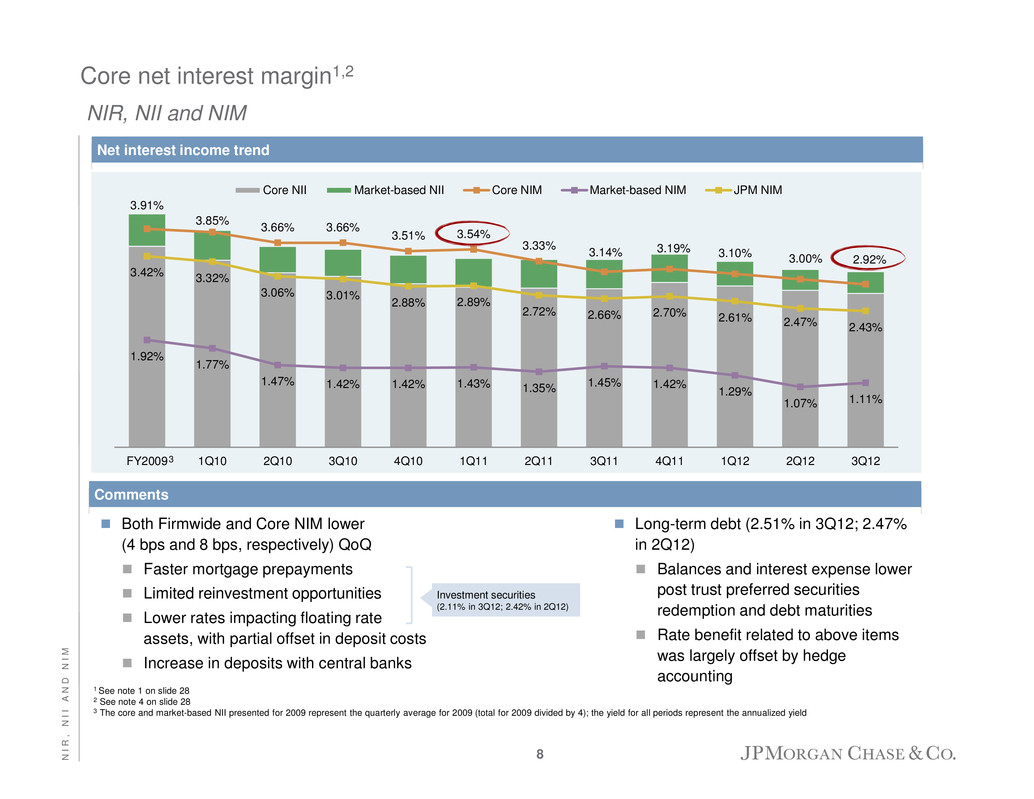
Core net interest margin1,2 NIR, NII and NIM 1 See note 1 on slide 28 2 See note 4 on slide 28 3 The core and market-based NII presented for 2009 represent the quarterly average for 2009 (total for 2009 divided by 4); the yield for all periods represent the annualized yield Both Firmwide and Core NIM lower (4 bps and 8 bps, respectively) QoQ Faster mortgage prepayments Limited reinvestment opportunities Lower rates impacting floating rate assets, with partial offset in deposit costs Increase in deposits with central banks Comments Long-term debt (2.51% in 3Q12; 2.47% in 2Q12) Balances and interest expense lower post trust preferred securities redemption and debt maturities Rate benefit related to above items was largely offset by hedge accounting Net interest income trend Investment securities (2.11% in 3Q12; 2.42% in 2Q12) 3.91% 3.85% 3.66% 3.66% 3.51% 3.54% 3.33% 3.14% 3.19% 3.10% 3.00% 2.92% 1.92% 1.77% 1.47% 1.42% 1.42% 1.43% 1.35% 1.45% 1.42% 1.29% 1.07% 1.11% 3.42% 3.32% 3.06% 3.01% 2.88% 2.89% 2.72% 2.66% 2.70% 2.61% 2.47% 2.43% FY2009 1Q10 2Q10 3Q10 4Q10 1Q11 2Q11 3Q11 4Q11 1Q12 2Q12 3Q12 Core NII Market-based NII Core NIM Market-based NIM JPM NIM 3 8 N I R , N I I A N D N I M
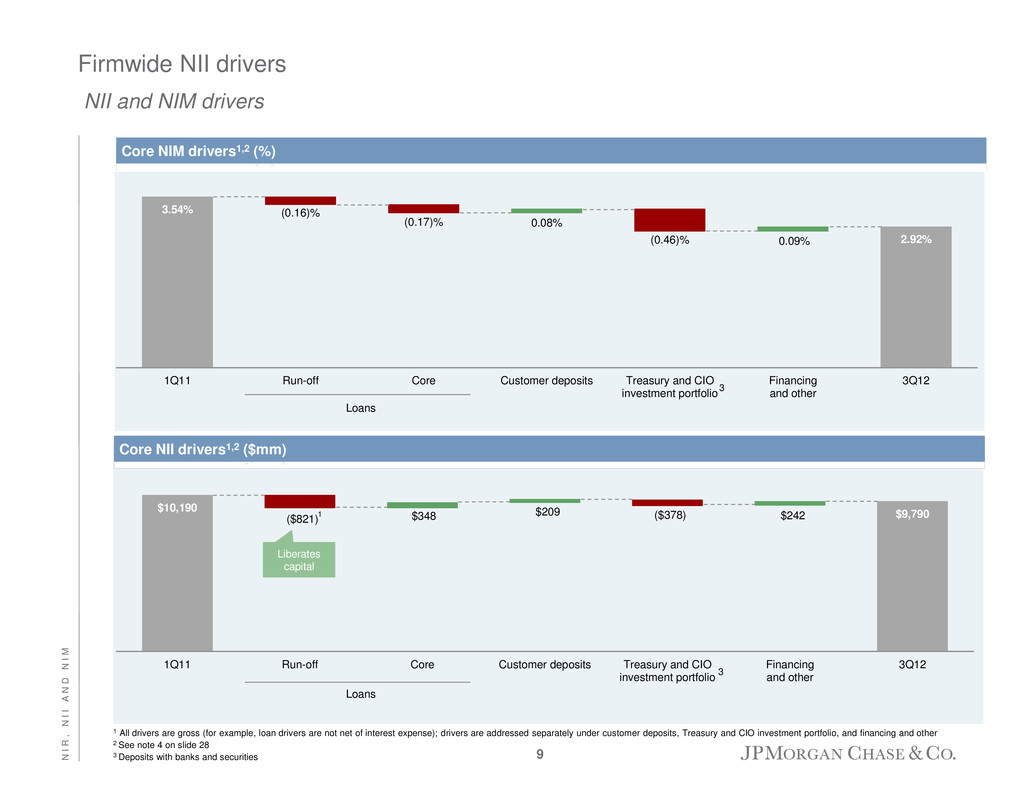
Firmwide NII drivers NII and NIM drivers Core NIM drivers1,2 (%) 3.54% 2.92% (0.16)% (0.17)% 0.08% (0.46)% 0.09% 1Q11 Run-off Core Customer deposits Treasury and CIO investment portfolio Financing and other 3Q12 $10,190 $9,790 ($821) $348 $209 ($378) $242 1Q11 Run-off Core Customer deposits Treasury and CIO investment portfolio Financing and other 3Q12 Core NII drivers1,2 ($mm) Liberates capital 1 1 All drivers are gross (for example, loan drivers are not net of interest expense); drivers are addressed separately under customer deposits, Treasury and CIO investment portfolio, and financing and other 2 See note 4 on slide 28 3 Deposits with banks and securities Loans Loans 3 3 9 N I R , N I I A N D N I M
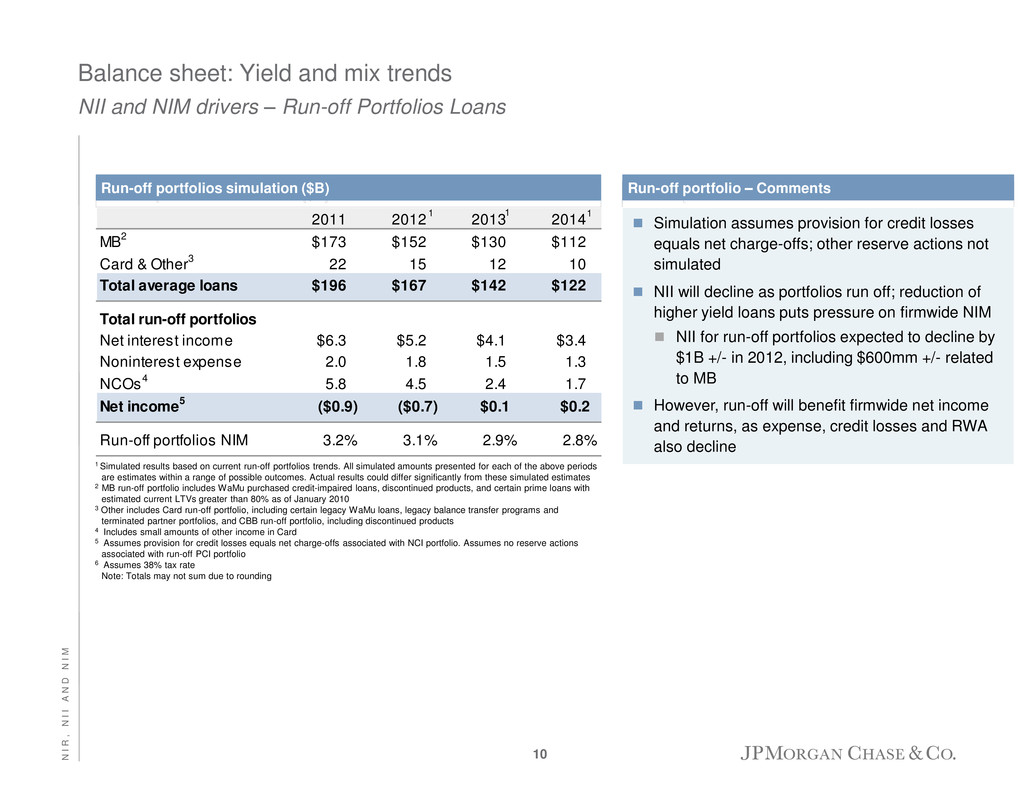
Balance sheet: Yield and mix trends NII and NIM drivers – Run-off Portfolios Loans 2011 2012 2013 2014 MB 2 $173 $152 $130 $112 Card & Other 3 22 15 12 10 Total average loans $196 $167 $142 $122 Total run-off portfolios Net interest income $6.3 $5.2 $4.1 $3.4 Noninterest expense 2.0 1.8 1.5 1.3 NCOs 4 5.8 4.5 2.4 1.7 Net income 5 ($0.9) ($0.7) $0.1 $0.2 Run-off portfolios NIM 3.2% 3.1% 2.9% 2.8% 1 Simulated results based on current run-off portfolios trends. All simulated amounts presented for each of the above periods are estimates within a range of possible outcomes. Actual results could differ significantly from these simulated estimates 2 MB run-off portfolio includes WaMu purchased credit-impaired loans, discontinued products, and certain prime loans with estimated current LTVs greater than 80% as of January 2010 3 Other includes Card run-off portfolio, including certain legacy WaMu loans, legacy balance transfer programs and terminated partner portfolios, and CBB run-off portfolio, including discontinued products 4 Includes small amounts of other income in Card 5 Assumes provision for credit losses equals net charge-offs associated with NCI portfolio. Assumes no reserve actions associated with run-off PCI portfolio 6 Assumes 38% tax rate Note: Totals may not sum due to rounding Simulation assumes provision for credit losses equals net charge-offs; other reserve actions not simulated NII will decline as portfolios run off; reduction of higher yield loans puts pressure on firmwide NIM NII for run-off portfolios expected to decline by $1B +/- in 2012, including $600mm +/- related to MB However, run-off will benefit firmwide net income and returns, as expense, credit losses and RWA also decline Run-off portfolios simulation ($B) 1 Run-off portfolio – Comments 1 1 10 N I R , N I I A N D N I M
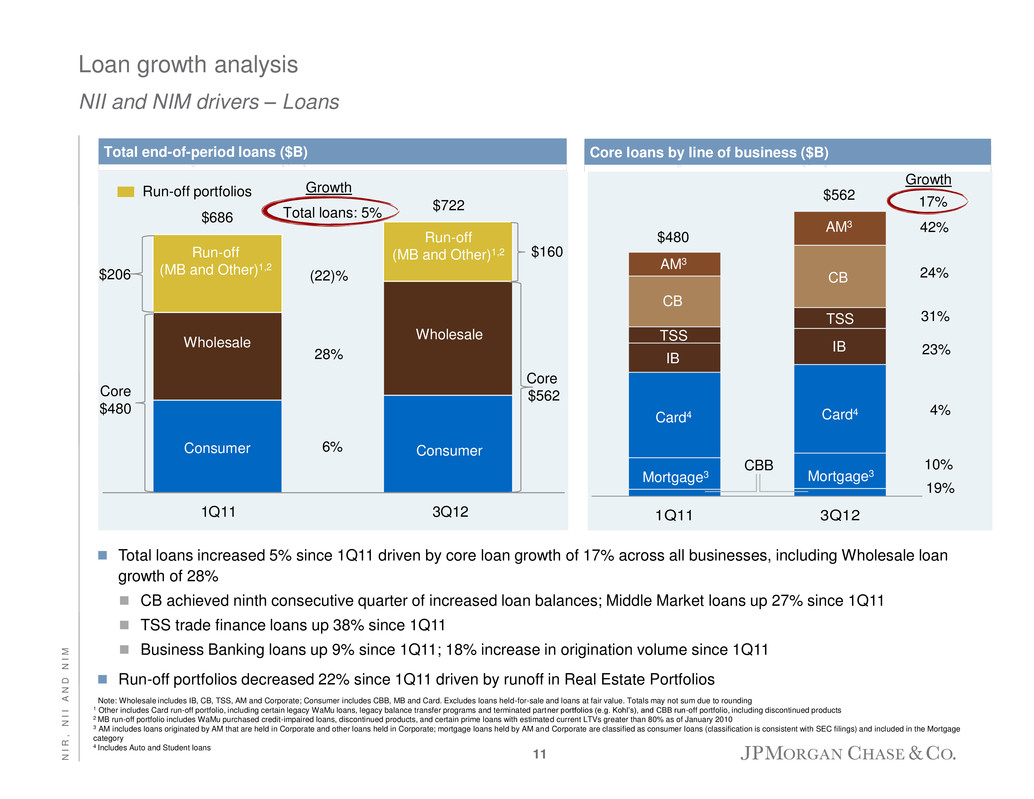
Loan growth analysis NII and NIM drivers – Loans Total loans increased 5% since 1Q11 driven by core loan growth of 17% across all businesses, including Wholesale loan growth of 28% CB achieved ninth consecutive quarter of increased loan balances; Middle Market loans up 27% since 1Q11 TSS trade finance loans up 38% since 1Q11 Business Banking loans up 9% since 1Q11; 18% increase in origination volume since 1Q11 Run-off portfolios decreased 22% since 1Q11 driven by runoff in Real Estate Portfolios Note: Wholesale includes IB, CB, TSS, AM and Corporate; Consumer includes CBB, MB and Card. Excludes loans held-for-sale and loans at fair value. Totals may not sum due to rounding 1 Other includes Card run-off portfolio, including certain legacy WaMu loans, legacy balance transfer programs and terminated partner portfolios (e.g. Kohl’s), and CBB run-off portfolio, including discontinued products 2 MB run-off portfolio includes WaMu purchased credit-impaired loans, discontinued products, and certain prime loans with estimated current LTVs greater than 80% as of January 2010 3 AM includes loans originated by AM that are held in Corporate and other loans held in Corporate; mortgage loans held by AM and Corporate are classified as consumer loans (classification is consistent with SEC filings) and included in the Mortgage category 4 Includes Auto and Student loans 1Q11 3Q12 Total end-of-period loans ($B) $686 $722 (22)% 28% Growth Total loans: 5% Consumer Wholesale Run-off (MB and Other)1,2 Consumer Wholesale Core $480 Core $562 $206 $160 Card Services & Auto Mortgage Banking CB CB IB IB TSS TSS CBB Card Services & Auto 1Q11 3 $480 $562 Card4 Mortgage3 Mortgage3 Growth 17% Card4 42% 24% 23% 31% 4% 10% 19% Core loans by line of business ($B) Run-off portfolios Run-off (MB and Other)1,2 CBB 6% CB IB TSS AM3 CB IB TSS AM3 11 N I R , N I I A N D N I M
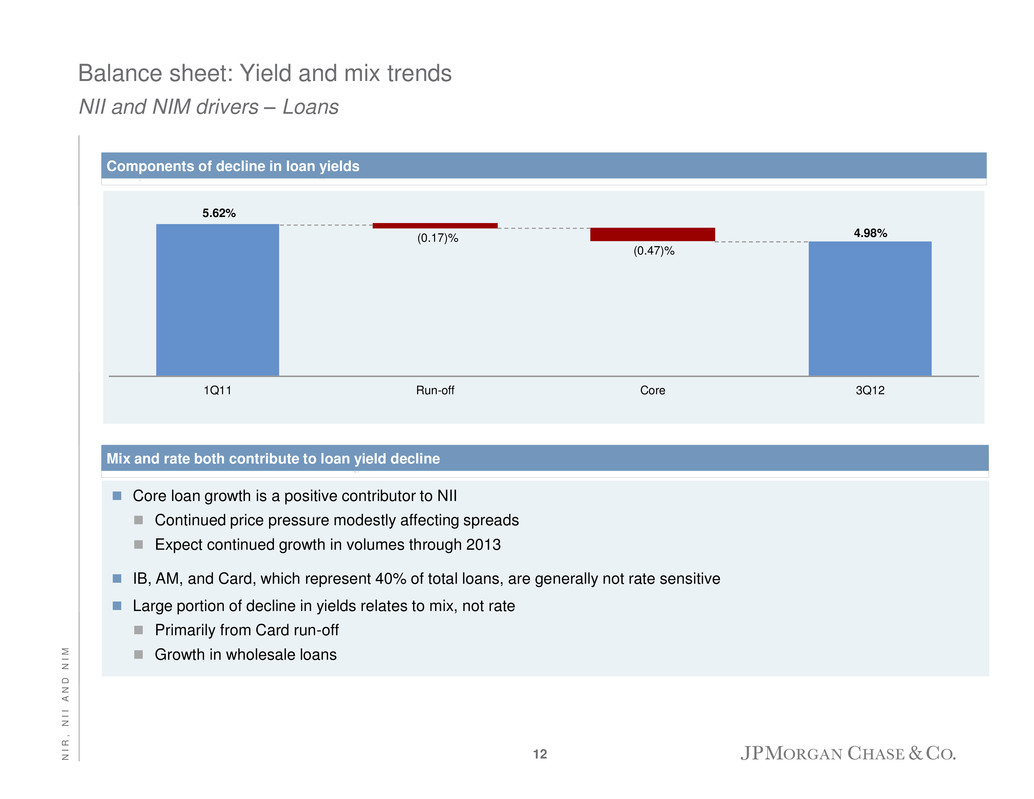
5.62% 4.98% (0.17)% (0.47)% 1Q11 Run-off Core 3Q12 Balance sheet: Yield and mix trends NII and NIM drivers – Loans Components of decline in loan yields Mix and rate both contribute to loan yield decline Core loan growth is a positive contributor to NII Continued price pressure modestly affecting spreads Expect continued growth in volumes through 2013 IB, AM, and Card, which represent 40% of total loans, are generally not rate sensitive Large portion of decline in yields relates to mix, not rate Primarily from Card run-off Growth in wholesale loans 12 N I R , N I I A N D N I M

CBB CBB Other1 Other1 TSS TSS CB CB AM AM 1Q11 3Q12 Deposit growth NII and NIM drivers – Deposits Avg. deposits by line of business ($B) 27% 32% 12% Avg. interest-bearing vs. noninterest-bearing deposits ($B) 0.50% 0.43% 34% 1Q11 3Q12 Interest-bearing deposits Noninterest-bearing deposits $930 $1,098 0.53% 0.34% $1,098 $930 1 Other includes IB, MB, Card and Corporate Growth (24)% 18% Deposit yield Deposit margin has decreased, largely offset by volume growth and reduction in cost of interest bearing deposits 13 N I R , N I I A N D N I M
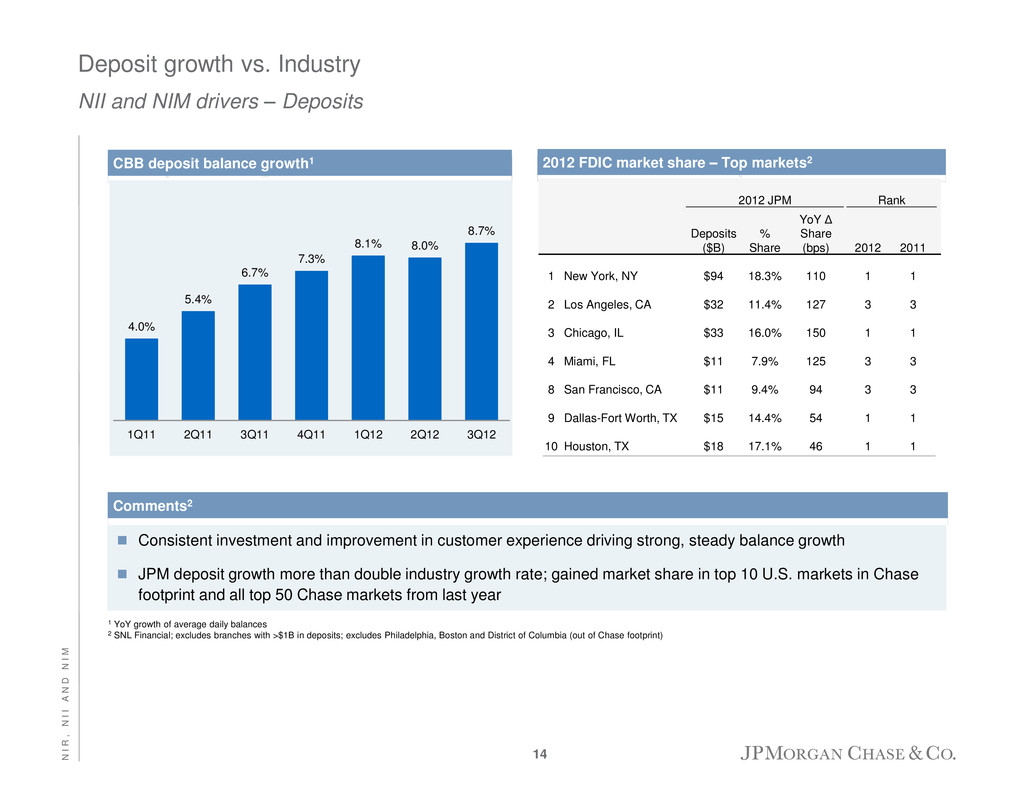
Deposit growth vs. Industry NII and NIM drivers – Deposits CBB deposit balance growth1 4.0% 5.4% 6.7% 7.3% 8.1% 8.0% 8.7% 1Q11 2Q11 3Q11 4Q11 1Q12 2Q12 3Q12 Consistent investment and improvement in customer experience driving strong, steady balance growth JPM deposit growth more than double industry growth rate; gained market share in top 10 U.S. markets in Chase footprint and all top 50 Chase markets from last year 2012 FDIC market share – Top markets2 Comments2 1 YoY growth of average daily balances 2 SNL Financial; excludes branches with >$1B in deposits; excludes Philadelphia, Boston and District of Columbia (out of Chase footprint) 2012 JPM Rank Deposits ($B) % Share YoY Δ Share (bps) 2012 2011 1 New York, NY $94 18.3% 110 1 1 2 Los Angeles, CA $32 11.4% 127 3 3 3 Chicago, IL $33 16.0% 150 1 1 4 Miami, FL $11 7.9% 125 3 3 8 San Francisco, CA $11 9.4% 94 3 3 9 Dallas-Fort Worth, TX $15 14.4% 54 1 1 10 Houston, TX $18 17.1% 46 1 1 14 N I R , N I I A N D N I M
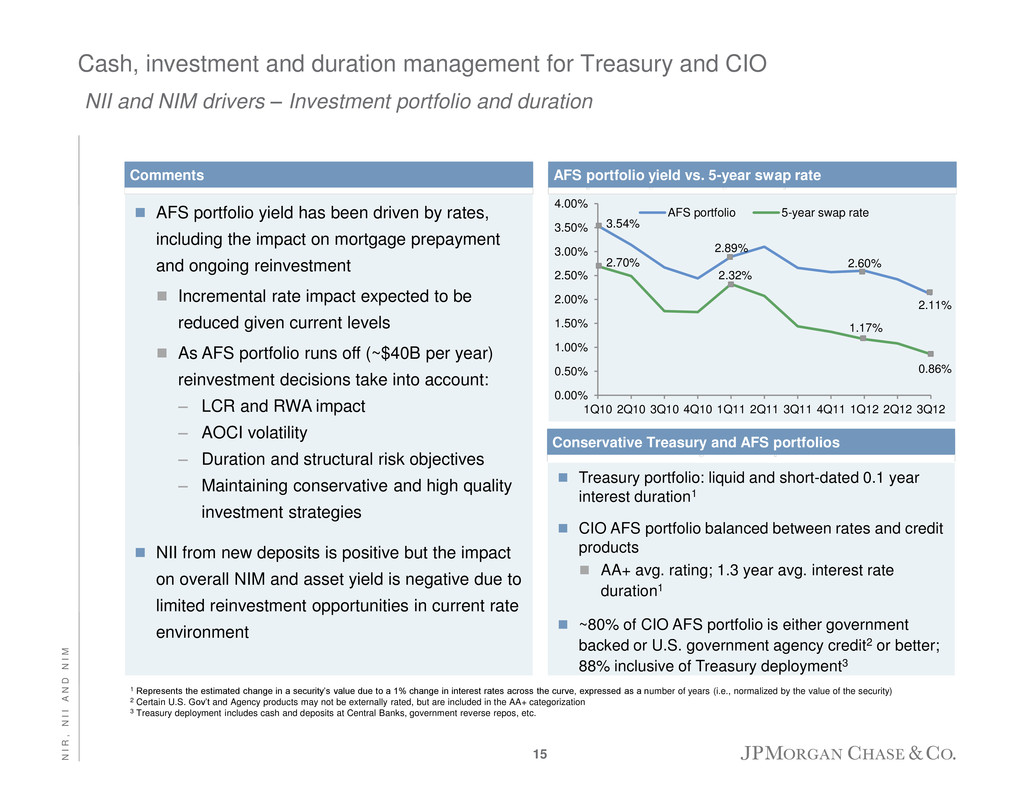
Cash, investment and duration management for Treasury and CIO NII and NIM drivers – Investment portfolio and duration AFS portfolio yield has been driven by rates, including the impact on mortgage prepayment and ongoing reinvestment Incremental rate impact expected to be reduced given current levels As AFS portfolio runs off (~$40B per year) reinvestment decisions take into account: – LCR and RWA impact – AOCI volatility – Duration and structural risk objectives – Maintaining conservative and high quality investment strategies NII from new deposits is positive but the impact on overall NIM and asset yield is negative due to limited reinvestment opportunities in current rate environment AFS portfolio yield vs. 5-year swap rate 3.54% 2.89% 2.60% 2.11% 2.70% 2.32% 1.17% 0.86% 0.00% 0.50% 1.00% 1.50% 2.00% 2.50% 3.00% 3.50% 4.00% 1Q10 2Q10 3Q10 4Q10 1Q11 2Q11 3Q11 4Q11 1Q12 2Q12 3Q12 AFS portfolio 5-year swap rate 1 Represents the estimated change in a security’s value due to a 1% change in interest rates across the curve, expressed as a number of years (i.e., normalized by the value of the security) 2 Certain U.S. Gov’t and Agency products may not be externally rated, but are included in the AA+ categorization 3 Treasury deployment includes cash and deposits at Central Banks, government reverse repos, etc. Comments Conservative Treasury and AFS portfolios Treasury portfolio: liquid and short-dated 0.1 year interest duration1 CIO AFS portfolio balanced between rates and credit products AA+ avg. rating; 1.3 year avg. interest rate duration1 ~80% of CIO AFS portfolio is either government backed or U.S. government agency credit2 or better; 88% inclusive of Treasury deployment3 15 N I R , N I I A N D N I M
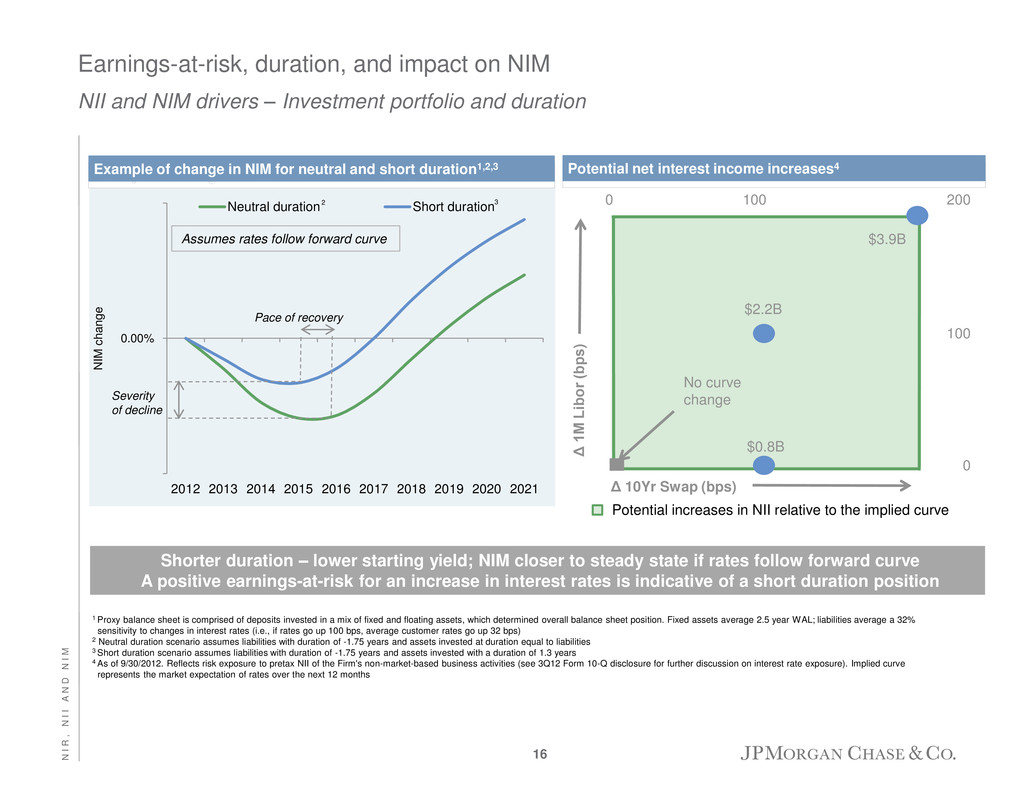
2012 2013 2014 2015 2016 2017 2018 2019 2020 2021 Neutral duration Short duration Earnings-at-risk, duration, and impact on NIM NII and NIM drivers – Investment portfolio and duration Example of change in NIM for neutral and short duration1,2,3 1 Proxy balance sheet is comprised of deposits invested in a mix of fixed and floating assets, which determined overall balance sheet position. Fixed assets average 2.5 year WAL; liabilities average a 32% sensitivity to changes in interest rates (i.e., if rates go up 100 bps, average customer rates go up 32 bps) 2 Neutral duration scenario assumes liabilities with duration of -1.75 years and assets invested at duration equal to liabilities 3 Short duration scenario assumes liabilities with duration of -1.75 years and assets invested with a duration of 1.3 years 4 As of 9/30/2012. Reflects risk exposure to pretax NII of the Firm's non-market-based business activities (see 3Q12 Form 10-Q disclosure for further discussion on interest rate exposure). Implied curve represents the market expectation of rates over the next 12 months Potential net interest income increases4 Δ 10Yr Swap (bps) 0 200 0 Δ 1M Libor (bp s ) 100 100 $2.2B $3.9B No curve change $0.8B Potential increases in NII relative to the implied curve 2 3 Shorter duration – lower starting yield; NIM closer to steady state if rates follow forward curve A positive earnings-at-risk for an increase in interest rates is indicative of a short duration position Assumes rates follow forward curve Pace of recovery Severity of decline 0.00% NI M c h a n g e 16 N I R , N I I A N D N I M
Agenda Page 17 CCB and CIB new disclosure 17 NIR, NII and NIM 6 Outlook 24 Appendix 26 G O L D M A N S A C H S U . S . F I N A N C I A L S E R V I C E S C O N F E R E N C E
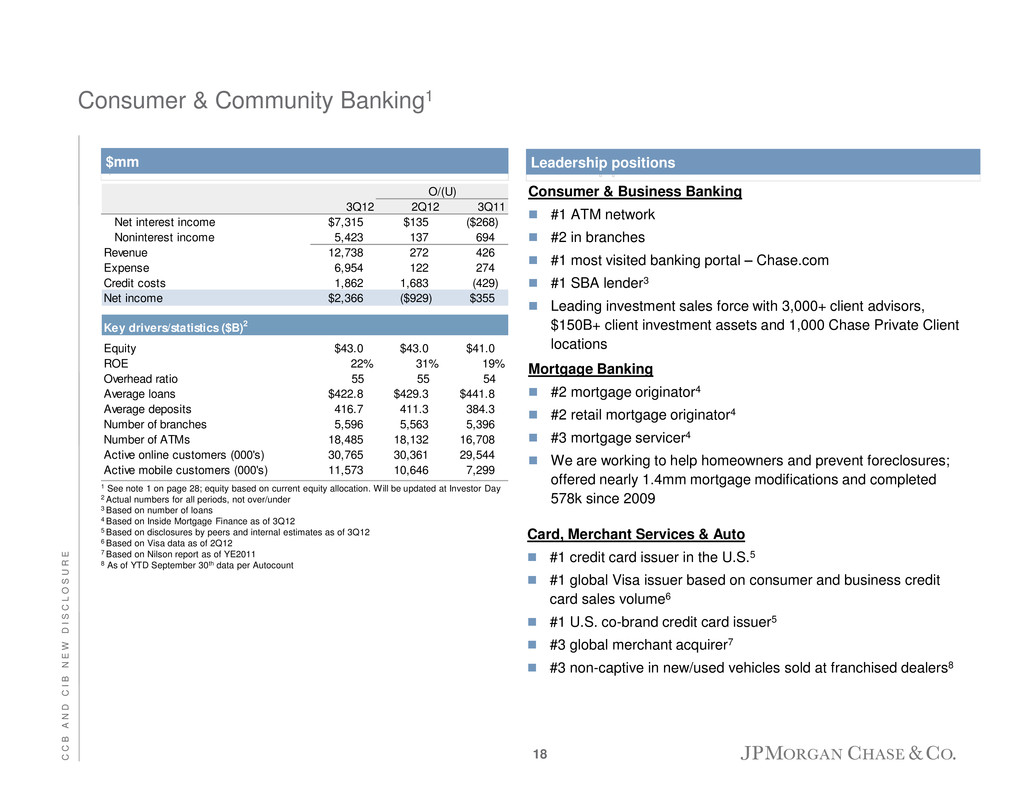
Consumer & Community Banking1 1 See note 1 on page 28; equity based on current equity allocation. Will be updated at Investor Day 2 Actual numbers for all periods, not over/under 3 Based on number of loans 4 Based on Inside Mortgage Finance as of 3Q12 5 Based on disclosures by peers and internal estimates as of 3Q12 6 Based on Visa data as of 2Q12 7 Based on Nilson report as of YE2011 8 As of YTD September 30th data per Autocount Card, Merchant Services & Auto #1 credit card issuer in the U.S.5 #1 global Visa issuer based on consumer and business credit card sales volume6 #1 U.S. co-brand credit card issuer5 #3 global merchant acquirer7 #3 non-captive in new/used vehicles sold at franchised dealers8 Consumer & Business Banking #1 ATM network #2 in branches #1 most visited banking portal – Chase.com #1 SBA lender3 Leading investment sales force with 3,000+ client advisors, $150B+ client investment assets and 1,000 Chase Private Client locations Mortgage Banking #2 mortgage originator4 #2 retail mortgage originator4 #3 mortgage servicer4 We are working to help homeowners and prevent foreclosures; offered nearly 1.4mm mortgage modifications and completed 578k since 2009 $mm Leadership positions O/(U) 3Q12 2Q12 3Q11 Net interest income $7,315 $135 ($268) Noninterest income 5,423 137 694 Revenue 12,738 272 426 Expense 6,954 122 274 Credit costs 1,862 1,683 (429) Net income $2,366 ($929) $355 Key drivers/statistics ($B)2 Equity $43.0 $43.0 $41.0 ROE 22% 31% 19% Overhead ratio 55 55 54 Average loans $422.8 $429.3 $441.8 Average deposits 416.7 411.3 384.3 Number of branches 5,596 5,563 5,396 Number of ATMs 18,485 18,132 16,708 Active online custo rs (000's) 30,765 30,361 29,544 Active mobile customers (000's) 11,573 10,646 7,299 18 C C B A N D C I B N E W D I S C L O S U R E
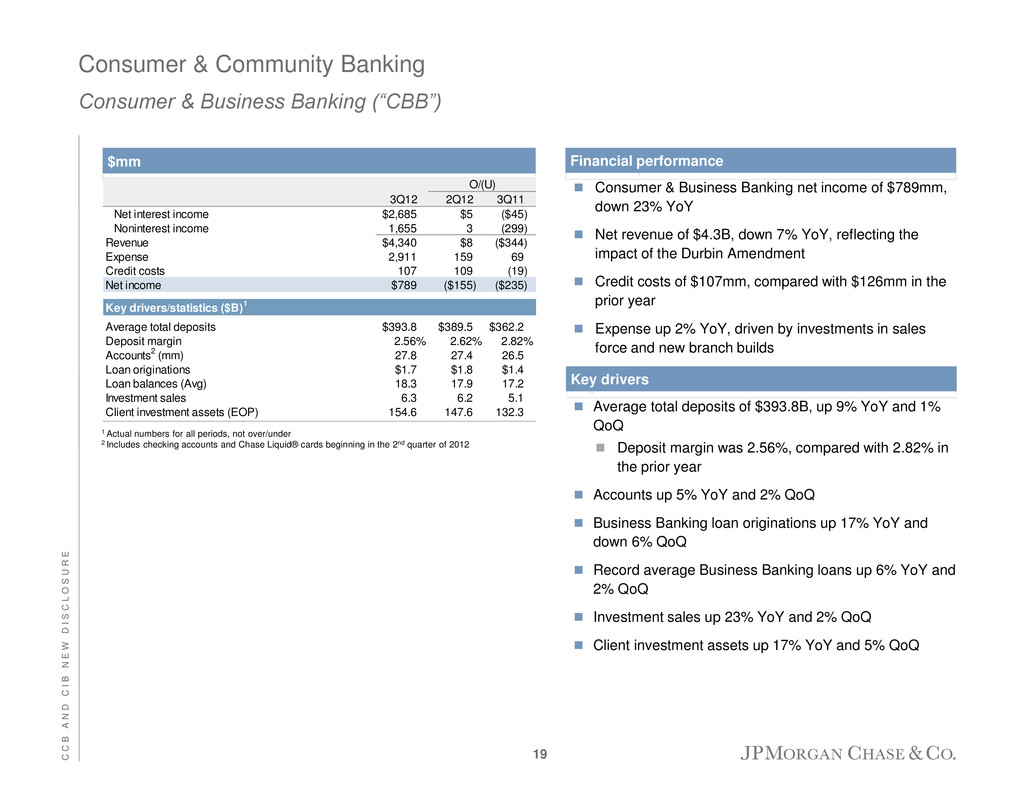
Consumer & Community Banking Consumer & Business Banking (“CBB”) 1 Actual numbers for all periods, not over/under 2 Includes checking accounts and Chase Liquid® cards beginning in the 2nd quarter of 2012 Consumer & Business Banking net income of $789mm, down 23% YoY Net revenue of $4.3B, down 7% YoY, reflecting the impact of the Durbin Amendment Credit costs of $107mm, compared with $126mm in the prior year Expense up 2% YoY, driven by investments in sales force and new branch builds Average total deposits of $393.8B, up 9% YoY and 1% QoQ Deposit margin was 2.56%, compared with 2.82% in the prior year Accounts up 5% YoY and 2% QoQ Business Banking loan originations up 17% YoY and down 6% QoQ Record average Business Banking loans up 6% YoY and 2% QoQ Investment sales up 23% YoY and 2% QoQ Client investment assets up 17% YoY and 5% QoQ Financial performance Key drivers $mm O/(U) 3Q12 2Q12 3Q11 Net interest income $2,685 $5 ($45) Noninterest income 1,655 3 (299) Revenue $4,340 $8 ($344) Expense 2,911 159 69 Credit costs 107 109 (19) Net income $789 ($155) ($235) Key drivers/statistics ($B) 1 Average total deposits $393.8 $389.5 $362.2 Deposit margin 2.56% 2.62% 2.82% Accounts 2 (mm) 27.8 27.4 26.5 Loan originations $1.7 $1.8 $1.4 Loan balances (Avg) 18.3 17.9 17.2 Investment sales 6.3 6.2 5.1 Client investment assets (EOP) 154.6 147.6 132.3 19 C C B A N D C I B N E W D I S C L O S U R E
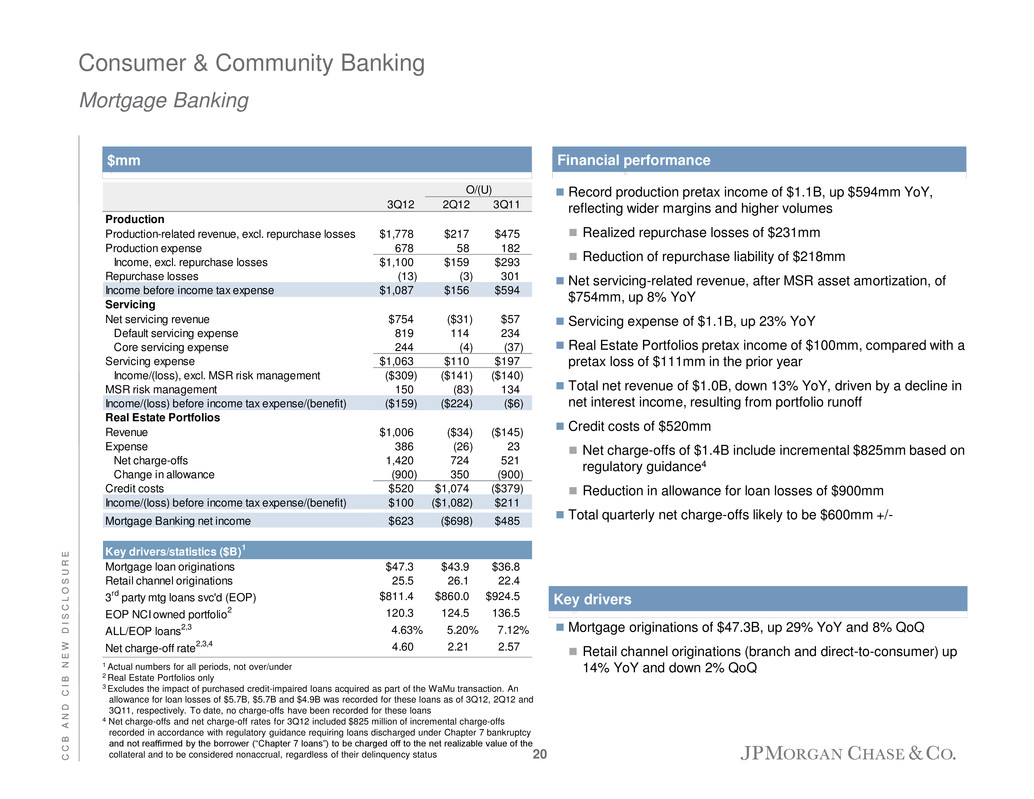
Consumer & Community Banking Mortgage Banking Record production pretax income of $1.1B, up $594mm YoY, reflecting wider margins and higher volumes Realized repurchase losses of $231mm Reduction of repurchase liability of $218mm Net servicing-related revenue, after MSR asset amortization, of $754mm, up 8% YoY Servicing expense of $1.1B, up 23% YoY Real Estate Portfolios pretax income of $100mm, compared with a pretax loss of $111mm in the prior year Total net revenue of $1.0B, down 13% YoY, driven by a decline in net interest income, resulting from portfolio runoff Credit costs of $520mm Net charge-offs of $1.4B include incremental $825mm based on regulatory guidance4 Reduction in allowance for loan losses of $900mm Total quarterly net charge-offs likely to be $600mm +/- Mortgage originations of $47.3B, up 29% YoY and 8% QoQ Retail channel originations (branch and direct-to-consumer) up 14% YoY and down 2% QoQ 1 Actual numbers for all periods, not over/under 2 Real Estate Portfolios only 3 Excludes the impact of purchased credit-impaired loans acquired as part of the WaMu transaction. An allowance for loan losses of $5.7B, $5.7B and $4.9B was recorded for these loans as of 3Q12, 2Q12 and 3Q11, respectively. To date, no charge-offs have been recorded for these loans 4 Net charge-offs and net charge-off rates for 3Q12 included $825 million of incremental charge-offs recorded in accordance with regulatory guidance requiring loans discharged under Chapter 7 bankruptcy and not reaffirmed by the borrower (“Chapter 7 loans”) to be charged off to the net realizable value of the collateral and to be considered nonaccrual, regardless of their delinquency status $mm Financial performance Key drivers O/(U) 3Q12 2Q12 3Q11 Production Production-related revenue, excl. repurchase losses $1,778 $217 $475 Production expense 678 58 182 Income, excl. repurchase losses $1,100 $159 $293 Repurchase losses (13) (3) 301 Income before income tax expense $1,087 $156 $594 Servicing Net servicing revenue $754 ($31) $57 Default servicing expense 819 114 234 Core servicing expense 244 (4) (37) Servicing expense $1,063 $110 $197 Income/(loss), excl. MSR risk management ($309) ($141) ($140) MSR risk management 150 (83) 134 Income/(loss) before income tax expense/(benefit) ($159) ($224) ($6) Real Estate Portfolios Revenue $1,006 ($34) ($145) Expense 386 (26) 23 Net charge-offs 1,420 724 521 Change in allowance (900) 350 (900) Credit costs $520 $1,074 ($379) Income/(loss) before income tax expense/(benefit) $100 ($1,082) $211 Mortgage Banking net income $623 ($698) $485 Key drivers/statistics ($B) 1 Mortgage loan originations $47.3 $43.9 $36.8 Retail channel originations 25.5 26.1 22.4 3 rd party mtg loans vc'd (EOP) $811.4 $860.0 $924.5 EOP NCI owned p rtfolio 2 120.3 124.5 136.5 ALL/EOP loans 2,3 4.63% 5.20% 7.12% Net charge-off rate 2,3,4 4.60 2.21 2.57 20 C C B A N D C I B N E W D I S C L O S U R E
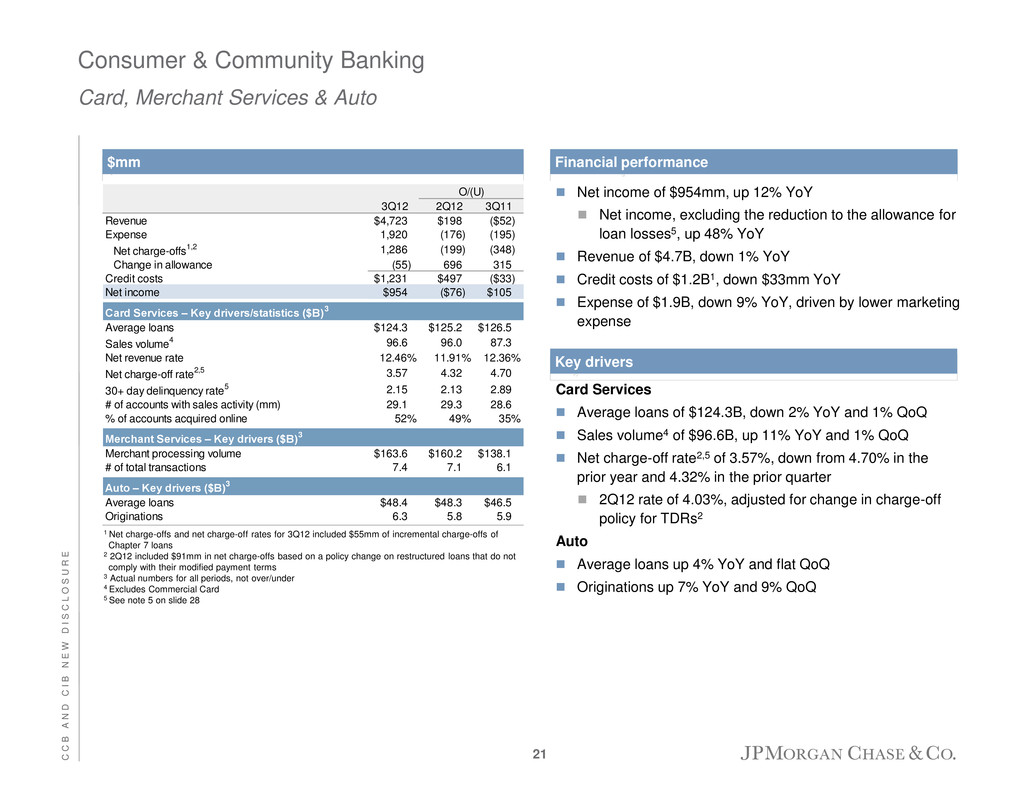
Net income of $954mm, up 12% YoY Net income, excluding the reduction to the allowance for loan losses5, up 48% YoY Revenue of $4.7B, down 1% YoY Credit costs of $1.2B1, down $33mm YoY Expense of $1.9B, down 9% YoY, driven by lower marketing expense 1 Net charge-offs and net charge-off rates for 3Q12 included $55mm of incremental charge-offs of Chapter 7 loans 2 2Q12 included $91mm in net charge-offs based on a policy change on restructured loans that do not comply with their modified payment terms 3 Actual numbers for all periods, not over/under 4 Excludes Commercial Card 5 See note 5 on slide 28 Card Services Average loans of $124.3B, down 2% YoY and 1% QoQ Sales volume4 of $96.6B, up 11% YoY and 1% QoQ Net charge-off rate2,5 of 3.57%, down from 4.70% in the prior year and 4.32% in the prior quarter 2Q12 rate of 4.03%, adjusted for change in charge-off policy for TDRs2 Auto Average loans up 4% YoY and flat QoQ Originations up 7% YoY and 9% QoQ Consumer & Community Banking Card, Merchant Services & Auto $mm Financial performance Key drivers O/(U) 3Q12 2Q12 3Q11 Revenue $4,723 $198 ($52) Expense 1,920 (176) (195) Net charge-offs 1,2 1,286 (199) (348) Change in allowance (55) 696 315 Credit costs $1,231 $497 ($33) Net income $954 ($76) $105 Card Services – Key drivers/statistics ($B) 3 Average loans $124.3 $125.2 $126.5 Sales volume 4 96.6 96.0 87.3 Net revenue rate 12.46% 11.91% 12.36% Net charge-off rate 2,5 3.57 4.32 4.70 30+ day delinquency rate 5 2.15 2.13 2.89 # of accounts with sales activity (mm) 29.1 29.3 28.6 % of accounts acquired online 52% 49% 35% erchant Services – Key drivers ($B) 3 Merchant processing volume $163.6 $160.2 $138.1 # of total transactions 7.4 7.1 6.1 Auto – Key drivers ($B) 3 Average loans $48.4 $48.3 $46.5 Originations 6.3 5.8 5.9 21 C C B A N D C I B N E W D I S C L O S U R E
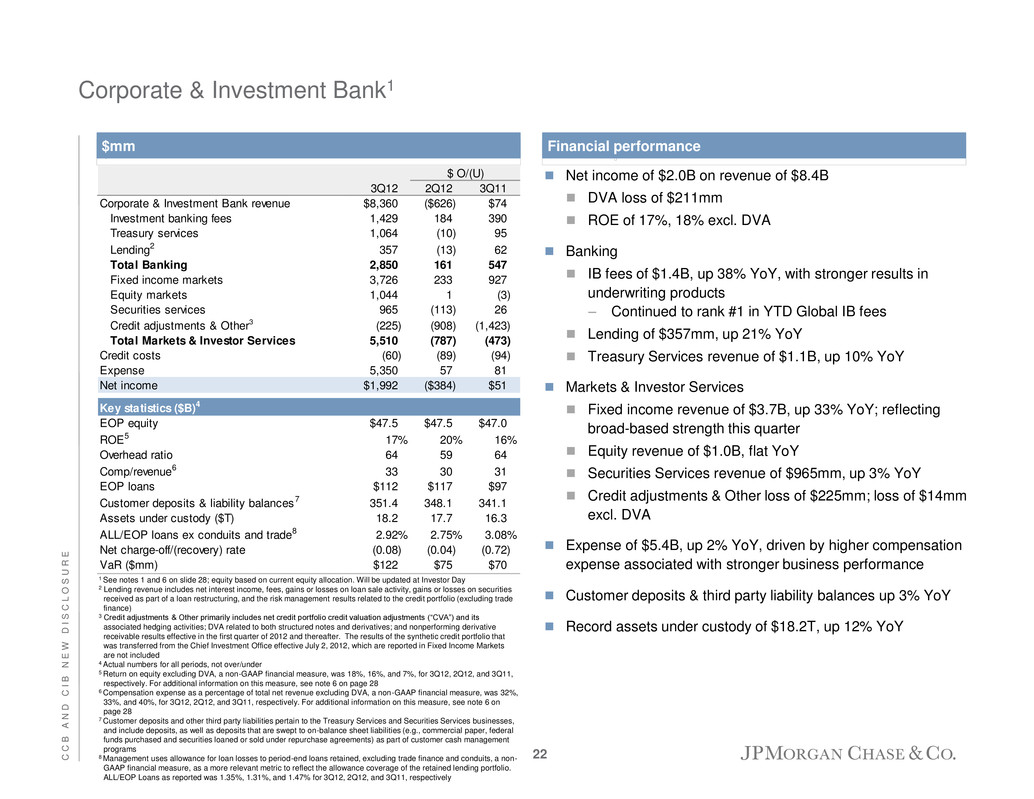
3Q12 2Q12 3Q11 Corporate & Investment Bank revenue $8,360 ($626) $74 Investment banking fees 1,429 184 390 Treasury services 1,064 (10) 95 Lending2 357 (13) 62 Total Banking 2,850 161 547 Fixed income markets 3,726 233 927 Equity markets 1,044 1 (3) Securities services 965 (113) 26 Credit adjustments & Other3 (225) (908) (1,423) Total Markets & Investor Services 5,510 (787) (473) Credit costs (60) (89) (94) Expense 5,350 57 81 Net income $1,992 ($384) $51 Key statistics ($B)4 EOP equity $47.5 $47.5 $47.0 ROE5 17% 20% 16% Overhead ratio 64 59 64 Comp/revenue6 33 30 31 EOP loans $112 $117 $97 Customer deposits & liability balances7 351.4 348.1 341.1 Assets under custody ($T) 18.2 17.7 16.3 ALL/EOP loans ex conduits and trade8 2.92% 2.75% 3.08% Net charge-off/(recovery) rate (0.08) (0.04) (0.72) VaR ($mm) $122 $75 $70 $ O/(U) Corporate & Investment Bank1 $mm Net income of $2.0B on revenue of $8.4B DVA loss of $211mm ROE of 17%, 18% excl. DVA Banking IB fees of $1.4B, up 38% YoY, with stronger results in underwriting products – Continued to rank #1 in YTD Global IB fees Lending of $357mm, up 21% YoY Treasury Services revenue of $1.1B, up 10% YoY Markets & Investor Services Fixed income revenue of $3.7B, up 33% YoY; reflecting broad-based strength this quarter Equity revenue of $1.0B, flat YoY Securities Services revenue of $965mm, up 3% YoY Credit adjustments & Other loss of $225mm; loss of $14mm excl. DVA Expense of $5.4B, up 2% YoY, driven by higher compensation expense associated with stronger business performance Customer deposits & third party liability balances up 3% YoY Record assets under custody of $18.2T, up 12% YoY Financial performance 1 See notes 1 and 6 on slide 28; equity based on current equity allocation. Will be updated at Investor Day 2 Lending revenue includes net interest income, fees, gains or losses on loan sale activity, gains or losses on securities received as part of a loan restructuring, and the risk management results related to the credit portfolio (excluding trade finance) 3 Credit adjustments & Other primarily includes net credit portfolio credit valuation adjustments (“CVA”) and its associated hedging activities; DVA related to both structured notes and derivatives; and nonperforming derivative receivable results effective in the first quarter of 2012 and thereafter. The results of the synthetic credit portfolio that was transferred from the Chief Investment Office effective July 2, 2012, which are reported in Fixed Income Markets are not included 4 Actual numbers for all periods, not over/under 5 Return on equity excluding DVA, a non-GAAP financial measure, was 18%, 16%, and 7%, for 3Q12, 2Q12, and 3Q11, respectively. For additional information on this measure, see note 6 on page 28 6 Compensation expense as a percentage of total net revenue excluding DVA, a non-GAAP financial measure, was 32%, 33%, and 40%, for 3Q12, 2Q12, and 3Q11, respectively. For additional information on this measure, see note 6 on page 28 7 Customer deposits and other third party liabilities pertain to the Treasury Services and Securities Services businesses, and include deposits, as well as deposits that are swept to on-balance sheet liabilities (e.g., commercial paper, federal funds purchased and securities loaned or sold under repurchase agreements) as part of customer cash management programs 8 Management uses allowance for loan losses to period-end loans retained, excluding trade finance and conduits, a non- GAAP financial measure, as a more relevant metric to reflect the allowance coverage of the retained lending portfolio. ALL/EOP Loans as reported was 1.35%, 1.31%, and 1.47% for 3Q12, 2Q12, and 3Q11, respectively 22 C C B A N D C I B N E W D I S C L O S U R E
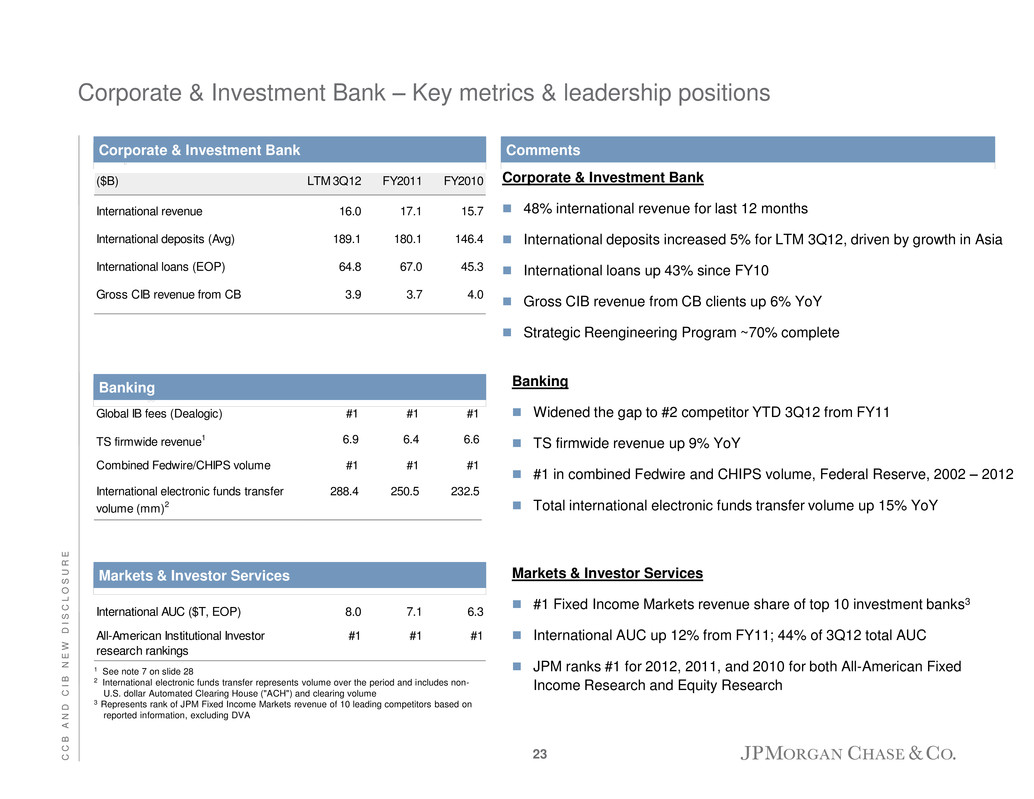
Corporate & Investment Bank – Key metrics & leadership positions Corporate & Investment Bank Comments 1 See note 7 on slide 28 2 International electronic funds transfer represents volume over the period and includes non- U.S. dollar Automated Clearing House ("ACH") and clearing volume 3 Represents rank of JPM Fixed Income Markets revenue of 10 leading competitors based on reported information, excluding DVA Corporate & Investment Bank 48% international revenue for last 12 months International deposits increased 5% for LTM 3Q12, driven by growth in Asia International loans up 43% since FY10 Gross CIB revenue from CB clients up 6% YoY Strategic Reengineering Program ~70% complete ($B) LTM 3Q12 FY2011 FY2010 International revenue 16.0 17.1 15.7 International dep sits (Avg) 189.1 180.1 146.4 International loans (EOP) 64.8 67.0 45.3 Gross CIB revenue from CB 3.9 3.7 4.0 Banking Banking Widened the gap to #2 competitor YTD 3Q12 from FY11 TS firmwide revenue up 9% YoY #1 in combined Fedwire and CHIPS volume, Federal Reserve, 2002 – 2012 Total international electronic funds transfer volume up 15% YoY Markets & Investor Services #1 Fixed Income Markets revenue share of top 10 investment banks3 International AUC up 12% from FY11; 44% of 3Q12 total AUC JPM ranks #1 for 2012, 2011, and 2010 for both All-American Fixed Income Research and Equity Research Markets & Investor Services International AUC ($T, EOP) 8.0 7.1 6.3 All-American Institutional Investor research rankings #1 #1 #1 Global IB fees (Dealogic) #1 #1 #1 TS firmwide revenue1 6.9 6.4 6.6 Combined Fedwire/CHIPS volume #1 #1 #1 International electro ic funds transfer volume (mm)2 288.4 250.5 232.5 23 C C B A N D C I B N E W D I S C L O S U R E
Agenda Page 24 Outlook 24 NIR, NII and NIM 6 CCB and CIB new disclosure 17 Appendix 26 G O L D M A N S A C H S U . S . F I N A N C I A L S E R V I C E S C O N F E R E N C E
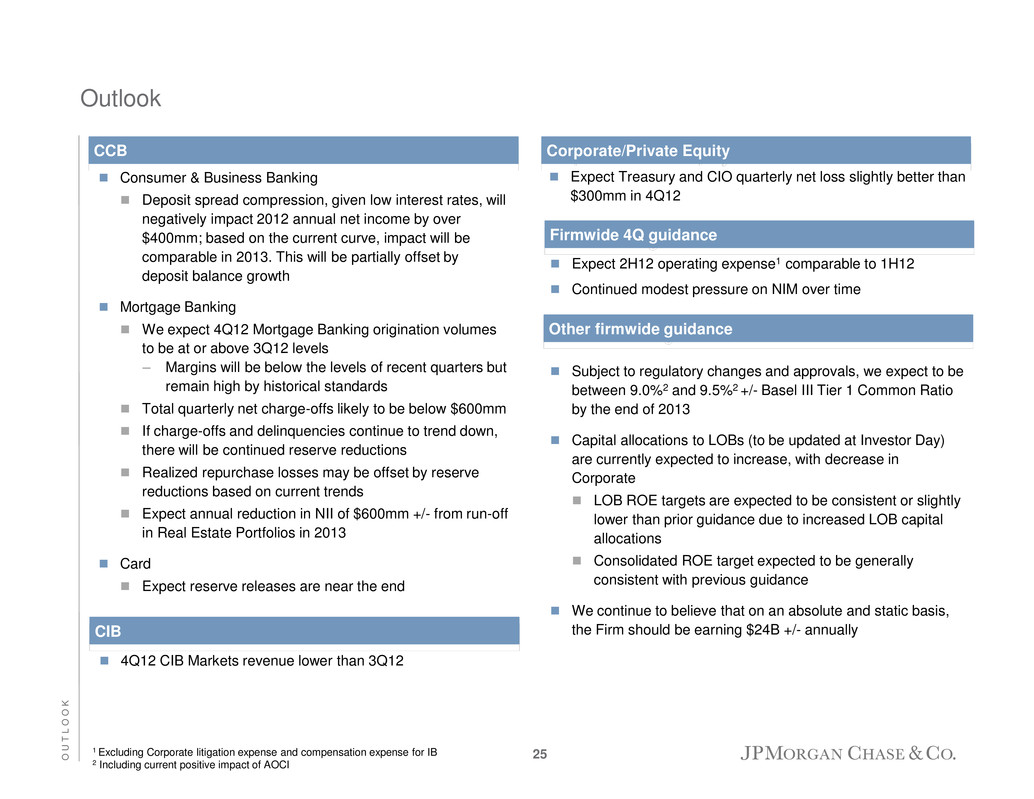
Outlook Expect 2H12 operating expense1 comparable to 1H12 Continued modest pressure on NIM over time Subject to regulatory changes and approvals, we expect to be between 9.0%2 and 9.5%2 +/- Basel III Tier 1 Common Ratio by the end of 2013 Capital allocations to LOBs (to be updated at Investor Day) are currently expected to increase, with decrease in Corporate LOB ROE targets are expected to be consistent or slightly lower than prior guidance due to increased LOB capital allocations Consolidated ROE target expected to be generally consistent with previous guidance We continue to believe that on an absolute and static basis, the Firm should be earning $24B +/- annually Firmwide 4Q guidance Corporate/Private Equity Expect Treasury and CIO quarterly net loss slightly better than $300mm in 4Q12 CCB Consumer & Business Banking Deposit spread compression, given low interest rates, will negatively impact 2012 annual net income by over $400mm; based on the current curve, impact will be comparable in 2013. This will be partially offset by deposit balance growth Mortgage Banking We expect 4Q12 Mortgage Banking origination volumes to be at or above 3Q12 levels – Margins will be below the levels of recent quarters but remain high by historical standards Total quarterly net charge-offs likely to be below $600mm If charge-offs and delinquencies continue to trend down, there will be continued reserve reductions Realized repurchase losses may be offset by reserve reductions based on current trends Expect annual reduction in NII of $600mm +/- from run-off in Real Estate Portfolios in 2013 Card Expect reserve releases are near the end CIB 4Q12 CIB Markets revenue lower than 3Q12 1 Excluding Corporate litigation expense and compensation expense for IB 2 Including current positive impact of AOCI Other firmwide guidance 25 O U T L O O K
Agenda Page 26 Appendix 26 NIR, NII and NIM 6 CCB and CIB new disclosure 17 Outlook 24 G O L D M A N S A C H S U . S . F I N A N C I A L S E R V I C E S C O N F E R E N C E
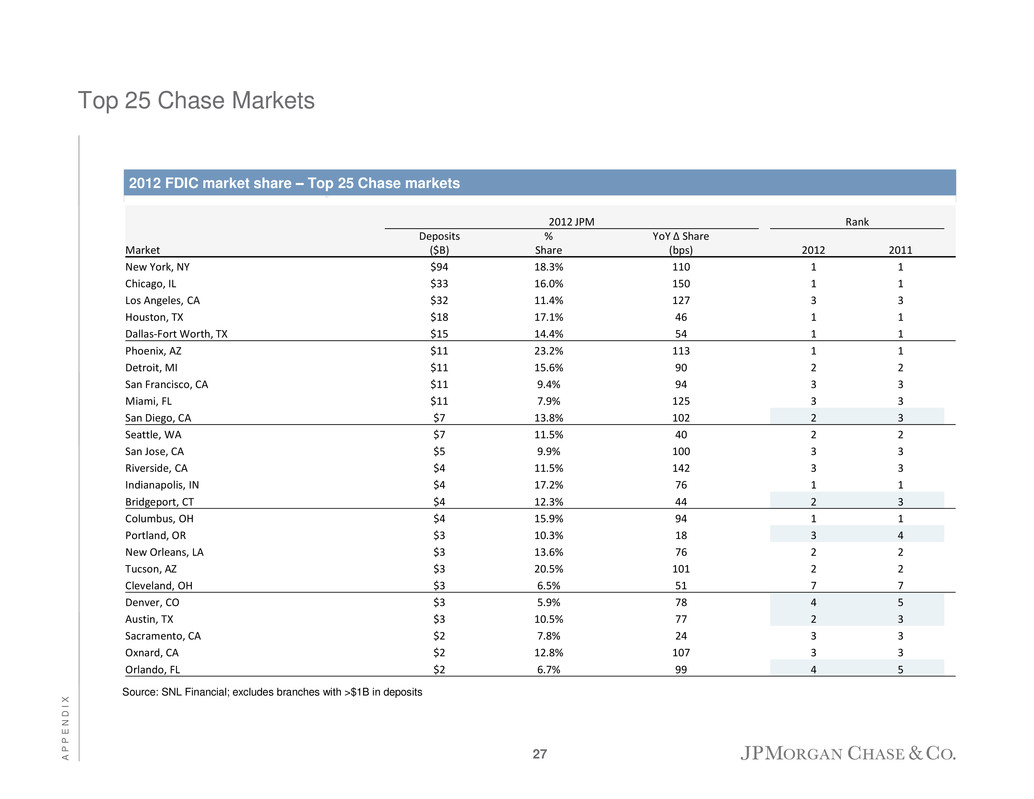
Top 25 Chase Markets 2012 FDIC market share – Top 25 Chase markets 2012 JPM Rank Market Deposits ($B) % Share YoY Δ Share (bps) 2012 2011 New York, NY $94 18.3% 110 1 1 Chicago, IL $33 16.0% 150 1 1 Los Angeles, CA $32 11.4% 127 3 3 Houston, TX $18 17.1% 46 1 1 Dallas-Fort Worth, TX $15 14.4% 54 1 1 Phoenix, AZ $11 23.2% 113 1 1 Detroit, MI $11 15.6% 90 2 2 San Francisco, CA $11 9.4% 94 3 3 Miami, FL $11 7.9% 125 3 3 San Diego, CA $7 13.8% 102 2 3 Seattle, WA $7 11.5% 40 2 2 San Jose, CA $5 9.9% 100 3 3 Riverside, CA $4 11.5% 142 3 3 Indianapolis, IN $4 17.2% 76 1 1 Bridgeport, CT $4 12.3% 44 2 3 Columbus, OH $4 15.9% 94 1 1 Portland, OR $3 10.3% 18 3 4 New Orleans, LA $3 13.6% 76 2 2 Tucson, AZ $3 20.5% 101 2 2 Cleveland, OH $3 6.5% 51 7 7 Denver, CO $3 5.9% 78 4 5 Austin, TX $3 10.5% 77 2 3 Sacramento, CA $2 7.8% 24 3 3 Oxnard, CA $2 12.8% 107 3 3 Orlando, FL $2 6.7% 99 4 5 Source: SNL Financial; excludes branches with >$1B in deposits 27 A P P E N D I X

Notes on non-GAAP financial measures 1. In addition to analyzing the Firm’s results on a reported basis, management reviews the Firm’s results and the results of the lines of business on a “managed” basis, which is a non-GAAP financial measure. The Firm’s definition of managed basis starts with the reported U.S. GAAP results and includes certain reclassifications to present total net revenue for the Firm (and each of the business segments) on a fully taxable-equivalent (“FTE”) basis. Accordingly, revenue from tax-exempt securities and investments that receive tax credits is presented in the managed results on a basis comparable to taxable securities and investments. This non-GAAP financial measure allows management to assess the comparability of revenue arising from both taxable and tax-exempt sources. The corresponding income tax impact related to tax-exempt items is recorded within income tax expense. These adjustments have no impact on net income as reported by the Firm as a whole or by the lines of business. 2. Tangible common equity (“TCE”) represents common stockholders’ equity (i.e., total stockholders’ equity less preferred stock) less goodwill and identifiable intangible assets (other than MSRs), net of related deferred tax liabilities. Return on tangible common equity measures the Firm’s earnings as a percentage of TCE. In management’s view, these measures are meaningful to the Firm, as well as analysts and investors, in assessing the Firm’s use of equity, and in facilitating comparisons with peers. 3. The Basel I Tier 1 common ratio is Tier 1 common capital divided by Basel I risk-weighted assets. Tier 1 common capital is defined as Tier 1 capital less elements of Tier 1 capital not in the form of common equity, such as perpetual preferred stock, noncontrolling interests in subsidiaries, and trust preferred capital debt securities. Tier 1 common capital, a non-GAAP financial measure, is used by banking regulators, investors and analysts to assess and compare the quality and composition of the Firm’s capital with the capital of other financial services companies. The Firm uses Tier 1 common capital along with other capital measures to assess and monitor its capital position. On December 16, 2010, the Basel Committee issued its final version of the Basel Capital Accord, commonly referred to as “Basel III.” In June 2012, the U.S. federal banking agencies published final rules on Basel 2.5 that will go into effect on January 1, 2013 and result in additional capital requirements for trading positions and securitizations. Also, in June 2012, the U.S. federal banking agencies published for comment a Notice of Proposed Rulemaking (the “NPR”) for implementing Basel III, in the United States. The Firm’s estimate of its Tier 1 common ratio under Basel III is a non-GAAP financial measure and reflects the Firm’s current understanding of the Basel III rules and the application of such rules to its businesses as currently conducted based on information currently published by the Basel Committee and U.S. federal banking agencies, and therefore excludes the impact of any changes the Firm may make in the future to its businesses as a result of implementing the Basel III rules. The Firm’s estimates of its Basel III Tier 1 common ratio will evolve over time as the Firm’s businesses change, and as a result of further rule-making on Basel III implementation from U.S. federal banking agencies. Management considers this estimate as a key measure to assess the Firm’s capital position in conjunction with its capital ratios under Basel I requirements, in order to enable management, investors and analysts to compare the Firm’s capital under the Basel III capital standards with similar estimates provided by other financial services companies. 4. In addition to reviewing JPMorgan Chase's net interest income on a managed basis, management also reviews core net interest income to assess the performance of its core lending, investing (including asset/liability management) and deposit-raising activities, excluding the impact of IB's market-based activities. The chart presents an analysis of managed core net interest income and core net interest margin. Each of these amounts is a non-GAAP financial measure due to the exclusion of IB's market-based net interest income and the related assets. Management believes the exclusion of IB's market-based activities provides investors and analysts a more meaningful measure to analyze non-market related business trends of the Firm and can be used as a comparable measure to other financial institutions primarily focused on core lending, investing and deposit-raising activities. 5. In Consumer & Community Banking, supplemental information is provided for Card Services, to provide more meaningful measures that enable comparability with prior periods. The change in net income is presented excluding the change in the allowance, which assumes a tax rate of 38%. The net charge-off rate and 30+ day delinquency rate presented include loans held-for-sale. 6. Corporate & Investment Bank provides several non-GAAP financial measures which exclude the impact of DVA on: net revenue, net income, compensation ratio and return on equity. These measures are used by management to assess the underlying performance of the business and for comparability with peers. The ratio for the allowance for loan losses to period- end loans is calculated excluding the impact of trade finance loans and consolidated Firm-administered multi-seller conduits, to provide a more meaningful assessment of CIB’s allowance coverage ratio. Additional notes on financial measures 7. Treasury Services firmwide metrics include certain Treasury Services product revenue reported in other lines of business related to customers who are also customers of those other lines of business. In order to capture the firmwide impact of Treasury Services products and revenue, management reviews firmwide revenue in assessing financial performance for Treasury Services. Firmwide metrics are necessary, in management’s view, in order to understand the aggregate Treasury Services business. Notes 28 A P P E N D I X

Forward-looking statements This presentation contains forward-looking statements within the meaning of the Private Securities Litigation Reform Act of 1995. These statements are based on the current beliefs and expectations of JPMorgan Chase & Co.’s management and are subject to significant risks and uncertainties. Actual results may differ from those set forth in the forward-looking statements. Factors that could cause JPMorgan Chase and Co.’s actual results to differ materially from those described in the forward-looking statements can be found in JPMorgan Chase & Co.’s Annual Report on Form 10-K for the year ended December 31, 2011, Quarterly Report on Form 10-Q/A for the quarter ended March 31, 2012, Quarterly Report on Form 10-Q for the quarter ended June 30, 2012, and Quarterly Report on Form 10-Q for the quarter ended September 30, 2012 which have been filed with the Securities and Exchange Commission and are available on JPMorgan Chase & Co.’s website (http://investor.shareholder.com/jpmorganchase) and on the Securities and Exchange Commission's website (www.sec.gov). JPMorgan Chase & Co. does not undertake to update the forward-looking statements to reflect the impact of circumstances or events that may arise after the date of the forward-looking statements. 29 A P P E N D I X


