EARNINGS RELEASE FINANCIAL SUPPLEMENT
FIRST QUARTER 2020
|
| | | | | | | | |
| JPMORGAN CHASE & CO. | | | |
| TABLE OF CONTENTS | | | | | | | | |
| | | | | | | | | |
| | | | | | | | Page(s) | |
| Consolidated Results | | | | | | | | |
| Consolidated Financial Highlights | | | | | | | 2–3 | |
| Consolidated Statements of Income | | | | | | | 4 | |
| Consolidated Balance Sheets | | | | | | | 5 | |
| Condensed Average Balance Sheets and Annualized Yields | | | | | | | 6 | |
| Reconciliation from Reported to Managed Basis | | | | | | | 7 | |
| Segment Results - Managed Basis | | | | | | | 8 | |
| Capital and Other Selected Balance Sheet Items | | | | | | | 9 | |
| Earnings Per Share and Related Information | | | | | | | 10 | |
| | | | | | | | | |
| Business Segment Results | | | | | | | | |
| Consumer & Community Banking (“CCB”) | | | | | | | 11–14 | |
| Corporate & Investment Bank (“CIB”) | | | | | | | 15–17 | |
| Commercial Banking (“CB”) | | | | | | | 18–19 | |
| Asset & Wealth Management (“AWM”) | | | | | | | 20–22 | |
| Corporate | | | | | | | 23 | |
| | | | | | | | | |
| Credit-Related Information | | | | | | | 24–27 | |
| | | | | | | | | |
| Non-GAAP Financial Measures | | | | | | | 28 | |
| Financial Instruments – Credit Losses (“CECL”), accounting guidance adopted January 1, 2020 | | | | | 29 | |
| Merchant Services Realignment | | | | | | | 30 | |
| Glossary of Terms and Acronyms (a) | | | | | | | | |
| | | | | | | | | |
| |
| (a) | Refer to the Glossary of Terms and Acronyms on pages 293–299 of JPMorgan Chase & Co.’s (the “Firm’s”) Annual Report on Form 10-K for the year ended December 31, 2019 (the “ 2019 Form 10-K”). |
|
| | | | | | | | | | | | | | | | | | | | | | | | | | |
| JPMORGAN CHASE & CO. | | | | | |
| CONSOLIDATED FINANCIAL HIGHLIGHTS | | | | |
| (in millions, except per share and ratio data) | | | |
| | | | | | | | | | | | | | | |
| | QUARTERLY TRENDS | |
| | | | | | | | | | | | 1Q20 Change | |
| SELECTED INCOME STATEMENT DATA | 1Q20 | | 4Q19 | | 3Q19 | | 2Q19 | | 1Q19 | | 4Q19 | | 1Q19 | |
| Reported Basis | | | | | | | | | | | | | | |
| Total net revenue | $ | 28,251 |
| | $ | 28,331 |
| | $ | 29,341 |
| | $ | 28,832 |
| | $ | 29,123 |
| | — | % |
| (3 | )% |
|
| Total noninterest expense | 16,850 |
| | 16,339 |
| | 16,422 |
| | 16,341 |
| | 16,395 |
| | 3 |
| | 3 |
| |
| Pre-provision profit | 11,401 |
| | 11,992 |
| | 12,919 |
| | 12,491 |
| | 12,728 |
| | (5 | ) | | (10 | ) | |
| Provision for credit losses | 8,285 |
| | 1,427 |
| | 1,514 |
| | 1,149 |
| | 1,495 |
| | 481 |
| | 454 |
| |
| NET INCOME | 2,865 |
| | 8,520 |
| | 9,080 |
| | 9,652 |
| | 9,179 |
| | (66 | ) | | (69 | ) | |
| | | | | | | | | | | | | | | |
| Managed Basis (a) | | | | | | | | | | | | | | |
| Total net revenue | 29,069 |
| | 29,211 |
| | 30,064 |
| | 29,566 |
| | 29,851 |
| | — |
| | (3 | ) | |
| Total noninterest expense | 16,850 |
| | 16,339 |
| | 16,422 |
| | 16,341 |
| | 16,395 |
| | 3 |
| | 3 |
| |
| Pre-provision profit | 12,219 |
| | 12,872 |
| | 13,642 |
| | 13,225 |
| | 13,456 |
| | (5 | ) | | (9 | ) | |
| Provision for credit losses | 8,285 |
| | 1,427 |
| | 1,514 |
| | 1,149 |
| | 1,495 |
| | 481 |
| | 454 |
| |
| NET INCOME | 2,865 |
| | 8,520 |
| | 9,080 |
| | 9,652 |
| | 9,179 |
| | (66 | ) | | (69 | ) | |
| | | | | | | | | | | | | | | |
| EARNINGS PER SHARE DATA | | | | | | | | | | | | | | |
| Net income: Basic | $ | 0.79 |
| | $ | 2.58 |
| | $ | 2.69 |
| | $ | 2.83 |
| | $ | 2.65 |
| | (69 | ) | | (70 | ) | |
| Diluted | 0.78 |
| | 2.57 |
| | 2.68 |
| | 2.82 |
| | 2.65 |
| | (70 | ) | | (71 | ) | |
| Average shares: Basic | 3,095.8 |
| | 3,140.7 |
| | 3,198.5 |
| | 3,250.6 |
| | 3,298.0 |
| | (1 | ) | | (6 | ) | |
| Diluted | 3,100.7 |
| | 3,148.5 |
| | 3,207.2 |
| | 3,259.7 |
| | 3,308.2 |
| | (2 | ) | | (6 | ) | |
| | | | | | | | | | | | | | | |
| MARKET AND PER COMMON SHARE DATA | | | | | | | | | | | | | | |
| Market capitalization | $ | 274,323 |
| | $ | 429,913 |
| | $ | 369,133 |
| | $ | 357,479 |
| | $ | 328,387 |
| | (36 | ) | | (16 | ) | |
| Common shares at period-end | 3,047.0 |
| | 3,084.0 |
| | 3,136.5 |
| | 3,197.5 |
| | 3,244.0 |
| | (1 | ) | | (6 | ) | |
| Book value per share | 75.88 |
| | 75.98 |
| | 75.24 |
| | 73.88 |
| | 71.78 |
| | — |
| | 6 |
| |
| Tangible book value per share (“TBVPS”) (b) | 60.71 |
| | 60.98 |
| | 60.48 |
| | 59.52 |
| | 57.62 |
| | — |
| | 5 |
| |
| Cash dividends declared per share | 0.90 |
| | 0.90 |
| | 0.90 |
| | 0.80 |
| | 0.80 |
| | — |
| | 13 |
| |
| | | | | | | | | | | | | | | |
| FINANCIAL RATIOS (c) | | | | | | | | | | | | | | |
| Return on common equity (“ROE”) | 4 | % |
| 14 | % |
| 15 | % |
| 16 | % | | 16 | % | | | | | |
| Return on tangible common equity (“ROTCE”) (b) | 5 |
| | 17 |
| | 18 |
| | 20 |
| | 19 |
| | | | | |
| Return on assets | 0.40 |
| | 1.22 |
| | 1.30 |
| | 1.41 |
| | 1.39 |
| | | | | |
| | | | | | | | | | | | | | | |
| CAPITAL RATIOS (d) | | | | | | | | | | | | | | |
| Common equity Tier 1 (“CET1”) capital ratio | 11.5 | % | (e) | 12.4 | % | | 12.3 | % | | 12.2 | % | | 12.1 | % | | | | | |
| Tier 1 capital ratio | 13.3 |
| (e) | 14.1 |
| | 14.1 |
| | 14.0 |
| | 13.8 |
| | | | | |
| Total capital ratio | 15.5 |
| (e) | 16.0 |
| | 15.9 |
| | 15.8 |
| | 15.7 |
| | | | | |
| Tier 1 leverage ratio | 7.5 |
| (e) | 7.9 |
| | 7.9 |
| | 8.0 |
| | 8.1 |
| | | | | |
| Supplementary leverage ratio (“SLR”) | 6.0 |
| (e) | 6.3 |
| | 6.3 |
| | 6.4 |
| | 6.4 |
| | | | | |
| | | | | | | | | | | | | | | |
Effective January 1, 2020, the Firm adopted the Financial Instruments – Credit Losses (“CECL”) accounting guidance. Refer to page 29 for further information.
| |
| (a) | Refer to Reconciliation from Reported to Managed Basis on page 7 for a further discussion of managed basis. |
| |
| (b) | TBVPS and ROTCE are each non-GAAP financial measures. TBVPS represents tangible common equity (“TCE”) divided by common shares at period-end. ROTCE measures the Firm’s net income applicable to common equity as a percentage of average TCE. TCE is also a non-GAAP financial measure; refer to page 9 for a reconciliation of common stockholders’ equity to TCE. Refer to page 28 for a further discussion of these measures. |
| |
| (c) | Quarterly ratios are based upon annualized amounts. |
| |
| (d) | As of March 31, 2020, the capital measures reflect the revised CECL capital transition provisions and the removal of assets purchased pursuant to a non-recourse loan provided under the Money Market Liquidity Facility (“MMLF”), as provided by the U.S. banking agencies. Refer to page 29 for further information on the revised CECL capital transition provisions and Capital Risk Management on pages 85-92 of the Firm’s 2019 Form 10-K for additional information on these capital measures. |
|
| | | | | | | | | | | | | | | | | | | | | | | | | | |
| JPMORGAN CHASE & CO. | | | | | |
| CONSOLIDATED FINANCIAL HIGHLIGHTS, CONTINUED | | | |
| (in millions, except ratio and headcount data) | | | | |
| | | | | | | | | | | | | | | |
| | QUARTERLY TRENDS | |
| | | | | | | | | | | | 1Q20 Change | |
| | 1Q20 | | 4Q19 | | 3Q19 | | 2Q19 | | 1Q19 | | 4Q19 | | 1Q19 | |
| SELECTED BALANCE SHEET DATA (period-end) | | | | | | | | | | | | | | |
| Total assets | $ | 3,139,431 |
| | $ | 2,687,379 |
| | $ | 2,764,661 |
| | $ | 2,727,379 |
| | $ | 2,737,188 |
| | 17 | % | | 15 | % | |
| Loans: | | | | | | | | | | | | | | |
| Consumer, excluding credit card loans (a) | 295,627 |
| | 298,001 |
| | 300,407 |
| | 315,705 |
| | 326,407 |
| | (1 | ) | | (9 | ) | |
| Credit card loans | 154,021 |
| | 168,924 |
| | 159,571 |
| | 157,576 |
| | 150,527 |
| | (9 | ) | | 2 |
| |
| Wholesale loans (a) | 565,727 |
| | 492,844 |
| | 485,240 |
| | 483,608 |
| | 479,311 |
| | 15 |
| | 18 |
| |
| Total Loans | 1,015,375 |
| | 959,769 |
| | 945,218 |
| | 956,889 |
| | 956,245 |
| | 6 |
| | 6 |
| |
| | | | | | | | | | | | | | | |
| Deposits: | | | | | | | | | | | | | | |
| U.S. offices: | | | | | | | | | | | | | | |
| Noninterest-bearing | 448,195 |
| | 395,667 |
| | 393,522 |
| | 394,237 |
| | 388,572 |
| | 13 |
| | 15 |
| |
| Interest-bearing | 1,026,603 |
| | 876,156 |
| | 844,137 |
| | 841,397 |
| | 826,723 |
| | 17 |
| | 24 |
| |
| Non-U.S. offices: | | | | | | | | | | | | | | |
| Noninterest-bearing | 22,192 |
| | 20,087 |
| | 21,455 |
| | 20,419 |
| | 21,090 |
| | 10 |
| | 5 |
| |
| Interest-bearing | 339,019 |
| | 270,521 |
| | 266,147 |
| | 268,308 |
| | 257,056 |
| | 25 |
| | 32 |
| |
| Total deposits | 1,836,009 |
| | 1,562,431 |
| | 1,525,261 |
| | 1,524,361 |
| | 1,493,441 |
| | 18 |
| | 23 |
| |
| | | | | | | | | | | | | | | |
| Long-term debt | 299,344 |
| | 291,498 |
| | 296,472 |
| | 288,869 |
| | 290,893 |
| | 3 |
| | 3 |
| |
| Common stockholders’ equity | 231,199 |
| | 234,337 |
| | 235,985 |
| | 236,222 |
| | 232,844 |
| | (1 | ) | | (1 | ) | |
| Total stockholders’ equity | 261,262 |
| | 261,330 |
| | 264,348 |
| | 263,215 |
| | 259,837 |
| | — |
| | 1 |
| |
| | | | | | | | | | | | | | | |
| Loans-to-deposits ratio | 55 | % |
| 61 | % |
| 62 | % | | 63 | % | | 64 | % |
| | | | |
| | | | | | | | | | | | | | | |
| Headcount | 256,720 |
| | 256,981 |
| | 257,444 |
| | 254,983 |
| | 255,998 |
| | — |
| | — |
| |
| | | | | | | | | | | | | | | |
| 95% CONFIDENCE LEVEL - TOTAL VaR (b) | | | | | | | | | | | | | | |
| Average VaR | $ | 59 |
| | $ | 37 |
| | $ | 39 |
| | $ | 46 |
| | $ | 52 |
| | 59 |
| | 13 |
| |
| | | | | | | | | | | | | | | |
| LINE OF BUSINESS NET REVENUE (c) | | | | | | | | | | | | | | |
| Consumer & Community Banking | $ | 13,171 |
| | $ | 13,795 |
| | $ | 14,008 |
| | $ | 13,569 |
| | $ | 13,490 |
| | (5 | ) | | (2 | ) | |
| Corporate & Investment Bank | 9,948 |
| | 9,647 |
| | 9,522 |
| | 9,831 |
| | 10,034 |
| | 3 |
| | (1 | ) | |
| Commercial Banking | 2,178 |
| | 2,297 |
| | 2,274 |
| | 2,285 |
| | 2,413 |
| | (5 | ) | | (10 | ) | |
| Asset & Wealth Management | 3,606 |
| | 3,700 |
| | 3,568 |
| | 3,559 |
| | 3,489 |
| | (3 | ) | | 3 |
| |
| Corporate | 166 |
| | (228 | ) | | 692 |
| | 322 |
| | 425 |
| | NM |
| | (61 | ) | |
| TOTAL NET REVENUE | $ | 29,069 |
| | $ | 29,211 |
| | $ | 30,064 |
| | $ | 29,566 |
| | $ | 29,851 |
| | — |
| | (3 | ) | |
| | | | | | | | | | | | | | | |
| LINE OF BUSINESS NET INCOME | | | | | | | | | | | | | | |
| Consumer & Community Banking | $ | 191 |
| | $ | 4,214 |
| | $ | 4,245 |
| | $ | 4,157 |
| | $ | 3,947 |
| | (95 | ) | | (95 | ) | |
| Corporate & Investment Bank | 1,988 |
| | 2,938 |
| | 2,831 |
| | 2,946 |
| | 3,260 |
| | (32 | ) | | (39 | ) | |
| Commercial Banking | 147 |
| | 944 |
| | 943 |
| | 1,002 |
| | 1,060 |
| | (84 | ) | | (86 | ) | |
| Asset & Wealth Management | 664 |
| | 785 |
| | 668 |
| | 719 |
| | 661 |
| | (15 | ) | | — |
| |
| Corporate | (125 | ) | | (361 | ) | | 393 |
| | 828 |
| | 251 |
| | 65 |
| | NM |
| |
| NET INCOME | $ | 2,865 |
| | $ | 8,520 |
| | $ | 9,080 |
| | $ | 9,652 |
| | $ | 9,179 |
| | (66 | ) | | (69 | ) | |
| | | | | | | | | | | | | | | |
| | | | | | | | | | | | | |
Effective January 1, 2020, the Firm adopted the CECL accounting guidance. Refer to page 29 for further information.
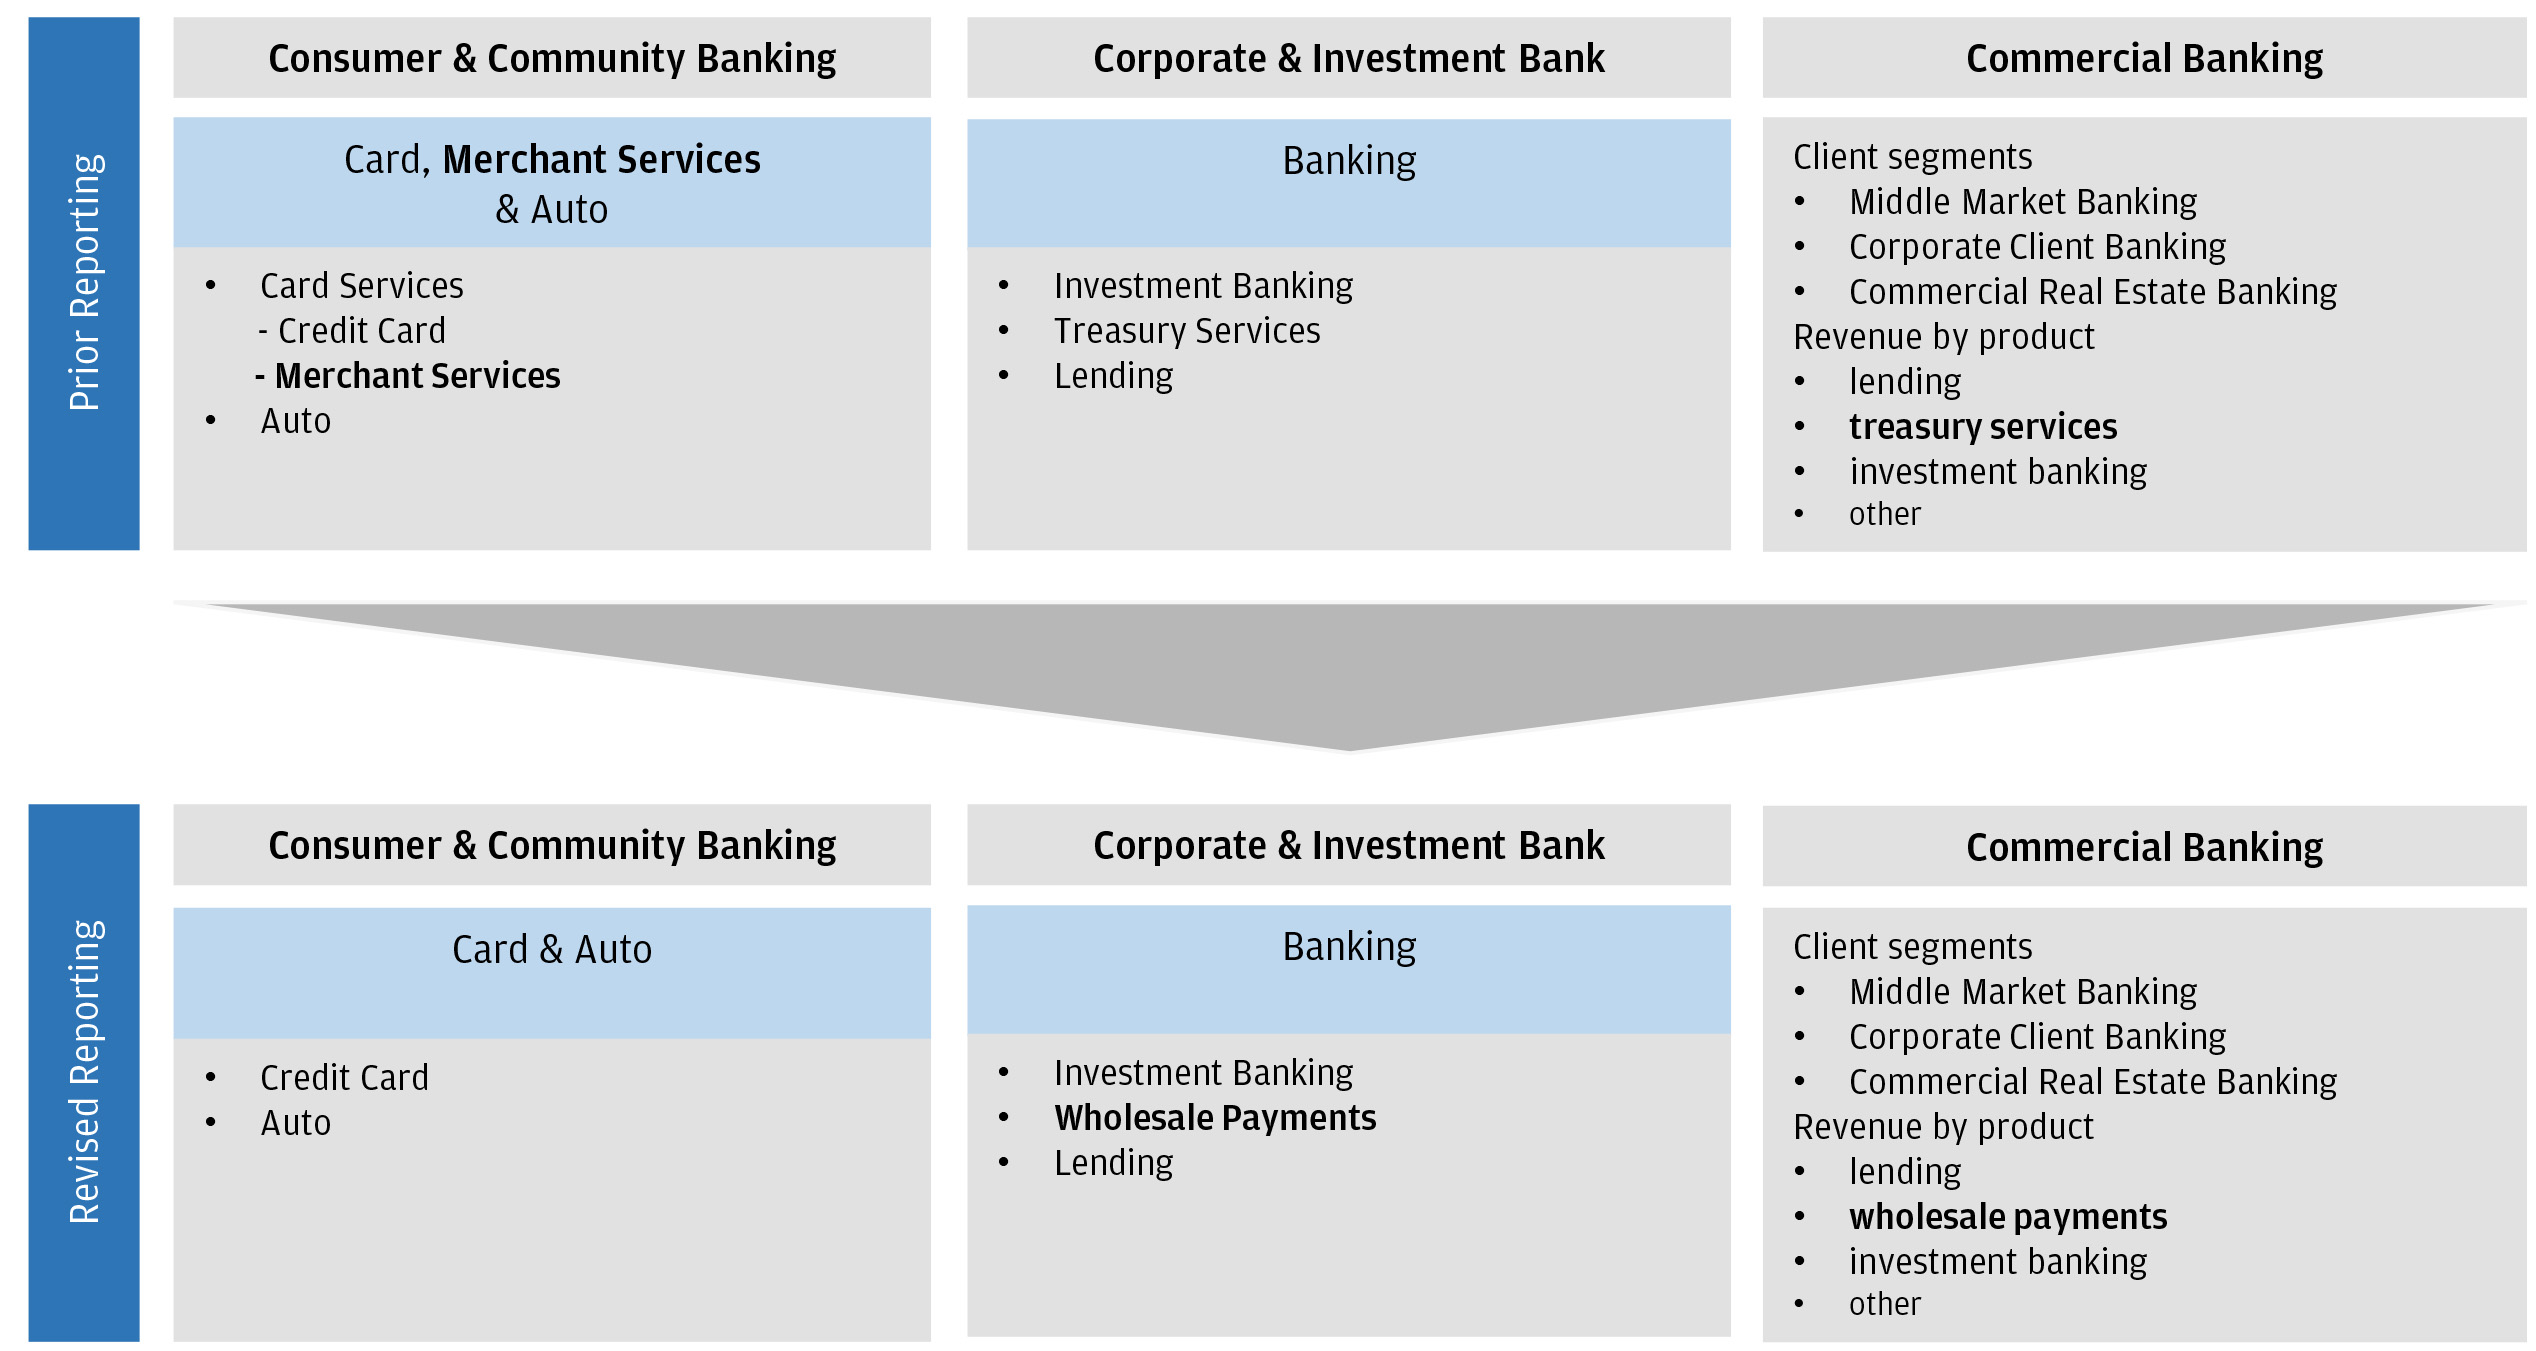
In the first quarter of 2020, the Merchant Services business was realigned from CCB to CIB as part of the Firm’s Wholesale Payments business. The prior period amounts were revised to conform with the current presentation. Refer to page 30 for further information.
| |
| (a) | In conjunction with the adoption of CECL, the Firm reclassified certain loans from the consumer, excluding credit card portfolio segment to the wholesale portfolio segment. Prior periods have been revised to conform with the current presentation. Refer to page 29 for further information. |
| |
| (b) | Effective January 1, 2020, the Firm refined the scope of VaR to exclude positions related to the risk management of interest rate exposure from changes in the Firm’s own credit spread on fair value option elected liabilities, and included these positions in other-sensitivity based measures. This change was made to more appropriately reflect the risk from changes in the Firm’s own credit spread on fair value option elected liabilities in a single market risk measure. In the absence of this refinement, the average Total VaR for the three months ended March 31, 2020 would have been higher by $6 million. |
| |
| (c) | Refer to Reconciliation from Reported to Managed Basis on page 7 for a further discussion of managed basis. |
|
| | | | | | | | | | | | | | | | | | | | | | | | | | |
| JPMORGAN CHASE & CO. | | | | | |
| CONSOLIDATED STATEMENTS OF INCOME | | | | |
| (in millions, except per share and ratio data) | | | | |
| | | | | | | | | | | | | | | |
| | QUARTERLY TRENDS | |
| | | | | | | | | | | | 1Q20 Change | |
| REVENUE | 1Q20 | | 4Q19 | | 3Q19 | | 2Q19 | | 1Q19 | | 4Q19 | | 1Q19 | |
| Investment banking fees | $ | 1,866 |
| | $ | 1,843 |
| | $ | 1,967 |
| | $ | 1,851 |
| | $ | 1,840 |
| | 1 | % | | 1 | % | |
| Principal transactions | 2,937 |
| | 2,779 |
| | 3,449 |
| | 3,714 |
| | 4,076 |
| | 6 |
| | (28 | ) | |
| Lending- and deposit-related fees (a) | 1,706 |
| | 1,772 |
| | 1,671 |
| | 1,624 |
| | 1,559 |
| | (4 | ) | | 9 |
| |
| Asset management, administration and commissions (a) | 4,540 |
| | 4,301 |
| | 4,306 |
| | 4,264 |
| | 4,037 |
| | 6 |
| | 12 |
| |
| Investment securities gains | 233 |
| | 123 |
| | 78 |
| | 44 |
| | 13 |
| | 89 |
| | NM |
| |
| Mortgage fees and related income | 320 |
| | 474 |
| | 887 |
| | 279 |
| | 396 |
| | (32 | ) | | (19 | ) | |
| Card income | 1,054 |
| | 1,381 |
| | 1,283 |
| | 1,366 |
| | 1,274 |
| | (24 | ) | | (17 | ) | |
| Other income | 1,156 |
| | 1,492 |
| | 1,472 |
| | 1,292 |
| | 1,475 |
| | (23 | ) | | (22 | ) | |
| Noninterest revenue | 13,812 |
| | 14,165 |
| | 15,113 |
| | 14,434 |
| | 14,670 |
| | (2 | ) | | (6 | ) | |
| Interest income | 19,161 |
| | 19,927 |
| | 21,121 |
| | 21,603 |
| | 21,389 |
| | (4 | ) | | (10 | ) | |
| Interest expense | 4,722 |
| | 5,761 |
| | 6,893 |
| | 7,205 |
| | 6,936 |
| | (18 | ) | | (32 | ) | |
| Net interest income | 14,439 |
| | 14,166 |
| | 14,228 |
| | 14,398 |
| | 14,453 |
| | 2 |
| | — |
| |
| TOTAL NET REVENUE | 28,251 |
| | 28,331 |
| | 29,341 |
| | 28,832 |
| | 29,123 |
| | — |
| | (3 | ) | |
| | | | | | | | | | | | | | | |
| Provision for credit losses | 8,285 |
| | 1,427 |
| | 1,514 |
| | 1,149 |
| | 1,495 |
| | 481 |
| | 454 |
| |
| | | | | | | | | | | | | | | |
| NONINTEREST EXPENSE | | | | | | | | | | | | | | |
| Compensation expense | 8,895 |
| | 8,088 |
| | 8,583 |
| | 8,547 |
| | 8,937 |
| | 10 |
| | — |
| |
| Occupancy expense | 1,066 |
| | 1,084 |
| | 1,110 |
| | 1,060 |
| | 1,068 |
| | (2 | ) | | — |
| |
| Technology, communications and equipment expense | 2,578 |
| | 2,585 |
| | 2,494 |
| | 2,378 |
| | 2,364 |
| | — |
| | 9 |
| |
| Professional and outside services | 2,028 |
| | 2,226 |
| | 2,056 |
| | 2,212 |
| | 2,039 |
| | (9 | ) | | (1 | ) | |
| Marketing | 859 |
| | 893 |
| | 945 |
| | 862 |
| | 879 |
| | (4 | ) | | (2 | ) | |
| Other expense (b) | 1,424 |
| | 1,463 |
| | 1,234 |
| | 1,282 |
| | 1,108 |
| | (3 | ) | | 29 |
| |
| TOTAL NONINTEREST EXPENSE | 16,850 |
| | 16,339 |
| | 16,422 |
| | 16,341 |
| | 16,395 |
| | 3 |
| | 3 |
| |
| Income before income tax expense | 3,116 |
| | 10,565 |
| | 11,405 |
| | 11,342 |
| | 11,233 |
| | (71 | ) | | (72 | ) | |
| Income tax expense | 251 |
| | 2,045 |
| | 2,325 |
| | 1,690 |
| (e) | 2,054 |
| | (88 | ) | | (88 | ) | |
| NET INCOME | $ | 2,865 |
| | $ | 8,520 |
| | $ | 9,080 |
| | $ | 9,652 |
| | $ | 9,179 |
| | (66 | ) | | (69 | ) | |
| | | | | | | | | | | | | | | |
| | | | | | | | | | | | | | | |
| NET INCOME PER COMMON SHARE DATA | | | | | | | | | | | | | | |
| Basic earnings per share | $ | 0.79 |
| | $ | 2.58 |
| | $ | 2.69 |
| | $ | 2.83 |
| | $ | 2.65 |
| | (69 | ) | | (70 | ) | |
| Diluted earnings per share | 0.78 |
| | 2.57 |
| | 2.68 |
| | 2.82 |
| | 2.65 |
| | (70 | ) | | (71 | ) | |
| | | | | | | | | | | | | | | |
| FINANCIAL RATIOS | | | | | | | | | | | | | | |
| Return on common equity (c) | 4 | % | | 14 | % | | 15 | % | | 16 | % | | 16 | % | | | | | |
| Return on tangible common equity (c)(d) | 5 |
| | 17 |
| | 18 |
| | 20 |
| | 19 |
| | | | | |
| Return on assets (c) | 0.40 |
| | 1.22 |
| | 1.30 |
| | 1.41 |
| | 1.39 |
| | | | | |
| Effective income tax rate | 8.1 |
| | 19.4 |
| | 20.4 |
| | 14.9 |
| (e) | 18.3 |
| | | | | |
| Overhead ratio | 60 |
| | 58 |
| | 56 |
| | 57 |
| | 56 |
| | | | | |
| | | | | | | | | | | | | | | |
| | | | | | | | | | | | | | | |
| |
| (a) | In the first quarter of 2020, the Firm reclassified certain fees from asset management, administration and commissions to lending- and deposit-related fees. Prior period amounts were revised to conform with the current presentation. |
| |
| (b) | Included Firmwide legal expense/(benefit) of $197 million, $241 million, $10 million, $69 million and $(81) million for the three months ended March 31, 2020, December 31, 2019, September 30, 2019, June 30, 2019, and March 31, 2019, respectively. |
| |
| (c) | Quarterly ratios are based upon annualized amounts. |
| |
| (d) | Refer to page 28 for further discussion of ROTCE. |
| |
| (e) | The three months ended June 30, 2019 included income tax benefits of $768 million due to the resolution of certain tax audits. |
|
| | | | | | | | | | | | | | | | | | | | | | | | | | |
| JPMORGAN CHASE & CO. | | | | | |
| CONSOLIDATED BALANCE SHEETS | | | | |
| (in millions) | | | | |
| | | | | | | | | | | | Mar 31, 2020 | |
| | | | | | | | | | | | Change | |
| | Mar 31, | | Dec 31, | | Sep 30, | | Jun 30, | | Mar 31, | | Dec 31, | | Mar 31, | |
| | 2020 | | 2019 | | 2019 | | 2019 | | 2019 | | 2019 | | 2019 | |
| ASSETS | | | | | | | | | | | | | | |
| Cash and due from banks | $ | 24,001 |
| | $ | 21,704 |
| | $ | 21,215 |
| | $ | 23,164 |
| | $ | 21,946 |
| | 11 | % | | 9 | % | |
| Deposits with banks | 343,533 |
| | 241,927 |
| | 235,382 |
| | 244,874 |
| | 280,658 |
| | 42 |
| | 22 |
| |
| Federal funds sold and securities purchased under | | | | | | | | | | | | | | |
| resale agreements | 248,580 |
| | 249,157 |
| | 257,391 |
| | 267,864 |
| | 299,140 |
| | — |
| | (17 | ) | |
| Securities borrowed | 139,839 |
| | 139,758 |
| | 138,336 |
| | 130,661 |
| | 123,186 |
| | — |
| | 14 |
| |
| Trading assets: | | | | | | | | | | | | | | |
| Debt and equity instruments | 466,932 |
| | 361,337 |
| | 440,298 |
| | 470,495 |
| | 483,069 |
| | 29 |
| | (3 | ) | |
| Derivative receivables | 81,648 |
| | 49,766 |
| | 55,577 |
| | 52,878 |
| | 50,333 |
| | 64 |
| | 62 |
| |
| Available-for-sale securities | 399,944 |
|
| 350,699 |
|
| 353,421 |
|
| 276,357 |
|
| 236,516 |
| | 14 |
|
| 69 |
| |
| Held-to-maturity securities, net of allowance for credit losses (a) | 71,200 |
|
| 47,540 |
|
| 40,830 |
|
| 30,907 |
|
| 30,849 |
| | 50 |
|
| 131 |
| |
| Investment securities, net of allowance for credit losses (a) | 471,144 |
| | 398,239 |
| | 394,251 |
| | 307,264 |
| | 267,365 |
| | 18 |
| | 76 |
| |
| Loans | 1,015,375 |
| | 959,769 |
| | 945,218 |
| | 956,889 |
| | 956,245 |
| | 6 |
| | 6 |
| |
| Less: Allowance for loan losses | 23,244 |
| | 13,123 |
| | 13,235 |
| | 13,166 |
| | 13,533 |
| | 77 |
| | 72 |
| |
| Loans, net of allowance for loan losses | 992,131 |
| | 946,646 |
| | 931,983 |
| | 943,723 |
| | 942,712 |
| | 5 |
| | 5 |
| |
| Accrued interest and accounts receivable | 122,064 |
| | 72,861 |
| | 88,988 |
| | 88,399 |
| | 72,240 |
| | 68 |
| | 69 |
| |
| Premises and equipment | 25,882 |
| | 25,813 |
| | 25,117 |
| | 24,665 |
| | 24,160 |
| | — |
| | 7 |
| |
| Goodwill, MSRs and other intangible assets | 51,867 |
| | 53,341 |
| | 53,078 |
| | 53,302 |
| | 54,168 |
| | (3 | ) | | (4 | ) | |
| Other assets | 171,810 |
| | 126,830 |
| | 123,045 |
| | 120,090 |
| | 118,211 |
| | 35 |
| | 45 |
| |
| TOTAL ASSETS | $ | 3,139,431 |
| | $ | 2,687,379 |
| | $ | 2,764,661 |
| | $ | 2,727,379 |
| | $ | 2,737,188 |
| | 17 |
| | 15 |
| |
| | | | | | | | | | | | | | | |
| LIABILITIES | | | | | | | | | | | | | | |
| Deposits | $ | 1,836,009 |
| | $ | 1,562,431 |
| | $ | 1,525,261 |
| | $ | 1,524,361 |
| | $ | 1,493,441 |
| | 18 |
| | 23 |
| |
| Federal funds purchased and securities loaned or sold | | | | | | | | | | | | | | |
| under repurchase agreements | 233,207 |
| | 183,675 |
| | 247,766 |
| | 201,683 |
| | 222,677 |
| | 27 |
| | 5 |
| |
| Short-term borrowings | 51,909 |
| | 40,920 |
| | 48,893 |
| | 59,890 |
| | 71,305 |
| | 27 |
| | (27 | ) | |
| Trading liabilities: | | | | | | | | | | | | | | |
| Debt and equity instruments | 119,109 |
| | 75,569 |
| | 90,553 |
| | 106,160 |
| | 117,904 |
| | 58 |
| | 1 |
| |
| Derivative payables | 65,087 |
| | 43,708 |
| | 47,790 |
| | 41,479 |
| | 39,003 |
| | 49 |
| | 67 |
| |
| Accounts payable and other liabilities | 253,874 |
| | 210,407 |
| | 225,063 |
| | 216,137 |
| | 216,173 |
| | 21 |
| | 17 |
| |
| Beneficial interests issued by consolidated VIEs | 19,630 |
| | 17,841 |
| | 18,515 |
| | 25,585 |
| | 25,955 |
| | 10 |
| | (24 | ) | |
| Long-term debt | 299,344 |
| | 291,498 |
| | 296,472 |
| | 288,869 |
| | 290,893 |
| | 3 |
| | 3 |
| |
| TOTAL LIABILITIES | 2,878,169 |
| | 2,426,049 |
| | 2,500,313 |
| | 2,464,164 |
| | 2,477,351 |
| | 19 |
| | 16 |
| |
| | | | | | | | | | | | | | | |
| STOCKHOLDERS’ EQUITY | | | | | | | | | | | | | | |
| Preferred stock | 30,063 |
| | 26,993 |
| | 28,363 |
| (b) | 26,993 |
| | 26,993 |
| | 11 |
| | 11 |
| |
| Common stock | 4,105 |
| | 4,105 |
| | 4,105 |
| | 4,105 |
| | 4,105 |
| | — |
| | — |
| |
| Additional paid-in capital | 87,857 |
| | 88,522 |
| | 88,512 |
| | 88,359 |
| | 88,170 |
| | (1 | ) | | — |
| |
| Retained earnings | 220,226 |
| | 223,211 |
| | 217,888 |
| | 212,093 |
| | 205,437 |
| | (1 | ) | | 7 |
| |
| Accumulated other comprehensive income/(loss) | 7,418 |
| | 1,569 |
| | 1,800 |
| | 1,114 |
| | (558 | ) | | 373 |
| | NM |
| |
| Shares held in RSU Trust, at cost | (21 | ) | | (21 | ) | | (21 | ) | | (21 | ) | | (21 | ) | | — |
| | — |
| |
| Treasury stock, at cost | (88,386 | ) | | (83,049 | ) | | (76,299 | ) | | (69,428 | ) | | (64,289 | ) | | (6 | ) | | (37 | ) | |
| TOTAL STOCKHOLDERS’ EQUITY | 261,262 |
| | 261,330 |
| | 264,348 |
| | 263,215 |
| | 259,837 |
| | — |
| | 1 |
| |
| TOTAL LIABILITIES AND STOCKHOLDERS’ EQUITY | $ | 3,139,431 |
| | $ | 2,687,379 |
| | $ | 2,764,661 |
| | $ | 2,727,379 |
| | $ | 2,737,188 |
| | 17 |
| | 15 |
| |
| | | | | | | | | | | | | | | |
| | | | | | | | | | | | | | | |
Effective January 1, 2020, the Firm adopted the CECL accounting guidance. Refer to page 29 for further information.
| |
| (a) | At March 31, 2020, the allowance for credit losses on held-to-maturity securities was $19 million. |
| |
| (b) | Included $1.4 billion, which was redeemed on October 30, 2019, as previously announced on September 26, 2019. |
|
| | | | | | | | | | | | | | | | | | | | | | | | | |
| JPMORGAN CHASE & CO. | | | | | | |
| CONDENSED AVERAGE BALANCE SHEETS AND ANNUALIZED YIELDS | |
| (in millions, except rates) | | | | |
| | QUARTERLY TRENDS |
| | | | | | | | | | | | 1Q20 Change |
| AVERAGE BALANCES | 1Q20 | | 4Q19 | | 3Q19 | | 2Q19 | | 1Q19 | | 4Q19 | | 1Q19 |
| ASSETS | | | | | | | | | | | | | |
| Deposits with banks | $ | 279,748 |
| | $ | 272,648 |
| | $ | 267,578 |
| | $ | 289,838 |
| | $ | 290,281 |
| | 3 | % | | (4 | )% |
| Federal funds sold and securities purchased under | | | | | | | | | | | | | |
| resale agreements | 253,403 |
| | 248,170 |
| | 276,721 |
| | 288,781 |
| | 288,478 |
| | 2 |
| | (12 | ) |
| Securities borrowed | 136,127 |
| | 135,374 |
| | 139,939 |
| | 126,157 |
| | 123,467 |
| | 1 |
| | 10 |
|
| Trading assets - debt instruments | 346,911 |
| | 323,554 |
| | 339,198 |
| | 351,716 |
| | 322,541 |
| | 7 |
| | 8 |
|
| Investment securities | 421,529 |
| | 394,002 |
| | 343,134 |
| | 281,232 |
| | 259,400 |
| | 7 |
| | 63 |
|
| Loans | 962,820 |
| | 948,298 |
| | 947,280 |
| | 954,854 |
| | 968,019 |
| | 2 |
| | (1 | ) |
| All other interest-earning assets (a) | 65,194 |
| | 55,695 |
| | 51,304 |
| | 46,516 |
| | 46,708 |
| | 17 |
| | 40 |
|
| Total interest-earning assets | 2,465,732 |
| | 2,377,741 |
| | 2,365,154 |
| | 2,339,094 |
| | 2,298,894 |
| | 4 |
| | 7 |
|
| Trading assets - equity and other instruments | 114,479 |
| | 114,112 |
| | 113,980 |
| | 120,545 |
| | 108,598 |
| | — |
| | 5 |
|
| Trading assets - derivative receivables | 66,309 |
| | 52,860 |
| | 57,062 |
| | 52,659 |
| | 52,522 |
| | 25 |
| | 26 |
|
| All other noninterest-earning assets | 243,712 |
| | 232,557 |
| | 228,856 |
| | 226,757 |
| | 224,700 |
| | 5 |
| | 8 |
|
| TOTAL ASSETS | $ | 2,890,232 |
| | $ | 2,777,270 |
| | $ | 2,765,052 |
| | $ | 2,739,055 |
| | $ | 2,684,714 |
| | 4 |
| | 8 |
|
| LIABILITIES | | | | | | | | | | | | | |
| Interest-bearing deposits | $ | 1,216,555 |
| | $ | 1,154,716 |
| | $ | 1,123,452 |
| | $ | 1,104,051 |
| | $ | 1,080,274 |
| | 5 |
| | 13 |
|
| Federal funds purchased and securities loaned or | | | | | | | | | | | | | |
| sold under repurchase agreements | 243,922 |
| | 235,481 |
| | 239,698 |
| | 227,313 |
| | 209,065 |
| | 4 |
| | 17 |
|
| Short-term borrowings (b) | 37,288 |
| | 39,936 |
| | 44,814 |
| | 58,262 |
| | 67,074 |
| | (7 | ) | | (44 | ) |
| Trading liabilities - debt and other interest-bearing liabilities (c) | 192,950 |
| | 170,049 |
| | 183,369 |
| | 191,655 |
| | 183,478 |
| | 13 |
| | 5 |
|
| Beneficial interests issued by consolidated VIEs | 18,048 |
| | 19,390 |
| | 21,123 |
| | 26,713 |
| | 22,829 |
| | (7 | ) | | (21 | ) |
| Long-term debt | 243,996 |
| | 248,521 |
| | 248,985 |
| | 246,053 |
| | 248,302 |
| | (2 | ) | | (2 | ) |
| Total interest-bearing liabilities | 1,952,759 |
| | 1,868,093 |
| | 1,861,441 |
| | 1,854,047 |
| | 1,811,022 |
| | 5 |
| | 8 |
|
| Noninterest-bearing deposits | 419,631 |
| | 413,582 |
| | 407,428 |
| | 408,243 |
| | 399,468 |
| | 1 |
| | 5 |
|
| Trading liabilities - equity and other instruments | 30,721 |
| | 28,197 |
| | 31,310 |
| | 30,170 |
| | 34,734 |
| | 9 |
| | (12 | ) |
| Trading liabilities - derivative payables | 54,990 |
| | 44,361 |
| | 45,987 |
| | 40,233 |
| | 39,567 |
| | 24 |
| | 39 |
|
| All other noninterest-bearing liabilities | 168,195 |
| | 162,490 |
| | 155,032 |
| | 146,343 |
| | 142,746 |
| | 4 |
| | 18 |
|
| TOTAL LIABILITIES | 2,626,296 |
| | 2,516,723 |
| | 2,501,198 |
| | 2,479,036 |
| | 2,427,537 |
| | 4 |
| | 8 |
|
| Preferred stock | 29,406 |
| | 27,669 |
| | 28,241 |
| | 26,993 |
| | 27,126 |
| | 6 |
| | 8 |
|
| Common stockholders’ equity | 234,530 |
| | 232,878 |
| | 235,613 |
| | 233,026 |
| | 230,051 |
| | 1 |
| | 2 |
|
| TOTAL STOCKHOLDERS’ EQUITY | 263,936 |
| | 260,547 |
| | 263,854 |
| | 260,019 |
| | 257,177 |
| | 1 |
| | 3 |
|
| TOTAL LIABILITIES AND STOCKHOLDERS’ EQUITY | $ | 2,890,232 |
| | $ | 2,777,270 |
| | $ | 2,765,052 |
| | $ | 2,739,055 |
| | $ | 2,684,714 |
| | 4 |
| | 8 |
|
| | | | | | | | | | | | | | |
| AVERAGE RATES (d) | | | | | | | | | | | | | |
| INTEREST-EARNING ASSETS | | | | | | | | | | | | | |
| Deposits with banks | 0.82 |
| % | 1.00 |
| % | 1.33 |
| % | 1.57 |
| % | 1.64 |
| % | | | |
| Federal funds sold and securities purchased under | | | | | | | | | | | | | |
| resale agreements | 1.74 |
| | 2.05 |
| | 2.21 |
| | 2.33 |
| | 2.32 |
| | | | |
| Securities borrowed | 0.45 |
| | 0.81 |
| | 1.23 |
| | 1.48 |
| | 1.30 |
| | | | |
| Trading assets - debt instruments | 2.87 |
| | 3.03 |
| | 3.12 |
| | 3.34 |
| | 3.50 |
| | | | |
| Investment securities | 2.48 |
| | 2.65 |
| | 2.92 |
| | 3.28 |
| | 3.37 |
| | | | |
| Loans | 5.00 |
| | 5.11 |
| | 5.29 |
| | 5.36 |
| | 5.41 |
| | | | |
| All other interest-earning assets (a) | 2.58 |
| | 3.45 |
| | 4.27 |
| | 4.07 |
| | 3.98 |
| | | | |
| Total interest-earning assets | 3.14 |
| | 3.35 |
| | 3.56 |
| | 3.73 |
| | 3.80 |
| | | | |
| | | | | | | | | | | | | | |
| INTEREST-BEARING LIABILITIES | | | | | | | | | | | | | |
| Interest-bearing deposits | 0.52 |
| | 0.67 |
| | 0.85 |
| | 0.88 |
| | 0.82 |
| | | | |
| Federal funds purchased and securities loaned or | | | | | | | | | | | | | |
| sold under repurchase agreements | 1.30 |
| | 1.77 |
| | 2.05 |
| | 2.16 |
| | 2.15 |
| | | | |
| Short-term borrowings (b) | 1.63 |
| | 1.97 |
| | 2.31 |
| | 2.49 |
| | 2.59 |
| | | | |
| Trading liabilities - debt and other interest-bearing liabilities (c) | 0.77 |
| | 1.04 |
| | 1.43 |
| | 1.60 |
| | 1.59 |
| | | | |
| Beneficial interests issued by consolidated VIEs | 2.02 |
| | 2.22 |
| | 2.53 |
| | 2.63 |
| | 2.66 |
| | | | |
| Long-term debt | 2.88 |
| | 3.21 |
| | 3.49 |
| | 3.69 |
| | 3.82 |
| | | | |
| Total interest-bearing liabilities | 0.97 |
| | 1.22 |
| | 1.47 |
| | 1.56 |
| | 1.55 |
| | | | |
| | | | | | | | | | | | | | |
| INTEREST RATE SPREAD | 2.17 |
| % | 2.13 |
| % | 2.09 |
| % | 2.17 |
| % | 2.25 |
| % | | | |
| NET YIELD ON INTEREST-EARNING ASSETS | 2.37 |
| % | 2.38 |
| % | 2.41 |
| % | 2.49 |
| % | 2.57 |
| % | | | |
| Memo: Net yield on interest-earning assets excluding CIB Markets (e) | 3.01 |
| % | 3.06 |
| % | 3.23 |
| % | 3.35 |
| % | 3.43 |
| % | | | |
| | | | | | | | | | | | | | |
| |
| (a) | Includes prime brokerage-related held-for-investment customer receivables, which are classified in accrued interest and accounts receivable, and all other interest-earning assets, which are classified in other assets on the Consolidated Balance Sheets. |
| |
| (b) | Includes commercial paper. |
| |
| (c) | All other interest-bearing liabilities include prime brokerage-related customer payables. |
| |
| (d) | Interest includes the effect of related hedging derivatives. Taxable-equivalent amounts are used where applicable. |
| |
| (e) | Net yield on interest-earning assets excluding CIB Markets is a non-GAAP financial measure. Refer to page 28 for further discussion of the net yield on interest-earning assets excluding CIB Markets. |
|
| | | | | | | | | | | | | | | |
| JPMORGAN CHASE & CO. | | | | | |
| RECONCILIATION FROM REPORTED TO MANAGED BASIS | |
| (in millions, except ratios) | | | | |
| | | | | | | | | | | | | | | | |
The Firm prepares its Consolidated Financial Statements using accounting principles generally accepted in the U.S. (“U.S. GAAP”). That presentation, which is referred to as “reported” basis, provides the reader with an understanding of the Firm’s results that can be tracked consistently from year-to-year and enables a comparison of the Firm’s performance with other companies’ U.S. GAAP financial statements. In addition to analyzing the Firm’s results on a reported basis, management reviews Firmwide results, including the overhead ratio, on a “managed” basis; these Firmwide managed basis results are non-GAAP financial measures. The Firm also reviews the results of the lines of business on a managed basis. Refer to the notes on Non-GAAP Financial Measures on page 28 for additional information on managed basis.
The following summary table provides a reconciliation from reported U.S. GAAP results to managed basis.
|
| | | | | | | | | | | | | | | | | | | | | | | | | |
| | QUARTERLY TRENDS |
| | | | | | | | | | | | 1Q20 Change |
| | 1Q20 | | 4Q19 | | 3Q19 | | 2Q19 | | 1Q19 | | 4Q19 | | 1Q19 |
| OTHER INCOME | | | | | | | | | | | | | |
| Other income - reported | $ | 1,156 |
| | $ | 1,492 |
| | $ | 1,472 |
| | $ | 1,292 |
| | $ | 1,475 |
| | (23 | )% | | (22 | )% |
| Fully taxable-equivalent adjustments (a) | 708 |
| | 757 |
| | 596 |
| | 596 |
| | 585 |
| | (6 | ) | | 21 |
|
| Other income - managed | $ | 1,864 |
| | $ | 2,249 |
| | $ | 2,068 |
| | $ | 1,888 |
| | $ | 2,060 |
| | (17 | ) | | (10 | ) |
| | | | | | | | | | | | | | |
| TOTAL NONINTEREST REVENUE | | | | | | | | | | | | | |
| Total noninterest revenue - reported | $ | 13,812 |
| | $ | 14,165 |
| | $ | 15,113 |
| | $ | 14,434 |
| | $ | 14,670 |
| | (2 | ) | | (6 | ) |
| Fully taxable-equivalent adjustments (a) | 708 |
| | 757 |
| | 596 |
| | 596 |
| | 585 |
| | (6 | ) | | 21 |
|
| Total noninterest revenue - managed | $ | 14,520 |
| | $ | 14,922 |
| | $ | 15,709 |
| | $ | 15,030 |
| | $ | 15,255 |
| | (3 | ) | | (5 | ) |
| | | | | | | | | | | | | | |
| NET INTEREST INCOME | | | | | | | | | | | | | |
| Net interest income - reported | $ | 14,439 |
| | $ | 14,166 |
| | $ | 14,228 |
| | $ | 14,398 |
| | $ | 14,453 |
| | 2 |
| | — |
|
| Fully taxable-equivalent adjustments (a) | 110 |
| | 123 |
| | 127 |
| | 138 |
| | 143 |
| | (11 | ) | | (23 | ) |
| Net interest income - managed | $ | 14,549 |
| | $ | 14,289 |
| | $ | 14,355 |
| | $ | 14,536 |
| | $ | 14,596 |
| | 2 |
| | — |
|
| | | | | | | | | | | | | | |
| TOTAL NET REVENUE | | | | | | | | | | | | | |
| Total net revenue - reported | $ | 28,251 |
| | $ | 28,331 |
| | $ | 29,341 |
| | $ | 28,832 |
| | $ | 29,123 |
| | — |
| | (3 | ) |
| Fully taxable-equivalent adjustments (a) | 818 |
| | 880 |
| | 723 |
| | 734 |
| | 728 |
| | (7 | ) | | 12 |
|
| Total net revenue - managed | $ | 29,069 |
| | $ | 29,211 |
| | $ | 30,064 |
| | $ | 29,566 |
| | $ | 29,851 |
| | — |
| | (3 | ) |
| | | | | | | | | | | | | | |
| PRE-PROVISION PROFIT | | | | | | | | | | | | | |
| Pre-provision profit - reported | $ | 11,401 |
| | $ | 11,992 |
| | $ | 12,919 |
| | $ | 12,491 |
| | $ | 12,728 |
| | (5 | ) | | (10 | ) |
| Fully taxable-equivalent adjustments (a) | 818 |
| | 880 |
| | 723 |
| | 734 |
| | 728 |
| | (7 | ) | | 12 |
|
| Pre-provision profit - managed | $ | 12,219 |
| | $ | 12,872 |
| | $ | 13,642 |
| | $ | 13,225 |
| | $ | 13,456 |
| | (5 | ) | | (9 | ) |
| | | | | | | | | | | | | | |
| INCOME BEFORE INCOME TAX EXPENSE | | | | | | | | | | | | | |
| Income before income tax expense - reported | $ | 3,116 |
| | $ | 10,565 |
| | $ | 11,405 |
| | $ | 11,342 |
| | $ | 11,233 |
| | (71 | ) | | (72 | ) |
| Fully taxable-equivalent adjustments (a) | 818 |
| | 880 |
| | 723 |
| | 734 |
| | 728 |
| | (7 | ) | | 12 |
|
| Income before income tax expense - managed | $ | 3,934 |
| | $ | 11,445 |
| | $ | 12,128 |
| | $ | 12,076 |
| | $ | 11,961 |
| | (66 | ) | | (67 | ) |
| | | | | | | | | | | | | | |
| INCOME TAX EXPENSE | | | | | | | | | | | | | |
| Income tax expense - reported | $ | 251 |
| | $ | 2,045 |
| | $ | 2,325 |
| | $ | 1,690 |
| | $ | 2,054 |
| | (88 | ) | | (88 | ) |
| Fully taxable-equivalent adjustments (a) | 818 |
| | 880 |
| | 723 |
| | 734 |
| | 728 |
| | (7 | ) | | 12 |
|
| Income tax expense - managed | $ | 1,069 |
| | $ | 2,925 |
| | $ | 3,048 |
| | $ | 2,424 |
| | $ | 2,782 |
| | (63 | ) | | (62 | ) |
| | | | | | | | | | | | | | |
| OVERHEAD RATIO | | | | | | | | | | | | | |
| Overhead ratio - reported | 60 |
| % | 58 |
| % | 56 |
| % | 57 |
| % | 56 |
| % | | | |
| Overhead ratio - managed | 58 |
| | 56 |
| | 55 |
| | 55 |
| | 55 |
| | | | |
| | | | | | | | | | | | | | |
| | | | | | | | | | | | | | |
(a) Predominantly recognized in CIB, CB and Corporate.
|
| | | | | | | | | | | | | | | | | | | | | | | | | | |
| JPMORGAN CHASE & CO. | | | | | |
| SEGMENT RESULTS - MANAGED BASIS | | | | |
| (in millions) | | |
| | | | | | | | | | | | | | | |
| | | | | | | | | | | | | | | |
| | QUARTERLY TRENDS | |
| | | | | | | | | | | | 1Q20 Change | |
| | 1Q20 | | 4Q19 | | 3Q19 | | 2Q19 | | 1Q19 | | 4Q19 | | 1Q19 | |
| TOTAL NET REVENUE (fully taxable-equivalent (“FTE”)) | | | | | | | | | | | | | | |
| Consumer & Community Banking | $ | 13,171 |
| | $ | 13,795 |
| | $ | 14,008 |
| | $ | 13,569 |
| | $ | 13,490 |
| | (5 | )% |
| (2 | )% |
|
| Corporate & Investment Bank | 9,948 |
| | 9,647 |
| | 9,522 |
| | 9,831 |
| | 10,034 |
| | 3 |
| | (1 | ) | |
| Commercial Banking | 2,178 |
| | 2,297 |
| | 2,274 |
| | 2,285 |
| | 2,413 |
| | (5 | ) | | (10 | ) | |
| Asset & Wealth Management | 3,606 |
| | 3,700 |
| | 3,568 |
| | 3,559 |
| | 3,489 |
| | (3 | ) | | 3 |
| |
| Corporate | 166 |
| | (228 | ) | | 692 |
| | 322 |
| | 425 |
| | NM |
| | (61 | ) | |
| TOTAL NET REVENUE | $ | 29,069 |
| | $ | 29,211 |
| | $ | 30,064 |
| | $ | 29,566 |
| | $ | 29,851 |
| | — |
| | (3 | ) | |
| | | | | | | | | | | | | | | |
| TOTAL NONINTEREST EXPENSE | | | | | | | | | | | | | | |
| Consumer & Community Banking | $ | 7,161 |
| | $ | 7,011 |
| | $ | 7,075 |
| | $ | 6,921 |
| | $ | 6,970 |
| | 2 |
| | 3 |
| |
| Corporate & Investment Bank | 5,896 |
| | 5,392 |
| | 5,504 |
| | 5,661 |
| | 5,629 |
| | 9 |
| | 5 |
| |
| Commercial Banking | 988 |
| | 943 |
| | 940 |
| | 931 |
| | 938 |
| | 5 |
| | 5 |
| |
| Asset & Wealth Management | 2,659 |
| | 2,650 |
| | 2,622 |
| | 2,596 |
| | 2,647 |
| | — |
| | — |
| |
| Corporate | 146 |
| | 343 |
| | 281 |
| | 232 |
| | 211 |
| | (57 | ) | | (31 | ) | |
| TOTAL NONINTEREST EXPENSE | $ | 16,850 |
| | $ | 16,339 |
| | $ | 16,422 |
| | $ | 16,341 |
| | $ | 16,395 |
| | 3 |
| | 3 |
| |
| | | | | | | | | | | | | | | |
| PRE-PROVISION PROFIT/(LOSS) | | | | | | | | | | | | | | |
| Consumer & Community Banking | $ | 6,010 |
| | $ | 6,784 |
| | $ | 6,933 |
| | $ | 6,648 |
| | $ | 6,520 |
| | (11 | ) | | (8 | ) | |
| Corporate & Investment Bank | 4,052 |
| | 4,255 |
| | 4,018 |
| | 4,170 |
| | 4,405 |
| | (5 | ) | | (8 | ) | |
| Commercial Banking | 1,190 |
| | 1,354 |
| | 1,334 |
| | 1,354 |
| | 1,475 |
| | (12 | ) | | (19 | ) | |
| Asset & Wealth Management | 947 |
| | 1,050 |
| | 946 |
| | 963 |
| | 842 |
| | (10 | ) | | 12 |
| |
| Corporate | 20 |
| | (571 | ) | | 411 |
| | 90 |
| | 214 |
| | NM |
| | (91 | ) | |
| PRE-PROVISION PROFIT | $ | 12,219 |
| | $ | 12,872 |
| | $ | 13,642 |
| | $ | 13,225 |
| | $ | 13,456 |
| | (5 | ) | | (9 | ) | |
| | | | | | | | | | | | | | | |
| PROVISION FOR CREDIT LOSSES | | | | | | | | | | | | | | |
| Consumer & Community Banking | $ | 5,772 |
| | $ | 1,207 |
| | $ | 1,311 |
| | $ | 1,120 |
| | $ | 1,314 |
| | 378 |
| | 339 |
| |
| Corporate & Investment Bank | 1,401 |
| | 98 |
| | 92 |
| | — |
| | 87 |
| | NM |
| | NM |
| |
| Commercial Banking | 1,010 |
| | 110 |
| | 67 |
| | 29 |
| | 90 |
| | NM |
| | NM |
| |
| Asset & Wealth Management | 94 |
| | 13 |
| | 44 |
| | 2 |
| | 2 |
| | NM |
| | NM |
| |
| Corporate | 8 |
| | (1 | ) | | — |
| | (2 | ) | | 2 |
| | NM |
| | 300 |
| |
| PROVISION FOR CREDIT LOSSES | $ | 8,285 |
| | $ | 1,427 |
| | $ | 1,514 |
| | $ | 1,149 |
| | $ | 1,495 |
| | 481 |
| | 454 |
| |
| | | | | | | | | | | | | | | |
| NET INCOME/(LOSS) | | | | | | | | | | | | | | |
| Consumer & Community Banking | $ | 191 |
| | $ | 4,214 |
| | $ | 4,245 |
| | $ | 4,157 |
| | $ | 3,947 |
| | (95 | ) | | (95 | ) | |
| Corporate & Investment Bank | 1,988 |
| | 2,938 |
| | 2,831 |
| | 2,946 |
| | 3,260 |
| | (32 | ) | | (39 | ) | |
| Commercial Banking | 147 |
| | 944 |
| | 943 |
| | 1,002 |
| | 1,060 |
| | (84 | ) | | (86 | ) | |
| Asset & Wealth Management | 664 |
| | 785 |
| | 668 |
| | 719 |
| | 661 |
| | (15 | ) | | — |
| |
| Corporate | (125 | ) | | (361 | ) | | 393 |
| | 828 |
| | 251 |
| | 65 |
| | NM |
| |
| TOTAL NET INCOME | $ | 2,865 |
| | $ | 8,520 |
| | $ | 9,080 |
| | $ | 9,652 |
| | $ | 9,179 |
| | (66 | ) | | (69 | ) | |
| | | | | | | | | | | | | | | |
| | | | | | | | | | | | | | | |
In the first quarter of 2020, the Merchant Services business was realigned from CCB to CIB as part of the Firm’s Wholesale Payments business. The prior period amounts were revised to conform with the current presentation. Refer to page 30 for further information.
|
| | | | | | | | | | | | | | | | | | | | | | | | | | |
| JPMORGAN CHASE & CO. | | | |
| CAPITAL AND OTHER SELECTED BALANCE SHEET ITEMS |
| (in millions, except ratio data) | | |
| | | | | | | | | | | | | | | |
| | | | | | | | | | | | Mar 31, 2020 | |
| | | | | | | | | | | | Change | |
| | Mar 31, | | Dec 31, | | Sep 30, | | Jun 30, | | Mar 31, | | Dec 31, | | Mar 31, | |
| | 2020 | | 2019 | | 2019 | | 2019 | | 2019 | | 2019 | | 2019 | |
| CAPITAL (a) | | | | | | | | | | | | | | |
| Risk-based capital metrics | | | | | | | | | | | | | | |
| Standardized | | | | | | | | | | | | | | |
| CET1 capital | $ | 183,585 |
| (e) | $ | 187,753 |
|
| $ | 188,151 |
|
| $ | 189,169 |
|
| $ | 186,116 |
| | (2 | )% | | (1 | )% | |
| Tier 1 capital | 213,384 |
| (e) | 214,432 |
| | 214,831 |
| | 215,808 |
| | 212,644 |
| | — |
| | — |
| |
| Total capital | 247,530 |
| (e) | 242,589 |
| | 243,500 |
| | 244,490 |
| | 241,483 |
| | 2 |
| | 3 |
| |
| Risk-weighted assets | 1,599,920 |
| (e) | 1,515,869 |
| | 1,527,762 |
| | 1,545,101 |
| | 1,542,903 |
| | 6 |
| | 4 |
| |
| CET1 capital ratio | 11.5 | % | (e) | 12.4 | % | | 12.3 | % | | 12.2 | % | | 12.1 | % | | | | | |
| Tier 1 capital ratio | 13.3 |
| (e) | 14.1 |
| | 14.1 |
| | 14.0 |
| | 13.8 |
| | | | | |
| Total capital ratio | 15.5 |
| (e) | 16.0 |
| | 15.9 |
| | 15.8 |
| | 15.7 |
| | | | | |
| | | | | | | | | | | | | | | |
| Advanced | | | | | | | | | | | | | | |
| CET1 capital | $ | 183,585 |
| (e) | $ | 187,753 |
| | $ | 188,151 |
| | $ | 189,169 |
| | $ | 186,116 |
| | (2 | ) | | (1 | ) | |
| Tier 1 capital | 213,384 |
| (e) | 214,432 |
| | 214,831 |
| | 215,808 |
| | 212,644 |
| | — |
| | — |
| |
| Total capital | 234,423 |
| (e) | 232,112 |
| | 233,203 |
| | 234,507 |
| | 231,454 |
| | 1 |
| | 1 |
| |
| Risk-weighted assets | 1,491,797 |
| (e) | 1,397,878 |
| | 1,435,693 |
| | 1,449,211 |
| | 1,432,526 |
| | 7 |
| | 4 |
| |
| CET1 capital ratio | 12.3 | % | (e) | 13.4 | % | | 13.1 | % | | 13.1 | % | | 13.0 | % | | | | | |
| Tier 1 capital ratio | 14.3 |
| (e) | 15.3 |
| | 15.0 |
| | 14.9 |
| | 14.8 |
| | | | | |
| Total capital ratio | 15.7 |
| (e) | 16.6 |
| | 16.2 |
| | 16.2 |
| | 16.2 |
| | | | | |
| | | | | | | | | | | | | | | |
| Leverage-based capital metrics | | | | | | | | | | | | | | |
| Adjusted average assets (b) | $ | 2,842,222 |
| (e) | $ | 2,730,239 |
| | $ | 2,717,852 |
| | $ | 2,692,225 |
| | $ | 2,637,741 |
| | 4 |
| | 8 |
| |
| Tier 1 leverage ratio | 7.5 | % | (e) | 7.9 | % | | 7.9 | % | | 8.0 | % | | 8.1 | % | | | | | |
| | | | | | | | | | | | | | | |
| Total leverage exposure | 3,535,603 |
| (e) | 3,423,431 |
| | 3,404,535 |
| | 3,367,154 |
| | 3,309,501 |
| | 3 |
| | 7 |
| |
| SLR | 6.0 | % | (e) | 6.3 | % | | 6.3 | % | | 6.4 | % | | 6.4 | % | | | | | |
| | | | | | | | | | | | | | | |
| TANGIBLE COMMON EQUITY (period-end) (c) | | | | | | | | | | | | | | |
| Common stockholders’ equity | $ | 231,199 |
| | $ | 234,337 |
| | $ | 235,985 |
| | $ | 236,222 |
| | $ | 232,844 |
| | (1 | ) | | (1 | ) | |
| Less: Goodwill | 47,800 |
| | 47,823 |
| | 47,818 |
| | 47,477 |
| | 47,474 |
| | — |
| | 1 |
| |
| Less: Other intangible assets | 800 |
| | 819 |
| | 841 |
| | 732 |
| | 737 |
| | (2 | ) | | 9 |
| |
| Add: Certain deferred tax liabilities (d) | 2,389 |
| | 2,381 |
| | 2,371 |
| | 2,316 |
| | 2,293 |
| | — |
| | 4 |
| |
| Total tangible common equity | $ | 184,988 |
| | $ | 188,076 |
| | $ | 189,697 |
| | $ | 190,329 |
| | $ | 186,926 |
| | (2 | ) | | (1 | ) | |
| | | | | | | | | | | | | | | |
| TANGIBLE COMMON EQUITY (average) (c) | | | | | | | | | | | | | | |
| Common stockholders’ equity | $ | 234,530 |
| | $ | 232,878 |
| | $ | 235,613 |
| | $ | 233,026 |
| | $ | 230,051 |
| | 1 |
| | 2 |
| |
| Less: Goodwill | 47,812 |
| | 47,819 |
| | 47,707 |
| | 47,472 |
| | 47,475 |
| | — |
| | 1 |
| |
| Less: Other intangible assets | 812 |
| | 831 |
| | 842 |
| | 741 |
| | 744 |
| | (2 | ) | | 9 |
| |
| Add: Certain deferred tax liabilities (d) | 2,385 |
| | 2,375 |
| | 2,344 |
| | 2,304 |
| | 2,287 |
| | — |
| | 4 |
| |
| Total tangible common equity | $ | 188,291 |
| | $ | 186,603 |
| | $ | 189,408 |
| | $ | 187,117 |
| | $ | 184,119 |
| | 1 |
| | 2 |
| |
| | | | | | | | | | | | | | | |
| INTANGIBLE ASSETS (period-end) | | | | | | | | | | | | | | |
| Goodwill | $ | 47,800 |
| | $ | 47,823 |
| | $ | 47,818 |
| | $ | 47,477 |
| | $ | 47,474 |
| | — |
| | 1 |
| |
| Mortgage servicing rights | 3,267 |
| | 4,699 |
| | 4,419 |
| | 5,093 |
| | 5,957 |
| | (30 | ) | | (45 | ) | |
| Other intangible assets | 800 |
| | 819 |
| | 841 |
| | 732 |
| | 737 |
| | (2 | ) | | 9 |
| |
| Total intangible assets | $ | 51,867 |
| | $ | 53,341 |
| | $ | 53,078 |
| | $ | 53,302 |
| | $ | 54,168 |
| | (3 | ) | | (4 | ) | |
| | | | | | | | | | | | | | | |
| | | | | | | | | | | | | | | |
Effective January 1, 2020, the Firm adopted the CECL accounting guidance. Refer to page 29 for further information.
| |
| (a) | As of March 31, 2020, the capital measures reflect the revised CECL capital transition provisions and the removal of assets purchased pursuant to a non-recourse loan provided under the MMLF, as provided by the U.S. banking agencies. Refer to page 29 for further information on the revised CECL capital transition provisions and Capital Risk Management on pages 85-92 of the Firm’s 2019 Form 10-K for additional information on these capital measures. |
| |
| (b) | Adjusted average assets, for purposes of calculating leverage ratios, includes total quarterly average assets adjusted for on-balance sheet assets that are subject to deduction from Tier 1 capital, predominantly goodwill and other intangible assets. |
| |
| (c) | Refer to page 28 for further discussion of TCE. |
| |
| (d) | Represents deferred tax liabilities related to tax-deductible goodwill and to identifiable intangibles created in nontaxable transactions, which are netted against goodwill and other intangibles when calculating TCE. |
|
| | | | | | | | | | | | | | | | | | | | | | | | | | |
| JPMORGAN CHASE & CO. | | | | | |
| EARNINGS PER SHARE AND RELATED INFORMATION | |
| (in millions, except per share and ratio data) | | | | |
| | | | | | | | | | | | | | | |
| | QUARTERLY TRENDS | |
| | | | | | | | | | | | 1Q20 Change | |
| | 1Q20 | | 4Q19 | | 3Q19 | | 2Q19 | | 1Q19 | | 4Q19 | | 1Q19 | |
| EARNINGS PER SHARE | | | | | | | | | | | | | | |
| Basic earnings per share | | | | | | | | | | | | | | |
| Net income | $ | 2,865 |
| | $ | 8,520 |
| | $ | 9,080 |
| | $ | 9,652 |
| | $ | 9,179 |
| | (66 | )% | | (69 | )% | |
| Less: Preferred stock dividends | 421 |
| | 386 |
| | 423 |
| | 404 |
| | 374 |
| | 9 |
| | 13 |
| |
| Net income applicable to common equity | 2,444 |
| | 8,134 |
| | 8,657 |
| | 9,248 |
| | 8,805 |
| | (70 | ) | | (72 | ) | |
| Less: Dividends and undistributed earnings allocated to | | | | | | | | | | | | | | |
| participating securities | 13 |
| | 44 |
| | 51 |
| | 56 |
| | 52 |
| | (70 | ) | | (75 | ) | |
| Net income applicable to common stockholders | $ | 2,431 |
| | $ | 8,090 |
| | $ | 8,606 |
| | $ | 9,192 |
| | $ | 8,753 |
| | (70 | ) | | (72 | ) | |
| | | | | | | | | | | | | | | |
| Total weighted-average basic shares outstanding | 3,095.8 |
| | 3,140.7 |
| | 3,198.5 |
| | 3,250.6 |
| | 3,298.0 |
| | (1 | ) | | (6 | ) | |
| Net income per share | $ | 0.79 |
| | $ | 2.58 |
| | $ | 2.69 |
| | $ | 2.83 |
| | $ | 2.65 |
| | (69 | ) | | (70 | ) | |
| | | | | | | | | | | | | | | |
| Diluted earnings per share | | | | | | | | | | | | | | |
| Net income applicable to common stockholders | $ | 2,431 |
| | $ | 8,090 |
| | $ | 8,606 |
| | $ | 9,192 |
| | $ | 8,753 |
| | (70 | ) | | (72 | ) | |
| Total weighted-average basic shares outstanding | 3,095.8 |
| | 3,140.7 |
| | 3,198.5 |
| | 3,250.6 |
| | 3,298.0 |
| | (1 | ) | | (6 | ) | |
Add: Dilutive impact of stock appreciation rights (“SARs”) and employee stock options, unvested performance share units (“PSUs”) and nondividend-earning restricted stock units (“RSUs”) | 4.9 |
| | 7.8 |
| | 8.7 |
| | 9.1 |
| | 10.2 |
| | (37 | ) | | (52 | ) | |
| Total weighted-average diluted shares outstanding | 3,100.7 |
| | 3,148.5 |
| | 3,207.2 |
| | 3,259.7 |
| | 3,308.2 |
| | (2 | ) | | (6 | ) | |
| Net income per share | $ | 0.78 |
| | $ | 2.57 |
| | $ | 2.68 |
| | $ | 2.82 |
| | $ | 2.65 |
| | (70 | ) | | (71 | ) | |
| | | | | | | | | | | | | | | |
| COMMON DIVIDENDS | | | | | | | | | | | | | | |
| Cash dividends declared per share | $ | 0.90 |
| | $ | 0.90 |
| | $ | 0.90 |
| | $ | 0.80 |
| | $ | 0.80 |
| | — |
| | 13 |
| |
| Dividend payout ratio | 114 | % | | 35 | % | | 33 | % | | 28 | % | | 30 | % | | | | | |
| | | | | | | | | | | | | | | |
| COMMON EQUITY REPURCHASE PROGRAM (a) | | | | | | | | | | | | | | |
| Total shares of common stock repurchased | 50.0 |
| | 54.0 |
| | 62.0 |
| | 47.5 |
| | 49.5 |
| | (7 | ) | | 1 |
| |
| Average price paid per share of common stock | $ | 127.92 |
| | $ | 127.24 |
| | $ | 112.07 |
| | $ | 109.83 |
| | $ | 102.78 |
| | 1 |
| | 24 |
| |
| Aggregate repurchases of common equity | 6,397 |
| | 6,871 |
| | 6,949 |
| | 5,210 |
| | 5,091 |
| | (7 | ) | | 26 |
| |
| | | | | | | | | | | | | | | |
| EMPLOYEE ISSUANCE | | | | | | | | | | | | | | |
| Shares issued from treasury stock related to employee | | | | | | | | | | | | | | |
| stock-based compensation awards and employee stock | | | | | | | | | | | | | | |
| purchase plans | 13.0 |
| | 1.5 |
| | 1.0 |
| | 1.0 |
| | 17.7 |
| | NM |
| | (27 | ) | |
| Net impact of employee issuances on stockholders’ equity (b) | $ | 398 |
| | $ | 132 |
| | $ | 232 |
| | $ | 258 |
| | $ | 348 |
| | 202 |
| | 14 |
| |
| | | | | | | | | | | | | | | |
| | | | | | | | | | | | | | | |
| |
| (a) | On March 15, 2020, in response to the COVID-19 pandemic, the Firm temporarily suspended repurchases of its common equity through the second quarter of 2020. The current equity repurchase program, which was announced on June 27, 2019, authorized the Firm to repurchase up to $29.4 billion of common equity between July 1, 2019 and June 30, 2020. |
| |
| (b) | The net impact of employee issuances on stockholders’ equity is driven by the cost of equity compensation awards that is recognized over the applicable vesting periods. The cost is partially offset by tax impacts related to the distribution of shares and the exercise of employee stock options and SARs. |
|
| | | | | | | | | | | | | | | | | | | | | | | | | | |
| JPMORGAN CHASE & CO. | | | | | |
| CONSUMER & COMMUNITY BANKING | | | | |
| FINANCIAL HIGHLIGHTS | | | | |
| (in millions, except ratio data) | | | | |
| | | | | | | | | | | | | | | |
| | | | | | | | | | | | | | | |
| | QUARTERLY TRENDS | |
| | | | | | | | | | | | 1Q20 Change | |
| | 1Q20 | | 4Q19 | | 3Q19 | | 2Q19 | | 1Q19 | | 4Q19 | | 1Q19 | |
| INCOME STATEMENT | | | | | | | | | | | | | | |
| REVENUE | | | | | | | | | | | | | | |
| Lending- and deposit-related fees (a) | $ | 972 |
| | $ | 1,032 |
| | $ | 1,026 |
| | $ | 971 |
| | $ | 909 |
| | (6 | )% | | 7 | % | |
| Asset management, administration and commissions (a) | 585 |
| | 609 |
| | 606 |
| | 620 |
| | 581 |
| | (4 | ) | | 1 |
| |
| Mortgage fees and related income (b) | 320 |
| | 474 |
| | 886 |
| | 279 |
| | 396 |
| | (32 | ) | | (19 | ) | |
| Card income | 768 |
| | 1,029 |
| | 955 |
| | 998 |
| | 909 |
| | (25 | ) | | (16 | ) | |
| All other income | 1,373 |
| | 1,396 |
| | 1,383 |
| | 1,321 |
| | 1,290 |
| | (2 | ) | | 6 |
| |
| Noninterest revenue | 4,018 |
| | 4,540 |
| | 4,856 |
| | 4,189 |
| | 4,085 |
| | (11 | ) | | (2 | ) | |
| Net interest income (b) | 9,153 |
| | 9,255 |
| | 9,152 |
| | 9,380 |
| | 9,405 |
| | (1 | ) | | (3 | ) | |
| TOTAL NET REVENUE | 13,171 |
| | 13,795 |
| | 14,008 |
| | 13,569 |
| | 13,490 |
| | (5 | ) | | (2 | ) | |
| | | | | | | | | | | | | | | |
| Provision for credit losses | 5,772 |
| | 1,207 |
| | 1,311 |
| | 1,120 |
| | 1,314 |
| | 378 |
| | 339 |
| |
| | | | | | | | | | | | | | | |
| NONINTEREST EXPENSE | | | | | | | | | | | | | | |
| Compensation expense | 2,597 |
| | 2,497 |
| | 2,544 |
| | 2,531 |
| | 2,566 |
| | 4 |
| | 1 |
| |
| Noncompensation expense (c) | 4,564 |
| | 4,514 |
| | 4,531 |
| | 4,390 |
| | 4,404 |
| | 1 |
| | 4 |
| |
| TOTAL NONINTEREST EXPENSE | 7,161 |
| | 7,011 |
| | 7,075 |
| | 6,921 |
| | 6,970 |
| | 2 |
| | 3 |
| |
| | | | | | | | | | | | | | | |
| Income before income tax expense | 238 |
| | 5,577 |
| | 5,622 |
| | 5,528 |
| | 5,206 |
| | (96 | ) | | (95 | ) | |
| Income tax expense | 47 |
| | 1,363 |
| | 1,377 |
| | 1,371 |
| | 1,259 |
| | (97 | ) | | (96 | ) | |
| NET INCOME | $ | 191 |
| | $ | 4,214 |
| | $ | 4,245 |
| | $ | 4,157 |
| | $ | 3,947 |
| | (95 | ) | | (95 | ) | |
| | | | | | | | | | | | | | | |
| REVENUE BY LINE OF BUSINESS | | | | | | | | | | | | | | |
| Consumer & Business Banking | $ | 6,091 |
| | $ | 6,537 |
| | $ | 6,782 |
| | $ | 6,897 |
| | $ | 6,661 |
| | (7 | ) | | (9 | ) | |
| Home Lending (b) | 1,161 |
| | 1,250 |
| | 1,465 |
| | 1,118 |
| | 1,346 |
| | (7 | ) | | (14 | ) | |
| Card & Auto | 5,919 |
| | 6,008 |
| | 5,761 |
| | 5,554 |
| | 5,483 |
| | (1 | ) | | 8 |
| |
| | | | | | | | | | | | | | | |
| MORTGAGE FEES AND RELATED INCOME DETAILS: | | | | | | | | | | | | | | |
| Net production revenue (b) | 319 |
| | 327 |
| | 738 |
| | 353 |
| | 200 |
| | (2 | ) | | 60 |
| |
| Net mortgage servicing revenue (d) | 1 |
| | 147 |
| | 148 |
| | (74 | ) | | 196 |
| | (99 | ) | | (99 | ) | |
| Mortgage fees and related income | $ | 320 |
| | $ | 474 |
| | $ | 886 |
| | $ | 279 |
| | $ | 396 |
| | (32 | ) | | (19 | ) | |
| | | | | | | | | | | | | | | |
| FINANCIAL RATIOS | | | | | | | | | | | | | | |
| ROE | 1 |
| % | 31 |
| % | 31 |
| % | 31 |
| % | 30 |
| % | | | | |
| Overhead ratio | 54 |
| | 51 |
| | 51 |
| | 51 |
| | 52 |
| | | | | |
| | | | | | | | | | | | | | | |
| | | | | | | | | | | | | | | |
In the first quarter of 2020, the Merchant Services business was realigned from CCB to CIB as part of the Firm’s Wholesale Payments business. The prior period amounts were revised to conform with the current presentation. Refer to page 30 for further information.
| |
| (a) | In the first quarter of 2020, the Firm reclassified certain fees from asset management, administration and commissions to lending- and deposit-related fees. The prior period amounts were revised to conform with the current presentation. |
| |
| (b) | Net production revenue in the third quarter of 2019 included approximately $350 million of gains on the sale of certain mortgage loans that were predominantly offset by a charge in net interest income for the unwind of the related internal funding from Treasury and Chief Investment Office (“CIO”) associated with these loans. The charge reflects the net present value of that funding and is recognized as interest income in Treasury and CIO. Refer to footnote (a) in Corporate on page 23 and Funds Transfer Pricing (“FTP”) on page 61 of the Firm’s 2019 Form 10-K for further information. |
| |
| (c) | Included depreciation expense on leased assets of $1.1 billion, $1.1 billion, $1.0 billion, $957 million and $967 million for the three months ended March 31, 2020, December 31, 2019, September 30, 2019, June 30, 2019, and March 31, 2019, respectively. |
| |
| (d) | Included MSR risk management results of $(90) million, $35 million, $53 million, $(244) million and $(9) million for the three months ended March 31, 2020, December 31, 2019, September 30, 2019, June 30, 2019, and March 31, 2019, respectively. |
|
| | | | | | | | | | | | | | | | | | | | | | | | | | |
| JPMORGAN CHASE & CO. | | | | | |
| CONSUMER & COMMUNITY BANKING | | | | |
| FINANCIAL HIGHLIGHTS, CONTINUED | | | | |
| (in millions, except headcount data) | | | | |
| | | | | | | | | | | | | | | |
| | QUARTERLY TRENDS | |
| | | | | | | | | | | | 1Q20 Change | |
| | 1Q20 | | 4Q19 | | 3Q19 | | 2Q19 | | 1Q19 | | 4Q19 | | 1Q19 | |
| SELECTED BALANCE SHEET DATA (period-end) | | | | | | | | | | | | | | |
| Total assets | $ | 506,147 |
| | $ | 532,538 |
| | $ | 525,223 |
| | $ | 536,758 |
| | $ | 539,127 |
| | (5 | )% | | (6 | )% | |
| | | | | | | | | | | | | | | |
| Loans: | | | | | | | | | | | | | | |
| Consumer & Business Banking | 27,709 |
| | 27,199 |
| | 26,699 |
| | 26,616 |
| | 26,492 |
| | 2 |
| | 5 |
| |
| Home Lending | 196,401 |
| | 199,799 |
| | 203,339 |
| | 219,533 |
| | 230,599 |
| | (2 | ) | | (15 | ) | |
| Card | 154,021 |
| | 168,924 |
| | 159,571 |
| | 157,576 |
| | 150,527 |
| | (9 | ) | | 2 |
| |
| Auto | 61,468 |
| | 61,522 |
| | 61,410 |
| | 62,073 |
| | 62,786 |
| | — |
| | (2 | ) | |
| Total loans | 439,599 |
| | 457,444 |
| | 451,019 |
| | 465,798 |
| | 470,404 |
| | (4 | ) | | (7 | ) | |
| | | | | | | | | | | | | | | |
| Deposits | 775,068 |
| | 718,354 |
| | 701,111 |
| | 695,096 |
| | 702,587 |
| | 8 |
| | 10 |
| |
| Equity | 52,000 |
| | 52,000 |
| | 52,000 |
| | 52,000 |
| | 52,000 |
| | — |
| | — |
| |
| | | | | | | | | | | | | | | |
| SELECTED BALANCE SHEET DATA (average) | | | | | | | | | | | | | | |
| Total assets | $ | 517,213 |
| | $ | 525,863 |
| | $ | 530,649 |
| | $ | 534,612 |
| | $ | 546,042 |
| | (2 | ) | | (5 | ) | |
| | | | | | | | | | | | | | | |
| Loans: | | | | | | | | | | | | | | |
| Consumer & Business Banking | 27,261 |
| | 26,820 |
| | 26,550 |
| | 26,570 |
| | 26,488 |
| | 2 |
| | 3 |
| |
| Home Lending | 198,042 |
| | 201,599 |
| | 213,372 |
| | 224,685 |
| | 238,949 |
| | (2 | ) | | (17 | ) | |
| Card | 162,660 |
| | 162,112 |
| | 158,168 |
| | 153,746 |
| | 151,134 |
| | — |
| | 8 |
| |
| Auto | 60,893 |
| | 61,100 |
| | 61,371 |
| | 62,236 |
| | 62,763 |
| | — |
| | (3 | ) | |
| Total loans | 448,856 |
| | 451,631 |
| | 459,461 |
| | 467,237 |
| | 479,334 |
| | (1 | ) | | (6 | ) | |
| | | | | | | | | | | | | | | |
| Deposits | 733,648 |
| | 707,953 |
| | 693,943 |
| | 690,892 |
| | 681,013 |
| | 4 |
| | 8 |
| |
| Equity | 52,000 |
| | 52,000 |
| | 52,000 |
| | 52,000 |
| | 52,000 |
| | — |
| | — |
| |
| | | | | | | | | | | | | | | |
| Headcount | 122,081 |
| | 123,115 |
| | 123,532 |
| | 123,580 |
| | 124,305 |
| | (1 | ) | | (2 | ) | |
| | | | | | | | | | | | | | | |
| | | | | | | | | | | | | | | |
In the first quarter of 2020, the Merchant Services business was realigned from CCB to CIB as part of the Firm’s Wholesale Payments business. The prior period amounts were revised to conform with the current presentation. Refer to page 30 for further information.
|
| | | | | | | | | | | | | | | | | | | | | | | | | | |
| JPMORGAN CHASE & CO. | | | | | |
| CONSUMER & COMMUNITY BANKING | | | | |
| FINANCIAL HIGHLIGHTS, CONTINUED | | | | |
| (in millions, except ratio data) | QUARTERLY TRENDS | |
| | | | | | | | | | | | 1Q20 Change | |
| | 1Q20 | | 4Q19 | | 3Q19 | | 2Q19 | | 1Q19 | | 4Q19 | | 1Q19 | |
| CREDIT DATA AND QUALITY STATISTICS | | | | | | | | | | | | | | |
| Nonaccrual loans (a)(b) | $ | 4,008 |
| | $ | 3,018 |
| | $ | 3,099 |
| | $ | 3,142 |
| | $ | 3,265 |
| | 33 | % | | 23 | % | |
| Net charge-offs/(recoveries) | | | | | | | | | | | | | | |
| Consumer & Business Banking | 74 |
| | 92 |
| | 79 |
| | 66 |
| | 59 |
| | (20 | ) | | 25 |
| |
| Home Lending | (122 | ) | | (23 | ) | | (42 | ) | | (28 | ) | | (5 | ) | | (430 | ) | | NM |
| |
| Card | 1,313 |
| | 1,231 |
| | 1,175 |
| | 1,240 |
| | 1,202 |
| | 7 |
| | 9 |
| |
| Auto | 48 |
| | 57 |
| | 49 |
| | 42 |
| | 58 |
| | (16 | ) | | (17 | ) | |
| Total net charge-offs/(recoveries) | $ | 1,313 |
| | $ | 1,357 |
| | $ | 1,261 |
|
| $ | 1,320 |
| | $ | 1,314 |
| | (3 | ) | | — |
| |
| Net charge-off/(recovery) rate | | | | | | | | | | | | | | |
| Consumer & Business Banking | 1.09 |
| % | 1.36 |
| % | 1.18 |
| % | 1.00 |
| % | 0.90 |
| % | | | | |
| Home Lending | (0.25 | ) | | (0.05 | ) | | (0.08 | ) | | (0.05 | ) | | (0.01 | ) | | | | | |
| Card | 3.25 |
| | 3.01 |
| | 2.95 |
| | 3.24 |
| | 3.23 |
| | | | | |
| Auto | 0.32 |
| | 0.37 |
| | 0.32 |
| | 0.27 |
| | 0.37 |
| | | | | |
| Total net charge-off/(recovery) rate | 1.18 |
| | 1.20 |
| | 1.10 |
|
| 1.14 |
| | 1.11 |
| | | | | |
| | | | | | | | | | | | | | | |
| 30+ day delinquency rate | | | | | | | | | | | | | | |
| Home Lending (c)(d) | 1.48 |
|
| 1.58 |
|
| 1.63 |
|
| 1.55 |
|
| 1.62 |
|
| | | | |
| Card | 1.96 |
| | 1.87 |
| | 1.84 |
| | 1.71 |
| | 1.85 |
| | | | | |
| Auto | 0.89 |
| | 0.94 |
| | 0.88 |
| | 0.82 |
| | 0.63 |
| | | | | |
| | | | | | | | | | | | | | | |
| 90+ day delinquency rate - Card | 1.02 |
| | 0.95 |
| | 0.90 |
| | 0.87 |
| | 0.97 |
| | | | | |
| | | | | | | | | | | | | | | |
| Allowance for loan losses | | | | | | | | | | | | | | |
| Consumer & Business Banking | $ | 882 |
| | $ | 746 |
| | $ | 746 |
| | $ | 796 |
| | $ | 796 |
| | 18 |
| | 11 |
| |
| Home Lending | 2,137 |
| | 1,890 |
| | 2,159 |
| | 2,302 |
| | 2,741 |
| | 13 |
| | (22 | ) | |
| Card | 14,950 |
| | 5,683 |
| | 5,583 |
| | 5,383 |
| | 5,183 |
| | 163 |
| | 188 |
| |
| Auto | 732 |
| | 465 |
| | 465 |
| | 465 |
| | 465 |
| | 57 |
| | 57 |
| |
| Total allowance for loan losses | $ | 18,701 |
| | $ | 8,784 |
| | $ | 8,953 |
| | $ | 8,946 |
| | $ | 9,185 |
| | 113 |
| | 104 |
| |
| | | | | | | | | | | | | | | |
Effective January 1, 2020, the Firm adopted the CECL accounting guidance. The adoption resulted in a change in the accounting for PCI loans, which are considered purchased credit deteriorated (“PCD”) loans under CECL. Refer to page 29 for further information.
| |
| (a) | At March 31, 2020, nonaccrual loans included $970 million of PCD loans. Prior to the adoption of CECL, nonaccrual loans excluded PCI loans as the Firm recognized interest income on each pool of PCI loans as each of the pools was performing. |
| |
| (b) | At March 31, 2020, December 31, 2019, September 30, 2019, June 30, 2019 and March 31, 2019, nonaccrual loans excluded mortgage loans 90 or more days past due and insured by U.S. government agencies of $616 million, $961 million, $1.6 billion, $1.8 billion and $2.2 billion, respectively. These amounts have been excluded based upon the government guarantee. |
| |
| (c) | At March 31, 2020, the 30+ day delinquency rates included PCD loans. The rates prior to January 1, 2020 were revised to include the impact of PCI loans. |
| |
| (d) | At March 31, 2020, December 31, 2019, September 30, 2019, June 30, 2019 and March 31, 2019, excluded mortgage loans insured by U.S. government agencies of $1.0 billion, $1.7 billion, $2.7 billion, $2.9 billion and $3.2 billion, respectively, that are 30 or more days past due. These amounts have been excluded based upon the government guarantee. |
|
| | | | | | | | | | | | | | | | | | | | | | | | | | |
| JPMORGAN CHASE & CO. | | | | | |
| CONSUMER & COMMUNITY BANKING | | | | |
| FINANCIAL HIGHLIGHTS, CONTINUED | | | | |
| (in millions, except ratio data and where otherwise noted) | | | | |
| | | | | | | | | | | | | | | |
| | QUARTERLY TRENDS | |
| | | | | | | | | | | | 1Q20 Change | |
| | 1Q20 | | 4Q19 | | 3Q19 | | 2Q19 | | 1Q19 | | 4Q19 | | 1Q19 | |
| BUSINESS METRICS | | | | | | | | | | | | | | |
| Number of: | | | | | | | | | | | | | | |
| Branches | 4,967 |
| | 4,976 |
| | 4,949 |
| | 4,970 |
| | 5,028 |
| | — | % | | (1 | )% | |
| Active digital customers (in thousands) (a) | 53,799 |
| | 52,421 |
| | 51,843 |
| | 51,032 |
| | 50,651 |
| | 3 |
| | 6 |
| |
| Active mobile customers (in thousands) (b) | 38,236 |
| | 37,297 |
| | 36,510 |
| | 35,392 |
| | 34,371 |
| | 3 |
| | 11 |
| |
| | | | | | | | | | | | | | | |
| Debit and credit card sales volume (in billions) | $ | 266.0 |
| | $ | 295.6 |
| | $ | 282.2 |
| | $ | 281.5 |
| | $ | 255.1 |
| | (10 | ) | | 4 |
| |
| | | | | | | | | | | | | | | |
| Consumer & Business Banking | | | | | | | | | | | | | | |
| Average deposits | $ | 718,909 |
| | $ | 691,696 |
| | $ | 678,281 |
| | $ | 676,663 |
| | $ | 668,526 |
| | 4 |
| | 8 |
| |
| Deposit margin | 2.06 |
| % | 2.28 |
| % | 2.47 |
| % | 2.60 |
| % | 2.62 |
| % | | | | |
| Business banking origination volume | $ | 1,491 |
| | $ | 1,827 |
| | $ | 1,550 |
| | $ | 1,741 |
| | $ | 1,480 |
| | (18 | ) | | 1 |
| |
| Client investment assets | 322,999 |
| | 358,036 |
| | 337,915 |
| | 328,141 |
| | 312,310 |
| | (10 | ) | | 3 |
| |
| | | | | | | | | | | | | | | |
| Home Lending (in billions) | | | | | | | | | | | | | | |
| Mortgage origination volume by channel | | | | | | | | | | | | | | |
| Retail | $ | 14.1 |
| | $ | 16.4 |
| | $ | 14.2 |
| | $ | 12.5 |
| | $ | 7.9 |
| | (14 | ) | | 78 |
| |
| Correspondent | 14.0 |
| | 16.9 |
| | 18.2 |
| | 12.0 |
| | 7.1 |
| | (17 | ) | | 97 |
| |
| Total mortgage origination volume (c) | $ | 28.1 |
| | $ | 33.3 |
| | $ | 32.4 |
| | $ | 24.5 |
| | $ | 15.0 |
| | (16 | ) | | 87 |
| |
| Total loans serviced (period-end) | $ | 737.8 |
| | $ | 761.4 |
| | $ | 774.8 |
| | $ | 780.1 |
| | $ | 791.5 |
| | (3 | ) | | (7 | ) | |
| Third-party mortgage loans serviced (period-end) | 505.0 |
| | 520.8 |
| | 535.8 |
| | 526.6 |
| | 529.6 |
| | (3 | ) | | (5 | ) | |
| MSR carrying value (period-end) | 3.3 |
| | 4.7 |
| | 4.4 |
| | 5.1 |
| | 6.0 |
| | (30 | ) | | (45 | ) | |
| Ratio of MSR carrying value (period-end) to third-party | | | | | | | | | | | | | | |
| mortgage loans serviced (period-end) | 0.65 |
| % | 0.90 |
| % | 0.82 |
| % | 0.97 |
| % | 1.13 |
| % | | | | |
| MSR revenue multiple (d) | 2.10 | x | | 2.73 | x | | 2.41 | x | | 2.69 | x | | 3.32 | x | | | | | |
| | | | | | | | | | | | | | | |
| Credit Card | | | | | | | | | | | | | | |
| Credit card sales volume, excluding Commercial Card (in billions) | $ | 179.1 |
| | $ | 204.2 |
| | $ | 193.6 |
| | $ | 192.5 |
| | $ | 172.5 |
| | (12 | ) | | 4 |
| |
| Net revenue rate | 10.68 |
| % | 10.76 |
| % | 10.53 |
| % | 10.53 |
| % | 10.68 |
| % | | | | |
| | | | | | | | | | | | | | | |
| Auto | | | | | | | | | | | | | | |
| Loan and lease origination volume (in billions) | $ | 8.3 |
| | $ | 8.5 |
| | $ | 9.1 |
| | $ | 8.5 |
| | $ | 7.9 |
| | (2 | ) | | 5 |
| |
| Average auto operating lease assets | 23,081 |
| | 22,427 |
| | 21,765 |
| | 21,314 |
| | 20,831 |
| | 3 |
| | 11 |
| |
| | | | | | | | | | | | | | | |
| | | | | | | | | | | | | | | |
| |
| (a) | Users of all web and/or mobile platforms who have logged in within the past 90 days. |
| |
| (b) | Users of all mobile platforms who have logged in within the past 90 days. |
| |
| (c) | Firmwide mortgage origination volume was $31.9 billion, $37.4 billion, $35.8 billion, $26.3 billion and $16.4 billion for the three months ended March 31, 2020, December 31, 2019, September 30, 2019, June 30, 2019 and March 31, 2019, respectively. |
| |
| (d) | Represents the ratio of MSR carrying value (period-end) to third-party mortgage loans serviced (period-end) divided by the ratio of annualized loan servicing-related revenue to third-party mortgage loans serviced (average). |
|
| | | | | | | | | | | | | | | | | | | | | | | | | | |
| JPMORGAN CHASE & CO. | | | | | |
| CORPORATE & INVESTMENT BANK | | | | |
| FINANCIAL HIGHLIGHTS | | | | |
| (in millions, except ratio data) | | | | | | | | | | | | | | |
| | QUARTERLY TRENDS | |
| | | | | | | | | | | | 1Q20 Change | |
| | 1Q20 | | 4Q19 | | 3Q19 | | 2Q19 | | 1Q19 | | 4Q19 | | 1Q19 | |
| INCOME STATEMENT | | | | | | | | | | | | | | |
| REVENUE | | | | | | | | | | | | | | |
| Investment banking fees | $ | 1,907 |
| | $ | 1,904 |
| | $ | 1,981 |
| | $ | 1,846 |
| | $ | 1,844 |
| | — | % | | 3 | % | |
| Principal transactions | 3,188 |
| | 2,932 |
| | 3,418 |
| | 3,885 |
| | 4,164 |
| | 9 |
| | (23 | ) | |
| Lending- and deposit-related fees (a) | 450 |
| | 462 |
| | 398 |
| | 412 |
| | 396 |
| | (3 | ) | | 14 |
| |
| Asset management, administration and commissions (a) | 1,261 |
| | 1,059 |
| | 1,160 |
| | 1,112 |
| | 1,067 |
| | 19 |
| | 18 |
| |
| All other income | 35 |
| | 622 |
| | 397 |
| | 405 |
| | 365 |
| | (94 | ) | | (90 | ) | |
| Noninterest revenue | 6,841 |
| | 6,979 |
| | 7,354 |
| | 7,660 |
| | 7,836 |
| | (2 | ) | | (13 | ) | |
| Net interest income | 3,107 |
| | 2,668 |
| | 2,168 |
| | 2,171 |
| | 2,198 |
| | 16 |
| | 41 |
| |
| TOTAL NET REVENUE (b) | 9,948 |
| | 9,647 |
| | 9,522 |
| | 9,831 |
| | 10,034 |
| | 3 |
| | (1 | ) | |
| | | | | | | | | | | | | | | |
| Provision for credit losses | 1,401 |
| | 98 |
| | 92 |
| | — |
| | 87 |
| | NM |
| | NM |
| |
| | | | | | | | | | | | | | | |
| NONINTEREST EXPENSE | | | | | | | | | | | | | | |
| Compensation expense | 3,006 |
| | 2,377 |
| | 2,873 |
| | 2,839 |
| | 3,091 |
| | 26 |
| | (3 | ) | |
| Noncompensation expense | 2,890 |
| | 3,015 |
| | 2,631 |
| | 2,822 |
| | 2,538 |
| | (4 | ) | | 14 |
| |
| TOTAL NONINTEREST EXPENSE | 5,896 |
| | 5,392 |
| | 5,504 |
| | 5,661 |
| | 5,629 |
| | 9 |
| | 5 |
| |
| | | | | | | | | | | | | | | |
| Income before income tax expense | 2,651 |
| | 4,157 |
| | 3,926 |
| | 4,170 |
| | 4,318 |
| | (36 | ) | | (39 | ) | |
| Income tax expense | 663 |
| | 1,219 |
| | 1,095 |
| | 1,224 |
| | 1,058 |
| | (46 | ) | | (37 | ) | |
| NET INCOME | $ | 1,988 |
| | $ | 2,938 |
| | $ | 2,831 |
| | $ | 2,946 |
| | $ | 3,260 |
| | (32 | ) | | (39 | ) | |
| | | | | | | | | | | | | | | |
| FINANCIAL RATIOS | | | | | | | | | | | | | | |
| ROE | 9 | % | | 14 | % | | 13 | % | | 14 | % | | 16 | % | | | | | |
| Overhead ratio | 59 |
| | 56 |
| | 58 |
| | 58 |
| | 56 |
| | | | | |
| Compensation expense as percentage of total net revenue | 30 |
| | 25 |
| | 30 |
| | 29 |
| | 31 |
| | | | | |
| | | | | | | | | | | | | | | |
| REVENUE BY BUSINESS | | | | | | | | | | | | | | |
| Investment Banking | $ | 886 |
| | $ | 1,823 |
| | $ | 1,871 |
| | $ | 1,776 |
| | $ | 1,745 |
| | (51 | ) | | (49 | ) | |
| Wholesale Payments | 1,359 |
| | 1,433 |
| | 1,361 |
| | 1,402 |
| | 1,415 |
| | (5 | ) | | (4 | ) | |
| Lending | 350 |
| | 250 |
| | 253 |
| | 260 |
| | 258 |
| | 40 |
| | 36 |
| |
| Total Banking | 2,595 |
| | 3,506 |
| | 3,485 |
| | 3,438 |
| | 3,418 |
| | (26 | ) | | (24 | ) | |
| Fixed Income Markets | 4,993 |
| | 3,446 |
| | 3,557 |
| | 3,690 |
| | 3,725 |
| | 45 |
| | 34 |
| |
| Equity Markets | 2,237 |
| | 1,508 |
| | 1,517 |
| | 1,728 |
| | 1,741 |
| | 48 |
| | 28 |
| |
| Securities Services | 1,074 |
| | 1,061 |
| | 1,034 |
| | 1,045 |
| | 1,014 |
| | 1 |
| | 6 |
| |
| Credit Adjustments & Other (c) | (951 | ) | | 126 |
| | (71 | ) | | (70 | ) | | 136 |
| | NM |
| | NM |
| |
| Total Markets & Securities Services | 7,353 |
| | 6,141 |
| | 6,037 |
| | 6,393 |
| | 6,616 |
| | 20 |
| | 11 |
| |
| TOTAL NET REVENUE | $ | 9,948 |
| | $ | 9,647 |
| | $ | 9,522 |
| | $ | 9,831 |
| | $ | 10,034 |
| | 3 |
| | (1 | ) | |
| | | | | | | | | | | | | | | |
| | | | | | | | | | | | | | | |
In the first quarter of 2020, the Merchant Services business was realigned from CCB to CIB as part of the Firm’s Wholesale Payments business. The prior period amounts were revised to conform with the current presentation. Refer to page 30 for further information.
| |
| (a) | In the first quarter of 2020, the Firm reclassified certain fees from asset management, administration and commissions to lending- and deposit-related fees. Prior period amounts were revised to conform with the current presentation. |
| |
| (b) | Includes tax-equivalent adjustments, predominantly due to income tax credits related to alternative energy investments; income tax credits and amortization of the cost of investments in affordable housing projects; as well as tax-exempt income from municipal bonds of $667 million, $646 million, $527 million, $547 million and $539 million for the three months ended March 31, 2020, December 31, 2019, September 30, 2019, June 30, 2019, and March 31, 2019, respectively. |
| |
| (c) | Consists primarily of credit valuation adjustments (“CVA”) managed centrally within CIB and funding valuation adjustments (“FVA”) on derivatives and certain components of fair value option elected liabilities. Results are presented net of associated hedging activities and net of CVA and FVA amounts allocated to Fixed Income Markets and Equity Markets. |
|
| | | | | | | | | | | | | | | | | | | | | | | | | | |
| JPMORGAN CHASE & CO. | | | | | |
| CORPORATE & INVESTMENT BANK | | | | |
| FINANCIAL HIGHLIGHTS, CONTINUED | | | | |
| (in millions, except ratio and headcount data) | | | | | | | | | | | | | | |
| | QUARTERLY TRENDS | |
| | | | | | | | | | | | 1Q20 Change | |
| | 1Q20 | | 4Q19 | | 3Q19 | | 2Q19 | | 1Q19 | | 4Q19 | | 1Q19 | |
| SELECTED BALANCE SHEET DATA (period-end) | | | | | | | | | | | | | | |
| Assets | $ | 1,217,459 |
| | $ | 914,705 |
| | $ | 1,030,396 |
| | $ | 976,430 |
| | $ | 1,019,470 |
| | 33 | % | | 19 | % | |
| Loans: | | | | | | | | | | | | | | |
| Loans retained (a) | 165,376 |
| | 121,733 |
| | 118,290 |
| | 123,074 |
| | 127,086 |
| | 36 |
| | 30 |
| |
| Loans held-for-sale and loans at fair value | 9,326 |
| | 10,112 |
| | 8,324 |
| | 6,838 |
| | 7,783 |
| | (8 | ) | | 20 |
| |
| Total loans | 174,702 |
| | 131,845 |
| | 126,614 |
| | 129,912 |
| | 134,869 |
| | 33 |
| | 30 |
| |
| | | | | | | | | | | | | | | |
| Equity | 80,000 |
| | 80,000 |
| | 80,000 |
| | 80,000 |
| | 80,000 |
| | — |
| | — |
| |
| | | | | | | | | | | | | | | |
| SELECTED BALANCE SHEET DATA (average) | | | | | | | | | | | | | | |
| Assets | $ | 1,082,820 |
| | $ | 994,152 |
| | $ | 1,011,246 |
| | $ | 1,000,517 |
| | $ | 967,632 |
| | 9 |
| | 12 |
| |
| Trading assets - debt and equity instruments | 427,316 |
| | 398,604 |
| | 415,450 |
| | 421,775 |
| | 381,312 |
| | 7 |
| | 12 |
| |
| Trading assets - derivative receivables | 55,133 |
| | 45,153 |
| | 48,266 |
| | 48,815 |
| | 50,609 |
| | 22 |
| | 9 |
| |
| Loans: | | | | | | | | | | | | | | |
| Loans retained (a) | 128,838 |
| | 119,412 |
| | 119,007 |
| | 124,194 |
| | 126,990 |
| | 8 |
| | 1 |
| |
| Loans held-for-sale and loans at fair value | 9,818 |
| | 9,708 |
| | 8,344 |
| | 7,763 |
| | 8,615 |
| | 1 |
| | 14 |
| |
| Total loans | 138,656 |
| | 129,120 |
| | 127,351 |
| | 131,957 |
| | 135,605 |
| | 7 |
| | 2 |
| |
| | | | | | | | | | | | | | | |
| Equity | 80,000 |
| | 80,000 |
| | 80,000 |
| | 80,000 |
| | 80,000 |
| | — |
| | — |
| |
| | | | | | | | | | | | | | | |
| Headcount | 60,245 |
| | 60,013 |
| | 60,028 |
| | 59,111 |
| | 58,811 |
| | — |
| | 2 |
| |
| | | | | | | | | | | | | | | |
| CREDIT DATA AND QUALITY STATISTICS | | | | | | | | | | | | | | |
| Net charge-offs/(recoveries) | $ | 55 |
| | $ | 43 |
| | $ | 38 |
| | $ | 72 |
| | $ | 30 |
| | 28 |
| | 83 |
| |
| Nonperforming assets: | | | | | | | | | | | | | | |
| Nonaccrual loans: | | | | | | | | | | | | | | |
| Nonaccrual loans retained (b) | 689 |
| | 308 |
| | 712 |
| | 569 |
| | 812 |
| | 124 |
| | (15 | ) | |
| Nonaccrual loans held-for-sale and loans at fair value | 138 |
| | 95 |
| | 262 |
| | 370 |
| | 313 |
| | 45 |
| | (56 | ) | |
| Total nonaccrual loans | 827 |
| | 403 |
| | 974 |
| | 939 |
| | 1,125 |
| | 105 |
| | (26 | ) | |
| | | | | | | | | | | | | | | |
| Derivative receivables | 85 |
| | 30 |
| | 26 |
| | 39 |
| | 44 |
| | 184 |
| | 94 |
| |
| Assets acquired in loan satisfactions | 43 |
| | 70 |
| | 75 |
| | 58 |
| | 58 |
| | (39 | ) | | (26 | ) | |
| Total nonperforming assets | 955 |
| | 503 |
| | 1,075 |
| | 1,036 |
| | 1,227 |
| | 90 |
| | (22 | ) | |
| Allowance for credit losses: | | | | | | | | | | | | | | |
| Allowance for loan losses | 1,422 |
| | 1,202 |
| | 1,171 |
| | 1,131 |
| | 1,252 |
| | 18 |
| | 14 |
| |
| Allowance for lending-related commitments | 1,468 |
| | 848 |
| | 824 |
| | 807 |
| | 758 |
| | 73 |
| | 94 |
| |
| Total allowance for credit losses | 2,890 |
| | 2,050 |
| | 1,995 |
| | 1,938 |
| | 2,010 |
| | 41 |
| | 44 |
| |
| | | | | | | | | | | | | | | |
| Net charge-off/(recovery) rate (a)(c) | 0.17 | % | | 0.14 | % | | 0.13 | % | | 0.23 | % | | 0.10 | % | | | | | |
| Allowance for loan losses to period-end loans retained (a) | 0.86 |
| | 0.99 |
| | 0.99 |
| | 0.92 |
| | 0.99 |
| | | | | |
| Allowance for loan losses to period-end loans retained, | | | | | | | | | | | | | | |
| excluding trade finance and conduits (d) | 1.11 |
| | 1.31 |
| | 1.33 |
| | 1.27 |
| | 1.34 |
| | | | | |
| Allowance for loan losses to nonaccrual loans retained (a)(b) | 206 |
| | 390 |
| | 164 |
| | 199 |
| | 154 |
| | | | | |
| Nonaccrual loans to total period-end loans | 0.47 |
| | 0.31 |
| | 0.77 |
| | 0.72 |
| | 0.83 |
| | | | | |
| | | | | | | | | | | | | | | |
| | | | | | | | | | | | | | | |
In the first quarter of 2020, the Merchant Services business was realigned from CCB to CIB as part of the Firm’s Wholesale Payments business. The prior period amounts were revised to conform with the current presentation. Refer to page 30 for further information.
| |
| (a) | Loans retained includes credit portfolio loans, loans held by consolidated Firm-administered multi-seller conduits, trade finance loans, other held-for-investment loans and overdrafts. |
| |
| (b) | Allowance for loan losses of $317 million, $110 million, $207 million, $147 million and $252 million were held against nonaccrual loans at March 31, 2020, December 31, 2019, September 30, 2019, June 30, 2019, and March 31, 2019, respectively. |
| |
| (c) | Loans held-for-sale and loans at fair value were excluded when calculating the net charge-off/(recovery) rate. |
| |
| (d) | Management uses allowance for loan losses to period-end loans retained, excluding trade finance and conduits, a non-GAAP financial measure, to provide a more meaningful assessment of CIB’s allowance coverage ratio. |
|
| | | | | | | | | | | | | | | | | | | | | | | | | | |
| JPMORGAN CHASE & CO. | | | | | |
| CORPORATE & INVESTMENT BANK | | | | |
| FINANCIAL HIGHLIGHTS, CONTINUED | | | | |
| (in millions, except where otherwise noted) | | | | | | | | | | | | | | |
| | QUARTERLY TRENDS | |
| | | | | | | | | | | | 1Q20 Change | |
| | 1Q20 | | 4Q19 | | 3Q19 | | 2Q19 | | 1Q19 | | 4Q19 | | 1Q19 | |
| BUSINESS METRICS | | | | | | | | | | | | | | |
| Advisory | $ | 503 |
| | $ | 702 |
| | $ | 506 |
| | $ | 525 |
| | $ | 644 |
| | (28 | )% | | (22 | )% | |
| Equity underwriting | 331 |
| | 382 |
| | 514 |
| | 505 |
| | 265 |
| | (13 | ) | | 25 |
| |
| Debt underwriting | 1,073 |
| | 820 |
| | 961 |
| | 816 |
| | 935 |
| | 31 |
| | 15 |
| |
| Total investment banking fees | $ | 1,907 |
| | $ | 1,904 |
| | $ | 1,981 |
| | $ | 1,846 |
| | $ | 1,844 |
| | — |
| | 3 |
| |
| | | | | | | | | | | | | | | |
| Client deposits and other third-party liabilities (average) (a) | 514,464 |
| | 485,037 |
| | 471,328 |
| | 458,237 |
| | 444,055 |
| | 6 |
| | 16 |
| |
| | | | | | | | | | | | | | | |
| Merchant processing volume (in billions) (b) | 374.8 |
| | 402.9 |
| | 380.5 |
| | 371.6 |
| | 356.5 |
| | (7 | ) | | 5 |
| |
| | | | | | | | | | | | | | | |
| Assets under custody (“AUC”) (period-end) (in billions) | $ | 24,409 |
| | $ | 26,831 |
| | $ | 25,695 |
| | $ | 25,450 |
| | $ | 24,716 |
| | (9 | ) | | (1 | ) | |
| | | | | | | | | | | | | | | |
| 95% Confidence Level - Total CIB VaR (average) (c) | | | | | | | | | | | | | | |
| CIB trading VaR by risk type: (d) | | | | | | | | | | | | | | |
| Fixed income | $ | 60 |
| | $ | 39 |
| | $ | 37 |
| | $ | 39 |
| | $ | 44 |
| | 54 |
| | 36 |
| |
| Foreign exchange | 7 |
| | 5 |
| | 6 |
| | 7 |
| | 9 |
| | 40 |
| | (22 | ) | |
| Equities | 20 |
| | 18 |
| | 22 |
| | 25 |
| | 16 |
| | 11 |
| | 25 |
| |
| Commodities and other | 10 |
| | 7 |
| | 8 |
| | 9 |
| | 10 |
| | 43 |
| | — |
| |
| Diversification benefit to CIB trading VaR (e) | (40 | ) | | (32 | ) | | (34 | ) | | (36 | ) | | (32 | ) | | (25 | ) | | (25 | ) | |
| CIB trading VaR (d) | 57 |
| | 37 |
| | 39 |
| | 44 |
| | 47 |
| | 54 |
| | 21 |
| |
| Credit portfolio VaR (f) | 9 |
| | 5 |
| | 5 |
| | 5 |
| | 5 |
| | 80 |
| | 80 |
| |
| Diversification benefit to CIB VaR (e) | (8 | ) | | (5 | ) | | (6 | ) | | (5 | ) | | (4 | ) | | (60 | ) | | (100 | ) | |
| CIB VaR | $ | 58 |
| | $ | 37 |
| | $ | 38 |
| | $ | 44 |
| | $ | 48 |
| | 57 |
| | 21 |
| |
| | | | | | | | | | | | | | | |
| | | | | | | | | | | | | | | |
| |
| (a) | Client deposits and other third-party liabilities pertain to the Wholesale Payments and Securities Services businesses. |
| |
| (b) | Represents total merchant processing volume across CIB, CCB and CB. Refer to page 30 for additional information. |
| |
| (c) | Effective January 1, 2020, the Firm refined the scope of VaR to exclude positions related to the risk management of interest rate exposure from changes in the Firm’s own credit spread on fair value option elected liabilities, and included these positions in other-sensitivity based measures. This change was made to more appropriately reflect the risk from changes in the Firm’s own credit spread on fair value option elected liabilities in a single market risk measure. In the absence of this refinement, the average VaR for each of the following reported components would have been higher by the following amounts: CIB fixed income of $4 million, CIB Trading VaR $5 million and CIB VaR $6 million for the three months ended March 31, 2019. |
| |
| (d) | CIB trading VaR includes substantially all market-making and client-driven activities, as well as certain risk management activities in CIB, including credit spread sensitivity to CVA. Refer to VaR measurement on pages 121–123 of the Firm’s 2019 Form 10-K for further information. |
| |
| (e) | Average portfolio VaR was less than the sum of the VaR of the components described above, which is due to portfolio diversification. The diversification effect reflects the fact that the risks were not perfectly correlated. |
| |
| (f) | Credit portfolio VaR includes the derivative CVA, hedges of the CVA and hedges of the retained loan portfolio, which are reported in principal transactions revenue. This VaR does not include the retained loan portfolio, which is not reported at fair value. |
|
| | | | | | | | | | | | | | | | | | | | | | | | | | |
| JPMORGAN CHASE & CO. | | | | | |
| COMMERCIAL BANKING | | | | |
| FINANCIAL HIGHLIGHTS | | | | |
| (in millions, except ratio data) | | | | | | | | | | | | | | |
| | | | | | | | | | | | | | | |
| | | | | | | | | | | | | | | |
| | QUARTERLY TRENDS | |
| | | | | | | | | | | | 1Q20 Change | |
| | 1Q20 | | 4Q19 | | 3Q19 | | 2Q19 | | 1Q19 | | 4Q19 | | 1Q19 | |
| INCOME STATEMENT | | | | | | | | | | | | | | |
| REVENUE | | | | | | | | | | | | | | |
| Lending- and deposit-related fees (a) | $ | 261 |
| | $ | 256 |
| | $ | 228 |
| | $ | 224 |
| | $ | 233 |
| | 2 | % | | 12 | % | |
| All other income (a) | 360 |
| | 437 |
| | 438 |
| | 399 |
| | 500 |
| | (18 | ) | | (28 | ) | |
| Noninterest revenue | 621 |
| | 693 |
| | 666 |
| | 623 |
| | 733 |
| | (10 | ) | | (15 | ) | |
| Net interest income | 1,557 |
| | 1,604 |
| | 1,608 |
| | 1,662 |
| | 1,680 |
| | (3 | ) | | (7 | ) | |
| TOTAL NET REVENUE (b) | 2,178 |
| | 2,297 |
| | 2,274 |
| | 2,285 |
| | 2,413 |
| | (5 | ) | | (10 | ) | |
| | | | | | | | | | | | | | | |
| Provision for credit losses | 1,010 |
| | 110 |
| | 67 |
| | 29 |
| | 90 |
| | NM |
| | NM |
| |
| | | | | | | | | | | | | | | |
| NONINTEREST EXPENSE | | | | | | | | | | | | | | |
| Compensation expense | 472 |
| | 444 |
| | 454 |
| | 438 |
| | 449 |
| | 6 |
| | 5 |
| |
| Noncompensation expense | 513 |
| | 499 |
| | 486 |
| | 493 |
| | 489 |
| | 3 |
| | 5 |
| |
| Amortization of intangibles | 3 |
| | — |
| | — |
| | — |
| | — |
| | NM |
| | NM |
| |
| TOTAL NONINTEREST EXPENSE | 988 |
| | 943 |
| | 940 |
| | 931 |
| | 938 |
| | 5 |
| | 5 |
| |
| | | | | | | | | | | | | | | |
| Income before income tax expense | 180 |
| | 1,244 |
| | 1,267 |
| | 1,325 |
| | 1,385 |
| | (86 | ) | | (87 | ) | |
| Income tax expense | 33 |
| | 300 |
| | 324 |
| | 323 |
| | 325 |
| | (89 | ) | | (90 | ) | |
| NET INCOME | $ | 147 |
| | $ | 944 |
| | $ | 943 |
| | $ | 1,002 |
| | $ | 1,060 |
| | (84 | ) | | (86 | ) | |
| | | | | | | | | | | | | | | |
| Revenue by product | | | | | | | | | | | | | | |
| Lending | $ | 954 |
| | $ | 1,027 |
| | $ | 1,006 |
| | $ | 1,012 |
| | $ | 1,012 |
| | (7 | ) | | (6 | ) | |
| Wholesale payments | 991 |
| | 1,021 |
| | 1,017 |
| | 1,063 |
| | 1,104 |
| | (3 | ) | | (10 | ) | |
| Investment banking (c) | 235 |
| | 211 |
| | 226 |
| | 193 |
| | 289 |
| | 11 |
| | (19 | ) | |
| Other | (2 | ) | | 38 |
| | 25 |
| | 17 |
| | 8 |
| | NM |
| | NM |
| |
Total Commercial Banking net revenue (b)
| $ | 2,178 |
| | $ | 2,297 |
| | $ | 2,274 |
| | $ | 2,285 |
| | $ | 2,413 |
| | (5 | ) | | (10 | ) | |
| | | | | | | | | | | | | | | |
| Investment banking revenue, gross (d) | $ | 686 |
| | $ | 634 |
| | $ | 700 |
| | $ | 592 |
| | $ | 818 |
| | 8 |
| | (16 | ) | |
| | | | | | | | | | | | | | | |
| Revenue by client segment | | | | | | | | | | | | | | |
| Middle Market Banking | $ | 946 |
| | $ | 934 |
| | $ | 925 |
| | $ | 961 |
| | $ | 974 |
| | 1 |
| | (3 | ) | |
| Corporate Client Banking | 681 |
| | 759 |
| | 767 |
| | 744 |
| | 851 |
| | (10 | ) | | (20 | ) | |
| Commercial Real Estate Banking | 541 |
| | 537 |
| | 547 |
| | 538 |
| | 547 |
| | 1 |
| | (1 | ) | |
| Other | 10 |
| | 67 |
| | 35 |
| | 42 |
| | 41 |
| | (85 | ) | | (76 | ) | |
| Total Commercial Banking net revenue (b) | $ | 2,178 |
| | $ | 2,297 |
| | $ | 2,274 |
| | $ | 2,285 |
| | $ | 2,413 |
| | (5 | ) | | (10 | ) | |
| | | | | | | | | | | | | | | |
| FINANCIAL RATIOS | | | | | | | | | | | | | | |
| ROE | 2 |
| % | 16 |
| % | 16 |
| % | 17 |
| % | 19 |
| % | | | | |
| Overhead ratio | 45 |
| | 41 |
| | 41 |
| | 41 |
| | 39 |
| | | | | |
| | | | | | | | | | | | | | | |
| | | | | | | | | | | | | | | |
In the first quarter of 2020, the Merchant Services business was realigned from CCB to CIB and the revenue and expense of the business is reported across CCB, CIB and CB based primarily on client relationship. In conjunction with this realignment, treasury services product revenue has been renamed wholesale payments. Prior period revenue and expense amounts were revised to conform with the current presentation. Refer to page 30 for further information.
| |
| (a) | In the first quarter of 2020, the Firm reclassified certain fees from asset management, administration and commissions (which are included in all other income) to lending- and deposit-related fees. Prior period amounts were revised to conform with the current presentation. |
| |
| (b) | Total net revenue included tax-equivalent adjustments from income tax credits related to equity investments in designated community development entities and in entities established for rehabilitation of historic properties, as well as tax-exempt income related to municipal financing activities of $81 million, $152 million, $114 million, $100 million and $94 million for the three months ended March 31, 2020, December 31, 2019, September 30, 2019, June 30, 2019, and March 31, 2019, respectively. |
| |
| (c) | Includes CB’s share of revenue from investment banking products sold to CB clients through the CIB. |
| |
| (d) | Refer to page 60 of the Firm’s 2019 Form 10-K for discussion of revenue sharing. |
|
| | | | | | | | | | | | | | | | | | | | | | | | | | |
| JPMORGAN CHASE & CO. | | | | | |
| COMMERCIAL BANKING | | | | |
| FINANCIAL HIGHLIGHTS, CONTINUED | | | | |
| (in millions, except headcount and ratio data) | QUARTERLY TRENDS | |
| | | | | | | | | | | | 1Q20 Change | |
| | 1Q20 | | 4Q19 | | 3Q19 | | 2Q19 | | 1Q19 | | 4Q19 | | 1Q19 | |
| SELECTED BALANCE SHEET DATA (period-end) | | | | | | | | | | | | | | |
| Total assets | $ | 247,786 |
| | $ | 220,514 |
| | $ | 222,483 |
| | $ | 220,712 |
| | $ | 216,111 |
| | 12 | % | | 15 | % | |
| Loans: | | | | | | | | | | | | | | |
| Loans retained | 232,254 |
| | 207,287 |
| | 209,448 |
| | 208,323 |
| | 204,927 |
| | 12 |
| | 13 |
| |
| Loans held-for-sale and loans at fair value | 1,112 |
| | 1,009 |
| | 3,187 |
| | 1,284 |
| | 410 |
| | 10 |
| | 171 |
| |
| Total loans | $ | 233,366 |
| | $ | 208,296 |
| | $ | 212,635 |
| | $ | 209,607 |
| | $ | 205,337 |
| | 12 |
| | 14 |
| |
| Equity | 22,000 |
| | 22,000 |
| | 22,000 |
| | 22,000 |
| | 22,000 |
| | — |
| | — |
| |
| | | | | | | | | | | | | | | |
| Period-end loans by client segment | | | | | | | | | | | | | | |
| Middle Market Banking | $ | 60,317 |
| | $ | 54,188 |
| | $ | 54,298 |
| | $ | 56,346 |
| | $ | 56,846 |
| | 11 |
| | 6 |
| |
| Corporate Client Banking | 69,540 |
| | 51,165 |
| | 55,976 |
| | 51,500 |
| | 46,897 |
| | 36 |
| | 48 |
| |
| Commercial Real Estate Banking | 102,799 |
| | 101,951 |
| | 101,326 |
| | 100,751 |
| | 100,622 |
| | 1 |
| | 2 |
| |
| Other | 710 |
| | 992 |
| | 1,035 |
| | 1,010 |
| | 972 |
| | (28 | ) | | (27 | ) | |
| Total Commercial Banking loans | $ | 233,366 |
| | $ | 208,296 |
| | $ | 212,635 |
| | $ | 209,607 |
| | $ | 205,337 |
| | 12 |
| | 14 |
| |
| | | | | | | | | | | | | | | |
| SELECTED BALANCE SHEET DATA (average) | | | | | | | | | | | | | | |
| Total assets | $ | 226,071 |
| | $ | 219,891 |
| | $ | 218,620 |
| | $ | 218,760 |
| | $ | 218,297 |
| | 3 |
| | 4 |
| |
| Loans: | | | | | | | | | | | | | | |
| Loans retained | 209,988 |
| | 208,776 |
| | 207,286 |
| | 206,771 |
| | 204,462 |
| | 1 |
| | 3 |
| |
| Loans held-for-sale and loans at fair value | 1,831 |
| | 1,036 |
| | 963 |
| | 701 |
| | 1,634 |
| | 77 |
| | 12 |
| |
| Total loans | $ | 211,819 |
| | $ | 209,812 |
| | $ | 208,249 |
| | $ | 207,472 |
| | $ | 206,096 |
| | 1 |
| | 3 |
| |
| Client deposits and other third-party liabilities | 188,808 |
| | 182,546 |
| | 172,714 |
| | 168,247 |
| | 167,260 |
| | 3 |
| | 13 |
| |
| Equity | 22,000 |
| | 22,000 |
| | 22,000 |
| | 22,000 |
| | 22,000 |
| | — |
| | — |
| |
| | | | | | | | | | | | | | | |
| Average loans by client segment | | | | | | | | | | | | | | |
| Middle Market Banking | $ | 56,045 |
| | $ | 54,114 |
| | $ | 54,806 |
| | $ | 57,155 |
| | $ | 56,723 |
| | 4 |
| | (1 | ) | |
| Corporate Client Banking | 53,032 |
| | 53,187 |
| | 51,389 |
| | 48,656 |
| | 48,141 |
| | — |
| | 10 |
| |
| Commercial Real Estate Banking | 101,526 |
| | 101,542 |
| | 101,044 |
| | 100,671 |
| | 100,264 |
| | — |
| | 1 |
| |
| Other | 1,216 |
| | 969 |
| | 1,010 |
| | 990 |
| | 968 |
| | 25 |
| | 26 |
| |
| Total Commercial Banking loans | $ | 211,819 |
| | $ | 209,812 |
| | $ | 208,249 |
| | $ | 207,472 |
| | $ | 206,096 |
| | 1 |
| | 3 |
| |
| | | | | | | | | | | | | | | |
| Headcount | 11,779 |
| | 11,629 |
| | 11,501 |
| | 11,248 |
| | 11,033 |
| | 1 |
| | 7 |
| |
| | | | | | | | | | | | | | | |
| CREDIT DATA AND QUALITY STATISTICS | | | | | | | | | | | | | | |
| Net charge-offs/(recoveries) | $ | 100 |
| | $ | 89 |
| | $ | 45 |
| | $ | 15 |
| | $ | 11 |
| | 12 |
| | NM |
| |
| Nonperforming assets | | | | | | | | | | | | | | |
| Nonaccrual loans: | | | | | | | | | | | | | | |
| Nonaccrual loans retained (a) | 793 |
| | 498 |
| | 659 |
| | 614 |
| | 544 |
| | 59 |
| | 46 |
| |
| Nonaccrual loans held-for-sale and loans | | | | | | | | | | | | | | |
| at fair value | — |
| | — |
| | — |
| | — |
| | — |
| | — |
| | — |
| |
| Total nonaccrual loans | 793 |
| | 498 |
| | 659 |
| | 614 |
| | 544 |
| | 59 |
| | 46 |
| |
| | | | | | | | | | | | | | | |
| Assets acquired in loan satisfactions | 24 |
| | 25 |
| | 19 |
| | 20 |
| | — |
| | (4 | ) | | NM |
| |
| Total nonperforming assets | 817 |
| | 523 |
| | 678 |
| | 634 |
| | 544 |
| | 56 |
| | 50 |
| |
| Allowance for credit losses: | | | | | | | | | | | | | | |
| Allowance for loan losses | 2,680 |
| | 2,780 |
| | 2,759 |
| | 2,756 |
| | 2,766 |
| | (4 | ) | | (3 | ) | |
| Allowance for lending-related commitments | 505 |
| | 293 |
| | 293 |
| | 274 |
| | 250 |
| | 72 |
| | 102 |
| |
| Total allowance for credit losses | 3,185 |
| | 3,073 |
| | 3,052 |
| | 3,030 |
| | 3,016 |
| | 4 |
| | 6 |
| |
| | | | | | | | | | | | | | | |
| Net charge-off/(recovery) rate (b) | 0.19 |
| % | 0.17 |
| % | 0.09 |
| % | 0.03 |
| % | 0.02 |
| % | | | | |
| Allowance for loan losses to period-end loans retained | 1.15 |
| | 1.34 |
| | 1.32 |
| | 1.32 |
| | 1.35 |
| | | | | |
| Allowance for loan losses to nonaccrual loans retained (a) | 338 |
| | 558 |
| | 419 |
| | 449 |
| | 508 |
| | | | | |
| Nonaccrual loans to period-end total loans | 0.34 |
| | 0.24 |
| | 0.31 |
| | 0.29 |
| | 0.26 |
| | | | | |
| | | | | | | | | | | | | | | |
| |
| (a) | Allowance for loan losses of $175 million, $114 million, $119 million, $125 million and $132 million was held against nonaccrual loans retained at March 31, 2020, December 31, 2019, September 30, 2019, June 30, 2019, and March 31, 2019, respectively. |
| |
| (b) | Loans held-for-sale and loans at fair value were excluded when calculating the net charge-off/(recovery) rate. |
|
| | | | | | | | | | | | | | | | | | | | | | | | | | |
| JPMORGAN CHASE & CO. | | | | | |
| ASSET & WEALTH MANAGEMENT | | | | |
| FINANCIAL HIGHLIGHTS | | | | |
| (in millions, except ratio and headcount data) | | | | | | | | | | | | | | |
| | | | | | | | | | | | | | | |
| | | | | | | | | | | | | | | |
| | QUARTERLY TRENDS | |
| | | | | | | | | | | | 1Q20 Change | |
| | 1Q20 | | 4Q19 | | 3Q19 | | 2Q19 | | 1Q19 | | 4Q19 | | 1Q19 | |
| INCOME STATEMENT | | | | | | | | | | | | | | |
| REVENUE | | | | | | | | | | | | | | |
| Asset management, administration and commissions | $ | 2,706 |
| | $ | 2,654 |
| | $ | 2,574 |
| | $ | 2,568 |
| | $ | 2,416 |
| | 2 | % | | 12 | % | |
| All other income | 3 |
| | 173 |
| | 139 |
| | 115 |
| | 177 |
| | (98 | ) | | (98 | ) | |
| Noninterest revenue | 2,709 |
| | 2,827 |
| | 2,713 |
| | 2,683 |
| | 2,593 |
| | (4 | ) | | 4 |
| |
| Net interest income | 897 |
| | 873 |
| | 855 |
| | 876 |
| | 896 |
| | 3 |
| | — |
| |
| TOTAL NET REVENUE | 3,606 |
| | 3,700 |
| | 3,568 |
| | 3,559 |
| | 3,489 |
| | (3 | ) | | 3 |
| |
| | | | | | | | | | | | | | | |
| Provision for credit losses | 94 |
| | 13 |
| | 44 |
| | 2 |
| | 2 |
| | NM |
| | NM |
| |
| | | | | | | | | | | | | | | |
| NONINTEREST EXPENSE | | | | | | | | | | | | | | |
| Compensation expense | 1,411 |
| | 1,446 |
| | 1,391 |
| | 1,406 |
| | 1,462 |
| | (2 | ) | | (3 | ) | |
| Noncompensation expense | 1,248 |
| | 1,204 |
| | 1,231 |
| | 1,190 |
| | 1,185 |
| | 4 |
| | 5 |
| |
| TOTAL NONINTEREST EXPENSE | 2,659 |
| | 2,650 |
| | 2,622 |
| | 2,596 |
| | 2,647 |
| | — |
| | — |
| |
| | | | | | | | | | | | | | | |
| Income before income tax expense | 853 |
| | 1,037 |
| | 902 |
| | 961 |
| | 840 |
| | (18 | ) | | 2 |
| |
| Income tax expense | 189 |
| | 252 |
| | 234 |
| | 242 |
| | 179 |
| | (25 | ) | | 6 |
| |
| NET INCOME | $ | 664 |
| | $ | 785 |
| | $ | 668 |
| | $ | 719 |
| | $ | 661 |
| | (15 | ) | | — |
| |
| | | | | | | | | | | | | | | |
| REVENUE BY LINE OF BUSINESS | | | | | | | | | | | | | | |
| Asset Management | $ | 1,740 |
| | $ | 1,892 |
| | $ | 1,816 |
| | $ | 1,785 |
| | $ | 1,761 |
| | (8 | ) | | (1 | ) | |
| Wealth Management | 1,866 |
| | 1,808 |
| | 1,752 |
| | 1,774 |
| | 1,728 |
| | 3 |
| | 8 |
| |
| TOTAL NET REVENUE | $ | 3,606 |
| | $ | 3,700 |
| | $ | 3,568 |
| | $ | 3,559 |
| | $ | 3,489 |
| | (3 | ) | | 3 |
| |
| | | | | | | | | | | | | | | |
| FINANCIAL RATIOS | | | | | | | | | | | | | | |
| ROE | 25 |
| % | 29 |
| % | 24 |
| % | 27 |
| % | 25 |
| % | | | | |
| Overhead ratio | 74 |
| | 72 |
| | 73 |
| | 73 |
| | 76 |
| | | | | |
| Pretax margin ratio: | | | | | | | | | | | | | | |
| Asset Management | 24 |
| | 30 |
| | 25 |
| | 25 |
| | 23 |
| | | | | |
| Wealth Management | 24 |
| | 26 |
| | 25 |
| | 29 |
| | 25 |
| | | | | |
| Asset & Wealth Management | 24 |
| | 28 |
| | 25 |
| | 27 |
| | 24 |
| | | | | |
| | | | | | | | | | | | | | | |
| Headcount | 23,830 |
| | 24,191 |
| | 24,228 |
| | 23,683 |
| | 24,347 |
| | (1 | ) | | (2 | ) | |
| | | | | | | | | | | | | | | |
| Number of Wealth Management client advisors | 2,878 |
| | 2,890 |
| | 2,872 |
| | 2,735 |
| | 2,877 |
| | — |
| | — |
| |
| | | | | | | | | | | | | | | |
| | | | | | | | | | | | | | | |
|
| | | | | | | | | | | | | | | | | | | | | | | | | | |
| JPMORGAN CHASE & CO. | | | | | |
| ASSET & WEALTH MANAGEMENT | | | | |
| FINANCIAL HIGHLIGHTS, CONTINUED | | | | |
| (in millions, except ratio data) | | | | | | | | | | | | | | |
| | | | | | | | | | | | | | | |
| | QUARTERLY TRENDS | |
| | | | | | | | | | | | 1Q20 Change | |
| | 1Q20 | | 4Q19 | | 3Q19 | | 2Q19 | | 1Q19 | | 4Q19 | | 1Q19 | |
| SELECTED BALANCE SHEET DATA (period-end) | | | | | | | | | | | | | | |
| Total assets | $ | 186,102 |
| | $ | 182,004 |
| | $ | 174,226 |
| | $ | 172,149 |
| | $ | 165,865 |
| | 2 | % | | 12 | % | |
| Loans | 166,058 |
| | 160,535 |
| | 153,245 |
| | 149,877 |
| | 143,750 |
| | 3 |
| | 16 |
| |
| Deposits | 168,561 |
| | 147,804 |
| | 138,439 |
| | 136,225 |
| | 143,348 |
| | 14 |
| | 18 |
| |
| Equity | 10,500 |
| | 10,500 |
| | 10,500 |
| | 10,500 |
| | 10,500 |
| | — |
| | — |
| |
| | | | | | | | | | | | | | | |
| SELECTED BALANCE SHEET DATA (average) | | | | | | | | | | | | | | |
| Total assets | $ | 183,316 |
| | $ | 176,925 |
| | $ | 171,121 |
| | $ | 167,544 |
| | $ | 167,358 |
| | 4 |
| | 10 |
| |
| Loans | 161,823 |
| | 156,106 |
| | 150,486 |
| | 146,494 |
| | 145,406 |
| | 4 |
| | 11 |
| |
| Deposits | 150,631 |
| | 143,059 |
| | 138,822 |
| | 140,317 |
| | 138,235 |
| | 5 |
| | 9 |
| |
| Equity | 10,500 |
| | 10,500 |
| | 10,500 |
| | 10,500 |
| | 10,500 |
| | — |
| | — |
| |
| | | | | | | | | | | | | | | |
| CREDIT DATA AND QUALITY STATISTICS | | | | | | | | | | | | | | |
| Net charge-offs | 2 |
| | $ | 4 |
| | $ | 26 |
| | $ | (3 | ) | | $ | 4 |
| | (50 | ) | | (50 | ) | |
| Nonaccrual loans | 304 |
| | 116 |
| | 176 |
| | 127 |
| | 285 |
| | 162 |
| | 7 |
| |
| Allowance for credit losses: | | | | | | | | | | | | | | |
| Allowance for loan losses | 438 |
| | 354 |
| | 350 |
| | 331 |
| | 325 |
| | 24 |
| | 35 |
| |
| Allowance for lending-related commitments | 14 |
| | 19 |
| | 16 |
| | 17 |
| | 18 |
| | (26 | ) | | (22 | ) | |
| Total allowance for credit losses | 452 |
| | 373 |
| | 366 |
| | 348 |
| | 343 |
| | 21 |
| | 32 |
| |
| Net charge-off/(recovery) rate | — |
| % | 0.01 |
| % | 0.07 |
| % | (0.01 | ) | % | 0.01 |
| % | | | | |
| Allowance for loan losses to period-end loans | 0.26 |
| | 0.22 |
| | 0.23 |
| | 0.22 |
| | 0.23 |
| | | | | |
| Allowance for loan losses to nonaccrual loans | 144 |
| | 305 |
| | 199 |
| | 261 |
| | 114 |
| | | | | |
| Nonaccrual loans to period-end loans | 0.18 |
| | 0.07 |
| | 0.11 |
| | 0.08 |
| | 0.20 |
| | | | | |
| | | | | | | | | | | | | | | |
| | | | | | | | | | | | | | | |
|
| | | | | | | | | | | | | | | | | | | | | | | | | | |
| JPMORGAN CHASE & CO. | | | | | |
| ASSET & WEALTH MANAGEMENT | | | | |
| FINANCIAL HIGHLIGHTS, CONTINUED | | | | |
| (in billions) | | | | | | | | | | | | | | |
| | | | | | | | | | | | | | | |
| | | | | | | | | | | | | | | |
| | | | | | | | | | | | Mar 31, 2020 | |
| | | | | | | | | | | | Change | |
| | Mar 31, | | Dec 31, | | Sep 30, | | Jun 30, | | Mar 31, | | Dec 31, | | Mar 31, | |
| CLIENT ASSETS | 2020 | | 2019 | | 2019 | | 2019 | | 2019 | | 2019 | | 2019 | |
| Assets by asset class | | | | | | | | | | | | | | |
| Liquidity | $ | 618 |
| | $ | 542 |
| | $ | 505 |
| | $ | 481 |
| | $ | 476 |
| | 14 | % | | 30 | % | |
| Fixed income | 586 |
| | 602 |
| | 590 |
| | 543 |
| | 495 |
| | (3 | ) | | 18 |
| |
| Equity | 369 |
| | 474 |
| | 437 |
| | 441 |
| | 427 |
| | (22 | ) | | (14 | ) | |
| Multi-asset and alternatives | 666 |
| | 746 |
| | 714 |
| | 713 |
| | 698 |
| | (11 | ) | | (5 | ) | |
| TOTAL ASSETS UNDER MANAGEMENT | 2,239 |
| | 2,364 |
| | 2,246 |
| | 2,178 |
| | 2,096 |
| | (5 | ) | | 7 |
| |
| Custody/brokerage/administration/deposits | 763 |
| | 862 |
| | 815 |
| | 820 |
| | 801 |
| | (11 | ) | | (5 | ) | |
| TOTAL CLIENT ASSETS | $ | 3,002 |
| | $ | 3,226 |
| | $ | 3,061 |
| | $ | 2,998 |
| | $ | 2,897 |
| | (7 | ) | | 4 |
| |
| | | | | | | | | | | | | | | |
| Memo: | | | | | | | | | | | | | | |
| Alternatives client assets (a) | $ | 188 |
| | $ | 185 |
| | $ | 183 |
| | $ | 177 |
| | $ | 172 |
| | 2 |
| | 9 |
| |
| | | | | | | | | | | | | | | |
| Assets by client segment | | | | | | | | | | | | | | |
| Private Banking | $ | 617 |
| | $ | 672 |
| | $ | 636 |
| | $ | 617 |
| | $ | 597 |
| | (8 | ) | | 3 |
| |
| Institutional | 1,097 |
| | 1,074 |
| | 1,029 |
| | 991 |
| | 943 |
| | 2 |
| | 16 |
| |
| Retail | 525 |
| | 618 |
| | 581 |
| | 570 |
| | 556 |
| | (15 | ) | | (6 | ) | |
| TOTAL ASSETS UNDER MANAGEMENT | $ | 2,239 |
| | $ | 2,364 |
| | $ | 2,246 |
| | $ | 2,178 |
| | $ | 2,096 |
| | (5 | ) | | 7 |
| |
| | | | | | | | | | | | | | | |
| Private Banking | $ | 1,355 |
| | $ | 1,504 |
| | $ | 1,424 |
| | $ | 1,410 |
| | $ | 1,371 |
| | (10 | ) | | (1 | ) | |
| Institutional | 1,118 |
| | 1,099 |
| | 1,051 |
| | 1,013 |
| | 965 |
| | 2 |
| | 16 |
| |
| Retail | 529 |
| | 623 |
| | 586 |
| | 575 |
| | 561 |
| | (15 | ) | | (6 | ) | |
| TOTAL CLIENT ASSETS | $ | 3,002 |
| | $ | 3,226 |
| | $ | 3,061 |
| | $ | 2,998 |
| | $ | 2,897 |
| | (7 | ) | | 4 |
| |
| | | | | | | | | | | | | | | |
| Assets under management rollforward | | | | | | | | | | | | | | |
| Beginning balance | $ | 2,364 |
| | $ | 2,246 |
| | $ | 2,178 |
| | $ | 2,096 |
| | $ | 1,987 |
| | | | | |
| Net asset flows: | | | | | | | | | | | | | | |
| Liquidity | 75 |
| | 37 |
| | 24 |
| | 4 |
| | (5 | ) | | | | | |
| Fixed income | 1 |
| | 9 |
| | 41 |
| | 37 |
| | 19 |
| | | | | |
| Equity | (1 | ) | | (1 | ) | | (2 | ) | | (1 | ) | | (6 | ) | | | | | |
| Multi-asset and alternatives | (2 | ) | | 6 |
| | 1 |
| | — |
| | (3 | ) | | | | | |
| Market/performance/other impacts | (198 | ) | | 67 |
| | 4 |
| | 42 |
| | 104 |
| | | | | |
| Ending balance | $ | 2,239 |
| | $ | 2,364 |
| | $ | 2,246 |
| | $ | 2,178 |
| | $ | 2,096 |
| | | | | |
| | | | | | | | | | | | | | | |
| Client assets rollforward | | | | | | | | | | | | | | |
| Beginning balance | $ | 3,226 |
| | $ | 3,061 |
| | $ | 2,998 |
| | $ | 2,897 |
| | $ | 2,733 |
| | | | | |
| Net asset flows | 85 |
| | 58 |
| | 59 |
| | 52 |
| | 9 |
| | | | | |
| Market/performance/other impacts | (309 | ) | | 107 |
| | 4 |
| | 49 |
| | 155 |
| | | | | |
| Ending balance | $ | 3,002 |
| | $ | 3,226 |
| | $ | 3,061 |
| | $ | 2,998 |
| | $ | 2,897 |
| | | | | |
| | | | | | | | | | | | | | | |
| | | | | | | | | | | | | | | |
| |
| (a) | Represents assets under management, as well as client balances in brokerage accounts. |
|
| | | | | | | | | | | | | | | | | | | | | | | | | | |
| JPMORGAN CHASE & CO. | | | | | |
| CORPORATE | | | | |
| FINANCIAL HIGHLIGHTS | | | | |
| (in millions, except headcount data) | | | | | | | | | | | | | | |
| | | | | | | | | | | | | | | |
| | QUARTERLY TRENDS | |
| | | | | | | | | | | | 1Q20 Change | |
| | 1Q20 | | 4Q19 | | 3Q19 | | 2Q19 | | 1Q19 | | 4Q19 | | 1Q19 | |
| INCOME STATEMENT | | | | | | | | | | | | | | |
| REVENUE | | | | | | | | | | | | | | |
| Principal transactions | $ | (113 | ) | | $ | (234 | ) | | $ | 10 |
| | $ | (175 | ) | | $ | (62 | ) | | 52 | % | | (82 | )% | |
| Investment securities gains | 233 |
| | 123 |
| | 78 |
| | 44 |
| | 13 |
| | 89 |
| | NM |
| |
| All other income | 211 |
| | (6 | ) | | 32 |
| | 6 |
| | 57 |
| | NM |
| | 270 |
| |
| Noninterest revenue | 331 |
| | (117 | ) | | 120 |
| | (125 | ) | | 8 |
| | NM |
| | NM |
| |
| Net interest income (a) | (165 | ) | | (111 | ) | | 572 |
| | 447 |
| | 417 |
| | (49 | ) | | NM |
| |
| TOTAL NET REVENUE (b) | 166 |
| | (228 | ) | | 692 |
| | 322 |
| | 425 |
| | NM |
| | (61 | ) | |
| | | | | | | | | | | | | | | |
| Provision for credit losses | 8 |
| | (1 | ) | | — |
| | (2 | ) | | 2 |
| | NM |
| | 300 |
| |
| | | | | | | | | | | | | | | |
| NONINTEREST EXPENSE (c) | 146 |
| | 343 |
| | 281 |
| | 232 |
| | 211 |
| | (57 | ) | | (31 | ) | |
| Income/(loss) before income tax expense/(benefit) | 12 |
| | (570 | ) | | 411 |
| | 92 |
| | 212 |
| | NM |
| | (94 | ) | |
| Income tax expense/(benefit) | 137 |
| | (209 | ) | | 18 |
| | (736 | ) | (f) | (39 | ) | | NM |
| | NM |
| |
| NET INCOME/(LOSS) | $ | (125 | ) | | $ | (361 | ) | | $ | 393 |
| | $ | 828 |
| | $ | 251 |
| | 65 |
| | NM |
| |
| | | | | | | | | | | | | | | |
| MEMO: | | | | | | | | | | | | | | |
| TOTAL NET REVENUE | | | | | | | | | | | | | | |
| Treasury and Chief Investment Office (“CIO”) (a) | 169 |
| | 102 |
| | 801 |
| | 618 |
| | 511 |
| | 66 |
| | (67 | ) | |
| Other Corporate | (3 | ) | | (330 | ) | | (109 | ) | | (296 | ) | | (86 | ) | | 99 |
| | 97 |
| |
| TOTAL NET REVENUE | $ | 166 |
| | $ | (228 | ) | | $ | 692 |
| | $ | 322 |
| | $ | 425 |
| | NM |
| | (61 | ) | |
| | | | | | | | | | | | | | | |
| NET INCOME/(LOSS) | | | | | | | | | | | | | | |
| Treasury and CIO | 83 |
| | 22 |
| | 576 |
| | 462 |
| | 334 |
| | 277 |
| | (75 | ) | |
| Other Corporate | (208 | ) | | (383 | ) | | (183 | ) | | 366 |
| | (83 | ) | | 46 |
| | (151 | ) | |
| TOTAL NET INCOME/(LOSS) | $ | (125 | ) | | $ | (361 | ) | | $ | 393 |
| | $ | 828 |
| | $ | 251 |
| | 65 |
| | NM |
| |
| | | | | | | | | | | | | | | |
| SELECTED BALANCE SHEET DATA (period-end) | | | | | | | | | | | | | | |
| Total assets | $ | 981,937 |
| | $ | 837,618 |
| | $ | 812,333 |
| | $ | 821,330 |
| | $ | 796,615 |
| | 17 |
| | 23 |
| |
| Loans | 1,650 |
| | 1,649 |
| | 1,705 |
| | 1,695 |
| | 1,885 |
| | — |
| | (12 | ) | |
| | | | | | | | | | | | | | | |
| Headcount | 38,785 |
| | 38,033 |
| | 38,155 |
| | 37,361 |
| | 37,502 |
| | 2 |
| | 3 |
| |
| | | | | | | | | | | | | | | |
| SUPPLEMENTAL INFORMATION | | | | | | | | | | | | | | |
| TREASURY and CIO | | | | | | | | | | | | | | |
| Investment securities gains | $ | 233 |
| | $ | 123 |
| | $ | 78 |
| | $ | 44 |
| | $ | 13 |
| | 89 |
| | NM |
| |
| Available-for-sale (“AFS”) investment securities (average) | 372,954 |
| | 350,100 |
| | 305,894 |
| | 248,612 |
| | 226,605 |
| | 7 |
| | 65 |
| |
| Held-to-maturity (“HTM”) investment securities (average) | 46,673 |
| | 42,125 |
| | 35,494 |
| | 30,929 |
| | 31,082 |
| | 11 |
| | 50 |
| |
| Investment securities portfolio (average) | $ | 419,627 |
| | $ | 392,225 |
| | $ | 341,388 |
| | $ | 279,541 |
| | $ | 257,687 |
| | 7 |
| | 63 |
| |
| AFS investment securities (period-end) | 397,891 |
| | 348,876 |
| | 351,599 |
| | 274,533 |
| | 234,832 |
| | 14 |
| | 69 |
| |
| HTM investment securities, net of allowance for credit losses (period-end) (d)(e) | 71,200 |
| | 47,540 |
| | 40,830 |
| | 30,907 |
| | 30,849 |
| | 50 |
| | 131 |
| |
| Investment securities portfolio, net of allowance for credit losses (period-end) (d) | $ | 469,091 |
| | $ | 396,416 |
| | $ | 392,429 |
| | $ | 305,440 |
| | $ | 265,681 |
| | 18 |
| | 77 |
| |
| | | | | | | | | | | | | | | |
| | | | | | | | | | | | | | | |
| |
| (a) | Net interest income in the third quarter of 2019 included income related to the unwind of the internal funding provided by Treasury and CIO to CCB upon the sale of certain mortgage loans. Refer to footnote (b) in CCB on page 11 for further information. |
| |
| (b) | Included tax-equivalent adjustments, driven by tax-exempt income from municipal bonds, of $61 million, $73 million, $74 million, $81 million and $86 million for the three months ended March 31, 2020, December 31, 2019, September 30, 2019, June 30, 2019 and March 31, 2019, respectively. |
| |
| (c) | Included legal expense/(benefit) of $(20) million, $(25) million, $(32) million, $(67) million and $(90) million for the three months ended March 31, 2020, December 31, 2019, September 30, 2019, June 30, 2019, and March 31, 2019, respectively. |
| |
| (d) | At March 31, 2020, the allowance for credit losses on held-to-maturity securities was $19 million. Refer to page 29 for further information. |
| |
| (e) | During the first quarter of 2020, the Firm transferred $26.1 billion of U.S. government-sponsored enterprise and government agency mortgage-backed securities from AFS to HTM for capital management purposes. |
| |
| (f) | The three months ended June 30, 2019 included income tax benefits of $742 million due to the resolution of certain tax audits. |
|
| | | | | | | | | | | | | | | | | | | | | | | | | | |
| JPMORGAN CHASE & CO. | | | | | |
| CREDIT-RELATED INFORMATION | | | | |
| (in millions) | | | | |
| | | | | | | | | | | | Mar 31, 2020 | |
| | | | | | | | | | | | Change | |
| | Mar 31, | | Dec 31, | | Sep 30, | | Jun 30, | | Mar 31, | | Dec 31, | | Mar 31, | |
| | 2020 | | 2019 | | 2019 | | 2019 | | 2019 | | 2019 | | 2019 | |
| CREDIT EXPOSURE | | | | | | | | | | | | | | |
| Consumer, excluding credit card loans (a) | | | | | | | | | | | | | | |
| Loans retained | $ | 293,779 |
| | $ | 294,999 |
| | $ | 295,586 |
| | $ | 314,675 |
| | $ | 322,208 |
| | — |
| | (9 | ) | |
| Loans held-for-sale | 1,848 |
| | 3,002 |
| | 4,821 |
| | 1,030 |
| | 4,199 |
| | (38 | ) | | (56 | ) | |
| Total consumer, excluding credit card loans | 295,627 |
| | 298,001 |
| | 300,407 |
| | 315,705 |
| | 326,407 |
| | (1 | ) | | (9 | ) | |
| | | | | | | | | | | | | | | |
| Credit card loans | | | | | | | | | | | | | | |
| Loans retained | 154,021 |
| | 168,924 |
| | 159,571 |
| | 157,568 |
| | 150,515 |
| | (9 | ) | | 2 |
| |
| Loans held-for-sale | — |
| | — |
| | — |
| | 8 |
| | 12 |
| | — |
| | NM |
| |
| Total credit card loans | 154,021 |
| | 168,924 |
| | 159,571 |
| | 157,576 |
| | 150,527 |
| | (9 | ) | | 2 |
| |
| Total consumer loans | 449,648 |
| | 466,925 |
| | 459,978 |
| | 473,281 |
| | 476,934 |
| | (4 | ) | | (6 | ) | |
| | | | | | | | | | | | | | | |
| Wholesale loans (b) | | | | | | | | | | | | | | |
| Loans retained | 555,289 |
| | 481,678 |
| | 473,730 |
| | 475,485 |
| | 471,118 |
| | 15 |
| | 18 |
| |
| Loans held-for-sale and loans at fair value | 10,438 |
| | 11,166 |
| | 11,510 |
| | 8,123 |
| | 8,193 |
| | (7 | ) | | 27 |
| |
| Total wholesale loans | 565,727 |
| | 492,844 |
| | 485,240 |
| | 483,608 |
| | 479,311 |
| | 15 |
| | 18 |
| |
| | | | | | | | | | | | | | | |
| Total loans | 1,015,375 |
| | 959,769 |
| | 945,218 |
| | 956,889 |
| | 956,245 |
| | 6 |
| | 6 |
| |
| Derivative receivables | 81,648 |
| | 49,766 |
| | 55,577 |
| | 52,878 |
| | 50,333 |
| | 64 |
| | 62 |
| |
| Receivables from customers and other (c) | 33,376 |
| | 33,706 |
| | 32,236 |
| | 27,414 |
| | 20,952 |
| | (1 | ) | | 59 |
| |
| Total credit-related assets | 1,130,399 |
| | 1,043,241 |
| | 1,033,031 |
| | 1,037,181 |
| | 1,027,530 |
| | 8 |
| | 10 |
| |
| | | | | | | | | | | | | | | |
| Lending-related commitments | | | | | | | | | | | | | | |
| Consumer, excluding credit card | 41,535 |
| | 40,169 |
| | 41,697 |
| | 40,132 |
| | 37,955 |
| | 3 |
| | 9 |
| |
| Credit card (d) | 681,442 |
| | 650,720 |
| | 645,880 |
| | 633,970 |
| | 626,922 |
| | 5 |
| | 9 |
| |
| Wholesale | 358,485 |
| | 413,310 |
| | 405,470 |
| | 403,767 |
| | 394,010 |
| | (13 | ) | | (9 | ) | |
| Total lending-related commitments | 1,081,462 |
| | 1,104,199 |
| | 1,093,047 |
| | 1,077,869 |
| | 1,058,887 |
| | (2 | ) | | 2 |
| |
| | | | | | | | | | | | | | | |
| Total credit exposure | $ | 2,211,861 |
| | $ | 2,147,440 |
| | $ | 2,126,078 |
| | $ | 2,115,050 |
| | $ | 2,086,417 |
| | 3 |
| | 6 |
| |
| | | | | | | | | | | | | | | |
| Memo: Total by category | | | | | | | | | | | | | | |
| Consumer exposure (e) | $ | 1,172,625 |
| | $ | 1,157,814 |
| | $ | 1,147,573 |
| | $ | 1,147,404 |
| | $ | 1,141,831 |
| | 1 |
| | 3 |
| |
| Wholesale exposures (f) | 1,039,236 |
| | 989,626 |
| | 978,505 |
| | 967,646 |
| | 944,586 |
| | 5 |
| | 10 |
| |
| Total credit exposure | $ | 2,211,861 |
| | $ | 2,147,440 |
| | $ | 2,126,078 |
| | $ | 2,115,050 |
| | $ | 2,086,417 |
| | 3 |
| | 6 |
| |
| | | | | | | | | | | | | | | |
| | | | | | | | | | | | | | | |
Effective January 1, 2020, the Firm adopted the CECL accounting guidance. The adoption resulted in a change in the accounting for PCI loans, which are considered PCD loans under CECL. In conjunction with the adoption of CECL, the Firm reclassified certain loans and commitments from the consumer, excluding credit card portfolio segment to the wholesale portfolio segment. Prior periods have been revised to conform with the current presentation. Refer to page 29 for further information.
| |
| (a) | Includes scored loans held in CCB, scored prime mortgage and scored home equity loans held in AWM, and scored prime mortgage loans held in Corporate. |
| |
| (b) | Includes loans held in CIB, CB, AWM , Corporate, as well as risk-rated business banking and auto dealer loans held in CCB for which the wholesale methodology is applied for determining the allowance for loan losses. Excludes scored loans held in CCB, scored prime mortgage and scored home equity loans held in AWM and scored prime mortgage loans held in Corporate. |
| |
| (c) | Primarily represents brokerage-related held-for-investment customer receivables, which are classified in accrued interest and accounts receivable on the Consolidated balance sheets. |
| |
| (d) | Includes commercial card lending-related commitments primarily in CB and CIB. |
| |
| (e) | Represents total consumer loans, lending-related commitments, and receivables from customers and other. |
| |
| (f) | Represents total wholesale loans, lending-related commitments, derivative receivables, and receivables from customers and other. |
|
| | | | | | | | | | | | | | | | | | | | | | | | | | |
| JPMORGAN CHASE & CO. | | | | | |
| CREDIT-RELATED INFORMATION, CONTINUED | | | |
| (in millions, except ratio data) | | | | |
| | | | | | | | | | | | | | | |
| | | | | | | | | | | | Mar 31, 2020 | |
| | | | | | | | | | | | Change | |
| | Mar 31, | | Dec 31, | | Sep 30, | | Jun 30, | | Mar 31, | | Dec 31, | | Mar 31, | |
| | 2020 | | 2019 | | 2019 | | 2019 | | 2019 | | 2019 | | 2019 | |
| NONPERFORMING ASSETS (a) | | | | | | | | | | | | | | |
| Consumer nonaccrual loans (b)(c) | $ | 3,877 |
| | $ | 2,928 |
| | $ | 2,986 |
| | $ | 3,077 |
| | $ | 3,180 |
| | 32 | % | | 22 | % | |
| | | �� | | | | | | | | | | | | |
| Wholesale nonaccrual loans | | | | | | | | | | | | | | |
| Loans retained | 1,957 |
| | 1,057 |
| | 1,703 |
| | 1,423 |
| | 1,779 |
| | 85 |
| | 10 |
| |
| Loans held-for-sale and loans at fair value | 138 |
| | 95 |
| | 262 |
| | 370 |
| | 313 |
| | 45 |
| | (56 | ) | |
| Total wholesale nonaccrual loans | 2,095 |
| | 1,152 |
| | 1,965 |
| | 1,793 |
| | 2,092 |
| | 82 |
| | — |
| |
| | | | | | | | | | | | | | | |
| Total nonaccrual loans | 5,972 |
| | 4,080 |
| | 4,951 |
| | 4,870 |
| | 5,272 |
| | 46 |
| | 13 |
| |
| | | | | | | | | | | | | | | |
| Derivative receivables | 85 |
| | 30 |
| | 26 |
| | 39 |
| | 44 |
| | 183 |
| | 93 |
| |
| Assets acquired in loan satisfactions | 364 |
| | 387 |
| | 366 |
| | 351 |
| | 300 |
| | (6 | ) | | 21 |
| |
| Total nonperforming assets | 6,421 |
| | 4,497 |
| | 5,343 |
| | 5,260 |
| | 5,616 |
| | 43 |
| | 14 |
| |
| Wholesale lending-related commitments (d) | 619 |
| | 474 |
| (e)
| 446 |
| | 465 |
| | 455 |
| | 31 |
| | 36 |
| |
| Total nonperforming exposure | $ | 7,040 |
| | $ | 4,971 |
| | $ | 5,789 |
| | $ | 5,725 |
| | $ | 6,071 |
| | 42 |
| | 16 |
| |
| | | | | | | | | | | | | | | |
| NONACCRUAL LOAN-RELATED RATIOS | | | | | | | | | | | |
| Total nonaccrual loans to total loans (c) | 0.59 | % | | 0.43 | % | | 0.52 | % | | 0.51 | % | | 0.55 | % | | | | | |
| Total consumer, excluding credit card nonaccrual loans to | | | | | | | | | | | | | | |
| total consumer, excluding credit card loans (c) | 1.31 |
| | 0.98 |
| | 0.99 |
| | 0.97 |
| | 0.97 |
| | | | | |
| Total wholesale nonaccrual loans to total | | | | | | | | | | | | | | |
| wholesale loans | 0.37 |
| | 0.23 |
| | 0.40 |
| | 0.37 |
| | 0.44 |
| | | | | |
| | | | | | | | | | | | | | | |
| | | | | | | | | | | | | | | |
| |
| (a) | At March 31, 2020, December 31, 2019, September 30, 2019, June 30, 2019, and March 31, 2019, nonperforming assets excluded: (1) mortgage loans insured by U.S. government agencies of $616 million, $961 million, $1.6 billion, $1.8 billion and $2.2 billion, respectively, that are 90 or more days past due; and (2) real estate owned (“REO”) insured by U.S. government agencies of $29 million, $41 million, $50 million, $56 million and $69 million, respectively. These amounts have been excluded based upon the government guarantee. In addition, the Firm’s policy is generally to exempt credit card loans from being placed on nonaccrual status as permitted by regulatory guidance issued by the Federal Financial Institutions Examination Council (“FFIEC”). Refer to Note 12 of the Firm’s 2019 Form 10-K for additional information on the Firm’s credit card nonaccrual and charge-off policies. |
| |
| (b) | Included nonaccrual loans held-for-sale of $2 million, $2 million and $31 million at December 31, 2019, September 30, 2019, and June 30, 2019, respectively. There were no nonaccrual loans held-for-sale in all other periods presented. |
| |
| (c) | At March 31, 2020, nonaccrual loans included $970 million of PCD loans. Prior to the adoption of CECL, nonaccrual loans excluded PCI loans as the Firm recognized interest income on each pool of PCI loans as each of the pools was performing. |
| |
| (d) | Represents commitments that are risk rated as nonaccrual. |
| |
| (e) | The prior period amount has been revised to conform with the current period presentation. |
|
| | | | | | | | | | | | | | | | | | | | | | | | | | |
| JPMORGAN CHASE & CO. | | | | | |
| CREDIT-RELATED INFORMATION, CONTINUED | | | |
| (in millions, except ratio data) | | | | |
| | | | | | | | | | | | | | | |
| | QUARTERLY TRENDS | |
| | | | | | | | | | | | 1Q20 Change | |
| | 1Q20 | | 4Q19 | | 3Q19 | | 2Q19 | | 1Q19 | | 4Q19 | | 1Q19 | |
| SUMMARY OF CHANGES IN THE ALLOWANCES | | | | | | | | | | | | | | |
| ALLOWANCE FOR LOAN LOSSES | | | | | | | | | | | | | | |
| Beginning balance | $ | 17,295 |
| (a) | $ | 13,235 |
| | $ | 13,166 |
| | $ | 13,533 |
| | $ | 13,445 |
| | 31 | % | | 29 | % | |
| Net charge-offs: | | | | | | | | | | | | | | |
| Gross charge-offs | 1,902 |
| | 1,788 |
| | 1,676 |
| | 1,704 |
| | 1,642 |
| | 6 |
| | 16 |
| |
| Gross recoveries collected | (433 | ) | | (294 | ) | | (305 | ) | | (301 | ) | | (281 | ) | | (47 | ) | | (54 | ) | |
| Net charge-offs | 1,469 |
| | 1,494 |
| | 1,371 |
| | 1,403 |
| | 1,361 |
| | (2 | ) | | 8 |
| |
| Write-offs of PCI loans | NA |
| | 19 |
| (b) | 43 |
| (b) | 39 |
| (b) | 50 |
| (b) | NM |
| | NM |
| |
| Provision for loan losses | 7,418 |
| | 1,401 |
| | 1,479 |
| | 1,077 |
| | 1,492 |
| | 429 |
| | 397 |
| |
| Other | — |
| | — |
| | 4 |
| | (2 | ) | | 7 |
| | — |
| | NM |
| |
| Ending balance | $ | 23,244 |
| | $ | 13,123 |
| | $ | 13,235 |
| | $ | 13,166 |
| | $ | 13,533 |
| | 77 |
| | 72 |
| |
| | | | | | | | | | | | | | | |
| ALLOWANCE FOR LENDING-RELATED COMMITMENTS | | | | | | | | | | | | | | |
| Beginning balance | $ | 1,289 |
| (a) | $ | 1,165 |
| | $ | 1,129 |
| | $ | 1,058 |
| | $ | 1,055 |
| | 11 |
| | 22 |
| |
| Provision for lending-related commitments | 858 |
| | 26 |
| | 35 |
| | 72 |
| | 3 |
| | NM |
| | NM |
| |
| Other | — |
| | — |
| | 1 |
| | (1 | ) | | — |
| | — |
| | — |
| |
| Ending balance | $ | 2,147 |
| | $ | 1,191 |
| | $ | 1,165 |
| | $ | 1,129 |
| | $ | 1,058 |
| | 80 |
| | 103 |
| |
| | | | | | | | | | | | | | | |
| Total allowance for credit losses | $ | 25,391 |
| | $ | 14,314 |
| | $ | 14,400 |
| | $ | 14,295 |
| | $ | 14,591 |
| | 77 |
| | 74 |
| |
| | | | | | | | | | | | | | | |
| NET CHARGE-OFF/(RECOVERY) RATES | | | | | | | | | | | | | | |
| Consumer retained, excluding credit card loans | (0.01 | )% | | 0.15 | % | | 0.11 | % | | 0.09 | % | | 0.13 | % | | | | | |
| Credit card retained loans | 3.25 |
| | 3.01 |
| | 2.95 |
| | 3.24 |
| | 3.23 |
| | | | | |
| Total consumer retained loans | 1.15 |
| | 1.16 |
| | 1.08 |
| | 1.11 |
| | 1.10 |
| | | | | |
| Wholesale retained loans | 0.13 |
| | 0.13 |
| | 0.10 |
| | 0.08 |
| | 0.04 |
| | | | | |
| Total retained loans | 0.62 |
| | 0.63 |
| | 0.58 |
| | 0.60 |
| | 0.58 |
| | | | | |
| | | | | | | | | | | | | | | |
| Memo: Average retained loans | | | | | | | | | | | | | | |
| Consumer retained, excluding credit card loans | $ | 294,156 |
| | $ | 295,258 |
| | $ | 304,385 |
| | $ | 319,424 |
| | $ | 333,480 |
| | — |
| | (12 | ) | |
| Credit card retained loans | 162,660 |
| | 162,112 |
| | 158,166 |
| | 153,736 |
| | 151,120 |
| | — |
| | 8 |
| |
| Total average retained consumer loans | 456,816 |
| | 457,370 |
| | 462,551 |
| | 473,160 |
| | 484,600 |
| | — |
| | (6 | ) | |
| Wholesale retained loans | 491,819 |
| | 476,402 |
| | 469,942 |
| | 472,049 |
| | 471,957 |
| | 3 |
| | 4 |
| |
| Total average retained loans | $ | 948,635 |
| | $ | 933,772 |
| | $ | 932,493 |
| | $ | 945,209 |
| | $ | 956,557 |
| | 2 |
| | (1 | ) | |
| | | | | | | | | | | | | | | |
| |
| (a) | Upon the adoption of the CECL accounting guidance on January 1, 2020, the Firm recognized a net increase of $4.3 billion (“day 1 impact”) to the allowance for credit losses, of which $4.2 billion relates to the allowance for loan losses and $98 million relates to the allowance for lending-related commitments. Refer to page 29 for further information. |
| |
| (b) | Prior to the adoption of CECL, write-offs of PCI loans were recorded against the allowance for loan losses when actual losses for a pool exceeded estimated losses that were recorded as purchase accounting adjustments at the time of acquisition. A write-off of a PCI loan was recognized when the underlying loan was removed from a pool. |
|
| | | | | | | | | | | | | | | | | | | | | | | | | | |
| JPMORGAN CHASE & CO. | | | | | |
| CREDIT-RELATED INFORMATION, CONTINUED | | | |
| (in millions, except ratio data) | | | | |
| | | | | | | | | | | | | | | |
| | | | | | | | | | | | Mar 31, 2020 | |
| | | | | | | | | | | | Change | |
| | Mar 31, | | Dec 31, | | Sep 30, | | Jun 30, | | Mar 31, | | Dec 31, | | Mar 31, | |
| | 2020 | | 2019 | | 2019 | | 2019 | | 2019 | | 2019 | | 2019 | |
| ALLOWANCE COMPONENTS AND RATIOS | | | | | | | | | | | | | | |
| ALLOWANCE FOR LOAN LOSSES | | | | | | | | | | | | | | |
| Consumer, excluding credit card | | | | | | | | | | | | | | |
| Asset-specific (a) | $ | 223 |
| | $ | 75 |
| | $ | 88 |
| | $ | 87 |
| | $ | 89 |
| | 197 | % | | 151 | % | |
| Portfolio-based | 3,231 |
| | 1,476 |
| | 1,475 |
| | 1,538 |
| | 1,572 |
| | 119 |
| | 106 |
| |
| PCI | NA |
| | 987 |
| | 1,256 |
| | 1,299 |
| | 1,738 |
| | NM |
| | NM |
| |
| Total consumer, excluding credit card | 3,454 |
| | 2,538 |
| | 2,819 |
| | 2,924 |
| | 3,399 |
| | 36 |
| | 2 |
| |
| Credit card | | | | | | | | | | | | | | |
| Asset-specific (b) | 530 |
| | 477 |
| | 488 |
| | 472 |
| | 461 |
| | 11 |
| | 15 |
| |
| Portfolio-based | 14,420 |
| | 5,206 |
| | 5,095 |
| | 4,911 |
| | 4,722 |
| | 177 |
| | 205 |
| |
| Total credit card | 14,950 |
| | 5,683 |
| | 5,583 |
| | 5,383 |
| | 5,183 |
| | 163 |
| | 188 |
| |
| Total consumer | 18,404 |
| | 8,221 |
| | 8,402 |
| | 8,307 |
| | 8,582 |
| | 124 |
| | 114 |
| |
| Wholesale | | | | | | | | | | | | | | |
| Asset-specific (c) | 556 |
| | 295 |
| | 399 |
| | 346 |
| | 479 |
| | 88 |
| | 16 |
| |
| Portfolio-based | 4,284 |
| | 4,607 |
| | 4,434 |
| | 4,513 |
| | 4,472 |
| | (7 | ) | | (4 | ) | |
| Total wholesale | 4,840 |
| | 4,902 |
| | 4,833 |
| | 4,859 |
| | 4,951 |
| | (1 | ) | | (2 | ) | |
| Total allowance for loan losses | 23,244 |
| | 13,123 |
| | 13,235 |
| | 13,166 |
| | 13,533 |
| | 77 |
| | 72 |
| |
| Allowance for lending-related commitments | 2,147 |
| | 1,191 |
| | 1,165 |
| | 1,129 |
| | 1,058 |
| | 80 |
| | 103 |
| |
| Total allowance for credit losses | $ | 25,391 |
| | $ | 14,314 |
| | $ | 14,400 |
| | $ | 14,295 |
| | $ | 14,591 |
| | 77 |
| | 74 |
| |
| | | | | | | | | | | | | | | |
| CREDIT RATIOS | | | | | | | | | | | | | | |
| Consumer, excluding credit card allowance, to total | | | | | | | | | | | | | | |
| consumer, excluding credit card retained loans | 1.18 | % |
| 0.86 | % |
| 0.95 | % |
| 0.93 | % |
| 1.05 | % |
| | | | |
| Credit card allowance to total credit card retained loans | 9.71 |
| | 3.36 |
| | 3.50 |
| | 3.42 |
| | 3.44 |
| | | | | |
| Wholesale allowance to total wholesale retained loans | 0.87 |
| | 1.02 |
| | 1.02 |
| | 1.02 |
| | 1.05 |
| | | | | |
| Wholesale allowance to total wholesale retained loans, | | | | | | | | | | | | | | |
| excluding trade finance and conduits (d) | 0.93 |
| | 1.08 |
| | 1.08 |
| | 1.10 |
| | 1.13 |
| | | | | |
| Total allowance to total retained loans | 2.32 |
| | 1.39 |
| | 1.42 |
| | 1.39 |
| | 1.43 |
| | | | | |
| Consumer, excluding credit card allowance, to consumer, | | | | | | | | | | | | | | |
| excluding credit card retained nonaccrual loans (e) | 89 |
| | 87 |
| | 94 |
| | 96 |
| | 107 |
| | | | | |
| Total allowance, excluding credit card allowance, to retained | | | | | | | | | | | | | | |
| nonaccrual loans, excluding credit card nonaccrual loans (e) | 142 |
| | 187 |
| | 163 |
| | 174 |
| | 168 |
| | | | | |
| Wholesale allowance to wholesale retained nonaccrual loans | 247 |
| | 464 |
| | 284 |
| | 341 |
| | 278 |
| | | | | |
| Total allowance to total retained nonaccrual loans | 398 |
| | 329 |
| | 282 |
| | 295 |
| | 273 |
| | | | | |
| | | | | | | | | | | | | | | |
| |
| (a) | Includes modified PCD loans and loans that have been modified or are reasonably expected to be modified in a troubled debt restructuring (“TDR”). |
| |
| (b) | The asset-specific credit card allowance for loan losses relates to loans that have been modified or are reasonably expected to be modified in a TDR; the Firm calculates this allowance based on the loans’ original contractual interest rates and does not consider any incremental penalty rates. |
| |
| (c) | Includes risk-rated loans that have been placed on nonaccrual status and loans that have been modified or are reasonably expected to be modified in a TDR. |
| |
| (d) | Management uses allowance for loan losses to period-end loans retained, excluding CIB’s trade finance and conduits, a non-GAAP financial measure, to provide a more meaningful assessment of the wholesale allowance coverage ratio. |
| |
| (e) | Refer to footnote (a) on page 25 for information on the Firm’s nonaccrual policy for credit card loans. |
|
| | | | | | | | | | | | | | |
| JPMORGAN CHASE & CO. | | | |
| NON-GAAP FINANCIAL MEASURES |
| | | | | |
Non-GAAP Financial Measures
| |
| (a) | In addition to analyzing the Firm’s results on a reported basis, management reviews Firmwide results, including the overhead ratio, on a “managed” basis; these Firmwide managed basis results are non-GAAP financial measures. The Firm also reviews the results of the lines of business on a managed basis. The Firm’s definition of managed basis starts, in each case, with the reported U.S. GAAP results and includes certain reclassifications to present total net revenue for the Firm and each of the reportable business segments on a FTE basis. Accordingly, revenue from investments that receive tax credits and tax-exempt securities is presented in the managed results on a basis comparable to taxable investments and securities. These financial measures allow management to assess the comparability of revenue arising from both taxable and tax-exempt sources. The corresponding income tax impact related to tax-exempt items is recorded within income tax expense. These adjustments have no impact on net income as reported by the Firm as a whole or by the lines of business. |
| |
| (b) | TCE, ROTCE, and TBVPS are each non-GAAP financial measures. TCE represents the Firm’s common stockholders’ equity (i.e., total stockholders’ equity less preferred stock) less goodwill and identifiable intangible assets (other than MSRs), net of related deferred tax liabilities. ROTCE measures the Firm’s net income applicable to common equity as a percentage of average TCE. TBVPS represents the Firm’s TCE at period-end divided by common shares at period-end. TCE, ROTCE, and TBVPS are utilized by the Firm, as well as investors and analysts, in assessing the Firm’s use of equity. |
| |
| (c) | The ratio of the wholesale and CIB’s allowance for loan losses to period-end loans retained, excluding trade finance and conduits, is calculated excluding loans accounted for at fair value, loans held-for-sale, CIB’s trade finance loans and consolidated Firm-administered multi-seller conduits, as well as their related allowances, to provide a more meaningful assessment of the respective allowance coverage ratio. |
(d)In addition to reviewing net interest income and the net yield on a managed basis, management also reviews these metrics excluding CIB’s Markets businesses to assess the performance of the Firm’s lending, investing (including asset-liability management) and deposit-raising activities. The resulting metrics are referred to as non-markets related net interest income and net yield. CIB’s Markets businesses are Fixed Income Markets and Equity Markets. Management believes that disclosure of non-markets related net interest income and net yield provide investors and analysts with other measures by which to analyze the non-markets-related business trends of the Firm and provides a comparable measure to other financial institutions that are primarily focused on lending, investing and deposit-raising activities. |
| | | | | | | | | | | | | | | | | | | | | | | | | | |
| | QUARTERLY TRENDS | |
| | | | | | | | | | | | 1Q20 Change | |
| (in millions, except rates) | 1Q20 | | 4Q19 | | 3Q19 | | 2Q19 | | 1Q19 | | 4Q19 | | 1Q19 | |
| | | | | | | | | | | | | | | |
| Net interest income – reported | $ | 14,439 |
| | $ | 14,166 |
| | $ | 14,228 |
| | $ | 14,398 |
| | $ | 14,453 |
| | 2 | % | | — | % | |
| Fully taxable-equivalent adjustments | 110 |
| | 123 |
| | 127 |
| | 138 |
| | 143 |
| | (11 | )% | | (23 | ) | |
| Net interest income - managed basis (a) | $ | 14,549 |
| | $ | 14,289 |
| | $ | 14,355 |
| | $ | 14,536 |
| | $ | 14,596 |
| | 2 |
| | — |
| |
| Less: CIB Markets net interest income | 1,596 |
| | 1,149 |
| | 723 |
| | 624 |
| | 624 |
| | 39 |
| | 156 |
| |
| Net interest income excluding CIB Markets (a) | $ | 12,953 |
| | $ | 13,140 |
| | $ | 13,632 |
| | $ | 13,912 |
| | $ | 13,972 |
| | (1 | ) | | (7 | ) | |
| | | | | | | | | | | | | | | |
| Average interest-earning assets | $ | 2,465,732 |
| | $ | 2,377,741 |
| | $ | 2,365,154 |
| | $ | 2,339,094 |
| | $ | 2,298,894 |
| | 4 |
| | 7 |
| |
| Less: Average CIB Markets interest-earning assets | 736,035 |
| | 676,763 |
| | 690,593 |
| | 673,480 |
| | 649,180 |
| | 9 |
| | 13 |
| |
| Average interest-earning assets excluding CIB Markets | $ | 1,729,697 |
| | $ | 1,700,978 |
| | $ | 1,674,561 |
| | $ | 1,665,614 |
| | $ | 1,649,714 |
| | 2 |
| | 5 |
| |
| | | | | | | | | | | | | | | |
| Net yield on average interest-earning assets - managed basis | 2.37 | % | | 2.38 | % | | 2.41 | % | | 2.49 | % | | 2.57 | % | | | | | |
| Net yield on average CIB Markets interest-earning assets | 0.87 | % | | 0.67 | % | | 0.42 | % | | 0.37 | % | | 0.39 | % | | | | | |
| Net yield on average interest-earning assets excluding CIB Markets | 3.01 | % | | 3.06 | % | | 3.23 | % | | 3.35 | % | | 3.43 | % | | | | | |
(a) Interest includes the effect of related hedges. Taxable-equivalent amounts are used where applicable.
|
| | | | | | | | | | | | | |
| JPMORGAN CHASE & CO. | | | | |
| FINANCIAL INSTRUMENTS – CREDIT LOSSES (“CECL”), ACCOUNTING GUIDANCE ADOPTED JANUARY 1, 2020 |
| | | | | |
Financial Instruments – Credit Losses (“CECL”)
Effective January 1, 2020, the Firm adopted the Financial Instruments – Credit Losses (“CECL”) accounting guidance. The adoption of this guidance established a single allowance framework for all financial assets carried at amortized cost and certain off-balance sheet credit exposures. This framework requires that management’s estimate reflects credit losses over the full remaining expected life and considers expected future changes in macroeconomic conditions.
The following table presents the impacts to the allowance for credit losses and retained earnings upon adoption of this guidance on January 1, 2020:
|
| | | | | | | | | |
| (in billions) | December 31, 2019 | CECL adoption impact | January 1, 2020 |
| Allowance for credit losses | | | |
| Consumer, excluding credit card (a) | $ | 2.6 |
| $ | 0.4 |
| $ | 3.0 |
|
| Credit card | 5.7 |
| 5.5 |
| 11.2 |
|
| Wholesale (a) | 6.0 |
| (1.6 | ) | 4.4 |
|
| Firmwide | $ | 14.3 |
| $ | 4.3 |
| $ | 18.6 |
|
| | | | |
| Retained earnings | | | |
| Firmwide allowance increase | | $ | 4.3 |
| |
| Balance sheet reclassification (b) | | (0.8 | ) | |
| Total pre-tax impact | | 3.5 |
| |
| Tax effect | | (0.8 | ) | |
| Decrease to retained earnings | | $ | 2.7 |
| |
| |
| (a) | In conjunction with the adoption of CECL, the Firm reclassified risk-rated business banking and auto dealer loans and commitments held in CCB from the consumer, excluding credit card portfolio segment to the wholesale portfolio segment, to align with the methodology applied in determining the allowance. Prior periods have been revised to conform with the current presentation. Accordingly, $0.6 billion of the allowance for credit losses at December 31, 2019 and $(0.2) billion of the CECL adoption impact were reclassified. |
| |
| (b) | Represents the recognition of the nonaccretable difference on purchased credit deteriorated assets and the Firm’s election to recognize the reserve for uncollectible accrued interest on credit card loans in the allowance, both of which resulted in a corresponding increase to loans. |
Investment Securities
Upon adoption, held-to-maturity securities are presented net of an allowance for credit losses.
PCD loans
Upon adoption, the Firm elected to discontinue the pool-level accounting for PCI loans and to account for these loans on an individual loan basis. PCI loans are considered PCD loans under CECL and are subject to the Firm’s nonaccrual and charge-off policies. As a result, certain credit metrics and ratios which previously excluded PCI loans, now include the impact of PCD loans, prior periods have been revised to conform with the current presentation.
Changes in credit portfolio segment
In conjunction with the adoption of CECL, the Firm reclassified risk-rated business banking and auto dealer loans and commitments held in CCB from the consumer, excluding credit card portfolio segment to the wholesale portfolio segment, to align with the methodology applied in determining the allowance. Prior periods have been revised to conform with the current period presentation.
Capital transition provisions
As disclosed in the Firm’s 2019 Form 10-K, the Firm had initially elected to phase-in the January 1, 2020 (“day 1”) impact to retained earnings of $2.7 billion to regulatory capital, over a three-year transition period beginning in 2020. As part of its response to the impact of COVID-19, on March 31, 2020, the Federal Reserve, Federal Deposit Insurance Corporation and Office of the Comptroller of the Currency issued an interim final rule that provided the option to temporarily delay the effects of CECL on regulatory capital for two years, followed by a three-year transition period. The interim final rule provides a uniform approach for estimating the effects of CECL compared to the legacy incurred loss model during the first two years of the transition period by taking 25% of the change in the reported allowance for credit losses (excluding PCD loans). The cumulative amount that is not recognized in regulatory capital, in addition to the $2.7 billion day 1 impact, will be phased in at 25 percent per year beginning January 1, 2022. As of March 31, 2020, the capital measures of the Firm exclude the $2.7 billion day 1 impact to retained earnings and 25% of the $6.8 billion increase in the allowance for credit losses, excluding PCD loans.
|
| | | | | | | | | | | | | | |
| JPMORGAN CHASE & CO. | | | | | | | |
| MERCHANT SERVICES REALIGNMENT | | |
| | | | | |
In the first quarter of 2020, to complete the realignment of the Firm’s wholesale payment businesses the Firm established a Wholesale Payments business unit within CIB. The Wholesale Payments business comprises Treasury Services and Merchant Services across CIB, CCB and CB as well as CIB Trade Finance that was previously reported in Lending in CIB. As a result the assets, liabilities and headcount associated with the Merchant Services business were realigned to CIB from CCB. In conjunction with this realignment the revenue and expenses of the Merchant Services business will be reported across CCB, CIB and CB based primarily on client relationship. Prior periods have been revised to reflect this realignment and revised allocation methodology.
The table below represents select data realigned to CIB from CCB.
|
| | | | | | | | | | | | | | | |
| (in millions, except headcount data) | 4Q19 | | 3Q19 | | 2Q19 | | 1Q19 |
| SELECTED BALANCE SHEET DATA (period-end) | | | | | | | |
| Total assets (a) | $ | 6,552 |
| | $ | 7,264 |
| | $ | 13,932 |
| | $ | 13,359 |
|
| | | | | | | | |
| Headcount | 4,022 |
| | 4,155 |
| | 4,152 |
| | 4,114 |
|
(a) Predominantly accrued interest and accounts receivable.
The chart below provides a mapping of the Firm’s prior reporting to the current presentation for the impacted business segments.