Exhibit 99.2

EARNINGS RELEASE FINANCIAL SUPPLEMENT
SECOND QUARTER 2024
| JPMORGAN CHASE & CO. | | |||||||||||||||||||||||||
| TABLE OF CONTENTS | ||||||||||||||||||||||||||
| Page(s) | ||||||||||||||||||||||||||
| Consolidated Results | ||||||||||||||||||||||||||
| Consolidated Financial Highlights | 2–3 | |||||||||||||||||||||||||
| Consolidated Statements of Income | 4 | |||||||||||||||||||||||||
| Consolidated Balance Sheets | 5 | |||||||||||||||||||||||||
| Condensed Average Balance Sheets and Annualized Yields | 6 | |||||||||||||||||||||||||
| Reconciliation from Reported to Managed Basis | 7 | |||||||||||||||||||||||||
| Segment Results - Managed Basis | 8 | |||||||||||||||||||||||||
| Capital and Other Selected Balance Sheet Items | 9–10 | |||||||||||||||||||||||||
| Earnings Per Share and Related Information | 11 | |||||||||||||||||||||||||
| Business Segment Results | ||||||||||||||||||||||||||
| Consumer & Community Banking (“CCB”) | 12–15 | |||||||||||||||||||||||||
| Commercial & Investment Bank (“CIB”) | 16–19 | |||||||||||||||||||||||||
| Asset & Wealth Management (“AWM”) | 20–22 | |||||||||||||||||||||||||
| Corporate | 23 | |||||||||||||||||||||||||
| Credit-Related Information | 24-27 | |||||||||||||||||||||||||
| Non-GAAP Financial Measures | 28 | |||||||||||||||||||||||||
| Business Segment Reorganization | 29 | |||||||||||||||||||||||||
| Glossary of Terms and Acronyms (a) | ||||||||||||||||||||||||||
(a) Refer to the Glossary of Terms and Acronyms on pages 315–321 of JPMorgan Chase & Co.’s (the “Firm’s”) Annual Report on Form 10-K for the year ended December 31, 2023 (the “2023 Form 10-K”).
| JPMORGAN CHASE & CO. | | ||||||||||||||||||||||||||||||||||||||||||||||||||||||||||||||||
| CONSOLIDATED FINANCIAL HIGHLIGHTS | |||||||||||||||||||||||||||||||||||||||||||||||||||||||||||||||||
| (in millions, except per share and ratio data) | |||||||||||||||||||||||||||||||||||||||||||||||||||||||||||||||||
| QUARTERLY TRENDS | SIX MONTHS ENDED JUNE 30, | ||||||||||||||||||||||||||||||||||||||||||||||||||||||||||||||||
| 2Q24 Change | 2024 Change | ||||||||||||||||||||||||||||||||||||||||||||||||||||||||||||||||
| SELECTED INCOME STATEMENT DATA | 2Q24 | 1Q24 | 4Q23 | 3Q23 | 2Q23 | 1Q24 | 2Q23 | 2024 | 2023 | 2023 | |||||||||||||||||||||||||||||||||||||||||||||||||||||||
| Reported Basis | |||||||||||||||||||||||||||||||||||||||||||||||||||||||||||||||||
| Total net revenue | $ | 50,200 | (f) | $ | 41,934 | $ | 38,574 | $ | 39,874 | $ | 41,307 | 20 | % | 22 | % | $ | 92,134 | $ | 79,656 | 16 | % | ||||||||||||||||||||||||||||||||||||||||||||
| Total noninterest expense | 23,713 | 22,757 | (h) | 24,486 | (h) | 21,757 | 20,822 | 4 | 14 | 46,470 | 40,929 | 14 | |||||||||||||||||||||||||||||||||||||||||||||||||||||
| Pre-provision profit (a) | 26,487 | 19,177 | 14,088 | 18,117 | 20,485 | 38 | 29 | 45,664 | 38,727 | 18 | |||||||||||||||||||||||||||||||||||||||||||||||||||||||
| Provision for credit losses | 3,052 | 1,884 | 2,762 | 1,384 | 2,899 | 62 | 5 | 4,936 | 5,174 | (5) | |||||||||||||||||||||||||||||||||||||||||||||||||||||||
| NET INCOME | 18,149 | 13,419 | 9,307 | 13,151 | 14,472 | 35 | 25 | 31,568 | 27,094 | 17 | |||||||||||||||||||||||||||||||||||||||||||||||||||||||
| Managed Basis (b) | |||||||||||||||||||||||||||||||||||||||||||||||||||||||||||||||||
| Total net revenue | 50,992 | (f) | 42,548 | 39,943 | 40,686 | 42,401 | 20 | 20 | 93,540 | 81,737 | 14 | ||||||||||||||||||||||||||||||||||||||||||||||||||||||
| Total noninterest expense | 23,713 | 22,757 | (h) | 24,486 | (h) | 21,757 | 20,822 | 4 | 14 | 46,470 | 40,929 | 14 | |||||||||||||||||||||||||||||||||||||||||||||||||||||
| Pre-provision profit (a) | 27,279 | 19,791 | 15,457 | 18,929 | 21,579 | 38 | 26 | 47,070 | 40,808 | 15 | |||||||||||||||||||||||||||||||||||||||||||||||||||||||
| Provision for credit losses | 3,052 | 1,884 | 2,762 | 1,384 | 2,899 | 62 | 5 | 4,936 | 5,174 | (5) | |||||||||||||||||||||||||||||||||||||||||||||||||||||||
| NET INCOME | 18,149 | 13,419 | 9,307 | 13,151 | 14,472 | 35 | 25 | 31,568 | 27,094 | 17 | |||||||||||||||||||||||||||||||||||||||||||||||||||||||
| EARNINGS PER SHARE DATA | |||||||||||||||||||||||||||||||||||||||||||||||||||||||||||||||||
| Net income: Basic | $ | 6.13 | $ | 4.45 | $ | 3.04 | $ | 4.33 | $ | 4.76 | 38 | 29 | $ | 10.58 | $ | 8.86 | 19 | ||||||||||||||||||||||||||||||||||||||||||||||||
| Diluted | 6.12 | 4.44 | 3.04 | 4.33 | 4.75 | 38 | 29 | 10.56 | 8.85 | 19 | |||||||||||||||||||||||||||||||||||||||||||||||||||||||
| Average shares: Basic | 2,889.8 | 2,908.3 | 2,914.4 | 2,927.5 | 2,943.8 | (1) | (2) | 2,899.1 | 2,956.1 | (2) | |||||||||||||||||||||||||||||||||||||||||||||||||||||||
| Diluted | 2,894.9 | 2,912.8 | 2,919.1 | 2,932.1 | 2,948.3 | (1) | (2) | 2,903.9 | 2,960.5 | (2) | |||||||||||||||||||||||||||||||||||||||||||||||||||||||
| MARKET AND PER COMMON SHARE DATA | |||||||||||||||||||||||||||||||||||||||||||||||||||||||||||||||||
| Market capitalization | $ | 575,463 | $ | 575,195 | $ | 489,320 | $ | 419,254 | $ | 422,661 | — | 36 | $ | 575,463 | $ | 422,661 | 36 | ||||||||||||||||||||||||||||||||||||||||||||||||
| Common shares at period-end | 2,845.1 | 2,871.6 | 2,876.6 | 2,891.0 | 2,906.1 | (1) | (2) | 2,845.1 | 2,906.1 | (2) | |||||||||||||||||||||||||||||||||||||||||||||||||||||||
| Book value per share | 111.29 | 106.81 | 104.45 | 100.30 | 98.11 | 4 | 13 | 111.29 | 98.11 | 13 | |||||||||||||||||||||||||||||||||||||||||||||||||||||||
| Tangible book value per share (“TBVPS”) (a) | 92.77 | 88.43 | 86.08 | 82.04 | 79.90 | 5 | 16 | 92.77 | 79.90 | 16 | |||||||||||||||||||||||||||||||||||||||||||||||||||||||
| Cash dividends declared per share | 1.15 | 1.15 | 1.05 | 1.05 | 1.00 | — | 15 | 2.30 | 2.00 | 15 | |||||||||||||||||||||||||||||||||||||||||||||||||||||||
| FINANCIAL RATIOS (c) | |||||||||||||||||||||||||||||||||||||||||||||||||||||||||||||||||
| Return on common equity (“ROE”) | 23 | % | 17 | % | 12 | % | 18 | % | 20 | % | 20 | % | 19 | % | |||||||||||||||||||||||||||||||||||||||||||||||||||
| Return on tangible common equity (“ROTCE”) (a) | 28 | 21 | 15 | 22 | 25 | 25 | 24 | ||||||||||||||||||||||||||||||||||||||||||||||||||||||||||
| Return on assets | 1.79 | 1.36 | 0.95 | 1.36 | 1.51 | 1.58 | 1.45 | ||||||||||||||||||||||||||||||||||||||||||||||||||||||||||
| CAPITAL RATIOS (d) | |||||||||||||||||||||||||||||||||||||||||||||||||||||||||||||||||
| Common equity Tier 1 (“CET1”) capital ratio (e) | 15.3 | % | (g) | 15.0 | % | 15.0 | % | 14.3 | % | 13.8 | % | 15.3 | % | (g) | 13.8 | % | |||||||||||||||||||||||||||||||||||||||||||||||||
| Tier 1 capital ratio (e) | 16.7 | (g) | 16.4 | 16.6 | 15.9 | 15.4 | 16.7 | (g) | 15.4 | ||||||||||||||||||||||||||||||||||||||||||||||||||||||||
| Total capital ratio (e) | 18.5 | (g) | 18.2 | 18.5 | 17.8 | 17.3 | 18.5 | (g) | 17.3 | ||||||||||||||||||||||||||||||||||||||||||||||||||||||||
| Tier 1 leverage ratio | 7.2 | (g) | 7.2 | 7.2 | 7.1 | 6.9 | 7.2 | (g) | 6.9 | ||||||||||||||||||||||||||||||||||||||||||||||||||||||||
| Supplementary leverage ratio (“SLR”) | 6.1 | (g) | 6.1 | 6.1 | 6.0 | 5.8 | 6.1 | (g) | 5.8 | ||||||||||||||||||||||||||||||||||||||||||||||||||||||||
On May 1, 2023, JPMorgan Chase acquired certain assets and assumed certain liabilities of First Republic Bank (the “First Republic acquisition") from the Federal Deposit Insurance Corporation (“FDIC”).
(a)Pre-provision profit, TBVPS and ROTCE are each non-GAAP financial measures. Tangible common equity (“TCE”) is also a non-GAAP financial measure; refer to page 10 for a reconciliation of common stockholders’ equity to TCE. Refer to page 28 for a further discussion of these measures.
(b)Refer to Reconciliation from Reported to Managed Basis on page 7 for a further discussion of managed basis.
(c)Ratios are based upon annualized amounts.
(d)The capital metrics reflect the Current Expected Credit Losses ("CECL") capital transition provisions. As of June 30, 2024 and March 31, 2024, CET1 capital reflected the remaining CECL benefit of $720 million; as of December 31, 2023, September 30, 2023, and June 30, 2023, CET1 capital reflected the benefit of $1.4 billion. Refer to Note 21 of the Firm’s Quarterly Report on Form 10-Q for the quarterly period ended March 31, 2024, and Note 27 of the Firm’s 2023 Form 10-K for additional information.
(e)Reflect the Firm’s ratios under the Basel III Standardized approach. Refer to page 9 for further information on the Firm’s capital metrics.
(f)Included a $7.9 billion net gain related to Visa shares. On April 8, 2024, Visa Inc. announced the commencement of an exchange offer for Visa Class B-1 common stock. On May 6, 2024, the Firm announced that Visa accepted the Firm’s tender of its 37.2 million shares of Visa Class B-1 common stock in exchange for a combination of Visa Class B-2 common stock and Visa Class C common stock. Visa’s acceptance resulted in a gain for the Firm relating to the Visa Class C common stock, which is held at fair value. Refer to pages 8 and 100 of JPMorgan Chase’s Quarterly Report on Form 10-Q for the quarter ended March 31, 2024 for further information.
(g)Estimated.
(h)Included the FDIC special assessment to recover estimated losses to the Deposit Insurance Fund of $725 million for the three months ended March 31, 2024, which reflects an adjustment to the $2.9 billion estimate recorded in the three months ended December 31, 2023. Refer to Note 6 on page 220 of the Firm’s 2023 Form 10-K for additional information.
Page 2
| JPMORGAN CHASE & CO. | | ||||||||||||||||||||||||||||||||||||||||||||||||||||||||||||||||
| CONSOLIDATED FINANCIAL HIGHLIGHTS, CONTINUED | |||||||||||||||||||||||||||||||||||||||||||||||||||||||||||||||||
| (in millions, except ratios, employee data and where otherwise noted) | |||||||||||||||||||||||||||||||||||||||||||||||||||||||||||||||||
| QUARTERLY TRENDS | SIX MONTHS ENDED JUNE 30, | ||||||||||||||||||||||||||||||||||||||||||||||||||||||||||||||||
| 2Q24 Change | 2024 Change | ||||||||||||||||||||||||||||||||||||||||||||||||||||||||||||||||
| 2Q24 | 1Q24 | 4Q23 | 3Q23 | 2Q23 | 1Q24 | 2Q23 | 2024 | 2023 | 2023 | ||||||||||||||||||||||||||||||||||||||||||||||||||||||||
| SELECTED BALANCE SHEET DATA (period-end) | |||||||||||||||||||||||||||||||||||||||||||||||||||||||||||||||||
| Total assets | $ | 4,143,003 | $ | 4,090,727 | $ | 3,875,393 | $ | 3,898,333 | $ | 3,868,240 | 1 | % | 7 | % | $ | 4,143,003 | $ | 3,868,240 | 7 | % | |||||||||||||||||||||||||||||||||||||||||||||
| Loans: | |||||||||||||||||||||||||||||||||||||||||||||||||||||||||||||||||
| Consumer, excluding credit card loans | 396,955 | 403,404 | 410,093 | 408,769 | 408,204 | (2) | (3) | 396,955 | 408,204 | (3) | |||||||||||||||||||||||||||||||||||||||||||||||||||||||
| Credit card loans | 216,100 | 206,740 | 211,123 | 196,935 | 191,348 | 5 | 13 | 216,100 | 191,348 | 13 | |||||||||||||||||||||||||||||||||||||||||||||||||||||||
| Wholesale loans | 707,645 | 699,472 | 702,490 | 704,355 | 700,517 | 1 | 1 | 707,645 | 700,517 | 1 | |||||||||||||||||||||||||||||||||||||||||||||||||||||||
| Total loans | 1,320,700 | 1,309,616 | 1,323,706 | 1,310,059 | 1,300,069 | 1 | 2 | 1,320,700 | 1,300,069 | 2 | |||||||||||||||||||||||||||||||||||||||||||||||||||||||
| Deposits: | |||||||||||||||||||||||||||||||||||||||||||||||||||||||||||||||||
| U.S. offices: | |||||||||||||||||||||||||||||||||||||||||||||||||||||||||||||||||
| Noninterest-bearing | 632,316 | 657,651 | 643,748 | 651,240 | 656,778 | (4) | (4) | 632,316 | 656,778 | (4) | |||||||||||||||||||||||||||||||||||||||||||||||||||||||
| Interest-bearing | 1,291,737 | 1,311,857 | 1,303,100 | 1,295,609 | 1,311,893 | (2) | (2) | 1,291,737 | 1,311,893 | (2) | |||||||||||||||||||||||||||||||||||||||||||||||||||||||
| Non-U.S. offices: | |||||||||||||||||||||||||||||||||||||||||||||||||||||||||||||||||
| Noninterest-bearing | 26,362 | 24,109 | 23,097 | 22,410 | 24,268 | 9 | 9 | 26,362 | 24,268 | 9 | |||||||||||||||||||||||||||||||||||||||||||||||||||||||
| Interest-bearing | 446,115 | 434,792 | 430,743 | 410,267 | 406,023 | 3 | 10 | 446,115 | 406,023 | 10 | |||||||||||||||||||||||||||||||||||||||||||||||||||||||
| Total deposits | 2,396,530 | 2,428,409 | 2,400,688 | 2,379,526 | 2,398,962 | (1) | — | 2,396,530 | 2,398,962 | — | |||||||||||||||||||||||||||||||||||||||||||||||||||||||
| Long-term debt | 394,028 | 395,872 | 391,825 | 362,793 | 364,078 | — | 8 | 394,028 | 364,078 | 8 | |||||||||||||||||||||||||||||||||||||||||||||||||||||||
| Common stockholders’ equity | 316,652 | 306,737 | 300,474 | 289,967 | 285,112 | 3 | 11 | 316,652 | 285,112 | 11 | |||||||||||||||||||||||||||||||||||||||||||||||||||||||
| Total stockholders’ equity | 340,552 | 336,637 | 327,878 | 317,371 | 312,516 | 1 | 9 | 340,552 | 312,516 | 9 | |||||||||||||||||||||||||||||||||||||||||||||||||||||||
| Loans-to-deposits ratio | 55 | % | 54 | % | 55 | % | 55 | % | 54 | % | 55 | % | 54 | % | |||||||||||||||||||||||||||||||||||||||||||||||||||
| Employees | 313,206 | 311,921 | 309,926 | 308,669 | 300,066 | — | 4 | 313,206 | 300,066 | 4 | |||||||||||||||||||||||||||||||||||||||||||||||||||||||
| 95% CONFIDENCE LEVEL - TOTAL VaR | |||||||||||||||||||||||||||||||||||||||||||||||||||||||||||||||||
| Average VaR (a) | $ | 56 | $ | 48 | $ | 35 | $ | 41 | $ | 47 | 17 | 19 | |||||||||||||||||||||||||||||||||||||||||||||||||||||
| LINE OF BUSINESS NET REVENUE (b) | |||||||||||||||||||||||||||||||||||||||||||||||||||||||||||||||||
| Consumer & Community Banking | $ | 17,701 | $ | 17,653 | $ | 18,097 | $ | 18,362 | $ | 17,233 | — | 3 | $ | 35,354 | $ | 33,689 | 5 | ||||||||||||||||||||||||||||||||||||||||||||||||
| Commercial & Investment Bank (c) | 17,917 | 17,584 | 14,974 | 15,761 | 16,507 | 2 | 9 | 35,501 | 33,618 | 6 | |||||||||||||||||||||||||||||||||||||||||||||||||||||||
| Asset & Wealth Management | 5,252 | 5,109 | 5,095 | 5,005 | 4,943 | 3 | 6 | 10,361 | 9,727 | 7 | |||||||||||||||||||||||||||||||||||||||||||||||||||||||
| Corporate | 10,122 | 2,202 | 1,777 | 1,558 | 3,718 | 360 | 172 | 12,324 | 4,703 | 162 | |||||||||||||||||||||||||||||||||||||||||||||||||||||||
| TOTAL NET REVENUE | $ | 50,992 | $ | 42,548 | $ | 39,943 | $ | 40,686 | $ | 42,401 | 20 | 20 | $ | 93,540 | $ | 81,737 | 14 | ||||||||||||||||||||||||||||||||||||||||||||||||
| LINE OF BUSINESS NET INCOME/(LOSS) | |||||||||||||||||||||||||||||||||||||||||||||||||||||||||||||||||
| Consumer & Community Banking | $ | 4,210 | $ | 4,831 | $ | 4,788 | $ | 5,895 | $ | 5,306 | (13) | (21) | $ | 9,041 | $ | 10,549 | (14) | ||||||||||||||||||||||||||||||||||||||||||||||||
| Commercial & Investment Bank (c) | 5,897 | 6,622 | 4,177 | 5,027 | 5,300 | (11) | 11 | 12,519 | 11,068 | 13 | |||||||||||||||||||||||||||||||||||||||||||||||||||||||
| Asset & Wealth Management | 1,263 | 1,290 | 1,217 | 1,417 | 1,226 | (2) | 3 | 2,553 | 2,593 | (2) | |||||||||||||||||||||||||||||||||||||||||||||||||||||||
| Corporate | 6,779 | 676 | (875) | 812 | 2,640 | NM | 157 | 7,455 | 2,884 | 158 | |||||||||||||||||||||||||||||||||||||||||||||||||||||||
| NET INCOME | $ | 18,149 | $ | 13,419 | $ | 9,307 | $ | 13,151 | $ | 14,472 | 35 | 25 | $ | 31,568 | $ | 27,094 | 17 | ||||||||||||||||||||||||||||||||||||||||||||||||
On May 1, 2023, JPMorgan Chase acquired certain assets and assumed certain liabilities of First Republic Bank from the FDIC.
(a)Refer to Commercial & Investment Bank VaR on page 18 for further information.
(b)Refer to Reconciliation from Reported to Managed Basis on page 7 for a further discussion of managed basis.
(c)Effective in the second quarter of 2024, the Firm reorganized its reportable business segments by combining the former Corporate & Investment Bank and Commercial Banking business segments to form one segment, the Commercial & Investment Bank ("CIB"). Refer to Business Segment Reorganization on page 29 for further information.
Page 3
| JPMORGAN CHASE & CO. | | ||||||||||||||||||||||||||||||||||||||||||||||||||||||||||||||||
| CONSOLIDATED STATEMENTS OF INCOME | |||||||||||||||||||||||||||||||||||||||||||||||||||||||||||||||||
| (in millions, except per share and ratio data) | |||||||||||||||||||||||||||||||||||||||||||||||||||||||||||||||||
| QUARTERLY TRENDS | SIX MONTHS ENDED JUNE 30, | ||||||||||||||||||||||||||||||||||||||||||||||||||||||||||||||||
| 2Q24 Change | 2024 Change | ||||||||||||||||||||||||||||||||||||||||||||||||||||||||||||||||
| REVENUE | 2Q24 | 1Q24 | 4Q23 | 3Q23 | 2Q23 | 1Q24 | 2Q23 | 2024 | 2023 | 2023 | |||||||||||||||||||||||||||||||||||||||||||||||||||||||
| Investment banking fees | $ | 2,304 | $ | 1,954 | $ | 1,635 | $ | 1,722 | $ | 1,513 | 18 | % | 52 | % | $ | 4,258 | $ | 3,162 | 35 | % | |||||||||||||||||||||||||||||||||||||||||||||
| Principal transactions | 6,814 | 6,790 | 3,725 | 6,210 | 6,910 | — | (1) | 13,604 | 14,525 | (6) | |||||||||||||||||||||||||||||||||||||||||||||||||||||||
| Lending- and deposit-related fees | 1,828 | 1,902 | 1,926 | 2,039 | 1,828 | (4) | — | 3,730 | 3,448 | 8 | |||||||||||||||||||||||||||||||||||||||||||||||||||||||
| Asset management fees | 4,302 | 4,146 | 4,077 | 3,904 | 3,774 | 4 | 14 | 8,448 | 7,239 | 17 | |||||||||||||||||||||||||||||||||||||||||||||||||||||||
| Commissions and other fees | 1,924 | 1,805 | 1,697 | 1,705 | 1,739 | 7 | 11 | 3,729 | 3,434 | 9 | |||||||||||||||||||||||||||||||||||||||||||||||||||||||
| Investment securities losses | (547) | (366) | (743) | (669) | (900) | (49) | 39 | (913) | (1,768) | 48 | |||||||||||||||||||||||||||||||||||||||||||||||||||||||
| Mortgage fees and related income | 348 | 275 | 263 | 414 | 278 | 27 | 25 | 623 | 499 | 25 | |||||||||||||||||||||||||||||||||||||||||||||||||||||||
| Card income | 1,332 | 1,218 | 1,247 | 1,209 | 1,094 | 9 | 22 | 2,550 | 2,328 | 10 | |||||||||||||||||||||||||||||||||||||||||||||||||||||||
| Other income (a) | 9,149 | (e) | 1,128 | 696 | 614 | 3,292 | NM | 178 | 10,277 | (e) | 4,299 | 139 | |||||||||||||||||||||||||||||||||||||||||||||||||||||
| Noninterest revenue | 27,454 | 18,852 | 14,523 | 17,148 | 19,528 | 46 | 41 | 46,306 | 37,166 | 25 | |||||||||||||||||||||||||||||||||||||||||||||||||||||||
| Interest income | 48,513 | 47,438 | 47,384 | 44,556 | 41,644 | 2 | 16 | 95,951 | 78,648 | 22 | |||||||||||||||||||||||||||||||||||||||||||||||||||||||
| Interest expense | 25,767 | 24,356 | 23,333 | 21,830 | 19,865 | 6 | 30 | 50,123 | 36,158 | 39 | |||||||||||||||||||||||||||||||||||||||||||||||||||||||
| Net interest income | 22,746 | 23,082 | 24,051 | 22,726 | 21,779 | (1) | 4 | 45,828 | 42,490 | 8 | |||||||||||||||||||||||||||||||||||||||||||||||||||||||
| TOTAL NET REVENUE | 50,200 | 41,934 | 38,574 | 39,874 | 41,307 | 20 | 22 | 92,134 | 79,656 | 16 | |||||||||||||||||||||||||||||||||||||||||||||||||||||||
| Provision for credit losses | 3,052 | 1,884 | 2,762 | 1,384 | 2,899 | 62 | 5 | 4,936 | 5,174 | (5) | |||||||||||||||||||||||||||||||||||||||||||||||||||||||
| NONINTEREST EXPENSE | |||||||||||||||||||||||||||||||||||||||||||||||||||||||||||||||||
| Compensation expense | 12,953 | 13,118 | 11,847 | 11,726 | 11,216 | (1) | 15 | 26,071 | 22,892 | 14 | |||||||||||||||||||||||||||||||||||||||||||||||||||||||
| Occupancy expense | 1,248 | 1,211 | 1,208 | 1,197 | 1,070 | 3 | 17 | 2,459 | 2,185 | 13 | |||||||||||||||||||||||||||||||||||||||||||||||||||||||
| Technology, communications and equipment expense | 2,447 | 2,421 | 2,409 | 2,386 | 2,267 | 1 | 8 | 4,868 | 4,451 | 9 | |||||||||||||||||||||||||||||||||||||||||||||||||||||||
| Professional and outside services | 2,722 | 2,548 | 2,606 | 2,620 | 2,561 | 7 | 6 | 5,270 | 5,009 | 5 | |||||||||||||||||||||||||||||||||||||||||||||||||||||||
| Marketing | 1,221 | 1,160 | 1,298 | 1,126 | 1,122 | 5 | 9 | 2,381 | 2,167 | 10 | |||||||||||||||||||||||||||||||||||||||||||||||||||||||
| Other expense (b) | 3,122 | (f) | 2,299 | (g) | 5,118 | (g) | 2,702 | 2,586 | 36 | 21 | 5,421 | (f)(g) | 4,225 | 28 | |||||||||||||||||||||||||||||||||||||||||||||||||||
| TOTAL NONINTEREST EXPENSE | 23,713 | 22,757 | 24,486 | 21,757 | 20,822 | 4 | 14 | 46,470 | 40,929 | 14 | |||||||||||||||||||||||||||||||||||||||||||||||||||||||
| Income before income tax expense | 23,435 | 17,293 | 11,326 | 16,733 | 17,586 | 36 | 33 | 40,728 | 33,553 | 21 | |||||||||||||||||||||||||||||||||||||||||||||||||||||||
| Income tax expense (a) | 5,286 | 3,874 | 2,019 | (h) | 3,582 | 3,114 | 36 | 70 | 9,160 | 6,459 | 42 | ||||||||||||||||||||||||||||||||||||||||||||||||||||||
| NET INCOME | $ | 18,149 | $ | 13,419 | $ | 9,307 | $ | 13,151 | $ | 14,472 | 35 | 25 | $ | 31,568 | $ | 27,094 | 17 | ||||||||||||||||||||||||||||||||||||||||||||||||
| NET INCOME PER COMMON SHARE DATA | |||||||||||||||||||||||||||||||||||||||||||||||||||||||||||||||||
| Basic earnings per share | $ | 6.13 | $ | 4.45 | $ | 3.04 | $ | 4.33 | $ | 4.76 | 38 | 29 | $ | 10.58 | $ | 8.86 | 19 | ||||||||||||||||||||||||||||||||||||||||||||||||
| Diluted earnings per share | 6.12 | 4.44 | 3.04 | 4.33 | 4.75 | 38 | 29 | 10.56 | 8.85 | 19 | |||||||||||||||||||||||||||||||||||||||||||||||||||||||
| FINANCIAL RATIOS | |||||||||||||||||||||||||||||||||||||||||||||||||||||||||||||||||
| Return on common equity (c) | 23 | % | 17 | % | 12 | % | 18 | % | 20 | % | 20 | % | 19 | % | |||||||||||||||||||||||||||||||||||||||||||||||||||
| Return on tangible common equity (c)(d) | 28 | 21 | 15 | 22 | 25 | 25 | 24 | ||||||||||||||||||||||||||||||||||||||||||||||||||||||||||
| Return on assets (c) | 1.79 | 1.36 | 0.95 | 1.36 | 1.51 | 1.58 | 1.45 | ||||||||||||||||||||||||||||||||||||||||||||||||||||||||||
| Effective income tax rate | 22.6 | 22.4 | 17.8 | (h) | 21.4 | 17.7 | 22.5 | 19.3 | |||||||||||||||||||||||||||||||||||||||||||||||||||||||||
| Overhead ratio | 47 | 54 | 63 | 55 | 50 | 50 | 51 | ||||||||||||||||||||||||||||||||||||||||||||||||||||||||||
On May 1, 2023, JPMorgan Chase acquired certain assets and assumed certain liabilities of First Republic Bank from the FDIC.
(a)Effective January 1, 2024, the Firm adopted updates to the Accounting for Investments in Tax Credit Structures Using the Proportional Amortization Method guidance, under the modified retrospective method. The adoption of this guidance resulted in a change to the classification and timing of the amortization associated with certain of the Firm’s alternative energy tax-oriented investments. The amortization of these investments that was previously recognized in other income is now recognized in income tax expense, which aligns with the associated tax credits and other tax benefits. The change in accounting increased the Firm’s income tax expense for the three months ended March, 31, 2024, by approximately $450 million, with no material impact to net income.
(b)Included Firmwide legal expense of $317 million, $(72) million, $175 million, $665 million and $420 million for the three months ended June 30, 2024, March 31, 2024, December 31, 2023, September 30, 2023 and June 30, 2023, respectively, and $245 million and $596 million for the six months ended June 30, 2024 and June 30, 2023 respectively.
(c)Ratios are based upon annualized amounts.
(d)Refer to page 28 for a further discussion of ROTCE.
(e)Included a $7.9 billion net gain related to Visa shares. Refer to footnote (f) on page 2 for further information.
(f)Included a $1.0 billion donation of Visa shares to pre-fund contributions to the JPMorgan Chase Foundation.
(g)Included an FDIC special assessment to recover estimated losses to the Deposit Insurance Fund of $725 million for the three months ended March 31, 2024, which was an adjustment to the $2.9 billion estimate recorded in the three months ended December 31, 2023. Refer to Note 6 on page 220 of the Firm’s 2023 Form 10-K for additional information.
(h)Included an income tax benefit of $463 million for the three months ended December 31, 2023, related to the finalization of certain income tax regulations. The benefit resulted in a reduction in the Firm’s effective tax rate of 4.1 percentage points in the fourth quarter of 2023.
Page 4
| JPMORGAN CHASE & CO. | | |||||||||||||||||||||||||||||||||||||||||||
| CONSOLIDATED BALANCE SHEETS | ||||||||||||||||||||||||||||||||||||||||||||
| (in millions) | ||||||||||||||||||||||||||||||||||||||||||||
| Jun 30, 2024 | ||||||||||||||||||||||||||||||||||||||||||||
| Change | ||||||||||||||||||||||||||||||||||||||||||||
| Jun 30, | Mar 31, | Dec 31, | Sep 30, | Jun 30, | Mar 31, | Jun 30, | ||||||||||||||||||||||||||||||||||||||
| 2024 | 2024 | 2023 | 2023 | 2023 | 2024 | 2023 | ||||||||||||||||||||||||||||||||||||||
| ASSETS | ||||||||||||||||||||||||||||||||||||||||||||
| Cash and due from banks | $ | 27,265 | $ | 22,750 | $ | 29,066 | $ | 24,921 | $ | 26,064 | 20 | % | 5 | % | ||||||||||||||||||||||||||||||
| Deposits with banks | 503,554 | 539,366 | 595,085 | 486,448 | 469,059 | (7) | 7 | |||||||||||||||||||||||||||||||||||||
| Federal funds sold and securities purchased under | ||||||||||||||||||||||||||||||||||||||||||||
| resale agreements | 392,763 | 330,559 | 276,152 | 350,059 | 325,628 | 19 | 21 | |||||||||||||||||||||||||||||||||||||
| Securities borrowed | 199,062 | 198,336 | 200,436 | 188,279 | 163,563 | — | 22 | |||||||||||||||||||||||||||||||||||||
| Trading assets: | ||||||||||||||||||||||||||||||||||||||||||||
| Debt and equity instruments | 679,209 | 697,788 | 485,743 | 534,923 | 572,779 | (3) | 19 | |||||||||||||||||||||||||||||||||||||
| Derivative receivables | 54,673 | 56,621 | 54,864 | 67,070 | 64,217 | (3) | (15) | |||||||||||||||||||||||||||||||||||||
| Available-for-sale (“AFS”) securities | 266,252 | 236,152 | 201,704 | 197,119 | 203,262 | 13 | 31 | |||||||||||||||||||||||||||||||||||||
| Held-to-maturity (”HTM”) securities | 323,746 | 334,527 | 369,848 | 388,261 | 408,941 | (3) | (21) | |||||||||||||||||||||||||||||||||||||
| Investment securities, net of allowance for credit losses | 589,998 | 570,679 | 571,552 | 585,380 | 612,203 | 3 | (4) | |||||||||||||||||||||||||||||||||||||
| Loans | 1,320,700 | 1,309,616 | 1,323,706 | 1,310,059 | 1,300,069 | 1 | 2 | |||||||||||||||||||||||||||||||||||||
| Less: Allowance for loan losses | 22,991 | 22,351 | 22,420 | 21,946 | 21,980 | 3 | 5 | |||||||||||||||||||||||||||||||||||||
| Loans, net of allowance for loan losses | 1,297,709 | 1,287,265 | 1,301,286 | 1,288,113 | 1,278,089 | 1 | 2 | |||||||||||||||||||||||||||||||||||||
| Accrued interest and accounts receivable | 135,692 | 129,823 | 107,363 | 127,752 | 111,561 | 5 | 22 | |||||||||||||||||||||||||||||||||||||
| Premises and equipment | 30,582 | 30,279 | 30,157 | 29,677 | 29,493 | 1 | 4 | |||||||||||||||||||||||||||||||||||||
| Goodwill, MSRs and other intangible assets | 64,525 | 64,374 | 64,381 | 64,910 | 64,238 | — | — | |||||||||||||||||||||||||||||||||||||
| Other assets | 167,971 | 162,887 | 159,308 | 150,801 | 151,346 | 3 | 11 | |||||||||||||||||||||||||||||||||||||
| TOTAL ASSETS | $ | 4,143,003 | $ | 4,090,727 | $ | 3,875,393 | $ | 3,898,333 | $ | 3,868,240 | 1 | 7 | ||||||||||||||||||||||||||||||||
| LIABILITIES | ||||||||||||||||||||||||||||||||||||||||||||
| Deposits | $ | 2,396,530 | $ | 2,428,409 | $ | 2,400,688 | $ | 2,379,526 | $ | 2,398,962 | (1) | — | ||||||||||||||||||||||||||||||||
| Federal funds purchased and securities loaned or sold | ||||||||||||||||||||||||||||||||||||||||||||
| under repurchase agreements | 400,832 | 325,670 | 216,535 | 268,750 | 266,272 | 23 | 51 | |||||||||||||||||||||||||||||||||||||
| Short-term borrowings | 47,308 | 46,268 | 44,712 | 45,470 | 41,022 | 2 | 15 | |||||||||||||||||||||||||||||||||||||
| Trading liabilities: | ||||||||||||||||||||||||||||||||||||||||||||
| Debt and equity instruments | 206,018 | 192,324 | 139,581 | 165,494 | 132,264 | 7 | 56 | |||||||||||||||||||||||||||||||||||||
| Derivative payables | 34,818 | 36,003 | 40,847 | 41,963 | 46,545 | (3) | (25) | |||||||||||||||||||||||||||||||||||||
| Accounts payable and other liabilities | 295,813 | 301,469 | 290,307 | 292,070 | 286,934 | (2) | 3 | |||||||||||||||||||||||||||||||||||||
| Beneficial interests issued by consolidated VIEs | 27,104 | 28,075 | 23,020 | 24,896 | 19,647 | (3) | 38 | |||||||||||||||||||||||||||||||||||||
| Long-term debt | 394,028 | 395,872 | 391,825 | 362,793 | 364,078 | — | 8 | |||||||||||||||||||||||||||||||||||||
| TOTAL LIABILITIES | 3,802,451 | 3,754,090 | 3,547,515 | 3,580,962 | 3,555,724 | 1 | 7 | |||||||||||||||||||||||||||||||||||||
| STOCKHOLDERS’ EQUITY | ||||||||||||||||||||||||||||||||||||||||||||
| Preferred stock | 23,900 | 29,900 | 27,404 | 27,404 | 27,404 | (20) | (13) | |||||||||||||||||||||||||||||||||||||
| Common stock | 4,105 | 4,105 | 4,105 | 4,105 | 4,105 | — | — | |||||||||||||||||||||||||||||||||||||
| Additional paid-in capital | 90,328 | 89,903 | 90,128 | 89,899 | 89,578 | — | 1 | |||||||||||||||||||||||||||||||||||||
| Retained earnings | 356,924 | 342,414 | 332,901 | 327,044 | 317,359 | 4 | 12 | |||||||||||||||||||||||||||||||||||||
| Accumulated other comprehensive income/(loss) (“AOCI”) | (11,338) | (11,639) | (10,443) | (17,104) | (14,290) | 3 | 21 | |||||||||||||||||||||||||||||||||||||
| Treasury stock, at cost | (123,367) | (118,046) | (116,217) | (113,977) | (111,640) | (5) | (11) | |||||||||||||||||||||||||||||||||||||
| TOTAL STOCKHOLDERS’ EQUITY | 340,552 | 336,637 | 327,878 | 317,371 | 312,516 | 1 | 9 | |||||||||||||||||||||||||||||||||||||
| TOTAL LIABILITIES AND STOCKHOLDERS’ EQUITY | $ | 4,143,003 | $ | 4,090,727 | $ | 3,875,393 | $ | 3,898,333 | $ | 3,868,240 | 1 | 7 | ||||||||||||||||||||||||||||||||
On May 1, 2023, JPMorgan Chase acquired certain assets and assumed certain liabilities of First Republic Bank from the FDIC.
Page 5
| JPMORGAN CHASE & CO. | | ||||||||||||||||||||||||||||||||||||||||||||||||||||||||||||||||
| CONDENSED AVERAGE BALANCE SHEETS AND ANNUALIZED YIELDS | |||||||||||||||||||||||||||||||||||||||||||||||||||||||||||||||||
| (in millions, except rates) | |||||||||||||||||||||||||||||||||||||||||||||||||||||||||||||||||
| QUARTERLY TRENDS | SIX MONTHS ENDED JUNE 30, | ||||||||||||||||||||||||||||||||||||||||||||||||||||||||||||||||
| 2Q24 Change | 2024 Change | ||||||||||||||||||||||||||||||||||||||||||||||||||||||||||||||||
| AVERAGE BALANCES | 2Q24 | 1Q24 | 4Q23 | 3Q23 | 2Q23 | 1Q24 | 2Q23 | 2024 | 2023 | 2023 | |||||||||||||||||||||||||||||||||||||||||||||||||||||||
| ASSETS | |||||||||||||||||||||||||||||||||||||||||||||||||||||||||||||||||
| Deposits with banks | $ | 512,150 | $ | 535,708 | $ | 540,040 | $ | 456,954 | $ | 495,018 | (4) | % | 3 | % | $ | 523,929 | $ | 500,311 | 5 | % | |||||||||||||||||||||||||||||||||||||||||||||
| Federal funds sold and securities purchased under resale agreements | 370,817 | 323,988 | 319,056 | 309,848 | 326,563 | 14 | 14 | 347,402 | 319,911 | 9 | |||||||||||||||||||||||||||||||||||||||||||||||||||||||
| Securities borrowed | 195,877 | 192,545 | 200,369 | 188,279 | 191,393 | 2 | 2 | 194,211 | 192,114 | 1 | |||||||||||||||||||||||||||||||||||||||||||||||||||||||
| Trading assets - debt instruments | 452,933 | 422,516 | 374,254 | 383,576 | 391,945 | 7 | 16 | 437,725 | 374,908 | 17 | |||||||||||||||||||||||||||||||||||||||||||||||||||||||
| Investment securities | 580,044 | 580,046 | 579,450 | 606,593 | 611,552 | — | (5) | 580,045 | 616,772 | (6) | |||||||||||||||||||||||||||||||||||||||||||||||||||||||
| Loans | 1,313,085 | 1,311,578 | 1,315,439 | 1,306,322 | 1,238,237 | — | 6 | 1,312,332 | 1,184,231 | 11 | |||||||||||||||||||||||||||||||||||||||||||||||||||||||
| All other interest-earning assets (a) | 84,819 | 79,134 | 79,787 | 80,156 | 89,072 | 7 | (5) | 81,976 | 92,372 | (11) | |||||||||||||||||||||||||||||||||||||||||||||||||||||||
| Total interest-earning assets | 3,509,725 | 3,445,515 | 3,408,395 | 3,331,728 | 3,343,780 | 2 | 5 | 3,477,620 | 3,280,619 | 6 | |||||||||||||||||||||||||||||||||||||||||||||||||||||||
| Trading assets - equity and other instruments | 221,382 | 190,783 | 144,642 | 173,998 | 169,558 | 16 | 31 | 206,082 | 160,868 | 28 | |||||||||||||||||||||||||||||||||||||||||||||||||||||||
| Trading assets - derivative receivables | 57,175 | 57,635 | 62,069 | 66,972 | 63,339 | (1) | (10) | 57,405 | 63,929 | (10) | |||||||||||||||||||||||||||||||||||||||||||||||||||||||
| All other noninterest-earning assets | 283,161 | 274,704 | 270,526 | 267,079 | 274,711 | 3 | 3 | 278,933 | 275,657 | 1 | |||||||||||||||||||||||||||||||||||||||||||||||||||||||
| TOTAL ASSETS | $ | 4,071,443 | $ | 3,968,637 | $ | 3,885,632 | $ | 3,839,777 | $ | 3,851,388 | 3 | 6 | $ | 4,020,040 | $ | 3,781,073 | 6 | ||||||||||||||||||||||||||||||||||||||||||||||||
| LIABILITIES | |||||||||||||||||||||||||||||||||||||||||||||||||||||||||||||||||
| Interest-bearing deposits | $ | 1,722,856 | $ | 1,726,142 | $ | 1,713,189 | $ | 1,694,758 | $ | 1,715,699 | — | — | $ | 1,724,499 | $ | 1,692,993 | 2 | ||||||||||||||||||||||||||||||||||||||||||||||||
| Federal funds purchased and securities loaned or | |||||||||||||||||||||||||||||||||||||||||||||||||||||||||||||||||
| sold under repurchase agreements | 375,371 | 294,983 | 254,211 | 254,105 | 263,718 | 27 | 42 | 335,177 | 258,045 | 30 | |||||||||||||||||||||||||||||||||||||||||||||||||||||||
| Short-term borrowings | 38,234 | 38,529 | 37,941 | 37,837 | 35,335 | (1) | 8 | 38,381 | 37,039 | 4 | |||||||||||||||||||||||||||||||||||||||||||||||||||||||
| Trading liabilities - debt and all other interest-bearing liabilities (b) | 318,703 | 302,997 | 287,443 | 288,007 | 293,269 | 5 | 9 | 310,849 | 285,467 | 9 | |||||||||||||||||||||||||||||||||||||||||||||||||||||||
| Beneficial interests issued by consolidated VIEs | 26,222 | 27,407 | 23,133 | 21,890 | 15,947 | (4) | 64 | 26,815 | 14,722 | 82 | |||||||||||||||||||||||||||||||||||||||||||||||||||||||
| Long-term debt | 342,516 | 340,411 | 325,843 | 315,267 | 294,239 | 1 | 16 | 341,464 | 271,912 | 26 | |||||||||||||||||||||||||||||||||||||||||||||||||||||||
| Total interest-bearing liabilities | 2,823,902 | 2,730,469 | 2,641,760 | 2,611,864 | 2,618,207 | 3 | 8 | 2,777,185 | 2,560,178 | 8 | |||||||||||||||||||||||||||||||||||||||||||||||||||||||
| Noninterest-bearing deposits | 648,327 | 648,644 | 658,912 | 660,983 | 671,715 | — | (3) | 648,486 | 661,138 | (2) | |||||||||||||||||||||||||||||||||||||||||||||||||||||||
| Trading liabilities - equity and other instruments | 30,456 | 28,622 | 34,176 | 29,508 | 28,513 | 6 | 7 | 29,539 | 29,137 | 1 | |||||||||||||||||||||||||||||||||||||||||||||||||||||||
| Trading liabilities - derivative payables | 37,538 | 39,877 | 42,447 | 46,754 | 46,934 | (6) | (20) | 38,707 | 48,139 | (20) | |||||||||||||||||||||||||||||||||||||||||||||||||||||||
| All other noninterest-bearing liabilities | 196,590 | 192,796 | 186,871 | 178,466 | 180,730 | 2 | 9 | 194,694 | 180,517 | 8 | |||||||||||||||||||||||||||||||||||||||||||||||||||||||
| TOTAL LIABILITIES | 3,736,813 | 3,640,408 | 3,564,166 | 3,527,575 | 3,546,099 | 3 | 5 | 3,688,611 | 3,479,109 | 6 | |||||||||||||||||||||||||||||||||||||||||||||||||||||||
| Preferred stock | 25,867 | 27,952 | 27,404 | 27,404 | 27,404 | (7) | (6) | 26,910 | 27,404 | (2) | |||||||||||||||||||||||||||||||||||||||||||||||||||||||
| Common stockholders’ equity | 308,763 | 300,277 | 294,062 | 284,798 | 277,885 | 3 | 11 | 304,519 | 274,560 | 11 | |||||||||||||||||||||||||||||||||||||||||||||||||||||||
| TOTAL STOCKHOLDERS’ EQUITY | 334,630 | 328,229 | 321,466 | 312,202 | 305,289 | 2 | 10 | 331,429 | 301,964 | 10 | |||||||||||||||||||||||||||||||||||||||||||||||||||||||
| TOTAL LIABILITIES AND STOCKHOLDERS’ EQUITY | $ | 4,071,443 | $ | 3,968,637 | $ | 3,885,632 | $ | 3,839,777 | $ | 3,851,388 | 3 | 6 | $ | 4,020,040 | $ | 3,781,073 | 6 | ||||||||||||||||||||||||||||||||||||||||||||||||
| AVERAGE RATES (c) | |||||||||||||||||||||||||||||||||||||||||||||||||||||||||||||||||
| INTEREST-EARNING ASSETS | |||||||||||||||||||||||||||||||||||||||||||||||||||||||||||||||||
| Deposits with banks | 4.76 | % | 4.79 | % | 4.79 | % | 4.58 | % | 4.20 | % | 4.78 | % | 4.03 | % | |||||||||||||||||||||||||||||||||||||||||||||||||||
| Federal funds sold and securities purchased under resale agreements | 5.23 | 5.23 | 5.26 | 5.06 | 4.63 | 5.23 | 4.35 | ||||||||||||||||||||||||||||||||||||||||||||||||||||||||||
| Securities borrowed | 4.47 | 4.52 | 4.59 | 4.39 | 3.91 | 4.50 | 3.76 | ||||||||||||||||||||||||||||||||||||||||||||||||||||||||||
| Trading assets - debt instruments | 4.44 | 4.38 | 4.39 | 4.32 | 4.12 | 4.41 | 4.13 | ||||||||||||||||||||||||||||||||||||||||||||||||||||||||||
| Investment securities | 3.80 | 3.64 | 3.53 | 3.23 | 3.01 | 3.72 | 2.90 | ||||||||||||||||||||||||||||||||||||||||||||||||||||||||||
| Loans | 7.03 | 7.03 | 6.97 | 6.79 | 6.59 | 7.03 | 6.49 | ||||||||||||||||||||||||||||||||||||||||||||||||||||||||||
| All other interest-earning assets (a)(d) | 10.14 | 10.22 | 10.10 | 9.42 | 8.85 | 10.18 | 8.15 | ||||||||||||||||||||||||||||||||||||||||||||||||||||||||||
| Total interest-earning assets | 5.57 | 5.55 | 5.53 | 5.32 | 5.01 | 5.56 | 4.85 | ||||||||||||||||||||||||||||||||||||||||||||||||||||||||||
| INTEREST-BEARING LIABILITIES | |||||||||||||||||||||||||||||||||||||||||||||||||||||||||||||||||
| Interest-bearing deposits | 2.90 | 2.85 | 2.78 | 2.53 | 2.24 | 2.88 | 2.05 | ||||||||||||||||||||||||||||||||||||||||||||||||||||||||||
| Federal funds purchased and securities loaned or | |||||||||||||||||||||||||||||||||||||||||||||||||||||||||||||||||
| sold under repurchase agreements | 5.47 | 5.41 | 5.51 | 5.50 | 5.17 | 5.45 | 4.85 | ||||||||||||||||||||||||||||||||||||||||||||||||||||||||||
| Short-term borrowings | 5.27 | 5.57 | 5.55 | 5.38 | 4.87 | 5.42 | 4.63 | ||||||||||||||||||||||||||||||||||||||||||||||||||||||||||
| Trading liabilities - debt and all other interest-bearing liabilities (b) | 3.29 | 3.50 | 3.58 | 3.39 | 3.25 | 3.39 | 3.07 | ||||||||||||||||||||||||||||||||||||||||||||||||||||||||||
| Beneficial interests issued by consolidated VIEs | 5.40 | 5.34 | 5.36 | 5.38 | 4.95 | 5.37 | 4.71 | ||||||||||||||||||||||||||||||||||||||||||||||||||||||||||
| Long-term debt | 5.61 | 5.46 | 5.33 | 5.33 | 5.28 | 5.53 | 5.33 | ||||||||||||||||||||||||||||||||||||||||||||||||||||||||||
| Total interest-bearing liabilities | 3.67 | 3.59 | 3.50 | 3.32 | 3.04 | 3.63 | 2.85 | ||||||||||||||||||||||||||||||||||||||||||||||||||||||||||
| INTEREST RATE SPREAD | 1.90 | 1.96 | 2.03 | 2.00 | 1.97 | 1.93 | 2.00 | ||||||||||||||||||||||||||||||||||||||||||||||||||||||||||
| NET YIELD ON INTEREST-EARNING ASSETS | 2.62 | 2.71 | 2.81 | 2.72 | 2.62 | 2.66 | 2.63 | ||||||||||||||||||||||||||||||||||||||||||||||||||||||||||
| Memo: Net yield on interest-earning assets excluding Markets (e) | 3.86 | 3.83 | 3.86 | 3.89 | 3.83 | 3.85 | 3.82 | ||||||||||||||||||||||||||||||||||||||||||||||||||||||||||
(a) Includes brokerage-related held-for-investment customer receivables, which are classified in accrued interest and accounts receivable, and all other interest-earning assets, which are classified in other assets, on the Consolidated Balance Sheets.
(b) All other interest-bearing liabilities include brokerage-related customer payables.
(c) Interest includes the effect of related hedging derivatives. Taxable-equivalent amounts are used where applicable.
(d) The rates reflect the impact of interest earned on cash collateral where the cash collateral has been netted against certain derivative payables.
(e) Net yield on interest-earning assets excluding Markets is a non-GAAP financial measure. Refer to page 28 for a further discussion of this measure.
Page 6
| JPMORGAN CHASE & CO. | | ||||||||||||||||||||||||||||||||||||||||||||||
| RECONCILIATION FROM REPORTED TO MANAGED BASIS | |||||||||||||||||||||||||||||||||||||||||||||||
| (in millions, except ratios) | |||||||||||||||||||||||||||||||||||||||||||||||
The Firm prepares its Consolidated Financial Statements using accounting principles generally accepted in the U.S. (“U.S. GAAP”). That presentation, which is referred to as “reported” basis, provides the reader with an understanding of the Firm’s results that can be tracked consistently from year-to-year and enables a comparison of the Firm’s performance with other companies’ U.S. GAAP financial statements. In addition to analyzing the Firm’s results on a reported basis, management reviews Firmwide results, including the overhead ratio, on a “managed” basis; these Firmwide managed basis results are non-GAAP financial measures. The Firm also reviews the results of the lines of business on a managed basis. Refer to the notes on Non-GAAP Financial Measures on page 28 for additional information on managed basis.
The following summary table provides a reconciliation from reported U.S. GAAP results to managed basis.
| QUARTERLY TRENDS | SIX MONTHS ENDED JUNE 30, | |||||||||||||||||||||||||||||||||||||||||||||||||||||||||||||||||||
| 2Q24 Change | 2024 Change | |||||||||||||||||||||||||||||||||||||||||||||||||||||||||||||||||||
| 2Q24 | 1Q24 | 4Q23 | 3Q23 | 2Q23 | 1Q24 | 2Q23 | 2024 | 2023 | 2023 | |||||||||||||||||||||||||||||||||||||||||||||||||||||||||||
| OTHER INCOME | ||||||||||||||||||||||||||||||||||||||||||||||||||||||||||||||||||||
| Other income - reported (a) | $ | 9,149 | $ | 1,128 | $ | 696 | $ | 614 | $ | 3,292 | NM | 178 | % | $ | 10,277 | $ | 4,299 | 139 | % | |||||||||||||||||||||||||||||||||||||||||||||||||
| Fully taxable-equivalent adjustments (a)(b) | 677 | 493 | 1,243 | 682 | 990 | 37 | (32) | 1,170 | 1,857 | (37) | ||||||||||||||||||||||||||||||||||||||||||||||||||||||||||
| Other income - managed | $ | 9,826 | $ | 1,621 | $ | 1,939 | $ | 1,296 | $ | 4,282 | NM | 129 | $ | 11,447 | $ | 6,156 | 86 | |||||||||||||||||||||||||||||||||||||||||||||||||||
| TOTAL NONINTEREST REVENUE | ||||||||||||||||||||||||||||||||||||||||||||||||||||||||||||||||||||
| Total noninterest revenue - reported | $ | 27,454 | $ | 18,852 | $ | 14,523 | $ | 17,148 | $ | 19,528 | 46 | 41 | $ | 46,306 | $ | 37,166 | 25 | |||||||||||||||||||||||||||||||||||||||||||||||||||
| Fully taxable-equivalent adjustments | 677 | 493 | 1,243 | 682 | 990 | 37 | (32) | 1,170 | 1,857 | (37) | ||||||||||||||||||||||||||||||||||||||||||||||||||||||||||
| Total noninterest revenue - managed | $ | 28,131 | $ | 19,345 | $ | 15,766 | $ | 17,830 | $ | 20,518 | 45 | 37 | $ | 47,476 | $ | 39,023 | 22 | |||||||||||||||||||||||||||||||||||||||||||||||||||
| NET INTEREST INCOME | ||||||||||||||||||||||||||||||||||||||||||||||||||||||||||||||||||||
| Net interest income - reported | $ | 22,746 | $ | 23,082 | $ | 24,051 | $ | 22,726 | $ | 21,779 | (1) | 4 | $ | 45,828 | $ | 42,490 | 8 | |||||||||||||||||||||||||||||||||||||||||||||||||||
| Fully taxable-equivalent adjustments (b) | 115 | 121 | 126 | 130 | 104 | (5) | 11 | 236 | 224 | 5 | ||||||||||||||||||||||||||||||||||||||||||||||||||||||||||
| Net interest income - managed | $ | 22,861 | $ | 23,203 | $ | 24,177 | $ | 22,856 | $ | 21,883 | (1) | 4 | $ | 46,064 | $ | 42,714 | 8 | |||||||||||||||||||||||||||||||||||||||||||||||||||
| TOTAL NET REVENUE | ||||||||||||||||||||||||||||||||||||||||||||||||||||||||||||||||||||
| Total net revenue - reported | $ | 50,200 | $ | 41,934 | $ | 38,574 | $ | 39,874 | $ | 41,307 | 20 | 22 | $ | 92,134 | $ | 79,656 | 16 | |||||||||||||||||||||||||||||||||||||||||||||||||||
| Fully taxable-equivalent adjustments | 792 | 614 | 1,369 | 812 | 1,094 | 29 | (28) | 1,406 | 2,081 | (32) | ||||||||||||||||||||||||||||||||||||||||||||||||||||||||||
| Total net revenue - managed | $ | 50,992 | $ | 42,548 | $ | 39,943 | $ | 40,686 | $ | 42,401 | 20 | 20 | $ | 93,540 | $ | 81,737 | 14 | |||||||||||||||||||||||||||||||||||||||||||||||||||
| PRE-PROVISION PROFIT | ||||||||||||||||||||||||||||||||||||||||||||||||||||||||||||||||||||
| Pre-provision profit - reported | $ | 26,487 | $ | 19,177 | $ | 14,088 | $ | 18,117 | $ | 20,485 | 38 | 29 | $ | 45,664 | $ | 38,727 | 18 | |||||||||||||||||||||||||||||||||||||||||||||||||||
| Fully taxable-equivalent adjustments | 792 | 614 | 1,369 | 812 | 1,094 | 29 | (28) | 1,406 | 2,081 | (32) | ||||||||||||||||||||||||||||||||||||||||||||||||||||||||||
| Pre-provision profit - managed | $ | 27,279 | $ | 19,791 | $ | 15,457 | $ | 18,929 | $ | 21,579 | 38 | 26 | $ | 47,070 | $ | 40,808 | 15 | |||||||||||||||||||||||||||||||||||||||||||||||||||
| INCOME BEFORE INCOME TAX EXPENSE | ||||||||||||||||||||||||||||||||||||||||||||||||||||||||||||||||||||
| Income before income tax expense - reported | $ | 23,435 | $ | 17,293 | $ | 11,326 | $ | 16,733 | $ | 17,586 | 36 | 33 | $ | 40,728 | $ | 33,553 | 21 | |||||||||||||||||||||||||||||||||||||||||||||||||||
| Fully taxable-equivalent adjustments | 792 | 614 | 1,369 | 812 | 1,094 | 29 | (28) | 1,406 | 2,081 | (32) | ||||||||||||||||||||||||||||||||||||||||||||||||||||||||||
| Income before income tax expense - managed | $ | 24,227 | $ | 17,907 | $ | 12,695 | $ | 17,545 | $ | 18,680 | 35 | 30 | $ | 42,134 | $ | 35,634 | 18 | |||||||||||||||||||||||||||||||||||||||||||||||||||
| INCOME TAX EXPENSE | ||||||||||||||||||||||||||||||||||||||||||||||||||||||||||||||||||||
| Income tax expense - reported (a) | $ | 5,286 | $ | 3,874 | $ | 2,019 | $ | 3,582 | $ | 3,114 | 36 | 70 | $ | 9,160 | $ | 6,459 | 42 | |||||||||||||||||||||||||||||||||||||||||||||||||||
| Fully taxable-equivalent adjustments (a) | 792 | 614 | 1,369 | 812 | 1,094 | 29 | (28) | 1,406 | 2,081 | (32) | ||||||||||||||||||||||||||||||||||||||||||||||||||||||||||
| Income tax expense - managed | $ | 6,078 | $ | 4,488 | $ | 3,388 | $ | 4,394 | $ | 4,208 | 35 | 44 | $ | 10,566 | $ | 8,540 | 24 | |||||||||||||||||||||||||||||||||||||||||||||||||||
| OVERHEAD RATIO | ||||||||||||||||||||||||||||||||||||||||||||||||||||||||||||||||||||
| Overhead ratio - reported | 47 | % | 54 | % | 63 | % | 55 | % | 50 | % | 50 | % | 51 | % | ||||||||||||||||||||||||||||||||||||||||||||||||||||||
| Overhead ratio - managed | 47 | 53 | 61 | 53 | 49 | 50 | 50 | |||||||||||||||||||||||||||||||||||||||||||||||||||||||||||||
(a)Effective January 1, 2024, the Firm adopted updates to the Accounting for Investments in Tax Credit Structures Using the Proportional Amortization Method guidance, under the modified retrospective method. Refer to page 4 for additional information.
(b)Predominantly recognized in CIB and Corporate.
Page 7
| JPMORGAN CHASE & CO. | | ||||||||||||||||||||||||||||||||||||||||||||||||||||||||||||||||
| SEGMENT RESULTS - MANAGED BASIS | |||||||||||||||||||||||||||||||||||||||||||||||||||||||||||||||||
| (in millions) | |||||||||||||||||||||||||||||||||||||||||||||||||||||||||||||||||
| QUARTERLY TRENDS | SIX MONTHS ENDED JUNE 30, | ||||||||||||||||||||||||||||||||||||||||||||||||||||||||||||||||
| 2Q24 Change | 2024 Change | ||||||||||||||||||||||||||||||||||||||||||||||||||||||||||||||||
| 2Q24 | 1Q24 | 4Q23 | 3Q23 | 2Q23 | 1Q24 | 2Q23 | 2024 | 2023 | 2023 | ||||||||||||||||||||||||||||||||||||||||||||||||||||||||
| TOTAL NET REVENUE (fully taxable-equivalent (“FTE”)) | |||||||||||||||||||||||||||||||||||||||||||||||||||||||||||||||||
| Consumer & Community Banking | $ | 17,701 | $ | 17,653 | $ | 18,097 | $ | 18,362 | $ | 17,233 | — | % | 3 | % | $ | 35,354 | $ | 33,689 | 5 | % | |||||||||||||||||||||||||||||||||||||||||||||
| Commercial & Investment Bank (a) | 17,917 | 17,584 | 14,974 | 15,761 | 16,507 | 2 | 9 | 35,501 | 33,618 | 6 | |||||||||||||||||||||||||||||||||||||||||||||||||||||||
| Asset & Wealth Management | 5,252 | 5,109 | 5,095 | 5,005 | 4,943 | 3 | 6 | 10,361 | 9,727 | 7 | |||||||||||||||||||||||||||||||||||||||||||||||||||||||
| Corporate | 10,122 | 2,202 | 1,777 | 1,558 | 3,718 | 360 | 172 | 12,324 | 4,703 | 162 | |||||||||||||||||||||||||||||||||||||||||||||||||||||||
| TOTAL NET REVENUE | $ | 50,992 | $ | 42,548 | $ | 39,943 | $ | 40,686 | $ | 42,401 | 20 | 20 | $ | 93,540 | $ | 81,737 | 14 | ||||||||||||||||||||||||||||||||||||||||||||||||
| TOTAL NONINTEREST EXPENSE | |||||||||||||||||||||||||||||||||||||||||||||||||||||||||||||||||
| Consumer & Community Banking | $ | 9,425 | $ | 9,297 | $ | 9,336 | $ | 9,105 | $ | 8,313 | 1 | 13 | $ | 18,722 | $ | 16,378 | 14 | ||||||||||||||||||||||||||||||||||||||||||||||||
| Commercial & Investment Bank (a) | 9,166 | 8,724 | 8,169 | 8,818 | 8,194 | 5 | 12 | 17,890 | 16,985 | 5 | |||||||||||||||||||||||||||||||||||||||||||||||||||||||
| Asset & Wealth Management | 3,543 | 3,460 | 3,388 | 3,138 | 3,163 | 2 | 12 | 7,003 | 6,254 | 12 | |||||||||||||||||||||||||||||||||||||||||||||||||||||||
| Corporate | 1,579 | 1,276 | 3,593 | 696 | 1,152 | 24 | 37 | 2,855 | 1,312 | 118 | |||||||||||||||||||||||||||||||||||||||||||||||||||||||
| TOTAL NONINTEREST EXPENSE | $ | 23,713 | $ | 22,757 | $ | 24,486 | $ | 21,757 | $ | 20,822 | 4 | 14 | $ | 46,470 | $ | 40,929 | 14 | ||||||||||||||||||||||||||||||||||||||||||||||||
| PRE-PROVISION PROFIT/(LOSS) | |||||||||||||||||||||||||||||||||||||||||||||||||||||||||||||||||
| Consumer & Community Banking | $ | 8,276 | $ | 8,356 | $ | 8,761 | $ | 9,257 | $ | 8,920 | (1) | (7) | $ | 16,632 | $ | 17,311 | (4) | ||||||||||||||||||||||||||||||||||||||||||||||||
| Commercial & Investment Bank (a) | 8,751 | 8,860 | 6,805 | 6,943 | 8,313 | (1) | 5 | 17,611 | 16,633 | 6 | |||||||||||||||||||||||||||||||||||||||||||||||||||||||
| Asset & Wealth Management | 1,709 | 1,649 | 1,707 | 1,867 | 1,780 | 4 | (4) | 3,358 | 3,473 | (3) | |||||||||||||||||||||||||||||||||||||||||||||||||||||||
| Corporate | 8,543 | 926 | (1,816) | 862 | 2,566 | NM | 233 | 9,469 | 3,391 | 179 | |||||||||||||||||||||||||||||||||||||||||||||||||||||||
| PRE-PROVISION PROFIT | $ | 27,279 | $ | 19,791 | $ | 15,457 | $ | 18,929 | $ | 21,579 | 38 | 26 | $ | 47,070 | $ | 40,808 | 15 | ||||||||||||||||||||||||||||||||||||||||||||||||
| PROVISION FOR CREDIT LOSSES | |||||||||||||||||||||||||||||||||||||||||||||||||||||||||||||||||
| Consumer & Community Banking | $ | 2,643 | $ | 1,913 | $ | 2,189 | $ | 1,446 | $ | 1,862 | 38 | 42 | $ | 4,556 | $ | 3,264 | 40 | ||||||||||||||||||||||||||||||||||||||||||||||||
| Commercial & Investment Bank (a) | 384 | 1 | 576 | (95) | 1,135 | NM | (66) | 385 | 1,610 | (76) | |||||||||||||||||||||||||||||||||||||||||||||||||||||||
| Asset & Wealth Management | 20 | (57) | (1) | (13) | 145 | NM | (86) | (37) | 173 | NM | |||||||||||||||||||||||||||||||||||||||||||||||||||||||
| Corporate | 5 | 27 | (2) | 46 | (243) | (81) | NM | 32 | 127 | (75) | |||||||||||||||||||||||||||||||||||||||||||||||||||||||
| PROVISION FOR CREDIT LOSSES | $ | 3,052 | $ | 1,884 | $ | 2,762 | $ | 1,384 | $ | 2,899 | 62 | 5 | $ | 4,936 | $ | 5,174 | (5) | ||||||||||||||||||||||||||||||||||||||||||||||||
| NET INCOME/(LOSS) | |||||||||||||||||||||||||||||||||||||||||||||||||||||||||||||||||
| Consumer & Community Banking | $ | 4,210 | $ | 4,831 | $ | 4,788 | $ | 5,895 | $ | 5,306 | (13) | (21) | $ | 9,041 | $ | 10,549 | (14) | ||||||||||||||||||||||||||||||||||||||||||||||||
| Commercial & Investment Bank (a) | 5,897 | 6,622 | 4,177 | 5,027 | 5,300 | (11) | 11 | 12,519 | 11,068 | 13 | |||||||||||||||||||||||||||||||||||||||||||||||||||||||
| Asset & Wealth Management | 1,263 | 1,290 | 1,217 | 1,417 | 1,226 | (2) | 3 | 2,553 | 2,593 | (2) | |||||||||||||||||||||||||||||||||||||||||||||||||||||||
| Corporate | 6,779 | 676 | (875) | 812 | 2,640 | NM | 157 | 7,455 | 2,884 | 158 | |||||||||||||||||||||||||||||||||||||||||||||||||||||||
| TOTAL NET INCOME | $ | 18,149 | $ | 13,419 | $ | 9,307 | $ | 13,151 | $ | 14,472 | 35 | 25 | $ | 31,568 | $ | 27,094 | 17 | ||||||||||||||||||||||||||||||||||||||||||||||||
(a)Effective in the second quarter of 2024, the Firm reorganized its reportable business segments by combining the former Corporate & Investment Bank and Commercial Banking business segments to form one segment, the Commercial & Investment Bank ("CIB"). Refer to Business Segment Reorganization on page 29 for further information.
Page 8
| JPMORGAN CHASE & CO. | | ||||||||||||||||||||||||||||||||||||||||||||||||||||||||||||||||
| CAPITAL AND OTHER SELECTED BALANCE SHEET ITEMS | |||||||||||||||||||||||||||||||||||||||||||||||||||||||||||||||||
| (in millions, except ratio data) | |||||||||||||||||||||||||||||||||||||||||||||||||||||||||||||||||
| Jun 30, 2024 | |||||||||||||||||||||||||||||||||||||||||||||||||||||||||||||||||
| Change | SIX MONTHS ENDED JUNE 30, | ||||||||||||||||||||||||||||||||||||||||||||||||||||||||||||||||
| Jun 30, | Mar 31, | Dec 31, | Sep 30, | Jun 30, | Mar 31, | Jun 30, | 2024 Change | ||||||||||||||||||||||||||||||||||||||||||||||||||||||||||
| 2024 | 2024 | 2023 | 2023 | 2023 | 2024 | 2023 | 2024 | 2023 | 2023 | ||||||||||||||||||||||||||||||||||||||||||||||||||||||||
| CAPITAL (a) | |||||||||||||||||||||||||||||||||||||||||||||||||||||||||||||||||
| Risk-based capital metrics | |||||||||||||||||||||||||||||||||||||||||||||||||||||||||||||||||
| Standardized | |||||||||||||||||||||||||||||||||||||||||||||||||||||||||||||||||
| CET1 capital | $ | 267,195 | (c) | $ | 257,569 | $ | 250,585 | $ | 241,825 | $ | 235,827 | 4 | % | 13 | % | ||||||||||||||||||||||||||||||||||||||||||||||||||
| Tier 1 capital | 290,465 | (c) | 280,771 | 277,306 | 268,579 | 262,585 | 3 | 11 | |||||||||||||||||||||||||||||||||||||||||||||||||||||||||
| Total capital | 322,191 | (c) | 312,149 | 308,497 | 300,859 | 295,281 | 3 | 9 | |||||||||||||||||||||||||||||||||||||||||||||||||||||||||
| Risk-weighted assets | 1,742,525 | (c) | 1,712,081 | 1,671,995 | 1,692,219 | 1,706,927 | 2 | 2 | |||||||||||||||||||||||||||||||||||||||||||||||||||||||||
| CET1 capital ratio | 15.3 | % | (c) | 15.0 | % | 15.0 | % | 14.3 | % | 13.8 | % | ||||||||||||||||||||||||||||||||||||||||||||||||||||||
| Tier 1 capital ratio | 16.7 | (c) | 16.4 | 16.6 | 15.9 | 15.4 | |||||||||||||||||||||||||||||||||||||||||||||||||||||||||||
| Total capital ratio | 18.5 | (c) | 18.2 | 18.5 | 17.8 | 17.3 | |||||||||||||||||||||||||||||||||||||||||||||||||||||||||||
| Advanced | |||||||||||||||||||||||||||||||||||||||||||||||||||||||||||||||||
| CET1 capital | $ | 267,195 | (c) | $ | 257,569 | $ | 250,585 | $ | 241,825 | $ | 235,827 | 4 | 13 | ||||||||||||||||||||||||||||||||||||||||||||||||||||
| Tier 1 capital | 290,465 | (c) | 280,771 | 277,306 | 268,579 | 262,585 | 3 | 11 | |||||||||||||||||||||||||||||||||||||||||||||||||||||||||
| Total capital | 308,673 | (c) | 298,766 | 295,417 | 287,560 | 281,953 | 3 | 9 | |||||||||||||||||||||||||||||||||||||||||||||||||||||||||
| Risk-weighted assets | 1,727,559 | (c) | 1,681,317 | 1,669,156 | 1,671,593 | 1,694,714 | 3 | 2 | |||||||||||||||||||||||||||||||||||||||||||||||||||||||||
| CET1 capital ratio | 15.5 | % | (c) | 15.3 | % | 15.0 | % | 14.5 | % | 13.9 | % | ||||||||||||||||||||||||||||||||||||||||||||||||||||||
| Tier 1 capital ratio | 16.8 | (c) | 16.7 | 16.6 | 16.1 | 15.5 | |||||||||||||||||||||||||||||||||||||||||||||||||||||||||||
| Total capital ratio | 17.9 | (c) | 17.8 | 17.7 | 17.2 | 16.6 | |||||||||||||||||||||||||||||||||||||||||||||||||||||||||||
| Leverage-based capital metrics | |||||||||||||||||||||||||||||||||||||||||||||||||||||||||||||||||
| Adjusted average assets (b) | $ | 4,016,677 | (c) | $ | 3,913,677 | $ | 3,831,200 | $ | 3,785,641 | $ | 3,796,579 | 3 | 6 | ||||||||||||||||||||||||||||||||||||||||||||||||||||
| Tier 1 leverage ratio | 7.2 | % | (c) | 7.2 | % | 7.2 | % | 7.1 | % | 6.9 | % | ||||||||||||||||||||||||||||||||||||||||||||||||||||||
| Total leverage exposure | $ | 4,768,572 | (c) | $ | 4,634,634 | $ | 4,540,465 | $ | 4,500,253 | $ | 4,492,761 | 3 | 6 | ||||||||||||||||||||||||||||||||||||||||||||||||||||
| SLR | 6.1 | % | (c) | 6.1 | % | 6.1 | % | 6.0 | % | 5.8 | % | ||||||||||||||||||||||||||||||||||||||||||||||||||||||
| Total Loss-Absorbing Capacity (“TLAC”) | |||||||||||||||||||||||||||||||||||||||||||||||||||||||||||||||||
| Eligible external TLAC | $ | 534,027 | (c) | $ | 520,386 | $ | 513,799 | $ | 496,183 | $ | 493,760 | 3 | 8 | ||||||||||||||||||||||||||||||||||||||||||||||||||||
| MEMO: CET1 CAPITAL ROLLFORWARD | |||||||||||||||||||||||||||||||||||||||||||||||||||||||||||||||||
| Standardized/Advanced CET1 capital, beginning balance | $ | 257,569 | $ | 250,585 | $ | 241,825 | $ | 235,827 | $ | 227,144 | 3 | 13 | $ | 250,585 | $ | 218,934 | 14 | % | |||||||||||||||||||||||||||||||||||||||||||||||
| Net income applicable to common equity | 17,832 | 13,022 | 8,921 | 12,765 | 14,099 | 37 | 26 | 30,854 | 26,365 | 17 | |||||||||||||||||||||||||||||||||||||||||||||||||||||||
| Dividends declared on common stock | (3,322) | (3,348) | (3,064) | (3,080) | (2,948) | 1 | (13) | (6,670) | (5,911) | (13) | |||||||||||||||||||||||||||||||||||||||||||||||||||||||
| Net purchase of treasury stock | (5,321) | (1,829) | (2,240) | (2,337) | (2,268) | (191) | (135) | (7,150) | (4,304) | (66) | |||||||||||||||||||||||||||||||||||||||||||||||||||||||
| Changes in additional paid-in capital | 425 | (225) | 229 | 321 | 423 | NM | — | 200 | 534 | (63) | |||||||||||||||||||||||||||||||||||||||||||||||||||||||
| Changes related to AOCI applicable to capital: | |||||||||||||||||||||||||||||||||||||||||||||||||||||||||||||||||
| Unrealized gains/(losses) on investment securities | 108 | 141 | 4,362 | (1,950) | 757 | (23) | (86) | 249 | 2,969 | (92) | |||||||||||||||||||||||||||||||||||||||||||||||||||||||
| Translation adjustments, net of hedges | (156) | (204) | 402 | (340) | 70 | 24 | NM | (360) | 267 | NM | |||||||||||||||||||||||||||||||||||||||||||||||||||||||
| Fair value hedges | 8 | (21) | (86) | (5) | 11 | NM | (27) | (13) | (10) | (30) | |||||||||||||||||||||||||||||||||||||||||||||||||||||||
| Defined benefit pension and other postretirement employee benefit plans | (3) | 26 | 455 | (21) | (6) | NM | 50 | 23 | (61) | NM | |||||||||||||||||||||||||||||||||||||||||||||||||||||||
| Changes related to other CET1 capital adjustments | 55 | (c) | (578) | (219) | 645 | (1,455) | NM | NM | (523) | (c) | (2,956) | 82 | |||||||||||||||||||||||||||||||||||||||||||||||||||||
| Change in Standardized/Advanced CET1 capital | 9,626 | (c) | 6,984 | 8,760 | 5,998 | 8,683 | 38 | 11 | 16,610 | (c) | 16,893 | (2) | |||||||||||||||||||||||||||||||||||||||||||||||||||||
| Standardized/Advanced CET1 capital, ending balance | $ | 267,195 | (c) | $ | 257,569 | $ | 250,585 | $ | 241,825 | $ | 235,827 | 4 | 13 | $ | 267,195 | (c) | $ | 235,827 | 13 | ||||||||||||||||||||||||||||||||||||||||||||||
(a)The capital metrics reflect the CECL capital transition provisions. As of June 30, 2024 and March 31, 2024, CET1 capital reflected the remaining CECL benefit of $720 million; as of December 31, 2023, September 30, 2023, and June 30, 2023, CET1 capital reflected the benefit of $1.4 billion. Refer to Note 21 of the Firm’s Quarterly Report on Form 10-Q for the quarterly period ended March 31, 2024, and Note 27 of the Firm’s 2023 Form 10-K for additional information.
(b)Adjusted average assets, for purposes of calculating the leverage ratios, includes quarterly average assets adjusted for on-balance sheet assets that are subject to deduction from Tier 1 capital, predominantly goodwill, inclusive of estimated equity method goodwill, and other intangible assets.
(c)Estimated.
Page 9
| JPMORGAN CHASE & CO. | | ||||||||||||||||||||||||||||||||||||||||||||||||||||||||||||||||
| CAPITAL AND OTHER SELECTED BALANCE SHEET ITEMS, CONTINUED | |||||||||||||||||||||||||||||||||||||||||||||||||||||||||||||||||
| (in millions, except ratio data) | |||||||||||||||||||||||||||||||||||||||||||||||||||||||||||||||||
| Jun 30, 2024 | |||||||||||||||||||||||||||||||||||||||||||||||||||||||||||||||||
| Change | SIX MONTHS ENDED JUNE 30, | ||||||||||||||||||||||||||||||||||||||||||||||||||||||||||||||||
| Jun 30, | Mar 31, | Dec 31, | Sep 30, | Jun 30, | Mar 31, | Jun 30, | 2024 Change | ||||||||||||||||||||||||||||||||||||||||||||||||||||||||||
| 2024 | 2024 | 2023 | 2023 | 2023 | 2024 | 2023 | 2024 | 2023 | 2023 | ||||||||||||||||||||||||||||||||||||||||||||||||||||||||
| TANGIBLE COMMON EQUITY (period-end) (a) | |||||||||||||||||||||||||||||||||||||||||||||||||||||||||||||||||
| Common stockholders’ equity | $ | 316,652 | $ | 306,737 | $ | 300,474 | $ | 289,967 | $ | 285,112 | 3 | % | 11 | % | |||||||||||||||||||||||||||||||||||||||||||||||||||
| Less: Goodwill | 52,620 | 52,636 | 52,634 | 52,492 | 52,380 | — | — | ||||||||||||||||||||||||||||||||||||||||||||||||||||||||||
| Less: Other intangible assets | 3,058 | 3,133 | 3,225 | 3,309 | 3,629 | (2) | (16) | ||||||||||||||||||||||||||||||||||||||||||||||||||||||||||
| Add: Certain deferred tax liabilities (b) | 2,969 | 2,981 | 2,996 | 3,025 | 3,097 | — | (4) | ||||||||||||||||||||||||||||||||||||||||||||||||||||||||||
| Total tangible common equity | $ | 263,943 | $ | 253,949 | $ | 247,611 | $ | 237,191 | $ | 232,200 | 4 | 14 | |||||||||||||||||||||||||||||||||||||||||||||||||||||
| TANGIBLE COMMON EQUITY (average) (a) | |||||||||||||||||||||||||||||||||||||||||||||||||||||||||||||||||
| Common stockholders’ equity | $ | 308,763 | $ | 300,277 | $ | 294,062 | $ | 284,798 | $ | 277,885 | 3 | 11 | $ | 304,519 | $ | 274,560 | 11 | % | |||||||||||||||||||||||||||||||||||||||||||||||
| Less: Goodwill | 52,618 | 52,614 | 52,538 | 52,427 | 52,342 | — | 1 | 52,616 | 52,031 | 1 | |||||||||||||||||||||||||||||||||||||||||||||||||||||||
| Less: Other intangible assets | 3,086 | 3,157 | 3,254 | 3,511 | 2,191 | (2) | 41 | 3,122 | 1,746 | 79 | |||||||||||||||||||||||||||||||||||||||||||||||||||||||
| Add: Certain deferred tax liabilities (b) | 2,975 | 2,988 | 2,992 | 3,080 | 2,902 | — | 3 | 2,982 | 2,727 | 9 | |||||||||||||||||||||||||||||||||||||||||||||||||||||||
| Total tangible common equity | $ | 256,034 | $ | 247,494 | $ | 241,262 | $ | 231,940 | $ | 226,254 | 3 | 13 | $ | 251,763 | $ | 223,510 | 13 | ||||||||||||||||||||||||||||||||||||||||||||||||
| INTANGIBLE ASSETS (period-end) | |||||||||||||||||||||||||||||||||||||||||||||||||||||||||||||||||
| Goodwill | $ | 52,620 | $ | 52,636 | $ | 52,634 | $ | 52,492 | $ | 52,380 | — | — | |||||||||||||||||||||||||||||||||||||||||||||||||||||
| Mortgage servicing rights | 8,847 | 8,605 | 8,522 | 9,109 | 8,229 | 3 | 8 | ||||||||||||||||||||||||||||||||||||||||||||||||||||||||||
| Other intangible assets | 3,058 | 3,133 | 3,225 | 3,309 | 3,629 | (2) | (16) | ||||||||||||||||||||||||||||||||||||||||||||||||||||||||||
| Total intangible assets | $ | 64,525 | $ | 64,374 | $ | 64,381 | $ | 64,910 | $ | 64,238 | — | — | |||||||||||||||||||||||||||||||||||||||||||||||||||||
(a)Refer to page 28 for further discussion of TCE.
(b)Represents deferred tax liabilities related to tax-deductible goodwill and to identifiable intangibles created in nontaxable transactions, which are netted against goodwill and other intangibles when calculating TCE.
Page 10
| JPMORGAN CHASE & CO. | | ||||||||||||||||||||||||||||||||||||||||||||||||||||||||||||||||
| EARNINGS PER SHARE AND RELATED INFORMATION | |||||||||||||||||||||||||||||||||||||||||||||||||||||||||||||||||
| (in millions, except per share and ratio data) | |||||||||||||||||||||||||||||||||||||||||||||||||||||||||||||||||
| QUARTERLY TRENDS | SIX MONTHS ENDED JUNE 30, | ||||||||||||||||||||||||||||||||||||||||||||||||||||||||||||||||
| 2Q24 Change | 2024 Change | ||||||||||||||||||||||||||||||||||||||||||||||||||||||||||||||||
| 2Q24 | 1Q24 | 4Q23 | 3Q23 | 2Q23 | 1Q24 | 2Q23 | 2024 | 2023 | 2023 | ||||||||||||||||||||||||||||||||||||||||||||||||||||||||
| EARNINGS PER SHARE | |||||||||||||||||||||||||||||||||||||||||||||||||||||||||||||||||
| Basic earnings per share | |||||||||||||||||||||||||||||||||||||||||||||||||||||||||||||||||
| Net income | $ | 18,149 | $ | 13,419 | $ | 9,307 | $ | 13,151 | $ | 14,472 | 35 | % | 25 | % | $ | 31,568 | $ | 27,094 | 17 | % | |||||||||||||||||||||||||||||||||||||||||||||
| Less: Preferred stock dividends | 317 | 397 | 386 | 386 | 373 | (20) | (15) | 714 | 729 | (2) | |||||||||||||||||||||||||||||||||||||||||||||||||||||||
| Net income applicable to common equity | 17,832 | 13,022 | 8,921 | 12,765 | 14,099 | 37 | 26 | 30,854 | 26,365 | 17 | |||||||||||||||||||||||||||||||||||||||||||||||||||||||
| Less: Dividends and undistributed earnings allocated to | |||||||||||||||||||||||||||||||||||||||||||||||||||||||||||||||||
| participating securities | 114 | 80 | 51 | 80 | 88 | 43 | 30 | 193 | 161 | 20 | |||||||||||||||||||||||||||||||||||||||||||||||||||||||
| Net income applicable to common stockholders | $ | 17,718 | $ | 12,942 | $ | 8,870 | $ | 12,685 | $ | 14,011 | 37 | 26 | $ | 30,661 | $ | 26,204 | 17 | ||||||||||||||||||||||||||||||||||||||||||||||||
| Total weighted-average basic shares outstanding | 2,889.8 | 2,908.3 | 2,914.4 | 2,927.5 | 2,943.8 | (1) | (2) | 2,899.1 | 2,956.1 | (2) | |||||||||||||||||||||||||||||||||||||||||||||||||||||||
| Net income per share | $ | 6.13 | $ | 4.45 | $ | 3.04 | $ | 4.33 | $ | 4.76 | 38 | 29 | $ | 10.58 | $ | 8.86 | 19 | ||||||||||||||||||||||||||||||||||||||||||||||||
| Diluted earnings per share | |||||||||||||||||||||||||||||||||||||||||||||||||||||||||||||||||
| Net income applicable to common stockholders | $ | 17,718 | $ | 12,942 | $ | 8,870 | $ | 12,685 | $ | 14,011 | 37 | 26 | $ | 30,661 | $ | 26,204 | 17 | ||||||||||||||||||||||||||||||||||||||||||||||||
| Total weighted-average basic shares outstanding | 2,889.8 | 2,908.3 | 2,914.4 | 2,927.5 | 2,943.8 | (1) | (2) | 2,899.1 | 2,956.1 | (2) | |||||||||||||||||||||||||||||||||||||||||||||||||||||||
| Add: Dilutive impact of unvested performance share units (“PSUs”), nondividend-earning restricted stock units (“RSUs”) and stock appreciation rights (“SARs”) | 5.1 | 4.5 | 4.7 | 4.6 | 4.5 | 13 | 13 | 4.8 | 4.4 | 9 | |||||||||||||||||||||||||||||||||||||||||||||||||||||||
| Total weighted-average diluted shares outstanding | 2,894.9 | 2,912.8 | 2,919.1 | 2,932.1 | 2,948.3 | (1) | (2) | 2,903.9 | 2,960.5 | (2) | |||||||||||||||||||||||||||||||||||||||||||||||||||||||
| Net income per share | $ | 6.12 | $ | 4.44 | $ | 3.04 | $ | 4.33 | $ | 4.75 | 38 | 29 | $ | 10.56 | $ | 8.85 | 19 | ||||||||||||||||||||||||||||||||||||||||||||||||
| COMMON DIVIDENDS | |||||||||||||||||||||||||||||||||||||||||||||||||||||||||||||||||
| Cash dividends declared per share | $ | 1.15 | $ | 1.15 | (c) | $ | 1.05 | $ | 1.05 | $ | 1.00 | — | 15 | $ | 2.30 | $ | 2.00 | 15 | |||||||||||||||||||||||||||||||||||||||||||||||
| Dividend payout ratio | 19 | % | 26 | % | 34 | % | 24 | % | 21 | % | 22 | % | 22 | % | |||||||||||||||||||||||||||||||||||||||||||||||||||
| COMMON SHARE REPURCHASE PROGRAM (a) | |||||||||||||||||||||||||||||||||||||||||||||||||||||||||||||||||
| Total shares of common stock repurchased | 27.0 | 15.9 | 15.2 | 15.6 | 16.7 | 70 | 62 | 42.9 | 38.7 | 11 | |||||||||||||||||||||||||||||||||||||||||||||||||||||||
| Average price paid per share of common stock | $ | 196.83 | $ | 179.50 | $ | 151.02 | $ | 151.46 | $ | 137.20 | 10 | 43 | $ | 190.42 | $ | 135.19 | 41 | ||||||||||||||||||||||||||||||||||||||||||||||||
| Aggregate repurchases of common stock | 5,318 | 2,849 | 2,301 | 2,364 | 2,293 | 87 | 132 | 8,167 | 5,233 | 56 | |||||||||||||||||||||||||||||||||||||||||||||||||||||||
| EMPLOYEE ISSUANCE | |||||||||||||||||||||||||||||||||||||||||||||||||||||||||||||||||
| Shares issued from treasury stock related to employee | |||||||||||||||||||||||||||||||||||||||||||||||||||||||||||||||||
| stock-based compensation awards and employee stock | |||||||||||||||||||||||||||||||||||||||||||||||||||||||||||||||||
| purchase plans | 0.5 | 10.9 | 0.8 | 0.6 | 0.5 | (95) | — | 11.4 | 10.5 | 9 | |||||||||||||||||||||||||||||||||||||||||||||||||||||||
| Net impact of employee issuances on stockholders’ equity (b) | $ | 459 | $ | 801 | $ | 308 | $ | 368 | $ | 467 | (43) | (2) | $ | 1,260 | $ | 1,495 | (16) | ||||||||||||||||||||||||||||||||||||||||||||||||
(a)The Firm was authorized to purchase up to $30 billion of common shares under its repurchase program announced on April 13, 2022. Effective July 1, 2024, the Firm’s Board of Directors have authorized a new common share repurchase program of $30 billion that replaced the previous repurchase program.
(b)The net impact of employee issuances on stockholders’ equity is driven by the cost of equity compensation awards that is recognized over the applicable vesting periods. The cost is partially offset by tax impacts related to the distribution of shares and the exercise of SARs.
(c)On March 19, 2024, the Board of Directors declared a quarterly common stock dividend of $1.15 per share.
Page 11
| JPMORGAN CHASE & CO. | | ||||||||||||||||||||||||||||||||||||||||||||||||||||||||||||||||
| CONSUMER & COMMUNITY BANKING | |||||||||||||||||||||||||||||||||||||||||||||||||||||||||||||||||
| FINANCIAL HIGHLIGHTS | |||||||||||||||||||||||||||||||||||||||||||||||||||||||||||||||||
| (in millions, except ratio data) | |||||||||||||||||||||||||||||||||||||||||||||||||||||||||||||||||
| QUARTERLY TRENDS | SIX MONTHS ENDED JUNE 30, | ||||||||||||||||||||||||||||||||||||||||||||||||||||||||||||||||
| 2Q24 Change | 2024 Change | ||||||||||||||||||||||||||||||||||||||||||||||||||||||||||||||||
| 2Q24 | 1Q24 | 4Q23 | 3Q23 | 2Q23 | 1Q24 | 2Q23 | 2024 | 2023 | 2023 | ||||||||||||||||||||||||||||||||||||||||||||||||||||||||
| INCOME STATEMENT | |||||||||||||||||||||||||||||||||||||||||||||||||||||||||||||||||
| REVENUE | |||||||||||||||||||||||||||||||||||||||||||||||||||||||||||||||||
| Lending- and deposit-related fees | $ | 830 | $ | 822 | $ | 856 | $ | 836 | $ | 841 | 1 | % | (1) | % | $ | 1,652 | $ | 1,664 | (1) | % | |||||||||||||||||||||||||||||||||||||||||||||
| Asset management fees | 978 | 947 | 899 | 891 | 816 | 3 | 20 | 1,925 | 1,492 | 29 | |||||||||||||||||||||||||||||||||||||||||||||||||||||||
| Mortgage fees and related income | 346 | 274 | 261 | 417 | 274 | 26 | 26 | 620 | 497 | 25 | |||||||||||||||||||||||||||||||||||||||||||||||||||||||
| Card income | 741 | 682 | 684 | 626 | 483 | 9 | 53 | 1,423 | 1,222 | 16 | |||||||||||||||||||||||||||||||||||||||||||||||||||||||
| All other income (a) | 1,101 | 1,220 | 1,270 | 1,212 | 1,129 | (10) | (2) | 2,321 | 2,291 | 1 | |||||||||||||||||||||||||||||||||||||||||||||||||||||||
| Noninterest revenue | 3,996 | 3,945 | 3,970 | 3,982 | 3,543 | 1 | 13 | 7,941 | 7,166 | 11 | |||||||||||||||||||||||||||||||||||||||||||||||||||||||
| Net interest income | 13,705 | 13,708 | 14,127 | 14,380 | 13,690 | — | — | 27,413 | 26,523 | 3 | |||||||||||||||||||||||||||||||||||||||||||||||||||||||
| TOTAL NET REVENUE | 17,701 | 17,653 | 18,097 | 18,362 | 17,233 | — | 3 | 35,354 | 33,689 | 5 | |||||||||||||||||||||||||||||||||||||||||||||||||||||||
| Provision for credit losses | 2,643 | 1,913 | 2,189 | 1,446 | 1,862 | 38 | 42 | 4,556 | 3,264 | 40 | |||||||||||||||||||||||||||||||||||||||||||||||||||||||
| NONINTEREST EXPENSE | |||||||||||||||||||||||||||||||||||||||||||||||||||||||||||||||||
| Compensation expense | 4,240 | 4,229 | 4,023 | 3,975 | 3,628 | — | 17 | 8,469 | 7,173 | 18 | |||||||||||||||||||||||||||||||||||||||||||||||||||||||
| Noncompensation expense (b) | 5,185 | 5,068 | 5,313 | 5,130 | 4,685 | 2 | 11 | 10,253 | 9,205 | 11 | |||||||||||||||||||||||||||||||||||||||||||||||||||||||
| TOTAL NONINTEREST EXPENSE | 9,425 | 9,297 | 9,336 | 9,105 | 8,313 | (d) | 1 | 13 | 18,722 | 16,378 | (d) | 14 | |||||||||||||||||||||||||||||||||||||||||||||||||||||
| Income before income tax expense | 5,633 | 6,443 | 6,572 | 7,811 | 7,058 | (13) | (20) | 12,076 | 14,047 | (14) | |||||||||||||||||||||||||||||||||||||||||||||||||||||||
| Income tax expense | 1,423 | 1,612 | 1,784 | 1,916 | 1,752 | (12) | (19) | 3,035 | 3,498 | (13) | |||||||||||||||||||||||||||||||||||||||||||||||||||||||
| NET INCOME | $ | 4,210 | $ | 4,831 | $ | 4,788 | $ | 5,895 | $ | 5,306 | (13) | (21) | $ | 9,041 | $ | 10,549 | (14) | ||||||||||||||||||||||||||||||||||||||||||||||||
| REVENUE BY BUSINESS | |||||||||||||||||||||||||||||||||||||||||||||||||||||||||||||||||
| Banking & Wealth Management | $ | 10,375 | $ | 10,324 | $ | 10,877 | $ | 11,345 | $ | 10,936 | — | (5) | $ | 20,699 | $ | 20,977 | (1) | ||||||||||||||||||||||||||||||||||||||||||||||||
| Home Lending | 1,319 | 1,186 | 1,161 | 1,252 | 1,007 | 11 | 31 | 2,505 | 1,727 | 45 | |||||||||||||||||||||||||||||||||||||||||||||||||||||||
| Card Services & Auto | 6,007 | 6,143 | 6,059 | 5,765 | 5,290 | (2) | 14 | 12,150 | 10,985 | 11 | |||||||||||||||||||||||||||||||||||||||||||||||||||||||
| MORTGAGE FEES AND RELATED INCOME DETAILS | |||||||||||||||||||||||||||||||||||||||||||||||||||||||||||||||||
| Production revenue | 157 | 130 | 82 | 162 | 102 | 21 | 54 | 287 | 177 | 62 | |||||||||||||||||||||||||||||||||||||||||||||||||||||||
| Net mortgage servicing revenue (c) | 189 | 144 | 179 | 255 | 172 | 31 | 10 | 333 | 320 | 4 | |||||||||||||||||||||||||||||||||||||||||||||||||||||||
| Mortgage fees and related income | $ | 346 | $ | 274 | $ | 261 | $ | 417 | $ | 274 | 26 | 26 | $ | 620 | $ | 497 | 25 | ||||||||||||||||||||||||||||||||||||||||||||||||
| FINANCIAL RATIOS | |||||||||||||||||||||||||||||||||||||||||||||||||||||||||||||||||
| ROE | 30 | % | 35 | % | 33 | % | 41 | % | 38 | % | 33 | % | 39 | % | |||||||||||||||||||||||||||||||||||||||||||||||||||
| Overhead ratio | 53 | 53 | 52 | 50 | 48 | 53 | 49 | ||||||||||||||||||||||||||||||||||||||||||||||||||||||||||
(a)Primarily includes operating lease income and commissions and other fees. Operating lease income was $682 million, $665 million, $666 million, $685 million and $704 million for the three months ended June 30, 2024, March 31, 2024, December 31, 2023, September 30, 2023 and June 30, 2023, respectively, and $1.3 billion and $1.4 billion for the six months ended June 30, 2024 and 2023, respectively.
(b)Included depreciation expense on leased assets of $430 million, $427 million, $425 million, $458 million and $445 million for the three months ended June 30, 2024, March 31, 2024, December 31, 2023, September 30, 2023 and June 30, 2023, respectively, and $857 million and $852 million for the six months ended June 30, 2024 and 2023, respectively.
(c)Included MSR risk management results of $39 million, $(1) million, $7 million, $111 million and $25 million for the three months ended June 30, 2024, March 31, 2024, December 31, 2023, September 30, 2023 and June 30, 2023, respectively, and $38 million and $13 million for the six months ended June 30, 2024 and 2023, respectively.
(d)In the second quarter of 2023, substantially all of the expense associated with First Republic was reported in Corporate. Commencing in the third quarter of 2023, the expense is now being allocated to the respective LOB.
Page 12
| JPMORGAN CHASE & CO. | | ||||||||||||||||||||||||||||||||||||||||||||||||||||||||||||||||
| CONSUMER & COMMUNITY BANKING | |||||||||||||||||||||||||||||||||||||||||||||||||||||||||||||||||
| FINANCIAL HIGHLIGHTS, CONTINUED | |||||||||||||||||||||||||||||||||||||||||||||||||||||||||||||||||
| (in millions, except employee data) | |||||||||||||||||||||||||||||||||||||||||||||||||||||||||||||||||
| QUARTERLY TRENDS | SIX MONTHS ENDED JUNE 30, | ||||||||||||||||||||||||||||||||||||||||||||||||||||||||||||||||
| 2Q24 Change | 2024 Change | ||||||||||||||||||||||||||||||||||||||||||||||||||||||||||||||||
| 2Q24 | 1Q24 | 4Q23 | 3Q23 | 2Q23 | 1Q24 | 2Q23 | 2024 | 2023 | 2023 | ||||||||||||||||||||||||||||||||||||||||||||||||||||||||
| SELECTED BALANCE SHEET DATA (period-end) | |||||||||||||||||||||||||||||||||||||||||||||||||||||||||||||||||
| Total assets | $ | 638,493 | $ | 629,122 | $ | 642,951 | $ | 626,196 | $ | 620,193 | 1 | % | 3 | % | $ | 638,493 | $ | 620,193 | 3 | % | |||||||||||||||||||||||||||||||||||||||||||||
| Loans: | |||||||||||||||||||||||||||||||||||||||||||||||||||||||||||||||||
| Banking & Wealth Management | 31,078 | 31,266 | 31,142 | 30,574 | 30,959 | (1) | — | 31,078 | 30,959 | — | |||||||||||||||||||||||||||||||||||||||||||||||||||||||
| Home Lending (a) | 250,032 | 254,243 | 259,181 | 261,858 | 262,432 | (2) | (5) | 250,032 | 262,432 | (5) | |||||||||||||||||||||||||||||||||||||||||||||||||||||||
| Card Services | 216,213 | 206,823 | 211,175 | 196,955 | 191,353 | 5 | 13 | 216,213 | 191,353 | 13 | |||||||||||||||||||||||||||||||||||||||||||||||||||||||
| Auto | 75,310 | 76,508 | 77,705 | 74,831 | 73,587 | (2) | 2 | 75,310 | 73,587 | 2 | |||||||||||||||||||||||||||||||||||||||||||||||||||||||
| Total loans | 572,633 | 568,840 | 579,203 | 564,218 | 558,331 | 1 | 3 | 572,633 | 558,331 | 3 | |||||||||||||||||||||||||||||||||||||||||||||||||||||||
| Deposits | 1,069,753 | 1,105,583 | 1,094,738 | (c) | 1,136,884 | 1,173,514 | (3) | (9) | 1,069,753 | 1,173,514 | (9) | ||||||||||||||||||||||||||||||||||||||||||||||||||||||
| Equity | 54,500 | 54,500 | 55,500 | 55,500 | 55,500 | — | (2) | 54,500 | 55,500 | (2) | |||||||||||||||||||||||||||||||||||||||||||||||||||||||
| SELECTED BALANCE SHEET DATA (average) | |||||||||||||||||||||||||||||||||||||||||||||||||||||||||||||||||
| Total assets | $ | 628,757 | $ | 627,862 | $ | 629,744 | $ | 622,760 | $ | 576,417 | — | 9 | $ | 628,309 | $ | 541,788 | 16 | ||||||||||||||||||||||||||||||||||||||||||||||||
| Loans: | |||||||||||||||||||||||||||||||||||||||||||||||||||||||||||||||||
| Banking & Wealth Management | 31,419 | 31,241 | 30,718 | 30,686 | 30,628 | 1 | 3 | 31,330 | 29,572 | 6 | |||||||||||||||||||||||||||||||||||||||||||||||||||||||
| Home Lending (b) | 254,385 | 257,866 | 261,394 | 264,041 | 229,569 | (1) | 11 | 256,126 | 201,005 | 27 | |||||||||||||||||||||||||||||||||||||||||||||||||||||||
| Card Services | 210,119 | 204,701 | 202,685 | 195,245 | 187,028 | 3 | 12 | 207,410 | 183,758 | 13 | |||||||||||||||||||||||||||||||||||||||||||||||||||||||
| Auto | 75,804 | 77,268 | 76,409 | 74,358 | 71,083 | (2) | 7 | 76,535 | 69,920 | 9 | |||||||||||||||||||||||||||||||||||||||||||||||||||||||
| Total loans | 571,727 | 571,076 | 571,206 | 564,330 | 518,308 | — | 10 | 571,401 | 484,255 | 18 | |||||||||||||||||||||||||||||||||||||||||||||||||||||||
| Deposits | 1,073,544 | 1,079,243 | 1,092,432 | (c) | 1,143,539 | 1,157,309 | (1) | (7) | 1,076,393 | 1,135,261 | (5) | ||||||||||||||||||||||||||||||||||||||||||||||||||||||
| Equity | 54,500 | 54,500 | 55,500 | 55,500 | 54,346 | — | — | 54,500 | 53,180 | 2 | |||||||||||||||||||||||||||||||||||||||||||||||||||||||
| Employees | 143,412 | 142,758 | 141,640 | 141,125 | 137,087 | — | 5 | 143,412 | 137,087 | 5 | |||||||||||||||||||||||||||||||||||||||||||||||||||||||
(a)At June 30, 2024, March 31, 2024, December 31, 2023, September 30, 2023 and June 30, 2023, Home Lending loans held-for-sale and loans at fair value were $5.9 billion, $4.8 billion, $3.4 billion, $4.1 billion and $3.9 billion, respectively.
(b)Average Home Lending loans held-for sale and loans at fair value were $7.7 billion, $4.7 billion, $4.7 billion, $5.7 billion and $5.3 billion for the three months ended June 30, 2024, March 31, 2024, December 31, 2023, September 30, 2023 and June 30, 2023, respectively, and $6.2 billion and $4.4 billion for the six months ended June 30, 2024 and 2023, respectively.
(c)In the fourth quarter of 2023, CCB transferred certain deposits associated with First Republic to AWM and CIB. Refer to page 67 of the Firm’s 2023 Form 10-K for additional information.
Page 13
| JPMORGAN CHASE & CO. | | ||||||||||||||||||||||||||||||||||||||||||||||||||||||||||
| CONSUMER & COMMUNITY BANKING | |||||||||||||||||||||||||||||||||||||||||||||||||||||||||||
| FINANCIAL HIGHLIGHTS, CONTINUED | |||||||||||||||||||||||||||||||||||||||||||||||||||||||||||
| (in millions, except ratio data) | QUARTERLY TRENDS | SIX MONTHS ENDED JUNE 30, | |||||||||||||||||||||||||||||||||||||||||||||||||||||||||
| 2Q24 Change | 2024 Change | ||||||||||||||||||||||||||||||||||||||||||||||||||||||||||
| 2Q24 | 1Q24 | 4Q23 | 3Q23 | 2Q23 | 1Q24 | 2Q23 | 2024 | 2023 | 2023 | ||||||||||||||||||||||||||||||||||||||||||||||||||
| CREDIT DATA AND QUALITY STATISTICS | |||||||||||||||||||||||||||||||||||||||||||||||||||||||||||
| Nonaccrual loans (a) | $ | 3,413 | $ | 3,647 | $ | 3,740 | $ | 3,690 | $ | 3,823 | (6) | % | (11) | % | $ | 3,413 | $ | 3,823 | (11) | % | |||||||||||||||||||||||||||||||||||||||
| Net charge-offs/(recoveries) | |||||||||||||||||||||||||||||||||||||||||||||||||||||||||||
| Banking & Wealth Management | 176 | 79 | 81 | 88 | 92 | 123 | 91 | 255 | 171 | 49 | |||||||||||||||||||||||||||||||||||||||||||||||||
| Home Lending | (40) | (7) | 6 | (16) | (28) | (471) | (43) | (47) | (46) | (2) | |||||||||||||||||||||||||||||||||||||||||||||||||
| Card Services | 1,830 | 1,688 | 1,426 | 1,227 | 1,124 | 8 | 63 | 3,518 | 2,046 | 72 | |||||||||||||||||||||||||||||||||||||||||||||||||
| Auto | 98 | 119 | 125 | 100 | 63 | (18) | 56 | 217 | 132 | 64 | |||||||||||||||||||||||||||||||||||||||||||||||||
| Total net charge-offs/(recoveries) | $ | 2,064 | $ | 1,879 | $ | 1,638 | $ | 1,399 | $ | 1,251 | 10 | 65 | $ | 3,943 | $ | 2,303 | 71 | ||||||||||||||||||||||||||||||||||||||||||
| Net charge-off/(recovery) rate | |||||||||||||||||||||||||||||||||||||||||||||||||||||||||||
| Banking & Wealth Management | 2.25 | % | 1.02 | % | 1.05 | % | 1.14 | % | 1.20 | % | 1.64 | % | 1.17 | % | |||||||||||||||||||||||||||||||||||||||||||||
| Home Lending | (0.07) | (0.01) | 0.01 | (0.02) | (0.05) | (0.04) | (0.05) | ||||||||||||||||||||||||||||||||||||||||||||||||||||
| Card Services | 3.50 | 3.32 | 2.79 | 2.49 | 2.41 | 3.41 | 2.25 | ||||||||||||||||||||||||||||||||||||||||||||||||||||
| Auto | 0.52 | 0.62 | 0.65 | 0.53 | 0.36 | 0.57 | 0.38 | ||||||||||||||||||||||||||||||||||||||||||||||||||||
| Total net charge-off/(recovery) rate | 1.47 | 1.33 | 1.15 | 0.99 | 0.98 | 1.40 | 0.97 | ||||||||||||||||||||||||||||||||||||||||||||||||||||
| 30+ day delinquency rate | |||||||||||||||||||||||||||||||||||||||||||||||||||||||||||
| Home Lending (b) | 0.70 | % | 0.70 | % | 0.66 | % | 0.59 | % | 0.58 | % | 0.70 | % | 0.58 | % | |||||||||||||||||||||||||||||||||||||||||||||
| Card Services | 2.08 | 2.23 | 2.14 | 1.94 | 1.70 | 2.08 | 1.70 | ||||||||||||||||||||||||||||||||||||||||||||||||||||
| Auto | 1.12 | 1.03 | 1.19 | 1.13 | 0.92 | 1.12 | 0.92 | ||||||||||||||||||||||||||||||||||||||||||||||||||||
| 90+ day delinquency rate - Card Services | 1.07 | 1.16 | 1.05 | 0.94 | 0.84 | 1.07 | 0.84 | ||||||||||||||||||||||||||||||||||||||||||||||||||||
| Allowance for loan losses | |||||||||||||||||||||||||||||||||||||||||||||||||||||||||||
| Banking & Wealth Management | $ | 685 | $ | 706 | $ | 685 | $ | 686 | $ | 731 | (3) | (6) | $ | 685 | $ | 731 | (6) | ||||||||||||||||||||||||||||||||||||||||||
| Home Lending | 437 | 432 | 578 | 573 | 777 | 1 | (44) | 437 | 777 | (44) | |||||||||||||||||||||||||||||||||||||||||||||||||
| Card Services | 13,206 | 12,606 | 12,453 | 11,901 | 11,600 | 5 | 14 | 13,206 | 11,600 | 14 | |||||||||||||||||||||||||||||||||||||||||||||||||
| Auto | 742 | 742 | 742 | 742 | 717 | — | 3 | 742 | 717 | 3 | |||||||||||||||||||||||||||||||||||||||||||||||||
| Total allowance for loan losses | $ | 15,070 | $ | 14,486 | $ | 14,458 | $ | 13,902 | $ | 13,825 | 4 | 9 | $ | 15,070 | $ | 13,825 | 9 | ||||||||||||||||||||||||||||||||||||||||||
(a)At June 30, 2024, March 31, 2024, December 31, 2023, September 30, 2023 and June 30, 2023, nonaccrual loans excluded mortgage loans 90 or more days past due and insured by U.S. government agencies of $96 million, $107 million, $123 million, $123 million and $139 million, respectively. These amounts have been excluded based upon the government guarantee. In addition, the Firm’s policy is generally to exempt credit card loans from being placed on nonaccrual status as permitted by regulatory guidance.
(b)At June 30, 2024, March 31, 2024, December 31, 2023, September 30, 2023 and June 30, 2023, excluded mortgage loans 30 or more days past due and insured by U.S. government agencies of $137 million, $147 million, $176 million, $175 million and $195 million, respectively. These amounts have been excluded based upon the government guarantee.
Page 14
| JPMORGAN CHASE & CO. | | |||||||||||||||||||||||||||||||||||||||||||||||||||||||||||||||||||
| CONSUMER & COMMUNITY BANKING | ||||||||||||||||||||||||||||||||||||||||||||||||||||||||||||||||||||
| FINANCIAL HIGHLIGHTS, CONTINUED | ||||||||||||||||||||||||||||||||||||||||||||||||||||||||||||||||||||
| (in millions, except ratio data and where otherwise noted) | ||||||||||||||||||||||||||||||||||||||||||||||||||||||||||||||||||||
| QUARTERLY TRENDS | SIX MONTHS ENDED JUNE 30, | |||||||||||||||||||||||||||||||||||||||||||||||||||||||||||||||||||
| 2Q24 Change | 2024 Change | |||||||||||||||||||||||||||||||||||||||||||||||||||||||||||||||||||
| 2Q24 | 1Q24 | 4Q23 | 3Q23 | 2Q23 | 1Q24 | 2Q23 | 2024 | 2023 | 2023 | |||||||||||||||||||||||||||||||||||||||||||||||||||||||||||
| BUSINESS METRICS | ||||||||||||||||||||||||||||||||||||||||||||||||||||||||||||||||||||
| Number of: | ||||||||||||||||||||||||||||||||||||||||||||||||||||||||||||||||||||
| Branches | 4,884 | 4,907 | 4,897 | 4,863 | 4,874 | — | % | — | % | 4,884 | 4,874 | — | % | |||||||||||||||||||||||||||||||||||||||||||||||||||||||
| Active digital customers (in thousands) (a) (b) | 69,011 | 68,496 | 66,983 | 66,765 | 65,559 | 1 | 5 | 69,011 | 65,559 | 5 | ||||||||||||||||||||||||||||||||||||||||||||||||||||||||||
| Active mobile customers (in thousands) (b) (c) | 55,564 | 54,674 | 53,828 | 53,221 | 51,963 | 2 | 7 | 55,564 | 51,963 | 7 | ||||||||||||||||||||||||||||||||||||||||||||||||||||||||||
| Debit and credit card sales volume (in billions) | $ | 453.7 | $ | 420.7 | $ | 441.0 | $ | 426.3 | $ | 424.0 | 8 | 7 | $ | 874.4 | $ | 811.3 | 8 | |||||||||||||||||||||||||||||||||||||||||||||||||||
| Total payments transaction volume (in trillions) (b) (d) | 1.6 | 1.5 | 1.5 | 1.5 | 1.5 | 7 | 7 | 3.1 | 2.9 | 7 | ||||||||||||||||||||||||||||||||||||||||||||||||||||||||||
| Banking & Wealth Management | ||||||||||||||||||||||||||||||||||||||||||||||||||||||||||||||||||||
| Average deposits | $ | 1,058,914 | $ | 1,065,562 | $ | 1,077,725 | $ | 1,127,807 | $ | 1,142,755 | (1) | (7) | $ | 1,062,238 | $ | 1,120,746 | (5) | |||||||||||||||||||||||||||||||||||||||||||||||||||
| Deposit margin | 2.72 | % | 2.71 | % | 2.82 | % | 2.92 | % | 2.83 | % | 2.71 | % | 2.81 | % | ||||||||||||||||||||||||||||||||||||||||||||||||||||||
| Business Banking average loans | $ | 19,461 | $ | 19,447 | $ | 19,511 | $ | 19,520 | $ | 19,628 | — | (1) | $ | 19,454 | $ | 19,755 | (2) | |||||||||||||||||||||||||||||||||||||||||||||||||||
| Business Banking origination volume | 1,312 | 1,130 | 1,130 | 1,321 | 1,275 | 16 | 3 | 2,442 | 2,302 | 6 | ||||||||||||||||||||||||||||||||||||||||||||||||||||||||||
| Client investment assets (e) | 1,013,680 | 1,010,315 | 951,115 | 882,253 | 892,897 | — | 14 | 1,013,680 | 892,897 | 14 | ||||||||||||||||||||||||||||||||||||||||||||||||||||||||||
| Number of client advisors | 5,672 | 5,571 | 5,456 | 5,424 | 5,153 | 2 | 10 | 5,672 | 5,153 | 10 | ||||||||||||||||||||||||||||||||||||||||||||||||||||||||||
| Home Lending (in billions) | ||||||||||||||||||||||||||||||||||||||||||||||||||||||||||||||||||||
| Mortgage origination volume by channel | ||||||||||||||||||||||||||||||||||||||||||||||||||||||||||||||||||||
| Retail | $ | 6.9 | $ | 4.4 | $ | 4.7 | $ | 6.8 | $ | 7.3 | 57 | (5) | $ | 11.3 | $ | 10.9 | 4 | |||||||||||||||||||||||||||||||||||||||||||||||||||
| Correspondent | 3.8 | 2.2 | 2.5 | 4.2 | 3.9 | 73 | (3) | 6.0 | 6.0 | — | ||||||||||||||||||||||||||||||||||||||||||||||||||||||||||
| Total mortgage origination volume (f) | $ | 10.7 | $ | 6.6 | $ | 7.2 | $ | 11.0 | $ | 11.2 | 62 | (4) | $ | 17.3 | $ | 16.9 | 2 | |||||||||||||||||||||||||||||||||||||||||||||||||||
| Third-party mortgage loans serviced (period-end) | 642.8 | 626.2 | 631.2 | 637.8 | 604.5 | 3 | 6 | 642.8 | 604.5 | 6 | ||||||||||||||||||||||||||||||||||||||||||||||||||||||||||
| MSR carrying value (period-end) | 8.8 | 8.6 | 8.5 | 9.1 | 8.2 | 2 | 7 | 8.8 | 8.2 | 7 | ||||||||||||||||||||||||||||||||||||||||||||||||||||||||||
| Card Services | ||||||||||||||||||||||||||||||||||||||||||||||||||||||||||||||||||||
| Sales volume, excluding commercial card (in billions) | $ | 316.6 | $ | 291.0 | $ | 307.2 | $ | 296.2 | $ | 294.0 | 9 | 8 | 607.6 | 560.2 | 8 | |||||||||||||||||||||||||||||||||||||||||||||||||||||
| Net revenue rate | 9.61 | % | 10.09 | % | 9.82 | % | 9.60 | % | 9.11 | % | 9.85 | % | 9.73 | % | ||||||||||||||||||||||||||||||||||||||||||||||||||||||
| Net yield on average loans | 9.46 | 9.90 | 9.70 | 9.54 | 9.31 | 9.67 | 9.60 | |||||||||||||||||||||||||||||||||||||||||||||||||||||||||||||
| Auto | ||||||||||||||||||||||||||||||||||||||||||||||||||||||||||||||||||||
| Loan and lease origination volume (in billions) | $ | 10.8 | $ | 8.9 | $ | 9.9 | $ | 10.2 | $ | 12.0 | 21 | (10) | $ | 19.7 | $ | 21.2 | (7) | |||||||||||||||||||||||||||||||||||||||||||||||||||
| Average auto operating lease assets | 10,693 | 10,435 | 10,440 | 10,701 | 11,015 | 2 | (3) | 10,564 | 11,275 | (6) | ||||||||||||||||||||||||||||||||||||||||||||||||||||||||||
(a)Users of all web and/or mobile platforms who have logged in within the past 90 days.
(b)Excludes First Republic accounts not yet converted to JPMorgan Chase platforms.
(c)Users of all mobile platforms who have logged in within the past 90 days.
(d)Total payments transaction volume includes debit and credit card sales volume and gross outflows of ACH, ATM, teller, wires, BillPay, PayChase, Zelle, person-to-person and checks.
(e)Includes assets invested in managed accounts and J.P. Morgan mutual funds where AWM is the investment manager. Refer to AWM segment results on pages 20-22 for additional information.
(f)Firmwide mortgage origination volume was $12.3 billion, $7.6 billion, $8.6 billion, $13.0 billion and $13.0 billion for the three months ended June 30, 2024, March 31, 2024, December 31, 2023, September 30, 2023 and June 30, 2023, respectively, and $19.9 billion and $19.8 billion for the six months ended June 30, 2024 and 2023, respectively.
Page 15
| JPMORGAN CHASE & CO. | | ||||||||||||||||||||||||||||||||||||||||||||||||||||||||||||||||
| COMMERCIAL & INVESTMENT BANK | |||||||||||||||||||||||||||||||||||||||||||||||||||||||||||||||||
| FINANCIAL HIGHLIGHTS | |||||||||||||||||||||||||||||||||||||||||||||||||||||||||||||||||
| (in millions, except ratio data) | |||||||||||||||||||||||||||||||||||||||||||||||||||||||||||||||||
| QUARTERLY TRENDS | SIX MONTHS ENDED JUNE 30, | ||||||||||||||||||||||||||||||||||||||||||||||||||||||||||||||||
| 2Q24 Change | 2024 Change | ||||||||||||||||||||||||||||||||||||||||||||||||||||||||||||||||
| 2Q24 | 1Q24 | 4Q23 | 3Q23 | 2Q23 | 1Q24 | 2Q23 | 2024 | 2023 | 2023 | ||||||||||||||||||||||||||||||||||||||||||||||||||||||||
| INCOME STATEMENT | |||||||||||||||||||||||||||||||||||||||||||||||||||||||||||||||||
| REVENUE | |||||||||||||||||||||||||||||||||||||||||||||||||||||||||||||||||
| Investment banking fees | $ | 2,356 | $ | 2,014 | $ | 1,667 | $ | 1,729 | $ | 1,569 | 17 | % | 50 | % | $ | 4,370 | $ | 3,235 | 35 | % | |||||||||||||||||||||||||||||||||||||||||||||
| Principal transactions | 6,691 | 6,634 | 3,649 | 5,971 | 6,742 | 1 | (1) | 13,325 | 14,174 | (6) | |||||||||||||||||||||||||||||||||||||||||||||||||||||||
| Lending- and deposit-related fees | 924 | 973 | 909 | 966 | 782 | (5) | 18 | 1,897 | 1,548 | 23 | |||||||||||||||||||||||||||||||||||||||||||||||||||||||
| Commissions and other fees | 1,337 | 1,272 | 1,208 | 1,184 | 1,238 | 5 | 8 | 2,609 | 2,487 | 5 | |||||||||||||||||||||||||||||||||||||||||||||||||||||||
| Card income | 579 | 525 | 552 | 572 | 601 | 10 | (4) | 1,104 | 1,089 | 1 | |||||||||||||||||||||||||||||||||||||||||||||||||||||||
| All other income | 857 | 743 | 1,041 | 420 | 705 | 15 | 22 | 1,600 | 1,408 | 14 | |||||||||||||||||||||||||||||||||||||||||||||||||||||||
| Noninterest revenue | 12,744 | 12,161 | 9,026 | 10,842 | 11,637 | 5 | 10 | 24,905 | 23,941 | 4 | |||||||||||||||||||||||||||||||||||||||||||||||||||||||
| Net interest income | 5,173 | 5,423 | 5,948 | 4,919 | 4,870 | (5) | 6 | 10,596 | 9,677 | 9 | |||||||||||||||||||||||||||||||||||||||||||||||||||||||
| TOTAL NET REVENUE (a) | 17,917 | 17,584 | 14,974 | 15,761 | 16,507 | 2 | 9 | 35,501 | 33,618 | 6 | |||||||||||||||||||||||||||||||||||||||||||||||||||||||
| Provision for credit losses | 384 | 1 | 576 | (95) | 1,135 | NM | (66) | 385 | 1,610 | (76) | |||||||||||||||||||||||||||||||||||||||||||||||||||||||
| NONINTEREST EXPENSE | |||||||||||||||||||||||||||||||||||||||||||||||||||||||||||||||||
| Compensation expense | 4,752 | 4,896 | 4,107 | 4,155 | 4,117 | (3) | 15 | 9,648 | 8,843 | 9 | |||||||||||||||||||||||||||||||||||||||||||||||||||||||
| Noncompensation expense | 4,414 | 3,828 | 4,062 | 4,663 | 4,077 | 15 | 8 | 8,242 | 8,142 | 1 | |||||||||||||||||||||||||||||||||||||||||||||||||||||||
| TOTAL NONINTEREST EXPENSE | 9,166 | 8,724 | 8,169 | 8,818 | 8,194 | 5 | 12 | 17,890 | 16,985 | 5 | |||||||||||||||||||||||||||||||||||||||||||||||||||||||
| Income before income tax expense | 8,367 | 8,859 | 6,229 | 7,038 | 7,178 | (6) | 17 | 17,226 | 15,023 | 15 | |||||||||||||||||||||||||||||||||||||||||||||||||||||||
| Income tax expense | 2,470 | 2,237 | 2,052 | 2,011 | 1,878 | 10 | 32 | 4,707 | 3,955 | 19 | |||||||||||||||||||||||||||||||||||||||||||||||||||||||
| NET INCOME | $ | 5,897 | $ | 6,622 | $ | 4,177 | $ | 5,027 | $ | 5,300 | (11) | 11 | $ | 12,519 | $ | 11,068 | 13 | ||||||||||||||||||||||||||||||||||||||||||||||||
| FINANCIAL RATIOS | |||||||||||||||||||||||||||||||||||||||||||||||||||||||||||||||||
| ROE | 17 | % | 20 | % | 11 | % | 14 | % | 15 | % | 18 | % | 16 | % | |||||||||||||||||||||||||||||||||||||||||||||||||||
| Overhead ratio | 51 | 50 | 55 | 56 | 50 | 50 | 51 | ||||||||||||||||||||||||||||||||||||||||||||||||||||||||||
| Compensation expense as percentage of total net revenue | 27 | 28 | 27 | 26 | 25 | 27 | 26 | ||||||||||||||||||||||||||||||||||||||||||||||||||||||||||
| REVENUE BY BUSINESS | |||||||||||||||||||||||||||||||||||||||||||||||||||||||||||||||||
| Investment Banking | $ | 2,464 | $ | 2,216 | $ | 1,783 | $ | 1,818 | $ | 1,687 | 11 | 46 | $ | 4,680 | $ | 3,475 | 35 | ||||||||||||||||||||||||||||||||||||||||||||||||
| Payments | 4,546 | 4,466 | 4,456 | 4,217 | 4,714 | 2 | (4) | 9,012 | 9,145 | (1) | |||||||||||||||||||||||||||||||||||||||||||||||||||||||
| Lending | 1,936 | 1,724 | 1,763 | 1,934 | 1,749 | 12 | 11 | 3,660 | 3,199 | 14 | |||||||||||||||||||||||||||||||||||||||||||||||||||||||
| Other | 4 | (3) | 36 | 24 | 38 | NM | (89) | 1 | 47 | (98) | |||||||||||||||||||||||||||||||||||||||||||||||||||||||
| Total Banking & Payments | 8,950 | 8,403 | 8,038 | 7,993 | 8,188 | 7 | 9 | 17,353 | 15,866 | 9 | |||||||||||||||||||||||||||||||||||||||||||||||||||||||
| Fixed Income Markets | 4,822 | 5,327 | 4,068 | 4,548 | 4,608 | (9) | 5 | 10,149 | 10,361 | (2) | |||||||||||||||||||||||||||||||||||||||||||||||||||||||
| Equity Markets | 2,971 | 2,686 | 1,779 | 2,069 | 2,454 | 11 | 21 | 5,657 | 5,139 | 10 | |||||||||||||||||||||||||||||||||||||||||||||||||||||||
| Securities Services | 1,261 | 1,183 | 1,191 | 1,212 | 1,221 | 7 | 3 | 2,444 | 2,369 | 3 | |||||||||||||||||||||||||||||||||||||||||||||||||||||||
| Credit Adjustments & Other (b) | (87) | (15) | (102) | (61) | 36 | (480) | NM | (102) | (117) | 13 | |||||||||||||||||||||||||||||||||||||||||||||||||||||||
| Total Markets & Securities Services | 8,967 | 9,181 | 6,936 | 7,768 | 8,319 | (2) | 8 | 18,148 | 17,752 | 2 | |||||||||||||||||||||||||||||||||||||||||||||||||||||||
| TOTAL NET REVENUE | $ | 17,917 | $ | 17,584 | $ | 14,974 | $ | 15,761 | $ | 16,507 | 2 | 9 | $ | 35,501 | $ | 33,618 | 6 | ||||||||||||||||||||||||||||||||||||||||||||||||
| Banking & Payments revenue by client coverage segment (c) | |||||||||||||||||||||||||||||||||||||||||||||||||||||||||||||||||
| Global Corporate Banking & Global Investment Banking | $ | 6,141 | $ | 5,820 | $ | 5,415 | $ | 5,469 | $ | 5,452 | 6 | % | 13 | % | $ | 11,961 | $ | 10,816 | 11 | % | |||||||||||||||||||||||||||||||||||||||||||||
| Commercial Banking | 2,860 | 2,837 | 2,949 | 2,874 | 2,801 | 1 | 2 | 5,697 | 5,227 | 9 | |||||||||||||||||||||||||||||||||||||||||||||||||||||||
| Middle Market Banking | 1,936 | 1,927 | 2,010 | 1,949 | 1,996 | — | (3) | 3,863 | 3,781 | 2 | |||||||||||||||||||||||||||||||||||||||||||||||||||||||
| Commercial Real Estate Banking | 924 | 910 | 939 | 925 | 805 | 2 | 15 | 1,834 | 1,446 | 27 | |||||||||||||||||||||||||||||||||||||||||||||||||||||||
| Other | (51) | (254) | (326) | (350) | (65) | 80 | 22 | (305) | (177) | (72) | |||||||||||||||||||||||||||||||||||||||||||||||||||||||
| Total Banking & Payments revenue | $ | 8,950 | $ | 8,403 | $ | 8,038 | $ | 7,993 | $ | 8,188 | 7 | 9 | $ | 17,353 | $ | 15,866 | 9 | ||||||||||||||||||||||||||||||||||||||||||||||||
(a)Included tax equivalent adjustments primarily from income tax credits from investments in alternative energy, affordable housing and new markets, income from tax-exempt securities and loans, as well as the related amortization and other tax benefits of the investments in alternative energy and affordable housing of $737 million, $557 million, $1.3 billion, $746 million and $1.0 billion for the three months ended June 30, 2024, March 31, 2024, December 31, 2023, September 30, 2023 and June 30, 2023, respectively, and $1.3 billion and $2.0 billion for the six months ended June 30, 2024 and 2023, respectively. Effective January 1, 2024, the Firm adopted updates to the Accounting for Investments in Tax Credit Structures Using the Proportional Amortization Method guidance, under the modified retrospective method. Refer to page 4 for additional information.
(b)Consists primarily of centrally managed credit valuation adjustments (“CVA”), funding valuation adjustments (“FVA”) on derivatives, other valuation adjustments, and certain components of fair value option elected liabilities, which are primarily reported in principal transactions revenue. Results are presented net of associated hedging activities and net of CVA and FVA amounts allocated to Fixed Income Markets and Equity Markets.
(c)Refer to page 29 for a description of each of the client coverage segments.
Page 16
| JPMORGAN CHASE & CO. | | ||||||||||||||||||||||||||||||||||||||||||||||||||||||||||||||||
| COMMERCIAL & INVESTMENT BANK | |||||||||||||||||||||||||||||||||||||||||||||||||||||||||||||||||
| FINANCIAL HIGHLIGHTS, CONTINUED | |||||||||||||||||||||||||||||||||||||||||||||||||||||||||||||||||
| (in millions, except ratio and employee data) | |||||||||||||||||||||||||||||||||||||||||||||||||||||||||||||||||
| QUARTERLY TRENDS | SIX MONTHS ENDED JUNE 30, | ||||||||||||||||||||||||||||||||||||||||||||||||||||||||||||||||
| 2Q24 Change | 2024 Change | ||||||||||||||||||||||||||||||||||||||||||||||||||||||||||||||||
| 2Q24 | 1Q24 | 4Q23 | 3Q23 | 2Q23 | 1Q24 | 2Q23 | 2024 | 2023 | 2023 | ||||||||||||||||||||||||||||||||||||||||||||||||||||||||
| SELECTED BALANCE SHEET DATA (period-end) | |||||||||||||||||||||||||||||||||||||||||||||||||||||||||||||||||
| Total assets | $ | 1,939,038 | $ | 1,898,251 | $ | 1,638,493 | $ | 1,746,598 | $ | 1,737,334 | 2 | % | 12 | % | $ | 1,939,038 | $ | 1,737,334 | 12 | % | |||||||||||||||||||||||||||||||||||||||||||||
| Loans: | |||||||||||||||||||||||||||||||||||||||||||||||||||||||||||||||||
| Loans retained | 475,880 | 475,454 | 475,186 | 475,644 | 476,574 | — | — | 475,880 | 476,574 | — | |||||||||||||||||||||||||||||||||||||||||||||||||||||||
| Loans held-for-sale and loans at fair value (a) | 41,737 | 40,746 | 39,464 | 39,984 | 40,499 | 2 | 3 | 41,737 | 40,499 | 3 | |||||||||||||||||||||||||||||||||||||||||||||||||||||||
| Total loans | 517,617 | 516,200 | 514,650 | 515,628 | 517,073 | — | — | 517,617 | 517,073 | — | |||||||||||||||||||||||||||||||||||||||||||||||||||||||
| Equity | 132,000 | 132,000 | 138,000 | 138,000 | 138,000 | — | (4) | 132,000 | 138,000 | (4) | |||||||||||||||||||||||||||||||||||||||||||||||||||||||
| Banking & Payments loans by client coverage segment (period-end) (b) | |||||||||||||||||||||||||||||||||||||||||||||||||||||||||||||||||
| Global Corporate Banking & Global Investment Banking | $ | 132,592 | $ | 129,179 | $ | 128,097 | $ | 130,133 | $ | 133,535 | 3 | (1) | $ | 132,592 | $ | 133,535 | (1) | ||||||||||||||||||||||||||||||||||||||||||||||||
| Commercial Banking | 220,222 | 223,474 | 221,550 | 222,368 | 222,782 | (1) | (1) | 220,222 | 222,782 | (1) | |||||||||||||||||||||||||||||||||||||||||||||||||||||||
| Middle Market Banking | 75,488 | 79,207 | 78,043 | 78,955 | 79,885 | (5) | (6) | 75,488 | 79,885 | (6) | |||||||||||||||||||||||||||||||||||||||||||||||||||||||
| Commercial Real Estate Banking | 144,734 | 144,267 | 143,507 | 143,413 | 142,897 | — | 1 | 144,734 | 142,897 | 1 | |||||||||||||||||||||||||||||||||||||||||||||||||||||||
| Other | 266 | 588 | 526 | 291 | 371 | (55) | (28) | 266 | 371 | (28) | |||||||||||||||||||||||||||||||||||||||||||||||||||||||
| Total Banking & Payments loans | 353,080 | 353,241 | 350,173 | 352,792 | 356,688 | — | (1) | 353,080 | 356,688 | (1) | |||||||||||||||||||||||||||||||||||||||||||||||||||||||
| SELECTED BALANCE SHEET DATA (average) | |||||||||||||||||||||||||||||||||||||||||||||||||||||||||||||||||
| Total assets | $ | 1,915,880 | $ | 1,794,118 | $ | 1,703,717 | $ | 1,725,146 | $ | 1,752,732 | 7 | 9 | $ | 1,854,999 | $ | 1,719,118 | 8 | ||||||||||||||||||||||||||||||||||||||||||||||||
| Trading assets - debt and equity instruments | 638,473 | 580,899 | 490,268 | 522,843 | 533,092 | 10 | 20 | 609,686 | 511,066 | 19 | |||||||||||||||||||||||||||||||||||||||||||||||||||||||
| Trading assets - derivative receivables | 58,850 | 57,268 | 62,481 | 65,800 | 63,118 | 3 | (7) | 58,059 | 63,578 | (9) | |||||||||||||||||||||||||||||||||||||||||||||||||||||||
| Loans: | |||||||||||||||||||||||||||||||||||||||||||||||||||||||||||||||||
| Loans retained | 471,861 | 471,187 | 473,879 | 475,285 | 459,244 | — | 3 | 471,524 | 440,914 | 7 | |||||||||||||||||||||||||||||||||||||||||||||||||||||||
| Loans held-for-sale and loans at fair value (a) | 42,868 | 43,537 | 40,415 | 40,605 | 38,858 | (2) | 10 | 43,202 | 41,278 | 5 | |||||||||||||||||||||||||||||||||||||||||||||||||||||||
| Total loans | 514,729 | 514,724 | 514,294 | 515,890 | 498,102 | — | 3 | 514,726 | 482,192 | 7 | |||||||||||||||||||||||||||||||||||||||||||||||||||||||
| Deposits | 1,046,993 | 1,045,788 | 1,032,226 | (c) | 988,765 | 998,014 | — | 5 | 1,046,391 | 981,861 | 7 | ||||||||||||||||||||||||||||||||||||||||||||||||||||||
| Equity | 132,000 | 132,000 | 138,000 | 138,000 | 137,505 | — | (4) | 132,000 | 137,005 | (4) | |||||||||||||||||||||||||||||||||||||||||||||||||||||||
| Banking & Payments loans by client coverage segment (average) (b) | |||||||||||||||||||||||||||||||||||||||||||||||||||||||||||||||||
| Global Corporate Banking & Global Investment Banking | $ | 130,320 | $ | 127,403 | $ | 130,287 | $ | 132,394 | $ | 131,852 | 2 | (1) | $ | 128,861 | $ | 131,118 | (2) | ||||||||||||||||||||||||||||||||||||||||||||||||
| Commercial Banking | 220,767 | 222,323 | 222,057 | 221,729 | 211,431 | (1) | 4 | 221,545 | 196,385 | 13 | |||||||||||||||||||||||||||||||||||||||||||||||||||||||
| Middle Market Banking | 76,229 | 78,364 | 78,601 | 78,774 | 78,037 | (3) | (2) | 77,296 | 75,547 | 2 | |||||||||||||||||||||||||||||||||||||||||||||||||||||||
| Commercial Real Estate Banking | 144,538 | 143,959 | 143,456 | 142,955 | 133,394 | — | 8 | 144,249 | 120,838 | 19 | |||||||||||||||||||||||||||||||||||||||||||||||||||||||
| Other | 360 | 590 | 449 | 435 | 227 | (39) | 59 | 475 | 218 | 118 | |||||||||||||||||||||||||||||||||||||||||||||||||||||||
| Total Banking & Payments loans | 351,447 | 350,316 | 352,793 | 354,558 | 343,510 | — | 2 | 350,881 | 327,721 | 7 | |||||||||||||||||||||||||||||||||||||||||||||||||||||||
| Employees | 93,387 | 92,478 | 92,271 | 92,181 | 90,813 | 1 | 3 | 93,387 | 90,813 | 3 | |||||||||||||||||||||||||||||||||||||||||||||||||||||||
(a)Loans held-for-sale and loans at fair value primarily reflect lending-related positions originated and purchased in Markets, including loans held for securitization.
(b)Refer to page 29 for a description of each of the client coverage segments.
(c)In the fourth quarter of 2023, certain deposits associated with First Republic were transferred from CCB. Refer to page 67 of the Firm’s 2023 Form 10-K for additional information.
Page 17
Page 18
| JPMORGAN CHASE & CO. | | ||||||||||||||||||||||||||||||||||||||||||||||||||||||||||||||||
| COMMERCIAL & INVESTMENT BANK | |||||||||||||||||||||||||||||||||||||||||||||||||||||||||||||||||
| FINANCIAL HIGHLIGHTS, CONTINUED | |||||||||||||||||||||||||||||||||||||||||||||||||||||||||||||||||
| (in millions, except ratio and employee data) | |||||||||||||||||||||||||||||||||||||||||||||||||||||||||||||||||
| QUARTERLY TRENDS | SIX MONTHS ENDED JUNE 30, | ||||||||||||||||||||||||||||||||||||||||||||||||||||||||||||||||
| 2Q24 Change | 2024 Change | ||||||||||||||||||||||||||||||||||||||||||||||||||||||||||||||||
| 2Q24 | 1Q24 | 4Q23 | 3Q23 | 2Q23 | 1Q24 | 2Q23 | 2024 | 2023 | 2023 | ||||||||||||||||||||||||||||||||||||||||||||||||||||||||
| CREDIT DATA AND QUALITY STATISTICS | |||||||||||||||||||||||||||||||||||||||||||||||||||||||||||||||||
| Net charge-offs/(recoveries) | $ | 164 | $ | 69 | $ | 247 | $ | 98 | $ | 156 | 138 | 5 | $ | 233 | $ | 243 | (4) | ||||||||||||||||||||||||||||||||||||||||||||||||
| Nonperforming assets: | |||||||||||||||||||||||||||||||||||||||||||||||||||||||||||||||||
| Nonaccrual loans: | |||||||||||||||||||||||||||||||||||||||||||||||||||||||||||||||||
| Nonaccrual loans retained (a) | 2,631 | 2,146 | 1,675 | 1,867 | 1,992 | 23 | 32 | 2,631 | 1,992 | 32 | |||||||||||||||||||||||||||||||||||||||||||||||||||||||
| Nonaccrual loans held-for-sale and loans at fair value (b) | 988 | 1,093 | 828 | 825 | 818 | (10) | 21 | 988 | 818 | 21 | |||||||||||||||||||||||||||||||||||||||||||||||||||||||
| Total nonaccrual loans | 3,619 | 3,239 | 2,503 | 2,692 | 2,810 | 12 | 29 | 3,619 | 2,810 | 29 | |||||||||||||||||||||||||||||||||||||||||||||||||||||||
| Derivative receivables | 290 | 293 | 364 | 293 | 286 | (1) | 1 | 290 | 286 | 1 | |||||||||||||||||||||||||||||||||||||||||||||||||||||||
| Assets acquired in loan satisfactions | 220 | 159 | 169 | 173 | 133 | 38 | 65 | 220 | 133 | 65 | |||||||||||||||||||||||||||||||||||||||||||||||||||||||
| Total nonperforming assets | 4,129 | 3,691 | 3,036 | 3,158 | 3,229 | 12 | 28 | 4,129 | 3,229 | 28 | |||||||||||||||||||||||||||||||||||||||||||||||||||||||
| Allowance for credit losses: | |||||||||||||||||||||||||||||||||||||||||||||||||||||||||||||||||
| Allowance for loan losses | 7,344 | 7,291 | 7,326 | 7,135 | 7,260 | 1 | 1 | 7,344 | 7,260 | 1 | |||||||||||||||||||||||||||||||||||||||||||||||||||||||
| Allowance for lending-related commitments | 1,930 | 1,785 | 1,849 | 1,940 | 2,008 | 8 | (4) | 1,930 | 2,008 | (4) | |||||||||||||||||||||||||||||||||||||||||||||||||||||||
| Total allowance for credit losses | 9,274 | 9,076 | 9,175 | 9,075 | 9,268 | 2 | — | 9,274 | 9,268 | — | |||||||||||||||||||||||||||||||||||||||||||||||||||||||
| Net charge-off/(recovery) rate (c) | 0.14 | % | 0.06 | % | 0.21 | % | 0.08 | % | 0.14 | % | 0.10 | % | 0.11 | % | |||||||||||||||||||||||||||||||||||||||||||||||||||
| Allowance for loan losses to period-end loans retained | 1.54 | 1.53 | 1.54 | 1.50 | 1.52 | 1.54 | 1.52 | ||||||||||||||||||||||||||||||||||||||||||||||||||||||||||
| Allowance for loan losses to nonaccrual loans retained (a) | 279 | 340 | 437 | 382 | 364 | 279 | 364 | ||||||||||||||||||||||||||||||||||||||||||||||||||||||||||
| Nonaccrual loans to total period-end loans | 0.70 | 0.63 | 0.49 | 0.52 | 0.54 | 0.70 | 0.54 | ||||||||||||||||||||||||||||||||||||||||||||||||||||||||||
(a)Allowance for loan losses of $452 million, $375 million, $251 million, $346 million and $350 million were held against these nonaccrual loans at June 30, 2024, March 31, 2024, December 31, 2023, September 30, 2023 and June 30, 2023, respectively.
(b)At June 30, 2024, March 31, 2024, December 31, 2023, September 30, 2023 and June 30, 2023, nonaccrual loans excluded mortgage loans 90 or more days past due and insured by U.S. government agencies of $42 million, $50 million, $59 million, $65 million and $76 million, respectively. These amounts have been excluded based upon the government guarantee.
(c)Loans held-for-sale and loans at fair value were excluded when calculating the net charge-off/(recovery) rate.
.
Page 19
| JPMORGAN CHASE & CO. | | ||||||||||||||||||||||||||||||||||||||||||||||||||||||||||||||||
| COMMERCIAL & INVESTMENT BANK | |||||||||||||||||||||||||||||||||||||||||||||||||||||||||||||||||
| FINANCIAL HIGHLIGHTS, CONTINUED | |||||||||||||||||||||||||||||||||||||||||||||||||||||||||||||||||
| (in millions, except where otherwise noted) | |||||||||||||||||||||||||||||||||||||||||||||||||||||||||||||||||
| QUARTERLY TRENDS | SIX MONTHS ENDED JUNE 30, | ||||||||||||||||||||||||||||||||||||||||||||||||||||||||||||||||
| 2Q24 Change | 2024 Change | ||||||||||||||||||||||||||||||||||||||||||||||||||||||||||||||||
| 2Q24 | 1Q24 | 4Q23 | 3Q23 | 2Q23 | 1Q24 | 2Q23 | 2024 | 2023 | 2023 | ||||||||||||||||||||||||||||||||||||||||||||||||||||||||
| BUSINESS METRICS | |||||||||||||||||||||||||||||||||||||||||||||||||||||||||||||||||
| Advisory | $ | 785 | $ | 598 | $ | 751 | $ | 767 | $ | 540 | 31 | % | 45 | % | $ | 1,383 | $ | 1,296 | 7 | % | |||||||||||||||||||||||||||||||||||||||||||||
| Equity underwriting | 495 | 355 | 324 | 274 | 318 | 39 | 56 | 850 | 553 | 54 | |||||||||||||||||||||||||||||||||||||||||||||||||||||||
| Debt underwriting | 1,076 | 1,061 | 592 | 688 | 711 | 1 | 51 | 2,137 | 1,386 | 54 | |||||||||||||||||||||||||||||||||||||||||||||||||||||||
| Total investment banking fees | $ | 2,356 | $ | 2,014 | $ | 1,667 | $ | 1,729 | $ | 1,569 | 17 | 50 | $ | 4,370 | $ | 3,235 | 35 | ||||||||||||||||||||||||||||||||||||||||||||||||
| Client deposits and other third-party liabilities (average) (a) | 936,725 | 931,603 | 928,561 | 900,292 | 922,702 | 1 | 2 | 934,164 | 911,265 | 3 | |||||||||||||||||||||||||||||||||||||||||||||||||||||||
| Assets under custody (“AUC”) (period-end) (in billions) | $ | 34,024 | $ | 33,985 | $ | 32,392 | $ | 29,725 | $ | 30,424 | — | 12 | $ | 34,024 | $ | 30,424 | 12 | ||||||||||||||||||||||||||||||||||||||||||||||||
| 95% Confidence Level - Total CIB VaR (average) (b) | |||||||||||||||||||||||||||||||||||||||||||||||||||||||||||||||||
| CIB trading VaR by risk type: (c) | |||||||||||||||||||||||||||||||||||||||||||||||||||||||||||||||||
| Fixed income | $ | 31 | $ | 35 | $ | 35 | $ | 49 | $ | 57 | (11) | (46) | |||||||||||||||||||||||||||||||||||||||||||||||||||||
| Foreign exchange | 18 | 13 | 10 | 17 | 12 | 38 | 50 | ||||||||||||||||||||||||||||||||||||||||||||||||||||||||||
| Equities | 7 | 6 | 5 | 7 | 8 | 17 | (13) | ||||||||||||||||||||||||||||||||||||||||||||||||||||||||||
| Commodities and other | 9 | 7 | 8 | 10 | 12 | 29 | (25) | ||||||||||||||||||||||||||||||||||||||||||||||||||||||||||
| Diversification benefit to CIB trading VaR (d) | (32) | (29) | (29) | (48) | (48) | (10) | 33 | ||||||||||||||||||||||||||||||||||||||||||||||||||||||||||
| CIB trading VaR (c) | 33 | 32 | 29 | 35 | 41 | 3 | (20) | ||||||||||||||||||||||||||||||||||||||||||||||||||||||||||
| Credit Portfolio VaR (e) | 21 | 24 | 16 | 15 | 14 | (13) | 50 | ||||||||||||||||||||||||||||||||||||||||||||||||||||||||||
| Diversification benefit to CIB VaR (d) | (16) | (15) | (13) | (12) | (11) | (7) | (45) | ||||||||||||||||||||||||||||||||||||||||||||||||||||||||||
| CIB VaR | $ | 38 | $ | 41 | $ | 32 | $ | 38 | $ | 44 | (7) | (14) | |||||||||||||||||||||||||||||||||||||||||||||||||||||
(a)Client deposits and other third-party liabilities pertain to the Payments and Securities Services businesses.
(b)The impact of the CIB business segment reorganization was not material to Total CIB VaR. Prior periods have not been revised.
(c)CIB trading VaR includes substantially all market-making and client-driven activities, as well as certain risk management activities in CIB, including credit spread sensitivity to CVA. Refer to VaR measurement on pages 137–139 of the Firm’s 2023 Form 10-K for further information and pages 71–72 of the Firm’s Quarterly Report on Form 10-Q for the quarterly period ended March 31, 2024 for further information.
(d)Diversification benefit represents the difference between the portfolio VaR and the sum of its individual components. This reflects the non-additive nature of VaR due to imperfect correlation across CIB risks.
(e)Credit Portfolio VaR includes the derivative CVA, hedges of the CVA and credit protection purchased against certain retained loans and lending-related commitments, which are reported in principal transactions revenue. This VaR does not include the retained loan portfolio, which is not reported at fair value. In line with the Firm's internal model governance, the credit risk component of CVA related to certain counterparties was removed from Credit Portfolio VaR due to the widening of the credit spreads for those counterparties to elevated levels. The related hedges were also removed to maintain consistency. This exposure is now reflected in other sensitivity-based measures.
Page 20
| JPMORGAN CHASE & CO. | | ||||||||||||||||||||||||||||||||||||||||||||||||||||||||||||||||
| ASSET & WEALTH MANAGEMENT | |||||||||||||||||||||||||||||||||||||||||||||||||||||||||||||||||
| FINANCIAL HIGHLIGHTS | |||||||||||||||||||||||||||||||||||||||||||||||||||||||||||||||||
| (in millions, except ratio and employee data) | |||||||||||||||||||||||||||||||||||||||||||||||||||||||||||||||||
| QUARTERLY TRENDS | SIX MONTHS ENDED JUNE 30, | ||||||||||||||||||||||||||||||||||||||||||||||||||||||||||||||||
| 2Q24 Change | 2024 Change | ||||||||||||||||||||||||||||||||||||||||||||||||||||||||||||||||
| 2Q24 | 1Q24 | 4Q23 | 3Q23 | 2Q23 | 1Q24 | 2Q23 | 2024 | 2023 | 2023 | ||||||||||||||||||||||||||||||||||||||||||||||||||||||||
| INCOME STATEMENT | |||||||||||||||||||||||||||||||||||||||||||||||||||||||||||||||||
| REVENUE | |||||||||||||||||||||||||||||||||||||||||||||||||||||||||||||||||
| Asset management fees | $ | 3,304 | $ | 3,170 | $ | 3,137 | $ | 2,975 | (a) | $ | 2,932 | (a) | 4 | % | 13 | % | $ | 6,474 | $ | 5,714 | (a) | 13 | % | ||||||||||||||||||||||||||||||||||||||||||
| Commissions and other fees | 232 | 193 | 153 | 190 | (a) | 194 | (a) | 20 | 20 | 425 | 354 | (a) | 20 | ||||||||||||||||||||||||||||||||||||||||||||||||||||
| All other income | 97 | 151 | 148 | 266 | 232 | (36) | (58) | 248 | 623 | (60) | |||||||||||||||||||||||||||||||||||||||||||||||||||||||
| Noninterest revenue | 3,633 | 3,514 | 3,438 | 3,431 | 3,358 | 3 | 8 | 7,147 | 6,691 | 7 | |||||||||||||||||||||||||||||||||||||||||||||||||||||||
| Net interest income | 1,619 | 1,595 | 1,657 | 1,574 | 1,585 | 2 | 2 | 3,214 | 3,036 | 6 | |||||||||||||||||||||||||||||||||||||||||||||||||||||||
| TOTAL NET REVENUE | 5,252 | 5,109 | 5,095 | 5,005 | 4,943 | 3 | 6 | 10,361 | 9,727 | 7 | |||||||||||||||||||||||||||||||||||||||||||||||||||||||
| Provision for credit losses | 20 | (57) | (1) | (13) | 145 | NM | (86) | (37) | 173 | NM | |||||||||||||||||||||||||||||||||||||||||||||||||||||||
| NONINTEREST EXPENSE | |||||||||||||||||||||||||||||||||||||||||||||||||||||||||||||||||
| Compensation expense | 1,960 | 1,972 | 1,857 | 1,777 | 1,746 | (1) | 12 | 3,932 | 3,481 | 13 | |||||||||||||||||||||||||||||||||||||||||||||||||||||||
| Noncompensation expense | 1,583 | 1,488 | 1,531 | 1,361 | 1,417 | 6 | 12 | 3,071 | 2,773 | 11 | |||||||||||||||||||||||||||||||||||||||||||||||||||||||
| TOTAL NONINTEREST EXPENSE | 3,543 | 3,460 | 3,388 | 3,138 | 3,163 | 2 | 12 | 7,003 | 6,254 | 12 | |||||||||||||||||||||||||||||||||||||||||||||||||||||||
| Income before income tax expense | 1,689 | 1,706 | 1,708 | 1,880 | 1,635 | (1) | 3 | 3,395 | 3,300 | 3 | |||||||||||||||||||||||||||||||||||||||||||||||||||||||
| Income tax expense | 426 | 416 | 491 | 463 | 409 | 2 | 4 | 842 | 707 | 19 | |||||||||||||||||||||||||||||||||||||||||||||||||||||||
| NET INCOME | $ | 1,263 | $ | 1,290 | $ | 1,217 | $ | 1,417 | $ | 1,226 | (2) | 3 | $ | 2,553 | $ | 2,593 | (2) | ||||||||||||||||||||||||||||||||||||||||||||||||
| REVENUE BY LINE OF BUSINESS | |||||||||||||||||||||||||||||||||||||||||||||||||||||||||||||||||
| Asset Management | $ | 2,437 | $ | 2,326 | $ | 2,403 | $ | 2,164 | $ | 2,128 | 5 | 15 | $ | 4,763 | $ | 4,562 | 4 | ||||||||||||||||||||||||||||||||||||||||||||||||
| Global Private Bank | 2,815 | 2,783 | 2,692 | 2,841 | 2,815 | 1 | — | 5,598 | 5,165 | 8 | |||||||||||||||||||||||||||||||||||||||||||||||||||||||
| TOTAL NET REVENUE | $ | 5,252 | $ | 5,109 | $ | 5,095 | $ | 5,005 | $ | 4,943 | 3 | 6 | $ | 10,361 | $ | 9,727 | 7 | ||||||||||||||||||||||||||||||||||||||||||||||||
| FINANCIAL RATIOS | |||||||||||||||||||||||||||||||||||||||||||||||||||||||||||||||||
| ROE | 32 | % | 33 | % | 28 | % | 32 | % | 29 | % | 32 | % | 31 | % | |||||||||||||||||||||||||||||||||||||||||||||||||||
| Overhead ratio | 67 | 68 | 66 | 63 | 64 | 68 | 64 | ||||||||||||||||||||||||||||||||||||||||||||||||||||||||||
| Pretax margin ratio: | |||||||||||||||||||||||||||||||||||||||||||||||||||||||||||||||||
| Asset Management | 30 | 28 | 29 | 29 | 27 | 29 | 32 | ||||||||||||||||||||||||||||||||||||||||||||||||||||||||||
| Global Private Bank | 34 | 38 | 37 | 44 | 37 | 36 | 35 | ||||||||||||||||||||||||||||||||||||||||||||||||||||||||||
| Asset & Wealth Management | 32 | 33 | 34 | 38 | 33 | 33 | 34 | ||||||||||||||||||||||||||||||||||||||||||||||||||||||||||
| Employees | 28,579 | 28,670 | 28,485 | 28,083 | 26,931 | — | 6 | 28,579 | 26,931 | 6 | |||||||||||||||||||||||||||||||||||||||||||||||||||||||
| Number of Global Private Bank client advisors | 3,509 | 3,536 | 3,515 | 3,443 | 3,214 | (1) | 9 | 3,509 | 3,214 | 9 | |||||||||||||||||||||||||||||||||||||||||||||||||||||||
(a)Prior-period amounts have been revised to conform with the current presentation.
Page 21
Page 22
| JPMORGAN CHASE & CO. | | ||||||||||||||||||||||||||||||||||||||||||||||||||||||||||||||||
| ASSET & WEALTH MANAGEMENT | |||||||||||||||||||||||||||||||||||||||||||||||||||||||||||||||||
| FINANCIAL HIGHLIGHTS, CONTINUED | |||||||||||||||||||||||||||||||||||||||||||||||||||||||||||||||||
| (in millions, except ratio data) | |||||||||||||||||||||||||||||||||||||||||||||||||||||||||||||||||
| QUARTERLY TRENDS | SIX MONTHS ENDED JUNE 30, | ||||||||||||||||||||||||||||||||||||||||||||||||||||||||||||||||
| 2Q24 Change | 2024 Change | ||||||||||||||||||||||||||||||||||||||||||||||||||||||||||||||||
| 2Q24 | 1Q24 | 4Q23 | 3Q23 | 2Q23 | 1Q24 | 2Q23 | 2024 | 2023 | 2023 | ||||||||||||||||||||||||||||||||||||||||||||||||||||||||
| SELECTED BALANCE SHEET DATA (period-end) | |||||||||||||||||||||||||||||||||||||||||||||||||||||||||||||||||
| Total assets | $ | 247,353 | $ | 240,555 | $ | 245,512 | $ | 249,866 | $ | 247,118 | 3 | % | — | % | $ | 247,353 | $ | 247,118 | — | % | |||||||||||||||||||||||||||||||||||||||||||||
| Loans | 228,042 | 222,472 | 227,929 | 228,114 | 222,493 | 3 | 2 | 228,042 | 222,493 | 2 | |||||||||||||||||||||||||||||||||||||||||||||||||||||||
| Deposits | 236,492 | 230,413 | 233,232 | (a) | 215,152 | 199,763 | 3 | 18 | 236,492 | 199,763 | 18 | ||||||||||||||||||||||||||||||||||||||||||||||||||||||
| Equity | 15,500 | 15,500 | 17,000 | 17,000 | 17,000 | — | (9) | 15,500 | 17,000 | (9) | |||||||||||||||||||||||||||||||||||||||||||||||||||||||
| SELECTED BALANCE SHEET DATA (average) | |||||||||||||||||||||||||||||||||||||||||||||||||||||||||||||||||
| Total assets | $ | 242,155 | $ | 241,384 | $ | 247,202 | $ | 245,616 | $ | 238,987 | — | 1 | $ | 241,770 | $ | 233,933 | 3 | ||||||||||||||||||||||||||||||||||||||||||||||||
| Loans | 224,122 | 223,429 | 227,042 | 223,760 | 219,469 | — | 2 | 223,775 | 215,491 | 4 | |||||||||||||||||||||||||||||||||||||||||||||||||||||||
| Deposits | 227,423 | 227,723 | 226,640 | (a) | 201,975 | 211,872 | — | 7 | 227,573 | 218,078 | 4 | ||||||||||||||||||||||||||||||||||||||||||||||||||||||
| Equity | 15,500 | 15,500 | 17,000 | 17,000 | 16,670 | — | (7) | 15,500 | 16,337 | (5) | |||||||||||||||||||||||||||||||||||||||||||||||||||||||
| CREDIT DATA AND QUALITY STATISTICS | |||||||||||||||||||||||||||||||||||||||||||||||||||||||||||||||||
| Net charge-offs/(recoveries) | $ | 3 | $ | 8 | $ | 12 | $ | 1 | $ | 2 | (63) | 50 | $ | 11 | $ | — | NM | ||||||||||||||||||||||||||||||||||||||||||||||||
| Nonaccrual loans | 745 | 769 | 650 | 621 | 615 | (3) | 21 | 745 | 615 | 21 | |||||||||||||||||||||||||||||||||||||||||||||||||||||||
| Allowance for credit losses: | |||||||||||||||||||||||||||||||||||||||||||||||||||||||||||||||||
| Allowance for loan losses | 575 | 571 | 633 | 642 | 649 | 1 | (11) | 575 | 649 | (11) | |||||||||||||||||||||||||||||||||||||||||||||||||||||||
| Allowance for lending-related commitments | 40 | 27 | 28 | 32 | 39 | 48 | 3 | 40 | 39 | 3 | |||||||||||||||||||||||||||||||||||||||||||||||||||||||
| Total allowance for credit losses | 615 | 598 | 661 | 674 | 688 | 3 | (11) | 615 | 688 | (11) | |||||||||||||||||||||||||||||||||||||||||||||||||||||||
| Net charge-off/(recovery) rate | 0.01 | % | 0.01 | % | 0.02 | % | — | % | — | % | 0.01 | % | — | % | |||||||||||||||||||||||||||||||||||||||||||||||||||
| Allowance for loan losses to period-end loans | 0.25 | 0.26 | 0.28 | 0.28 | 0.29 | 0.25 | 0.29 | ||||||||||||||||||||||||||||||||||||||||||||||||||||||||||
| Allowance for loan losses to nonaccrual loans | 77 | 74 | 97 | 103 | 106 | 77 | 106 | ||||||||||||||||||||||||||||||||||||||||||||||||||||||||||
| Nonaccrual loans to period-end loans | 0.33 | 0.35 | 0.29 | 0.27 | 0.28 | 0.33 | 0.28 | ||||||||||||||||||||||||||||||||||||||||||||||||||||||||||
(a)In the fourth quarter of 2023, certain deposits associated with First Republic were transferred from CCB. Refer to page 67 of the Firm’s 2023 Form 10-K for additional information.
Page 23
| JPMORGAN CHASE & CO. | | ||||||||||||||||||||||||||||||||||||||||||||||||||||||||||||||||
| ASSET & WEALTH MANAGEMENT | |||||||||||||||||||||||||||||||||||||||||||||||||||||||||||||||||
| FINANCIAL HIGHLIGHTS, CONTINUED | |||||||||||||||||||||||||||||||||||||||||||||||||||||||||||||||||
| (in billions) | |||||||||||||||||||||||||||||||||||||||||||||||||||||||||||||||||
| Jun 30, 2024 | |||||||||||||||||||||||||||||||||||||||||||||||||||||||||||||||||
| Change | SIX MONTHS ENDED JUNE 30, | ||||||||||||||||||||||||||||||||||||||||||||||||||||||||||||||||
| Jun 30, | Mar 31, | Dec 31, | Sep 30, | Jun 30, | Mar 31, | Jun 30, | 2024 Change | ||||||||||||||||||||||||||||||||||||||||||||||||||||||||||
| CLIENT ASSETS | 2024 | 2024 | 2023 | 2023 | 2023 | 2024 | 2023 | 2024 | 2023 | 2023 | |||||||||||||||||||||||||||||||||||||||||||||||||||||||
| Assets by asset class | |||||||||||||||||||||||||||||||||||||||||||||||||||||||||||||||||
| Liquidity | $ | 953 | $ | 927 | $ | 926 | $ | 867 | $ | 826 | 3 | % | 15 | % | $ | 953 | $ | 826 | 15 | % | |||||||||||||||||||||||||||||||||||||||||||||
| Fixed income | 785 | 762 | 751 | 707 | 718 | 3 | 9 | 785 | 718 | 9 | |||||||||||||||||||||||||||||||||||||||||||||||||||||||
| Equity | 1,017 | 964 | 868 | 780 | 792 | 5 | 28 | 1,017 | 792 | 28 | |||||||||||||||||||||||||||||||||||||||||||||||||||||||
| Multi-asset | 719 | 711 | 680 | 626 | 647 | 1 | 11 | 719 | 647 | 11 | |||||||||||||||||||||||||||||||||||||||||||||||||||||||
| Alternatives | 208 | 200 | 197 | 206 | 205 | 4 | 1 | 208 | 205 | 1 | |||||||||||||||||||||||||||||||||||||||||||||||||||||||
| TOTAL ASSETS UNDER MANAGEMENT | 3,682 | 3,564 | 3,422 | 3,186 | 3,188 | 3 | 15 | 3,682 | 3,188 | 15 | |||||||||||||||||||||||||||||||||||||||||||||||||||||||
| Custody/brokerage/administration/deposits | 1,705 | 1,655 | 1,590 | 1,458 | 1,370 | 3 | 24 | 1,705 | 1,370 | 24 | |||||||||||||||||||||||||||||||||||||||||||||||||||||||
| TOTAL CLIENT ASSETS (a) | $ | 5,387 | $ | 5,219 | $ | 5,012 | $ | 4,644 | $ | 4,558 | 3 | 18 | $ | 5,387 | $ | 4,558 | 18 | ||||||||||||||||||||||||||||||||||||||||||||||||
| Assets by client segment | |||||||||||||||||||||||||||||||||||||||||||||||||||||||||||||||||
| Private Banking | $ | 1,097 | $ | 1,052 | $ | 974 | $ | 888 | $ | 881 | 4 | 25 | $ | 1,097 | $ | 881 | 25 | ||||||||||||||||||||||||||||||||||||||||||||||||
| Global Institutional | 1,540 | 1,494 | 1,488 | 1,424 | 1,423 | 3 | 8 | 1,540 | 1,423 | 8 | |||||||||||||||||||||||||||||||||||||||||||||||||||||||
| Global Funds | 1,045 | 1,018 | 960 | 874 | 884 | 3 | 18 | 1,045 | 884 | 18 | |||||||||||||||||||||||||||||||||||||||||||||||||||||||
| TOTAL ASSETS UNDER MANAGEMENT | $ | 3,682 | $ | 3,564 | $ | 3,422 | $ | 3,186 | $ | 3,188 | 3 | 15 | $ | 3,682 | $ | 3,188 | 15 | ||||||||||||||||||||||||||||||||||||||||||||||||
| Private Banking | $ | 2,681 | $ | 2,599 | $ | 2,452 | $ | 2,249 | $ | 2,170 | 3 | 24 | $ | 2,681 | $ | 2,170 | 24 | ||||||||||||||||||||||||||||||||||||||||||||||||
| Global Institutional | 1,654 | 1,595 | 1,594 | 1,514 | 1,497 | 4 | 10 | 1,654 | 1,497 | 10 | |||||||||||||||||||||||||||||||||||||||||||||||||||||||
| Global Funds | 1,052 | 1,025 | 966 | 881 | 891 | 3 | 18 | 1,052 | 891 | 18 | |||||||||||||||||||||||||||||||||||||||||||||||||||||||
| TOTAL CLIENT ASSETS (a) | $ | 5,387 | $ | 5,219 | $ | 5,012 | $ | 4,644 | $ | 4,558 | 3 | 18 | $ | 5,387 | $ | 4,558 | 18 | ||||||||||||||||||||||||||||||||||||||||||||||||
| Assets under management rollforward | |||||||||||||||||||||||||||||||||||||||||||||||||||||||||||||||||
| Beginning balance | $ | 3,564 | $ | 3,422 | $ | 3,186 | $ | 3,188 | $ | 3,006 | $ | 3,422 | $ | 2,766 | |||||||||||||||||||||||||||||||||||||||||||||||||||
| Net asset flows: | |||||||||||||||||||||||||||||||||||||||||||||||||||||||||||||||||
| Liquidity | 16 | (4) | 49 | 40 | 60 | 12 | 153 | ||||||||||||||||||||||||||||||||||||||||||||||||||||||||||
| Fixed income | 22 | 14 | 6 | 1 | 37 | 36 | 63 | ||||||||||||||||||||||||||||||||||||||||||||||||||||||||||
| Equity | 31 | 21 | 12 | 16 | 20 | 52 | 42 | ||||||||||||||||||||||||||||||||||||||||||||||||||||||||||
| Multi-asset | (3) | (2) | (1) | 1 | 3 | (5) | 1 | ||||||||||||||||||||||||||||||||||||||||||||||||||||||||||
| Alternatives | 2 | 1 | (5) | 2 | 1 | 3 | 2 | ||||||||||||||||||||||||||||||||||||||||||||||||||||||||||
| Market/performance/other impacts | 50 | 112 | 175 | (62) | 61 | 162 | 161 | ||||||||||||||||||||||||||||||||||||||||||||||||||||||||||
| Ending balance | $ | 3,682 | $ | 3,564 | $ | 3,422 | $ | 3,186 | $ | 3,188 | $ | 3,682 | $ | 3,188 | |||||||||||||||||||||||||||||||||||||||||||||||||||
| Client assets rollforward | |||||||||||||||||||||||||||||||||||||||||||||||||||||||||||||||||
| Beginning balance | $ | 5,219 | $ | 5,012 | $ | 4,644 | $ | 4,558 | $ | 4,347 | $ | 5,012 | $ | 4,048 | |||||||||||||||||||||||||||||||||||||||||||||||||||
| Net asset flows | 79 | 43 | 94 | 132 | 112 | 122 | 264 | ||||||||||||||||||||||||||||||||||||||||||||||||||||||||||
| Market/performance/other impacts | 89 | 164 | 274 | (46) | 99 | 253 | 246 | ||||||||||||||||||||||||||||||||||||||||||||||||||||||||||
| Ending balance | $ | 5,387 | $ | 5,219 | $ | 5,012 | $ | 4,644 | $ | 4,558 | $ | 5,387 | $ | 4,558 | |||||||||||||||||||||||||||||||||||||||||||||||||||
| SELECTED FIRMWIDE METRICS | |||||||||||||||||||||||||||||||||||||||||||||||||||||||||||||||||
| Wealth Management | |||||||||||||||||||||||||||||||||||||||||||||||||||||||||||||||||
| Client assets (in billions) (b) | $ | 3,427 | $ | 3,360 | $ | 3,177 | $ | 2,929 | $ | 2,862 | 2 | 20 | $ | 3,427 | $ | 2,862 | 20 | ||||||||||||||||||||||||||||||||||||||||||||||||
| Number of client advisors | 9,181 | 9,107 | 8,971 | 8,867 | 8,367 | 1 | 10 | 9,181 | 8,367 | 10 | |||||||||||||||||||||||||||||||||||||||||||||||||||||||
(a)Includes CCB client investment assets invested in managed accounts and J.P. Morgan mutual funds where AWM is the investment manager.
(b)Consists of Global Private Bank in AWM and client investment assets in J.P. Morgan Wealth Management in CCB.
Page 24
| JPMORGAN CHASE & CO. | | ||||||||||||||||||||||||||||||||||||||||||||||||||||||||||||||||
| CORPORATE | |||||||||||||||||||||||||||||||||||||||||||||||||||||||||||||||||
| FINANCIAL HIGHLIGHTS | |||||||||||||||||||||||||||||||||||||||||||||||||||||||||||||||||
| (in millions, except employee data) | |||||||||||||||||||||||||||||||||||||||||||||||||||||||||||||||||
| QUARTERLY TRENDS | SIX MONTHS ENDED JUNE 30, | ||||||||||||||||||||||||||||||||||||||||||||||||||||||||||||||||
| 2Q24 Change | 2024 Change | ||||||||||||||||||||||||||||||||||||||||||||||||||||||||||||||||
| 2Q24 | 1Q24 | 4Q23 | 3Q23 | 2Q23 | 1Q24 | 2Q23 | 2024 | 2023 | 2023 | ||||||||||||||||||||||||||||||||||||||||||||||||||||||||
| INCOME STATEMENT | |||||||||||||||||||||||||||||||||||||||||||||||||||||||||||||||||
| REVENUE | |||||||||||||||||||||||||||||||||||||||||||||||||||||||||||||||||
| Principal transactions | $ | 60 | $ | 65 | $ | (21) | $ | 128 | $ | 113 | (8) | % | (47) | % | $ | 125 | $ | 195 | (36) | % | |||||||||||||||||||||||||||||||||||||||||||||
| Investment securities losses | (546) | (366) | (743) | (669) | (900) | (49) | % | 39 | (912) | (1,768) | 48 | % | |||||||||||||||||||||||||||||||||||||||||||||||||||||
| All other income | 8,244 | (e) | 26 | 96 | 116 | 2,767 | (i) | NM | 198 | 8,270 | (e) | 2,798 | 196 | % | |||||||||||||||||||||||||||||||||||||||||||||||||||
| Noninterest revenue | 7,758 | (275) | (668) | (425) | 1,980 | NM | 292 | 7,483 | 1,225 | NM | |||||||||||||||||||||||||||||||||||||||||||||||||||||||
| Net interest income | 2,364 | 2,477 | 2,445 | 1,983 | 1,738 | (5) | 36 | 4,841 | 3,478 | 39 | |||||||||||||||||||||||||||||||||||||||||||||||||||||||
| TOTAL NET REVENUE (a) | 10,122 | 2,202 | 1,777 | 1,558 | 3,718 | 360 | 172 | 12,324 | 4,703 | 162 | |||||||||||||||||||||||||||||||||||||||||||||||||||||||
| Provision for credit losses | 5 | 27 | (2) | 46 | (243) | (81) | NM | 32 | 127 | (75) | |||||||||||||||||||||||||||||||||||||||||||||||||||||||
| NONINTEREST EXPENSE | 1,579 | (f) | 1,276 | (g) | 3,593 | (g) | 696 | 1,152 | (j) | 24 | 37 | 2,855 | (f)(g) | 1,312 | (j) | 118 | |||||||||||||||||||||||||||||||||||||||||||||||||
| Income/(loss) before income tax expense/(benefit) | 8,538 | 899 | (1,814) | 816 | 2,809 | NM | 204 | 9,437 | 3,264 | 189 | |||||||||||||||||||||||||||||||||||||||||||||||||||||||
| Income tax expense/(benefit) | 1,759 | 223 | (939) | (h) | 4 | 169 | (k) | NM | NM | 1,982 | 380 | (k) | 422 | ||||||||||||||||||||||||||||||||||||||||||||||||||||
NET INCOME/(LOSS) | $ | 6,779 | $ | 676 | $ | (875) | $ | 812 | $ | 2,640 | NM | 157 | $ | 7,455 | $ | 2,884 | 158 | ||||||||||||||||||||||||||||||||||||||||||||||||
| MEMO: | |||||||||||||||||||||||||||||||||||||||||||||||||||||||||||||||||
| TOTAL NET REVENUE | |||||||||||||||||||||||||||||||||||||||||||||||||||||||||||||||||
| Treasury and Chief Investment Office (“CIO”) | 2,084 | 2,317 | 2,065 | 1,640 | 1,261 | (10) | 65 | 4,401 | 2,367 | 86 | |||||||||||||||||||||||||||||||||||||||||||||||||||||||
| Other Corporate | 8,038 | (115) | (288) | (82) | 2,457 | NM | 227 | 7,923 | 2,336 | 239 | |||||||||||||||||||||||||||||||||||||||||||||||||||||||
| TOTAL NET REVENUE | $ | 10,122 | $ | 2,202 | $ | 1,777 | $ | 1,558 | $ | 3,718 | 360 | 172 | $ | 12,324 | $ | 4,703 | 162 | ||||||||||||||||||||||||||||||||||||||||||||||||
| NET INCOME/(LOSS) | |||||||||||||||||||||||||||||||||||||||||||||||||||||||||||||||||
| Treasury and CIO | 1,513 | 1,641 | 1,396 | 1,129 | 1,057 | (8) | 43 | 3,154 | 1,681 | 88 | |||||||||||||||||||||||||||||||||||||||||||||||||||||||
| Other Corporate | 5,266 | (965) | (2,271) | (317) | 1,583 | NM | 233 | 4,301 | 1,203 | 258 | |||||||||||||||||||||||||||||||||||||||||||||||||||||||
| TOTAL NET INCOME/(LOSS) | $ | 6,779 | $ | 676 | $ | (875) | $ | 812 | $ | 2,640 | NM | 157 | $ | 7,455 | $ | 2,884 | 158 | ||||||||||||||||||||||||||||||||||||||||||||||||
| SELECTED BALANCE SHEET DATA (period-end) | |||||||||||||||||||||||||||||||||||||||||||||||||||||||||||||||||
| Total assets | $ | 1,318,119 | $ | 1,322,799 | $ | 1,348,437 | $ | 1,275,673 | $ | 1,263,595 | — | 4 | $ | 1,318,119 | $ | 1,263,595 | 4 | ||||||||||||||||||||||||||||||||||||||||||||||||
| Loans | 2,408 | 2,104 | 1,924 | 2,099 | 2,172 | 14 | 11 | 2,408 | 2,172 | 11 | |||||||||||||||||||||||||||||||||||||||||||||||||||||||
| Deposits (b) | 26,073 | 22,515 | 21,826 | 20,363 | 21,083 | 16 | 24 | 26,073 | 21,083 | 24 | |||||||||||||||||||||||||||||||||||||||||||||||||||||||
| Employees | 47,828 | 48,015 | 47,530 | 47,280 | 45,235 | — | 6 | 47,828 | 45,235 | 6 | |||||||||||||||||||||||||||||||||||||||||||||||||||||||
| SUPPLEMENTAL INFORMATION | |||||||||||||||||||||||||||||||||||||||||||||||||||||||||||||||||
| TREASURY and CIO | |||||||||||||||||||||||||||||||||||||||||||||||||||||||||||||||||
| Investment securities losses | $ | (546) | $ | (366) | $ | (743) | $ | (669) | $ | (900) | (49) | 39 | $ | (912) | $ | (1,768) | 48 | ||||||||||||||||||||||||||||||||||||||||||||||||
| Available-for-sale securities (average) | 247,304 | 222,943 | 199,581 | 201,875 | 198,620 | 11 | 25 | 235,124 | 200,687 | 17 | |||||||||||||||||||||||||||||||||||||||||||||||||||||||
| Held-to-maturity securities (average) (c) | 330,347 | 354,759 | 377,709 | 402,816 | 410,594 | (7) | (20) | 342,553 | 413,953 | (17) | |||||||||||||||||||||||||||||||||||||||||||||||||||||||
| Investment securities portfolio (average) | $ | 577,651 | $ | 577,702 | $ | 577,290 | $ | 604,691 | $ | 609,214 | — | (5) | $ | 577,677 | $ | 614,640 | (6) | ||||||||||||||||||||||||||||||||||||||||||||||||
| Available-for-sale securities (period-end) | 263,624 | 233,770 | 199,354 | 195,200 | 201,211 | 13 | 31 | 263,624 | 201,211 | 31 | |||||||||||||||||||||||||||||||||||||||||||||||||||||||
| Held-to-maturity securities (period-end) (c) | 323,746 | 334,527 | 369,848 | 388,261 | 408,941 | (3) | (21) | 323,746 | 408,941 | (21) | |||||||||||||||||||||||||||||||||||||||||||||||||||||||
| Investment securities portfolio, net of allowance for credit losses (period-end) (d) | $ | 587,370 | $ | 568,297 | $ | 569,202 | $ | 583,461 | $ | 610,152 | 3 | (4) | $ | 587,370 | $ | 610,152 | (4) | ||||||||||||||||||||||||||||||||||||||||||||||||
(a)Included tax-equivalent adjustments, predominantly driven by tax-exempt income from municipal bonds, of $45 million, $49 million, $53 million, $57 million and $45 million for the three months ended June 30, 2024, March 31, 2024, December 31, 2023, September 30, 2023 and June 30, 2023, respectively and $94 million and $101 million for the six months ended June 30, 2024 and 2023, respectively.
(b)Predominantly relates to the Firm's international consumer initiatives.
(c)At June 30, 2024, March 31, 2024, December 31, 2023, September 30, 2023 and June 30, 2023, the estimated fair value of the HTM securities portfolio was $294.8 billion, $305.4 billion, $342.8 billion, $348.7 billion and $375.3 billion, respectively.
(d)At June 30, 2024, March 31, 2024, December 31, 2023, September 30, 2023 and June 30, 2023, the allowance for credit losses on investment securities was $125 million, $120 million, $94 million, $87 million and $74 million, respectively.
(e)Included a $7.9 billion net gain related to Visa shares. Refer to footnote (f) on page 2 for further information.
(f)Included a $1.0 billion donation of Visa shares to pre-fund contributions to the JPMorgan Chase Foundation.
(g)Included an FDIC special assessment to recover estimated losses to the Deposit Insurance Fund of $725 million for the three months ended March 31, 2024, which was an adjustment to the $2.9 billion estimate recorded in the three months ended December 31, 2023. Refer to Note 6 on page 220 of the Firm’s 2023 Form 10-K for additional information.
(h)Included an income tax benefit of $463 million for the three months ended December 31, 2023, related to the finalization of certain income tax regulations.
(i)Included preliminary estimated bargain purchase gain of $2.7 billion associated with First Republic.
(j)In the second quarter of 2023, substantially all of the expense associated with First Republic was reported in Corporate. Commencing in the third quarter of 2023, the expense is now being allocated to the respective LOB.
(k)Income taxes associated with the First Republic acquisition were reflected in the estimated bargain purchase gain.
Page 25
| JPMORGAN CHASE & CO. | | |||||||||||||||||||||||||||||||||||||||||||
| CREDIT-RELATED INFORMATION | ||||||||||||||||||||||||||||||||||||||||||||
| (in millions) | ||||||||||||||||||||||||||||||||||||||||||||
| Jun 30, 2024 | ||||||||||||||||||||||||||||||||||||||||||||
| Change | ||||||||||||||||||||||||||||||||||||||||||||
| Jun 30, | Mar 31, | Dec 31, | Sep 30, | Jun 30, | Mar 31, | Jun 30, | ||||||||||||||||||||||||||||||||||||||
| 2024 | 2024 | 2023 | 2023 | 2023 | 2024 | 2023 | ||||||||||||||||||||||||||||||||||||||
| CREDIT EXPOSURE | ||||||||||||||||||||||||||||||||||||||||||||
| Consumer, excluding credit card loans (a) | ||||||||||||||||||||||||||||||||||||||||||||
| Loans retained | $ | 382,795 | $ | 389,592 | $ | 397,275 | $ | 397,054 | $ | 396,195 | (2) | % | (3) | % | ||||||||||||||||||||||||||||||
| Loans held-for-sale and loans at fair value | 14,160 | 13,812 | 12,818 | 11,715 | 12,009 | 3 | 18 | |||||||||||||||||||||||||||||||||||||
| Total consumer, excluding credit card loans | 396,955 | 403,404 | 410,093 | 408,769 | 408,204 | (2) | (3) | |||||||||||||||||||||||||||||||||||||
| Credit card loans | ||||||||||||||||||||||||||||||||||||||||||||
| Loans retained | 216,100 | 206,740 | 211,123 | 196,935 | 191,348 | 5 | 13 | |||||||||||||||||||||||||||||||||||||
| Total credit card loans | 216,100 | 206,740 | 211,123 | 196,935 | 191,348 | 5 | 13 | |||||||||||||||||||||||||||||||||||||
| Total consumer loans | 613,055 | 610,144 | 621,216 | 605,704 | 599,552 | — | 2 | |||||||||||||||||||||||||||||||||||||
| Wholesale loans (b) | ||||||||||||||||||||||||||||||||||||||||||||
| Loans retained | 674,152 | 667,761 | 672,472 | 671,952 | 668,145 | 1 | 1 | |||||||||||||||||||||||||||||||||||||
| Loans held-for-sale and loans at fair value | 33,493 | 31,711 | 30,018 | 32,403 | 32,372 | 6 | 3 | |||||||||||||||||||||||||||||||||||||
| Total wholesale loans | 707,645 | 699,472 | 702,490 | 704,355 | 700,517 | 1 | 1 | |||||||||||||||||||||||||||||||||||||
| Total loans | 1,320,700 | 1,309,616 | 1,323,706 | 1,310,059 | 1,300,069 | 1 | 2 | |||||||||||||||||||||||||||||||||||||
| Derivative receivables | 54,673 | 56,621 | 54,864 | 67,070 | 64,217 | (3) | (15) | |||||||||||||||||||||||||||||||||||||
| Receivables from customers (c) | 56,018 | 52,036 | 47,625 | 43,376 | 42,741 | 8 | 31 | |||||||||||||||||||||||||||||||||||||
| Total credit-related assets | 1,431,391 | 1,418,273 | 1,426,195 | 1,420,505 | 1,407,027 | 1 | 2 | |||||||||||||||||||||||||||||||||||||
| Lending-related commitments | ||||||||||||||||||||||||||||||||||||||||||||
| Consumer, excluding credit card | 47,215 | 46,660 | 45,403 | 48,313 | 50,846 | 1 | (7) | |||||||||||||||||||||||||||||||||||||
| Credit card (d) | 964,727 | 943,935 | 915,658 | 898,903 | 881,485 | 2 | 9 | |||||||||||||||||||||||||||||||||||||
| Wholesale | 545,020 | 532,514 | 536,786 | 531,568 | 541,089 | 2 | 1 | |||||||||||||||||||||||||||||||||||||
| Total lending-related commitments | 1,556,962 | 1,523,109 | 1,497,847 | 1,478,784 | 1,473,420 | 2 | 6 | |||||||||||||||||||||||||||||||||||||
| Total credit exposure | $ | 2,988,353 | $ | 2,941,382 | $ | 2,924,042 | $ | 2,899,289 | $ | 2,880,447 | 2 | 4 | ||||||||||||||||||||||||||||||||
| Memo: Total by category | ||||||||||||||||||||||||||||||||||||||||||||
| Consumer exposure (e) | $ | 1,624,997 | $ | 1,600,739 | $ | 1,582,277 | $ | 1,552,920 | $ | 1,531,883 | 2 | 6 | ||||||||||||||||||||||||||||||||
| Wholesale exposure (f) | 1,363,356 | 1,340,643 | 1,341,765 | 1,346,369 | 1,348,564 | 2 | 1 | |||||||||||||||||||||||||||||||||||||
| Total credit exposure | $ | 2,988,353 | $ | 2,941,382 | $ | 2,924,042 | $ | 2,899,289 | $ | 2,880,447 | 2 | 4 | ||||||||||||||||||||||||||||||||
(a)Includes scored loans held in CCB, scored mortgage and home equity loans held in AWM, and scored mortgage loans held in CIB and Corporate.
(b)Includes loans held in CIB, AWM, Corporate as well as risk-rated loans held in CCB, including business banking and J.P. Morgan Wealth Management loans held in Banking & Wealth Management, and auto dealer loans for which the wholesale methodology is applied when determining the allowance for loan losses.
(c)Receivables from customers reflect held-for-investment margin loans to brokerage clients in CIB, CCB and AWM; these are reported within accrued interest and accounts receivable on the Consolidated balance sheets.
(d)Also includes commercial card lending-related commitments primarily in CIB.
(e)Represents total consumer loans and lending-related commitments.
(f)Represents total wholesale loans, lending-related commitments, derivative receivables, and receivables from customers.
Page 26
| JPMORGAN CHASE & CO. | | |||||||||||||||||||||||||||||||||||||||||||
| CREDIT-RELATED INFORMATION, CONTINUED | ||||||||||||||||||||||||||||||||||||||||||||
| (in millions, except ratio data) | ||||||||||||||||||||||||||||||||||||||||||||
| Jun 30, 2024 | ||||||||||||||||||||||||||||||||||||||||||||
| Change | ||||||||||||||||||||||||||||||||||||||||||||
| Jun 30, | Mar 31, | Dec 31, | Sep 30, | Jun 30, | Mar 31, | Jun 30, | ||||||||||||||||||||||||||||||||||||||
| 2024 | 2024 | 2023 | 2023 | 2023 | 2024 | 2023 | ||||||||||||||||||||||||||||||||||||||
| NONPERFORMING ASSETS (a) | ||||||||||||||||||||||||||||||||||||||||||||
| Consumer nonaccrual loans | ||||||||||||||||||||||||||||||||||||||||||||
| Loans retained | $ | 3,423 | $ | 3,630 | $ | 3,643 | $ | 3,766 | $ | 3,784 | (6) | % | (10) | % | ||||||||||||||||||||||||||||||
| Loans held-for-sale and loans at fair value | 382 | 481 | 560 | 408 | 481 | (21) | (21) | |||||||||||||||||||||||||||||||||||||
| Total consumer nonaccrual loans | 3,805 | 4,111 | 4,203 | 4,174 | 4,265 | (7) | (11) | |||||||||||||||||||||||||||||||||||||
| Wholesale nonaccrual loans | ||||||||||||||||||||||||||||||||||||||||||||
| Loans retained | 3,289 | 2,927 | 2,346 | 2,907 | 2,593 | 12 | 27 | |||||||||||||||||||||||||||||||||||||
| Loans held-for-sale and loans at fair value | 697 | 639 | 368 | 439 | 415 | 9 | 68 | |||||||||||||||||||||||||||||||||||||
| Total wholesale nonaccrual loans | 3,986 | 3,566 | 2,714 | 3,346 | 3,008 | 12 | 33 | |||||||||||||||||||||||||||||||||||||
| Total nonaccrual loans | 7,791 | 7,677 | 6,917 | 7,520 | 7,273 | 1 | 7 | |||||||||||||||||||||||||||||||||||||
| Derivative receivables | 290 | 293 | 364 | 293 | 286 | (1) | 1 | |||||||||||||||||||||||||||||||||||||
| Assets acquired in loan satisfactions | 342 | 295 | 316 | 318 | 279 | 16 | 23 | |||||||||||||||||||||||||||||||||||||
| Total nonperforming assets | 8,423 | 8,265 | 7,597 | 8,131 | 7,838 | 2 | 7 | |||||||||||||||||||||||||||||||||||||
| Wholesale lending-related commitments (b) | 541 | 390 | 464 | 387 | 332 | 39 | 63 | |||||||||||||||||||||||||||||||||||||
| Total nonperforming exposure | $ | 8,964 | $ | 8,655 | $ | 8,061 | $ | 8,518 | $ | 8,170 | 4 | 10 | ||||||||||||||||||||||||||||||||
| NONACCRUAL LOAN-RELATED RATIOS | ||||||||||||||||||||||||||||||||||||||||||||
| Total nonaccrual loans to total loans | 0.59 | % | 0.59 | % | 0.52 | % | 0.57 | % | 0.56 | % | ||||||||||||||||||||||||||||||||||
| Total consumer, excluding credit card nonaccrual loans to | ||||||||||||||||||||||||||||||||||||||||||||
| total consumer, excluding credit card loans | 0.96 | 1.02 | 1.02 | 1.02 | 1.04 | |||||||||||||||||||||||||||||||||||||||
| Total wholesale nonaccrual loans to total | ||||||||||||||||||||||||||||||||||||||||||||
| wholesale loans | 0.56 | 0.51 | 0.39 | 0.48 | 0.43 | |||||||||||||||||||||||||||||||||||||||
(a)At June 30, 2024, March 31, 2024, December 31, 2023, September 30, 2023 and June 30, 2023, nonperforming assets excluded mortgage loans 90 or more days past due and insured by U.S. government agencies of $138 million, $157 million, $182 million, $188 million and $215 million, respectively. These amounts have been excluded based upon the government guarantee. In addition, the Firm’s policy is generally to exempt credit card loans from being placed on nonaccrual status as permitted by regulatory guidance. Refer to Note 12 of the Firm’s 2023 Form 10-K for additional information on the Firm’s credit card nonaccrual and charge-off policies.
(b)Represents commitments that are risk rated as nonaccrual.
Page 27
| JPMORGAN CHASE & CO. | | ||||||||||||||||||||||||||||||||||||||||||||||||||||||||||||||||
| CREDIT-RELATED INFORMATION, CONTINUED | |||||||||||||||||||||||||||||||||||||||||||||||||||||||||||||||||
| (in millions, except ratio data) | |||||||||||||||||||||||||||||||||||||||||||||||||||||||||||||||||
| QUARTERLY TRENDS | SIX MONTHS ENDED JUNE 30, | ||||||||||||||||||||||||||||||||||||||||||||||||||||||||||||||||
| 2Q24 Change | 2024 Change | ||||||||||||||||||||||||||||||||||||||||||||||||||||||||||||||||
| 2Q24 | 1Q24 | 4Q23 | 3Q23 | 2Q23 | 1Q24 | 2Q23 | 2024 | 2023 | 2023 | ||||||||||||||||||||||||||||||||||||||||||||||||||||||||
| SUMMARY OF CHANGES IN THE ALLOWANCES | |||||||||||||||||||||||||||||||||||||||||||||||||||||||||||||||||
| ALLOWANCE FOR LOAN LOSSES | |||||||||||||||||||||||||||||||||||||||||||||||||||||||||||||||||
| Beginning balance | $ | 22,351 | $ | 22,420 | $ | 21,946 | $ | 21,980 | $ | 20,053 | — | % | 11 | % | $ | 22,420 | $ | 19,139 | 17 | % | |||||||||||||||||||||||||||||||||||||||||||||
| Net charge-offs: | |||||||||||||||||||||||||||||||||||||||||||||||||||||||||||||||||
| Gross charge-offs | 2,726 | 2,381 | 2,557 | 1,869 | 1,776 | 14 | 53 | 5,107 | 3,227 | 58 | |||||||||||||||||||||||||||||||||||||||||||||||||||||||
| Gross recoveries collected | (495) | (425) | (393) | (372) | (365) | (16) | (36) | (920) | (679) | (35) | |||||||||||||||||||||||||||||||||||||||||||||||||||||||
| Net charge-offs | 2,231 | 1,956 | 2,164 | 1,497 | 1,411 | 14 | 58 | 4,187 | 2,548 | 64 | |||||||||||||||||||||||||||||||||||||||||||||||||||||||
| Provision for loan losses | 2,871 | 1,887 | 2,625 | 1,479 | 3,317 | (b) | 52 | (13) | 4,758 | 5,364 | (11) | ||||||||||||||||||||||||||||||||||||||||||||||||||||||
| Other | — | — | 13 | (16) | 21 | — | NM | — | 25 | NM | |||||||||||||||||||||||||||||||||||||||||||||||||||||||
| Ending balance | $ | 22,991 | $ | 22,351 | $ | 22,420 | $ | 21,946 | $ | 21,980 | 3 | 5 | $ | 22,991 | $ | 21,980 | 5 | ||||||||||||||||||||||||||||||||||||||||||||||||
| ALLOWANCE FOR LENDING-RELATED COMMITMENTS | |||||||||||||||||||||||||||||||||||||||||||||||||||||||||||||||||
| Beginning balance | $ | 1,916 | $ | 1,974 | $ | 2,075 | $ | 2,186 | $ | 2,370 | (3) | (19) | $ | 1,974 | $ | 2,382 | (17) | ||||||||||||||||||||||||||||||||||||||||||||||||
| Provision for lending-related commitments | 154 | (60) | (100) | (107) | (188) | (b) | NM | NM | 94 | (201) | NM | ||||||||||||||||||||||||||||||||||||||||||||||||||||||
| Other | (2) | 2 | (1) | (4) | 4 | NM | NM | — | 5 | NM | |||||||||||||||||||||||||||||||||||||||||||||||||||||||
| Ending balance | $ | 2,068 | $ | 1,916 | $ | 1,974 | $ | 2,075 | $ | 2,186 | 8 | (5) | $ | 2,068 | $ | 2,186 | (5) | ||||||||||||||||||||||||||||||||||||||||||||||||
| ALLOWANCE FOR INVESTMENT SECURITIES | $ | 177 | $ | 154 | $ | 128 | $ | 117 | $ | 104 | 15 | 70 | $ | 177 | $ | 104 | 70 | ||||||||||||||||||||||||||||||||||||||||||||||||
| Total allowance for credit losses (a) | $ | 25,236 | $ | 24,421 | $ | 24,522 | $ | 24,138 | $ | 24,270 | 3 | 4 | $ | 25,236 | $ | 24,270 | 4 | ||||||||||||||||||||||||||||||||||||||||||||||||
| NET CHARGE-OFF/(RECOVERY) RATES | |||||||||||||||||||||||||||||||||||||||||||||||||||||||||||||||||
| Consumer retained, excluding credit card loans | 0.14 | % | 0.19 | % | 0.21 | % | 0.17 | % | 0.14 | % | 0.16 | % | 0.16 | % | |||||||||||||||||||||||||||||||||||||||||||||||||||
| Credit card retained loans | 3.50 | 3.32 | 2.79 | 2.49 | 2.41 | 3.41 | 2.25 | ||||||||||||||||||||||||||||||||||||||||||||||||||||||||||
| Total consumer retained loans | 1.33 | 1.26 | 1.08 | 0.93 | 0.91 | 1.29 | 0.90 | ||||||||||||||||||||||||||||||||||||||||||||||||||||||||||
| Wholesale retained loans | 0.16 | 0.05 | 0.31 | 0.06 | 0.10 | 0.11 | 0.08 | ||||||||||||||||||||||||||||||||||||||||||||||||||||||||||
| Total retained loans | 0.71 | 0.62 | 0.68 | 0.47 | 0.47 | 0.67 | 0.45 | ||||||||||||||||||||||||||||||||||||||||||||||||||||||||||
| Memo: Average retained loans | |||||||||||||||||||||||||||||||||||||||||||||||||||||||||||||||||
| Consumer retained, excluding credit card loans | $ | 385,662 | $ | 394,033 | $ | 397,819 | $ | 396,788 | $ | 359,543 | (2) | 7 | $ | 389,847 | $ | 330,227 | 18 | ||||||||||||||||||||||||||||||||||||||||||||||||
| Credit card retained loans | 210,020 | 204,637 | 202,652 | 195,232 | 187,027 | 3 | 12 | 207,329 | 183,757 | 13 | |||||||||||||||||||||||||||||||||||||||||||||||||||||||
| Total average retained consumer loans | 595,682 | 598,670 | 600,471 | 592,020 | 546,570 | — | 9 | 597,176 | 513,984 | 16 | |||||||||||||||||||||||||||||||||||||||||||||||||||||||
| Wholesale retained loans | 666,347 | 664,588 | 669,899 | 667,825 | 647,474 | — | 3 | 665,468 | 624,566 | 7 | |||||||||||||||||||||||||||||||||||||||||||||||||||||||
| Total average retained loans | $ | 1,262,029 | $ | 1,263,258 | $ | 1,270,370 | $ | 1,259,845 | $ | 1,194,044 | — | 6 | $ | 1,262,644 | $ | 1,138,550 | 11 | ||||||||||||||||||||||||||||||||||||||||||||||||
(a)At June 30, 2024, March 31, 2024, December 31, 2023, September 30, 2023 and June 30, 2023 excludes an allowance for credit losses associated with certain accounts receivable in CIB of $278 million, $274 million, $243 million, $17 million and $18 million, respectively.
(b)Included a $1.2 billion provision for credit losses associated with the First Republic acquisition.
Page 28
| JPMORGAN CHASE & CO. | | |||||||||||||||||||||||||||||||||||||||||||
| CREDIT-RELATED INFORMATION, CONTINUED | ||||||||||||||||||||||||||||||||||||||||||||
| (in millions, except ratio data) | ||||||||||||||||||||||||||||||||||||||||||||
| Jun 30, 2024 | ||||||||||||||||||||||||||||||||||||||||||||
| Change | ||||||||||||||||||||||||||||||||||||||||||||
| Jun 30, | Mar 31, | Dec 31, | Sep 30, | Jun 30, | Mar 31, | Jun 30, | ||||||||||||||||||||||||||||||||||||||
| 2024 | 2024 | 2023 | 2023 | 2023 | 2024 | 2023 | ||||||||||||||||||||||||||||||||||||||
| ALLOWANCE COMPONENTS AND RATIOS | ||||||||||||||||||||||||||||||||||||||||||||
| ALLOWANCE FOR LOAN LOSSES | ||||||||||||||||||||||||||||||||||||||||||||
| Consumer, excluding credit card | ||||||||||||||||||||||||||||||||||||||||||||
| Asset-specific | $ | (856) | $ | (873) | $ | (876) | $ | (942) | $ | (971) | 2 | % | 12 | % | ||||||||||||||||||||||||||||||
| Portfolio-based | 2,599 | 2,603 | 2,732 | 2,796 | 3,019 | — | (14) | |||||||||||||||||||||||||||||||||||||
| Total consumer, excluding credit card | 1,743 | 1,730 | 1,856 | 1,854 | 2,048 | 1 | (15) | |||||||||||||||||||||||||||||||||||||
| Credit card | ||||||||||||||||||||||||||||||||||||||||||||
| Portfolio-based | 13,200 | 12,600 | 12,450 | 11,900 | 11,600 | 5 | 14 | |||||||||||||||||||||||||||||||||||||
| Total credit card | 13,200 | 12,600 | 12,450 | 11,900 | 11,600 | 5 | 14 | |||||||||||||||||||||||||||||||||||||
| Total consumer | 14,943 | 14,330 | 14,306 | 13,754 | 13,648 | 4 | 9 | |||||||||||||||||||||||||||||||||||||
| Wholesale | ||||||||||||||||||||||||||||||||||||||||||||
| Asset-specific | 562 | 514 | 392 | 732 | 478 | 9 | 18 | |||||||||||||||||||||||||||||||||||||
| Portfolio-based | 7,486 | 7,507 | 7,722 | 7,460 | 7,854 | — | (5) | |||||||||||||||||||||||||||||||||||||
| Total wholesale | 8,048 | 8,021 | 8,114 | 8,192 | 8,332 | — | (3) | |||||||||||||||||||||||||||||||||||||
| Total allowance for loan losses | 22,991 | 22,351 | 22,420 | 21,946 | 21,980 | 3 | 5 | |||||||||||||||||||||||||||||||||||||
| Allowance for lending-related commitments | 2,068 | 1,916 | 1,974 | 2,075 | 2,186 | 8 | (5) | |||||||||||||||||||||||||||||||||||||
| Allowance for investment securities | 177 | 154 | 128 | 117 | 104 | 15 | 70 | |||||||||||||||||||||||||||||||||||||
| Total allowance for credit losses | $ | 25,236 | $ | 24,421 | $ | 24,522 | $ | 24,138 | $ | 24,270 | 3 | 4 | ||||||||||||||||||||||||||||||||
| CREDIT RATIOS | ||||||||||||||||||||||||||||||||||||||||||||
| Consumer, excluding credit card allowance, to total | ||||||||||||||||||||||||||||||||||||||||||||
| consumer, excluding credit card retained loans | 0.46 | % | 0.44 | % | 0.47 | % | 0.47 | % | 0.52 | % | ||||||||||||||||||||||||||||||||||
| Credit card allowance to total credit card retained loans | 6.11 | 6.09 | 5.90 | 6.04 | 6.06 | |||||||||||||||||||||||||||||||||||||||
| Wholesale allowance to total wholesale retained loans | 1.19 | 1.20 | 1.21 | 1.22 | 1.25 | |||||||||||||||||||||||||||||||||||||||
| Total allowance to total retained loans | 1.81 | 1.77 | 1.75 | 1.73 | 1.75 | |||||||||||||||||||||||||||||||||||||||
| Consumer, excluding credit card allowance, to consumer, | ||||||||||||||||||||||||||||||||||||||||||||
| excluding credit card retained nonaccrual loans (a) | 51 | 48 | 51 | 49 | 54 | |||||||||||||||||||||||||||||||||||||||
| Total allowance, excluding credit card allowance, to retained | ||||||||||||||||||||||||||||||||||||||||||||
| nonaccrual loans, excluding credit card nonaccrual loans (a) | 146 | 149 | 166 | 151 | 163 | |||||||||||||||||||||||||||||||||||||||
| Wholesale allowance to wholesale retained nonaccrual loans | 245 | 274 | 346 | 282 | 321 | |||||||||||||||||||||||||||||||||||||||
| Total allowance to total retained nonaccrual loans | 343 | 341 | 374 | 329 | 345 | |||||||||||||||||||||||||||||||||||||||
(a)Refer to footnote (a) on page 25 for information on the Firm’s nonaccrual policy for credit card loans.
Page 29
| JPMORGAN CHASE & CO. | | |||||||||||||||||||||||||||||||||||||||||||
| NON-GAAP FINANCIAL MEASURES | ||||||||||||||||||||||||||||||||||||||||||||
Non-GAAP Financial Measures
(a)In addition to analyzing the Firm’s results on a reported basis, management reviews Firmwide results, including the overhead ratio, on a “managed” basis; these Firmwide managed basis results are non-GAAP financial measures. The Firm also reviews the results of the lines of business on a managed basis. The Firm’s definition of managed basis starts, in each case, with the reported U.S. GAAP results and includes certain reclassifications to present total net revenue for the Firm and each of the reportable business segments on an FTE basis. Accordingly, revenue from investments that receive tax credits and tax-exempt securities is presented in the managed results on a basis comparable to taxable investments and securities. These financial measures allow management to assess the comparability of revenue from year-to-year arising from both taxable and tax-exempt sources. The corresponding income tax impact related to tax-exempt items is recorded within income tax expense. These adjustments have no impact on net income as reported by the Firm as a whole or by the lines of business.
(b)Pre-provision profit is a non-GAAP financial measure which represents total net revenue less total noninterest expense. The Firm believes that this financial measure is useful in assessing the ability of a lending institution to generate income in excess of its provision for credit losses.
(c)TCE, ROTCE, and TBVPS are each non-GAAP financial measures. TCE represents the Firm’s common stockholders’ equity (i.e., total stockholders’ equity less preferred stock) less goodwill and identifiable intangible assets (other than MSRs), net of related deferred tax liabilities. ROTCE measures the Firm’s net income applicable to common equity as a percentage of average TCE. TBVPS represents the Firm’s TCE at period-end divided by common shares at period-end. TCE, ROTCE, and TBVPS are utilized by the Firm, as well as investors and analysts, in assessing the Firm’s use of equity.
(d)In addition to reviewing net interest income (“NII”), net yield, and noninterest revenue (“NIR”) on a managed basis, management also reviews these metrics excluding Markets, which is composed of Fixed Income Markets and Equity Markets, as shown below. Markets revenue consists of principal transactions, fees, commissions and other income, as well as net interest income.These metrics, which exclude Markets, are non-GAAP financial measures. Management reviews these metrics to assess the performance of the Firm’s lending, investing (including asset-liability management) and deposit-raising activities, apart from any volatility associated with Markets activities. In addition, management also assesses Markets business performance on a total revenue basis as offsets may occur across revenue lines. For example, securities that generate net interest income may be risk-managed by derivatives that are reflected at fair value in principal transactions revenue. Management believes these measures provide investors and analysts with alternative measures to analyze the revenue trends of the Firm. For additional information on Markets revenue, refer to page 75 of the Firm’s 2023 Form 10-K.
| QUARTERLY TRENDS | SIX MONTHS ENDED JUNE 30, | |||||||||||||||||||||||||||||||||||||||||||||||||||||||||||||
| 2Q24 Change | 2024 Change | |||||||||||||||||||||||||||||||||||||||||||||||||||||||||||||
| (in millions, except rates) | 2Q24 | 1Q24 | 4Q23 | 3Q23 | 2Q23 | 1Q24 | 2Q23 | 2024 | 2023 | 2023 | ||||||||||||||||||||||||||||||||||||||||||||||||||||
| Net interest income - reported | $ | 22,746 | $ | 23,082 | $ | 24,051 | $ | 22,726 | $ | 21,779 | (1) | % | 4 | % | $ | 45,828 | $ | 42,490 | 8 | % | ||||||||||||||||||||||||||||||||||||||||||
| Fully taxable-equivalent adjustments | 115 | 121 | 126 | 130 | 104 | (5) | 11 | 236 | 224 | 5 | ||||||||||||||||||||||||||||||||||||||||||||||||||||
| Net interest income - managed basis (a) | $ | 22,861 | $ | 23,203 | $ | 24,177 | $ | 22,856 | $ | 21,883 | (1) | 4 | $ | 46,064 | $ | 42,714 | 8 | |||||||||||||||||||||||||||||||||||||||||||||
| Less: Markets net interest income | (77) | 183 | 615 | (317) | (487) | NM | 84 | 106 | (592) | NM | ||||||||||||||||||||||||||||||||||||||||||||||||||||
| Net interest income excluding Markets (a) | $ | 22,938 | $ | 23,020 | $ | 23,562 | $ | 23,173 | $ | 22,370 | — | 3 | $ | 45,958 | $ | 43,306 | 6 | |||||||||||||||||||||||||||||||||||||||||||||
| Average interest-earning assets | $ | 3,509,725 | $ | 3,445,515 | $ | 3,408,395 | $ | 3,331,728 | $ | 3,343,780 | 2 | 5 | $ | 3,477,620 | $ | 3,280,619 | 6 | |||||||||||||||||||||||||||||||||||||||||||||
Less: Average Markets interest-earning assets | 1,116,853 | 1,031,075 | 985,997 | 970,789 | 1,003,877 | 8 | 11 | 1,073,964 | 993,283 | 8 | ||||||||||||||||||||||||||||||||||||||||||||||||||||
| Average interest-earning assets excluding Markets | $ | 2,392,872 | $ | 2,414,440 | $ | 2,422,398 | $ | 2,360,939 | $ | 2,339,903 | (1) | 2 | $ | 2,403,656 | $ | 2,287,336 | 5 | |||||||||||||||||||||||||||||||||||||||||||||
| Net yield on average interest-earning assets - managed basis | 2.62 | % | 2.71 | % | 2.81 | % | 2.72 | % | 2.62 | % | 2.66 | % | 2.63 | % | ||||||||||||||||||||||||||||||||||||||||||||||||
Net yield on average Markets interest-earning assets | (0.03) | 0.07 | 0.25 | (0.13) | (0.19) | 0.02 | (0.12) | |||||||||||||||||||||||||||||||||||||||||||||||||||||||
| Net yield on average interest-earning assets excluding Markets | 3.86 | 3.83 | 3.86 | 3.89 | 3.83 | 3.85 | 3.82 | |||||||||||||||||||||||||||||||||||||||||||||||||||||||
| Noninterest revenue - reported (b) | $ | 27,454 | $ | 18,852 | $ | 14,523 | $ | 17,148 | $ | 19,528 | 46 | 41 | $ | 46,306 | $ | 37,166 | 25 | |||||||||||||||||||||||||||||||||||||||||||||
| Fully taxable-equivalent adjustments (b) | 677 | 493 | 1,243 | 682 | 990 | 37 | (32) | 1,170 | 1,857 | (37) | ||||||||||||||||||||||||||||||||||||||||||||||||||||
| Noninterest revenue - managed basis | $ | 28,131 | $ | 19,345 | $ | 15,766 | $ | 17,830 | $ | 20,518 | 45 | 37 | $ | 47,476 | $ | 39,023 | 22 | |||||||||||||||||||||||||||||||||||||||||||||
| Less: Markets noninterest revenue (c) | 7,870 | 7,830 | 5,232 | 6,934 | 7,549 | 1 | 4 | 15,700 | 16,092 | (2) | ||||||||||||||||||||||||||||||||||||||||||||||||||||
| Noninterest revenue excluding Markets | $ | 20,261 | $ | 11,515 | $ | 10,534 | $ | 10,896 | $ | 12,969 | 76 | 56 | $ | 31,776 | $ | 22,931 | 39 | |||||||||||||||||||||||||||||||||||||||||||||
| Memo: Markets total net revenue | $ | 7,793 | $ | 8,013 | $ | 5,847 | $ | 6,617 | $ | 7,062 | (3) | 10 | $ | 15,806 | $ | 15,500 | 2 | |||||||||||||||||||||||||||||||||||||||||||||
(a) Interest includes the effect of related hedges. Taxable-equivalent amounts are used where applicable.
(b) Effective January 1, 2024, the Firm adopted updates to the Accounting for Investments in Tax Credit Structures Using the Proportional Amortization Method guidance, under the modified retrospective method. Refer to page 4 for additional information.
(c) Includes the markets-related revenues of the former Commercial Banking business segment. Prior-period amounts have been revised to conform with the current presentation.
| JPMORGAN CHASE & CO. | | |||||||||||||||||||||||||||||||||||||||||||
| BUSINESS SEGMENT REORGANIZATION | ||||||||||||||||||||||||||||||||||||||||||||
On May 15, 2024, JPMorgan Chase & Co. (“JPMorgan Chase” or the “Firm”) furnished the U.S. Securities and Exchange Commission with a Current Report on Form 8-K to provide supplemental financial information reflecting the reorganization of the Firm's reportable business segments that became effective in the second quarter of 2024, resulting in:
•The combination of the former Corporate & Investment Bank and Commercial Banking business segments to form one segment, the Commercial & Investment Bank ("CIB"); and
•No impact to the Firm’s other segments.
The following table provides a summary of the Firm’s impacted business segments prior to and after the reorganization.
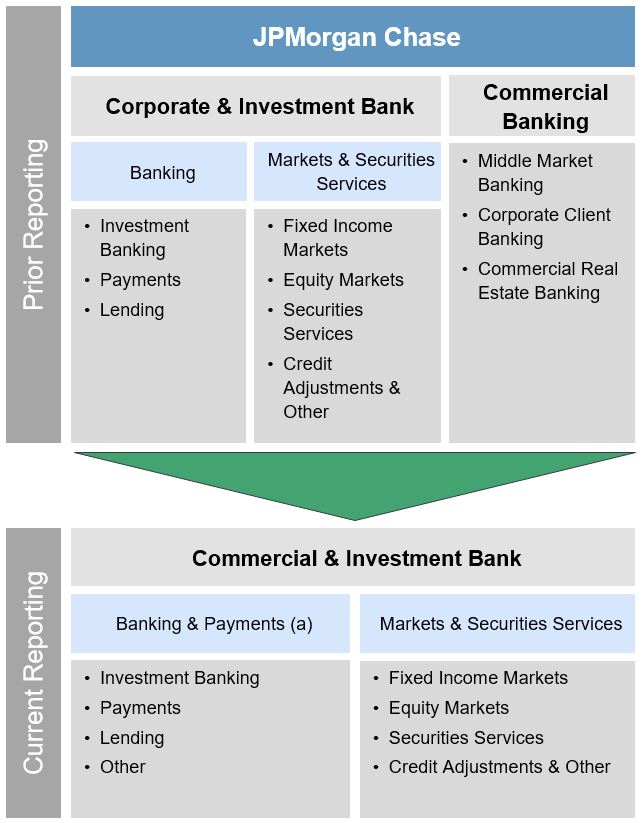
(a) Banking & Payments revenue by client coverage segment consists of the following:
Global Corporate Banking & Global Investment Banking provides banking products and services generally to large corporations, financial institutions and merchants.
Commercial Banking provides banking products and services generally to middle market clients, including start-ups, small and midsized companies, local governments, municipalities, and nonprofits, as well as to commercial real estate clients.
Other includes amounts related to credit protection purchased against certain retained loans and lending-related commitments in Lending, the impact of equity investments in Payments and balances not aligned with a primary client coverage segment.