FINANCIAL RESULTS Fourth Quarter 2004 J A N U A R Y 1 9, 2 0 0 5 |
Disclaimer This presentation contains forward-looking statements within the meaning of the Private Securities Litigation Reform Act of 1995. Such statements are based upon the current beliefs and expectations of JPMorgan Chase's management and are subject to significant risks and uncertainties. Actual results may differ from those set forth in the forward-looking statements. The following factors, among others, could cause actual results to differ from those set forth in the forward-looking statements: the risk that the cost savings and any revenue synergies from the merger may not be fully realized or may take longer to realize than expected and the risk that excess capital is not generated from the merger as anticipated or not utilized in an accretive manner. Additional factors that could cause JPMorgan Chase's results to differ materially from those described in the forward-looking statements can be found in the 2003 Annual Report on Form 10-K and the Quarterly Report on Form 10-Q dated September 30, 2004 of JPMorgan Chase filed with the Securities and Exchange Commission. |
Agenda Firm results - 4Q 2005 Outlook Appendix |
Mixed performance vs. third quarter Decline in Home Finance Improved trading results, strong IB fees Other business lines deliver profit improvement vs. third quarter Strong private equity gains Strong capital position - Tier 1 of 8.7% Merger integration progressing well 4Q04 Highlights |
4Q04 Earnings - GAAP Comparison Non-Operating Charges (After-Tax) |
4Q04 LOB Operating Earnings - GAAP Comparison1 1 Reflects realignment of the lines of business following the merger. For further information, reference is made to information furnished pursuant to Regulation FD by JPMC on Form 8-K dated October 1, 2004, as amended on October 20, 2004 and January 19, 2005. |
Proforma Discussion The proforma combined historical lines of business information presents the new business segments of the company as if these segments had existed as of the earliest date indicated. For further information regarding the proforma combined historical financial information, including reconciliation to JPMC GAAP financial information, see information furnished pursuant to Regulation FD by JPMC on Form 8-K dated October 1, 2004, as amended on October 20, 2004 and January 19, 2005. |
4Q Proforma Operating Performance Comparison 1 Operating basis excludes merger costs, the litigation reserve charge and charges related to conforming accounting policies, and presents revenues and credit costs without the effect of credit card securitizations. On a reported basis, revenues were $13.0bn and credit costs were $1.2bn. All references to credit costs refer to provision for credit losses. 2 Actual numbers for all periods, not over/under. Revenues up $410 sequentially due to increased IB trading & fees, higher private equity gains, partially offset by a decline in MSR hedging results Credit costs decline sequentially primarily due to reserve release associated with sale of manufactured housing portfolio Expenses increase primarily due to higher IB compensation expense |
LOB Operating Earnings - Proforma Comparison 1 Change from 4Q03 includes the impact of non-core portfolio actions related to the sale of Bank One's brokered home equity portfolio. The pre-tax impact was $(415)mm and the after-tax impact was $(257)mm. Excluding the impact of these actions, the year over year change would be $89mm. |
Investment Bank - Proforma Comparison IB fees at highest level in four years Significantly improved fixed income trading results from 3Q Decline in Equity Markets reflects weak portfolio management results Decline in Credit Portfolio YOY - lower loan volumes; sequential improvement driven by securities gains received as part of workouts Credit costs benefit from continued strong credit quality yet moderating improvement Expenses increased due to higher compensation 1 Actual numbers for all periods, not over/under. Source: Thompson Financial |
Retail Financial Services - Proforma Comparison 1 Excludes impact of non-core (brokered home equity portfolio) in 4Q03. See page 12 in 8K dated January 19, 2004. 2 Actual numbers for all periods, not over/under. Consumer and Small Business Banking: continued earnings growth Home Finance: decline in Prime Production & Servicing earnings Auto: ongoing competitive environment; positive credit trends continue Insurance: stable earnings |
Consumer and Small Business - Proforma Comparison 1Actual numbers for all periods, not over/under. Revenue growth driven by wider spreads on deposits reflecting higher short term interest rates and growth in deposit balances Net checking accounts up 7% YOY Average loans up 3% YOY Retail network expansion continued YOY with 106 new branches and 325 new ATMs Rollout of branch P&Ls and new sales based compensation |
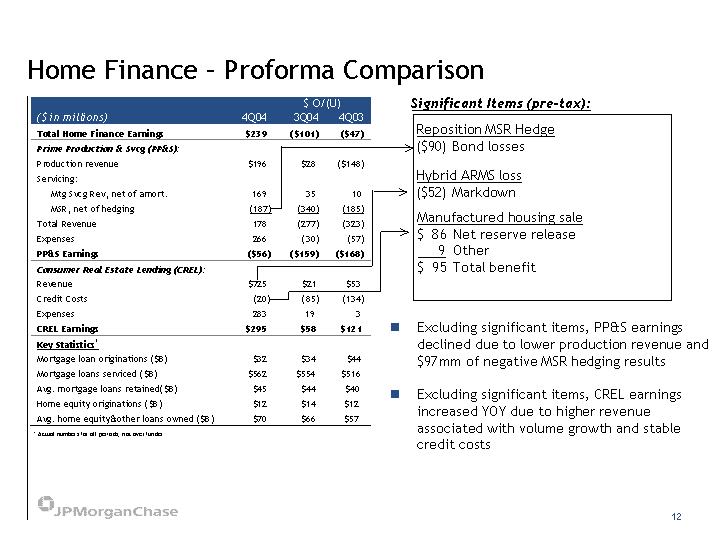
Home Finance - Proforma Comparison Reposition MSR Hedge ($90) Bond losses Significant Items (pre-tax): Hybrid ARMS loss ($52) Markdown Manufactured housing sale $ 86 Net reserve release 9 Other $ 95 Total benefit 1 Actual numbers for all periods, not over/under Excluding significant items, PP&S earnings declined due to lower production revenue and $97mm of negative MSR hedging results Excluding significant items, CREL earnings increased YOY due to higher revenue associated with volume growth and stable credit costs |
Revenues higher YOY driven by increased loan balances (up 5%) and charge volume (up 9%) as well as the impact of Circuit City Stronger YOY credit quality-improved net charge-off rate (down 24 bps) and delinquency ratios (30+ day down 51 bps) Expenses down slightly YOY driven by lower compensation and marketing expenses partially offset by higher expenses from Circuit City Converted remaining 80% of ONE portfolio to TSYS; continuing conversion in '05 of Chase portfolio Card Services - Proforma Comparison (Managed) 1Actual numbers for all periods, not over/under. |
Revenues increased 4% due to an 11% increase in deposit volumes and wider spreads Credit costs decreased YOY because of improving credit quality in the portfolio Expenses flat YOY and down 6% sequentially Commercial Banking - Proforma Comparison 1Actual numbers for all periods, not over/under. |
Revenues higher YOY driven by 30% deposit growth to $150 billion, higher spreads, EFS acquisition, and growing business volumes. One-time gain in prior year of $36mm. Assets under custody of $9.1 trillion, up 20% YOY Corporate Trust Securities under administration of $6.6 trillion, up 4% YOY Expenses higher YOY driven by EFS acquisition, up-front expenses associated with the on-boarding of new business and higher legal and technology-related costs Treasury & Securities Services - Proforma Comparison 1Actual numbers for all periods, not over/under. |
Revenues up 10% YOY driven by AUS in-flows, performance fees and global equity market appreciation Improved investment performance- Percent of Customer Assets in Funds Ranked 3 or better increased YOY from 75% to 81% Earnings growth driven by revenue growth, positive operating leverage and improved credit costs Assets under supervision up 11% YOY; assets under management up 6% YOY Acquisition of majority interest in Highbridge Capital closed mid December Asset & Wealth Management - Proforma Comparison 1Actual numbers for all periods, not over/under. |
Corporate - Proforma Comparison Private equity gains very strong; portfolio down to $7.5bn from $9.6bn at Dec '03 Treasury securities gains up compared to losses taken in 4Q03 NII down due to Treasury portfolio repositioning YOY; NII down sequentially due to higher funding costs Other income down sequentially due to absence of 3Q gains 1NII, other income and expenses are included in Private Equity, Treasury and Other Corporate Earnings |
Agenda Firm results - 4Q 2005 Outlook Overview Lines of Business Conclusions Appendix |
Merger Accomplishments Financial reporting architecture Holding company merger Branding strategy Technology insourcing Merger of lead banks TSYS card conversions Card bank merger Headcount reduction HR policies and benefits conformed Other policies instituted |
Financial discipline largely in place Detailed bottoms-up budget with thousands of P&Ls Corporate expense allocation changes effectively complete Expenses above market levels are retained in the Corporate Sector Revenue shares reflecting third party economics largely in place Finalizing technology plans Need to drive continued efficiency Extensive and continuing analysis of all risk (including earnings at risk) Will drive deeper understanding, increased accountability and better decision making |
2005 Highlights and Observations Comments assume steady-state economy, normal market and rate curve Approaching normalized credit costs by 4th quarter of 2005 Lower treasury risk profile Merger saves built into 2005 plan Continued investments to build infrastructure and drive organic growth More efficient use of resources |
Expect lower NII in 2005 Reduced Treasury portfolio (Q4 Corp NII reasonable reference point) Reduced IB non-trading NII (Q4 IB NII reasonable reference point) Reduced NII in RFS due to portfolio sales - approximately $250mm Private equity gains of $300mm per quarter is a reasonable expectation; will be lumpy Do not plan for treasury securities gains ($360mm in 2004) Do not count on net MSR hedging gains (very volatile) 2004 quarterly range of ($187)mm to $153mm One-time gains or losses should not be annualized1 Comments on Revenues 1 Q4 RFS reflects Manufactured Housing sale; Q1 and Q2 RFS reflects impact of brokered home equity portfolio; Q3 Corporate included gains on sales;Q4 IB Other Income reflects high level of securities gains from workouts |
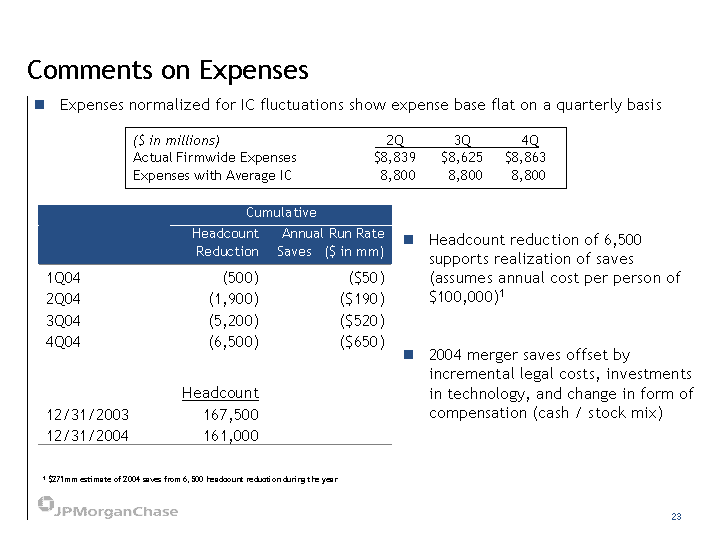
Expenses normalized for IC fluctuations show expense base flat on a quarterly basis ($ in millions) 2Q 3Q 4Q Actual Firmwide Expenses $8,839 $8,625 $8,863 Expenses with Average IC $8,800 $8,800 $8,800 Comments on Expenses Headcount reduction of 6,500 supports realization of saves (assumes annual cost per person of $100,000)1 2004 merger saves offset by incremental legal costs, investments in technology, and change in form of compensation (cash / stock mix) 1 $271mm estimate of 2004 saves from 6,500 headcount reduction during the year |
2005 Merger saves are built into 2005 Budget Comments on Expenses 1 $8,800*4 =$35,200mm; See prior page 2 Excludes Cazenove, expected to close in 1Q05 3 $1,875mm of cumulative saves in 2005 less $400mm of cumulative saves in 2004 Incremental spending: High value added spend |
Merger Saves & Costs Merger saves of $400 million in 2004 supported by headcount reduction of 6,500 Merger saves for 2005 are incorporated in budget and reach $2.2 billion run-rate in Q41 Total merger costs now estimated at $4.0 - $4.5 billion $1 billion capitalized to date $1.4 billion expensed in 2004 $1.4 billion estimated in 2005 Merger costs are lumpy (technology/real estate) 1 Q405 annualized saves: $550mm*4 = $2.2bn; Expected incremental merger saves for 2005 are $1,475mm ($1,875mm to be realized in 2005 less $400mm realized in 2004). |
Focus on adding sales people/bankers/marketing versus staff Comments on Headcount |
Note: All ratios exclude impact of loans held for sale (a) Card is shown on a managed basis (excludes impact of securitizations) (b) Excludes $652mm of MTM of brokered related portfolios in 2003 Comments on Credit Allowance for loan losses/loans 12/31/04 Wholesale 2.43% Retail Financial Services 0.67% Card 4.64% ($ in millions) 2003 2004 Net Charge-offs $9,880 $8,209 Change in Allowance ($1,294) ($1,719) Credit Costs $8,586 $6,490 |
Continue to build fortress balance sheet Tier-1 capital target above 8% 12/31/04 Tier 1 of 8.7% Excess capital generation creates capital flexibility Dividend payout target: 30-40% Stock buyback: $700mm in 2004 Investments in the business Modest increase in risk-weighted assets and risk Capital levels to remain relatively constant for LOBs in 2005 Comments on Capital |
Agenda Firm results - 4Q 2005 Outlook Overview Lines of Business Conclusions Appendix |
Corporate "Other Corporate" includes: Central technology & operations, corporate staff, and other centrally managed expenses (e.g. real estate, pension), net of allocations to lines of business Line of business tax offsets for tax exempt revenues Certain other one-time items not related to a specific line of business |
Tech & Ops Initiatives Investment Bank: Global platform for institutional credit risk management Credit trading platform Derivatives processing Equities cash infrastructure Strategic Data Center expansion and mainframe remediation/migration Network refresh of 11 major processing centers and 22 large corporate business hubs Consolidation of Global Help Desks including ensuring consistent infrastructure Consolidation of operating centers IBM integration activities Texas market integration (Estimated: 3Q05)/Tri-state market integration (Estimated 2006) Lending platforms Deposit systems Check processing Retail channels Card conversions Treasury Services Clearing conversions Continued Human Resources platform automation Risk and Finance infrastructure |
Strong IB fee pipeline entering 2005 Build the client-driven trading business Expect decline in Credit Portfolio revenues due to lower securities gains from workouts1 Expenses reflect investments, productivity, merger saves and IC changes driven by performance and business mix Getting more efficient Investing in infrastructure and growth in the business No real change in risk profile 1 Securities gains from workouts reported in "Other Income". Investment Bank |
Investment Bank Control & Efficiencies Growth New Business Development Controls Credit risk management Credit trading Infrastructure consolidation Derivatives processing Equities cash Equities derivative expansion Fixed Income -volume growth ABS/MBS Energy buildout FI & FX Prime Brokerage 3rd Party Distribution Investing in infrastructure and business growth |
Investment Bank - Trends in Global Rank Source: Thomson Financial/SDC; Institutional Investor magazine We will build relentlessly US #5 Europe #4 Lat.Am. #8 Japan1 --- Asia ex. #3 Japan US #1 Europe #6 Lat.Am. #3 Japan #4 Asia ex. #2 Japan 1 JPM not listed in top 25 ranking |
Consumer & Small Business Revenue growth driven by deposit growth, improved sales productivity and cross-sell Adding 1,000+ people in new branches and 1,000+ salespeople, offset by headcount reduction of 800 Expect increase in investment sales, mortgage production, home equity production and credit cards sold Incremental spend mostly offset by merger saves and efficiencies 150+ new branches 1,000+ new ATMs |
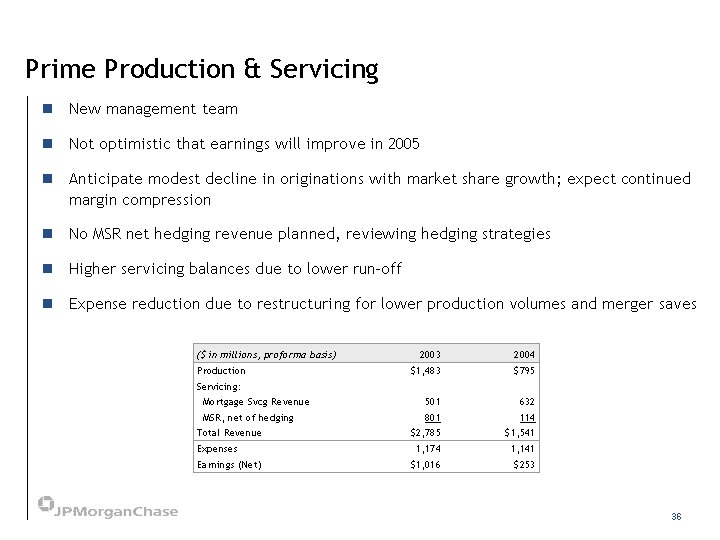
Prime Production & Servicing New management team Not optimistic that earnings will improve in 2005 Anticipate modest decline in originations with market share growth; expect continued margin compression No MSR net hedging revenue planned, reviewing hedging strategies Higher servicing balances due to lower run-off Expense reduction due to restructuring for lower production volumes and merger saves |
Card Services (Managed) Modest growth in spend and outstandings with modest margin compression over time Strategic initiatives include retail bank cross-sell, Chase branding and others Expense improvement from merger saves; efficiencies fund incremental spend ROO goal of 3% by year end 2005 |
Anticipate revenue growth driven by net AUS inflows, Highbridge acquisition, and deposit and loan growth Expect credit costs to increase from negative 2004 levels Anticipate higher expenses due to acquisition, incremental spend and 12b-1 fees1, partially offset by merger and productivity saves Asset & Wealth Management 1 Change in accounting for 12 b-1 fees will add approximately $60mm to revenue and expenses in 2005 |
Agenda Firm results - 4Q 2005 Outlook Overview Lines of Business Conclusions Appendix |
Long Term Financial Aspirations Good growth with solid returns and manageable volatility Investment Bank - 20% ROE (average through market cycle) Consumer & Small Business - < 60% overhead Home Finance: Prime Production & Servicing - TBD Home Finance: Consumer Real Estate Lending - Strong profitable growth Card - 3.5% ROO Commercial Banking - 52% overhead T&SS - 30% pre-tax margin AWM - 35% pre-tax margin Private Equity - $1.2 billion gains, 10% of tangible equity Other Corporate1 - pretax income improves by $1 billion from 2005 1 Corporate Sector less Private Equity & Treasury |
Employee Ownership 1 Reflects un-issued shares 2 Underestimates total employee ownership as it only includes shares held by transfer agents Employees share the upside of firm performance Senior management required to hold 75% of stock awarded Compensation plan consistent with ownership philosophy Great pay for great performance |
Conclusions Financial and operating discipline in place Building a fortress balance sheet Continue to drive for greater efficiencies and accountability Constantly reviewing trading, credit and interest rate risk 2005 will be a complex merger year, but will continue to focus on investing in businesses Complete belief in extraordinary businesses and platforms |
Agenda Firm results - 4Q 2005 Outlook Appendix Outlook Heritage JPMC Comparison |
Future Merger Saves by LOB 1 Source: 2Q04 Financial Results and Merger Update presentation on July 21, 2004. Reflects total saves estimate realized over 2004 - 2007. Merger saves for the Investment Bank and Commercial Banking were presented together. |
Consumer Real Estate Lending Anticipate flat to down earnings as growth in home equity offset by portfolio sales and change in subprime strategy Home Equity earnings growth driven by portfolio growth and merger efficiencies 1 2003 excludes the impact of non-core portfolio actions related to the sale of Bank One's brokered home equity portfolio. |
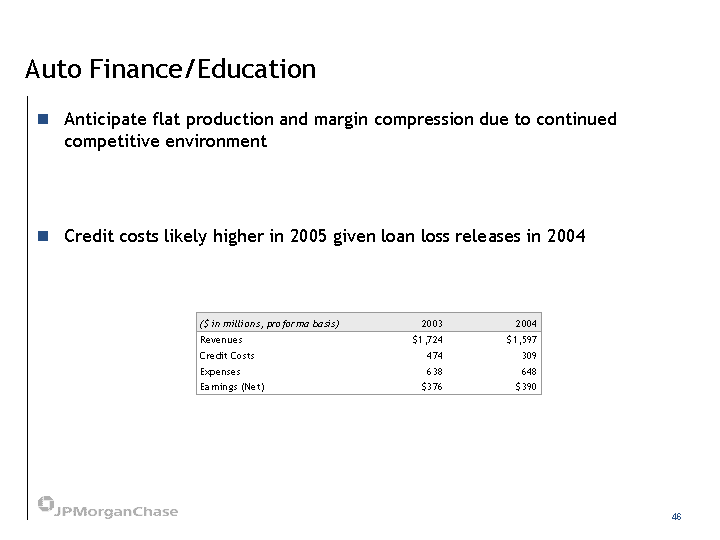
Auto Finance/Education Anticipate flat production and margin compression due to continued competitive environment Credit costs likely higher in 2005 given loan loss releases in 2004 |
Commercial Banking Earnings likely to decline in 2005 due to increased credit costs and increased expenses Revenues benefit from growth in treasury services and investment banking offset by margin compression on loans Expense increase primarily related to allocation policy changes (increase from T&SS) |
Treasury & Securities Services Business initiatives in Treasury Services slowed down in 2004 to get merger work done Anticipate modest revenue growth due to wider spreads on deposits and increased business volumes/activity in custody, trade, commercial card, ADRs and CDOs Additional work to be done due to complexity of systems |
Agenda Firm results - 4Q 2005 Outlook Appendix Heritage JPMC Comparison |
($ in millions) Investment Bank - Heritage JPMC Comparison 1Actual for all periods, not over/under. |
($ in millions) Retail Financial Services - Heritage JPMC Comparison 1Actual for all periods, not over/under. |
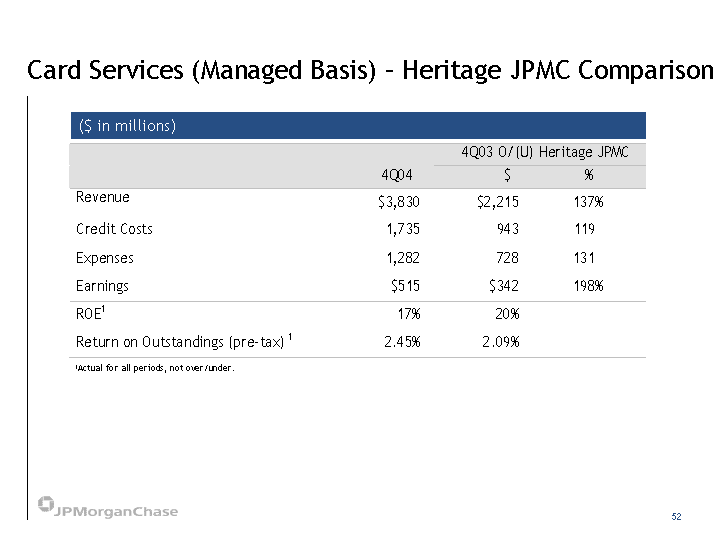
($ in millions) Card Services (Managed Basis) - Heritage JPMC Comparison 1Actual for all periods, not over/under. |
Commercial Banking - Heritage JPMC Comparison ($ in millions) 1Actual for all periods, not over/under. |
Treasury & Securities Svcs - JPMC Heritage Comparison ($ in millions) 1Actual for all periods, not over/under. |
Asset & Wealth Mgmt. - Heritage JPMC Comparison ($ in millions) 1Actual for all periods, not over/under. |
Corporate - Heritage JPMC Comparison ($ in millions) |