| FINANCIAL RESULTS 3Q09October 14, 2009 |
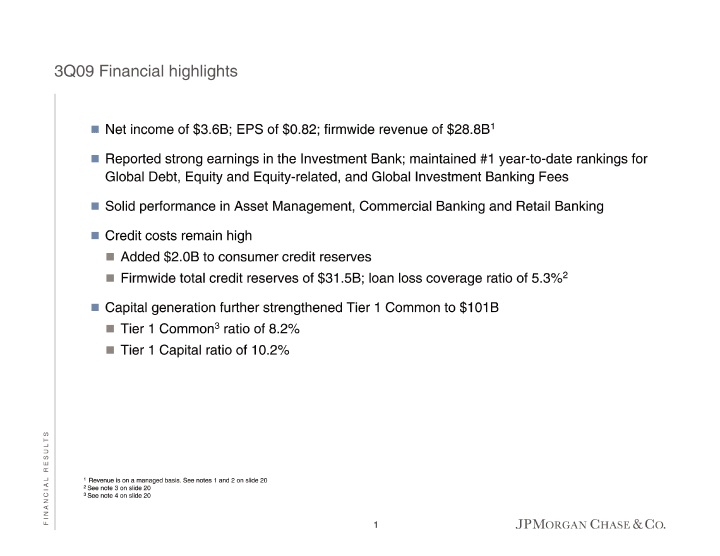
| 3Q09 Financial highlights 1 Net income of $ 3.6B; EPS of $ 0.82; firmwide revenue of $ 28.8B Reported strong earnings in the Investment Bank; maintained #1 year — to — date rankings for Global Debt, Equity and Equity — related, and Global Investment Banking Fees Solid performance in Asset Management, Commercial Banking and Retail Banking Credit costs remain high Added $ 2.0B to consumer credit reserves 2 Firmwide total credit reserves of $ 31.5B; loan loss coverage ratio of 5.3% Capital generation further strengthened Tier 1 Common to $ 101B 3 Tier 1 Common ratio of 8.2% Tier 1 Capital ratio of 10.2%1Revenue is on a managed basis. See notes 1 and 2 on slide 202See note 3 on slide 203See note 4 on slide 20 S T L U S E R L A I C N A N I F |
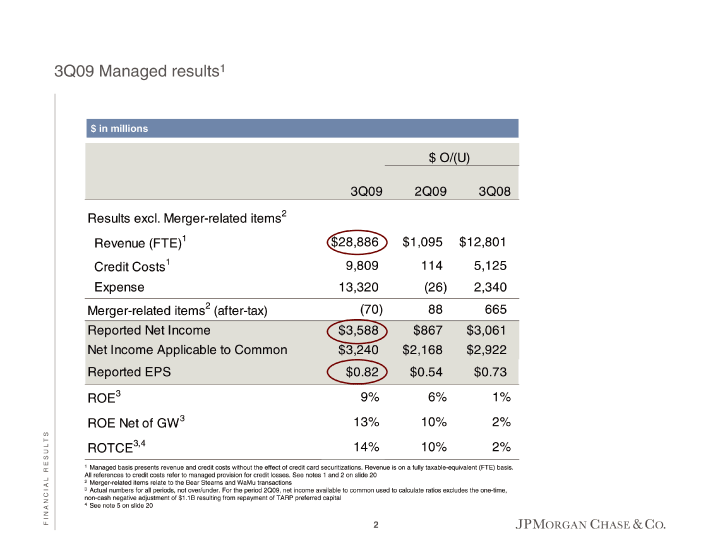
| 3Q09 Managed results1$ in millions $ in millions$ O/(U) 3Q09 2Q09 3Q08 2 Results excl. Merger — related items 1 $ 28,886 $ 1,095 $ 12,801 Revenue (FTE) 1 9,809 114 5,125 Credit Costs Expense 13,320 (26) 2,340 2 (70) 88 665 (after — tax) Merger — related items Reported Net Income $ 3,588 $ 867 $ 3,061 Net Income Applicable to Common $ 3,240 $ 2,168 $ 2,922 Reported EPS $ 0.82 $ 0.54 $ 0.73 3 9% 6% 1% ROE 3 13% 10% 2% ROE Net of GW 3,4 14% 10% 2% ROTCE1Managed basis presents revenue and credit costs without the effect of credit card securitizations. Revenue is on a fully taxable — equivalent (FTE) basis. All references to credit costs refer to managed provision for credit losses. See notes 1 and 2 on slide 202Merger — related items relate to the Bear Stearns and WaMu transactions3Actual numbers for all periods, not over/under. For the period 2Q09, net income available to common used to calculate ratios excludes the one — time, non — cash negative adjustment of $ 1.1B resulting from repayment of TARP preferred capital4See note 5 on slide 20 S T L U S E R L A I C N A N I F |
| Investment Bank |
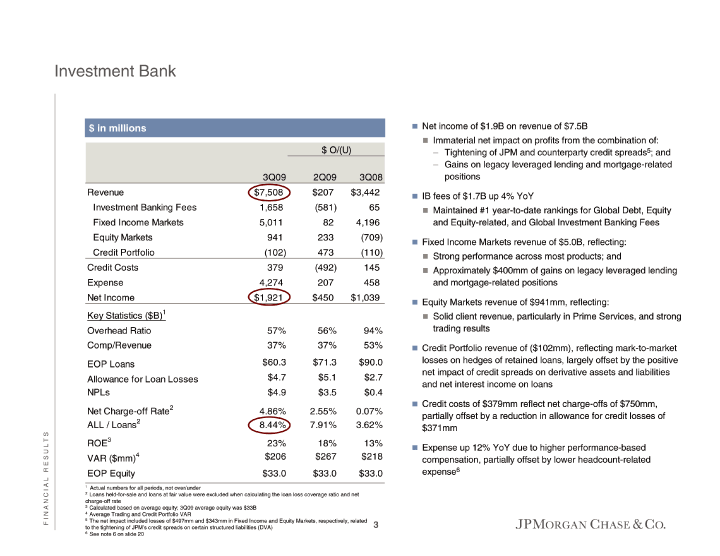
| $ in millions $ in millions$ O/(U) 3Q09 2Q09 3Q08 Revenue $ 7,508 $ 207 $ 3,442 Investment Banking Fees 1,658 (581) 65 Fixed Income Markets 5,011 82 4,196 Equity Markets 941 233 (709) Credit Portfolio (102) 473 (110) Credit Costs 379 (492) 145 Expense 4,274 207 458 Net Income $ 1,921 $ 450 $ 1,039 1 Key Statistics ( $ B) Overhead Ratio 57% 56% 94% Comp/Revenue 37% 37% 53% $ 60.3 $ 71.3 $ 90.0 EOP Loans $ 4.7 $ 5.1 $ 2.7 Allowance for Loan Losses NPLs $ 4.9 $ 3.5 $ 0.4 2 Net Charge — off Rate 4.86% 2.55% 0.07% 2 8.44% 7.91% 3.62% ALL / Loans 3 23% 18% 13% ROE $ 206 $ 267 $ 218 4 VAR ( $ mm) EOP Equity $ 33.0 $ 33.0 $ 33.01Actual numbers for all periods, not over/under2Loans held — for — sale and loans at fair value were excluded when calculating the loan loss coverage ratio and net charge — off rate3Calculated based on average equity; 3Q09 average equity was $ 33B4Average Trading and Credit Portfolio VAR5The net impact included losses of $ 497mm and $ 343mm in Fixed Income and Equity Markets, respectively,relatedto the tightening of JPM’s credit spreads on certain structured liabilities (DVA)6See note 6 on slide 20 S T L U S E R L A I C N A N I F Net income of $ 1.9B on revenue of $ 7.5B Immaterial net impact on profits from the combination of:5; and — Tightening of JPM and counterparty credit spreads — Gains on legacy leveraged lending and mortgage — related positions IB fees of $ 1.7B up 4% YoY Maintained #1 year — to — date rankings for Global Debt, Equity and Equity — related, and Global Investment Banking Fees Fixed Income Markets revenue of $ 5.0B, reflecting: Strong performance across most products; and Approximately $ 400mm of gains on legacy leveraged lending and mortgage — related positions Equity Markets revenue of $ 941mm, reflecting: Solid client revenue, particularly in Prime Services, and strong trading results Credit Portfolio revenue of ( $ 102mm), reflecting mark — to — market losses on hedges of retained loans, largely offset by the positive net impact of credit spreads on derivative assets and liabilities and net interest income on loans Credit costs of $ 379mm reflect net charge — offs of $ 750mm, partially offset by a reduction in allowance for credit losses of $ 371mm Expense up 12% YoY due to higher performance — based compensation, partially offset by lower headcount — related 6 expense |

| Retail Financial Services—drivers Average deposits of $ 339.6B up 62% YoY and down 2% QoQ: QoQ decline partially due to the maturation of high rate 3Q08 WaMu CDs during the quarter $ 210.1 Deposit margin expansion reflects disciplined pricing 3.06% strategy and a portfolio shift to wider spread deposit 24.5 products 5,423 Branch production statistics: 14,389 $ 4,389 Checking accounts up 4% YoY and 1% QoQ Credit card sales down 16% YoY and 18% QoQ Mortgage originations up 152% YoY and 15% QoQ Investment sales up 42% YoY and 18% QoQ Total Consumer Lending originations of $ 46.0B: Mortgage loan originations down 2% YoY and 10% QoQ 3Q08 Auto originations up 82% YoY and 30% QoQ: — YoY increase driven by market share gains in Prime 2.43% segments and new manufacturing relationships; 2.50% — QoQ increase driven primarily by CARS program $ 2.6 3rd party mortgage loans serviced down 1% YoY $ 94.8 $ 37.7 $ 53.5 $ 1,115 $ 3.8 $ 43.94 2Q09 $ 348.1 2.92% 25.3 5,203 14,144 $ 5,292 2Q09 3.84% 4.34% $ 0.6 $ 138.1 $ 41.1 $ 144.7 $ 1,118 $ 5.3 $ 43.1Retail Banking ( $ in billions) Retail Banking ( $ in billions)3Q09 Key Statistics Average Deposits $ 339.6 Deposit Margin 2.99% Checking Accts (mm) 25.5 # of Branches 5,126 # of ATMs 15,038 Investment Sales ( $ mm) $ 6,243Consumer Lending ( $ in billions) Consumer Lending ( $ in billions)3Q09 Credit Metrics: 3.75% Net Charge — off Rate (excl. credit — impaired) ALL / Loans (excl. credit — impaired) 4.56% Key Statistics Home Equity Originations $ 0.5 1 $ 134.0 Avg Home Equity Loans Owned Mortgage Loan Originations $ 37.1 1,2 $ 139.7 Avg Mortgage Loans Owned 3rd Party Mortgage Loans Svc’d $ 1,099 Auto Originations $ 6.9 Avg Auto Loans $ 43.31Includes purchased credit — impaired loans acquired as part of the WaMu transaction2Does not include held — for — sale loans S T L U S E R L A I C N A N I F |
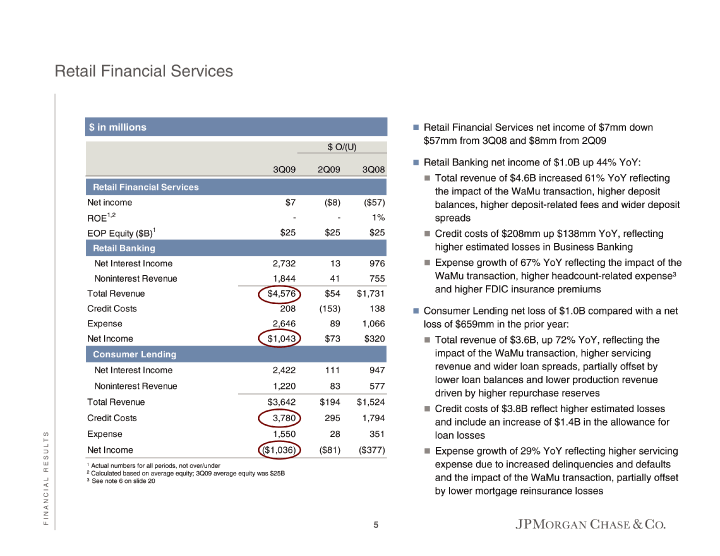
| Retail Financial Services |
| $ in millions $ in millions $ O/(U) 3Q08 ( $ 57) 1% $ 25 976 755 $ 1,731 138 1,066 $ 320 947 577 $ 1,524 1,794 351 ( $ 377) 2Q09 ( $ 8) — $ 25 13 41 $ 54 (153) 89 $ 73 111 83 $ 194 295 28 ( $ 81) 3Q09Retail Financial ServicesNet income $ 7 1,2 — ROE 1 $ 25 EOP Equity ( $ B)Retail Banking Net Interest Income 2,732 Noninterest Revenue 1,844 Total Revenue $ 4,576 Credit Costs 208 Expense 2,646 Net Income $ 1,043Consumer LendingNet Interest Income 2,422 Noninterest Revenue 1,220 Total Revenue $ 3,642 Credit Costs 3,780 Expense 1,550 Net Income ( $ 1,036)1Actual numbers for all periods, not over/under2Calculated based on average equity; 3Q09 average equity was $ 25B S T L U S E R 3 See note 6 on slide 20 L A I C N A N I Retail Financial Services net income of $ 7mm down $ 57mm from 3Q08 and $ 8mm from 2Q09 Retail Banking net income of $ 1.0B up 44% YoY: Total revenue of $ 4.6B increased 61% YoY reflecting the impact of the WaMu transaction, higher deposit balances, higher deposit — related fees and wider deposit spreads Credit costs of $ 208mm up $ 138mm YoY, reflecting higher estimated losses in Business Banking Expense growth of 67% YoY reflecting the impact of the WaMu transaction, higher headcount — related expense3and higher FDIC insurance premiums Consumer Lending net loss of $ 1.0B compared with a net loss of $ 659mm in the prior year: Total revenue of $ 3.6B, up 72% YoY, reflecting the impact of the WaMu transaction, higher servicing revenue and wider loan spreads, partially offset by lower loan balances and lower production revenue driven by higher repurchase reserves Credit costs of $ 3.8B reflect higher estimated losses and include an increase of $ 1.4B in the allowance for loan losses Expense growth of 29% YoY reflecting higher servicing expense due to increased delinquencies and defaults and the impact of the WaMu transaction, partially offset by lower mortgage reinsurance losses |
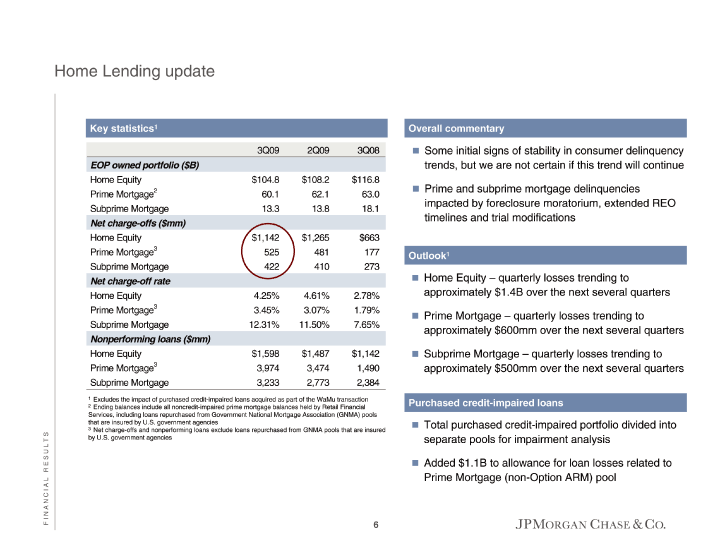
| Home Lending updateOverall commentary Overall commentarySome initial signs of stability in consumer delinquency trends, but we are not certain if this trend will continue Prime and subprime mortgage delinquencies impacted by foreclosure moratorium, extended REO timelines and trial modificationsOutlook1Outlook1Home Equity — quarterly losses trending to approximately $ 1.4B over the next several quarters Prime Mortgage — quarterly losses trending to approximately $ 600mm over the next several quarters Subprime Mortgage — quarterly losses trending to approximately $ 500mm over the next several quarters 3Q08 $ 116.8 63.0 18.1 $ 663 177 273 2.78% 1.79% 7.65% $ 1,142 1,490 2,384 2Q09 $ 108.2 62.1 13.8 $ 1,265 481 410 4.61% 3.07% 11.50% $ 1,487 3,474 2,773 3Q09 $ 104.8 60.1 13.3 $ 1,142 525 422 4.25% 3.45% 12.31% $ 1,598 3,974 3,233Key statistics1Key statistics1EOP owned portfolio ( $ B)Home Equity 2 Prime Mortgage Subprime MortgageNet charge — offs ( $ mm)Home Equity 3 Prime Mortgage Subprime MortgageNet charge — off rateHome Equity 3 Prime Mortgage Subprime MortgageNonperforming loans ( $ mm)Home Equity 3 Prime Mortgage Subprime Mortgage 1 Excludes the impact of purchased credit — impaired loans acquired as part of the WaMu transaction2Ending balances include all noncredit — impaired prime mortgage balances held by Retail Financial pools that are insured Services, including loans repurchased from Government National Mortgage Association (GNMA) pools that are insured by U.S. government agencies Net charge- offs and nonperforming loans exclude loans repurchased from GNMA3 by U. S. government agencies S T L U S E R L A I C N A N I F6 Purchased credit-impaired loans Purchased credit-impaired loans Total purchased credit — impaired portfolio divided into separate pools for impairment analysis Added $ 1.1B to allowance for loan losses related to Prime Mortgage (non — Option ARM) pool |
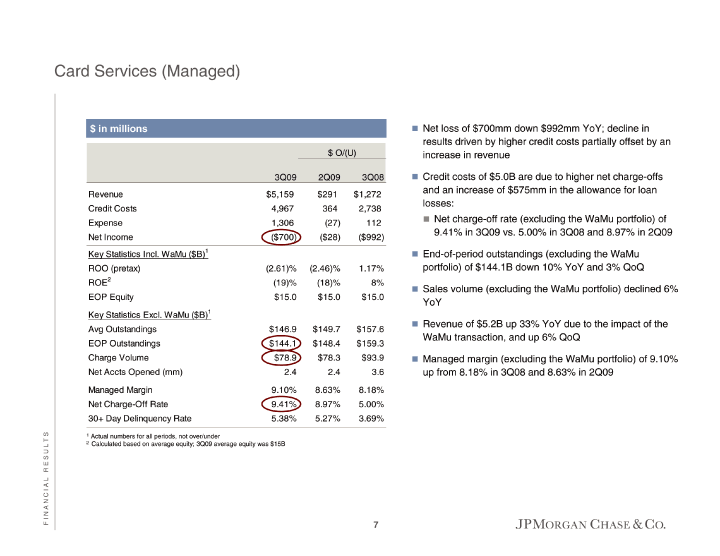
| Card Services (Managed) 3Q08 $ 1,272 2,738 112 ( $ 992) 1.17% 8% $ 15.0 $ 157.6 $ 159.3 $ 93.9 3.6 8.18% 5.00% 3.69% $ O/(U) 3Q09 2Q09 $ 5,159 $ 291 4,967 364 1,306 (27) ( $ 700) ( $ 28) (2.61)% (2.46)% (19)% (18)% $ 15.0 $ 15.0 $ 146.9 $ 149.7 $ 144.1 $ 148.4 $ 78.9 $ 78.3 2.4 2.4 9.10% 8.63% 9.41% 8.97% 5.38% 5.27%$ in millions $ in millionsRevenue Credit Costs Expense Net Income 1 Key Statistics Incl. WaMu ( $ B) ROO (pretax) 2 ROE EOP Equity 1 Key Statistics Excl. WaMu ( $ B) Avg Outstandings EOP Outstandings Charge Volume Net Accts Opened (mm) Managed Margin Net Charge — Off Rate 30+ Day Delinquency Rate 1 Actual numbers for all periods, not over/under2Calculated based on average equity; 3Q09 average equity was $ 15B F7 Net loss of $ 700mm down $ 992mm YoY; decline in results driven by higher credit costs partially offset by an increase in revenue Credit costs of $ 5.0B are due to higher net charge - offs and an increase of $ 575mm in the allowance for loan losses: Net charge — off rate (excluding the WaMu portfolio) of 9.41% in 3Q09 vs. 5.00% in 3Q08 and 8.97% in 2Q09 End — of - period outstandings (excluding the WaMu portfolio) of $ 144.1B down 10% YoY and 3% QoQ Sales volume (excluding the WaMu portfolio) declined 6% YoY Revenue of $ 5.2B up 33% YoY due to the impact of the WaMu transaction, and up 6% QoQ Managed margin (excluding the WaMu portfolio) of 9.10% up from 8.18% in 3Q08 and 8.63% in 2Q09 |
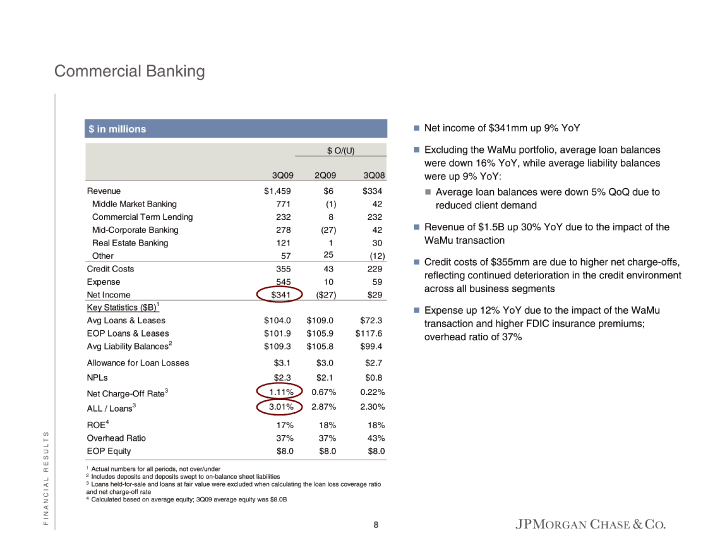
| Commercial Banking$ in millions $ in millions $ O/(U) 3Q08 $ 334 42 232 42 30 (12) 229 59 $ 29 $ 72.3 $ 117.6 $ 99.4 $ 2.7 $ 0.8 0.22% 2.30% 18% 43% $ 8.0 2Q09 $ 6 (1) 8 (27) 1 25 43 10 ( $ 27) $ 109.0 $ 105.9 $ 105.8 $ 3.0 $ 2.1 0.67% 2.87% 18% 37% $ 8.0 3Q09 $ 1,459 771 232 278 121 57 355 545 $ 341 $ 104.0 $ 101.9 $ 109.3 $ 3.1 $ 2.3 1.11% 3.01% 17% 37% $ 8.0 Revenue Middle Market Banking Commercial Term Lending Mid — Corporate Banking Real Estate Banking Other Credit Costs Expense Net Income 1 Key Statistics ( $ B) Avg Loans & Leases EOP Loans & Leases 2 Avg Liability Balances Allowance for Loan Losses NPLs 3 Net Charge — Off Rate 3 ALL / Loans 4 ROE Overhead Ratio EOP Equity1Actual numbers for all periods, not over/under S T L U S E R8 Includes deposits and deposits swept to on-balance sheet liabilities Loans held-for-sale and loans at fair value were excluded when calculating the loan loss coverage ratio and net charge-off rate Calculated based on average equity; 3Q09 average equity was $8.0B2 3 4 L A I C N A N I F Net income of $ 341mm up 9% YoY Excluding the WaMu portfolio, average loan balances were down 16% YoY, while average liability balances were up 9% YoY: Average loan balances were down 5% QoQ due to reduced client demand Revenue of $ 1.5B up 30% YoY due to the impact of the WaMu transaction Credit costs of $ 355mm are due to higher net charge — offs, reflecting continued deterioration in the credit environment across all business segments Expense up 12% YoY due to the impact of the WaMu transaction and higher FDIC insurance premiums; overhead ratio of 37% |

| Treasury & Securities Services $ O/(U) 2Q09 3Q08 ( $ 112) ( $ 165) (15) (27) (97) (138) (8) (59) ( $ 77) ( $ 104) $ 234.2 $ 260.0 $ 13.7 $ 14.4 31% 29% 30% 46% $ 2,642 $ 2,672 $ 1,676 $ 1,665 $ 340.0 $ 359.4 $ 5.0 $ 4.5 3Q09 $ 1,788 919 869 1,280 $ 302 $ 231.5 $ 14.9 26% 24% $ 2,523 $ 1,654 $ 340.8 $ 5.0$ in millions $ in millionsRevenue Treasury Services Worldwide Securities Svcs Expense Net Income 1 Key Statistics 2 Avg Liability Balances ( $ B) Assets under Custody ( $ T) Pretax Margin 3 ROE TSS Firmwide Revenue TS Firmwide Revenue 2 TSS Firmwide Avg Liab Bal ( $ B) EOP Equity ( $ B) 1 Actual numbers for all periods, not over/under2Includes deposits and deposits swept to on — balance sheet liabilities3Calculated based on average equity; 3Q09 average equity was $ 5B4See note 6 on slide 20 S T L U S E R L A I C N A N I F9 Net income of $ 302mm down 26% YoY and 20% QoQ Pretax margin of 26% Liability balances down 11% YoY and 1% QoQ Assets under custody up 3% YoY and 8% QoQ Revenue of $ 1.8B down 8% YoY, primarily driven by: WSS revenue of $ 869mm down 14% YoY due to lower securities lending balances, lower spreads and balances on liabilities products as well as the effect of market depreciation on certain custody assets TS revenue of $ 919mm down 3% YoY, reflecting spread compression on deposit products, offset by higher trade revenue driven by wider spreads and higher card product volumes Expense down 4% YoY, due to lower headcount — related expense , partially offset by higher FDIC insurance 4 premiums |
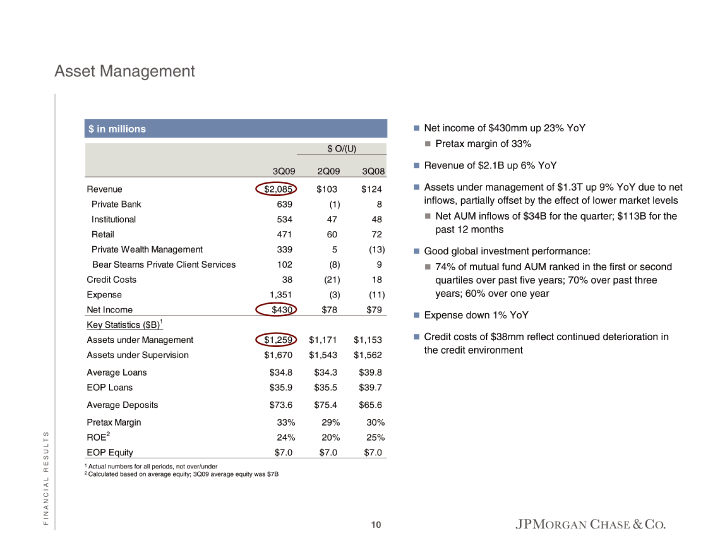
| Asset Management$ in millions $ in millions $ O/(U) 3Q08 $ 124 8 48 72 (13) 9 18 (11) $ 79 $ 1,153 $ 1,562 $ 39.8 $ 39.7 $ 65.6 30% 25% $ 7.010 2Q09 $ 103 (1) 47 60 5 (8) (21) (3) $ 78 $ 1,171 $ 1,543 $ 34.3 $ 35.5 $ 75.4 29% 20% $ 7.0 3Q09 $ 2,085 639 534 471 339 102 38 1,351 $ 430 $ 1,259 $ 1,670 $ 34.8 $ 35.9 $ 73.6 33% 24% $ 7.0 Revenue Private Bank Institutional Retail Private Wealth Management Bear Stearns Private Client Services Credit Costs Expense Net Income 1 Key Statistics ( $ B) Assets under Management Assets under Supervision Average Loans EOP Loans Average Deposits Pretax Margin 2 ROE EOP Equity1Actual numbers for all periods, not over/under2Calculated based on average equity; 3Q09 average equity was $ 7B S T L U S E R L A I C N A N I F Net income of $ 430mm up 23% YoY Pretax margin of 33% Revenue of $ 2.1B up 6% YoY Assets under management of $ 1.3T up 9% YoY due to net inflows, partially offset by the effect of lower market levels Net AUM inflows of $ 34B for the quarter; $ 113B for the past 12 months Good global investment performance: 74% of mutual fund AUM ranked in the first or second quartiles over past five years; 70% over past three years; 60% over one year Expense down 1% YoY Credit costs of $ 38mm reflect continued deterioration in the credit environment |

| Corporate/Private Equity $ O/ (U) 2Q09 3Q08 $ 115 $ 252 276 2,150 88 665 $ 479 $ 3,067 3Q09 $ 88 1,269 (70) $ 1,287Net Income ( $ in millions) Net Income ( $ in millions)Private Equity Corporate Merger — related items Net Income11 Private Equity Private Equity gains of $ 155mm in 3Q09 ’ Private Equity portfolio of $ 6.8B (6.0% of shareholders equity less goodwill)Corporate Net income of $ 1.3B includes the following: Noninterest revenue of approximately $ 900mm (after — tax), primarily related to investment portfolio trading income Benefit of higher investment portfolio net interest income 3Q08 $ 112 $ 86 $ 1,261 $ 2,251 8.9% 6.8% 2Q09 $ 122 $ 97 $ 1,260 $ 2,027 9.7% 7.7% 3Q09 $ 127 $ 101 $ 1,241 $ 2,041 10.2% 8.2% |
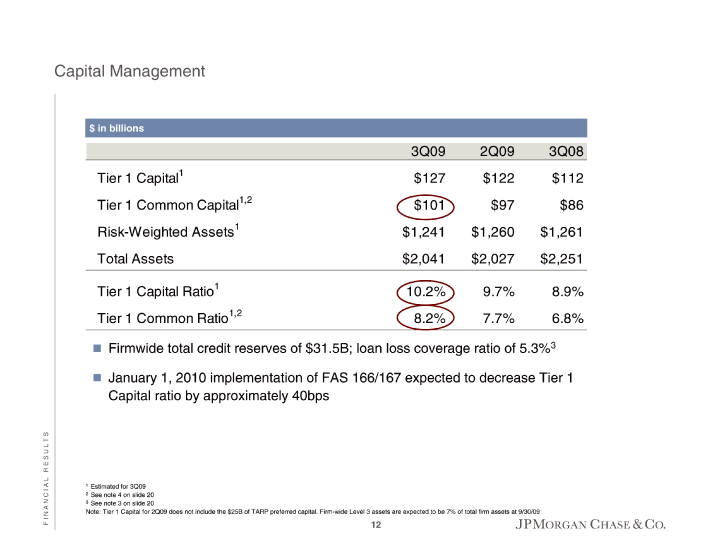
| Capital Management$ in billions $ in billions1 Tier 1 Capital 1,2 Tier 1 Common Capital 1 Risk — Weighted Assets Total Assets 1 Tier 1 Capital Ratio 1,2 Tier 1 Common Ratio 3 Firmwide total credit reserves of $ 31.5B; loan loss coverage ratio of 5.3% January 1, 2010 implementation of FAS 166/167 expected to decrease Tier 1 Capital ratio by approximately 40bps S T L U S E R12 Estimated for 3Q09 See note 4 on slide 20 See note 3 on slide 20 Note: Tier 1 Capital for 2Q09 does not include the $25B of TARP preferred capital. Firm-wide Level 3 assets are expected to be 7% of total firm assets at 9/30/091 2 3 L A I C N A N I F |
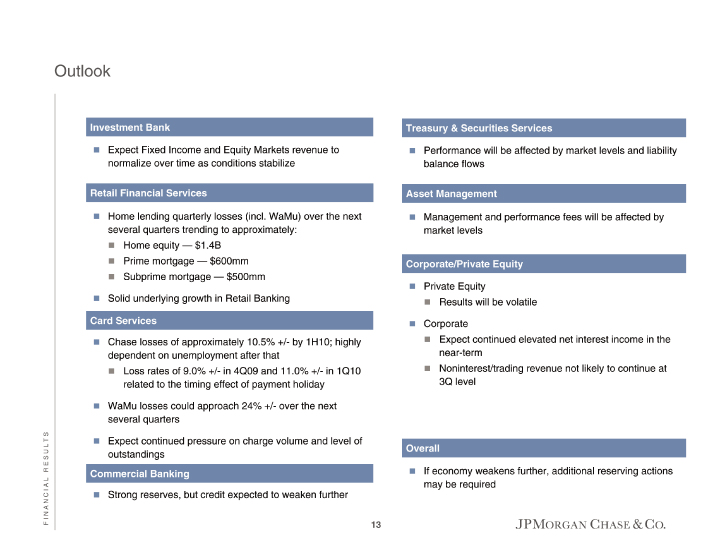
| OutlookInvestment Bank Investment Bank Expect Fixed Income and Equity Markets revenue to normalize over time as conditions stabilizeRetail Financial Services Retail Financial Services Home lending quarterly losses (incl. WaMu) over the next several quarters trending to approximately: Home equity — $ 1.4B Prime mortgage — $ 600mm Subprime mortgage — $ 500mm Solid underlying growth in Retail Banking by 1H10; highly Chase losses of approximately 10.5% +/- dependent on unemployment after thatCard Services Card Services Loss rates of 9.0% +/ — in 4Q09 and 11.0% +/ — in 1Q10 related to the timing effect of payment holiday over the next WaMu losses could approach 24% +/- several quarters Expect continued pressure on charge volume and level of L T S outstandingsCommercial Banking Commercial Banking U S E R L13 Strong reserves, but credit expected to weaken further A I C N A N I FTreasury & Securities ServicesTreasury & Securities Services Performance will be affected by market levels and liability balance flowsAsset Management Asset Management Management and performance fees will be affected by market levelsCorporate/Private Equity Corporate/Private Equity Private Equity Results will be volatile Corporate Expect continued elevated net interest income in the near — term Noninterest/trading revenue not likely to continue at 3Q levelOverallOverall If economy weakens further, additional reserving actions may be required |
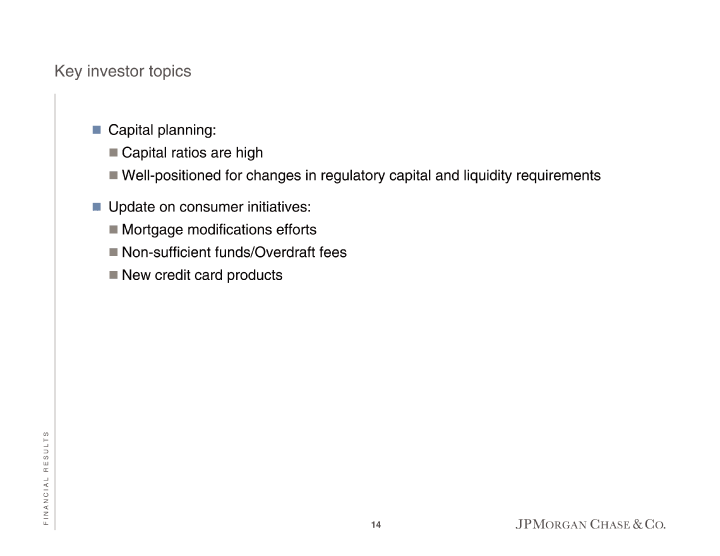
| Key investor topics Capital planning: Capital ratios are high Well — positioned for changes in regulatory capital and liquidity requirements Update on consumer initiatives: Mortgage modifications efforts Non - - sufficient funds/Overdraft fees New credit card products14 |
| Page15 15 Appendix Agenda |
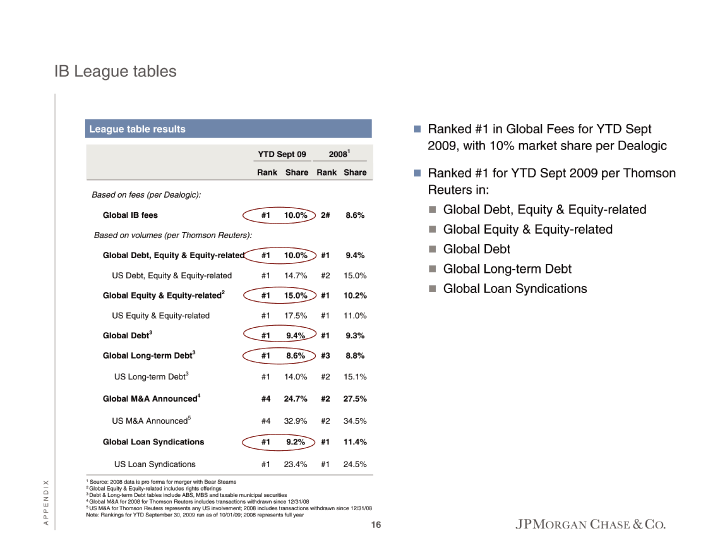
| R E S U L T S F I N A N C I A L IB League tables1 YTD Sept 09 2008 Rank Share Rank Share #1 10.0% 2# 8.6% #1 10.0% #1 9.4%#1 14.7% #2 15.0%#1 15.0% #1 10.2%#1 17.5% #1 11.0%#1 9.4% #1 9.3% #1 8.6% #3 8.8%#1 14.0% #2 15.1%#4 24.7% #2 27.5%#4 32.9% #2 34.5%#1 9.2% #1 11.4%#1 23.4% #1 24.5%League table results League table resultsBased on fees (per Dealogic):Global IB feesBased on volumes (per Thomson Reuters):Global Debt, Equity & Equity — relatedUS Debt, Equity & Equity - related2 Global Equity & Equity — relatedUS Equity & Equity — related3 Global Debt 3 Global Long - - term Debt3 US Long — term Debt4 Global M&A Announced5 US M&A AnnouncedGlobal Loan SyndicationsUS Loan Syndications 1 Source: 2008 data is pro forma for merger with Bear Stearns2Global Equity & Equity — related includes rights offerings3Debt & Long — term Debt tables include ABS, MBS and taxable municipal securities4Global M&A for 2008 for Thomson Reuters includes transactions withdrawn since 12/31/085US M&A for Thomson Reuters represents any US involvement; 2008 includes transactions withdrawn since 12/31/08 Note: Rankings for YTD September 30, 2009 run as of 10/01/09; 2008 represents full year X I D N E P P A16 Ranked #1 in Global Fees for YTD Sept 2009, with 10% market share per Dealogic Ranked #1 for YTD Sept 2009 per Thomson Reuters in: Global Debt, Equity & Equity — related Global Equity & Equity - - related Global Debt Global Long — term Debt Global Loan Syndications |
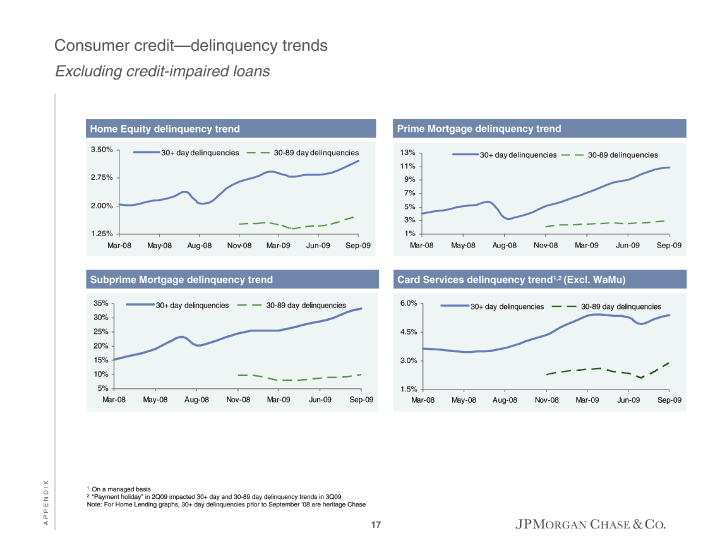
| Consumer credit—delinquency trendsExcluding credit-impaired loans X 1 On a managed basis2“Payment holiday” in 2Q09 impacted 30+ day and 30 — 89 day delinquency trends in 3Q09 Note: For Home Lending graphs, 30+ day delinquencies prior to September ’08 are heritage Chase I D N E P P A17 |
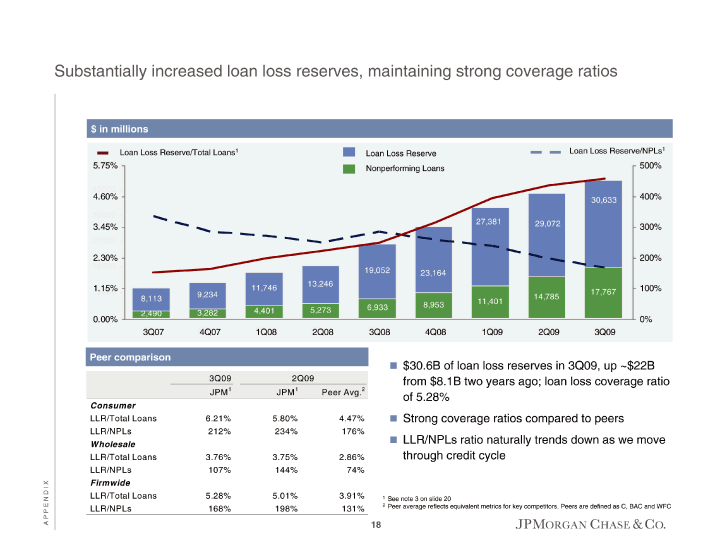
| Substantially increased loan loss reserves, maintaining strong coverage ratios18 $ 30.6B of loan loss reserves in 3Q09, up ~ $ 22B from $ 8.1B two years ago; loan loss coverage ratio of 5.28% Strong coverage ratios compared to peers LLR/NPLs ratio naturally trends down as we move through credit cycle1See note 3 on slide 202Peer average reflects equivalent metrics for key competitors. Peers are defined as C, BAC and WFC |
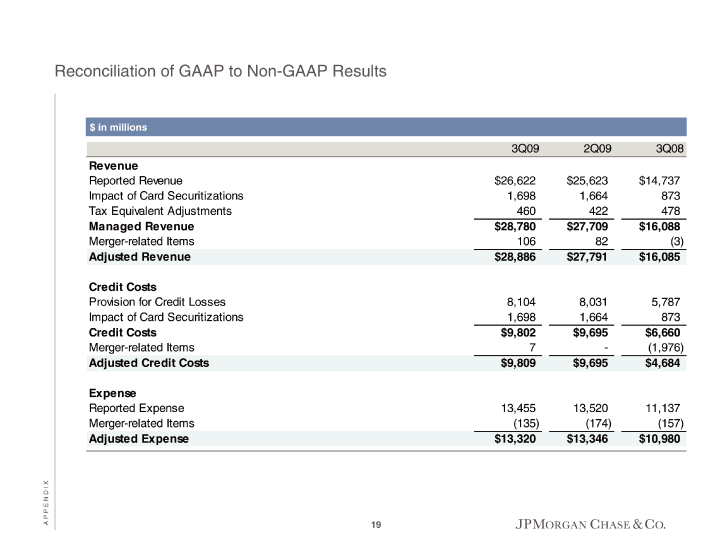
| 3Q08 $ 14,737 873 478$ 16,088(3)$ 16,0855,787 873$ 6,660(1,976)$ 4,68411,137 (157)$ 10,980 2Q09 $ 25,623 1,664 422$ 27,70982$ 27,7918,031 1,664$ 9,695-$ 9,69513,520 (174)$ 13,346 3Q09 $ 26,622 1,698 460$ 28,780106$ 28,8868,104 1,698$ 9,8027$ 9,80913,455 (135)$ 13,320 Reconciliation of GAAP to Non — GAAP Results$ in millions $ in millions RevenueReported Revenue Impact of Card Securitizations Tax Equivalent AdjustmentsManaged RevenueMerger — related ItemsAdjusted Revenue Credit CostsProvision for Credit Losses Impact of Card SecuritizationsCredit CostsMerger — related ItemsAdjusted Credit Costs ExpenseReported Expense Merger — related ItemsAdjusted Expense 19 |
| Notes on non-GAAP financial measures and forward-looking statementsThis presentation includes non-GAAP financial measures.value and loans held- in Additionally, Consumer Lending net charge-off rates exclude the impact of purchased credit-impaired loans. The allowance related to the MSRs) and goodwill, net of related deferred tax liabilities. The TCE measures costs related to employees. 1.Financial results are presented on a managed basis, as such basis is described in the firm’s Quarterly Reports on Form 10-Q for the quarters ended March 31, 2009 and June 30, 2009, and its Annual Report on Form 10-K for the year ended December 31, 2008. 2.All non-GAAP financial measures included in this presentation are provided to assist readers in understanding certain trend information. Additional information concerning such non-GAAP financial measures can be found in the above-referenced filings, to which reference is hereby made. 3.The ratio for the allowance for loan losses to end-of-period loans excludes the following: loans accounted for at fair for-sale; purchased credit-impaired loans; the allowance for loan losses related to purchased credit-impaired loans; and, loans from the Washington Mutual Master Trust, which were consolidated on the firm’s balance sheet at fair value during the second quarter of 2009. purchased credit-impaired portfolio was $1.1 billion at September 30, 2009. 4.Tier 1 Common Capital (“Tier 1 Common”) is calculated, for all purposes, as Tier 1 Capital less qualifying perpetual preferred stock, qualifying trust preferred securities, and qualifying minority interest in subsidiaries. 5.Tangible Common Equity (“TCE”) is calculated, for all purposes, as common stockholders equity (i.e., total stockholders’ equity less preferred stock) less identifiable intangible assets (other than used in this presentation are not necessarily comparable to similarly titled measures provided by other firms due to differences calculation methodologies. 6.Headcount-related expense includes salary and benefits, and other noncompensationForward looking statementsSuch Factors that could cause JPMorgan Chase’s Actual results may differ from those set forth in the forward-looking statements. ) and on the Securities and Exchange Commission’s website (www.sec.gov). JPMorgan Chase does20This presentation contains forward-looking statements within the meaning of the Private Securities Litigation Reform Act of 1995. statements are based upon the current beliefs and expectations of JPMorgan Chase’s management and are subject to significant risks and uncertainties. actual results to differ materially from those described in the forward-looking statements can be found in JPMorgan Chase’s Quarterly Reports on Form 10-Q for the quarters ended March 31, 2009 and June 30, 2009, and its Annual Report on Form 10-K for the year ended December 31, 2008, each of which has been filed with the Securities and Exchange Commission and is available on JPMorgan Chase’s website (www.jpmorganchase.com not undertake to update the forward-looking statements to reflect the impact of circumstances or events that may arise after the date of the forward-looking statements. APPENDIX |