Exhibit 99.1

Disclaimer
These presentations contain forward-looking statements within the meaning of the Private Securities Litigation Reform Act of 1995. Such statements are based upon the current beliefs and expectations of JPMorgan Chase’s management and are subject to significant risks and uncertainties. Actual results may differ from those set forth in the forward-looking statements. Factors that could cause JPMorgan Chase’s results to differ materially from those described in the forward-looking statements can be found in the 2006 Annual Report on Form 10-K for the year ended December 31, 2006 (2006 Annual Report) of JPMorgan Chase filed with the Securities and Exchange Commission and available at the Securities and Exchange Commission’s Internet site (http://www.sec.gov).
The 2003 and 2004 financial information provided in this presentation is presented on a proforma combined basis, which includes purchase accounting adjustments made in connection with the merger of JPMorgan Chase and Bank One. The 2003 and 2004 proforma combined historical results represent how the financial information of JPMorgan Chase and Bank One may have appeared on a combined basis had the two companies been merged as of January 1, 2003. Additional information, including a reconciliation from proforma results to GAAP, can be found on the Form 8-K/As furnished to the Securities and Exchange Commission on April 20, 2005 and July 20, 2005.
The selected financial information provided in this presentation for periods prior to 2003 is presented on a combined basis and represents only the summation of historical results reported by JPMorgan Chase and Bank One, without any purchase accounting adjustments.
 | 2 |
2007 Investor Day Agenda
Opening Remarks | 9:00 a.m. | |
Investment Bank –Steve Black & Bill Winters | 9:15 a.m. | |
Asset Management –Jes Staley | 10:00 a.m. | |
Break | 10:30 a.m. | |
Card Services –Rich Srednicki | 10:45 a.m. | |
Lunch | 12:00 p.m. | |
Treasury & Securities Services –Heidi Miller | 1:00 p.m. | |
Commercial Banking –Todd Maclin | 1:30 p.m. | |
Break | 2:00 p.m. | |
Retail Financial Services –Charlie Scharf | 2:15 p.m. | |
Corporate –Mike Cavanagh & Frank Bisignano | 3:00 p.m. | |
Closing Remarks and Q&A –Jamie Dimon | 3:30 p.m. |
| 3 |
MARCH 6, 2007
INVESTMENT BANK
Steve Black and Bill Winters, co-CEOs

Agenda
| • | Review of 2006 performance |
| • | Performance target |
| • | Areas of focus |
| • | Accelerate revenue growth |
| • | Build and retain talent |
| • | Enhance management discipline |
| • | Key takeaways |
2007 JPMORGAN CHASE INVESTOR DAY
| 1 |
2006 Performance
Financial results ($mm)
| 2006 | 2005 | % O/(U) | |||||||||
Net Revenue | $ | 18,277 | $ | 14,613 | 25 | % | |||||
Investment Banking Fees | 5,537 | 4,096 | 35 | ||||||||
Fixed Income Markets | 8,369 | 7,277 | 15 | ||||||||
Equity Markets | 3,264 | 1,799 | 81 | ||||||||
Credit Portfolio | 1,107 | 1,441 | (23 | ) | |||||||
Credit Costs | 191 | (838 | ) | NM | |||||||
Noninterest Expense | 12,304 | 9,749 | 26 | ||||||||
Compensation Expense | 8,190 | 5,792 | 41 | ||||||||
Noncomp Expense | 4,114 | 3,957 | 4 | % | |||||||
Net Income | $ | 3,764 | $ | 3,763 | — | ||||||
Key Statistics | |||||||||||
ROE | 18 | % | 18 | % | |||||||
Overhead Ratio1 | 65 | % | 67 | % | |||||||
Comp/Revenue Ratio1 | 43 | % | 40 | % | |||||||
VAR2 | $ | 88 | $ | 88 | |||||||
1 | Ratios exclude effect of SFAS 123R |
2 | IB Trading and Credit Portfolio VAR |
2006 Highlights
| • | Record revenue |
| • | Record IB fees |
| • | Record debt and equity underwriting |
| • | Highest advisory fees since 2000 |
| • | Record Fixed Income and Equity Markets |
| • | Credit cost versus prior year benefit; continued stable credit quality |
| • | Good expense management, with noncompensation expense relatively flat to 2005 |
| • | Net Income flat despite $1 billion increase in credit costs |
2007 JPMORGAN CHASE INVESTOR DAY
| 2 |
2006 was a break-out year in revenue growth
Total revenue ($B)
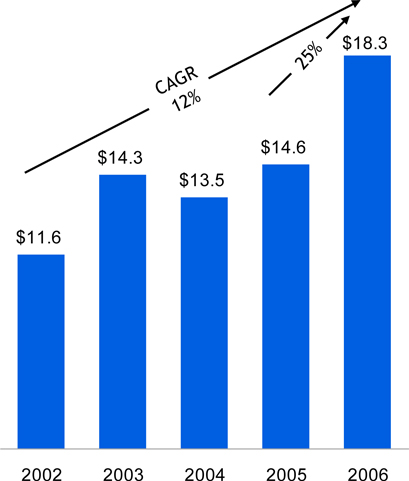
IB fees ($B)
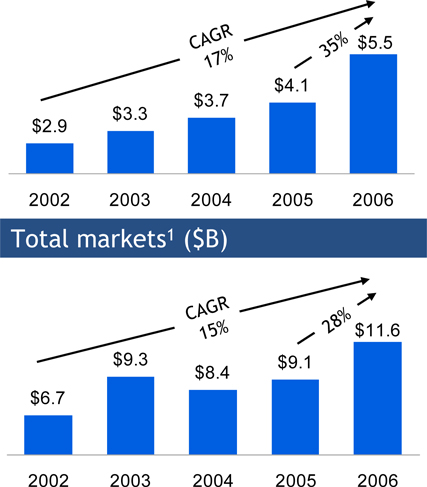
Note: 2002 data presented on a combined basis for JPM and Bank One; 2003 - 2004 data presented on a pro forma basis
1 | Includes Fixed Income and Equity Markets revenue |
2007 JPMORGAN CHASE INVESTOR DAY
| 3 |
#1 globally in our targeted transactions
| • | #1 in “Target deals” including and excluding loans |
| • | #1 in M&A “Target deals” |
| • | #1 in Loan “Target deals” |
# deals-2006
“Target deals” defined as:
| • | M&A transactions³ $250mm |
| • | Equity transactions³ $100mm |
| • | Investment Grade Corporate Bonds³ $500mm |
| • | High Yield Corporate Bonds³ $250mm |
| • | Syndication Loans: Leveraged³ $250mm and Investment Grade³ $1B |
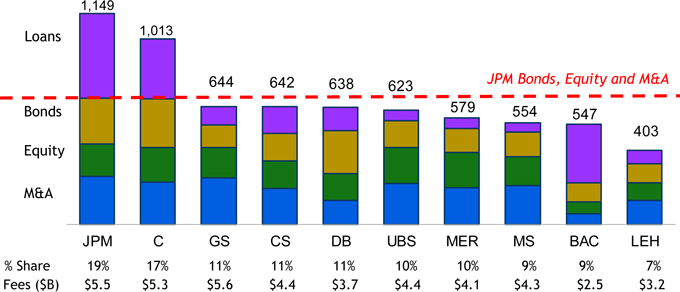
Source: Dealogic
2007 JPMORGAN CHASE INVESTOR DAY
| 4 |
We maintain focus on growing our Fixed Income and Equity Markets franchises
2006 Fixed Income Markets revenue ($B)
2006 Equity Markets revenue ($B)
2007 JPMORGAN CHASE INVESTOR DAY
| 5 |
Agenda
| • | Review of 2006 performance |
| • | Performance target |
| • | Areas of focus |
| • | Accelerate revenue growth |
| • | Build and retain talent |
| • | Enhance management discipline |
| • | Key takeaways |
2007 JPMORGAN CHASE INVESTOR DAY
| 6 |
Performance target and 2007 outlook
Performance target
| • | 20% ROE through the cycle |
| • | Strive to achieve by end of 2007 |
2007 Outlook
| • | Strong IB fee pipeline entering 2007 |
| • | Credit costs trend to more normal levels |
| • | Modest increase in expense (ex. incentive compensation) reflecting continued investments in growth areas |
2007 JPMORGAN CHASE INVESTOR DAY
| 7 |
Agenda
| • | Review of 2006 performance |
| • | Performance target |
| • | Areas of focus |
| • | Accelerate revenue growth |
| • | Maintain momentum in IB fees |
| • | Capture synergies of universal bank model |
| • | Fill product gaps |
| • | Invest in growth initiatives |
| • | Build and retain talent |
| • | Enhance management discipline |
| • | Risk productivity and ROI |
| • | Credit risk |
| • | Capital re-allocation |
| • | Business efficiency and expense management |
| • | Key takeaways |
2007 JPMORGAN CHASE INVESTOR DAY
| 8 |
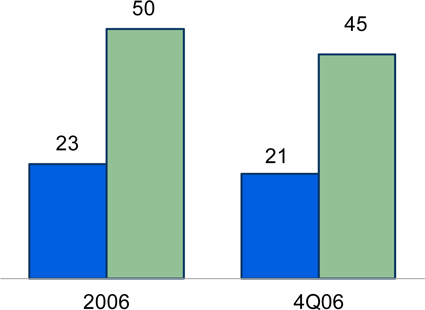
Keys to our success: transformational deals
| 2006 | 2005 | |||||
JPM participation in top 25 Global M&A Announced deals | 56 | % | 44 | % | ||
JPM participation in top 25 LBOs | 48 | % | 40 | % | ||
JPM participation in top 25 fee events | 48 | % | 40 | % | ||
JPM wallet share in top 25 fee events | 9.0 | % | 7.4 | % |
Source: Dealogic

| 2006 | 2005 | |||||||
No. of deals generating $25mm+ in IB fees (“elephant” deals) | 27 | 10 | ||||||
Aggregate IB fees from “elephant” deals ($mm) | ~$ | 1,200 | ~ $ | 400 | ||||
Percentage of total IB fees | 23 | % | 10 | % | ||||
2007 JPMORGAN CHASE INVESTOR DAY
| 9 |
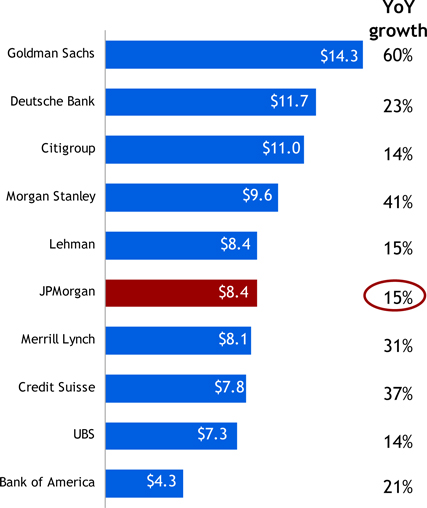
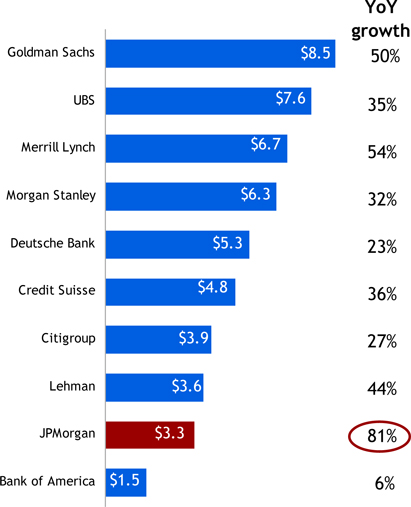
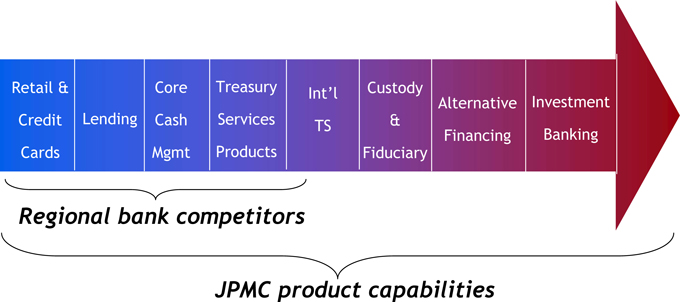
Powerful client franchise with significant upside

Source: Dealogic, 3/1/07; Data for FY 2006
2007 JPMORGAN CHASE INVESTOR DAY
| 10 |
Continuing to capture synergies of the universal bank model
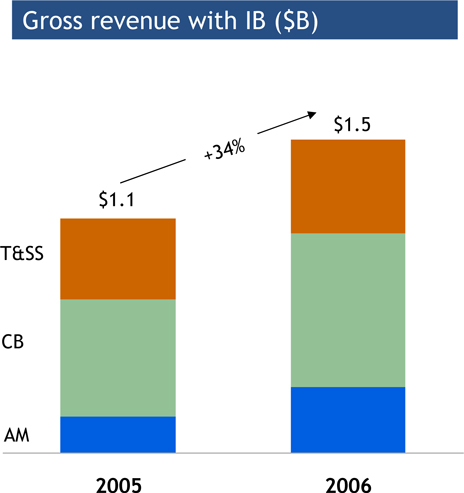
Examples of 2006 progress
| • | T&SS: FX revenue from TSS cross-sell up 17% from 2005 |
| • | CB: Gross IB revenue from CB clients up 30% from 2005 |
| • | AM: Fivefold increase in AUM from IB/Mid-Corp referrals |
2007 JPMORGAN CHASE INVESTOR DAY
| 11 |
Key growth initiatives
Progress | Next steps | Incremental earnings impact1 | ||||
| Energy | • America build-out largely complete
• 2006 client revenues 80% above 2005 level
• Expanded our product capabilities
• Trading in Physical Gas & Storage, Financial & Physical Power, Coal, Financial Oil, Emissions Credits, Dry Freight | • Complete European build-out; focus on Asia
• Estimated wallet of $11B by 2010 – targeting a 8% market share | $100-$160mm | |||
| Securitized Products | • Strong performance with increased market share:
-Global ABS2: #10 to #6 -Global ABS conduits3: #2 -Fannie Mae CMO4: #1 -CMBS5: #2 U.S., #4 Global
| • Continue to expand our securitization capabilities across the globe, including in principal finance | $100-$160mm | |||
• Securitization of Chase Home Lending non-conforming production for sale at 95% (up from 80% in 2005) | ||||||
1 | Potential incremental impact to 2006 earnings post build-out, which may be beyond 2007; results will be dependent on market conditions |
2 | Source: Thomson Financial |
3 | Moody’s Asset-Backed Commercial Paper program index, Six-months ended June 30, 2006 |
4 | Source: FNMA |
5 | Source: Commercial Mortgage Alert |
2007 JPMORGAN CHASE INVESTOR DAY
| 12 |
Key growth initiatives
Progress | Next steps | Incremental earnings impact1 | ||||
| Asia | • Asia ex. Japan JPM IB fees CAGR of 30%+ from 2004-2006
• Threefold increase in China revenue with strong traction in ECM since 2004
• 50%+ revenue growth in India since 2004 | Next steps for Emerging Markets below, plus:
• Continue to address expected growth in China ECM wallet
• Client opportunity in Korea from expected de-regulation
• Middle market opportunity in India
• Market share growth opportunity in Japan | $50-$250mm | |||
| Emerging Markets | • Strong 2006 local markets performance in EMEA (72% YoY growth) and Latin America (86% YoY growth)
• Emerging Markets underwriting fees grew ~50% YoY | • Develop strong local securities capabilities to complement existing strong cross-border franchise
• Grow organically or through partnership/acquisition if opportunities exist
• Leverage existing leadership positions in high growth markets (Eastern Europe, Russia, Brazil, Middle East) | $50mm+ | |||
1 | Potential incremental impact to 2006 earnings post build-out, which may be beyond 2007; results will be dependent on market conditions |
2007 JPMORGAN CHASE INVESTOR DAY
| 13 |
Key growth initiatives
Progress | Next Steps | Incremental earnings impact1 | ||||
| Pension Advisory and Risk Management | • Completed principal investment in UK pension insurance company to transfer pension plans from corporates
• Obtained Advisory Opinion supporting our risk management model
• Initiated work on tools to more effectively manage longevity risks | • Complete initial transactions in UK
• Implement pension risk management framework
• Build-out of proprietary risk management analytics and securitized & traded pensions liability market
• Continue development of mortality indices and longevity risks products | $50-$100mm | |||
| Retail Structured Products | • Achieved 30%+ revenue growth in 2006
• Aggressive build-up of the team – added over 20 marketers in 2006
• Strategic alliance with Fidelity Brokerage Co to provide JPmorgan Equity & Fixed Income products | • 2007 investments in:
• Additional marketing hires
• Tech & Ops to build client services and cross-product STP infrastructure
• Expanding issuance vehicles capabilities
• Marketing & branding | $50-$100mm | |||
1 | Potential incremental impact to 2006 earnings post build-out, which may be beyond 2007; results will be dependent on market conditions |
2007 JPMORGAN CHASE INVESTOR DAY
| 14 |
Key growth initiatives
Progress | Next Steps | Incremental earinings impact1 | ||||
IB Coverage Expansion | • Conducted Strategic analysis of client segmentation, clients per banker, existing client growth and new client opportunities
• Detailed account planning complete | • Complete investment hires
• Track calling activity to continually ensure that resources are aligned with revenue opportunities | $25-$50mm |
1 | Potential incremental impact to 2006 earnings post build-out, which may be beyond 2007; results will be dependent on market conditions |
2007 JPMORGAN CHASE INVESTOR DAY
| 15 |
Great progress on people agenda
• Critical hires in growth areas
• Top talent management
• Retention
• Entry-level talent pipeline
• Manager training & accountability
• Diversity | 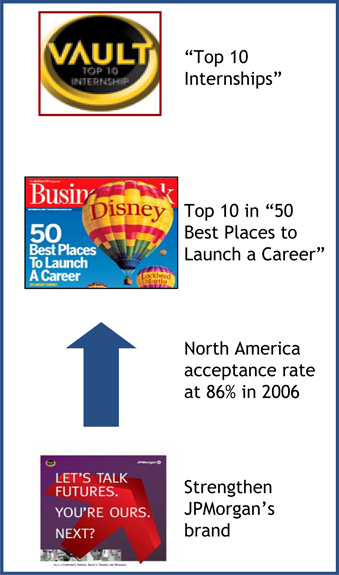 |
2007 JPMORGAN CHASE INVESTOR DAY
| 16 |
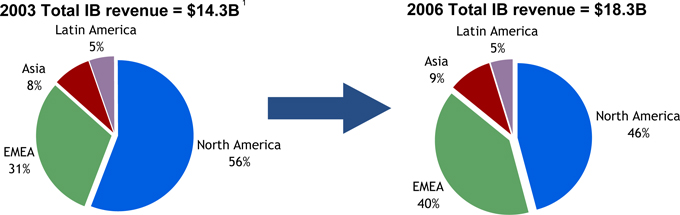
A more diverse revenue stream across regions and asset classes
Total IB revenue
Markets revenue2
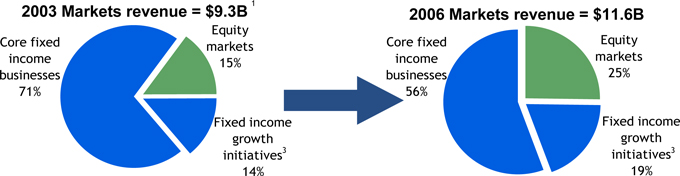
1 | 2003 results presented on a pro forma basis |
2 | Fixed Income and Equity Markets revenue |
3 | Fixed Income growth initiatives include Energy, Securitized Products and Emerging Markets |
2007 JPMORGAN CHASE INVESTOR DAY
| 17 |
Reduced trading volatility and enhanced returns
Principal transactions ($mm)
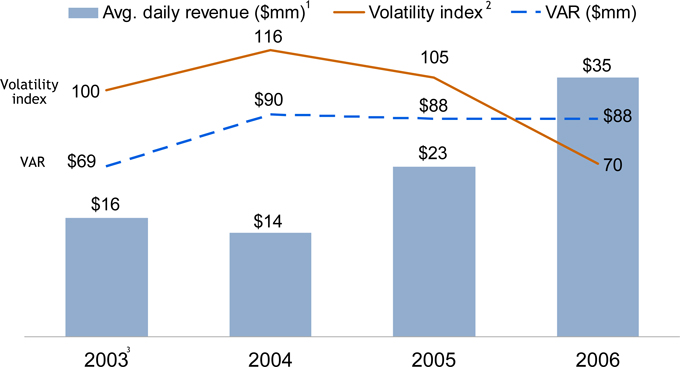
1 | Average daily revenue of principal transactions |
2 | Daily revenue volatility indexed to 100 for 2003 |
3 | 2003 data reflects JPMorgan Chase only |
2007 JPMORGAN CHASE INVESTOR DAY
| 18 |
Loans down 28% since 2000 with growing fee share
Average loans and IB fee market share ($B)
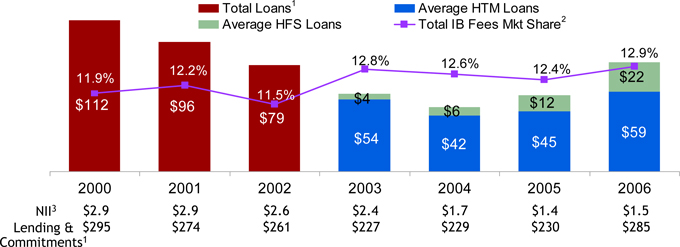
| • | Strong credit quality of IB loan book — 71% investment grade |
| • | Prudence in a credit bull market resulted in lower NII |
| • | Recent loan growth driven by capital markets activity and securitization business build-out |
| • | Largest industry concentration (Banks & Finance companies) was 10% in 2006, down from 17% in 2003 |
1 | Loan balances for 2000-2002 are presented on a combined basis for JPM IB loans and Bank One Corporate Banking loans ex. Commercial Real Estate loans; loan balances for 2003-2004 are presented on a pro forma basis |
2 | Market share calculated based on total IB fees reported by the following peers : C, GS, MS, DB, UBS, CS, LEH, MER, and BAC; C and UBS fees are firm-wide |
3 | IB NII excluding trading-related NII |
2007 JPMORGAN CHASE INVESTOR DAY
| 19 |
Efficiency/expense management initiatives
Progress | Next steps | Incremental earnings impact1 | ||
• Funding investments with continued productivity savings | • Reduce support to front office ratios
• Migrate support functions to lower cost locations
• Automate and streamline business processes
• Consolidate servers and applications
• Optimize usage of market data services and travel & entertainment | $160-$270mm |
1 | Potential incremental impact to 2006 earnings; results may be achieved beyond 2007 |
2007 JPMORGAN CHASE INVESTOR DAY
| 20 |
Agenda
| • | Review of 2006 performance |
| • | Performance target |
| • | Areas of focus |
| • | Accelerate revenue growth |
| • | Build and retain talent |
| • | Enhance management discipline |
| • | Key takeaways |
2007 JPMORGAN CHASE INVESTOR DAY
| 21 |
Key takeaways
| • | Upside from growth initiatives |
| • | Strong organic revenue growth across businesses |
| • | Expense control while investing for growth |
| • | Disciplined approach to credit and risk |
| • | Attract and retain world-class talent |
2007 JPMORGAN CHASE INVESTOR DAY
| 22 |
MARCH 6, 2007
ASSET MANAGEMENT
Jes Staley, CEO
2006 Performance
Financial results ($mm)
| 2006 | 2005 | % O/(U) | |||||||||
Net Revenue | $ | 6,787 | $ | 5,664 | 20 | % | |||||
PB | 1,907 | 1,689 | 13 | ||||||||
PCS | 1,023 | 1,036 | (1 | ) | |||||||
Institutional | 1,972 | 1,395 | 41 | ||||||||
Retail | 1,885 | 1,544 | 22 | ||||||||
Credit Costs | (28 | ) | (56 | ) | (50 | ) | |||||
Noninterest Expense | 4,578 | 3,860 | 19 | ||||||||
Net Income | $ | 1,409 | $ | 1,216 | 16 | % | |||||
Key Statistics ($B) | |||||||||||
Pretax Margin | 33 | % | 33 | % | |||||||
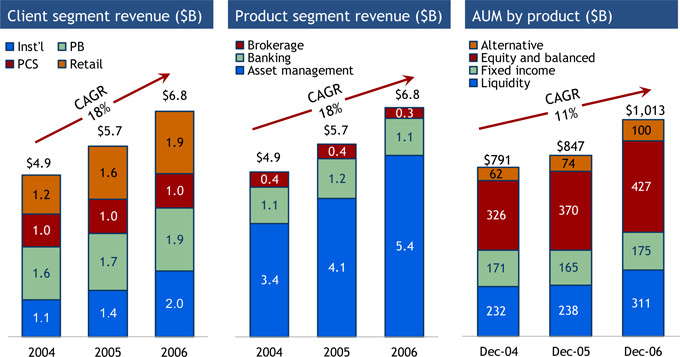
Assets under Management | $ | 1,013 | $ | 847 | 20 | % | |||||
2006 Highlights
| • | Record performance with 20% revenue growth and 20% pre-tax earnings growth |
| • | Continued strong investment performance |
| • | Assets under management reached $1 trillion with a total of $1.3 trillion in assets under supervision |
| • | Record level of net assets under management inflows of $89 billion |
| • | Grew alternative assets under management, including hedge funds, real estate, private equity and currency, by 35% to $100 billion |
2007 JPMORGAN CHASE INVESTOR DAY
| 2 |
Revenue growth and product profile
2007 JPMORGAN CHASE INVESTOR DAY
| 3 |
Update on progress in 2006
| • | Investment performance |
| • | 83% of mutual fund AUM ranked in 1st or 2nd quartile over 1 year, 79% over 5 years |
| • | Portfolio manager turnover under 10% through 2006 |
| • | Growth |
| • | AUM flows of $89B; strong flows into alternatives and retail mutual funds |
| • | Launched over 60 new funds globally, including SmartRetirement, Highbridge Statistical Market Neutral and India Real Estate |
| • | Private Bank client advisor growth of 11% |
| • | Reached $100 billion in 401(k) assets and successfully piloted retail rollover program; slower than expected growth in number of 401(k) participants |
| • | Management discipline and efficiency |
| • | Completed two phases of Trust platform convergence in U.S. |
| • | Implemented Global Transfer Agency platform in Luxembourg in 3Q06 |
2007 JPMORGAN CHASE INVESTOR DAY
| 4 |
Competitive positioning
Bubble Size = 2006 pretax income
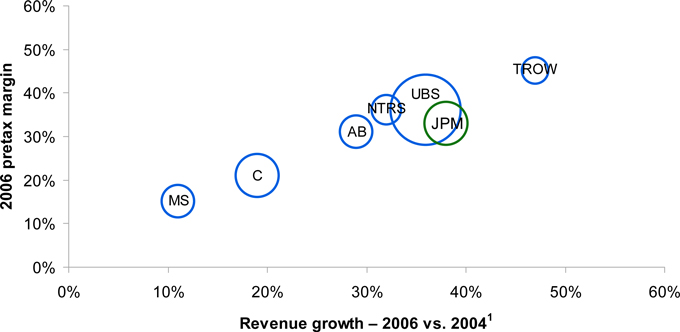
1 | Absolute revenue growth |
Key: AB - AllianceBernstein; C - Citigroup Private Bank and Smith Barney; MS - Morgan Stanley Investment Management and Individual Investor Group; NTRS - Northern Trust; UBS - UBS Asset Management, Wealth Management and Wealth Management USA; TROW - T. Rowe Price
Adjustments:
1. AB 2005 and 2006 results adjusted by $19.5mm and $16.4mm respectively, for gains on sale of Cash Management Services business
2. Citi results exclude Japan business; 2005 earnings exclude $122mm relating to the Japan business
3. MS 2005 results exclude a reduction of $241mm from the allocation of an insurance settlement related to the events of September 11th and a $29mm charge for a lease adjustment
2007 JPMORGAN CHASE INVESTOR DAY
| 5 |
Performance targets
Performance targets
| • | Pretax margin of 35% while investing for growth |
| • | Achieve in 2007 |
| • | LOB goal of 20% earnings growth through the cycle |
Strategic goals
| • | Sustain superior investment performance |
| • | Continue to expand third-party distribution |
| • | Stay in front of shift to alternative assets and absolute return investing |
| • | Grow 401(k) and IRA rollover retail channels |
| • | Extend PB and PCS footprint, gain efficiencies and expand PCS investment offering |
2007 JPMORGAN CHASE INVESTOR DAY
| 6 |
Investment performance
| • | Maintain investment performance above targets |
| • | 65% of mutual fund AUM in 1st and 2nd quartiles over 1, 3 and 5 years |
| • | 60% of selected AUM beating benchmarks over 1, 3 and 5 years |
| • | 55% of mutual fund AUM rated 4 or 5 stars |
| • | Portfolio manager retention |
| • | Maintain portfolio manager turnover rate below 10% |
2007 JPMORGAN CHASE INVESTOR DAY
| 7 |
Third-party distribution
| • | Third-party inflows were 11% in the U.S. and 24% internationally in 2006; expect faster growth in U.S. in 2007 |
| • | U.S.: grew number of mutual fund advisor relationships by 30%, won preferred placement within 24 distributor programs across multiple channels in 2006; focus on further growth in 2007 |
| • | Europe: Ranked 2nd in net sales of long term funds, with 2006 net sales of $19.7B; targeting a shift towards intermediated channels in 2007 |
| • | Asia: in 2007 plan to launch 2-3 new funds in China; obtain license and build out sales force in India; obtain license, develop funds and establish distribution capabilities in Korea |
2007 JPMORGAN CHASE INVESTOR DAY
| 8 |
Alternative assets/absolute return investing
| • | Alternatives have been growing at a CAGR of 28% since 2003, with flows of $14B in 2006; targeting double-digit growth in 2007 |
| • | Continued to experience strong flows into Highbridge funds ($6B during 2006) with 97% growth in assets under management in the year |
| • | Raised over $350mm for India Real Estate Fund in 2006; building out Real Estate Infrastructure, China and Renaissance funds in 2007 |
2007 JPMORGAN CHASE INVESTOR DAY
| 9 |
401(k) and IRA rollover
| • | Grew participants by 5% in 2006 to 1.4 million; targeting double-digit participant growth in 2007 |
| • | AUM growth of 29% in 2006; targeting similar growth in 2007 |
| • | Complete integration of CCA Strategies, an employee benefits and compensation consulting firm that will extend our retirement services capabilities |
| • | Strengthen connection to RFS and PCS to increase client rollover opportunities |
2007 JPMORGAN CHASE INVESTOR DAY
| 10 |
PB and PCS
| • | Grew PB and PCS AUM by 10% in 2006; targeting double-digit growth in 2007 |
| • | Grow number of client advisors in PB and PCS by 5 - 10% |
| • | Continue to extend PB investments practice to PCS |
| • | Expand PCS geographic footprint – established new offices in Atlanta, St. Louis and Princeton in 2006 |
| • | Generate asset and revenue growth in the Trust business |
2007 JPMORGAN CHASE INVESTOR DAY
| 11 |
Conclusion
| • | Continue to deliver strong investment performance |
| • | Leverage product offerings across more internal and external distribution channels |
| • | Market conditions will impact performance |
| • | 2007 Outlook |
| • | Revenue up from 2006 benefiting from net asset inflows and continued growth in deposits and loans |
| • | Expense up from 2006 reflecting continued investments and business growth |
| • | Credit costs trend to more normal levels |
2007 JPMORGAN CHASE INVESTOR DAY
| 12 |
MARCH 6, 2007
CARD SERVICES
Rich Srednicki, CEO
Agenda
| • | 2006 Performance |
| • | Business model |
| • | New account acquisitions |
| • | Existing customers |
| • | Performance target and 2007 outlook |
| • | Business strategy |
2007 JPMORGAN CHASE INVESTOR DAY
| 2 |

2007 JPMORGAN CHASE INVESTOR DAY
| 3 |
Agenda
| • | 2006 Performance |
| • | Business model |
| • | New account acquisitions |
| • | Existing customers |
| • | Performance target and 2007 outlook |
| • | Business strategy |
2007 JPMORGAN CHASE INVESTOR DAY
| 4 |
2006 Results
Financial results1($mm)
| 2006 | 2005 | % change | |||||||||
Net Revenue | $ | 14,745 | $ | 14,931 | (1 | )% | |||||
Credit Costs | 4,598 | 7,346 | (37 | ) | |||||||
Noninterest Expense | 5,086 | 4,610 | 10 | ||||||||
Net Income | $ | 3,206 | $ | 1,907 | 68 | % | |||||
Key Statistics ($B) | |||||||||||
ROE | 23 | % | 16 | % | |||||||
Allocated Capital | $ | 14.1 | $ | 11.8 | |||||||
ROO (pretax) | 3.59 | % | 2.18 | % | |||||||
Managed Margin | 8.36 | % | 8.64 | % | |||||||
Net Charge-off Rate | 3.33 | % | 5.21 | % | |||||||
30-Day Delinquency Rate | 3.13 | % | 2.79 | % | |||||||
Avg. Outstandings | $ | 141 | $ | 136 | 3 | % | |||||
EOP Outstandings | $ | 153 | $ | 142 | 7 | % | |||||
Charge Volume | $ | 340 | $ | 302 | 12 | % | |||||
Net Accts Opened (mm)2 | 46 | 21 | |||||||||
1 | 2005 results have been adjusted to reflect the deconsolidation of Paymentech |
2 | Includes approximately 30mm accounts in 2006 and approximately 10mm accounts in 2005 related to acquisitions |
2006 Highlights
| • | Significant progress made in 2006 |
| • | Record earnings |
| • | Record net income of $3.2B up 68% YoY |
| • | Historically low credit costs (down 37% YoY) due to significantly lower bankruptcy filings and lower delinquencies |
| • | ROO (Pretax) of 3.59% |
| • | ROE of 23% |
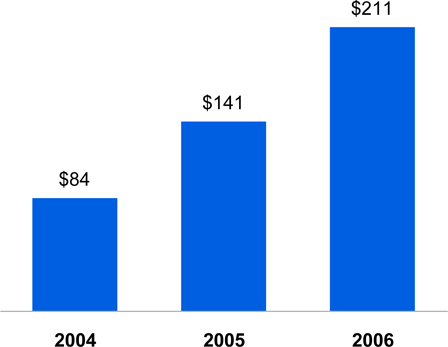
| • | Record organic new accounts of 15.9mm vs. 11.4mm in 2005 |
| • | Charge volume increase of 12% YoY |
| • | Strong outstandings growth of 7% YoY |
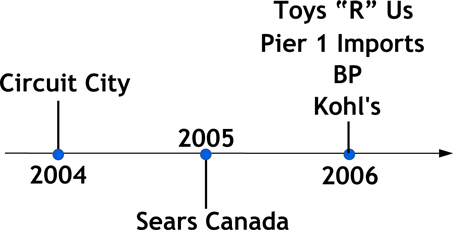
| • | Continued to build private label portfolio with the addition of Kohl’s, BP, Pier 1 Imports and Toys “R” Us; strong performance at Sears Canada and Circuit City |
| • | Continued marketing investment |
| • | New advertising |
| • | New products |
| • | Incremental acquisitions |
2007 JPMORGAN CHASE INVESTOR DAY
| 5 |
What we said last year at Investor Day
| • | Continue to grow high ROE and high ROO businesses |
| • | Continue to improve new account acquisition profitability |
| • | Continued investment in growth initiatives |
| • | Retail branch cross-sell |
| • | Service-to-sales/card activation program |
| • | Judgmental lending |
| • | Build brand awareness through advertising and innovation |
| • | Business card expansion |
| • | Continued focus on expense effectiveness |
| • | Complete merchant business integration and improve sales/profits |
| • | Strategic acquisitions/partnerships |
| • | Circuit City (2004), Sears Canada (2005), BP private label (2006) |
2007 JPMORGAN CHASE INVESTOR DAY
| 6 |
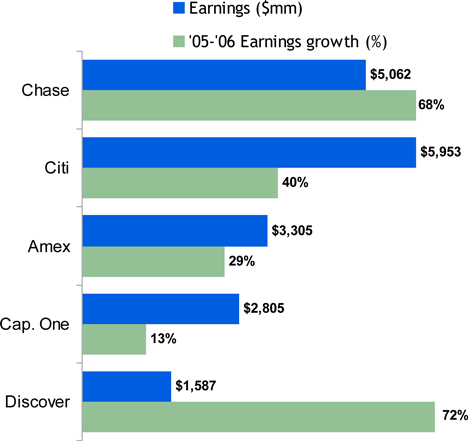
Improvement in returns and earnings growth
| • | Compounded annual growth rate (CAGR) from 2003 to 2006 is the most improved among peers, but ROO is still below top competitors |
2006 Pretax earnings and growth
2003 - 2006 Pretax earnings CAGR & 2006 ROO
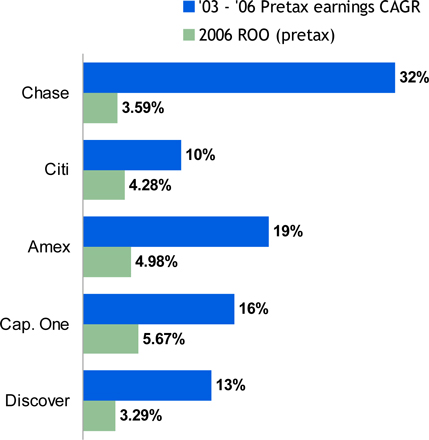
Source: Company Reports; SEC filings
Notes: Citi U.S. Card segment; includes Canada and Puerto Rico but excludes Mexico Capital One U.S. Card segment; excludes international credit card and small business Discover data includes international loans
American Express U.S. Card Services segment; includes U.S. consumer & small business lending and charge card portfolios, pre-paid and travelers cheques and travel services division Bank of America Card Services segment data is not comparable
2007 JPMORGAN CHASE INVESTOR DAY
| 7 |
Market share
| • | We continue to grow share of outstandings and sales and run the business as a growth business |
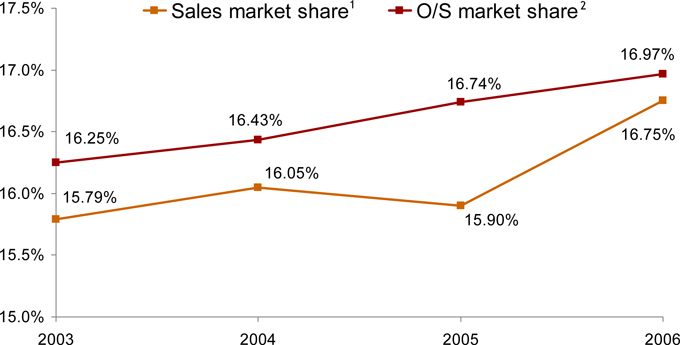
1 | Sources: Visa & MasterCard industry data; Amex and Discover company reports |
2 | Source: Federal Reserve, U.S. revolving credit data |
2007 JPMORGAN CHASE INVESTOR DAY
| 8 |
Credit quality
Net credit loss rate
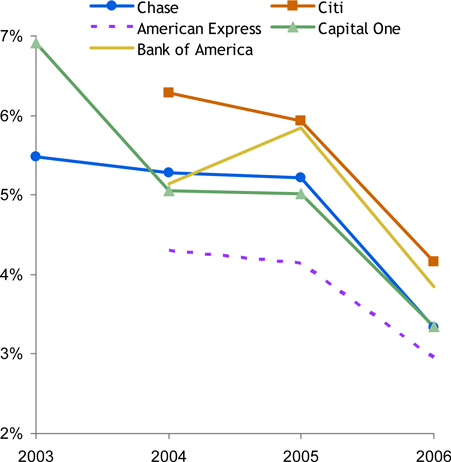
Delinquencies
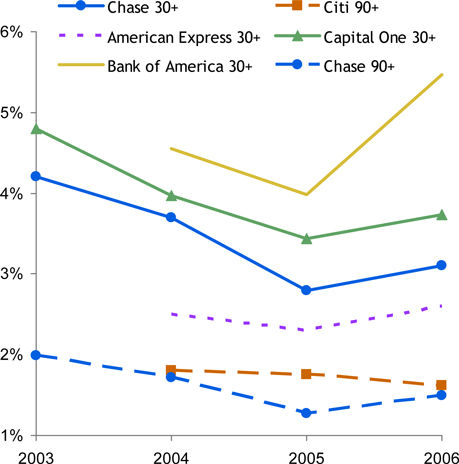
Source: Earnings Releases; SEC filings
Notes: Bank of America U.S. Consumer and Small Business segment
Citi U.S. Card segment; includes Canada and Puerto Rico but excludes Mexico Capital One U.S. Card segment; excludes international credit card and small business Discover data includes international loans
American Express U.S. consumer & small business lending portfolios
2007 JPMORGAN CHASE INVESTOR DAY
| 9 |
Payment rates
| • | Industry payment rates increased during 2006 due to economic full employment, implementation of higher minimum payments and higher mix of rewards customers |
| • | January 2007 reflects normal seasonality |
Master trust data1
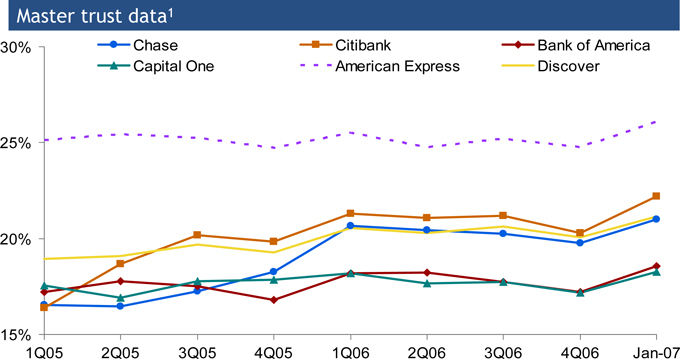
1 | Source: SEC filings |
2007 JPMORGAN CHASE INVESTOR DAY
| 10 |
Credit card cross-sell
No. of credit card accounts/branch/month1
Service to sales revenue ($mm)2
1 | Includes telephone banking |
2 | Revenue from product sales after satisfactory completion of an inbound customer service phone call |
2007 JPMORGAN CHASE INVESTOR DAY
| 11 |
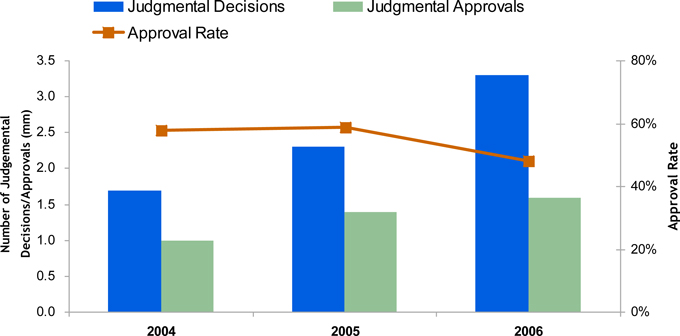
Judgmental lending
| • | We continue to increase our use of judgmental lending and automate our learnings as appropriate |
| • | The approval rate declined in 2006 as we automated the higher credit quality accounts |
2007 JPMORGAN CHASE INVESTOR DAY
| 12 |
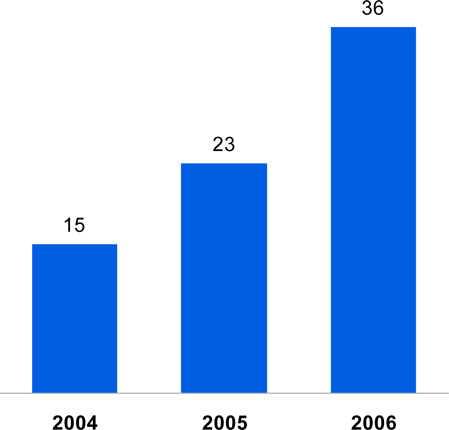
New account acquisitions
| • | Significant growth in organic new account acquisitions |
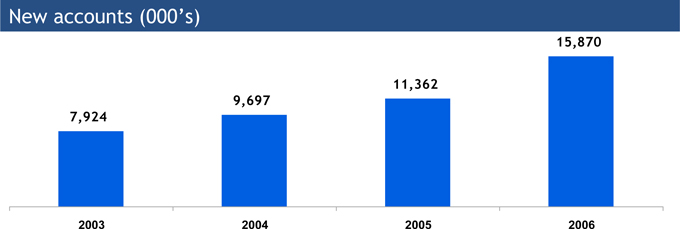
| • | Credit quality has been maintained despite growth in new account acquisitions, which helps reduce volatility of earnings |
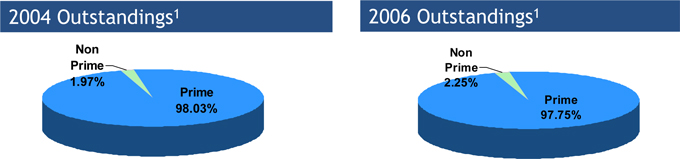
1 | Based on end of period outstandings; Prime and non prime designation at origination |
2007 JPMORGAN CHASE INVESTOR DAY
| 13 |
Rewards
| • | Cards with rewards increased from 32% of outstandings in 2003 to 53% in 2006 |
Rewards as a percentage of outstandings1
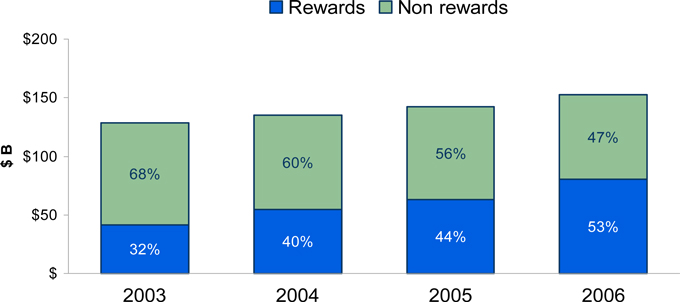
1 | Based on end of period outstandings |
2007 JPMORGAN CHASE INVESTOR DAY
| 14 |
Agenda
| • | 2006 Performance |
| • | Business model |
| • | New account acquisitions |
| • | Existing customers |
| • | Performance target and 2007 outlook |
| • | Business strategy |
2007 JPMORGAN CHASE INVESTOR DAY
| 15 |
How we run our business
| • | Long-term view |
| • | High return, annuity business |
| • | Target low double-digit earnings growth through the cycle |
| • | Believe industry will grow 5-6% through the cycle, plus our marketing investments and efficiencies |
| • | Given our scale and organic growth rate, low double-digit earnings growth is sustainable |
| • | Our investments are modeled to achieve this |
2007 JPMORGAN CHASE INVESTOR DAY
| 16 |
Marketing investments
Investments are two types
| • | New account acquisitions |
| • | For a given dollar investment, we seek to maximize “out-year” earnings (i.e. 3+ years) at minimum return hurdles (primarily return on outstandings and return on equity) |
| • | We constantly and rigorously review investment returns |
| • | Investments not constrained by net interest margin, revenue, outstandings or any single metric |
| • | Existing customers |
| • | Fee services, “spend and get” rewards, balance transfers and convenience checks |
| • | Investments essentially uncapped because most are “in-year” pretax income positive |
2007 JPMORGAN CHASE INVESTOR DAY
| 17 |
New account acquisition channel diversification
| • | Over the past few years we have moved away from a predominately direct mail source to multiple sources that utilize our partner and retail branch channels |
New accounts1
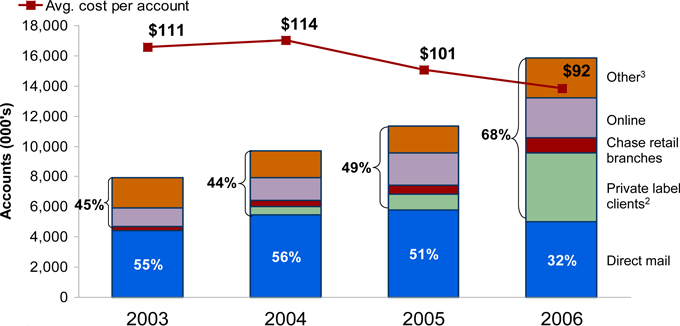
1 | Excludes portfolio acquisitions |
2 | Includes Sears Canada, Kohl’s, Circuit City, Pier 1 Imports, BP private label and Toys “R” Us private label portfolios |
3 | Includes telemarketing, take-ones, events and media |
2007 JPMORGAN CHASE INVESTOR DAY
| 18 |
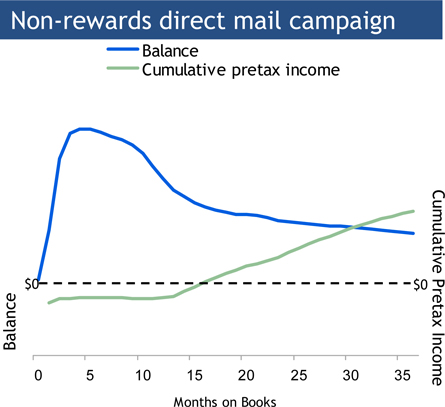
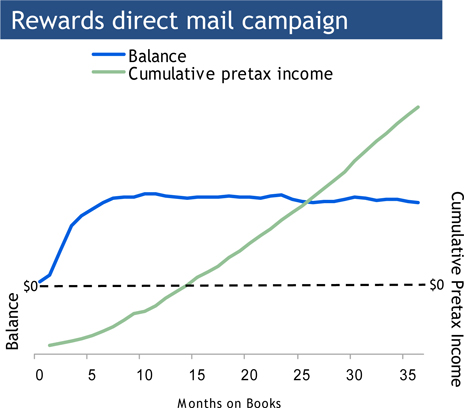
New account acquisitions – direct mail
| • | For both groups (non-rewards and rewards), our returns are exceeding our internal hurdles which focus on return on outstandings |
| • | Non-rewards accounts are cumulative pretax income negative until the introductory period expires and then produces stable earnings |
| • | Rewards accounts have higher customer engagement creating a more stable balance and a steeper slope in cumulative earnings |
2007 JPMORGAN CHASE INVESTOR DAY
| 19 |
New account acquisitions – rewards vs. non-rewards
| • | Higher spend volumes on our co-brand travel portfolio translate into higher balances |
| • | We allocate capital based on risk which results in lower capital allocation rate for our co-brand travel portfolio |
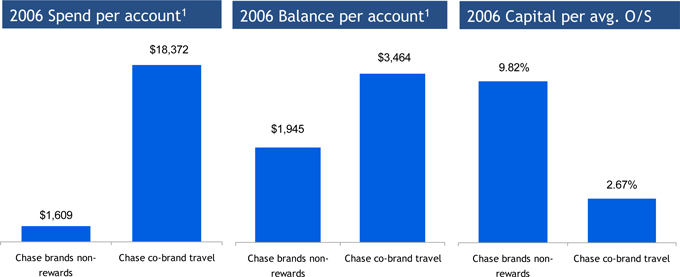
1 | Based on accounts on file |
2007 JPMORGAN CHASE INVESTOR DAY
| 20 |
Existing customers
| • | Types of marketing investments to existing customers |
| • | Balance transfers |
| • | Fee services |
| • | Spend-related activities to build loyalty and balances |
| • | Unlike new account acquisitions, these expenditures tend to either generate immediate returns or are done to reduce attrition |
| • | Maximize return on invested dollars |
| • | Investments must breakeven in less than 1 year |
| • | Returns from these programs are also reflected in our acquisition models |
2007 JPMORGAN CHASE INVESTOR DAY
| 21 |
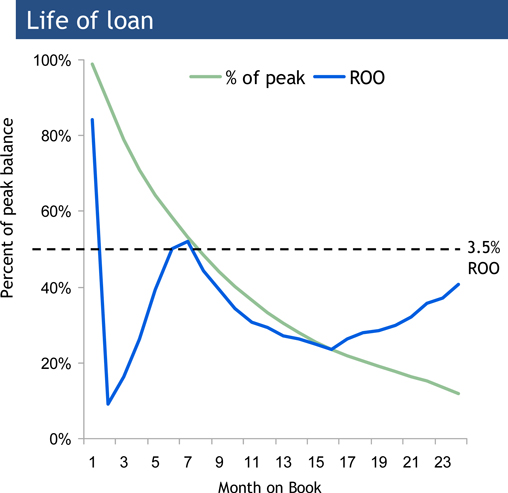
Existing customers
• Similar to our non-rewards acquisition curves, balance transfers tend to attrite fairly quickly and are closely tied to the term of the low rate offer |
• The majority of income is from fee income in the first month, and once the fee has been recognized the return on outstandings is under 3.5% |
• These programs have average internal rate of returns of 20+% and are offered to less than 20% of our customers |
2007 JPMORGAN CHASE INVESTOR DAY
| 22 |
Agenda
| • | 2006 Performance |
| • | Business model |
| • | New account acquisitions |
| • | Existing customers |
| • | Performance target and 2007 outlook |
| • | Business strategy |
2007 JPMORGAN CHASE INVESTOR DAY
| 23 |
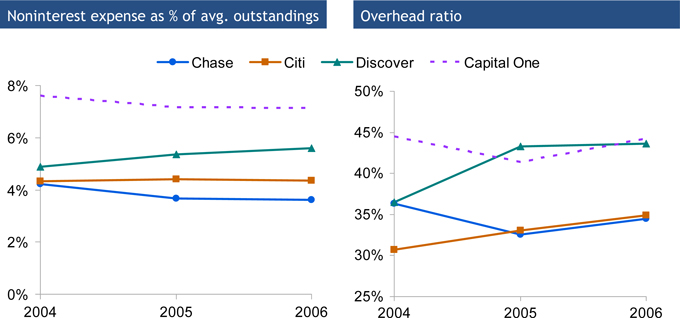
Pretax return on outstandings (ROO)
| • | Chase has closed some of the ROO gap but still lags competitors |
| • | The level and mix of marketing investment will have an impact on our ROO |
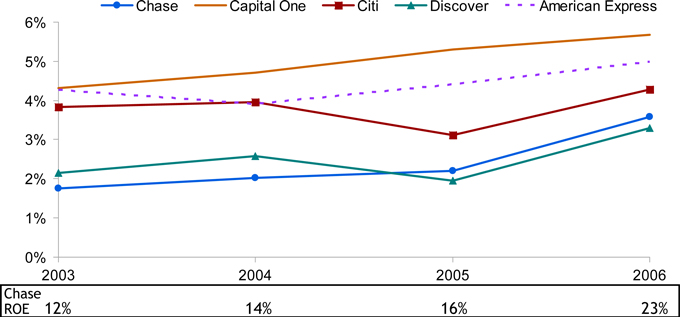
Source: Company Reports; SEC filings
Notes: Citi U.S. Card segment; includes Canada and Puerto Rico but excludes Mexico
Capital One U.S. Card segment; excludes international credit card and small business
Discover data includes international loans
American Express U.S. Card Services segment; includes U.S. consumer & small business lending and charge card portfolios, pre-paid and travelers cheques and travel services division Bank of America Card Services segment data is not comparable
2007 JPMORGAN CHASE INVESTOR DAY
| 24 |
Performance target and 2007 outlook
Performance target
| • | 23% - 25% ROE |
| • | Expect to maintain even as credit returns to through the cycle averages |
2007 Outlook
| • | Expect growth in outstandings and spend |
| • | Revenue expected to increase |
| • | Net interest income up |
| • | Noninterest revenue down due to higher partner payments and rewards expense |
| • | Credit costs gradually begin to trend up but remain below through-the-cycle average, which is now expected to be 4.75% - 5.00% |
| • | Decline in expense due to lower marketing spend |
2007 JPMORGAN CHASE INVESTOR DAY
| 25 |
Path to performance target
| • | As business matures, sufficient amounts of portfolio will be in year 3+ |
| • | Level and mix of our marketing investment impacts target |
| • | Level of spend for new account acquisitions |
| • | Based on competitive market and economic conditions, we adjust our level of marketing investment |
| • | Favorable market and economic conditions over the last several years have allowed us to increase our level of marketing investment vs our investment objectives |
| • | Level of spend for existing customers (Balance transfer programs) |
| • | Average internal rate of returns of 20+% |
| • | Generate fees, balances, engagement |
| • | Once fee is realized, low return on outstandings |
| • | Balances have short average life |
| • | Very low risk, very targeted (< 20% of customers) |
| • | Risks to long-term hurdles |
| • | Competitive landscape |
| • | Credit loss normalization |
| • | Legislative environment |
2007 JPMORGAN CHASE INVESTOR DAY
| 26 |
Agenda
| • | 2006 Performance |
| • | Business model |
| • | New account acquisitions |
| • | Existing customers |
| • | Performance target and 2007 outlook |
| • | Business strategy |
2007 JPMORGAN CHASE INVESTOR DAY
| 27 |
Selected areas of focus for 2007
| • | Grow Chase-branded business |
| • | Expand our position in key growth segments of the market e.g., business card |
| • | Continue to grow partner business – both co-brand and private label |
| • | Maintain disciplined and efficient operating environment |
2007 JPMORGAN CHASE INVESTOR DAY
| 28 |
Grow the Chase-branded business
 | • Increase brand awareness and relevance among key customer segments | |
 | • Increase share of wallet and build loyalty
• Right products (e.g., Freedom), new products slated for ‘07
• Best customer treatment
• Service-to-sales cross-sell and customer engagement | |
 | • Continue to partner with Retail Financial Services
• Branch cross-sell to engage customers
• Home equity cross-sell to Card customers | |
2007 JPMORGAN CHASE INVESTOR DAY
| 29 |
Grow Chase-branded business – Chase freedom launch
| • | Chase Freedom is a truly unique and differentiated rewards product that delivers 3 promises to the customer |
 | • The freedom to choose – between cash back or points
• The freedom to change – from cash back to points or points to cash back without losing any rewards
• The freedom to earn more – earn 3% in gas, grocery and quick service restaurant purchases and 1% on all other purchases |
Brand awareness – total unaided | Key program results | |
 | • Launched September 18
• More than 700,000 accounts
• #1 product sold through Chase retail branches
• Fully integrated marketing campaign
• Attracts younger customers
• Strong early spend and activation numbers | |
Source: Chase Credit Card Tracker – Millward Brown
2007 JPMORGAN CHASE INVESTOR DAY
| 30 |
Expand in key growth segments - Small Business
| • | Chase’s focus and investment in the Small Business sector is a key driver of growth |
| • | Only 4% of small business expenses on cards compared to 28% of consumer expenses |
| • | Key drivers of growth in Small Business |
| • | Focusing on customers – Building products designed to meet partner and customer needs |
| • | Leveraging JPMC – Working closely across LOBs to deliver the best of Chase |
| • | Investing – Dedicating capacity and investment dollars to focus on the targeted market |
| • | Targeting sectors – Developing and launching sector specific strategies (e.g., contractor card) and partner business cards |
Projected market growth in credit card spend1
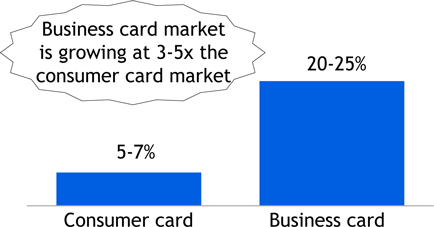
Chase Small Business card growth (2006 vs. 2005)
1 | Source: Internal estimates for growth over next 3-5 years |
2007 JPMORGAN CHASE INVESTOR DAY
| 31 |
Grow partnership business – co-brand business
| • Signed/renewed over 30 partnership deals in 2006 including:
| |
 | • Product expansion to ensure right products for right customers, e.g. Continental: Platinum, Business Card, Presidential Plus
• Broaden redemption capabilities to leverage partner relationships:
• United Alternative Redemption: Statement credits for purchases of tickets on United.com, hotel and car rentals
• BP: Redeem for gift cards, charitable donations or cash | |
 | • Increase customer touch points through channel expansion, e.g. Instant credit/POS, Internet placement
• Further leveraging partner’s distribution channels for all Chase products
• Expand partner relationships with other LOBs, e.g. Retail Bank, Student Lending, Treasury Services | |


2007 JPMORGAN CHASE INVESTOR DAY
| 32 |
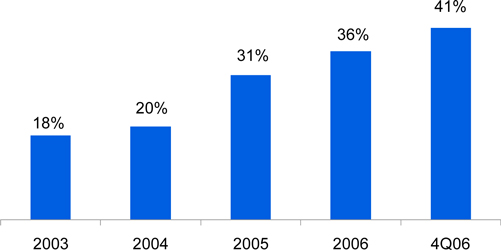
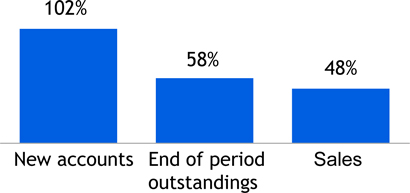
Grow partner business – private label clients
Acquisition timeline
New accounts ($000’s)
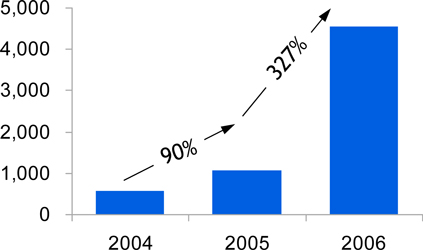
End of period outstandings ($mm)

Sales volume ($B)

2007 JPMORGAN CHASE INVESTOR DAY
| 33 |
Leverage key capabilities to increase sales and drive loyalty for our retail partners
| • | Positions in both private label and co-brand enables us to bring a strong and distinctive set of capabilities to our retail partners: |
| • | Instant credit and integrated product (co-brand and private label) underwriting |
| • | National field sales model to support in-store sales and promotions |
| • | Proprietary processing platform for scale and efficiency |
| • | Paymentech and Chase loyalty solutions |
2007 JPMORGAN CHASE INVESTOR DAY
| 34 |
Maintain disciplined and efficient operating environment
| • | Chase Card Services compares very favorably on expense efficiencies by creating a culture of operational excellence with highest service standards |
Source: Earnings Release and SEC filings
Notes: Citi U.S. Card segment includes U.S., Canada and Puerto Rico but excludes Mexico
Capital One data is for U.S. Card segment which excludes small business and international
Discover data includes international loans
Bank of America Card Services and Amex U.S. Card Services data is not comparable
2007 JPMORGAN CHASE INVESTOR DAY
| 35 |
Our objective is market leadership
| • | Objective is to maintain strong growth and high returns for the business |
| • | High quality customer franchise with strong presence in both the rewards and non-rewards segments of the market |
| • | Best co-brand and partnership portfolio providing: |
| • | A breadth of partners to meet a broad range of customer interests |
| • | Opportunities to leverage partner channels to attract highly engaged customers |
| • | Opportunity to create more synergy between the merchant acquiring and issuing businesses |
| • | A culture of operational excellence with highest service standards and low costs |
| • | Continuing to invest in building core capabilities and marketing to meet our long term growth goals |
2007 JPMORGAN CHASE INVESTOR DAY
| 36 |
MARCH 6, 2007
TREASURY & SECURITIES SERVICES
Heidi Miller, CEO
Agenda
| • | 2006 Recap |
| • | Goals and accomplishments |
| • | Financials |
| • | Peer comparables |
| • | 2007 Priorities |
| • | Financial targets |
| • | How we get there |
2007 JPMORGAN CHASE INVESTOR DAY
| 1 |
2006 Goals and accomplishments
| What we said | What we did | |
• Substantial progress in 2006 toward 35% pretax margin | • Increased margin by 400 bps | |
• Continue merger integration | • Substantially completed merger • Exceeded merger savings target | |
• Grow international share | • Increased non-U.S. revenue to 44% from 35% in 2004 and 40% in 2005 | |
• Attain best-in-class client service across all products – people and systems | • Multi-language capabilities • Online dashboard • Improved client satisfaction | |
• Increase distribution partnership across the firm | • Established global corporate bank • Re-aligned to increase focus on Middle Market and Business Banking | |
2007 JPMORGAN CHASE INVESTOR DAY
| 2 |
2006 Performance
Financial results ($mm)
| 2006 | 2005 | % O/(U) | |||||||||
Net Revenue | $ | 6,109 | $ | 5,539 | 10 | % | |||||
Treasury Services | 2,792 | 2,695 | 4 | ||||||||
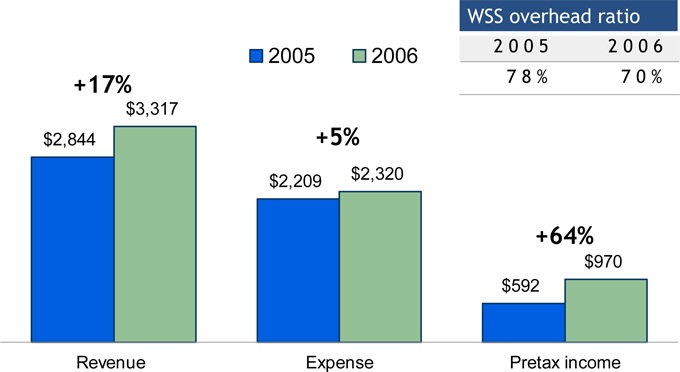
Worldwide Securities Svcs | 3,317 | 2,844 | 17 | ||||||||
Noninterest Expense | 4,266 | 4,050 | 5 | ||||||||
Net Income | $ | 1,090 | $ | 863 | 26 | % | |||||
Key Statistics ($B) | |||||||||||
ROE | 48 | % | 57 | % | |||||||
Equity | $ | 2.3 | $ | 1.5 | 50 | % | |||||
Pretax Margin | 28 | % | 24 | % | |||||||
Avg. Liability Balances | $ | 190 | $ | 155 | 22 | % | |||||
Assets under Custody ($T) | $ | 13.9 | $ | 10.7 | 30 | % | |||||
Headcount | 25,423 | 22,207 | 14 | % | |||||||
TSS Firmwide Revenue | $ | 8.6 | $ | 7.8 | 10 | % | |||||
TSS Firmwide Pretax Margin | 38 | % | 35 | % | |||||||
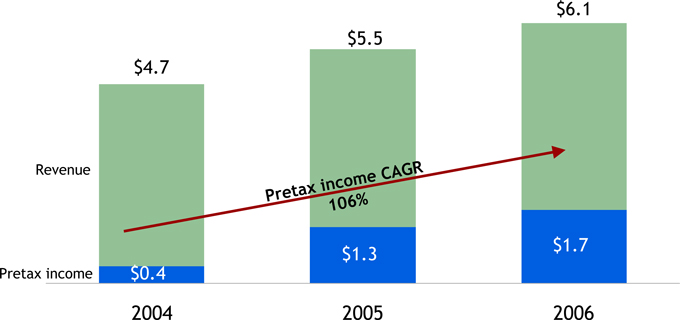
2006 Highlights
| • | Double-digit revenue and net income growth |
| • | Positive operating leverage, after investment |
| • | Diversifying internationally |
2007 JPMORGAN CHASE INVESTOR DAY
| 3 |
TSS - making steady progress
$ in billions
2007 JPMORGAN CHASE INVESTOR DAY
| 4 |
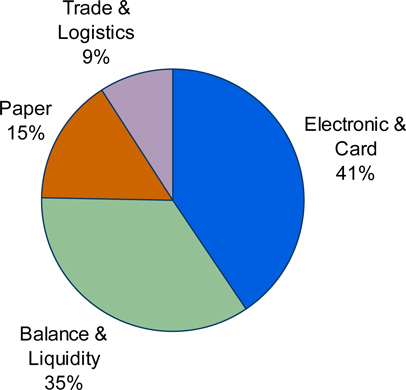
TSS – complete and diversified product set
2006 TS revenue contribution
2006 TS revenue - $2.8B
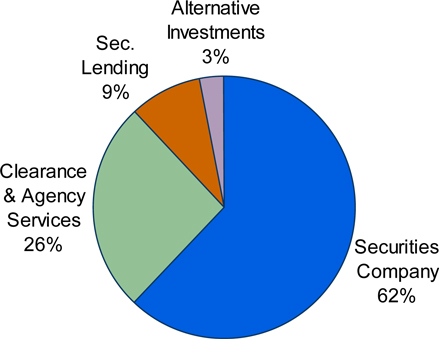
2006 WSS revenue contribution
2006 WSS revenue - $3.3B
2007 JPMORGAN CHASE INVESTOR DAY
| 5 |
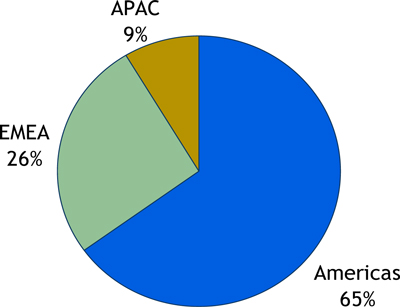
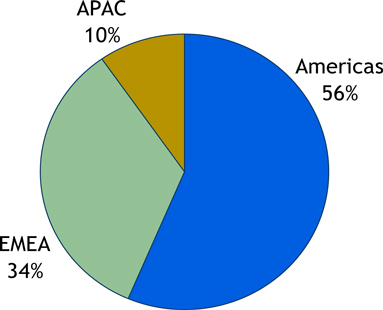
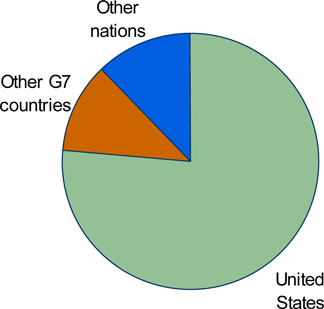
TSS – increasing international presence
2004 Revenue by region
Total revenue - $4.7B
Headcount
Americas | 15,080 | |
EMEA | 4,019 | |
APAC | 1,368 | |
Total | 20,467 | |
2006 Revenue by region
Total revenue - $6.1B
Headcount
Americas | 17,353 | |
EMEA | 5,227 | |
APAC | 2,843 | |
Total | 25,423 | |
2007 JPMORGAN CHASE INVESTOR DAY
| 6 |
TSS - peer comparables: a tale of two businesses
2006 Peer analysis
| Revenue | Pretax margin | EOP AUC | Avg liability bal.1 | ||||||||||||||||||||
| ($B) 2006 | vs. 2005 | 2006 | vs. 2005 | ($T) 2006 | vs. 2005 | ($B) 2006 | vs. 2005 | ||||||||||||||||
JPM (TSS Firmwide)2 | $ | 8.6 | 10 | % | 38 | % | 300 bps | $ | 13.9 | 30 | % | $ | 262.7 | 19 | % | ||||||||
C (Global Transaction Services) | 6.0 | 22 | 33 | 100 bps | 10.4 | 21 | 188.8 | 22 | |||||||||||||||
WB (Treasury & Int’l Trade Finance) | 1.0 | 7 | 34 | 400 bps | n/a | n/a | 17.2 | 14 | |||||||||||||||
BAC (Treasury Services) | 6.7 | 11 | 51 | 300 bps | n/a | n/a | 205.6 | 8 | |||||||||||||||
BK (Institutional Services) | 6.0 | 12 | 36 | 100 bps | 13.0 | 19 | 52.7 | 16 | |||||||||||||||
STT (Investment Servicing) | 5.1 | 13 | 27 | 100 bps | 11.9 | 17 | 63.9 | 10 | |||||||||||||||
MEL3 | 2.0 | 15 | 20 | (100) bps | 4.5 | 16 | 14.7 | 7 | |||||||||||||||
Peer Average | $ | 4.5 | 13 | % | 34 | % | 150 bps | $ | 10.0 | 18 | % | $ | 90.5 | 13 | % | ||||||||
1 | Liability balances include deposits and deposits swept to on-balance sheet liabilities |
2 | Firmwide figures include TS revenue ($2.5B) and associated allocated expenses recorded in Commercial Banking, Regional Banking and Asset Management businesses |
3 | Excludes asset management, private wealth management and other Sources: Company reports and SEC filings |
2007 JPMORGAN CHASE INVESTOR DAY
| 7 |
WSS – most improved and top of the class
2006 Peer analysis
| Revenue | Pretax mrgin | EOP AUC | Avg liability bal.1 | ||||||||||||||||||||
| ($B) 2006 | vs. 2005 | 2006 | vs. 2005 | ($ T) 2006 | vs. 2005 | ($B) 2006 | vs. 2005 | ||||||||||||||||
JPM WSS | $ | 3.3 | 17 | % | 29 | % | 800 bps | $ | 13.9 | 30 | % | $ | 100.7 | 24 | % | ||||||||
BK (Institutional Services) | 5.6 | 14 | 36 | 100 bps | 13.0 | 19 | n/a | n/a | |||||||||||||||
STT (Investment Servicing) | 5.1 | 13 | 27 | 100 bps | 11.9 | 17 | 63.9 | 10 | |||||||||||||||
MEL2 | 2.0 | 15 | 20 | (100)bps | 4.5 | 16 | 14.7 | 7 | |||||||||||||||
Peer Average | $ | 4.2 | 14 | % | 28 | % | 33 bps | $ | 9.8 | 17 | % | $ | 39.3 | 9 | % | ||||||||
1 | Liability balances include deposits and deposits swept to on-balance sheet liabilities |
2 | Excludes asset management, private wealth management and other |
| Sources: | Company reports and SEC filings |
2007 JPMORGAN CHASE INVESTOR DAY
| 8 |
WSS — solid growth with positive operating leverage
Financial results ($mm)
2007 JPMORGAN CHASE INVESTOR DAY
| 9 |
WSS – winning in the marketplace
| Outsourcing | ||||||
• Threadneedle Asset Management • Old Mutual Asset Management • Henderson Global Investors • Hicks Muse | Europe South Africa Europe U.S. |  | $200+ B AUA1 | |||
| Global Custody/ Fund Accounting/ Securities Lending | ||||||
• Nordea Asset Management • TX Employee Retirement System • Superannuation Trust of Australia • Freddie Mac • MFS Investment Management • ATT/SBC (pension fund) | Europe U.S. Australia U.S. U.S. U.S. |  | $800+ B AUC | |||
| ADR | ||||||
• Petrobras • Rosneft • United Utilities | Brazil Russia U.K. |  | $200+ B Market Cap | |||
1 | Assets under administration |
2007 JPMORGAN CHASE INVESTOR DAY
| 10 |
WSS – recognized leader in the industry
Worldwide Securities Services awards and rankings
• | #1 by assets under custody ($13.9T)1 |
| • | European Custodian of the Year - ICFA European Custody and Fund Administration Awards, February 2007 |
| • | Top Rated in EMEA, N. America and Overall - Global Custodian Tri-Party Survey, March 2006 |
| • | Best FX Service Overall - Global Investor FX Client Survey, March 2006 |
| • | #1 Overall Cash Provider, #1 for Rates/Price Competitiveness, #1 in Ability to deal in Size, #1 in Reporting Capabilities - ISF (International Securities Finance) Annual Repo/Securities Lending Survey, June 2006 |
| • | #1 in “Clash of the Titans” - R & M Global Custody Survey, 2007 |
| • | Best Investor Services – Waters Magazine, July 2006 |
| • | Best Custody Specialist –The Asset’sannual Triple A Transaction Banking Awards, 2007 |
| • | Custodian of the Year - Funds Europe, November 2006 |
| • | Securities Services Provider of the Year - The Banker, November 2006 |
| • | #2 ADR bank in market cap under management - SEC 13-F filings, Jan 2006 |
1 | As of 12/31/06 |
2007 JPMORGAN CHASE INVESTOR DAY
| 11 |
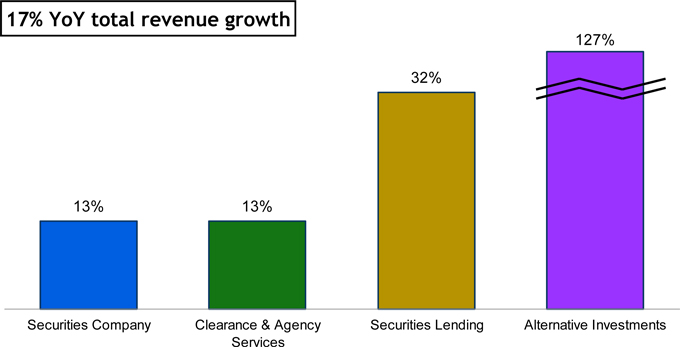
WSS — double digit growth in all products
2005-2006 WSS product revenue growth
2007 JPMORGAN CHASE INVESTOR DAY
| 12 |
WSS - #1 through organic growth
AUC growth by region 2002-20061($T)
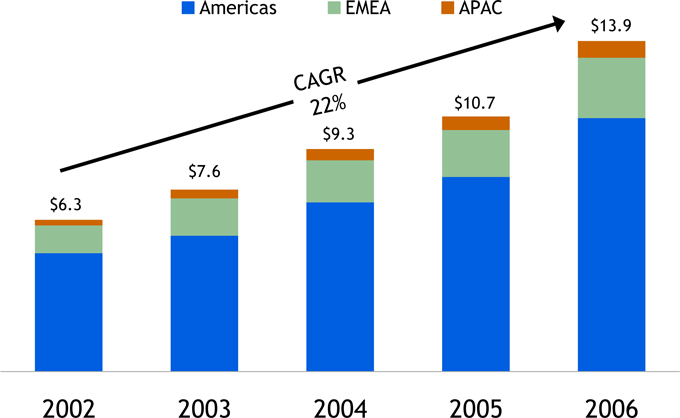
1 | 2002 data presented on a combined basis for JPM and Bank One. 2003 - 2004 data presented on a proforma basis. |
2007 JPMORGAN CHASE INVESTOR DAY
| 13 |
WSS – AUC mix drives revenue
2006 Assets by location
$13.9T
Implications:
| • | Rate card differentials |
| • | FX flows |
2006 AUC by asset type
$13.9T
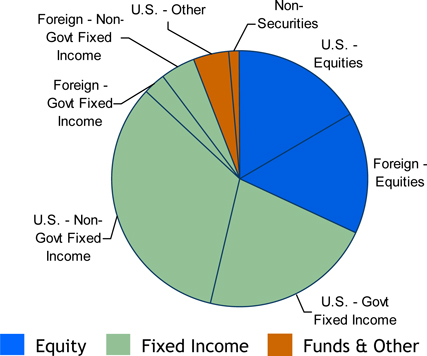
Implications:
| • | Securities Lending opportunities |
| • | Size of lendable base |
2007 JPMORGAN CHASE INVESTOR DAY
| 14 |
WSS - more than a custodian
Number of NAVs by region 2004-2006 (mm)
Fund Services rankings
| • | #1 provider for non-U.S. domiciled funds |
| • | #2 provider globally |
| • | #3 provider for U.S. mutual funds |
Source: 2006 Mutual Fund Service Guide
2007 JPMORGAN CHASE INVESTOR DAY
| 15 |
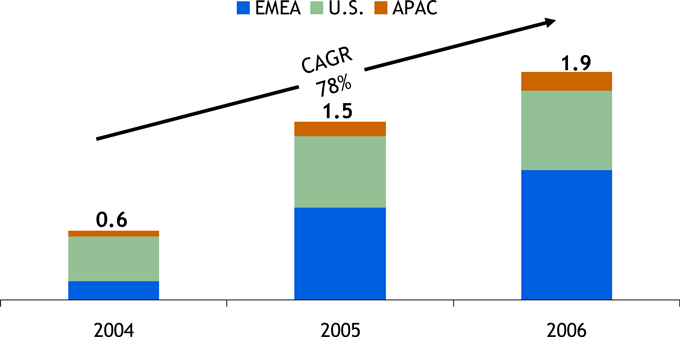
WSS - investments are starting to pay off
2003-2006 WSS hedge fund services, AUA1($B)

1 | Assets under administration |
2007 JPMORGAN CHASE INVESTOR DAY
| 16 |
WSS - all deals not created equal
| • | Traditional custody deals |
| • | Highly scalable |
| • | No on-boarding of client’s employees |
| • | Quick take-on (30-60 day ramp-up) |
| • | Fund Administration / Accounting deals |
| • | Requires more integration with client infrastructure |
| • | Not as scalable as custody |
| • | 90-120 days to transition accounts |
| • | Outsourcing deals |
| • | Typically large and complex transactions |
| • | Deals done as “lift-outs” due to size and complexity |
| • | Requires 6-8 months of technology build for initial integration and migration |
| • | Usually requires on-boarding of client’s employees |
| • | 12-18 month ramp-up for complete integration and cost consolidation |
2007 JPMORGAN CHASE INVESTOR DAY
| 17 |
TS - good margins, single-digit revenue growth
2006 Peer analysis
| Revenue | Pretax margin | Avg liability bal.1 | |||||||||||||||
| ($B) 2006 | vs. 2005 | 2006 | vs. 2005 | ($B) 2006 | vs. 2005 | ||||||||||||
JPM (TS Firmwide)2 | $ | 5.2 | 6 | % | 44 | % | 200 bps | $ | 162.0 | 16 | % | ||||||
C (Global Transaction Services)3 | 4.1 | 19 | 33 | 100 bps | 188.8 | 22 | |||||||||||
BAC (Treasury Services) | 6.7 | 11 | 51 | 300 bps | 205.6 | 8 | |||||||||||
WB (Treasury & Int’l Trade Finance) | 1.0 | 7 | 34 | 400 bps | 17.2 | 14 | |||||||||||
Peer Average | $ | 3.9 | 13 | % | 39 | % | 267 bps | $ | 137.2 | 15 | % | ||||||
1 | Liability balances include deposits and deposits swept to on-balance sheet liabilities |
2 | Firmwide figures include TS revenue ($2.5B) and associated expenses recorded in Commercial Banking, Regional Banking and Asset Management line-of-businesses |
3 | Includes WSS equivalent liability balances |
| Sources: | Company reports and SEC filings |
2007 JPMORGAN CHASE INVESTOR DAY
| 18 |
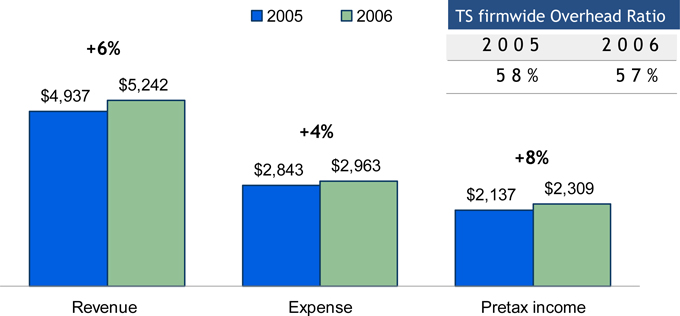
TS — continued margin improvement
TS firmwide financial results ($mm)
2007 JPMORGAN CHASE INVESTOR DAY
| 19 |
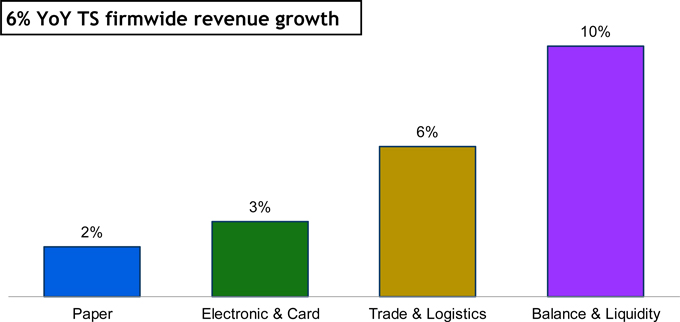
TS — solid growth led by liquidity and trade
2005-2006 TS firmwide product revenue growth
2007 JPMORGAN CHASE INVESTOR DAY
| 20 |
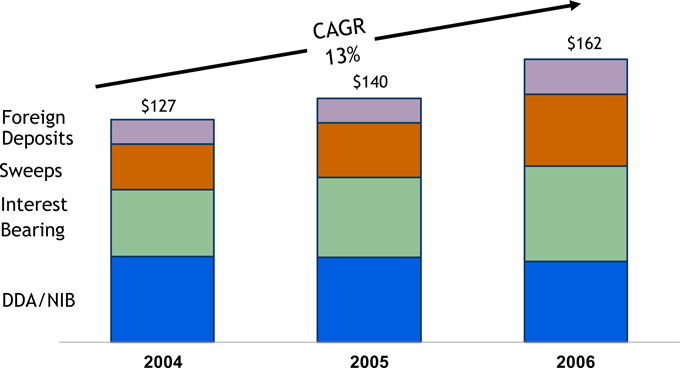
TS – high growth with changing mix
2004-2006 TS firmwide balance growth ($B)
2007 JPMORGAN CHASE INVESTOR DAY
| 21 |
TS – market leader
Electronic and Card | RANK | |
• ACH | ||
• Debit originations | #1 | |
• Credit originations | #1 | |
• USD | ||
• Fedwire | #1 | |
• CHIPS | #1 | |
• Book | #1 | |
• Cards | ||
• Purchasing Card (Transaction $) | #1 | |
• Payroll Cards | #1 | |
Paper | ||
• Check Clearing (Total Volume) | #2 | |
• Controlled Disbursement (Checks Paid) | #2 | |
• Retail Lockbox (Remittances) | #2 | |
• Wholesale Lockbox (Remittances) | #2 | |
Liquidity | ||
• Sweep Accounts (Avg Daily Balances) | #1 | |
Source: 2006 Ernst & Young Cash Management Services Study – Product Ranking Report
| • | #1 in electronic products –fastest growing segment |
| • | #1 in USD Treasury clearing & commercial payments globally (‘03-’05) |
Source: FI Metrix
2007 JPMORGAN CHASE INVESTOR DAY
| 22 |
TS – international franchise key to future growth
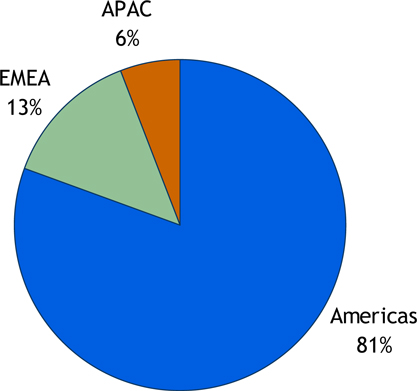
TS firmwide revenue by region - 2006
Total firmwide revenue - $5.2B
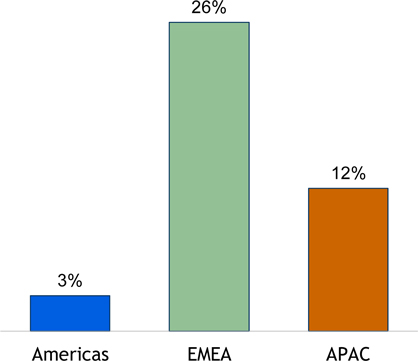
TS firmwide revenue growth by region – ‘06 vs ‘05
2007 JPMORGAN CHASE INVESTOR DAY
| 23 |
Treasury Services global capabilities and presence

2007 JPMORGAN CHASE INVESTOR DAY
| 24 |
TS – winning in the marketplace
Core Cash Management
• Duke Energy |  | • Lockbox, ACH, bill printing
• 22.8mm bills printed | ||
Electronic Payments
• NY Department of Labor Unemployment Insurance |
| • EFS, Debit Card, ACH
• 220,000 cards issued in first month
• 400,000 currently active | ||
Trade & Logistics
• Global Communications equipment |
| • Supply chain logistics
• Over $1B in goods processed manufacturer | ||
Pan-Asian Cash Management
• Multi-national Corporation |
| • Collections & disbursements, FX, Liquidity & investments, Global client Access
• Spans 13 Asian countries, 11 languages, 7 time zones, 14 currencies | ||


2007 JPMORGAN CHASE INVESTOR DAY
| 25 |
TS - market leadership
Awards
| • | Best overall bank for Cash Management in North America -Global Finance, 2006 |
| • | Best Cash Management Specialist -The Asset, 2006 |
| • | Best ECA Trade Solution Bank -The Asset, 2006 |
| • | Best Liquidity solution provider -The Asset, 2006 |
| • | Best Trade Services Provider -Trade and Forfaiting Review, 2006 |
| • | #1 overall service in Asia -Euromoney, 2006 |
| • | #1 Non-indigenous Euro Clearer –German RTGS system,2006 |
| • | #1 in Implementation of SEPA –Euromoney,2006 |
| • | JPMorgan Chase Vastera named One of “100 Great Supply Chain Partners” -Global Logistics and Supply Chain Strategies, 2006 |
| • | #1 ACH items originated –NACHA, 2006 |
| • | #1 CHIPS, FedWire & Book Transfers –Ernst & Young, 2006 |
| • | #1 Sweep Accounts, Average Daily Balances –Ernst & Young, 2006 |
2007 JPMORGAN CHASE INVESTOR DAY
| 26 |
TS – completing the merger; end in sight
| • | Much accomplished in 2006 |
| • | Exceeded merger save targets |
| • | Completed all scheduled milestones and systems conversion |
| • | Executed site and data center consolidations |
| • | Last major milestone 3Q07 |
| • | Tri-State wholesale DDA conversion |
2007 JPMORGAN CHASE INVESTOR DAY
| 27 |
TSS performance targets: growth and efficiency
Performance target
| • | 35% pretax margin |
| • | Strive to achieve by end of 2007 |
How we get there
| • | Invest in high-margin/ high-growth areas |
| • | International markets |
| • | Alternative Investment Services |
| • | Migration from paper to electronic payments |
| • | Client diversification and penetration |
| • | Global Corporate Banking |
| • | Chase Commercial Bank (Middle Market) & Business Banking |
| • | Improve efficiency, productivity and client experience |
2007 JPMORGAN CHASE INVESTOR DAY
| 28 |
Growing importance of international
Foreign direct investments (FDI) inflows (U.S. $B)

Forecast GDP in BRIC and G6
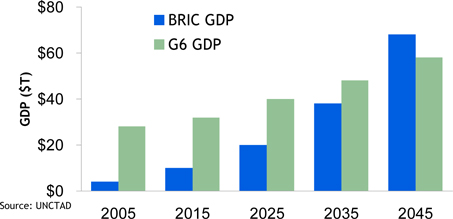

| • | Faster growth in most products |
| • | Higher margins |
| • | Growth of BRIC economies |
| • | Higher growth of trade and payments within regions |
| • | Increasing global market interaction |
2007 JPMORGAN CHASE INVESTOR DAY
| 29 |
International expansion – what we are doing
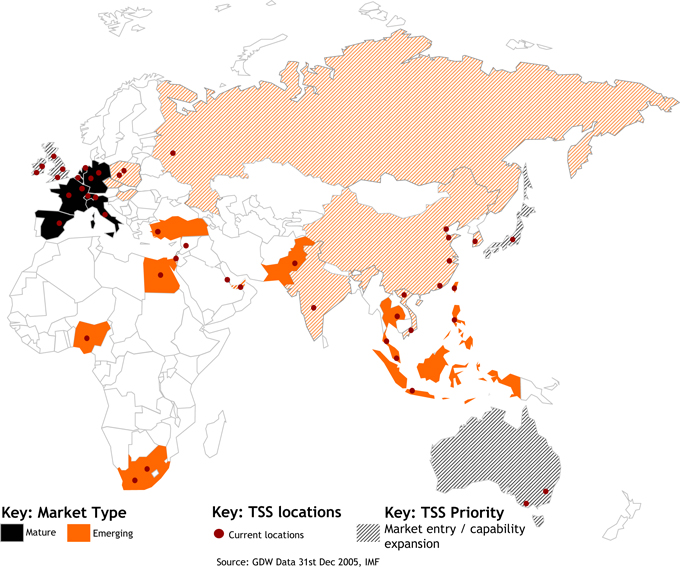
Mature Markets
| • | Additional sales & coverage |
| • | Footprint and operational efficiencies |
Emerging
| • | Wholesale branches |
| ��� | Local infrastructure |
| • | Local language capabilities |
| • | Sales & coverage |
| • | Trade windows |
2007 JPMORGAN CHASE INVESTOR DAY
| 30 |
Why invest in Alternative Investment Services?
Percentage of funds which expect to increase/decrease asset class allocations – next 3 years1
Funds %
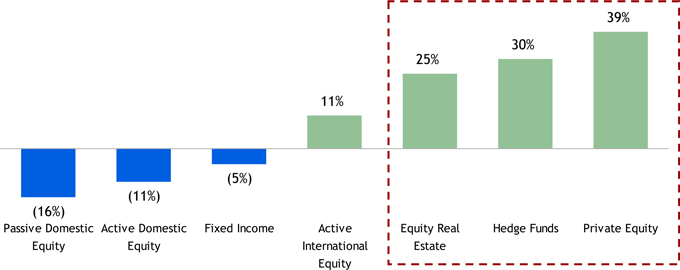
• | Hedge funds are fastest growing investor segment (23% CAGR)2 |
1 | Source: Greenwich Associates – IAM Market Dynamics Report. |
2 | Source: HFR database; CAGR for 2001 through 2008E |
2007 JPMORGAN CHASE INVESTOR DAY
| 31 |
Alternative investments – what we are doing
Migrating from a custodian to an asset servicer
| • | Integrate Transfer Agency in U.S. |
| • | Continue to enhance reporting for new products |
| • | Roll-out product Internationally |
| • | Developing best-in-class technology platforms |
| • | Leveraging firmwide expertise and relationship |
2007 JPMORGAN CHASE INVESTOR DAY
| 32 |
Paper to electronic - what we are doing

Product development and promotion:
| • | Check Deposits, e.g., Image Capture |
| • | Disbursements, e.g., Purchasing Card |
| • | Automated Clearing House (ACH), e.g., Accounts Receivable Conversion |
| • | Wholesale Lockbox, e.g., Receivables Edge |
2007 JPMORGAN CHASE INVESTOR DAY
| 33 |
Stellar client franchise – opportunities abound
2006 Client mix
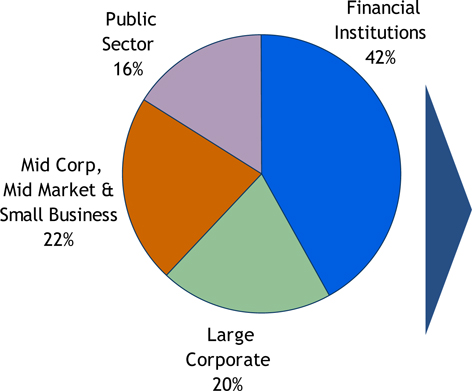
Key insights
| • | Financial Institutions remain core strength |
| • | Increase share of wallet with Large Corporates via Global Corporate Bank |
| • | Middle Market significant source of growth |
| • | Opportunities emerging with endowments / foundations and international public sector |
2007 JPMORGAN CHASE INVESTOR DAY
| 34 |
Global Corporate Banking – focused coverage
Global Corporate Banking model
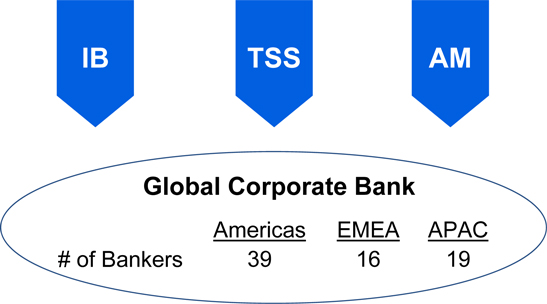
Key Segments
| Broker Dealer | FIG | Latin America | Consumer / Health / Retail | |||
| Industrials | Telecom / Media / Tech | Energy | Transportation / Paper & Bldg |
Key opportunities
| • | Leverage universal bank model |
| • | Increase share of wallet |
| • | Improve number of products per customer |
| • | Improve client experience |
2007 JPMORGAN CHASE INVESTOR DAY
| 35 |
Middle Market expansion
2004-2006 TS Middle Market growth ($B)
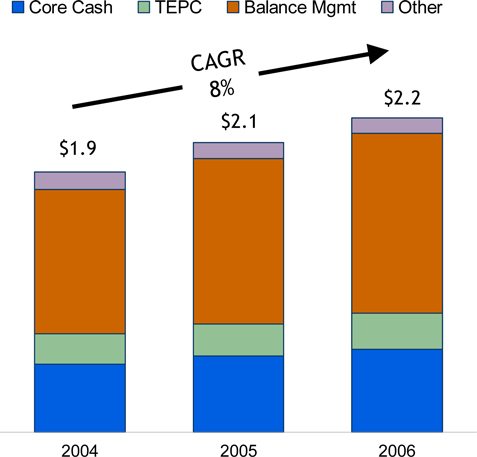
Note: TEPC indicates Trade, E-Payables and Commercial Cards
Growth initiatives
| • | Increase prospect conversion |
| • | Improve coverage model and productivity of CB Bankers and TS Sales |
| • | Market global capabilities |
| • | Tailor product to Middle Market client |
| • | Increase focus on Business Banking product and sales |
2007 JPMORGAN CHASE INVESTOR DAY
| 36 |
How we get there - efficiency & productivity
• Technology examples
• Improve vendor management
• Increase efficiency of production support
• Reduce contractor costs
• Consolidate data centers
• Reduce infrastructure costs
• Operations examples
• Re-engineer and improve processes
• Leverage operational utilities
• Improve straight-through processing rates
• Global sourcing in low cost locations |  |
1 | 2-3 year pretax income impact |
2007 JPMORGAN CHASE INVESTOR DAY
| 37 |
How we get there - efficiency & productivity
• Client Service examples
• Site consolidation
• Global sourcing in low-cost locations
• Re-engineering and process improvement
• Implement tools to automate manual processes
• Reduce on-boarding time |  |
1 | 2-3 year pretax income impact |
2007 JPMORGAN CHASE INVESTOR DAY
| 38 |
TSS – opportunities abound but…
| • | Absolute level of interest rates |
| • | Shape of the yield curve |
| • | Liability balance mix |
| • | Securities lending spreads |
| • | FX volatility |
| • | Equity markets levels |
| • | Competition and price compression |
| • | Productivity agenda |
…impact timing
2007 JPMORGAN CHASE INVESTOR DAY
| 39 |
In summary, we have to…
| • | Expand internationally |
| • | Execute on new coverage models |
| • | Global Corporate Bank |
| • | Cross-TSS customer segments |
| • | Increase penetration of key client segments and grow share of wallet |
| • | Aggressively manage pricing and expenses in commoditizing products |
| • | Focus on new product innovation and sales of higher margin products |
| • | Execute Bank of New York transition and Tri-State conversion |
2007 JPMORGAN CHASE INVESTOR DAY
| 40 |
MARCH 6, 2007
COMMERCIAL BANKING
Todd Maclin, CEO
Organizational structure
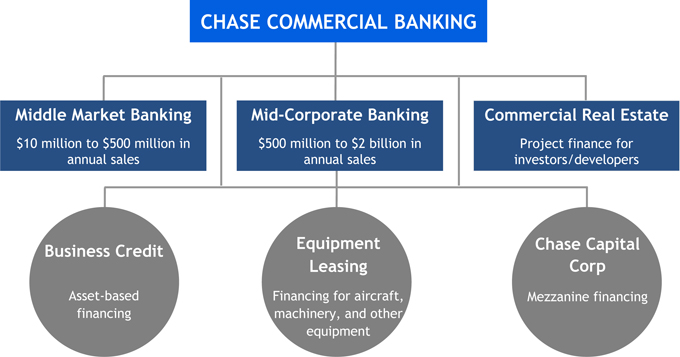
| • | Over 30,000 clients and 70,000 middle market prospects |
| • | Highly granular and diversified loan portfolio |
2007 JPMORGAN CHASE INVESTOR DAY
| 2 |
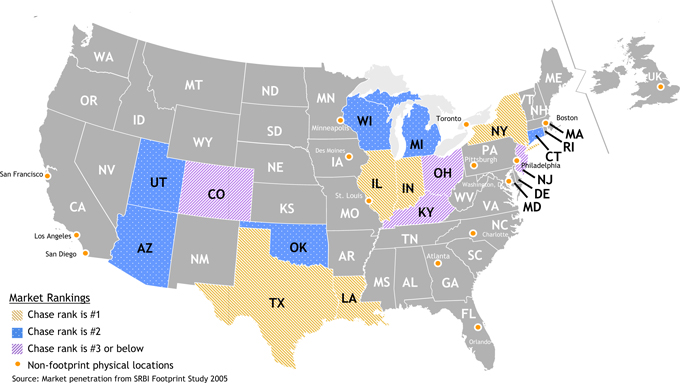
Commercial Banking footprint
| • | Presence in 14 of the 15 top MSAs |
| • | #1 in 5 states with average market penetration of 48% |
| • | 15 out-of-footprint offices (4 added during 2006) |
2007 JPMORGAN CHASE INVESTOR DAY
| 3 |
2006 Performance
Financial results ($mm)
| 2006 | 2005 | % O/(U) | |||||||||
Net Revenue | $ | 3,800 | $ | 3,488 | 9 | % | |||||
Middle Market | 2,535 | 2,358 | 8 | ||||||||
Mid-Corporate Banking | 656 | 551 | 19 | ||||||||
Real Estate | 458 | 434 | 6 | ||||||||
Other | 151 | 145 | 4 | ||||||||
Credit Costs | 160 | 73 | 119 | ||||||||
Noninterest Expense | 1,979 | 1,856 | 7 | ||||||||
Net Income | $ | 1,010 | $ | 951 | 6 | % | |||||
Key Statistics ($B) | |||||||||||
ROE1 | 18 | % | 28 | % | |||||||
Overhead Ratio | 52 | % | 53 | % | |||||||
Net Charge-off Rate | 0.05 | % | 0.05 | % | |||||||
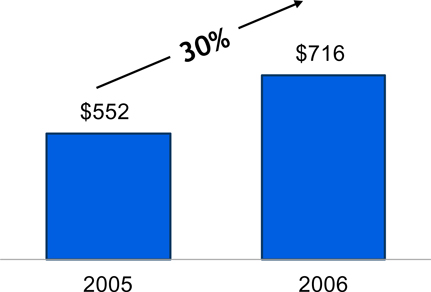
Gross IB Revenue | $ | 716 | $ | 552 | 30 | % | |||||
Avg. Loans & Leases | $ | 54 | $ | 48 | 11 | % | |||||
Avg. Liability Balances2 | $ | 74 | $ | 66 | 11 | % | |||||
1 | Reflects allocated capital of $3.4B in 2005 and $5.7B in 2006 |
2 | Includes deposits and deposits swept to on-balance sheet liabilities |
3 | Loan Pricing Corp 12/31/06; FY2006 results. |
2006 Highlights
| • | Record revenue of $3.8B |
| • | 65% of revenue is non-lending |
| • | Double-digit loan and liability balance growth |
| • | Record gross IB revenue of $716MM, up 30% YoY |
| • | Surpassed 50% overhead target - 4Q06 at 48% |
| • | 8 consecutive quarters of loan growth and NPL ratio below 1% |
• | #2 Large Middle Market Lender3 |
• | #2 Traditional Middle Market Lender3 |
• | #2 Asset-Based Lender3 |
2007 JPMORGAN CHASE INVESTOR DAY
| 4 |
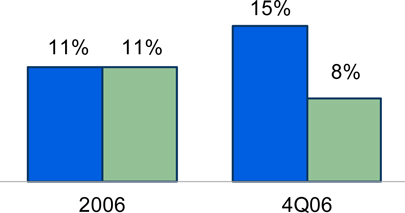
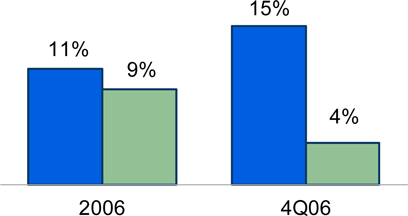
Strong competitive position
Revenue growth1
Noninterest revenue growth1
Operating leverage2
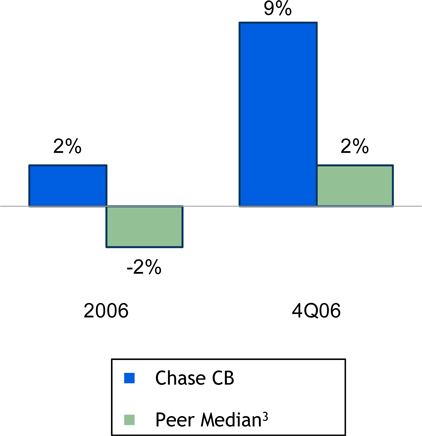
1 | All growth rates are YoY |
2 | Operating Leverage is defined as YoY growth rate in revenue less YoY growth rate in expenses |
3 | Peer median includes comparable commercial segments at BAC, C, CMA, FITB, NCC, PNC, STI, USB, WB, WFC, ZION; acquisitions impacted the YoY results for PNC, WB, WFC and ZION |
2007 JPMORGAN CHASE INVESTOR DAY
| 5 |
Strong competitive position in 2006
Loan growth1,2
Liability balance growth1,2
Loan/deposit ratio
Rank | Peer | 4Q06 Ratio | ||
1 | Chase CB | 0.7 | ||
2 | ZION | 0.9 | ||
3 | USB | 1.5 | ||
4 | PNC | 1.7 | ||
5 | C | 1.8 | ||
6 | WB | 2.0 | ||
7 | CMA | 2.3 | ||
8 | WFC | 2.3 | ||
9 | NCC | 2.7 | ||
10 | STI | 2.9 | ||
Peer Median | 2.0 | |||

1 | In 4Q06, BNY transaction added $2.3B in loans and $1.2B in liability balances |
2 | All growth rates are YoY |
3 | Peer median includes comparable commercial segments at BAC, C, CMA, FITB, NCC, PNC, STI, USB, WB, WFC, ZION; acquisitions impacted the YoY results for PNC, WB, WFC and ZION |
2007 JPMORGAN CHASE INVESTOR DAY
| 6 |
Strong competitive position
Net charge-off ratio (bps)
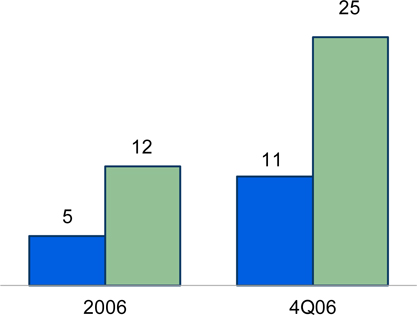
NPL/loans ratio1(bps)

1 | NPL – Nonperforming Loans |
2 | Peer median includes comparable commercial segments at BAC, C, CMA, FITB, NCC, PNC, STI, USB, WB, WFC, ZION; acquisitions impacted the YoY results for PNC, WB, WFC and ZION |
2007 JPMORGAN CHASE INVESTOR DAY
| 7 |
Since last year’s Investor Day…
| Last year’s goal | Our 2006 performance | |
 | • Converted 800 prospects to clients
• Won 70% of deals pitched
• Targeted sales effort to accelerate client acquisition | |
 | • Gross Investment Banking revenue up 30%
• Treasury Services revenue up 9% | |
 | • Improved market share in Syndications, High Yield Debt, Equity & Equity-Related and M&A1
• Expanded client coverage in out-of-footprint markets
• Grew TS product revenue by 9% | |
 | • Sales training for all bankers and line managers
• Intensive TS and IB product training for all bankers | |
1 | Thomson Financial - Data is based on companies with annual sales of $100mm to $2.5B |
2007 JPMORGAN CHASE INVESTOR DAY
| 8 |
Since last year’s Investor Day...
| Last year’s goal | Our 2006 Performance | |
 | • Net charge-off ratio of 0.05%, under the peer median of 0.12%
• Over $3B in managed exits | |
 | • Leveraging market research to make business decisions
• Enhancing banker tools for sales process
• Delegated prospect model pilot | |
 | • Increased representation of women and people of color in senior roles
• Retained 95% of top-rated diverse talent
• Conducted leadership training for senior and middle management | |
 | • 4Q06 overhead ratio of 48% | |
 | • Integrated Bank of New York Middle Market and Real Estate businesses
• Reorganized Real Estate segment
• Created Chase Capital Corp | |
2007 JPMORGAN CHASE INVESTOR DAY
| 9 |
New performance target: 45% overhead ratio
Overhead ratio trend
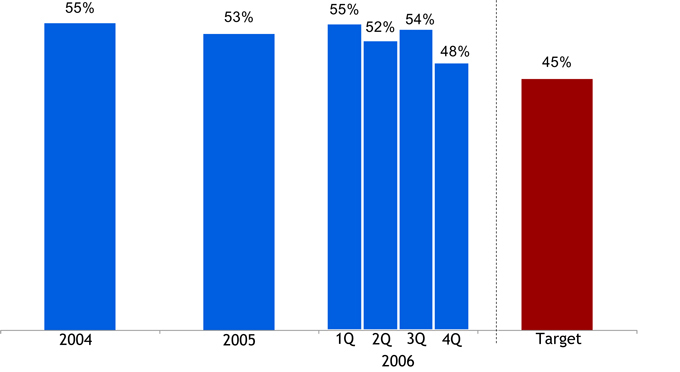
| • | Overhead target of 45% will require both revenue growth and expense discipline |
| • | Manage expense: reinvest expense efficiencies in front-line |
| • | Strive to achieve in 2008 |
2007 JPMORGAN CHASE INVESTOR DAY
| 10 |
Achieving our target: 2007 priorities
Maintain the momentum
| • | Deepen client relationships |
| • | Expand market share |
| • | Enhance product and service offerings |
| • | Opportunistically invest as credit markets tighten |
| • | Actively manage credit exposure |
| • | Continue to raise the bar on talent development and performance measurement |
Optimize the value of differentiation
2007 JPMORGAN CHASE INVESTOR DAY
| 11 |
Deepen client relationships: deliver the firm
2007 JPMORGAN CHASE INVESTOR DAY
| 12 |
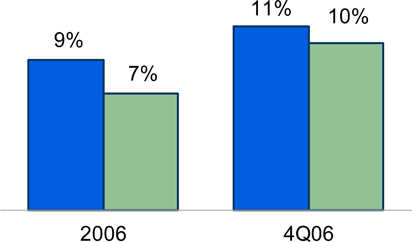
Deepen client relationships: Treasury Services
TS revenue ($B)
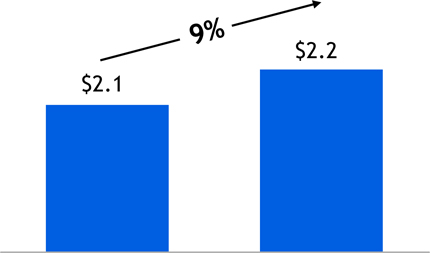
2006 TS revenue composition
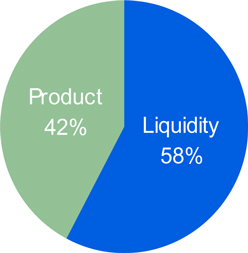
| • | Broad platform of cash management capabilities |
| • | High penetration of client base |
| • | 62% of clients broadly leverage TS |
| • | Opportunity to cross-sell more TS products to 38% of clients |
2007 JPMORGAN CHASE INVESTOR DAY
| 13 |
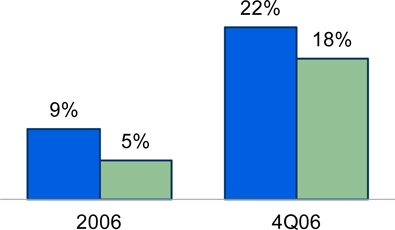
Deepen client relationships: Investment Banking
| • | World-class investment banking platform |
| • | Nearly doubled number of first-time IB product users in 2006 |
| • | Opportunity: only 1,000 clients fully leverage our IB platform today |
Gross IB revenue ($mm)

2007 JPMORGAN CHASE INVESTOR DAY
| 14 |
Deepen client relationships: International
| • | World-class international platform |
| • | 15-20% of commercial clients require international capabilities |
| • | Approximately 1,200 of our clients utilize our international platform today, double the number from last year |
| • | 2007 expansion |
| • | Leverage multi-currency platform in Europe |
| • | Expand coverage to India, Singapore |
| • | Add headcount to keep pace with growth |
| • | Enhance online FX |
Middle Market int’l revenue ($mm)
2007 JPMORGAN CHASE INVESTOR DAY
| 15 |
Expand market share: prospect conversion
| • | Increasing prospect conversion velocity |
| • | Targeted sales effort to accelerate client acquisition |
| • | Implemented tools, scorecard, incentive programs and marketing initiatives |
| • | Have over 70,000 Middle Market prospects |
| • | Active measurement drives results |
| • | Over the last 12 months: |
Calls to Middle Market customers and prospects | >125,000 | ||
Pitches to Middle Market customers and prospects | >25,000 | ||
Deals won of total pitched | 70 | % |
2007 JPMORGAN CHASE INVESTOR DAY
| 16 |
Expand market share: $10-50mm segment
| • | Aligned with Business Banking (RFS) to fully cover market |
| • | Streamlined credit approval process |
| • | Targeted products and services to meet client needs |
| • | Focused marketing efforts |
• | Middle market companies by size1 |
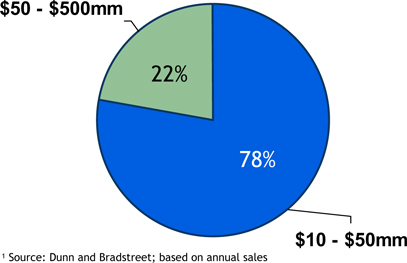
1 | Source: Dunn and Bradstreet; based on annual sales |
$ 10-50mm segment facts
| • | Over 120,000 companies |
| • | Over 50,000 in our footprint |
| • | 37% penetration in our footprint, lead bank for one-third of companies |
2007 JPMORGAN CHASE INVESTOR DAY
| 17 |
Enhance product & service offerings: Treasury Services
| • | Product innovation is changing commercial bank landscape |
| • | Cutting edge solutions and online capabilities improve margin |
| • | Commercial card |
| • | Image cash letter |
| • | IDD |
| • | Technology enhancements simplify customer banking processes |
| • | Continual focus to improve on-boarding, service, and overall customer satisfaction |
2007 JPMORGAN CHASE INVESTOR DAY
| 18 |
Opportunistically invest as credit markets tighten
The environment
| • | Rapidly changing landscape of capital providers |
| • | World-class JPMC relationships with alternative capital sources |
| • | Scale and expertise to serve as a principal |

Our response
| • | Established Chase Capital Corporation |
| • | Alternative sources of financing for middle market companies: |
| • | Mezzanine |
| • | Second lien |
| • | Preferred equity |
| • | Strong deal pipeline from existing customers/prospect base |
| • | Investing to broaden our private placement capabilities |
2007 JPMORGAN CHASE INVESTOR DAY
| 19 |
Actively manage credit exposure
| • | Diverse, granular portfolio |
| • | Maintain high credit standards despite aggressive competition |
| • | Lowest real estate concentration among commercial banking peers |
| • | Dynamic portfolio management |
| • | Over $3B in managed exits |
2006 Middle Market loans by geography
2006 CB loans by industry
Real estate | 18 | % | |
Real estate construction | 5 | % | |
Owner occupied | 3 | % | |
Other secured | 6 | % | |
Unsecured real estate | 4 | % | |
Consumer products & retail consumer svcs. | 13 | % | |
Healthcare | 6 | % | |
Oil & gas | 6 | % | |
State & municipal government | 6 | % | |
Building materials and construction | 5 | % | |
Machinery & eqpt. manufacturing | 5 | % | |
Banks & finance companies | 4 | % | |
Business services | 4 | % | |
Metals & mining | 4 | % | |
Agriculture & paper manufacturing | 3 | % | |
Media | 3 | % | |
Transportation | 3 | % | |
Other diversified1 | 20 | % |
1 | Other diversified includes various industries with less than 3% concentration |
2007 JPMORGAN CHASE INVESTOR DAY
| 20 |
Continue to raise the bar: talent development & performance measurement
| • | Hiring and training |
| • | Product and sales training for bankers |
| • | Service professional training |
| • | Strong Chase brand creates front-line hiring momentum |
| • | Inclusive diverse workplace |
| • | Management accountability |
| • | New and improved National Banker Scorecard |
| • | Measured by banker and market |
| • | Tracks calling, conversions, expanded and lost business, and pipeline |
2007 JPMORGAN CHASE INVESTOR DAY
| 21 |
Conclusions & takeaways
| • | Maintain the momentum from 2006 |
| • | Deepen customer relationships and increase prospect conversion velocity |
| • | Deliver the message of differentiation |
| • | Manage through 2007 headwinds |
| • | Inverted yield curve |
| • | Deteriorating credit cycle |
| • | Loan spread compression |
| • | Shift to lower margin liability products |
| • | 2007 Outlook |
| • | Business growth with competitive environment and rate pressure |
| • | Credit costs moving toward more normal levels |
2007 JPMORGAN CHASE INVESTOR DAY
| 22 |
MARCH 6, 2007
RETAIL FINANCIAL SERVICES
Charlie Scharf, CEO
Agenda
| • | 2006 results |
| • | Business updates & priorities |
| • | Performance targets & 2007 outlook |
2007 JPMORGAN CHASE INVESTOR DAY
| 2 |
RFS 2006 performance
Financial results ($ mm)
| 2006 | 2005 | $ O/(U) | ||||||||||
Net Revenue | $ | 14,825 | $ | 14,830 | $ | (5 | ) | |||||
Credit Costs | 561 | 724 | (163 | ) | ||||||||
Noninterest Expense | 8,927 | 8,585 | 342 | |||||||||
Net Income | $ | 3,213 | $ | 3,427 | $ | (214 | ) | |||||
Key Statistics | Target | |||||||||||
ROE | 22 | % | 26 | % | 28 -30 | % | ||||||
ROTE1 | 27 | % | 31 | % | ||||||||
Overhead Ratio (ex. CDI) | 57 | % | 55 | % | 50 | % | ||||||
1 | Return on Tangible Common Equity is defined as return on common stockholders’ equity net of goodwill and core deposit intangibles |
Items impacting YoY variance
| • | Portfolio losses of $215mm in 2006 & $150mm in 2005 |
| • | MSR model adjustment |
| • | Katrina special reserve in 2005 |
| • | Bank of New York acquisition |
| • | Sale of insurance business |
2007 JPMORGAN CHASE INVESTOR DAY
| 3 |
2006 Segment performance
Segment results ($mm)
| 2006 | 2005 | $ O/(U) | ||||||||||
Regional Banking | $ | 2,884 | $ | 2,780 | $ | 104 | ||||||
Mortgage Banking | (17 | ) | 379 | (396 | ) | |||||||
Auto Finance | 346 | 268 | 78 | |||||||||
Total Net Income | $ | 3,213 | $ | 3,427 | ($ | 214 | ) | |||||
Key Statistics | Target | |||||||||||
Regional Banking | ||||||||||||
ROE | 27 | % | 31 | % | ||||||||
ROTE1 | 38 | % | 41 | % | ||||||||
Overhead Ratio (ex. CDI) | 53 | % | 53 | % | 50 | % | ||||||
Mortgage Banking ROE | NM | 24 | % | 20 | % | |||||||
Auto Finance ROE | 14 | % | 10 | % | 15 | % | ||||||
1 | Return on Tangible Common Equity is defined as return on common stockholders’ equity net of goodwill and core deposit intangibles |
Segment summary
| • | Regional Banking |
| • | Good results through difficult environment |
| • | Mortgage Banking |
| • | Competitive production environment |
| • | Disappointing servicing results |
| • | Auto Finance |
| • | Good progress, great credit |
2007 JPMORGAN CHASE INVESTOR DAY
| 4 |
Financial priorities
| • | Move towards targeted returns and margin |
| • | Achieve reasonable revenue growth |
| • | Always make necessary long term investments |
| • | Manage risks and returns through all economic environments |
2007 JPMORGAN CHASE INVESTOR DAY
| 5 |
Home Lending – integral part of JPMC
2,459 Loan Officers
• 20% of production
3,079 Bank Branches
• 20% of production
• 33% of HE balances
Direct Channels
- Telephone
- Direct mail
- Internet
Broker
Correspondent
• 60% of production |  | Home Lending
• Salesforce management
• Operations
• Servicing
• Collections
IB Partnership
• Product development
• Pricing
• Sell or hold decision
• Distribution |  | Mortgage Bank P&L
• Production
• Servicing
Regional Banking
• Home Equity portfolio
• Sub-prime portfolio
Investment Bank
• Distribution profit
JPM investment portfolio
• Prime Mortgage |
Note: Excludes CNT Flow
2007 JPMORGAN CHASE INVESTOR DAY
| 6 |
Home Lending – 2006 priorities
| • | Deeper understanding of MSR asset |
| • | Upgrading infrastructure |
| • | Move toward high-margin products |
| • | Grow purchase market share |
| • | Reduce excess expense |
2007 JPMORGAN CHASE INVESTOR DAY
| 7 |
Home Lending – upgrading infrastructure
1H06 | 2H06 | 2007 | 2008 & beyond | |||||
| Mortgage | • Loan delivery system (capital markets) | • Trade management system (capital markets) | • Retail loan origination system | • Operational data store | ||||
• Marketing analytics tool |
• Wholesale loan origination system | |||||||
| Home Equity | • Blackberry origination access | • Wholesale loan origination system
• Customized pre- approved HE offering in branches | • Retail loan origination system | |||||
| Servicing | • BNY platform consolidation | • Mortgage servicing platform |
2007 JPMORGAN CHASE INVESTOR DAY
| 8 |
Home Lending – Mortgage Banking
Production revenue
| Production sold $(B) | Revenue (bps) | Production revenue $( mm) | ||||||||||||||||||||||||
| 2006 | 2005 | Change | 2006 | 2005 | Change | 2006 | 2005 | Change | ||||||||||||||||||
Prime | ||||||||||||||||||||||||||
Conforming & Jumbo | $ | 53.1 | $ | 64.5 | $ | (11.4 | ) | |||||||||||||||||||
Alt-A | 8.3 | 3.3 | 5.0 | |||||||||||||||||||||||
Gov’t & Other | 4.6 | 5.0 | (0.4 | ) | ||||||||||||||||||||||
Subtotal | $ | 66.0 | $ | 72.8 | $ | (6.8 | ) | 97 | 92 | 5 | $ | 640 | $ | 670 | $ | (30 | ) | |||||||||
Subprime¹ | 11.5 | 9.7 | 1.8 | 168 | 77 | 91 | 193 | 74 | 119 | |||||||||||||||||
Total | $ | 77.5 | $ | 82.5 | $ | (5.0 | ) | 108 | 90 | 18 | $ | 833 | $ | 744 | $ | 89 | ||||||||||
| ¹ | Includes sub-prime mortgage loans transferred to Regional Banking |
| • | In 2006, 31% of production came from “high-margin” loans vs. 22% in 2005 (high-margin loans include Alt-A, sub-prime and government loans) |
2007 JPMORGAN CHASE INVESTOR DAY
| 9 |
Home Lending - Investment Bank partnership
Mortgages sold to or jointly originated with Investment Bank
| ($B) | 2006 | 2005 | 2004 | ||||||
Prime | $ | 18.4 | $ | 14.0 | $ | 1.6 | |||
Subprime | 5.1 | — | — | ||||||
Subtotal | $ | 23.5 | $ | 14.0 | $ | 1.6 | |||
Joint | 19.4 | 4.3 | — | ||||||
Total | $ | 42.9 | $ | 18.3 | $ | 1.6 | |||
| • | Capital markets integration |
| • | End-to-end economics |
| • | Product expansion |
2007 JPMORGAN CHASE INVESTOR DAY
| 10 |
Home Lending
Potential firmwide opportunity
| Net Income | ROE | |||
Mortgage Banking | $ 400mm-$600mm | 20%-30% | ||
Home Equity/Subprime portfolio | $800mm | 18%-20% | ||
Prime portfolio | ||||
Investment Bank | ||||
Total ($B) | $1.2B -$ 1.5B+ | |||
| • | Earnings potential is significant to JPMC |
2007 JPMORGAN CHASE INVESTOR DAY
| 11 |
Home Lending priorities
| • | Long-term importance of Home Lending |
| • | Mortgage |
| • | Home Equity |
| • | Prime |
| • | Sub-prime |
| • | Leverage all parts of JPMC |
| • | Improve underlying infrastructure |
| • | Achieve best-in-class cost structure |
| • | Grow share through difficult industry environments |
2007 JPMORGAN CHASE INVESTOR DAY
| 12 |
Auto Finance
Net income and ROE trends
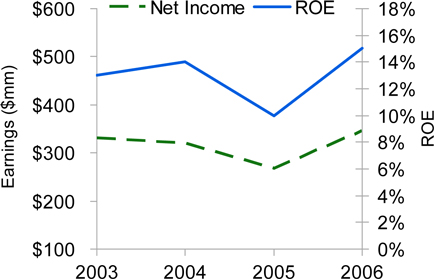
Production volume & ROA trends
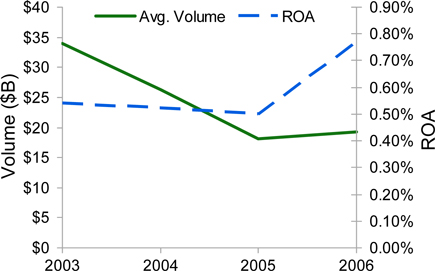
| • | Focus on returns over growth |
| • | Transition from super prime to full spectrum lender |
% of Production | 2006 | 2005 | ||||
Prime | 74 | % | 84 | % | ||
Near Prime | 17 | % | 10 | % | ||
Sub-prime | 9 | % | 6 | % |
2007 JPMORGAN CHASE INVESTOR DAY
| 13 |
Regional Banking - 2006 priorities
| • | Tri-state conversion |
| • | Build out salesforce |
| • | Open 150 - 200 new branches |
| • | Retrofit/Rebrand |
| • | Reduce excess expense |
| • | Growth |
| • | Core checking accounts |
| • | Cross-sell |
| • | Home Lending |
| • | Investments |
| • | Credit Card |
While managing margin through the rate cycle
2007 JPMORGAN CHASE INVESTOR DAY
| 14 |
Priorities - salesforce growth
Quarterly trend
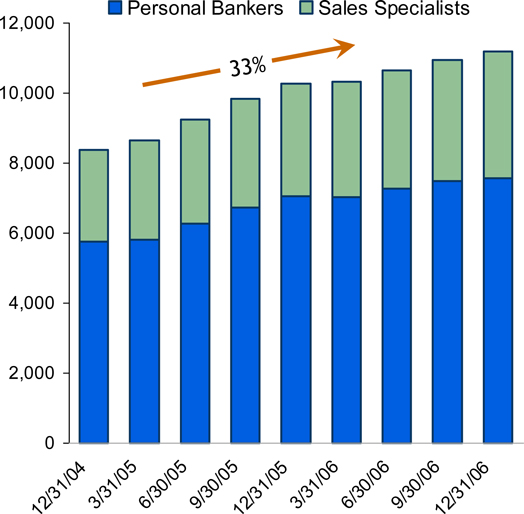
| • | Adding sales specialists and bankers in new & existing branches |
| • | Loan officers |
| • | Investment sales reps |
| • | Business bankers |
| • | Optimizing support staff in the branches |
| • | Approximately 13% reduction in same-store tellers since 12/31/04 |
2007 JPMORGAN CHASE INVESTOR DAY
| 15 |
Priorities - growing customer base organically
Total checking accounts
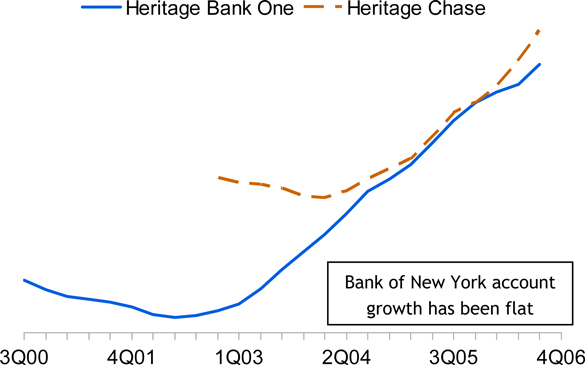
Actions taken
| • | Changed compensation |
| • | Extended hours |
| • | Updated products |
| • | Sales campaigns |
| • | Competitive pricing |
| • | Added & refurbished branches & ATMs |
| • | Added salesforce |
| • | Improved technology |
| • | Sales and service |
2007 JPMORGAN CHASE INVESTOR DAY
| 16 |
Priorities - growth in cross-sell
Credit cards (# units in 000s)
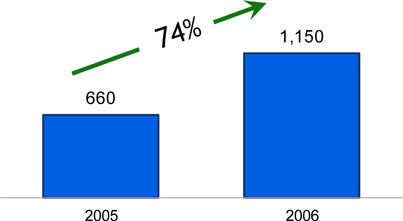
Mortgage & Home Equity sales ($B)
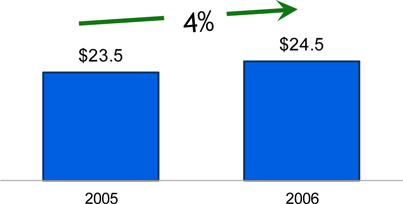
Highlights
| • | Deepening customer relationship |
| • | Same store production: |
| • | Credit card sales up 52% |
| • | Mortgage sales up 17% |
| • | Investment sales up 31% |
Investment sales ($mm)
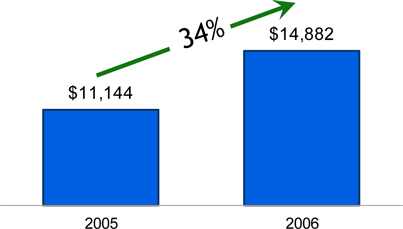
2007 JPMORGAN CHASE INVESTOR DAY
| 17 |
Managing margin through the cycle
Regional Banking - deposit mix and margin
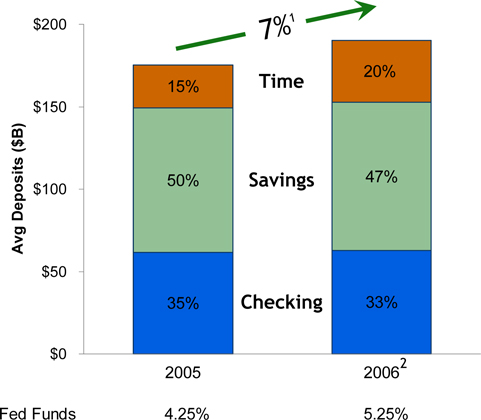
| $mm | bps | ||||||
2005 Net Interest Margin | $ | 8,531 | |||||
Lending | 107 | (15 | ) | ||||
Deposits | |||||||
Account growth3 | 472 | 2 | |||||
Avg. account balance | (15 | ) | (— | ) | |||
Mix & migration | (224 | ) | (12 | ) | |||
Spreads | 66 | 4 | |||||
Subtotal - deposits | $ | 299 | (6 | ) | |||
Insurance | (169 | ) | |||||
Total Variance | $ | 237 | |||||
2006 Net Interest Margin | $ | 8,768 | |||||
1 | Deposit growth rate excludes Bank of New York balances |
2 | 2006 Deposit mix includes Bank of New York balances |
3 | Account growth includes Bank of New York |
2007 JPMORGAN CHASE INVESTOR DAY
| 18 |
Managing deposit margin
Deposit spread
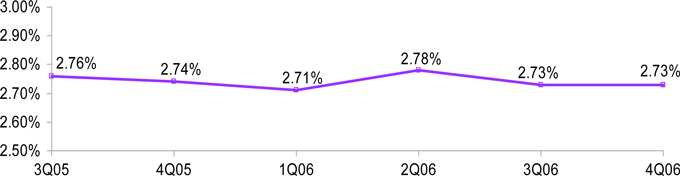
| • | Manage customer dollars in total to optimize economics as balances shift between investment alternatives |
| • | Actively introduce new products to meet changing customer needs |
| • | CD-only households and balances are consistent with prior year levels |
| • | Narrower product spreads are creating ongoing pressure |
| • | Market-based pricing |
| • | Competitive in markets where appropriate |
2007 JPMORGAN CHASE INVESTOR DAY
| 19 |
Regional Banking - 2006 priorities
To do
| • | Tri-State conversion |
| • | Build out salesforce |
| • | Open 150 -200 new branches |
| • | Retrofit/Rebrand |
| • | Reduce excess expense |
| • | Growth |
| • | Core checking accounts |
| • | Cross-sell |
| • | Home Lending |
| • | Investment sales |
| • | Credit card |
Completed
| • | Completed on 9/16/2006 |
| • | Added over 900 salespeople |
| • | Added 125 branches & BNY (339) |
| • | Completed Bank One rebranding |
| • | Completed merger saves |
| • | Checking accounts grew 14% |
| • | Branch cross-sell |
| • | Home Lending grew 4% |
| • | Investment sales grew 34% |
| • | Credit cards grew 74% |
While managing margin through the rate cycle
2007 JPMORGAN CHASE INVESTOR DAY
| 20 |
Priorities - new branches profitability
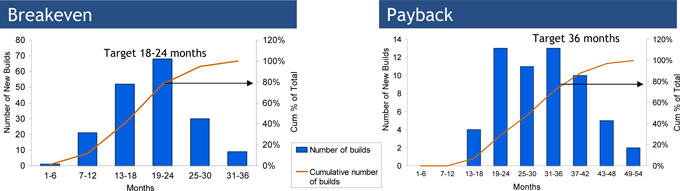
| • | Total portfolio - more than 50% are less than 2 years old |
| • | Track branches on vintage basis - each vintage shows improvement |
| • | New build P&L: |
| • | Expense includes: |
| • | Branch salaries, benefits, and incentives |
| • | Real estate and/or lease expense |
| • | Fraud/operating losses |
| • | Technology (phones, PCs, etc) |
| • | Incremental product costs |
| • | Revenue excludes: |
| • | Private Client Services |
| • | Private Banking |
| • | Middle Market |
| • | Transfers-in of existing customer relationships |
2007 JPMORGAN CHASE INVESTOR DAY
| 21 |
Priorities - new branches profitability
Pretax profits on new builds
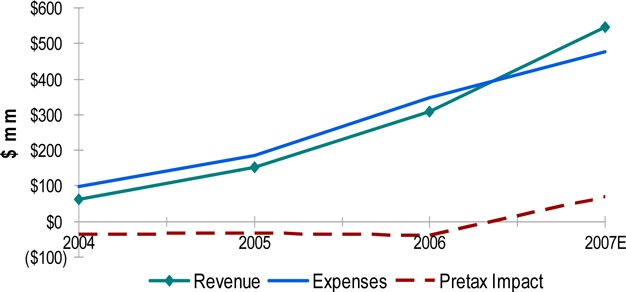
| • | New build pretax impact |
| • | 2004 - $(36)mm |
| • | 2005 - $(33)mm |
| • | 2006 - $(40)mm |
| • | Expense increase |
| • | 2004 to 2005 - $89mm |
| • | 2005 to 2006 - $163mm |
Non-deposit related revenue contributes 15% for mature branches, while it contributes 25% for a new branch
2007 JPMORGAN CHASE INVESTOR DAY
| 22 |
Bank of New York integration schedule
1Q07 | 2Q07 | 3Q07 | ||
• Extend branch hours | • Job family mapping | • Branch P&L roll-out | ||
• Training | • Salesforce growth | • Sales management processes | ||
• System conversions | • Rebranding | • Branch consolidations begin | ||
• Sales campaigns | • Credit card/Debit card reissue | |||
• Retrofit | • Compensation changes | |||
2007 JPMORGAN CHASE INVESTOR DAY
| 23 |
Bank of New York opportunity
Average branch comparisons
Profitability | Chase vs. BNY | |||||
Revenue
Expense | 1.8x higher
1.5x higher |  | +10 points higher pretax margin | |||
Production statistics | National sales | |||||
Checking growth (#) | 5x higher | |||||
Investment sales | 6x higher | |||||
Credit cards | 17x higher | |||||
Home Equity | 10x higher | |||||
Mortgage | 18x higher | |||||
Note: Bank of New York reflects 4Q annualized for comparison purposes
2007 JPMORGAN CHASE INVESTOR DAY
| 24 |
Regional Banking - 2007 priorities
Constantly improving execution
| • | Bank of New York conversion |
| • | Systems |
| • | Merger integration |
| • | Build out salesforce |
| • | Open 125 - 150 new branches |
| • | Retrofit/Rebrand |
| • | Reduce excess expense |
| • | Growth |
| • | Core checking accounts |
| • | Cross-sell |
| • | Home Lending |
| • | Investments |
| • | Credit card |
Added priorities
| • | Segment focus |
| • | Entry level consumer |
| • | Mass market |
| • | Affluent |
| • | Students |
| • | Multi-cultural |
| • | Customer service |
While managing margin through the rate cycle
2007 JPMORGAN CHASE INVESTOR DAY
| 25 |
Comments on credit
Net charge-off rates by business
| 2005 | 2006 | 4Q05 | 4Q06 | Approximate through the Cycle | ||||||
Retail Financial Services | ||||||||||
Home Equity1 | 0.20% | 0.18% | 0.23% | 0.24% | 0.30% | |||||
Mortgage | 0.06% | 0.12% | 0.04% | 0.20% | 0.42% | |||||
Prime Mortgage | 0.02% | 0.04% | 0.02% | 0.06% | 0.08% | |||||
Sub-Prime Mortgage | 0.16% | 0.31% | 0.11% | 0.61% | 1.00% | |||||
Auto Finance | 0.54% | 0.56% | 0.66% | 0.75% | 0.75% | |||||
Business Banking | 0.80% | 0.69% | 1.01% | 1.08% | 1.30% |
| ($mm) | 2006 | 2005 | |||||
Net charge-offs | $ | 576 | $ | 572 | |||
Change in allowance for credit losses | (15 | ) | 152 | ||||
Credit costs | $ | 561 | $ | 724 | |||
Allowance for loan losses/loans | 12/31/06 | ||
Retail Financial Services | 0.77 | % |
1 | Includes, beginning in 4Q06, a minimal amount of sub-prime home equity loans and lines of credit, which had been previously included in sub-prime mortgage; the through-the-cycle net charge-off rate has been modified to reflect the additional loans and lines of credit |
2007 JPMORGAN CHASE INVESTOR DAY
| 26 |
Consumer 30-day delinquency trends
Prime mortgage¹
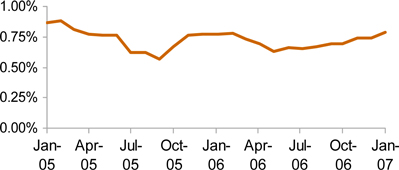
Sub-prime mortgage
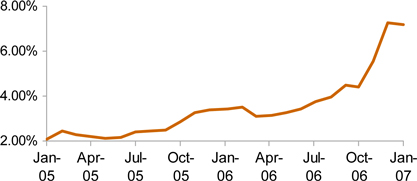
Home equity
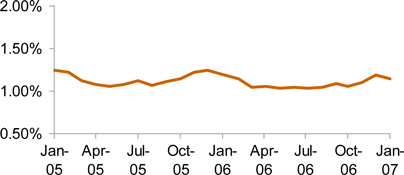
Prime and sub-prime auto
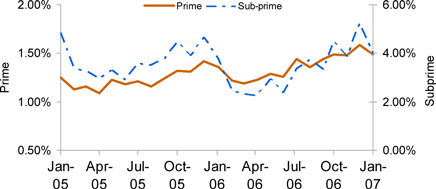
Note: Owned Portfolio basis
| ¹ | Delinquency rate excludes government guaranteed mortgages |
2007 JPMORGAN CHASE INVESTOR DAY
| 27 |
Consumer sub-prime lending1
Fourth quarter 2006 EOP outstandings
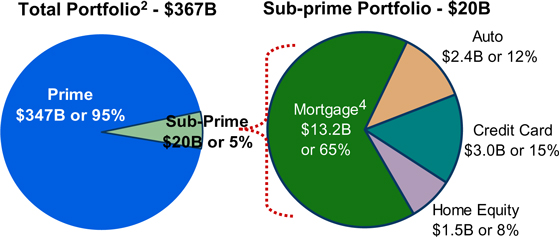
Third quarter 2006 EOP outstandings
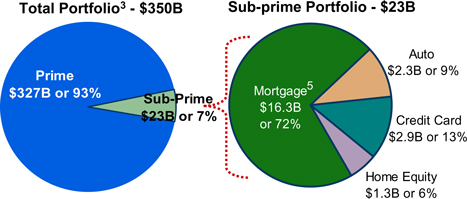
| • | Operate in a limited way in sub-prime space |
| • | Established limits for Auto, Card and Real Estate which are reviewed annually |
| • | Mortgage is the majority of sub-prime portfolio, but exposure is being reduced |
| • | Sold most of 2006 sub-prime vintage production |
| • | 4Q06 sub-prime mortgage portfolio of $13.2B includes $4.5B of loans classified as held-for-sale; expected to be sold in 1H07 |
1 | Designated as sub-prime at origination |
2 | Includes $153B of managed credit card loans and $214B of owned retail loans |
3 | Includes $144B of managed credit card loans and $206B of owned retail loans |
4 | Includes $4.5B of loans classified as held-for-sale |
5 | Includes $4.3B of loans classified as held-for-sale |
2007 JPMORGAN CHASE INVESTOR DAY
| 28 |
Home Equity Risk Profile
Home Equity as of year-end 20061
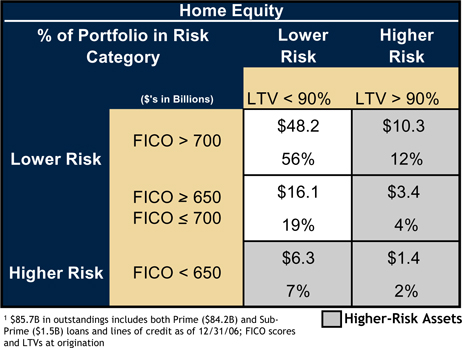
| • | $21B of higher risk home equity portfolio, or 10% of total retail portfolio |
| • | The highest risk segment with FICO scores below 650 and LTV’s greater than 90% is only 2% of the home equity portfolio |
2007 JPMORGAN CHASE INVESTOR DAY
| 29 |
Sub-Prime Mortgage Risk Profile
Sub-Prime Mortgage as of year-end 20061
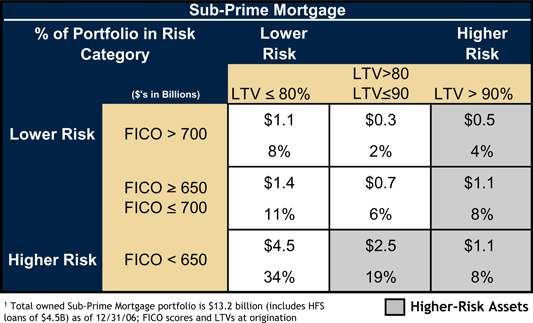
| • | Sub-prime mortgage loss severities have begun to increase and 2006 vintage delinquency is higher than 2005 and 2004 at similar loan ages |
| • | $5B of higher-risk sub-prime mortgage, or 2% of total retail portfolio |
| • | The highest risk segment with FICO scores below 600 and LTV’s greater than 90% is only 2% of the sub-prime mortgage portfolio |
| • | No negative amortization mortgages, option ARMs or 50-year products |
2007 JPMORGAN CHASE INVESTOR DAY
| 30 |
Retail Financial Services – roadmap to target ROE
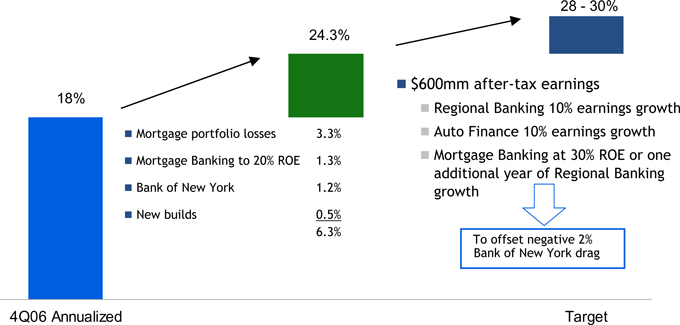
2007 JPMORGAN CHASE INVESTOR DAY
| 31 |
Performance targets and 2007 outlook
Performance targets
| • | Retail Financial Services |
| • | 28-30% ROE with volatility |
| • | Strive to achieve by end of 2007 |
| • | 50% Overhead Ratio (excl. CDI) |
| • | Pressure from ramp-up in new builds |
| • | Regional Banking – 50% overhead ratio (excl. CDI) |
| • | Mortgage Banking – 20%-30% ROE |
| • | Auto Finance – 15% ROE |
2007 outlook
| • | Net interest income up slightly from 4Q run-rate with balance growth offset by margin pressure |
| • | Noninterest revenue up from 4Q run-rate (adjusted for portfolio repositioning) driven by improved mortgage results and higher branch production |
| • | Credit costs trend to more normal levels; continued weakness in sub-prime mortgage expected |
| • | Slight increase in expense from 4Q level with continued investment in build-out of distribution network |
2007 JPMORGAN CHASE INVESTOR DAY
| 32 |
MARCH 6, 2007
CORPORATE
Mike Cavanagh, CFO
Frank Bisignano, CAO
Corporate
Financial results ($mm)
| 2006 | 2005 | |||||||
Private Equity | $ | 627 | $ | 821 | ||||
Treasury | (560 | ) | (2,028 | ) | ||||
Other Corporate | 169 | (2,128 | ) | |||||
Merger Costs | (189 | ) | (448 | ) | ||||
Income from Continuing Operations | $ | 47 | $ | (3,783 | ) | |||
Income from Discontinued Operations1 | 795 | 229 | ||||||
Net Income | $ | 842 | $ | (3,554 | ) | |||
1 | Discontinued operations include the income statement activity of selected corporate trust businesses sold to The Bank of New York on October 1, 2006. The fourth quarter of 2006 included an after-tax gain of $622 million related to the transaction. |
2007 JPMORGAN CHASE INVESTOR DAY
| 2 |
Private Equity
Financial results ($mm)
| 2006 | 2005 | |||||||
Net Income | $ | 627 | $ | 821 | ||||
Private Equity Gains | 1,299 | 1,691 | ||||||
EOP Private Equity Portfolio ($B) | $ | 6.1 | $ | 6.2 | ||||
Private Equity as % of Common Equity less GW1 | 8.6 | % | 9.7 | % | ||||
1 | Based on end-of-period balances |
JPMP update
| • | Spin off of JPMorgan Partners investment professionals completed on August 1, 2006 |
| • | h-JPMP professionals continue to manage JPM investments retained on our books |
| • | JPM has invested in new fund raised by h-JPMP professionals |
| • | OEP remains private equity investment arm |
2007 Outlook
| • | Results will be market-driven and volatile |
| • | $1.3B in gains and $627mm in net income in 2006 |
Private equity portfolio
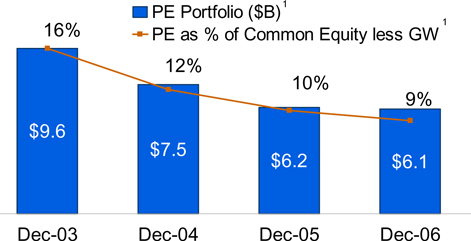
2007 JPMORGAN CHASE INVESTOR DAY
| 3 |
Treasury and Corporate Other
Financial results ($mm)
| 2006 | 2005 | |||||||
Treasury | ($ | 560 | ) | ($ | 2,028 | ) | ||
Corporate Other | 169 | (2,128 | ) | |||||
Total Net Income | ($ | 391 | ) | ($ | 4,156 | ) | ||
Avg Treasury Investment Portfolio ($B) | $ | 63.4 | $ | 46.5 | ||||
Adjusted net income ($mm)
| 2006 | 2005 | |||||||
Net Income | ($ | 391 | ) | ($ | 4,156 | ) | ||
Adjustments (after tax)1 | ||||||||
Tax benefits | 367 | 55 | ||||||
Material litigation insurance recoveries/(charges) | 317 | (1,590 | ) | |||||
Gain on BrownCo | — | 752 | ||||||
Accelerated vesting of options | — | (90 | ) | |||||
MasterCard IPO gain | 64 | — | ||||||
Treasury securities gains/(losses) | (384 | ) | (921 | ) | ||||
Adjusted Net Income | ($ | 755 | ) | ($ | 2,362 | ) | ||
2007 Outlook
| • | Combined net loss excluding Treasury portfolio repositioning and one-time items improved from ($2.4)B in 2005 to ($750)mm in 2006 |
| • | Expect combined net loss to be $50mm - $100mm per quarter in 2007 |
Adjusted net income1($mm)
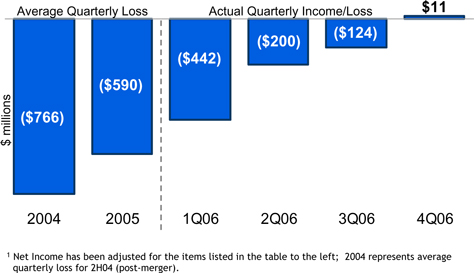
2007 JPMORGAN CHASE INVESTOR DAY
| 4 |
Capital strength
$ in billions
| 12/31/06 | 12/31/05 | |||||||
Tangible Common Equity1 | $ | 63.3 | $ | 55.3 | ||||
Common Shareholder’s Equity less Goodwill | $ | 70.6 | $ | 63.5 | ||||
Tier 1 Capital | $ | 81.1 | $ | 72.5 | ||||
Risk Weighted Assets | $ | 935.9 | $ | 850.6 | ||||
Tier 1 Capital Ratio | 8.7 | % | 8.5 | % | ||||
Total Capital Ratio | 12.3 | % | 12.0 | % | ||||
Leverage Ratio | 6.2 | % | 6.3 | % | ||||
TCE/Managed RWA1 | 6.5 | % | 6.0 | % | ||||
ROTCE – Continuing Ops.1,2 | 23 | % | 15 | % | ||||
ROE Net of Goodwill – Continuing Ops.2 | 20 | % | 13 | % | ||||
• | Repurchased 90.7mm shares for $3.9B in 20063 |
1 | Tangible Common Equity is defined as common stockholders’ equity less identifiable intangible assets (other than MSRs) and goodwill. ROTCE is based on this calculation of TCE. TCE as used in the TCE/Managed RWA ratio, which is used for purposes of a capital strength calculation, is defined as common stockholders’ equity plus a portion of junior subordinated notes (which have certain equity-like characteristics due to their subordinated and long-term nature) less identifiable intangible assets (other than MSRs) and goodwill. The latter definition of TCE is used by the firm and some analysts and creditors of the firm when analyzing the firm’s capital strength. The TCE measures used in this presentation are not necessarily comparable to similarly titled measures provided by other firms due to differences in calculation methodologies. |
2 | ROTCE and ROE Net of Goodwill for 2005 and 2006 |
3 | There is $5.2B remaining capacity under the $ 8B March 2006 Board authorization as of 12/31/06 |
2007 JPMORGAN CHASE INVESTOR DAY
| 5 |
Accounting developments
1Q07 Accounting items preview | P&L impact | Equity impact | ||
• FIN 48 – Uncertain taxes | ~ $400mm | |||
• SFAS 157 – Fair value measurement
• EITF 02-3 nullification
• Firm’s nonperformance risk
• Private equity
• Transaction-related costs | Tbd Tbd No net impact | ~ $250mm after tax | ||
• SFS 159 – Fair value option
• Retrospective elections
• Prospective elections | Tbd |
Tbd | ||
2007 JPMORGAN CHASE INVESTOR DAY
| 6 |
Other Corporate – Real Estate and Technology
Financial results ($mm)
| Real Estate | Central Technology & Operations | |||||||||||||||
| 2006 | 2005 | 2006 | 2005 | |||||||||||||
Gross Expense1 | $ | 2,638 | $ | 2,605 | $ | 4,235 | $ | 4,460 | ||||||||
Recoveries | (2,381 | ) | (2,334 | ) | (3,671 | ) | (3,593 | ) | ||||||||
Net Expense | $ | 257 | $ | 271 | $ | 564 | $ | 867 | ||||||||
1 | Includes gains and losses on real estate dispositions and cost to carry |
Real estate
| • | Net reduction of 4mm sq. ft. from 71.4mm on 12/31/05 to 67.4mm on 12/31/06 |
| • | Shed 7mm sq. ft. of excess space |
| • | City consolidations |
| • | Pool sales |
| • | Invested in 3mm additional sq. ft. to support growth/infrastructure initiatives |
| • | Retail branches |
| • | Acquisitions (e.g., Bank of New York) |
| • | Data centers |
Central Technology & Operations
| • | Substantial reduction in expense and headcount while supporting volume growth and new business initiatives |
| • | Consolidated data centers |
| • | Reduced headcount by 1,900 (10%) |
| • | Continued focus on infrastructure utilization and cost per FTE |
2007 JPMORGAN CHASE INVESTOR DAY
| 7 |